Zip Codes with the Highest Percentage of Population Employed in Life, Physical & Social Science in Spring, TX
RELATED REPORTS & OPTIONS
Life, Physical & Social Science
Spring
Compare Zip Codes
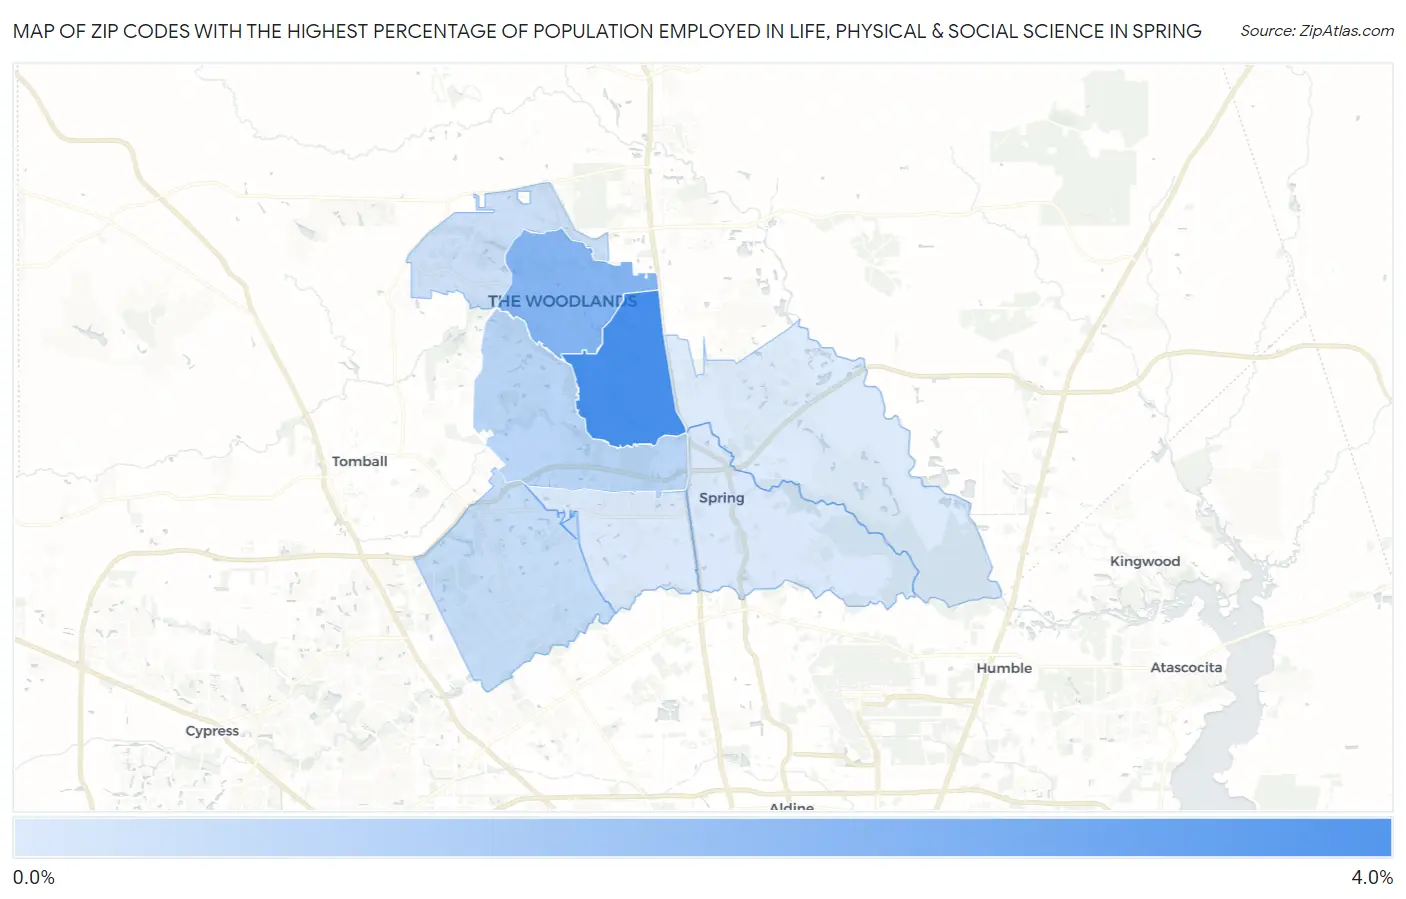
Map of Zip Codes with the Highest Percentage of Population Employed in Life, Physical & Social Science in Spring
0.89%
4.0%
Zip Codes with the Highest Percentage of Population Employed in Life, Physical & Social Science in Spring, TX
| Zip Code | % Employed | vs State | vs National | |
| 1. | 77380 | 4.0% | 0.84%(+3.16)#39 | 1.1%(+2.91)#1,156 |
| 2. | 77381 | 2.7% | 0.84%(+1.84)#71 | 1.1%(+1.59)#2,270 |
| 3. | 77389 | 1.6% | 0.84%(+0.776)#196 | 1.1%(+0.528)#5,078 |
| 4. | 77379 | 1.4% | 0.84%(+0.535)#257 | 1.1%(+0.286)#6,320 |
| 5. | 77382 | 1.2% | 0.84%(+0.351)#332 | 1.1%(+0.102)#7,547 |
| 6. | 77373 | 0.95% | 0.84%(+0.105)#433 | 1.1%(-0.143)#9,515 |
| 7. | 77388 | 0.92% | 0.84%(+0.075)#449 | 1.1%(-0.174)#9,801 |
| 8. | 77386 | 0.89% | 0.84%(+0.043)#466 | 1.1%(-0.206)#10,099 |
1
Common Questions
What are the Top 5 Zip Codes with the Highest Percentage of Population Employed in Life, Physical & Social Science in Spring, TX?
Top 5 Zip Codes with the Highest Percentage of Population Employed in Life, Physical & Social Science in Spring, TX are:
What zip code has the Highest Percentage of Population Employed in Life, Physical & Social Science in Spring, TX?
77380 has the Highest Percentage of Population Employed in Life, Physical & Social Science in Spring, TX with 4.0%.
What is the Percentage of Population Employed in Life, Physical & Social Science in Spring, TX?
Percentage of Population Employed in Life, Physical & Social Science in Spring is 0.93%.
What is the Percentage of Population Employed in Life, Physical & Social Science in Texas?
Percentage of Population Employed in Life, Physical & Social Science in Texas is 0.84%.
What is the Percentage of Population Employed in Life, Physical & Social Science in the United States?
Percentage of Population Employed in Life, Physical & Social Science in the United States is 1.1%.