Jayton, TX Map & Demographics
Jayton Map
Jayton Overview
$29,384
PER CAPITA INCOME
$81,607
AVG FAMILY INCOME
$68,651
AVG HOUSEHOLD INCOME
0.38
INEQUALITY / GINI INDEX
421
TOTAL POPULATION
208
MALE POPULATION
213
FEMALE POPULATION
97.65
MALES / 100 FEMALES
102.40
FEMALES / 100 MALES
48.9
MEDIAN AGE
3.1
AVG FAMILY SIZE
2.3
AVG HOUSEHOLD SIZE
146
LABOR FORCE [ PEOPLE ]
44.9%
PERCENT IN LABOR FORCE
2.1%
UNEMPLOYMENT RATE
Jayton Zip Codes
Jayton Area Codes
Income in Jayton
Income Overview in Jayton
Per Capita Income in Jayton is $29,384, while median incomes of families and households are $81,607 and $68,651 respectively.
| Characteristic | Number | Measure |
| Per Capita Income | 421 | $29,384 |
| Median Family Income | 93 | $81,607 |
| Mean Family Income | 93 | $99,485 |
| Median Household Income | 161 | $68,651 |
| Mean Household Income | 161 | $76,333 |
| Income Deficit | 93 | $0 |
| Wage / Income Gap (%) | 421 | 0.00% |
| Wage / Income Gap ($) | 421 | 100.00¢ per $1 |
| Gini / Inequality Index | 421 | 0.38 |
Earnings by Sex in Jayton
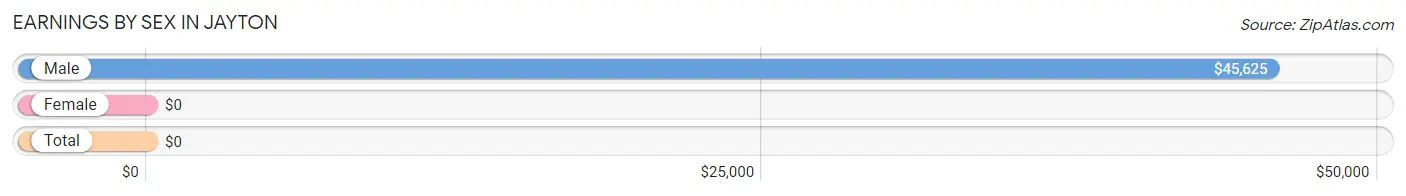
| Sex | Number | Average Earnings |
| Male | 81 (43.1%) | $45,625 |
| Female | 107 (56.9%) | $0 |
| Total | 188 (100.0%) | $0 |
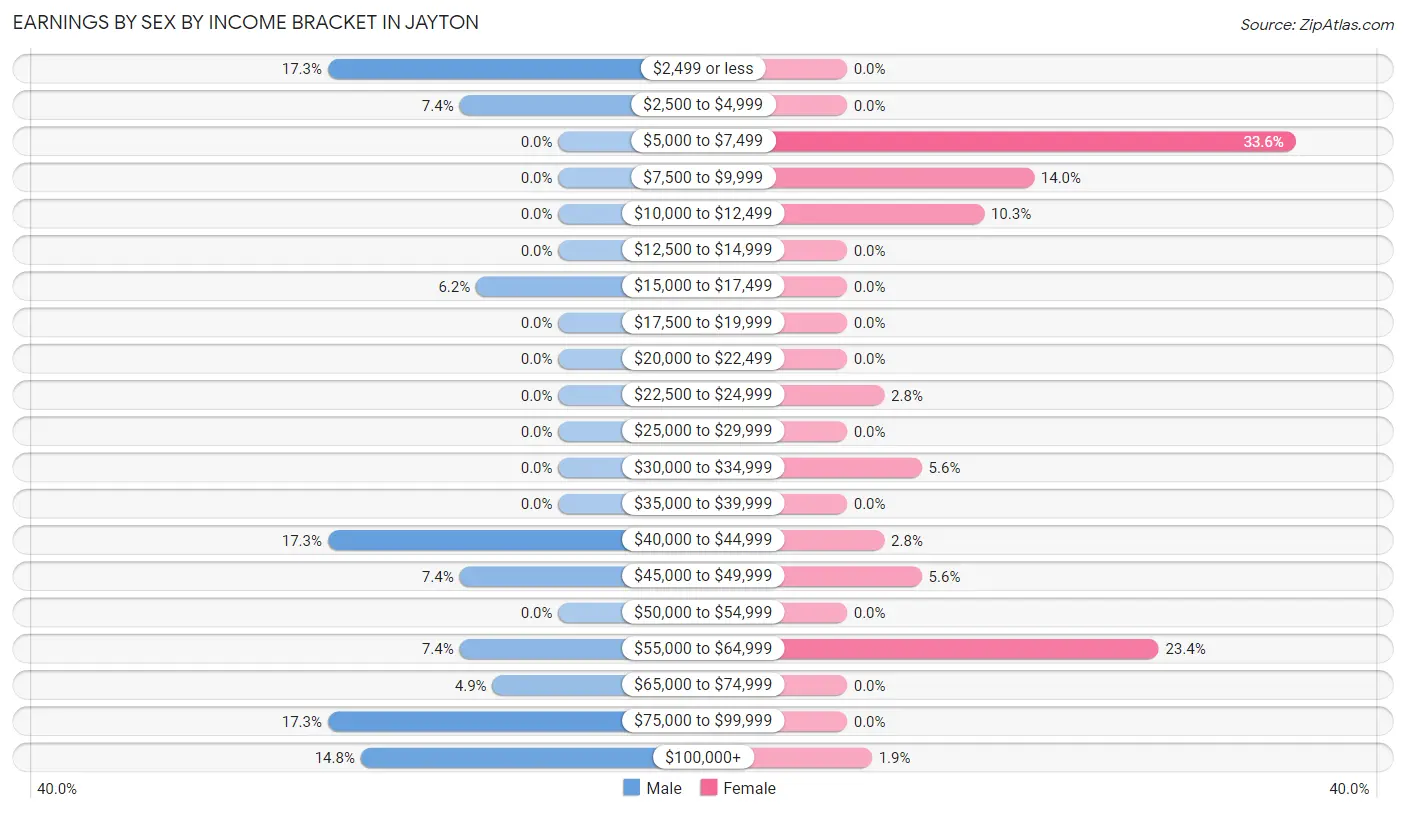
Earnings by Sex by Income Bracket in Jayton
The most common earnings brackets in Jayton are $2,499 or less for men (14 | 17.3%) and $5,000 to $7,499 for women (36 | 33.6%).
| Income | Male | Female |
| $2,499 or less | 14 (17.3%) | 0 (0.0%) |
| $2,500 to $4,999 | 6 (7.4%) | 0 (0.0%) |
| $5,000 to $7,499 | 0 (0.0%) | 36 (33.6%) |
| $7,500 to $9,999 | 0 (0.0%) | 15 (14.0%) |
| $10,000 to $12,499 | 0 (0.0%) | 11 (10.3%) |
| $12,500 to $14,999 | 0 (0.0%) | 0 (0.0%) |
| $15,000 to $17,499 | 5 (6.2%) | 0 (0.0%) |
| $17,500 to $19,999 | 0 (0.0%) | 0 (0.0%) |
| $20,000 to $22,499 | 0 (0.0%) | 0 (0.0%) |
| $22,500 to $24,999 | 0 (0.0%) | 3 (2.8%) |
| $25,000 to $29,999 | 0 (0.0%) | 0 (0.0%) |
| $30,000 to $34,999 | 0 (0.0%) | 6 (5.6%) |
| $35,000 to $39,999 | 0 (0.0%) | 0 (0.0%) |
| $40,000 to $44,999 | 14 (17.3%) | 3 (2.8%) |
| $45,000 to $49,999 | 6 (7.4%) | 6 (5.6%) |
| $50,000 to $54,999 | 0 (0.0%) | 0 (0.0%) |
| $55,000 to $64,999 | 6 (7.4%) | 25 (23.4%) |
| $65,000 to $74,999 | 4 (4.9%) | 0 (0.0%) |
| $75,000 to $99,999 | 14 (17.3%) | 0 (0.0%) |
| $100,000+ | 12 (14.8%) | 2 (1.9%) |
| Total | 81 (100.0%) | 107 (100.0%) |
Earnings by Sex by Educational Attainment in Jayton
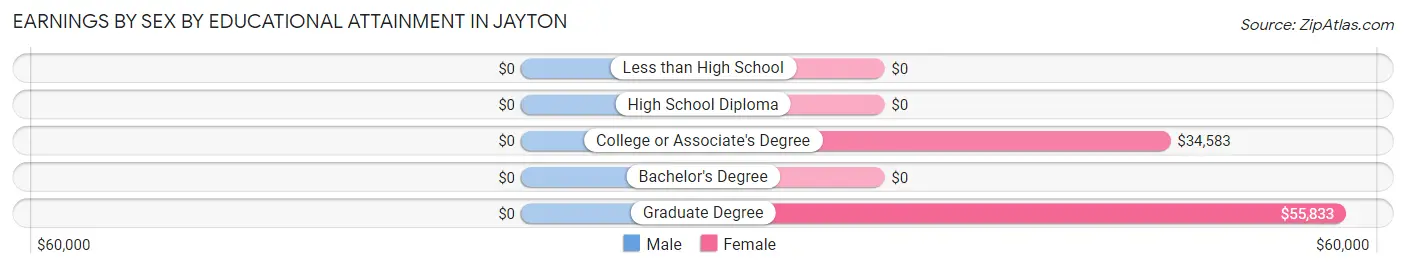
| Educational Attainment | Male Income | Female Income |
| Less than High School | - | - |
| High School Diploma | - | - |
| College or Associate's Degree | - | - |
| Bachelor's Degree | - | - |
| Graduate Degree | - | - |
| Total | $51,250 | $0 |
Family Income in Jayton
Family Income Brackets in Jayton
According to the Jayton family income data, there are 30 families falling into the $100,000 to $149,999 income range, which is the most common income bracket and makes up 32.3% of all families.
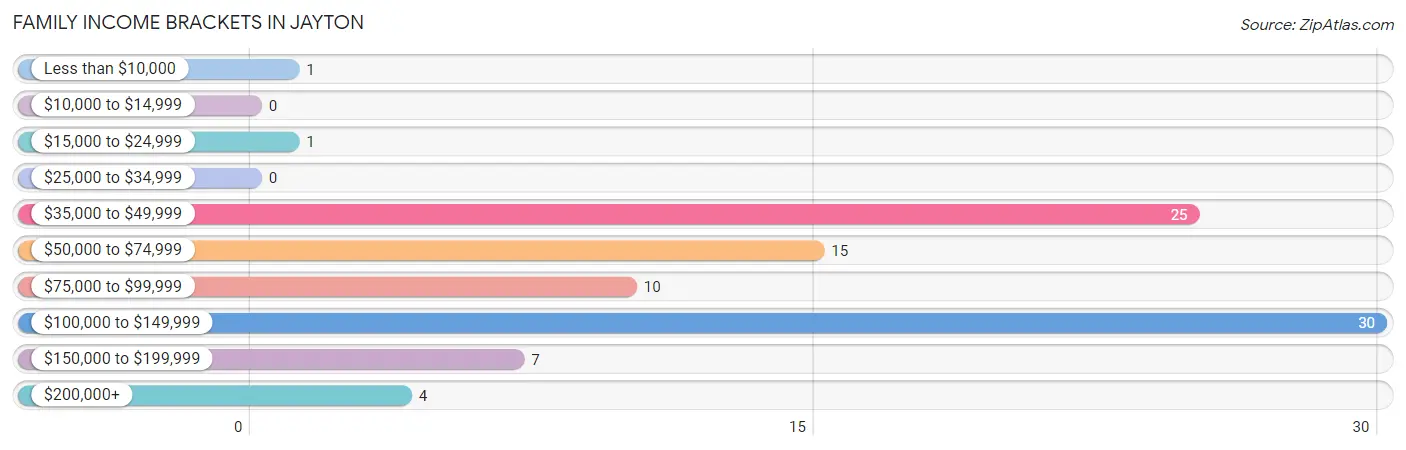
| Income Bracket | # Families | % Families |
| Less than $10,000 | 1 | 1.1% |
| $10,000 to $14,999 | 0 | 0.0% |
| $15,000 to $24,999 | 1 | 1.1% |
| $25,000 to $34,999 | 0 | 0.0% |
| $35,000 to $49,999 | 25 | 26.9% |
| $50,000 to $74,999 | 15 | 16.1% |
| $75,000 to $99,999 | 10 | 10.8% |
| $100,000 to $149,999 | 30 | 32.3% |
| $150,000 to $199,999 | 7 | 7.5% |
| $200,000+ | 4 | 4.3% |
Family Income by Famaliy Size in Jayton
4-person families (19 | 20.4%) account for the highest median family income in Jayton with $141,125 per family, while 4-person families (19 | 20.4%) have the highest median income of $35,281 per family member.
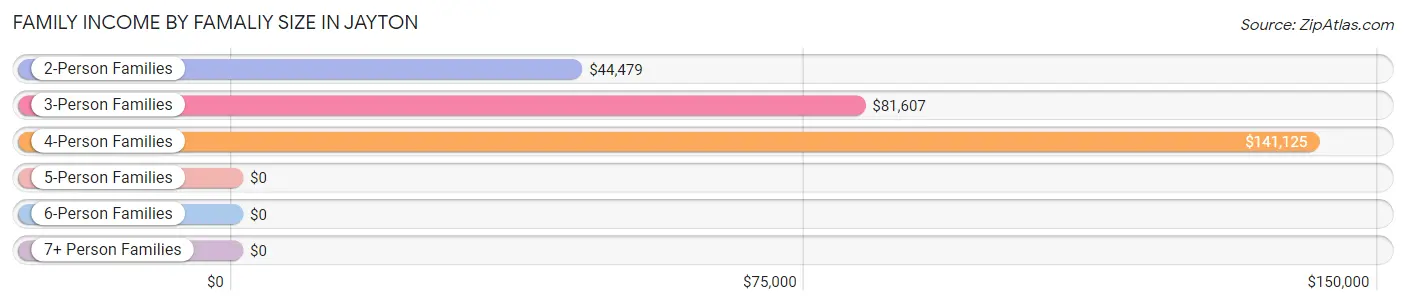
| Income Bracket | # Families | Median Income |
| 2-Person Families | 39 (41.9%) | $44,479 |
| 3-Person Families | 29 (31.2%) | $81,607 |
| 4-Person Families | 19 (20.4%) | $141,125 |
| 5-Person Families | 6 (6.5%) | $0 |
| 6-Person Families | 0 (0.0%) | $0 |
| 7+ Person Families | 0 (0.0%) | $0 |
| Total | 93 (100.0%) | $81,607 |
Family Income by Number of Earners in Jayton
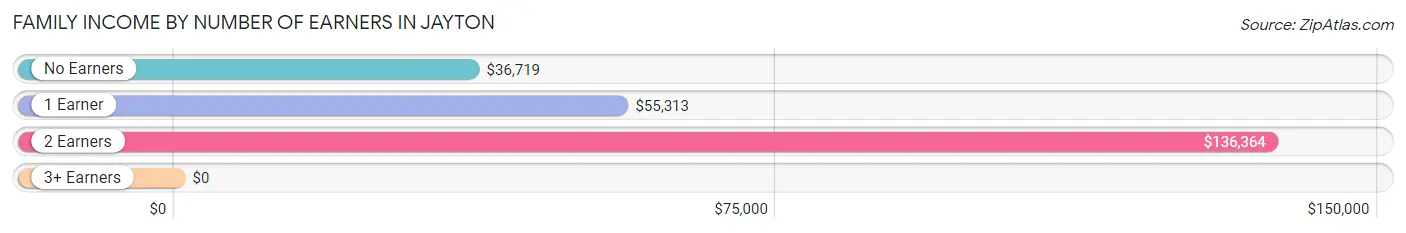
| Number of Earners | # Families | Median Income |
| No Earners | 11 (11.8%) | $36,719 |
| 1 Earner | 27 (29.0%) | $55,313 |
| 2 Earners | 52 (55.9%) | $136,364 |
| 3+ Earners | 3 (3.2%) | $0 |
| Total | 93 (100.0%) | $81,607 |
Household Income in Jayton
Household Income Brackets in Jayton
With 53 households falling in the category, the $50,000 to $74,999 income range is the most frequent in Jayton, accounting for 32.9% of all households.
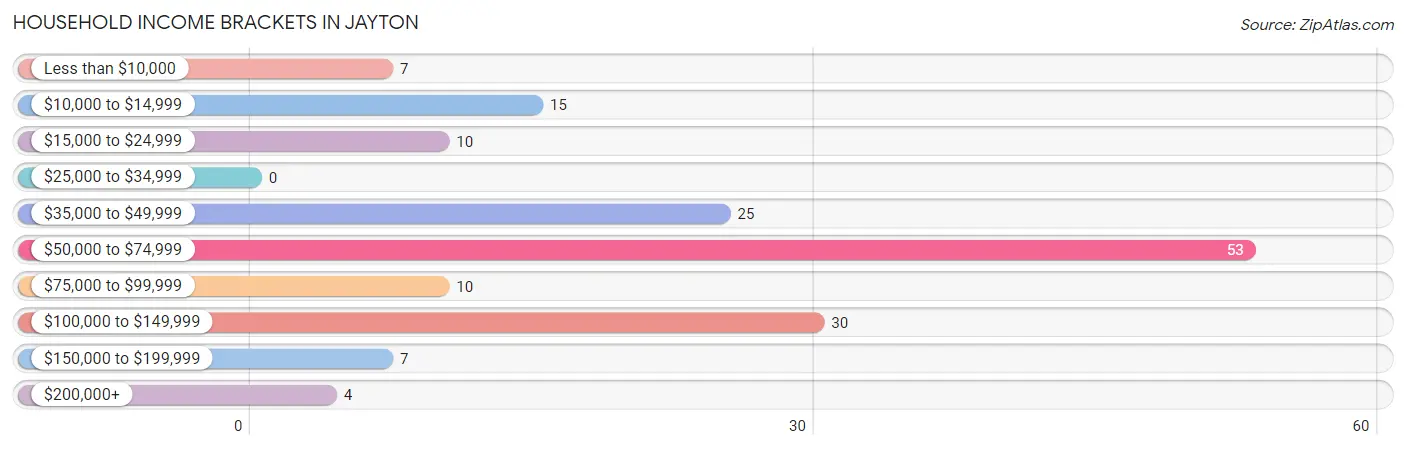
| Income Bracket | # Households | % Households |
| Less than $10,000 | 7 | 4.3% |
| $10,000 to $14,999 | 15 | 9.3% |
| $15,000 to $24,999 | 10 | 6.2% |
| $25,000 to $34,999 | 0 | 0.0% |
| $35,000 to $49,999 | 25 | 15.5% |
| $50,000 to $74,999 | 53 | 32.9% |
| $75,000 to $99,999 | 10 | 6.2% |
| $100,000 to $149,999 | 30 | 18.6% |
| $150,000 to $199,999 | 7 | 4.3% |
| $200,000+ | 4 | 2.5% |
Household Income by Householder Age in Jayton
The median household income in Jayton is $68,651, with the highest median household income of $115,417 found in the 25 to 44 years age bracket for the primary householder. A total of 37 households (23.0%) fall into this category.
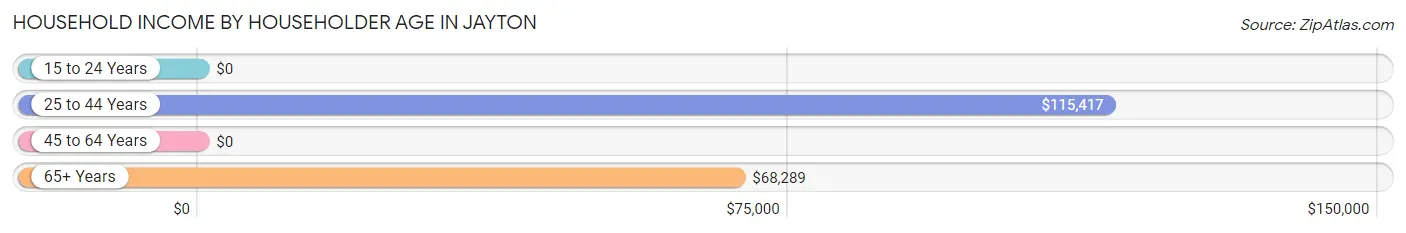
| Income Bracket | # Households | Median Income |
| 15 to 24 Years | 0 (0.0%) | $0 |
| 25 to 44 Years | 37 (23.0%) | $115,417 |
| 45 to 64 Years | 32 (19.9%) | $0 |
| 65+ Years | 92 (57.1%) | $68,289 |
| Total | 161 (100.0%) | $68,651 |
Poverty in Jayton
Income Below Poverty by Sex and Age in Jayton
With 10.9% poverty level for males and 8.3% for females among the residents of Jayton, 18 to 24 year old males and 55 to 64 year old females are the most vulnerable to poverty, with 13 males (76.5%) and 7 females (50.0%) in their respective age groups living below the poverty level.
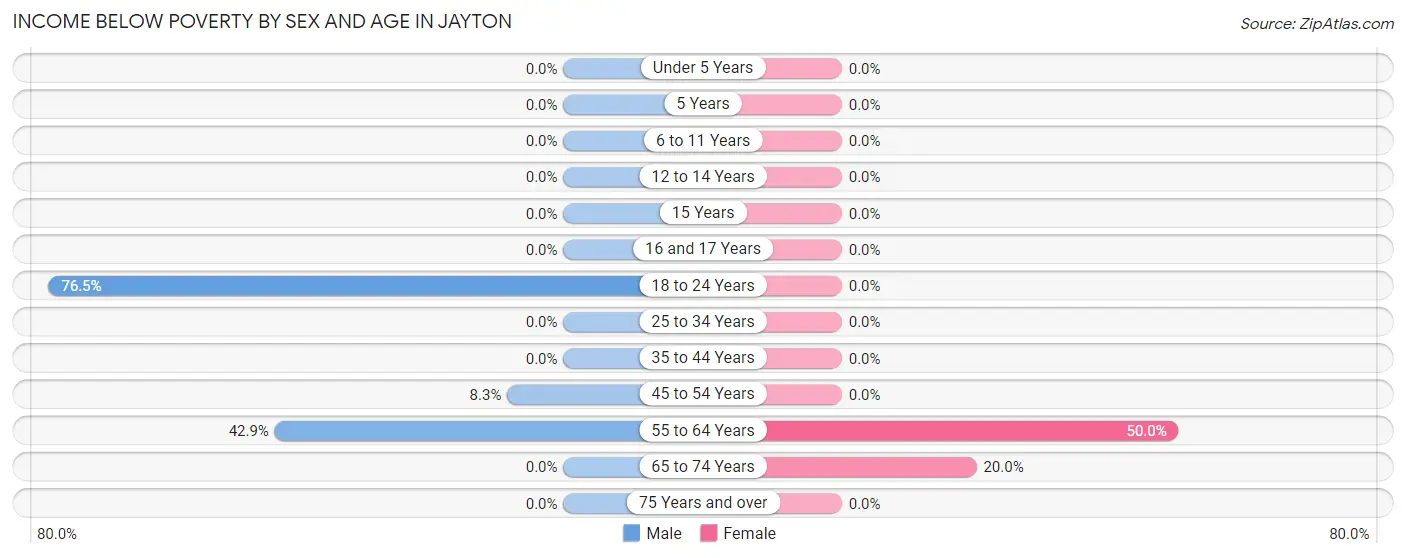
| Age Bracket | Male | Female |
| Under 5 Years | 0 (0.0%) | 0 (0.0%) |
| 5 Years | 0 (0.0%) | 0 (0.0%) |
| 6 to 11 Years | 0 (0.0%) | 0 (0.0%) |
| 12 to 14 Years | 0 (0.0%) | 0 (0.0%) |
| 15 Years | 0 (0.0%) | 0 (0.0%) |
| 16 and 17 Years | 0 (0.0%) | 0 (0.0%) |
| 18 to 24 Years | 13 (76.5%) | 0 (0.0%) |
| 25 to 34 Years | 0 (0.0%) | 0 (0.0%) |
| 35 to 44 Years | 0 (0.0%) | 0 (0.0%) |
| 45 to 54 Years | 1 (8.3%) | 0 (0.0%) |
| 55 to 64 Years | 6 (42.9%) | 7 (50.0%) |
| 65 to 74 Years | 0 (0.0%) | 8 (20.0%) |
| 75 Years and over | 0 (0.0%) | 0 (0.0%) |
| Total | 20 (10.9%) | 15 (8.3%) |
Income Above Poverty by Sex and Age in Jayton
According to the poverty statistics in Jayton, males aged 5 years and females aged under 5 years are the age groups that are most secure financially, with 100.0% of males and 100.0% of females in these age groups living above the poverty line.
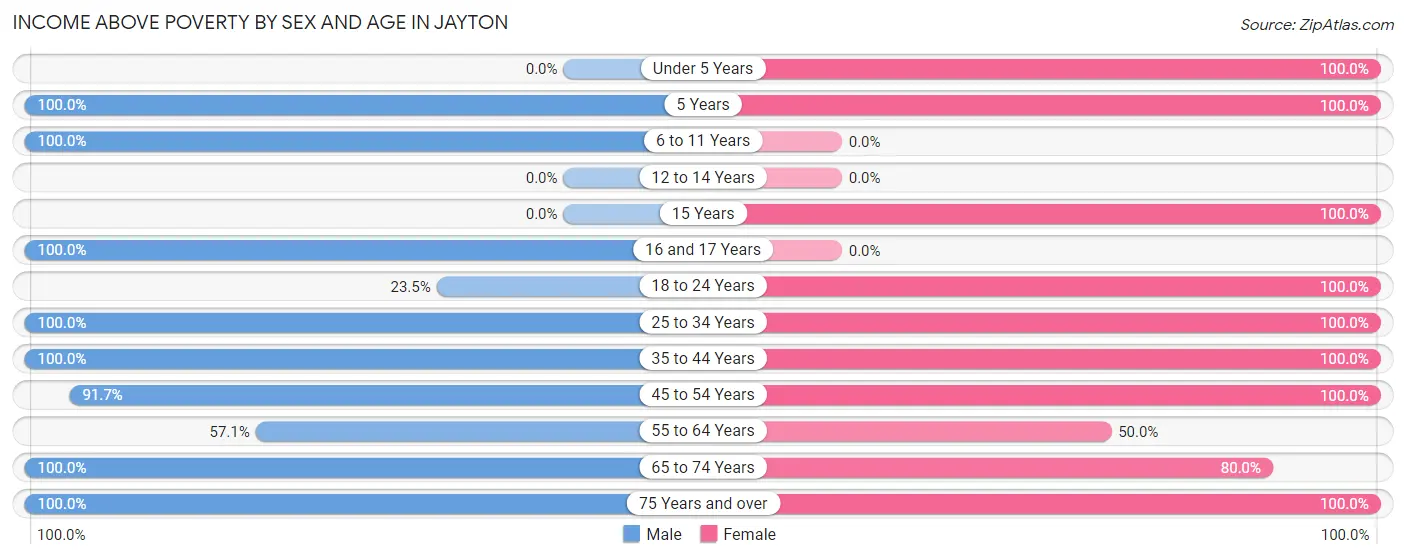
| Age Bracket | Male | Female |
| Under 5 Years | 0 (0.0%) | 20 (100.0%) |
| 5 Years | 12 (100.0%) | 6 (100.0%) |
| 6 to 11 Years | 47 (100.0%) | 0 (0.0%) |
| 12 to 14 Years | 0 (0.0%) | 0 (0.0%) |
| 15 Years | 0 (0.0%) | 2 (100.0%) |
| 16 and 17 Years | 3 (100.0%) | 0 (0.0%) |
| 18 to 24 Years | 4 (23.5%) | 14 (100.0%) |
| 25 to 34 Years | 8 (100.0%) | 10 (100.0%) |
| 35 to 44 Years | 36 (100.0%) | 9 (100.0%) |
| 45 to 54 Years | 11 (91.7%) | 11 (100.0%) |
| 55 to 64 Years | 8 (57.1%) | 7 (50.0%) |
| 65 to 74 Years | 24 (100.0%) | 32 (80.0%) |
| 75 Years and over | 10 (100.0%) | 55 (100.0%) |
| Total | 163 (89.1%) | 166 (91.7%) |
Income Below Poverty Among Married-Couple Families in Jayton
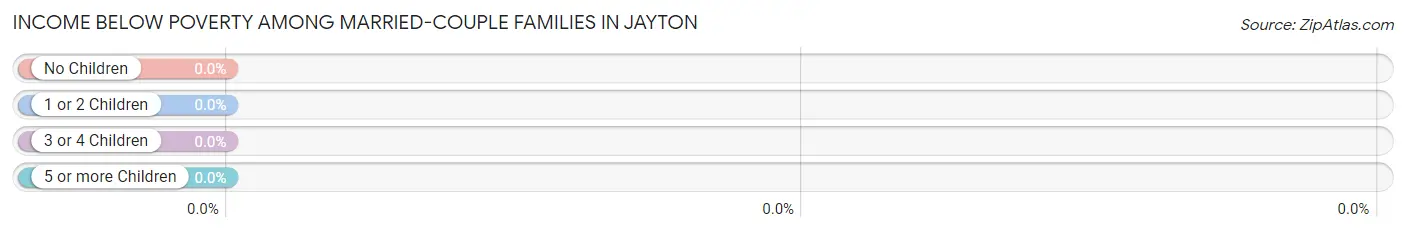
| Children | Above Poverty | Below Poverty |
| No Children | 45 (100.0%) | 0 (0.0%) |
| 1 or 2 Children | 27 (100.0%) | 0 (0.0%) |
| 3 or 4 Children | 6 (100.0%) | 0 (0.0%) |
| 5 or more Children | 0 (0.0%) | 0 (0.0%) |
| Total | 78 (100.0%) | 0 (0.0%) |
Income Below Poverty Among Single-Parent Households in Jayton
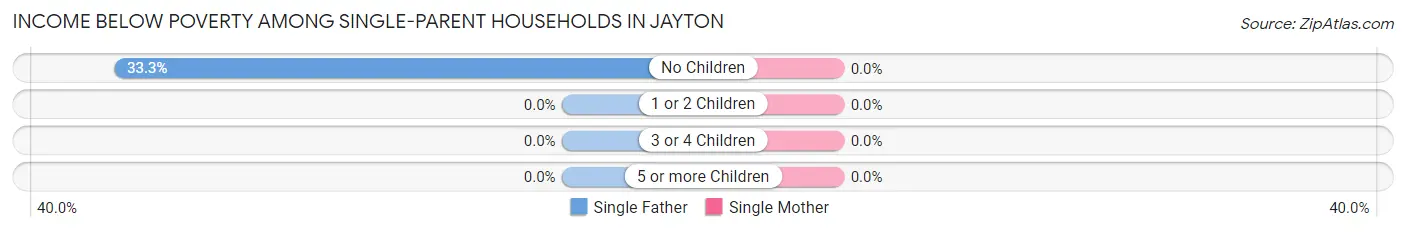
| Children | Single Father | Single Mother |
| No Children | 1 (33.3%) | 0 (0.0%) |
| 1 or 2 Children | 0 (0.0%) | 0 (0.0%) |
| 3 or 4 Children | 0 (0.0%) | 0 (0.0%) |
| 5 or more Children | 0 (0.0%) | 0 (0.0%) |
| Total | 1 (33.3%) | 0 (0.0%) |
Income Below Poverty Among Married-Couple vs Single-Parent Households in Jayton
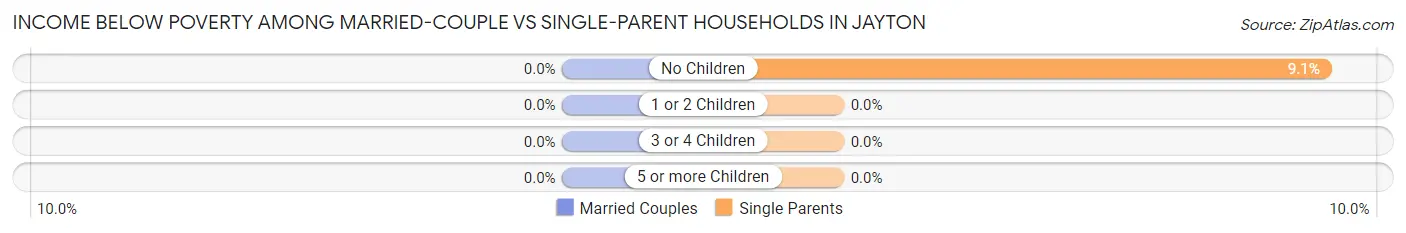
| Children | Married-Couple Families | Single-Parent Households |
| No Children | 0 (0.0%) | 1 (9.1%) |
| 1 or 2 Children | 0 (0.0%) | 0 (0.0%) |
| 3 or 4 Children | 0 (0.0%) | 0 (0.0%) |
| 5 or more Children | 0 (0.0%) | 0 (0.0%) |
| Total | 0 (0.0%) | 1 (6.7%) |
Race in Jayton
The most populous races in Jayton are White / Caucasian (356 | 84.6%), Hispanic or Latino (83 | 19.7%), and Two or more Races (34 | 8.1%).
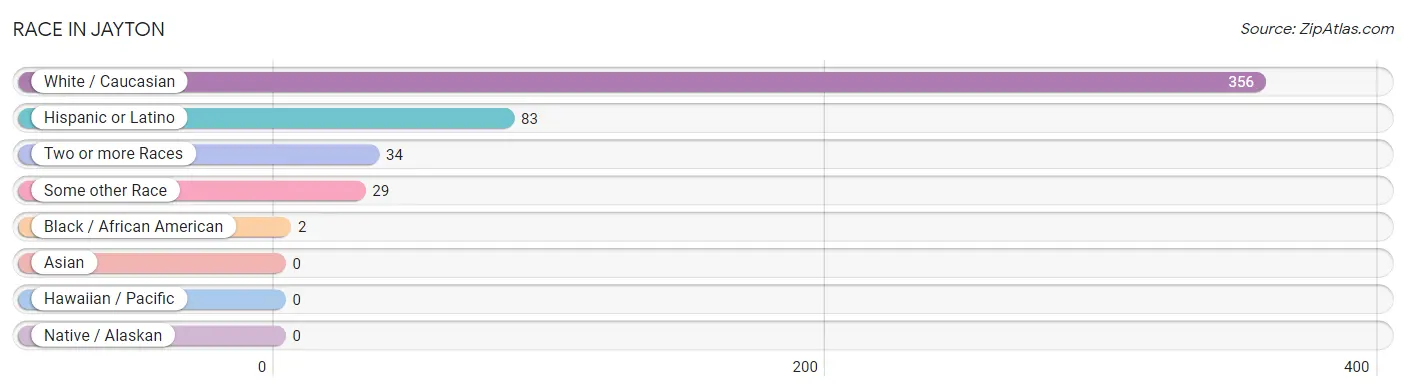
| Race | # Population | % Population |
| Asian | 0 | 0.0% |
| Black / African American | 2 | 0.5% |
| Hawaiian / Pacific | 0 | 0.0% |
| Hispanic or Latino | 83 | 19.7% |
| Native / Alaskan | 0 | 0.0% |
| White / Caucasian | 356 | 84.6% |
| Two or more Races | 34 | 8.1% |
| Some other Race | 29 | 6.9% |
| Total | 421 | 100.0% |
Ancestry in Jayton
The most populous ancestries reported in Jayton are Mexican (81 | 19.2%), English (69 | 16.4%), Scottish (45 | 10.7%), Irish (25 | 5.9%), and German (19 | 4.5%), together accounting for 56.8% of all Jayton residents.
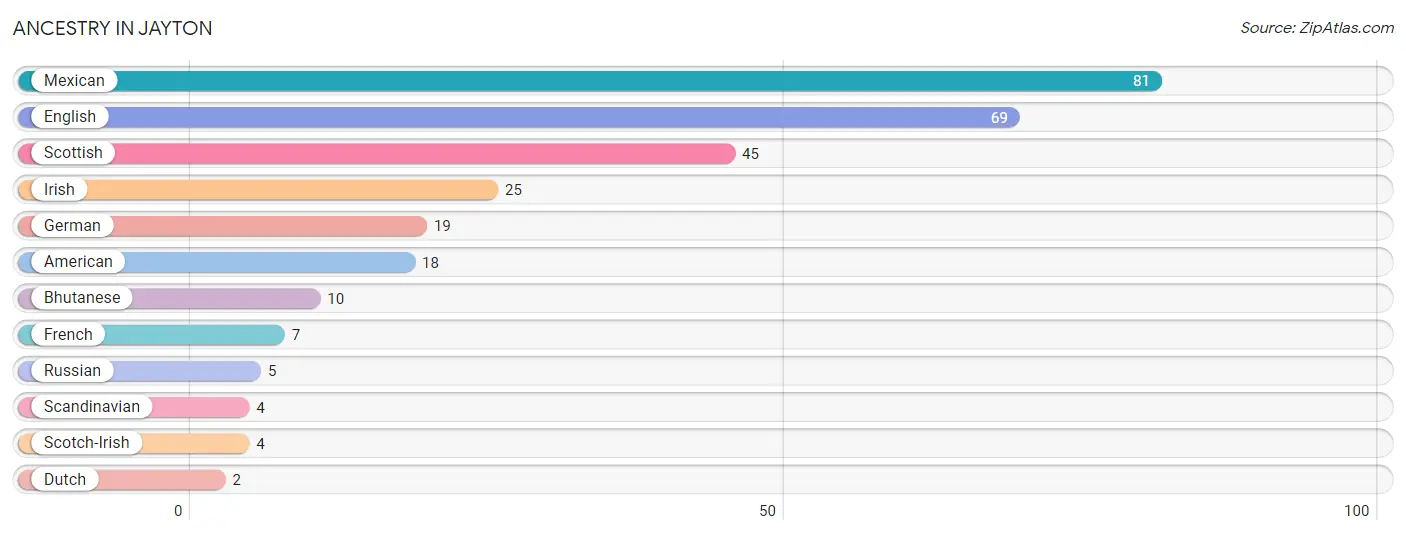
| Ancestry | # Population | % Population |
| American | 18 | 4.3% |
| Bhutanese | 10 | 2.4% |
| Dutch | 2 | 0.5% |
| English | 69 | 16.4% |
| French | 7 | 1.7% |
| German | 19 | 4.5% |
| Irish | 25 | 5.9% |
| Mexican | 81 | 19.2% |
| Russian | 5 | 1.2% |
| Scandinavian | 4 | 0.9% |
| Scotch-Irish | 4 | 0.9% |
| Scottish | 45 | 10.7% | View All 12 Rows |
Immigrants in Jayton
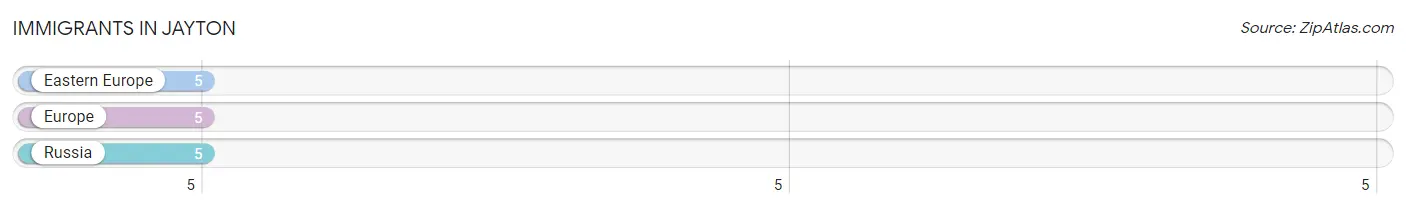
The most numerous immigrant groups reported in Jayton came from Eastern Europe (5 | 1.2%), Europe (5 | 1.2%), and Russia (5 | 1.2%), together accounting for 3.6% of all Jayton residents.
| Immigration Origin | # Population | % Population |
| Eastern Europe | 5 | 1.2% |
| Europe | 5 | 1.2% |
| Russia | 5 | 1.2% | View All 3 Rows |
Sex and Age in Jayton
Sex and Age in Jayton
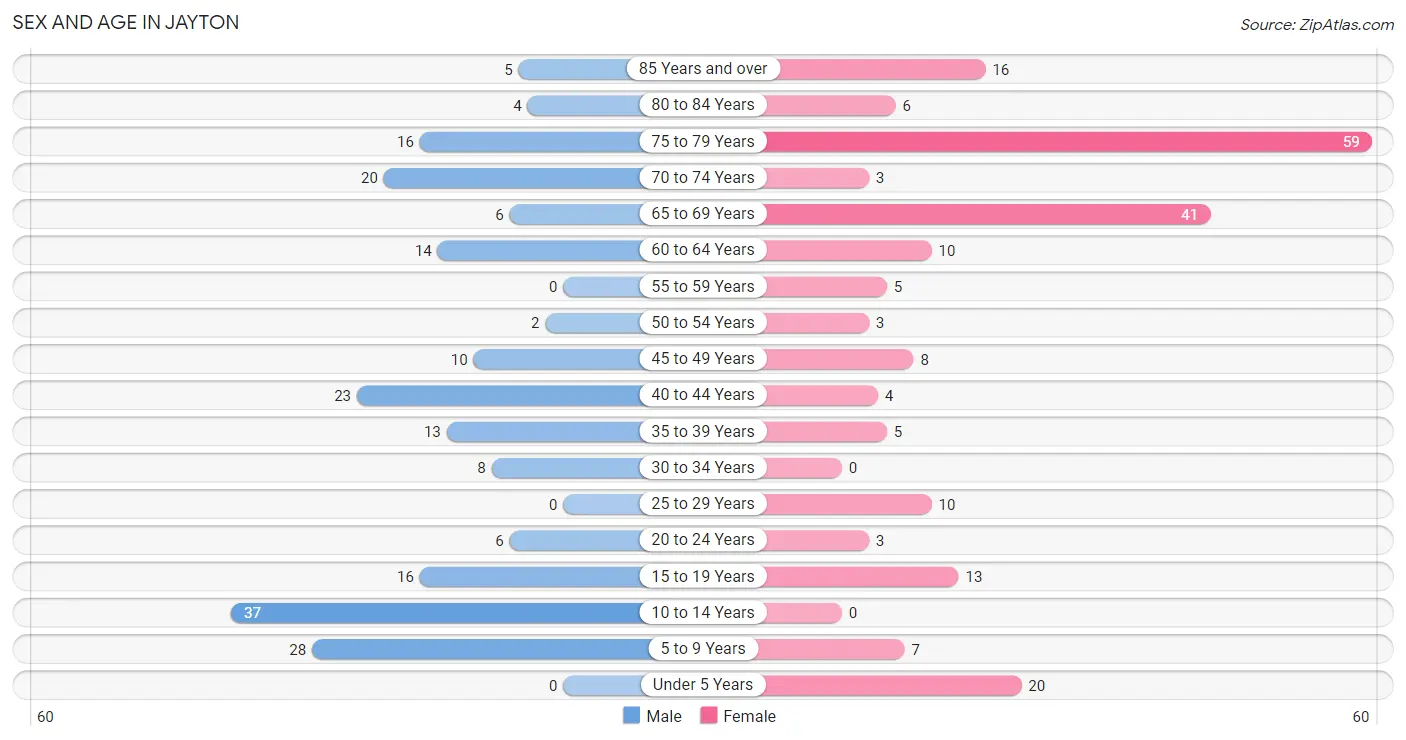
The most populous age groups in Jayton are 10 to 14 Years (37 | 17.8%) for men and 75 to 79 Years (59 | 27.7%) for women.
| Age Bracket | Male | Female |
| Under 5 Years | 0 (0.0%) | 20 (9.4%) |
| 5 to 9 Years | 28 (13.5%) | 7 (3.3%) |
| 10 to 14 Years | 37 (17.8%) | 0 (0.0%) |
| 15 to 19 Years | 16 (7.7%) | 13 (6.1%) |
| 20 to 24 Years | 6 (2.9%) | 3 (1.4%) |
| 25 to 29 Years | 0 (0.0%) | 10 (4.7%) |
| 30 to 34 Years | 8 (3.8%) | 0 (0.0%) |
| 35 to 39 Years | 13 (6.2%) | 5 (2.4%) |
| 40 to 44 Years | 23 (11.1%) | 4 (1.9%) |
| 45 to 49 Years | 10 (4.8%) | 8 (3.8%) |
| 50 to 54 Years | 2 (1.0%) | 3 (1.4%) |
| 55 to 59 Years | 0 (0.0%) | 5 (2.4%) |
| 60 to 64 Years | 14 (6.7%) | 10 (4.7%) |
| 65 to 69 Years | 6 (2.9%) | 41 (19.3%) |
| 70 to 74 Years | 20 (9.6%) | 3 (1.4%) |
| 75 to 79 Years | 16 (7.7%) | 59 (27.7%) |
| 80 to 84 Years | 4 (1.9%) | 6 (2.8%) |
| 85 Years and over | 5 (2.4%) | 16 (7.5%) |
| Total | 208 (100.0%) | 213 (100.0%) |
Families and Households in Jayton
Median Family Size in Jayton
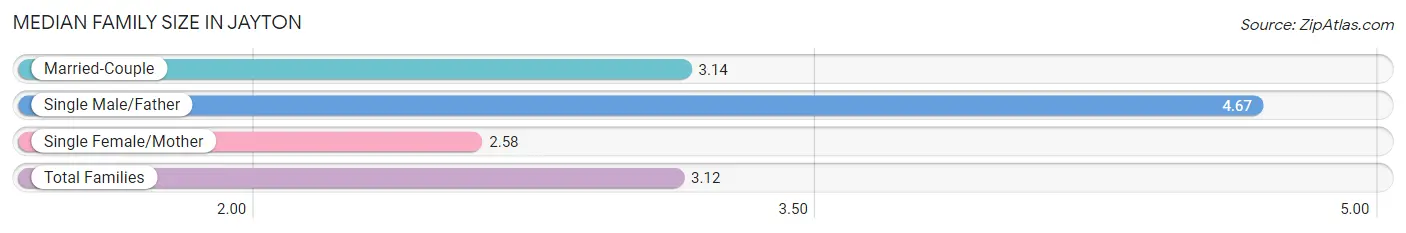
The median family size in Jayton is 3.12 persons per family, with single male/father families (3 | 3.2%) accounting for the largest median family size of 4.67 persons per family. On the other hand, single female/mother families (12 | 12.9%) represent the smallest median family size with 2.58 persons per family.
| Family Type | # Families | Family Size |
| Married-Couple | 78 (83.9%) | 3.14 |
| Single Male/Father | 3 (3.2%) | 4.67 |
| Single Female/Mother | 12 (12.9%) | 2.58 |
| Total Families | 93 (100.0%) | 3.12 |
Median Household Size in Jayton
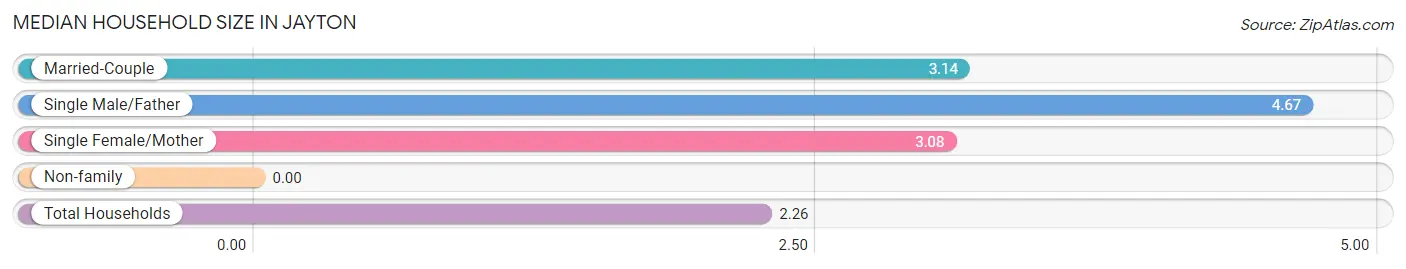
| Household Type | # Households | Household Size |
| Married-Couple | 78 (48.4%) | 3.14 |
| Single Male/Father | 3 (1.9%) | 4.67 |
| Single Female/Mother | 12 (7.4%) | 3.08 |
| Non-family | 68 (42.2%) | - |
| Total Households | 161 (100.0%) | 2.26 |
Household Size by Marriage Status in Jayton
Out of a total of 161 households in Jayton, 93 (57.8%) are family households, while 68 (42.2%) are nonfamily households. The most numerous type of family households are 2-person households, comprising 38, and the most common type of nonfamily households are 1-person households, comprising 68.
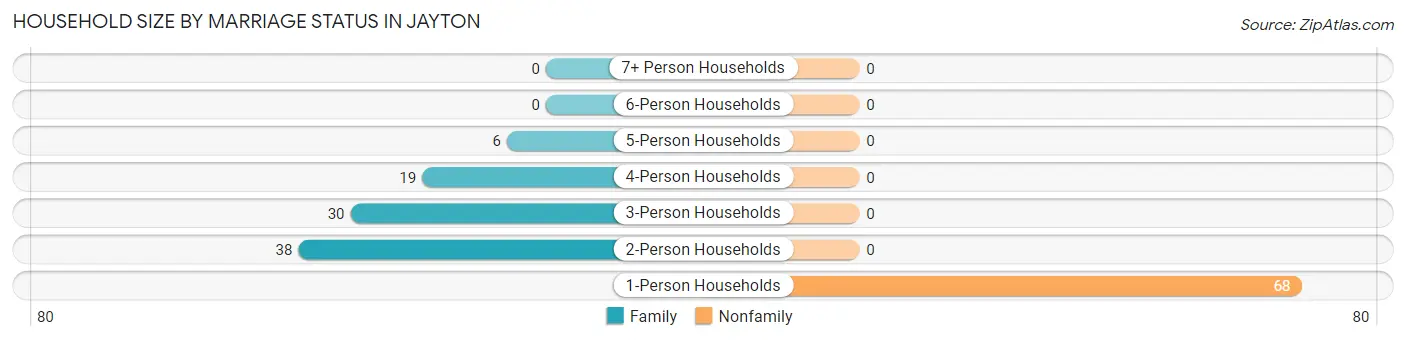
| Household Size | Family Households | Nonfamily Households |
| 1-Person Households | - | 68 (42.2%) |
| 2-Person Households | 38 (23.6%) | 0 (0.0%) |
| 3-Person Households | 30 (18.6%) | 0 (0.0%) |
| 4-Person Households | 19 (11.8%) | 0 (0.0%) |
| 5-Person Households | 6 (3.7%) | 0 (0.0%) |
| 6-Person Households | 0 (0.0%) | 0 (0.0%) |
| 7+ Person Households | 0 (0.0%) | 0 (0.0%) |
| Total | 93 (57.8%) | 68 (42.2%) |
Female Fertility in Jayton
Fertility by Age in Jayton
| Age Bracket | Women with Births | Births / 1,000 Women |
| 15 to 19 years | 0 (0.0%) | 0.0 |
| 20 to 34 years | 0 (0.0%) | 0.0 |
| 35 to 50 years | 0 (0.0%) | 0.0 |
| Total | 0 (0.0%) | 0.0 |
Fertility by Age by Marriage Status in Jayton
| Age Bracket | Married | Unmarried |
| 15 to 19 years | 0 (0.0%) | 0 (0.0%) |
| 20 to 34 years | 0 (0.0%) | 0 (0.0%) |
| 35 to 50 years | 0 (0.0%) | 0 (0.0%) |
| Total | 0 (0.0%) | 0 (0.0%) |
Fertility by Education in Jayton
| Educational Attainment | Women with Births | Births / 1,000 Women |
| Less than High School | 0 (0.0%) | 0.0 |
| High School Diploma | 0 (0.0%) | 0.0 |
| College or Associate's Degree | 0 (0.0%) | 0.0 |
| Bachelor's Degree | 0 (0.0%) | 0.0 |
| Graduate Degree | 0 (0.0%) | 0.0 |
| Total | 0 (0.0%) | 0.0 |
Fertility by Education by Marriage Status in Jayton
| Educational Attainment | Married | Unmarried |
| Less than High School | 0 (0.0%) | 0 (0.0%) |
| High School Diploma | 0 (0.0%) | 0 (0.0%) |
| College or Associate's Degree | 0 (0.0%) | 0 (0.0%) |
| Bachelor's Degree | 0 (0.0%) | 0 (0.0%) |
| Graduate Degree | 0 (0.0%) | 0 (0.0%) |
| Total | 0 (0.0%) | 0 (0.0%) |
Employment Characteristics in Jayton
Employment by Class of Employer in Jayton
Among the 137 employed individuals in Jayton, private company employees (67 | 48.9%), not-for-profit organizations (28 | 20.4%), and local government employees (27 | 19.7%) make up the most common classes of employment.
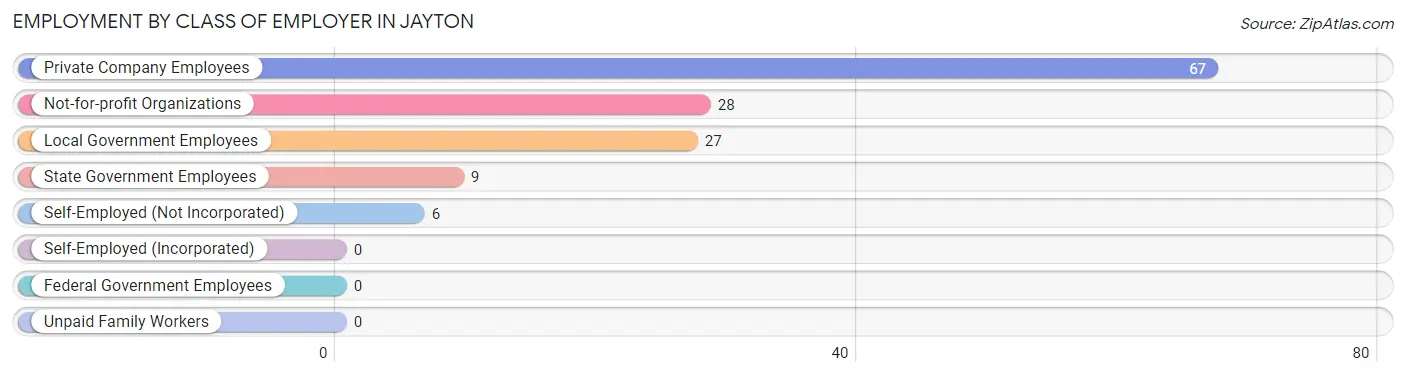
| Employer Class | # Employees | % Employees |
| Private Company Employees | 67 | 48.9% |
| Self-Employed (Incorporated) | 0 | 0.0% |
| Self-Employed (Not Incorporated) | 6 | 4.4% |
| Not-for-profit Organizations | 28 | 20.4% |
| Local Government Employees | 27 | 19.7% |
| State Government Employees | 9 | 6.6% |
| Federal Government Employees | 0 | 0.0% |
| Unpaid Family Workers | 0 | 0.0% |
| Total | 137 | 100.0% |
Employment Status by Age in Jayton
According to the labor force statistics for Jayton, out of the total population over 16 years of age (325), 44.9% or 146 individuals are in the labor force, with 2.1% or 3 of them unemployed. The age group with the highest labor force participation rate is 20 to 24 years, with 100.0% or 9 individuals in the labor force. Within the labor force, the 20 to 24 years age range has the highest percentage of unemployed individuals, with 33.3% or 3 of them being unemployed.
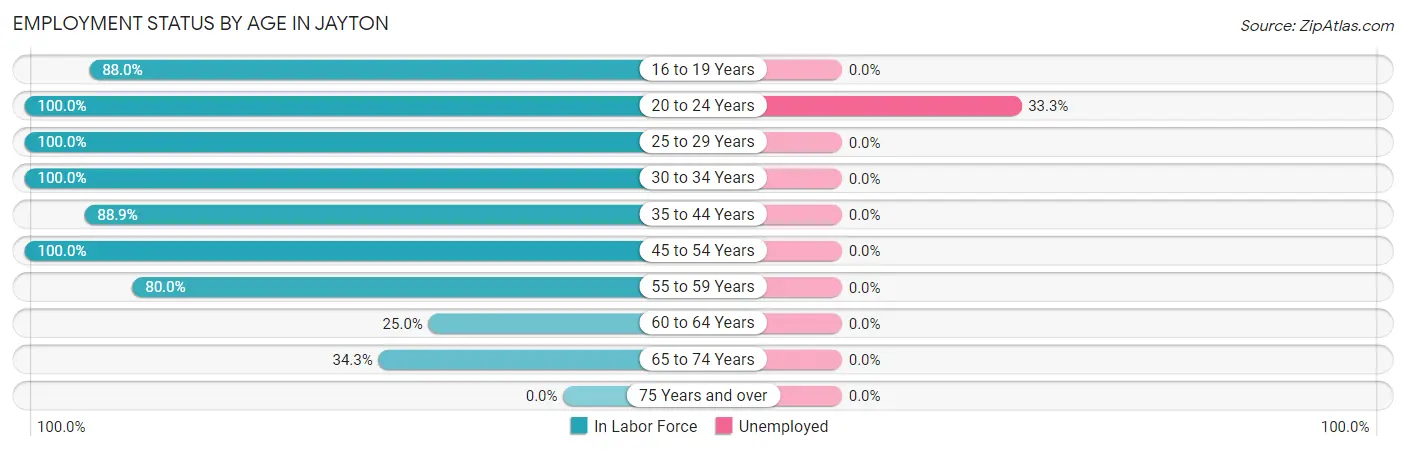
| Age Bracket | In Labor Force | Unemployed |
| 16 to 19 Years | 22 (88.0%) | 0 (0.0%) |
| 20 to 24 Years | 9 (100.0%) | 3 (33.3%) |
| 25 to 29 Years | 10 (100.0%) | 0 (0.0%) |
| 30 to 34 Years | 8 (100.0%) | 0 (0.0%) |
| 35 to 44 Years | 40 (88.9%) | 0 (0.0%) |
| 45 to 54 Years | 23 (100.0%) | 0 (0.0%) |
| 55 to 59 Years | 4 (80.0%) | 0 (0.0%) |
| 60 to 64 Years | 6 (25.0%) | 0 (0.0%) |
| 65 to 74 Years | 24 (34.3%) | 0 (0.0%) |
| 75 Years and over | 0 (0.0%) | 0 (0.0%) |
| Total | 146 (44.9%) | 3 (2.1%) |
Employment Status by Educational Attainment in Jayton
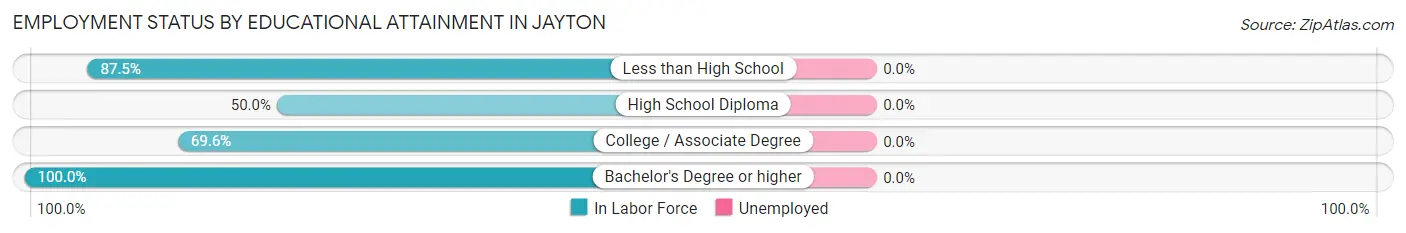
| Educational Attainment | In Labor Force | Unemployed |
| Less than High School | 14 (87.5%) | 0 (0.0%) |
| High School Diploma | 8 (50.0%) | 0 (0.0%) |
| College / Associate Degree | 32 (69.6%) | 0 (0.0%) |
| Bachelor's Degree or higher | 37 (100.0%) | 0 (0.0%) |
| Total | 91 (79.1%) | 0 (0.0%) |
Employment Occupations by Sex in Jayton
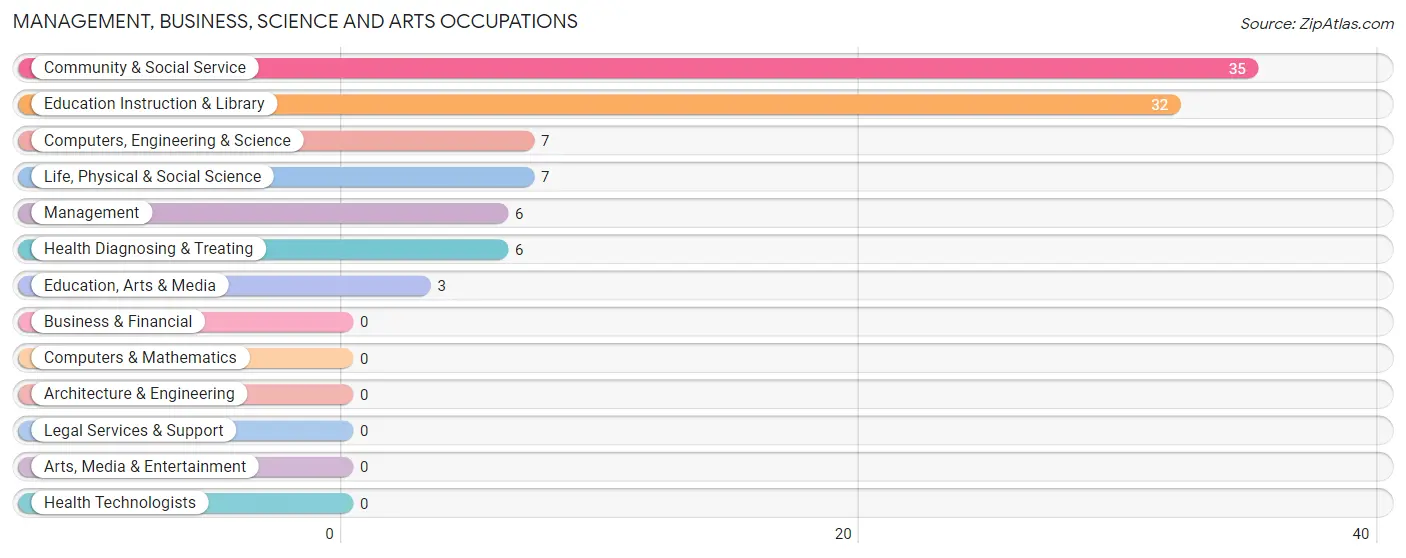
Management, Business, Science and Arts Occupations
The most common Management, Business, Science and Arts occupations in Jayton are Community & Social Service (35 | 24.5%), Education Instruction & Library (32 | 22.4%), Computers, Engineering & Science (7 | 4.9%), Life, Physical & Social Science (7 | 4.9%), and Management (6 | 4.2%).
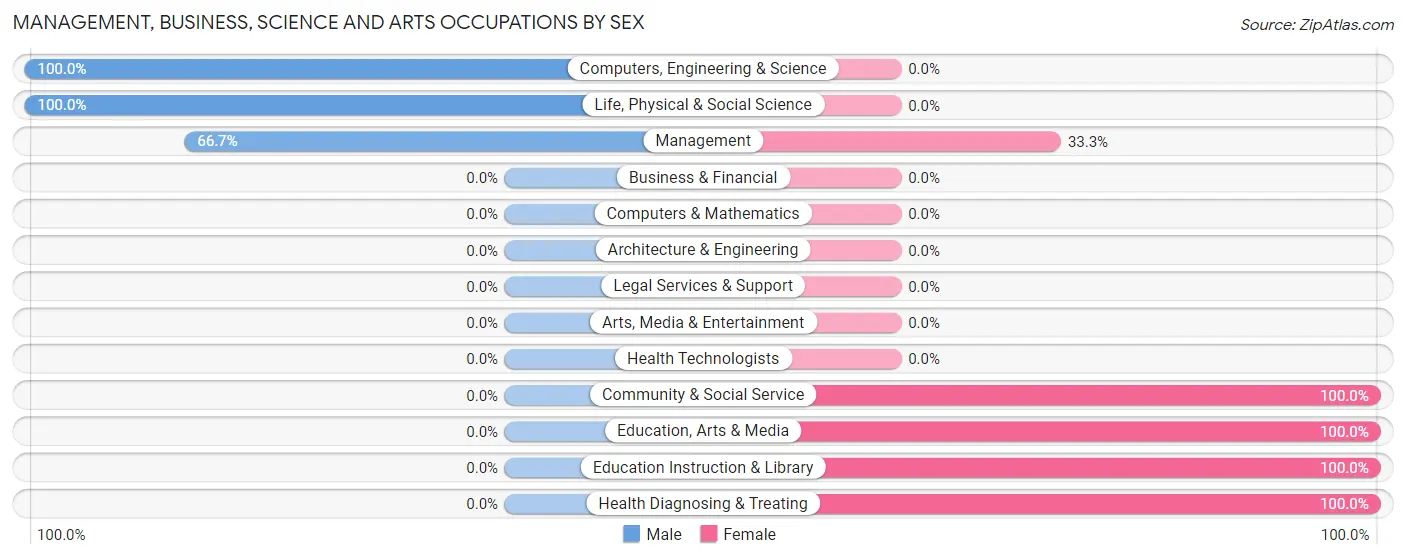
Management, Business, Science and Arts Occupations by Sex
Within the Management, Business, Science and Arts occupations in Jayton, the most male-oriented occupations are Computers, Engineering & Science (100.0%), Life, Physical & Social Science (100.0%), and Management (66.7%), while the most female-oriented occupations are Community & Social Service (100.0%), Education, Arts & Media (100.0%), and Education Instruction & Library (100.0%).
| Occupation | Male | Female |
| Management | 4 (66.7%) | 2 (33.3%) |
| Business & Financial | 0 (0.0%) | 0 (0.0%) |
| Computers, Engineering & Science | 7 (100.0%) | 0 (0.0%) |
| Computers & Mathematics | 0 (0.0%) | 0 (0.0%) |
| Architecture & Engineering | 0 (0.0%) | 0 (0.0%) |
| Life, Physical & Social Science | 7 (100.0%) | 0 (0.0%) |
| Community & Social Service | 0 (0.0%) | 35 (100.0%) |
| Education, Arts & Media | 0 (0.0%) | 3 (100.0%) |
| Legal Services & Support | 0 (0.0%) | 0 (0.0%) |
| Education Instruction & Library | 0 (0.0%) | 32 (100.0%) |
| Arts, Media & Entertainment | 0 (0.0%) | 0 (0.0%) |
| Health Diagnosing & Treating | 0 (0.0%) | 6 (100.0%) |
| Health Technologists | 0 (0.0%) | 0 (0.0%) |
| Total (Category) | 11 (20.4%) | 43 (79.6%) |
| Total (Overall) | 75 (52.4%) | 68 (47.5%) |
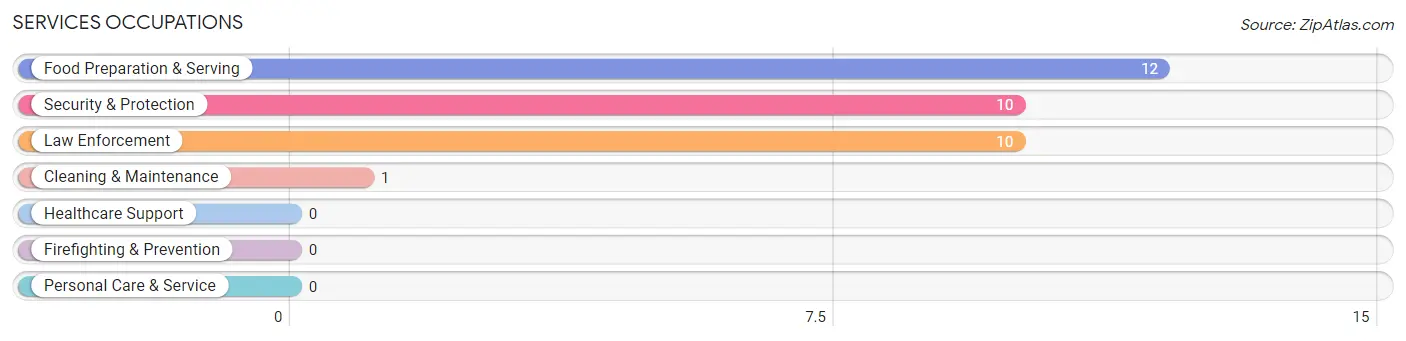
Services Occupations
The most common Services occupations in Jayton are Food Preparation & Serving (12 | 8.4%), Security & Protection (10 | 7.0%), Law Enforcement (10 | 7.0%), and Cleaning & Maintenance (1 | 0.7%).
Services Occupations by Sex
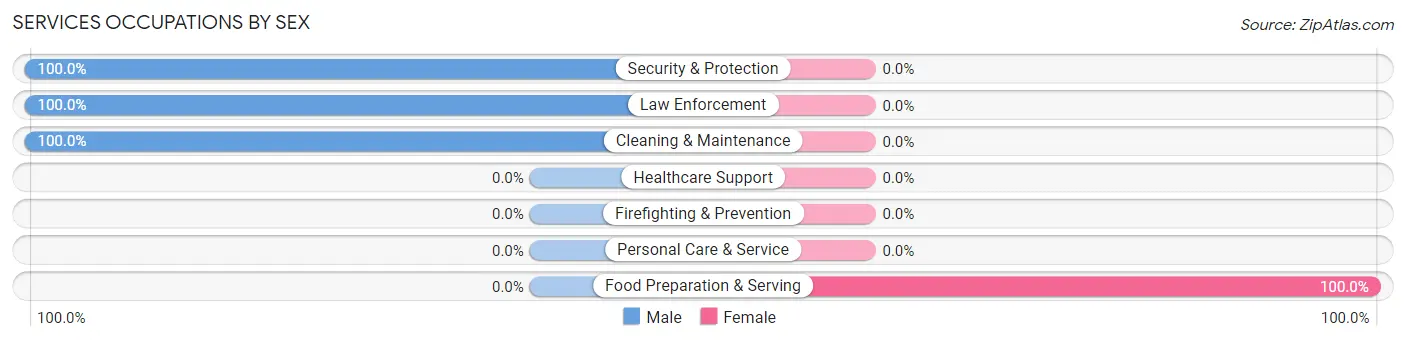
| Occupation | Male | Female |
| Healthcare Support | 0 (0.0%) | 0 (0.0%) |
| Security & Protection | 10 (100.0%) | 0 (0.0%) |
| Firefighting & Prevention | 0 (0.0%) | 0 (0.0%) |
| Law Enforcement | 10 (100.0%) | 0 (0.0%) |
| Food Preparation & Serving | 0 (0.0%) | 12 (100.0%) |
| Cleaning & Maintenance | 1 (100.0%) | 0 (0.0%) |
| Personal Care & Service | 0 (0.0%) | 0 (0.0%) |
| Total (Category) | 11 (47.8%) | 12 (52.2%) |
| Total (Overall) | 75 (52.4%) | 68 (47.5%) |
Sales and Office Occupations
The most common Sales and Office occupations in Jayton are Office & Administration (8 | 5.6%), and Sales & Related (5 | 3.5%).
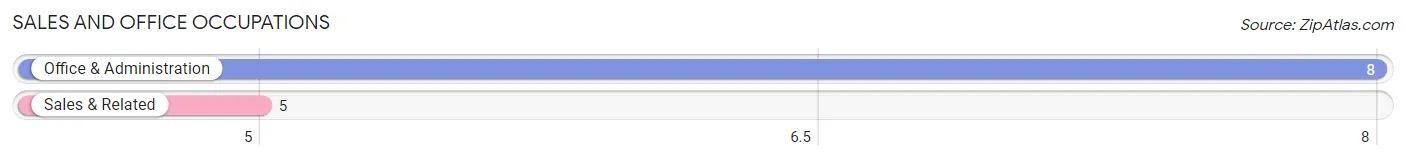
Sales and Office Occupations by Sex
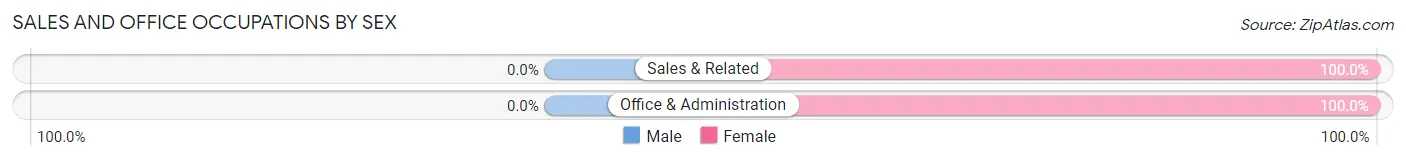
| Occupation | Male | Female |
| Sales & Related | 0 (0.0%) | 5 (100.0%) |
| Office & Administration | 0 (0.0%) | 8 (100.0%) |
| Total (Category) | 0 (0.0%) | 13 (100.0%) |
| Total (Overall) | 75 (52.4%) | 68 (47.5%) |
Natural Resources, Construction and Maintenance Occupations
The most common Natural Resources, Construction and Maintenance occupations in Jayton are Installation, Maintenance & Repair (25 | 17.5%), and Construction & Extraction (15 | 10.5%).
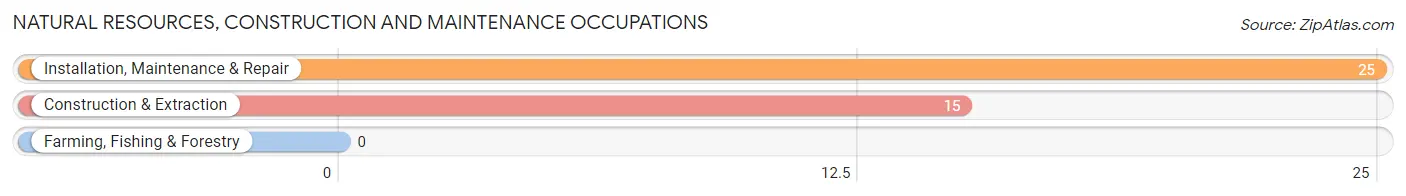
Natural Resources, Construction and Maintenance Occupations by Sex
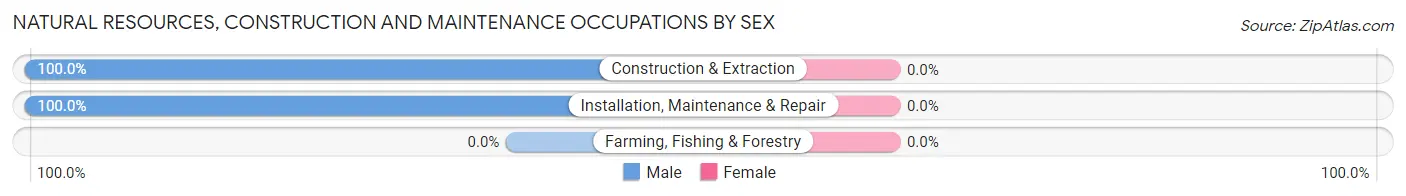
| Occupation | Male | Female |
| Farming, Fishing & Forestry | 0 (0.0%) | 0 (0.0%) |
| Construction & Extraction | 15 (100.0%) | 0 (0.0%) |
| Installation, Maintenance & Repair | 25 (100.0%) | 0 (0.0%) |
| Total (Category) | 40 (100.0%) | 0 (0.0%) |
| Total (Overall) | 75 (52.4%) | 68 (47.5%) |
Production, Transportation and Moving Occupations
The most common Production, Transportation and Moving occupations in Jayton are , and Material Moving (13 | 9.1%).
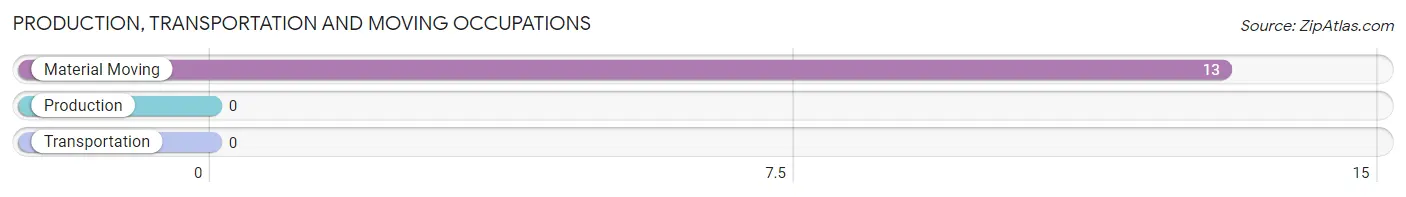
Production, Transportation and Moving Occupations by Sex
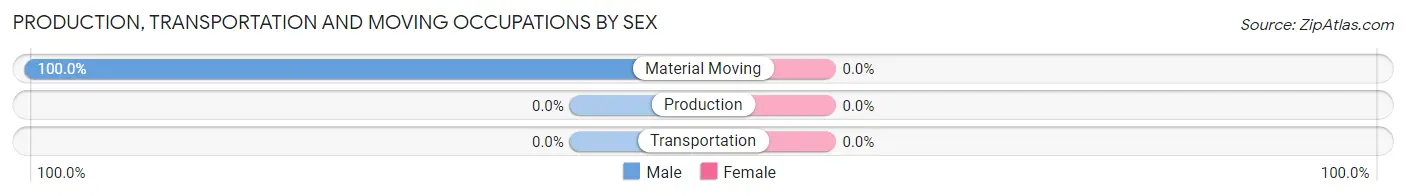
| Occupation | Male | Female |
| Production | 0 (0.0%) | 0 (0.0%) |
| Transportation | 0 (0.0%) | 0 (0.0%) |
| Material Moving | 13 (100.0%) | 0 (0.0%) |
| Total (Category) | 13 (100.0%) | 0 (0.0%) |
| Total (Overall) | 75 (52.4%) | 68 (47.5%) |
Employment Industries by Sex in Jayton
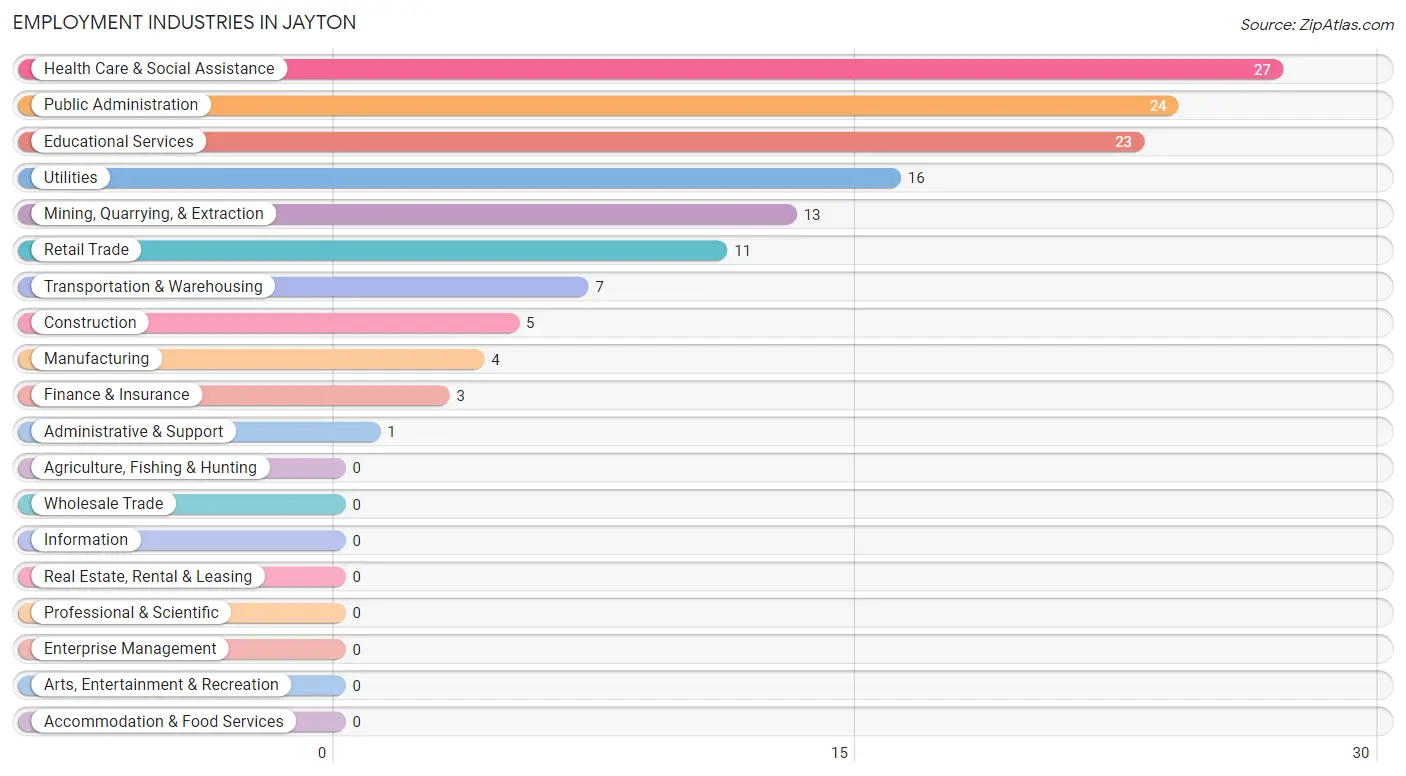
Employment Industries in Jayton
The major employment industries in Jayton include Health Care & Social Assistance (27 | 18.9%), Public Administration (24 | 16.8%), Educational Services (23 | 16.1%), Utilities (16 | 11.2%), and Mining, Quarrying, & Extraction (13 | 9.1%).
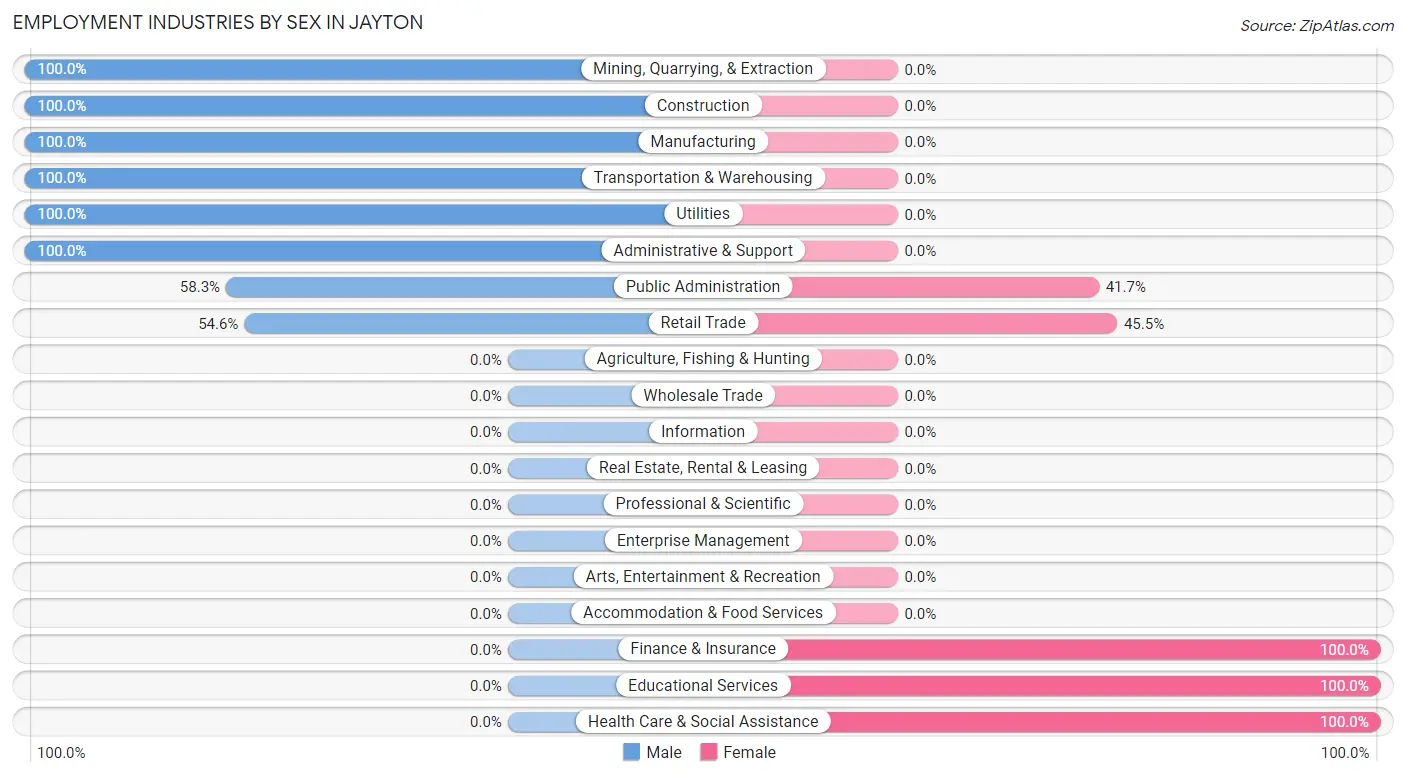
Employment Industries by Sex in Jayton
The Jayton industries that see more men than women are Mining, Quarrying, & Extraction (100.0%), Construction (100.0%), and Manufacturing (100.0%), whereas the industries that tend to have a higher number of women are Finance & Insurance (100.0%), Educational Services (100.0%), and Health Care & Social Assistance (100.0%).
| Industry | Male | Female |
| Agriculture, Fishing & Hunting | 0 (0.0%) | 0 (0.0%) |
| Mining, Quarrying, & Extraction | 13 (100.0%) | 0 (0.0%) |
| Construction | 5 (100.0%) | 0 (0.0%) |
| Manufacturing | 4 (100.0%) | 0 (0.0%) |
| Wholesale Trade | 0 (0.0%) | 0 (0.0%) |
| Retail Trade | 6 (54.5%) | 5 (45.5%) |
| Transportation & Warehousing | 7 (100.0%) | 0 (0.0%) |
| Utilities | 16 (100.0%) | 0 (0.0%) |
| Information | 0 (0.0%) | 0 (0.0%) |
| Finance & Insurance | 0 (0.0%) | 3 (100.0%) |
| Real Estate, Rental & Leasing | 0 (0.0%) | 0 (0.0%) |
| Professional & Scientific | 0 (0.0%) | 0 (0.0%) |
| Enterprise Management | 0 (0.0%) | 0 (0.0%) |
| Administrative & Support | 1 (100.0%) | 0 (0.0%) |
| Educational Services | 0 (0.0%) | 23 (100.0%) |
| Health Care & Social Assistance | 0 (0.0%) | 27 (100.0%) |
| Arts, Entertainment & Recreation | 0 (0.0%) | 0 (0.0%) |
| Accommodation & Food Services | 0 (0.0%) | 0 (0.0%) |
| Public Administration | 14 (58.3%) | 10 (41.7%) |
| Total | 75 (52.4%) | 68 (47.5%) |
Education in Jayton
School Enrollment in Jayton
The most common levels of schooling among the 112 students in Jayton are elementary school (42 | 37.5%), college / undergraduate (19 | 17.0%), and kindergarten (18 | 16.1%).
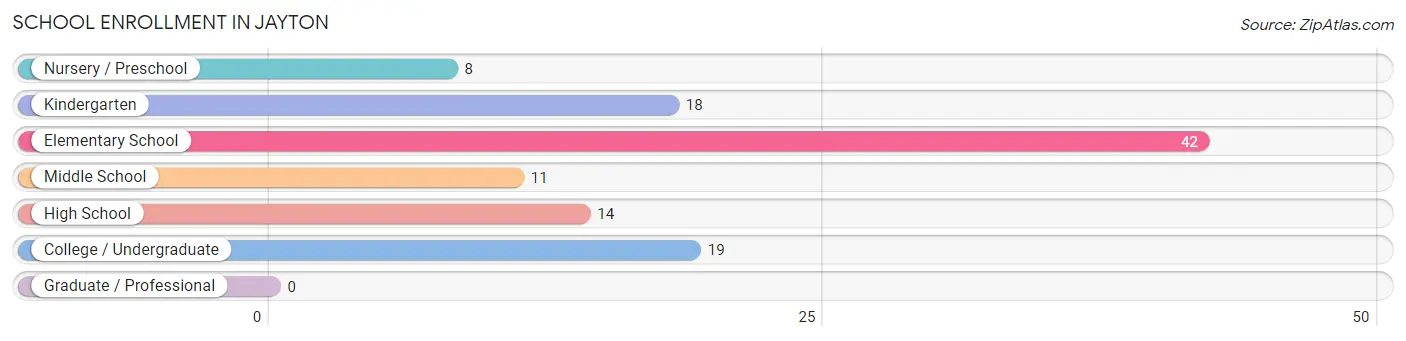
| School Level | # Students | % Students |
| Nursery / Preschool | 8 | 7.1% |
| Kindergarten | 18 | 16.1% |
| Elementary School | 42 | 37.5% |
| Middle School | 11 | 9.8% |
| High School | 14 | 12.5% |
| College / Undergraduate | 19 | 17.0% |
| Graduate / Professional | 0 | 0.0% |
| Total | 112 | 100.0% |
School Enrollment by Age by Funding Source in Jayton
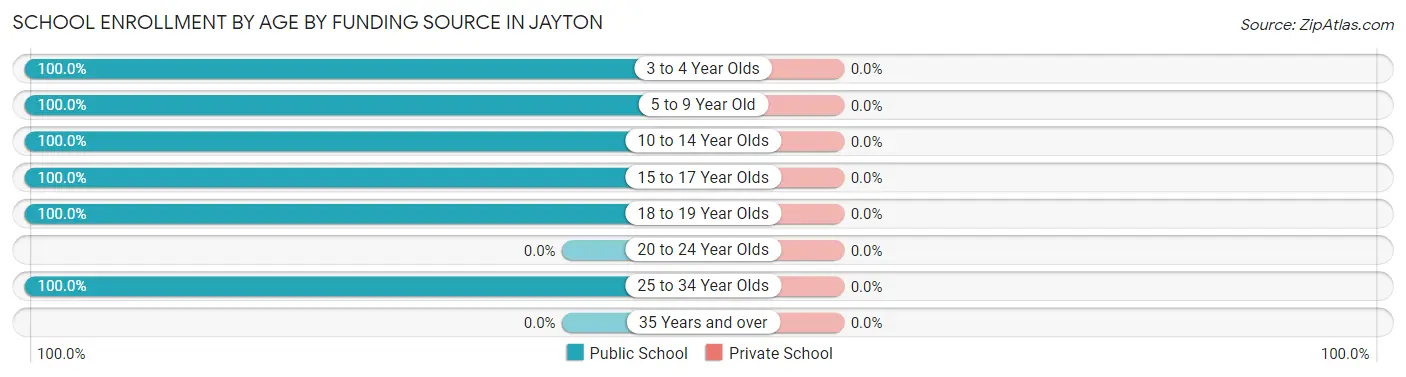
| Age Bracket | Public School | Private School |
| 3 to 4 Year Olds | 8 (100.0%) | 0 (0.0%) |
| 5 to 9 Year Old | 34 (100.0%) | 0 (0.0%) |
| 10 to 14 Year Olds | 37 (100.0%) | 0 (0.0%) |
| 15 to 17 Year Olds | 7 (100.0%) | 0 (0.0%) |
| 18 to 19 Year Olds | 18 (100.0%) | 0 (0.0%) |
| 20 to 24 Year Olds | 0 (0.0%) | 0 (0.0%) |
| 25 to 34 Year Olds | 8 (100.0%) | 0 (0.0%) |
| 35 Years and over | 0 (0.0%) | 0 (0.0%) |
| Total | 112 (100.0%) | 0 (0.0%) |
Educational Attainment by Field of Study in Jayton
Education (68 | 73.1%), bio, nature & agricultural (15 | 16.1%), science & technology (4 | 4.3%), social sciences (2 | 2.1%), and arts & humanities (2 | 2.1%) are the most common fields of study among 93 individuals in Jayton who have obtained a bachelor's degree or higher.
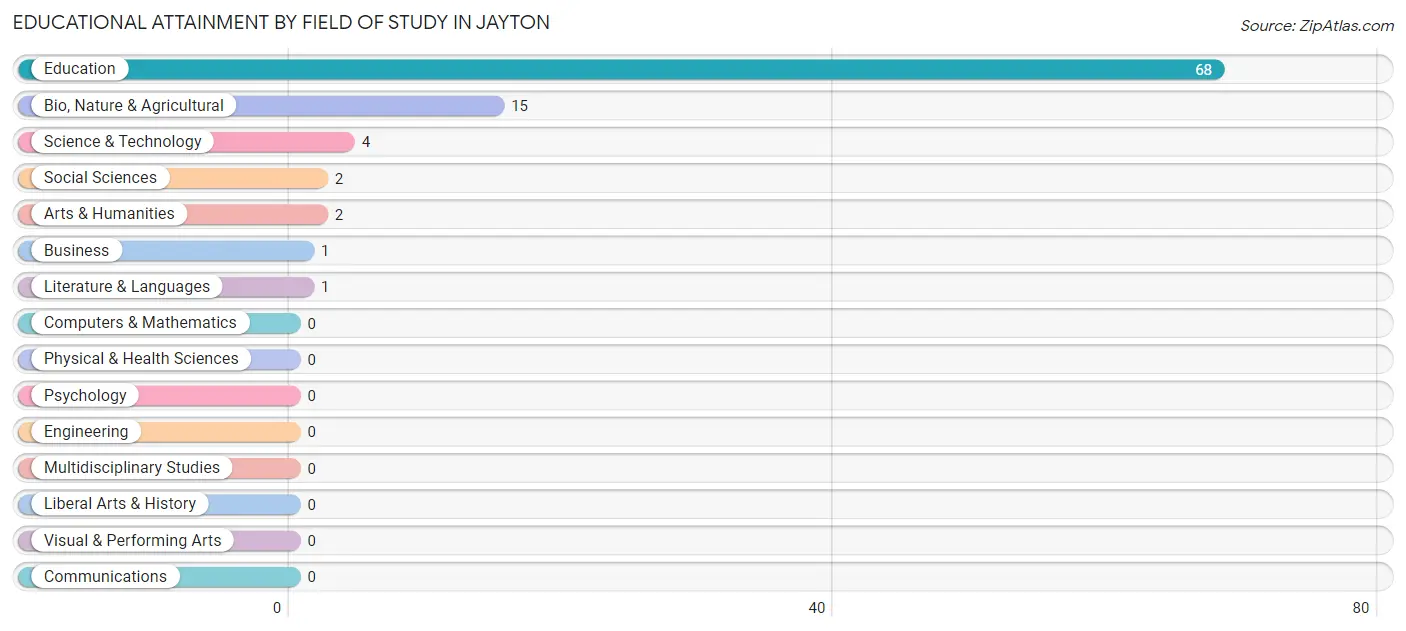
| Field of Study | # Graduates | % Graduates |
| Computers & Mathematics | 0 | 0.0% |
| Bio, Nature & Agricultural | 15 | 16.1% |
| Physical & Health Sciences | 0 | 0.0% |
| Psychology | 0 | 0.0% |
| Social Sciences | 2 | 2.1% |
| Engineering | 0 | 0.0% |
| Multidisciplinary Studies | 0 | 0.0% |
| Science & Technology | 4 | 4.3% |
| Business | 1 | 1.1% |
| Education | 68 | 73.1% |
| Literature & Languages | 1 | 1.1% |
| Liberal Arts & History | 0 | 0.0% |
| Visual & Performing Arts | 0 | 0.0% |
| Communications | 0 | 0.0% |
| Arts & Humanities | 2 | 2.1% |
| Total | 93 | 100.0% |
Transportation & Commute in Jayton
Vehicle Availability by Sex in Jayton
The most prevalent vehicle ownership categories in Jayton are males with 2 vehicles (39, accounting for 54.9%) and females with 2 vehicles (31, making up 59.1%).
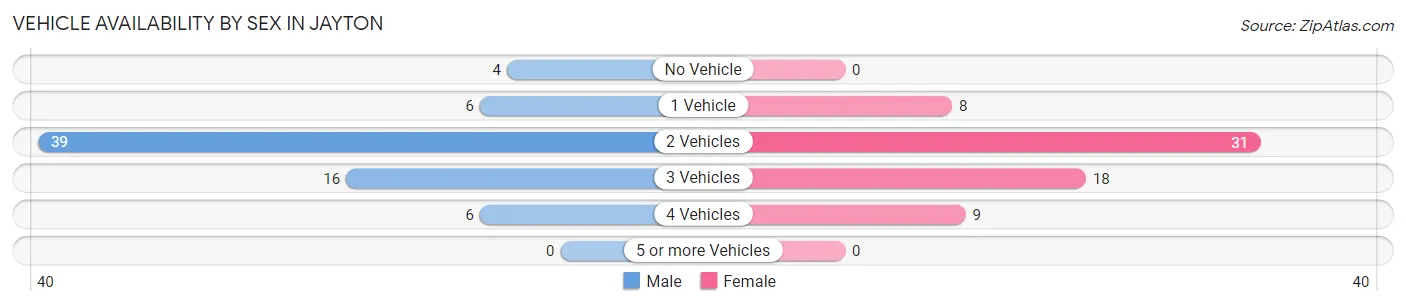
| Vehicles Available | Male | Female |
| No Vehicle | 4 (5.6%) | 0 (0.0%) |
| 1 Vehicle | 6 (8.5%) | 8 (12.1%) |
| 2 Vehicles | 39 (54.9%) | 31 (47.0%) |
| 3 Vehicles | 16 (22.5%) | 18 (27.3%) |
| 4 Vehicles | 6 (8.5%) | 9 (13.6%) |
| 5 or more Vehicles | 0 (0.0%) | 0 (0.0%) |
| Total | 71 (100.0%) | 66 (100.0%) |
Commute Time in Jayton
The most frequently occuring commute durations in Jayton are less than 5 minutes (58 commuters, 44.3%), 5 to 9 minutes (35 commuters, 26.7%), and 25 to 29 minutes (16 commuters, 12.2%).
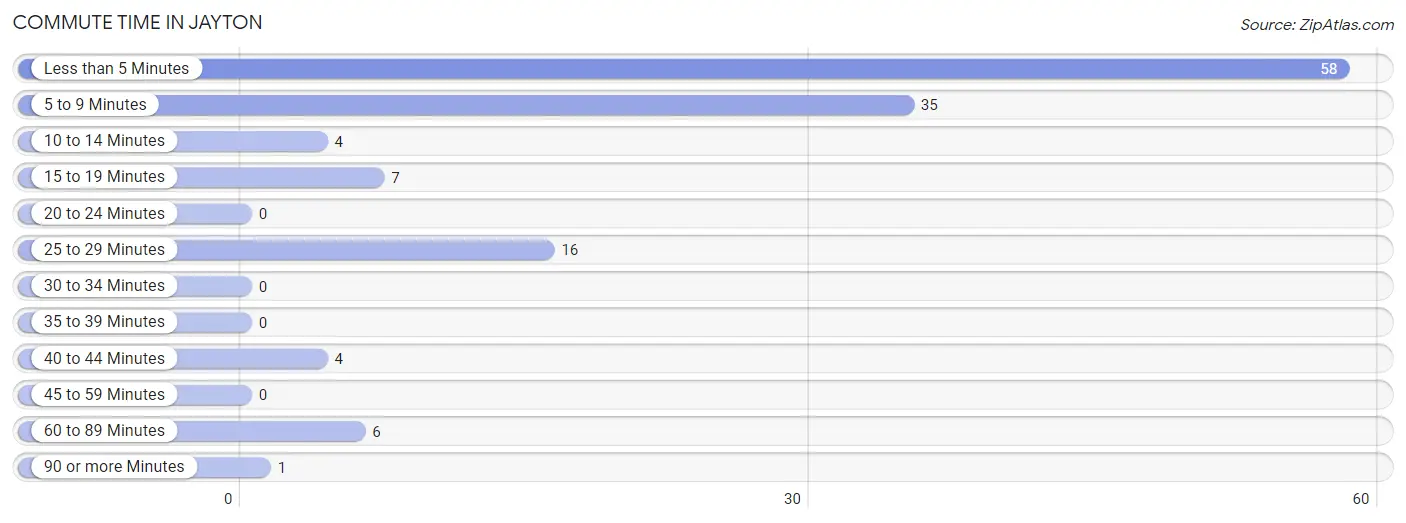
| Commute Time | # Commuters | % Commuters |
| Less than 5 Minutes | 58 | 44.3% |
| 5 to 9 Minutes | 35 | 26.7% |
| 10 to 14 Minutes | 4 | 3.0% |
| 15 to 19 Minutes | 7 | 5.3% |
| 20 to 24 Minutes | 0 | 0.0% |
| 25 to 29 Minutes | 16 | 12.2% |
| 30 to 34 Minutes | 0 | 0.0% |
| 35 to 39 Minutes | 0 | 0.0% |
| 40 to 44 Minutes | 4 | 3.0% |
| 45 to 59 Minutes | 0 | 0.0% |
| 60 to 89 Minutes | 6 | 4.6% |
| 90 or more Minutes | 1 | 0.8% |
Commute Time by Sex in Jayton
The most common commute times in Jayton are less than 5 minutes (22 commuters, 33.9%) for males and less than 5 minutes (36 commuters, 54.5%) for females.
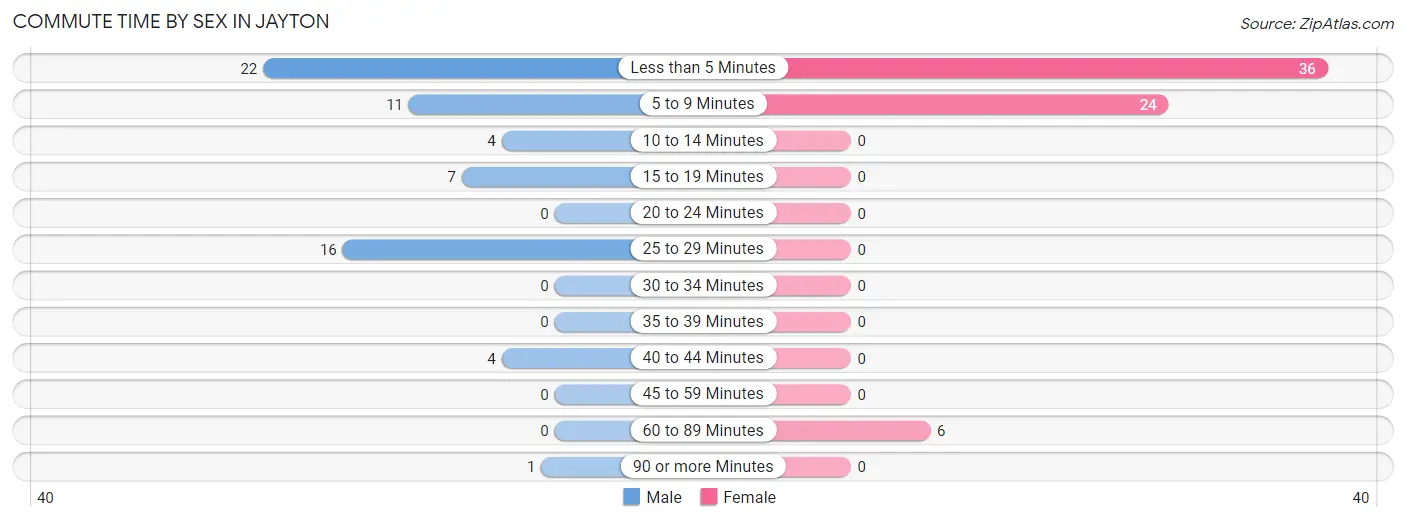
| Commute Time | Male | Female |
| Less than 5 Minutes | 22 (33.9%) | 36 (54.5%) |
| 5 to 9 Minutes | 11 (16.9%) | 24 (36.4%) |
| 10 to 14 Minutes | 4 (6.1%) | 0 (0.0%) |
| 15 to 19 Minutes | 7 (10.8%) | 0 (0.0%) |
| 20 to 24 Minutes | 0 (0.0%) | 0 (0.0%) |
| 25 to 29 Minutes | 16 (24.6%) | 0 (0.0%) |
| 30 to 34 Minutes | 0 (0.0%) | 0 (0.0%) |
| 35 to 39 Minutes | 0 (0.0%) | 0 (0.0%) |
| 40 to 44 Minutes | 4 (6.1%) | 0 (0.0%) |
| 45 to 59 Minutes | 0 (0.0%) | 0 (0.0%) |
| 60 to 89 Minutes | 0 (0.0%) | 6 (9.1%) |
| 90 or more Minutes | 1 (1.5%) | 0 (0.0%) |
Time of Departure to Work by Sex in Jayton
The most frequent times of departure to work in Jayton are 6:30 AM to 6:59 AM (32, 49.2%) for males and 8:30 AM to 8:59 AM (23, 34.8%) for females.
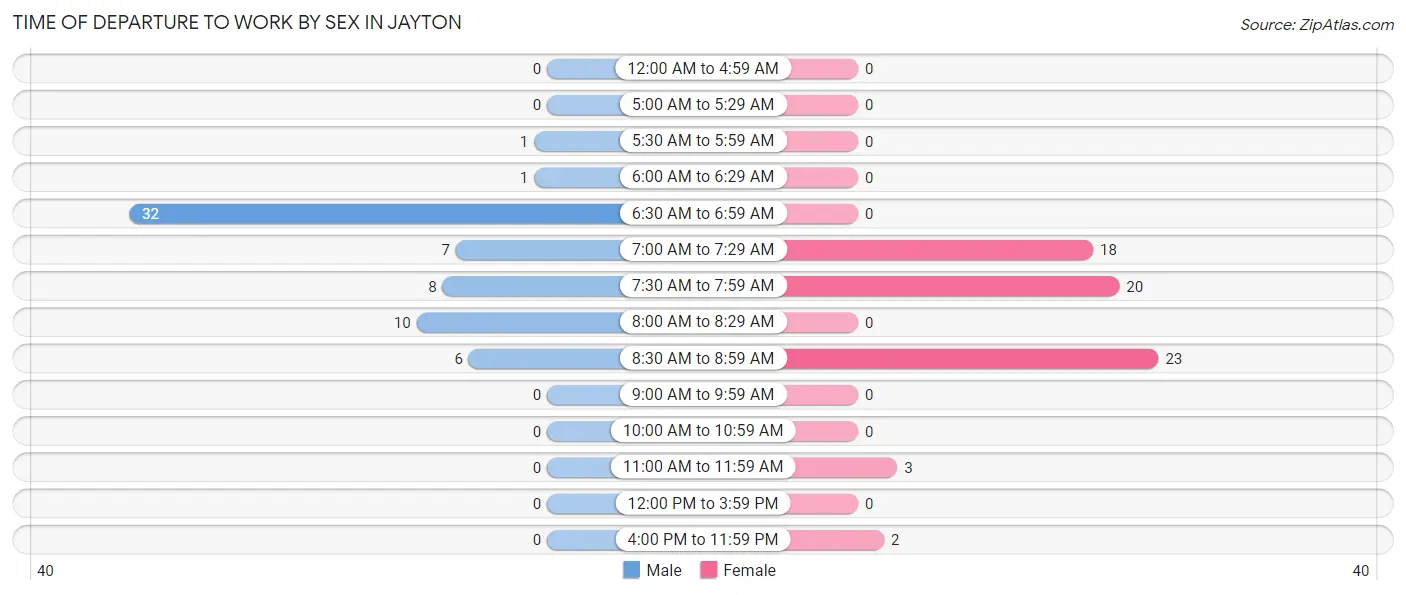
| Time of Departure | Male | Female |
| 12:00 AM to 4:59 AM | 0 (0.0%) | 0 (0.0%) |
| 5:00 AM to 5:29 AM | 0 (0.0%) | 0 (0.0%) |
| 5:30 AM to 5:59 AM | 1 (1.5%) | 0 (0.0%) |
| 6:00 AM to 6:29 AM | 1 (1.5%) | 0 (0.0%) |
| 6:30 AM to 6:59 AM | 32 (49.2%) | 0 (0.0%) |
| 7:00 AM to 7:29 AM | 7 (10.8%) | 18 (27.3%) |
| 7:30 AM to 7:59 AM | 8 (12.3%) | 20 (30.3%) |
| 8:00 AM to 8:29 AM | 10 (15.4%) | 0 (0.0%) |
| 8:30 AM to 8:59 AM | 6 (9.2%) | 23 (34.8%) |
| 9:00 AM to 9:59 AM | 0 (0.0%) | 0 (0.0%) |
| 10:00 AM to 10:59 AM | 0 (0.0%) | 0 (0.0%) |
| 11:00 AM to 11:59 AM | 0 (0.0%) | 3 (4.5%) |
| 12:00 PM to 3:59 PM | 0 (0.0%) | 0 (0.0%) |
| 4:00 PM to 11:59 PM | 0 (0.0%) | 2 (3.0%) |
| Total | 65 (100.0%) | 66 (100.0%) |
Housing Occupancy in Jayton
Occupancy by Ownership in Jayton
Of the total 161 dwellings in Jayton, owner-occupied units account for 133 (82.6%), while renter-occupied units make up 28 (17.4%).
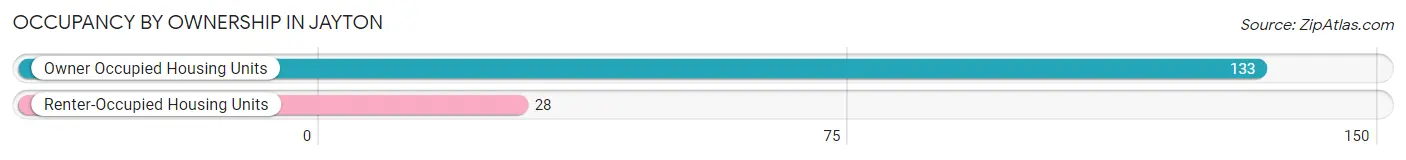
| Occupancy | # Housing Units | % Housing Units |
| Owner Occupied Housing Units | 133 | 82.6% |
| Renter-Occupied Housing Units | 28 | 17.4% |
| Total Occupied Housing Units | 161 | 100.0% |
Occupancy by Household Size in Jayton
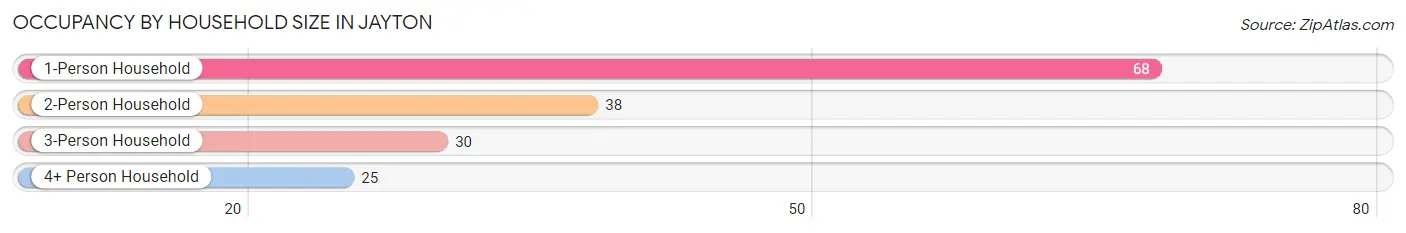
| Household Size | # Housing Units | % Housing Units |
| 1-Person Household | 68 | 42.2% |
| 2-Person Household | 38 | 23.6% |
| 3-Person Household | 30 | 18.6% |
| 4+ Person Household | 25 | 15.5% |
| Total Housing Units | 161 | 100.0% |
Occupancy by Ownership by Household Size in Jayton
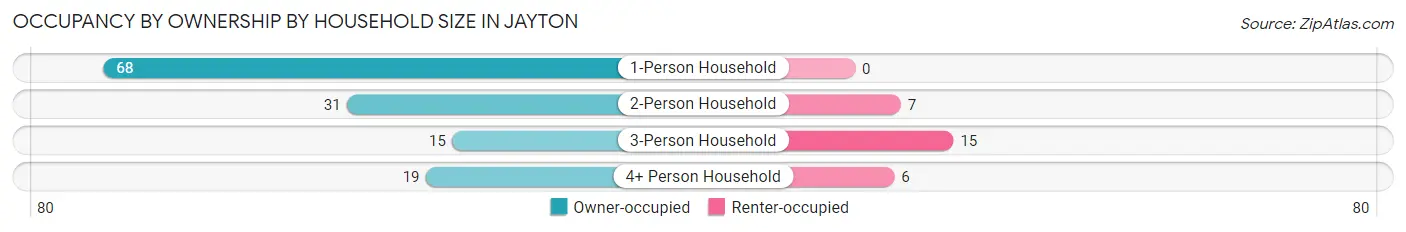
| Household Size | Owner-occupied | Renter-occupied |
| 1-Person Household | 68 (100.0%) | 0 (0.0%) |
| 2-Person Household | 31 (81.6%) | 7 (18.4%) |
| 3-Person Household | 15 (50.0%) | 15 (50.0%) |
| 4+ Person Household | 19 (76.0%) | 6 (24.0%) |
| Total Housing Units | 133 (82.6%) | 28 (17.4%) |
Occupancy by Educational Attainment in Jayton
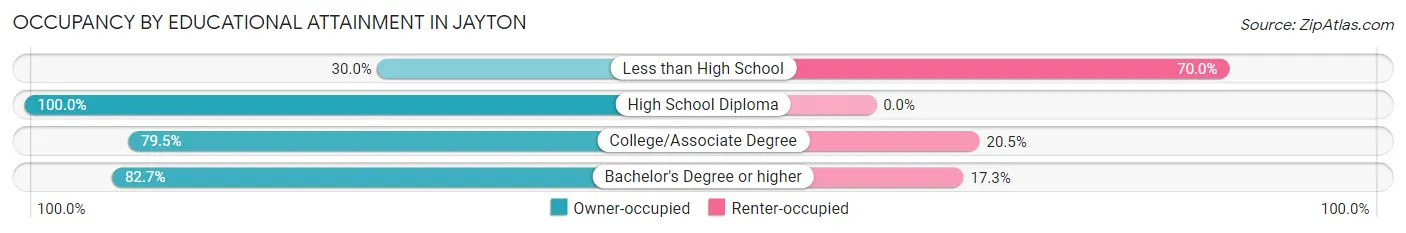
| Household Size | Owner-occupied | Renter-occupied |
| Less than High School | 3 (30.0%) | 7 (70.0%) |
| High School Diploma | 37 (100.0%) | 0 (0.0%) |
| College/Associate Degree | 31 (79.5%) | 8 (20.5%) |
| Bachelor's Degree or higher | 62 (82.7%) | 13 (17.3%) |
Occupancy by Age of Householder in Jayton
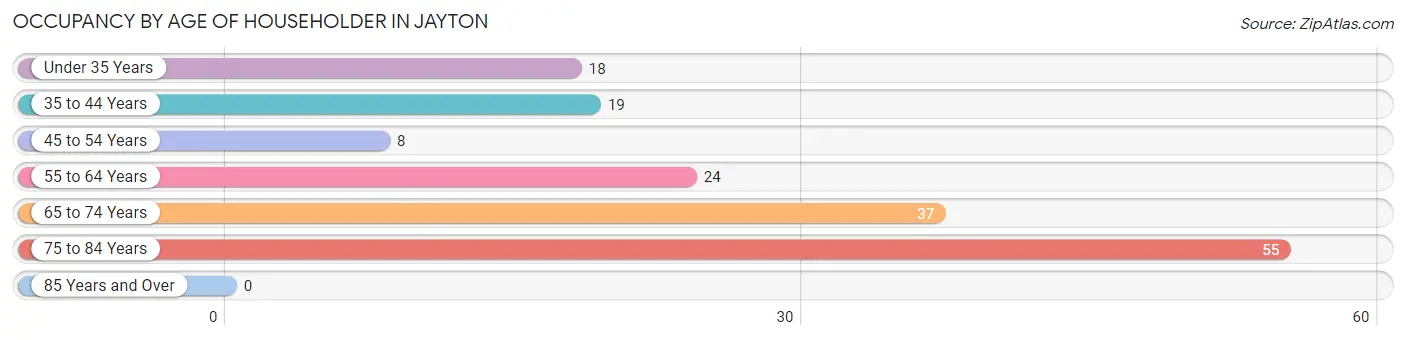
| Age Bracket | # Households | % Households |
| Under 35 Years | 18 | 11.2% |
| 35 to 44 Years | 19 | 11.8% |
| 45 to 54 Years | 8 | 5.0% |
| 55 to 64 Years | 24 | 14.9% |
| 65 to 74 Years | 37 | 23.0% |
| 75 to 84 Years | 55 | 34.2% |
| 85 Years and Over | 0 | 0.0% |
| Total | 161 | 100.0% |
Housing Finances in Jayton
Median Income by Occupancy in Jayton
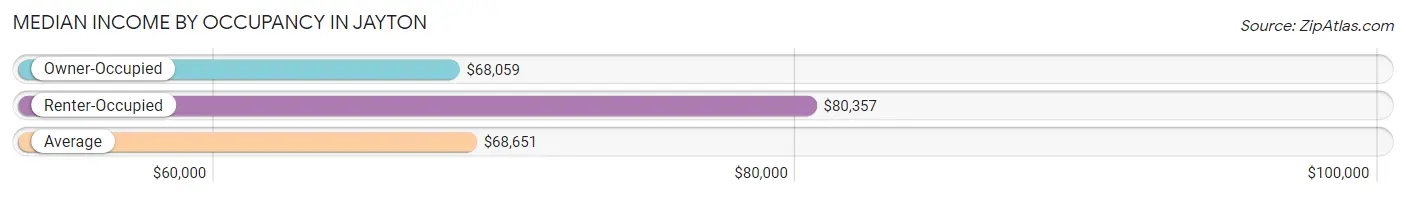
| Occupancy Type | # Households | Median Income |
| Owner-Occupied | 133 (82.6%) | $68,059 |
| Renter-Occupied | 28 (17.4%) | $80,357 |
| Average | 161 (100.0%) | $68,651 |
Occupancy by Householder Income Bracket in Jayton
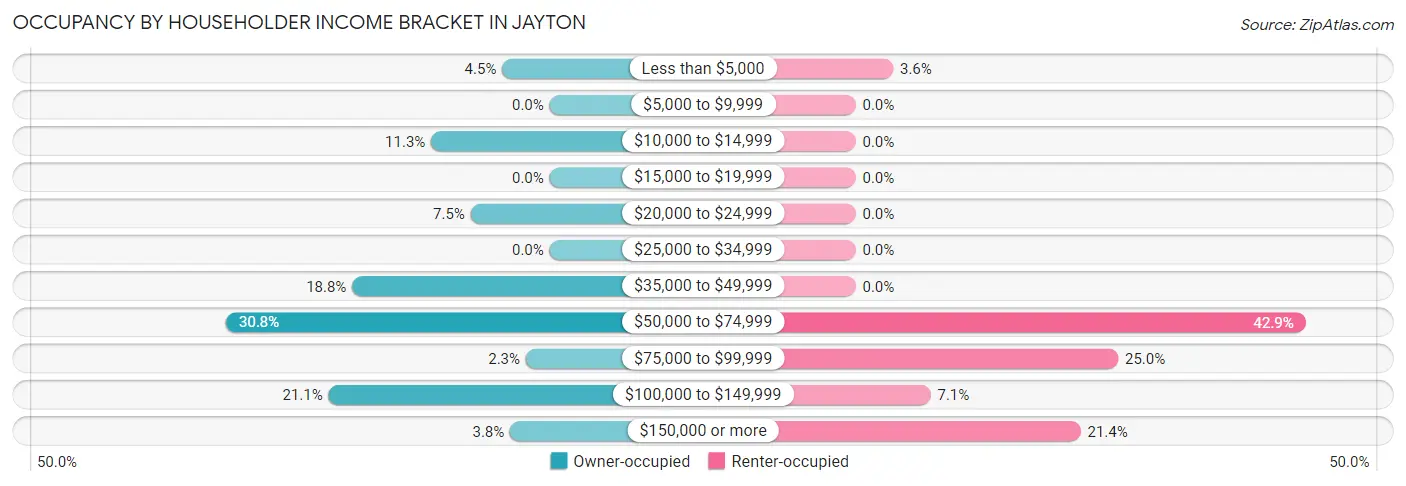
| Income Bracket | Owner-occupied | Renter-occupied |
| Less than $5,000 | 6 (4.5%) | 1 (3.6%) |
| $5,000 to $9,999 | 0 (0.0%) | 0 (0.0%) |
| $10,000 to $14,999 | 15 (11.3%) | 0 (0.0%) |
| $15,000 to $19,999 | 0 (0.0%) | 0 (0.0%) |
| $20,000 to $24,999 | 10 (7.5%) | 0 (0.0%) |
| $25,000 to $34,999 | 0 (0.0%) | 0 (0.0%) |
| $35,000 to $49,999 | 25 (18.8%) | 0 (0.0%) |
| $50,000 to $74,999 | 41 (30.8%) | 12 (42.9%) |
| $75,000 to $99,999 | 3 (2.3%) | 7 (25.0%) |
| $100,000 to $149,999 | 28 (21.0%) | 2 (7.1%) |
| $150,000 or more | 5 (3.8%) | 6 (21.4%) |
| Total | 133 (100.0%) | 28 (100.0%) |
Monthly Housing Cost Tiers in Jayton
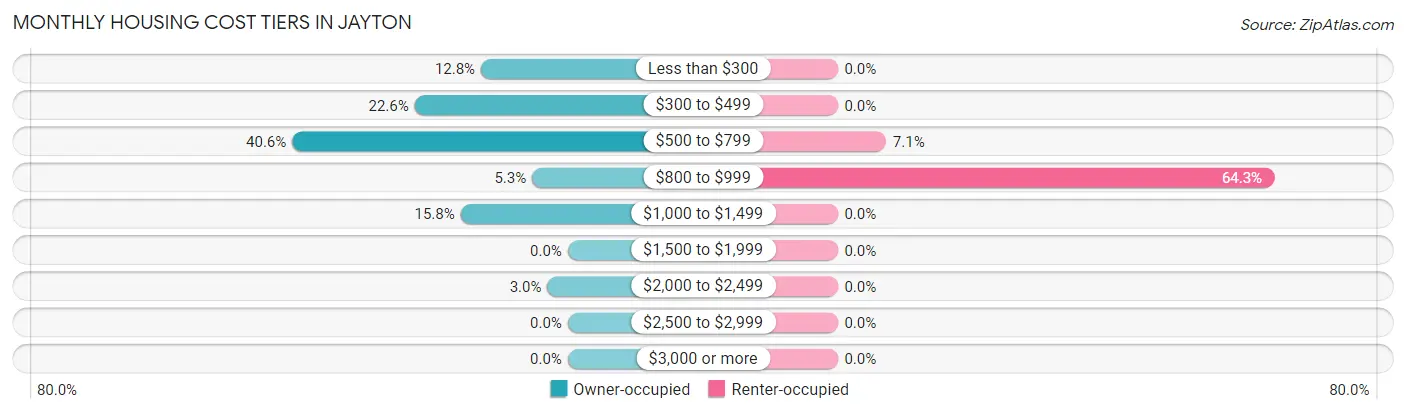
| Monthly Cost | Owner-occupied | Renter-occupied |
| Less than $300 | 17 (12.8%) | 0 (0.0%) |
| $300 to $499 | 30 (22.6%) | 0 (0.0%) |
| $500 to $799 | 54 (40.6%) | 2 (7.1%) |
| $800 to $999 | 7 (5.3%) | 18 (64.3%) |
| $1,000 to $1,499 | 21 (15.8%) | 0 (0.0%) |
| $1,500 to $1,999 | 0 (0.0%) | 0 (0.0%) |
| $2,000 to $2,499 | 4 (3.0%) | 0 (0.0%) |
| $2,500 to $2,999 | 0 (0.0%) | 0 (0.0%) |
| $3,000 or more | 0 (0.0%) | 0 (0.0%) |
| Total | 133 (100.0%) | 28 (100.0%) |
Physical Housing Characteristics in Jayton
Housing Structures in Jayton
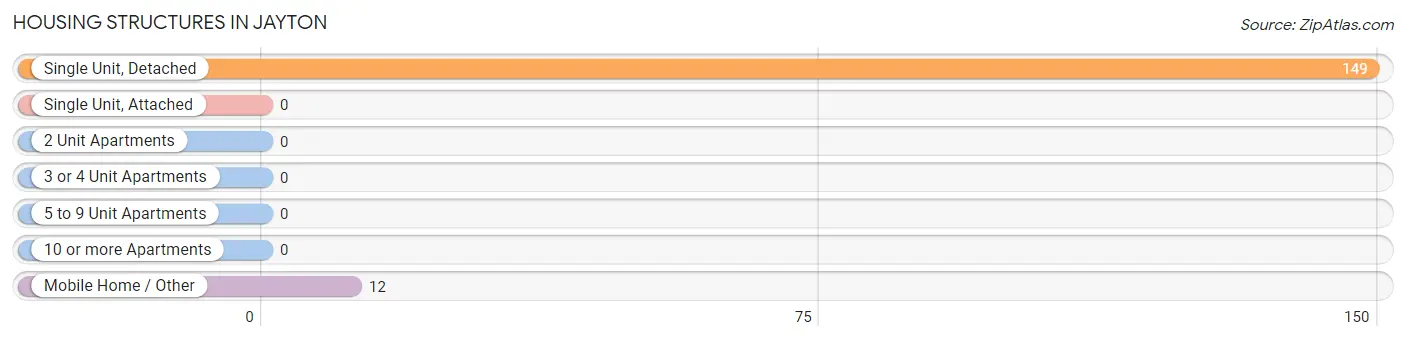
| Structure Type | # Housing Units | % Housing Units |
| Single Unit, Detached | 149 | 92.5% |
| Single Unit, Attached | 0 | 0.0% |
| 2 Unit Apartments | 0 | 0.0% |
| 3 or 4 Unit Apartments | 0 | 0.0% |
| 5 to 9 Unit Apartments | 0 | 0.0% |
| 10 or more Apartments | 0 | 0.0% |
| Mobile Home / Other | 12 | 7.4% |
| Total | 161 | 100.0% |
Housing Structures by Occupancy in Jayton
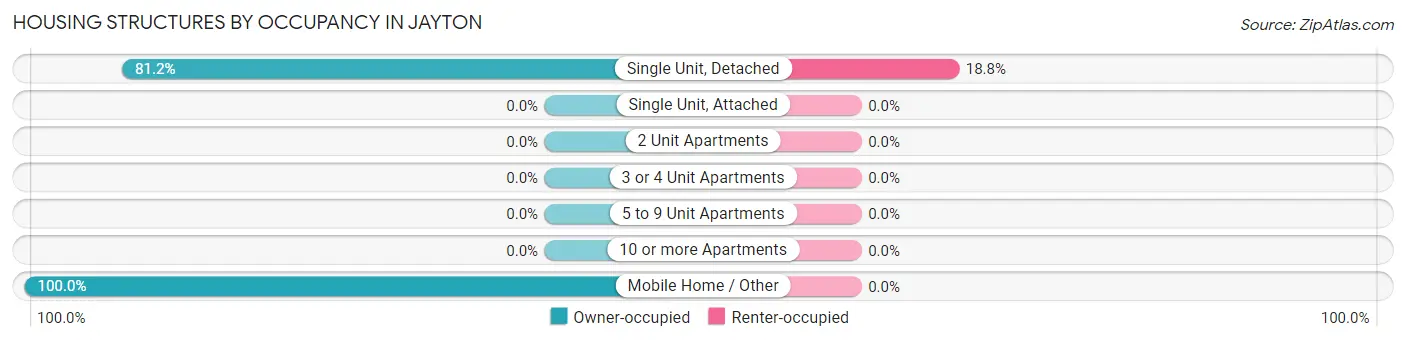
| Structure Type | Owner-occupied | Renter-occupied |
| Single Unit, Detached | 121 (81.2%) | 28 (18.8%) |
| Single Unit, Attached | 0 (0.0%) | 0 (0.0%) |
| 2 Unit Apartments | 0 (0.0%) | 0 (0.0%) |
| 3 or 4 Unit Apartments | 0 (0.0%) | 0 (0.0%) |
| 5 to 9 Unit Apartments | 0 (0.0%) | 0 (0.0%) |
| 10 or more Apartments | 0 (0.0%) | 0 (0.0%) |
| Mobile Home / Other | 12 (100.0%) | 0 (0.0%) |
| Total | 133 (82.6%) | 28 (17.4%) |
Housing Structures by Number of Rooms in Jayton
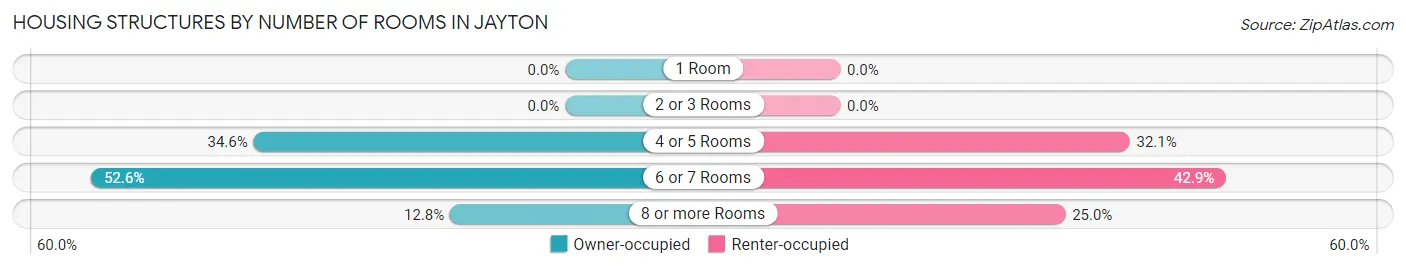
| Number of Rooms | Owner-occupied | Renter-occupied |
| 1 Room | 0 (0.0%) | 0 (0.0%) |
| 2 or 3 Rooms | 0 (0.0%) | 0 (0.0%) |
| 4 or 5 Rooms | 46 (34.6%) | 9 (32.1%) |
| 6 or 7 Rooms | 70 (52.6%) | 12 (42.9%) |
| 8 or more Rooms | 17 (12.8%) | 7 (25.0%) |
| Total | 133 (100.0%) | 28 (100.0%) |
Housing Structure by Heating Type in Jayton
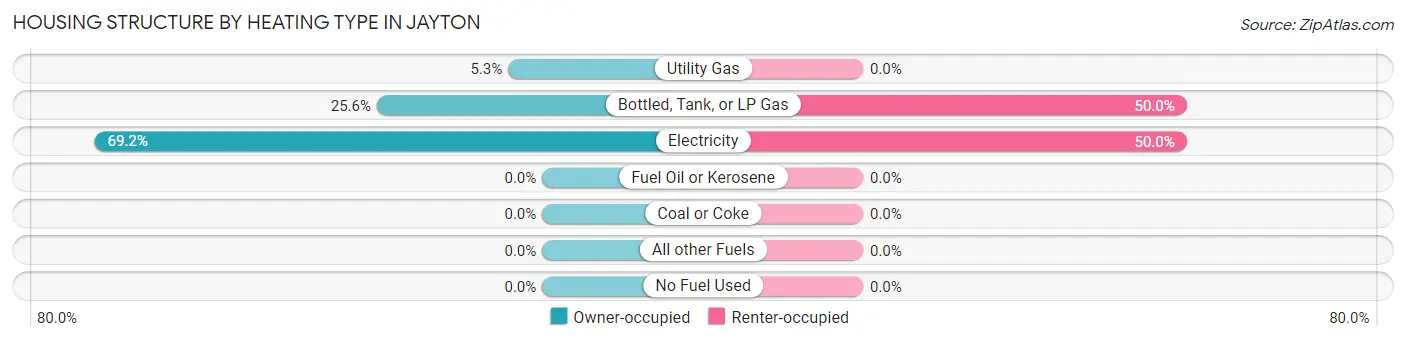
| Heating Type | Owner-occupied | Renter-occupied |
| Utility Gas | 7 (5.3%) | 0 (0.0%) |
| Bottled, Tank, or LP Gas | 34 (25.6%) | 14 (50.0%) |
| Electricity | 92 (69.2%) | 14 (50.0%) |
| Fuel Oil or Kerosene | 0 (0.0%) | 0 (0.0%) |
| Coal or Coke | 0 (0.0%) | 0 (0.0%) |
| All other Fuels | 0 (0.0%) | 0 (0.0%) |
| No Fuel Used | 0 (0.0%) | 0 (0.0%) |
| Total | 133 (100.0%) | 28 (100.0%) |
Household Vehicle Usage in Jayton
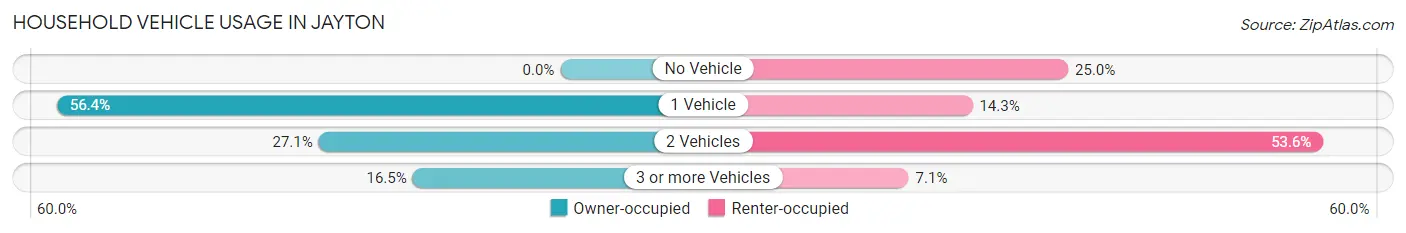
| Vehicles per Household | Owner-occupied | Renter-occupied |
| No Vehicle | 0 (0.0%) | 7 (25.0%) |
| 1 Vehicle | 75 (56.4%) | 4 (14.3%) |
| 2 Vehicles | 36 (27.1%) | 15 (53.6%) |
| 3 or more Vehicles | 22 (16.5%) | 2 (7.1%) |
| Total | 133 (100.0%) | 28 (100.0%) |
Real Estate & Mortgages in Jayton
Real Estate and Mortgage Overview in Jayton
| Characteristic | Without Mortgage | With Mortgage |
| Housing Units | 117 | 16 |
| Median Property Value | $71,200 | $0 |
| Median Household Income | $67,599 | $4 |
| Monthly Housing Costs | $609 | $0 |
| Real Estate Taxes | - | - |
Property Value by Mortgage Status in Jayton
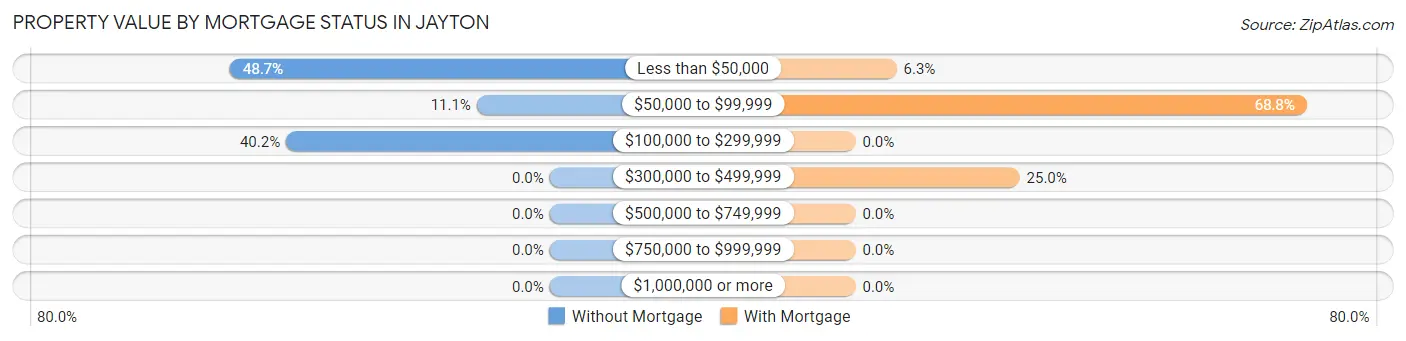
| Property Value | Without Mortgage | With Mortgage |
| Less than $50,000 | 57 (48.7%) | 1 (6.2%) |
| $50,000 to $99,999 | 13 (11.1%) | 11 (68.8%) |
| $100,000 to $299,999 | 47 (40.2%) | 0 (0.0%) |
| $300,000 to $499,999 | 0 (0.0%) | 4 (25.0%) |
| $500,000 to $749,999 | 0 (0.0%) | 0 (0.0%) |
| $750,000 to $999,999 | 0 (0.0%) | 0 (0.0%) |
| $1,000,000 or more | 0 (0.0%) | 0 (0.0%) |
| Total | 117 (100.0%) | 16 (100.0%) |
Household Income by Mortgage Status in Jayton
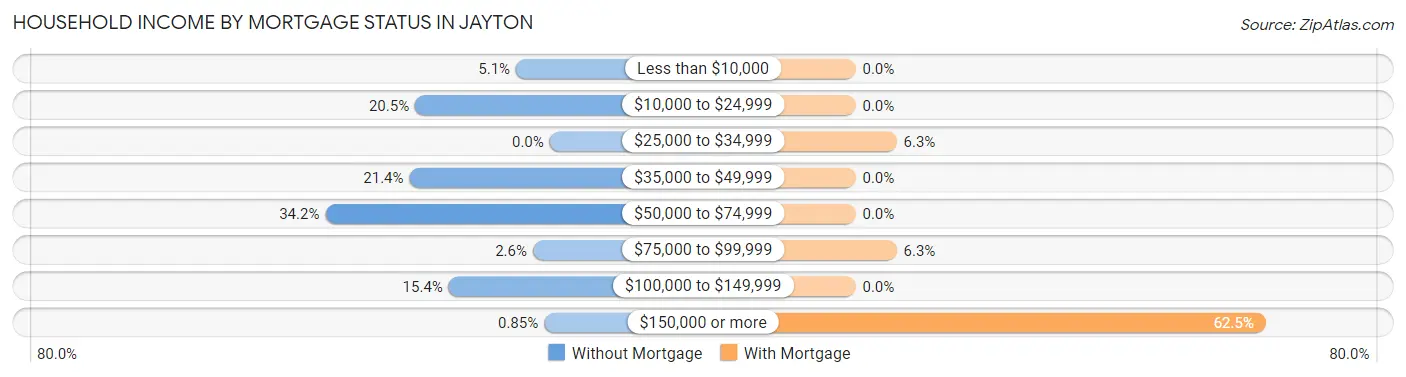
| Household Income | Without Mortgage | With Mortgage |
| Less than $10,000 | 6 (5.1%) | 0 (0.0%) |
| $10,000 to $24,999 | 24 (20.5%) | 0 (0.0%) |
| $25,000 to $34,999 | 0 (0.0%) | 1 (6.2%) |
| $35,000 to $49,999 | 25 (21.4%) | 0 (0.0%) |
| $50,000 to $74,999 | 40 (34.2%) | 0 (0.0%) |
| $75,000 to $99,999 | 3 (2.6%) | 1 (6.2%) |
| $100,000 to $149,999 | 18 (15.4%) | 0 (0.0%) |
| $150,000 or more | 1 (0.9%) | 10 (62.5%) |
| Total | 117 (100.0%) | 16 (100.0%) |
Property Value to Household Income Ratio in Jayton
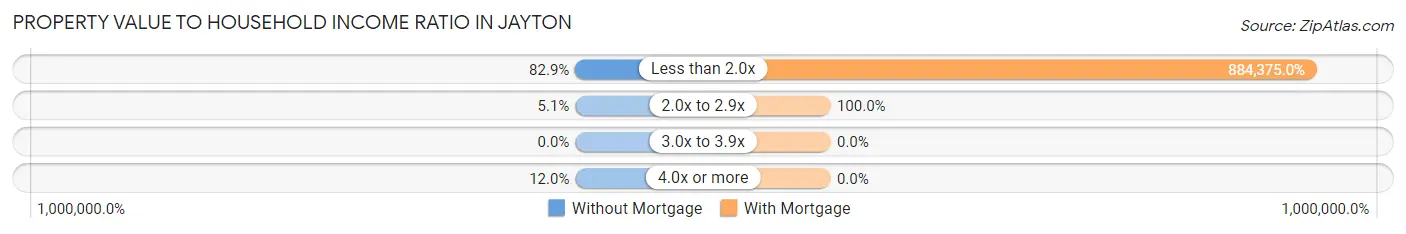
| Value-to-Income Ratio | Without Mortgage | With Mortgage |
| Less than 2.0x | 97 (82.9%) | 141,500 (884,375.0%) |
| 2.0x to 2.9x | 6 (5.1%) | 16 (100.0%) |
| 3.0x to 3.9x | 0 (0.0%) | 0 (0.0%) |
| 4.0x or more | 14 (12.0%) | 0 (0.0%) |
| Total | 117 (100.0%) | 16 (100.0%) |
Real Estate Taxes by Mortgage Status in Jayton
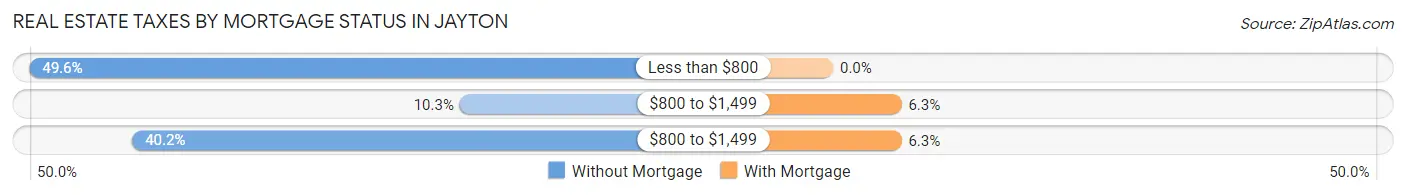
| Property Taxes | Without Mortgage | With Mortgage |
| Less than $800 | 58 (49.6%) | 0 (0.0%) |
| $800 to $1,499 | 12 (10.3%) | 1 (6.2%) |
| $800 to $1,499 | 47 (40.2%) | 1 (6.2%) |
| Total | 117 (100.0%) | 16 (100.0%) |
Health & Disability in Jayton
Health Insurance Coverage by Age in Jayton
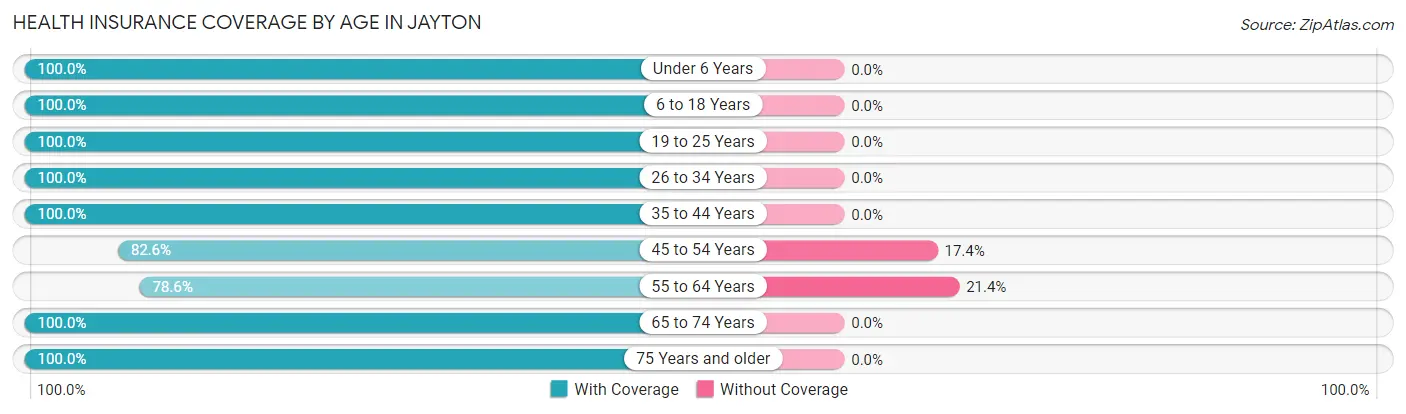
| Age Bracket | With Coverage | Without Coverage |
| Under 6 Years | 38 (100.0%) | 0 (0.0%) |
| 6 to 18 Years | 70 (100.0%) | 0 (0.0%) |
| 19 to 25 Years | 13 (100.0%) | 0 (0.0%) |
| 26 to 34 Years | 18 (100.0%) | 0 (0.0%) |
| 35 to 44 Years | 45 (100.0%) | 0 (0.0%) |
| 45 to 54 Years | 19 (82.6%) | 4 (17.4%) |
| 55 to 64 Years | 22 (78.6%) | 6 (21.4%) |
| 65 to 74 Years | 64 (100.0%) | 0 (0.0%) |
| 75 Years and older | 65 (100.0%) | 0 (0.0%) |
| Total | 354 (97.3%) | 10 (2.8%) |
Health Insurance Coverage by Citizenship Status in Jayton
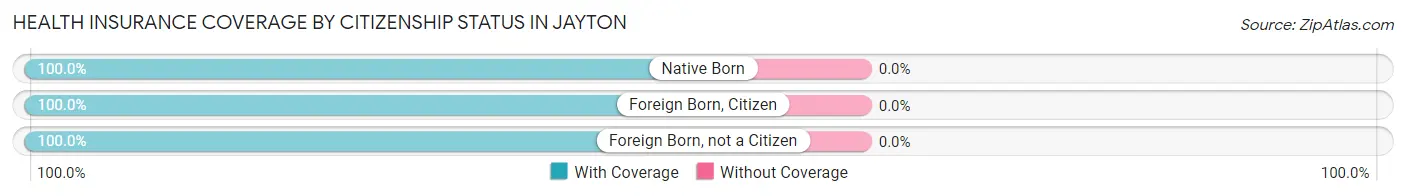
| Citizenship Status | With Coverage | Without Coverage |
| Native Born | 38 (100.0%) | 0 (0.0%) |
| Foreign Born, Citizen | 70 (100.0%) | 0 (0.0%) |
| Foreign Born, not a Citizen | 13 (100.0%) | 0 (0.0%) |
Health Insurance Coverage by Household Income in Jayton
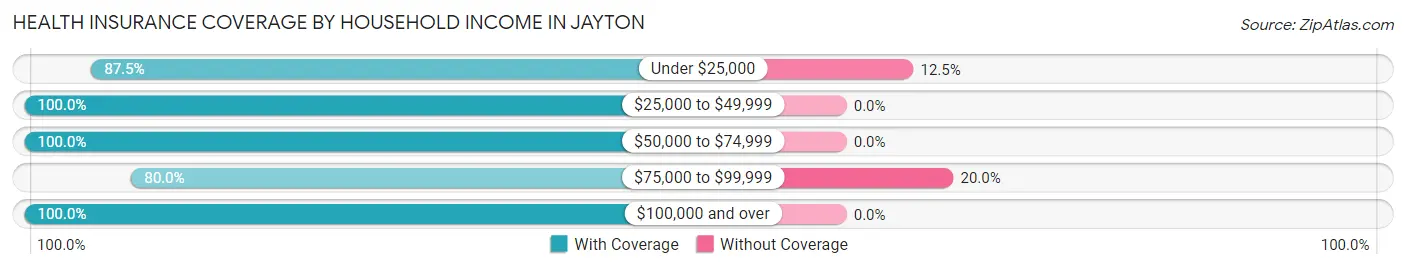
| Household Income | With Coverage | Without Coverage |
| Under $25,000 | 42 (87.5%) | 6 (12.5%) |
| $25,000 to $49,999 | 65 (100.0%) | 0 (0.0%) |
| $50,000 to $74,999 | 73 (100.0%) | 0 (0.0%) |
| $75,000 to $99,999 | 16 (80.0%) | 4 (20.0%) |
| $100,000 and over | 158 (100.0%) | 0 (0.0%) |
Public vs Private Health Insurance Coverage by Age in Jayton
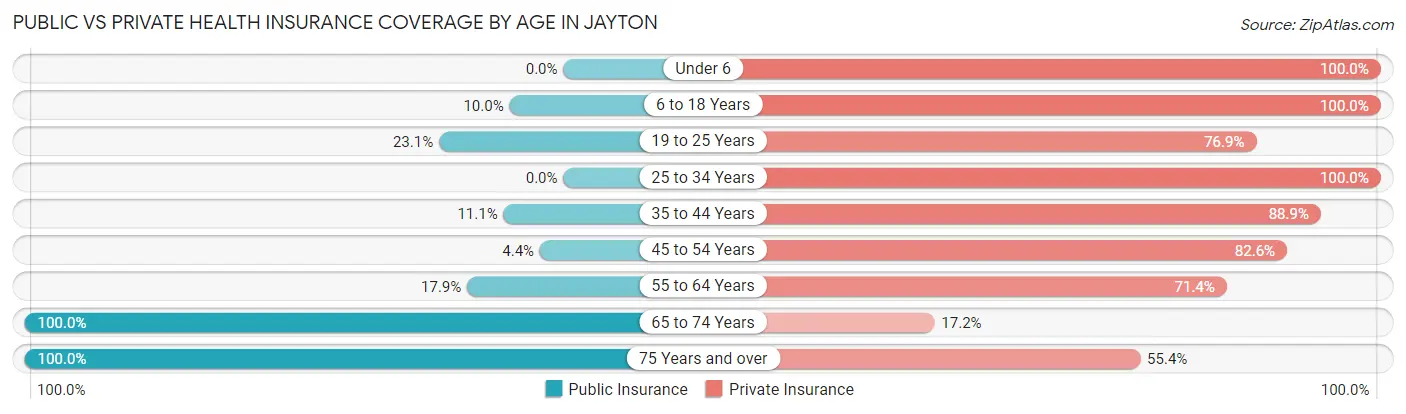
| Age Bracket | Public Insurance | Private Insurance |
| Under 6 | 0 (0.0%) | 38 (100.0%) |
| 6 to 18 Years | 7 (10.0%) | 70 (100.0%) |
| 19 to 25 Years | 3 (23.1%) | 10 (76.9%) |
| 25 to 34 Years | 0 (0.0%) | 18 (100.0%) |
| 35 to 44 Years | 5 (11.1%) | 40 (88.9%) |
| 45 to 54 Years | 1 (4.3%) | 19 (82.6%) |
| 55 to 64 Years | 5 (17.9%) | 20 (71.4%) |
| 65 to 74 Years | 64 (100.0%) | 11 (17.2%) |
| 75 Years and over | 65 (100.0%) | 36 (55.4%) |
| Total | 150 (41.2%) | 262 (72.0%) |
Disability Status by Sex by Age in Jayton
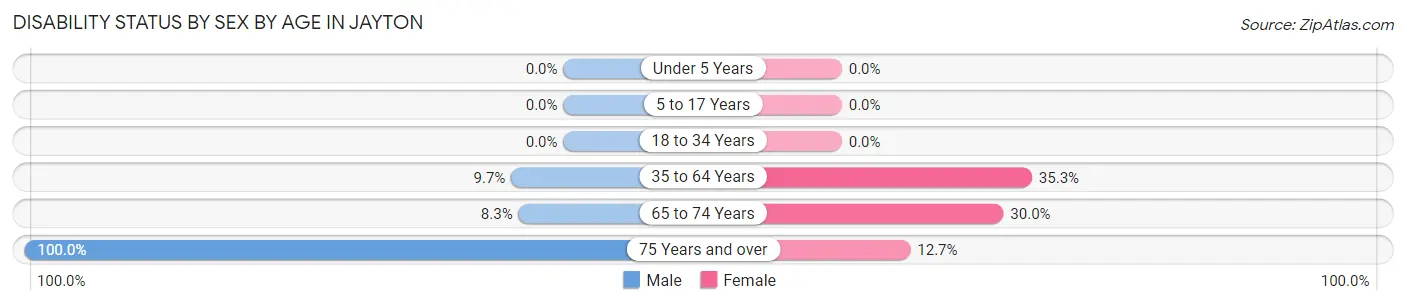
| Age Bracket | Male | Female |
| Under 5 Years | 0 (0.0%) | 0 (0.0%) |
| 5 to 17 Years | 0 (0.0%) | 0 (0.0%) |
| 18 to 34 Years | 0 (0.0%) | 0 (0.0%) |
| 35 to 64 Years | 6 (9.7%) | 12 (35.3%) |
| 65 to 74 Years | 2 (8.3%) | 12 (30.0%) |
| 75 Years and over | 10 (100.0%) | 7 (12.7%) |
Disability Class by Sex by Age in Jayton
Disability Class: Hearing Difficulty
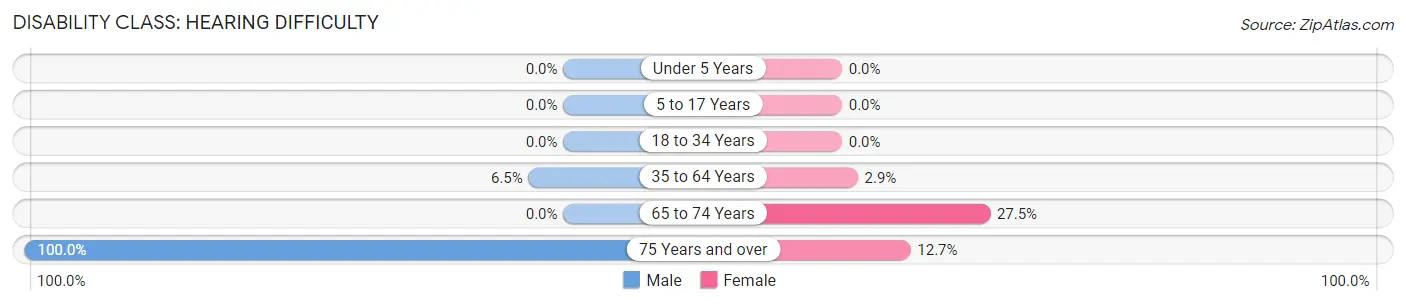
| Age Bracket | Male | Female |
| Under 5 Years | 0 (0.0%) | 0 (0.0%) |
| 5 to 17 Years | 0 (0.0%) | 0 (0.0%) |
| 18 to 34 Years | 0 (0.0%) | 0 (0.0%) |
| 35 to 64 Years | 4 (6.5%) | 1 (2.9%) |
| 65 to 74 Years | 0 (0.0%) | 11 (27.5%) |
| 75 Years and over | 10 (100.0%) | 7 (12.7%) |
Disability Class: Vision Difficulty
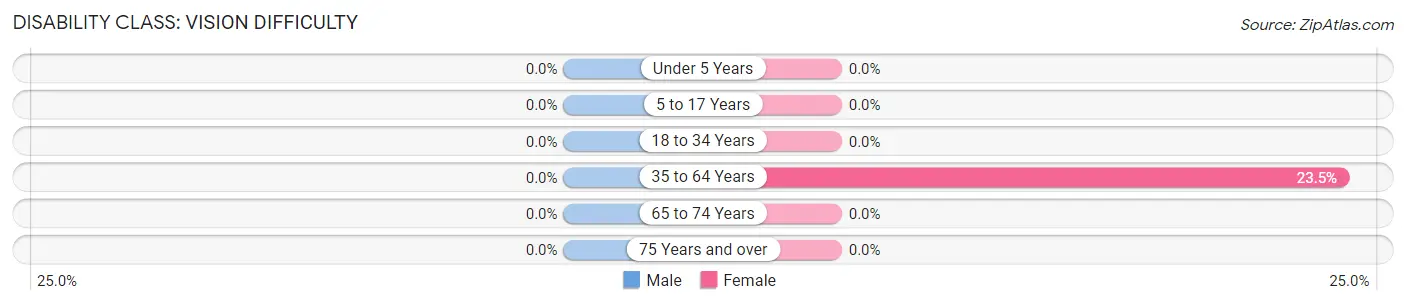
| Age Bracket | Male | Female |
| Under 5 Years | 0 (0.0%) | 0 (0.0%) |
| 5 to 17 Years | 0 (0.0%) | 0 (0.0%) |
| 18 to 34 Years | 0 (0.0%) | 0 (0.0%) |
| 35 to 64 Years | 0 (0.0%) | 8 (23.5%) |
| 65 to 74 Years | 0 (0.0%) | 0 (0.0%) |
| 75 Years and over | 0 (0.0%) | 0 (0.0%) |
Disability Class: Cognitive Difficulty
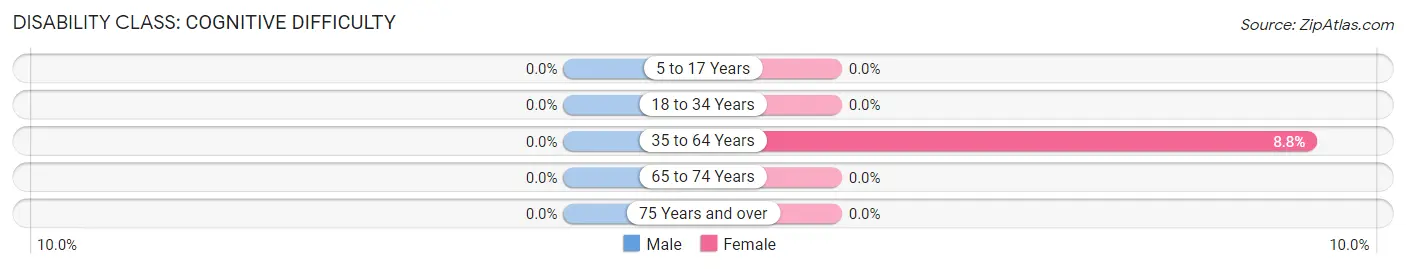
| Age Bracket | Male | Female |
| 5 to 17 Years | 0 (0.0%) | 0 (0.0%) |
| 18 to 34 Years | 0 (0.0%) | 0 (0.0%) |
| 35 to 64 Years | 0 (0.0%) | 3 (8.8%) |
| 65 to 74 Years | 0 (0.0%) | 0 (0.0%) |
| 75 Years and over | 0 (0.0%) | 0 (0.0%) |
Disability Class: Ambulatory Difficulty
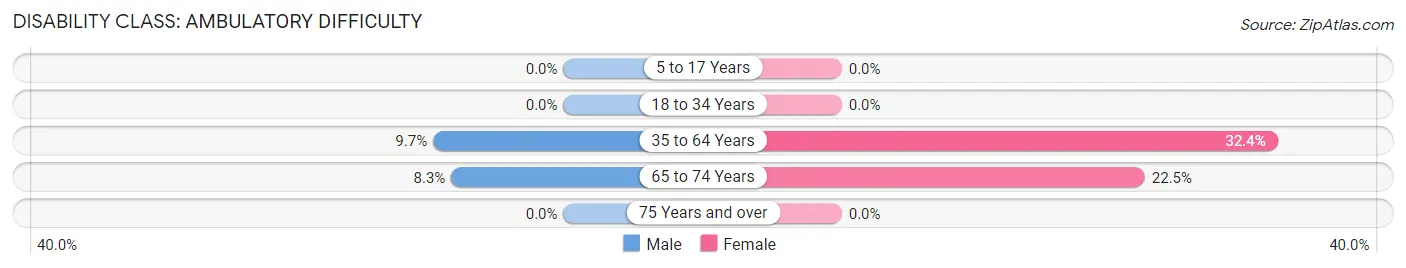
| Age Bracket | Male | Female |
| 5 to 17 Years | 0 (0.0%) | 0 (0.0%) |
| 18 to 34 Years | 0 (0.0%) | 0 (0.0%) |
| 35 to 64 Years | 6 (9.7%) | 11 (32.4%) |
| 65 to 74 Years | 2 (8.3%) | 9 (22.5%) |
| 75 Years and over | 0 (0.0%) | 0 (0.0%) |
Disability Class: Self-Care Difficulty
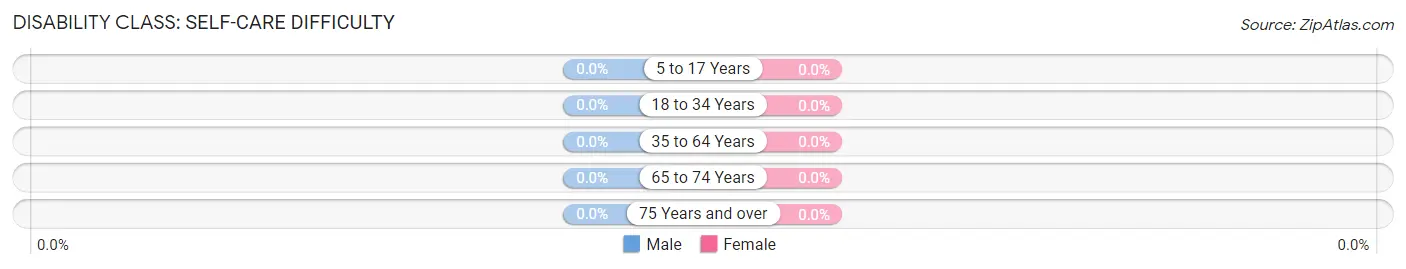
| Age Bracket | Male | Female |
| 5 to 17 Years | 0 (0.0%) | 0 (0.0%) |
| 18 to 34 Years | 0 (0.0%) | 0 (0.0%) |
| 35 to 64 Years | 0 (0.0%) | 0 (0.0%) |
| 65 to 74 Years | 0 (0.0%) | 0 (0.0%) |
| 75 Years and over | 0 (0.0%) | 0 (0.0%) |
Technology Access in Jayton
Computing Device Access in Jayton
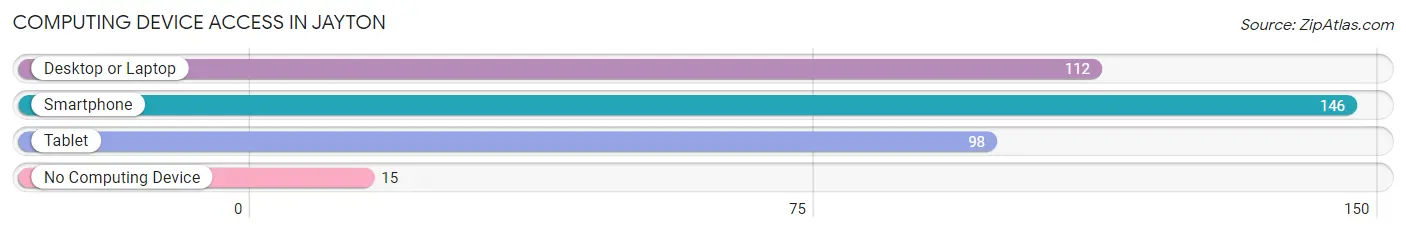
| Device Type | # Households | % Households |
| Desktop or Laptop | 112 | 69.6% |
| Smartphone | 146 | 90.7% |
| Tablet | 98 | 60.9% |
| No Computing Device | 15 | 9.3% |
| Total | 161 | 100.0% |
Internet Access in Jayton
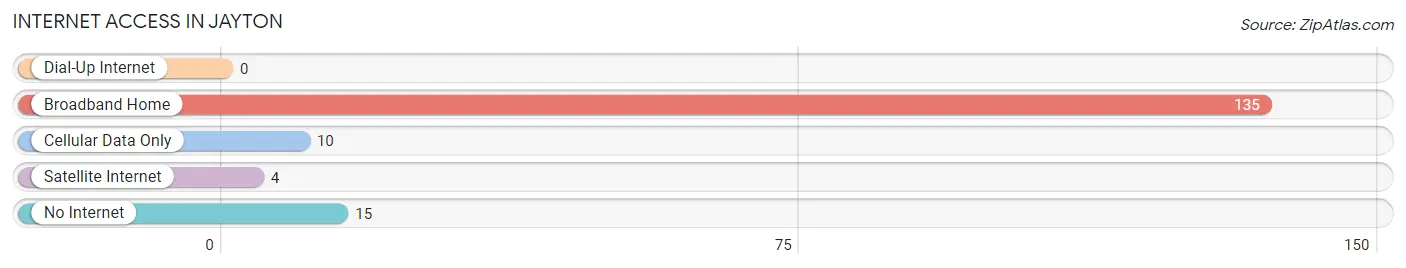
| Internet Type | # Households | % Households |
| Dial-Up Internet | 0 | 0.0% |
| Broadband Home | 135 | 83.9% |
| Cellular Data Only | 10 | 6.2% |
| Satellite Internet | 4 | 2.5% |
| No Internet | 15 | 9.3% |
| Total | 161 | 100.0% |
Jayton Summary
History
The small town of Jayton, Texas is located in the heart of the Texas Panhandle, in Kent County. It was founded in 1891 by a group of settlers from the nearby town of Spur. The town was named after the first postmaster, J.A. Jay, and was originally known as Jay’s Town.
The town was a typical small Texas town, with a population of just over 500 people in the early 1900s. The town was primarily agricultural, with cotton and grain being the main crops. The town also had a few small businesses, including a general store, a blacksmith shop, and a livery stable.
In the early 1900s, the town was also home to a number of churches, including the First Baptist Church, the Methodist Church, and the Church of Christ. The town also had a school, which was built in 1910.
In the 1920s, the town began to grow, as the population increased to over 1,000 people. The town was still primarily agricultural, but the economy began to diversify, with the addition of a number of new businesses, including a bank, a hotel, and a movie theater.
In the 1940s, the town experienced a period of growth, as the population increased to over 2,000 people. The economy continued to diversify, with the addition of a number of new businesses, including a cotton gin, a feed store, and a hardware store.
In the 1950s, the town experienced a period of decline, as the population decreased to just over 1,000 people. The economy continued to diversify, with the addition of a number of new businesses, including a grocery store, a cafe, and a gas station.
In the 1960s, the town experienced a period of growth, as the population increased to over 2,000 people. The economy continued to diversify, with the addition of a number of new businesses, including a furniture store, a clothing store, and a restaurant.
In the 1970s, the town experienced a period of decline, as the population decreased to just over 1,000 people. The economy continued to diversify, with the addition of a number of new businesses, including a pharmacy, a beauty salon, and a car dealership.
In the 1980s, the town experienced a period of growth, as the population increased to over 2,000 people. The economy continued to diversify, with the addition of a number of new businesses, including a lumber yard, a tire store, and a car wash.
In the 1990s, the town experienced a period of decline, as the population decreased to just over 1,000 people. The economy continued to diversify, with the addition of a number of new businesses, including a convenience store, a video store, and a pizza parlor.
Geography
Jayton is located in the heart of the Texas Panhandle, in Kent County. The town is situated on the banks of the Clear Fork of the Brazos River, and is surrounded by rolling hills and prairies. The town is located approximately 50 miles east of Lubbock, and is approximately 100 miles west of Abilene.
The climate in Jayton is semi-arid, with hot summers and mild winters. The average annual temperature is around 68 degrees Fahrenheit, with an average high of around 90 degrees in the summer and an average low of around 40 degrees in the winter. The average annual precipitation is around 20 inches.
Economy
The economy of Jayton is primarily based on agriculture, with cotton and grain being the main crops. The town also has a number of small businesses, including a grocery store, a cafe, a hardware store, and a car dealership.
The town is also home to a number of manufacturing companies, including a furniture factory, a clothing factory, and a plastics factory. The town is also home to a number of oil and gas companies, as well as a number of wind farms.
Demographics
As of the 2010 census, the population of Jayton was 1,092. The racial makeup of the town was 94.3% White, 0.7% African American, 0.3% Native American, 0.2% Asian, 0.1% Pacific Islander, 2.7% from other races, and 1.9% from two or more races. Hispanic or Latino of any race were 5.2% of the population.
The median income for a household in Jayton was $31,250, and the median income for a family was $37,500. The per capita income for the town was $15,945. About 16.2% of families and 19.2% of the population were below the poverty line, including 25.2% of those under age 18 and 15.2% of those age 65 or over.
Common Questions
What is Per Capita Income in Jayton?
Per Capita income in Jayton is $29,384.
What is the Median Family Income in Jayton?
Median Family Income in Jayton is $81,607.
What is the Median Household income in Jayton?
Median Household Income in Jayton is $68,651.
What is Inequality or Gini Index in Jayton?
Inequality or Gini Index in Jayton is 0.38.
What is the Total Population of Jayton?
Total Population of Jayton is 421.
What is the Total Male Population of Jayton?
Total Male Population of Jayton is 208.
What is the Total Female Population of Jayton?
Total Female Population of Jayton is 213.
What is the Ratio of Males per 100 Females in Jayton?
There are 97.65 Males per 100 Females in Jayton.
What is the Ratio of Females per 100 Males in Jayton?
There are 102.40 Females per 100 Males in Jayton.
What is the Median Population Age in Jayton?
Median Population Age in Jayton is 48.9 Years.
What is the Average Family Size in Jayton
Average Family Size in Jayton is 3.1 People.
What is the Average Household Size in Jayton
Average Household Size in Jayton is 2.3 People.
How Large is the Labor Force in Jayton?
There are 146 People in the Labor Forcein in Jayton.
What is the Percentage of People in the Labor Force in Jayton?
44.9% of People are in the Labor Force in Jayton.
What is the Unemployment Rate in Jayton?
Unemployment Rate in Jayton is 2.1%.