Shallowater, TX Map & Demographics
Shallowater Map
Shallowater Overview
$31,776
PER CAPITA INCOME
$80,000
AVG FAMILY INCOME
$71,572
AVG HOUSEHOLD INCOME
14.4%
WAGE / INCOME GAP [ % ]
85.6¢/ $1
WAGE / INCOME GAP [ $ ]
0.38
INEQUALITY / GINI INDEX
2,926
TOTAL POPULATION
1,532
MALE POPULATION
1,394
FEMALE POPULATION
109.90
MALES / 100 FEMALES
90.99
FEMALES / 100 MALES
38.3
MEDIAN AGE
3.2
AVG FAMILY SIZE
2.8
AVG HOUSEHOLD SIZE
1,354
LABOR FORCE [ PEOPLE ]
63.9%
PERCENT IN LABOR FORCE
3.9%
UNEMPLOYMENT RATE
Shallowater Zip Codes
Shallowater Area Codes
Income in Shallowater
Income Overview in Shallowater
Per Capita Income in Shallowater is $31,776, while median incomes of families and households are $80,000 and $71,572 respectively.
| Characteristic | Number | Measure |
| Per Capita Income | 2,926 | $31,776 |
| Median Family Income | 816 | $80,000 |
| Mean Family Income | 816 | $101,981 |
| Median Household Income | 1,060 | $71,572 |
| Mean Household Income | 1,060 | $88,314 |
| Income Deficit | 816 | $0 |
| Wage / Income Gap (%) | 2,926 | 14.45% |
| Wage / Income Gap ($) | 2,926 | 85.55¢ per $1 |
| Gini / Inequality Index | 2,926 | 0.38 |
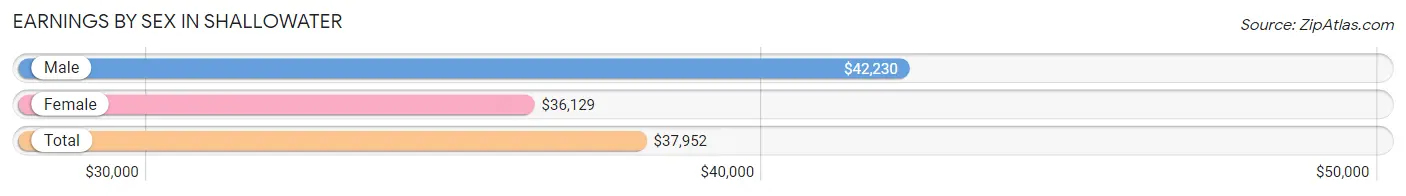
Earnings by Sex in Shallowater
Average Earnings in Shallowater are $37,952, $42,230 for men and $36,129 for women, a difference of 14.4%.
| Sex | Number | Average Earnings |
| Male | 745 (52.7%) | $42,230 |
| Female | 668 (47.3%) | $36,129 |
| Total | 1,413 (100.0%) | $37,952 |
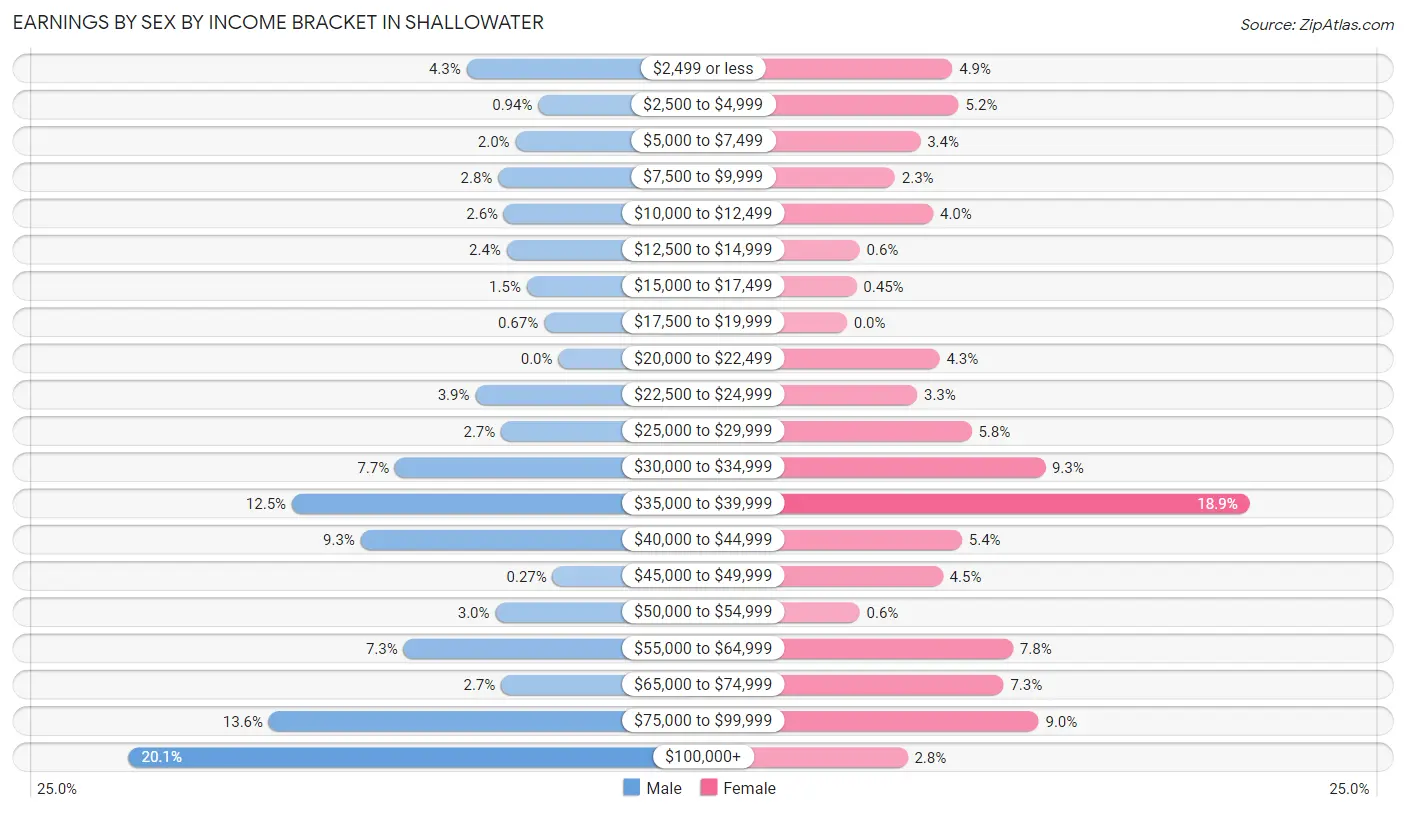
Earnings by Sex by Income Bracket in Shallowater
The most common earnings brackets in Shallowater are $100,000+ for men (150 | 20.1%) and $35,000 to $39,999 for women (126 | 18.9%).
| Income | Male | Female |
| $2,499 or less | 32 (4.3%) | 33 (4.9%) |
| $2,500 to $4,999 | 7 (0.9%) | 35 (5.2%) |
| $5,000 to $7,499 | 15 (2.0%) | 23 (3.4%) |
| $7,500 to $9,999 | 21 (2.8%) | 15 (2.2%) |
| $10,000 to $12,499 | 19 (2.5%) | 27 (4.0%) |
| $12,500 to $14,999 | 18 (2.4%) | 4 (0.6%) |
| $15,000 to $17,499 | 11 (1.5%) | 3 (0.4%) |
| $17,500 to $19,999 | 5 (0.7%) | 0 (0.0%) |
| $20,000 to $22,499 | 0 (0.0%) | 29 (4.3%) |
| $22,500 to $24,999 | 29 (3.9%) | 22 (3.3%) |
| $25,000 to $29,999 | 20 (2.7%) | 39 (5.8%) |
| $30,000 to $34,999 | 57 (7.6%) | 62 (9.3%) |
| $35,000 to $39,999 | 93 (12.5%) | 126 (18.9%) |
| $40,000 to $44,999 | 69 (9.3%) | 36 (5.4%) |
| $45,000 to $49,999 | 2 (0.3%) | 30 (4.5%) |
| $50,000 to $54,999 | 22 (2.9%) | 4 (0.6%) |
| $55,000 to $64,999 | 54 (7.2%) | 52 (7.8%) |
| $65,000 to $74,999 | 20 (2.7%) | 49 (7.3%) |
| $75,000 to $99,999 | 101 (13.6%) | 60 (9.0%) |
| $100,000+ | 150 (20.1%) | 19 (2.8%) |
| Total | 745 (100.0%) | 668 (100.0%) |
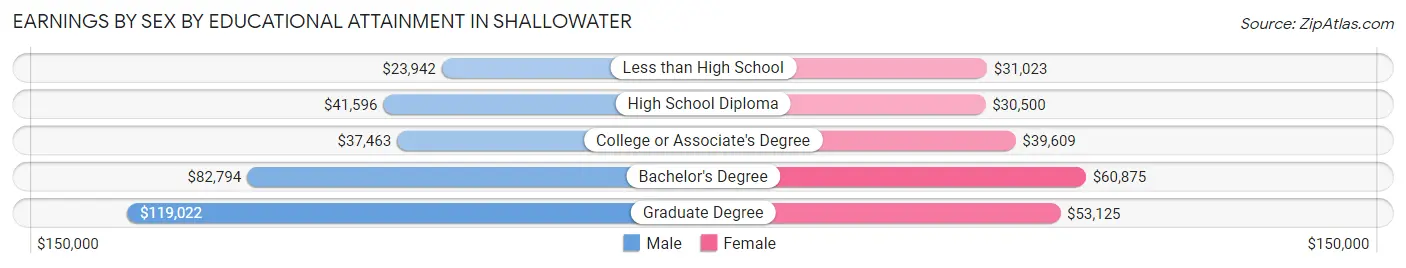
Earnings by Sex by Educational Attainment in Shallowater
Average earnings in Shallowater are $53,750 for men and $36,304 for women, a difference of 32.5%. Men with an educational attainment of graduate degree enjoy the highest average annual earnings of $119,022, while those with less than high school education earn the least with $23,942. Women with an educational attainment of bachelor's degree earn the most with the average annual earnings of $60,875, while those with high school diploma education have the smallest earnings of $30,500.
| Educational Attainment | Male Income | Female Income |
| Less than High School | $23,942 | $31,023 |
| High School Diploma | $41,596 | $30,500 |
| College or Associate's Degree | $37,463 | $39,609 |
| Bachelor's Degree | $82,794 | $60,875 |
| Graduate Degree | $119,022 | $53,125 |
| Total | $53,750 | $36,304 |
Family Income in Shallowater
Family Income Brackets in Shallowater
According to the Shallowater family income data, there are 184 families falling into the $50,000 to $74,999 income range, which is the most common income bracket and makes up 22.6% of all families. Conversely, the $25,000 to $34,999 income bracket is the least frequent group with only 6 families (0.7%) belonging to this category.
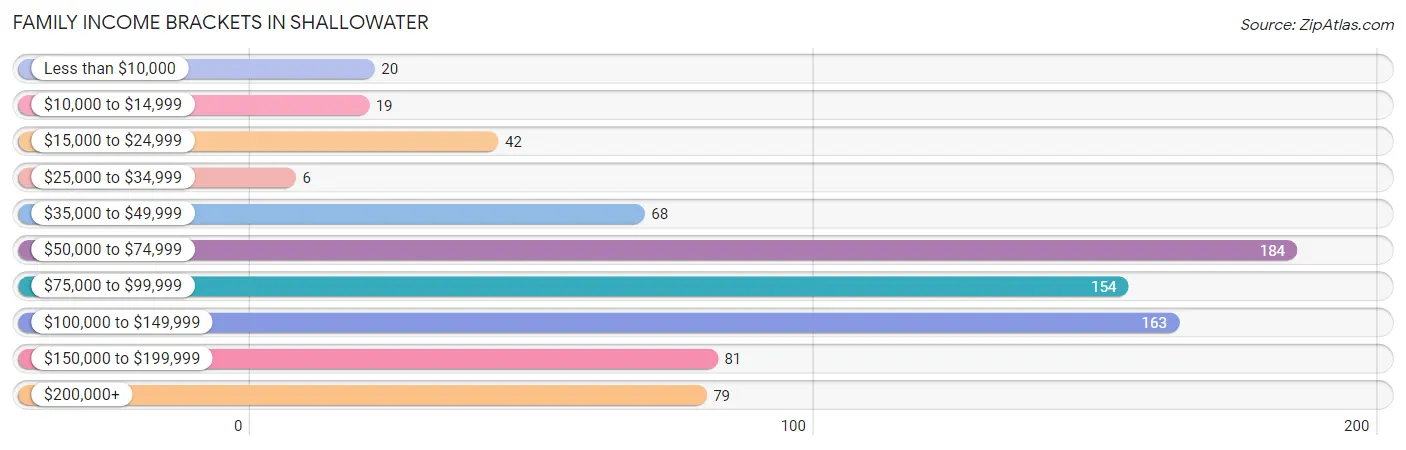
| Income Bracket | # Families | % Families |
| Less than $10,000 | 20 | 2.5% |
| $10,000 to $14,999 | 19 | 2.3% |
| $15,000 to $24,999 | 42 | 5.1% |
| $25,000 to $34,999 | 6 | 0.7% |
| $35,000 to $49,999 | 68 | 8.3% |
| $50,000 to $74,999 | 184 | 22.5% |
| $75,000 to $99,999 | 154 | 18.9% |
| $100,000 to $149,999 | 163 | 20.0% |
| $150,000 to $199,999 | 81 | 9.9% |
| $200,000+ | 79 | 9.7% |
Family Income by Famaliy Size in Shallowater
5-person families (75 | 9.2%) account for the highest median family income in Shallowater with $103,977 per family, while 2-person families (333 | 40.8%) have the highest median income of $37,054 per family member.
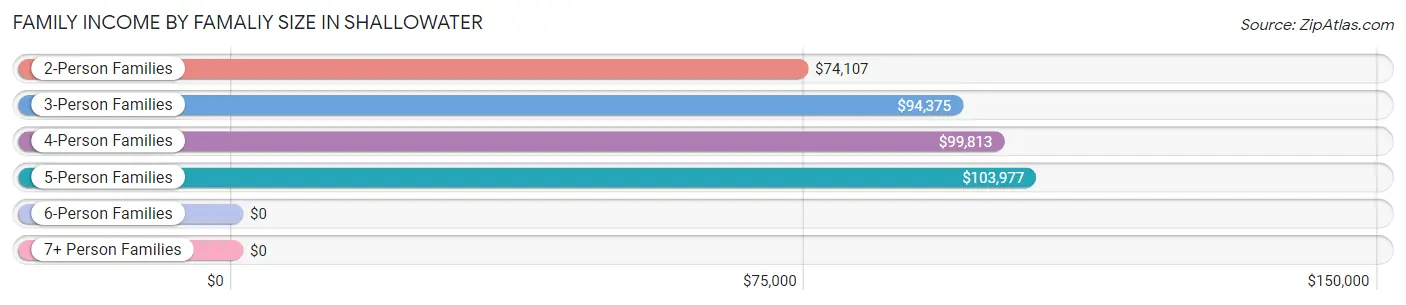
| Income Bracket | # Families | Median Income |
| 2-Person Families | 333 (40.8%) | $74,107 |
| 3-Person Families | 143 (17.5%) | $94,375 |
| 4-Person Families | 221 (27.1%) | $99,813 |
| 5-Person Families | 75 (9.2%) | $103,977 |
| 6-Person Families | 44 (5.4%) | $0 |
| 7+ Person Families | 0 (0.0%) | $0 |
| Total | 816 (100.0%) | $80,000 |
Family Income by Number of Earners in Shallowater
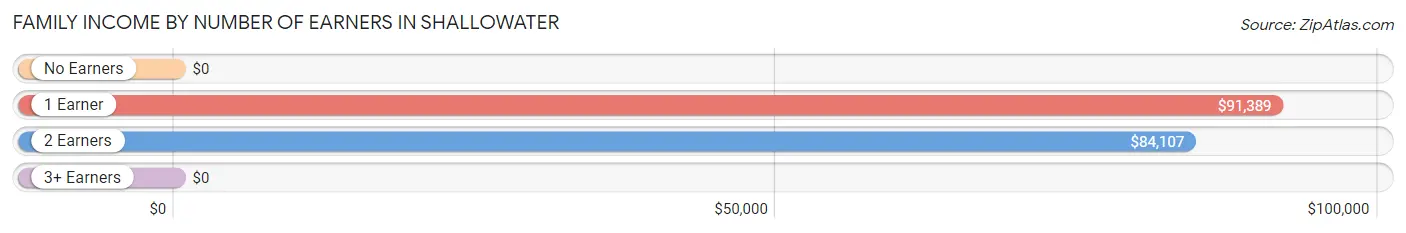
| Number of Earners | # Families | Median Income |
| No Earners | 102 (12.5%) | $0 |
| 1 Earner | 190 (23.3%) | $91,389 |
| 2 Earners | 463 (56.7%) | $84,107 |
| 3+ Earners | 61 (7.5%) | $0 |
| Total | 816 (100.0%) | $80,000 |
Household Income in Shallowater
Household Income Brackets in Shallowater
With 288 households falling in the category, the $50,000 to $74,999 income range is the most frequent in Shallowater, accounting for 27.2% of all households. In contrast, only 6 households (0.6%) fall into the $25,000 to $34,999 income bracket, making it the least populous group.
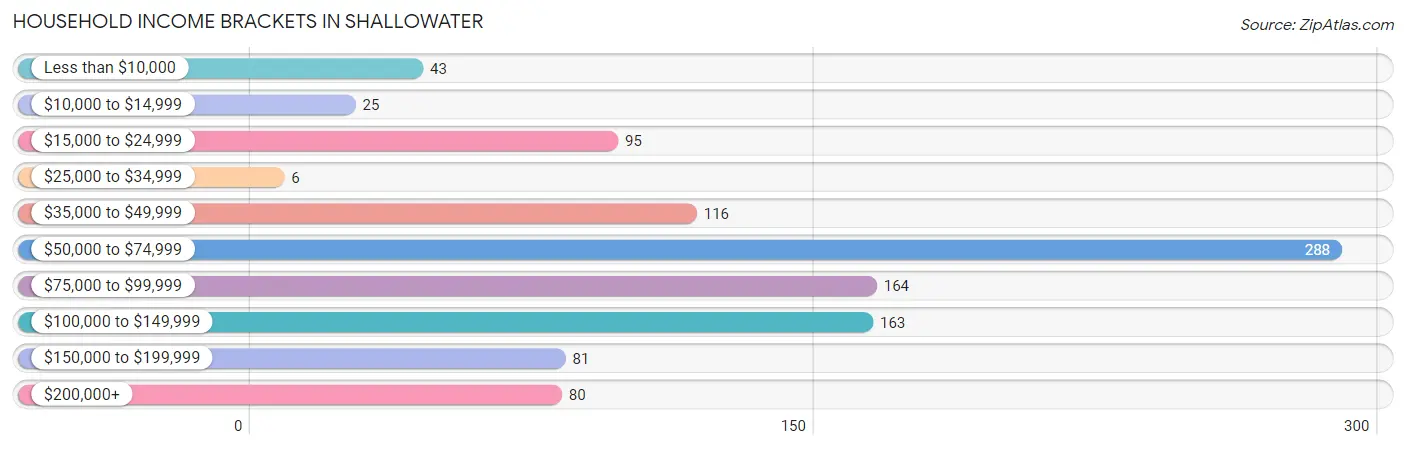
| Income Bracket | # Households | % Households |
| Less than $10,000 | 43 | 4.1% |
| $10,000 to $14,999 | 25 | 2.4% |
| $15,000 to $24,999 | 95 | 9.0% |
| $25,000 to $34,999 | 6 | 0.6% |
| $35,000 to $49,999 | 116 | 10.9% |
| $50,000 to $74,999 | 288 | 27.2% |
| $75,000 to $99,999 | 164 | 15.5% |
| $100,000 to $149,999 | 163 | 15.4% |
| $150,000 to $199,999 | 81 | 7.6% |
| $200,000+ | 80 | 7.5% |
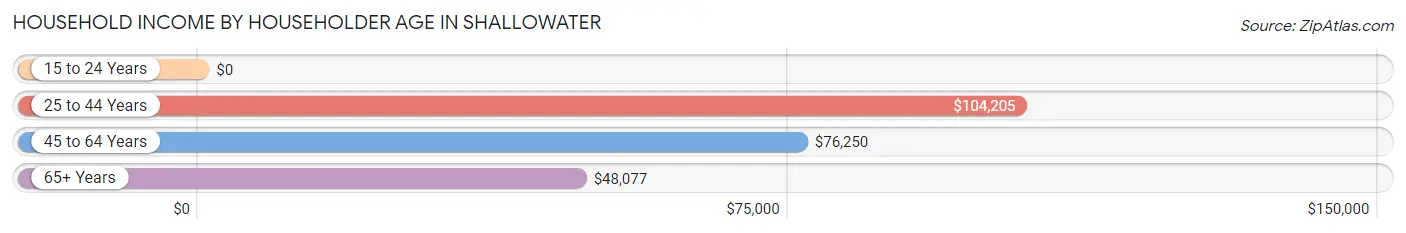
Household Income by Householder Age in Shallowater
The median household income in Shallowater is $71,572, with the highest median household income of $104,205 found in the 25 to 44 years age bracket for the primary householder. A total of 295 households (27.8%) fall into this category. Meanwhile, the 15 to 24 years age bracket for the primary householder has the lowest median household income of $0, with 8 households (0.7%) in this group.
| Income Bracket | # Households | Median Income |
| 15 to 24 Years | 8 (0.7%) | $0 |
| 25 to 44 Years | 295 (27.8%) | $104,205 |
| 45 to 64 Years | 419 (39.5%) | $76,250 |
| 65+ Years | 338 (31.9%) | $48,077 |
| Total | 1,060 (100.0%) | $71,572 |
Poverty in Shallowater
Income Below Poverty by Sex and Age in Shallowater
With 6.7% poverty level for males and 6.7% for females among the residents of Shallowater, under 5 year old males and 25 to 34 year old females are the most vulnerable to poverty, with 19 males (28.8%) and 33 females (19.2%) in their respective age groups living below the poverty level.
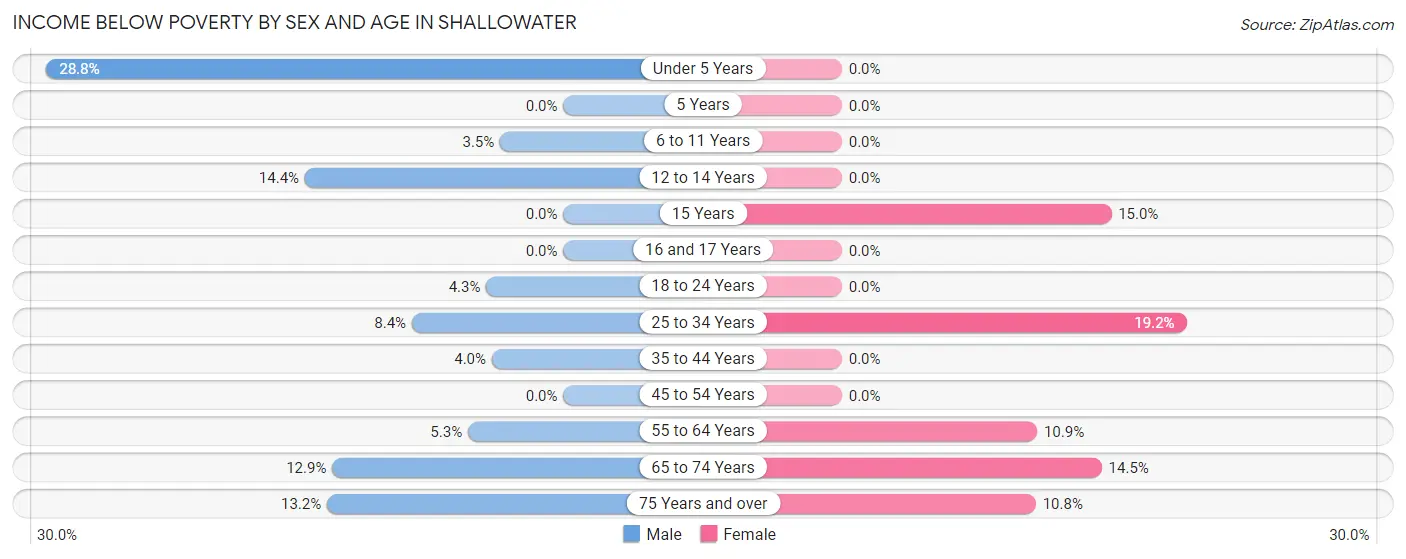
| Age Bracket | Male | Female |
| Under 5 Years | 19 (28.8%) | 0 (0.0%) |
| 5 Years | 0 (0.0%) | 0 (0.0%) |
| 6 to 11 Years | 10 (3.5%) | 0 (0.0%) |
| 12 to 14 Years | 20 (14.4%) | 0 (0.0%) |
| 15 Years | 0 (0.0%) | 3 (15.0%) |
| 16 and 17 Years | 0 (0.0%) | 0 (0.0%) |
| 18 to 24 Years | 3 (4.3%) | 0 (0.0%) |
| 25 to 34 Years | 15 (8.4%) | 33 (19.2%) |
| 35 to 44 Years | 7 (4.0%) | 0 (0.0%) |
| 45 to 54 Years | 0 (0.0%) | 0 (0.0%) |
| 55 to 64 Years | 6 (5.3%) | 15 (10.9%) |
| 65 to 74 Years | 13 (12.9%) | 23 (14.5%) |
| 75 Years and over | 10 (13.2%) | 19 (10.8%) |
| Total | 103 (6.7%) | 93 (6.7%) |
Income Above Poverty by Sex and Age in Shallowater
According to the poverty statistics in Shallowater, males aged 5 years and females aged under 5 years are the age groups that are most secure financially, with 100.0% of males and 100.0% of females in these age groups living above the poverty line.
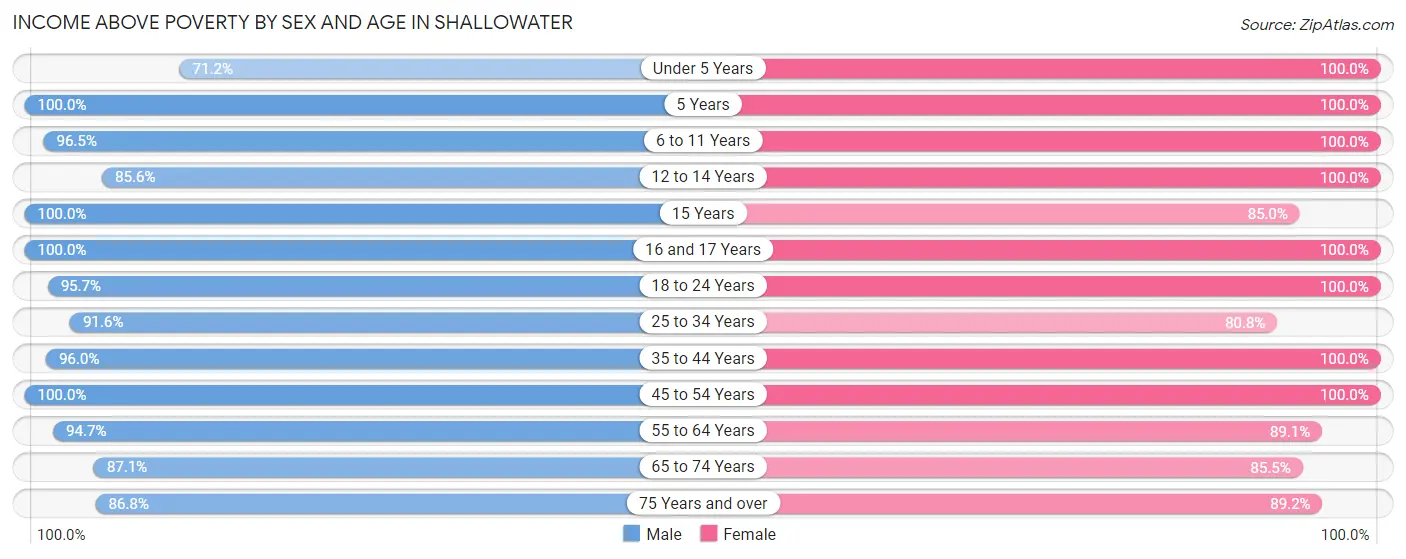
| Age Bracket | Male | Female |
| Under 5 Years | 47 (71.2%) | 59 (100.0%) |
| 5 Years | 23 (100.0%) | 45 (100.0%) |
| 6 to 11 Years | 274 (96.5%) | 106 (100.0%) |
| 12 to 14 Years | 119 (85.6%) | 50 (100.0%) |
| 15 Years | 11 (100.0%) | 17 (85.0%) |
| 16 and 17 Years | 56 (100.0%) | 53 (100.0%) |
| 18 to 24 Years | 67 (95.7%) | 43 (100.0%) |
| 25 to 34 Years | 163 (91.6%) | 139 (80.8%) |
| 35 to 44 Years | 169 (96.0%) | 190 (100.0%) |
| 45 to 54 Years | 235 (100.0%) | 183 (100.0%) |
| 55 to 64 Years | 107 (94.7%) | 123 (89.1%) |
| 65 to 74 Years | 88 (87.1%) | 136 (85.5%) |
| 75 Years and over | 66 (86.8%) | 157 (89.2%) |
| Total | 1,425 (93.3%) | 1,301 (93.3%) |
Income Below Poverty Among Married-Couple Families in Shallowater
The poverty statistics for married-couple families in Shallowater show that 2.5% or 16 of the total 628 families live below the poverty line. Families with no children have the highest poverty rate of 4.7%, comprising of 16 families. On the other hand, families with 1 or 2 children have the lowest poverty rate of 0.0%, which includes 0 families.
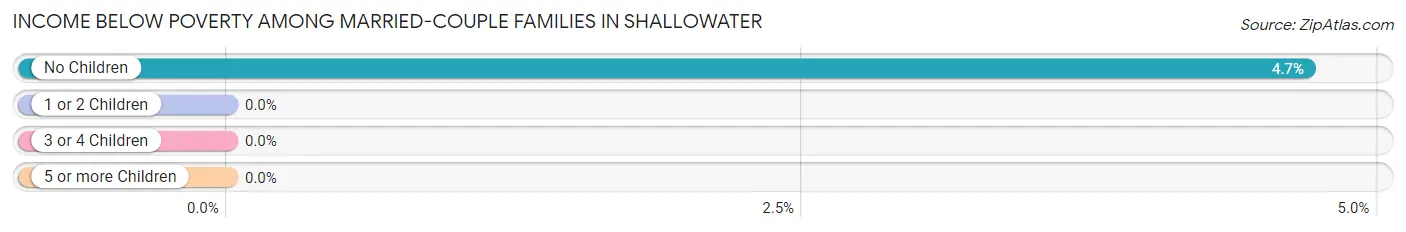
| Children | Above Poverty | Below Poverty |
| No Children | 325 (95.3%) | 16 (4.7%) |
| 1 or 2 Children | 202 (100.0%) | 0 (0.0%) |
| 3 or 4 Children | 85 (100.0%) | 0 (0.0%) |
| 5 or more Children | 0 (0.0%) | 0 (0.0%) |
| Total | 612 (97.5%) | 16 (2.5%) |
Income Below Poverty Among Single-Parent Households in Shallowater
According to the poverty data in Shallowater, 14.3% or 7 single-father households and 25.2% or 35 single-mother households are living below the poverty line. Among single-father households, those with no children have the highest poverty rate, with 7 households (35.0%) experiencing poverty. Likewise, among single-mother households, those with 1 or 2 children have the highest poverty rate, with 29 households (27.1%) falling below the poverty line.
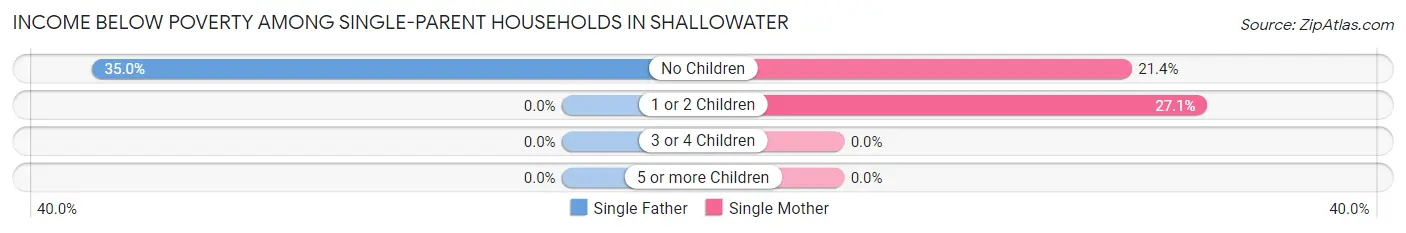
| Children | Single Father | Single Mother |
| No Children | 7 (35.0%) | 6 (21.4%) |
| 1 or 2 Children | 0 (0.0%) | 29 (27.1%) |
| 3 or 4 Children | 0 (0.0%) | 0 (0.0%) |
| 5 or more Children | 0 (0.0%) | 0 (0.0%) |
| Total | 7 (14.3%) | 35 (25.2%) |
Income Below Poverty Among Married-Couple vs Single-Parent Households in Shallowater
The poverty data for Shallowater shows that 16 of the married-couple family households (2.5%) and 42 of the single-parent households (22.3%) are living below the poverty level. Within the married-couple family households, those with no children have the highest poverty rate, with 16 households (4.7%) falling below the poverty line. Among the single-parent households, those with no children have the highest poverty rate, with 13 household (27.1%) living below poverty.
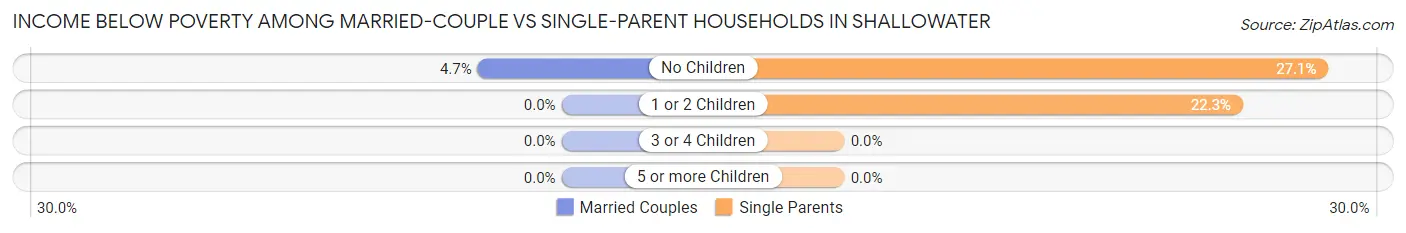
| Children | Married-Couple Families | Single-Parent Households |
| No Children | 16 (4.7%) | 13 (27.1%) |
| 1 or 2 Children | 0 (0.0%) | 29 (22.3%) |
| 3 or 4 Children | 0 (0.0%) | 0 (0.0%) |
| 5 or more Children | 0 (0.0%) | 0 (0.0%) |
| Total | 16 (2.5%) | 42 (22.3%) |
Race in Shallowater
The most populous races in Shallowater are White / Caucasian (2,191 | 74.9%), Hispanic or Latino (981 | 33.5%), and Two or more Races (635 | 21.7%).
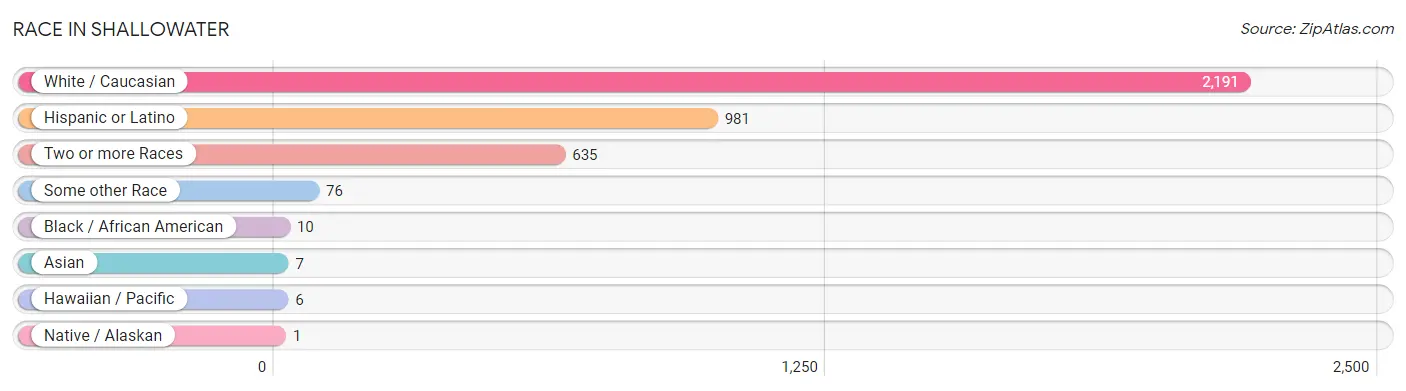
| Race | # Population | % Population |
| Asian | 7 | 0.2% |
| Black / African American | 10 | 0.3% |
| Hawaiian / Pacific | 6 | 0.2% |
| Hispanic or Latino | 981 | 33.5% |
| Native / Alaskan | 1 | 0.0% |
| White / Caucasian | 2,191 | 74.9% |
| Two or more Races | 635 | 21.7% |
| Some other Race | 76 | 2.6% |
| Total | 2,926 | 100.0% |
Ancestry in Shallowater
The most populous ancestries reported in Shallowater are Mexican (798 | 27.3%), German (340 | 11.6%), American (276 | 9.4%), English (256 | 8.7%), and Irish (154 | 5.3%), together accounting for 62.3% of all Shallowater residents.
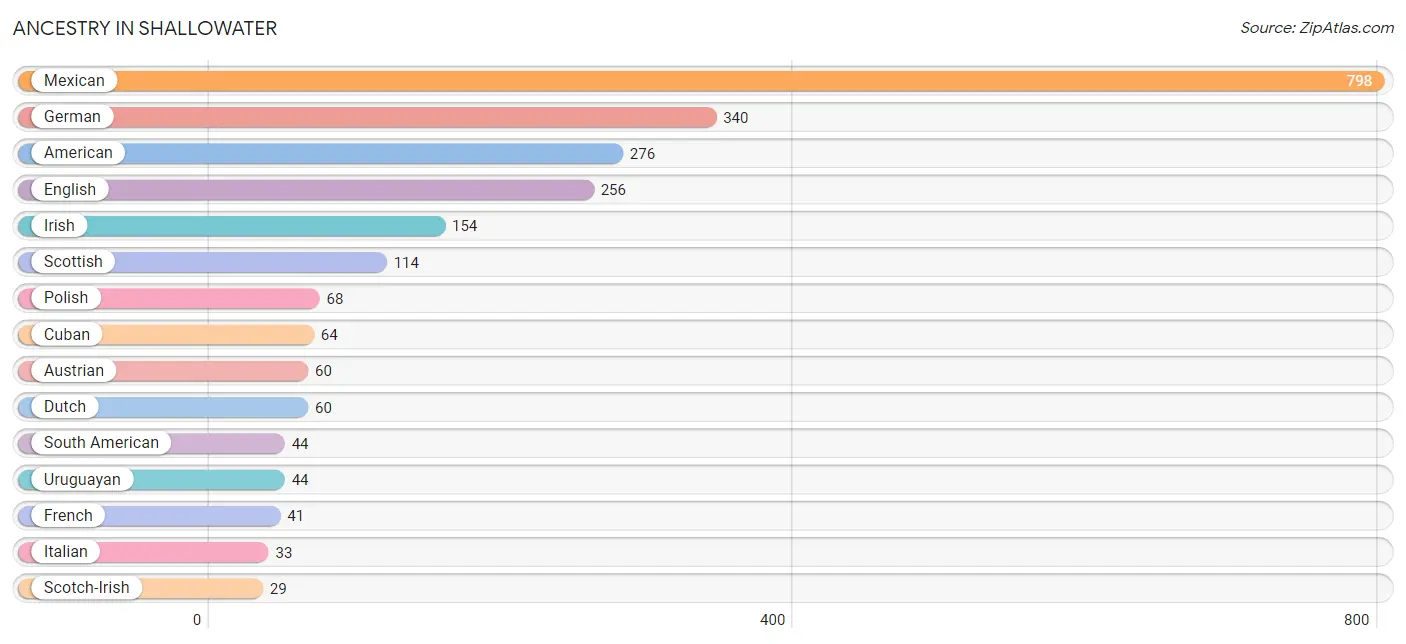
| Ancestry | # Population | % Population |
| American | 276 | 9.4% |
| Austrian | 60 | 2.1% |
| British | 12 | 0.4% |
| Comanche | 1 | 0.0% |
| Cuban | 64 | 2.2% |
| Czech | 13 | 0.4% |
| Dutch | 60 | 2.1% |
| English | 256 | 8.7% |
| French | 41 | 1.4% |
| German | 340 | 11.6% |
| Guamanian / Chamorro | 16 | 0.5% |
| Indian (Asian) | 7 | 0.2% |
| Irish | 154 | 5.3% |
| Italian | 33 | 1.1% |
| Jamaican | 10 | 0.3% |
| Mexican | 798 | 27.3% |
| Polish | 68 | 2.3% |
| Scotch-Irish | 29 | 1.0% |
| Scottish | 114 | 3.9% |
| South American | 44 | 1.5% |
| Spanish | 16 | 0.5% |
| Uruguayan | 44 | 1.5% |
| Welsh | 2 | 0.1% | View All 23 Rows |
Immigrants in Shallowater
The most numerous immigrant groups reported in Shallowater came from Latin America (88 | 3.0%), Central America (67 | 2.3%), Mexico (67 | 2.3%), South America (11 | 0.4%), and Uruguay (11 | 0.4%), together accounting for 8.3% of all Shallowater residents.
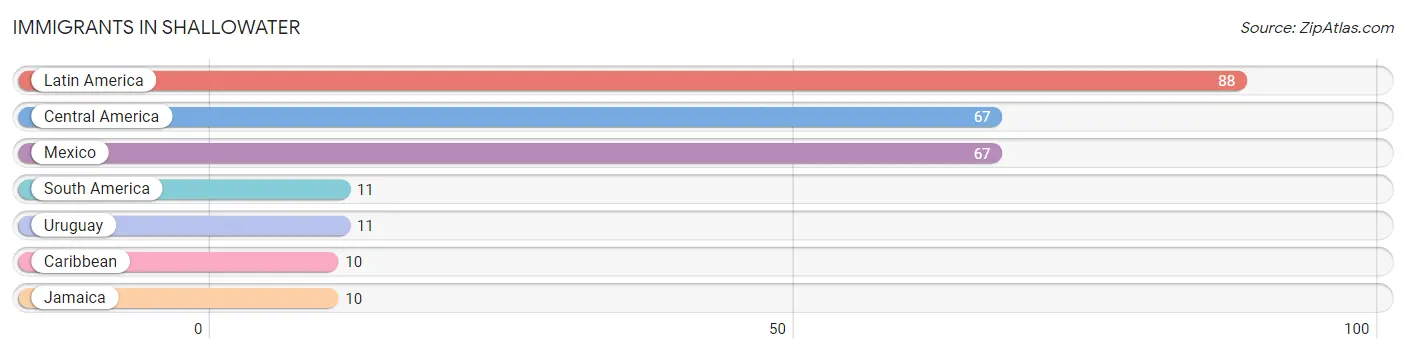
| Immigration Origin | # Population | % Population |
| Caribbean | 10 | 0.3% |
| Central America | 67 | 2.3% |
| Jamaica | 10 | 0.3% |
| Latin America | 88 | 3.0% |
| Mexico | 67 | 2.3% |
| South America | 11 | 0.4% |
| Uruguay | 11 | 0.4% | View All 7 Rows |
Sex and Age in Shallowater
Sex and Age in Shallowater
The most populous age groups in Shallowater are 5 to 9 Years (234 | 15.3%) for men and 45 to 49 Years (126 | 9.0%) for women.
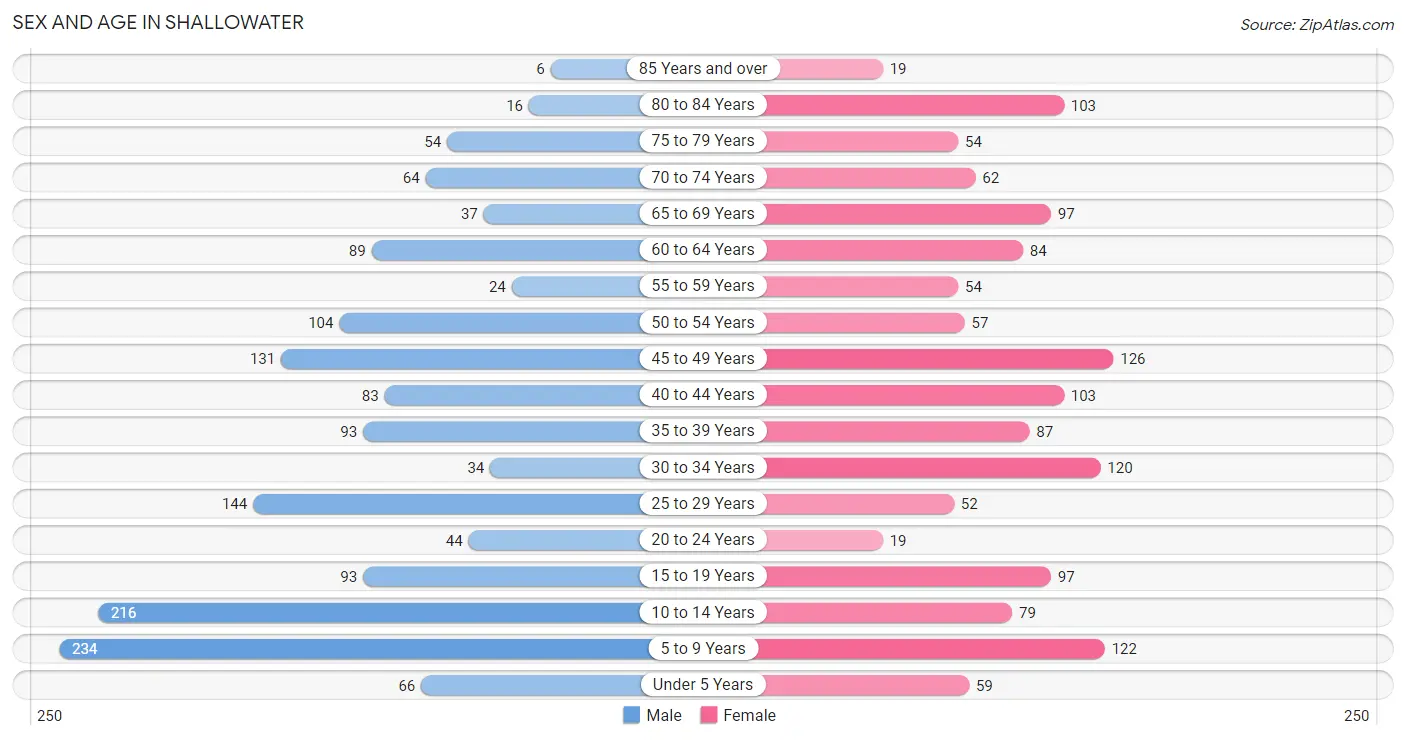
| Age Bracket | Male | Female |
| Under 5 Years | 66 (4.3%) | 59 (4.2%) |
| 5 to 9 Years | 234 (15.3%) | 122 (8.7%) |
| 10 to 14 Years | 216 (14.1%) | 79 (5.7%) |
| 15 to 19 Years | 93 (6.1%) | 97 (7.0%) |
| 20 to 24 Years | 44 (2.9%) | 19 (1.4%) |
| 25 to 29 Years | 144 (9.4%) | 52 (3.7%) |
| 30 to 34 Years | 34 (2.2%) | 120 (8.6%) |
| 35 to 39 Years | 93 (6.1%) | 87 (6.2%) |
| 40 to 44 Years | 83 (5.4%) | 103 (7.4%) |
| 45 to 49 Years | 131 (8.6%) | 126 (9.0%) |
| 50 to 54 Years | 104 (6.8%) | 57 (4.1%) |
| 55 to 59 Years | 24 (1.6%) | 54 (3.9%) |
| 60 to 64 Years | 89 (5.8%) | 84 (6.0%) |
| 65 to 69 Years | 37 (2.4%) | 97 (7.0%) |
| 70 to 74 Years | 64 (4.2%) | 62 (4.4%) |
| 75 to 79 Years | 54 (3.5%) | 54 (3.9%) |
| 80 to 84 Years | 16 (1.0%) | 103 (7.4%) |
| 85 Years and over | 6 (0.4%) | 19 (1.4%) |
| Total | 1,532 (100.0%) | 1,394 (100.0%) |
Families and Households in Shallowater
Median Family Size in Shallowater
The median family size in Shallowater is 3.20 persons per family, with married-couple families (628 | 77.0%) accounting for the largest median family size of 3.25 persons per family. On the other hand, single male/father families (49 | 6.0%) represent the smallest median family size with 2.57 persons per family.
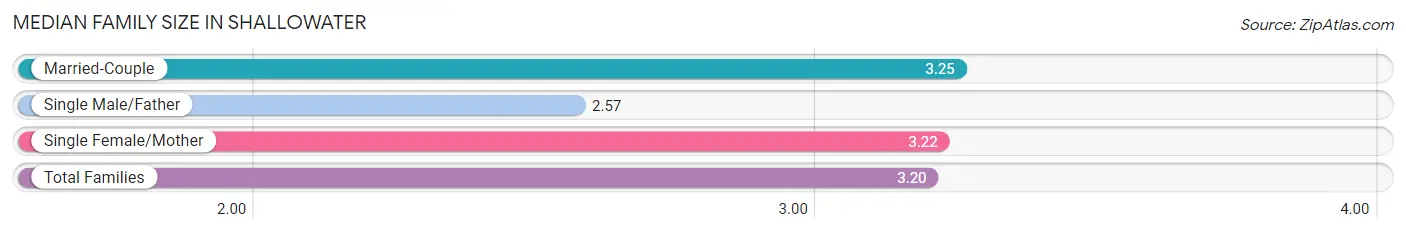
| Family Type | # Families | Family Size |
| Married-Couple | 628 (77.0%) | 3.25 |
| Single Male/Father | 49 (6.0%) | 2.57 |
| Single Female/Mother | 139 (17.0%) | 3.22 |
| Total Families | 816 (100.0%) | 3.20 |
Median Household Size in Shallowater
The median household size in Shallowater is 2.76 persons per household, with single female/mother households (139 | 13.1%) accounting for the largest median household size of 3.32 persons per household. non-family households (244 | 23.0%) represent the smallest median household size with 1.21 persons per household.
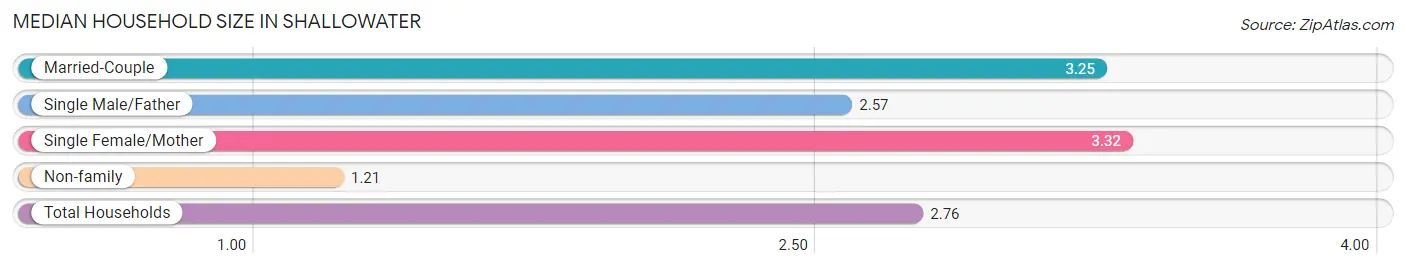
| Household Type | # Households | Household Size |
| Married-Couple | 628 (59.3%) | 3.25 |
| Single Male/Father | 49 (4.6%) | 2.57 |
| Single Female/Mother | 139 (13.1%) | 3.32 |
| Non-family | 244 (23.0%) | 1.21 |
| Total Households | 1,060 (100.0%) | 2.76 |
Household Size by Marriage Status in Shallowater
Out of a total of 1,060 households in Shallowater, 816 (77.0%) are family households, while 244 (23.0%) are nonfamily households. The most numerous type of family households are 2-person households, comprising 333, and the most common type of nonfamily households are 1-person households, comprising 196.
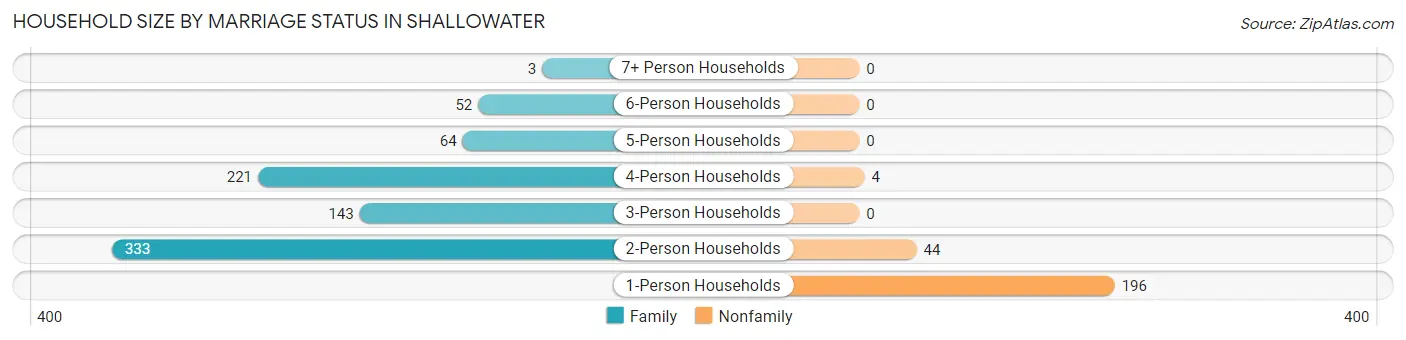
| Household Size | Family Households | Nonfamily Households |
| 1-Person Households | - | 196 (18.5%) |
| 2-Person Households | 333 (31.4%) | 44 (4.2%) |
| 3-Person Households | 143 (13.5%) | 0 (0.0%) |
| 4-Person Households | 221 (20.8%) | 4 (0.4%) |
| 5-Person Households | 64 (6.0%) | 0 (0.0%) |
| 6-Person Households | 52 (4.9%) | 0 (0.0%) |
| 7+ Person Households | 3 (0.3%) | 0 (0.0%) |
| Total | 816 (77.0%) | 244 (23.0%) |
Female Fertility in Shallowater
Fertility by Age in Shallowater
Average fertility rate in Shallowater is 16.0 births per 1,000 women. Women in the age bracket of 20 to 34 years have the highest fertility rate with 52.0 births per 1,000 women. Women in the age bracket of 20 to 34 years acount for 100.0% of all women with births.
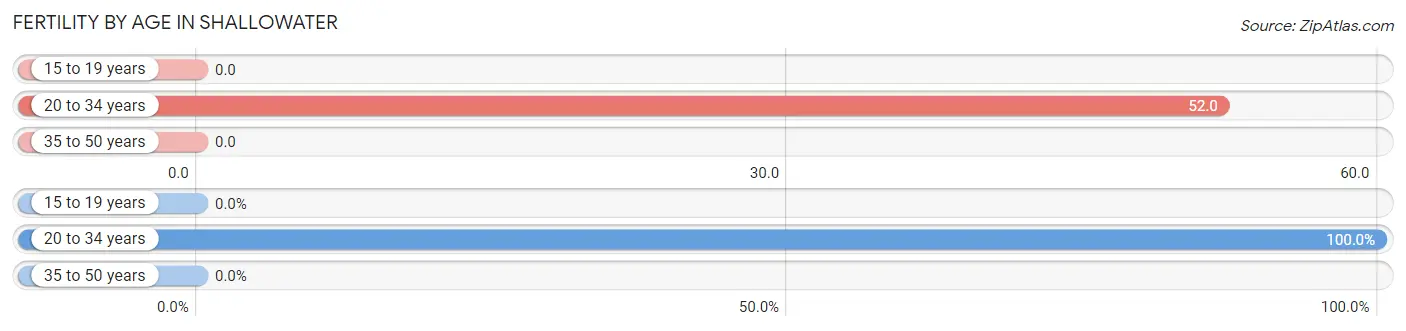
| Age Bracket | Women with Births | Births / 1,000 Women |
| 15 to 19 years | 0 (0.0%) | 0.0 |
| 20 to 34 years | 10 (100.0%) | 52.0 |
| 35 to 50 years | 0 (0.0%) | 0.0 |
| Total | 10 (100.0%) | 16.0 |
Fertility by Age by Marriage Status in Shallowater
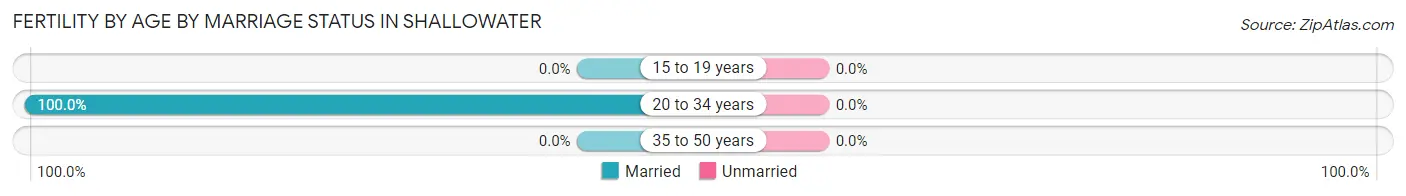
| Age Bracket | Married | Unmarried |
| 15 to 19 years | 0 (0.0%) | 0 (0.0%) |
| 20 to 34 years | 10 (100.0%) | 0 (0.0%) |
| 35 to 50 years | 0 (0.0%) | 0 (0.0%) |
| Total | 10 (100.0%) | 0 (0.0%) |
Fertility by Education in Shallowater
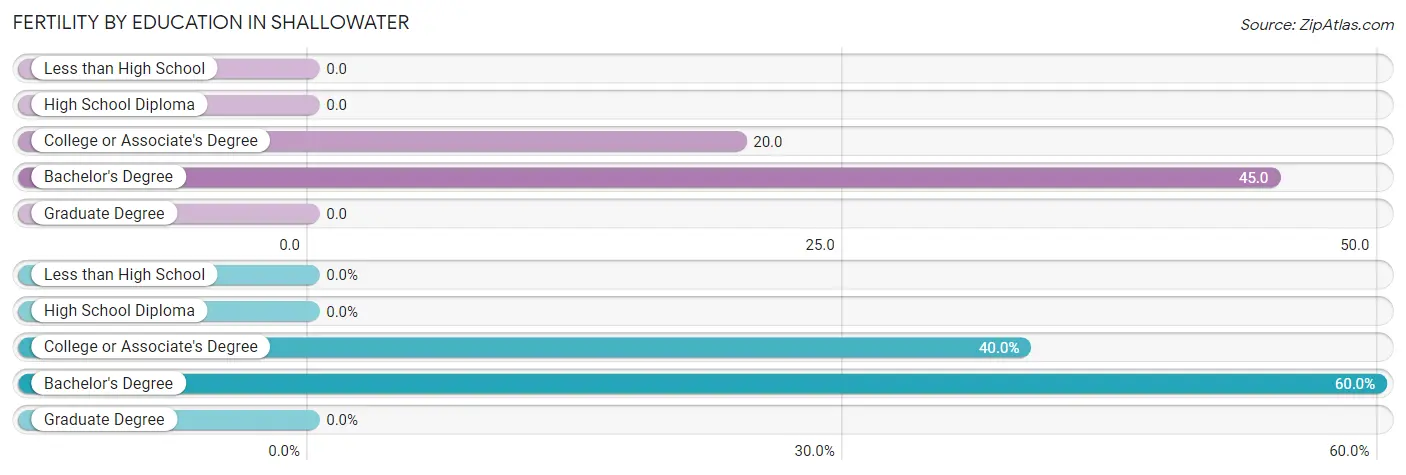
| Educational Attainment | Women with Births | Births / 1,000 Women |
| Less than High School | 0 (0.0%) | 0.0 |
| High School Diploma | 0 (0.0%) | 0.0 |
| College or Associate's Degree | 4 (40.0%) | 20.0 |
| Bachelor's Degree | 6 (60.0%) | 45.0 |
| Graduate Degree | 0 (0.0%) | 0.0 |
| Total | 10 (100.0%) | 16.0 |
Fertility by Education by Marriage Status in Shallowater
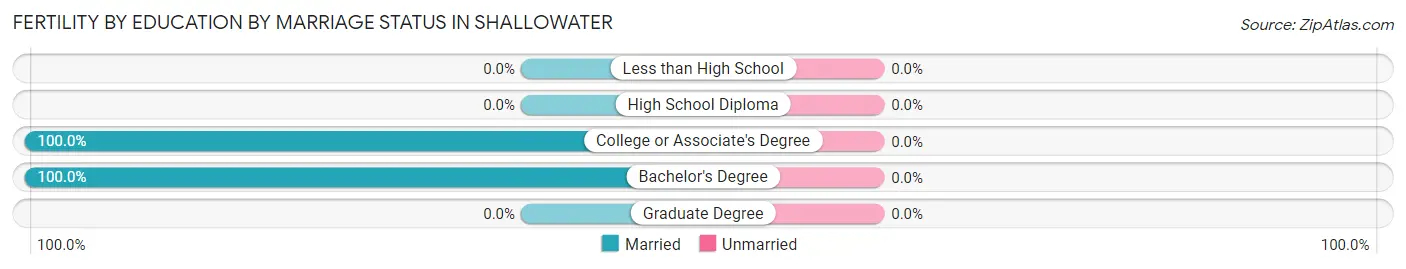
| Educational Attainment | Married | Unmarried |
| Less than High School | 0 (0.0%) | 0 (0.0%) |
| High School Diploma | 0 (0.0%) | 0 (0.0%) |
| College or Associate's Degree | 4 (100.0%) | 0 (0.0%) |
| Bachelor's Degree | 6 (100.0%) | 0 (0.0%) |
| Graduate Degree | 0 (0.0%) | 0 (0.0%) |
| Total | 10 (100.0%) | 0 (0.0%) |
Employment Characteristics in Shallowater
Employment by Class of Employer in Shallowater
Among the 1,282 employed individuals in Shallowater, private company employees (749 | 58.4%), state government employees (140 | 10.9%), and local government employees (134 | 10.4%) make up the most common classes of employment.
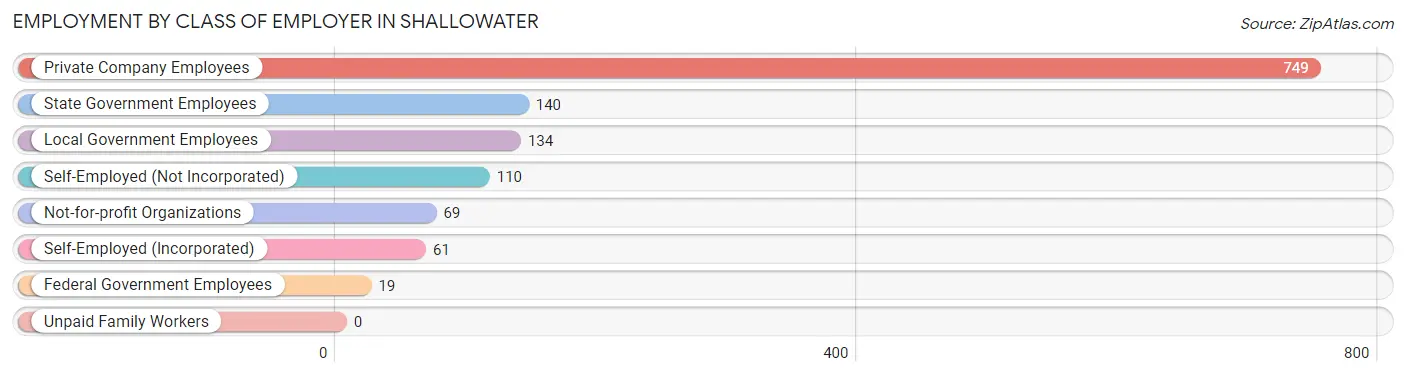
| Employer Class | # Employees | % Employees |
| Private Company Employees | 749 | 58.4% |
| Self-Employed (Incorporated) | 61 | 4.8% |
| Self-Employed (Not Incorporated) | 110 | 8.6% |
| Not-for-profit Organizations | 69 | 5.4% |
| Local Government Employees | 134 | 10.4% |
| State Government Employees | 140 | 10.9% |
| Federal Government Employees | 19 | 1.5% |
| Unpaid Family Workers | 0 | 0.0% |
| Total | 1,282 | 100.0% |
Employment Status by Age in Shallowater
According to the labor force statistics for Shallowater, out of the total population over 16 years of age (2,119), 63.9% or 1,354 individuals are in the labor force, with 3.9% or 53 of them unemployed. The age group with the highest labor force participation rate is 20 to 24 years, with 100.0% or 63 individuals in the labor force. Within the labor force, the 20 to 24 years age range has the highest percentage of unemployed individuals, with 50.0% or 32 of them being unemployed.
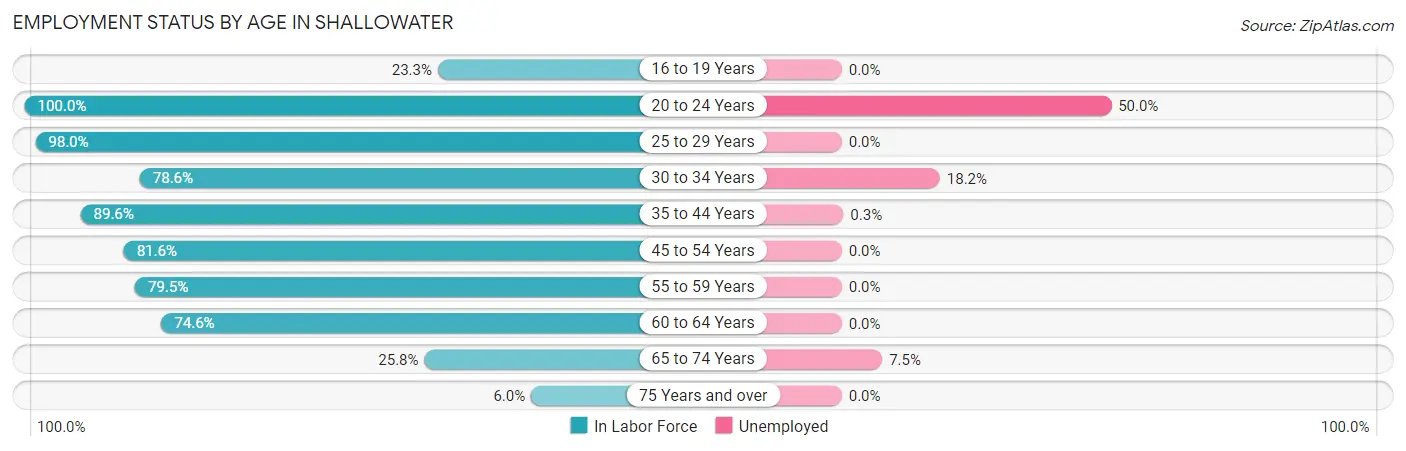
| Age Bracket | In Labor Force | Unemployed |
| 16 to 19 Years | 37 (23.3%) | 0 (0.0%) |
| 20 to 24 Years | 63 (100.0%) | 32 (50.0%) |
| 25 to 29 Years | 192 (98.0%) | 0 (0.0%) |
| 30 to 34 Years | 121 (78.6%) | 22 (18.2%) |
| 35 to 44 Years | 328 (89.6%) | 1 (0.3%) |
| 45 to 54 Years | 341 (81.6%) | 0 (0.0%) |
| 55 to 59 Years | 62 (79.5%) | 0 (0.0%) |
| 60 to 64 Years | 129 (74.6%) | 0 (0.0%) |
| 65 to 74 Years | 67 (25.8%) | 5 (7.5%) |
| 75 Years and over | 15 (6.0%) | 0 (0.0%) |
| Total | 1,354 (63.9%) | 53 (3.9%) |
Employment Status by Educational Attainment in Shallowater
According to labor force statistics for Shallowater, 84.7% of individuals (1,173) out of the total population between 25 and 64 years of age (1,385) are in the labor force, with 2.0% or 23 of them being unemployed. The group with the highest labor force participation rate are those with the educational attainment of bachelor's degree or higher, with 92.0% or 369 individuals in the labor force. Within the labor force, individuals with college / associate degree education have the highest percentage of unemployment, with 4.2% or 16 of them being unemployed.
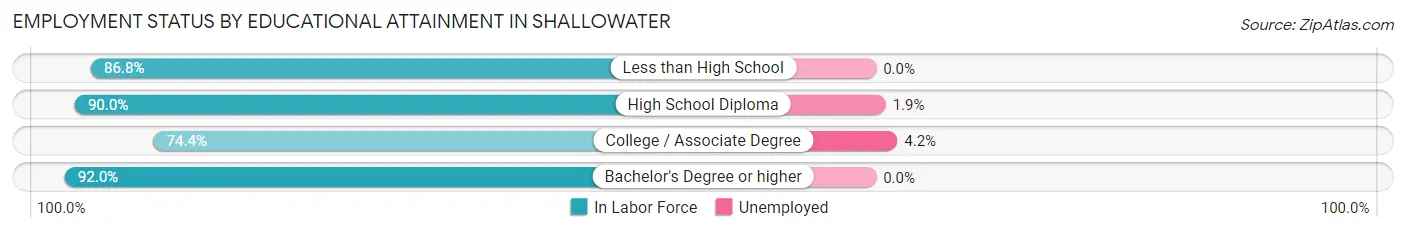
| Educational Attainment | In Labor Force | Unemployed |
| Less than High School | 59 (86.8%) | 0 (0.0%) |
| High School Diploma | 368 (90.0%) | 8 (1.9%) |
| College / Associate Degree | 377 (74.4%) | 21 (4.2%) |
| Bachelor's Degree or higher | 369 (92.0%) | 0 (0.0%) |
| Total | 1,173 (84.7%) | 28 (2.0%) |
Employment Occupations by Sex in Shallowater
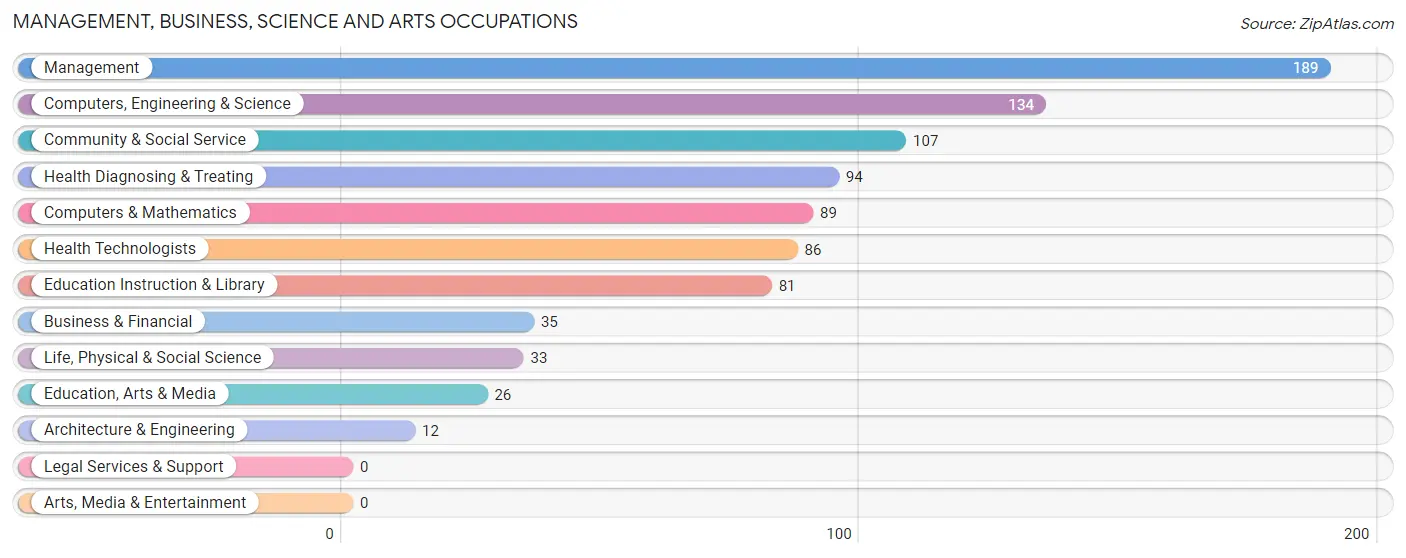
Management, Business, Science and Arts Occupations
The most common Management, Business, Science and Arts occupations in Shallowater are Management (189 | 14.7%), Computers, Engineering & Science (134 | 10.4%), Community & Social Service (107 | 8.3%), Health Diagnosing & Treating (94 | 7.3%), and Computers & Mathematics (89 | 6.9%).
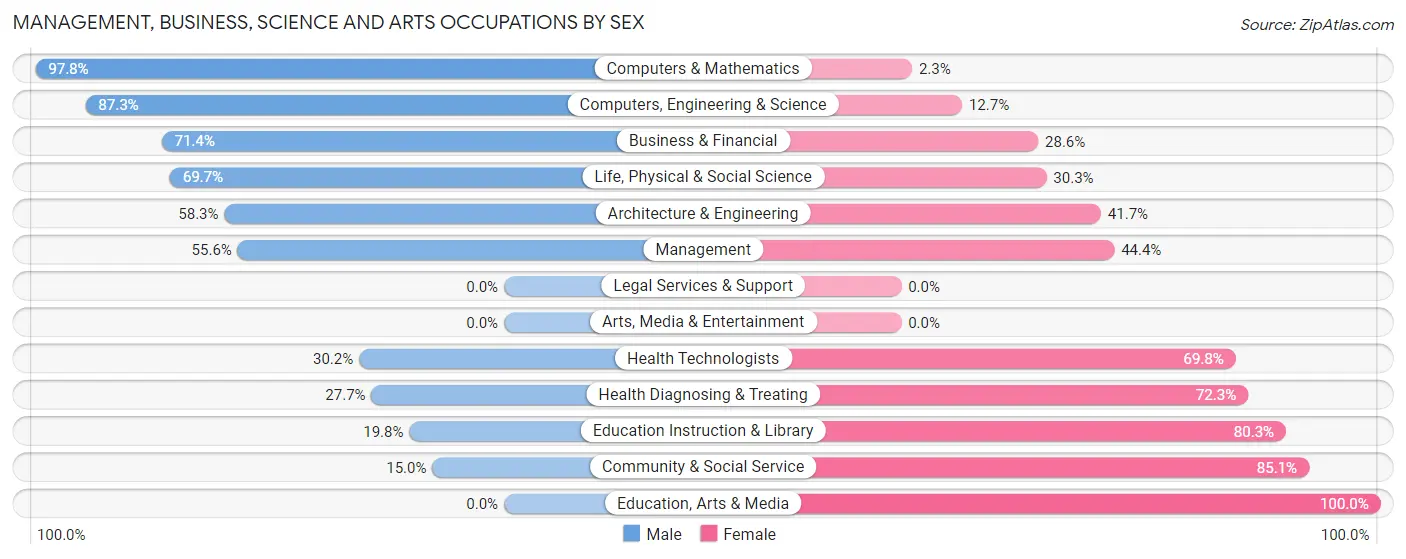
Management, Business, Science and Arts Occupations by Sex
Within the Management, Business, Science and Arts occupations in Shallowater, the most male-oriented occupations are Computers & Mathematics (97.8%), Computers, Engineering & Science (87.3%), and Business & Financial (71.4%), while the most female-oriented occupations are Education, Arts & Media (100.0%), Community & Social Service (85.1%), and Education Instruction & Library (80.2%).
| Occupation | Male | Female |
| Management | 105 (55.6%) | 84 (44.4%) |
| Business & Financial | 25 (71.4%) | 10 (28.6%) |
| Computers, Engineering & Science | 117 (87.3%) | 17 (12.7%) |
| Computers & Mathematics | 87 (97.8%) | 2 (2.2%) |
| Architecture & Engineering | 7 (58.3%) | 5 (41.7%) |
| Life, Physical & Social Science | 23 (69.7%) | 10 (30.3%) |
| Community & Social Service | 16 (14.9%) | 91 (85.1%) |
| Education, Arts & Media | 0 (0.0%) | 26 (100.0%) |
| Legal Services & Support | 0 (0.0%) | 0 (0.0%) |
| Education Instruction & Library | 16 (19.8%) | 65 (80.2%) |
| Arts, Media & Entertainment | 0 (0.0%) | 0 (0.0%) |
| Health Diagnosing & Treating | 26 (27.7%) | 68 (72.3%) |
| Health Technologists | 26 (30.2%) | 60 (69.8%) |
| Total (Category) | 289 (51.7%) | 270 (48.3%) |
| Total (Overall) | 690 (53.6%) | 598 (46.4%) |
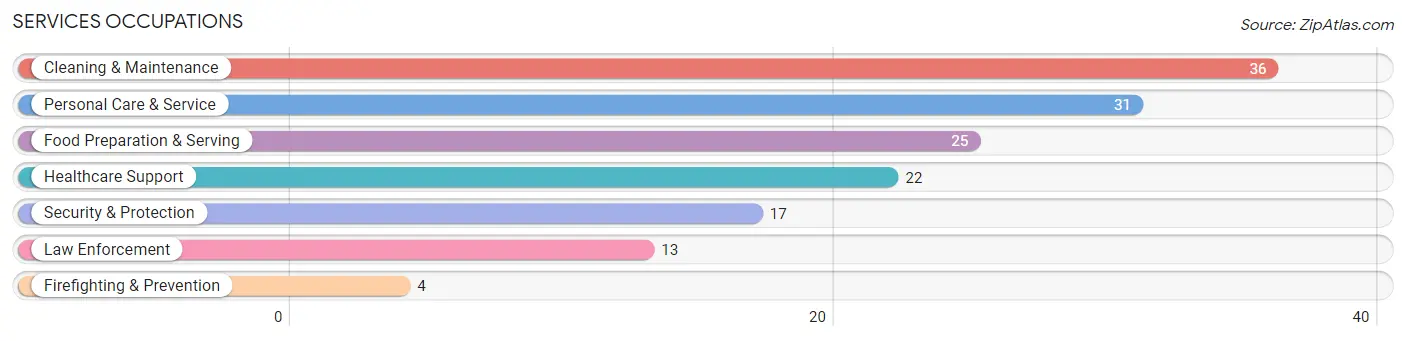
Services Occupations
The most common Services occupations in Shallowater are Cleaning & Maintenance (36 | 2.8%), Personal Care & Service (31 | 2.4%), Food Preparation & Serving (25 | 1.9%), Healthcare Support (22 | 1.7%), and Security & Protection (17 | 1.3%).
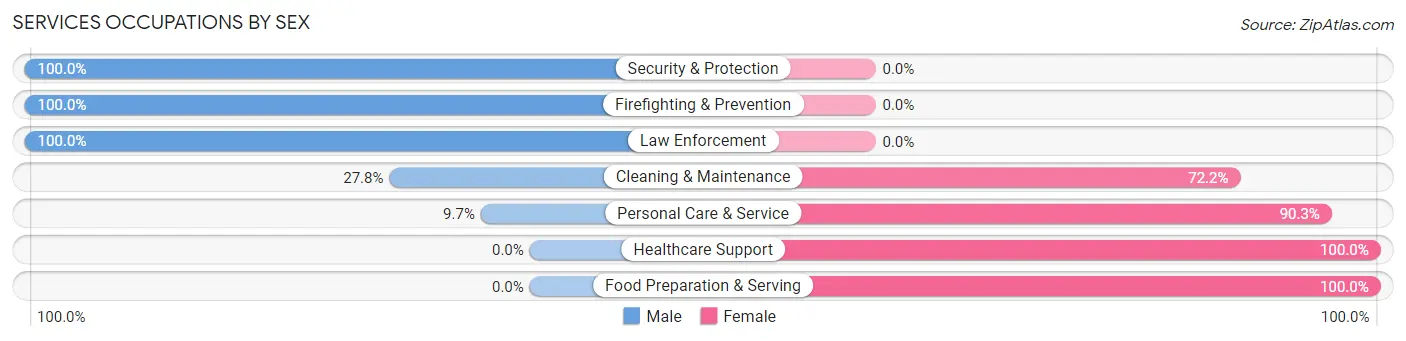
Services Occupations by Sex
Within the Services occupations in Shallowater, the most male-oriented occupations are Security & Protection (100.0%), Firefighting & Prevention (100.0%), and Law Enforcement (100.0%), while the most female-oriented occupations are Healthcare Support (100.0%), Food Preparation & Serving (100.0%), and Personal Care & Service (90.3%).
| Occupation | Male | Female |
| Healthcare Support | 0 (0.0%) | 22 (100.0%) |
| Security & Protection | 17 (100.0%) | 0 (0.0%) |
| Firefighting & Prevention | 4 (100.0%) | 0 (0.0%) |
| Law Enforcement | 13 (100.0%) | 0 (0.0%) |
| Food Preparation & Serving | 0 (0.0%) | 25 (100.0%) |
| Cleaning & Maintenance | 10 (27.8%) | 26 (72.2%) |
| Personal Care & Service | 3 (9.7%) | 28 (90.3%) |
| Total (Category) | 30 (22.9%) | 101 (77.1%) |
| Total (Overall) | 690 (53.6%) | 598 (46.4%) |
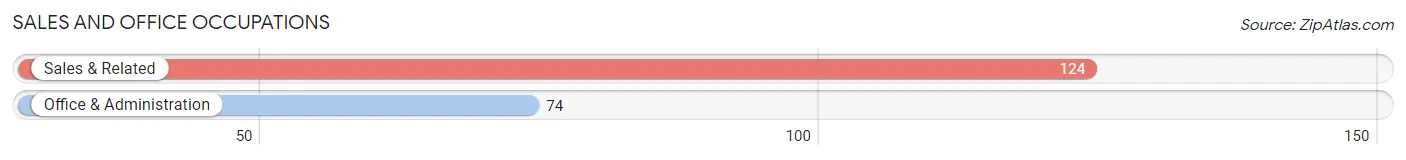
Sales and Office Occupations
The most common Sales and Office occupations in Shallowater are Sales & Related (124 | 9.6%), and Office & Administration (74 | 5.8%).
Sales and Office Occupations by Sex
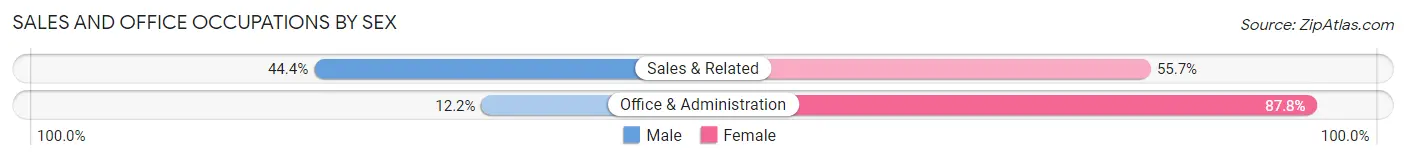
| Occupation | Male | Female |
| Sales & Related | 55 (44.4%) | 69 (55.6%) |
| Office & Administration | 9 (12.2%) | 65 (87.8%) |
| Total (Category) | 64 (32.3%) | 134 (67.7%) |
| Total (Overall) | 690 (53.6%) | 598 (46.4%) |
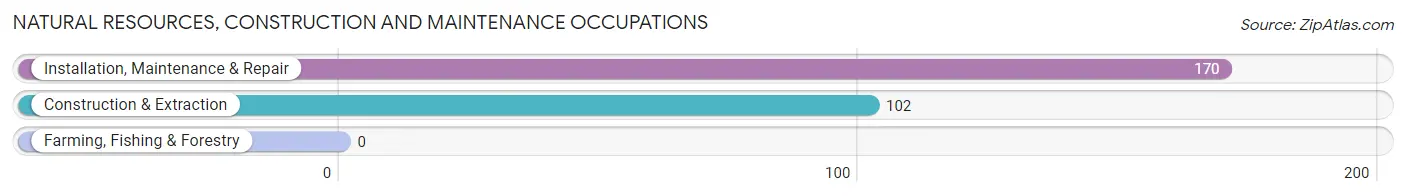
Natural Resources, Construction and Maintenance Occupations
The most common Natural Resources, Construction and Maintenance occupations in Shallowater are Installation, Maintenance & Repair (170 | 13.2%), and Construction & Extraction (102 | 7.9%).
Natural Resources, Construction and Maintenance Occupations by Sex
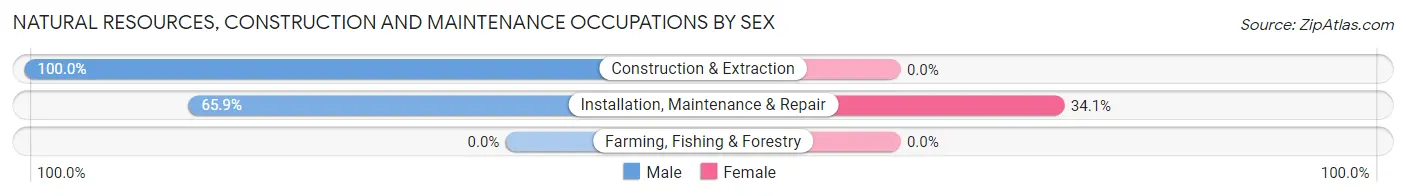
| Occupation | Male | Female |
| Farming, Fishing & Forestry | 0 (0.0%) | 0 (0.0%) |
| Construction & Extraction | 102 (100.0%) | 0 (0.0%) |
| Installation, Maintenance & Repair | 112 (65.9%) | 58 (34.1%) |
| Total (Category) | 214 (78.7%) | 58 (21.3%) |
| Total (Overall) | 690 (53.6%) | 598 (46.4%) |
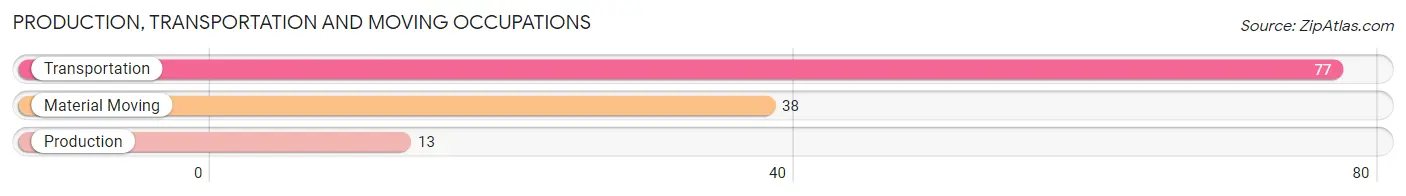
Production, Transportation and Moving Occupations
The most common Production, Transportation and Moving occupations in Shallowater are Transportation (77 | 6.0%), Material Moving (38 | 2.9%), and Production (13 | 1.0%).
Production, Transportation and Moving Occupations by Sex
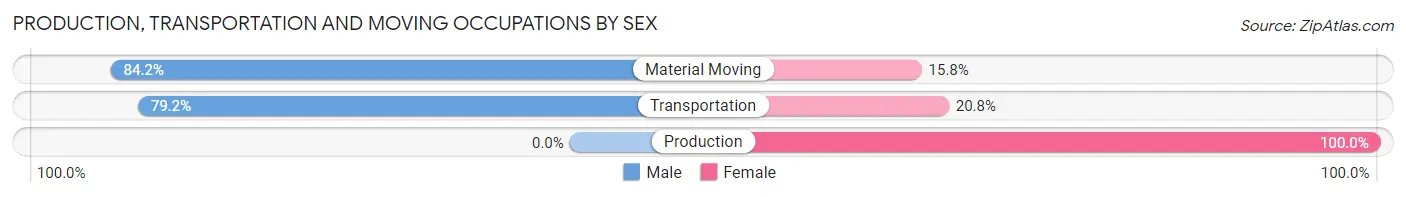
| Occupation | Male | Female |
| Production | 0 (0.0%) | 13 (100.0%) |
| Transportation | 61 (79.2%) | 16 (20.8%) |
| Material Moving | 32 (84.2%) | 6 (15.8%) |
| Total (Category) | 93 (72.7%) | 35 (27.3%) |
| Total (Overall) | 690 (53.6%) | 598 (46.4%) |
Employment Industries by Sex in Shallowater
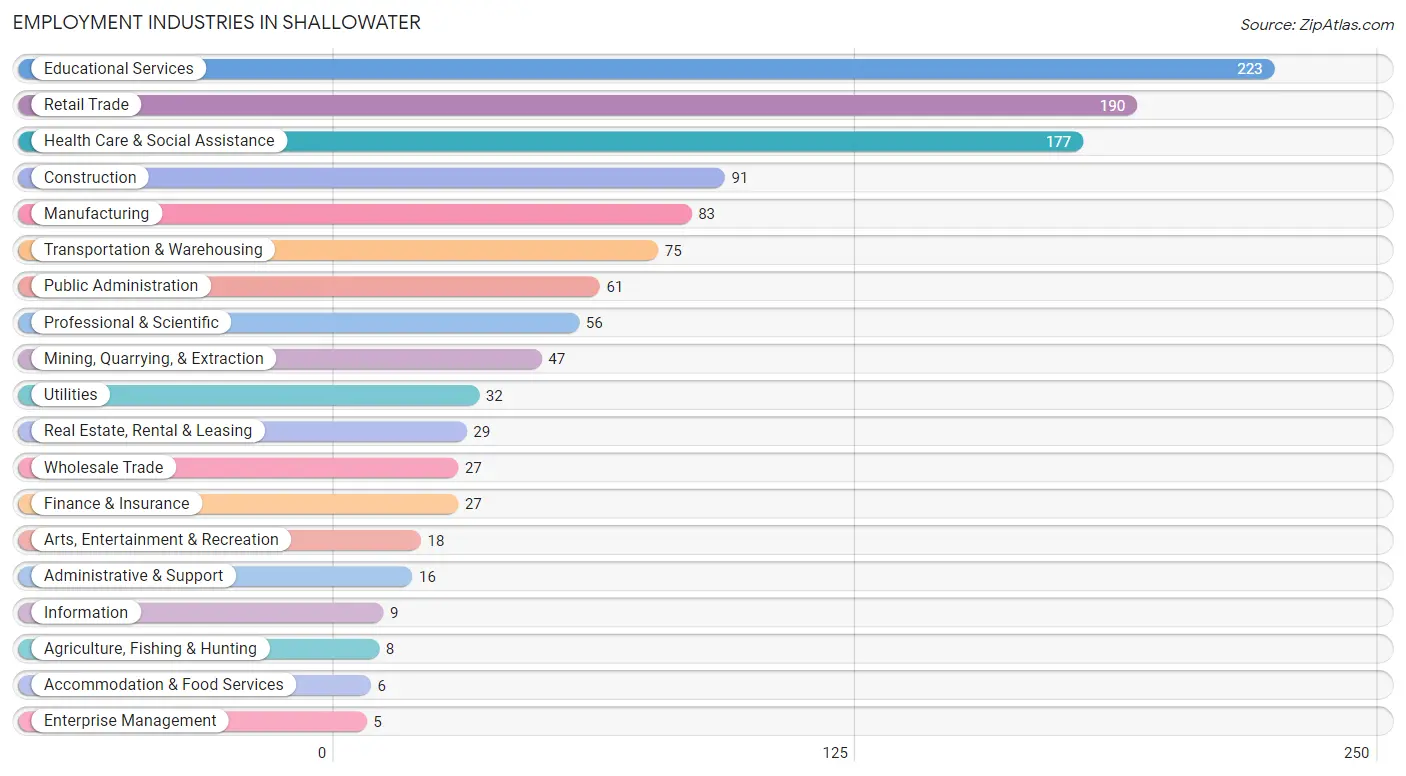
Employment Industries in Shallowater
The major employment industries in Shallowater include Educational Services (223 | 17.3%), Retail Trade (190 | 14.7%), Health Care & Social Assistance (177 | 13.7%), Construction (91 | 7.1%), and Manufacturing (83 | 6.4%).
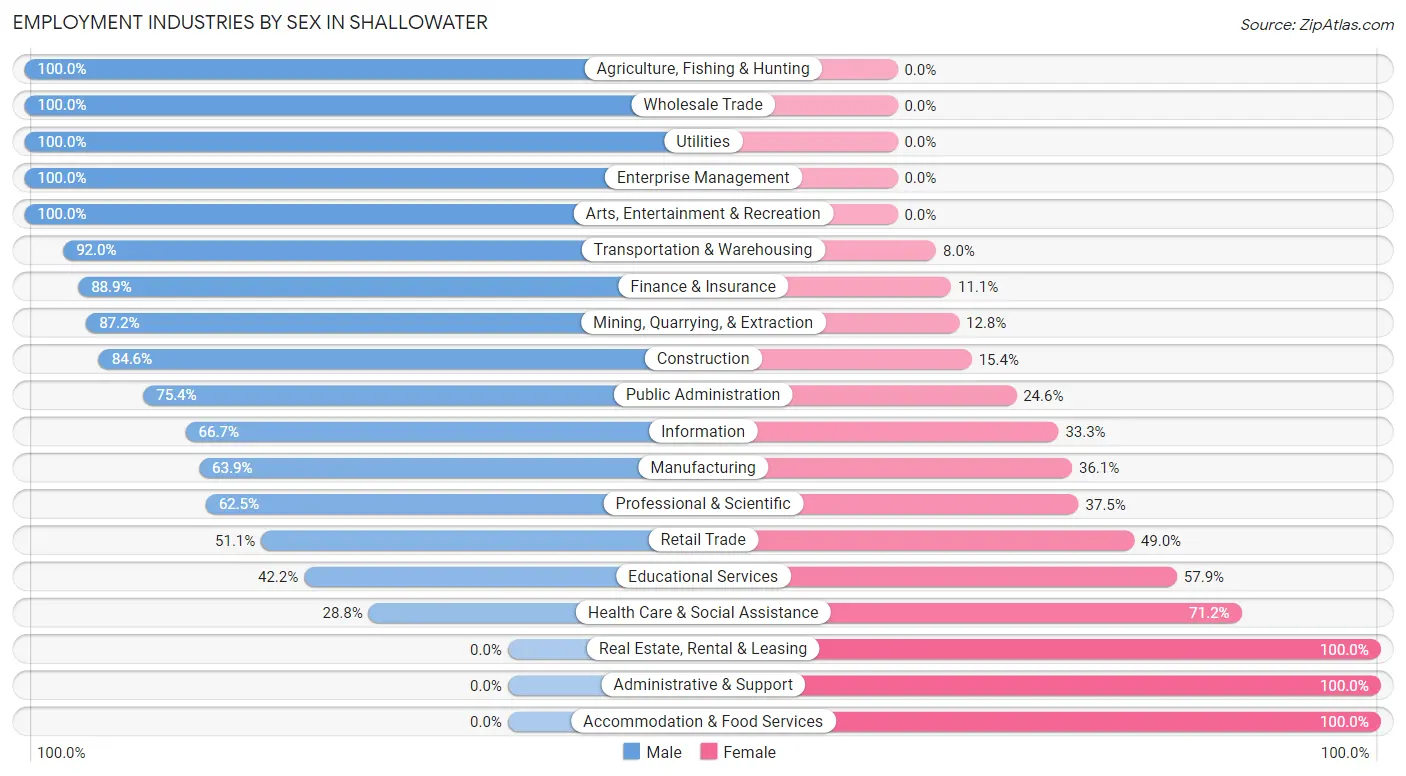
Employment Industries by Sex in Shallowater
The Shallowater industries that see more men than women are Agriculture, Fishing & Hunting (100.0%), Wholesale Trade (100.0%), and Utilities (100.0%), whereas the industries that tend to have a higher number of women are Real Estate, Rental & Leasing (100.0%), Administrative & Support (100.0%), and Accommodation & Food Services (100.0%).
| Industry | Male | Female |
| Agriculture, Fishing & Hunting | 8 (100.0%) | 0 (0.0%) |
| Mining, Quarrying, & Extraction | 41 (87.2%) | 6 (12.8%) |
| Construction | 77 (84.6%) | 14 (15.4%) |
| Manufacturing | 53 (63.9%) | 30 (36.1%) |
| Wholesale Trade | 27 (100.0%) | 0 (0.0%) |
| Retail Trade | 97 (51.0%) | 93 (48.9%) |
| Transportation & Warehousing | 69 (92.0%) | 6 (8.0%) |
| Utilities | 32 (100.0%) | 0 (0.0%) |
| Information | 6 (66.7%) | 3 (33.3%) |
| Finance & Insurance | 24 (88.9%) | 3 (11.1%) |
| Real Estate, Rental & Leasing | 0 (0.0%) | 29 (100.0%) |
| Professional & Scientific | 35 (62.5%) | 21 (37.5%) |
| Enterprise Management | 5 (100.0%) | 0 (0.0%) |
| Administrative & Support | 0 (0.0%) | 16 (100.0%) |
| Educational Services | 94 (42.1%) | 129 (57.9%) |
| Health Care & Social Assistance | 51 (28.8%) | 126 (71.2%) |
| Arts, Entertainment & Recreation | 18 (100.0%) | 0 (0.0%) |
| Accommodation & Food Services | 0 (0.0%) | 6 (100.0%) |
| Public Administration | 46 (75.4%) | 15 (24.6%) |
| Total | 690 (53.6%) | 598 (46.4%) |
Education in Shallowater
School Enrollment in Shallowater
The most common levels of schooling among the 882 students in Shallowater are middle school (255 | 28.9%), elementary school (215 | 24.4%), and high school (184 | 20.9%).
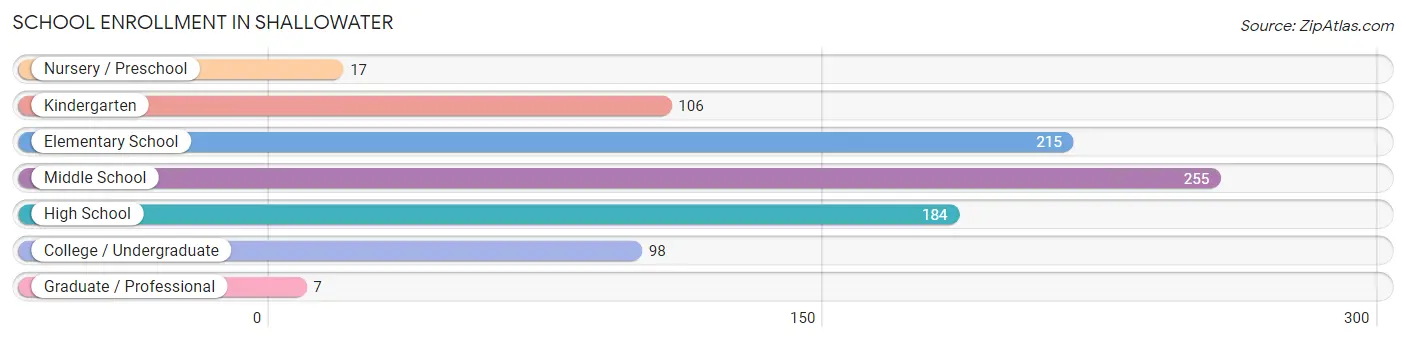
| School Level | # Students | % Students |
| Nursery / Preschool | 17 | 1.9% |
| Kindergarten | 106 | 12.0% |
| Elementary School | 215 | 24.4% |
| Middle School | 255 | 28.9% |
| High School | 184 | 20.9% |
| College / Undergraduate | 98 | 11.1% |
| Graduate / Professional | 7 | 0.8% |
| Total | 882 | 100.0% |
School Enrollment by Age by Funding Source in Shallowater
Out of a total of 882 students who are enrolled in schools in Shallowater, 17 (1.9%) attend a private institution, while the remaining 865 (98.1%) are enrolled in public schools. The age group of 3 to 4 year olds has the highest likelihood of being enrolled in private schools, with 7 (63.6% in the age bracket) enrolled. Conversely, the age group of 5 to 9 year old has the lowest likelihood of being enrolled in a private school, with 300 (100.0% in the age bracket) attending a public institution.
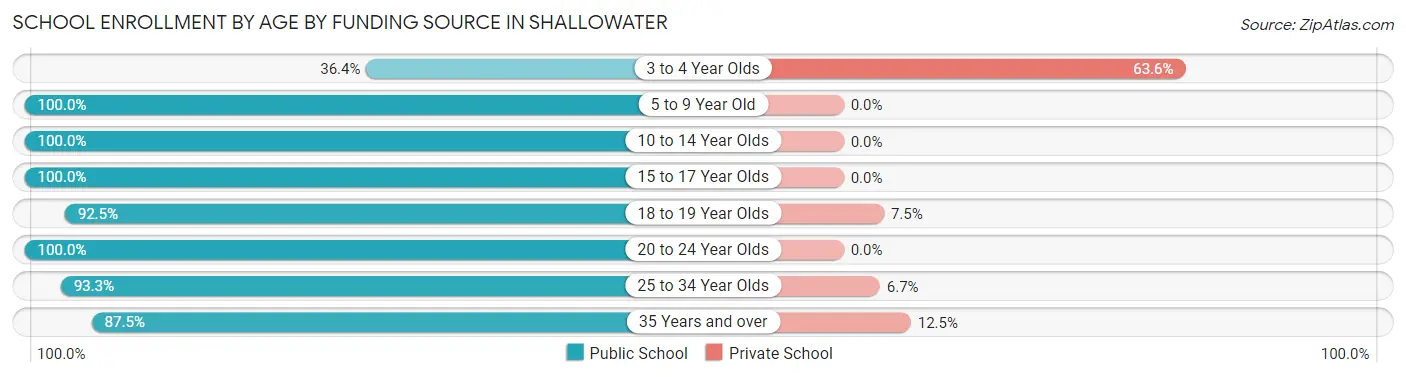
| Age Bracket | Public School | Private School |
| 3 to 4 Year Olds | 4 (36.4%) | 7 (63.6%) |
| 5 to 9 Year Old | 300 (100.0%) | 0 (0.0%) |
| 10 to 14 Year Olds | 283 (100.0%) | 0 (0.0%) |
| 15 to 17 Year Olds | 140 (100.0%) | 0 (0.0%) |
| 18 to 19 Year Olds | 37 (92.5%) | 3 (7.5%) |
| 20 to 24 Year Olds | 11 (100.0%) | 0 (0.0%) |
| 25 to 34 Year Olds | 83 (93.3%) | 6 (6.7%) |
| 35 Years and over | 7 (87.5%) | 1 (12.5%) |
| Total | 865 (98.1%) | 17 (1.9%) |
Educational Attainment by Field of Study in Shallowater
Education (135 | 25.2%), business (117 | 21.9%), science & technology (82 | 15.3%), arts & humanities (48 | 9.0%), and liberal arts & history (31 | 5.8%) are the most common fields of study among 535 individuals in Shallowater who have obtained a bachelor's degree or higher.
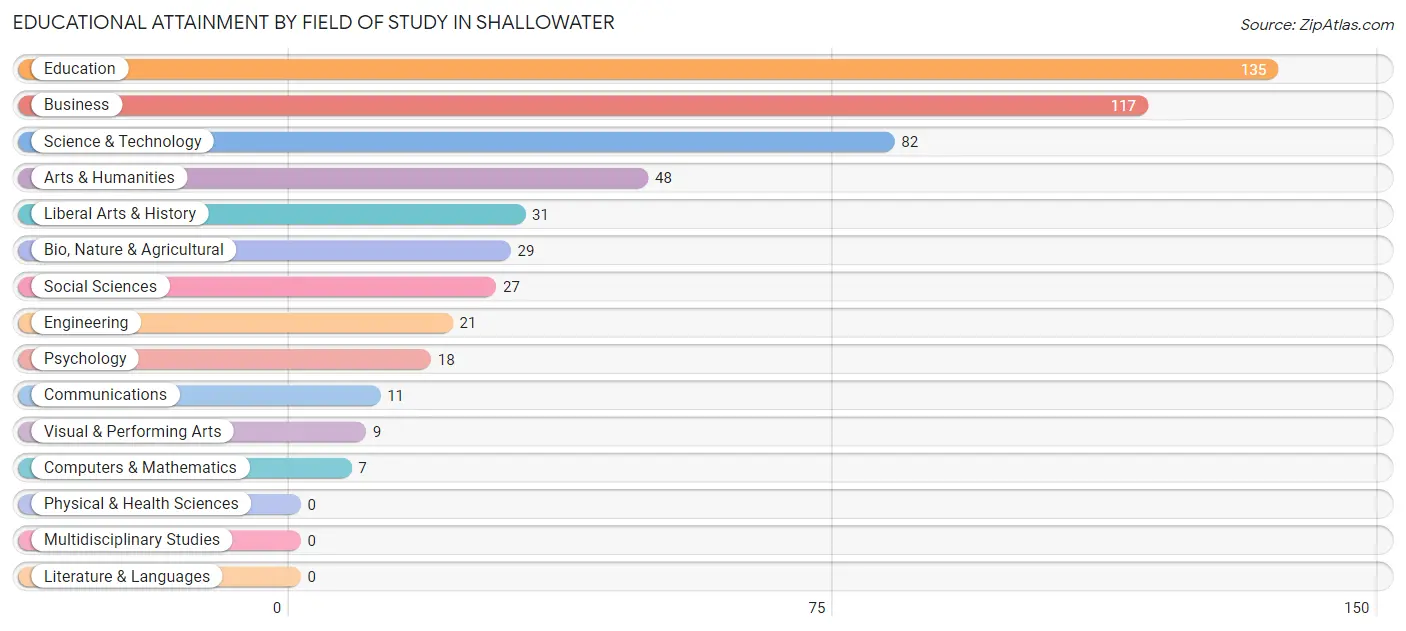
| Field of Study | # Graduates | % Graduates |
| Computers & Mathematics | 7 | 1.3% |
| Bio, Nature & Agricultural | 29 | 5.4% |
| Physical & Health Sciences | 0 | 0.0% |
| Psychology | 18 | 3.4% |
| Social Sciences | 27 | 5.1% |
| Engineering | 21 | 3.9% |
| Multidisciplinary Studies | 0 | 0.0% |
| Science & Technology | 82 | 15.3% |
| Business | 117 | 21.9% |
| Education | 135 | 25.2% |
| Literature & Languages | 0 | 0.0% |
| Liberal Arts & History | 31 | 5.8% |
| Visual & Performing Arts | 9 | 1.7% |
| Communications | 11 | 2.1% |
| Arts & Humanities | 48 | 9.0% |
| Total | 535 | 100.0% |
Transportation & Commute in Shallowater
Vehicle Availability by Sex in Shallowater
The most prevalent vehicle ownership categories in Shallowater are males with 2 vehicles (327, accounting for 46.8%) and females with 2 vehicles (259, making up 56.1%).
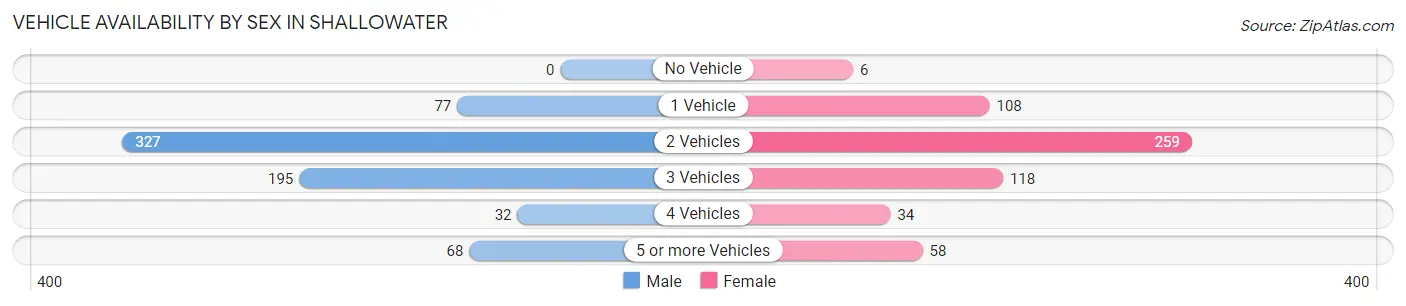
| Vehicles Available | Male | Female |
| No Vehicle | 0 (0.0%) | 6 (1.0%) |
| 1 Vehicle | 77 (11.0%) | 108 (18.5%) |
| 2 Vehicles | 327 (46.8%) | 259 (44.4%) |
| 3 Vehicles | 195 (27.9%) | 118 (20.2%) |
| 4 Vehicles | 32 (4.6%) | 34 (5.8%) |
| 5 or more Vehicles | 68 (9.7%) | 58 (10.0%) |
| Total | 699 (100.0%) | 583 (100.0%) |
Commute Time in Shallowater
The most frequently occuring commute durations in Shallowater are 20 to 24 minutes (320 commuters, 26.4%), 15 to 19 minutes (266 commuters, 22.0%), and less than 5 minutes (186 commuters, 15.3%).
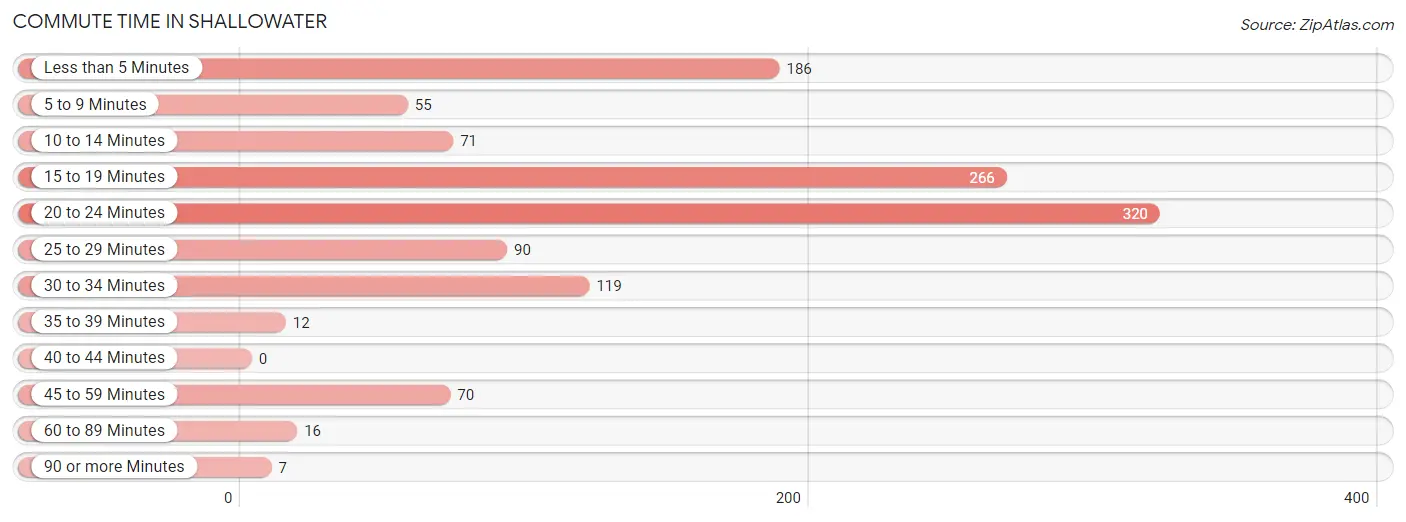
| Commute Time | # Commuters | % Commuters |
| Less than 5 Minutes | 186 | 15.3% |
| 5 to 9 Minutes | 55 | 4.5% |
| 10 to 14 Minutes | 71 | 5.9% |
| 15 to 19 Minutes | 266 | 22.0% |
| 20 to 24 Minutes | 320 | 26.4% |
| 25 to 29 Minutes | 90 | 7.4% |
| 30 to 34 Minutes | 119 | 9.8% |
| 35 to 39 Minutes | 12 | 1.0% |
| 40 to 44 Minutes | 0 | 0.0% |
| 45 to 59 Minutes | 70 | 5.8% |
| 60 to 89 Minutes | 16 | 1.3% |
| 90 or more Minutes | 7 | 0.6% |
Commute Time by Sex in Shallowater
The most common commute times in Shallowater are 15 to 19 minutes (193 commuters, 29.4%) for males and 20 to 24 minutes (143 commuters, 25.8%) for females.
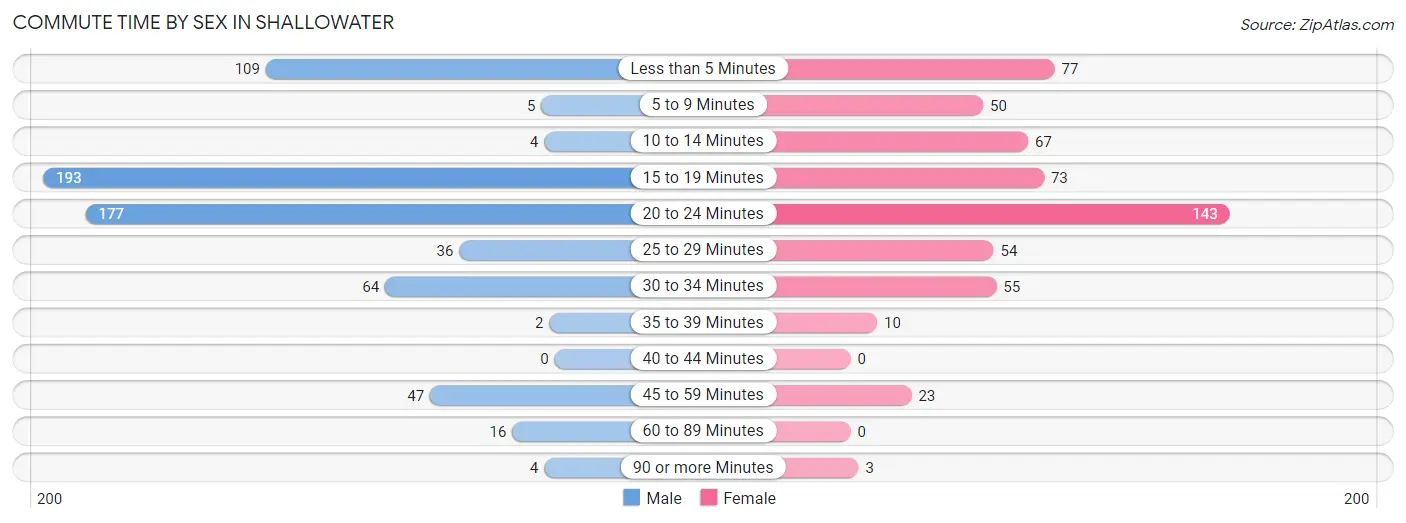
| Commute Time | Male | Female |
| Less than 5 Minutes | 109 (16.6%) | 77 (13.9%) |
| 5 to 9 Minutes | 5 (0.8%) | 50 (9.0%) |
| 10 to 14 Minutes | 4 (0.6%) | 67 (12.1%) |
| 15 to 19 Minutes | 193 (29.4%) | 73 (13.2%) |
| 20 to 24 Minutes | 177 (26.9%) | 143 (25.8%) |
| 25 to 29 Minutes | 36 (5.5%) | 54 (9.7%) |
| 30 to 34 Minutes | 64 (9.7%) | 55 (9.9%) |
| 35 to 39 Minutes | 2 (0.3%) | 10 (1.8%) |
| 40 to 44 Minutes | 0 (0.0%) | 0 (0.0%) |
| 45 to 59 Minutes | 47 (7.1%) | 23 (4.1%) |
| 60 to 89 Minutes | 16 (2.4%) | 0 (0.0%) |
| 90 or more Minutes | 4 (0.6%) | 3 (0.5%) |
Time of Departure to Work by Sex in Shallowater
The most frequent times of departure to work in Shallowater are 7:00 AM to 7:29 AM (258, 39.3%) for males and 7:30 AM to 7:59 AM (124, 22.3%) for females.
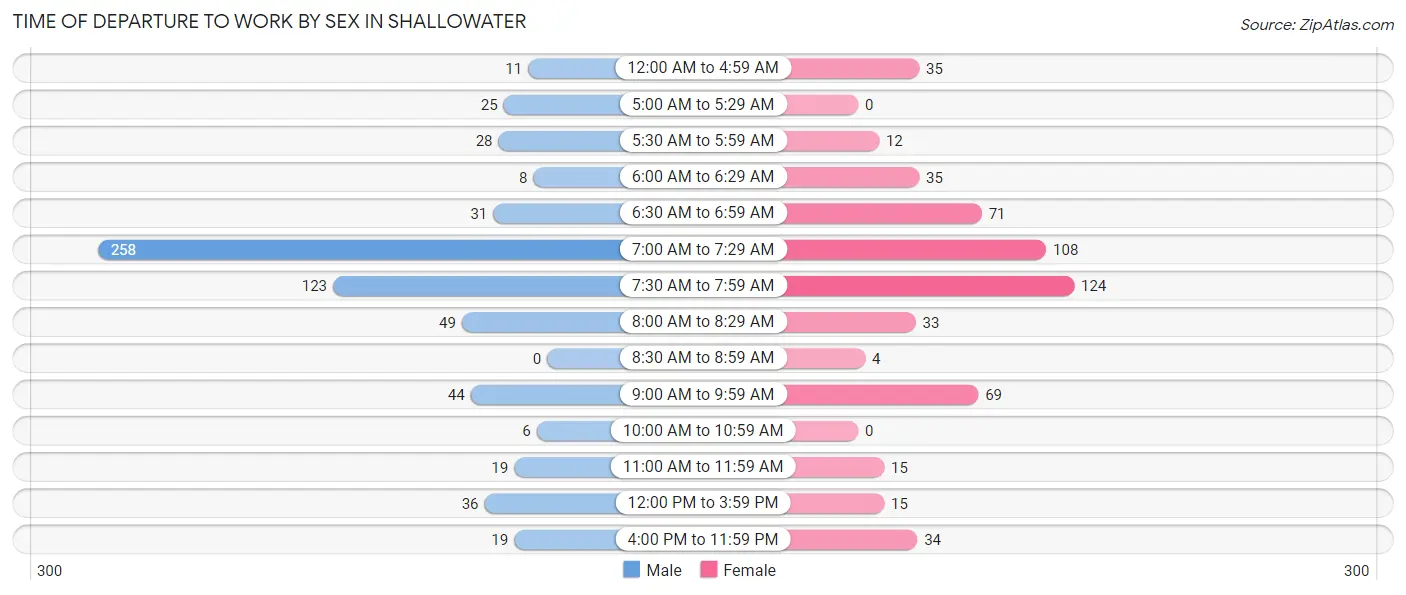
| Time of Departure | Male | Female |
| 12:00 AM to 4:59 AM | 11 (1.7%) | 35 (6.3%) |
| 5:00 AM to 5:29 AM | 25 (3.8%) | 0 (0.0%) |
| 5:30 AM to 5:59 AM | 28 (4.3%) | 12 (2.2%) |
| 6:00 AM to 6:29 AM | 8 (1.2%) | 35 (6.3%) |
| 6:30 AM to 6:59 AM | 31 (4.7%) | 71 (12.8%) |
| 7:00 AM to 7:29 AM | 258 (39.3%) | 108 (19.5%) |
| 7:30 AM to 7:59 AM | 123 (18.7%) | 124 (22.3%) |
| 8:00 AM to 8:29 AM | 49 (7.5%) | 33 (5.9%) |
| 8:30 AM to 8:59 AM | 0 (0.0%) | 4 (0.7%) |
| 9:00 AM to 9:59 AM | 44 (6.7%) | 69 (12.4%) |
| 10:00 AM to 10:59 AM | 6 (0.9%) | 0 (0.0%) |
| 11:00 AM to 11:59 AM | 19 (2.9%) | 15 (2.7%) |
| 12:00 PM to 3:59 PM | 36 (5.5%) | 15 (2.7%) |
| 4:00 PM to 11:59 PM | 19 (2.9%) | 34 (6.1%) |
| Total | 657 (100.0%) | 555 (100.0%) |
Housing Occupancy in Shallowater
Occupancy by Ownership in Shallowater
Of the total 1,060 dwellings in Shallowater, owner-occupied units account for 889 (83.9%), while renter-occupied units make up 171 (16.1%).
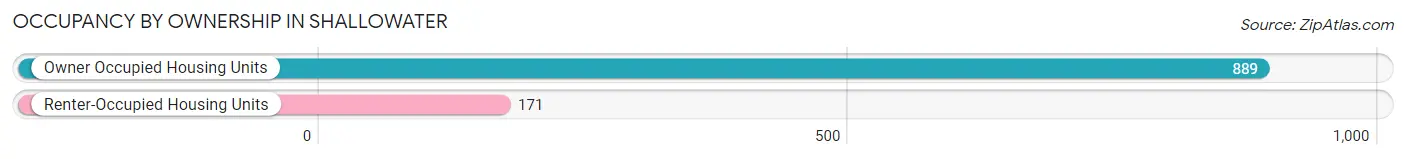
| Occupancy | # Housing Units | % Housing Units |
| Owner Occupied Housing Units | 889 | 83.9% |
| Renter-Occupied Housing Units | 171 | 16.1% |
| Total Occupied Housing Units | 1,060 | 100.0% |
Occupancy by Household Size in Shallowater
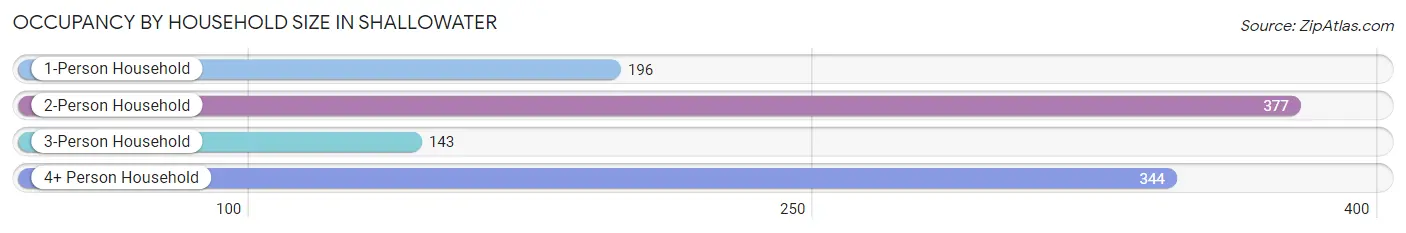
| Household Size | # Housing Units | % Housing Units |
| 1-Person Household | 196 | 18.5% |
| 2-Person Household | 377 | 35.6% |
| 3-Person Household | 143 | 13.5% |
| 4+ Person Household | 344 | 32.5% |
| Total Housing Units | 1,060 | 100.0% |
Occupancy by Ownership by Household Size in Shallowater
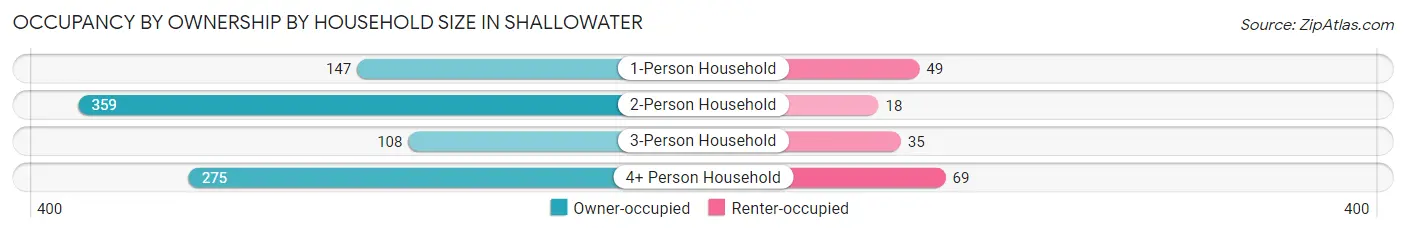
| Household Size | Owner-occupied | Renter-occupied |
| 1-Person Household | 147 (75.0%) | 49 (25.0%) |
| 2-Person Household | 359 (95.2%) | 18 (4.8%) |
| 3-Person Household | 108 (75.5%) | 35 (24.5%) |
| 4+ Person Household | 275 (79.9%) | 69 (20.1%) |
| Total Housing Units | 889 (83.9%) | 171 (16.1%) |
Occupancy by Educational Attainment in Shallowater
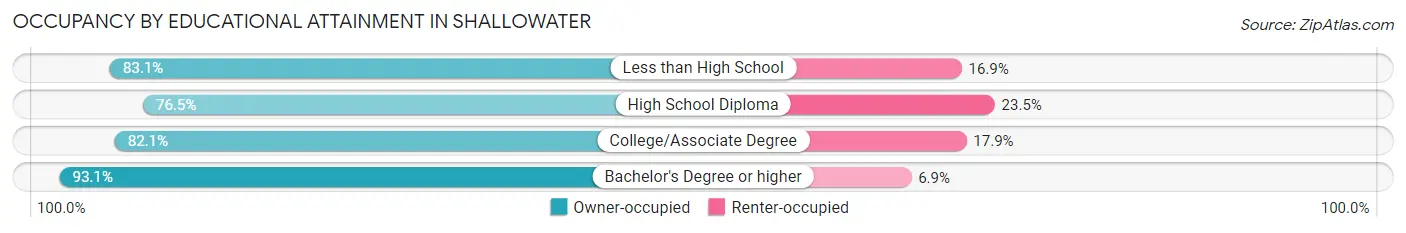
| Household Size | Owner-occupied | Renter-occupied |
| Less than High School | 54 (83.1%) | 11 (16.9%) |
| High School Diploma | 228 (76.5%) | 70 (23.5%) |
| College/Associate Degree | 312 (82.1%) | 68 (17.9%) |
| Bachelor's Degree or higher | 295 (93.1%) | 22 (6.9%) |
Occupancy by Age of Householder in Shallowater
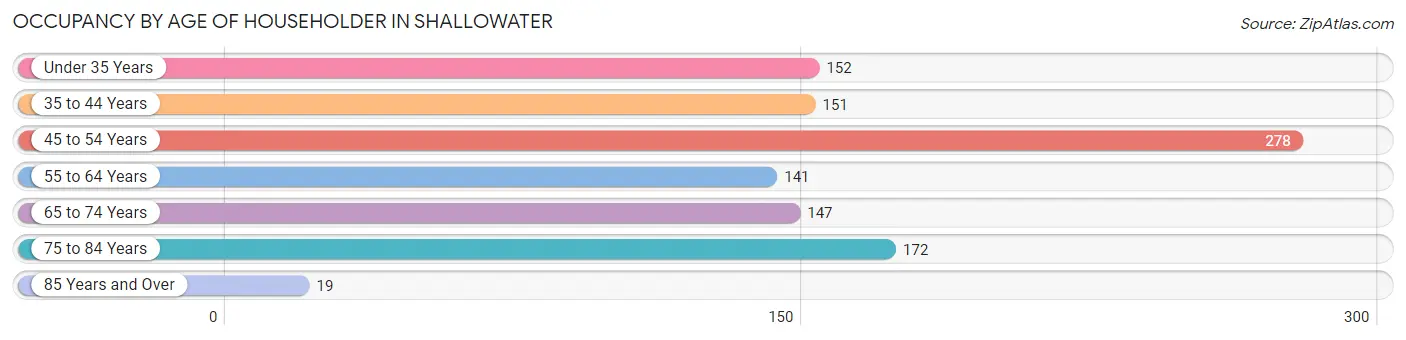
| Age Bracket | # Households | % Households |
| Under 35 Years | 152 | 14.3% |
| 35 to 44 Years | 151 | 14.2% |
| 45 to 54 Years | 278 | 26.2% |
| 55 to 64 Years | 141 | 13.3% |
| 65 to 74 Years | 147 | 13.9% |
| 75 to 84 Years | 172 | 16.2% |
| 85 Years and Over | 19 | 1.8% |
| Total | 1,060 | 100.0% |
Housing Finances in Shallowater
Median Income by Occupancy in Shallowater
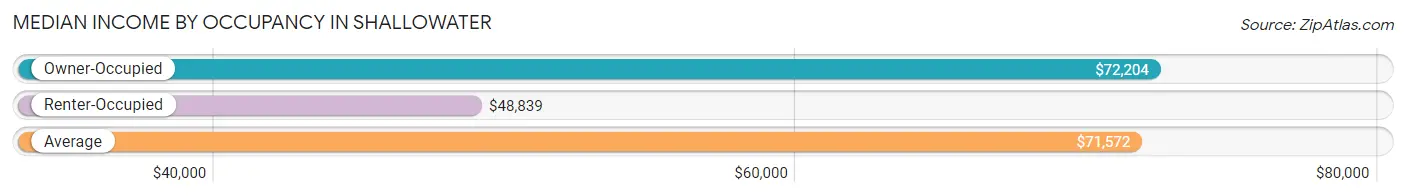
| Occupancy Type | # Households | Median Income |
| Owner-Occupied | 889 (83.9%) | $72,204 |
| Renter-Occupied | 171 (16.1%) | $48,839 |
| Average | 1,060 (100.0%) | $71,572 |
Occupancy by Householder Income Bracket in Shallowater
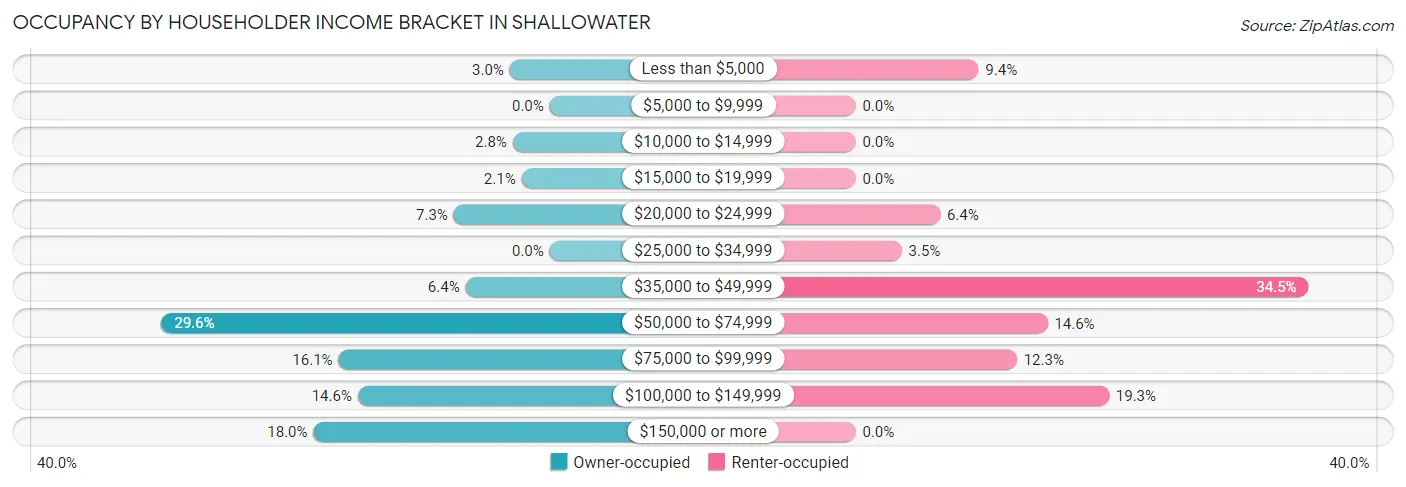
| Income Bracket | Owner-occupied | Renter-occupied |
| Less than $5,000 | 27 (3.0%) | 16 (9.4%) |
| $5,000 to $9,999 | 0 (0.0%) | 0 (0.0%) |
| $10,000 to $14,999 | 25 (2.8%) | 0 (0.0%) |
| $15,000 to $19,999 | 19 (2.1%) | 0 (0.0%) |
| $20,000 to $24,999 | 65 (7.3%) | 11 (6.4%) |
| $25,000 to $34,999 | 0 (0.0%) | 6 (3.5%) |
| $35,000 to $49,999 | 57 (6.4%) | 59 (34.5%) |
| $50,000 to $74,999 | 263 (29.6%) | 25 (14.6%) |
| $75,000 to $99,999 | 143 (16.1%) | 21 (12.3%) |
| $100,000 to $149,999 | 130 (14.6%) | 33 (19.3%) |
| $150,000 or more | 160 (18.0%) | 0 (0.0%) |
| Total | 889 (100.0%) | 171 (100.0%) |
Monthly Housing Cost Tiers in Shallowater
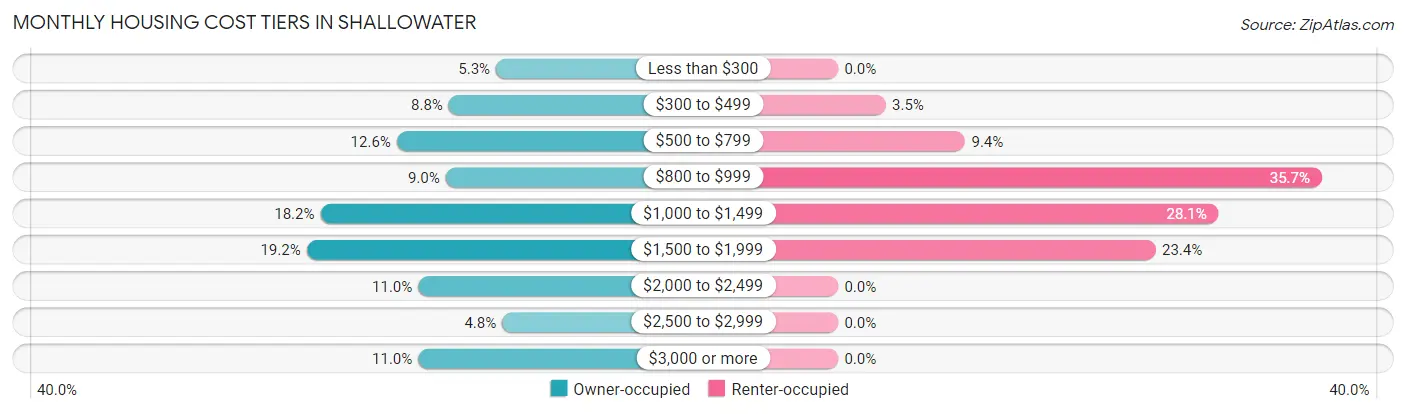
| Monthly Cost | Owner-occupied | Renter-occupied |
| Less than $300 | 47 (5.3%) | 0 (0.0%) |
| $300 to $499 | 78 (8.8%) | 6 (3.5%) |
| $500 to $799 | 112 (12.6%) | 16 (9.4%) |
| $800 to $999 | 80 (9.0%) | 61 (35.7%) |
| $1,000 to $1,499 | 162 (18.2%) | 48 (28.1%) |
| $1,500 to $1,999 | 171 (19.2%) | 40 (23.4%) |
| $2,000 to $2,499 | 98 (11.0%) | 0 (0.0%) |
| $2,500 to $2,999 | 43 (4.8%) | 0 (0.0%) |
| $3,000 or more | 98 (11.0%) | 0 (0.0%) |
| Total | 889 (100.0%) | 171 (100.0%) |
Physical Housing Characteristics in Shallowater
Housing Structures in Shallowater
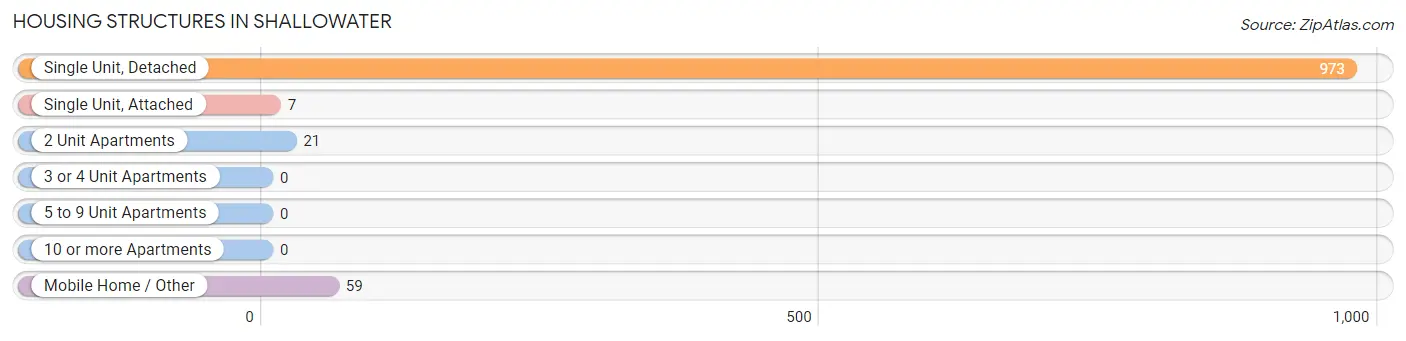
| Structure Type | # Housing Units | % Housing Units |
| Single Unit, Detached | 973 | 91.8% |
| Single Unit, Attached | 7 | 0.7% |
| 2 Unit Apartments | 21 | 2.0% |
| 3 or 4 Unit Apartments | 0 | 0.0% |
| 5 to 9 Unit Apartments | 0 | 0.0% |
| 10 or more Apartments | 0 | 0.0% |
| Mobile Home / Other | 59 | 5.6% |
| Total | 1,060 | 100.0% |
Housing Structures by Occupancy in Shallowater
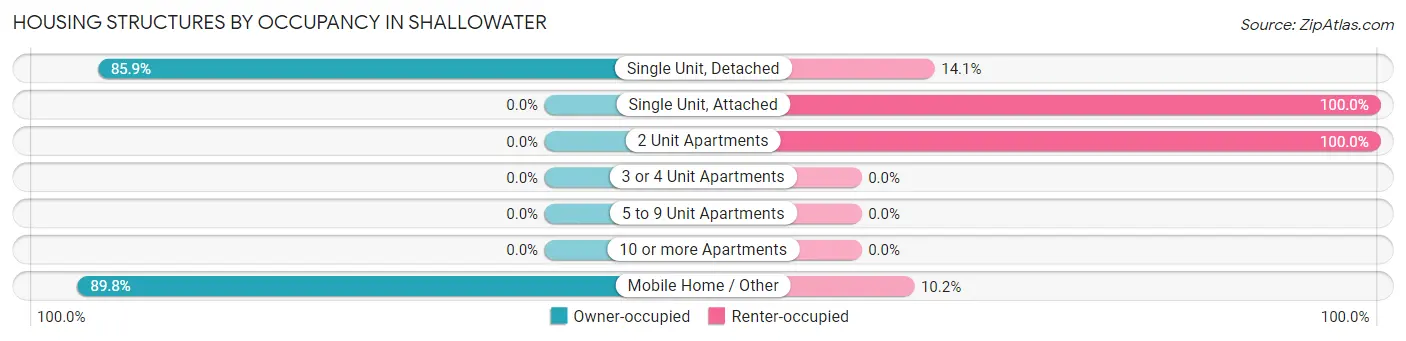
| Structure Type | Owner-occupied | Renter-occupied |
| Single Unit, Detached | 836 (85.9%) | 137 (14.1%) |
| Single Unit, Attached | 0 (0.0%) | 7 (100.0%) |
| 2 Unit Apartments | 0 (0.0%) | 21 (100.0%) |
| 3 or 4 Unit Apartments | 0 (0.0%) | 0 (0.0%) |
| 5 to 9 Unit Apartments | 0 (0.0%) | 0 (0.0%) |
| 10 or more Apartments | 0 (0.0%) | 0 (0.0%) |
| Mobile Home / Other | 53 (89.8%) | 6 (10.2%) |
| Total | 889 (83.9%) | 171 (16.1%) |
Housing Structures by Number of Rooms in Shallowater
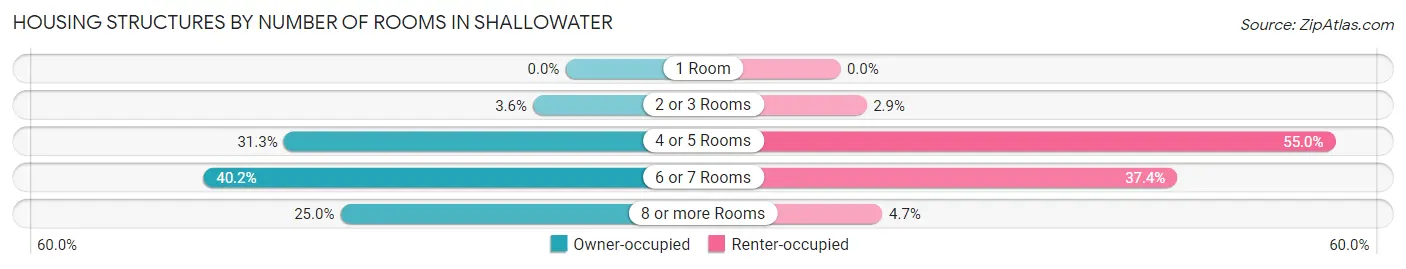
| Number of Rooms | Owner-occupied | Renter-occupied |
| 1 Room | 0 (0.0%) | 0 (0.0%) |
| 2 or 3 Rooms | 32 (3.6%) | 5 (2.9%) |
| 4 or 5 Rooms | 278 (31.3%) | 94 (55.0%) |
| 6 or 7 Rooms | 357 (40.2%) | 64 (37.4%) |
| 8 or more Rooms | 222 (25.0%) | 8 (4.7%) |
| Total | 889 (100.0%) | 171 (100.0%) |
Housing Structure by Heating Type in Shallowater
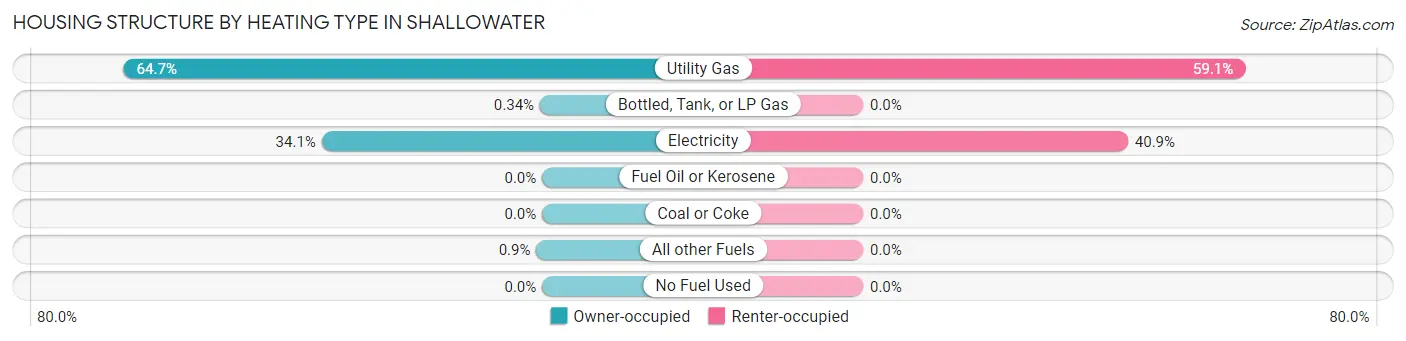
| Heating Type | Owner-occupied | Renter-occupied |
| Utility Gas | 575 (64.7%) | 101 (59.1%) |
| Bottled, Tank, or LP Gas | 3 (0.3%) | 0 (0.0%) |
| Electricity | 303 (34.1%) | 70 (40.9%) |
| Fuel Oil or Kerosene | 0 (0.0%) | 0 (0.0%) |
| Coal or Coke | 0 (0.0%) | 0 (0.0%) |
| All other Fuels | 8 (0.9%) | 0 (0.0%) |
| No Fuel Used | 0 (0.0%) | 0 (0.0%) |
| Total | 889 (100.0%) | 171 (100.0%) |
Household Vehicle Usage in Shallowater
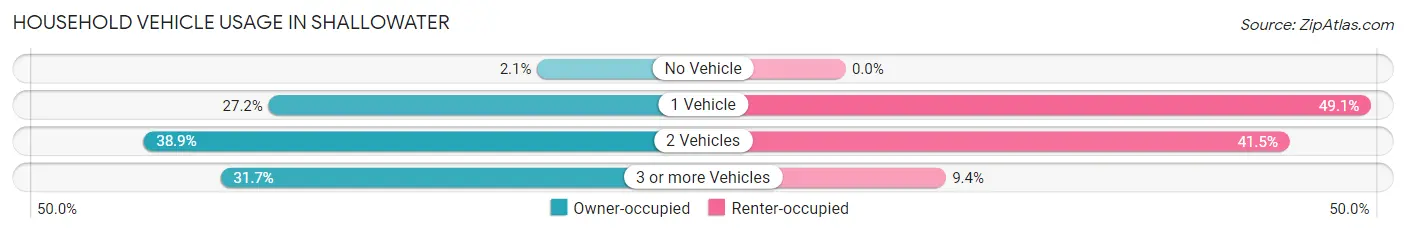
| Vehicles per Household | Owner-occupied | Renter-occupied |
| No Vehicle | 19 (2.1%) | 0 (0.0%) |
| 1 Vehicle | 242 (27.2%) | 84 (49.1%) |
| 2 Vehicles | 346 (38.9%) | 71 (41.5%) |
| 3 or more Vehicles | 282 (31.7%) | 16 (9.4%) |
| Total | 889 (100.0%) | 171 (100.0%) |
Real Estate & Mortgages in Shallowater
Real Estate and Mortgage Overview in Shallowater
| Characteristic | Without Mortgage | With Mortgage |
| Housing Units | 344 | 545 |
| Median Property Value | $127,800 | $238,300 |
| Median Household Income | $57,596 | $151 |
| Monthly Housing Costs | $637 | $98 |
| Real Estate Taxes | $2,427 | $0 |
Property Value by Mortgage Status in Shallowater
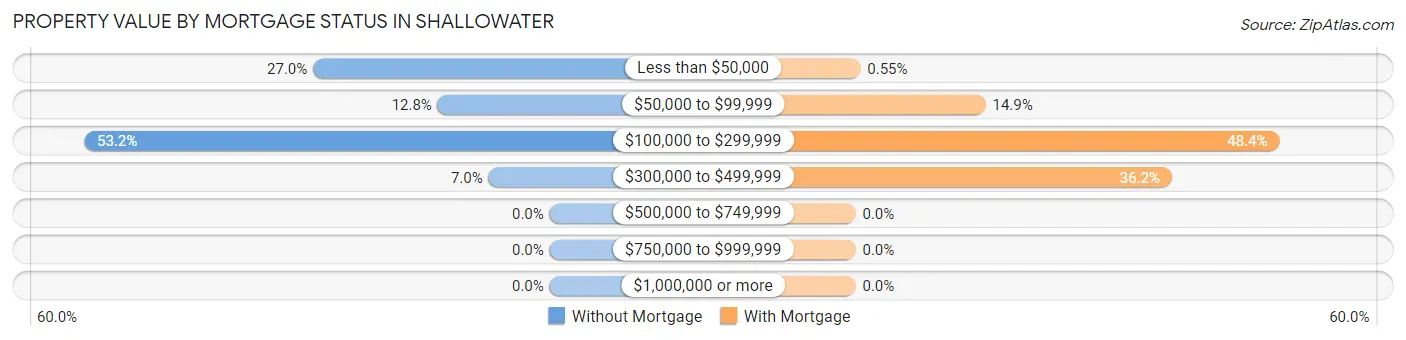
| Property Value | Without Mortgage | With Mortgage |
| Less than $50,000 | 93 (27.0%) | 3 (0.5%) |
| $50,000 to $99,999 | 44 (12.8%) | 81 (14.9%) |
| $100,000 to $299,999 | 183 (53.2%) | 264 (48.4%) |
| $300,000 to $499,999 | 24 (7.0%) | 197 (36.1%) |
| $500,000 to $749,999 | 0 (0.0%) | 0 (0.0%) |
| $750,000 to $999,999 | 0 (0.0%) | 0 (0.0%) |
| $1,000,000 or more | 0 (0.0%) | 0 (0.0%) |
| Total | 344 (100.0%) | 545 (100.0%) |
Household Income by Mortgage Status in Shallowater
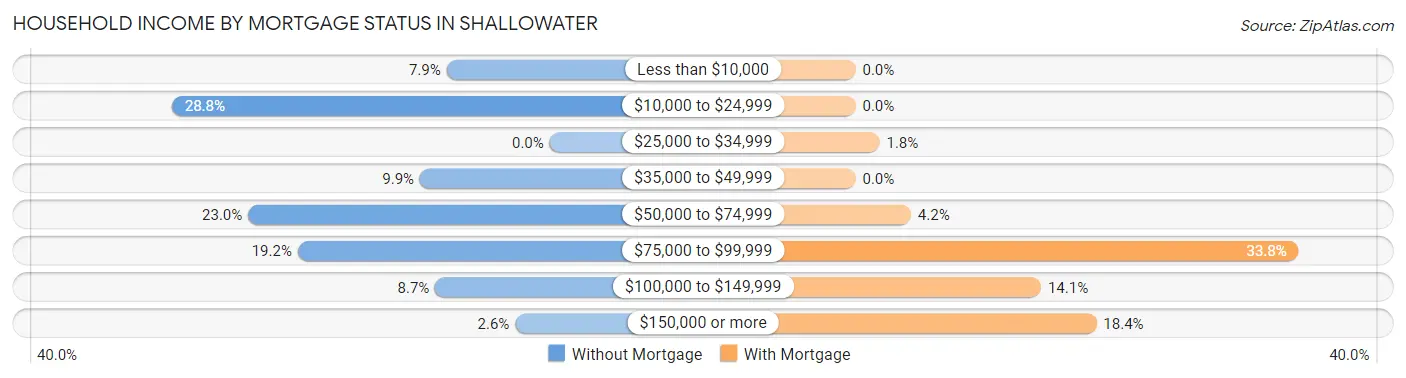
| Household Income | Without Mortgage | With Mortgage |
| Less than $10,000 | 27 (7.9%) | 0 (0.0%) |
| $10,000 to $24,999 | 99 (28.8%) | 0 (0.0%) |
| $25,000 to $34,999 | 0 (0.0%) | 10 (1.8%) |
| $35,000 to $49,999 | 34 (9.9%) | 0 (0.0%) |
| $50,000 to $74,999 | 79 (23.0%) | 23 (4.2%) |
| $75,000 to $99,999 | 66 (19.2%) | 184 (33.8%) |
| $100,000 to $149,999 | 30 (8.7%) | 77 (14.1%) |
| $150,000 or more | 9 (2.6%) | 100 (18.3%) |
| Total | 344 (100.0%) | 545 (100.0%) |
Property Value to Household Income Ratio in Shallowater
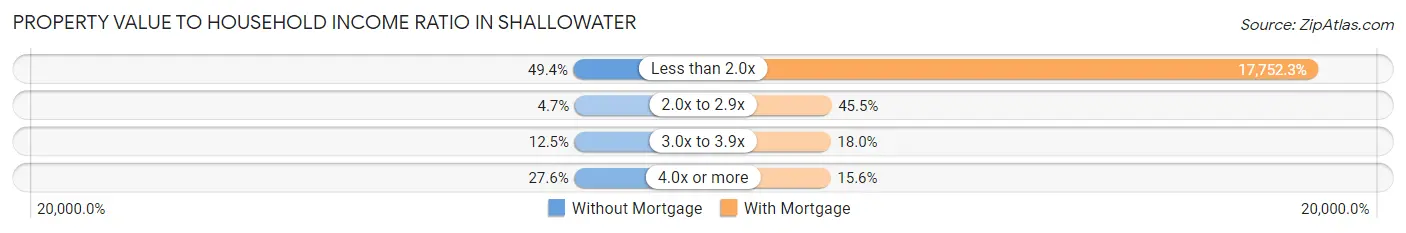
| Value-to-Income Ratio | Without Mortgage | With Mortgage |
| Less than 2.0x | 170 (49.4%) | 96,750 (17,752.3%) |
| 2.0x to 2.9x | 16 (4.6%) | 248 (45.5%) |
| 3.0x to 3.9x | 43 (12.5%) | 98 (18.0%) |
| 4.0x or more | 95 (27.6%) | 85 (15.6%) |
| Total | 344 (100.0%) | 545 (100.0%) |
Real Estate Taxes by Mortgage Status in Shallowater
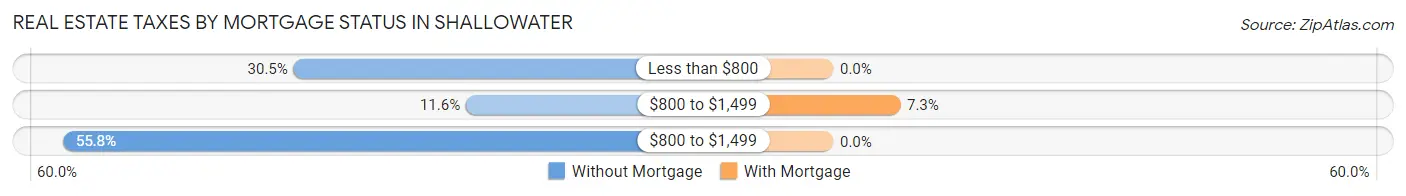
| Property Taxes | Without Mortgage | With Mortgage |
| Less than $800 | 105 (30.5%) | 0 (0.0%) |
| $800 to $1,499 | 40 (11.6%) | 40 (7.3%) |
| $800 to $1,499 | 192 (55.8%) | 0 (0.0%) |
| Total | 344 (100.0%) | 545 (100.0%) |
Health & Disability in Shallowater
Health Insurance Coverage by Age in Shallowater
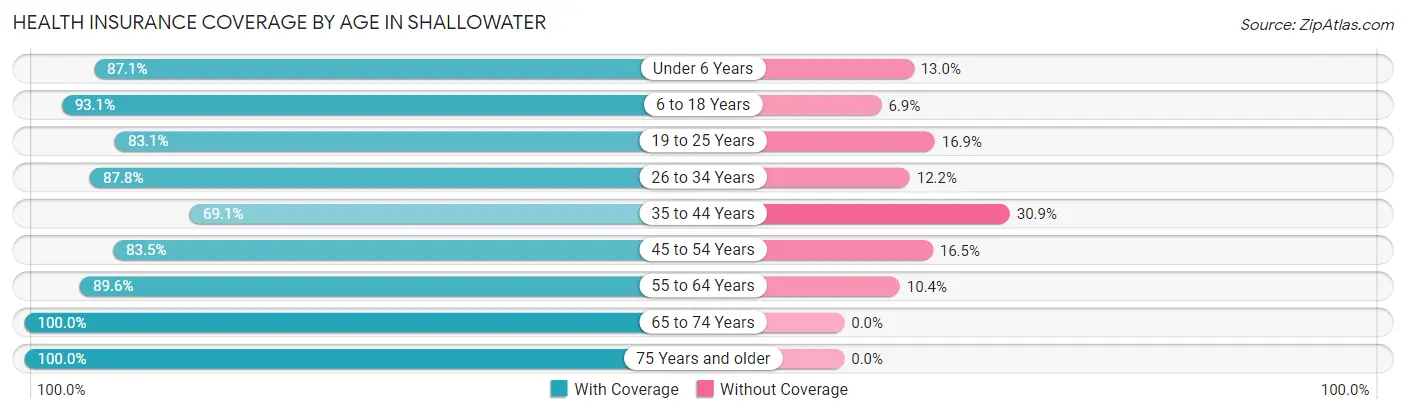
| Age Bracket | With Coverage | Without Coverage |
| Under 6 Years | 168 (87.1%) | 25 (13.0%) |
| 6 to 18 Years | 698 (93.1%) | 52 (6.9%) |
| 19 to 25 Years | 64 (83.1%) | 13 (16.9%) |
| 26 to 34 Years | 302 (87.8%) | 42 (12.2%) |
| 35 to 44 Years | 253 (69.1%) | 113 (30.9%) |
| 45 to 54 Years | 349 (83.5%) | 69 (16.5%) |
| 55 to 64 Years | 225 (89.6%) | 26 (10.4%) |
| 65 to 74 Years | 260 (100.0%) | 0 (0.0%) |
| 75 Years and older | 252 (100.0%) | 0 (0.0%) |
| Total | 2,571 (88.3%) | 340 (11.7%) |
Health Insurance Coverage by Citizenship Status in Shallowater
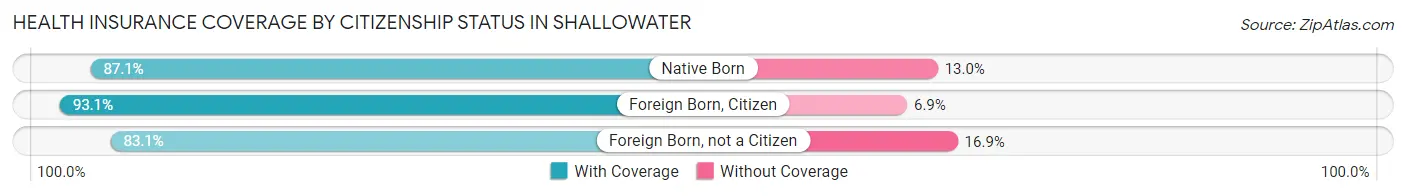
| Citizenship Status | With Coverage | Without Coverage |
| Native Born | 168 (87.1%) | 25 (13.0%) |
| Foreign Born, Citizen | 698 (93.1%) | 52 (6.9%) |
| Foreign Born, not a Citizen | 64 (83.1%) | 13 (16.9%) |
Health Insurance Coverage by Household Income in Shallowater
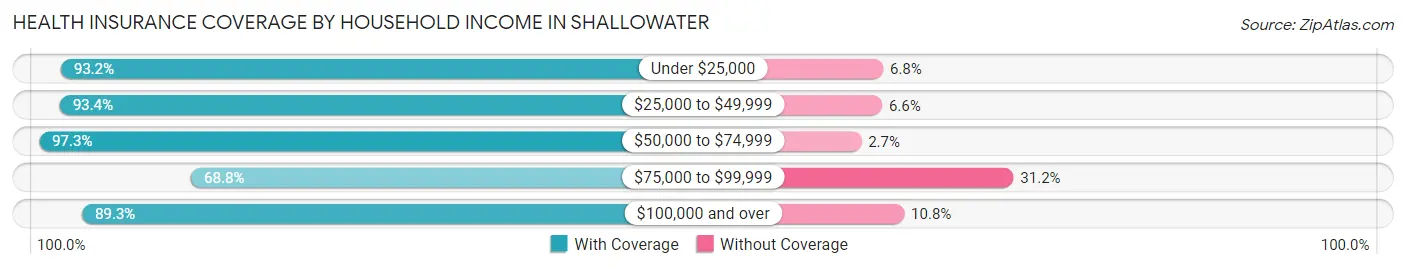
| Household Income | With Coverage | Without Coverage |
| Under $25,000 | 261 (93.2%) | 19 (6.8%) |
| $25,000 to $49,999 | 255 (93.4%) | 18 (6.6%) |
| $50,000 to $74,999 | 685 (97.3%) | 19 (2.7%) |
| $75,000 to $99,999 | 357 (68.8%) | 162 (31.2%) |
| $100,000 and over | 1,013 (89.2%) | 122 (10.7%) |
Public vs Private Health Insurance Coverage by Age in Shallowater
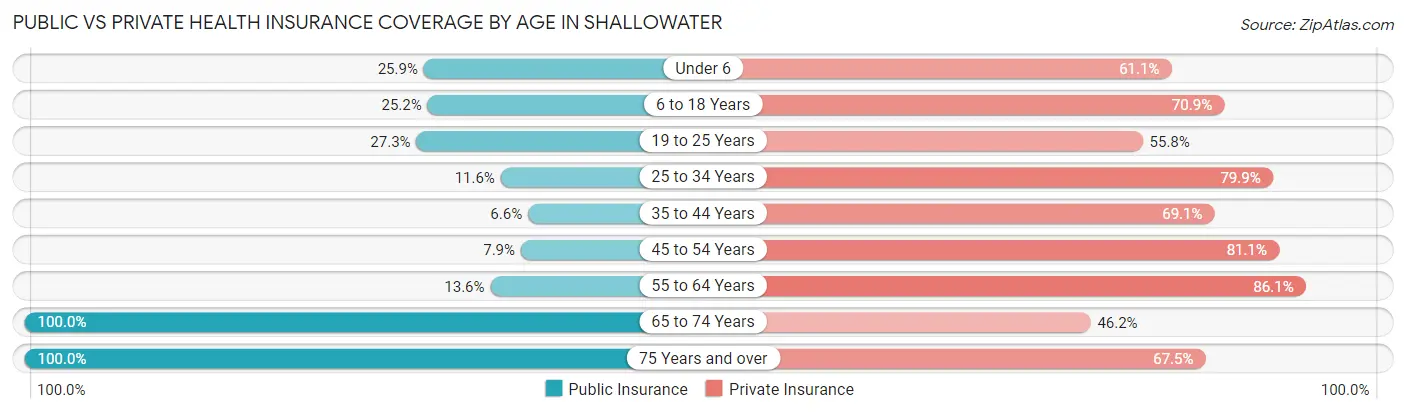
| Age Bracket | Public Insurance | Private Insurance |
| Under 6 | 50 (25.9%) | 118 (61.1%) |
| 6 to 18 Years | 189 (25.2%) | 532 (70.9%) |
| 19 to 25 Years | 21 (27.3%) | 43 (55.8%) |
| 25 to 34 Years | 40 (11.6%) | 275 (79.9%) |
| 35 to 44 Years | 24 (6.6%) | 253 (69.1%) |
| 45 to 54 Years | 33 (7.9%) | 339 (81.1%) |
| 55 to 64 Years | 34 (13.6%) | 216 (86.1%) |
| 65 to 74 Years | 260 (100.0%) | 120 (46.2%) |
| 75 Years and over | 252 (100.0%) | 170 (67.5%) |
| Total | 903 (31.0%) | 2,066 (71.0%) |
Disability Status by Sex by Age in Shallowater
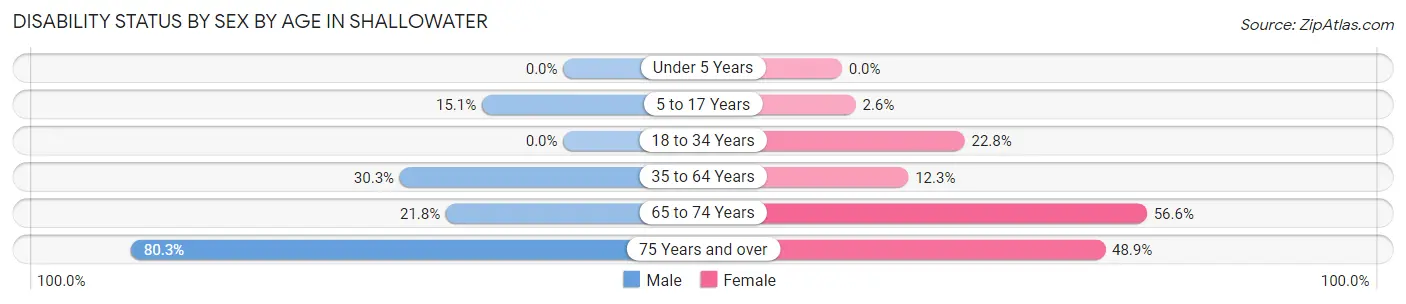
| Age Bracket | Male | Female |
| Under 5 Years | 0 (0.0%) | 0 (0.0%) |
| 5 to 17 Years | 78 (15.1%) | 7 (2.5%) |
| 18 to 34 Years | 0 (0.0%) | 49 (22.8%) |
| 35 to 64 Years | 159 (30.3%) | 63 (12.3%) |
| 65 to 74 Years | 22 (21.8%) | 90 (56.6%) |
| 75 Years and over | 61 (80.3%) | 86 (48.9%) |
Disability Class by Sex by Age in Shallowater
Disability Class: Hearing Difficulty
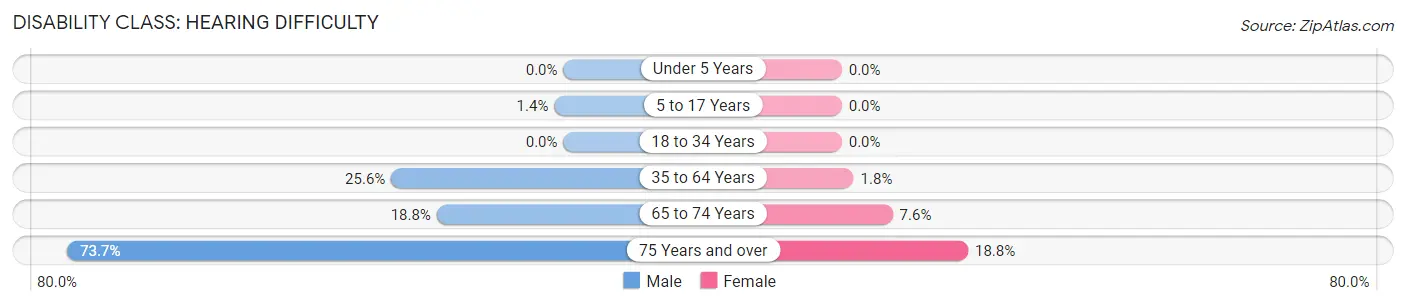
| Age Bracket | Male | Female |
| Under 5 Years | 0 (0.0%) | 0 (0.0%) |
| 5 to 17 Years | 7 (1.3%) | 0 (0.0%) |
| 18 to 34 Years | 0 (0.0%) | 0 (0.0%) |
| 35 to 64 Years | 134 (25.6%) | 9 (1.8%) |
| 65 to 74 Years | 19 (18.8%) | 12 (7.5%) |
| 75 Years and over | 56 (73.7%) | 33 (18.8%) |
Disability Class: Vision Difficulty
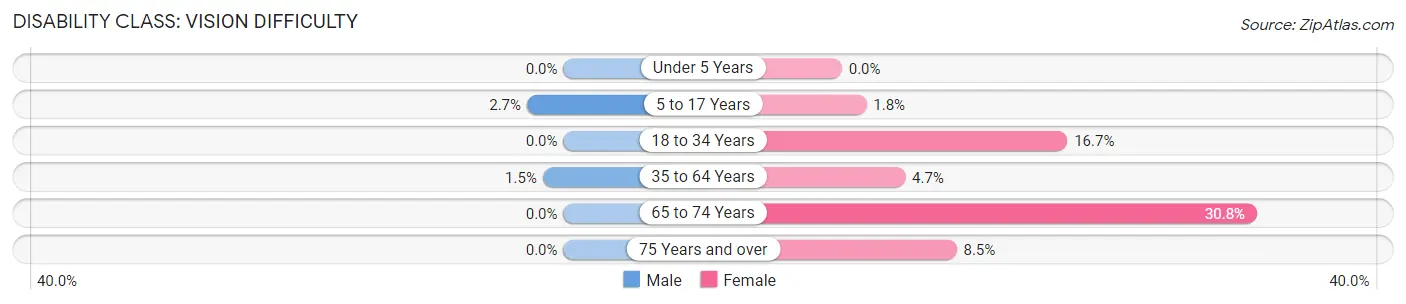
| Age Bracket | Male | Female |
| Under 5 Years | 0 (0.0%) | 0 (0.0%) |
| 5 to 17 Years | 14 (2.7%) | 5 (1.8%) |
| 18 to 34 Years | 0 (0.0%) | 36 (16.7%) |
| 35 to 64 Years | 8 (1.5%) | 24 (4.7%) |
| 65 to 74 Years | 0 (0.0%) | 49 (30.8%) |
| 75 Years and over | 0 (0.0%) | 15 (8.5%) |
Disability Class: Cognitive Difficulty

| Age Bracket | Male | Female |
| 5 to 17 Years | 71 (13.7%) | 7 (2.5%) |
| 18 to 34 Years | 0 (0.0%) | 24 (11.2%) |
| 35 to 64 Years | 17 (3.2%) | 31 (6.1%) |
| 65 to 74 Years | 0 (0.0%) | 6 (3.8%) |
| 75 Years and over | 17 (22.4%) | 6 (3.4%) |
Disability Class: Ambulatory Difficulty
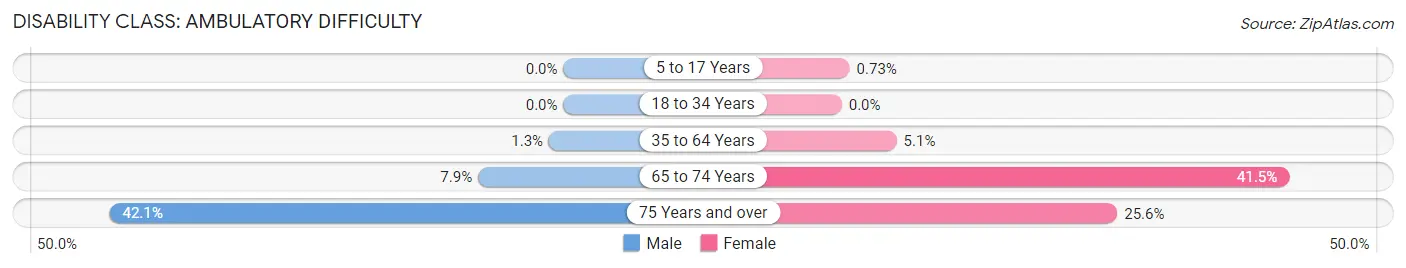
| Age Bracket | Male | Female |
| 5 to 17 Years | 0 (0.0%) | 2 (0.7%) |
| 18 to 34 Years | 0 (0.0%) | 0 (0.0%) |
| 35 to 64 Years | 7 (1.3%) | 26 (5.1%) |
| 65 to 74 Years | 8 (7.9%) | 66 (41.5%) |
| 75 Years and over | 32 (42.1%) | 45 (25.6%) |
Disability Class: Self-Care Difficulty
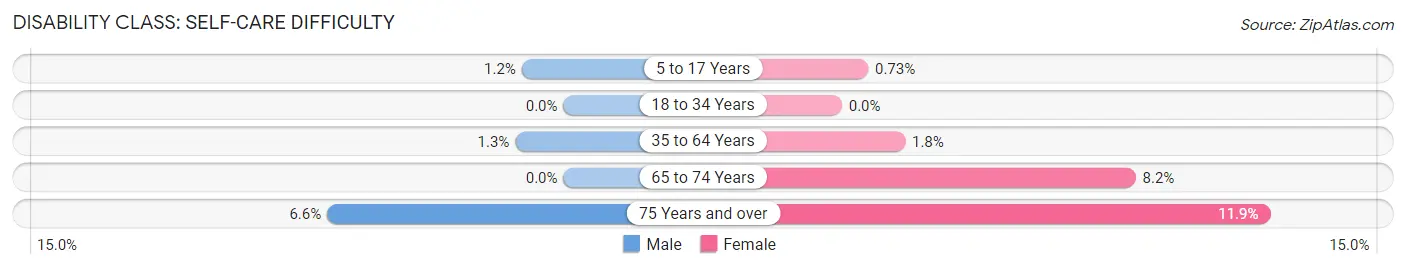
| Age Bracket | Male | Female |
| 5 to 17 Years | 6 (1.2%) | 2 (0.7%) |
| 18 to 34 Years | 0 (0.0%) | 0 (0.0%) |
| 35 to 64 Years | 7 (1.3%) | 9 (1.8%) |
| 65 to 74 Years | 0 (0.0%) | 13 (8.2%) |
| 75 Years and over | 5 (6.6%) | 21 (11.9%) |
Technology Access in Shallowater
Computing Device Access in Shallowater
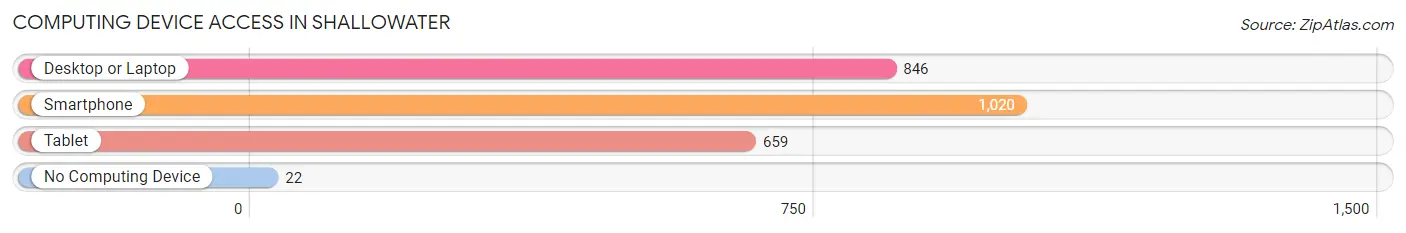
| Device Type | # Households | % Households |
| Desktop or Laptop | 846 | 79.8% |
| Smartphone | 1,020 | 96.2% |
| Tablet | 659 | 62.2% |
| No Computing Device | 22 | 2.1% |
| Total | 1,060 | 100.0% |
Internet Access in Shallowater
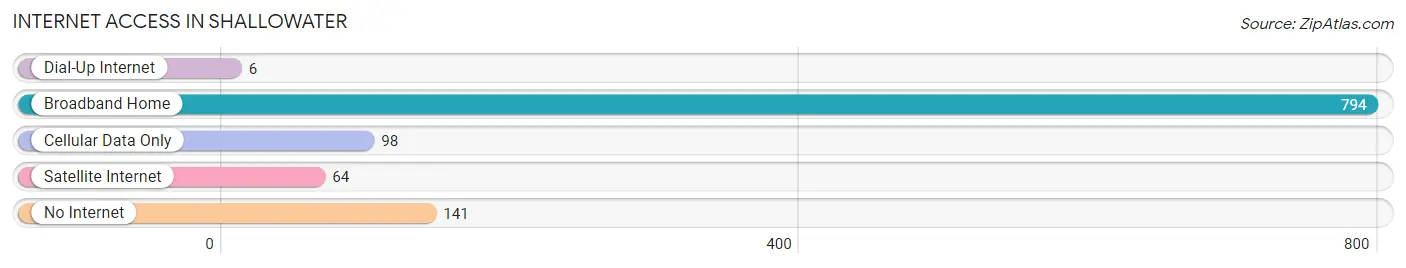
| Internet Type | # Households | % Households |
| Dial-Up Internet | 6 | 0.6% |
| Broadband Home | 794 | 74.9% |
| Cellular Data Only | 98 | 9.2% |
| Satellite Internet | 64 | 6.0% |
| No Internet | 141 | 13.3% |
| Total | 1,060 | 100.0% |
Shallowater Summary
Shallowater is a small city located in Lubbock County, Texas. It is situated about 15 miles northwest of the city of Lubbock. The population of Shallowater was 2,484 as of the 2010 census.
History
Shallowater was founded in 1909 by the Shallowater Land and Irrigation Company. The company was formed by a group of investors from Lubbock who wanted to develop the area for farming. The town was named after the shallow water table in the area. The first settlers arrived in 1910 and the town was officially incorporated in 1911.
The town grew slowly but steadily over the years. By the 1950s, Shallowater had become a thriving agricultural community. Cotton was the main crop grown in the area, and the town was home to several cotton gins.
Geography
Shallowater is located in the South Plains region of Texas. The town is situated at an elevation of 3,072 feet above sea level. The terrain is mostly flat, with some rolling hills in the area. The climate is semi-arid, with hot summers and mild winters.
The town is located near the Double Mountain Fork of the Brazos River. The river provides a source of irrigation for the area's agricultural operations.
Economy
Agriculture is the main economic driver in Shallowater. Cotton is the primary crop grown in the area, and the town is home to several cotton gins. Other crops grown in the area include corn, wheat, sorghum, and hay.
The town is also home to several businesses, including a grocery store, a hardware store, and a restaurant. There are also several small manufacturing companies located in the area.
Demographics
As of the 2010 census, the population of Shallowater was 2,484. The racial makeup of the town was 79.3% White, 0.7% African American, 0.3% Native American, 0.2% Asian, 16.2% from other races, and 3.5% from two or more races. Hispanic or Latino of any race were 33.2% of the population.
The median household income in Shallowater was $41,944, and the median family income was $48,958. The per capita income was $18,945. About 16.2% of families and 19.2% of the population were below the poverty line, including 25.2% of those under age 18 and 11.2% of those age 65 or over.
Shallowater is served by the Shallowater Independent School District. The district has one elementary school, one middle school, and one high school. The town is also home to a branch of South Plains College.
Common Questions
What is Per Capita Income in Shallowater?
Per Capita income in Shallowater is $31,776.
What is the Median Family Income in Shallowater?
Median Family Income in Shallowater is $80,000.
What is the Median Household income in Shallowater?
Median Household Income in Shallowater is $71,572.
What is Income or Wage Gap in Shallowater?
Income or Wage Gap in Shallowater is 14.4%.
Women in Shallowater earn 85.6 cents for every dollar earned by a man.
What is Inequality or Gini Index in Shallowater?
Inequality or Gini Index in Shallowater is 0.38.
What is the Total Population of Shallowater?
Total Population of Shallowater is 2,926.
What is the Total Male Population of Shallowater?
Total Male Population of Shallowater is 1,532.
What is the Total Female Population of Shallowater?
Total Female Population of Shallowater is 1,394.
What is the Ratio of Males per 100 Females in Shallowater?
There are 109.90 Males per 100 Females in Shallowater.
What is the Ratio of Females per 100 Males in Shallowater?
There are 90.99 Females per 100 Males in Shallowater.
What is the Median Population Age in Shallowater?
Median Population Age in Shallowater is 38.3 Years.
What is the Average Family Size in Shallowater
Average Family Size in Shallowater is 3.2 People.
What is the Average Household Size in Shallowater
Average Household Size in Shallowater is 2.8 People.
How Large is the Labor Force in Shallowater?
There are 1,354 People in the Labor Forcein in Shallowater.
What is the Percentage of People in the Labor Force in Shallowater?
63.9% of People are in the Labor Force in Shallowater.
What is the Unemployment Rate in Shallowater?
Unemployment Rate in Shallowater is 3.9%.