Gracemont, OK Map & Demographics
Gracemont Map
Gracemont Overview
$18,858
PER CAPITA INCOME
$38,333
AVG FAMILY INCOME
$32,500
AVG HOUSEHOLD INCOME
14.2%
WAGE / INCOME GAP [ % ]
85.8¢/ $1
WAGE / INCOME GAP [ $ ]
$14,300
FAMILY INCOME DEFICIT
0.41
INEQUALITY / GINI INDEX
292
TOTAL POPULATION
141
MALE POPULATION
151
FEMALE POPULATION
93.38
MALES / 100 FEMALES
107.09
FEMALES / 100 MALES
29.0
MEDIAN AGE
4.0
AVG FAMILY SIZE
3.1
AVG HOUSEHOLD SIZE
123
LABOR FORCE [ PEOPLE ]
58.6%
PERCENT IN LABOR FORCE
4.9%
UNEMPLOYMENT RATE
Gracemont Zip Codes
Gracemont Area Codes
Income in Gracemont
Income Overview in Gracemont
Per Capita Income in Gracemont is $18,858, while median incomes of families and households are $38,333 and $32,500 respectively.
| Characteristic | Number | Measure |
| Per Capita Income | 292 | $18,858 |
| Median Family Income | 58 | $38,333 |
| Mean Family Income | 58 | $59,260 |
| Median Household Income | 94 | $32,500 |
| Mean Household Income | 94 | $49,034 |
| Income Deficit | 58 | $14,300 |
| Wage / Income Gap (%) | 292 | 14.23% |
| Wage / Income Gap ($) | 292 | 85.77¢ per $1 |
| Gini / Inequality Index | 292 | 0.41 |
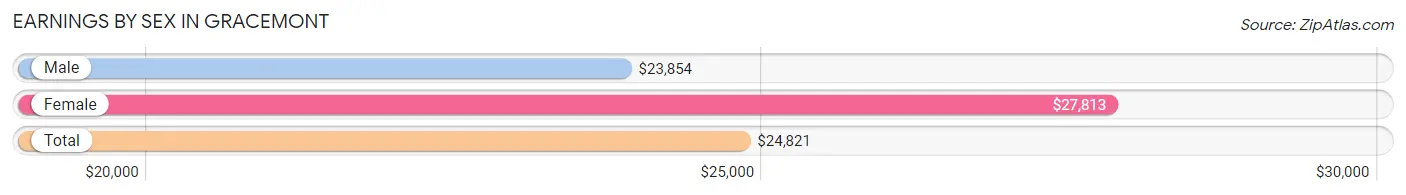
Earnings by Sex in Gracemont
Average Earnings in Gracemont are $24,821, $23,854 for men and $27,813 for women, a difference of 14.2%.
| Sex | Number | Average Earnings |
| Male | 75 (58.6%) | $23,854 |
| Female | 53 (41.4%) | $27,813 |
| Total | 128 (100.0%) | $24,821 |
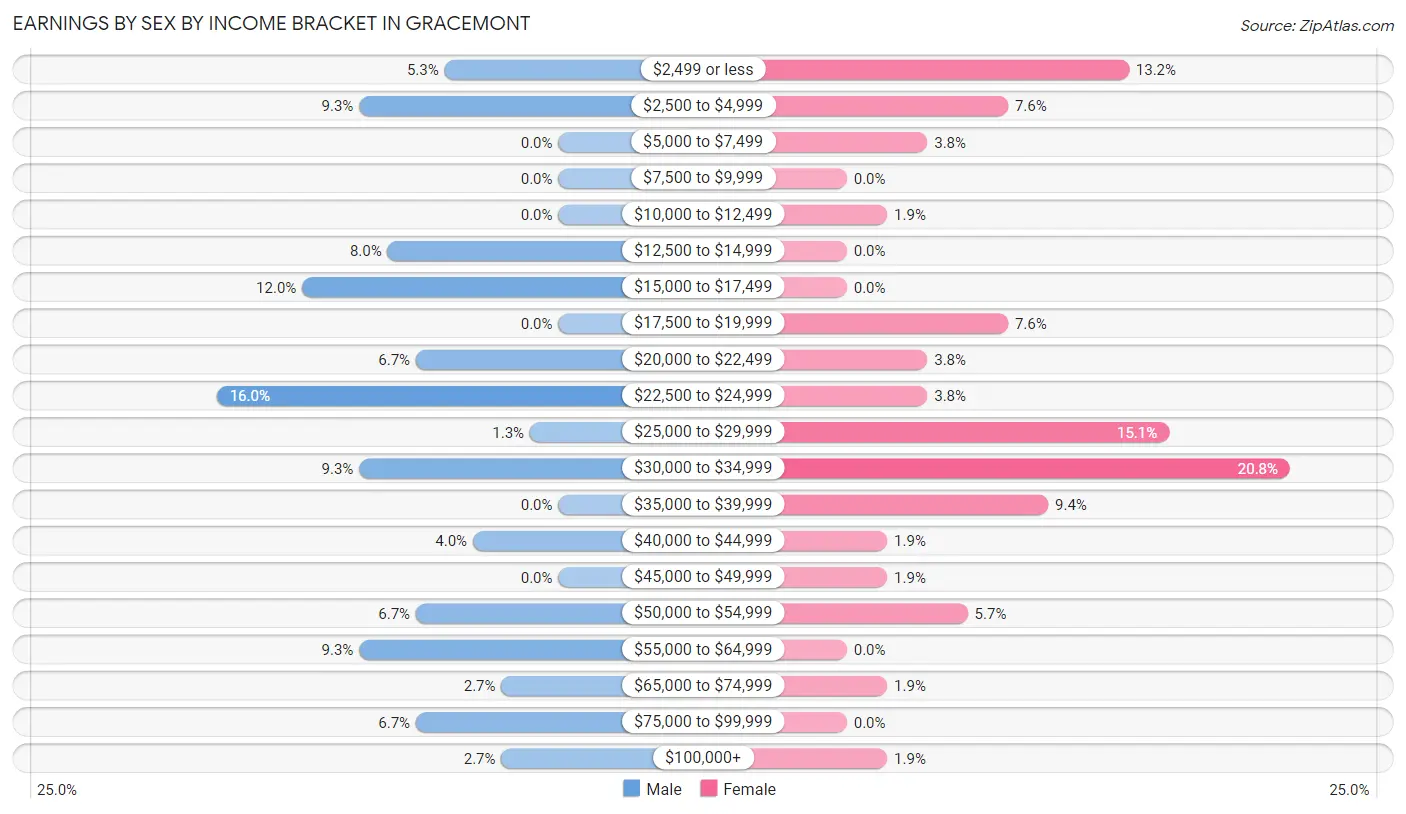
Earnings by Sex by Income Bracket in Gracemont
The most common earnings brackets in Gracemont are $22,500 to $24,999 for men (12 | 16.0%) and $30,000 to $34,999 for women (11 | 20.7%).
| Income | Male | Female |
| $2,499 or less | 4 (5.3%) | 7 (13.2%) |
| $2,500 to $4,999 | 7 (9.3%) | 4 (7.5%) |
| $5,000 to $7,499 | 0 (0.0%) | 2 (3.8%) |
| $7,500 to $9,999 | 0 (0.0%) | 0 (0.0%) |
| $10,000 to $12,499 | 0 (0.0%) | 1 (1.9%) |
| $12,500 to $14,999 | 6 (8.0%) | 0 (0.0%) |
| $15,000 to $17,499 | 9 (12.0%) | 0 (0.0%) |
| $17,500 to $19,999 | 0 (0.0%) | 4 (7.5%) |
| $20,000 to $22,499 | 5 (6.7%) | 2 (3.8%) |
| $22,500 to $24,999 | 12 (16.0%) | 2 (3.8%) |
| $25,000 to $29,999 | 1 (1.3%) | 8 (15.1%) |
| $30,000 to $34,999 | 7 (9.3%) | 11 (20.7%) |
| $35,000 to $39,999 | 0 (0.0%) | 5 (9.4%) |
| $40,000 to $44,999 | 3 (4.0%) | 1 (1.9%) |
| $45,000 to $49,999 | 0 (0.0%) | 1 (1.9%) |
| $50,000 to $54,999 | 5 (6.7%) | 3 (5.7%) |
| $55,000 to $64,999 | 7 (9.3%) | 0 (0.0%) |
| $65,000 to $74,999 | 2 (2.7%) | 1 (1.9%) |
| $75,000 to $99,999 | 5 (6.7%) | 0 (0.0%) |
| $100,000+ | 2 (2.7%) | 1 (1.9%) |
| Total | 75 (100.0%) | 53 (100.0%) |
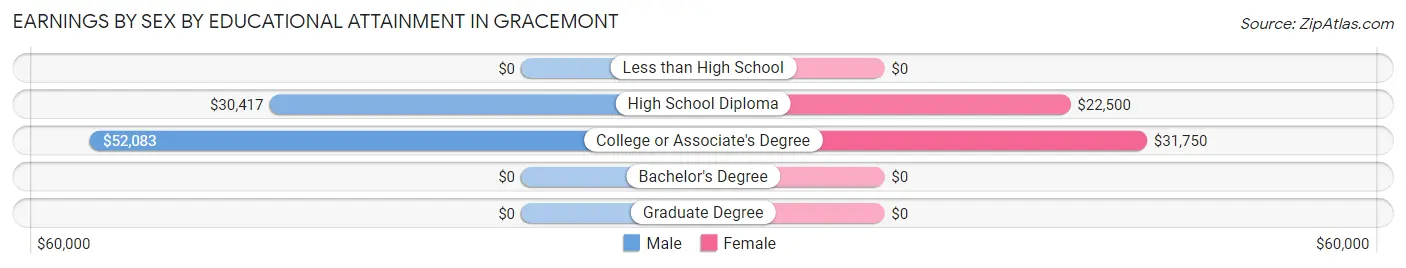
Earnings by Sex by Educational Attainment in Gracemont
Average earnings in Gracemont are $41,250 for men and $30,000 for women, a difference of 27.3%. Men with an educational attainment of college or associate's degree enjoy the highest average annual earnings of $52,083, while those with high school diploma education earn the least with $30,417. Women with an educational attainment of college or associate's degree earn the most with the average annual earnings of $31,750, while those with high school diploma education have the smallest earnings of $22,500.
| Educational Attainment | Male Income | Female Income |
| Less than High School | - | - |
| High School Diploma | $30,417 | $22,500 |
| College or Associate's Degree | $52,083 | $31,750 |
| Bachelor's Degree | - | - |
| Graduate Degree | - | - |
| Total | $41,250 | $30,000 |
Family Income in Gracemont
Family Income Brackets in Gracemont
According to the Gracemont family income data, there are 14 families falling into the $25,000 to $34,999 income range, which is the most common income bracket and makes up 24.1% of all families.
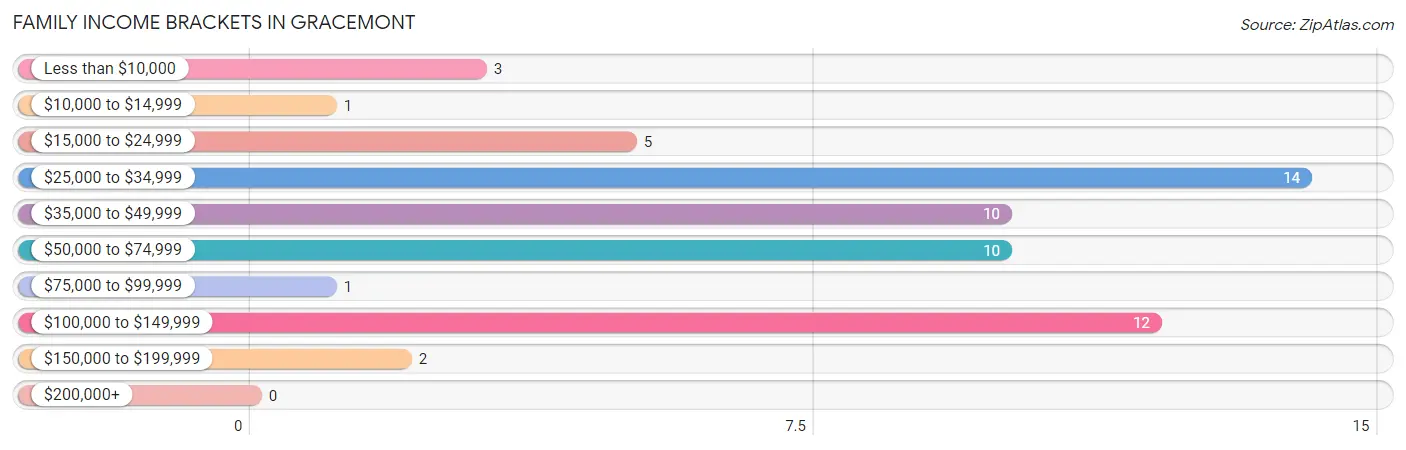
| Income Bracket | # Families | % Families |
| Less than $10,000 | 3 | 5.2% |
| $10,000 to $14,999 | 1 | 1.7% |
| $15,000 to $24,999 | 5 | 8.6% |
| $25,000 to $34,999 | 14 | 24.1% |
| $35,000 to $49,999 | 10 | 17.2% |
| $50,000 to $74,999 | 10 | 17.2% |
| $75,000 to $99,999 | 1 | 1.7% |
| $100,000 to $149,999 | 12 | 20.7% |
| $150,000 to $199,999 | 2 | 3.4% |
| $200,000+ | 0 | 0.0% |
Family Income by Famaliy Size in Gracemont
3-person families (11 | 19.0%) account for the highest median family income in Gracemont with $65,625 per family, while 3-person families (11 | 19.0%) have the highest median income of $21,875 per family member.
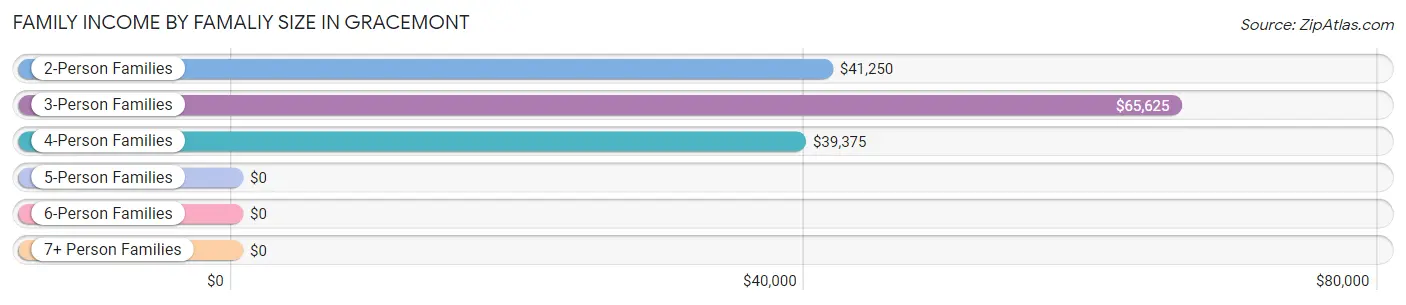
| Income Bracket | # Families | Median Income |
| 2-Person Families | 22 (37.9%) | $41,250 |
| 3-Person Families | 11 (19.0%) | $65,625 |
| 4-Person Families | 11 (19.0%) | $39,375 |
| 5-Person Families | 10 (17.2%) | $0 |
| 6-Person Families | 2 (3.5%) | $0 |
| 7+ Person Families | 2 (3.5%) | $0 |
| Total | 58 (100.0%) | $38,333 |
Family Income by Number of Earners in Gracemont
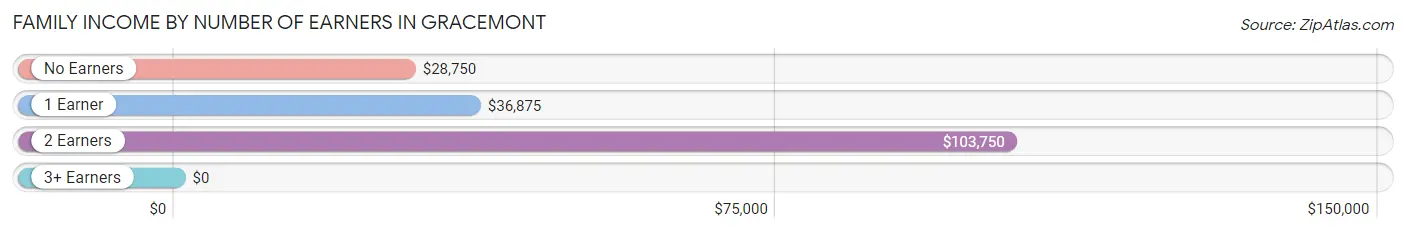
| Number of Earners | # Families | Median Income |
| No Earners | 13 (22.4%) | $28,750 |
| 1 Earner | 30 (51.7%) | $36,875 |
| 2 Earners | 11 (19.0%) | $103,750 |
| 3+ Earners | 4 (6.9%) | $0 |
| Total | 58 (100.0%) | $38,333 |
Household Income in Gracemont
Household Income Brackets in Gracemont
With 21 households falling in the category, the $25,000 to $34,999 income range is the most frequent in Gracemont, accounting for 22.3% of all households.
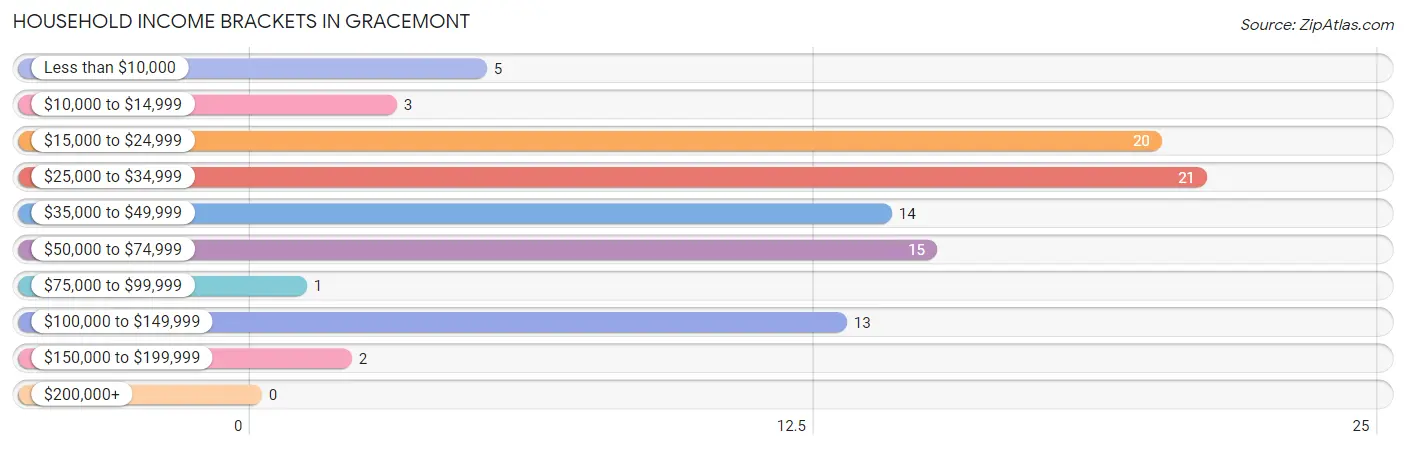
| Income Bracket | # Households | % Households |
| Less than $10,000 | 5 | 5.3% |
| $10,000 to $14,999 | 3 | 3.2% |
| $15,000 to $24,999 | 20 | 21.3% |
| $25,000 to $34,999 | 21 | 22.3% |
| $35,000 to $49,999 | 14 | 14.9% |
| $50,000 to $74,999 | 15 | 16.0% |
| $75,000 to $99,999 | 1 | 1.1% |
| $100,000 to $149,999 | 13 | 13.8% |
| $150,000 to $199,999 | 2 | 2.1% |
| $200,000+ | 0 | 0.0% |
Household Income by Householder Age in Gracemont
The median household income in Gracemont is $32,500, with the highest median household income of $46,250 found in the 45 to 64 years age bracket for the primary householder. A total of 26 households (27.7%) fall into this category. Meanwhile, the 15 to 24 years age bracket for the primary householder has the lowest median household income of $0, with 5 households (5.3%) in this group.
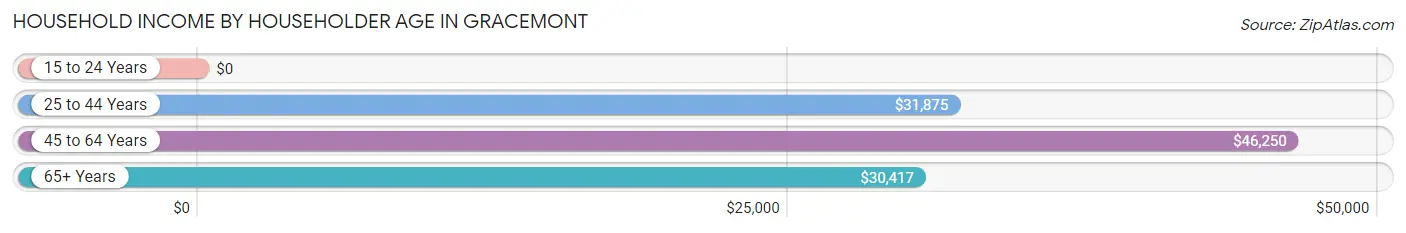
| Income Bracket | # Households | Median Income |
| 15 to 24 Years | 5 (5.3%) | $0 |
| 25 to 44 Years | 36 (38.3%) | $31,875 |
| 45 to 64 Years | 26 (27.7%) | $46,250 |
| 65+ Years | 27 (28.7%) | $30,417 |
| Total | 94 (100.0%) | $32,500 |
Poverty in Gracemont
Income Below Poverty by Sex and Age in Gracemont
With 30.5% poverty level for males and 19.9% for females among the residents of Gracemont, 16 and 17 year old males and 5 year old females are the most vulnerable to poverty, with 1 males (100.0%) and 3 females (42.9%) in their respective age groups living below the poverty level.
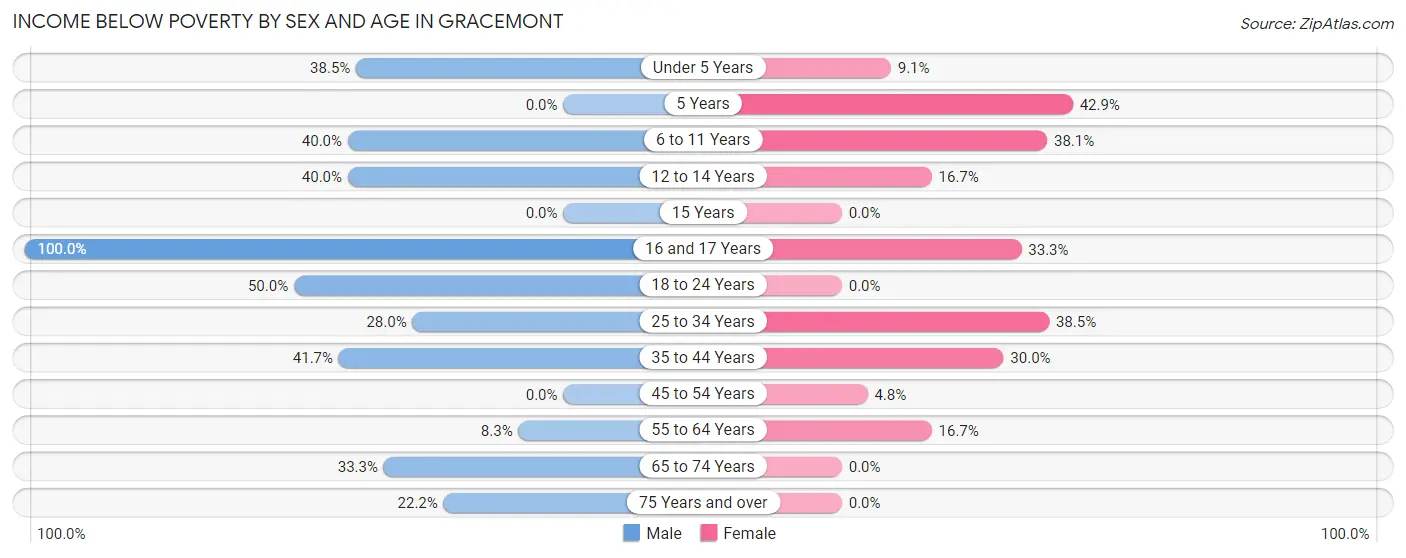
| Age Bracket | Male | Female |
| Under 5 Years | 5 (38.5%) | 1 (9.1%) |
| 5 Years | 0 (0.0%) | 3 (42.9%) |
| 6 to 11 Years | 4 (40.0%) | 8 (38.1%) |
| 12 to 14 Years | 2 (40.0%) | 2 (16.7%) |
| 15 Years | 0 (0.0%) | 0 (0.0%) |
| 16 and 17 Years | 1 (100.0%) | 1 (33.3%) |
| 18 to 24 Years | 14 (50.0%) | 0 (0.0%) |
| 25 to 34 Years | 7 (28.0%) | 10 (38.5%) |
| 35 to 44 Years | 5 (41.7%) | 3 (30.0%) |
| 45 to 54 Years | 0 (0.0%) | 1 (4.8%) |
| 55 to 64 Years | 1 (8.3%) | 1 (16.7%) |
| 65 to 74 Years | 2 (33.3%) | 0 (0.0%) |
| 75 Years and over | 2 (22.2%) | 0 (0.0%) |
| Total | 43 (30.5%) | 30 (19.9%) |
Income Above Poverty by Sex and Age in Gracemont
According to the poverty statistics in Gracemont, males aged 5 years and females aged 18 to 24 years are the age groups that are most secure financially, with 100.0% of males and 100.0% of females in these age groups living above the poverty line.
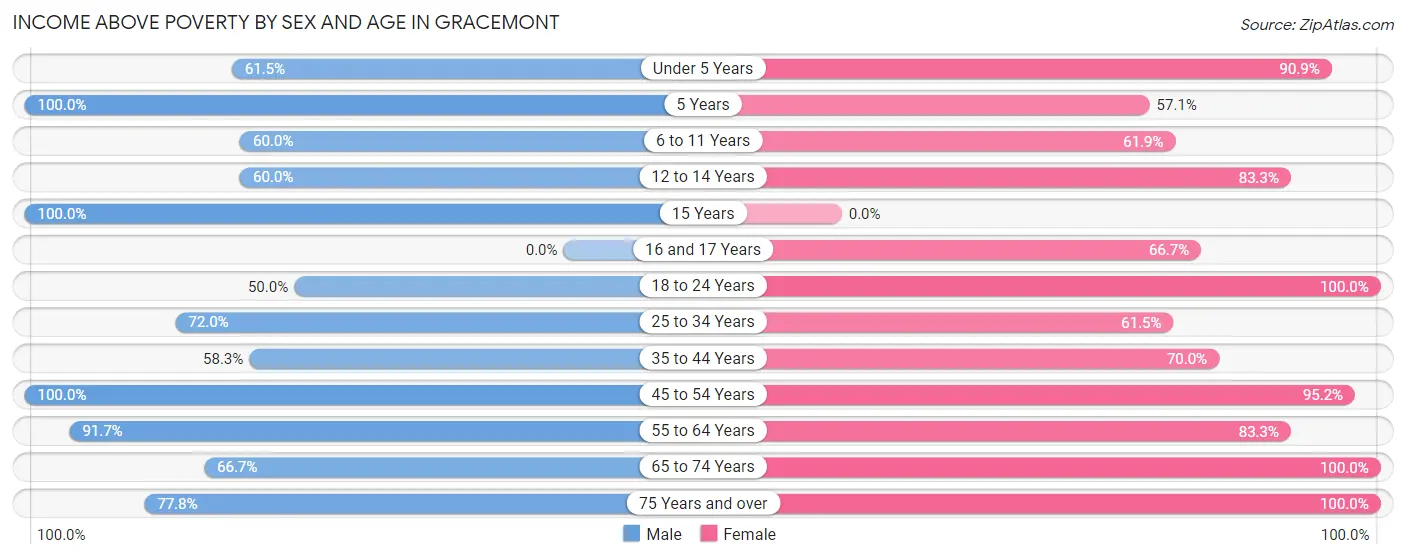
| Age Bracket | Male | Female |
| Under 5 Years | 8 (61.5%) | 10 (90.9%) |
| 5 Years | 1 (100.0%) | 4 (57.1%) |
| 6 to 11 Years | 6 (60.0%) | 13 (61.9%) |
| 12 to 14 Years | 3 (60.0%) | 10 (83.3%) |
| 15 Years | 2 (100.0%) | 0 (0.0%) |
| 16 and 17 Years | 0 (0.0%) | 2 (66.7%) |
| 18 to 24 Years | 14 (50.0%) | 16 (100.0%) |
| 25 to 34 Years | 18 (72.0%) | 16 (61.5%) |
| 35 to 44 Years | 7 (58.3%) | 7 (70.0%) |
| 45 to 54 Years | 17 (100.0%) | 20 (95.2%) |
| 55 to 64 Years | 11 (91.7%) | 5 (83.3%) |
| 65 to 74 Years | 4 (66.7%) | 12 (100.0%) |
| 75 Years and over | 7 (77.8%) | 6 (100.0%) |
| Total | 98 (69.5%) | 121 (80.1%) |
Income Below Poverty Among Married-Couple Families in Gracemont
The poverty statistics for married-couple families in Gracemont show that 15.6% or 5 of the total 32 families live below the poverty line. Families with 3 or 4 children have the highest poverty rate of 62.5%, comprising of 5 families. On the other hand, families with no children have the lowest poverty rate of 0.0%, which includes 0 families.
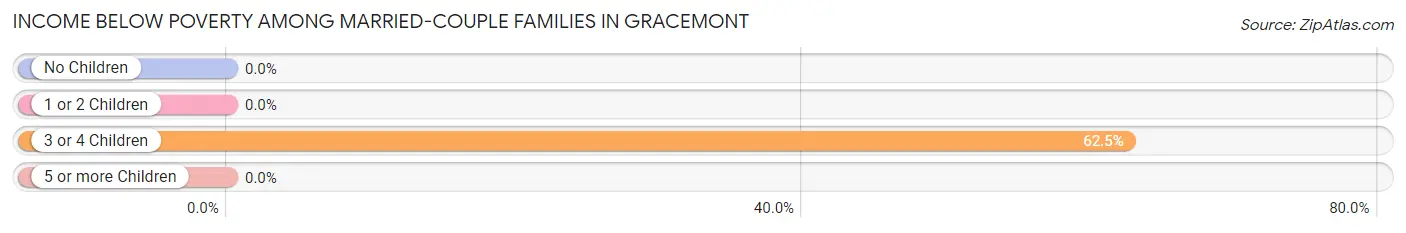
| Children | Above Poverty | Below Poverty |
| No Children | 19 (100.0%) | 0 (0.0%) |
| 1 or 2 Children | 5 (100.0%) | 0 (0.0%) |
| 3 or 4 Children | 3 (37.5%) | 5 (62.5%) |
| 5 or more Children | 0 (0.0%) | 0 (0.0%) |
| Total | 27 (84.4%) | 5 (15.6%) |
Income Below Poverty Among Single-Parent Households in Gracemont
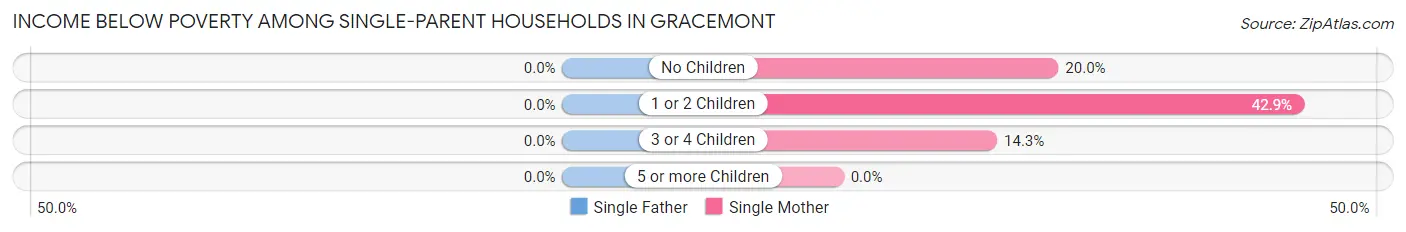
| Children | Single Father | Single Mother |
| No Children | 0 (0.0%) | 1 (20.0%) |
| 1 or 2 Children | 0 (0.0%) | 3 (42.9%) |
| 3 or 4 Children | 0 (0.0%) | 1 (14.3%) |
| 5 or more Children | 0 (0.0%) | 0 (0.0%) |
| Total | 0 (0.0%) | 5 (26.3%) |
Income Below Poverty Among Married-Couple vs Single-Parent Households in Gracemont
The poverty data for Gracemont shows that 5 of the married-couple family households (15.6%) and 5 of the single-parent households (19.2%) are living below the poverty level. Within the married-couple family households, those with 3 or 4 children have the highest poverty rate, with 5 households (62.5%) falling below the poverty line. Among the single-parent households, those with 1 or 2 children have the highest poverty rate, with 3 household (37.5%) living below poverty.
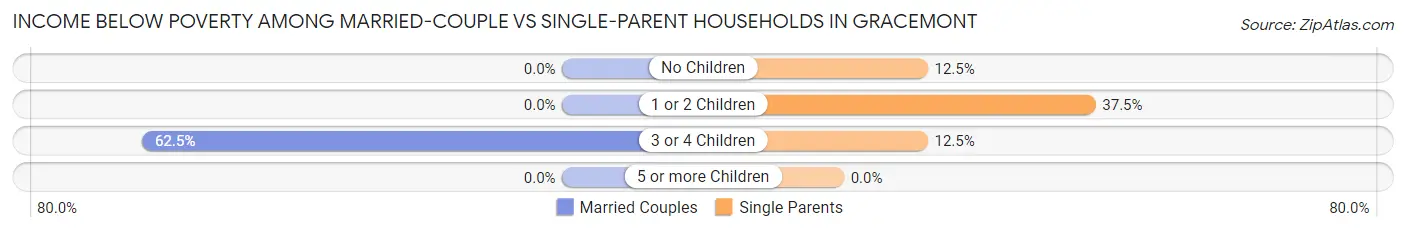
| Children | Married-Couple Families | Single-Parent Households |
| No Children | 0 (0.0%) | 1 (12.5%) |
| 1 or 2 Children | 0 (0.0%) | 3 (37.5%) |
| 3 or 4 Children | 5 (62.5%) | 1 (12.5%) |
| 5 or more Children | 0 (0.0%) | 0 (0.0%) |
| Total | 5 (15.6%) | 5 (19.2%) |
Race in Gracemont
The most populous races in Gracemont are White / Caucasian (177 | 60.6%), Native / Alaskan (62 | 21.2%), and Hispanic or Latino (45 | 15.4%).
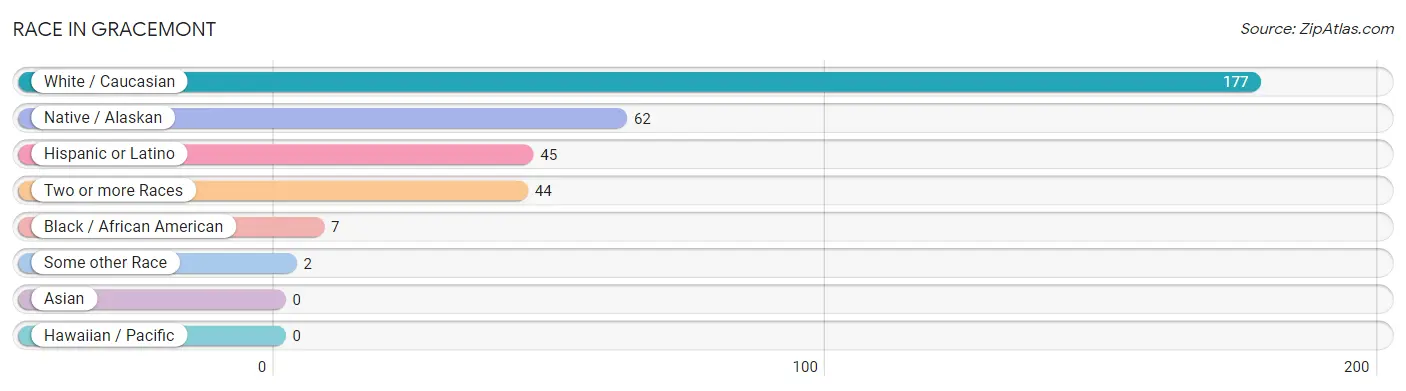
| Race | # Population | % Population |
| Asian | 0 | 0.0% |
| Black / African American | 7 | 2.4% |
| Hawaiian / Pacific | 0 | 0.0% |
| Hispanic or Latino | 45 | 15.4% |
| Native / Alaskan | 62 | 21.2% |
| White / Caucasian | 177 | 60.6% |
| Two or more Races | 44 | 15.1% |
| Some other Race | 2 | 0.7% |
| Total | 292 | 100.0% |
Ancestry in Gracemont
The most populous ancestries reported in Gracemont are Mexican (41 | 14.0%), Irish (37 | 12.7%), Kiowa (32 | 11.0%), Cherokee (22 | 7.5%), and English (22 | 7.5%), together accounting for 52.7% of all Gracemont residents.
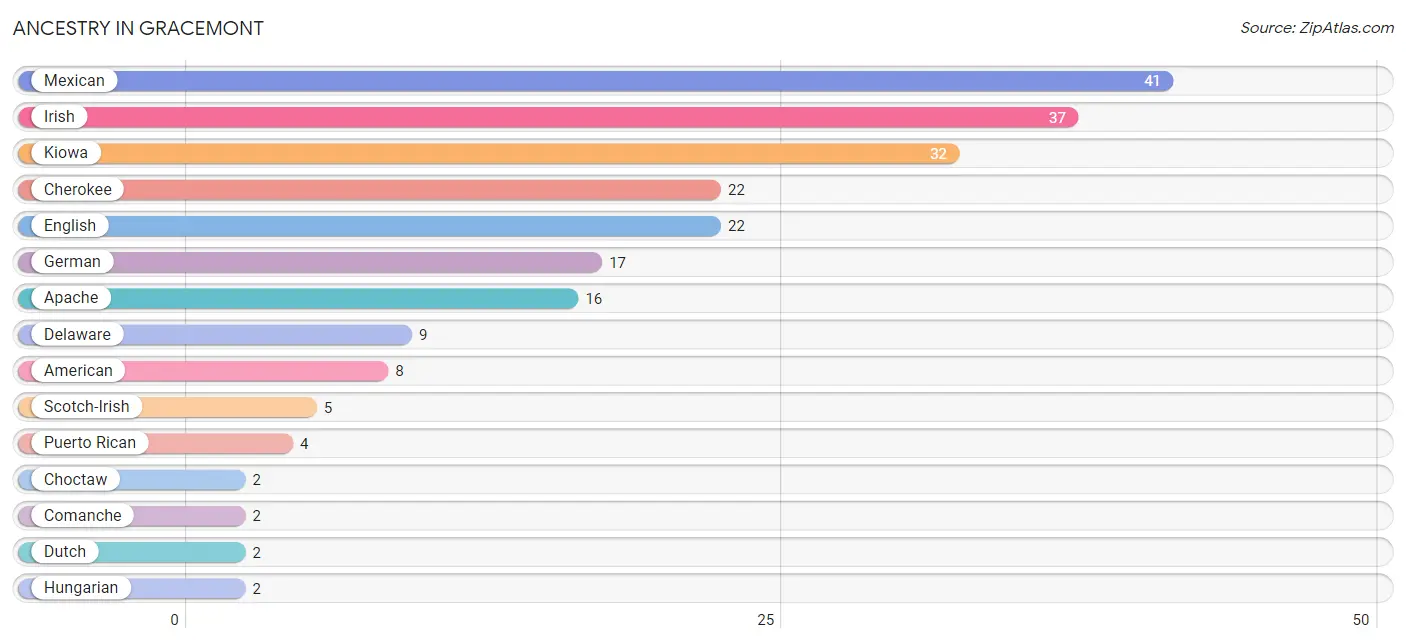
| Ancestry | # Population | % Population |
| American | 8 | 2.7% |
| Apache | 16 | 5.5% |
| Cherokee | 22 | 7.5% |
| Cheyenne | 1 | 0.3% |
| Chickasaw | 1 | 0.3% |
| Choctaw | 2 | 0.7% |
| Comanche | 2 | 0.7% |
| Delaware | 9 | 3.1% |
| Dutch | 2 | 0.7% |
| English | 22 | 7.5% |
| German | 17 | 5.8% |
| Hungarian | 2 | 0.7% |
| Indian (Asian) | 1 | 0.3% |
| Irish | 37 | 12.7% |
| Kiowa | 32 | 11.0% |
| Mexican | 41 | 14.0% |
| Polish | 2 | 0.7% |
| Puerto Rican | 4 | 1.4% |
| Scotch-Irish | 5 | 1.7% |
| Welsh | 1 | 0.3% | View All 20 Rows |
Immigrants in Gracemont
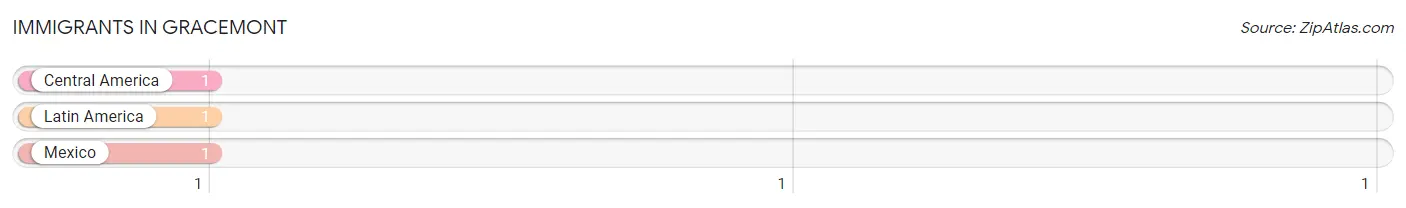
The most numerous immigrant groups reported in Gracemont came from Central America (1 | 0.3%), Latin America (1 | 0.3%), and Mexico (1 | 0.3%), together accounting for 1.0% of all Gracemont residents.
| Immigration Origin | # Population | % Population |
| Central America | 1 | 0.3% |
| Latin America | 1 | 0.3% |
| Mexico | 1 | 0.3% | View All 3 Rows |
Sex and Age in Gracemont
Sex and Age in Gracemont
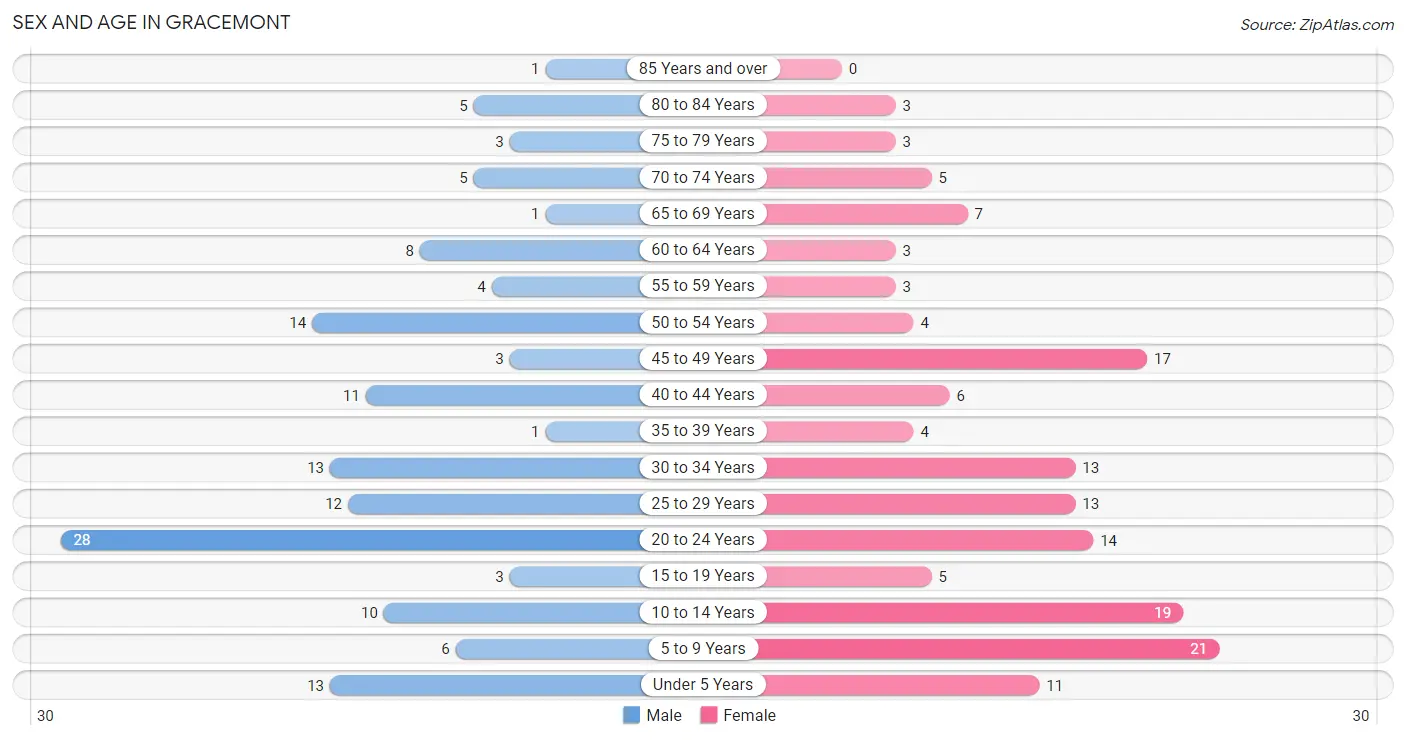
The most populous age groups in Gracemont are 20 to 24 Years (28 | 19.9%) for men and 5 to 9 Years (21 | 13.9%) for women.
| Age Bracket | Male | Female |
| Under 5 Years | 13 (9.2%) | 11 (7.3%) |
| 5 to 9 Years | 6 (4.3%) | 21 (13.9%) |
| 10 to 14 Years | 10 (7.1%) | 19 (12.6%) |
| 15 to 19 Years | 3 (2.1%) | 5 (3.3%) |
| 20 to 24 Years | 28 (19.9%) | 14 (9.3%) |
| 25 to 29 Years | 12 (8.5%) | 13 (8.6%) |
| 30 to 34 Years | 13 (9.2%) | 13 (8.6%) |
| 35 to 39 Years | 1 (0.7%) | 4 (2.6%) |
| 40 to 44 Years | 11 (7.8%) | 6 (4.0%) |
| 45 to 49 Years | 3 (2.1%) | 17 (11.3%) |
| 50 to 54 Years | 14 (9.9%) | 4 (2.6%) |
| 55 to 59 Years | 4 (2.8%) | 3 (2.0%) |
| 60 to 64 Years | 8 (5.7%) | 3 (2.0%) |
| 65 to 69 Years | 1 (0.7%) | 7 (4.6%) |
| 70 to 74 Years | 5 (3.5%) | 5 (3.3%) |
| 75 to 79 Years | 3 (2.1%) | 3 (2.0%) |
| 80 to 84 Years | 5 (3.5%) | 3 (2.0%) |
| 85 Years and over | 1 (0.7%) | 0 (0.0%) |
| Total | 141 (100.0%) | 151 (100.0%) |
Families and Households in Gracemont
Median Family Size in Gracemont
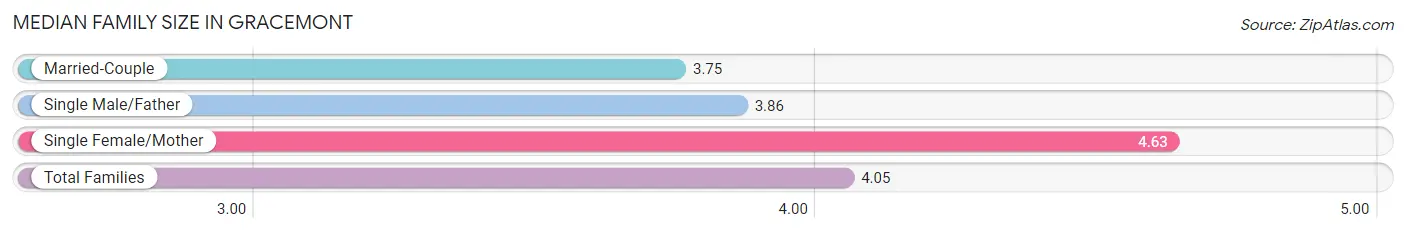
The median family size in Gracemont is 4.05 persons per family, with single female/mother families (19 | 32.8%) accounting for the largest median family size of 4.63 persons per family. On the other hand, married-couple families (32 | 55.2%) represent the smallest median family size with 3.75 persons per family.
| Family Type | # Families | Family Size |
| Married-Couple | 32 (55.2%) | 3.75 |
| Single Male/Father | 7 (12.1%) | 3.86 |
| Single Female/Mother | 19 (32.8%) | 4.63 |
| Total Families | 58 (100.0%) | 4.05 |
Median Household Size in Gracemont
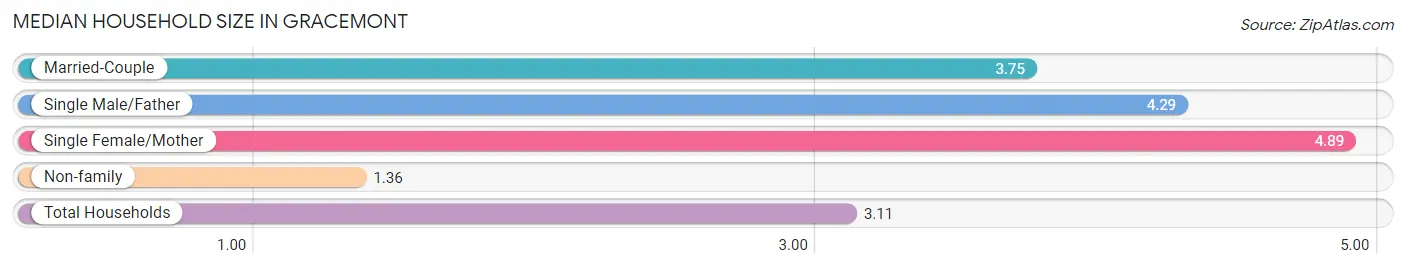
The median household size in Gracemont is 3.11 persons per household, with single female/mother households (19 | 20.2%) accounting for the largest median household size of 4.89 persons per household. non-family households (36 | 38.3%) represent the smallest median household size with 1.36 persons per household.
| Household Type | # Households | Household Size |
| Married-Couple | 32 (34.0%) | 3.75 |
| Single Male/Father | 7 (7.4%) | 4.29 |
| Single Female/Mother | 19 (20.2%) | 4.89 |
| Non-family | 36 (38.3%) | 1.36 |
| Total Households | 94 (100.0%) | 3.11 |
Household Size by Marriage Status in Gracemont
Out of a total of 94 households in Gracemont, 58 (61.7%) are family households, while 36 (38.3%) are nonfamily households. The most numerous type of family households are 2-person households, comprising 21, and the most common type of nonfamily households are 1-person households, comprising 30.
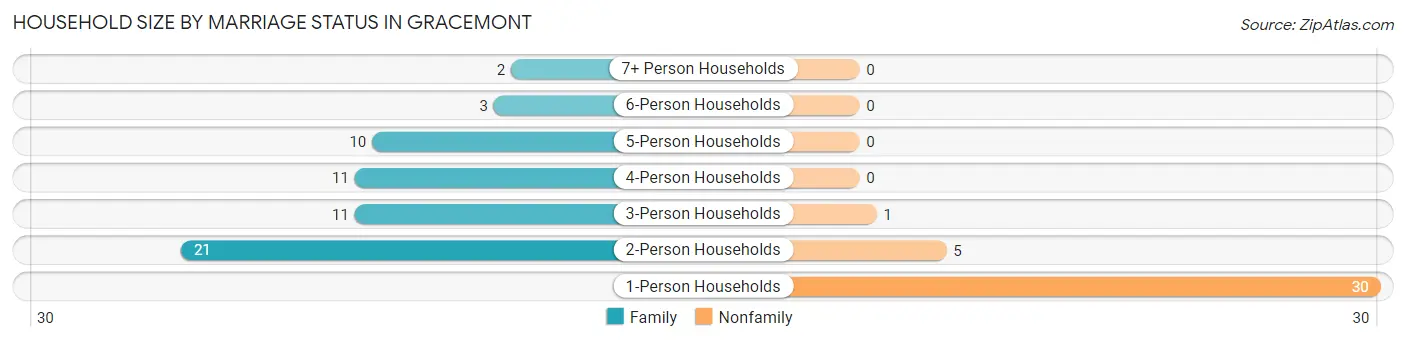
| Household Size | Family Households | Nonfamily Households |
| 1-Person Households | - | 30 (31.9%) |
| 2-Person Households | 21 (22.3%) | 5 (5.3%) |
| 3-Person Households | 11 (11.7%) | 1 (1.1%) |
| 4-Person Households | 11 (11.7%) | 0 (0.0%) |
| 5-Person Households | 10 (10.6%) | 0 (0.0%) |
| 6-Person Households | 3 (3.2%) | 0 (0.0%) |
| 7+ Person Households | 2 (2.1%) | 0 (0.0%) |
| Total | 58 (61.7%) | 36 (38.3%) |
Female Fertility in Gracemont
Fertility by Age in Gracemont
Average fertility rate in Gracemont is 97.0 births per 1,000 women. Women in the age bracket of 20 to 34 years have the highest fertility rate with 125.0 births per 1,000 women. Women in the age bracket of 20 to 34 years acount for 71.4% of all women with births.
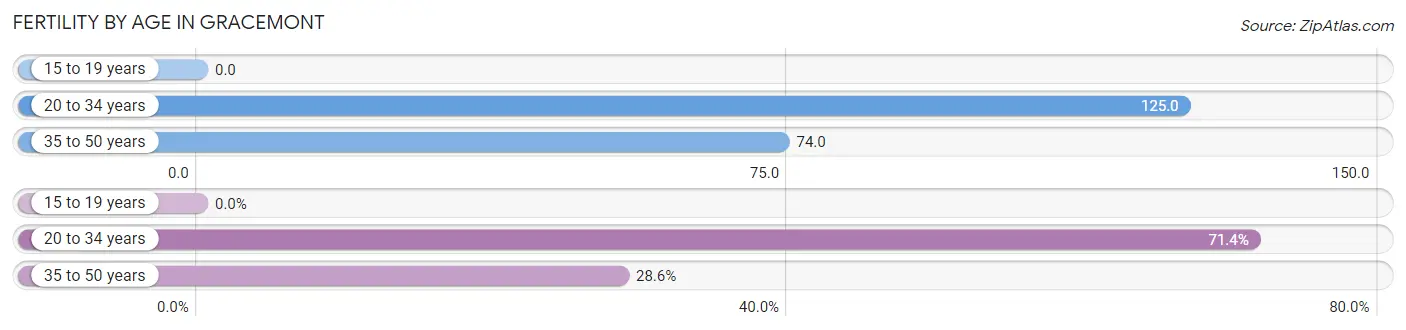
| Age Bracket | Women with Births | Births / 1,000 Women |
| 15 to 19 years | 0 (0.0%) | 0.0 |
| 20 to 34 years | 5 (71.4%) | 125.0 |
| 35 to 50 years | 2 (28.6%) | 74.0 |
| Total | 7 (100.0%) | 97.0 |
Fertility by Age by Marriage Status in Gracemont
57.1% of women with births (7) in Gracemont are married. The highest percentage of unmarried women with births falls into 20 to 34 years age bracket with 60.0% of them unmarried at the time of birth, while the lowest percentage of unmarried women with births belong to 35 to 50 years age bracket with 0.0% of them unmarried.
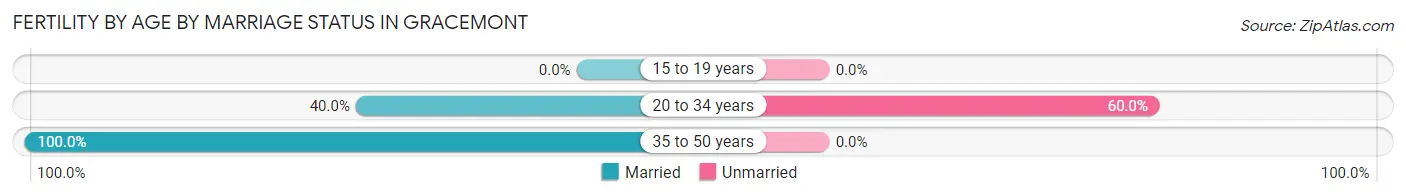
| Age Bracket | Married | Unmarried |
| 15 to 19 years | 0 (0.0%) | 0 (0.0%) |
| 20 to 34 years | 2 (40.0%) | 3 (60.0%) |
| 35 to 50 years | 2 (100.0%) | 0 (0.0%) |
| Total | 4 (57.1%) | 3 (42.9%) |
Fertility by Education in Gracemont
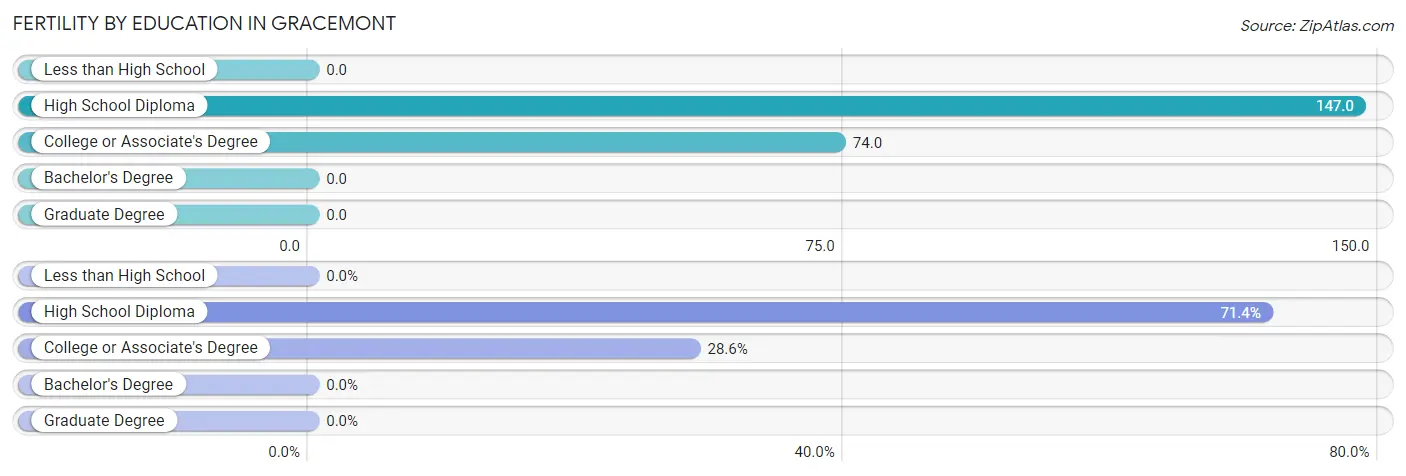
| Educational Attainment | Women with Births | Births / 1,000 Women |
| Less than High School | 0 (0.0%) | 0.0 |
| High School Diploma | 5 (71.4%) | 147.0 |
| College or Associate's Degree | 2 (28.6%) | 74.0 |
| Bachelor's Degree | 0 (0.0%) | 0.0 |
| Graduate Degree | 0 (0.0%) | 0.0 |
| Total | 7 (100.0%) | 97.0 |
Fertility by Education by Marriage Status in Gracemont
42.9% of women with births in Gracemont are unmarried. Women with the educational attainment of high school diploma are most likely to be married with 60.0% of them married at childbirth, while women with the educational attainment of college or associate's degree are least likely to be married with 50.0% of them unmarried at childbirth.
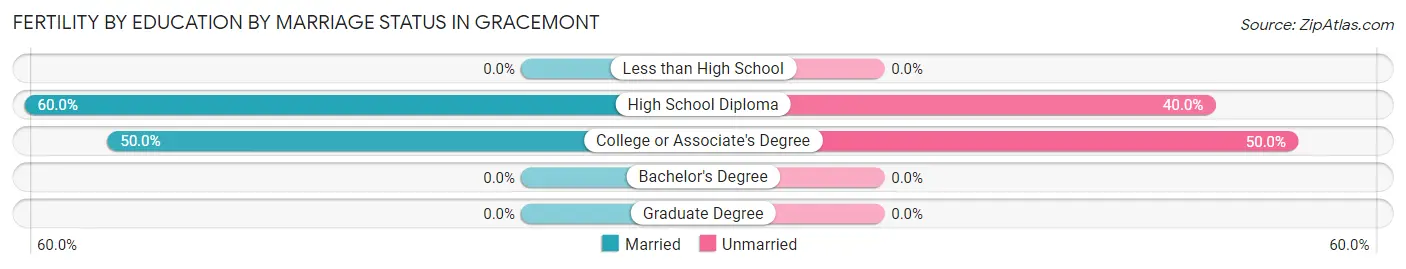
| Educational Attainment | Married | Unmarried |
| Less than High School | 0 (0.0%) | 0 (0.0%) |
| High School Diploma | 3 (60.0%) | 2 (40.0%) |
| College or Associate's Degree | 1 (50.0%) | 1 (50.0%) |
| Bachelor's Degree | 0 (0.0%) | 0 (0.0%) |
| Graduate Degree | 0 (0.0%) | 0 (0.0%) |
| Total | 4 (57.1%) | 3 (42.9%) |
Employment Characteristics in Gracemont
Employment by Class of Employer in Gracemont
Among the 116 employed individuals in Gracemont, private company employees (69 | 59.5%), local government employees (23 | 19.8%), and federal government employees (8 | 6.9%) make up the most common classes of employment.
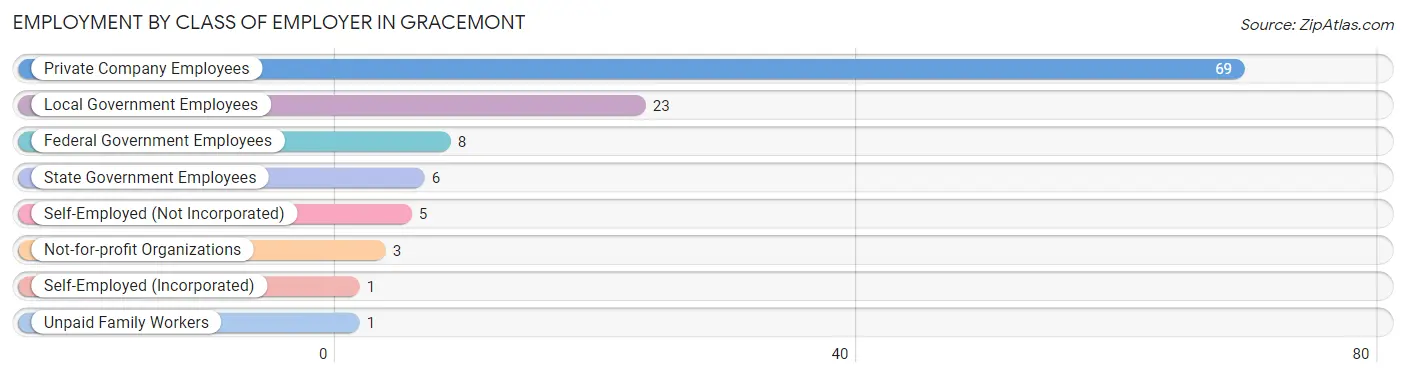
| Employer Class | # Employees | % Employees |
| Private Company Employees | 69 | 59.5% |
| Self-Employed (Incorporated) | 1 | 0.9% |
| Self-Employed (Not Incorporated) | 5 | 4.3% |
| Not-for-profit Organizations | 3 | 2.6% |
| Local Government Employees | 23 | 19.8% |
| State Government Employees | 6 | 5.2% |
| Federal Government Employees | 8 | 6.9% |
| Unpaid Family Workers | 1 | 0.9% |
| Total | 116 | 100.0% |
Employment Status by Age in Gracemont
According to the labor force statistics for Gracemont, out of the total population over 16 years of age (210), 58.6% or 123 individuals are in the labor force, with 4.9% or 6 of them unemployed. The age group with the highest labor force participation rate is 25 to 29 years, with 92.0% or 23 individuals in the labor force. Within the labor force, the 25 to 29 years age range has the highest percentage of unemployed individuals, with 17.4% or 4 of them being unemployed.
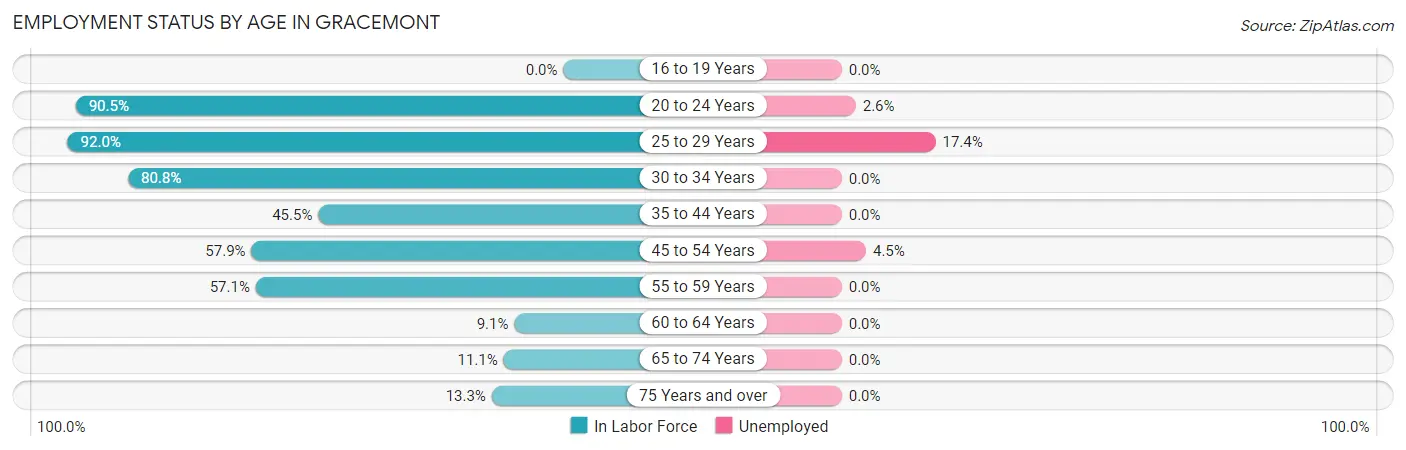
| Age Bracket | In Labor Force | Unemployed |
| 16 to 19 Years | 0 (0.0%) | 0 (0.0%) |
| 20 to 24 Years | 38 (90.5%) | 1 (2.6%) |
| 25 to 29 Years | 23 (92.0%) | 4 (17.4%) |
| 30 to 34 Years | 21 (80.8%) | 0 (0.0%) |
| 35 to 44 Years | 10 (45.5%) | 0 (0.0%) |
| 45 to 54 Years | 22 (57.9%) | 1 (4.5%) |
| 55 to 59 Years | 4 (57.1%) | 0 (0.0%) |
| 60 to 64 Years | 1 (9.1%) | 0 (0.0%) |
| 65 to 74 Years | 2 (11.1%) | 0 (0.0%) |
| 75 Years and over | 2 (13.3%) | 0 (0.0%) |
| Total | 123 (58.6%) | 6 (4.9%) |
Employment Status by Educational Attainment in Gracemont
According to labor force statistics for Gracemont, 62.8% of individuals (81) out of the total population between 25 and 64 years of age (129) are in the labor force, with 6.2% or 5 of them being unemployed. The group with the highest labor force participation rate are those with the educational attainment of bachelor's degree or higher, with 100.0% or 1 individuals in the labor force. Within the labor force, individuals with less than high school education have the highest percentage of unemployment, with 28.6% or 2 of them being unemployed.
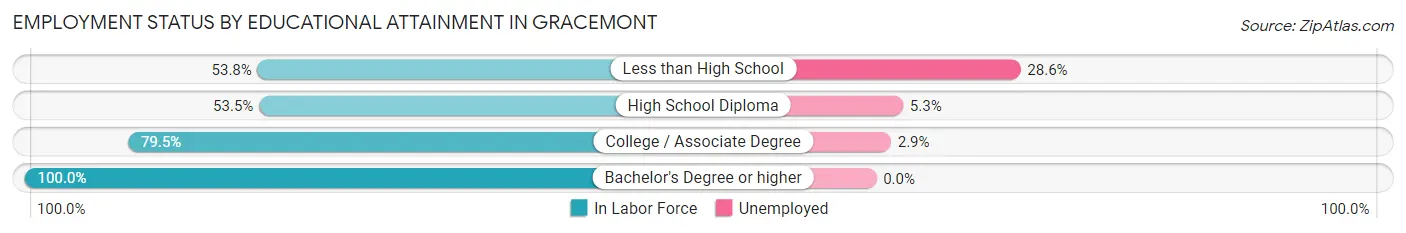
| Educational Attainment | In Labor Force | Unemployed |
| Less than High School | 7 (53.8%) | 4 (28.6%) |
| High School Diploma | 38 (53.5%) | 4 (5.3%) |
| College / Associate Degree | 35 (79.5%) | 1 (2.9%) |
| Bachelor's Degree or higher | 1 (100.0%) | 0 (0.0%) |
| Total | 81 (62.8%) | 8 (6.2%) |
Employment Occupations by Sex in Gracemont
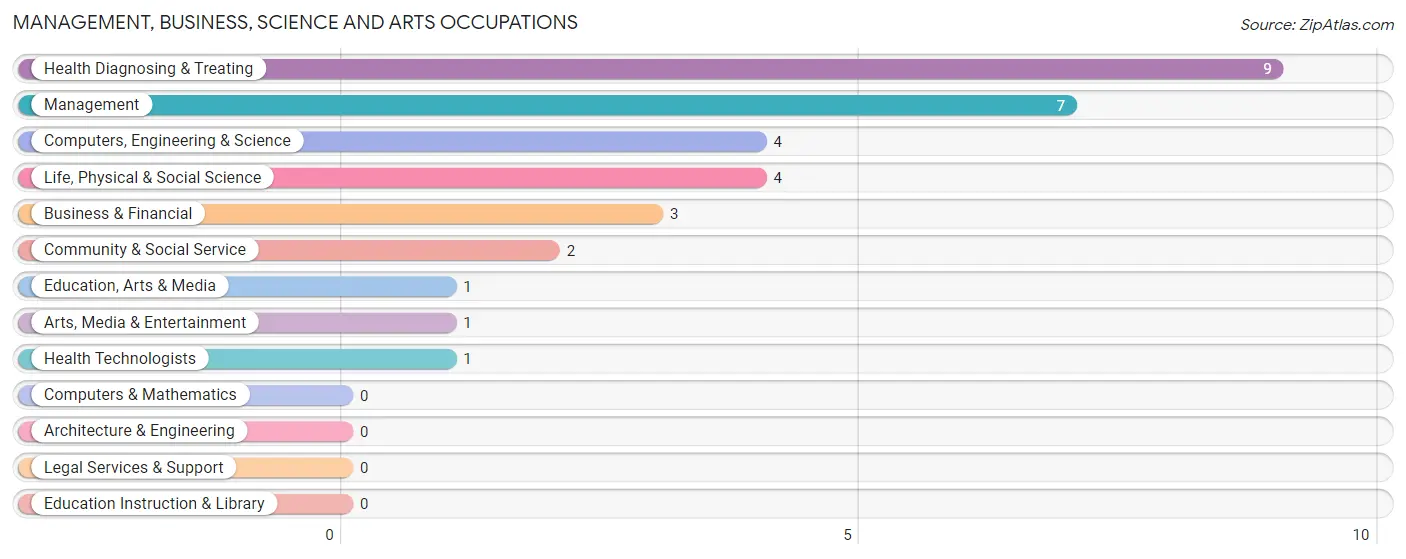
Management, Business, Science and Arts Occupations
The most common Management, Business, Science and Arts occupations in Gracemont are Health Diagnosing & Treating (9 | 7.7%), Management (7 | 6.0%), Computers, Engineering & Science (4 | 3.4%), Life, Physical & Social Science (4 | 3.4%), and Business & Financial (3 | 2.6%).
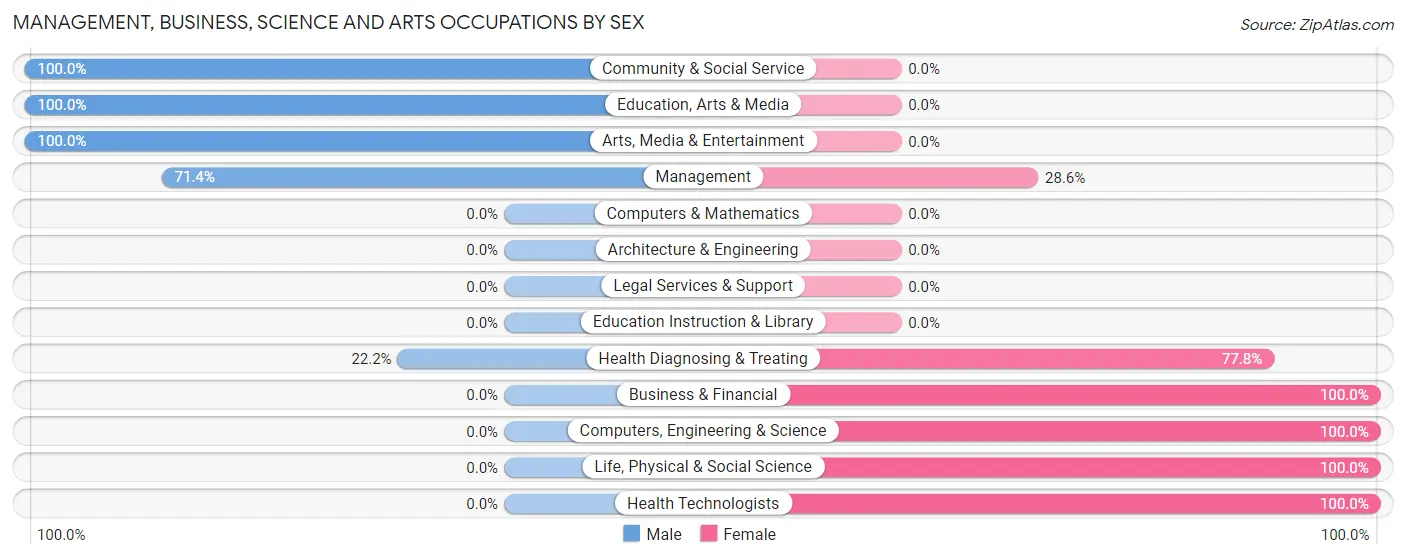
Management, Business, Science and Arts Occupations by Sex
Within the Management, Business, Science and Arts occupations in Gracemont, the most male-oriented occupations are Community & Social Service (100.0%), Education, Arts & Media (100.0%), and Arts, Media & Entertainment (100.0%), while the most female-oriented occupations are Business & Financial (100.0%), Computers, Engineering & Science (100.0%), and Life, Physical & Social Science (100.0%).
| Occupation | Male | Female |
| Management | 5 (71.4%) | 2 (28.6%) |
| Business & Financial | 0 (0.0%) | 3 (100.0%) |
| Computers, Engineering & Science | 0 (0.0%) | 4 (100.0%) |
| Computers & Mathematics | 0 (0.0%) | 0 (0.0%) |
| Architecture & Engineering | 0 (0.0%) | 0 (0.0%) |
| Life, Physical & Social Science | 0 (0.0%) | 4 (100.0%) |
| Community & Social Service | 2 (100.0%) | 0 (0.0%) |
| Education, Arts & Media | 1 (100.0%) | 0 (0.0%) |
| Legal Services & Support | 0 (0.0%) | 0 (0.0%) |
| Education Instruction & Library | 0 (0.0%) | 0 (0.0%) |
| Arts, Media & Entertainment | 1 (100.0%) | 0 (0.0%) |
| Health Diagnosing & Treating | 2 (22.2%) | 7 (77.8%) |
| Health Technologists | 0 (0.0%) | 1 (100.0%) |
| Total (Category) | 9 (36.0%) | 16 (64.0%) |
| Total (Overall) | 68 (58.1%) | 49 (41.9%) |
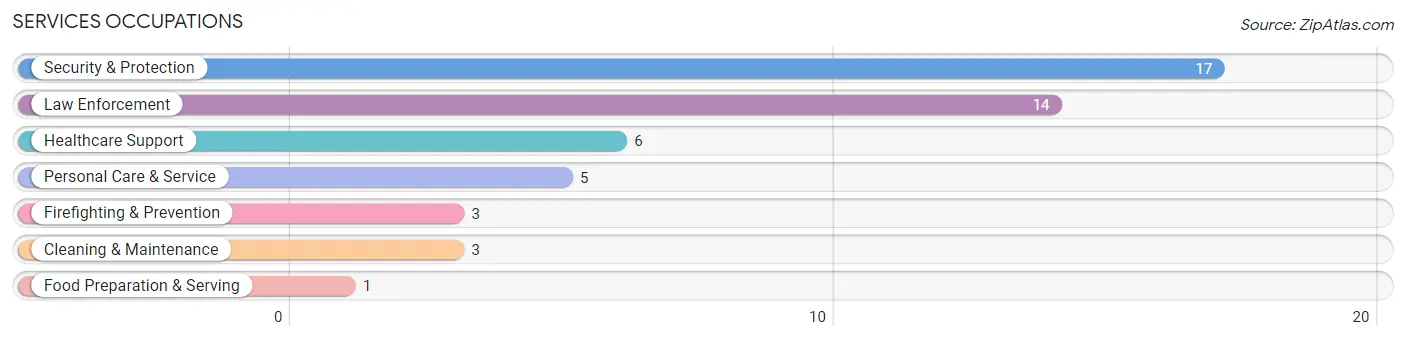
Services Occupations
The most common Services occupations in Gracemont are Security & Protection (17 | 14.5%), Law Enforcement (14 | 12.0%), Healthcare Support (6 | 5.1%), Personal Care & Service (5 | 4.3%), and Firefighting & Prevention (3 | 2.6%).
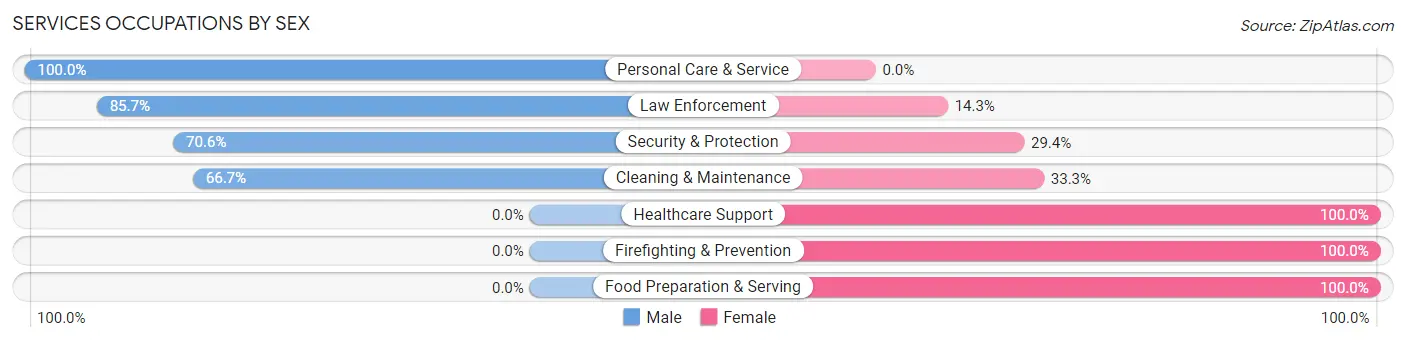
Services Occupations by Sex
Within the Services occupations in Gracemont, the most male-oriented occupations are Personal Care & Service (100.0%), Law Enforcement (85.7%), and Security & Protection (70.6%), while the most female-oriented occupations are Healthcare Support (100.0%), Firefighting & Prevention (100.0%), and Food Preparation & Serving (100.0%).
| Occupation | Male | Female |
| Healthcare Support | 0 (0.0%) | 6 (100.0%) |
| Security & Protection | 12 (70.6%) | 5 (29.4%) |
| Firefighting & Prevention | 0 (0.0%) | 3 (100.0%) |
| Law Enforcement | 12 (85.7%) | 2 (14.3%) |
| Food Preparation & Serving | 0 (0.0%) | 1 (100.0%) |
| Cleaning & Maintenance | 2 (66.7%) | 1 (33.3%) |
| Personal Care & Service | 5 (100.0%) | 0 (0.0%) |
| Total (Category) | 19 (59.4%) | 13 (40.6%) |
| Total (Overall) | 68 (58.1%) | 49 (41.9%) |
Sales and Office Occupations
The most common Sales and Office occupations in Gracemont are Office & Administration (14 | 12.0%), and Sales & Related (6 | 5.1%).
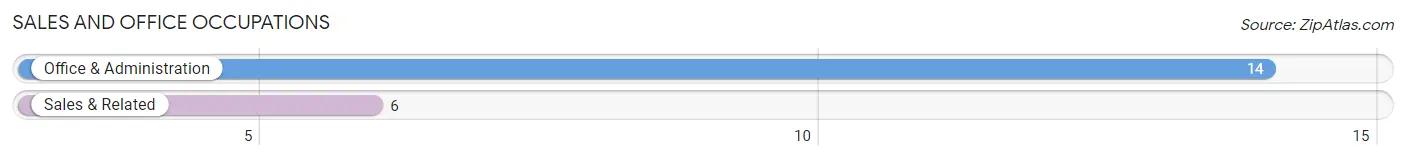
Sales and Office Occupations by Sex
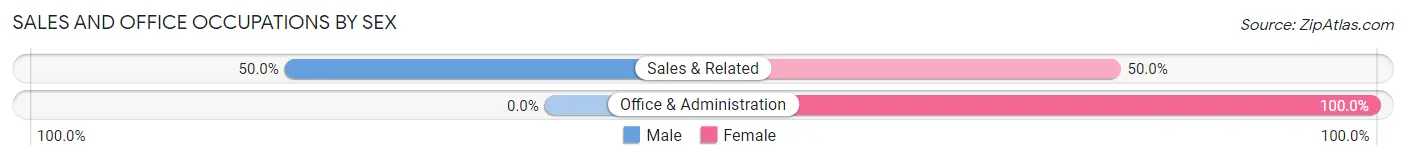
| Occupation | Male | Female |
| Sales & Related | 3 (50.0%) | 3 (50.0%) |
| Office & Administration | 0 (0.0%) | 14 (100.0%) |
| Total (Category) | 3 (15.0%) | 17 (85.0%) |
| Total (Overall) | 68 (58.1%) | 49 (41.9%) |
Natural Resources, Construction and Maintenance Occupations
The most common Natural Resources, Construction and Maintenance occupations in Gracemont are Construction & Extraction (12 | 10.3%), Installation, Maintenance & Repair (10 | 8.6%), and Farming, Fishing & Forestry (4 | 3.4%).
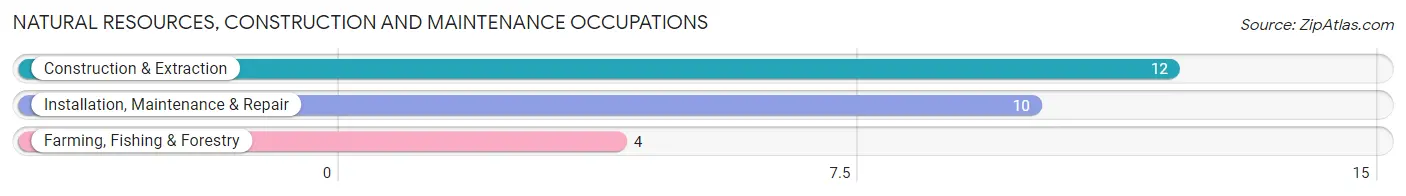
Natural Resources, Construction and Maintenance Occupations by Sex
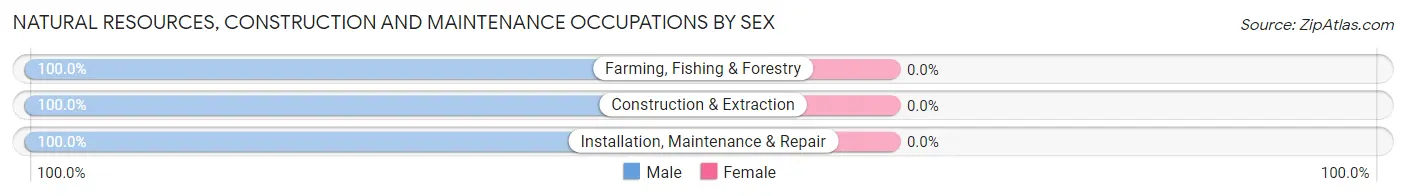
| Occupation | Male | Female |
| Farming, Fishing & Forestry | 4 (100.0%) | 0 (0.0%) |
| Construction & Extraction | 12 (100.0%) | 0 (0.0%) |
| Installation, Maintenance & Repair | 10 (100.0%) | 0 (0.0%) |
| Total (Category) | 26 (100.0%) | 0 (0.0%) |
| Total (Overall) | 68 (58.1%) | 49 (41.9%) |
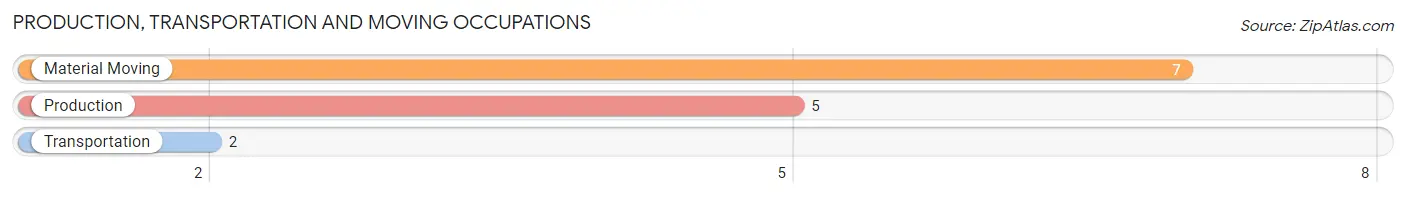
Production, Transportation and Moving Occupations
The most common Production, Transportation and Moving occupations in Gracemont are Material Moving (7 | 6.0%), Production (5 | 4.3%), and Transportation (2 | 1.7%).
Production, Transportation and Moving Occupations by Sex
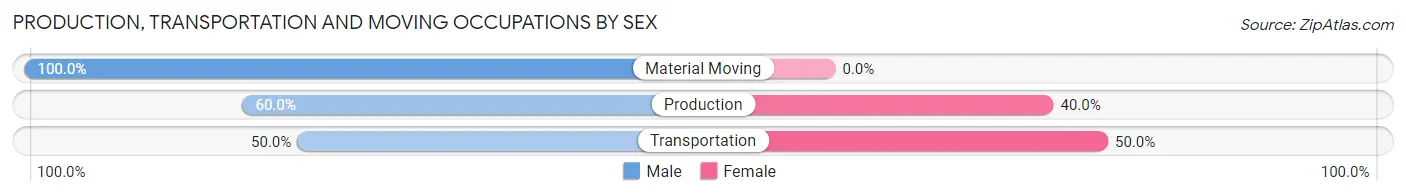
| Occupation | Male | Female |
| Production | 3 (60.0%) | 2 (40.0%) |
| Transportation | 1 (50.0%) | 1 (50.0%) |
| Material Moving | 7 (100.0%) | 0 (0.0%) |
| Total (Category) | 11 (78.6%) | 3 (21.4%) |
| Total (Overall) | 68 (58.1%) | 49 (41.9%) |
Employment Industries by Sex in Gracemont
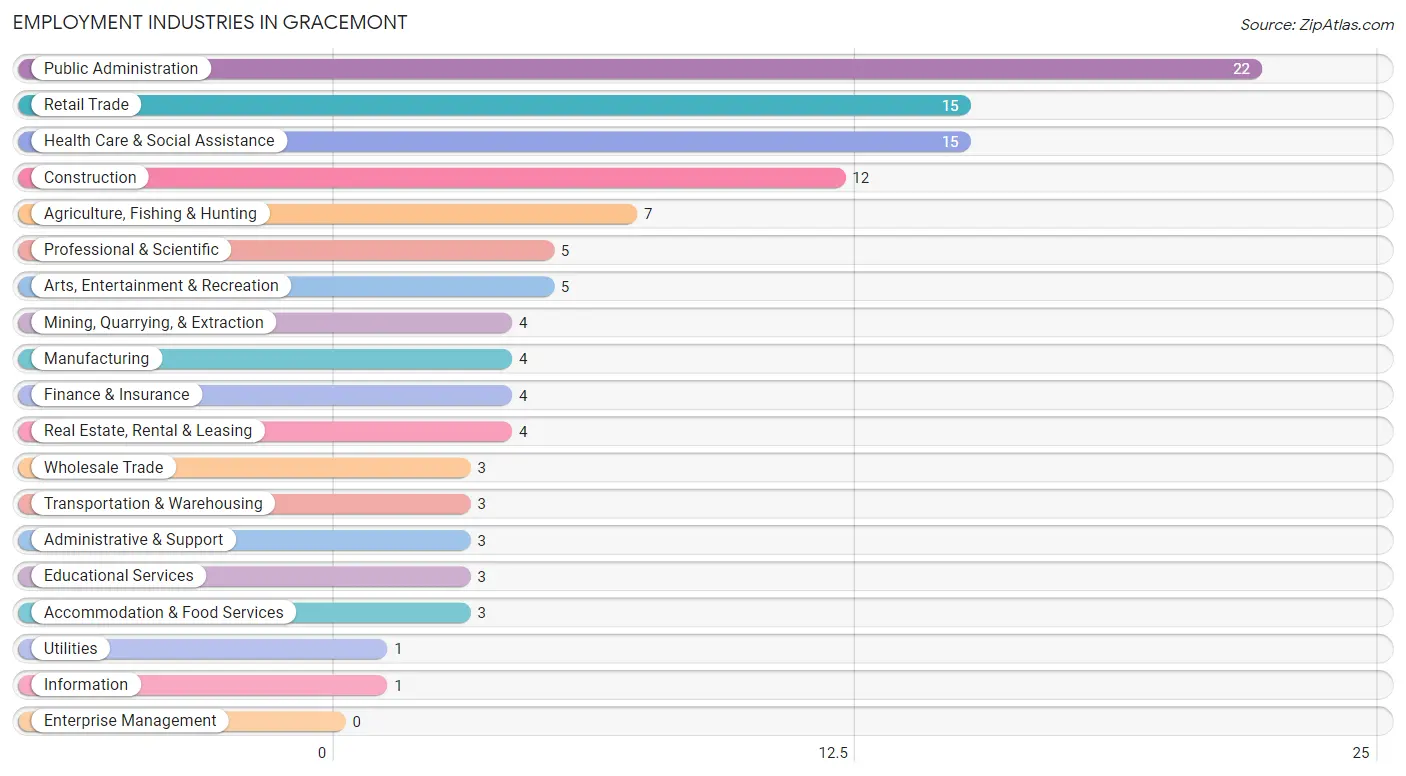
Employment Industries in Gracemont
The major employment industries in Gracemont include Public Administration (22 | 18.8%), Retail Trade (15 | 12.8%), Health Care & Social Assistance (15 | 12.8%), Construction (12 | 10.3%), and Agriculture, Fishing & Hunting (7 | 6.0%).
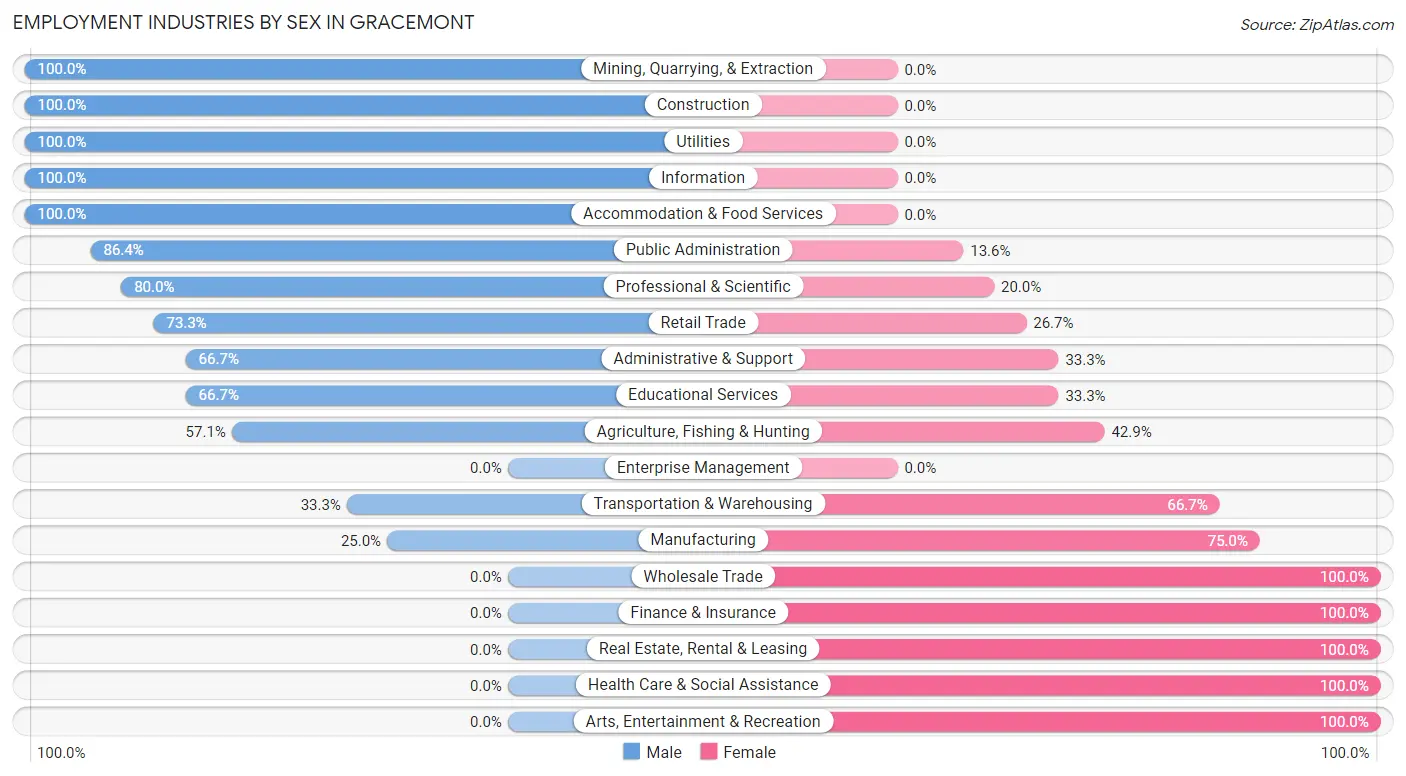
Employment Industries by Sex in Gracemont
The Gracemont industries that see more men than women are Mining, Quarrying, & Extraction (100.0%), Construction (100.0%), and Utilities (100.0%), whereas the industries that tend to have a higher number of women are Wholesale Trade (100.0%), Finance & Insurance (100.0%), and Real Estate, Rental & Leasing (100.0%).
| Industry | Male | Female |
| Agriculture, Fishing & Hunting | 4 (57.1%) | 3 (42.9%) |
| Mining, Quarrying, & Extraction | 4 (100.0%) | 0 (0.0%) |
| Construction | 12 (100.0%) | 0 (0.0%) |
| Manufacturing | 1 (25.0%) | 3 (75.0%) |
| Wholesale Trade | 0 (0.0%) | 3 (100.0%) |
| Retail Trade | 11 (73.3%) | 4 (26.7%) |
| Transportation & Warehousing | 1 (33.3%) | 2 (66.7%) |
| Utilities | 1 (100.0%) | 0 (0.0%) |
| Information | 1 (100.0%) | 0 (0.0%) |
| Finance & Insurance | 0 (0.0%) | 4 (100.0%) |
| Real Estate, Rental & Leasing | 0 (0.0%) | 4 (100.0%) |
| Professional & Scientific | 4 (80.0%) | 1 (20.0%) |
| Enterprise Management | 0 (0.0%) | 0 (0.0%) |
| Administrative & Support | 2 (66.7%) | 1 (33.3%) |
| Educational Services | 2 (66.7%) | 1 (33.3%) |
| Health Care & Social Assistance | 0 (0.0%) | 15 (100.0%) |
| Arts, Entertainment & Recreation | 0 (0.0%) | 5 (100.0%) |
| Accommodation & Food Services | 3 (100.0%) | 0 (0.0%) |
| Public Administration | 19 (86.4%) | 3 (13.6%) |
| Total | 68 (58.1%) | 49 (41.9%) |
Education in Gracemont
School Enrollment in Gracemont
The most common levels of schooling among the 80 students in Gracemont are middle school (22 | 27.5%), elementary school (19 | 23.7%), and college / undergraduate (16 | 20.0%).
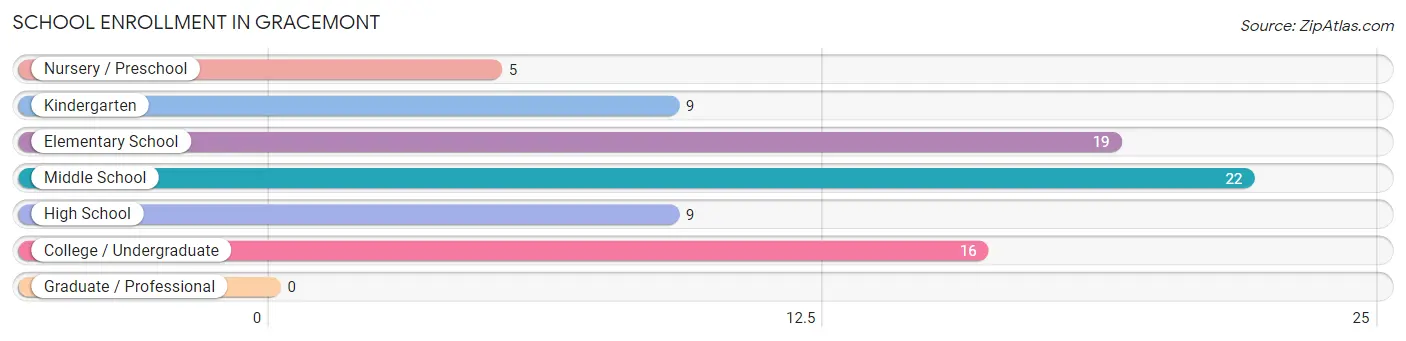
| School Level | # Students | % Students |
| Nursery / Preschool | 5 | 6.2% |
| Kindergarten | 9 | 11.3% |
| Elementary School | 19 | 23.7% |
| Middle School | 22 | 27.5% |
| High School | 9 | 11.3% |
| College / Undergraduate | 16 | 20.0% |
| Graduate / Professional | 0 | 0.0% |
| Total | 80 | 100.0% |
School Enrollment by Age by Funding Source in Gracemont
Out of a total of 80 students who are enrolled in schools in Gracemont, 9 (11.3%) attend a private institution, while the remaining 71 (88.7%) are enrolled in public schools. The age group of 15 to 17 year olds has the highest likelihood of being enrolled in private schools, with 3 (50.0% in the age bracket) enrolled. Conversely, the age group of 3 to 4 year olds has the lowest likelihood of being enrolled in a private school, with 1 (100.0% in the age bracket) attending a public institution.
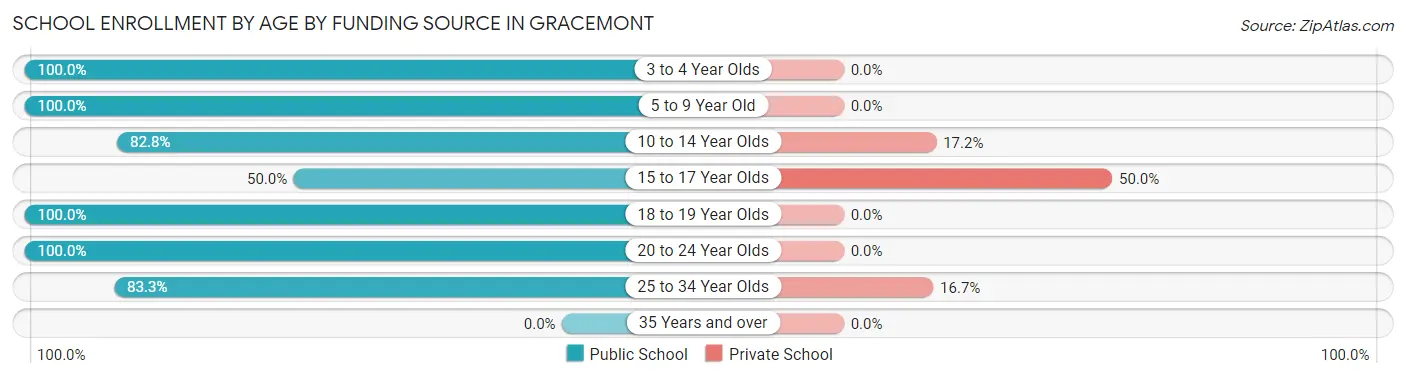
| Age Bracket | Public School | Private School |
| 3 to 4 Year Olds | 1 (100.0%) | 0 (0.0%) |
| 5 to 9 Year Old | 26 (100.0%) | 0 (0.0%) |
| 10 to 14 Year Olds | 24 (82.8%) | 5 (17.2%) |
| 15 to 17 Year Olds | 3 (50.0%) | 3 (50.0%) |
| 18 to 19 Year Olds | 2 (100.0%) | 0 (0.0%) |
| 20 to 24 Year Olds | 10 (100.0%) | 0 (0.0%) |
| 25 to 34 Year Olds | 5 (83.3%) | 1 (16.7%) |
| 35 Years and over | 0 (0.0%) | 0 (0.0%) |
| Total | 71 (88.8%) | 9 (11.3%) |
Educational Attainment by Field of Study in Gracemont
Business (2 | 50.0%), social sciences (1 | 25.0%), and science & technology (1 | 25.0%) are the most common fields of study among 4 individuals in Gracemont who have obtained a bachelor's degree or higher.
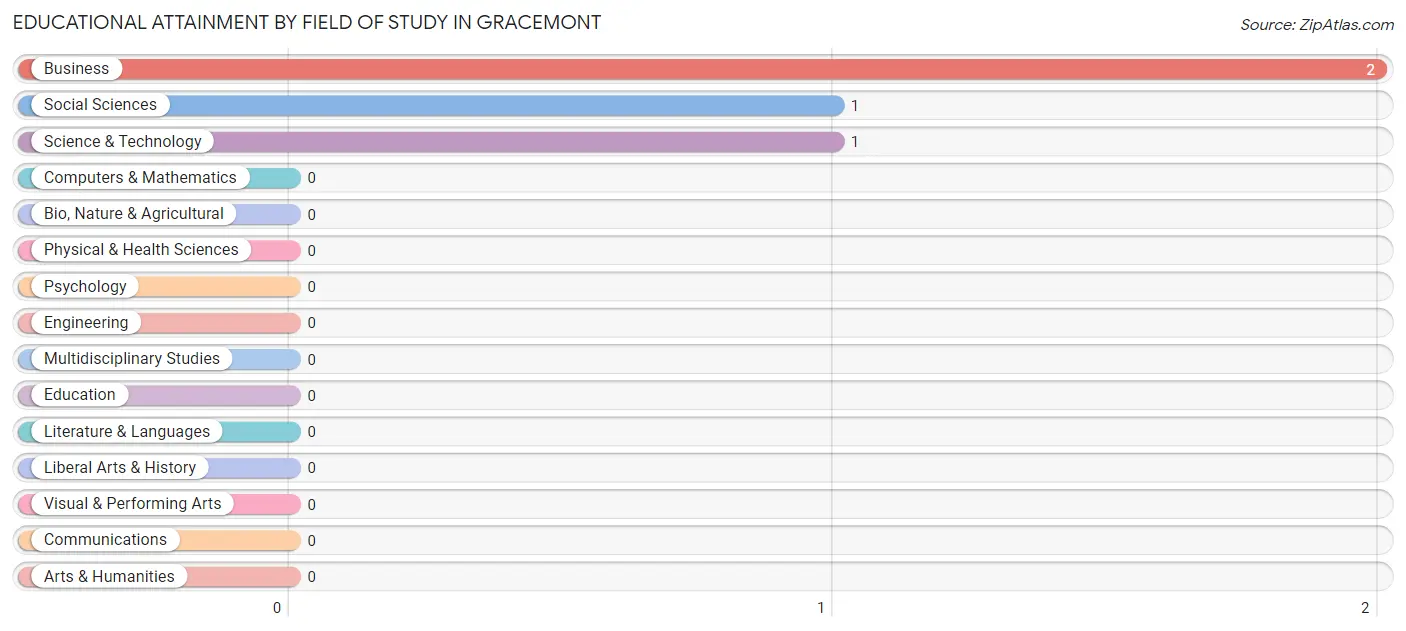
| Field of Study | # Graduates | % Graduates |
| Computers & Mathematics | 0 | 0.0% |
| Bio, Nature & Agricultural | 0 | 0.0% |
| Physical & Health Sciences | 0 | 0.0% |
| Psychology | 0 | 0.0% |
| Social Sciences | 1 | 25.0% |
| Engineering | 0 | 0.0% |
| Multidisciplinary Studies | 0 | 0.0% |
| Science & Technology | 1 | 25.0% |
| Business | 2 | 50.0% |
| Education | 0 | 0.0% |
| Literature & Languages | 0 | 0.0% |
| Liberal Arts & History | 0 | 0.0% |
| Visual & Performing Arts | 0 | 0.0% |
| Communications | 0 | 0.0% |
| Arts & Humanities | 0 | 0.0% |
| Total | 4 | 100.0% |
Transportation & Commute in Gracemont
Vehicle Availability by Sex in Gracemont
The most prevalent vehicle ownership categories in Gracemont are males with 2 vehicles (22, accounting for 32.8%) and females with 2 vehicles (21, making up 44.9%).
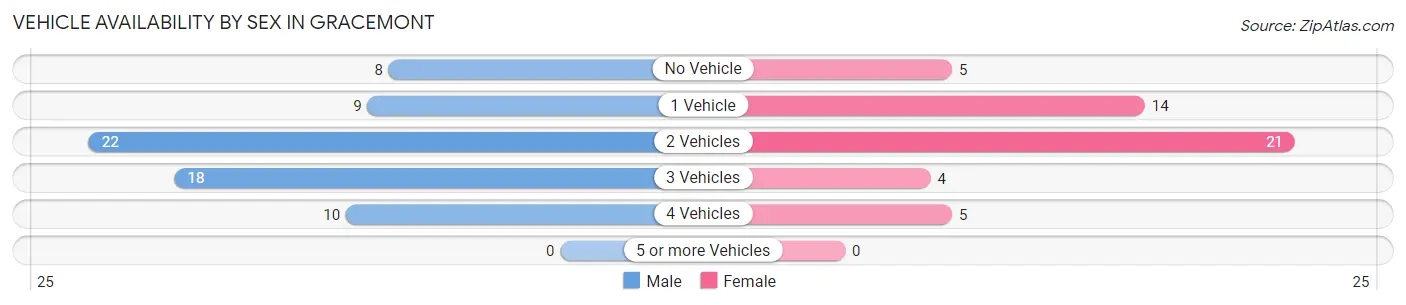
| Vehicles Available | Male | Female |
| No Vehicle | 8 (11.9%) | 5 (10.2%) |
| 1 Vehicle | 9 (13.4%) | 14 (28.6%) |
| 2 Vehicles | 22 (32.8%) | 21 (42.9%) |
| 3 Vehicles | 18 (26.9%) | 4 (8.2%) |
| 4 Vehicles | 10 (14.9%) | 5 (10.2%) |
| 5 or more Vehicles | 0 (0.0%) | 0 (0.0%) |
| Total | 67 (100.0%) | 49 (100.0%) |
Commute Time in Gracemont
The most frequently occuring commute durations in Gracemont are 10 to 14 minutes (23 commuters, 21.1%), less than 5 minutes (17 commuters, 15.6%), and 15 to 19 minutes (13 commuters, 11.9%).
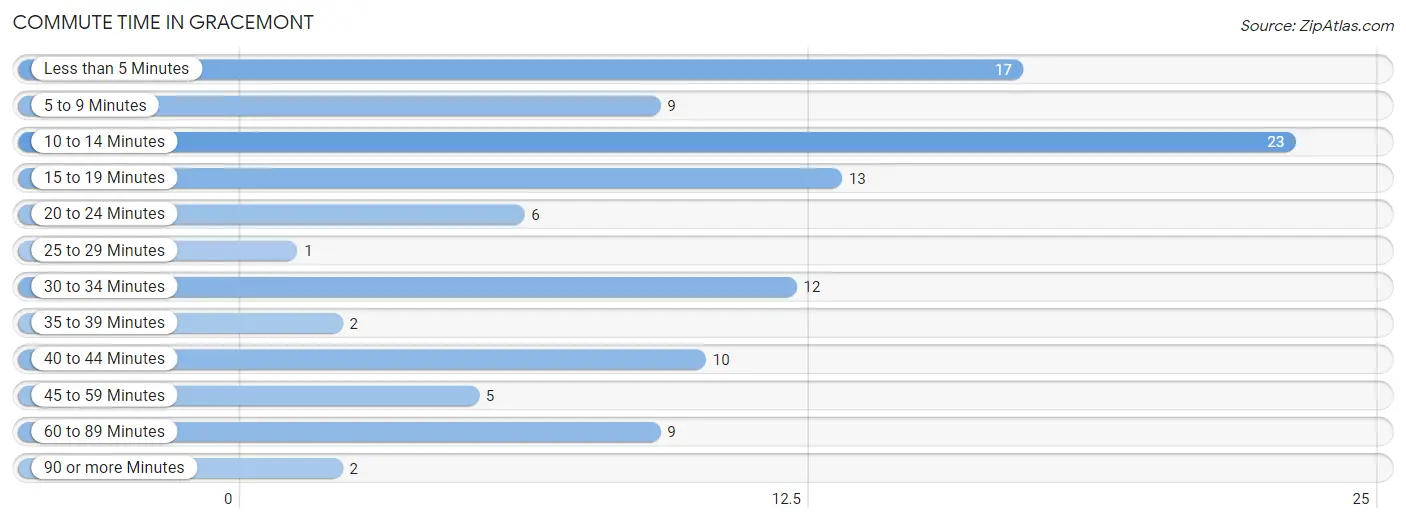
| Commute Time | # Commuters | % Commuters |
| Less than 5 Minutes | 17 | 15.6% |
| 5 to 9 Minutes | 9 | 8.3% |
| 10 to 14 Minutes | 23 | 21.1% |
| 15 to 19 Minutes | 13 | 11.9% |
| 20 to 24 Minutes | 6 | 5.5% |
| 25 to 29 Minutes | 1 | 0.9% |
| 30 to 34 Minutes | 12 | 11.0% |
| 35 to 39 Minutes | 2 | 1.8% |
| 40 to 44 Minutes | 10 | 9.2% |
| 45 to 59 Minutes | 5 | 4.6% |
| 60 to 89 Minutes | 9 | 8.3% |
| 90 or more Minutes | 2 | 1.8% |
Commute Time by Sex in Gracemont
The most common commute times in Gracemont are less than 5 minutes (11 commuters, 18.0%) for males and 10 to 14 minutes (15 commuters, 31.2%) for females.
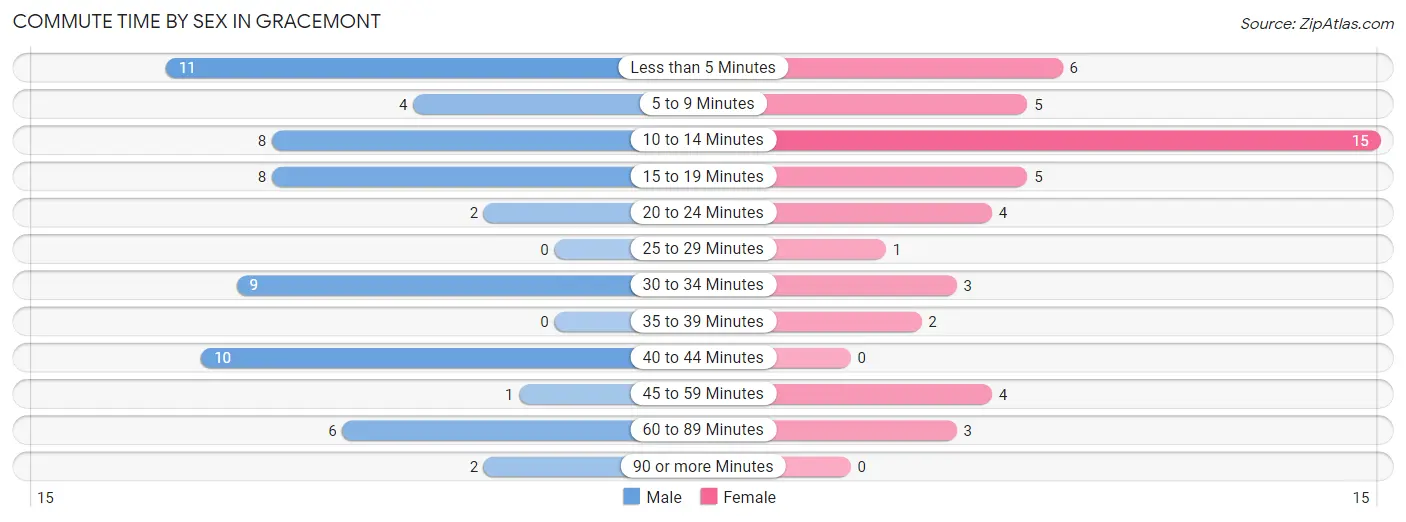
| Commute Time | Male | Female |
| Less than 5 Minutes | 11 (18.0%) | 6 (12.5%) |
| 5 to 9 Minutes | 4 (6.6%) | 5 (10.4%) |
| 10 to 14 Minutes | 8 (13.1%) | 15 (31.2%) |
| 15 to 19 Minutes | 8 (13.1%) | 5 (10.4%) |
| 20 to 24 Minutes | 2 (3.3%) | 4 (8.3%) |
| 25 to 29 Minutes | 0 (0.0%) | 1 (2.1%) |
| 30 to 34 Minutes | 9 (14.7%) | 3 (6.2%) |
| 35 to 39 Minutes | 0 (0.0%) | 2 (4.2%) |
| 40 to 44 Minutes | 10 (16.4%) | 0 (0.0%) |
| 45 to 59 Minutes | 1 (1.6%) | 4 (8.3%) |
| 60 to 89 Minutes | 6 (9.8%) | 3 (6.2%) |
| 90 or more Minutes | 2 (3.3%) | 0 (0.0%) |
Time of Departure to Work by Sex in Gracemont
The most frequent times of departure to work in Gracemont are 4:00 PM to 11:59 PM (24, 39.3%) for males and 7:30 AM to 7:59 AM (17, 35.4%) for females.
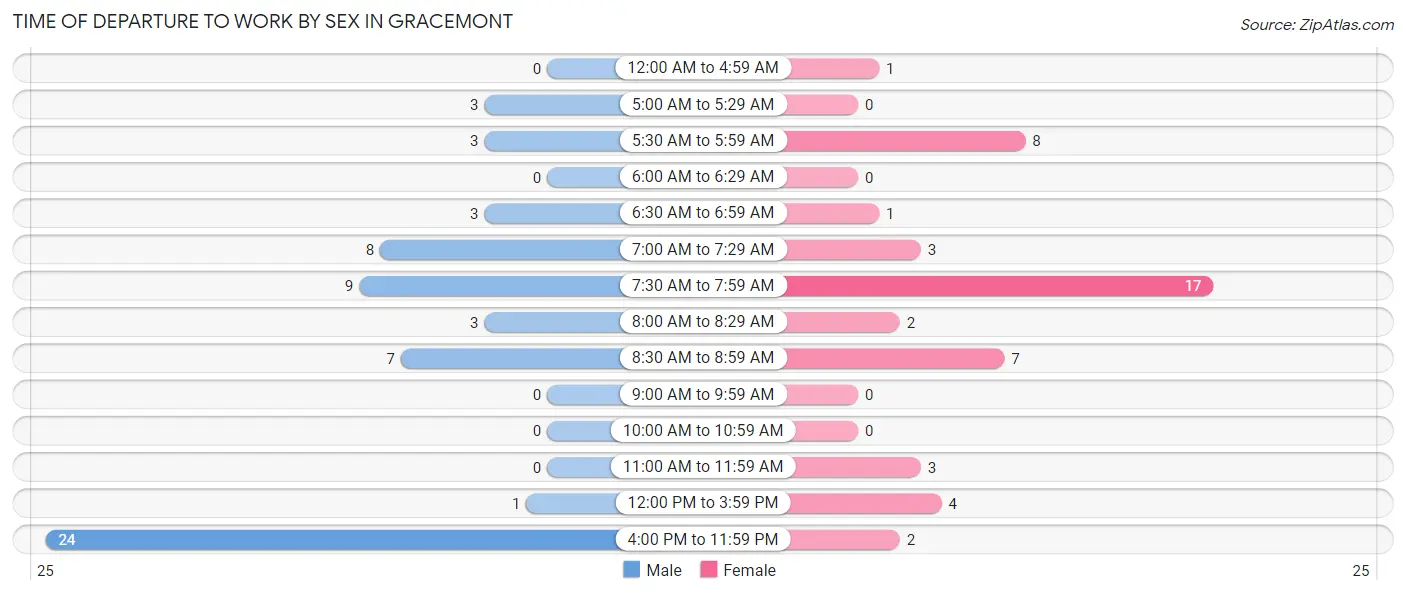
| Time of Departure | Male | Female |
| 12:00 AM to 4:59 AM | 0 (0.0%) | 1 (2.1%) |
| 5:00 AM to 5:29 AM | 3 (4.9%) | 0 (0.0%) |
| 5:30 AM to 5:59 AM | 3 (4.9%) | 8 (16.7%) |
| 6:00 AM to 6:29 AM | 0 (0.0%) | 0 (0.0%) |
| 6:30 AM to 6:59 AM | 3 (4.9%) | 1 (2.1%) |
| 7:00 AM to 7:29 AM | 8 (13.1%) | 3 (6.2%) |
| 7:30 AM to 7:59 AM | 9 (14.7%) | 17 (35.4%) |
| 8:00 AM to 8:29 AM | 3 (4.9%) | 2 (4.2%) |
| 8:30 AM to 8:59 AM | 7 (11.5%) | 7 (14.6%) |
| 9:00 AM to 9:59 AM | 0 (0.0%) | 0 (0.0%) |
| 10:00 AM to 10:59 AM | 0 (0.0%) | 0 (0.0%) |
| 11:00 AM to 11:59 AM | 0 (0.0%) | 3 (6.2%) |
| 12:00 PM to 3:59 PM | 1 (1.6%) | 4 (8.3%) |
| 4:00 PM to 11:59 PM | 24 (39.3%) | 2 (4.2%) |
| Total | 61 (100.0%) | 48 (100.0%) |
Housing Occupancy in Gracemont
Occupancy by Ownership in Gracemont
Of the total 94 dwellings in Gracemont, owner-occupied units account for 45 (47.9%), while renter-occupied units make up 49 (52.1%).
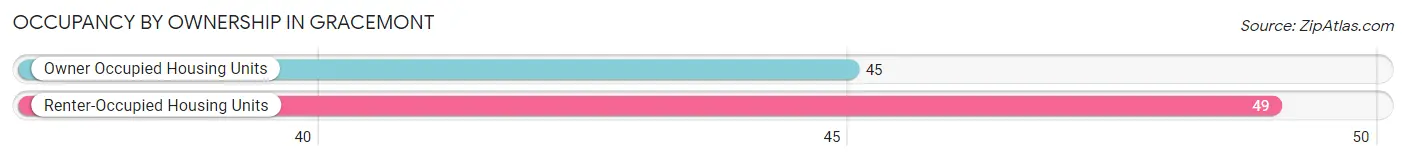
| Occupancy | # Housing Units | % Housing Units |
| Owner Occupied Housing Units | 45 | 47.9% |
| Renter-Occupied Housing Units | 49 | 52.1% |
| Total Occupied Housing Units | 94 | 100.0% |
Occupancy by Household Size in Gracemont
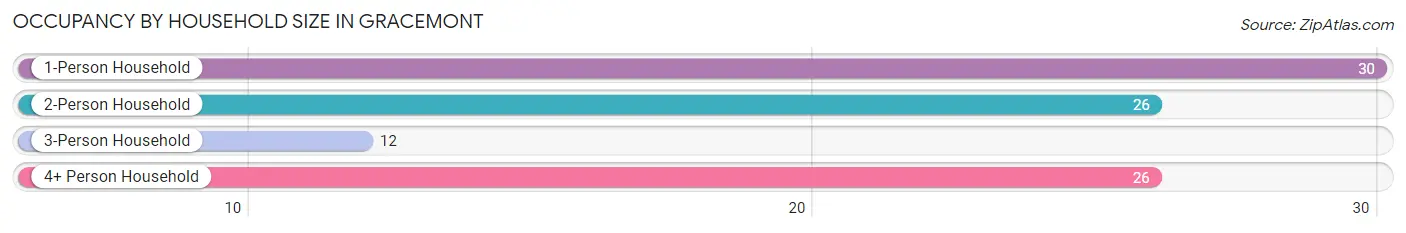
| Household Size | # Housing Units | % Housing Units |
| 1-Person Household | 30 | 31.9% |
| 2-Person Household | 26 | 27.7% |
| 3-Person Household | 12 | 12.8% |
| 4+ Person Household | 26 | 27.7% |
| Total Housing Units | 94 | 100.0% |
Occupancy by Ownership by Household Size in Gracemont
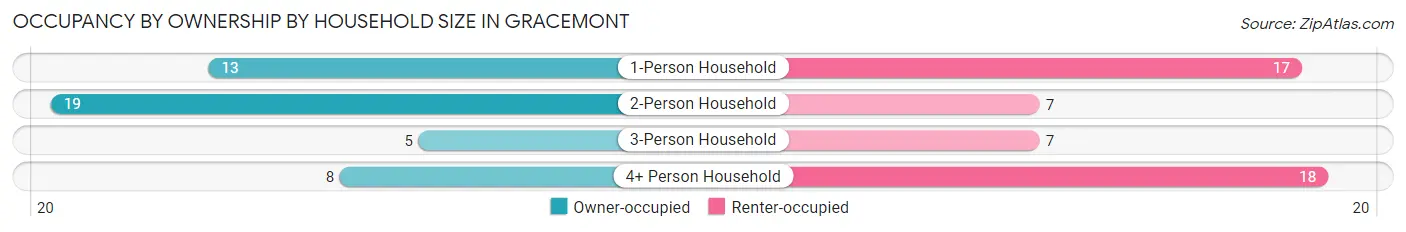
| Household Size | Owner-occupied | Renter-occupied |
| 1-Person Household | 13 (43.3%) | 17 (56.7%) |
| 2-Person Household | 19 (73.1%) | 7 (26.9%) |
| 3-Person Household | 5 (41.7%) | 7 (58.3%) |
| 4+ Person Household | 8 (30.8%) | 18 (69.2%) |
| Total Housing Units | 45 (47.9%) | 49 (52.1%) |
Occupancy by Educational Attainment in Gracemont
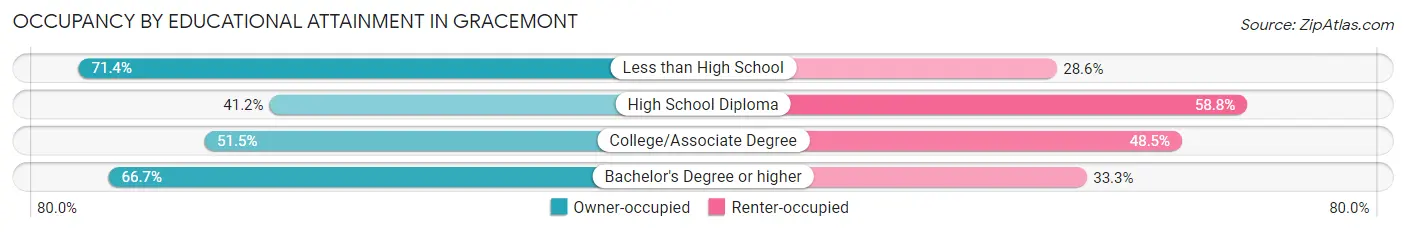
| Household Size | Owner-occupied | Renter-occupied |
| Less than High School | 5 (71.4%) | 2 (28.6%) |
| High School Diploma | 21 (41.2%) | 30 (58.8%) |
| College/Associate Degree | 17 (51.5%) | 16 (48.5%) |
| Bachelor's Degree or higher | 2 (66.7%) | 1 (33.3%) |
Occupancy by Age of Householder in Gracemont
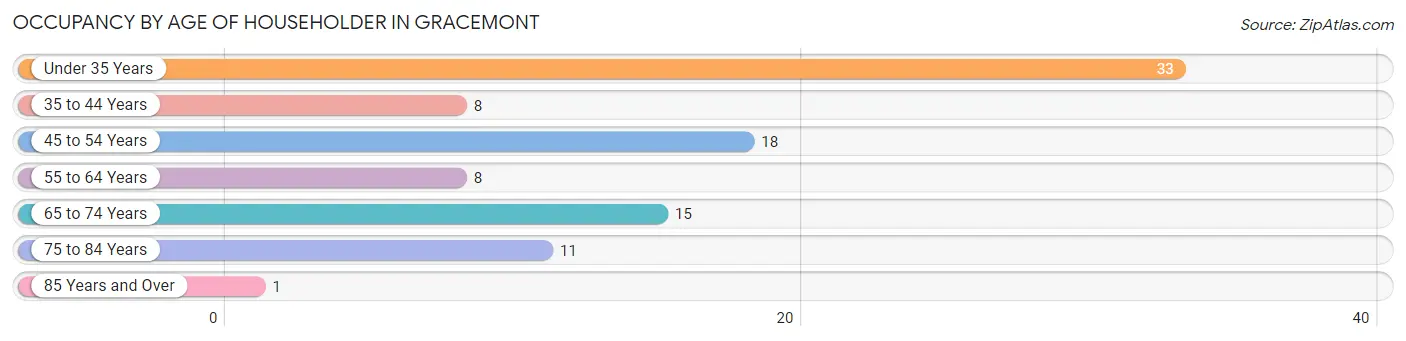
| Age Bracket | # Households | % Households |
| Under 35 Years | 33 | 35.1% |
| 35 to 44 Years | 8 | 8.5% |
| 45 to 54 Years | 18 | 19.2% |
| 55 to 64 Years | 8 | 8.5% |
| 65 to 74 Years | 15 | 16.0% |
| 75 to 84 Years | 11 | 11.7% |
| 85 Years and Over | 1 | 1.1% |
| Total | 94 | 100.0% |
Housing Finances in Gracemont
Median Income by Occupancy in Gracemont
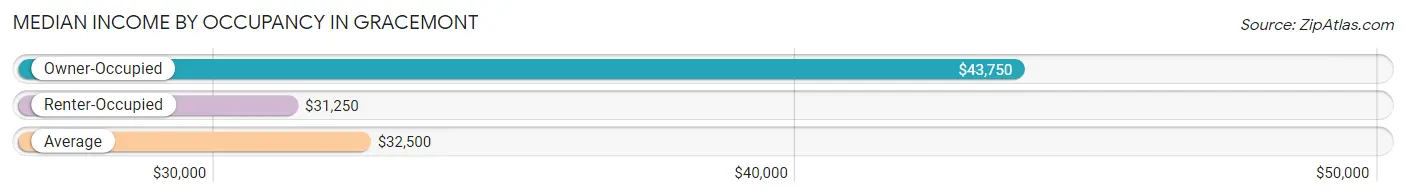
| Occupancy Type | # Households | Median Income |
| Owner-Occupied | 45 (47.9%) | $43,750 |
| Renter-Occupied | 49 (52.1%) | $31,250 |
| Average | 94 (100.0%) | $32,500 |
Occupancy by Householder Income Bracket in Gracemont
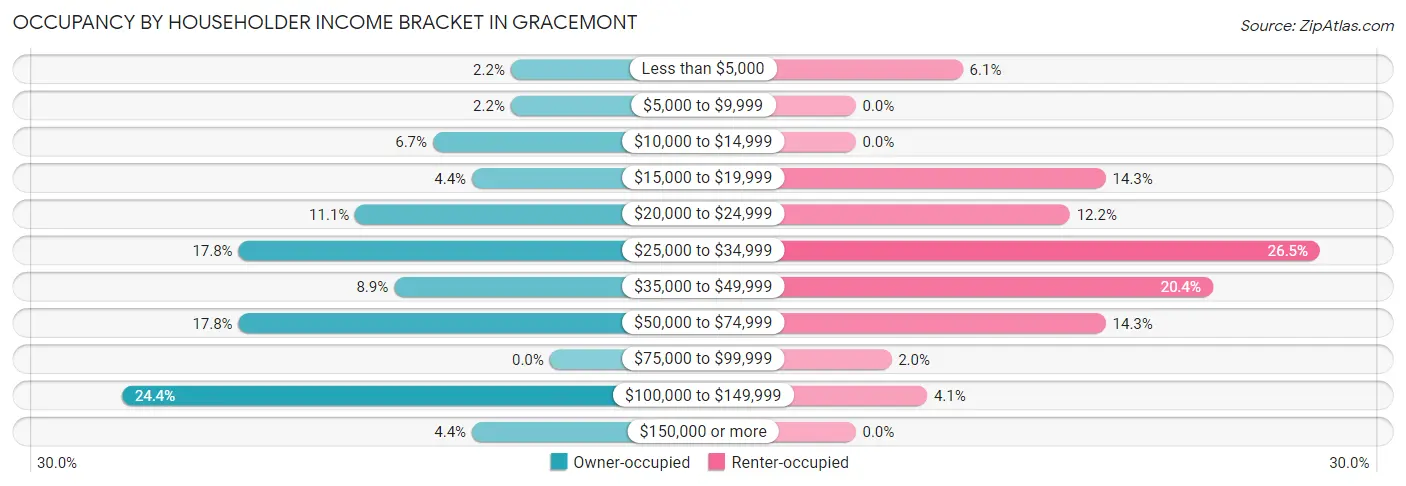
| Income Bracket | Owner-occupied | Renter-occupied |
| Less than $5,000 | 1 (2.2%) | 3 (6.1%) |
| $5,000 to $9,999 | 1 (2.2%) | 0 (0.0%) |
| $10,000 to $14,999 | 3 (6.7%) | 0 (0.0%) |
| $15,000 to $19,999 | 2 (4.4%) | 7 (14.3%) |
| $20,000 to $24,999 | 5 (11.1%) | 6 (12.2%) |
| $25,000 to $34,999 | 8 (17.8%) | 13 (26.5%) |
| $35,000 to $49,999 | 4 (8.9%) | 10 (20.4%) |
| $50,000 to $74,999 | 8 (17.8%) | 7 (14.3%) |
| $75,000 to $99,999 | 0 (0.0%) | 1 (2.0%) |
| $100,000 to $149,999 | 11 (24.4%) | 2 (4.1%) |
| $150,000 or more | 2 (4.4%) | 0 (0.0%) |
| Total | 45 (100.0%) | 49 (100.0%) |
Monthly Housing Cost Tiers in Gracemont
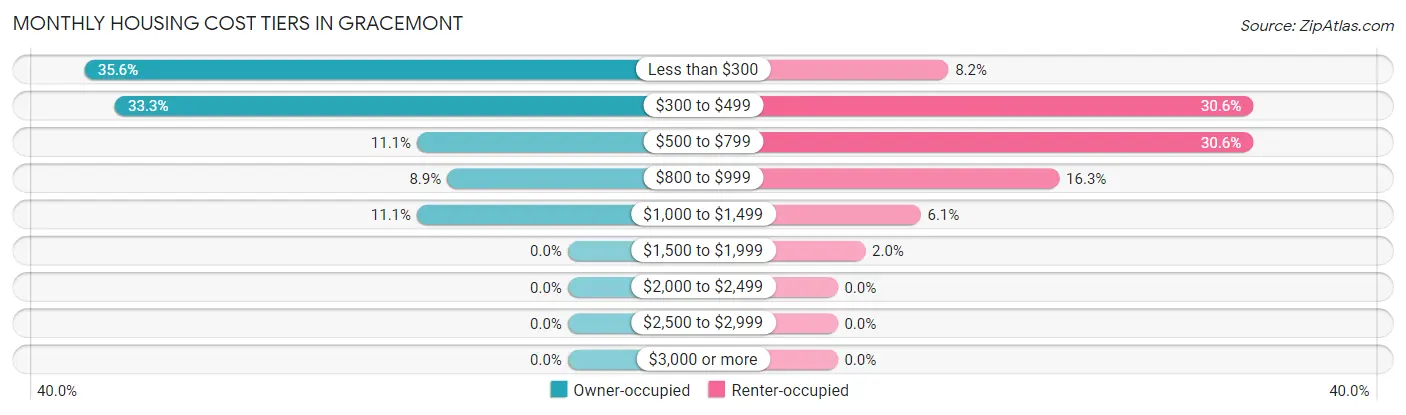
| Monthly Cost | Owner-occupied | Renter-occupied |
| Less than $300 | 16 (35.6%) | 4 (8.2%) |
| $300 to $499 | 15 (33.3%) | 15 (30.6%) |
| $500 to $799 | 5 (11.1%) | 15 (30.6%) |
| $800 to $999 | 4 (8.9%) | 8 (16.3%) |
| $1,000 to $1,499 | 5 (11.1%) | 3 (6.1%) |
| $1,500 to $1,999 | 0 (0.0%) | 1 (2.0%) |
| $2,000 to $2,499 | 0 (0.0%) | 0 (0.0%) |
| $2,500 to $2,999 | 0 (0.0%) | 0 (0.0%) |
| $3,000 or more | 0 (0.0%) | 0 (0.0%) |
| Total | 45 (100.0%) | 49 (100.0%) |
Physical Housing Characteristics in Gracemont
Housing Structures in Gracemont
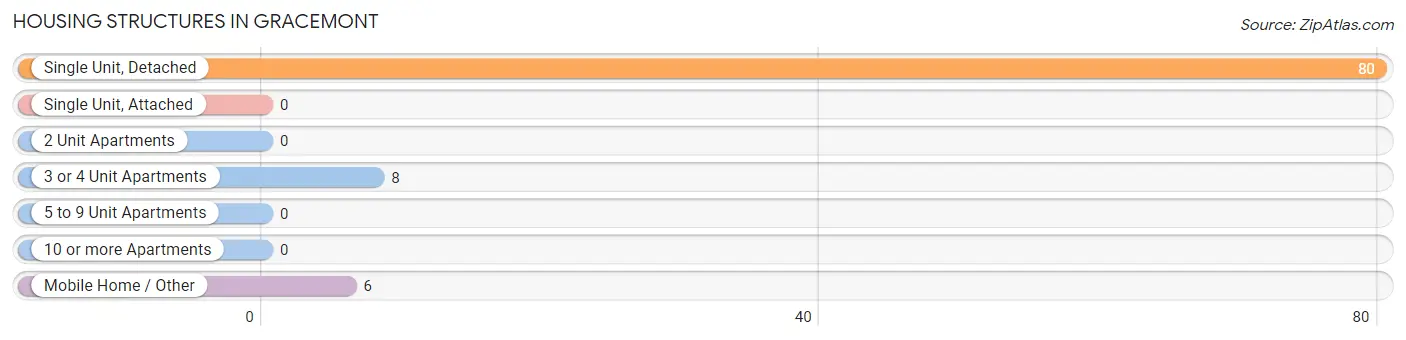
| Structure Type | # Housing Units | % Housing Units |
| Single Unit, Detached | 80 | 85.1% |
| Single Unit, Attached | 0 | 0.0% |
| 2 Unit Apartments | 0 | 0.0% |
| 3 or 4 Unit Apartments | 8 | 8.5% |
| 5 to 9 Unit Apartments | 0 | 0.0% |
| 10 or more Apartments | 0 | 0.0% |
| Mobile Home / Other | 6 | 6.4% |
| Total | 94 | 100.0% |
Housing Structures by Occupancy in Gracemont
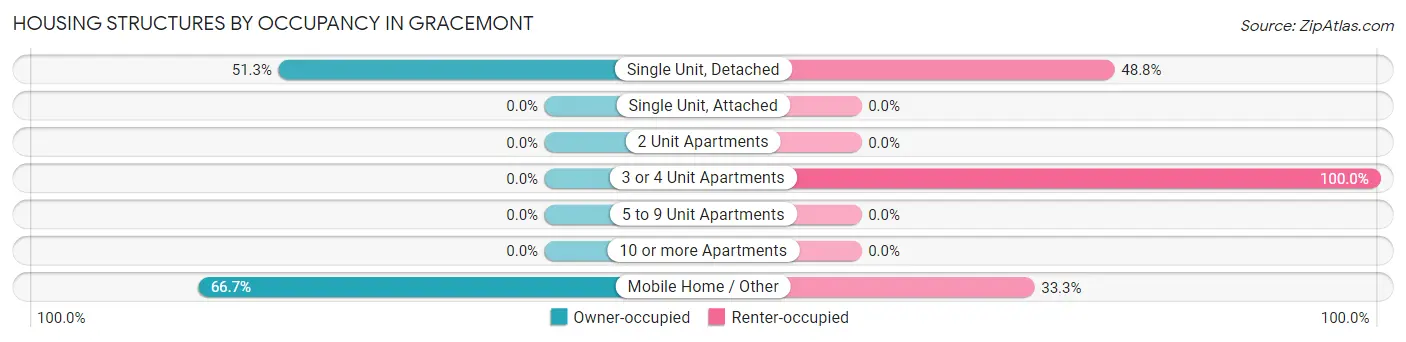
| Structure Type | Owner-occupied | Renter-occupied |
| Single Unit, Detached | 41 (51.2%) | 39 (48.7%) |
| Single Unit, Attached | 0 (0.0%) | 0 (0.0%) |
| 2 Unit Apartments | 0 (0.0%) | 0 (0.0%) |
| 3 or 4 Unit Apartments | 0 (0.0%) | 8 (100.0%) |
| 5 to 9 Unit Apartments | 0 (0.0%) | 0 (0.0%) |
| 10 or more Apartments | 0 (0.0%) | 0 (0.0%) |
| Mobile Home / Other | 4 (66.7%) | 2 (33.3%) |
| Total | 45 (47.9%) | 49 (52.1%) |
Housing Structures by Number of Rooms in Gracemont
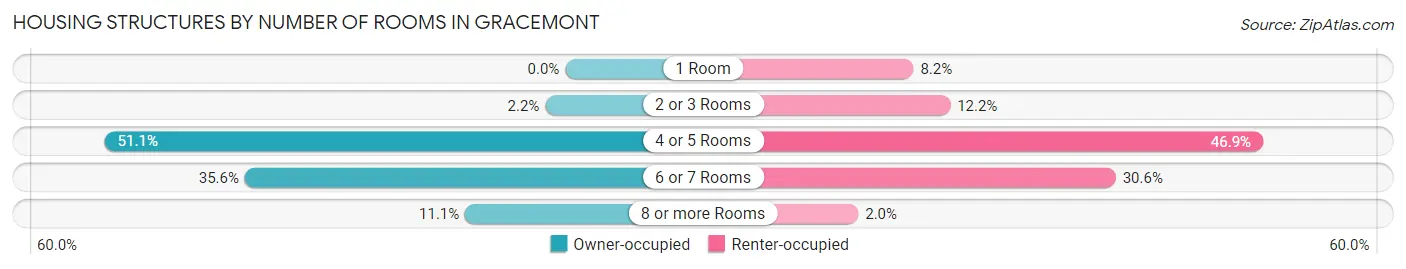
| Number of Rooms | Owner-occupied | Renter-occupied |
| 1 Room | 0 (0.0%) | 4 (8.2%) |
| 2 or 3 Rooms | 1 (2.2%) | 6 (12.2%) |
| 4 or 5 Rooms | 23 (51.1%) | 23 (46.9%) |
| 6 or 7 Rooms | 16 (35.6%) | 15 (30.6%) |
| 8 or more Rooms | 5 (11.1%) | 1 (2.0%) |
| Total | 45 (100.0%) | 49 (100.0%) |
Housing Structure by Heating Type in Gracemont
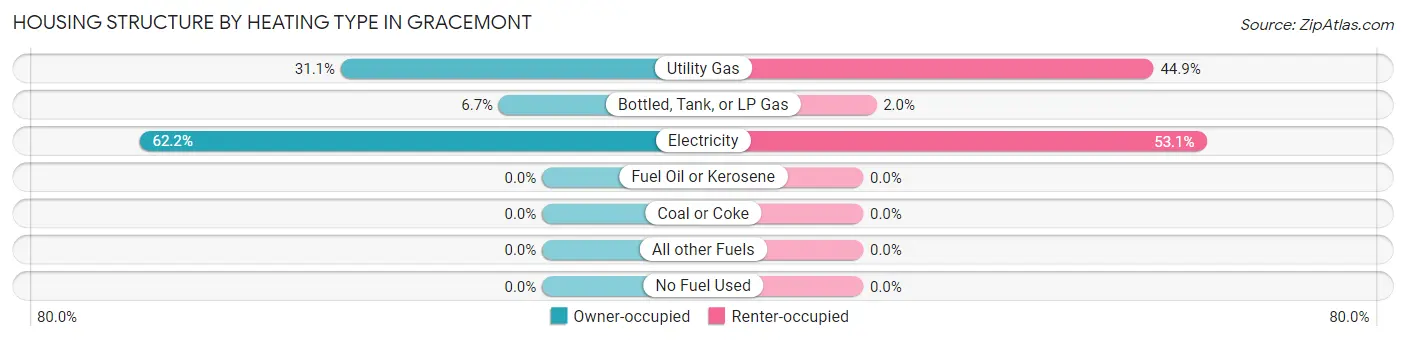
| Heating Type | Owner-occupied | Renter-occupied |
| Utility Gas | 14 (31.1%) | 22 (44.9%) |
| Bottled, Tank, or LP Gas | 3 (6.7%) | 1 (2.0%) |
| Electricity | 28 (62.2%) | 26 (53.1%) |
| Fuel Oil or Kerosene | 0 (0.0%) | 0 (0.0%) |
| Coal or Coke | 0 (0.0%) | 0 (0.0%) |
| All other Fuels | 0 (0.0%) | 0 (0.0%) |
| No Fuel Used | 0 (0.0%) | 0 (0.0%) |
| Total | 45 (100.0%) | 49 (100.0%) |
Household Vehicle Usage in Gracemont
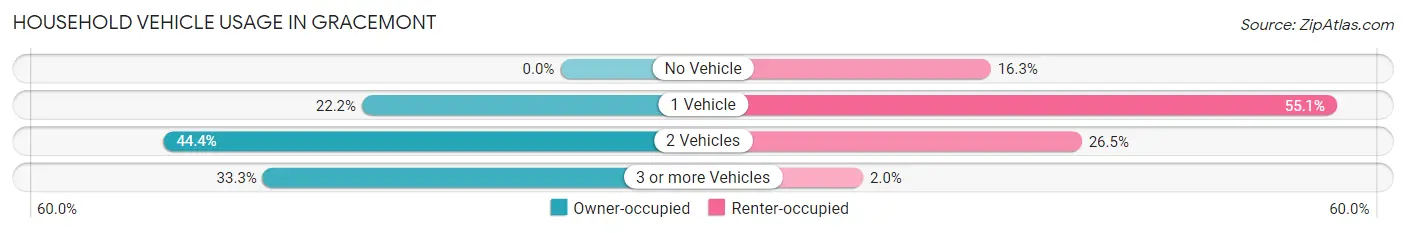
| Vehicles per Household | Owner-occupied | Renter-occupied |
| No Vehicle | 0 (0.0%) | 8 (16.3%) |
| 1 Vehicle | 10 (22.2%) | 27 (55.1%) |
| 2 Vehicles | 20 (44.4%) | 13 (26.5%) |
| 3 or more Vehicles | 15 (33.3%) | 1 (2.0%) |
| Total | 45 (100.0%) | 49 (100.0%) |
Real Estate & Mortgages in Gracemont
Real Estate and Mortgage Overview in Gracemont
| Characteristic | Without Mortgage | With Mortgage |
| Housing Units | 34 | 11 |
| Median Property Value | $49,000 | $103,100 |
| Median Household Income | $32,500 | $1 |
| Monthly Housing Costs | $310 | $0 |
| Real Estate Taxes | $236 | $3 |
Property Value by Mortgage Status in Gracemont
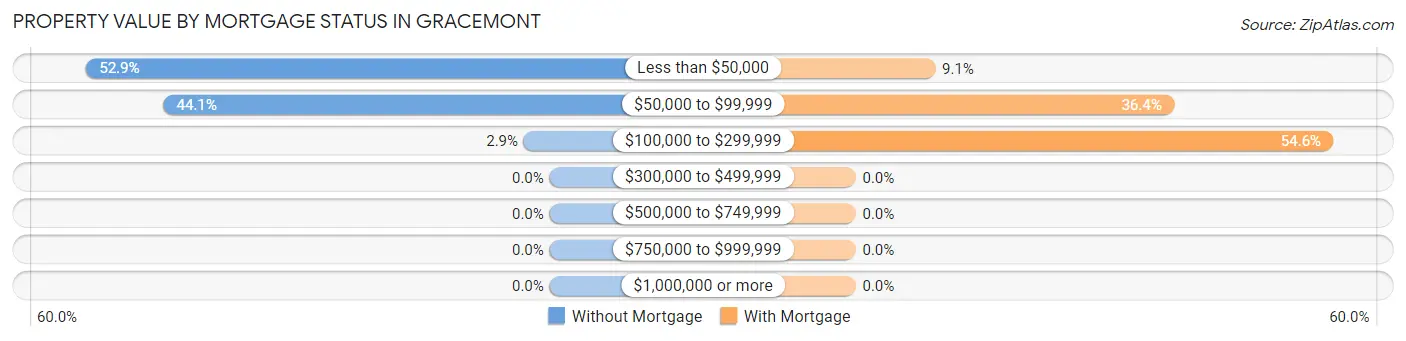
| Property Value | Without Mortgage | With Mortgage |
| Less than $50,000 | 18 (52.9%) | 1 (9.1%) |
| $50,000 to $99,999 | 15 (44.1%) | 4 (36.4%) |
| $100,000 to $299,999 | 1 (2.9%) | 6 (54.5%) |
| $300,000 to $499,999 | 0 (0.0%) | 0 (0.0%) |
| $500,000 to $749,999 | 0 (0.0%) | 0 (0.0%) |
| $750,000 to $999,999 | 0 (0.0%) | 0 (0.0%) |
| $1,000,000 or more | 0 (0.0%) | 0 (0.0%) |
| Total | 34 (100.0%) | 11 (100.0%) |
Household Income by Mortgage Status in Gracemont
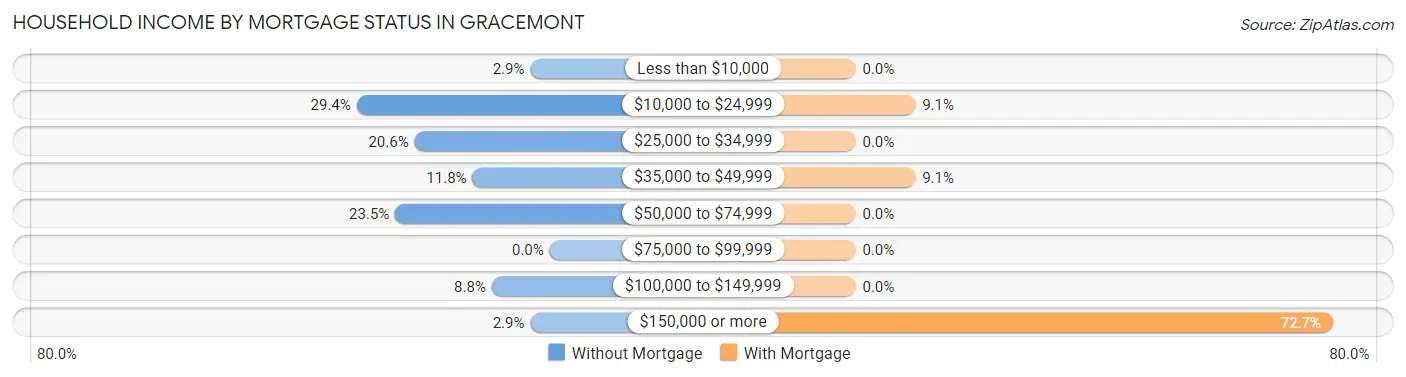
| Household Income | Without Mortgage | With Mortgage |
| Less than $10,000 | 1 (2.9%) | 0 (0.0%) |
| $10,000 to $24,999 | 10 (29.4%) | 1 (9.1%) |
| $25,000 to $34,999 | 7 (20.6%) | 0 (0.0%) |
| $35,000 to $49,999 | 4 (11.8%) | 1 (9.1%) |
| $50,000 to $74,999 | 8 (23.5%) | 0 (0.0%) |
| $75,000 to $99,999 | 0 (0.0%) | 0 (0.0%) |
| $100,000 to $149,999 | 3 (8.8%) | 0 (0.0%) |
| $150,000 or more | 1 (2.9%) | 8 (72.7%) |
| Total | 34 (100.0%) | 11 (100.0%) |
Property Value to Household Income Ratio in Gracemont
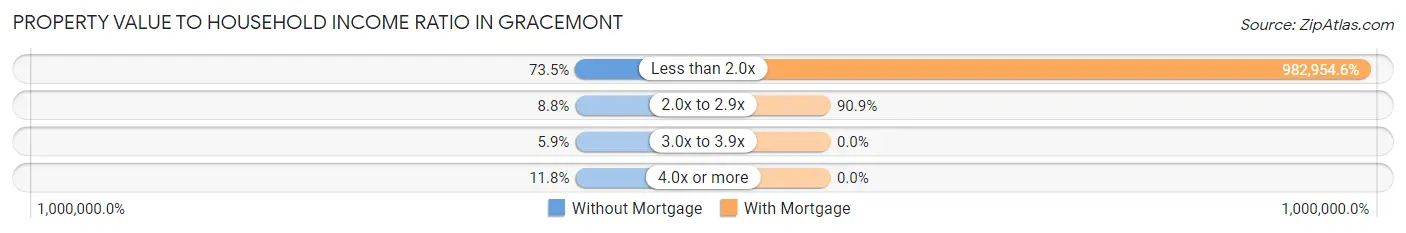
| Value-to-Income Ratio | Without Mortgage | With Mortgage |
| Less than 2.0x | 25 (73.5%) | 108,125 (982,954.6%) |
| 2.0x to 2.9x | 3 (8.8%) | 10 (90.9%) |
| 3.0x to 3.9x | 2 (5.9%) | 0 (0.0%) |
| 4.0x or more | 4 (11.8%) | 0 (0.0%) |
| Total | 34 (100.0%) | 11 (100.0%) |
Real Estate Taxes by Mortgage Status in Gracemont
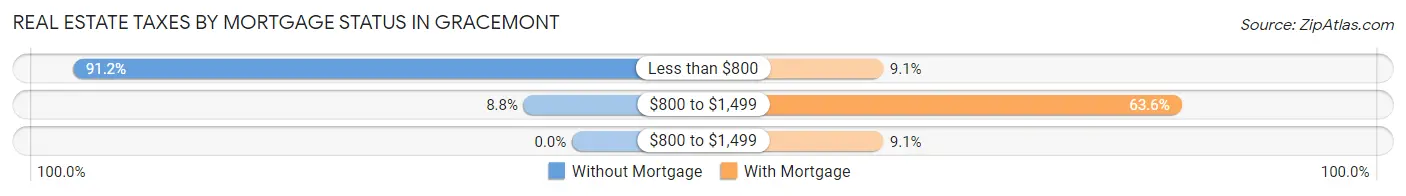
| Property Taxes | Without Mortgage | With Mortgage |
| Less than $800 | 31 (91.2%) | 1 (9.1%) |
| $800 to $1,499 | 3 (8.8%) | 7 (63.6%) |
| $800 to $1,499 | 0 (0.0%) | 1 (9.1%) |
| Total | 34 (100.0%) | 11 (100.0%) |
Health & Disability in Gracemont
Health Insurance Coverage by Age in Gracemont
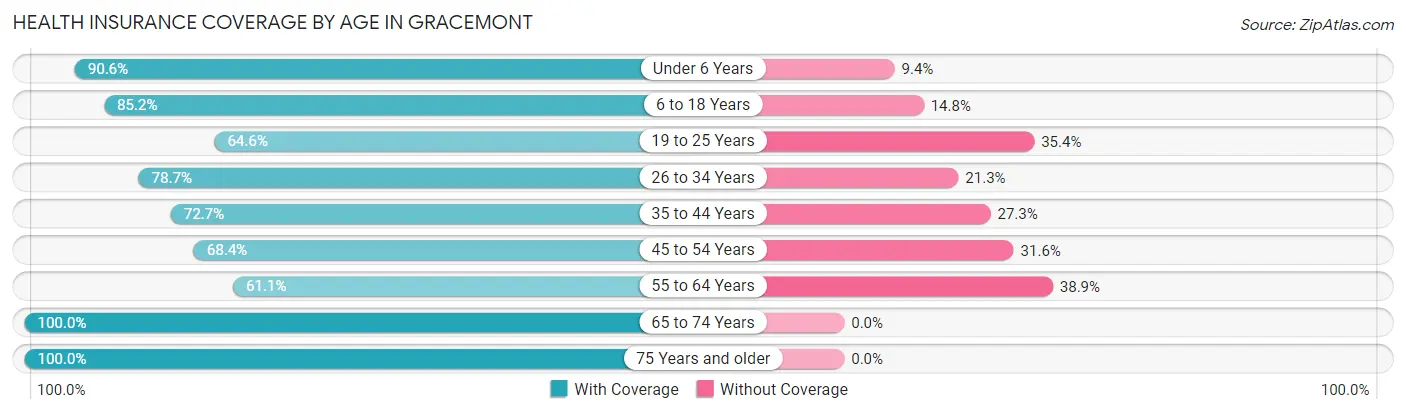
| Age Bracket | With Coverage | Without Coverage |
| Under 6 Years | 29 (90.6%) | 3 (9.4%) |
| 6 to 18 Years | 46 (85.2%) | 8 (14.8%) |
| 19 to 25 Years | 31 (64.6%) | 17 (35.4%) |
| 26 to 34 Years | 37 (78.7%) | 10 (21.3%) |
| 35 to 44 Years | 16 (72.7%) | 6 (27.3%) |
| 45 to 54 Years | 26 (68.4%) | 12 (31.6%) |
| 55 to 64 Years | 11 (61.1%) | 7 (38.9%) |
| 65 to 74 Years | 18 (100.0%) | 0 (0.0%) |
| 75 Years and older | 15 (100.0%) | 0 (0.0%) |
| Total | 229 (78.4%) | 63 (21.6%) |
Health Insurance Coverage by Citizenship Status in Gracemont
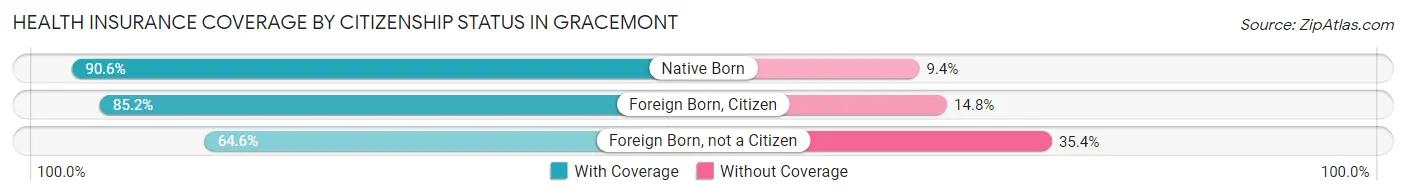
| Citizenship Status | With Coverage | Without Coverage |
| Native Born | 29 (90.6%) | 3 (9.4%) |
| Foreign Born, Citizen | 46 (85.2%) | 8 (14.8%) |
| Foreign Born, not a Citizen | 31 (64.6%) | 17 (35.4%) |
Health Insurance Coverage by Household Income in Gracemont
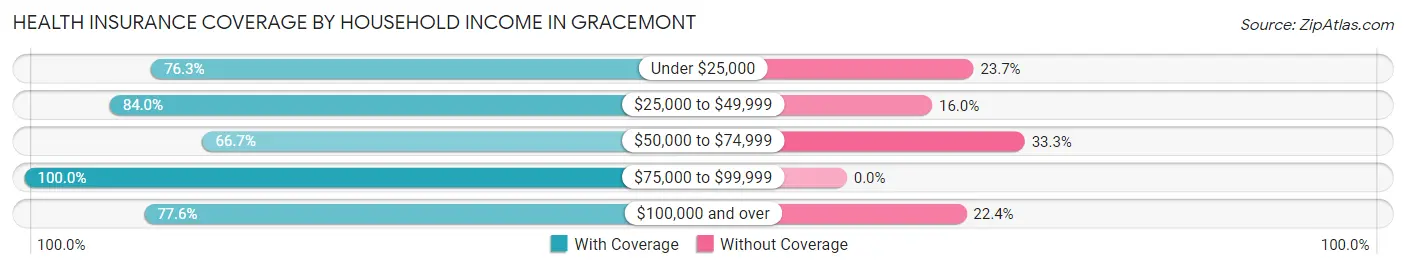
| Household Income | With Coverage | Without Coverage |
| Under $25,000 | 45 (76.3%) | 14 (23.7%) |
| $25,000 to $49,999 | 100 (84.0%) | 19 (16.0%) |
| $50,000 to $74,999 | 34 (66.7%) | 17 (33.3%) |
| $75,000 to $99,999 | 5 (100.0%) | 0 (0.0%) |
| $100,000 and over | 45 (77.6%) | 13 (22.4%) |
Public vs Private Health Insurance Coverage by Age in Gracemont
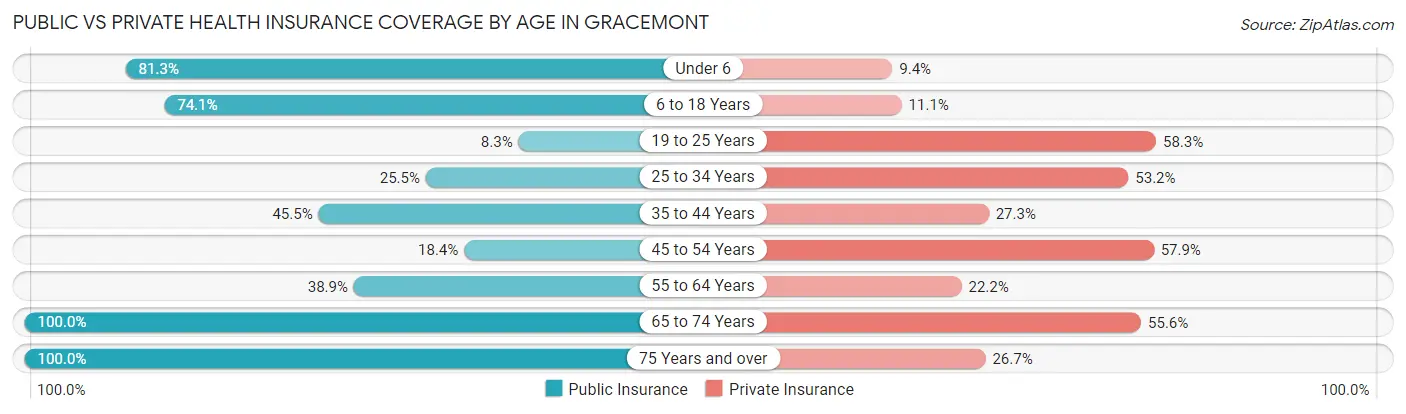
| Age Bracket | Public Insurance | Private Insurance |
| Under 6 | 26 (81.2%) | 3 (9.4%) |
| 6 to 18 Years | 40 (74.1%) | 6 (11.1%) |
| 19 to 25 Years | 4 (8.3%) | 28 (58.3%) |
| 25 to 34 Years | 12 (25.5%) | 25 (53.2%) |
| 35 to 44 Years | 10 (45.5%) | 6 (27.3%) |
| 45 to 54 Years | 7 (18.4%) | 22 (57.9%) |
| 55 to 64 Years | 7 (38.9%) | 4 (22.2%) |
| 65 to 74 Years | 18 (100.0%) | 10 (55.6%) |
| 75 Years and over | 15 (100.0%) | 4 (26.7%) |
| Total | 139 (47.6%) | 108 (37.0%) |
Disability Status by Sex by Age in Gracemont
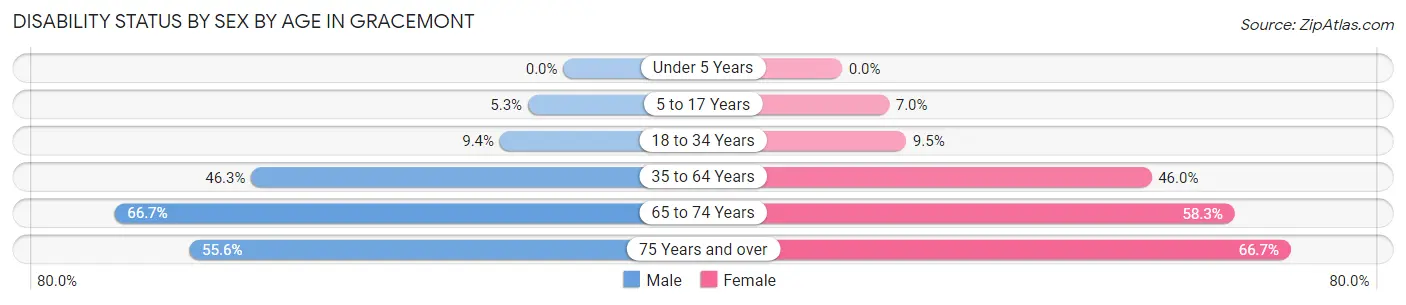
| Age Bracket | Male | Female |
| Under 5 Years | 0 (0.0%) | 0 (0.0%) |
| 5 to 17 Years | 1 (5.3%) | 3 (7.0%) |
| 18 to 34 Years | 5 (9.4%) | 4 (9.5%) |
| 35 to 64 Years | 19 (46.3%) | 17 (46.0%) |
| 65 to 74 Years | 4 (66.7%) | 7 (58.3%) |
| 75 Years and over | 5 (55.6%) | 4 (66.7%) |
Disability Class by Sex by Age in Gracemont
Disability Class: Hearing Difficulty
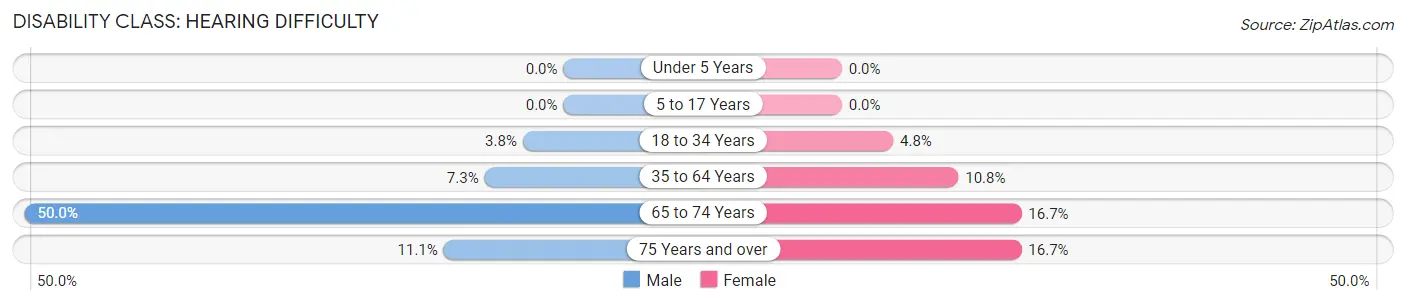
| Age Bracket | Male | Female |
| Under 5 Years | 0 (0.0%) | 0 (0.0%) |
| 5 to 17 Years | 0 (0.0%) | 0 (0.0%) |
| 18 to 34 Years | 2 (3.8%) | 2 (4.8%) |
| 35 to 64 Years | 3 (7.3%) | 4 (10.8%) |
| 65 to 74 Years | 3 (50.0%) | 2 (16.7%) |
| 75 Years and over | 1 (11.1%) | 1 (16.7%) |
Disability Class: Vision Difficulty
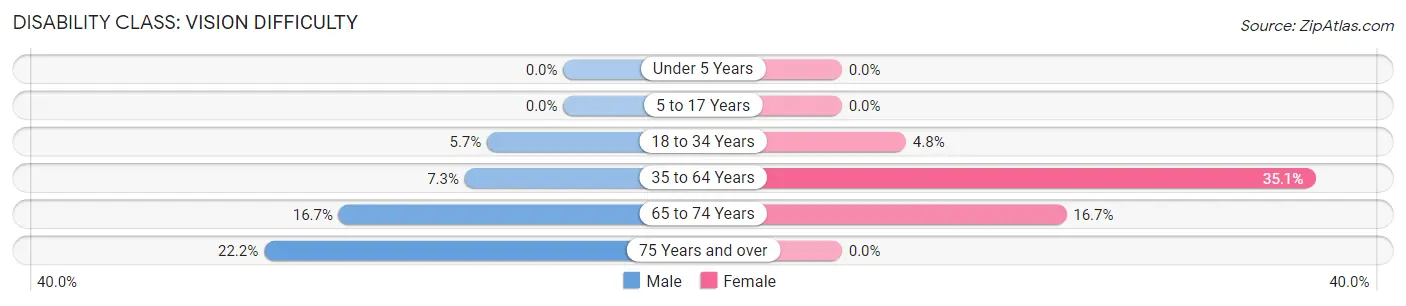
| Age Bracket | Male | Female |
| Under 5 Years | 0 (0.0%) | 0 (0.0%) |
| 5 to 17 Years | 0 (0.0%) | 0 (0.0%) |
| 18 to 34 Years | 3 (5.7%) | 2 (4.8%) |
| 35 to 64 Years | 3 (7.3%) | 13 (35.1%) |
| 65 to 74 Years | 1 (16.7%) | 2 (16.7%) |
| 75 Years and over | 2 (22.2%) | 0 (0.0%) |
Disability Class: Cognitive Difficulty
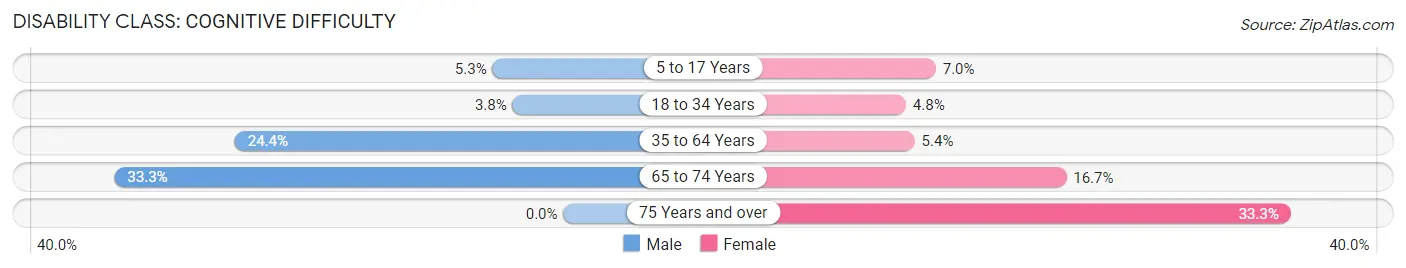
| Age Bracket | Male | Female |
| 5 to 17 Years | 1 (5.3%) | 3 (7.0%) |
| 18 to 34 Years | 2 (3.8%) | 2 (4.8%) |
| 35 to 64 Years | 10 (24.4%) | 2 (5.4%) |
| 65 to 74 Years | 2 (33.3%) | 2 (16.7%) |
| 75 Years and over | 0 (0.0%) | 2 (33.3%) |
Disability Class: Ambulatory Difficulty
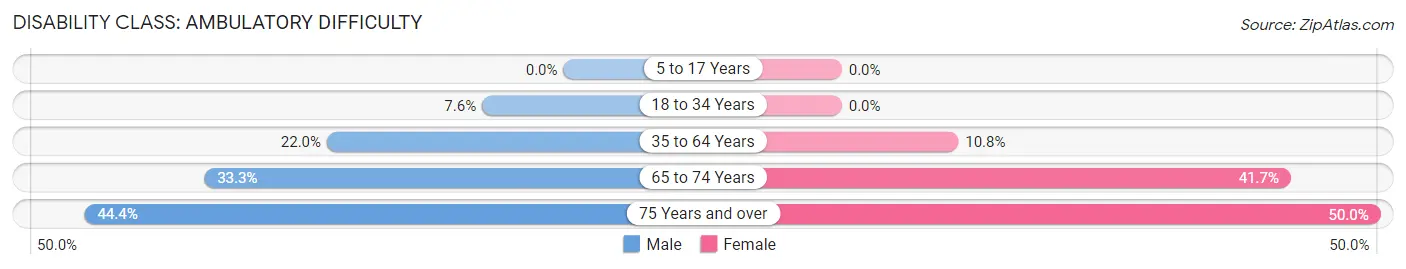
| Age Bracket | Male | Female |
| 5 to 17 Years | 0 (0.0%) | 0 (0.0%) |
| 18 to 34 Years | 4 (7.5%) | 0 (0.0%) |
| 35 to 64 Years | 9 (22.0%) | 4 (10.8%) |
| 65 to 74 Years | 2 (33.3%) | 5 (41.7%) |
| 75 Years and over | 4 (44.4%) | 3 (50.0%) |
Disability Class: Self-Care Difficulty
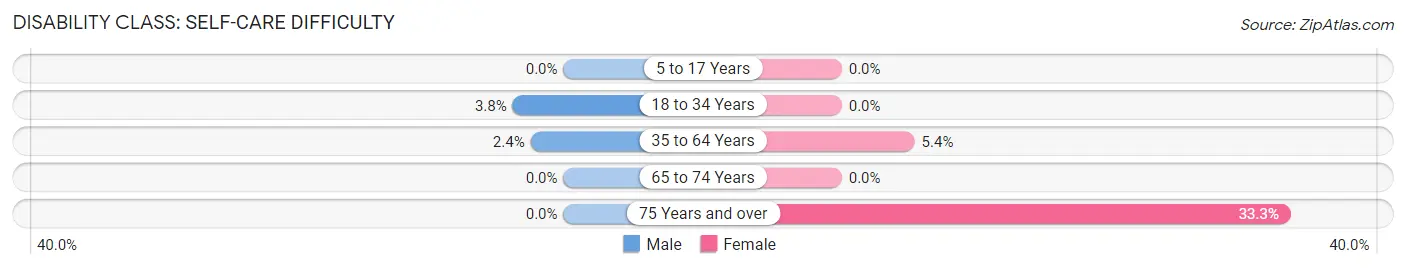
| Age Bracket | Male | Female |
| 5 to 17 Years | 0 (0.0%) | 0 (0.0%) |
| 18 to 34 Years | 2 (3.8%) | 0 (0.0%) |
| 35 to 64 Years | 1 (2.4%) | 2 (5.4%) |
| 65 to 74 Years | 0 (0.0%) | 0 (0.0%) |
| 75 Years and over | 0 (0.0%) | 2 (33.3%) |
Technology Access in Gracemont
Computing Device Access in Gracemont
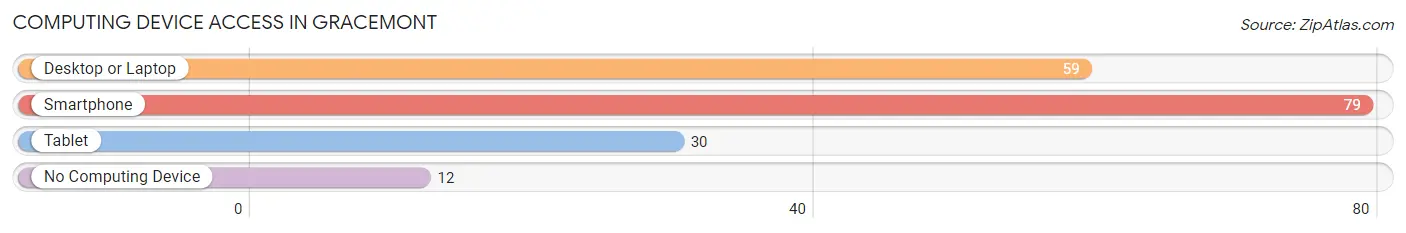
| Device Type | # Households | % Households |
| Desktop or Laptop | 59 | 62.8% |
| Smartphone | 79 | 84.0% |
| Tablet | 30 | 31.9% |
| No Computing Device | 12 | 12.8% |
| Total | 94 | 100.0% |
Internet Access in Gracemont
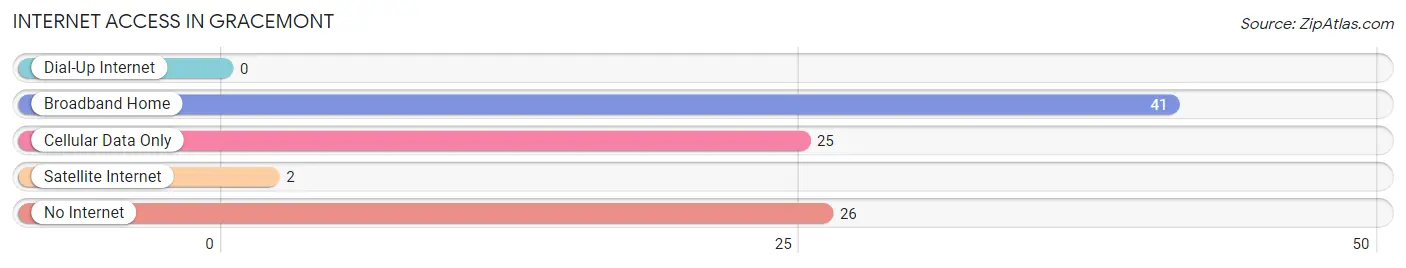
| Internet Type | # Households | % Households |
| Dial-Up Internet | 0 | 0.0% |
| Broadband Home | 41 | 43.6% |
| Cellular Data Only | 25 | 26.6% |
| Satellite Internet | 2 | 2.1% |
| No Internet | 26 | 27.7% |
| Total | 94 | 100.0% |
Gracemont Summary
Gracemont is a small town located in Caddo County, Oklahoma. It is situated in the southwestern part of the state, approximately 25 miles south of Oklahoma City. The town was founded in 1901 and was named after the daughter of the first postmaster, Grace Montgomery. As of the 2010 census, the population of Gracemont was 545.
History
Gracemont was founded in 1901 by the Choctaw Nation. The town was named after the daughter of the first postmaster, Grace Montgomery. The town was originally a farming community, but it soon became a center for oil production. In the early 1900s, the town was home to several oil wells, and the population grew rapidly. By 1910, the population had grown to over 500 people.
In the 1920s, the town experienced a period of growth and prosperity. Several businesses opened, including a bank, a hotel, a movie theater, and a grocery store. The town also had a school, a library, and a post office.
In the 1930s, the Great Depression hit the town hard. Many of the businesses closed, and the population declined. The town was able to survive, however, and by 1940 the population had grown to over 600 people.
In the 1950s, the town experienced a period of growth and prosperity once again. Several new businesses opened, including a hardware store, a restaurant, and a gas station. The town also had a school, a library, and a post office.
In the 1960s, the town experienced a period of decline. Many of the businesses closed, and the population declined. By 1970, the population had dropped to just over 400 people.
In the 1980s, the town experienced a period of growth and prosperity once again. Several new businesses opened, including a grocery store, a hardware store, and a restaurant. The town also had a school, a library, and a post office.
Geography
Gracemont is located in southwestern Oklahoma, approximately 25 miles south of Oklahoma City. The town is situated in the Red Bed Plains region of the state, which is characterized by flat terrain and red-colored soil. The town is located near the Washita River, which provides a source of water for the town.
The climate in Gracemont is generally mild, with hot summers and cold winters. The average annual temperature is around 60 degrees Fahrenheit. The average annual precipitation is around 35 inches.
Economy
The economy of Gracemont is largely based on agriculture. The town is home to several farms, which produce a variety of crops, including wheat, corn, and soybeans. The town also has several businesses, including a grocery store, a hardware store, and a restaurant.
The town is also home to several oil wells, which provide a source of income for the town. The oil industry is an important part of the local economy, and it provides jobs for many of the town’s residents.
Demographics
As of the 2010 census, the population of Gracemont was 545. The racial makeup of the town was 95.3% White, 0.7% African American, 0.2% Native American, 0.2% Asian, 0.2% from other races, and 3.6% from two or more races.
The median household income in Gracemont was $35,625, and the median family income was $41,250. The per capita income in the town was $17,813. About 11.2% of the population was below the poverty line.
Gracemont is a small town with a rich history and a bright future. The town has experienced periods of growth and decline, but it has always managed to survive. The town is home to several businesses, and the oil industry is an important part of the local economy. The town is also home to a diverse population, and it is a great place to live and work.
Common Questions
What is Per Capita Income in Gracemont?
Per Capita income in Gracemont is $18,858.
What is the Median Family Income in Gracemont?
Median Family Income in Gracemont is $38,333.
What is the Median Household income in Gracemont?
Median Household Income in Gracemont is $32,500.
What is Income or Wage Gap in Gracemont?
Income or Wage Gap in Gracemont is 14.2%.
Women in Gracemont earn 85.8 cents for every dollar earned by a man.
What is Family Income Deficit in Gracemont?
Family Income Deficit in Gracemont is $14,300.
Families that are below poverty line in Gracemont earn $14,300 less on average than the poverty threshold level.
What is Inequality or Gini Index in Gracemont?
Inequality or Gini Index in Gracemont is 0.41.
What is the Total Population of Gracemont?
Total Population of Gracemont is 292.
What is the Total Male Population of Gracemont?
Total Male Population of Gracemont is 141.
What is the Total Female Population of Gracemont?
Total Female Population of Gracemont is 151.
What is the Ratio of Males per 100 Females in Gracemont?
There are 93.38 Males per 100 Females in Gracemont.
What is the Ratio of Females per 100 Males in Gracemont?
There are 107.09 Females per 100 Males in Gracemont.
What is the Median Population Age in Gracemont?
Median Population Age in Gracemont is 29.0 Years.
What is the Average Family Size in Gracemont
Average Family Size in Gracemont is 4.0 People.
What is the Average Household Size in Gracemont
Average Household Size in Gracemont is 3.1 People.
How Large is the Labor Force in Gracemont?
There are 123 People in the Labor Forcein in Gracemont.
What is the Percentage of People in the Labor Force in Gracemont?
58.6% of People are in the Labor Force in Gracemont.
What is the Unemployment Rate in Gracemont?
Unemployment Rate in Gracemont is 4.9%.