Mountain View, OK Map & Demographics
Mountain View Map
Mountain View Overview
$28,001
PER CAPITA INCOME
$66,917
AVG FAMILY INCOME
$48,375
AVG HOUSEHOLD INCOME
11.4%
WAGE / INCOME GAP [ % ]
88.6¢/ $1
WAGE / INCOME GAP [ $ ]
0.42
INEQUALITY / GINI INDEX
604
TOTAL POPULATION
295
MALE POPULATION
309
FEMALE POPULATION
95.47
MALES / 100 FEMALES
104.75
FEMALES / 100 MALES
45.3
MEDIAN AGE
2.5
AVG FAMILY SIZE
2.1
AVG HOUSEHOLD SIZE
291
LABOR FORCE [ PEOPLE ]
56.1%
PERCENT IN LABOR FORCE
0.7%
UNEMPLOYMENT RATE
Mountain View Zip Codes
Mountain View Area Codes
Income in Mountain View
Income Overview in Mountain View
Per Capita Income in Mountain View is $28,001, while median incomes of families and households are $66,917 and $48,375 respectively.
| Characteristic | Number | Measure |
| Per Capita Income | 604 | $28,001 |
| Median Family Income | 197 | $66,917 |
| Mean Family Income | 197 | $74,871 |
| Median Household Income | 287 | $48,375 |
| Mean Household Income | 287 | $60,772 |
| Income Deficit | 197 | $0 |
| Wage / Income Gap (%) | 604 | 11.36% |
| Wage / Income Gap ($) | 604 | 88.64¢ per $1 |
| Gini / Inequality Index | 604 | 0.42 |
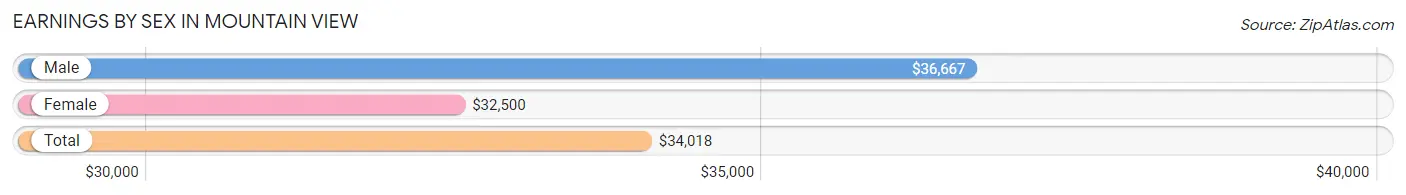
Earnings by Sex in Mountain View
Average Earnings in Mountain View are $34,018, $36,667 for men and $32,500 for women, a difference of 11.4%.
| Sex | Number | Average Earnings |
| Male | 148 (49.0%) | $36,667 |
| Female | 154 (51.0%) | $32,500 |
| Total | 302 (100.0%) | $34,018 |
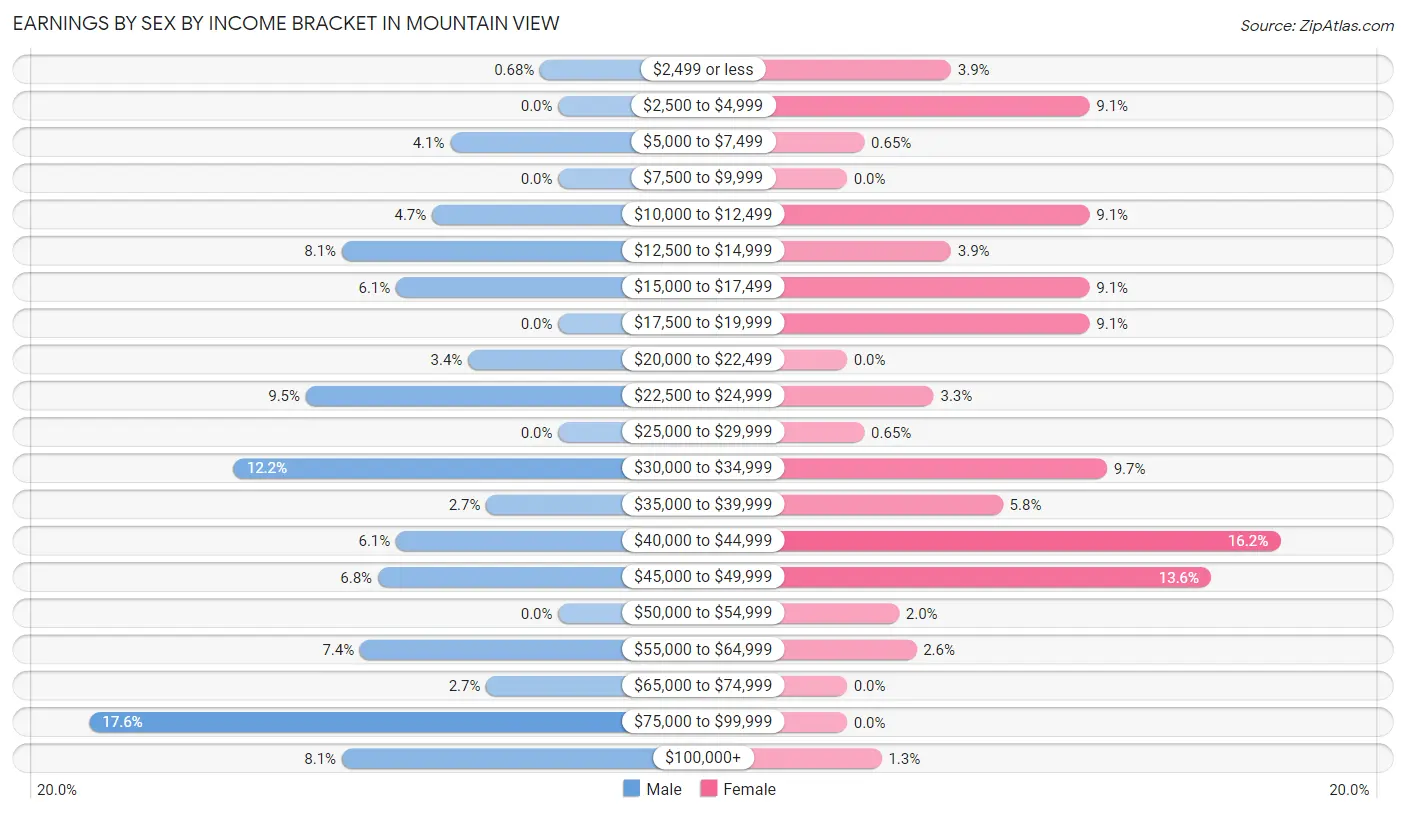
Earnings by Sex by Income Bracket in Mountain View
The most common earnings brackets in Mountain View are $75,000 to $99,999 for men (26 | 17.6%) and $40,000 to $44,999 for women (25 | 16.2%).
| Income | Male | Female |
| $2,499 or less | 1 (0.7%) | 6 (3.9%) |
| $2,500 to $4,999 | 0 (0.0%) | 14 (9.1%) |
| $5,000 to $7,499 | 6 (4.1%) | 1 (0.6%) |
| $7,500 to $9,999 | 0 (0.0%) | 0 (0.0%) |
| $10,000 to $12,499 | 7 (4.7%) | 14 (9.1%) |
| $12,500 to $14,999 | 12 (8.1%) | 6 (3.9%) |
| $15,000 to $17,499 | 9 (6.1%) | 14 (9.1%) |
| $17,500 to $19,999 | 0 (0.0%) | 14 (9.1%) |
| $20,000 to $22,499 | 5 (3.4%) | 0 (0.0%) |
| $22,500 to $24,999 | 14 (9.5%) | 5 (3.3%) |
| $25,000 to $29,999 | 0 (0.0%) | 1 (0.6%) |
| $30,000 to $34,999 | 18 (12.2%) | 15 (9.7%) |
| $35,000 to $39,999 | 4 (2.7%) | 9 (5.8%) |
| $40,000 to $44,999 | 9 (6.1%) | 25 (16.2%) |
| $45,000 to $49,999 | 10 (6.8%) | 21 (13.6%) |
| $50,000 to $54,999 | 0 (0.0%) | 3 (1.9%) |
| $55,000 to $64,999 | 11 (7.4%) | 4 (2.6%) |
| $65,000 to $74,999 | 4 (2.7%) | 0 (0.0%) |
| $75,000 to $99,999 | 26 (17.6%) | 0 (0.0%) |
| $100,000+ | 12 (8.1%) | 2 (1.3%) |
| Total | 148 (100.0%) | 154 (100.0%) |
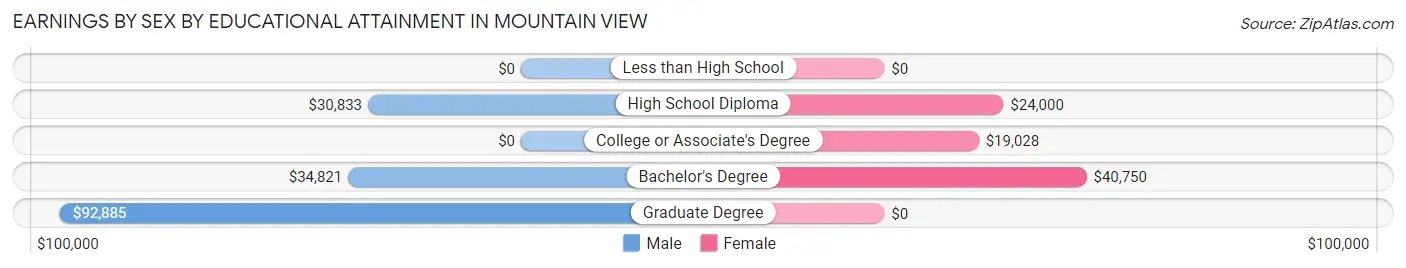
Earnings by Sex by Educational Attainment in Mountain View
Average earnings in Mountain View are $35,833 for men and $33,077 for women, a difference of 7.7%. Men with an educational attainment of graduate degree enjoy the highest average annual earnings of $92,885, while those with high school diploma education earn the least with $30,833. Women with an educational attainment of bachelor's degree earn the most with the average annual earnings of $40,750, while those with college or associate's degree education have the smallest earnings of $19,028.
| Educational Attainment | Male Income | Female Income |
| Less than High School | - | - |
| High School Diploma | $30,833 | $24,000 |
| College or Associate's Degree | - | - |
| Bachelor's Degree | $34,821 | $40,750 |
| Graduate Degree | $92,885 | $0 |
| Total | $35,833 | $33,077 |
Family Income in Mountain View
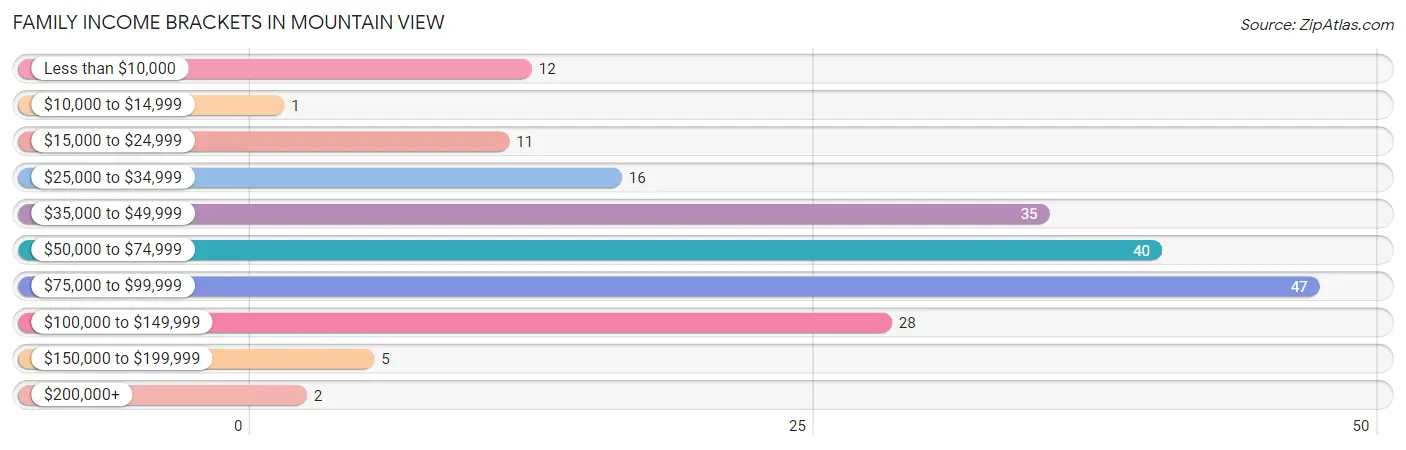
Family Income Brackets in Mountain View
According to the Mountain View family income data, there are 47 families falling into the $75,000 to $99,999 income range, which is the most common income bracket and makes up 23.9% of all families. Conversely, the $10,000 to $14,999 income bracket is the least frequent group with only 1 families (0.5%) belonging to this category.
| Income Bracket | # Families | % Families |
| Less than $10,000 | 12 | 6.1% |
| $10,000 to $14,999 | 1 | 0.5% |
| $15,000 to $24,999 | 11 | 5.6% |
| $25,000 to $34,999 | 16 | 8.1% |
| $35,000 to $49,999 | 35 | 17.8% |
| $50,000 to $74,999 | 40 | 20.3% |
| $75,000 to $99,999 | 47 | 23.9% |
| $100,000 to $149,999 | 28 | 14.2% |
| $150,000 to $199,999 | 5 | 2.5% |
| $200,000+ | 2 | 1.0% |
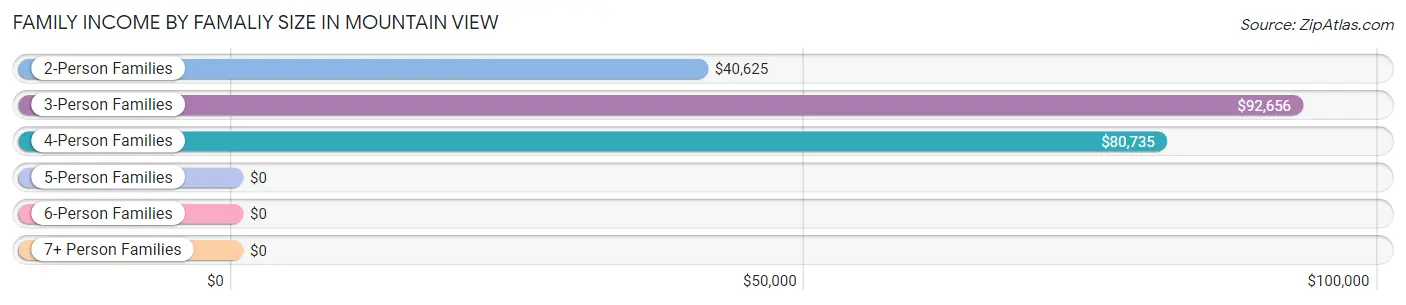
Family Income by Famaliy Size in Mountain View
3-person families (49 | 24.9%) account for the highest median family income in Mountain View with $92,656 per family, while 3-person families (49 | 24.9%) have the highest median income of $30,885 per family member.
| Income Bracket | # Families | Median Income |
| 2-Person Families | 85 (43.1%) | $40,625 |
| 3-Person Families | 49 (24.9%) | $92,656 |
| 4-Person Families | 60 (30.5%) | $80,735 |
| 5-Person Families | 3 (1.5%) | $0 |
| 6-Person Families | 0 (0.0%) | $0 |
| 7+ Person Families | 0 (0.0%) | $0 |
| Total | 197 (100.0%) | $66,917 |
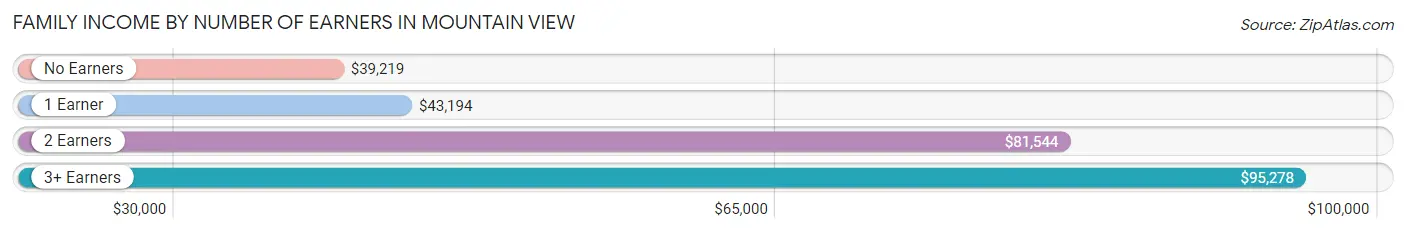
Family Income by Number of Earners in Mountain View
The median family income in Mountain View is $66,917, with families comprising 3+ earners (18) having the highest median family income of $95,278, while families with no earners (45) have the lowest median family income of $39,219, accounting for 9.1% and 22.8% of families, respectively.
| Number of Earners | # Families | Median Income |
| No Earners | 45 (22.8%) | $39,219 |
| 1 Earner | 55 (27.9%) | $43,194 |
| 2 Earners | 79 (40.1%) | $81,544 |
| 3+ Earners | 18 (9.1%) | $95,278 |
| Total | 197 (100.0%) | $66,917 |
Household Income in Mountain View
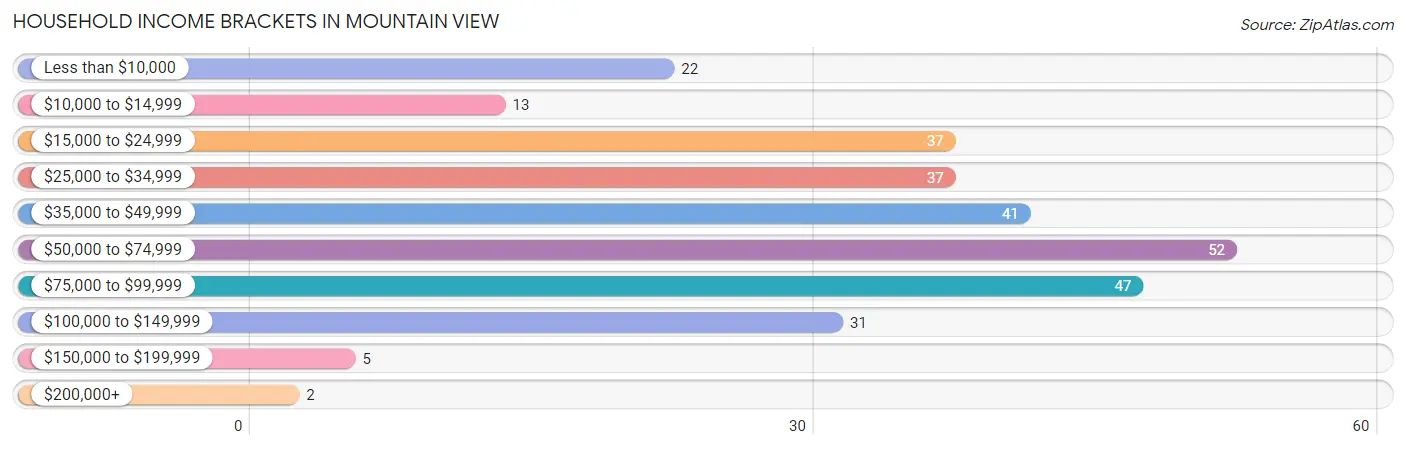
Household Income Brackets in Mountain View
With 52 households falling in the category, the $50,000 to $74,999 income range is the most frequent in Mountain View, accounting for 18.1% of all households. In contrast, only 2 households (0.7%) fall into the $200,000+ income bracket, making it the least populous group.
| Income Bracket | # Households | % Households |
| Less than $10,000 | 22 | 7.7% |
| $10,000 to $14,999 | 13 | 4.5% |
| $15,000 to $24,999 | 37 | 12.9% |
| $25,000 to $34,999 | 37 | 12.9% |
| $35,000 to $49,999 | 41 | 14.3% |
| $50,000 to $74,999 | 52 | 18.1% |
| $75,000 to $99,999 | 47 | 16.4% |
| $100,000 to $149,999 | 31 | 10.8% |
| $150,000 to $199,999 | 5 | 1.7% |
| $200,000+ | 2 | 0.7% |
Household Income by Householder Age in Mountain View
The median household income in Mountain View is $48,375, with the highest median household income of $66,250 found in the 45 to 64 years age bracket for the primary householder. A total of 100 households (34.8%) fall into this category. Meanwhile, the 15 to 24 years age bracket for the primary householder has the lowest median household income of $0, with 4 households (1.4%) in this group.
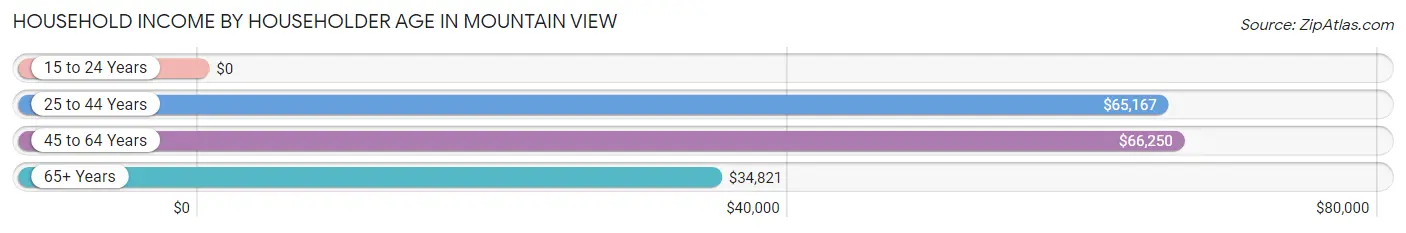
| Income Bracket | # Households | Median Income |
| 15 to 24 Years | 4 (1.4%) | $0 |
| 25 to 44 Years | 96 (33.5%) | $65,167 |
| 45 to 64 Years | 100 (34.8%) | $66,250 |
| 65+ Years | 87 (30.3%) | $34,821 |
| Total | 287 (100.0%) | $48,375 |
Poverty in Mountain View
Income Below Poverty by Sex and Age in Mountain View
With 14.9% poverty level for males and 15.2% for females among the residents of Mountain View, 6 to 11 year old males and 18 to 24 year old females are the most vulnerable to poverty, with 2 males (50.0%) and 2 females (100.0%) in their respective age groups living below the poverty level.
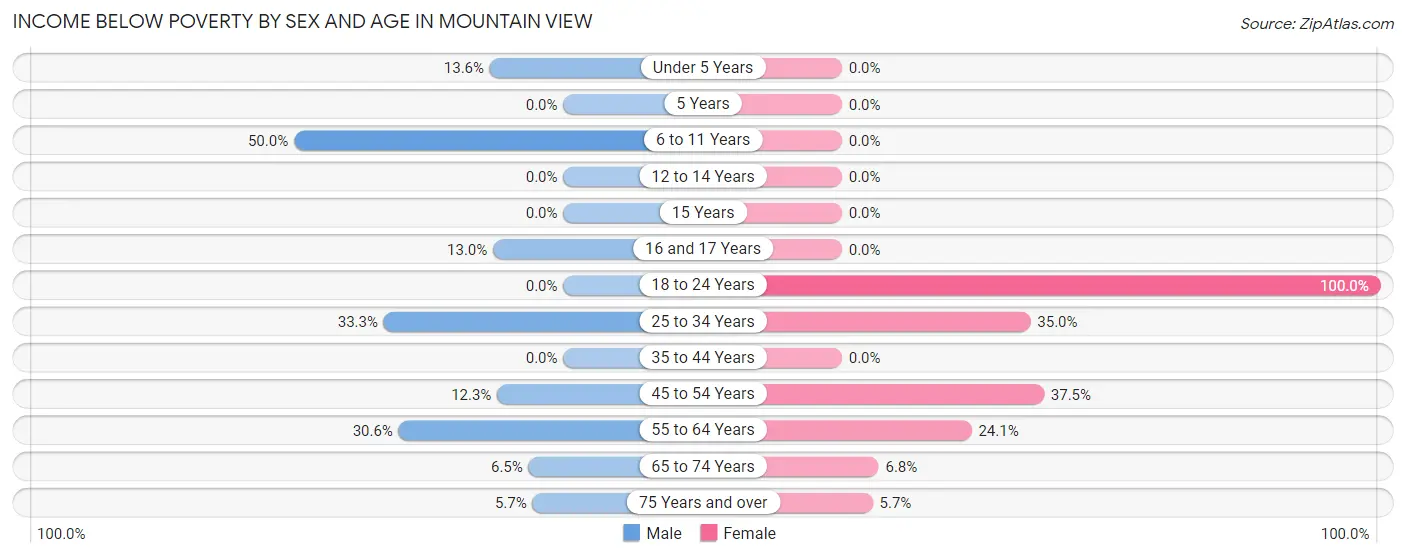
| Age Bracket | Male | Female |
| Under 5 Years | 3 (13.6%) | 0 (0.0%) |
| 5 Years | 0 (0.0%) | 0 (0.0%) |
| 6 to 11 Years | 2 (50.0%) | 0 (0.0%) |
| 12 to 14 Years | 0 (0.0%) | 0 (0.0%) |
| 15 Years | 0 (0.0%) | 0 (0.0%) |
| 16 and 17 Years | 3 (13.0%) | 0 (0.0%) |
| 18 to 24 Years | 0 (0.0%) | 2 (100.0%) |
| 25 to 34 Years | 14 (33.3%) | 21 (35.0%) |
| 35 to 44 Years | 0 (0.0%) | 0 (0.0%) |
| 45 to 54 Years | 7 (12.3%) | 6 (37.5%) |
| 55 to 64 Years | 11 (30.6%) | 13 (24.1%) |
| 65 to 74 Years | 2 (6.5%) | 3 (6.8%) |
| 75 Years and over | 2 (5.7%) | 2 (5.7%) |
| Total | 44 (14.9%) | 47 (15.2%) |
Income Above Poverty by Sex and Age in Mountain View
According to the poverty statistics in Mountain View, males aged 5 years and females aged under 5 years are the age groups that are most secure financially, with 100.0% of males and 100.0% of females in these age groups living above the poverty line.
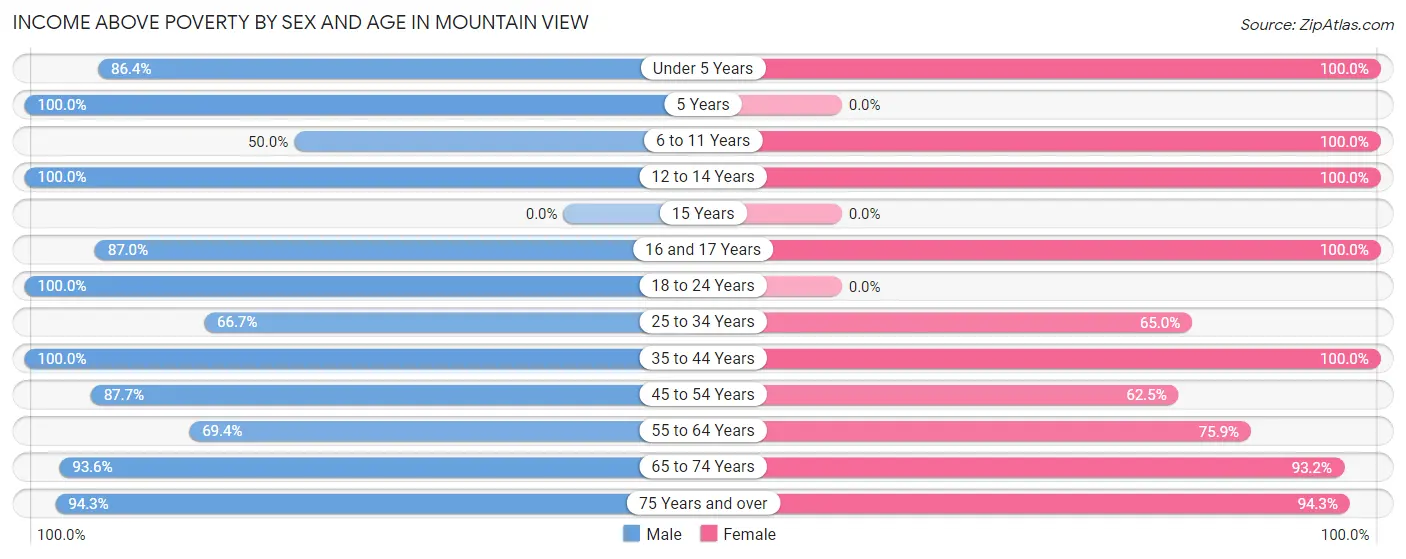
| Age Bracket | Male | Female |
| Under 5 Years | 19 (86.4%) | 2 (100.0%) |
| 5 Years | 6 (100.0%) | 0 (0.0%) |
| 6 to 11 Years | 2 (50.0%) | 15 (100.0%) |
| 12 to 14 Years | 9 (100.0%) | 27 (100.0%) |
| 15 Years | 0 (0.0%) | 0 (0.0%) |
| 16 and 17 Years | 20 (87.0%) | 4 (100.0%) |
| 18 to 24 Years | 6 (100.0%) | 0 (0.0%) |
| 25 to 34 Years | 28 (66.7%) | 39 (65.0%) |
| 35 to 44 Years | 24 (100.0%) | 50 (100.0%) |
| 45 to 54 Years | 50 (87.7%) | 10 (62.5%) |
| 55 to 64 Years | 25 (69.4%) | 41 (75.9%) |
| 65 to 74 Years | 29 (93.5%) | 41 (93.2%) |
| 75 Years and over | 33 (94.3%) | 33 (94.3%) |
| Total | 251 (85.1%) | 262 (84.8%) |
Income Below Poverty Among Married-Couple Families in Mountain View
The poverty statistics for married-couple families in Mountain View show that 4.4% or 7 of the total 159 families live below the poverty line. Families with no children have the highest poverty rate of 8.9%, comprising of 7 families. On the other hand, families with 1 or 2 children have the lowest poverty rate of 0.0%, which includes 0 families.
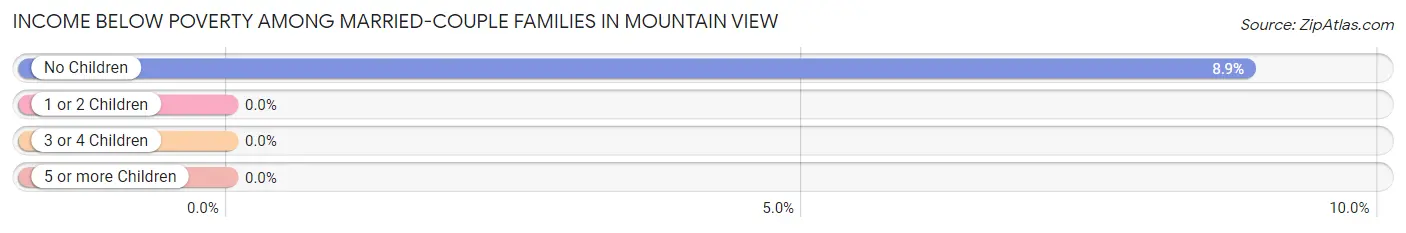
| Children | Above Poverty | Below Poverty |
| No Children | 72 (91.1%) | 7 (8.9%) |
| 1 or 2 Children | 80 (100.0%) | 0 (0.0%) |
| 3 or 4 Children | 0 (0.0%) | 0 (0.0%) |
| 5 or more Children | 0 (0.0%) | 0 (0.0%) |
| Total | 152 (95.6%) | 7 (4.4%) |
Income Below Poverty Among Single-Parent Households in Mountain View
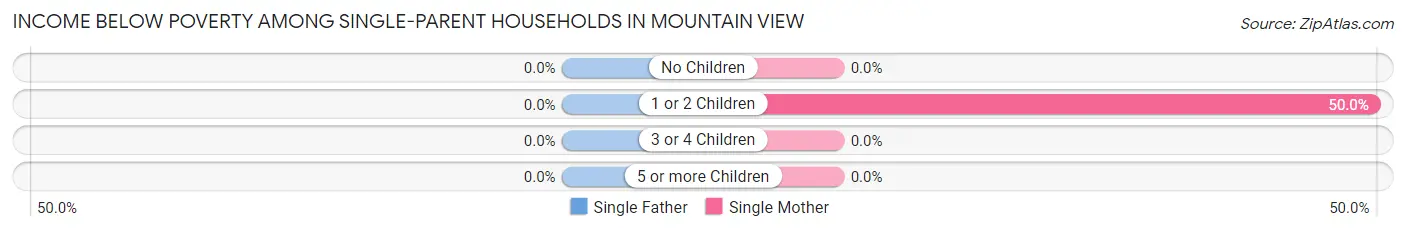
| Children | Single Father | Single Mother |
| No Children | 0 (0.0%) | 0 (0.0%) |
| 1 or 2 Children | 0 (0.0%) | 9 (50.0%) |
| 3 or 4 Children | 0 (0.0%) | 0 (0.0%) |
| 5 or more Children | 0 (0.0%) | 0 (0.0%) |
| Total | 0 (0.0%) | 9 (33.3%) |
Income Below Poverty Among Married-Couple vs Single-Parent Households in Mountain View
The poverty data for Mountain View shows that 7 of the married-couple family households (4.4%) and 9 of the single-parent households (23.7%) are living below the poverty level. Within the married-couple family households, those with no children have the highest poverty rate, with 7 households (8.9%) falling below the poverty line. Among the single-parent households, those with 1 or 2 children have the highest poverty rate, with 9 household (42.9%) living below poverty.
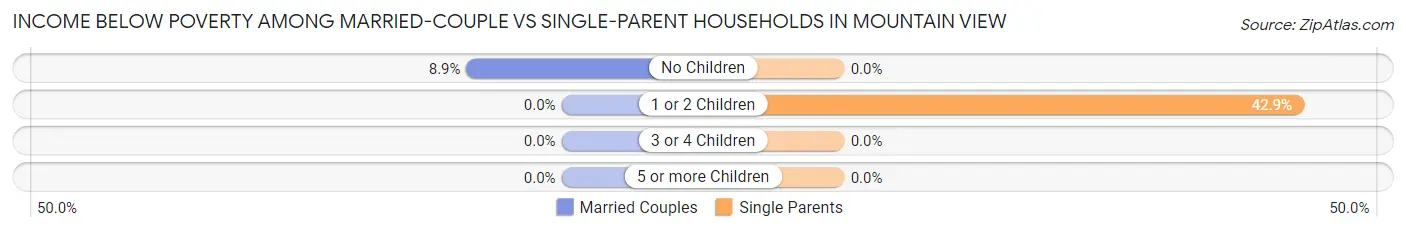
| Children | Married-Couple Families | Single-Parent Households |
| No Children | 7 (8.9%) | 0 (0.0%) |
| 1 or 2 Children | 0 (0.0%) | 9 (42.9%) |
| 3 or 4 Children | 0 (0.0%) | 0 (0.0%) |
| 5 or more Children | 0 (0.0%) | 0 (0.0%) |
| Total | 7 (4.4%) | 9 (23.7%) |
Race in Mountain View
The most populous races in Mountain View are White / Caucasian (444 | 73.5%), Native / Alaskan (100 | 16.6%), and Hispanic or Latino (49 | 8.1%).
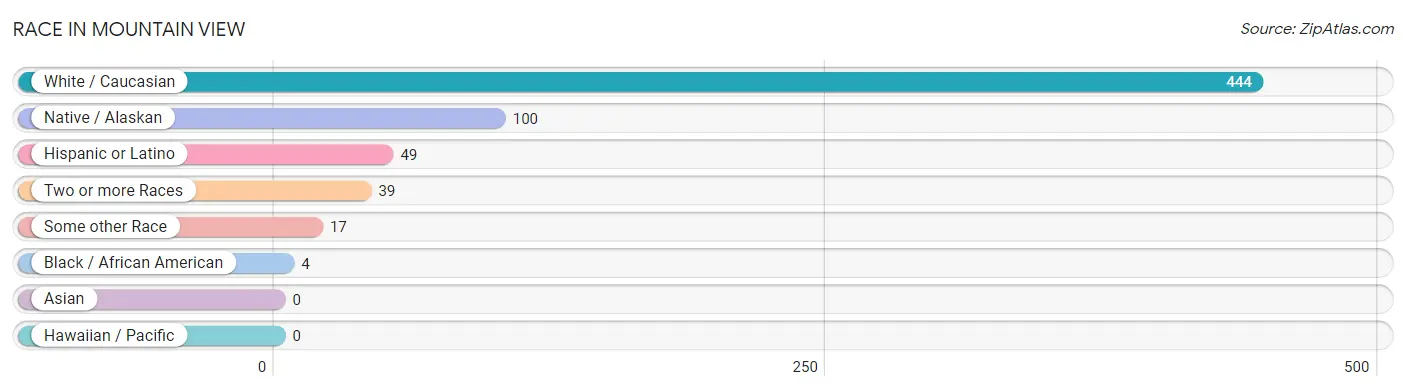
| Race | # Population | % Population |
| Asian | 0 | 0.0% |
| Black / African American | 4 | 0.7% |
| Hawaiian / Pacific | 0 | 0.0% |
| Hispanic or Latino | 49 | 8.1% |
| Native / Alaskan | 100 | 16.6% |
| White / Caucasian | 444 | 73.5% |
| Two or more Races | 39 | 6.5% |
| Some other Race | 17 | 2.8% |
| Total | 604 | 100.0% |
Ancestry in Mountain View
The most populous ancestries reported in Mountain View are German (76 | 12.6%), Irish (73 | 12.1%), Cherokee (64 | 10.6%), English (61 | 10.1%), and American (55 | 9.1%), together accounting for 54.5% of all Mountain View residents.
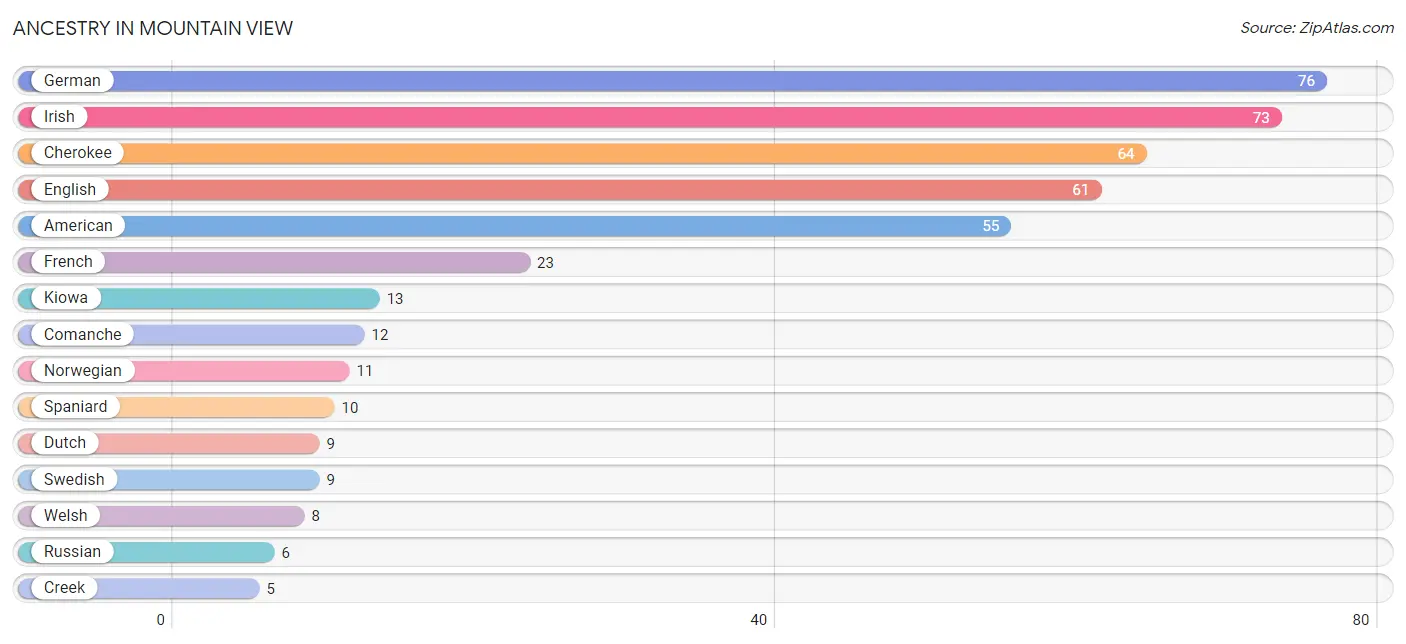
| Ancestry | # Population | % Population |
| American | 55 | 9.1% |
| Apache | 2 | 0.3% |
| Burmese | 3 | 0.5% |
| Cherokee | 64 | 10.6% |
| Chippewa | 4 | 0.7% |
| Comanche | 12 | 2.0% |
| Creek | 5 | 0.8% |
| Dutch | 9 | 1.5% |
| English | 61 | 10.1% |
| European | 3 | 0.5% |
| French | 23 | 3.8% |
| French Canadian | 4 | 0.7% |
| German | 76 | 12.6% |
| Irish | 73 | 12.1% |
| Italian | 3 | 0.5% |
| Kiowa | 13 | 2.1% |
| Mexican | 2 | 0.3% |
| Norwegian | 11 | 1.8% |
| Polish | 3 | 0.5% |
| Potawatomi | 4 | 0.7% |
| Russian | 6 | 1.0% |
| Scottish | 5 | 0.8% |
| Spaniard | 10 | 1.7% |
| Spanish | 3 | 0.5% |
| Swedish | 9 | 1.5% |
| Welsh | 8 | 1.3% | View All 26 Rows |
Immigrants in Mountain View
The most numerous immigrant groups reported in Mountain View came from Central America (2 | 0.3%), Latin America (2 | 0.3%), and Mexico (2 | 0.3%), together accounting for 1.0% of all Mountain View residents.
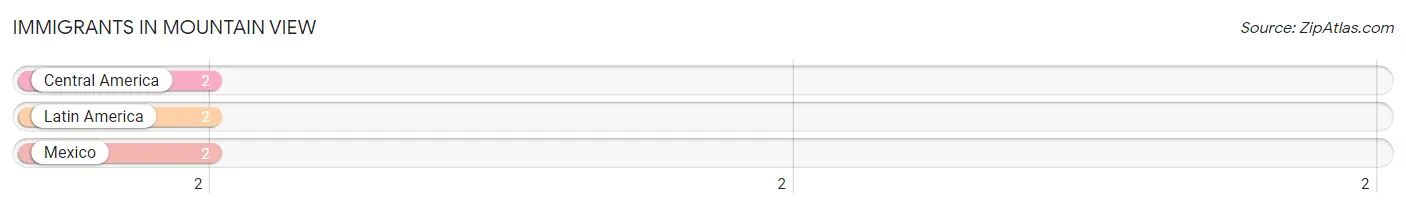
| Immigration Origin | # Population | % Population |
| Central America | 2 | 0.3% |
| Latin America | 2 | 0.3% |
| Mexico | 2 | 0.3% | View All 3 Rows |
Sex and Age in Mountain View
Sex and Age in Mountain View
The most populous age groups in Mountain View are 45 to 49 Years (48 | 16.3%) for men and 10 to 14 Years (35 | 11.3%) for women.
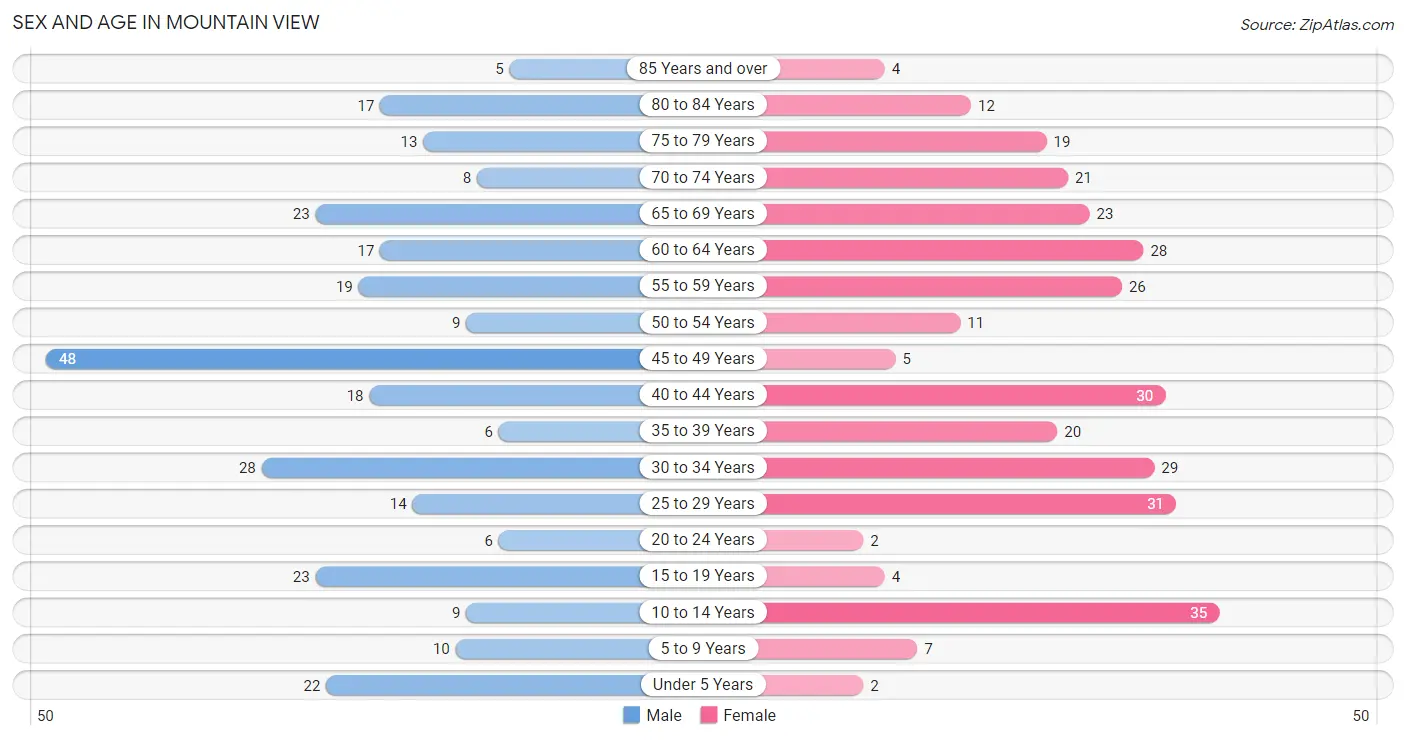
| Age Bracket | Male | Female |
| Under 5 Years | 22 (7.5%) | 2 (0.6%) |
| 5 to 9 Years | 10 (3.4%) | 7 (2.3%) |
| 10 to 14 Years | 9 (3.0%) | 35 (11.3%) |
| 15 to 19 Years | 23 (7.8%) | 4 (1.3%) |
| 20 to 24 Years | 6 (2.0%) | 2 (0.6%) |
| 25 to 29 Years | 14 (4.8%) | 31 (10.0%) |
| 30 to 34 Years | 28 (9.5%) | 29 (9.4%) |
| 35 to 39 Years | 6 (2.0%) | 20 (6.5%) |
| 40 to 44 Years | 18 (6.1%) | 30 (9.7%) |
| 45 to 49 Years | 48 (16.3%) | 5 (1.6%) |
| 50 to 54 Years | 9 (3.0%) | 11 (3.6%) |
| 55 to 59 Years | 19 (6.4%) | 26 (8.4%) |
| 60 to 64 Years | 17 (5.8%) | 28 (9.1%) |
| 65 to 69 Years | 23 (7.8%) | 23 (7.4%) |
| 70 to 74 Years | 8 (2.7%) | 21 (6.8%) |
| 75 to 79 Years | 13 (4.4%) | 19 (6.1%) |
| 80 to 84 Years | 17 (5.8%) | 12 (3.9%) |
| 85 Years and over | 5 (1.7%) | 4 (1.3%) |
| Total | 295 (100.0%) | 309 (100.0%) |
Families and Households in Mountain View
Median Family Size in Mountain View
The median family size in Mountain View is 2.47 persons per family, with married-couple families (159 | 80.7%) accounting for the largest median family size of 2.57 persons per family. On the other hand, single female/mother families (27 | 13.7%) represent the smallest median family size with 2.00 persons per family.
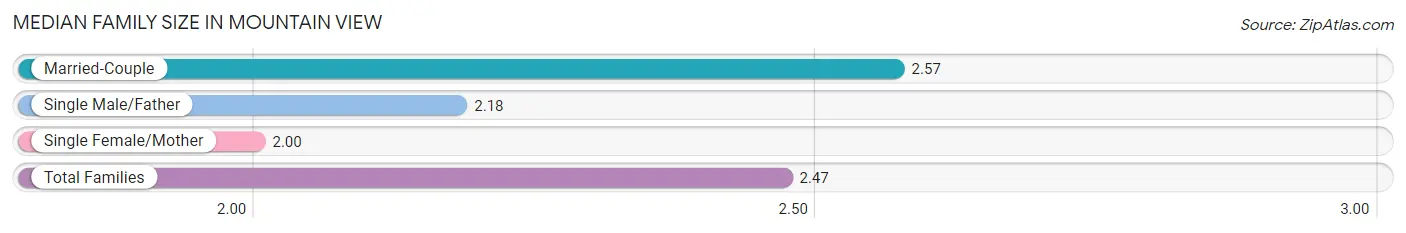
| Family Type | # Families | Family Size |
| Married-Couple | 159 (80.7%) | 2.57 |
| Single Male/Father | 11 (5.6%) | 2.18 |
| Single Female/Mother | 27 (13.7%) | 2.00 |
| Total Families | 197 (100.0%) | 2.47 |
Median Household Size in Mountain View
The median household size in Mountain View is 2.10 persons per household, with married-couple households (159 | 55.4%) accounting for the largest median household size of 2.6 persons per household. non-family households (90 | 31.4%) represent the smallest median household size with 1.26 persons per household.
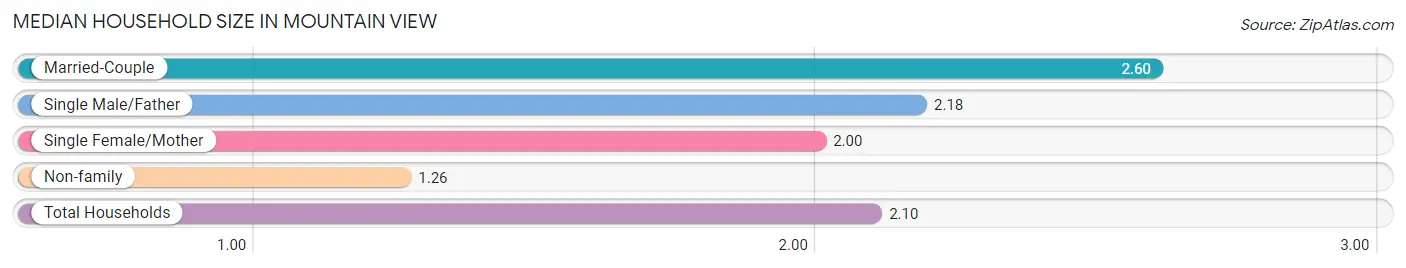
| Household Type | # Households | Household Size |
| Married-Couple | 159 (55.4%) | 2.60 |
| Single Male/Father | 11 (3.8%) | 2.18 |
| Single Female/Mother | 27 (9.4%) | 2.00 |
| Non-family | 90 (31.4%) | 1.26 |
| Total Households | 287 (100.0%) | 2.10 |
Household Size by Marriage Status in Mountain View
Out of a total of 287 households in Mountain View, 197 (68.6%) are family households, while 90 (31.4%) are nonfamily households. The most numerous type of family households are 2-person households, comprising 85, and the most common type of nonfamily households are 1-person households, comprising 69.
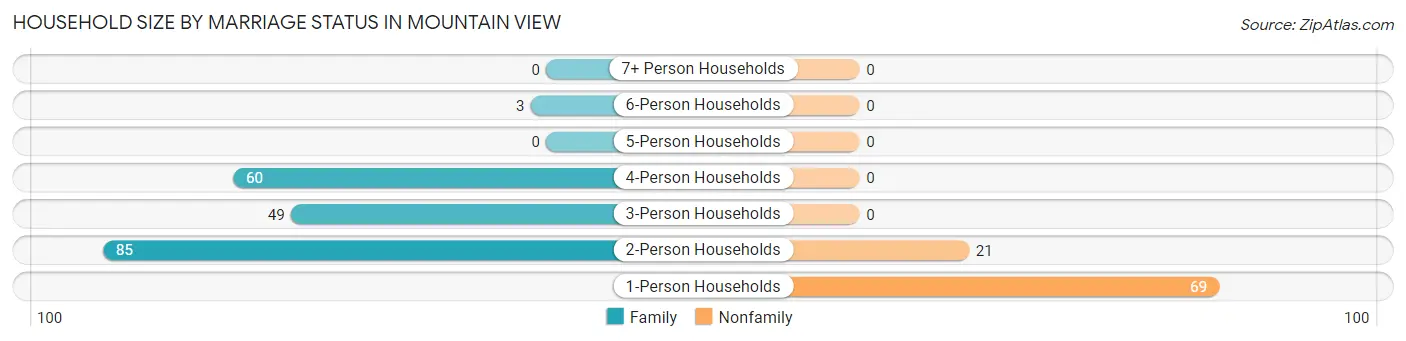
| Household Size | Family Households | Nonfamily Households |
| 1-Person Households | - | 69 (24.0%) |
| 2-Person Households | 85 (29.6%) | 21 (7.3%) |
| 3-Person Households | 49 (17.1%) | 0 (0.0%) |
| 4-Person Households | 60 (20.9%) | 0 (0.0%) |
| 5-Person Households | 0 (0.0%) | 0 (0.0%) |
| 6-Person Households | 3 (1.1%) | 0 (0.0%) |
| 7+ Person Households | 0 (0.0%) | 0 (0.0%) |
| Total | 197 (68.6%) | 90 (31.4%) |
Female Fertility in Mountain View
Fertility by Age in Mountain View
Average fertility rate in Mountain View is 33.0 births per 1,000 women. Women in the age bracket of 35 to 50 years have the highest fertility rate with 71.0 births per 1,000 women. Women in the age bracket of 35 to 50 years acount for 100.0% of all women with births.
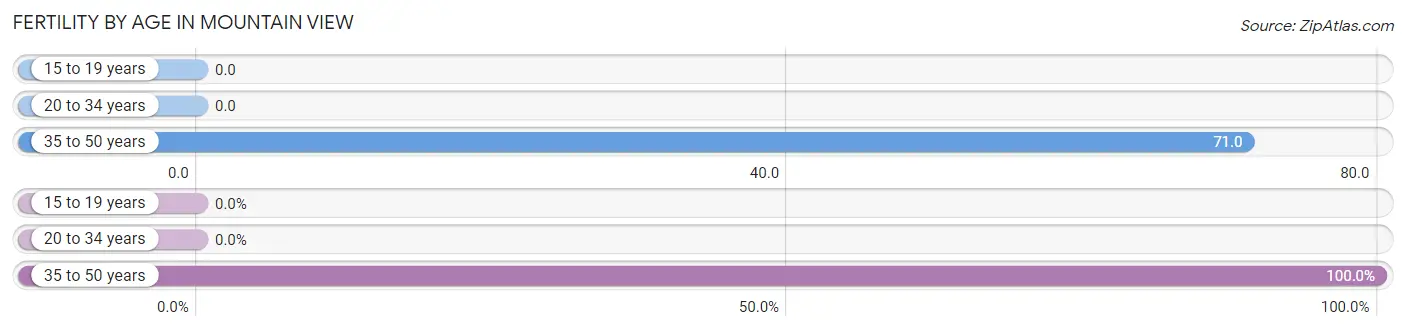
| Age Bracket | Women with Births | Births / 1,000 Women |
| 15 to 19 years | 0 (0.0%) | 0.0 |
| 20 to 34 years | 0 (0.0%) | 0.0 |
| 35 to 50 years | 4 (100.0%) | 71.0 |
| Total | 4 (100.0%) | 33.0 |
Fertility by Age by Marriage Status in Mountain View
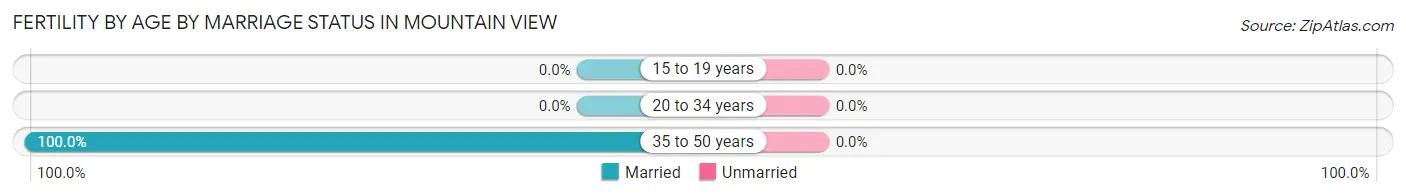
| Age Bracket | Married | Unmarried |
| 15 to 19 years | 0 (0.0%) | 0 (0.0%) |
| 20 to 34 years | 0 (0.0%) | 0 (0.0%) |
| 35 to 50 years | 4 (100.0%) | 0 (0.0%) |
| Total | 4 (100.0%) | 0 (0.0%) |
Fertility by Education in Mountain View
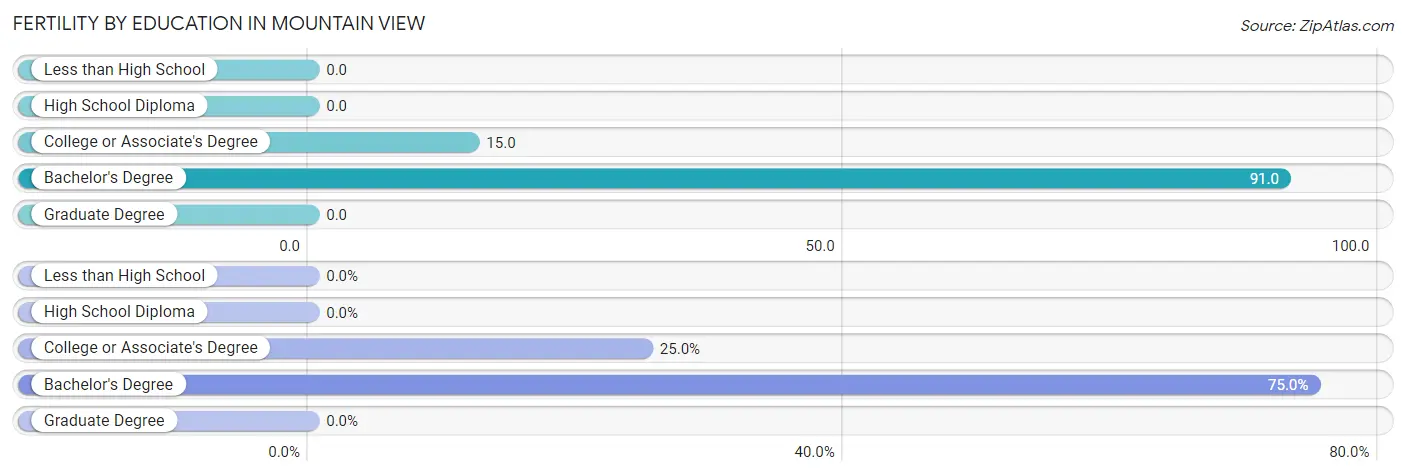
| Educational Attainment | Women with Births | Births / 1,000 Women |
| Less than High School | 0 (0.0%) | 0.0 |
| High School Diploma | 0 (0.0%) | 0.0 |
| College or Associate's Degree | 1 (25.0%) | 15.0 |
| Bachelor's Degree | 3 (75.0%) | 91.0 |
| Graduate Degree | 0 (0.0%) | 0.0 |
| Total | 4 (100.0%) | 33.0 |
Fertility by Education by Marriage Status in Mountain View
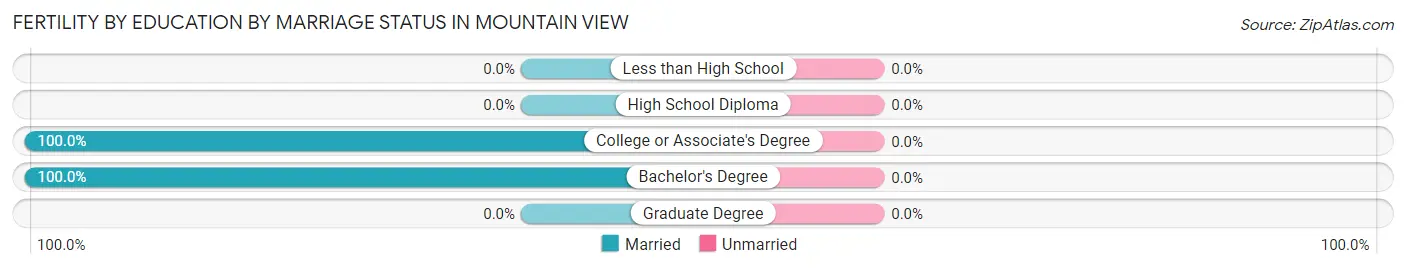
| Educational Attainment | Married | Unmarried |
| Less than High School | 0 (0.0%) | 0 (0.0%) |
| High School Diploma | 0 (0.0%) | 0 (0.0%) |
| College or Associate's Degree | 1 (100.0%) | 0 (0.0%) |
| Bachelor's Degree | 3 (100.0%) | 0 (0.0%) |
| Graduate Degree | 0 (0.0%) | 0 (0.0%) |
| Total | 4 (100.0%) | 0 (0.0%) |
Employment Characteristics in Mountain View
Employment by Class of Employer in Mountain View
Among the 271 employed individuals in Mountain View, private company employees (135 | 49.8%), state government employees (28 | 10.3%), and self-employed (not incorporated) (27 | 10.0%) make up the most common classes of employment.
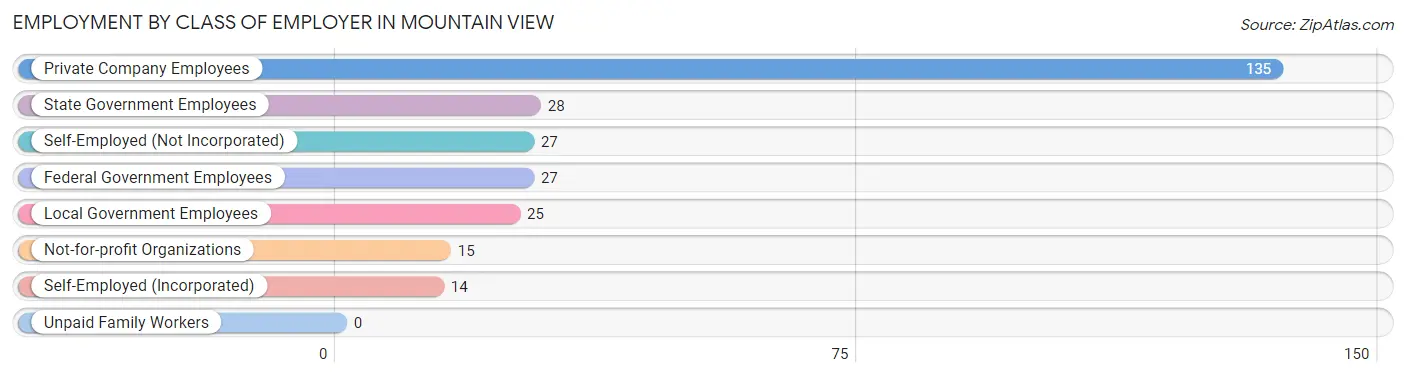
| Employer Class | # Employees | % Employees |
| Private Company Employees | 135 | 49.8% |
| Self-Employed (Incorporated) | 14 | 5.2% |
| Self-Employed (Not Incorporated) | 27 | 10.0% |
| Not-for-profit Organizations | 15 | 5.5% |
| Local Government Employees | 25 | 9.2% |
| State Government Employees | 28 | 10.3% |
| Federal Government Employees | 27 | 10.0% |
| Unpaid Family Workers | 0 | 0.0% |
| Total | 271 | 100.0% |
Employment Status by Age in Mountain View
According to the labor force statistics for Mountain View, out of the total population over 16 years of age (519), 56.1% or 291 individuals are in the labor force, with 0.7% or 2 of them unemployed. The age group with the highest labor force participation rate is 20 to 24 years, with 100.0% or 8 individuals in the labor force. Within the labor force, the 20 to 24 years age range has the highest percentage of unemployed individuals, with 25.0% or 2 of them being unemployed.
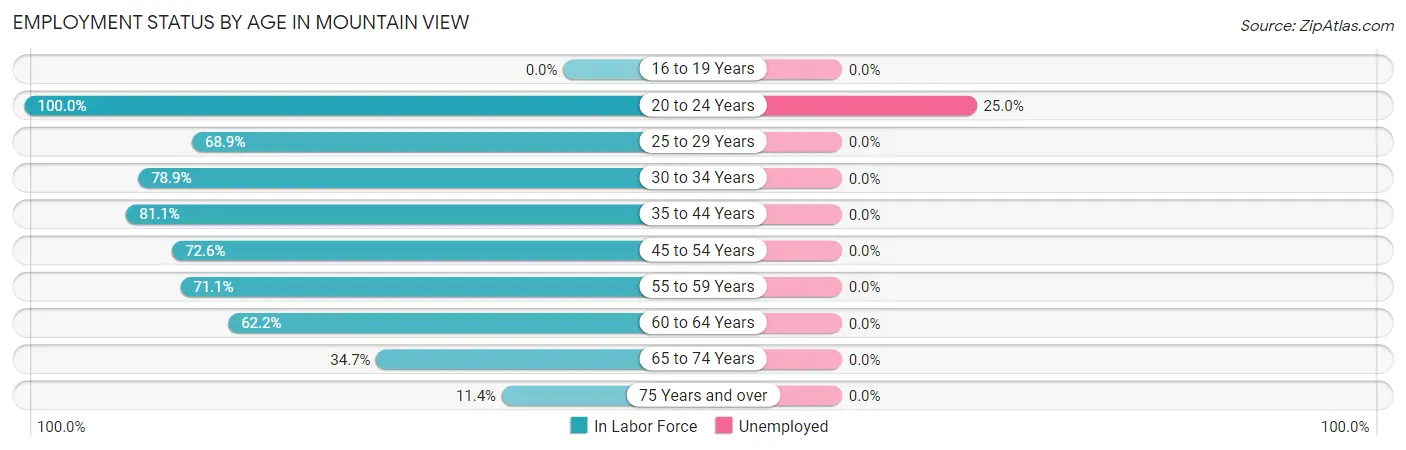
| Age Bracket | In Labor Force | Unemployed |
| 16 to 19 Years | 0 (0.0%) | 0 (0.0%) |
| 20 to 24 Years | 8 (100.0%) | 2 (25.0%) |
| 25 to 29 Years | 31 (68.9%) | 0 (0.0%) |
| 30 to 34 Years | 45 (78.9%) | 0 (0.0%) |
| 35 to 44 Years | 60 (81.1%) | 0 (0.0%) |
| 45 to 54 Years | 53 (72.6%) | 0 (0.0%) |
| 55 to 59 Years | 32 (71.1%) | 0 (0.0%) |
| 60 to 64 Years | 28 (62.2%) | 0 (0.0%) |
| 65 to 74 Years | 26 (34.7%) | 0 (0.0%) |
| 75 Years and over | 8 (11.4%) | 0 (0.0%) |
| Total | 291 (56.1%) | 2 (0.7%) |
Employment Status by Educational Attainment in Mountain View
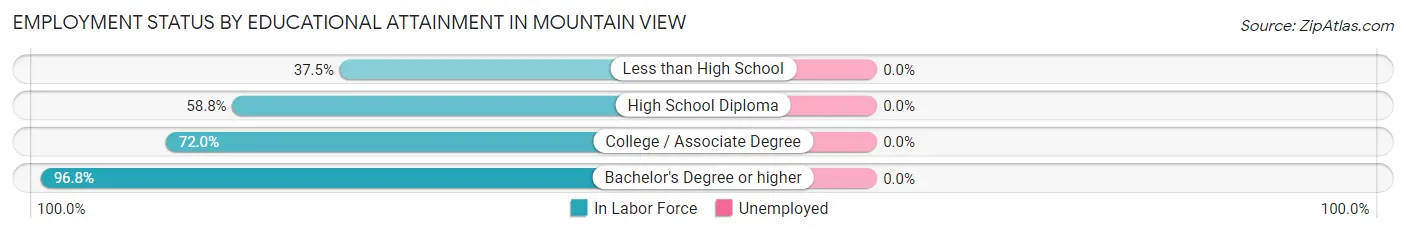
| Educational Attainment | In Labor Force | Unemployed |
| Less than High School | 3 (37.5%) | 0 (0.0%) |
| High School Diploma | 70 (58.8%) | 0 (0.0%) |
| College / Associate Degree | 85 (72.0%) | 0 (0.0%) |
| Bachelor's Degree or higher | 91 (96.8%) | 0 (0.0%) |
| Total | 249 (73.5%) | 0 (0.0%) |
Employment Occupations by Sex in Mountain View
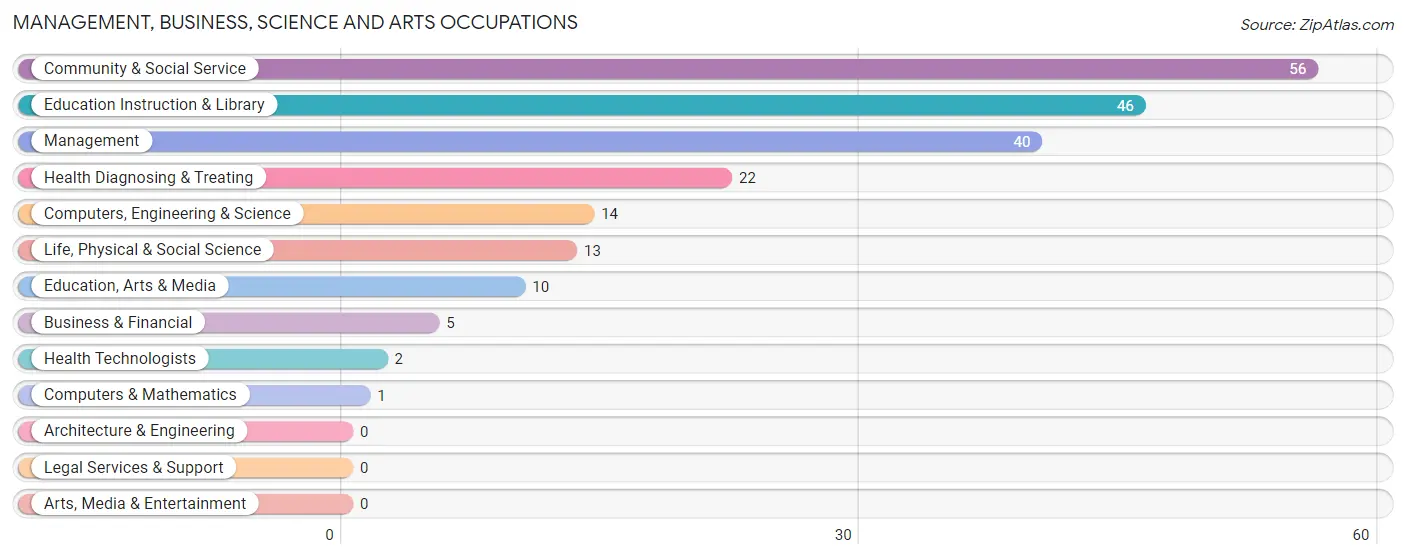
Management, Business, Science and Arts Occupations
The most common Management, Business, Science and Arts occupations in Mountain View are Community & Social Service (56 | 19.4%), Education Instruction & Library (46 | 15.9%), Management (40 | 13.8%), Health Diagnosing & Treating (22 | 7.6%), and Computers, Engineering & Science (14 | 4.8%).
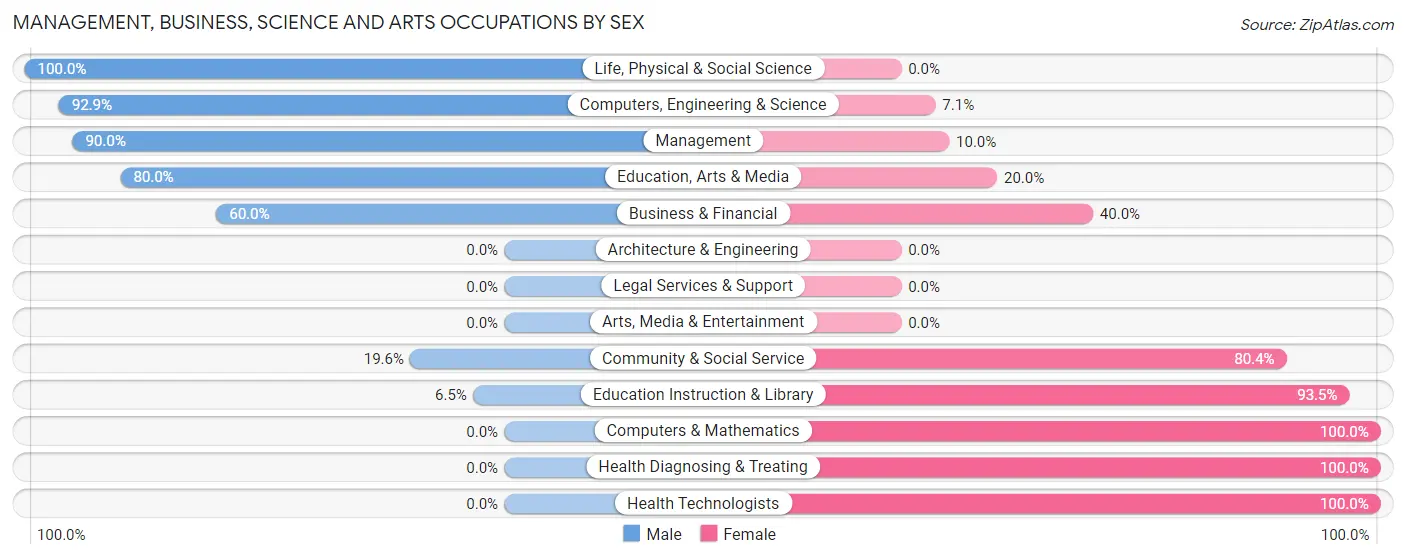
Management, Business, Science and Arts Occupations by Sex
Within the Management, Business, Science and Arts occupations in Mountain View, the most male-oriented occupations are Life, Physical & Social Science (100.0%), Computers, Engineering & Science (92.9%), and Management (90.0%), while the most female-oriented occupations are Computers & Mathematics (100.0%), Health Diagnosing & Treating (100.0%), and Health Technologists (100.0%).
| Occupation | Male | Female |
| Management | 36 (90.0%) | 4 (10.0%) |
| Business & Financial | 3 (60.0%) | 2 (40.0%) |
| Computers, Engineering & Science | 13 (92.9%) | 1 (7.1%) |
| Computers & Mathematics | 0 (0.0%) | 1 (100.0%) |
| Architecture & Engineering | 0 (0.0%) | 0 (0.0%) |
| Life, Physical & Social Science | 13 (100.0%) | 0 (0.0%) |
| Community & Social Service | 11 (19.6%) | 45 (80.4%) |
| Education, Arts & Media | 8 (80.0%) | 2 (20.0%) |
| Legal Services & Support | 0 (0.0%) | 0 (0.0%) |
| Education Instruction & Library | 3 (6.5%) | 43 (93.5%) |
| Arts, Media & Entertainment | 0 (0.0%) | 0 (0.0%) |
| Health Diagnosing & Treating | 0 (0.0%) | 22 (100.0%) |
| Health Technologists | 0 (0.0%) | 2 (100.0%) |
| Total (Category) | 63 (46.0%) | 74 (54.0%) |
| Total (Overall) | 146 (50.5%) | 143 (49.5%) |
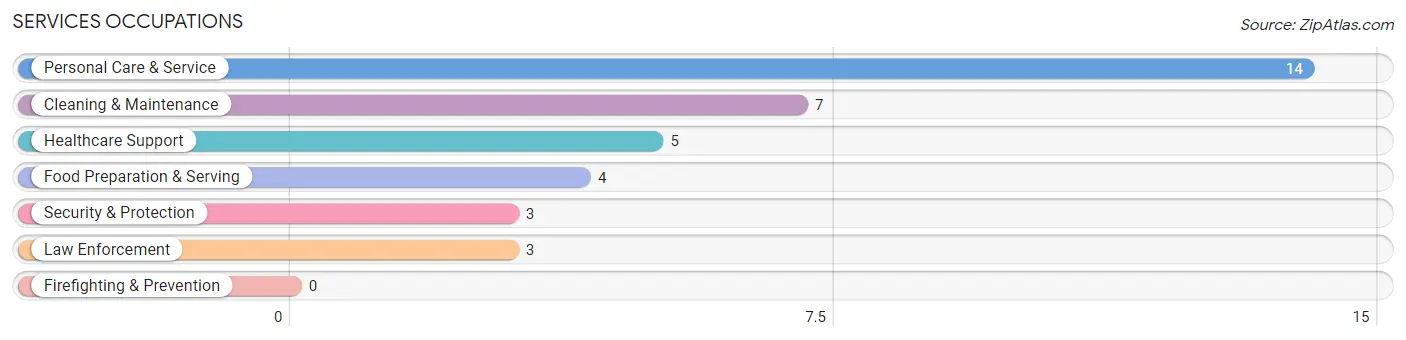
Services Occupations
The most common Services occupations in Mountain View are Personal Care & Service (14 | 4.8%), Cleaning & Maintenance (7 | 2.4%), Healthcare Support (5 | 1.7%), Food Preparation & Serving (4 | 1.4%), and Security & Protection (3 | 1.0%).
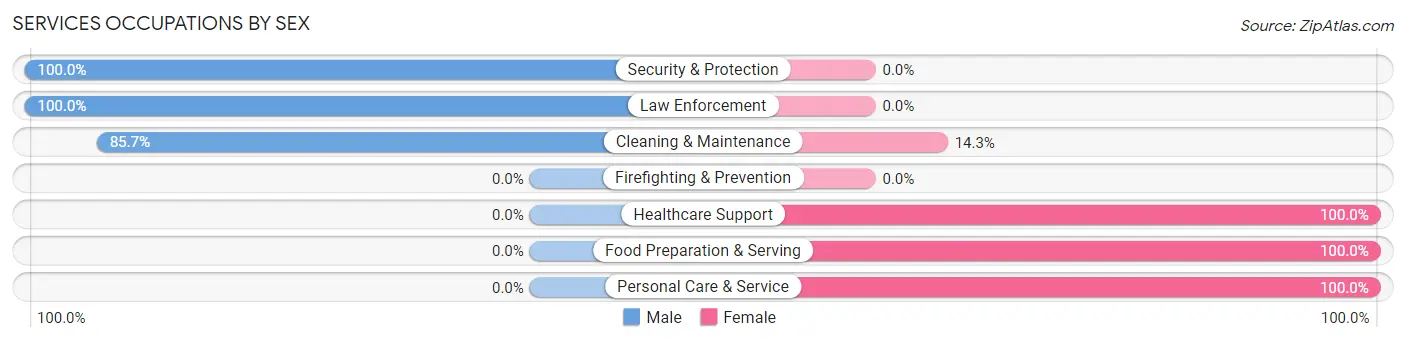
Services Occupations by Sex
Within the Services occupations in Mountain View, the most male-oriented occupations are Security & Protection (100.0%), Law Enforcement (100.0%), and Cleaning & Maintenance (85.7%), while the most female-oriented occupations are Healthcare Support (100.0%), Food Preparation & Serving (100.0%), and Personal Care & Service (100.0%).
| Occupation | Male | Female |
| Healthcare Support | 0 (0.0%) | 5 (100.0%) |
| Security & Protection | 3 (100.0%) | 0 (0.0%) |
| Firefighting & Prevention | 0 (0.0%) | 0 (0.0%) |
| Law Enforcement | 3 (100.0%) | 0 (0.0%) |
| Food Preparation & Serving | 0 (0.0%) | 4 (100.0%) |
| Cleaning & Maintenance | 6 (85.7%) | 1 (14.3%) |
| Personal Care & Service | 0 (0.0%) | 14 (100.0%) |
| Total (Category) | 9 (27.3%) | 24 (72.7%) |
| Total (Overall) | 146 (50.5%) | 143 (49.5%) |
Sales and Office Occupations
The most common Sales and Office occupations in Mountain View are Sales & Related (30 | 10.4%), and Office & Administration (20 | 6.9%).
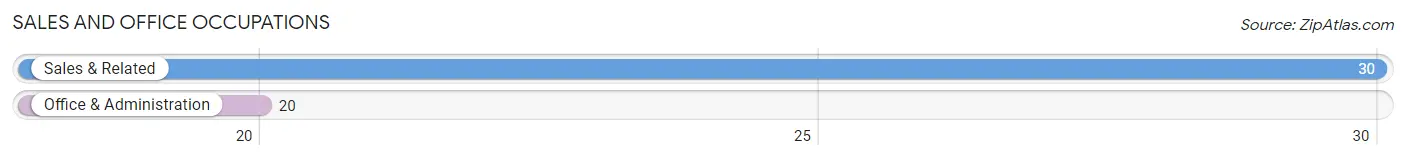
Sales and Office Occupations by Sex
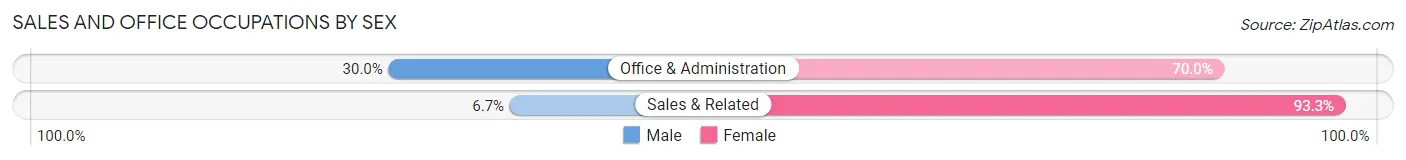
| Occupation | Male | Female |
| Sales & Related | 2 (6.7%) | 28 (93.3%) |
| Office & Administration | 6 (30.0%) | 14 (70.0%) |
| Total (Category) | 8 (16.0%) | 42 (84.0%) |
| Total (Overall) | 146 (50.5%) | 143 (49.5%) |
Natural Resources, Construction and Maintenance Occupations
The most common Natural Resources, Construction and Maintenance occupations in Mountain View are Construction & Extraction (19 | 6.6%), Farming, Fishing & Forestry (15 | 5.2%), and Installation, Maintenance & Repair (8 | 2.8%).
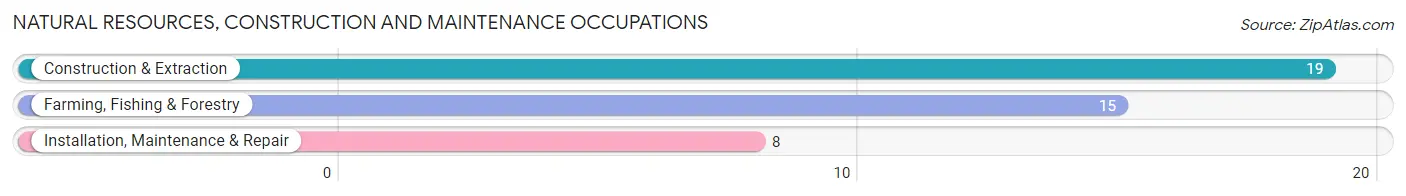
Natural Resources, Construction and Maintenance Occupations by Sex
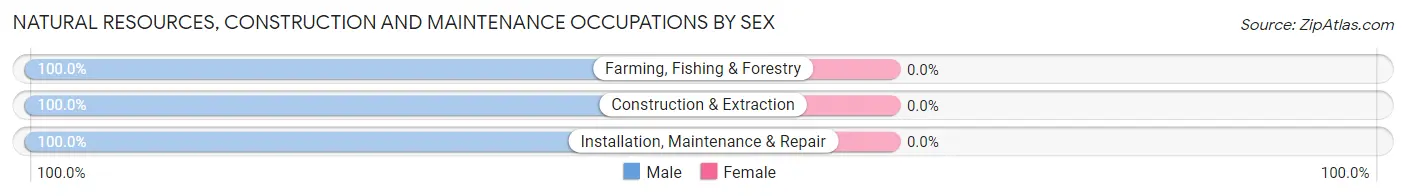
| Occupation | Male | Female |
| Farming, Fishing & Forestry | 15 (100.0%) | 0 (0.0%) |
| Construction & Extraction | 19 (100.0%) | 0 (0.0%) |
| Installation, Maintenance & Repair | 8 (100.0%) | 0 (0.0%) |
| Total (Category) | 42 (100.0%) | 0 (0.0%) |
| Total (Overall) | 146 (50.5%) | 143 (49.5%) |
Production, Transportation and Moving Occupations
The most common Production, Transportation and Moving occupations in Mountain View are Transportation (21 | 7.3%), Production (4 | 1.4%), and Material Moving (2 | 0.7%).
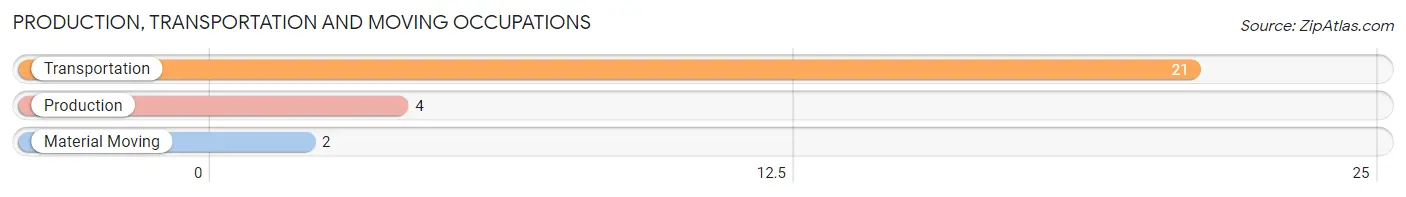
Production, Transportation and Moving Occupations by Sex
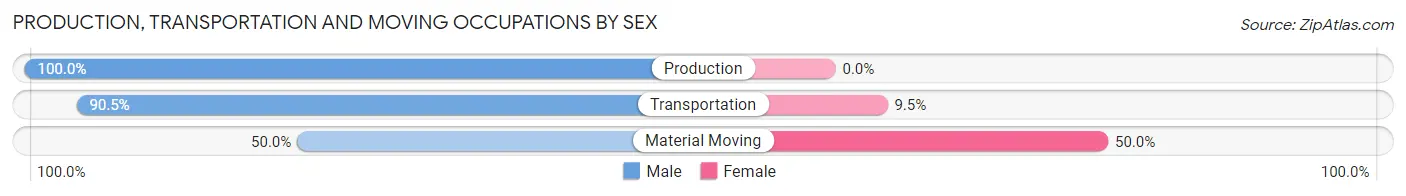
| Occupation | Male | Female |
| Production | 4 (100.0%) | 0 (0.0%) |
| Transportation | 19 (90.5%) | 2 (9.5%) |
| Material Moving | 1 (50.0%) | 1 (50.0%) |
| Total (Category) | 24 (88.9%) | 3 (11.1%) |
| Total (Overall) | 146 (50.5%) | 143 (49.5%) |
Employment Industries by Sex in Mountain View
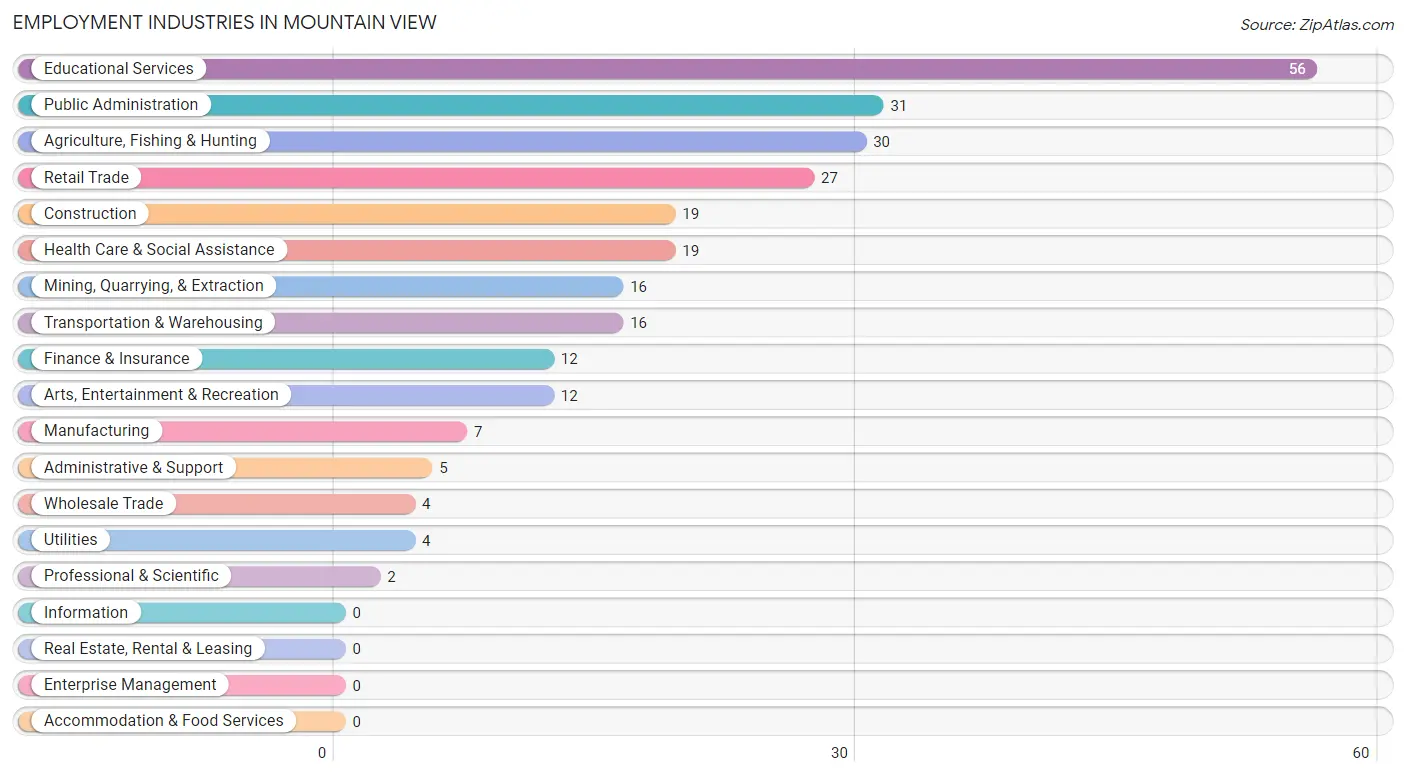
Employment Industries in Mountain View
The major employment industries in Mountain View include Educational Services (56 | 19.4%), Public Administration (31 | 10.7%), Agriculture, Fishing & Hunting (30 | 10.4%), Retail Trade (27 | 9.3%), and Construction (19 | 6.6%).
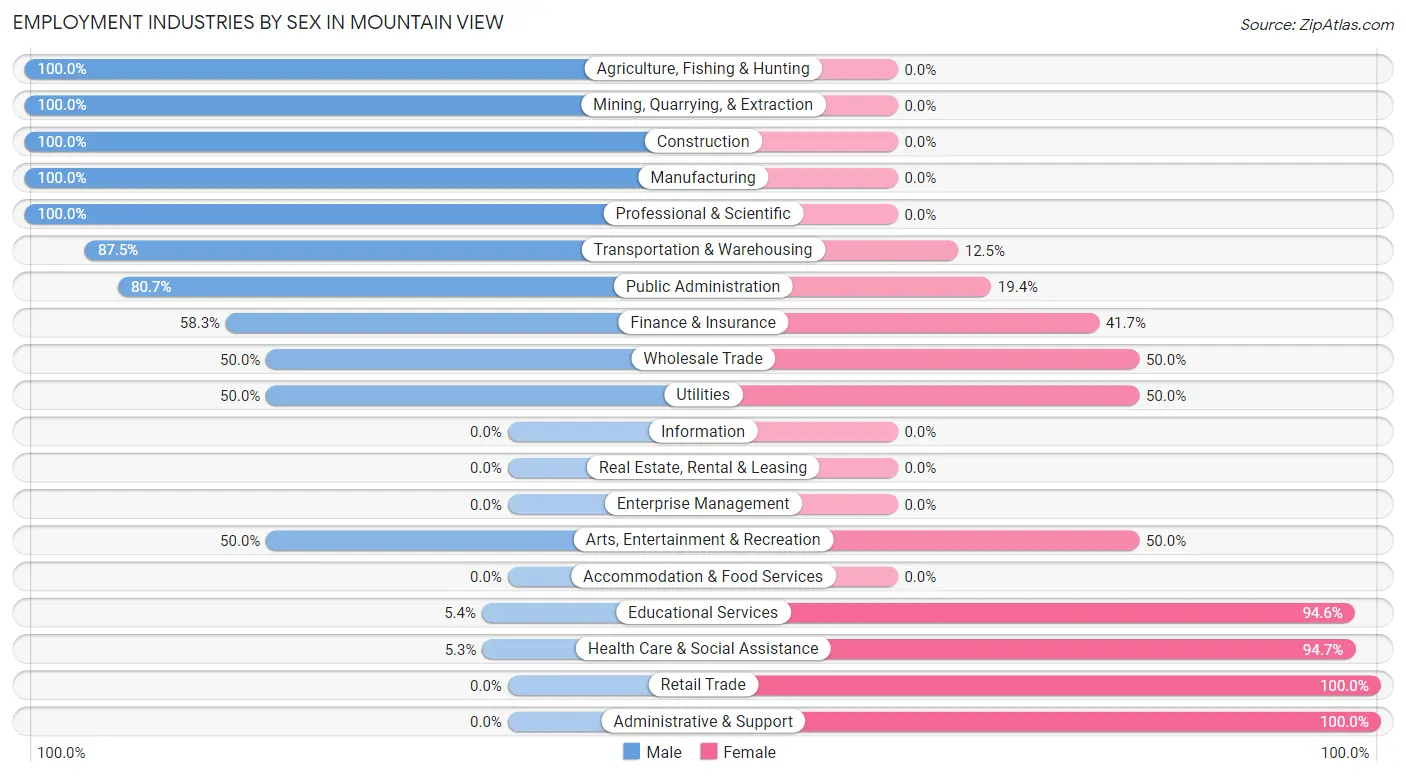
Employment Industries by Sex in Mountain View
The Mountain View industries that see more men than women are Agriculture, Fishing & Hunting (100.0%), Mining, Quarrying, & Extraction (100.0%), and Construction (100.0%), whereas the industries that tend to have a higher number of women are Retail Trade (100.0%), Administrative & Support (100.0%), and Health Care & Social Assistance (94.7%).
| Industry | Male | Female |
| Agriculture, Fishing & Hunting | 30 (100.0%) | 0 (0.0%) |
| Mining, Quarrying, & Extraction | 16 (100.0%) | 0 (0.0%) |
| Construction | 19 (100.0%) | 0 (0.0%) |
| Manufacturing | 7 (100.0%) | 0 (0.0%) |
| Wholesale Trade | 2 (50.0%) | 2 (50.0%) |
| Retail Trade | 0 (0.0%) | 27 (100.0%) |
| Transportation & Warehousing | 14 (87.5%) | 2 (12.5%) |
| Utilities | 2 (50.0%) | 2 (50.0%) |
| Information | 0 (0.0%) | 0 (0.0%) |
| Finance & Insurance | 7 (58.3%) | 5 (41.7%) |
| Real Estate, Rental & Leasing | 0 (0.0%) | 0 (0.0%) |
| Professional & Scientific | 2 (100.0%) | 0 (0.0%) |
| Enterprise Management | 0 (0.0%) | 0 (0.0%) |
| Administrative & Support | 0 (0.0%) | 5 (100.0%) |
| Educational Services | 3 (5.4%) | 53 (94.6%) |
| Health Care & Social Assistance | 1 (5.3%) | 18 (94.7%) |
| Arts, Entertainment & Recreation | 6 (50.0%) | 6 (50.0%) |
| Accommodation & Food Services | 0 (0.0%) | 0 (0.0%) |
| Public Administration | 25 (80.6%) | 6 (19.4%) |
| Total | 146 (50.5%) | 143 (49.5%) |
Education in Mountain View
School Enrollment in Mountain View
The most common levels of schooling among the 96 students in Mountain View are middle school (35 | 36.5%), high school (29 | 30.2%), and college / undergraduate (11 | 11.5%).
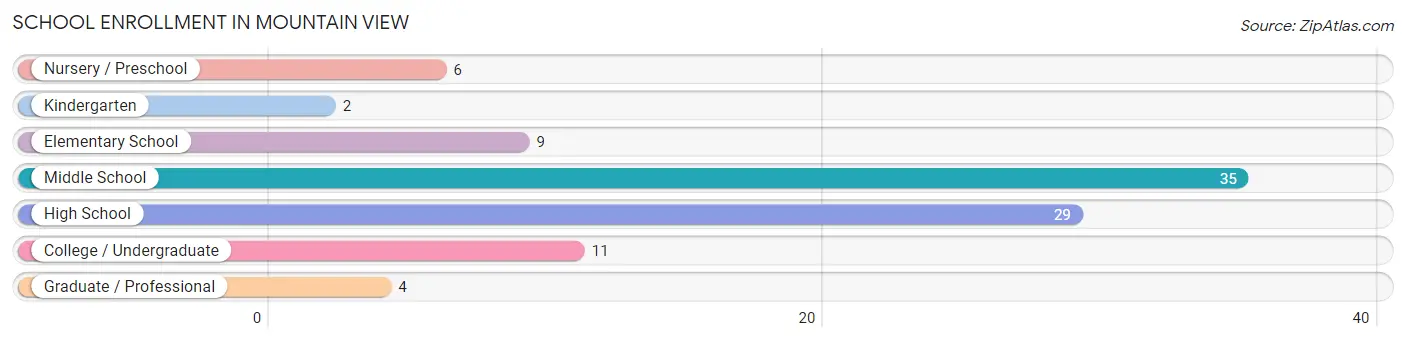
| School Level | # Students | % Students |
| Nursery / Preschool | 6 | 6.2% |
| Kindergarten | 2 | 2.1% |
| Elementary School | 9 | 9.4% |
| Middle School | 35 | 36.5% |
| High School | 29 | 30.2% |
| College / Undergraduate | 11 | 11.5% |
| Graduate / Professional | 4 | 4.2% |
| Total | 96 | 100.0% |
School Enrollment by Age by Funding Source in Mountain View
Out of a total of 96 students who are enrolled in schools in Mountain View, 7 (7.3%) attend a private institution, while the remaining 89 (92.7%) are enrolled in public schools. The age group of 15 to 17 year olds has the highest likelihood of being enrolled in private schools, with 4 (14.8% in the age bracket) enrolled. Conversely, the age group of 5 to 9 year old has the lowest likelihood of being enrolled in a private school, with 17 (100.0% in the age bracket) attending a public institution.
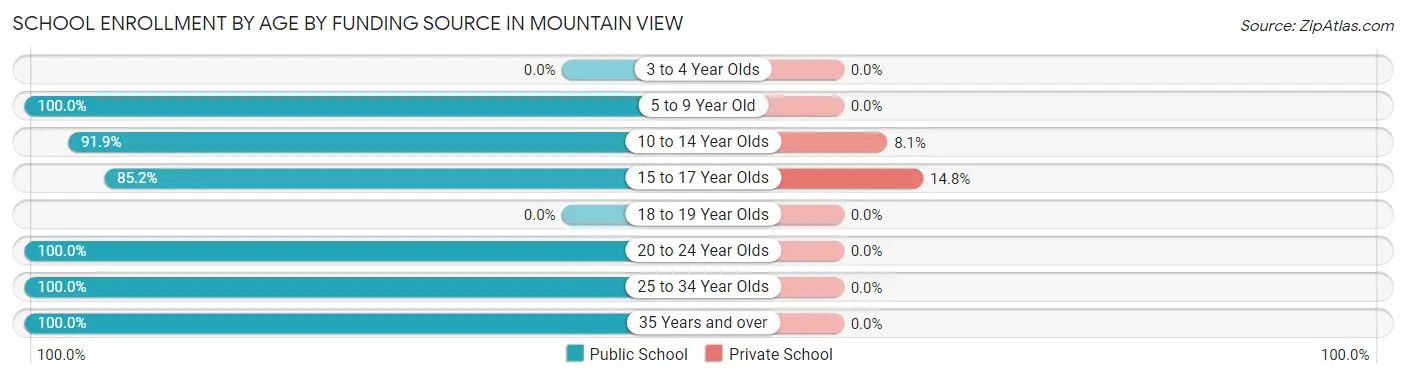
| Age Bracket | Public School | Private School |
| 3 to 4 Year Olds | 0 (0.0%) | 0 (0.0%) |
| 5 to 9 Year Old | 17 (100.0%) | 0 (0.0%) |
| 10 to 14 Year Olds | 34 (91.9%) | 3 (8.1%) |
| 15 to 17 Year Olds | 23 (85.2%) | 4 (14.8%) |
| 18 to 19 Year Olds | 0 (0.0%) | 0 (0.0%) |
| 20 to 24 Year Olds | 2 (100.0%) | 0 (0.0%) |
| 25 to 34 Year Olds | 4 (100.0%) | 0 (0.0%) |
| 35 Years and over | 9 (100.0%) | 0 (0.0%) |
| Total | 89 (92.7%) | 7 (7.3%) |
Educational Attainment by Field of Study in Mountain View
Education (43 | 35.2%), arts & humanities (20 | 16.4%), science & technology (16 | 13.1%), business (14 | 11.5%), and liberal arts & history (11 | 9.0%) are the most common fields of study among 122 individuals in Mountain View who have obtained a bachelor's degree or higher.
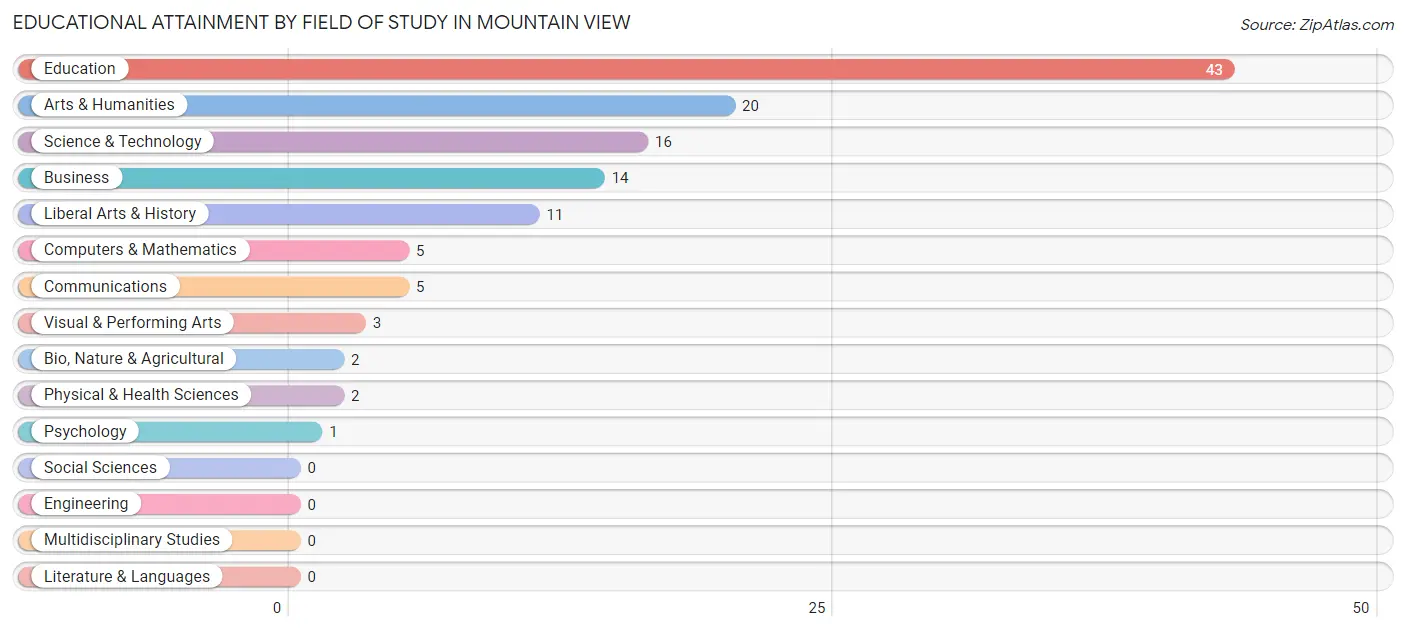
| Field of Study | # Graduates | % Graduates |
| Computers & Mathematics | 5 | 4.1% |
| Bio, Nature & Agricultural | 2 | 1.6% |
| Physical & Health Sciences | 2 | 1.6% |
| Psychology | 1 | 0.8% |
| Social Sciences | 0 | 0.0% |
| Engineering | 0 | 0.0% |
| Multidisciplinary Studies | 0 | 0.0% |
| Science & Technology | 16 | 13.1% |
| Business | 14 | 11.5% |
| Education | 43 | 35.2% |
| Literature & Languages | 0 | 0.0% |
| Liberal Arts & History | 11 | 9.0% |
| Visual & Performing Arts | 3 | 2.5% |
| Communications | 5 | 4.1% |
| Arts & Humanities | 20 | 16.4% |
| Total | 122 | 100.0% |
Transportation & Commute in Mountain View
Vehicle Availability by Sex in Mountain View
The most prevalent vehicle ownership categories in Mountain View are males with 2 vehicles (66, accounting for 48.2%) and females with 2 vehicles (56, making up 49.2%).
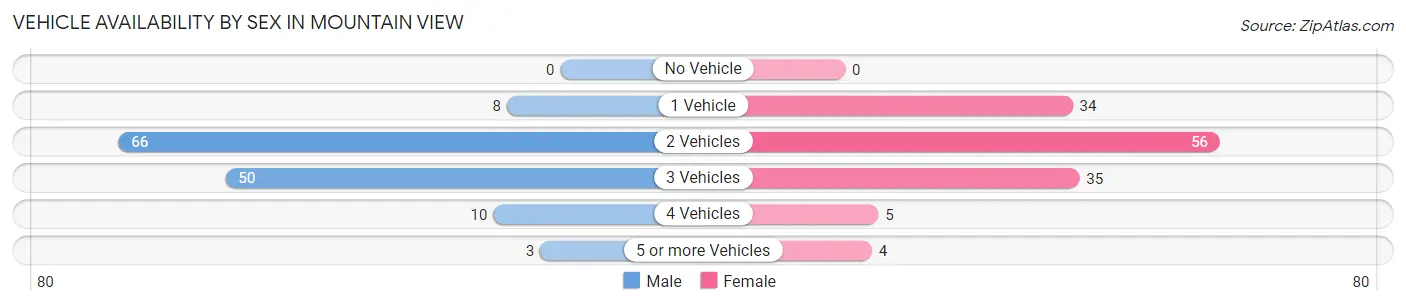
| Vehicles Available | Male | Female |
| No Vehicle | 0 (0.0%) | 0 (0.0%) |
| 1 Vehicle | 8 (5.8%) | 34 (25.4%) |
| 2 Vehicles | 66 (48.2%) | 56 (41.8%) |
| 3 Vehicles | 50 (36.5%) | 35 (26.1%) |
| 4 Vehicles | 10 (7.3%) | 5 (3.7%) |
| 5 or more Vehicles | 3 (2.2%) | 4 (3.0%) |
| Total | 137 (100.0%) | 134 (100.0%) |
Commute Time in Mountain View
The most frequently occuring commute durations in Mountain View are 5 to 9 minutes (63 commuters, 23.9%), less than 5 minutes (42 commuters, 15.9%), and 20 to 24 minutes (27 commuters, 10.2%).
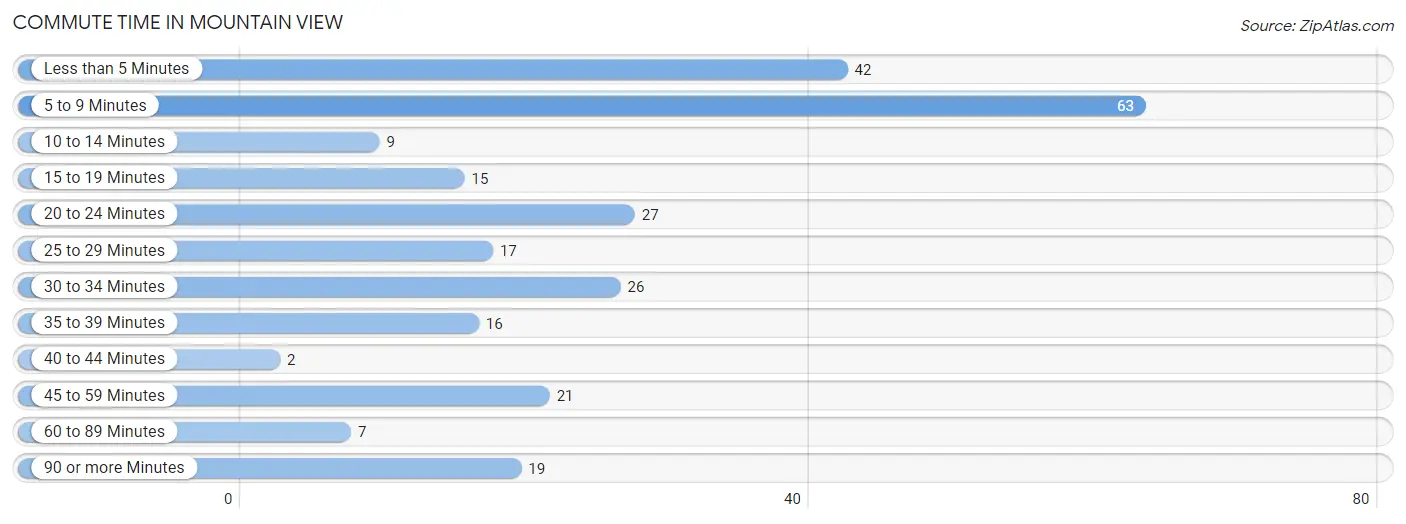
| Commute Time | # Commuters | % Commuters |
| Less than 5 Minutes | 42 | 15.9% |
| 5 to 9 Minutes | 63 | 23.9% |
| 10 to 14 Minutes | 9 | 3.4% |
| 15 to 19 Minutes | 15 | 5.7% |
| 20 to 24 Minutes | 27 | 10.2% |
| 25 to 29 Minutes | 17 | 6.4% |
| 30 to 34 Minutes | 26 | 9.9% |
| 35 to 39 Minutes | 16 | 6.1% |
| 40 to 44 Minutes | 2 | 0.8% |
| 45 to 59 Minutes | 21 | 8.0% |
| 60 to 89 Minutes | 7 | 2.6% |
| 90 or more Minutes | 19 | 7.2% |
Commute Time by Sex in Mountain View
The most common commute times in Mountain View are 5 to 9 minutes (30 commuters, 21.9%) for males and 5 to 9 minutes (33 commuters, 26.0%) for females.
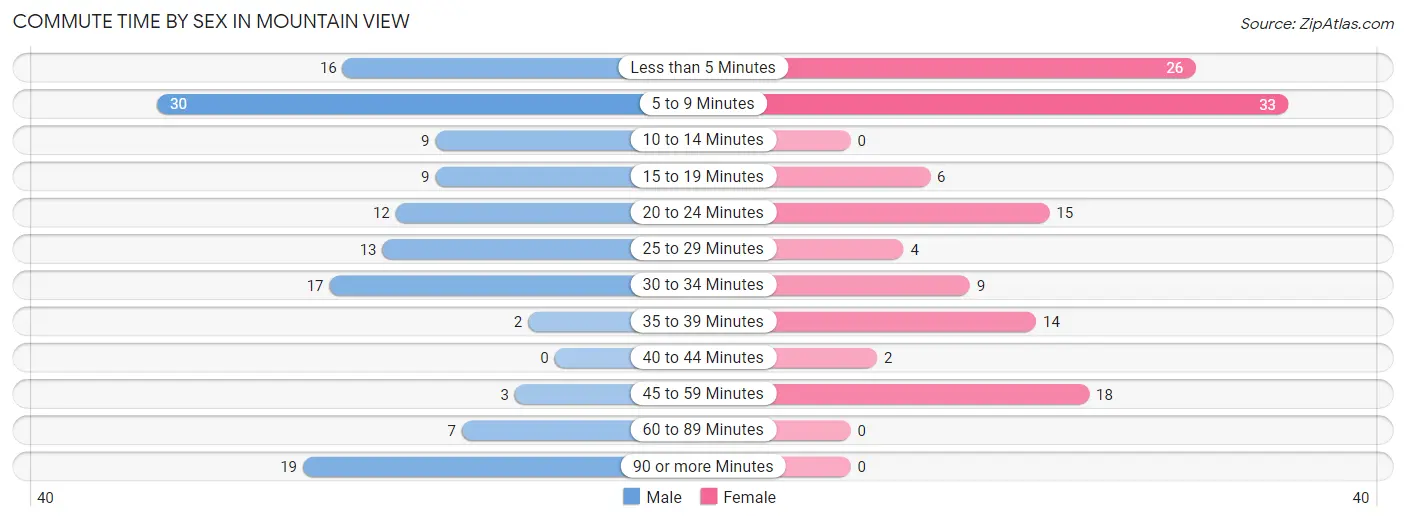
| Commute Time | Male | Female |
| Less than 5 Minutes | 16 (11.7%) | 26 (20.5%) |
| 5 to 9 Minutes | 30 (21.9%) | 33 (26.0%) |
| 10 to 14 Minutes | 9 (6.6%) | 0 (0.0%) |
| 15 to 19 Minutes | 9 (6.6%) | 6 (4.7%) |
| 20 to 24 Minutes | 12 (8.8%) | 15 (11.8%) |
| 25 to 29 Minutes | 13 (9.5%) | 4 (3.2%) |
| 30 to 34 Minutes | 17 (12.4%) | 9 (7.1%) |
| 35 to 39 Minutes | 2 (1.5%) | 14 (11.0%) |
| 40 to 44 Minutes | 0 (0.0%) | 2 (1.6%) |
| 45 to 59 Minutes | 3 (2.2%) | 18 (14.2%) |
| 60 to 89 Minutes | 7 (5.1%) | 0 (0.0%) |
| 90 or more Minutes | 19 (13.9%) | 0 (0.0%) |
Time of Departure to Work by Sex in Mountain View
The most frequent times of departure to work in Mountain View are 7:30 AM to 7:59 AM (35, 25.6%) for males and 7:00 AM to 7:29 AM (45, 35.4%) for females.
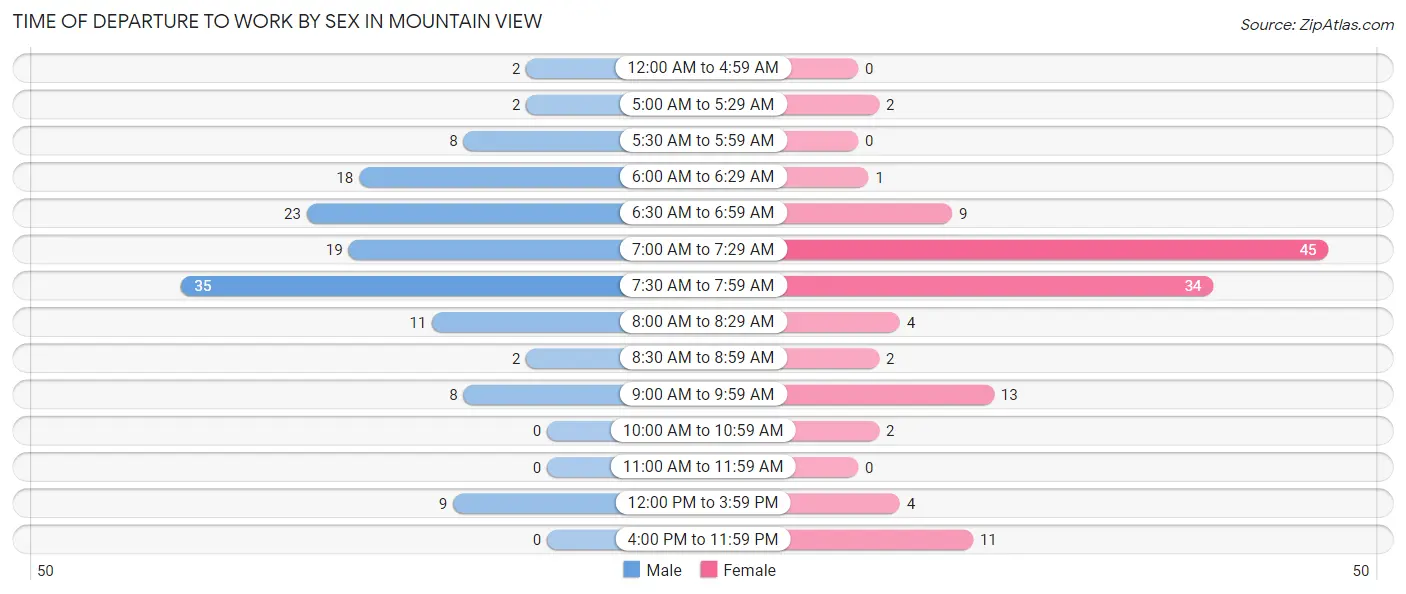
| Time of Departure | Male | Female |
| 12:00 AM to 4:59 AM | 2 (1.5%) | 0 (0.0%) |
| 5:00 AM to 5:29 AM | 2 (1.5%) | 2 (1.6%) |
| 5:30 AM to 5:59 AM | 8 (5.8%) | 0 (0.0%) |
| 6:00 AM to 6:29 AM | 18 (13.1%) | 1 (0.8%) |
| 6:30 AM to 6:59 AM | 23 (16.8%) | 9 (7.1%) |
| 7:00 AM to 7:29 AM | 19 (13.9%) | 45 (35.4%) |
| 7:30 AM to 7:59 AM | 35 (25.6%) | 34 (26.8%) |
| 8:00 AM to 8:29 AM | 11 (8.0%) | 4 (3.2%) |
| 8:30 AM to 8:59 AM | 2 (1.5%) | 2 (1.6%) |
| 9:00 AM to 9:59 AM | 8 (5.8%) | 13 (10.2%) |
| 10:00 AM to 10:59 AM | 0 (0.0%) | 2 (1.6%) |
| 11:00 AM to 11:59 AM | 0 (0.0%) | 0 (0.0%) |
| 12:00 PM to 3:59 PM | 9 (6.6%) | 4 (3.2%) |
| 4:00 PM to 11:59 PM | 0 (0.0%) | 11 (8.7%) |
| Total | 137 (100.0%) | 127 (100.0%) |
Housing Occupancy in Mountain View
Occupancy by Ownership in Mountain View
Of the total 287 dwellings in Mountain View, owner-occupied units account for 256 (89.2%), while renter-occupied units make up 31 (10.8%).
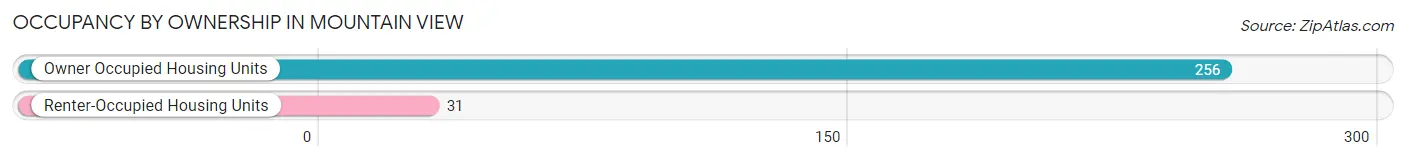
| Occupancy | # Housing Units | % Housing Units |
| Owner Occupied Housing Units | 256 | 89.2% |
| Renter-Occupied Housing Units | 31 | 10.8% |
| Total Occupied Housing Units | 287 | 100.0% |
Occupancy by Household Size in Mountain View
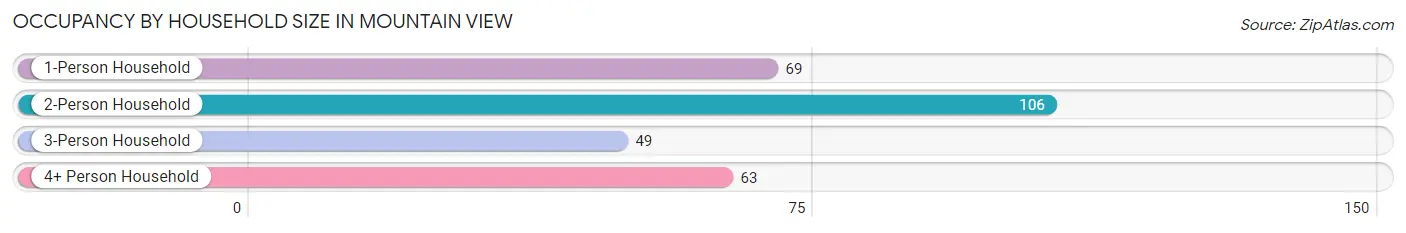
| Household Size | # Housing Units | % Housing Units |
| 1-Person Household | 69 | 24.0% |
| 2-Person Household | 106 | 36.9% |
| 3-Person Household | 49 | 17.1% |
| 4+ Person Household | 63 | 22.0% |
| Total Housing Units | 287 | 100.0% |
Occupancy by Ownership by Household Size in Mountain View
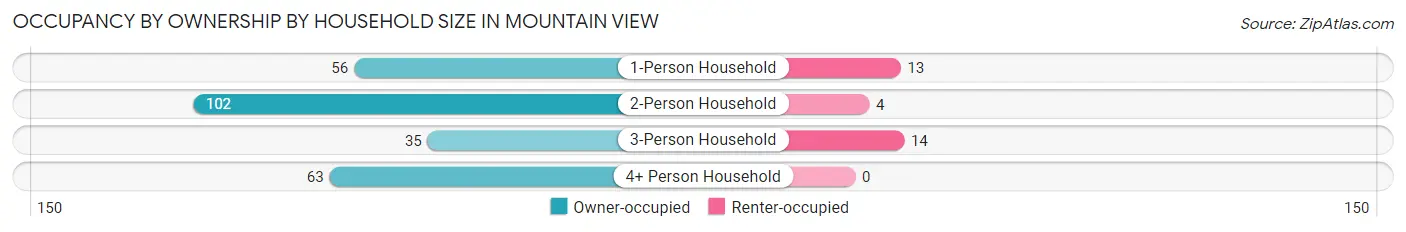
| Household Size | Owner-occupied | Renter-occupied |
| 1-Person Household | 56 (81.2%) | 13 (18.8%) |
| 2-Person Household | 102 (96.2%) | 4 (3.8%) |
| 3-Person Household | 35 (71.4%) | 14 (28.6%) |
| 4+ Person Household | 63 (100.0%) | 0 (0.0%) |
| Total Housing Units | 256 (89.2%) | 31 (10.8%) |
Occupancy by Educational Attainment in Mountain View
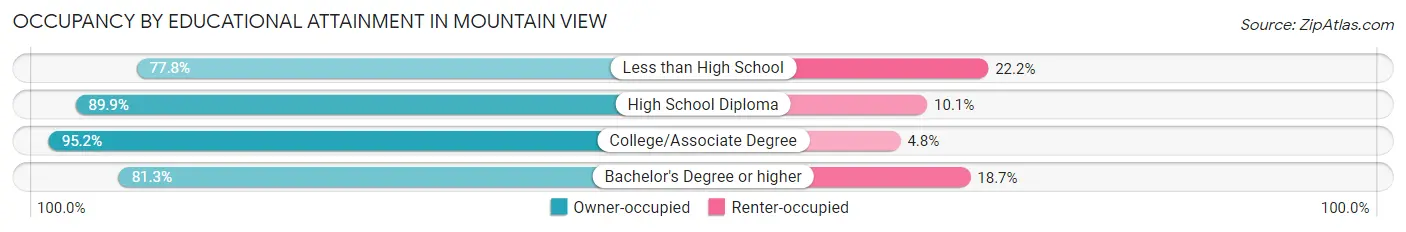
| Household Size | Owner-occupied | Renter-occupied |
| Less than High School | 7 (77.8%) | 2 (22.2%) |
| High School Diploma | 89 (89.9%) | 10 (10.1%) |
| College/Associate Degree | 99 (95.2%) | 5 (4.8%) |
| Bachelor's Degree or higher | 61 (81.3%) | 14 (18.7%) |
Occupancy by Age of Householder in Mountain View
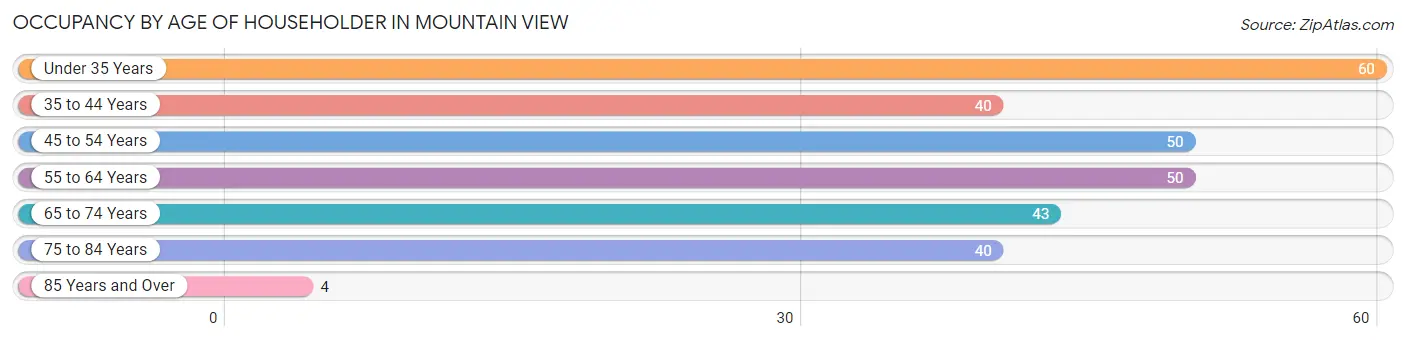
| Age Bracket | # Households | % Households |
| Under 35 Years | 60 | 20.9% |
| 35 to 44 Years | 40 | 13.9% |
| 45 to 54 Years | 50 | 17.4% |
| 55 to 64 Years | 50 | 17.4% |
| 65 to 74 Years | 43 | 15.0% |
| 75 to 84 Years | 40 | 13.9% |
| 85 Years and Over | 4 | 1.4% |
| Total | 287 | 100.0% |
Housing Finances in Mountain View
Median Income by Occupancy in Mountain View
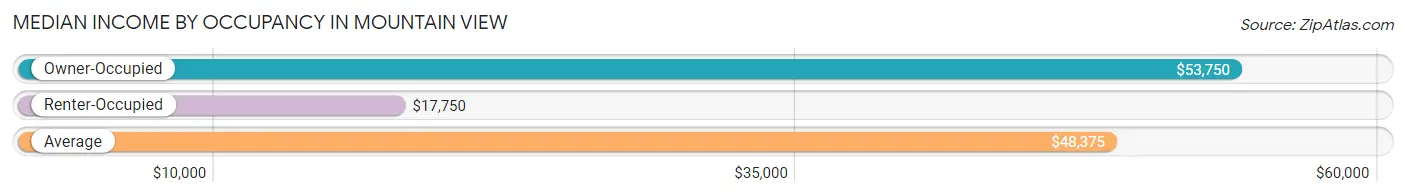
| Occupancy Type | # Households | Median Income |
| Owner-Occupied | 256 (89.2%) | $53,750 |
| Renter-Occupied | 31 (10.8%) | $17,750 |
| Average | 287 (100.0%) | $48,375 |
Occupancy by Householder Income Bracket in Mountain View
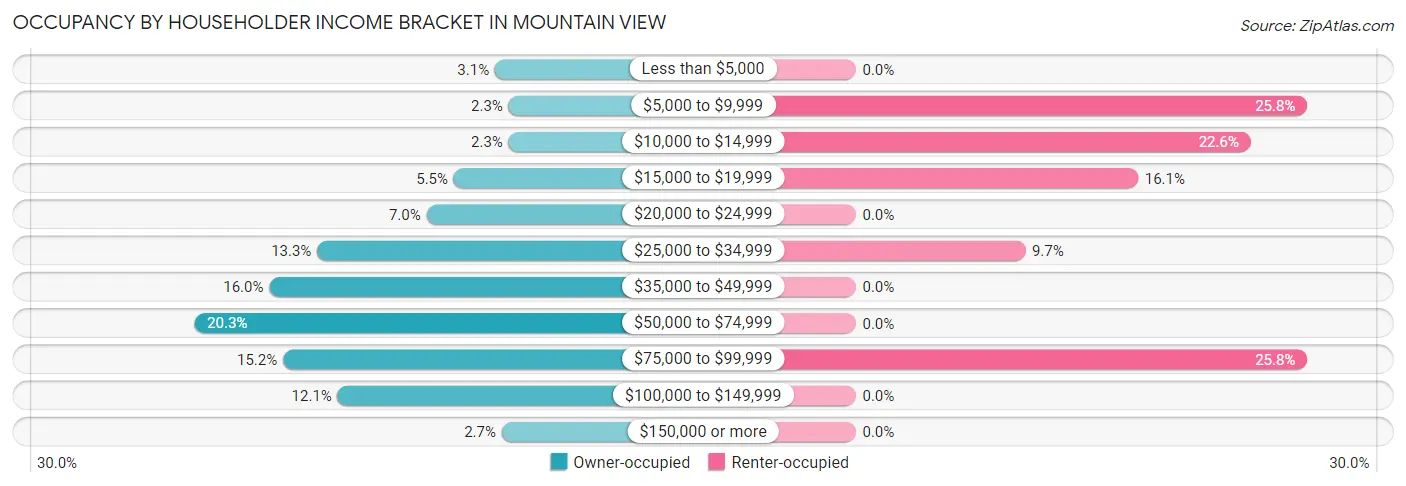
| Income Bracket | Owner-occupied | Renter-occupied |
| Less than $5,000 | 8 (3.1%) | 0 (0.0%) |
| $5,000 to $9,999 | 6 (2.3%) | 8 (25.8%) |
| $10,000 to $14,999 | 6 (2.3%) | 7 (22.6%) |
| $15,000 to $19,999 | 14 (5.5%) | 5 (16.1%) |
| $20,000 to $24,999 | 18 (7.0%) | 0 (0.0%) |
| $25,000 to $34,999 | 34 (13.3%) | 3 (9.7%) |
| $35,000 to $49,999 | 41 (16.0%) | 0 (0.0%) |
| $50,000 to $74,999 | 52 (20.3%) | 0 (0.0%) |
| $75,000 to $99,999 | 39 (15.2%) | 8 (25.8%) |
| $100,000 to $149,999 | 31 (12.1%) | 0 (0.0%) |
| $150,000 or more | 7 (2.7%) | 0 (0.0%) |
| Total | 256 (100.0%) | 31 (100.0%) |
Monthly Housing Cost Tiers in Mountain View
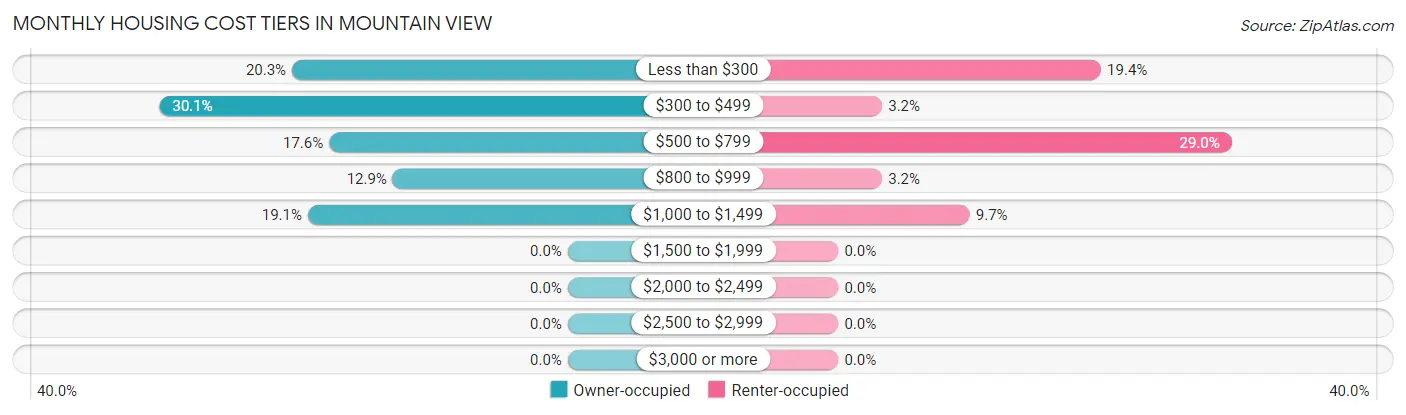
| Monthly Cost | Owner-occupied | Renter-occupied |
| Less than $300 | 52 (20.3%) | 6 (19.4%) |
| $300 to $499 | 77 (30.1%) | 1 (3.2%) |
| $500 to $799 | 45 (17.6%) | 9 (29.0%) |
| $800 to $999 | 33 (12.9%) | 1 (3.2%) |
| $1,000 to $1,499 | 49 (19.1%) | 3 (9.7%) |
| $1,500 to $1,999 | 0 (0.0%) | 0 (0.0%) |
| $2,000 to $2,499 | 0 (0.0%) | 0 (0.0%) |
| $2,500 to $2,999 | 0 (0.0%) | 0 (0.0%) |
| $3,000 or more | 0 (0.0%) | 0 (0.0%) |
| Total | 256 (100.0%) | 31 (100.0%) |
Physical Housing Characteristics in Mountain View
Housing Structures in Mountain View
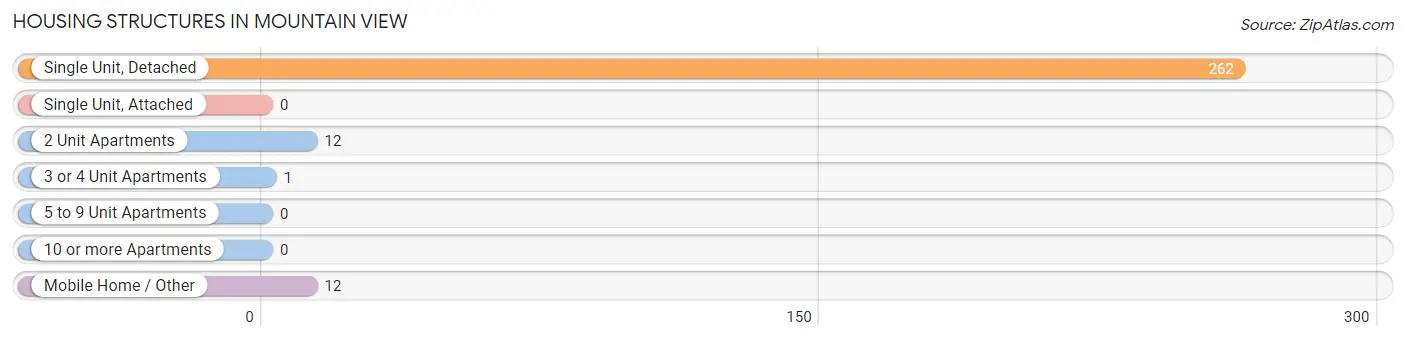
| Structure Type | # Housing Units | % Housing Units |
| Single Unit, Detached | 262 | 91.3% |
| Single Unit, Attached | 0 | 0.0% |
| 2 Unit Apartments | 12 | 4.2% |
| 3 or 4 Unit Apartments | 1 | 0.4% |
| 5 to 9 Unit Apartments | 0 | 0.0% |
| 10 or more Apartments | 0 | 0.0% |
| Mobile Home / Other | 12 | 4.2% |
| Total | 287 | 100.0% |
Housing Structures by Occupancy in Mountain View
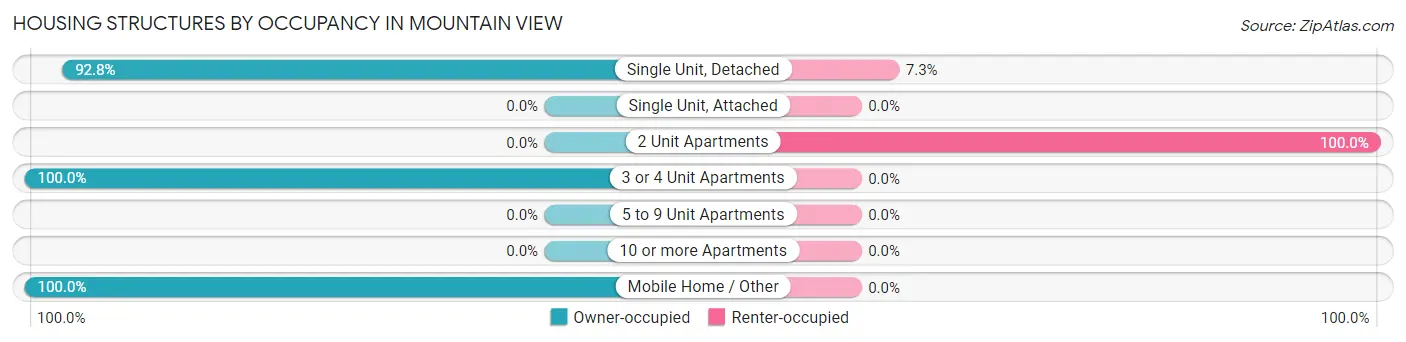
| Structure Type | Owner-occupied | Renter-occupied |
| Single Unit, Detached | 243 (92.7%) | 19 (7.2%) |
| Single Unit, Attached | 0 (0.0%) | 0 (0.0%) |
| 2 Unit Apartments | 0 (0.0%) | 12 (100.0%) |
| 3 or 4 Unit Apartments | 1 (100.0%) | 0 (0.0%) |
| 5 to 9 Unit Apartments | 0 (0.0%) | 0 (0.0%) |
| 10 or more Apartments | 0 (0.0%) | 0 (0.0%) |
| Mobile Home / Other | 12 (100.0%) | 0 (0.0%) |
| Total | 256 (89.2%) | 31 (10.8%) |
Housing Structures by Number of Rooms in Mountain View
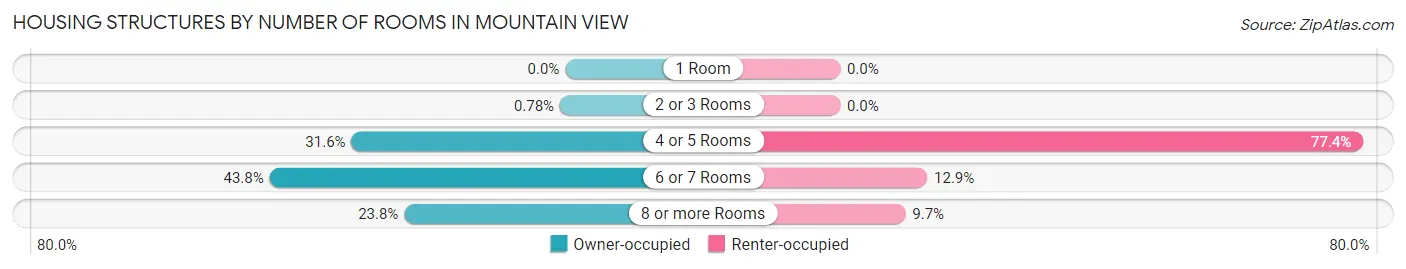
| Number of Rooms | Owner-occupied | Renter-occupied |
| 1 Room | 0 (0.0%) | 0 (0.0%) |
| 2 or 3 Rooms | 2 (0.8%) | 0 (0.0%) |
| 4 or 5 Rooms | 81 (31.6%) | 24 (77.4%) |
| 6 or 7 Rooms | 112 (43.8%) | 4 (12.9%) |
| 8 or more Rooms | 61 (23.8%) | 3 (9.7%) |
| Total | 256 (100.0%) | 31 (100.0%) |
Housing Structure by Heating Type in Mountain View
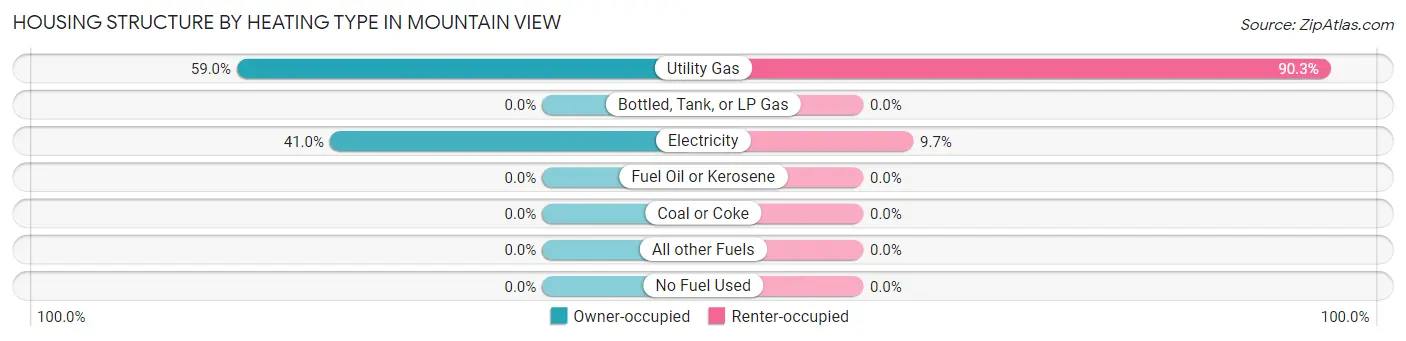
| Heating Type | Owner-occupied | Renter-occupied |
| Utility Gas | 151 (59.0%) | 28 (90.3%) |
| Bottled, Tank, or LP Gas | 0 (0.0%) | 0 (0.0%) |
| Electricity | 105 (41.0%) | 3 (9.7%) |
| Fuel Oil or Kerosene | 0 (0.0%) | 0 (0.0%) |
| Coal or Coke | 0 (0.0%) | 0 (0.0%) |
| All other Fuels | 0 (0.0%) | 0 (0.0%) |
| No Fuel Used | 0 (0.0%) | 0 (0.0%) |
| Total | 256 (100.0%) | 31 (100.0%) |
Household Vehicle Usage in Mountain View
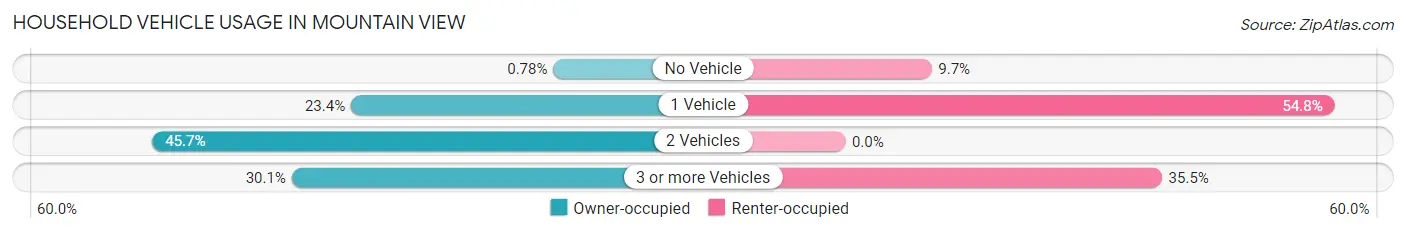
| Vehicles per Household | Owner-occupied | Renter-occupied |
| No Vehicle | 2 (0.8%) | 3 (9.7%) |
| 1 Vehicle | 60 (23.4%) | 17 (54.8%) |
| 2 Vehicles | 117 (45.7%) | 0 (0.0%) |
| 3 or more Vehicles | 77 (30.1%) | 11 (35.5%) |
| Total | 256 (100.0%) | 31 (100.0%) |
Real Estate & Mortgages in Mountain View
Real Estate and Mortgage Overview in Mountain View
| Characteristic | Without Mortgage | With Mortgage |
| Housing Units | 152 | 104 |
| Median Property Value | $56,100 | $89,200 |
| Median Household Income | $43,750 | $5 |
| Monthly Housing Costs | $331 | $0 |
| Real Estate Taxes | $345 | $0 |
Property Value by Mortgage Status in Mountain View
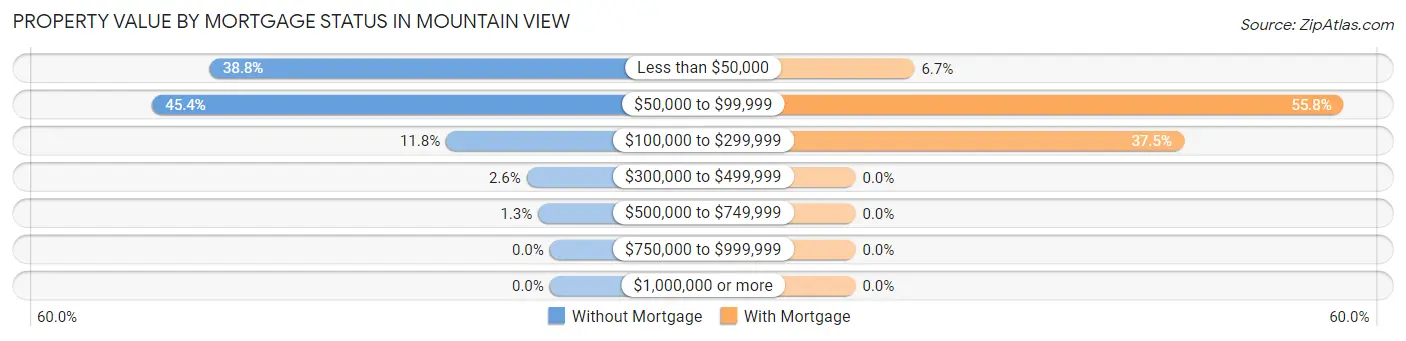
| Property Value | Without Mortgage | With Mortgage |
| Less than $50,000 | 59 (38.8%) | 7 (6.7%) |
| $50,000 to $99,999 | 69 (45.4%) | 58 (55.8%) |
| $100,000 to $299,999 | 18 (11.8%) | 39 (37.5%) |
| $300,000 to $499,999 | 4 (2.6%) | 0 (0.0%) |
| $500,000 to $749,999 | 2 (1.3%) | 0 (0.0%) |
| $750,000 to $999,999 | 0 (0.0%) | 0 (0.0%) |
| $1,000,000 or more | 0 (0.0%) | 0 (0.0%) |
| Total | 152 (100.0%) | 104 (100.0%) |
Household Income by Mortgage Status in Mountain View
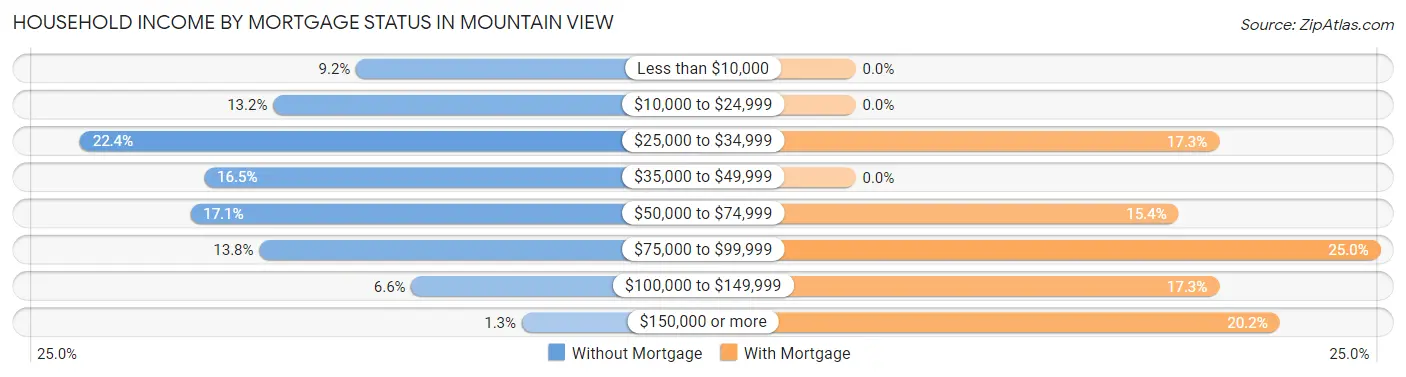
| Household Income | Without Mortgage | With Mortgage |
| Less than $10,000 | 14 (9.2%) | 0 (0.0%) |
| $10,000 to $24,999 | 20 (13.2%) | 0 (0.0%) |
| $25,000 to $34,999 | 34 (22.4%) | 18 (17.3%) |
| $35,000 to $49,999 | 25 (16.5%) | 0 (0.0%) |
| $50,000 to $74,999 | 26 (17.1%) | 16 (15.4%) |
| $75,000 to $99,999 | 21 (13.8%) | 26 (25.0%) |
| $100,000 to $149,999 | 10 (6.6%) | 18 (17.3%) |
| $150,000 or more | 2 (1.3%) | 21 (20.2%) |
| Total | 152 (100.0%) | 104 (100.0%) |
Property Value to Household Income Ratio in Mountain View
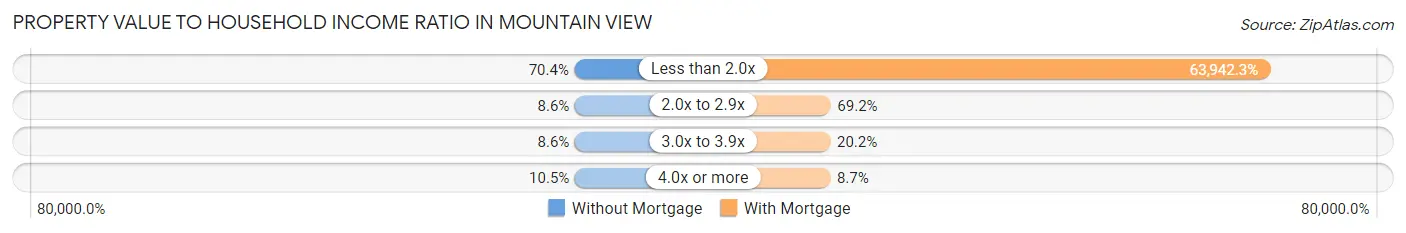
| Value-to-Income Ratio | Without Mortgage | With Mortgage |
| Less than 2.0x | 107 (70.4%) | 66,500 (63,942.3%) |
| 2.0x to 2.9x | 13 (8.6%) | 72 (69.2%) |
| 3.0x to 3.9x | 13 (8.6%) | 21 (20.2%) |
| 4.0x or more | 16 (10.5%) | 9 (8.6%) |
| Total | 152 (100.0%) | 104 (100.0%) |
Real Estate Taxes by Mortgage Status in Mountain View
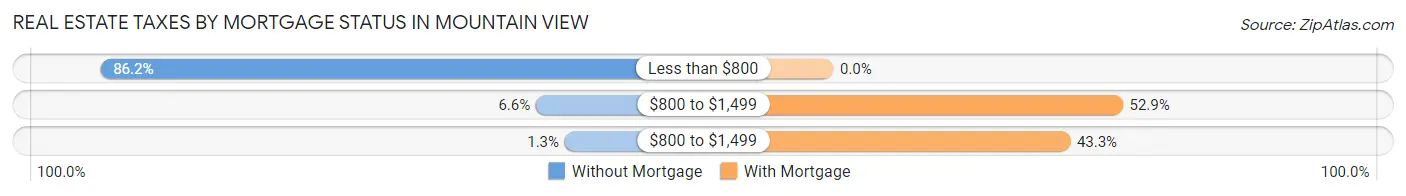
| Property Taxes | Without Mortgage | With Mortgage |
| Less than $800 | 131 (86.2%) | 0 (0.0%) |
| $800 to $1,499 | 10 (6.6%) | 55 (52.9%) |
| $800 to $1,499 | 2 (1.3%) | 45 (43.3%) |
| Total | 152 (100.0%) | 104 (100.0%) |
Health & Disability in Mountain View
Health Insurance Coverage by Age in Mountain View
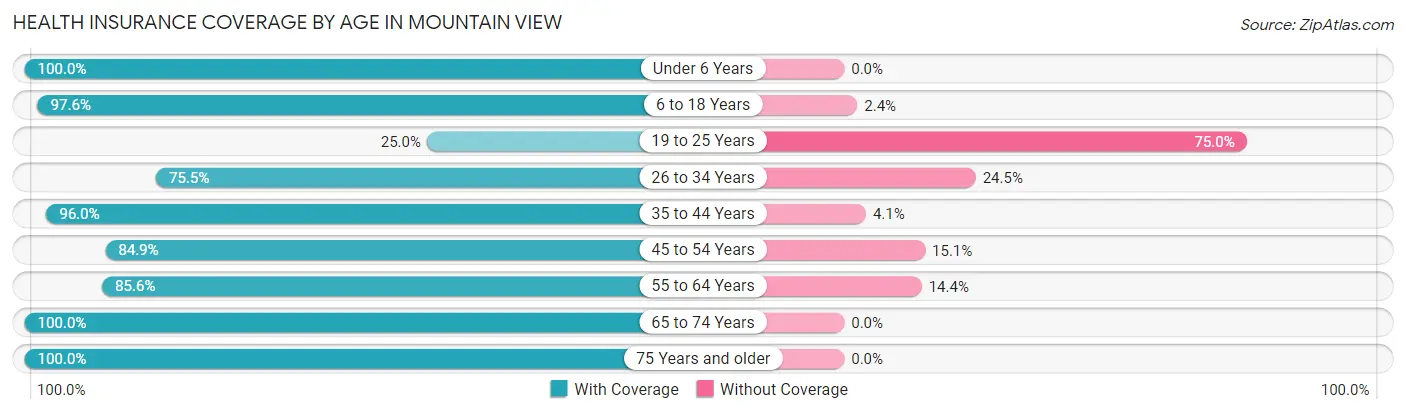
| Age Bracket | With Coverage | Without Coverage |
| Under 6 Years | 30 (100.0%) | 0 (0.0%) |
| 6 to 18 Years | 80 (97.6%) | 2 (2.4%) |
| 19 to 25 Years | 2 (25.0%) | 6 (75.0%) |
| 26 to 34 Years | 77 (75.5%) | 25 (24.5%) |
| 35 to 44 Years | 71 (96.0%) | 3 (4.1%) |
| 45 to 54 Years | 62 (84.9%) | 11 (15.1%) |
| 55 to 64 Years | 77 (85.6%) | 13 (14.4%) |
| 65 to 74 Years | 75 (100.0%) | 0 (0.0%) |
| 75 Years and older | 70 (100.0%) | 0 (0.0%) |
| Total | 544 (90.1%) | 60 (9.9%) |
Health Insurance Coverage by Citizenship Status in Mountain View
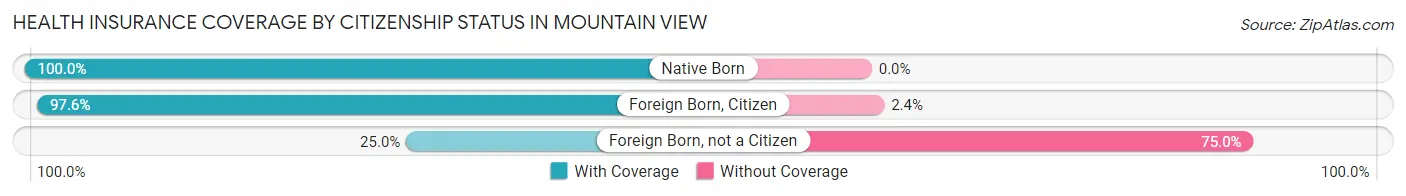
| Citizenship Status | With Coverage | Without Coverage |
| Native Born | 30 (100.0%) | 0 (0.0%) |
| Foreign Born, Citizen | 80 (97.6%) | 2 (2.4%) |
| Foreign Born, not a Citizen | 2 (25.0%) | 6 (75.0%) |
Health Insurance Coverage by Household Income in Mountain View
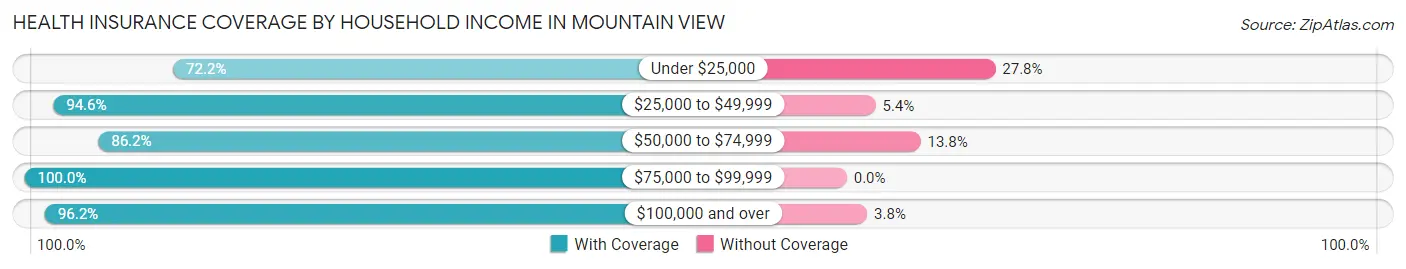
| Household Income | With Coverage | Without Coverage |
| Under $25,000 | 83 (72.2%) | 32 (27.8%) |
| $25,000 to $49,999 | 123 (94.6%) | 7 (5.4%) |
| $50,000 to $74,999 | 106 (86.2%) | 17 (13.8%) |
| $75,000 to $99,999 | 131 (100.0%) | 0 (0.0%) |
| $100,000 and over | 101 (96.2%) | 4 (3.8%) |
Public vs Private Health Insurance Coverage by Age in Mountain View
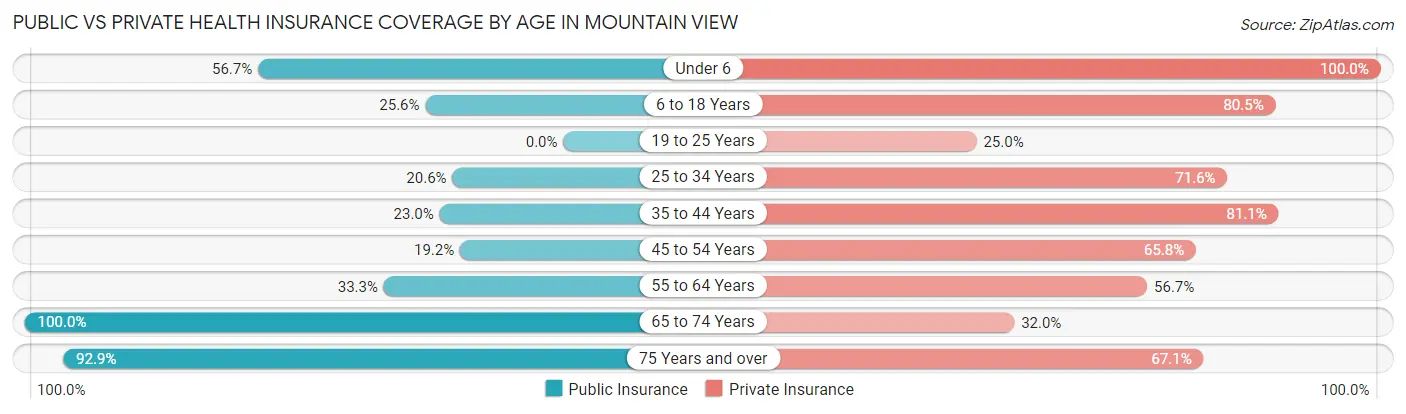
| Age Bracket | Public Insurance | Private Insurance |
| Under 6 | 17 (56.7%) | 30 (100.0%) |
| 6 to 18 Years | 21 (25.6%) | 66 (80.5%) |
| 19 to 25 Years | 0 (0.0%) | 2 (25.0%) |
| 25 to 34 Years | 21 (20.6%) | 73 (71.6%) |
| 35 to 44 Years | 17 (23.0%) | 60 (81.1%) |
| 45 to 54 Years | 14 (19.2%) | 48 (65.7%) |
| 55 to 64 Years | 30 (33.3%) | 51 (56.7%) |
| 65 to 74 Years | 75 (100.0%) | 24 (32.0%) |
| 75 Years and over | 65 (92.9%) | 47 (67.1%) |
| Total | 260 (43.0%) | 401 (66.4%) |
Disability Status by Sex by Age in Mountain View
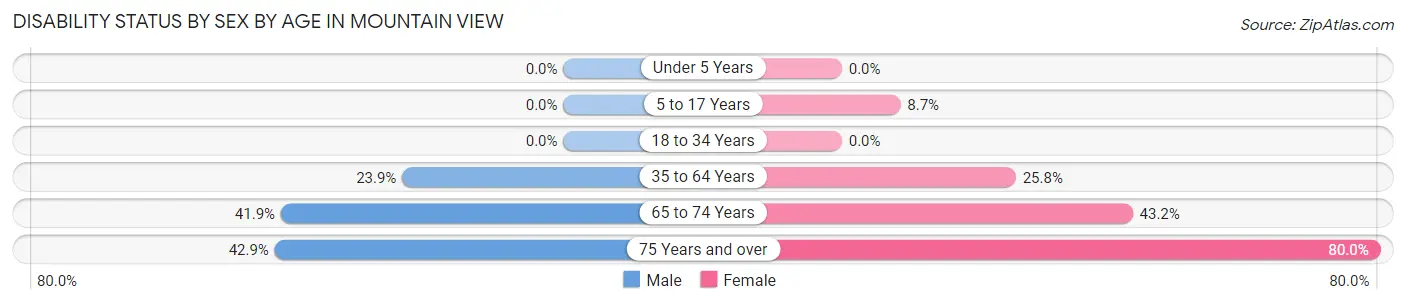
| Age Bracket | Male | Female |
| Under 5 Years | 0 (0.0%) | 0 (0.0%) |
| 5 to 17 Years | 0 (0.0%) | 4 (8.7%) |
| 18 to 34 Years | 0 (0.0%) | 0 (0.0%) |
| 35 to 64 Years | 28 (23.9%) | 31 (25.8%) |
| 65 to 74 Years | 13 (41.9%) | 19 (43.2%) |
| 75 Years and over | 15 (42.9%) | 28 (80.0%) |
Disability Class by Sex by Age in Mountain View
Disability Class: Hearing Difficulty
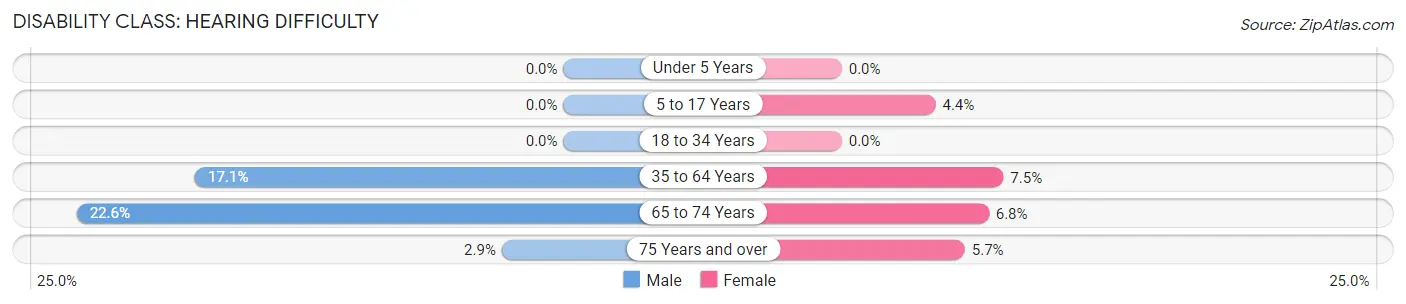
| Age Bracket | Male | Female |
| Under 5 Years | 0 (0.0%) | 0 (0.0%) |
| 5 to 17 Years | 0 (0.0%) | 2 (4.3%) |
| 18 to 34 Years | 0 (0.0%) | 0 (0.0%) |
| 35 to 64 Years | 20 (17.1%) | 9 (7.5%) |
| 65 to 74 Years | 7 (22.6%) | 3 (6.8%) |
| 75 Years and over | 1 (2.9%) | 2 (5.7%) |
Disability Class: Vision Difficulty
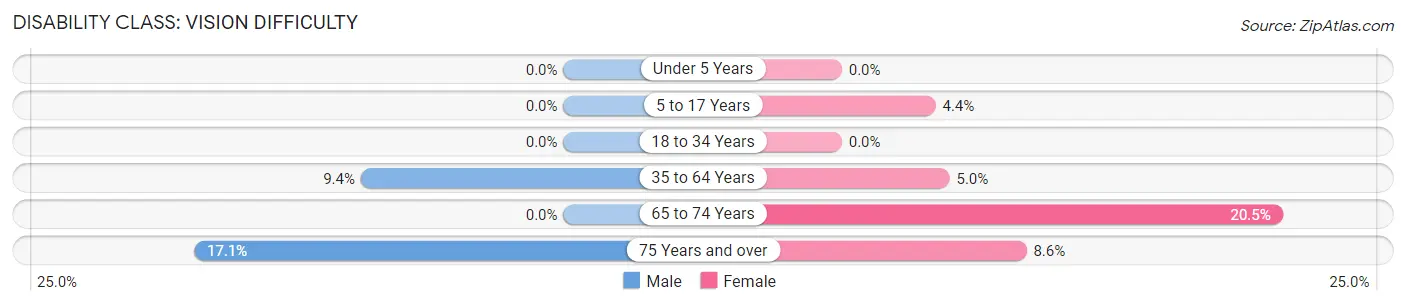
| Age Bracket | Male | Female |
| Under 5 Years | 0 (0.0%) | 0 (0.0%) |
| 5 to 17 Years | 0 (0.0%) | 2 (4.3%) |
| 18 to 34 Years | 0 (0.0%) | 0 (0.0%) |
| 35 to 64 Years | 11 (9.4%) | 6 (5.0%) |
| 65 to 74 Years | 0 (0.0%) | 9 (20.4%) |
| 75 Years and over | 6 (17.1%) | 3 (8.6%) |
Disability Class: Cognitive Difficulty
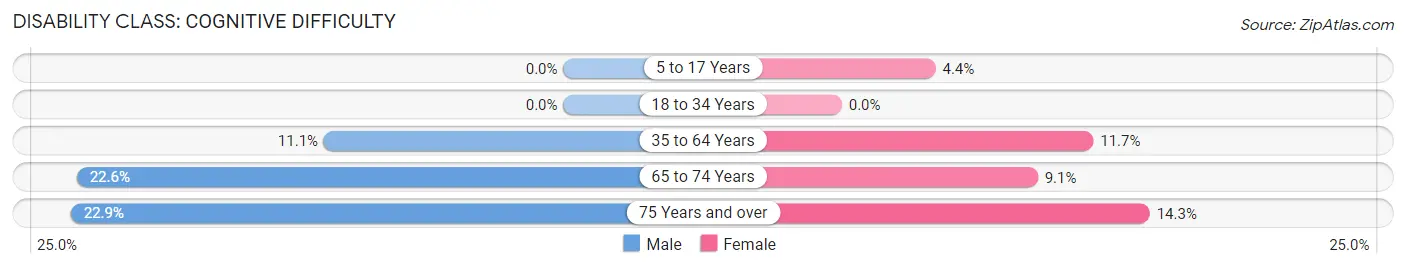
| Age Bracket | Male | Female |
| 5 to 17 Years | 0 (0.0%) | 2 (4.3%) |
| 18 to 34 Years | 0 (0.0%) | 0 (0.0%) |
| 35 to 64 Years | 13 (11.1%) | 14 (11.7%) |
| 65 to 74 Years | 7 (22.6%) | 4 (9.1%) |
| 75 Years and over | 8 (22.9%) | 5 (14.3%) |
Disability Class: Ambulatory Difficulty
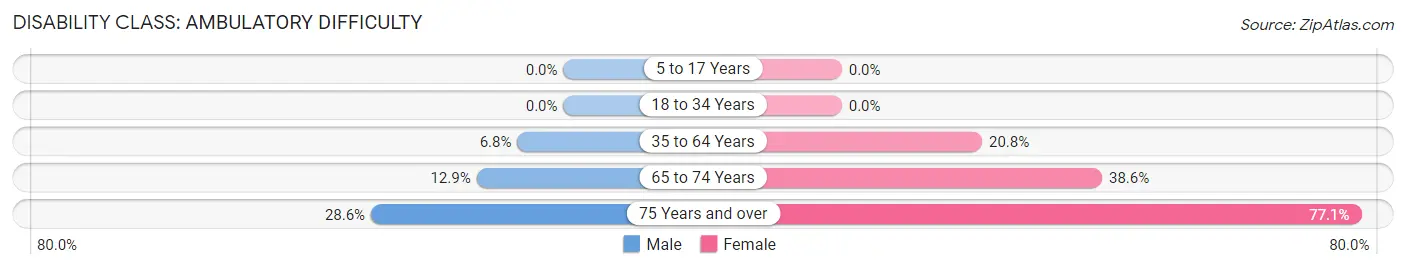
| Age Bracket | Male | Female |
| 5 to 17 Years | 0 (0.0%) | 0 (0.0%) |
| 18 to 34 Years | 0 (0.0%) | 0 (0.0%) |
| 35 to 64 Years | 8 (6.8%) | 25 (20.8%) |
| 65 to 74 Years | 4 (12.9%) | 17 (38.6%) |
| 75 Years and over | 10 (28.6%) | 27 (77.1%) |
Disability Class: Self-Care Difficulty
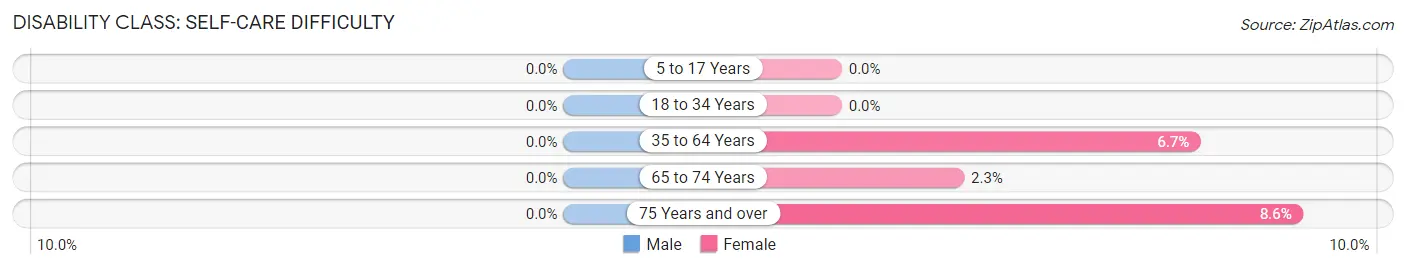
| Age Bracket | Male | Female |
| 5 to 17 Years | 0 (0.0%) | 0 (0.0%) |
| 18 to 34 Years | 0 (0.0%) | 0 (0.0%) |
| 35 to 64 Years | 0 (0.0%) | 8 (6.7%) |
| 65 to 74 Years | 0 (0.0%) | 1 (2.3%) |
| 75 Years and over | 0 (0.0%) | 3 (8.6%) |
Technology Access in Mountain View
Computing Device Access in Mountain View
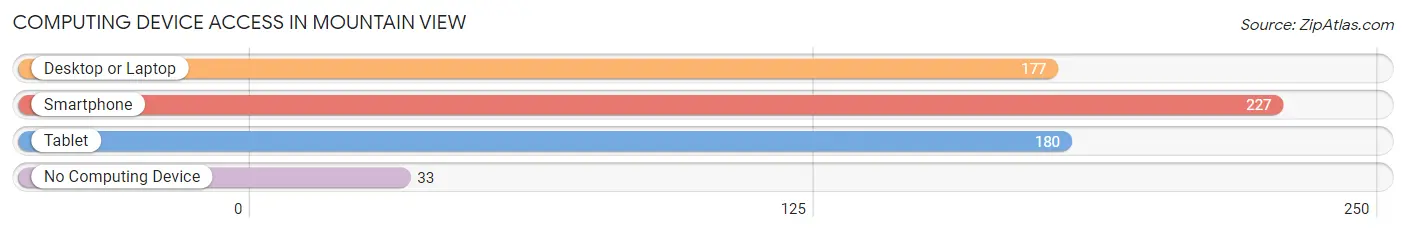
| Device Type | # Households | % Households |
| Desktop or Laptop | 177 | 61.7% |
| Smartphone | 227 | 79.1% |
| Tablet | 180 | 62.7% |
| No Computing Device | 33 | 11.5% |
| Total | 287 | 100.0% |
Internet Access in Mountain View
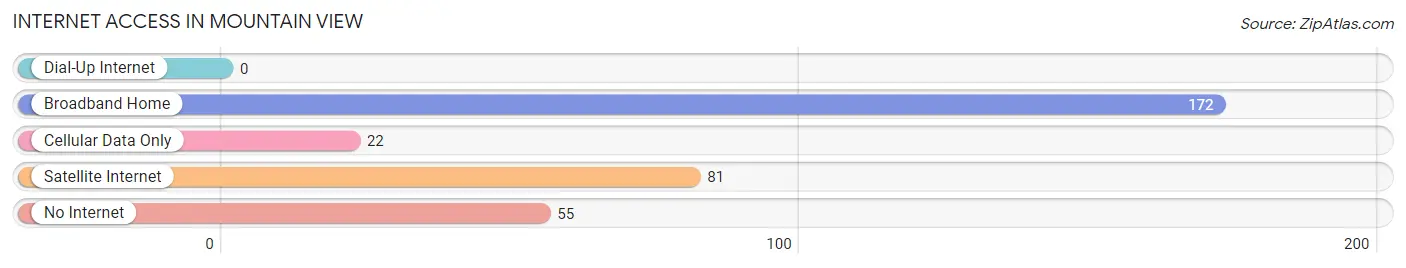
| Internet Type | # Households | % Households |
| Dial-Up Internet | 0 | 0.0% |
| Broadband Home | 172 | 59.9% |
| Cellular Data Only | 22 | 7.7% |
| Satellite Internet | 81 | 28.2% |
| No Internet | 55 | 19.2% |
| Total | 287 | 100.0% |
Mountain View Summary
Mountain View is a small town located in Kiowa County, Oklahoma. It is situated in the foothills of the Wichita Mountains, approximately 20 miles south of the city of Lawton. The town was founded in 1892 and has a population of approximately 1,000 people.
History
Mountain View was founded in 1892 by a group of settlers from Texas. The town was originally called “Mountain View Station” because of its location in the foothills of the Wichita Mountains. The town was officially incorporated in 1901 and the name was changed to Mountain View.
The town was a popular stop for travelers on the Rock Island Railroad. The railroad provided a connection to Lawton and other nearby towns. The town also served as a trading post for local Native American tribes.
In the early 1900s, Mountain View was a thriving community with a variety of businesses, including a hotel, a bank, a general store, a blacksmith shop, and a livery stable. The town also had a school, a post office, and a newspaper.
In the 1920s, the town began to decline as the railroad stopped running and the local economy shifted away from agriculture. The population decreased and many of the businesses closed.
In the 1950s, the town began to experience a resurgence as the nearby Fort Sill military base began to expand. The town’s population increased and new businesses opened.
Geography
Mountain View is located in the foothills of the Wichita Mountains in southwestern Oklahoma. The town is situated at an elevation of 1,400 feet and is surrounded by rolling hills and grasslands. The town is located approximately 20 miles south of the city of Lawton and is accessible via State Highway 49.
The town is located in a semi-arid climate with hot summers and mild winters. The average annual temperature is 64 degrees Fahrenheit and the average annual precipitation is 28 inches.
Economy
Mountain View’s economy is largely based on agriculture and tourism. The town is home to several farms and ranches that produce cattle, hay, and other crops. The town is also home to several tourist attractions, including the Wichita Mountains Wildlife Refuge and the Mountain View Museum.
The town is also home to several small businesses, including restaurants, retail stores, and service providers. The town is also home to a branch of the First National Bank of Oklahoma.
Demographics
As of the 2010 census, the population of Mountain View was 1,000 people. The racial makeup of the town was 95.2% White, 0.7% African American, 0.7% Native American, 0.3% Asian, and 2.1% from other races. The median household income was $31,250 and the median family income was $37,500.
Conclusion
Mountain View is a small town located in Kiowa County, Oklahoma. It was founded in 1892 and has a population of approximately 1,000 people. The town’s economy is largely based on agriculture and tourism. The town is home to several tourist attractions, including the Wichita Mountains Wildlife Refuge and the Mountain View Museum. The town is also home to several small businesses, including restaurants, retail stores, and service providers. The racial makeup of the town is 95.2% White, 0.7% African American, 0.7% Native American, 0.3% Asian, and 2.1% from other races. The median household income was $31,250 and the median family income was $37,500.
Common Questions
What is Per Capita Income in Mountain View?
Per Capita income in Mountain View is $28,001.
What is the Median Family Income in Mountain View?
Median Family Income in Mountain View is $66,917.
What is the Median Household income in Mountain View?
Median Household Income in Mountain View is $48,375.
What is Income or Wage Gap in Mountain View?
Income or Wage Gap in Mountain View is 11.4%.
Women in Mountain View earn 88.6 cents for every dollar earned by a man.
What is Inequality or Gini Index in Mountain View?
Inequality or Gini Index in Mountain View is 0.42.
What is the Total Population of Mountain View?
Total Population of Mountain View is 604.
What is the Total Male Population of Mountain View?
Total Male Population of Mountain View is 295.
What is the Total Female Population of Mountain View?
Total Female Population of Mountain View is 309.
What is the Ratio of Males per 100 Females in Mountain View?
There are 95.47 Males per 100 Females in Mountain View.
What is the Ratio of Females per 100 Males in Mountain View?
There are 104.75 Females per 100 Males in Mountain View.
What is the Median Population Age in Mountain View?
Median Population Age in Mountain View is 45.3 Years.
What is the Average Family Size in Mountain View
Average Family Size in Mountain View is 2.5 People.
What is the Average Household Size in Mountain View
Average Household Size in Mountain View is 2.1 People.
How Large is the Labor Force in Mountain View?
There are 291 People in the Labor Forcein in Mountain View.
What is the Percentage of People in the Labor Force in Mountain View?
56.1% of People are in the Labor Force in Mountain View.
What is the Unemployment Rate in Mountain View?
Unemployment Rate in Mountain View is 0.7%.