Moore, OK Map & Demographics
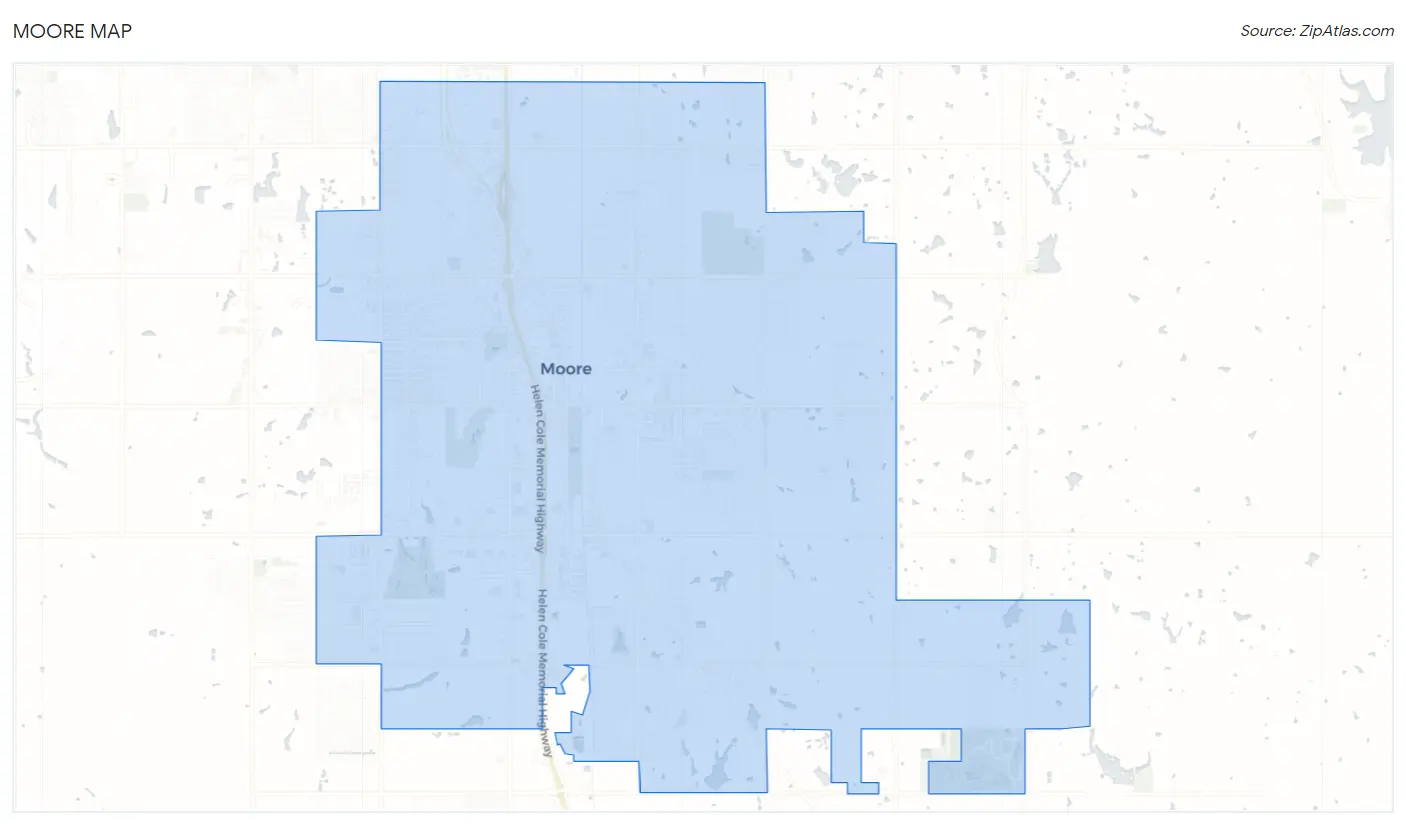
Moore Map
Moore Overview
$35,511
PER CAPITA INCOME
$85,467
AVG FAMILY INCOME
$73,285
AVG HOUSEHOLD INCOME
34.1%
WAGE / INCOME GAP [ % ]
65.9¢/ $1
WAGE / INCOME GAP [ $ ]
$11,710
FAMILY INCOME DEFICIT
0.40
INEQUALITY / GINI INDEX
62,685
TOTAL POPULATION
30,759
MALE POPULATION
31,926
FEMALE POPULATION
96.34
MALES / 100 FEMALES
103.79
FEMALES / 100 MALES
33.8
MEDIAN AGE
3.1
AVG FAMILY SIZE
2.6
AVG HOUSEHOLD SIZE
34,206
LABOR FORCE [ PEOPLE ]
69.6%
PERCENT IN LABOR FORCE
4.1%
UNEMPLOYMENT RATE
Moore Area Codes
Income in Moore
Income Overview in Moore
Per Capita Income in Moore is $35,511, while median incomes of families and households are $85,467 and $73,285 respectively.
| Characteristic | Number | Measure |
| Per Capita Income | 62,685 | $35,511 |
| Median Family Income | 16,420 | $85,467 |
| Mean Family Income | 16,420 | $101,198 |
| Median Household Income | 23,927 | $73,285 |
| Mean Household Income | 23,927 | $89,430 |
| Income Deficit | 16,420 | $11,710 |
| Wage / Income Gap (%) | 62,685 | 34.08% |
| Wage / Income Gap ($) | 62,685 | 65.92¢ per $1 |
| Gini / Inequality Index | 62,685 | 0.40 |
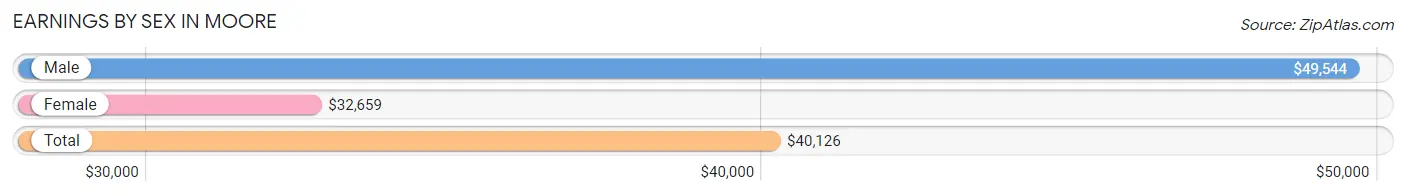
Earnings by Sex in Moore
Average Earnings in Moore are $40,126, $49,544 for men and $32,659 for women, a difference of 34.1%.
| Sex | Number | Average Earnings |
| Male | 19,114 (53.9%) | $49,544 |
| Female | 16,341 (46.1%) | $32,659 |
| Total | 35,455 (100.0%) | $40,126 |
Earnings by Sex by Income Bracket in Moore
The most common earnings brackets in Moore are $100,000+ for men (2,418 | 12.7%) and $25,000 to $29,999 for women (1,417 | 8.7%).
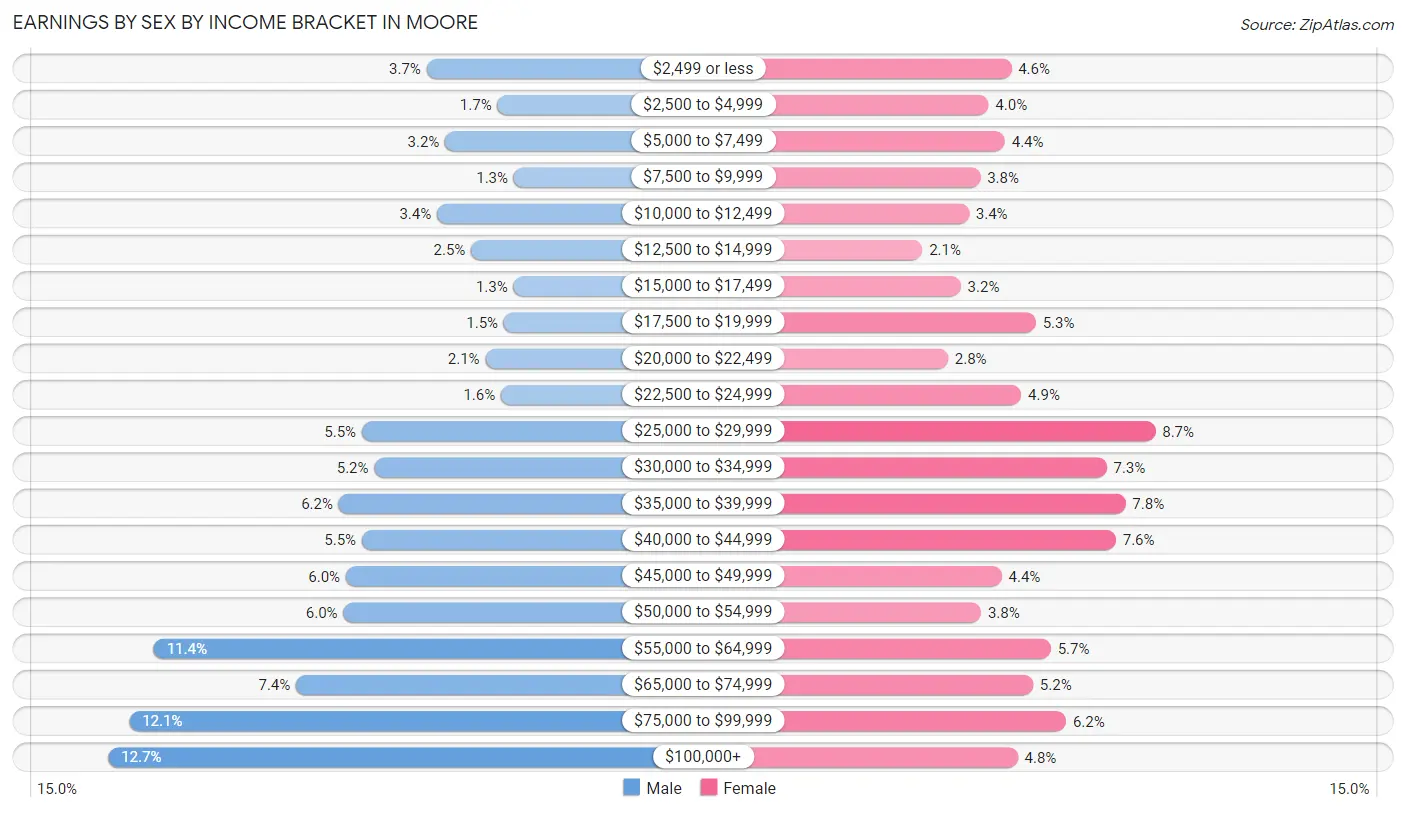
| Income | Male | Female |
| $2,499 or less | 708 (3.7%) | 755 (4.6%) |
| $2,500 to $4,999 | 327 (1.7%) | 650 (4.0%) |
| $5,000 to $7,499 | 607 (3.2%) | 726 (4.4%) |
| $7,500 to $9,999 | 239 (1.3%) | 612 (3.7%) |
| $10,000 to $12,499 | 652 (3.4%) | 560 (3.4%) |
| $12,500 to $14,999 | 469 (2.5%) | 347 (2.1%) |
| $15,000 to $17,499 | 241 (1.3%) | 523 (3.2%) |
| $17,500 to $19,999 | 292 (1.5%) | 868 (5.3%) |
| $20,000 to $22,499 | 391 (2.1%) | 464 (2.8%) |
| $22,500 to $24,999 | 307 (1.6%) | 800 (4.9%) |
| $25,000 to $29,999 | 1,056 (5.5%) | 1,417 (8.7%) |
| $30,000 to $34,999 | 989 (5.2%) | 1,193 (7.3%) |
| $35,000 to $39,999 | 1,179 (6.2%) | 1,280 (7.8%) |
| $40,000 to $44,999 | 1,056 (5.5%) | 1,235 (7.6%) |
| $45,000 to $49,999 | 1,141 (6.0%) | 711 (4.3%) |
| $50,000 to $54,999 | 1,154 (6.0%) | 616 (3.8%) |
| $55,000 to $64,999 | 2,174 (11.4%) | 937 (5.7%) |
| $65,000 to $74,999 | 1,409 (7.4%) | 855 (5.2%) |
| $75,000 to $99,999 | 2,305 (12.1%) | 1,007 (6.2%) |
| $100,000+ | 2,418 (12.7%) | 785 (4.8%) |
| Total | 19,114 (100.0%) | 16,341 (100.0%) |
Earnings by Sex by Educational Attainment in Moore
Average earnings in Moore are $55,097 for men and $35,847 for women, a difference of 34.9%. Men with an educational attainment of graduate degree enjoy the highest average annual earnings of $92,805, while those with less than high school education earn the least with $36,289. Women with an educational attainment of graduate degree earn the most with the average annual earnings of $72,702, while those with less than high school education have the smallest earnings of $28,596.
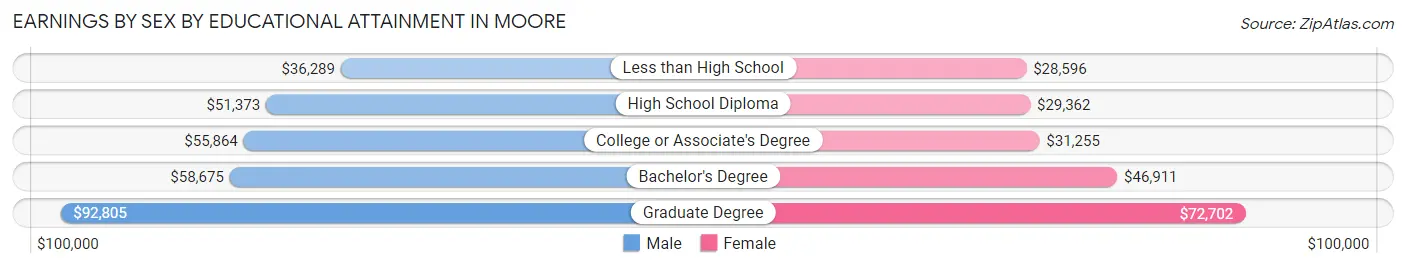
| Educational Attainment | Male Income | Female Income |
| Less than High School | $36,289 | $28,596 |
| High School Diploma | $51,373 | $29,362 |
| College or Associate's Degree | $55,864 | $31,255 |
| Bachelor's Degree | $58,675 | $46,911 |
| Graduate Degree | $92,805 | $72,702 |
| Total | $55,097 | $35,847 |
Family Income in Moore
Family Income Brackets in Moore
According to the Moore family income data, there are 3,892 families falling into the $100,000 to $149,999 income range, which is the most common income bracket and makes up 23.7% of all families. Conversely, the $10,000 to $14,999 income bracket is the least frequent group with only 230 families (1.4%) belonging to this category.
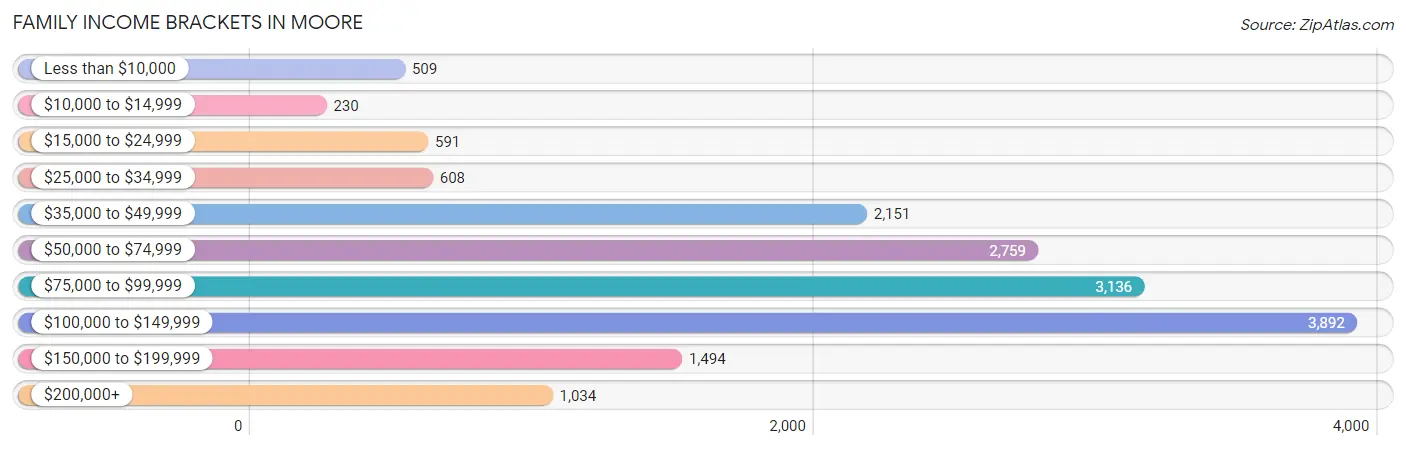
| Income Bracket | # Families | % Families |
| Less than $10,000 | 509 | 3.1% |
| $10,000 to $14,999 | 230 | 1.4% |
| $15,000 to $24,999 | 591 | 3.6% |
| $25,000 to $34,999 | 608 | 3.7% |
| $35,000 to $49,999 | 2,151 | 13.1% |
| $50,000 to $74,999 | 2,759 | 16.8% |
| $75,000 to $99,999 | 3,136 | 19.1% |
| $100,000 to $149,999 | 3,892 | 23.7% |
| $150,000 to $199,999 | 1,494 | 9.1% |
| $200,000+ | 1,034 | 6.3% |
Family Income by Famaliy Size in Moore
6-person families (646 | 3.9%) account for the highest median family income in Moore with $108,482 per family, while 2-person families (6,711 | 40.9%) have the highest median income of $38,818 per family member.
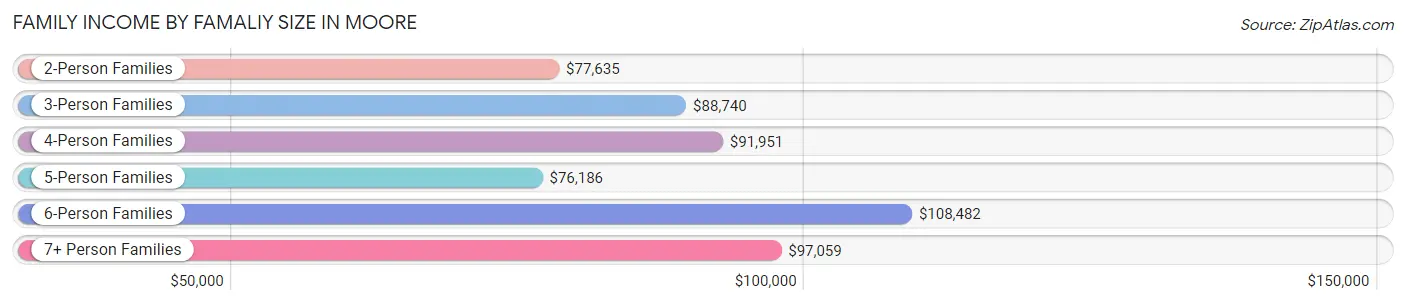
| Income Bracket | # Families | Median Income |
| 2-Person Families | 6,711 (40.9%) | $77,635 |
| 3-Person Families | 4,345 (26.5%) | $88,740 |
| 4-Person Families | 3,411 (20.8%) | $91,951 |
| 5-Person Families | 1,125 (6.9%) | $76,186 |
| 6-Person Families | 646 (3.9%) | $108,482 |
| 7+ Person Families | 182 (1.1%) | $97,059 |
| Total | 16,420 (100.0%) | $85,467 |
Family Income by Number of Earners in Moore
The median family income in Moore is $85,467, with families comprising 3+ earners (1,780) having the highest median family income of $120,161, while families with no earners (1,766) have the lowest median family income of $53,446, accounting for 10.8% and 10.8% of families, respectively.
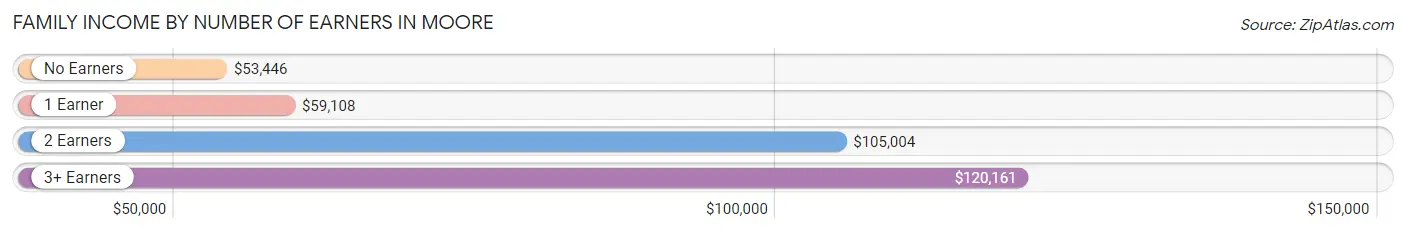
| Number of Earners | # Families | Median Income |
| No Earners | 1,766 (10.8%) | $53,446 |
| 1 Earner | 5,369 (32.7%) | $59,108 |
| 2 Earners | 7,505 (45.7%) | $105,004 |
| 3+ Earners | 1,780 (10.8%) | $120,161 |
| Total | 16,420 (100.0%) | $85,467 |
Household Income in Moore
Household Income Brackets in Moore
With 5,049 households falling in the category, the $50,000 to $74,999 income range is the most frequent in Moore, accounting for 21.1% of all households. In contrast, only 550 households (2.3%) fall into the $10,000 to $14,999 income bracket, making it the least populous group.
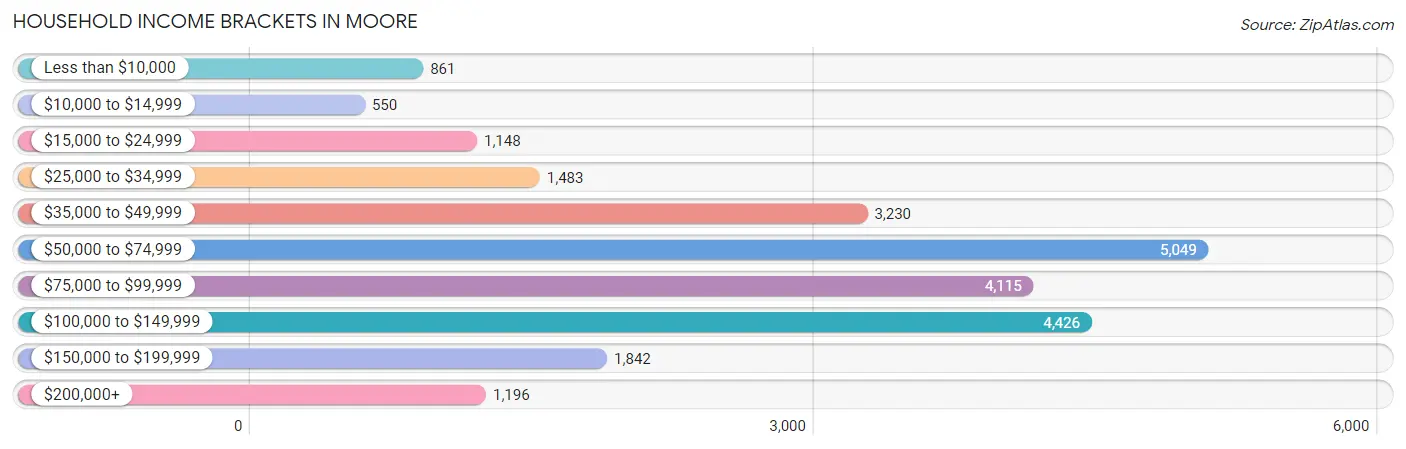
| Income Bracket | # Households | % Households |
| Less than $10,000 | 861 | 3.6% |
| $10,000 to $14,999 | 550 | 2.3% |
| $15,000 to $24,999 | 1,148 | 4.8% |
| $25,000 to $34,999 | 1,483 | 6.2% |
| $35,000 to $49,999 | 3,230 | 13.5% |
| $50,000 to $74,999 | 5,049 | 21.1% |
| $75,000 to $99,999 | 4,115 | 17.2% |
| $100,000 to $149,999 | 4,426 | 18.5% |
| $150,000 to $199,999 | 1,842 | 7.7% |
| $200,000+ | 1,196 | 5.0% |
Household Income by Householder Age in Moore
The median household income in Moore is $73,285, with the highest median household income of $81,291 found in the 45 to 64 years age bracket for the primary householder. A total of 8,032 households (33.6%) fall into this category. Meanwhile, the 65+ years age bracket for the primary householder has the lowest median household income of $55,303, with 5,174 households (21.6%) in this group.
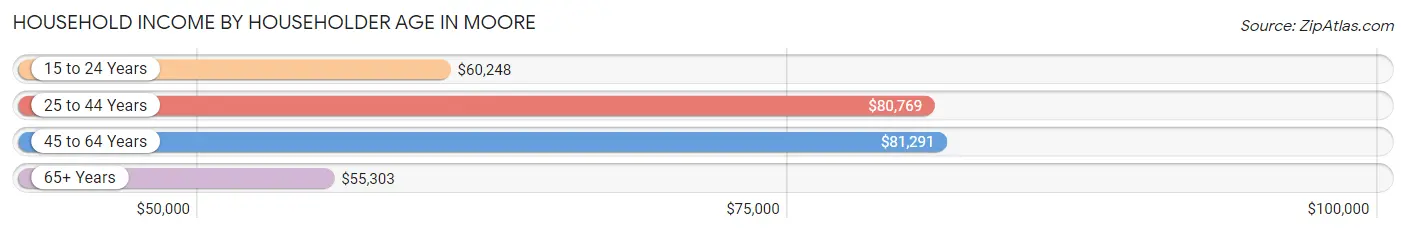
| Income Bracket | # Households | Median Income |
| 15 to 24 Years | 1,531 (6.4%) | $60,248 |
| 25 to 44 Years | 9,190 (38.4%) | $80,769 |
| 45 to 64 Years | 8,032 (33.6%) | $81,291 |
| 65+ Years | 5,174 (21.6%) | $55,303 |
| Total | 23,927 (100.0%) | $73,285 |
Poverty in Moore
Income Below Poverty by Sex and Age in Moore
With 8.5% poverty level for males and 12.3% for females among the residents of Moore, under 5 year old males and 5 year old females are the most vulnerable to poverty, with 443 males (19.8%) and 255 females (42.6%) in their respective age groups living below the poverty level.
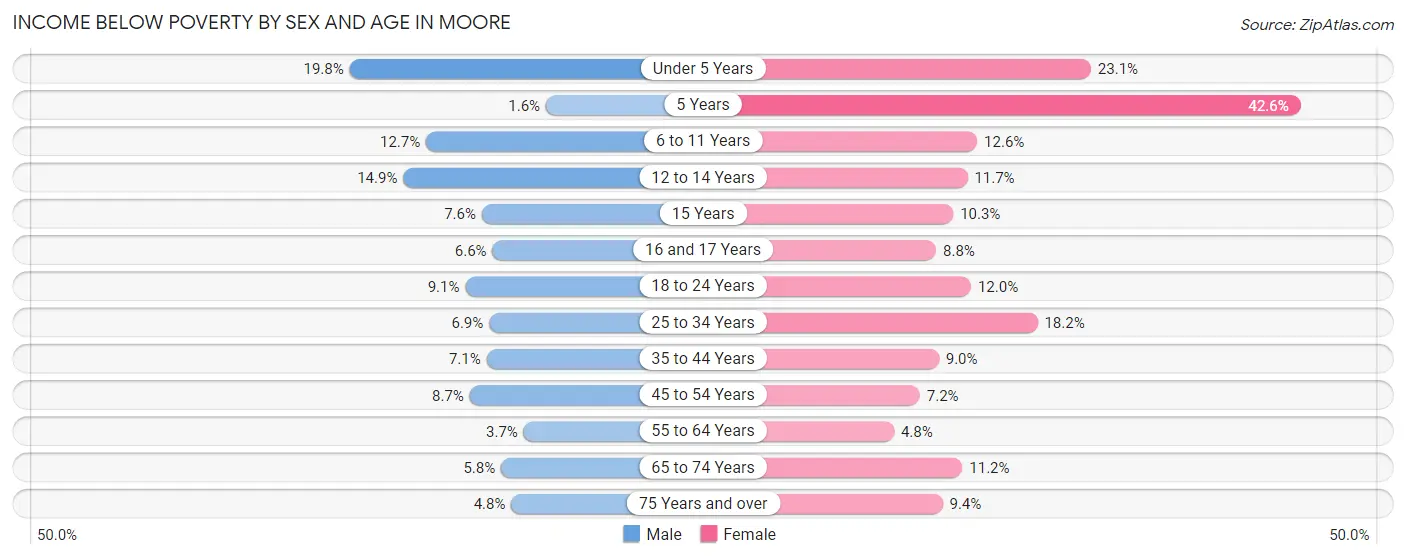
| Age Bracket | Male | Female |
| Under 5 Years | 443 (19.8%) | 509 (23.1%) |
| 5 Years | 6 (1.6%) | 255 (42.6%) |
| 6 to 11 Years | 294 (12.7%) | 268 (12.6%) |
| 12 to 14 Years | 181 (14.9%) | 170 (11.7%) |
| 15 Years | 32 (7.6%) | 37 (10.3%) |
| 16 and 17 Years | 64 (6.6%) | 69 (8.7%) |
| 18 to 24 Years | 303 (9.1%) | 326 (12.0%) |
| 25 to 34 Years | 396 (6.9%) | 990 (18.2%) |
| 35 to 44 Years | 258 (7.1%) | 336 (9.0%) |
| 45 to 54 Years | 314 (8.7%) | 274 (7.2%) |
| 55 to 64 Years | 120 (3.7%) | 177 (4.8%) |
| 65 to 74 Years | 123 (5.8%) | 285 (11.2%) |
| 75 Years and over | 63 (4.8%) | 202 (9.3%) |
| Total | 2,597 (8.5%) | 3,898 (12.3%) |
Income Above Poverty by Sex and Age in Moore
According to the poverty statistics in Moore, males aged 5 years and females aged 55 to 64 years are the age groups that are most secure financially, with 98.4% of males and 95.2% of females in these age groups living above the poverty line.
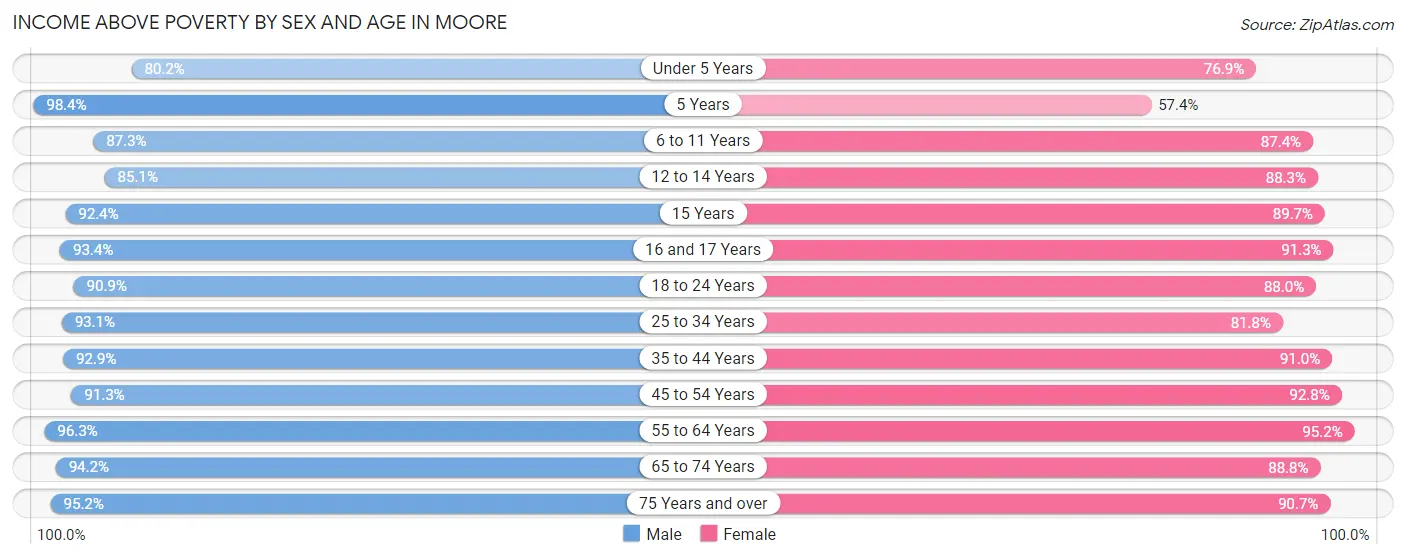
| Age Bracket | Male | Female |
| Under 5 Years | 1,790 (80.2%) | 1,693 (76.9%) |
| 5 Years | 364 (98.4%) | 344 (57.4%) |
| 6 to 11 Years | 2,014 (87.3%) | 1,866 (87.4%) |
| 12 to 14 Years | 1,037 (85.1%) | 1,288 (88.3%) |
| 15 Years | 391 (92.4%) | 321 (89.7%) |
| 16 and 17 Years | 908 (93.4%) | 720 (91.2%) |
| 18 to 24 Years | 3,028 (90.9%) | 2,394 (88.0%) |
| 25 to 34 Years | 5,350 (93.1%) | 4,462 (81.8%) |
| 35 to 44 Years | 3,360 (92.9%) | 3,399 (91.0%) |
| 45 to 54 Years | 3,300 (91.3%) | 3,511 (92.8%) |
| 55 to 64 Years | 3,142 (96.3%) | 3,477 (95.2%) |
| 65 to 74 Years | 2,004 (94.2%) | 2,262 (88.8%) |
| 75 Years and over | 1,242 (95.2%) | 1,958 (90.6%) |
| Total | 27,930 (91.5%) | 27,695 (87.7%) |
Income Below Poverty Among Married-Couple Families in Moore
The poverty statistics for married-couple families in Moore show that 3.5% or 406 of the total 11,761 families live below the poverty line. Families with 5 or more children have the highest poverty rate of 55.9%, comprising of 38 families. On the other hand, families with no children have the lowest poverty rate of 2.0%, which includes 118 families.
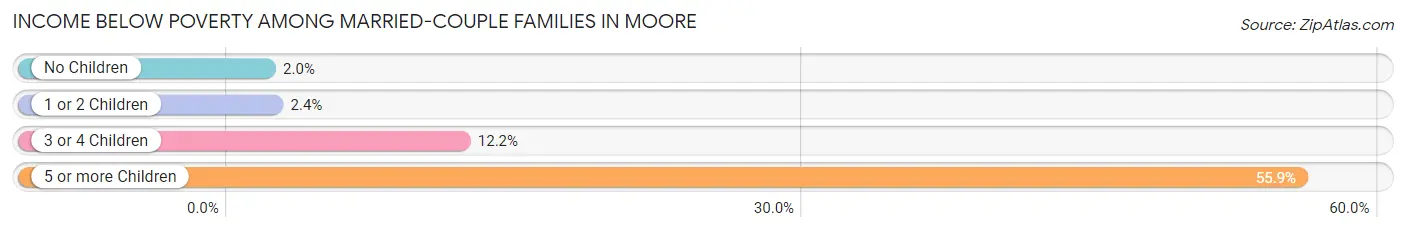
| Children | Above Poverty | Below Poverty |
| No Children | 5,798 (98.0%) | 118 (2.0%) |
| 1 or 2 Children | 4,516 (97.6%) | 110 (2.4%) |
| 3 or 4 Children | 1,011 (87.8%) | 140 (12.2%) |
| 5 or more Children | 30 (44.1%) | 38 (55.9%) |
| Total | 11,355 (96.6%) | 406 (3.5%) |
Income Below Poverty Among Single-Parent Households in Moore
According to the poverty data in Moore, 10.7% or 188 single-father households and 24.9% or 724 single-mother households are living below the poverty line. Among single-father households, those with 1 or 2 children have the highest poverty rate, with 160 households (13.2%) experiencing poverty. Likewise, among single-mother households, those with 5 or more children have the highest poverty rate, with 25 households (100.0%) falling below the poverty line.
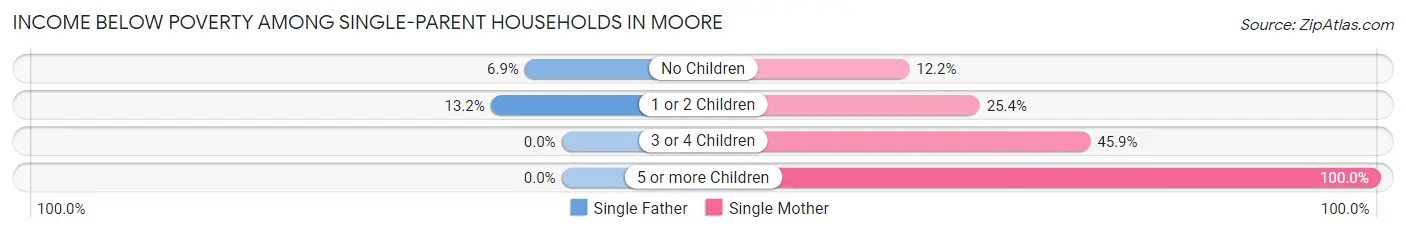
| Children | Single Father | Single Mother |
| No Children | 28 (6.9%) | 103 (12.2%) |
| 1 or 2 Children | 160 (13.2%) | 421 (25.4%) |
| 3 or 4 Children | 0 (0.0%) | 175 (45.9%) |
| 5 or more Children | 0 (0.0%) | 25 (100.0%) |
| Total | 188 (10.7%) | 724 (24.9%) |
Income Below Poverty Among Married-Couple vs Single-Parent Households in Moore
The poverty data for Moore shows that 406 of the married-couple family households (3.5%) and 912 of the single-parent households (19.6%) are living below the poverty level. Within the married-couple family households, those with 5 or more children have the highest poverty rate, with 38 households (55.9%) falling below the poverty line. Among the single-parent households, those with 5 or more children have the highest poverty rate, with 25 household (100.0%) living below poverty.
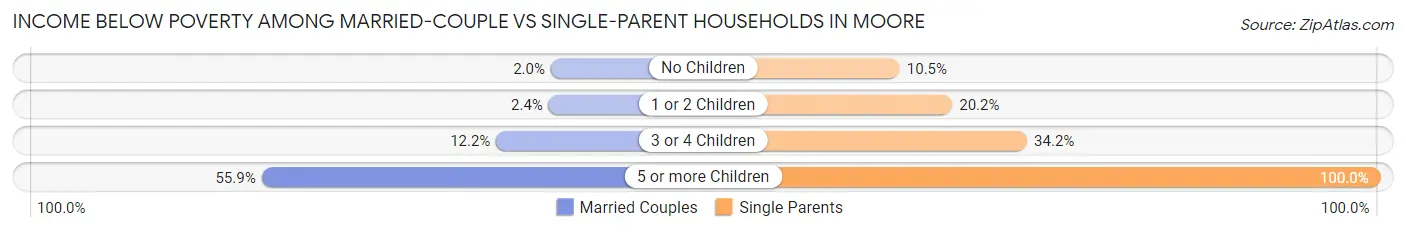
| Children | Married-Couple Families | Single-Parent Households |
| No Children | 118 (2.0%) | 131 (10.5%) |
| 1 or 2 Children | 110 (2.4%) | 581 (20.2%) |
| 3 or 4 Children | 140 (12.2%) | 175 (34.2%) |
| 5 or more Children | 38 (55.9%) | 25 (100.0%) |
| Total | 406 (3.5%) | 912 (19.6%) |
Race in Moore
The most populous races in Moore are White / Caucasian (46,099 | 73.5%), Two or more Races (7,186 | 11.5%), and Hispanic or Latino (7,120 | 11.4%).
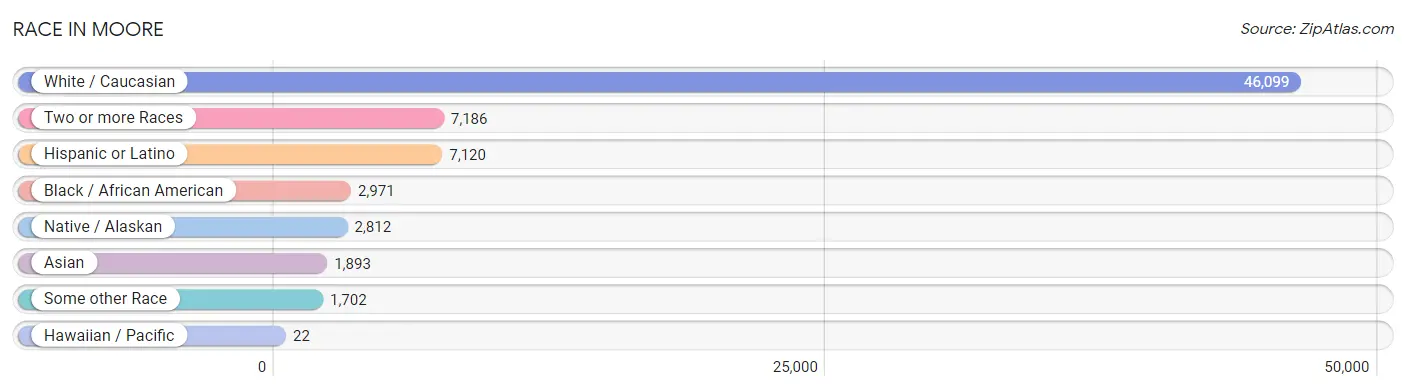
| Race | # Population | % Population |
| Asian | 1,893 | 3.0% |
| Black / African American | 2,971 | 4.7% |
| Hawaiian / Pacific | 22 | 0.0% |
| Hispanic or Latino | 7,120 | 11.4% |
| Native / Alaskan | 2,812 | 4.5% |
| White / Caucasian | 46,099 | 73.5% |
| Two or more Races | 7,186 | 11.5% |
| Some other Race | 1,702 | 2.7% |
| Total | 62,685 | 100.0% |
Ancestry in Moore
The most populous ancestries reported in Moore are American (7,218 | 11.5%), Irish (6,715 | 10.7%), German (6,707 | 10.7%), English (6,542 | 10.4%), and Mexican (5,603 | 8.9%), together accounting for 52.3% of all Moore residents.
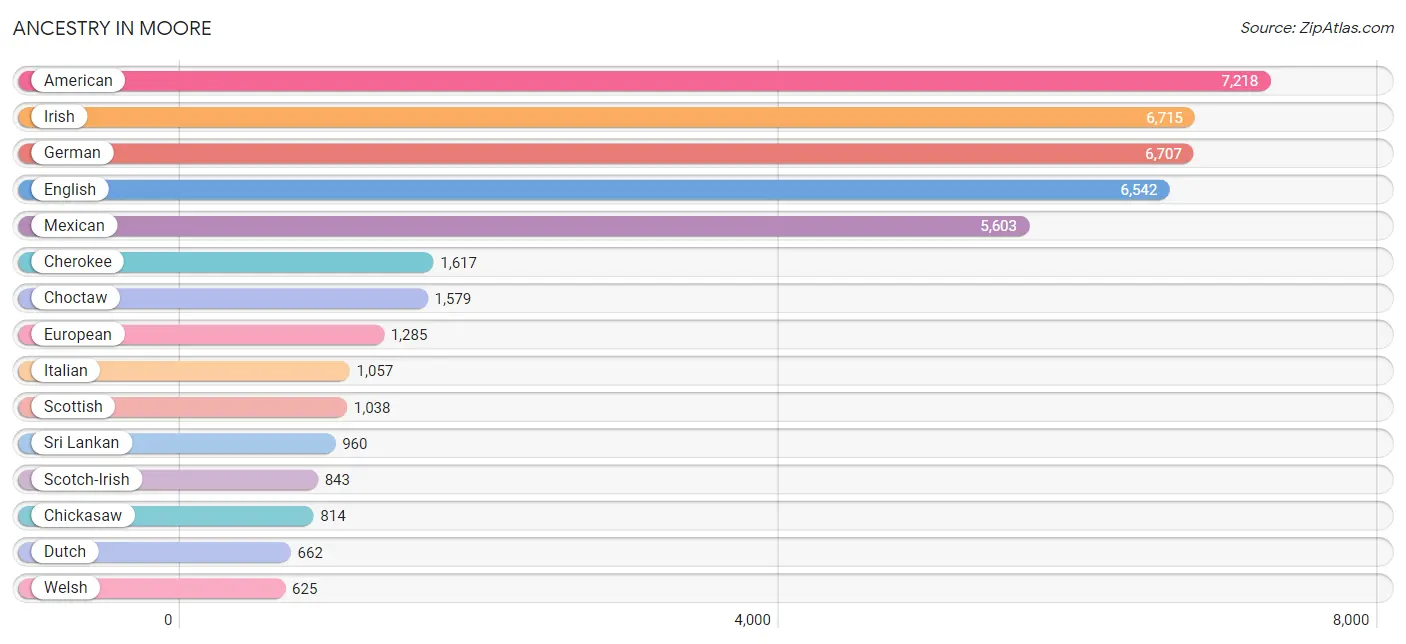
| Ancestry | # Population | % Population |
| African | 291 | 0.5% |
| Alaska Native | 30 | 0.1% |
| Albanian | 59 | 0.1% |
| American | 7,218 | 11.5% |
| Apache | 38 | 0.1% |
| Arab | 93 | 0.2% |
| Argentinean | 15 | 0.0% |
| Armenian | 118 | 0.2% |
| Austrian | 41 | 0.1% |
| Bangladeshi | 34 | 0.1% |
| Bhutanese | 158 | 0.3% |
| Blackfeet | 98 | 0.2% |
| Brazilian | 10 | 0.0% |
| British | 339 | 0.5% |
| Bulgarian | 35 | 0.1% |
| Burmese | 353 | 0.6% |
| Cajun | 46 | 0.1% |
| Canadian | 42 | 0.1% |
| Celtic | 46 | 0.1% |
| Central American | 513 | 0.8% |
| Central American Indian | 474 | 0.8% |
| Cherokee | 1,617 | 2.6% |
| Chickasaw | 814 | 1.3% |
| Chippewa | 79 | 0.1% |
| Choctaw | 1,579 | 2.5% |
| Comanche | 111 | 0.2% |
| Creek | 343 | 0.5% |
| Cuban | 28 | 0.0% |
| Czech | 119 | 0.2% |
| Czechoslovakian | 43 | 0.1% |
| Danish | 72 | 0.1% |
| Delaware | 11 | 0.0% |
| Dutch | 662 | 1.1% |
| Dutch West Indian | 32 | 0.1% |
| Eastern European | 6 | 0.0% |
| English | 6,542 | 10.4% |
| European | 1,285 | 2.1% |
| Finnish | 21 | 0.0% |
| French | 558 | 0.9% |
| French Canadian | 118 | 0.2% |
| German | 6,707 | 10.7% |
| Ghanaian | 199 | 0.3% |
| Greek | 49 | 0.1% |
| Guamanian / Chamorro | 41 | 0.1% |
| Guatemalan | 338 | 0.5% |
| Honduran | 159 | 0.3% |
| Hungarian | 89 | 0.1% |
| Icelander | 11 | 0.0% |
| Indian (Asian) | 416 | 0.7% |
| Indonesian | 25 | 0.0% |
| Irish | 6,715 | 10.7% |
| Iroquois | 33 | 0.1% |
| Italian | 1,057 | 1.7% |
| Jamaican | 26 | 0.0% |
| Kiowa | 182 | 0.3% |
| Korean | 238 | 0.4% |
| Laotian | 9 | 0.0% |
| Lebanese | 10 | 0.0% |
| Lithuanian | 88 | 0.1% |
| Luxembourger | 13 | 0.0% |
| Malaysian | 146 | 0.2% |
| Mexican | 5,603 | 8.9% |
| Mexican American Indian | 130 | 0.2% |
| Moroccan | 24 | 0.0% |
| Navajo | 48 | 0.1% |
| Nicaraguan | 8 | 0.0% |
| Northern European | 96 | 0.2% |
| Norwegian | 256 | 0.4% |
| Osage | 67 | 0.1% |
| Pakistani | 255 | 0.4% |
| Panamanian | 8 | 0.0% |
| Pennsylvania German | 17 | 0.0% |
| Peruvian | 15 | 0.0% |
| Polish | 545 | 0.9% |
| Portuguese | 147 | 0.2% |
| Potawatomi | 120 | 0.2% |
| Puerto Rican | 373 | 0.6% |
| Romanian | 99 | 0.2% |
| Russian | 46 | 0.1% |
| Samoan | 112 | 0.2% |
| Scandinavian | 134 | 0.2% |
| Scotch-Irish | 843 | 1.3% |
| Scottish | 1,038 | 1.7% |
| Seminole | 100 | 0.2% |
| Serbian | 3 | 0.0% |
| Sioux | 8 | 0.0% |
| South American | 117 | 0.2% |
| Spaniard | 242 | 0.4% |
| Spanish | 103 | 0.2% |
| Sri Lankan | 960 | 1.5% |
| Subsaharan African | 537 | 0.9% |
| Swedish | 187 | 0.3% |
| Syrian | 8 | 0.0% |
| Thai | 256 | 0.4% |
| Tlingit-Haida | 33 | 0.1% |
| Trinidadian and Tobagonian | 15 | 0.0% |
| Ukrainian | 87 | 0.1% |
| Uruguayan | 27 | 0.0% |
| Venezuelan | 60 | 0.1% |
| Vietnamese | 57 | 0.1% |
| Welsh | 625 | 1.0% |
| West Indian | 36 | 0.1% |
| Yakama | 22 | 0.0% | View All 103 Rows |
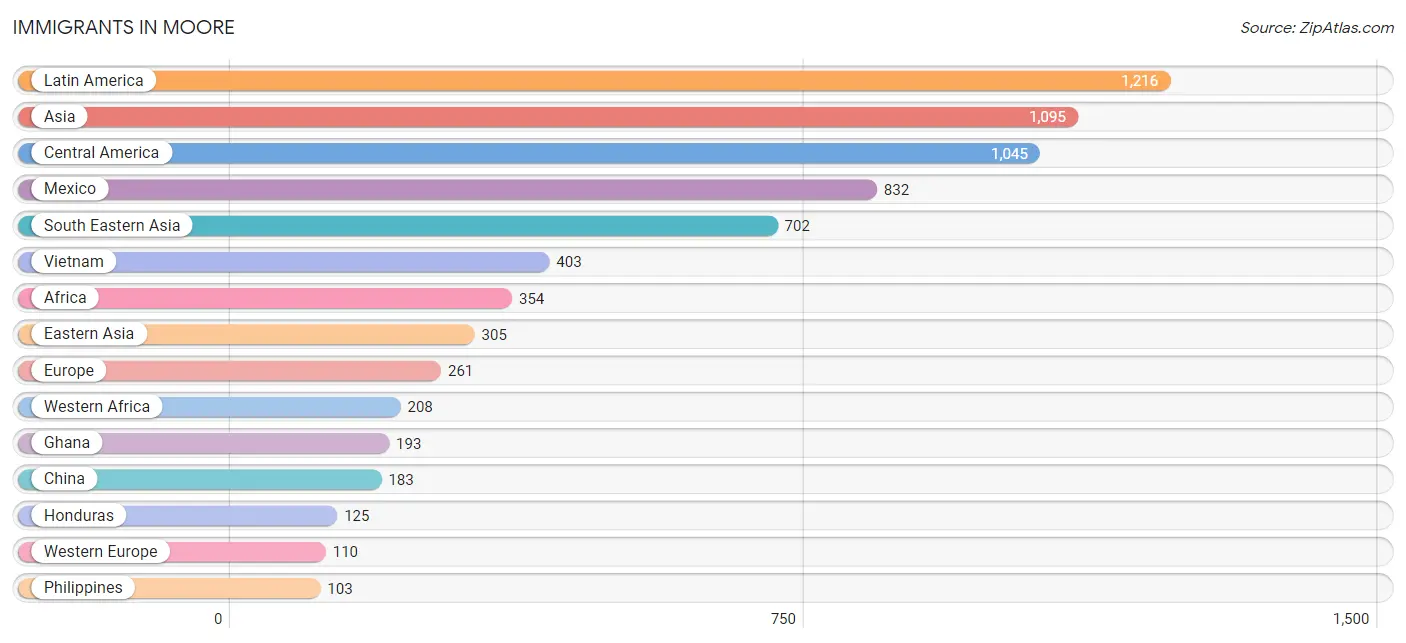
Immigrants in Moore
The most numerous immigrant groups reported in Moore came from Latin America (1,216 | 1.9%), Asia (1,095 | 1.8%), Central America (1,045 | 1.7%), Mexico (832 | 1.3%), and South Eastern Asia (702 | 1.1%), together accounting for 7.8% of all Moore residents.
| Immigration Origin | # Population | % Population |
| Africa | 354 | 0.6% |
| Albania | 59 | 0.1% |
| Argentina | 25 | 0.0% |
| Asia | 1,095 | 1.8% |
| Bangladesh | 57 | 0.1% |
| Cambodia | 40 | 0.1% |
| Cameroon | 59 | 0.1% |
| Canada | 17 | 0.0% |
| Caribbean | 77 | 0.1% |
| Central America | 1,045 | 1.7% |
| China | 183 | 0.3% |
| Cuba | 28 | 0.0% |
| Eastern Africa | 48 | 0.1% |
| Eastern Asia | 305 | 0.5% |
| Eastern Europe | 61 | 0.1% |
| England | 78 | 0.1% |
| Ethiopia | 48 | 0.1% |
| Europe | 261 | 0.4% |
| Germany | 94 | 0.2% |
| Ghana | 193 | 0.3% |
| Guatemala | 88 | 0.1% |
| Honduras | 125 | 0.2% |
| India | 22 | 0.0% |
| Iran | 7 | 0.0% |
| Jamaica | 20 | 0.0% |
| Japan | 58 | 0.1% |
| Korea | 64 | 0.1% |
| Laos | 50 | 0.1% |
| Latin America | 1,216 | 1.9% |
| Malaysia | 50 | 0.1% |
| Mexico | 832 | 1.3% |
| Middle Africa | 59 | 0.1% |
| Morocco | 24 | 0.0% |
| Netherlands | 16 | 0.0% |
| Nigeria | 15 | 0.0% |
| Northern Africa | 24 | 0.0% |
| Northern Europe | 89 | 0.1% |
| Peru | 32 | 0.1% |
| Philippines | 103 | 0.2% |
| Poland | 2 | 0.0% |
| Singapore | 6 | 0.0% |
| South Africa | 15 | 0.0% |
| South America | 94 | 0.2% |
| South Central Asia | 86 | 0.1% |
| South Eastern Asia | 702 | 1.1% |
| Southern Europe | 1 | 0.0% |
| Spain | 1 | 0.0% |
| Taiwan | 27 | 0.0% |
| Thailand | 50 | 0.1% |
| Trinidad and Tobago | 29 | 0.1% |
| Venezuela | 37 | 0.1% |
| Vietnam | 403 | 0.6% |
| Western Africa | 208 | 0.3% |
| Western Asia | 2 | 0.0% |
| Western Europe | 110 | 0.2% | View All 55 Rows |
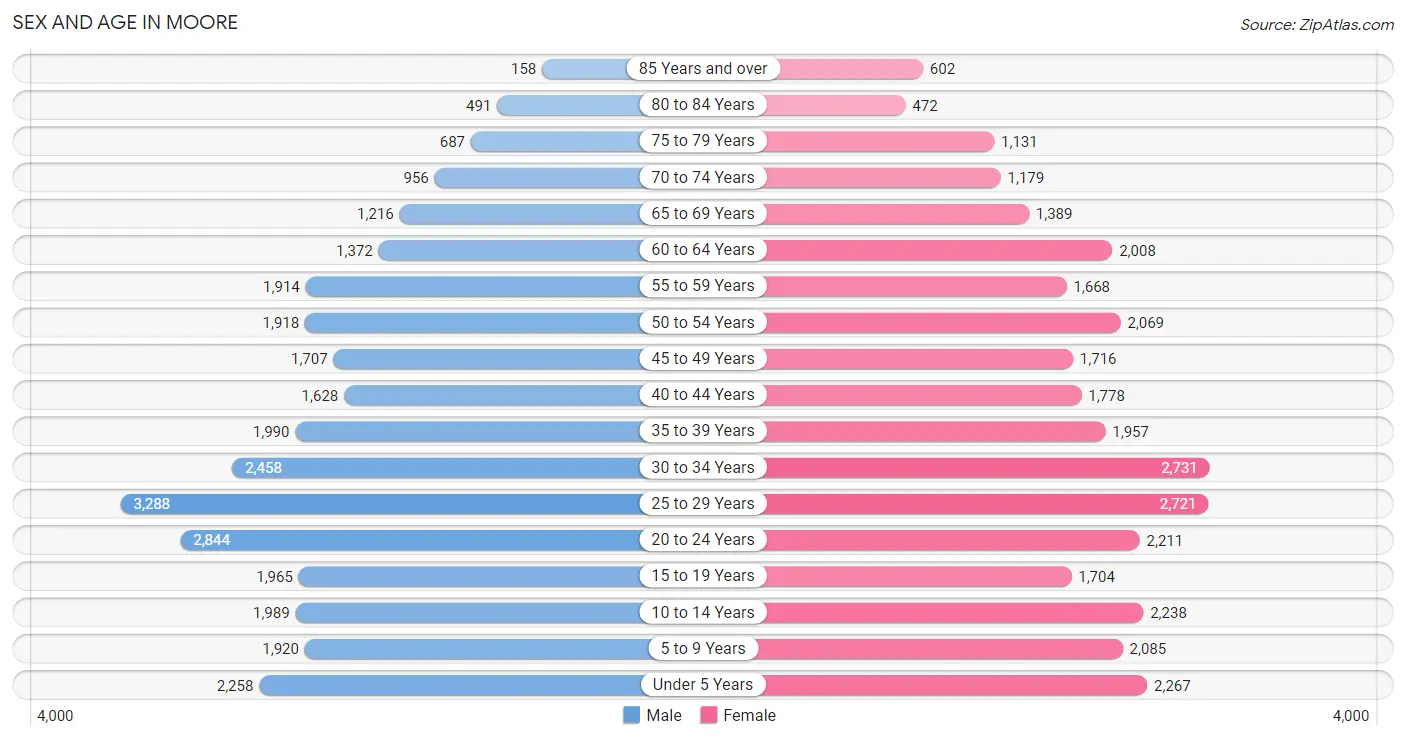
Sex and Age in Moore
Sex and Age in Moore
The most populous age groups in Moore are 25 to 29 Years (3,288 | 10.7%) for men and 30 to 34 Years (2,731 | 8.6%) for women.
| Age Bracket | Male | Female |
| Under 5 Years | 2,258 (7.3%) | 2,267 (7.1%) |
| 5 to 9 Years | 1,920 (6.2%) | 2,085 (6.5%) |
| 10 to 14 Years | 1,989 (6.5%) | 2,238 (7.0%) |
| 15 to 19 Years | 1,965 (6.4%) | 1,704 (5.3%) |
| 20 to 24 Years | 2,844 (9.2%) | 2,211 (6.9%) |
| 25 to 29 Years | 3,288 (10.7%) | 2,721 (8.5%) |
| 30 to 34 Years | 2,458 (8.0%) | 2,731 (8.6%) |
| 35 to 39 Years | 1,990 (6.5%) | 1,957 (6.1%) |
| 40 to 44 Years | 1,628 (5.3%) | 1,778 (5.6%) |
| 45 to 49 Years | 1,707 (5.6%) | 1,716 (5.4%) |
| 50 to 54 Years | 1,918 (6.2%) | 2,069 (6.5%) |
| 55 to 59 Years | 1,914 (6.2%) | 1,668 (5.2%) |
| 60 to 64 Years | 1,372 (4.5%) | 2,008 (6.3%) |
| 65 to 69 Years | 1,216 (4.0%) | 1,389 (4.3%) |
| 70 to 74 Years | 956 (3.1%) | 1,179 (3.7%) |
| 75 to 79 Years | 687 (2.2%) | 1,131 (3.5%) |
| 80 to 84 Years | 491 (1.6%) | 472 (1.5%) |
| 85 Years and over | 158 (0.5%) | 602 (1.9%) |
| Total | 30,759 (100.0%) | 31,926 (100.0%) |
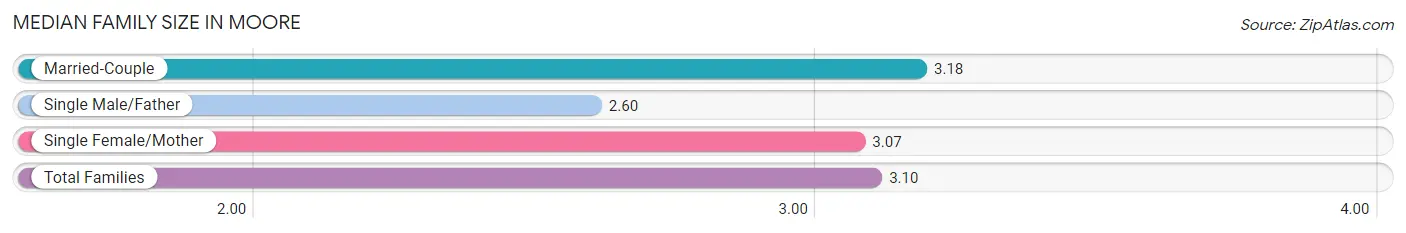
Families and Households in Moore
Median Family Size in Moore
The median family size in Moore is 3.10 persons per family, with married-couple families (11,761 | 71.6%) accounting for the largest median family size of 3.18 persons per family. On the other hand, single male/father families (1,750 | 10.7%) represent the smallest median family size with 2.60 persons per family.
| Family Type | # Families | Family Size |
| Married-Couple | 11,761 (71.6%) | 3.18 |
| Single Male/Father | 1,750 (10.7%) | 2.60 |
| Single Female/Mother | 2,909 (17.7%) | 3.07 |
| Total Families | 16,420 (100.0%) | 3.10 |
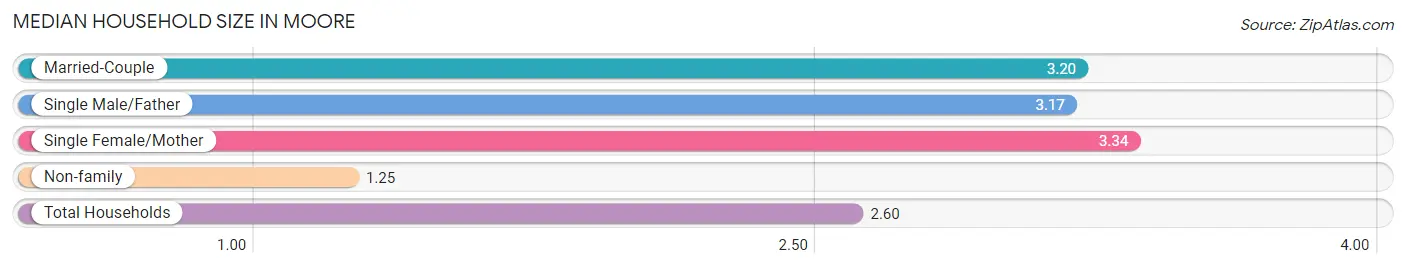
Median Household Size in Moore
The median household size in Moore is 2.60 persons per household, with single female/mother households (2,909 | 12.2%) accounting for the largest median household size of 3.34 persons per household. non-family households (7,507 | 31.4%) represent the smallest median household size with 1.25 persons per household.
| Household Type | # Households | Household Size |
| Married-Couple | 11,761 (49.1%) | 3.20 |
| Single Male/Father | 1,750 (7.3%) | 3.17 |
| Single Female/Mother | 2,909 (12.2%) | 3.34 |
| Non-family | 7,507 (31.4%) | 1.25 |
| Total Households | 23,927 (100.0%) | 2.60 |
Household Size by Marriage Status in Moore
Out of a total of 23,927 households in Moore, 16,420 (68.6%) are family households, while 7,507 (31.4%) are nonfamily households. The most numerous type of family households are 2-person households, comprising 6,021, and the most common type of nonfamily households are 1-person households, comprising 6,041.
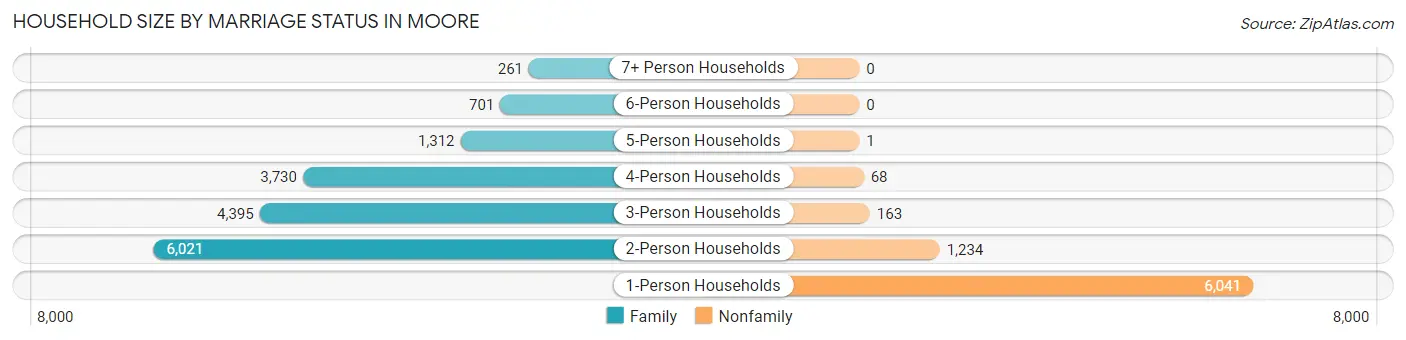
| Household Size | Family Households | Nonfamily Households |
| 1-Person Households | - | 6,041 (25.3%) |
| 2-Person Households | 6,021 (25.2%) | 1,234 (5.2%) |
| 3-Person Households | 4,395 (18.4%) | 163 (0.7%) |
| 4-Person Households | 3,730 (15.6%) | 68 (0.3%) |
| 5-Person Households | 1,312 (5.5%) | 1 (0.0%) |
| 6-Person Households | 701 (2.9%) | 0 (0.0%) |
| 7+ Person Households | 261 (1.1%) | 0 (0.0%) |
| Total | 16,420 (68.6%) | 7,507 (31.4%) |
Female Fertility in Moore
Fertility by Age in Moore
Average fertility rate in Moore is 88.0 births per 1,000 women. Women in the age bracket of 20 to 34 years have the highest fertility rate with 154.0 births per 1,000 women. Women in the age bracket of 20 to 34 years acount for 88.1% of all women with births.
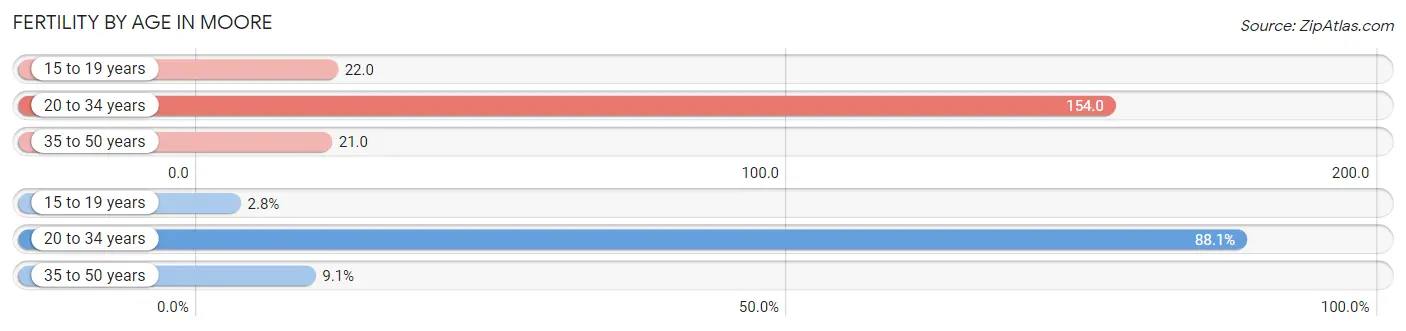
| Age Bracket | Women with Births | Births / 1,000 Women |
| 15 to 19 years | 37 (2.8%) | 22.0 |
| 20 to 34 years | 1,181 (88.1%) | 154.0 |
| 35 to 50 years | 122 (9.1%) | 21.0 |
| Total | 1,340 (100.0%) | 88.0 |
Fertility by Age by Marriage Status in Moore
77.7% of women with births (1,340) in Moore are married. The highest percentage of unmarried women with births falls into 15 to 19 years age bracket with 100.0% of them unmarried at the time of birth, while the lowest percentage of unmarried women with births belong to 20 to 34 years age bracket with 19.1% of them unmarried.
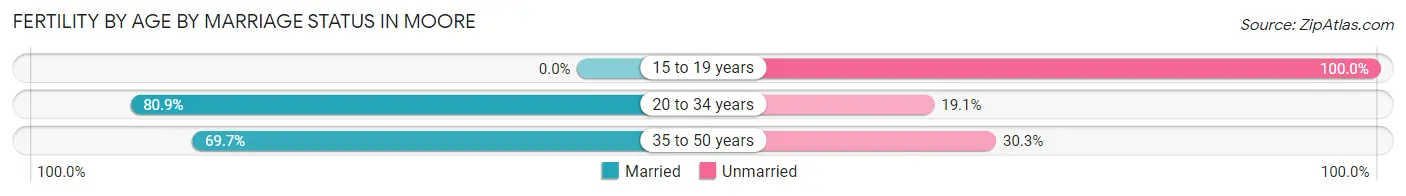
| Age Bracket | Married | Unmarried |
| 15 to 19 years | 0 (0.0%) | 37 (100.0%) |
| 20 to 34 years | 955 (80.9%) | 226 (19.1%) |
| 35 to 50 years | 85 (69.7%) | 37 (30.3%) |
| Total | 1,041 (77.7%) | 299 (22.3%) |
Fertility by Education in Moore
Average fertility rate in Moore is 88.0 births per 1,000 women. Women with the education attainment of college or associate's degree have the highest fertility rate of 107.0 births per 1,000 women, while women with the education attainment of graduate degree have the lowest fertility at 24.0 births per 1,000 women. Women with the education attainment of college or associate's degree represent 44.0% of all women with births.
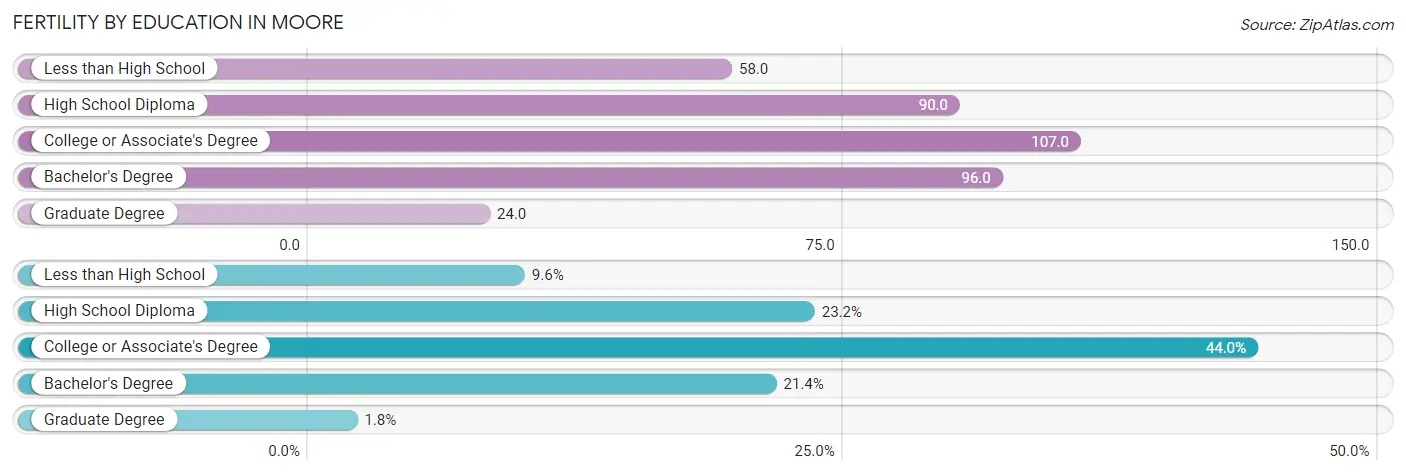
| Educational Attainment | Women with Births | Births / 1,000 Women |
| Less than High School | 129 (9.6%) | 58.0 |
| High School Diploma | 311 (23.2%) | 90.0 |
| College or Associate's Degree | 589 (44.0%) | 107.0 |
| Bachelor's Degree | 287 (21.4%) | 96.0 |
| Graduate Degree | 24 (1.8%) | 24.0 |
| Total | 1,340 (100.0%) | 88.0 |
Fertility by Education by Marriage Status in Moore
22.3% of women with births in Moore are unmarried. Women with the educational attainment of graduate degree are most likely to be married with 100.0% of them married at childbirth, while women with the educational attainment of less than high school are least likely to be married with 41.1% of them unmarried at childbirth.
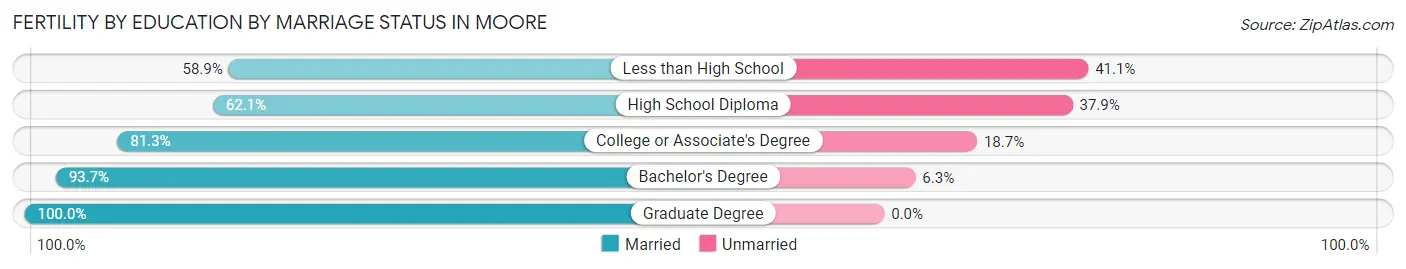
| Educational Attainment | Married | Unmarried |
| Less than High School | 76 (58.9%) | 53 (41.1%) |
| High School Diploma | 193 (62.1%) | 118 (37.9%) |
| College or Associate's Degree | 479 (81.3%) | 110 (18.7%) |
| Bachelor's Degree | 269 (93.7%) | 18 (6.3%) |
| Graduate Degree | 24 (100.0%) | 0 (0.0%) |
| Total | 1,041 (77.7%) | 299 (22.3%) |
Employment Characteristics in Moore
Employment by Class of Employer in Moore
Among the 32,159 employed individuals in Moore, private company employees (20,715 | 64.4%), federal government employees (3,341 | 10.4%), and local government employees (1,924 | 6.0%) make up the most common classes of employment.
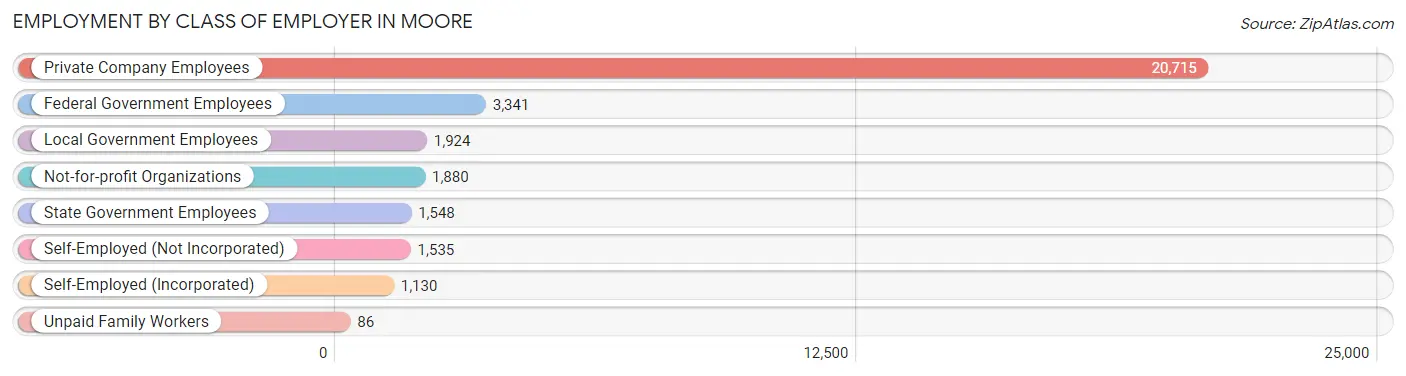
| Employer Class | # Employees | % Employees |
| Private Company Employees | 20,715 | 64.4% |
| Self-Employed (Incorporated) | 1,130 | 3.5% |
| Self-Employed (Not Incorporated) | 1,535 | 4.8% |
| Not-for-profit Organizations | 1,880 | 5.9% |
| Local Government Employees | 1,924 | 6.0% |
| State Government Employees | 1,548 | 4.8% |
| Federal Government Employees | 3,341 | 10.4% |
| Unpaid Family Workers | 86 | 0.3% |
| Total | 32,159 | 100.0% |
Employment Status by Age in Moore
According to the labor force statistics for Moore, out of the total population over 16 years of age (49,147), 69.6% or 34,206 individuals are in the labor force, with 4.1% or 1,402 of them unemployed. The age group with the highest labor force participation rate is 35 to 44 years, with 88.1% or 6,478 individuals in the labor force. Within the labor force, the 16 to 19 years age range has the highest percentage of unemployed individuals, with 12.4% or 172 of them being unemployed.
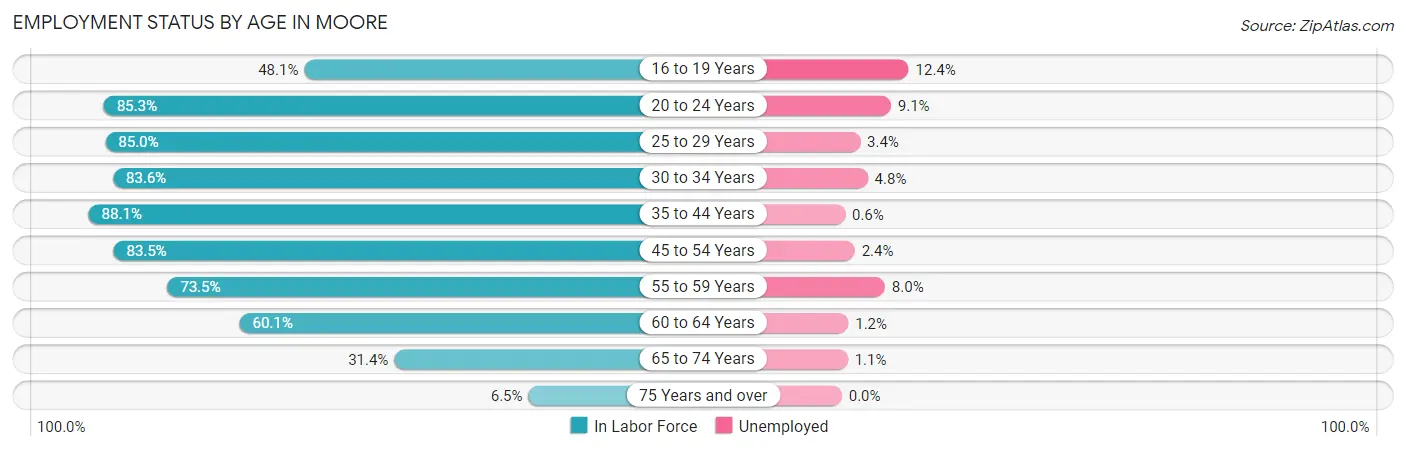
| Age Bracket | In Labor Force | Unemployed |
| 16 to 19 Years | 1,389 (48.1%) | 172 (12.4%) |
| 20 to 24 Years | 4,312 (85.3%) | 392 (9.1%) |
| 25 to 29 Years | 5,108 (85.0%) | 174 (3.4%) |
| 30 to 34 Years | 4,338 (83.6%) | 208 (4.8%) |
| 35 to 44 Years | 6,478 (88.1%) | 39 (0.6%) |
| 45 to 54 Years | 6,187 (83.5%) | 148 (2.4%) |
| 55 to 59 Years | 2,633 (73.5%) | 211 (8.0%) |
| 60 to 64 Years | 2,031 (60.1%) | 24 (1.2%) |
| 65 to 74 Years | 1,488 (31.4%) | 16 (1.1%) |
| 75 Years and over | 230 (6.5%) | 0 (0.0%) |
| Total | 34,206 (69.6%) | 1,402 (4.1%) |
Employment Status by Educational Attainment in Moore
According to labor force statistics for Moore, 81.3% of individuals (26,766) out of the total population between 25 and 64 years of age (32,923) are in the labor force, with 3.0% or 803 of them being unemployed. The group with the highest labor force participation rate are those with the educational attainment of bachelor's degree or higher, with 89.0% or 8,306 individuals in the labor force. Within the labor force, individuals with less than high school education have the highest percentage of unemployment, with 6.6% or 110 of them being unemployed.
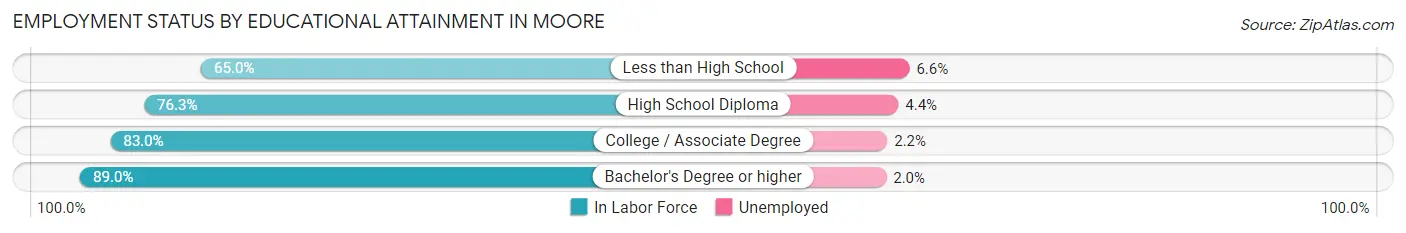
| Educational Attainment | In Labor Force | Unemployed |
| Less than High School | 1,660 (65.0%) | 169 (6.6%) |
| High School Diploma | 7,288 (76.3%) | 420 (4.4%) |
| College / Associate Degree | 9,532 (83.0%) | 253 (2.2%) |
| Bachelor's Degree or higher | 8,306 (89.0%) | 187 (2.0%) |
| Total | 26,766 (81.3%) | 988 (3.0%) |
Employment Occupations by Sex in Moore
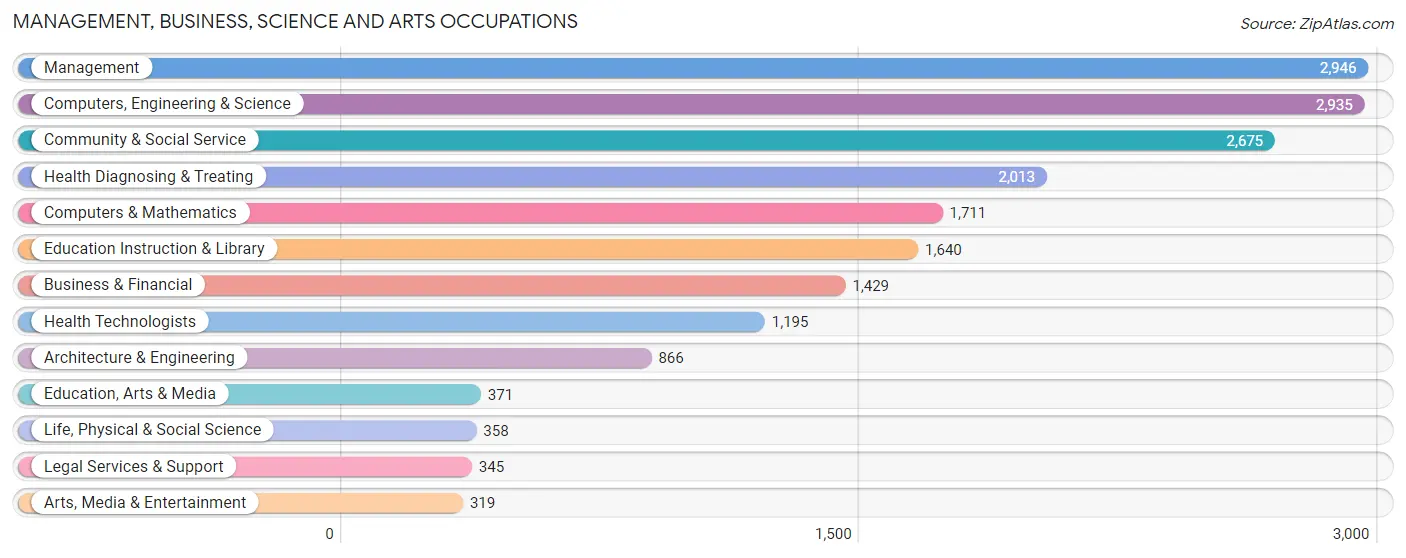
Management, Business, Science and Arts Occupations
The most common Management, Business, Science and Arts occupations in Moore are Management (2,946 | 9.2%), Computers, Engineering & Science (2,935 | 9.2%), Community & Social Service (2,675 | 8.4%), Health Diagnosing & Treating (2,013 | 6.3%), and Computers & Mathematics (1,711 | 5.4%).
Management, Business, Science and Arts Occupations by Sex
Within the Management, Business, Science and Arts occupations in Moore, the most male-oriented occupations are Architecture & Engineering (85.7%), Life, Physical & Social Science (82.4%), and Computers, Engineering & Science (79.8%), while the most female-oriented occupations are Health Technologists (86.0%), Health Diagnosing & Treating (79.0%), and Education, Arts & Media (73.3%).
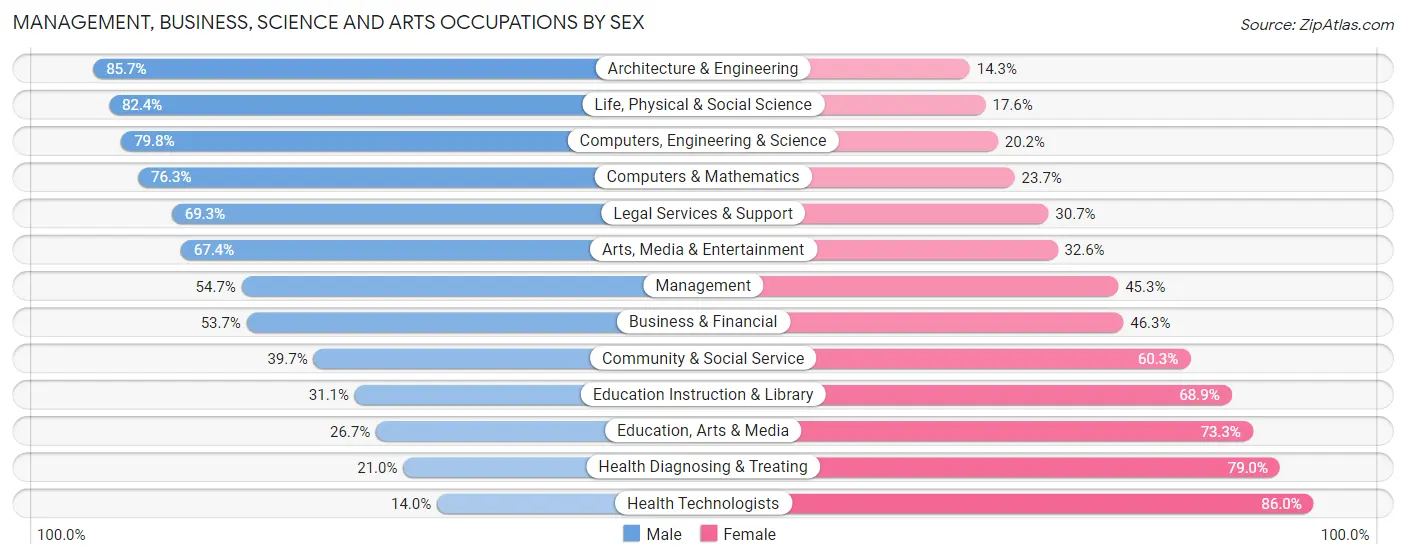
| Occupation | Male | Female |
| Management | 1,612 (54.7%) | 1,334 (45.3%) |
| Business & Financial | 767 (53.7%) | 662 (46.3%) |
| Computers, Engineering & Science | 2,343 (79.8%) | 592 (20.2%) |
| Computers & Mathematics | 1,306 (76.3%) | 405 (23.7%) |
| Architecture & Engineering | 742 (85.7%) | 124 (14.3%) |
| Life, Physical & Social Science | 295 (82.4%) | 63 (17.6%) |
| Community & Social Service | 1,063 (39.7%) | 1,612 (60.3%) |
| Education, Arts & Media | 99 (26.7%) | 272 (73.3%) |
| Legal Services & Support | 239 (69.3%) | 106 (30.7%) |
| Education Instruction & Library | 510 (31.1%) | 1,130 (68.9%) |
| Arts, Media & Entertainment | 215 (67.4%) | 104 (32.6%) |
| Health Diagnosing & Treating | 423 (21.0%) | 1,590 (79.0%) |
| Health Technologists | 167 (14.0%) | 1,028 (86.0%) |
| Total (Category) | 6,208 (51.7%) | 5,790 (48.3%) |
| Total (Overall) | 17,106 (53.6%) | 14,824 (46.4%) |
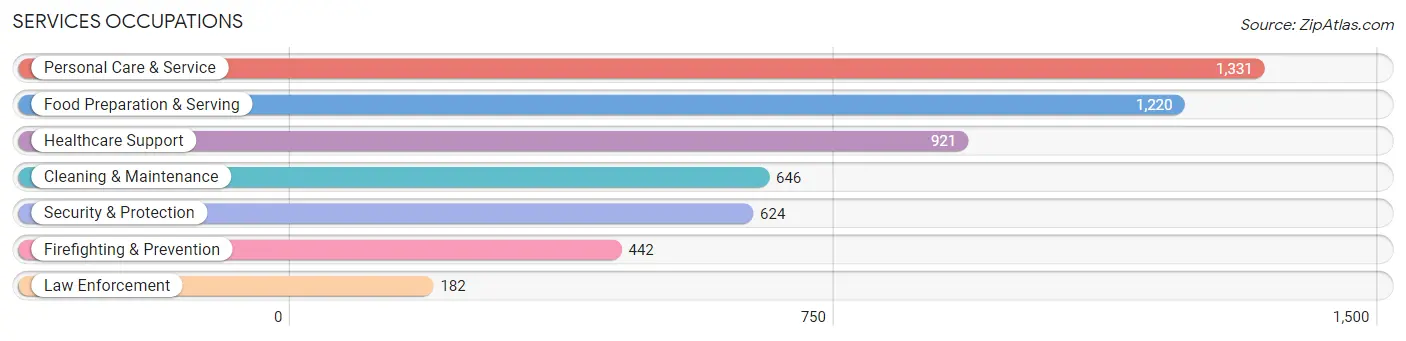
Services Occupations
The most common Services occupations in Moore are Personal Care & Service (1,331 | 4.2%), Food Preparation & Serving (1,220 | 3.8%), Healthcare Support (921 | 2.9%), Cleaning & Maintenance (646 | 2.0%), and Security & Protection (624 | 1.9%).
Services Occupations by Sex
Within the Services occupations in Moore, the most male-oriented occupations are Law Enforcement (92.3%), Security & Protection (87.2%), and Firefighting & Prevention (85.1%), while the most female-oriented occupations are Personal Care & Service (88.7%), Healthcare Support (84.3%), and Food Preparation & Serving (68.1%).
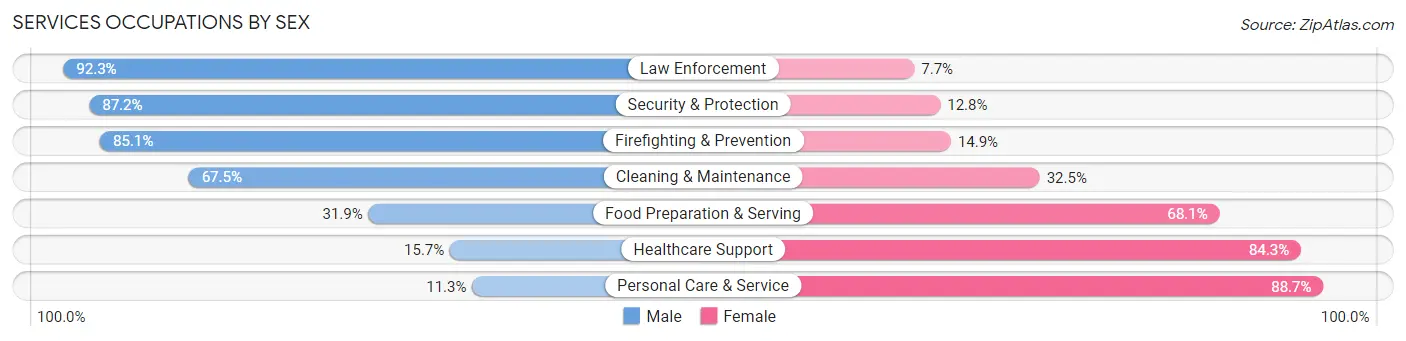
| Occupation | Male | Female |
| Healthcare Support | 145 (15.7%) | 776 (84.3%) |
| Security & Protection | 544 (87.2%) | 80 (12.8%) |
| Firefighting & Prevention | 376 (85.1%) | 66 (14.9%) |
| Law Enforcement | 168 (92.3%) | 14 (7.7%) |
| Food Preparation & Serving | 389 (31.9%) | 831 (68.1%) |
| Cleaning & Maintenance | 436 (67.5%) | 210 (32.5%) |
| Personal Care & Service | 151 (11.3%) | 1,180 (88.7%) |
| Total (Category) | 1,665 (35.1%) | 3,077 (64.9%) |
| Total (Overall) | 17,106 (53.6%) | 14,824 (46.4%) |
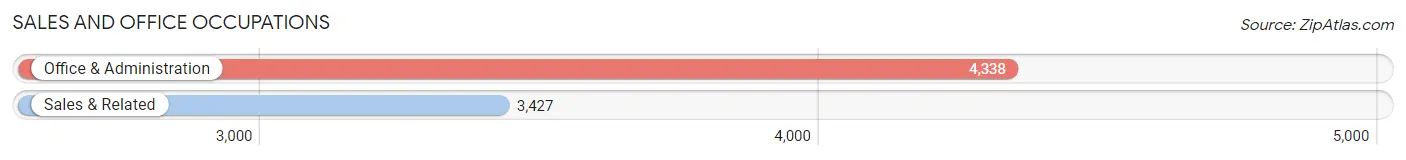
Sales and Office Occupations
The most common Sales and Office occupations in Moore are Office & Administration (4,338 | 13.6%), and Sales & Related (3,427 | 10.7%).
Sales and Office Occupations by Sex
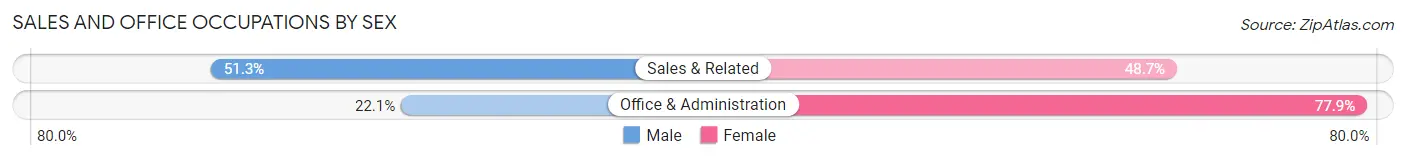
| Occupation | Male | Female |
| Sales & Related | 1,759 (51.3%) | 1,668 (48.7%) |
| Office & Administration | 958 (22.1%) | 3,380 (77.9%) |
| Total (Category) | 2,717 (35.0%) | 5,048 (65.0%) |
| Total (Overall) | 17,106 (53.6%) | 14,824 (46.4%) |
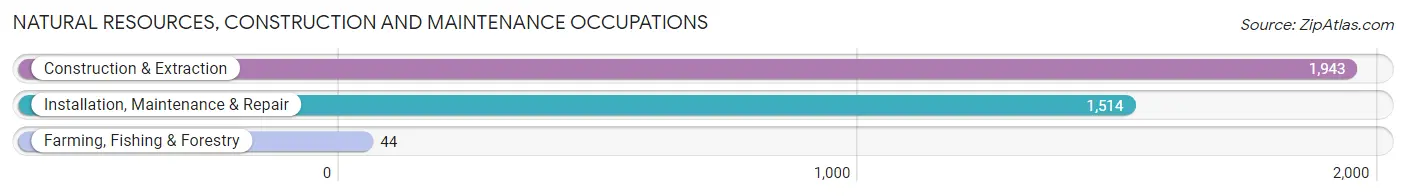
Natural Resources, Construction and Maintenance Occupations
The most common Natural Resources, Construction and Maintenance occupations in Moore are Construction & Extraction (1,943 | 6.1%), Installation, Maintenance & Repair (1,514 | 4.7%), and Farming, Fishing & Forestry (44 | 0.1%).
Natural Resources, Construction and Maintenance Occupations by Sex
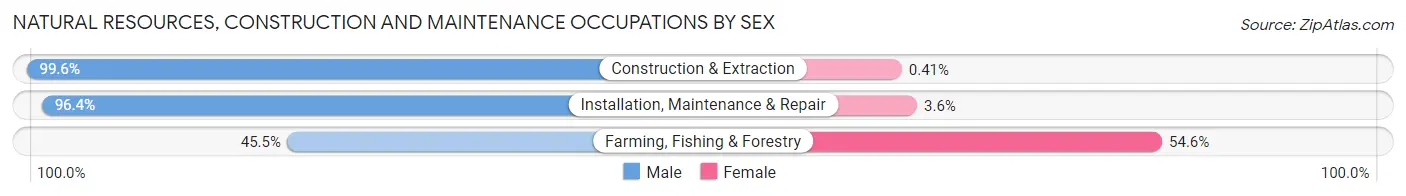
| Occupation | Male | Female |
| Farming, Fishing & Forestry | 20 (45.5%) | 24 (54.5%) |
| Construction & Extraction | 1,935 (99.6%) | 8 (0.4%) |
| Installation, Maintenance & Repair | 1,460 (96.4%) | 54 (3.6%) |
| Total (Category) | 3,415 (97.5%) | 86 (2.5%) |
| Total (Overall) | 17,106 (53.6%) | 14,824 (46.4%) |
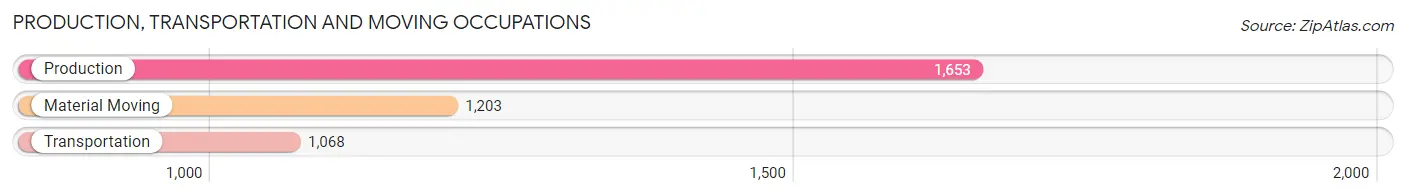
Production, Transportation and Moving Occupations
The most common Production, Transportation and Moving occupations in Moore are Production (1,653 | 5.2%), Material Moving (1,203 | 3.8%), and Transportation (1,068 | 3.3%).
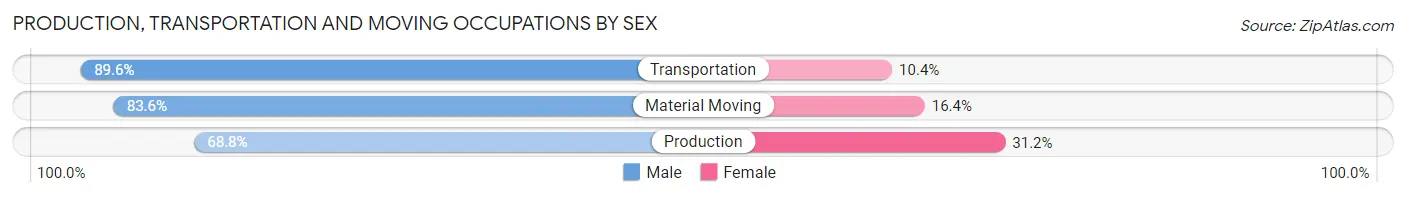
Production, Transportation and Moving Occupations by Sex
| Occupation | Male | Female |
| Production | 1,138 (68.8%) | 515 (31.2%) |
| Transportation | 957 (89.6%) | 111 (10.4%) |
| Material Moving | 1,006 (83.6%) | 197 (16.4%) |
| Total (Category) | 3,101 (79.0%) | 823 (21.0%) |
| Total (Overall) | 17,106 (53.6%) | 14,824 (46.4%) |
Employment Industries by Sex in Moore
Employment Industries in Moore
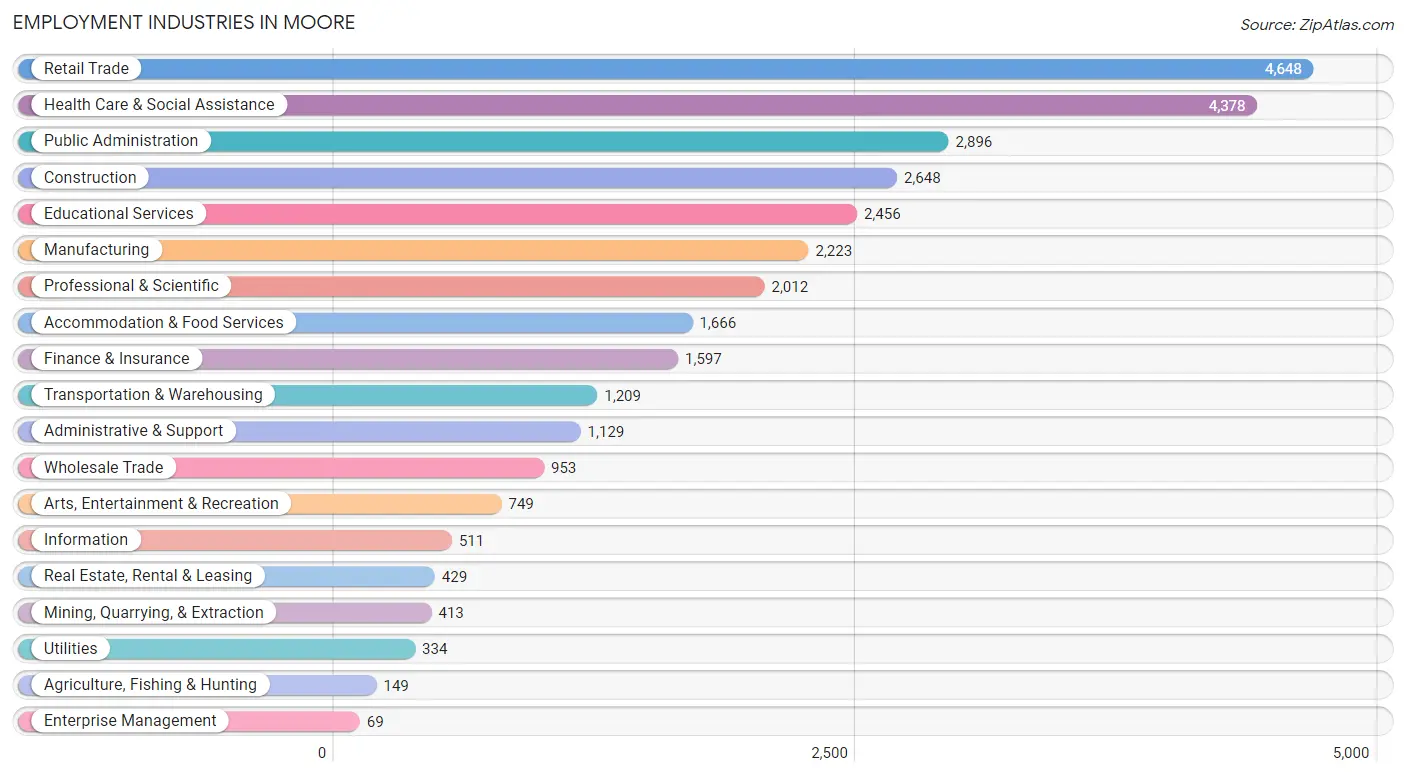
The major employment industries in Moore include Retail Trade (4,648 | 14.6%), Health Care & Social Assistance (4,378 | 13.7%), Public Administration (2,896 | 9.1%), Construction (2,648 | 8.3%), and Educational Services (2,456 | 7.7%).
Employment Industries by Sex in Moore
The Moore industries that see more men than women are Mining, Quarrying, & Extraction (98.1%), Enterprise Management (97.1%), and Construction (89.1%), whereas the industries that tend to have a higher number of women are Health Care & Social Assistance (82.6%), Finance & Insurance (71.1%), and Arts, Entertainment & Recreation (62.4%).
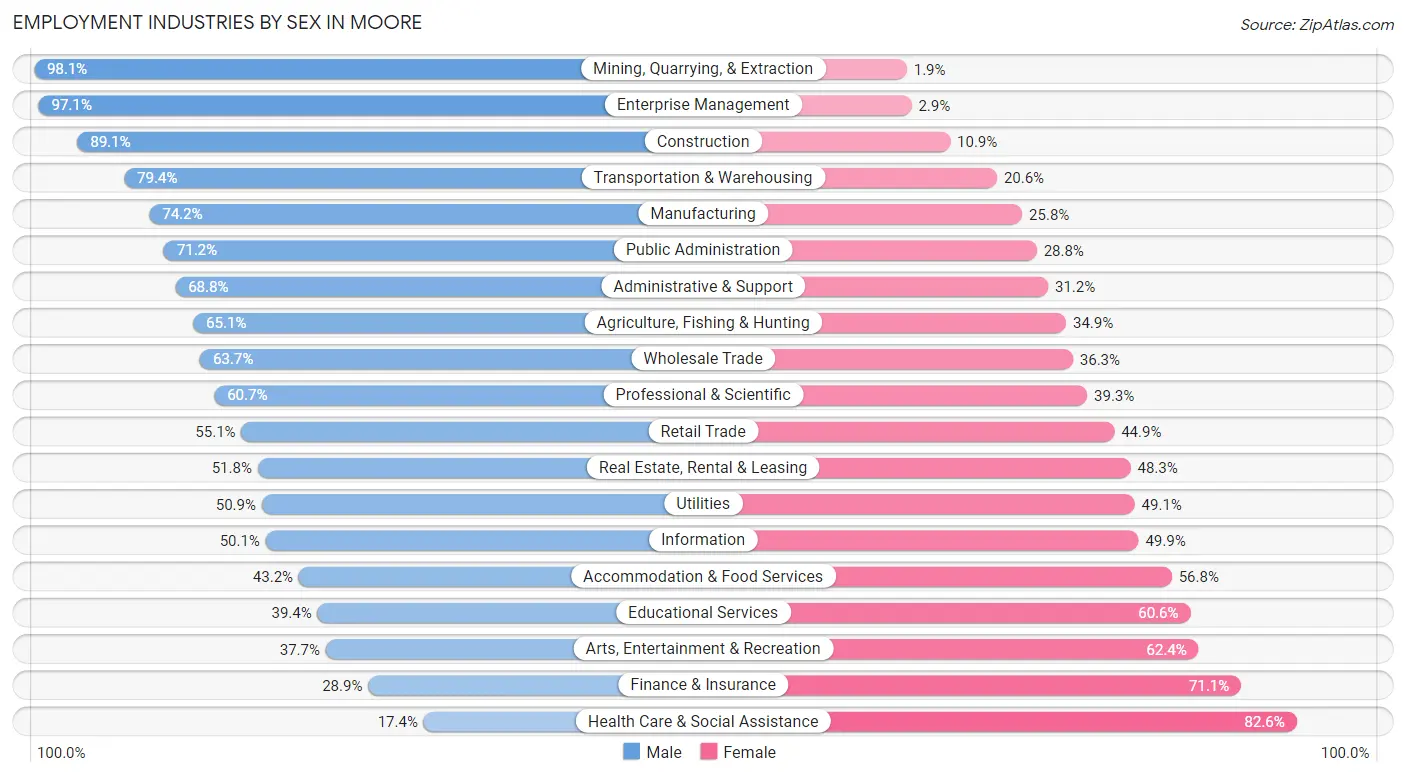
| Industry | Male | Female |
| Agriculture, Fishing & Hunting | 97 (65.1%) | 52 (34.9%) |
| Mining, Quarrying, & Extraction | 405 (98.1%) | 8 (1.9%) |
| Construction | 2,359 (89.1%) | 289 (10.9%) |
| Manufacturing | 1,649 (74.2%) | 574 (25.8%) |
| Wholesale Trade | 607 (63.7%) | 346 (36.3%) |
| Retail Trade | 2,562 (55.1%) | 2,086 (44.9%) |
| Transportation & Warehousing | 960 (79.4%) | 249 (20.6%) |
| Utilities | 170 (50.9%) | 164 (49.1%) |
| Information | 256 (50.1%) | 255 (49.9%) |
| Finance & Insurance | 461 (28.9%) | 1,136 (71.1%) |
| Real Estate, Rental & Leasing | 222 (51.7%) | 207 (48.2%) |
| Professional & Scientific | 1,222 (60.7%) | 790 (39.3%) |
| Enterprise Management | 67 (97.1%) | 2 (2.9%) |
| Administrative & Support | 777 (68.8%) | 352 (31.2%) |
| Educational Services | 967 (39.4%) | 1,489 (60.6%) |
| Health Care & Social Assistance | 761 (17.4%) | 3,617 (82.6%) |
| Arts, Entertainment & Recreation | 282 (37.7%) | 467 (62.4%) |
| Accommodation & Food Services | 720 (43.2%) | 946 (56.8%) |
| Public Administration | 2,061 (71.2%) | 835 (28.8%) |
| Total | 17,106 (53.6%) | 14,824 (46.4%) |
Education in Moore
School Enrollment in Moore
The most common levels of schooling among the 15,549 students in Moore are middle school (3,595 | 23.1%), high school (3,003 | 19.3%), and elementary school (2,881 | 18.5%).
| School Level | # Students | % Students |
| Nursery / Preschool | 978 | 6.3% |
| Kindergarten | 922 | 5.9% |
| Elementary School | 2,881 | 18.5% |
| Middle School | 3,595 | 23.1% |
| High School | 3,003 | 19.3% |
| College / Undergraduate | 2,864 | 18.4% |
| Graduate / Professional | 1,306 | 8.4% |
| Total | 15,549 | 100.0% |
School Enrollment by Age by Funding Source in Moore
Out of a total of 15,549 students who are enrolled in schools in Moore, 2,363 (15.2%) attend a private institution, while the remaining 13,186 (84.8%) are enrolled in public schools. The age group of 3 to 4 year olds has the highest likelihood of being enrolled in private schools, with 328 (46.3% in the age bracket) enrolled. Conversely, the age group of 10 to 14 year olds has the lowest likelihood of being enrolled in a private school, with 3,719 (89.3% in the age bracket) attending a public institution.
| Age Bracket | Public School | Private School |
| 3 to 4 Year Olds | 381 (53.7%) | 328 (46.3%) |
| 5 to 9 Year Old | 3,290 (89.0%) | 405 (11.0%) |
| 10 to 14 Year Olds | 3,719 (89.3%) | 445 (10.7%) |
| 15 to 17 Year Olds | 2,111 (87.4%) | 304 (12.6%) |
| 18 to 19 Year Olds | 590 (84.9%) | 105 (15.1%) |
| 20 to 24 Year Olds | 1,277 (86.4%) | 201 (13.6%) |
| 25 to 34 Year Olds | 1,051 (74.2%) | 365 (25.8%) |
| 35 Years and over | 762 (78.0%) | 215 (22.0%) |
| Total | 13,186 (84.8%) | 2,363 (15.2%) |
Educational Attainment by Field of Study in Moore
Business (2,618 | 21.6%), education (1,604 | 13.3%), science & technology (1,037 | 8.6%), social sciences (940 | 7.8%), and arts & humanities (912 | 7.5%) are the most common fields of study among 12,106 individuals in Moore who have obtained a bachelor's degree or higher.
| Field of Study | # Graduates | % Graduates |
| Computers & Mathematics | 792 | 6.5% |
| Bio, Nature & Agricultural | 670 | 5.5% |
| Physical & Health Sciences | 193 | 1.6% |
| Psychology | 569 | 4.7% |
| Social Sciences | 940 | 7.8% |
| Engineering | 713 | 5.9% |
| Multidisciplinary Studies | 135 | 1.1% |
| Science & Technology | 1,037 | 8.6% |
| Business | 2,618 | 21.6% |
| Education | 1,604 | 13.3% |
| Literature & Languages | 506 | 4.2% |
| Liberal Arts & History | 597 | 4.9% |
| Visual & Performing Arts | 354 | 2.9% |
| Communications | 466 | 3.8% |
| Arts & Humanities | 912 | 7.5% |
| Total | 12,106 | 100.0% |
Transportation & Commute in Moore
Vehicle Availability by Sex in Moore
The most prevalent vehicle ownership categories in Moore are males with 2 vehicles (8,184, accounting for 46.3%) and females with 2 vehicles (6,497, making up 56.8%).
| Vehicles Available | Male | Female |
| No Vehicle | 305 (1.7%) | 198 (1.4%) |
| 1 Vehicle | 2,990 (16.9%) | 2,858 (19.9%) |
| 2 Vehicles | 8,184 (46.3%) | 6,497 (45.1%) |
| 3 Vehicles | 3,902 (22.1%) | 3,178 (22.1%) |
| 4 Vehicles | 1,707 (9.7%) | 1,146 (8.0%) |
| 5 or more Vehicles | 608 (3.4%) | 524 (3.6%) |
| Total | 17,696 (100.0%) | 14,401 (100.0%) |
Commute Time in Moore
The most frequently occuring commute durations in Moore are 15 to 19 minutes (5,731 commuters, 19.2%), 20 to 24 minutes (5,640 commuters, 18.9%), and 30 to 34 minutes (4,806 commuters, 16.1%).
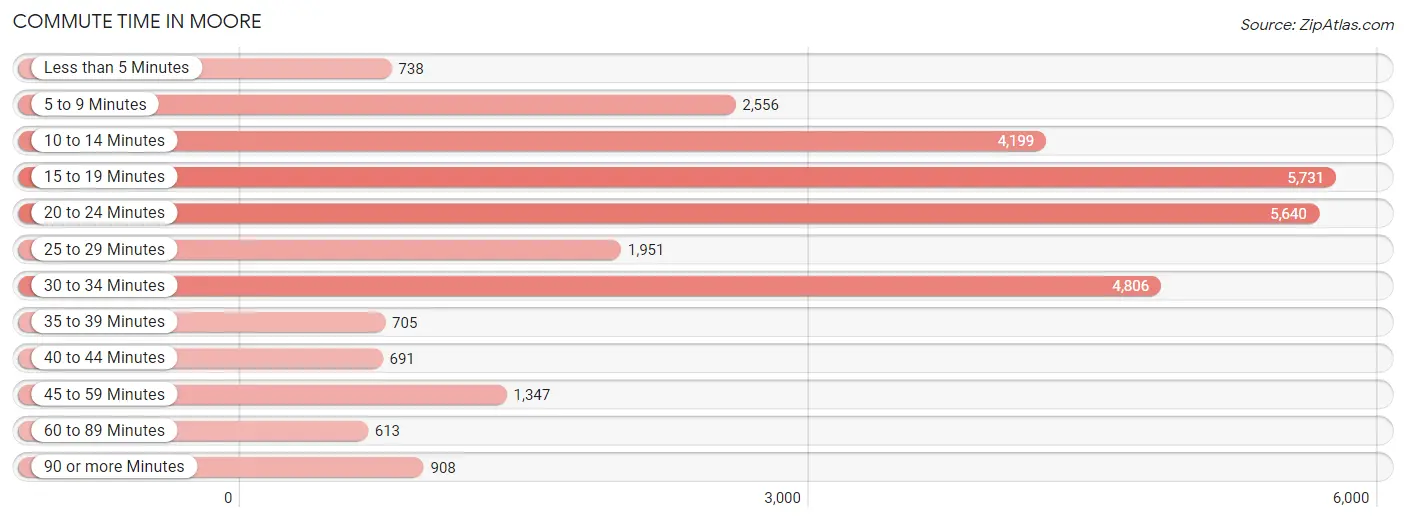
| Commute Time | # Commuters | % Commuters |
| Less than 5 Minutes | 738 | 2.5% |
| 5 to 9 Minutes | 2,556 | 8.6% |
| 10 to 14 Minutes | 4,199 | 14.1% |
| 15 to 19 Minutes | 5,731 | 19.2% |
| 20 to 24 Minutes | 5,640 | 18.9% |
| 25 to 29 Minutes | 1,951 | 6.5% |
| 30 to 34 Minutes | 4,806 | 16.1% |
| 35 to 39 Minutes | 705 | 2.4% |
| 40 to 44 Minutes | 691 | 2.3% |
| 45 to 59 Minutes | 1,347 | 4.5% |
| 60 to 89 Minutes | 613 | 2.1% |
| 90 or more Minutes | 908 | 3.0% |
Commute Time by Sex in Moore
The most common commute times in Moore are 20 to 24 minutes (3,249 commuters, 19.7%) for males and 15 to 19 minutes (2,696 commuters, 20.1%) for females.
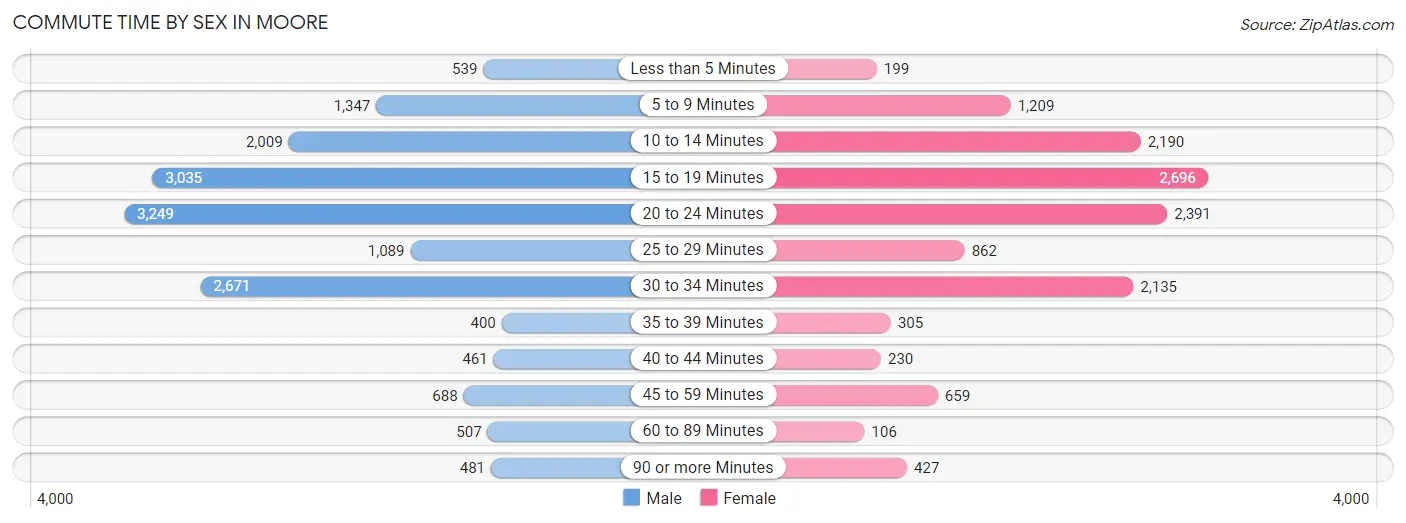
| Commute Time | Male | Female |
| Less than 5 Minutes | 539 (3.3%) | 199 (1.5%) |
| 5 to 9 Minutes | 1,347 (8.2%) | 1,209 (9.0%) |
| 10 to 14 Minutes | 2,009 (12.2%) | 2,190 (16.3%) |
| 15 to 19 Minutes | 3,035 (18.4%) | 2,696 (20.1%) |
| 20 to 24 Minutes | 3,249 (19.7%) | 2,391 (17.8%) |
| 25 to 29 Minutes | 1,089 (6.6%) | 862 (6.4%) |
| 30 to 34 Minutes | 2,671 (16.2%) | 2,135 (15.9%) |
| 35 to 39 Minutes | 400 (2.4%) | 305 (2.3%) |
| 40 to 44 Minutes | 461 (2.8%) | 230 (1.7%) |
| 45 to 59 Minutes | 688 (4.2%) | 659 (4.9%) |
| 60 to 89 Minutes | 507 (3.1%) | 106 (0.8%) |
| 90 or more Minutes | 481 (2.9%) | 427 (3.2%) |
Time of Departure to Work by Sex in Moore
The most frequent times of departure to work in Moore are 7:00 AM to 7:29 AM (2,684, 16.3%) for males and 7:30 AM to 7:59 AM (2,059, 15.4%) for females.
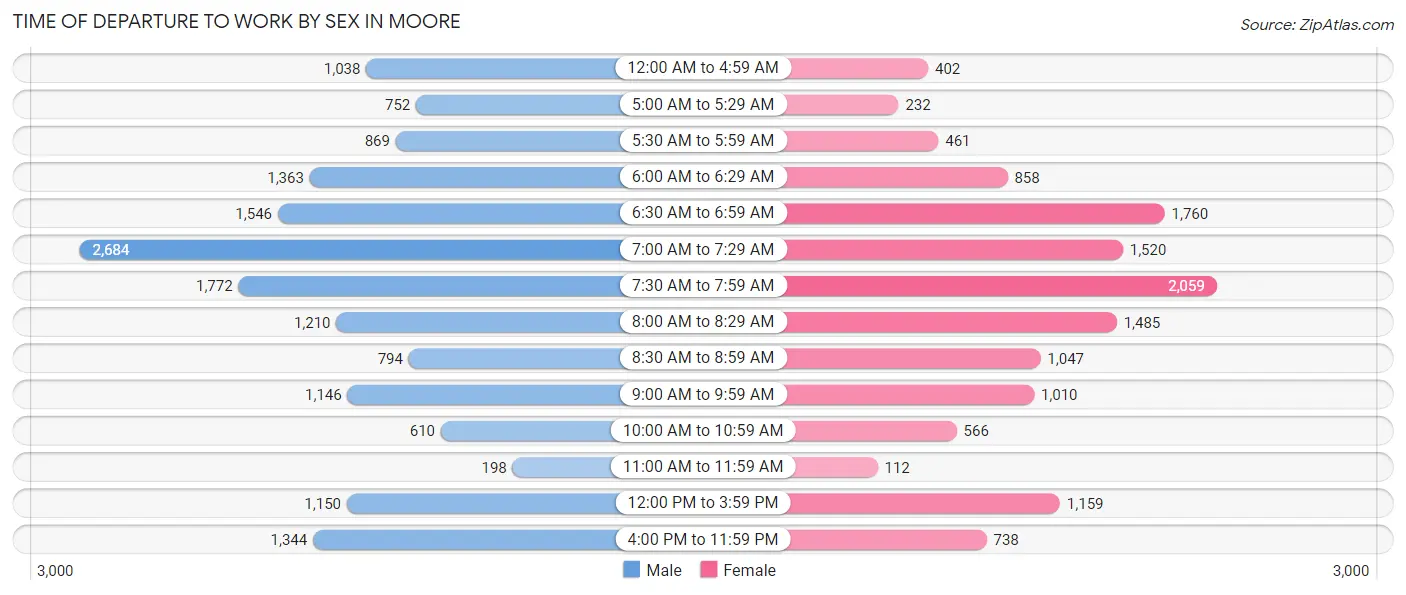
| Time of Departure | Male | Female |
| 12:00 AM to 4:59 AM | 1,038 (6.3%) | 402 (3.0%) |
| 5:00 AM to 5:29 AM | 752 (4.6%) | 232 (1.7%) |
| 5:30 AM to 5:59 AM | 869 (5.3%) | 461 (3.4%) |
| 6:00 AM to 6:29 AM | 1,363 (8.3%) | 858 (6.4%) |
| 6:30 AM to 6:59 AM | 1,546 (9.4%) | 1,760 (13.1%) |
| 7:00 AM to 7:29 AM | 2,684 (16.3%) | 1,520 (11.3%) |
| 7:30 AM to 7:59 AM | 1,772 (10.8%) | 2,059 (15.4%) |
| 8:00 AM to 8:29 AM | 1,210 (7.3%) | 1,485 (11.1%) |
| 8:30 AM to 8:59 AM | 794 (4.8%) | 1,047 (7.8%) |
| 9:00 AM to 9:59 AM | 1,146 (7.0%) | 1,010 (7.5%) |
| 10:00 AM to 10:59 AM | 610 (3.7%) | 566 (4.2%) |
| 11:00 AM to 11:59 AM | 198 (1.2%) | 112 (0.8%) |
| 12:00 PM to 3:59 PM | 1,150 (7.0%) | 1,159 (8.6%) |
| 4:00 PM to 11:59 PM | 1,344 (8.2%) | 738 (5.5%) |
| Total | 16,476 (100.0%) | 13,409 (100.0%) |
Housing Occupancy in Moore
Occupancy by Ownership in Moore
Of the total 23,927 dwellings in Moore, owner-occupied units account for 16,744 (70.0%), while renter-occupied units make up 7,183 (30.0%).
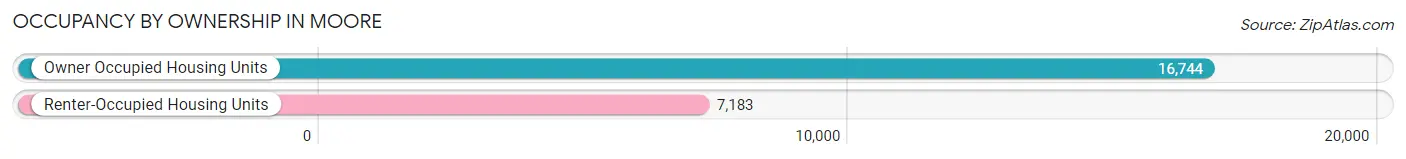
| Occupancy | # Housing Units | % Housing Units |
| Owner Occupied Housing Units | 16,744 | 70.0% |
| Renter-Occupied Housing Units | 7,183 | 30.0% |
| Total Occupied Housing Units | 23,927 | 100.0% |
Occupancy by Household Size in Moore
| Household Size | # Housing Units | % Housing Units |
| 1-Person Household | 6,041 | 25.3% |
| 2-Person Household | 7,255 | 30.3% |
| 3-Person Household | 4,558 | 19.1% |
| 4+ Person Household | 6,073 | 25.4% |
| Total Housing Units | 23,927 | 100.0% |
Occupancy by Ownership by Household Size in Moore
| Household Size | Owner-occupied | Renter-occupied |
| 1-Person Household | 4,030 (66.7%) | 2,011 (33.3%) |
| 2-Person Household | 5,077 (70.0%) | 2,178 (30.0%) |
| 3-Person Household | 3,050 (66.9%) | 1,508 (33.1%) |
| 4+ Person Household | 4,587 (75.5%) | 1,486 (24.5%) |
| Total Housing Units | 16,744 (70.0%) | 7,183 (30.0%) |
Occupancy by Educational Attainment in Moore
| Household Size | Owner-occupied | Renter-occupied |
| Less than High School | 1,079 (59.7%) | 728 (40.3%) |
| High School Diploma | 4,566 (72.6%) | 1,721 (27.4%) |
| College/Associate Degree | 5,494 (64.6%) | 3,016 (35.4%) |
| Bachelor's Degree or higher | 5,605 (76.5%) | 1,718 (23.5%) |
Occupancy by Age of Householder in Moore
| Age Bracket | # Households | % Households |
| Under 35 Years | 6,797 | 28.4% |
| 35 to 44 Years | 3,924 | 16.4% |
| 45 to 54 Years | 4,103 | 17.2% |
| 55 to 64 Years | 3,929 | 16.4% |
| 65 to 74 Years | 2,810 | 11.7% |
| 75 to 84 Years | 1,798 | 7.5% |
| 85 Years and Over | 566 | 2.4% |
| Total | 23,927 | 100.0% |
Housing Finances in Moore
Median Income by Occupancy in Moore
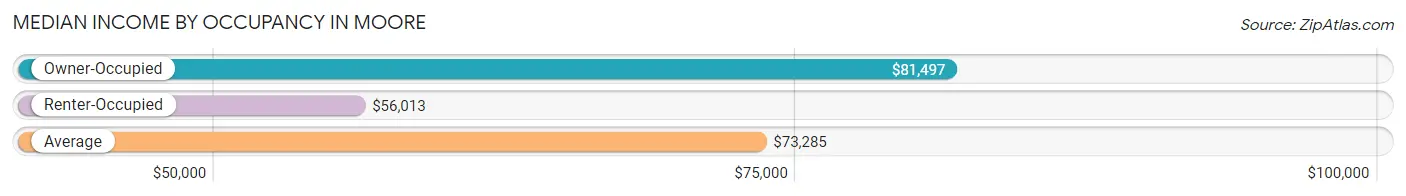
| Occupancy Type | # Households | Median Income |
| Owner-Occupied | 16,744 (70.0%) | $81,497 |
| Renter-Occupied | 7,183 (30.0%) | $56,013 |
| Average | 23,927 (100.0%) | $73,285 |
Occupancy by Householder Income Bracket in Moore
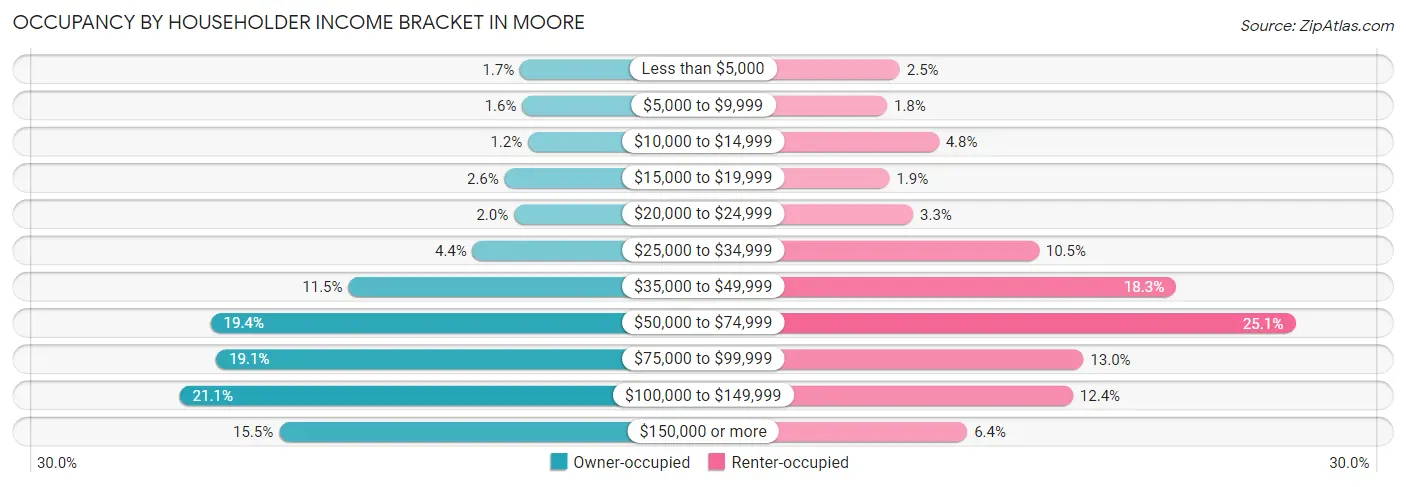
| Income Bracket | Owner-occupied | Renter-occupied |
| Less than $5,000 | 283 (1.7%) | 182 (2.5%) |
| $5,000 to $9,999 | 262 (1.6%) | 129 (1.8%) |
| $10,000 to $14,999 | 206 (1.2%) | 341 (4.8%) |
| $15,000 to $19,999 | 430 (2.6%) | 139 (1.9%) |
| $20,000 to $24,999 | 340 (2.0%) | 236 (3.3%) |
| $25,000 to $34,999 | 737 (4.4%) | 752 (10.5%) |
| $35,000 to $49,999 | 1,926 (11.5%) | 1,315 (18.3%) |
| $50,000 to $74,999 | 3,243 (19.4%) | 1,804 (25.1%) |
| $75,000 to $99,999 | 3,190 (19.1%) | 935 (13.0%) |
| $100,000 to $149,999 | 3,539 (21.1%) | 892 (12.4%) |
| $150,000 or more | 2,588 (15.5%) | 458 (6.4%) |
| Total | 16,744 (100.0%) | 7,183 (100.0%) |
Monthly Housing Cost Tiers in Moore
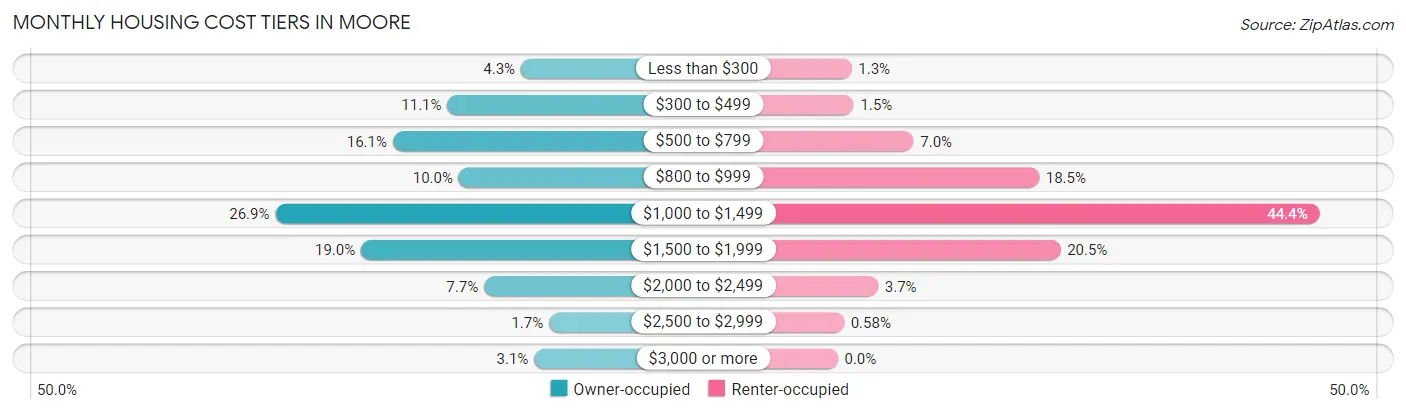
| Monthly Cost | Owner-occupied | Renter-occupied |
| Less than $300 | 721 (4.3%) | 92 (1.3%) |
| $300 to $499 | 1,856 (11.1%) | 107 (1.5%) |
| $500 to $799 | 2,696 (16.1%) | 502 (7.0%) |
| $800 to $999 | 1,680 (10.0%) | 1,332 (18.5%) |
| $1,000 to $1,499 | 4,508 (26.9%) | 3,188 (44.4%) |
| $1,500 to $1,999 | 3,186 (19.0%) | 1,473 (20.5%) |
| $2,000 to $2,499 | 1,291 (7.7%) | 267 (3.7%) |
| $2,500 to $2,999 | 288 (1.7%) | 42 (0.6%) |
| $3,000 or more | 518 (3.1%) | 0 (0.0%) |
| Total | 16,744 (100.0%) | 7,183 (100.0%) |
Physical Housing Characteristics in Moore
Housing Structures in Moore
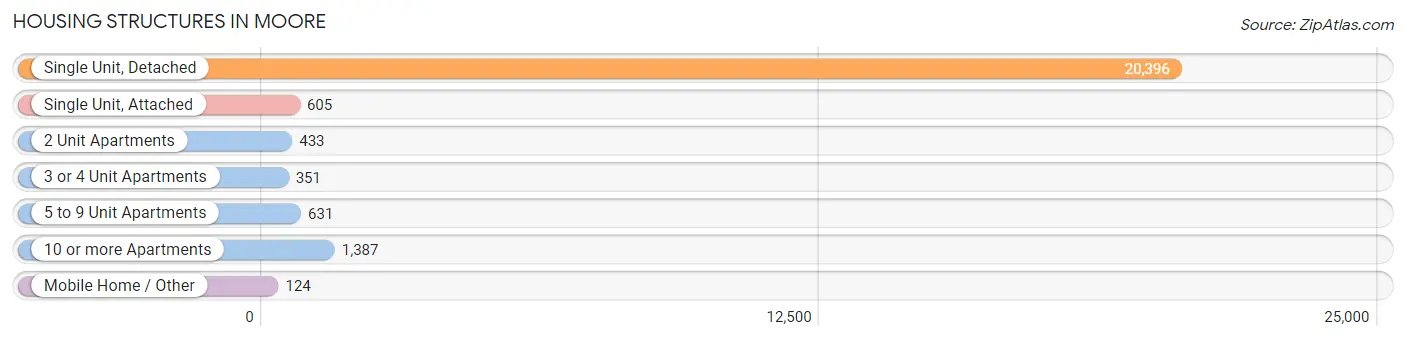
| Structure Type | # Housing Units | % Housing Units |
| Single Unit, Detached | 20,396 | 85.2% |
| Single Unit, Attached | 605 | 2.5% |
| 2 Unit Apartments | 433 | 1.8% |
| 3 or 4 Unit Apartments | 351 | 1.5% |
| 5 to 9 Unit Apartments | 631 | 2.6% |
| 10 or more Apartments | 1,387 | 5.8% |
| Mobile Home / Other | 124 | 0.5% |
| Total | 23,927 | 100.0% |
Housing Structures by Occupancy in Moore
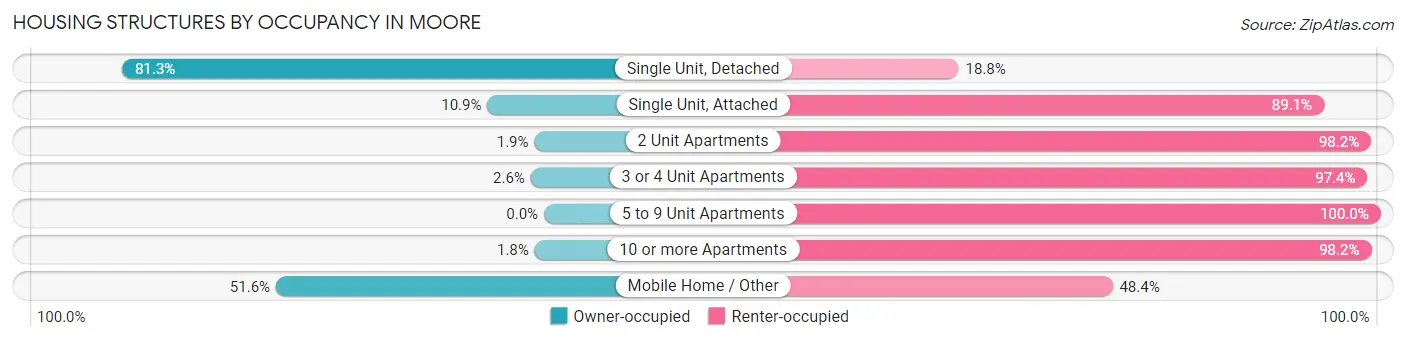
| Structure Type | Owner-occupied | Renter-occupied |
| Single Unit, Detached | 16,572 (81.2%) | 3,824 (18.8%) |
| Single Unit, Attached | 66 (10.9%) | 539 (89.1%) |
| 2 Unit Apartments | 8 (1.8%) | 425 (98.2%) |
| 3 or 4 Unit Apartments | 9 (2.6%) | 342 (97.4%) |
| 5 to 9 Unit Apartments | 0 (0.0%) | 631 (100.0%) |
| 10 or more Apartments | 25 (1.8%) | 1,362 (98.2%) |
| Mobile Home / Other | 64 (51.6%) | 60 (48.4%) |
| Total | 16,744 (70.0%) | 7,183 (30.0%) |
Housing Structures by Number of Rooms in Moore
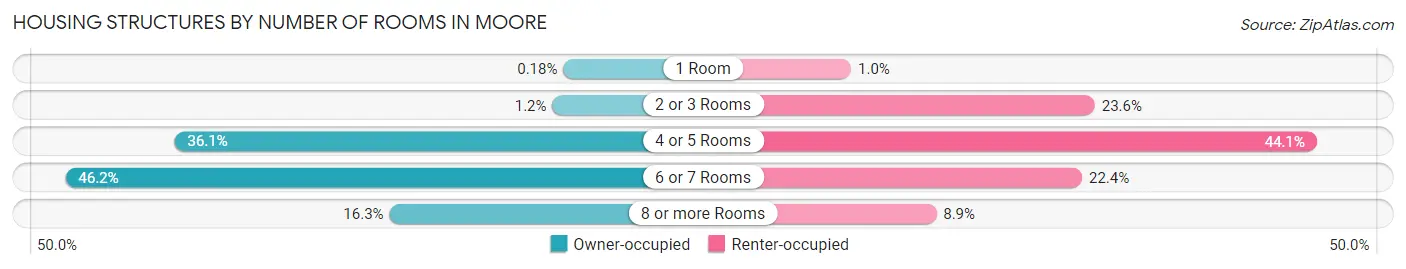
| Number of Rooms | Owner-occupied | Renter-occupied |
| 1 Room | 30 (0.2%) | 74 (1.0%) |
| 2 or 3 Rooms | 199 (1.2%) | 1,693 (23.6%) |
| 4 or 5 Rooms | 6,052 (36.1%) | 3,168 (44.1%) |
| 6 or 7 Rooms | 7,741 (46.2%) | 1,608 (22.4%) |
| 8 or more Rooms | 2,722 (16.3%) | 640 (8.9%) |
| Total | 16,744 (100.0%) | 7,183 (100.0%) |
Housing Structure by Heating Type in Moore
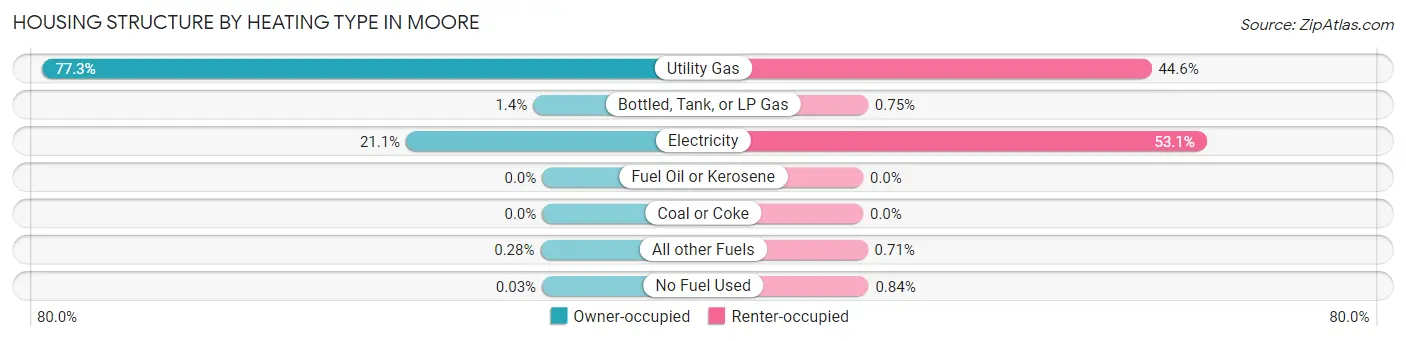
| Heating Type | Owner-occupied | Renter-occupied |
| Utility Gas | 12,934 (77.2%) | 3,203 (44.6%) |
| Bottled, Tank, or LP Gas | 234 (1.4%) | 54 (0.7%) |
| Electricity | 3,524 (21.0%) | 3,815 (53.1%) |
| Fuel Oil or Kerosene | 0 (0.0%) | 0 (0.0%) |
| Coal or Coke | 0 (0.0%) | 0 (0.0%) |
| All other Fuels | 47 (0.3%) | 51 (0.7%) |
| No Fuel Used | 5 (0.0%) | 60 (0.8%) |
| Total | 16,744 (100.0%) | 7,183 (100.0%) |
Household Vehicle Usage in Moore
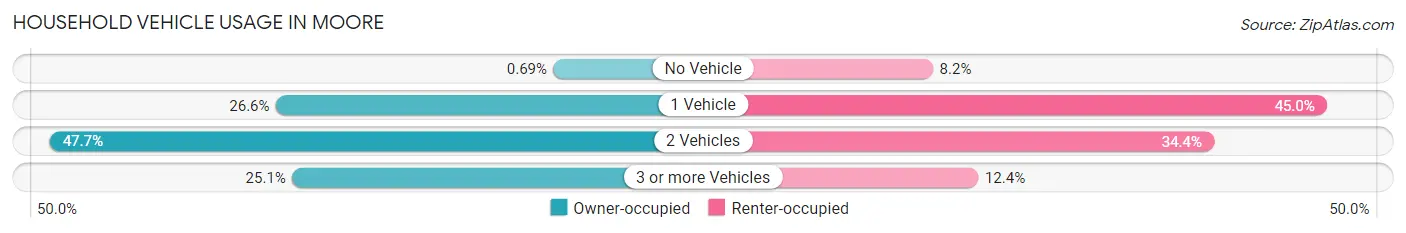
| Vehicles per Household | Owner-occupied | Renter-occupied |
| No Vehicle | 116 (0.7%) | 588 (8.2%) |
| 1 Vehicle | 4,452 (26.6%) | 3,230 (45.0%) |
| 2 Vehicles | 7,978 (47.6%) | 2,473 (34.4%) |
| 3 or more Vehicles | 4,198 (25.1%) | 892 (12.4%) |
| Total | 16,744 (100.0%) | 7,183 (100.0%) |
Real Estate & Mortgages in Moore
Real Estate and Mortgage Overview in Moore
| Characteristic | Without Mortgage | With Mortgage |
| Housing Units | 5,458 | 11,286 |
| Median Property Value | $149,900 | $177,500 |
| Median Household Income | $61,316 | $2,039 |
| Monthly Housing Costs | $521 | $502 |
| Real Estate Taxes | $1,662 | $697 |
Property Value by Mortgage Status in Moore
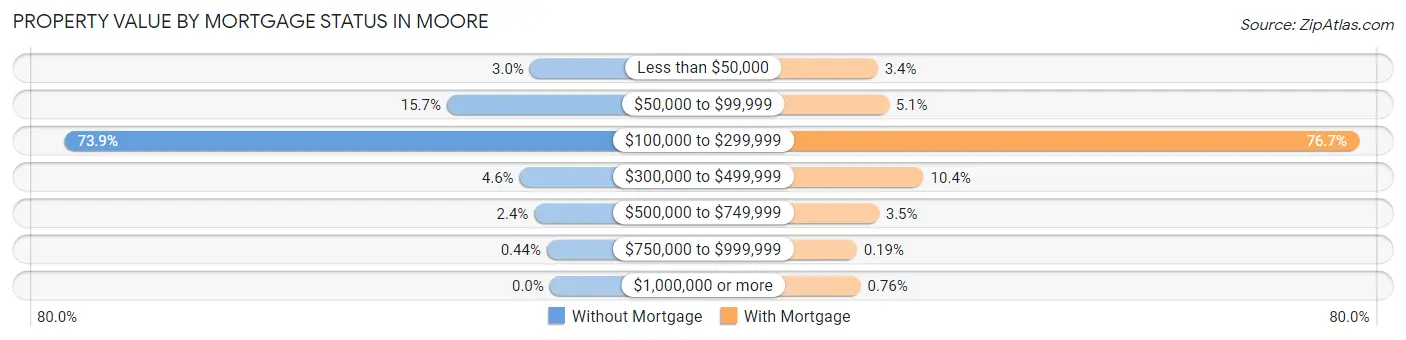
| Property Value | Without Mortgage | With Mortgage |
| Less than $50,000 | 166 (3.0%) | 382 (3.4%) |
| $50,000 to $99,999 | 855 (15.7%) | 571 (5.1%) |
| $100,000 to $299,999 | 4,034 (73.9%) | 8,653 (76.7%) |
| $300,000 to $499,999 | 251 (4.6%) | 1,172 (10.4%) |
| $500,000 to $749,999 | 128 (2.4%) | 400 (3.5%) |
| $750,000 to $999,999 | 24 (0.4%) | 22 (0.2%) |
| $1,000,000 or more | 0 (0.0%) | 86 (0.8%) |
| Total | 5,458 (100.0%) | 11,286 (100.0%) |
Household Income by Mortgage Status in Moore
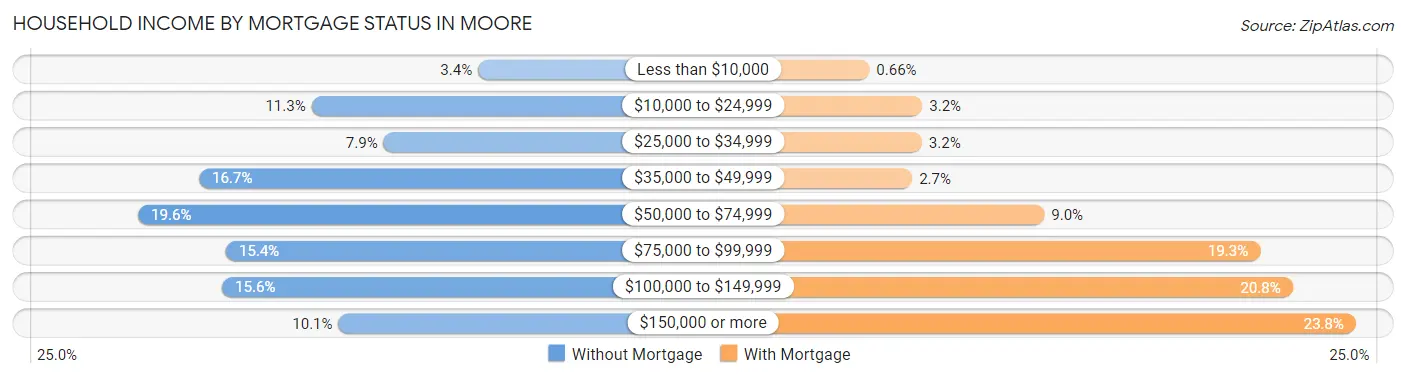
| Household Income | Without Mortgage | With Mortgage |
| Less than $10,000 | 186 (3.4%) | 75 (0.7%) |
| $10,000 to $24,999 | 619 (11.3%) | 359 (3.2%) |
| $25,000 to $34,999 | 432 (7.9%) | 357 (3.2%) |
| $35,000 to $49,999 | 911 (16.7%) | 305 (2.7%) |
| $50,000 to $74,999 | 1,069 (19.6%) | 1,015 (9.0%) |
| $75,000 to $99,999 | 841 (15.4%) | 2,174 (19.3%) |
| $100,000 to $149,999 | 851 (15.6%) | 2,349 (20.8%) |
| $150,000 or more | 549 (10.1%) | 2,688 (23.8%) |
| Total | 5,458 (100.0%) | 11,286 (100.0%) |
Property Value to Household Income Ratio in Moore
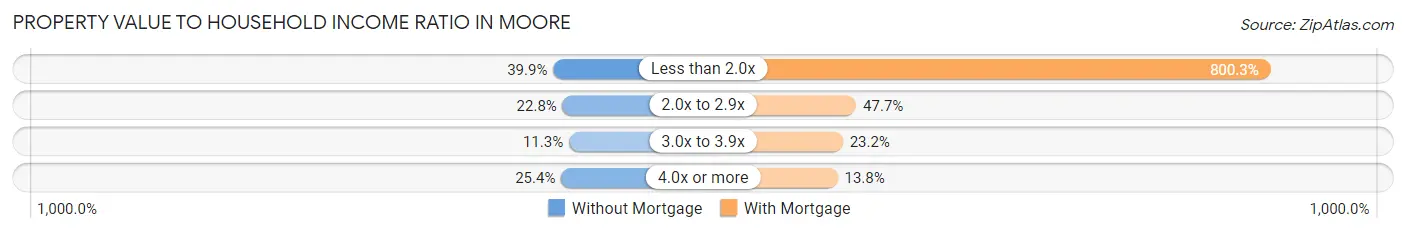
| Value-to-Income Ratio | Without Mortgage | With Mortgage |
| Less than 2.0x | 2,179 (39.9%) | 90,318 (800.3%) |
| 2.0x to 2.9x | 1,246 (22.8%) | 5,380 (47.7%) |
| 3.0x to 3.9x | 616 (11.3%) | 2,615 (23.2%) |
| 4.0x or more | 1,388 (25.4%) | 1,561 (13.8%) |
| Total | 5,458 (100.0%) | 11,286 (100.0%) |
Real Estate Taxes by Mortgage Status in Moore
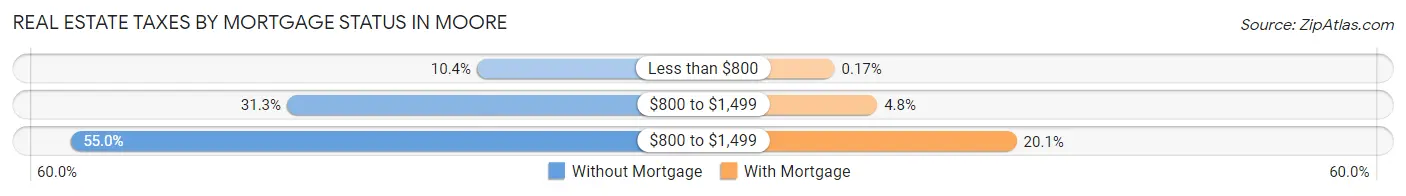
| Property Taxes | Without Mortgage | With Mortgage |
| Less than $800 | 570 (10.4%) | 19 (0.2%) |
| $800 to $1,499 | 1,706 (31.3%) | 546 (4.8%) |
| $800 to $1,499 | 3,002 (55.0%) | 2,271 (20.1%) |
| Total | 5,458 (100.0%) | 11,286 (100.0%) |
Health & Disability in Moore
Health Insurance Coverage by Age in Moore
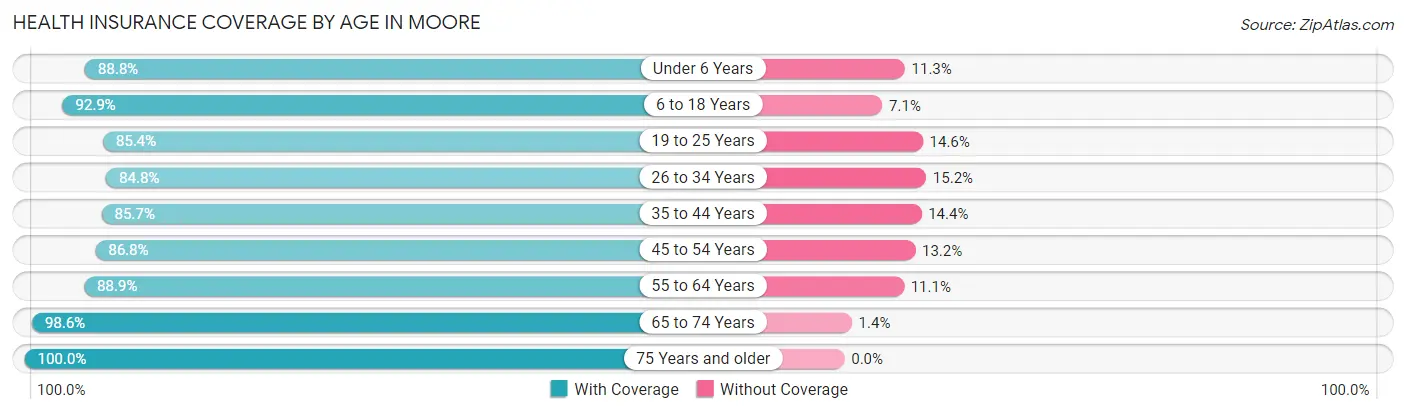
| Age Bracket | With Coverage | Without Coverage |
| Under 6 Years | 4,916 (88.7%) | 623 (11.3%) |
| 6 to 18 Years | 9,596 (92.9%) | 729 (7.1%) |
| 19 to 25 Years | 5,356 (85.4%) | 916 (14.6%) |
| 26 to 34 Years | 8,397 (84.8%) | 1,508 (15.2%) |
| 35 to 44 Years | 6,130 (85.7%) | 1,027 (14.3%) |
| 45 to 54 Years | 6,349 (86.8%) | 965 (13.2%) |
| 55 to 64 Years | 6,150 (88.9%) | 766 (11.1%) |
| 65 to 74 Years | 4,610 (98.6%) | 64 (1.4%) |
| 75 Years and older | 3,465 (100.0%) | 0 (0.0%) |
| Total | 54,969 (89.3%) | 6,598 (10.7%) |
Health Insurance Coverage by Citizenship Status in Moore
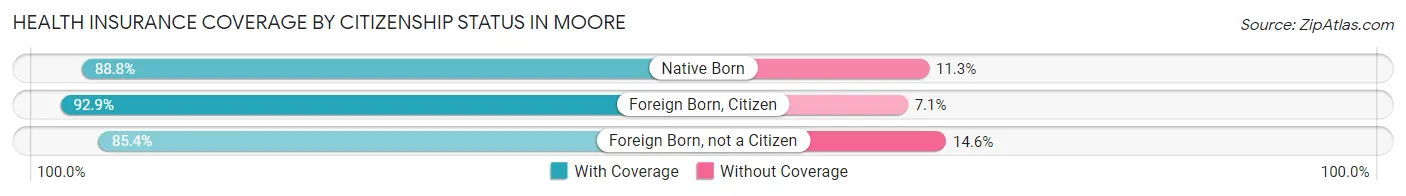
| Citizenship Status | With Coverage | Without Coverage |
| Native Born | 4,916 (88.7%) | 623 (11.3%) |
| Foreign Born, Citizen | 9,596 (92.9%) | 729 (7.1%) |
| Foreign Born, not a Citizen | 5,356 (85.4%) | 916 (14.6%) |
Health Insurance Coverage by Household Income in Moore
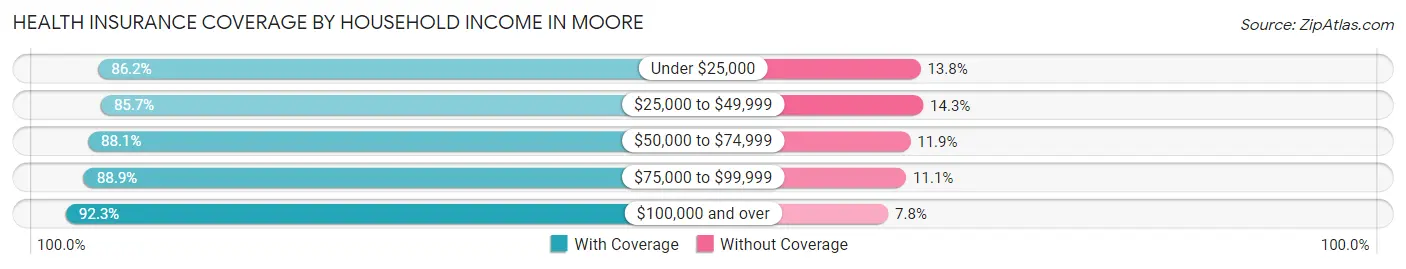
| Household Income | With Coverage | Without Coverage |
| Under $25,000 | 4,462 (86.2%) | 715 (13.8%) |
| $25,000 to $49,999 | 8,812 (85.7%) | 1,472 (14.3%) |
| $50,000 to $74,999 | 9,863 (88.1%) | 1,332 (11.9%) |
| $75,000 to $99,999 | 10,027 (88.9%) | 1,254 (11.1%) |
| $100,000 and over | 21,632 (92.2%) | 1,817 (7.7%) |
Public vs Private Health Insurance Coverage by Age in Moore
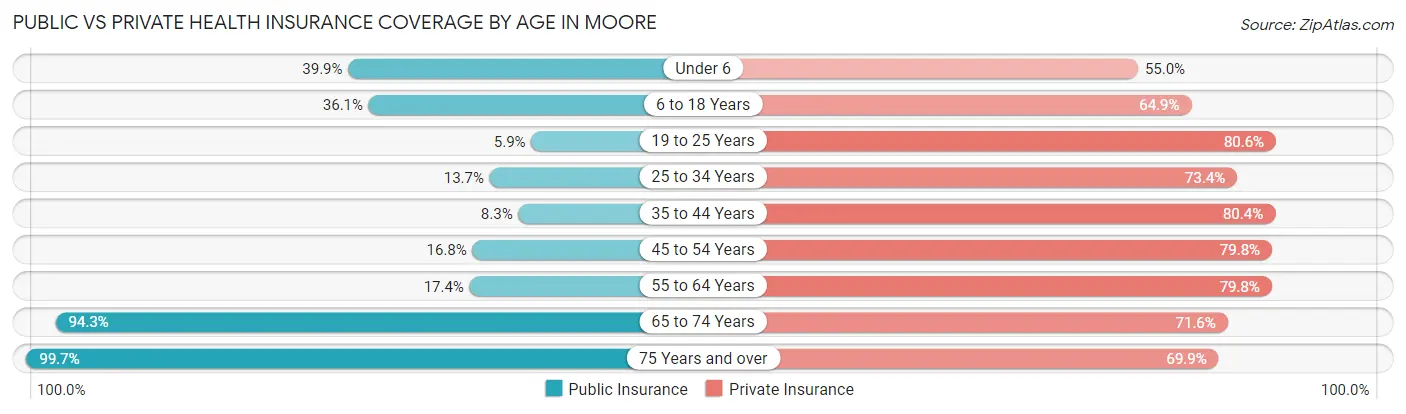
| Age Bracket | Public Insurance | Private Insurance |
| Under 6 | 2,210 (39.9%) | 3,045 (55.0%) |
| 6 to 18 Years | 3,727 (36.1%) | 6,698 (64.9%) |
| 19 to 25 Years | 372 (5.9%) | 5,054 (80.6%) |
| 25 to 34 Years | 1,352 (13.7%) | 7,268 (73.4%) |
| 35 to 44 Years | 596 (8.3%) | 5,754 (80.4%) |
| 45 to 54 Years | 1,232 (16.8%) | 5,839 (79.8%) |
| 55 to 64 Years | 1,202 (17.4%) | 5,518 (79.8%) |
| 65 to 74 Years | 4,406 (94.3%) | 3,347 (71.6%) |
| 75 Years and over | 3,454 (99.7%) | 2,423 (69.9%) |
| Total | 18,551 (30.1%) | 44,946 (73.0%) |
Disability Status by Sex by Age in Moore
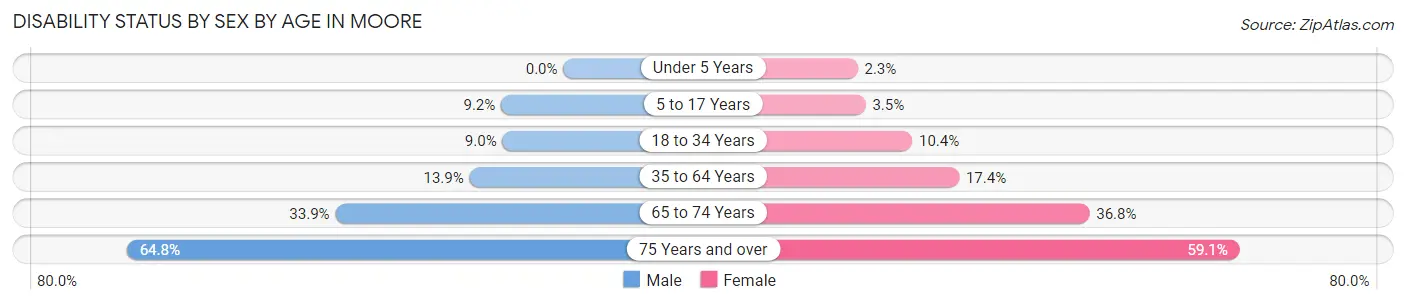
| Age Bracket | Male | Female |
| Under 5 Years | 0 (0.0%) | 53 (2.3%) |
| 5 to 17 Years | 490 (9.2%) | 192 (3.5%) |
| 18 to 34 Years | 774 (9.0%) | 853 (10.4%) |
| 35 to 64 Years | 1,425 (13.9%) | 1,941 (17.4%) |
| 65 to 74 Years | 720 (33.9%) | 936 (36.7%) |
| 75 Years and over | 846 (64.8%) | 1,276 (59.1%) |
Disability Class by Sex by Age in Moore
Disability Class: Hearing Difficulty
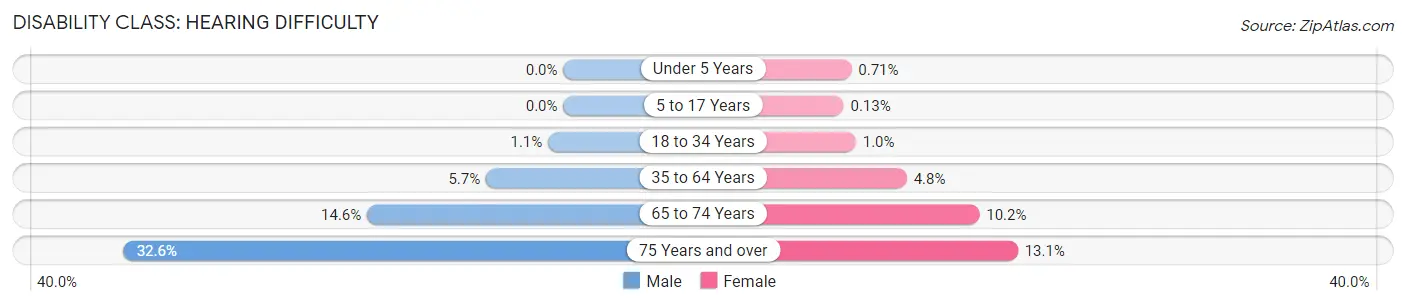
| Age Bracket | Male | Female |
| Under 5 Years | 0 (0.0%) | 16 (0.7%) |
| 5 to 17 Years | 0 (0.0%) | 7 (0.1%) |
| 18 to 34 Years | 97 (1.1%) | 85 (1.0%) |
| 35 to 64 Years | 587 (5.7%) | 538 (4.8%) |
| 65 to 74 Years | 310 (14.6%) | 260 (10.2%) |
| 75 Years and over | 426 (32.6%) | 282 (13.1%) |
Disability Class: Vision Difficulty
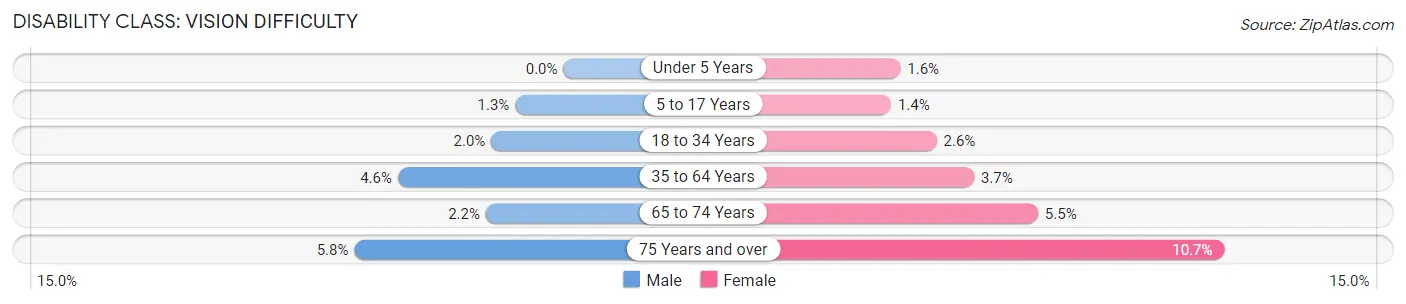
| Age Bracket | Male | Female |
| Under 5 Years | 0 (0.0%) | 37 (1.6%) |
| 5 to 17 Years | 71 (1.3%) | 75 (1.4%) |
| 18 to 34 Years | 172 (2.0%) | 216 (2.6%) |
| 35 to 64 Years | 472 (4.6%) | 410 (3.7%) |
| 65 to 74 Years | 46 (2.2%) | 139 (5.5%) |
| 75 Years and over | 76 (5.8%) | 230 (10.6%) |
Disability Class: Cognitive Difficulty
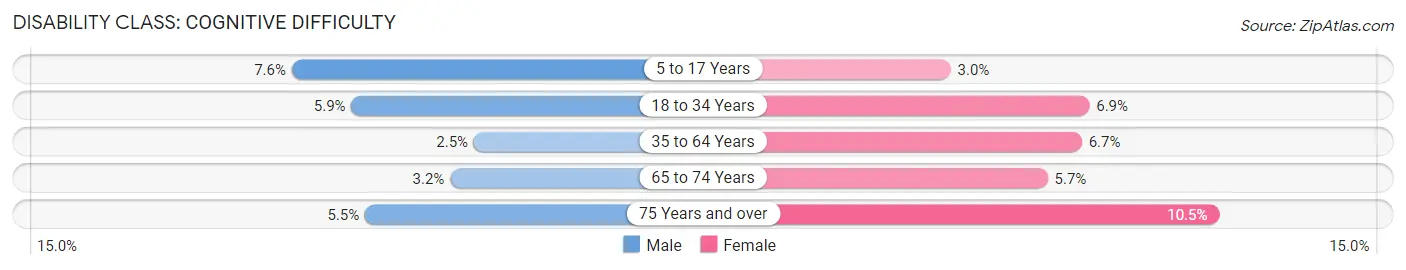
| Age Bracket | Male | Female |
| 5 to 17 Years | 401 (7.6%) | 166 (3.0%) |
| 18 to 34 Years | 505 (5.9%) | 563 (6.9%) |
| 35 to 64 Years | 255 (2.5%) | 745 (6.7%) |
| 65 to 74 Years | 67 (3.2%) | 146 (5.7%) |
| 75 Years and over | 72 (5.5%) | 227 (10.5%) |
Disability Class: Ambulatory Difficulty
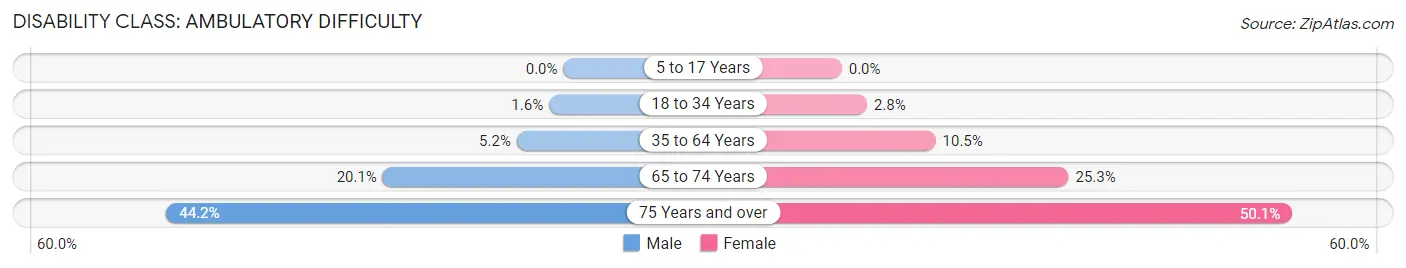
| Age Bracket | Male | Female |
| 5 to 17 Years | 0 (0.0%) | 0 (0.0%) |
| 18 to 34 Years | 137 (1.6%) | 230 (2.8%) |
| 35 to 64 Years | 531 (5.2%) | 1,166 (10.4%) |
| 65 to 74 Years | 428 (20.1%) | 643 (25.3%) |
| 75 Years and over | 577 (44.2%) | 1,083 (50.1%) |
Disability Class: Self-Care Difficulty
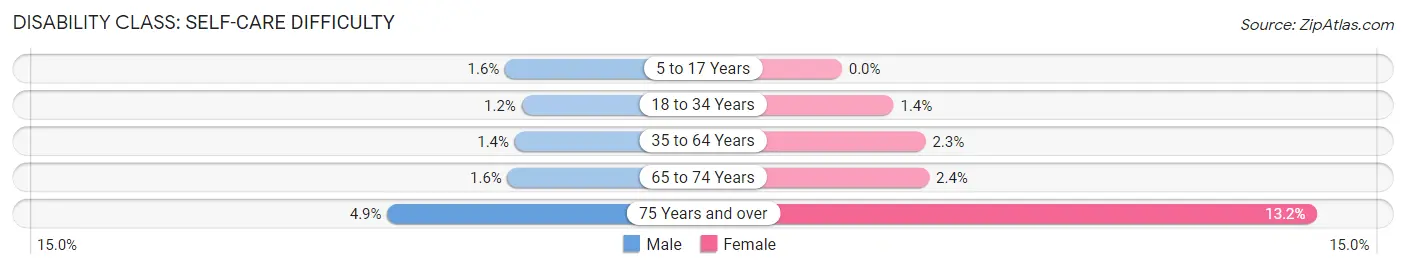
| Age Bracket | Male | Female |
| 5 to 17 Years | 86 (1.6%) | 0 (0.0%) |
| 18 to 34 Years | 99 (1.2%) | 118 (1.4%) |
| 35 to 64 Years | 138 (1.3%) | 260 (2.3%) |
| 65 to 74 Years | 33 (1.5%) | 62 (2.4%) |
| 75 Years and over | 64 (4.9%) | 286 (13.2%) |
Technology Access in Moore
Computing Device Access in Moore
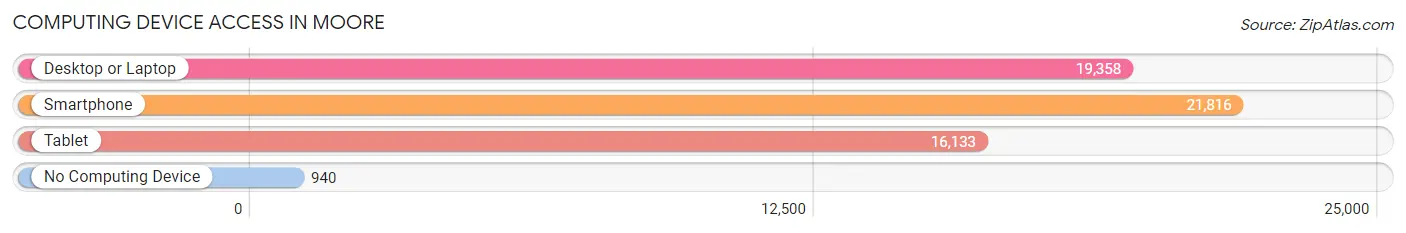
| Device Type | # Households | % Households |
| Desktop or Laptop | 19,358 | 80.9% |
| Smartphone | 21,816 | 91.2% |
| Tablet | 16,133 | 67.4% |
| No Computing Device | 940 | 3.9% |
| Total | 23,927 | 100.0% |
Internet Access in Moore
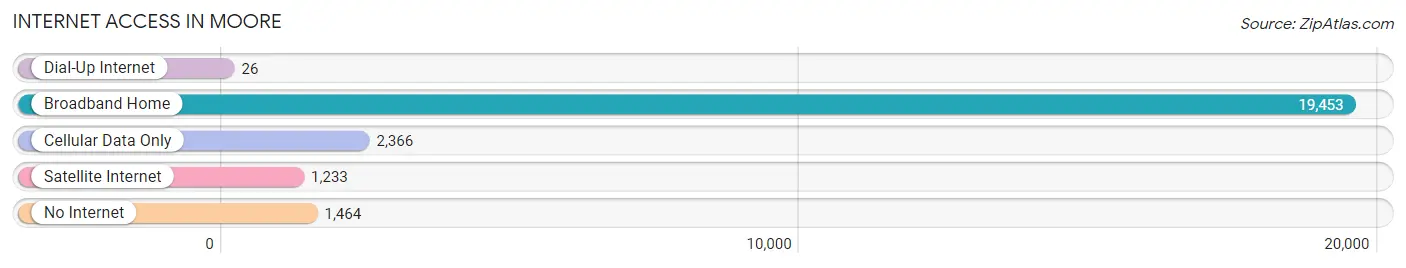
| Internet Type | # Households | % Households |
| Dial-Up Internet | 26 | 0.1% |
| Broadband Home | 19,453 | 81.3% |
| Cellular Data Only | 2,366 | 9.9% |
| Satellite Internet | 1,233 | 5.1% |
| No Internet | 1,464 | 6.1% |
| Total | 23,927 | 100.0% |
Moore Summary
Moore is a city located in Cleveland County, Oklahoma, United States. It is part of the Oklahoma City metropolitan area and is located just south of the city. The population was 55,081 at the 2010 census, making Moore the 7th largest city in the state of Oklahoma.
History
Moore was founded in 1891 by Al Moore, a rancher from Texas. He named the town after himself and it was incorporated in 1893. The town grew slowly until the 1950s when it began to experience rapid growth due to its proximity to Oklahoma City. By the 1970s, Moore had become a bedroom community for Oklahoma City and its population had grown to over 10,000.
In 1999, Moore was hit by a devastating tornado that destroyed much of the city. The tornado was part of the 1999 Oklahoma tornado outbreak and was rated an F5 on the Fujita scale, the highest rating possible. The tornado killed 36 people and injured hundreds more. The city was rebuilt and has since experienced continued growth.
Geography
Moore is located at 35°22'25"N 97°27'45"W (35.373611, -97.462500). According to the United States Census Bureau, the city has a total area of 44.2 square miles (114.3 km2), of which 44.1 square miles (114.2 km2) is land and 0.1 square miles (0.2 km2) (0.25%) is water.
Economy
Moore’s economy is largely based on retail and services. The city is home to several large shopping centers, including Moore Town Center, Moore Marketplace, and Moore Plaza. The city is also home to several large employers, including Tinker Air Force Base, the University of Oklahoma, and the Moore Public School District.
Demographics
As of the 2010 census, there were 55,081 people, 20,845 households, and 14,845 families residing in the city. The population density was 1,250.2 people per square mile (482.2/km2). There were 22,845 housing units at an average density of 517.7 per square mile (199.7/km2). The racial makeup of the city was 75.2% White, 8.2% African American, 4.2% Native American, 3.2% Asian, 0.1% Pacific Islander, 5.2% from other races, and 4.1% from two or more races. Hispanic or Latino of any race were 11.2% of the population.
There were 20,845 households, out of which 37.2% had children under the age of 18 living with them, 53.2% were married couples living together, 12.7% had a female householder with no husband present, and 29.2% were non-families. 24.2% of all households were made up of individuals, and 6.2% had someone living alone who was 65 years of age or older. The average household size was 2.62 and the average family size was 3.13.
In the city, the population was spread out, with 28.2% under the age of 18, 8.9% from 18 to 24, 32.2% from 25 to 44, 21.3% from 45 to 64, and 9.4% who were 65 years of age or older. The median age was 33 years. For every 100 females, there were 94.2 males. For every 100 females age 18 and over, there were 90.8 males.
The median income for a household in the city was $50,867, and the median income for a family was $58,867. Males had a median income of $41,827 versus $30,835 for females. The per capita income for the city was $22,867. About 6.2% of families and 8.2% of the population were below the poverty line, including 11.2% of those under age 18 and 6.2% of those age 65 or over.
Common Questions
What is Per Capita Income in Moore?
Per Capita income in Moore is $35,511.
What is the Median Family Income in Moore?
Median Family Income in Moore is $85,467.
What is the Median Household income in Moore?
Median Household Income in Moore is $73,285.
What is Income or Wage Gap in Moore?
Income or Wage Gap in Moore is 34.1%.
Women in Moore earn 65.9 cents for every dollar earned by a man.
What is Family Income Deficit in Moore?
Family Income Deficit in Moore is $11,710.
Families that are below poverty line in Moore earn $11,710 less on average than the poverty threshold level.
What is Inequality or Gini Index in Moore?
Inequality or Gini Index in Moore is 0.40.
What is the Total Population of Moore?
Total Population of Moore is 62,685.
What is the Total Male Population of Moore?
Total Male Population of Moore is 30,759.
What is the Total Female Population of Moore?
Total Female Population of Moore is 31,926.
What is the Ratio of Males per 100 Females in Moore?
There are 96.34 Males per 100 Females in Moore.
What is the Ratio of Females per 100 Males in Moore?
There are 103.79 Females per 100 Males in Moore.
What is the Median Population Age in Moore?
Median Population Age in Moore is 33.8 Years.
What is the Average Family Size in Moore
Average Family Size in Moore is 3.1 People.
What is the Average Household Size in Moore
Average Household Size in Moore is 2.6 People.
How Large is the Labor Force in Moore?
There are 34,206 People in the Labor Forcein in Moore.
What is the Percentage of People in the Labor Force in Moore?
69.6% of People are in the Labor Force in Moore.
What is the Unemployment Rate in Moore?
Unemployment Rate in Moore is 4.1%.