Fort Gibson, OK Map & Demographics
Fort Gibson Map
Fort Gibson Overview
$33,736
PER CAPITA INCOME
$96,895
AVG FAMILY INCOME
$67,813
AVG HOUSEHOLD INCOME
39.3%
WAGE / INCOME GAP [ % ]
60.7¢/ $1
WAGE / INCOME GAP [ $ ]
$10,837
FAMILY INCOME DEFICIT
0.45
INEQUALITY / GINI INDEX
3,810
TOTAL POPULATION
1,797
MALE POPULATION
2,013
FEMALE POPULATION
89.27
MALES / 100 FEMALES
112.02
FEMALES / 100 MALES
38.3
MEDIAN AGE
3.0
AVG FAMILY SIZE
2.2
AVG HOUSEHOLD SIZE
1,905
LABOR FORCE [ PEOPLE ]
62.1%
PERCENT IN LABOR FORCE
2.8%
UNEMPLOYMENT RATE
Fort Gibson Zip Codes
Fort Gibson Area Codes
Income in Fort Gibson
Income Overview in Fort Gibson
Per Capita Income in Fort Gibson is $33,736, while median incomes of families and households are $96,895 and $67,813 respectively.
| Characteristic | Number | Measure |
| Per Capita Income | 3,810 | $33,736 |
| Median Family Income | 995 | $96,895 |
| Mean Family Income | 995 | $102,760 |
| Median Household Income | 1,680 | $67,813 |
| Mean Household Income | 1,680 | $75,684 |
| Income Deficit | 995 | $10,837 |
| Wage / Income Gap (%) | 3,810 | 39.27% |
| Wage / Income Gap ($) | 3,810 | 60.73¢ per $1 |
| Gini / Inequality Index | 3,810 | 0.45 |
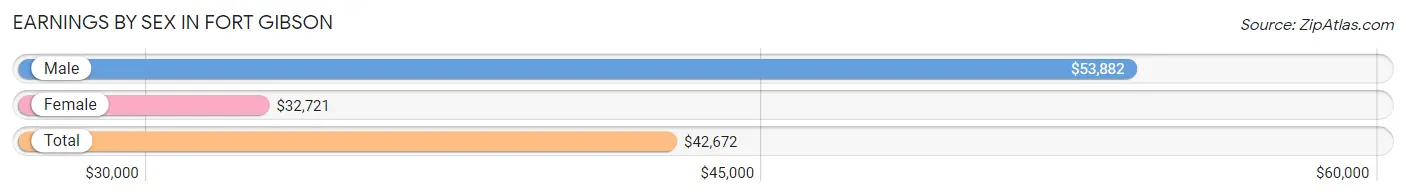
Earnings by Sex in Fort Gibson
Average Earnings in Fort Gibson are $42,672, $53,882 for men and $32,721 for women, a difference of 39.3%.
| Sex | Number | Average Earnings |
| Male | 905 (44.5%) | $53,882 |
| Female | 1,131 (55.5%) | $32,721 |
| Total | 2,036 (100.0%) | $42,672 |
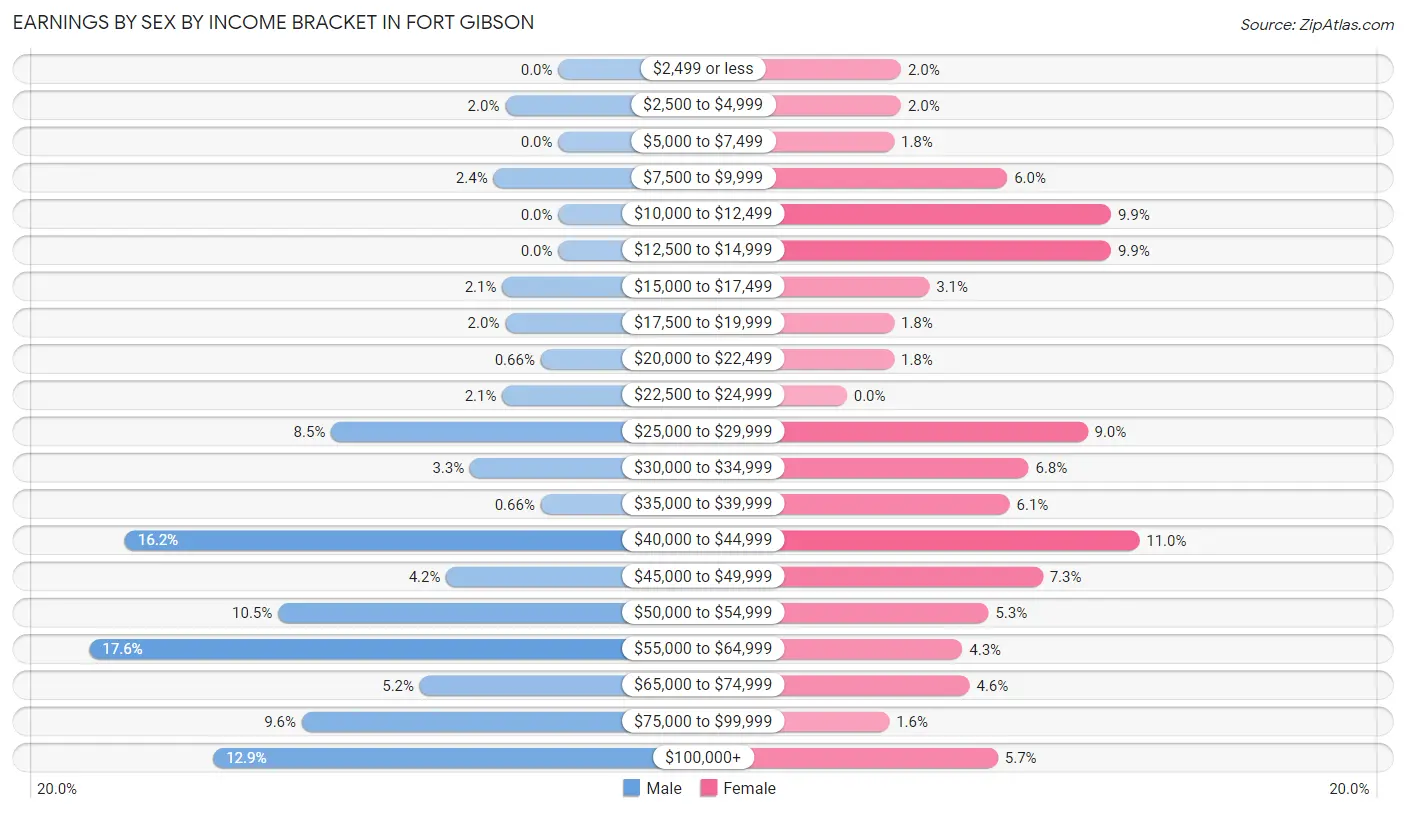
Earnings by Sex by Income Bracket in Fort Gibson
The most common earnings brackets in Fort Gibson are $55,000 to $64,999 for men (159 | 17.6%) and $40,000 to $44,999 for women (124 | 11.0%).
| Income | Male | Female |
| $2,499 or less | 0 (0.0%) | 23 (2.0%) |
| $2,500 to $4,999 | 18 (2.0%) | 23 (2.0%) |
| $5,000 to $7,499 | 0 (0.0%) | 20 (1.8%) |
| $7,500 to $9,999 | 22 (2.4%) | 68 (6.0%) |
| $10,000 to $12,499 | 0 (0.0%) | 112 (9.9%) |
| $12,500 to $14,999 | 0 (0.0%) | 112 (9.9%) |
| $15,000 to $17,499 | 19 (2.1%) | 35 (3.1%) |
| $17,500 to $19,999 | 18 (2.0%) | 20 (1.8%) |
| $20,000 to $22,499 | 6 (0.7%) | 20 (1.8%) |
| $22,500 to $24,999 | 19 (2.1%) | 0 (0.0%) |
| $25,000 to $29,999 | 77 (8.5%) | 102 (9.0%) |
| $30,000 to $34,999 | 30 (3.3%) | 77 (6.8%) |
| $35,000 to $39,999 | 6 (0.7%) | 69 (6.1%) |
| $40,000 to $44,999 | 147 (16.2%) | 124 (11.0%) |
| $45,000 to $49,999 | 38 (4.2%) | 83 (7.3%) |
| $50,000 to $54,999 | 95 (10.5%) | 60 (5.3%) |
| $55,000 to $64,999 | 159 (17.6%) | 49 (4.3%) |
| $65,000 to $74,999 | 47 (5.2%) | 52 (4.6%) |
| $75,000 to $99,999 | 87 (9.6%) | 18 (1.6%) |
| $100,000+ | 117 (12.9%) | 64 (5.7%) |
| Total | 905 (100.0%) | 1,131 (100.0%) |
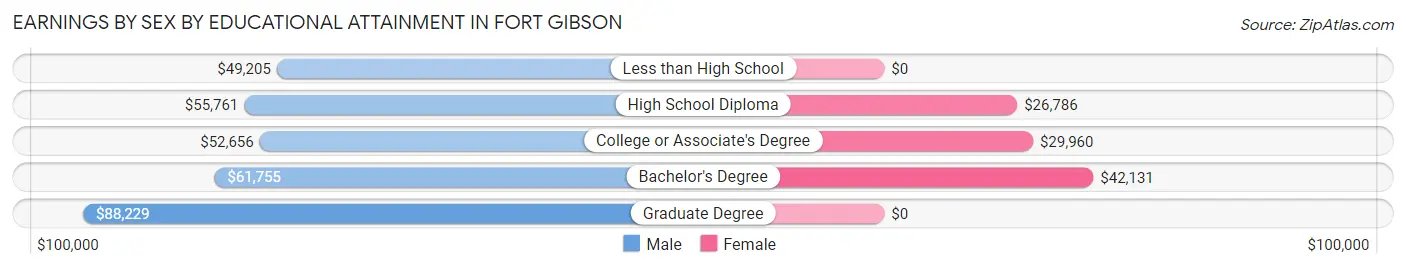
Earnings by Sex by Educational Attainment in Fort Gibson
Average earnings in Fort Gibson are $56,667 for men and $38,455 for women, a difference of 32.1%. Men with an educational attainment of graduate degree enjoy the highest average annual earnings of $88,229, while those with less than high school education earn the least with $49,205. Women with an educational attainment of bachelor's degree earn the most with the average annual earnings of $42,131, while those with high school diploma education have the smallest earnings of $26,786.
| Educational Attainment | Male Income | Female Income |
| Less than High School | $49,205 | $0 |
| High School Diploma | $55,761 | $26,786 |
| College or Associate's Degree | $52,656 | $29,960 |
| Bachelor's Degree | $61,755 | $42,131 |
| Graduate Degree | $88,229 | $0 |
| Total | $56,667 | $38,455 |
Family Income in Fort Gibson
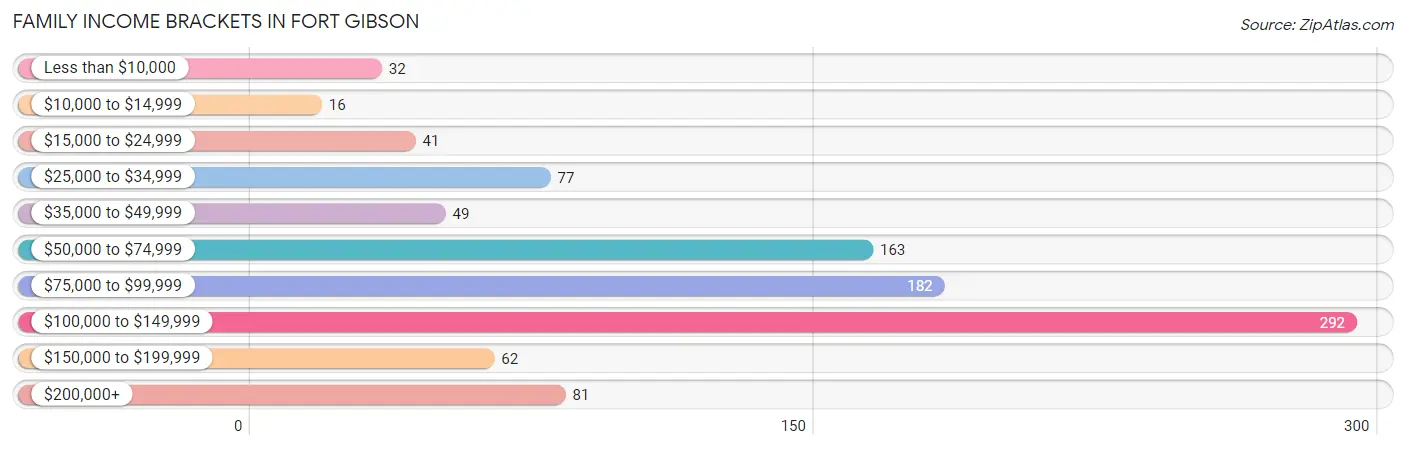
Family Income Brackets in Fort Gibson
According to the Fort Gibson family income data, there are 292 families falling into the $100,000 to $149,999 income range, which is the most common income bracket and makes up 29.3% of all families. Conversely, the $10,000 to $14,999 income bracket is the least frequent group with only 16 families (1.6%) belonging to this category.
| Income Bracket | # Families | % Families |
| Less than $10,000 | 32 | 3.2% |
| $10,000 to $14,999 | 16 | 1.6% |
| $15,000 to $24,999 | 41 | 4.1% |
| $25,000 to $34,999 | 77 | 7.7% |
| $35,000 to $49,999 | 49 | 4.9% |
| $50,000 to $74,999 | 163 | 16.4% |
| $75,000 to $99,999 | 182 | 18.3% |
| $100,000 to $149,999 | 292 | 29.3% |
| $150,000 to $199,999 | 62 | 6.2% |
| $200,000+ | 81 | 8.1% |
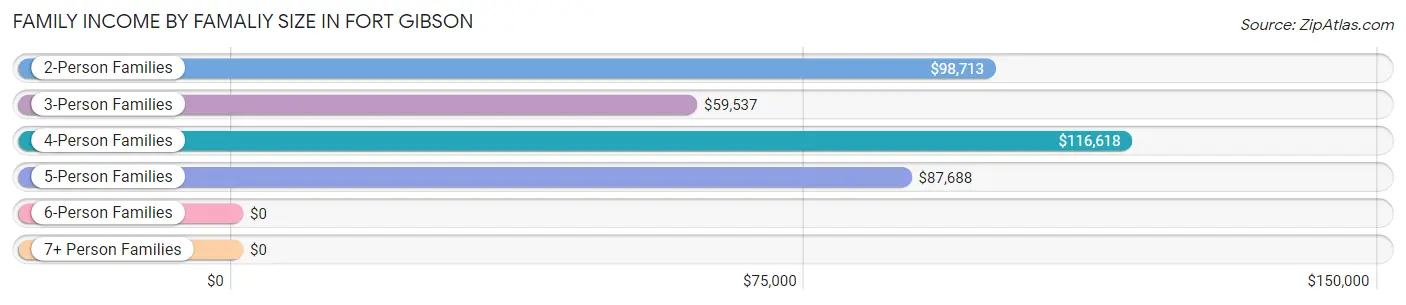
Family Income by Famaliy Size in Fort Gibson
4-person families (138 | 13.9%) account for the highest median family income in Fort Gibson with $116,618 per family, while 2-person families (475 | 47.7%) have the highest median income of $49,356 per family member.
| Income Bracket | # Families | Median Income |
| 2-Person Families | 475 (47.7%) | $98,713 |
| 3-Person Families | 262 (26.3%) | $59,537 |
| 4-Person Families | 138 (13.9%) | $116,618 |
| 5-Person Families | 79 (7.9%) | $87,688 |
| 6-Person Families | 41 (4.1%) | $0 |
| 7+ Person Families | 0 (0.0%) | $0 |
| Total | 995 (100.0%) | $96,895 |
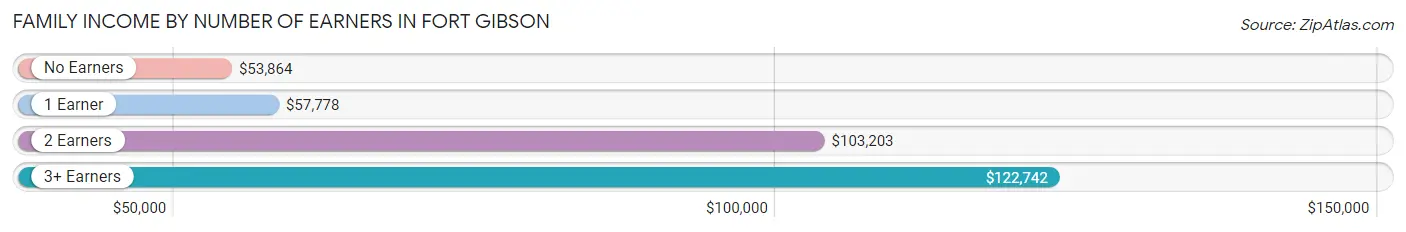
Family Income by Number of Earners in Fort Gibson
The median family income in Fort Gibson is $96,895, with families comprising 3+ earners (202) having the highest median family income of $122,742, while families with no earners (172) have the lowest median family income of $53,864, accounting for 20.3% and 17.3% of families, respectively.
| Number of Earners | # Families | Median Income |
| No Earners | 172 (17.3%) | $53,864 |
| 1 Earner | 220 (22.1%) | $57,778 |
| 2 Earners | 401 (40.3%) | $103,203 |
| 3+ Earners | 202 (20.3%) | $122,742 |
| Total | 995 (100.0%) | $96,895 |
Household Income in Fort Gibson
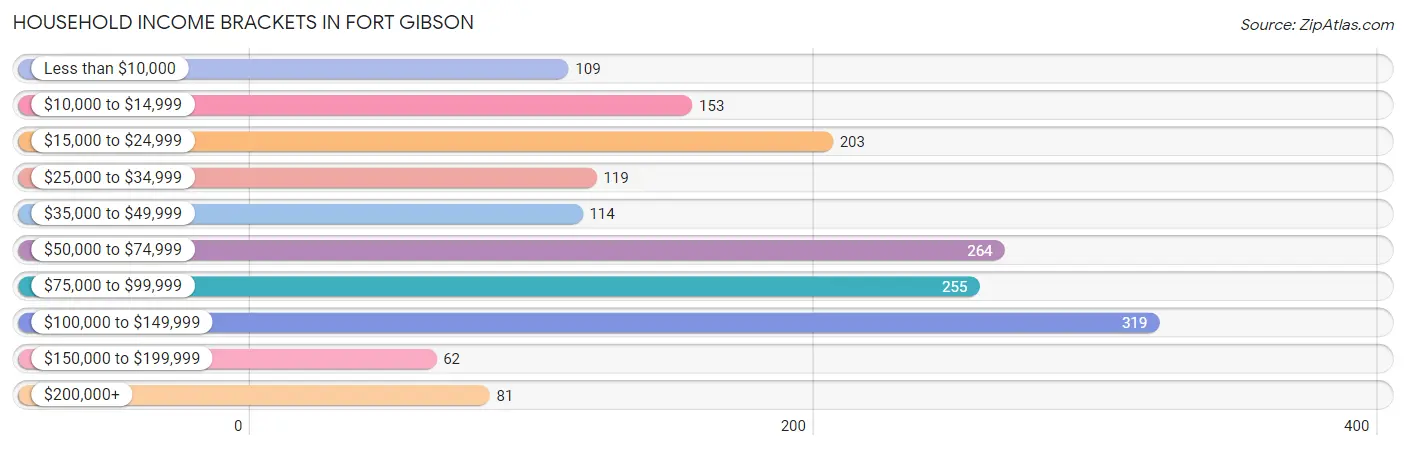
Household Income Brackets in Fort Gibson
With 319 households falling in the category, the $100,000 to $149,999 income range is the most frequent in Fort Gibson, accounting for 19.0% of all households. In contrast, only 62 households (3.7%) fall into the $150,000 to $199,999 income bracket, making it the least populous group.
| Income Bracket | # Households | % Households |
| Less than $10,000 | 109 | 6.5% |
| $10,000 to $14,999 | 153 | 9.1% |
| $15,000 to $24,999 | 203 | 12.1% |
| $25,000 to $34,999 | 119 | 7.1% |
| $35,000 to $49,999 | 114 | 6.8% |
| $50,000 to $74,999 | 264 | 15.7% |
| $75,000 to $99,999 | 255 | 15.2% |
| $100,000 to $149,999 | 319 | 19.0% |
| $150,000 to $199,999 | 62 | 3.7% |
| $200,000+ | 81 | 4.8% |
Household Income by Householder Age in Fort Gibson
The median household income in Fort Gibson is $67,813, with the highest median household income of $92,946 found in the 45 to 64 years age bracket for the primary householder. A total of 612 households (36.4%) fall into this category. Meanwhile, the 15 to 24 years age bracket for the primary householder has the lowest median household income of $40,978, with 96 households (5.7%) in this group.
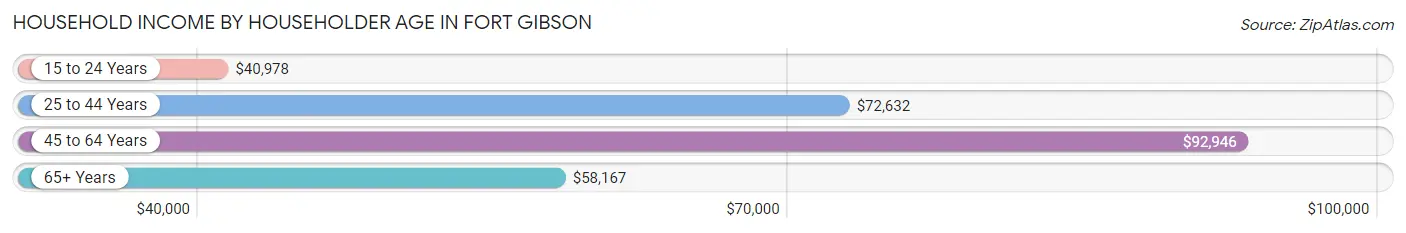
| Income Bracket | # Households | Median Income |
| 15 to 24 Years | 96 (5.7%) | $40,978 |
| 25 to 44 Years | 598 (35.6%) | $72,632 |
| 45 to 64 Years | 612 (36.4%) | $92,946 |
| 65+ Years | 374 (22.3%) | $58,167 |
| Total | 1,680 (100.0%) | $67,813 |
Poverty in Fort Gibson
Income Below Poverty by Sex and Age in Fort Gibson
With 11.0% poverty level for males and 11.8% for females among the residents of Fort Gibson, 12 to 14 year old males and under 5 year old females are the most vulnerable to poverty, with 35 males (68.6%) and 29 females (33.3%) in their respective age groups living below the poverty level.
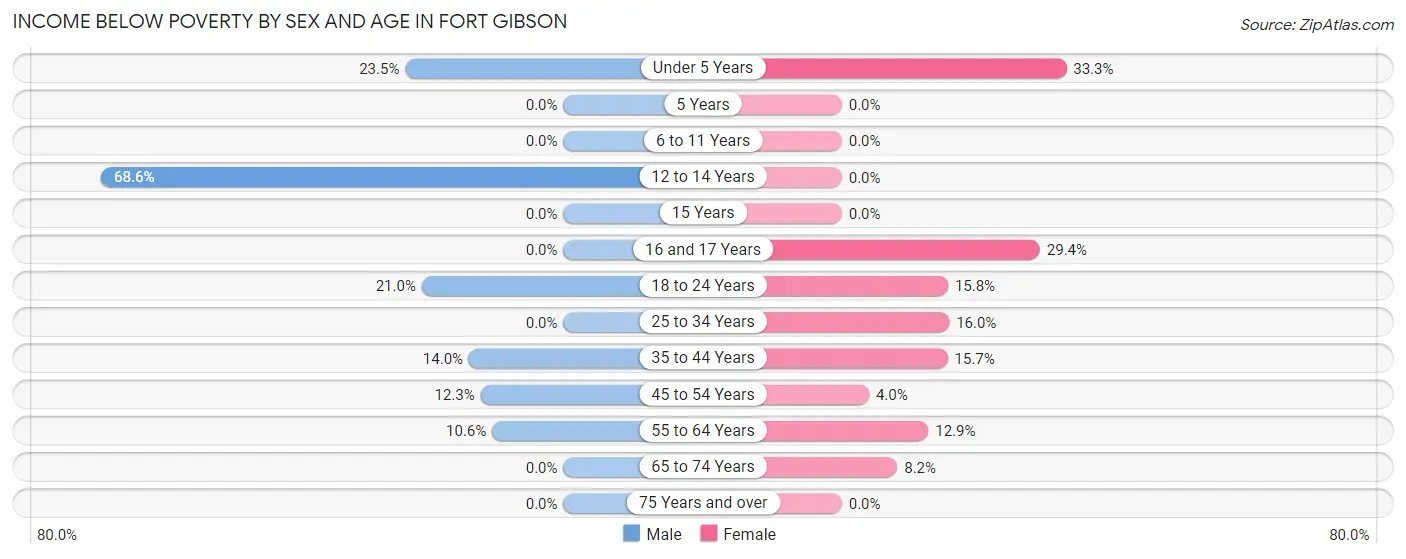
| Age Bracket | Male | Female |
| Under 5 Years | 31 (23.5%) | 29 (33.3%) |
| 5 Years | 0 (0.0%) | 0 (0.0%) |
| 6 to 11 Years | 0 (0.0%) | 0 (0.0%) |
| 12 to 14 Years | 35 (68.6%) | 0 (0.0%) |
| 15 Years | 0 (0.0%) | 0 (0.0%) |
| 16 and 17 Years | 0 (0.0%) | 15 (29.4%) |
| 18 to 24 Years | 41 (21.0%) | 32 (15.8%) |
| 25 to 34 Years | 0 (0.0%) | 59 (16.0%) |
| 35 to 44 Years | 45 (14.0%) | 33 (15.7%) |
| 45 to 54 Years | 23 (12.3%) | 12 (4.0%) |
| 55 to 64 Years | 20 (10.6%) | 32 (12.9%) |
| 65 to 74 Years | 0 (0.0%) | 22 (8.2%) |
| 75 Years and over | 0 (0.0%) | 0 (0.0%) |
| Total | 195 (11.0%) | 234 (11.8%) |
Income Above Poverty by Sex and Age in Fort Gibson
According to the poverty statistics in Fort Gibson, males aged 5 years and females aged 5 years are the age groups that are most secure financially, with 100.0% of males and 100.0% of females in these age groups living above the poverty line.
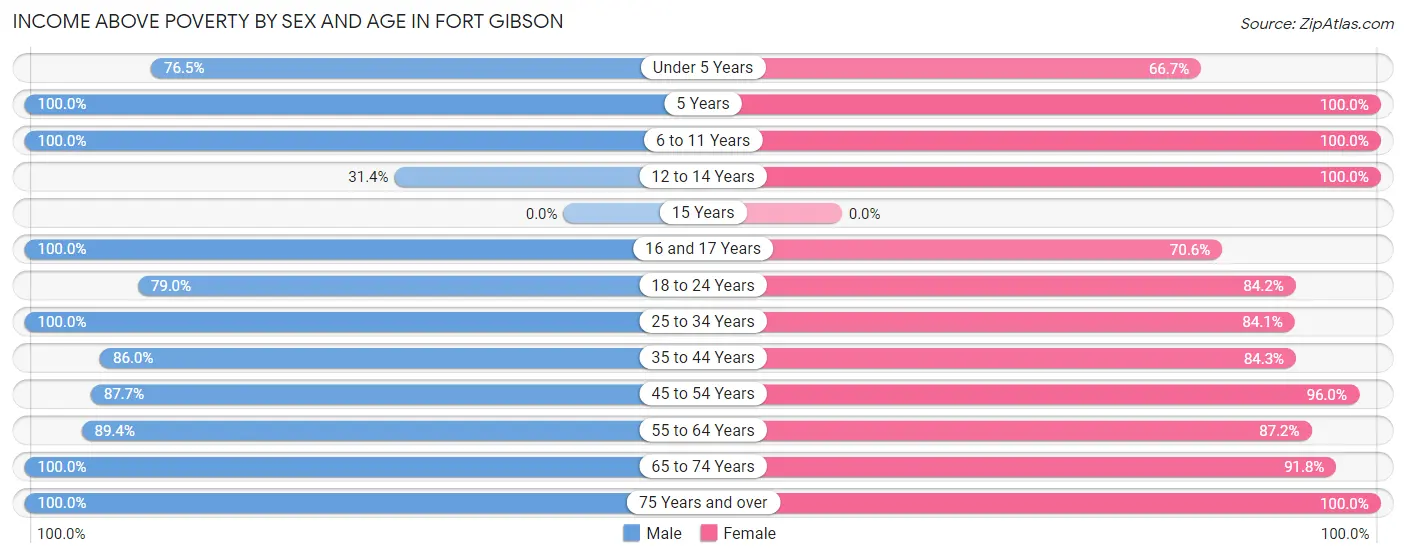
| Age Bracket | Male | Female |
| Under 5 Years | 101 (76.5%) | 58 (66.7%) |
| 5 Years | 27 (100.0%) | 28 (100.0%) |
| 6 to 11 Years | 269 (100.0%) | 120 (100.0%) |
| 12 to 14 Years | 16 (31.4%) | 27 (100.0%) |
| 15 Years | 0 (0.0%) | 0 (0.0%) |
| 16 and 17 Years | 22 (100.0%) | 36 (70.6%) |
| 18 to 24 Years | 154 (79.0%) | 171 (84.2%) |
| 25 to 34 Years | 175 (100.0%) | 311 (84.1%) |
| 35 to 44 Years | 276 (86.0%) | 177 (84.3%) |
| 45 to 54 Years | 164 (87.7%) | 285 (96.0%) |
| 55 to 64 Years | 169 (89.4%) | 217 (87.2%) |
| 65 to 74 Years | 106 (100.0%) | 245 (91.8%) |
| 75 Years and over | 102 (100.0%) | 69 (100.0%) |
| Total | 1,581 (89.0%) | 1,744 (88.2%) |
Income Below Poverty Among Married-Couple Families in Fort Gibson
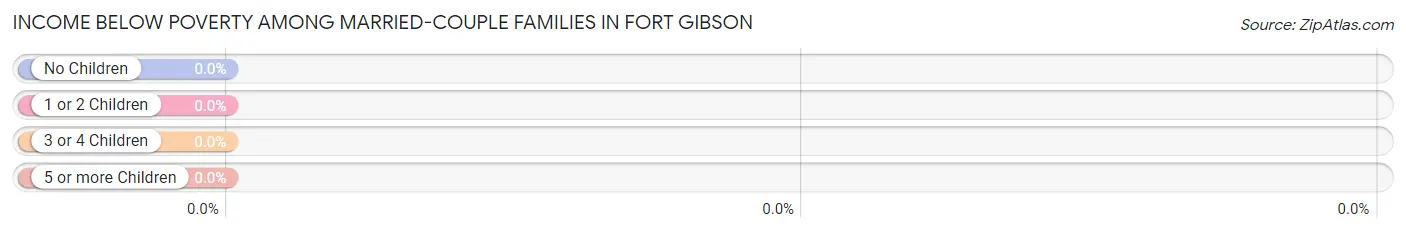
| Children | Above Poverty | Below Poverty |
| No Children | 394 (100.0%) | 0 (0.0%) |
| 1 or 2 Children | 266 (100.0%) | 0 (0.0%) |
| 3 or 4 Children | 20 (100.0%) | 0 (0.0%) |
| 5 or more Children | 0 (0.0%) | 0 (0.0%) |
| Total | 680 (100.0%) | 0 (0.0%) |
Income Below Poverty Among Single-Parent Households in Fort Gibson
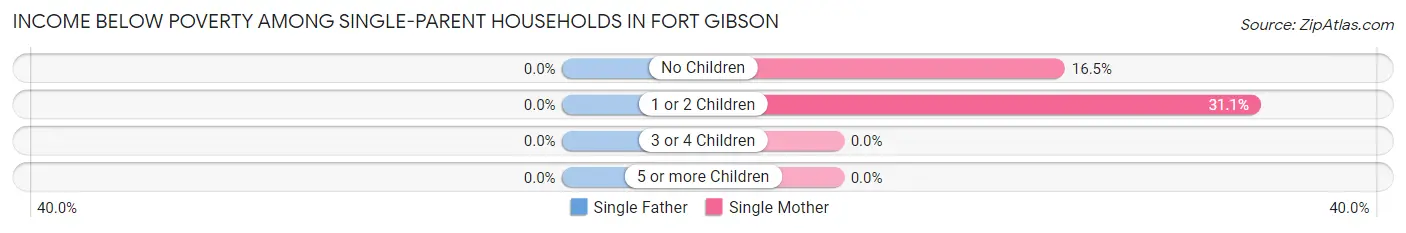
| Children | Single Father | Single Mother |
| No Children | 0 (0.0%) | 15 (16.5%) |
| 1 or 2 Children | 0 (0.0%) | 55 (31.1%) |
| 3 or 4 Children | 0 (0.0%) | 0 (0.0%) |
| 5 or more Children | 0 (0.0%) | 0 (0.0%) |
| Total | 0 (0.0%) | 70 (24.3%) |
Income Below Poverty Among Married-Couple vs Single-Parent Households in Fort Gibson
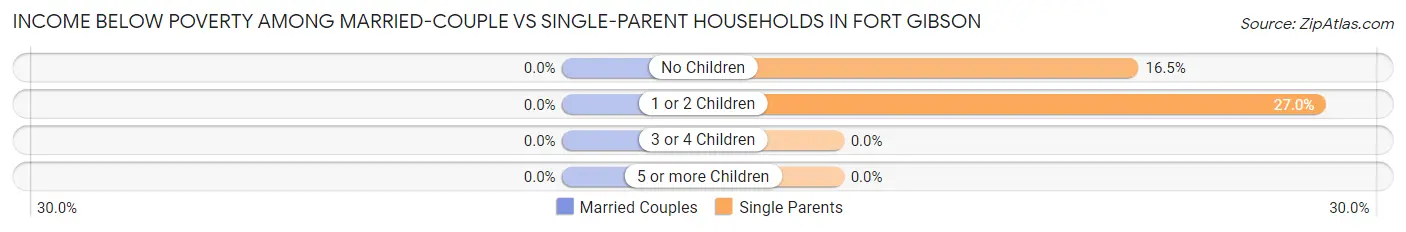
| Children | Married-Couple Families | Single-Parent Households |
| No Children | 0 (0.0%) | 15 (16.5%) |
| 1 or 2 Children | 0 (0.0%) | 55 (27.0%) |
| 3 or 4 Children | 0 (0.0%) | 0 (0.0%) |
| 5 or more Children | 0 (0.0%) | 0 (0.0%) |
| Total | 0 (0.0%) | 70 (22.2%) |
Race in Fort Gibson
The most populous races in Fort Gibson are White / Caucasian (2,090 | 54.9%), Native / Alaskan (1,106 | 29.0%), and Two or more Races (508 | 13.3%).
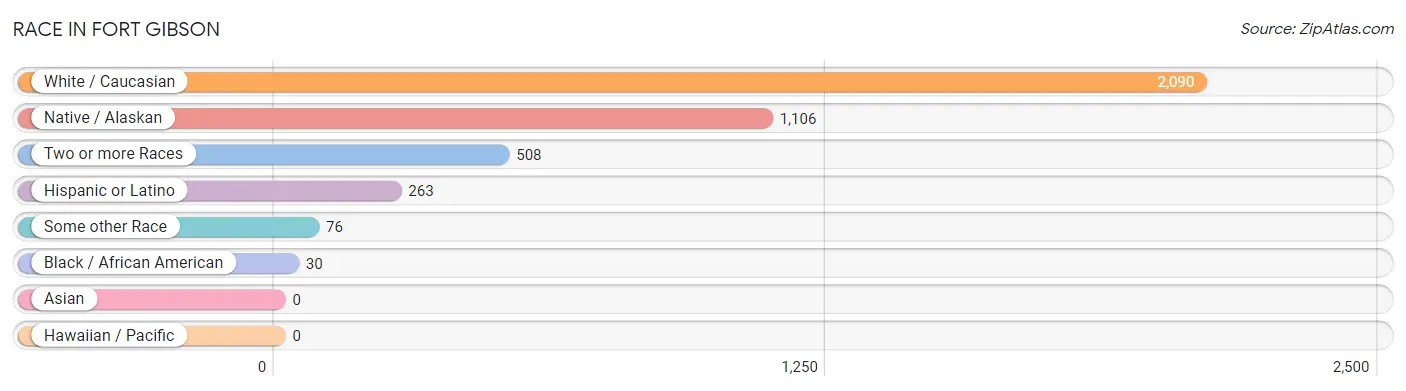
| Race | # Population | % Population |
| Asian | 0 | 0.0% |
| Black / African American | 30 | 0.8% |
| Hawaiian / Pacific | 0 | 0.0% |
| Hispanic or Latino | 263 | 6.9% |
| Native / Alaskan | 1,106 | 29.0% |
| White / Caucasian | 2,090 | 54.9% |
| Two or more Races | 508 | 13.3% |
| Some other Race | 76 | 2.0% |
| Total | 3,810 | 100.0% |
Ancestry in Fort Gibson
The most populous ancestries reported in Fort Gibson are Cherokee (1,152 | 30.2%), Irish (474 | 12.4%), American (310 | 8.1%), English (196 | 5.1%), and Mexican (188 | 4.9%), together accounting for 60.9% of all Fort Gibson residents.
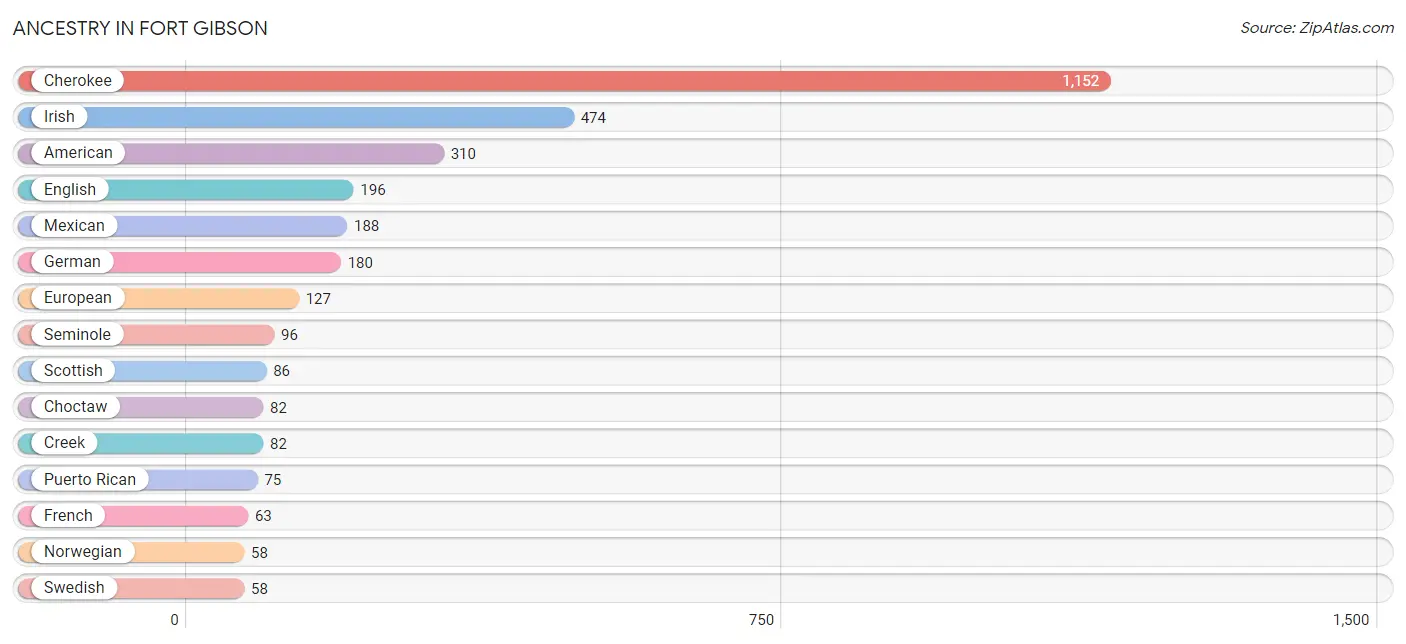
| Ancestry | # Population | % Population |
| American | 310 | 8.1% |
| British | 29 | 0.8% |
| Cherokee | 1,152 | 30.2% |
| Choctaw | 82 | 2.1% |
| Creek | 82 | 2.1% |
| Dutch | 5 | 0.1% |
| Dutch West Indian | 4 | 0.1% |
| English | 196 | 5.1% |
| European | 127 | 3.3% |
| French | 63 | 1.7% |
| German | 180 | 4.7% |
| Irish | 474 | 12.4% |
| Mexican | 188 | 4.9% |
| Norwegian | 58 | 1.5% |
| Puerto Rican | 75 | 2.0% |
| Scandinavian | 42 | 1.1% |
| Scotch-Irish | 29 | 0.8% |
| Scottish | 86 | 2.3% |
| Seminole | 96 | 2.5% |
| Swedish | 58 | 1.5% |
| Welsh | 11 | 0.3% | View All 21 Rows |
Immigrants in Fort Gibson

| Immigration Origin | # Population | % Population | View All 0 Rows |
Sex and Age in Fort Gibson
Sex and Age in Fort Gibson
The most populous age groups in Fort Gibson are 5 to 9 Years (183 | 10.2%) for men and 30 to 34 Years (269 | 13.4%) for women.
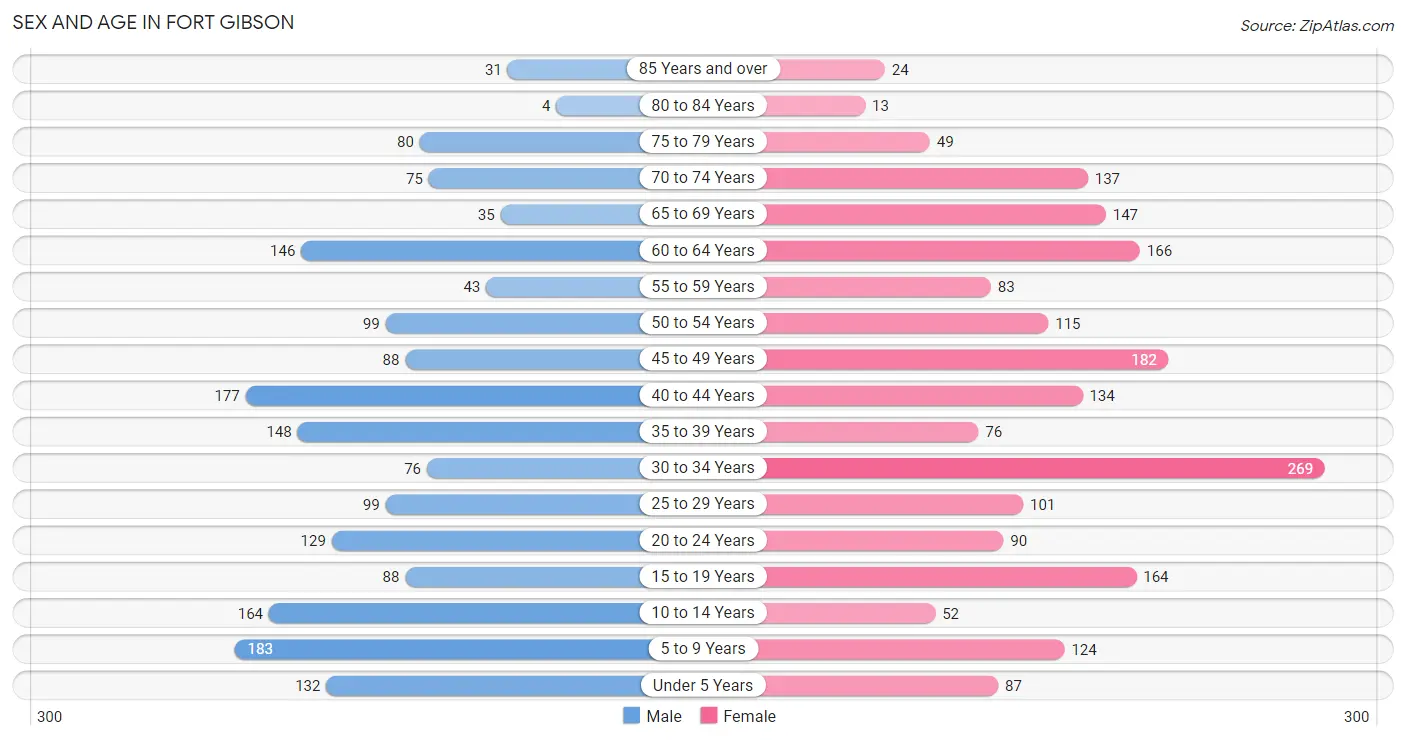
| Age Bracket | Male | Female |
| Under 5 Years | 132 (7.3%) | 87 (4.3%) |
| 5 to 9 Years | 183 (10.2%) | 124 (6.2%) |
| 10 to 14 Years | 164 (9.1%) | 52 (2.6%) |
| 15 to 19 Years | 88 (4.9%) | 164 (8.2%) |
| 20 to 24 Years | 129 (7.2%) | 90 (4.5%) |
| 25 to 29 Years | 99 (5.5%) | 101 (5.0%) |
| 30 to 34 Years | 76 (4.2%) | 269 (13.4%) |
| 35 to 39 Years | 148 (8.2%) | 76 (3.8%) |
| 40 to 44 Years | 177 (9.9%) | 134 (6.7%) |
| 45 to 49 Years | 88 (4.9%) | 182 (9.0%) |
| 50 to 54 Years | 99 (5.5%) | 115 (5.7%) |
| 55 to 59 Years | 43 (2.4%) | 83 (4.1%) |
| 60 to 64 Years | 146 (8.1%) | 166 (8.3%) |
| 65 to 69 Years | 35 (1.9%) | 147 (7.3%) |
| 70 to 74 Years | 75 (4.2%) | 137 (6.8%) |
| 75 to 79 Years | 80 (4.4%) | 49 (2.4%) |
| 80 to 84 Years | 4 (0.2%) | 13 (0.6%) |
| 85 Years and over | 31 (1.7%) | 24 (1.2%) |
| Total | 1,797 (100.0%) | 2,013 (100.0%) |
Families and Households in Fort Gibson
Median Family Size in Fort Gibson
The median family size in Fort Gibson is 3.00 persons per family, with married-couple families (680 | 68.3%) accounting for the largest median family size of 3.03 persons per family. On the other hand, single male/father families (27 | 2.7%) represent the smallest median family size with 2.74 persons per family.
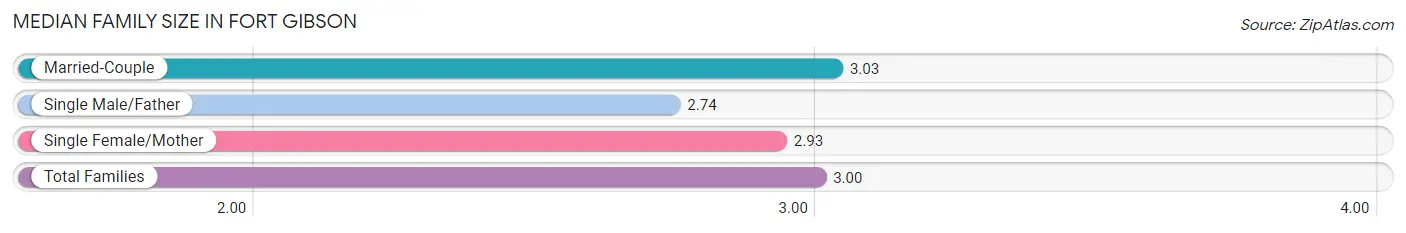
| Family Type | # Families | Family Size |
| Married-Couple | 680 (68.3%) | 3.03 |
| Single Male/Father | 27 (2.7%) | 2.74 |
| Single Female/Mother | 288 (28.9%) | 2.93 |
| Total Families | 995 (100.0%) | 3.00 |
Median Household Size in Fort Gibson
The median household size in Fort Gibson is 2.23 persons per household, with single male/father households (27 | 1.6%) accounting for the largest median household size of 3.81 persons per household. non-family households (685 | 40.8%) represent the smallest median household size with 1.09 persons per household.
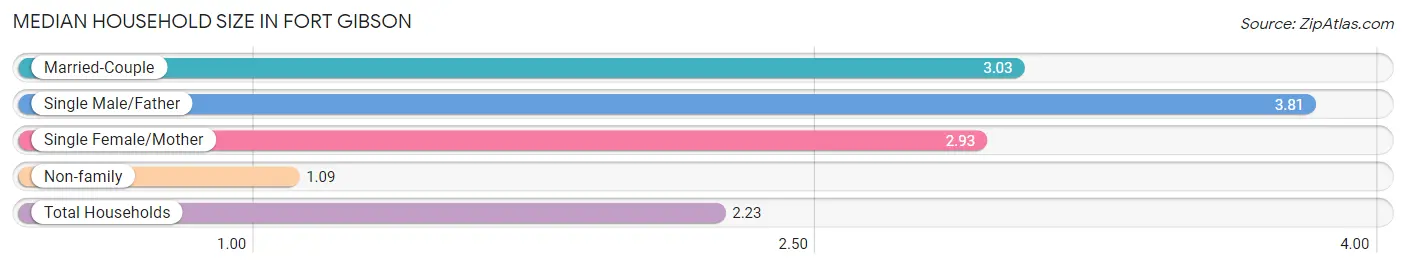
| Household Type | # Households | Household Size |
| Married-Couple | 680 (40.5%) | 3.03 |
| Single Male/Father | 27 (1.6%) | 3.81 |
| Single Female/Mother | 288 (17.1%) | 2.93 |
| Non-family | 685 (40.8%) | 1.09 |
| Total Households | 1,680 (100.0%) | 2.23 |
Household Size by Marriage Status in Fort Gibson
Out of a total of 1,680 households in Fort Gibson, 995 (59.2%) are family households, while 685 (40.8%) are nonfamily households. The most numerous type of family households are 2-person households, comprising 475, and the most common type of nonfamily households are 1-person households, comprising 604.
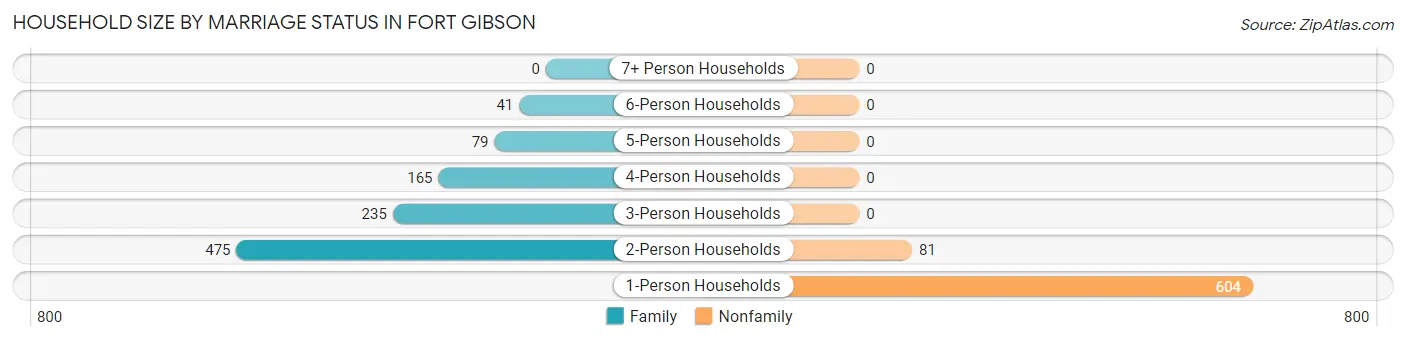
| Household Size | Family Households | Nonfamily Households |
| 1-Person Households | - | 604 (35.9%) |
| 2-Person Households | 475 (28.3%) | 81 (4.8%) |
| 3-Person Households | 235 (14.0%) | 0 (0.0%) |
| 4-Person Households | 165 (9.8%) | 0 (0.0%) |
| 5-Person Households | 79 (4.7%) | 0 (0.0%) |
| 6-Person Households | 41 (2.4%) | 0 (0.0%) |
| 7+ Person Households | 0 (0.0%) | 0 (0.0%) |
| Total | 995 (59.2%) | 685 (40.8%) |
Female Fertility in Fort Gibson
Fertility by Age in Fort Gibson
Average fertility rate in Fort Gibson is 28.0 births per 1,000 women. Women in the age bracket of 20 to 34 years have the highest fertility rate with 65.0 births per 1,000 women. Women in the age bracket of 20 to 34 years acount for 100.0% of all women with births.
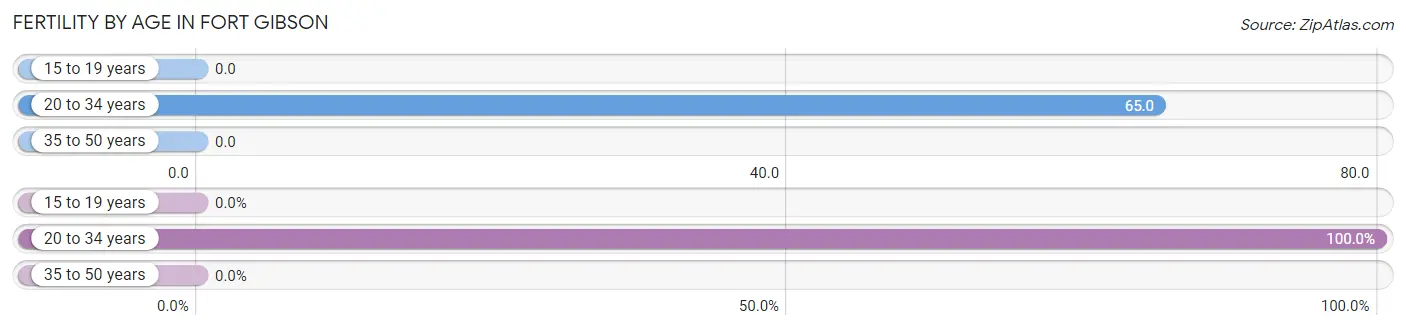
| Age Bracket | Women with Births | Births / 1,000 Women |
| 15 to 19 years | 0 (0.0%) | 0.0 |
| 20 to 34 years | 30 (100.0%) | 65.0 |
| 35 to 50 years | 0 (0.0%) | 0.0 |
| Total | 30 (100.0%) | 28.0 |
Fertility by Age by Marriage Status in Fort Gibson
53.3% of women with births (30) in Fort Gibson are married. The highest percentage of unmarried women with births falls into 20 to 34 years age bracket with 46.7% of them unmarried at the time of birth, while the lowest percentage of unmarried women with births belong to 20 to 34 years age bracket with 46.7% of them unmarried.
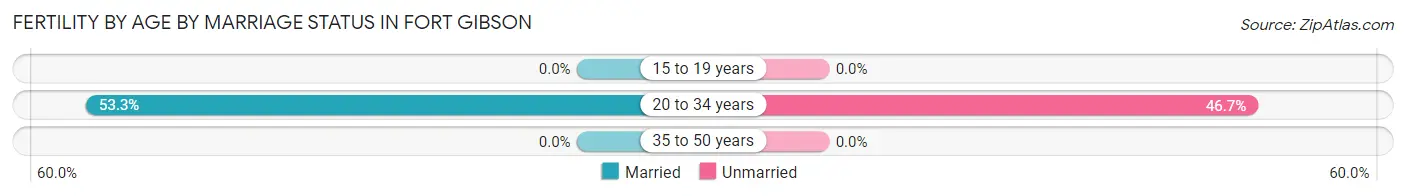
| Age Bracket | Married | Unmarried |
| 15 to 19 years | 0 (0.0%) | 0 (0.0%) |
| 20 to 34 years | 16 (53.3%) | 14 (46.7%) |
| 35 to 50 years | 0 (0.0%) | 0 (0.0%) |
| Total | 16 (53.3%) | 14 (46.7%) |
Fertility by Education in Fort Gibson
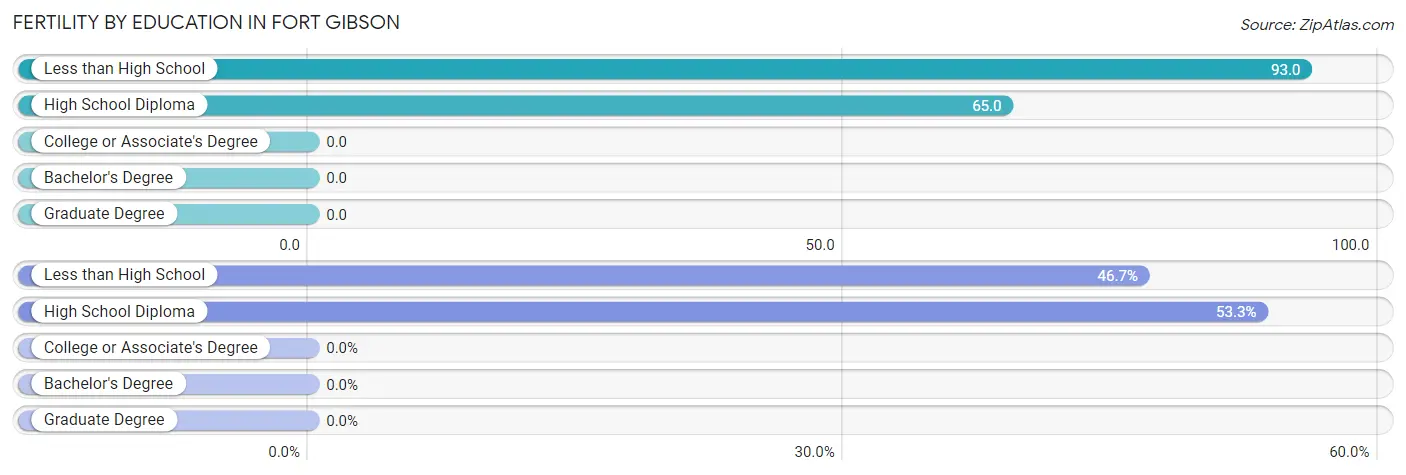
| Educational Attainment | Women with Births | Births / 1,000 Women |
| Less than High School | 14 (46.7%) | 93.0 |
| High School Diploma | 16 (53.3%) | 65.0 |
| College or Associate's Degree | 0 (0.0%) | 0.0 |
| Bachelor's Degree | 0 (0.0%) | 0.0 |
| Graduate Degree | 0 (0.0%) | 0.0 |
| Total | 30 (100.0%) | 28.0 |
Fertility by Education by Marriage Status in Fort Gibson
46.7% of women with births in Fort Gibson are unmarried. Women with the educational attainment of high school diploma are most likely to be married with 100.0% of them married at childbirth, while women with the educational attainment of less than high school are least likely to be married with 100.0% of them unmarried at childbirth.
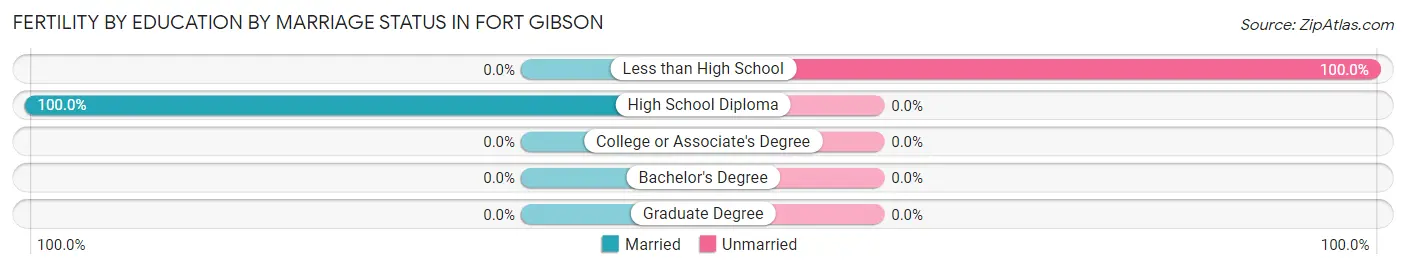
| Educational Attainment | Married | Unmarried |
| Less than High School | 0 (0.0%) | 14 (100.0%) |
| High School Diploma | 16 (100.0%) | 0 (0.0%) |
| College or Associate's Degree | 0 (0.0%) | 0 (0.0%) |
| Bachelor's Degree | 0 (0.0%) | 0 (0.0%) |
| Graduate Degree | 0 (0.0%) | 0 (0.0%) |
| Total | 16 (53.3%) | 14 (46.7%) |
Employment Characteristics in Fort Gibson
Employment by Class of Employer in Fort Gibson
Among the 1,839 employed individuals in Fort Gibson, private company employees (981 | 53.3%), local government employees (268 | 14.6%), and state government employees (241 | 13.1%) make up the most common classes of employment.
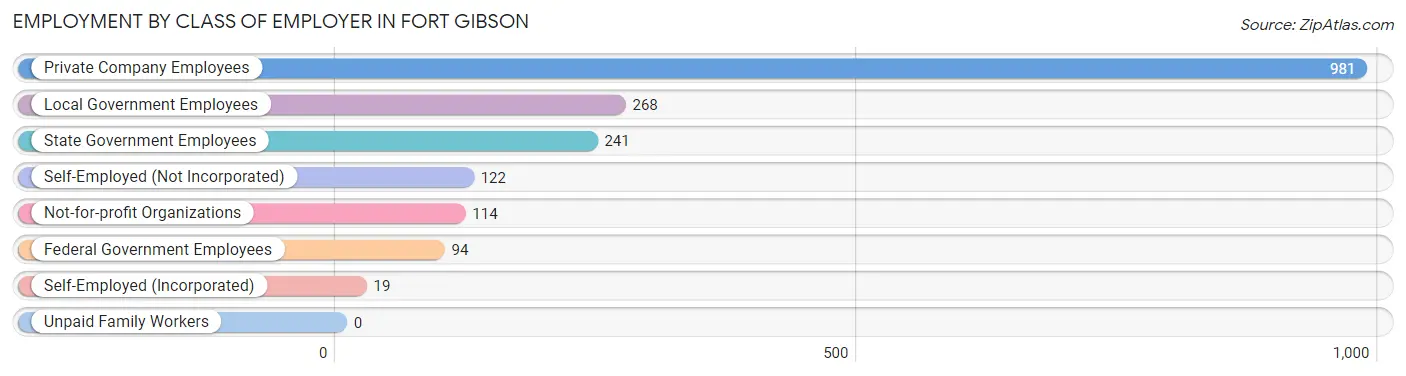
| Employer Class | # Employees | % Employees |
| Private Company Employees | 981 | 53.3% |
| Self-Employed (Incorporated) | 19 | 1.0% |
| Self-Employed (Not Incorporated) | 122 | 6.6% |
| Not-for-profit Organizations | 114 | 6.2% |
| Local Government Employees | 268 | 14.6% |
| State Government Employees | 241 | 13.1% |
| Federal Government Employees | 94 | 5.1% |
| Unpaid Family Workers | 0 | 0.0% |
| Total | 1,839 | 100.0% |
Employment Status by Age in Fort Gibson
According to the labor force statistics for Fort Gibson, out of the total population over 16 years of age (3,068), 62.1% or 1,905 individuals are in the labor force, with 2.8% or 53 of them unemployed. The age group with the highest labor force participation rate is 25 to 29 years, with 100.0% or 200 individuals in the labor force. Within the labor force, the 65 to 74 years age range has the highest percentage of unemployed individuals, with 12.0% or 14 of them being unemployed.
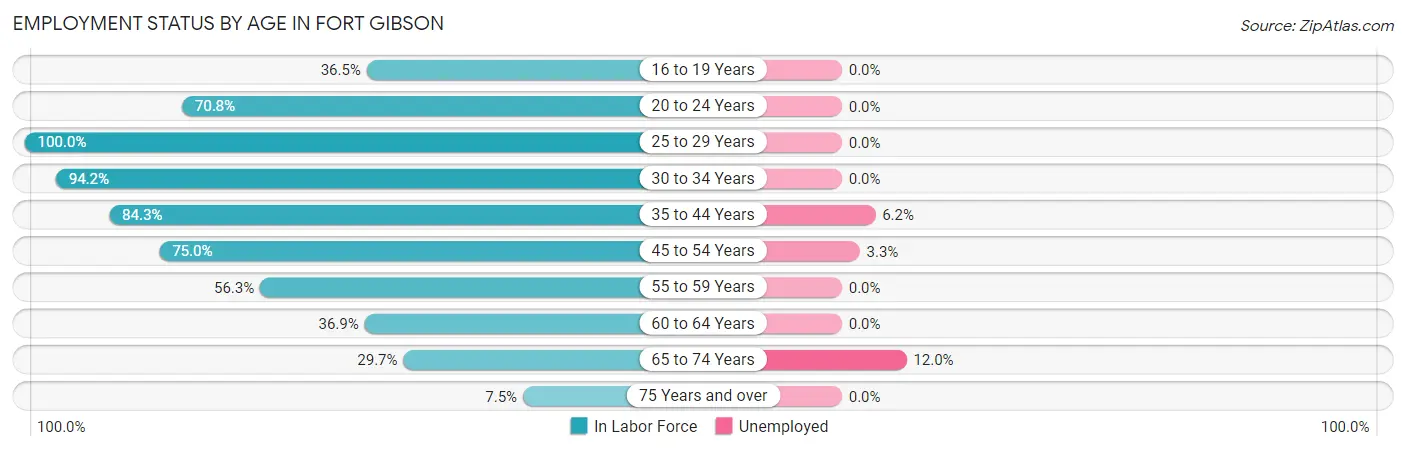
| Age Bracket | In Labor Force | Unemployed |
| 16 to 19 Years | 92 (36.5%) | 0 (0.0%) |
| 20 to 24 Years | 155 (70.8%) | 0 (0.0%) |
| 25 to 29 Years | 200 (100.0%) | 0 (0.0%) |
| 30 to 34 Years | 325 (94.2%) | 0 (0.0%) |
| 35 to 44 Years | 451 (84.3%) | 28 (6.2%) |
| 45 to 54 Years | 363 (75.0%) | 12 (3.3%) |
| 55 to 59 Years | 71 (56.3%) | 0 (0.0%) |
| 60 to 64 Years | 115 (36.9%) | 0 (0.0%) |
| 65 to 74 Years | 117 (29.7%) | 14 (12.0%) |
| 75 Years and over | 15 (7.5%) | 0 (0.0%) |
| Total | 1,905 (62.1%) | 53 (2.8%) |
Employment Status by Educational Attainment in Fort Gibson
According to labor force statistics for Fort Gibson, 76.2% of individuals (1,526) out of the total population between 25 and 64 years of age (2,002) are in the labor force, with 2.6% or 40 of them being unemployed. The group with the highest labor force participation rate are those with the educational attainment of bachelor's degree or higher, with 93.2% or 600 individuals in the labor force. Within the labor force, individuals with less than high school education have the highest percentage of unemployment, with 56.0% or 28 of them being unemployed.
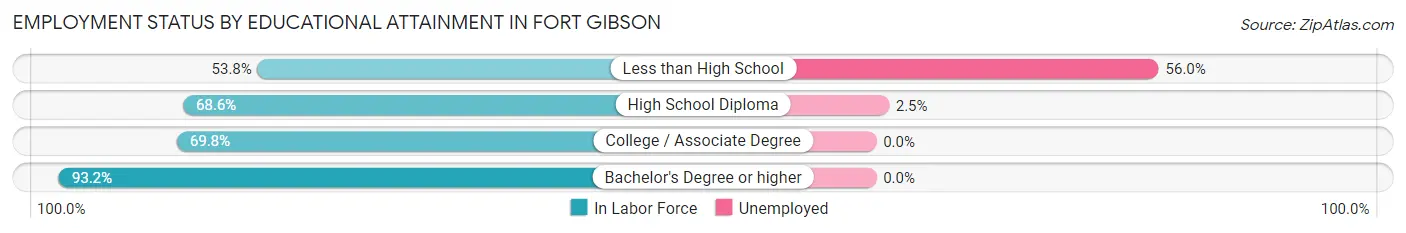
| Educational Attainment | In Labor Force | Unemployed |
| Less than High School | 50 (53.8%) | 52 (56.0%) |
| High School Diploma | 477 (68.6%) | 17 (2.5%) |
| College / Associate Degree | 398 (69.8%) | 0 (0.0%) |
| Bachelor's Degree or higher | 600 (93.2%) | 0 (0.0%) |
| Total | 1,526 (76.2%) | 52 (2.6%) |
Employment Occupations by Sex in Fort Gibson
Management, Business, Science and Arts Occupations
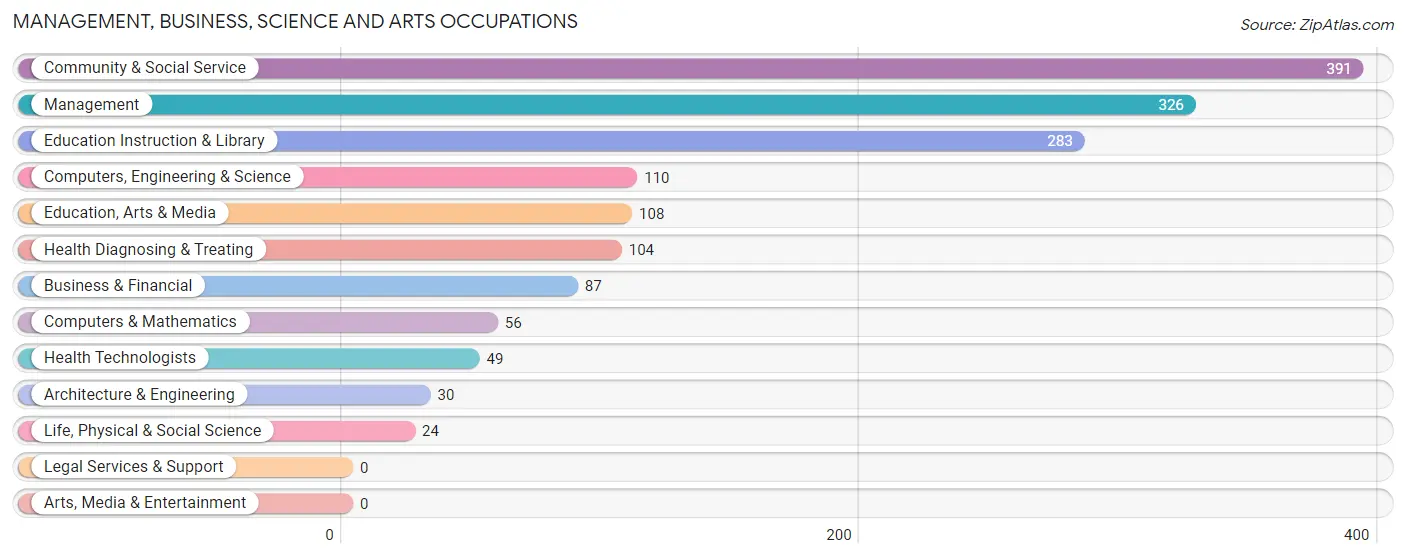
The most common Management, Business, Science and Arts occupations in Fort Gibson are Community & Social Service (391 | 21.1%), Management (326 | 17.6%), Education Instruction & Library (283 | 15.3%), Computers, Engineering & Science (110 | 5.9%), and Education, Arts & Media (108 | 5.8%).
Management, Business, Science and Arts Occupations by Sex
Within the Management, Business, Science and Arts occupations in Fort Gibson, the most male-oriented occupations are Architecture & Engineering (100.0%), Management (48.5%), and Computers, Engineering & Science (46.4%), while the most female-oriented occupations are Life, Physical & Social Science (100.0%), Health Diagnosing & Treating (79.8%), and Business & Financial (75.9%).
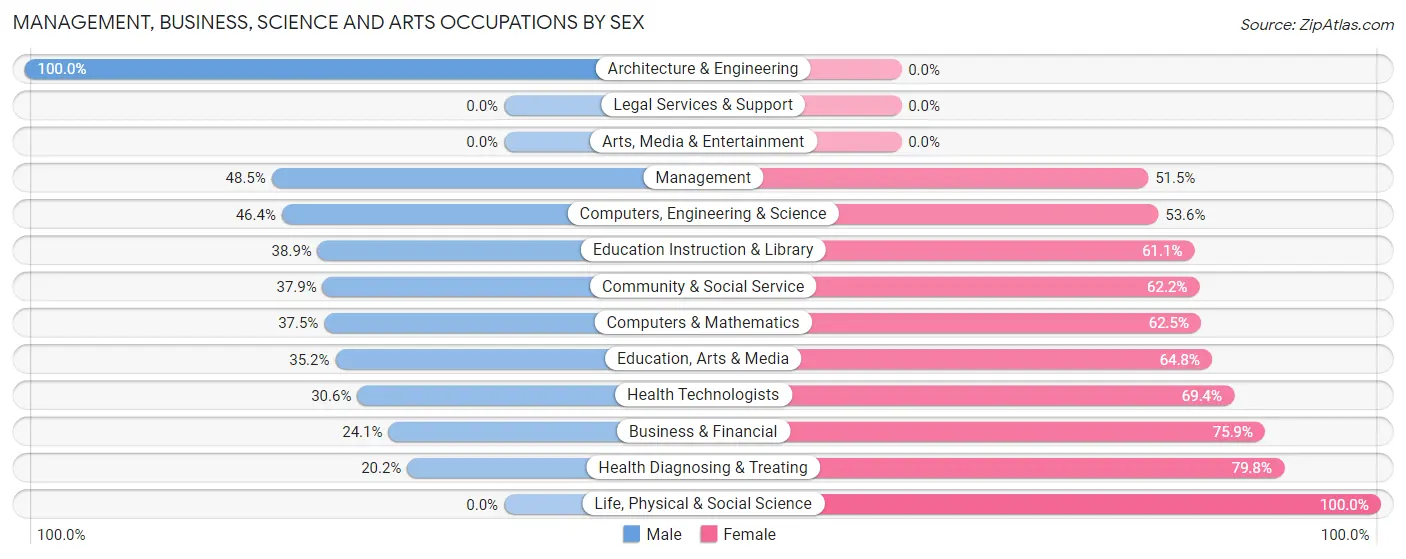
| Occupation | Male | Female |
| Management | 158 (48.5%) | 168 (51.5%) |
| Business & Financial | 21 (24.1%) | 66 (75.9%) |
| Computers, Engineering & Science | 51 (46.4%) | 59 (53.6%) |
| Computers & Mathematics | 21 (37.5%) | 35 (62.5%) |
| Architecture & Engineering | 30 (100.0%) | 0 (0.0%) |
| Life, Physical & Social Science | 0 (0.0%) | 24 (100.0%) |
| Community & Social Service | 148 (37.9%) | 243 (62.2%) |
| Education, Arts & Media | 38 (35.2%) | 70 (64.8%) |
| Legal Services & Support | 0 (0.0%) | 0 (0.0%) |
| Education Instruction & Library | 110 (38.9%) | 173 (61.1%) |
| Arts, Media & Entertainment | 0 (0.0%) | 0 (0.0%) |
| Health Diagnosing & Treating | 21 (20.2%) | 83 (79.8%) |
| Health Technologists | 15 (30.6%) | 34 (69.4%) |
| Total (Category) | 399 (39.2%) | 619 (60.8%) |
| Total (Overall) | 877 (47.4%) | 973 (52.6%) |
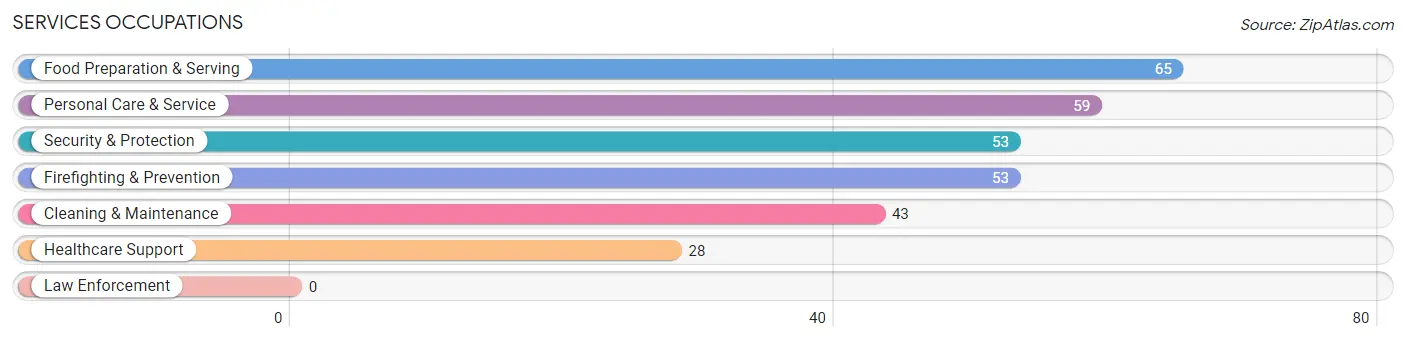
Services Occupations
The most common Services occupations in Fort Gibson are Food Preparation & Serving (65 | 3.5%), Personal Care & Service (59 | 3.2%), Security & Protection (53 | 2.9%), Firefighting & Prevention (53 | 2.9%), and Cleaning & Maintenance (43 | 2.3%).
Services Occupations by Sex
Within the Services occupations in Fort Gibson, the most male-oriented occupations are Security & Protection (100.0%), Firefighting & Prevention (100.0%), and Cleaning & Maintenance (37.2%), while the most female-oriented occupations are Healthcare Support (100.0%), Personal Care & Service (100.0%), and Food Preparation & Serving (66.1%).
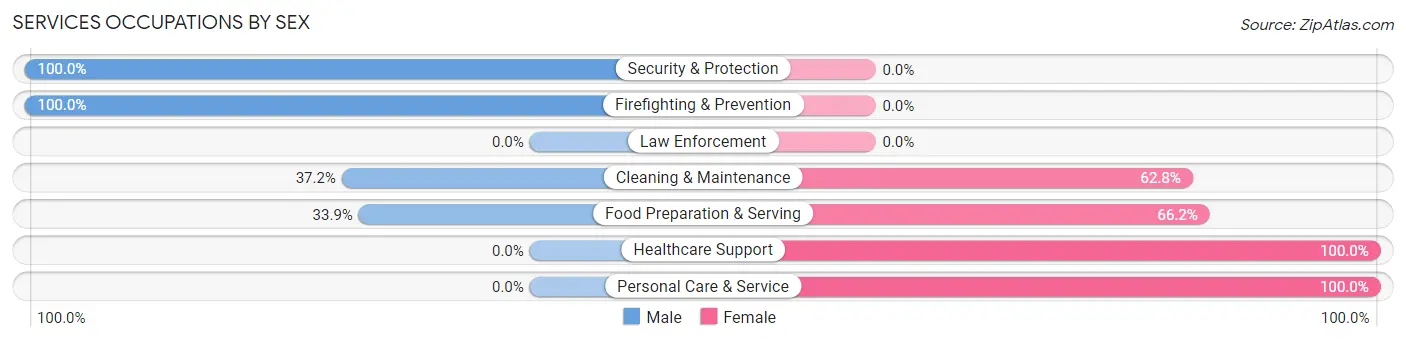
| Occupation | Male | Female |
| Healthcare Support | 0 (0.0%) | 28 (100.0%) |
| Security & Protection | 53 (100.0%) | 0 (0.0%) |
| Firefighting & Prevention | 53 (100.0%) | 0 (0.0%) |
| Law Enforcement | 0 (0.0%) | 0 (0.0%) |
| Food Preparation & Serving | 22 (33.9%) | 43 (66.1%) |
| Cleaning & Maintenance | 16 (37.2%) | 27 (62.8%) |
| Personal Care & Service | 0 (0.0%) | 59 (100.0%) |
| Total (Category) | 91 (36.7%) | 157 (63.3%) |
| Total (Overall) | 877 (47.4%) | 973 (52.6%) |
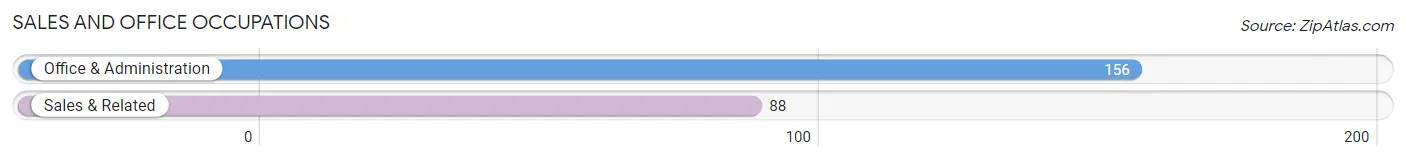
Sales and Office Occupations
The most common Sales and Office occupations in Fort Gibson are Office & Administration (156 | 8.4%), and Sales & Related (88 | 4.8%).
Sales and Office Occupations by Sex
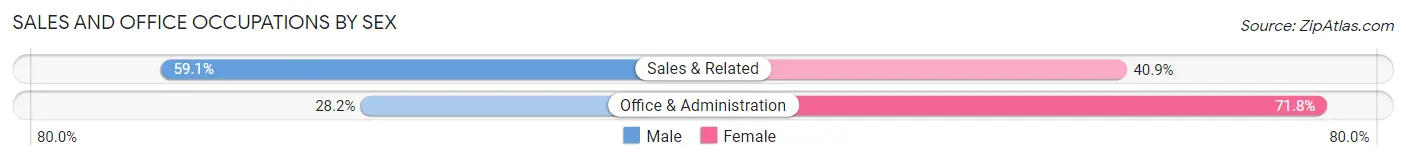
| Occupation | Male | Female |
| Sales & Related | 52 (59.1%) | 36 (40.9%) |
| Office & Administration | 44 (28.2%) | 112 (71.8%) |
| Total (Category) | 96 (39.3%) | 148 (60.7%) |
| Total (Overall) | 877 (47.4%) | 973 (52.6%) |
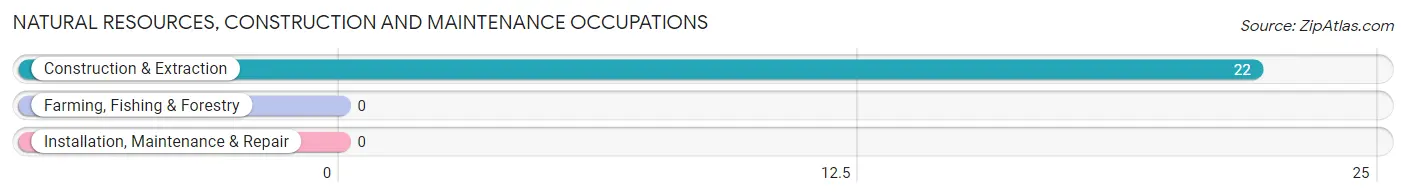
Natural Resources, Construction and Maintenance Occupations
The most common Natural Resources, Construction and Maintenance occupations in Fort Gibson are , and Construction & Extraction (22 | 1.2%).
Natural Resources, Construction and Maintenance Occupations by Sex
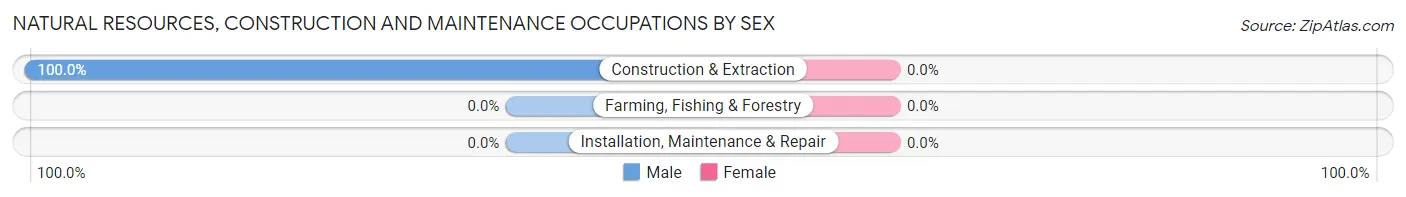
| Occupation | Male | Female |
| Farming, Fishing & Forestry | 0 (0.0%) | 0 (0.0%) |
| Construction & Extraction | 22 (100.0%) | 0 (0.0%) |
| Installation, Maintenance & Repair | 0 (0.0%) | 0 (0.0%) |
| Total (Category) | 22 (100.0%) | 0 (0.0%) |
| Total (Overall) | 877 (47.4%) | 973 (52.6%) |
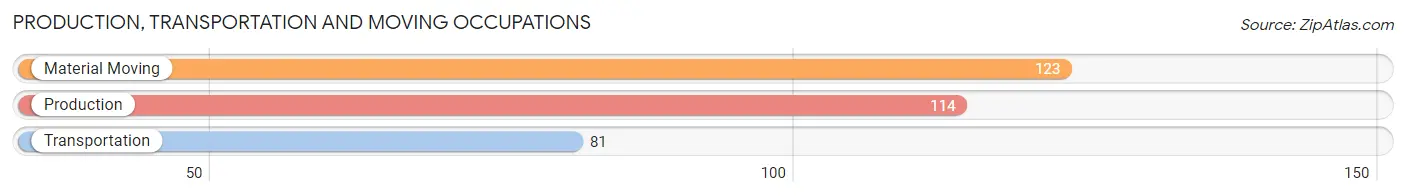
Production, Transportation and Moving Occupations
The most common Production, Transportation and Moving occupations in Fort Gibson are Material Moving (123 | 6.7%), Production (114 | 6.2%), and Transportation (81 | 4.4%).
Production, Transportation and Moving Occupations by Sex
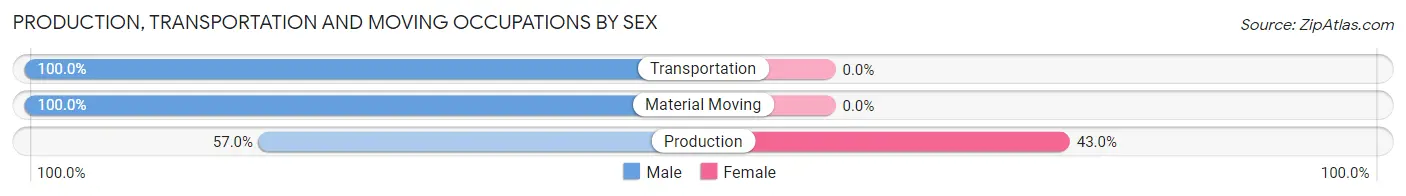
| Occupation | Male | Female |
| Production | 65 (57.0%) | 49 (43.0%) |
| Transportation | 81 (100.0%) | 0 (0.0%) |
| Material Moving | 123 (100.0%) | 0 (0.0%) |
| Total (Category) | 269 (84.6%) | 49 (15.4%) |
| Total (Overall) | 877 (47.4%) | 973 (52.6%) |
Employment Industries by Sex in Fort Gibson
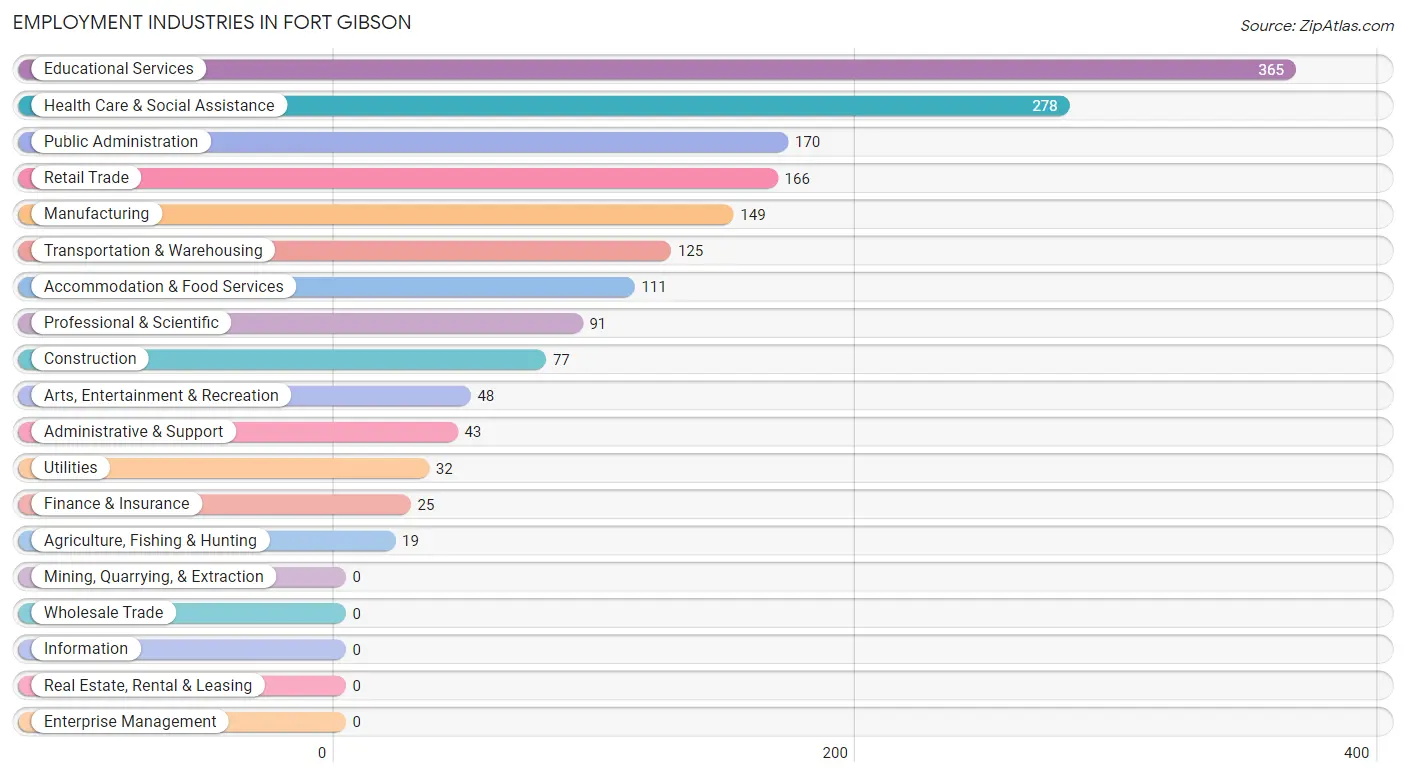
Employment Industries in Fort Gibson
The major employment industries in Fort Gibson include Educational Services (365 | 19.7%), Health Care & Social Assistance (278 | 15.0%), Public Administration (170 | 9.2%), Retail Trade (166 | 9.0%), and Manufacturing (149 | 8.1%).
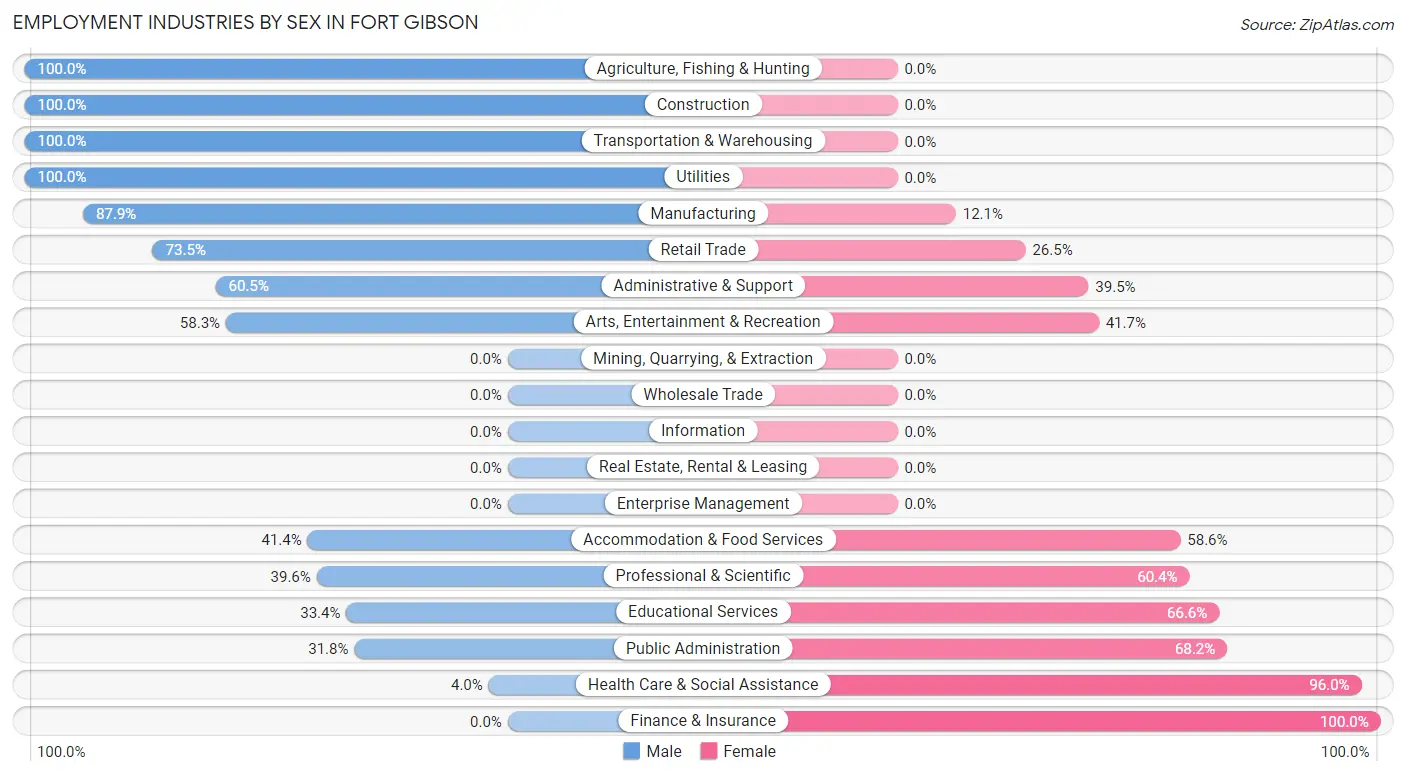
Employment Industries by Sex in Fort Gibson
The Fort Gibson industries that see more men than women are Agriculture, Fishing & Hunting (100.0%), Construction (100.0%), and Transportation & Warehousing (100.0%), whereas the industries that tend to have a higher number of women are Finance & Insurance (100.0%), Health Care & Social Assistance (96.0%), and Public Administration (68.2%).
| Industry | Male | Female |
| Agriculture, Fishing & Hunting | 19 (100.0%) | 0 (0.0%) |
| Mining, Quarrying, & Extraction | 0 (0.0%) | 0 (0.0%) |
| Construction | 77 (100.0%) | 0 (0.0%) |
| Manufacturing | 131 (87.9%) | 18 (12.1%) |
| Wholesale Trade | 0 (0.0%) | 0 (0.0%) |
| Retail Trade | 122 (73.5%) | 44 (26.5%) |
| Transportation & Warehousing | 125 (100.0%) | 0 (0.0%) |
| Utilities | 32 (100.0%) | 0 (0.0%) |
| Information | 0 (0.0%) | 0 (0.0%) |
| Finance & Insurance | 0 (0.0%) | 25 (100.0%) |
| Real Estate, Rental & Leasing | 0 (0.0%) | 0 (0.0%) |
| Professional & Scientific | 36 (39.6%) | 55 (60.4%) |
| Enterprise Management | 0 (0.0%) | 0 (0.0%) |
| Administrative & Support | 26 (60.5%) | 17 (39.5%) |
| Educational Services | 122 (33.4%) | 243 (66.6%) |
| Health Care & Social Assistance | 11 (4.0%) | 267 (96.0%) |
| Arts, Entertainment & Recreation | 28 (58.3%) | 20 (41.7%) |
| Accommodation & Food Services | 46 (41.4%) | 65 (58.6%) |
| Public Administration | 54 (31.8%) | 116 (68.2%) |
| Total | 877 (47.4%) | 973 (52.6%) |
Education in Fort Gibson
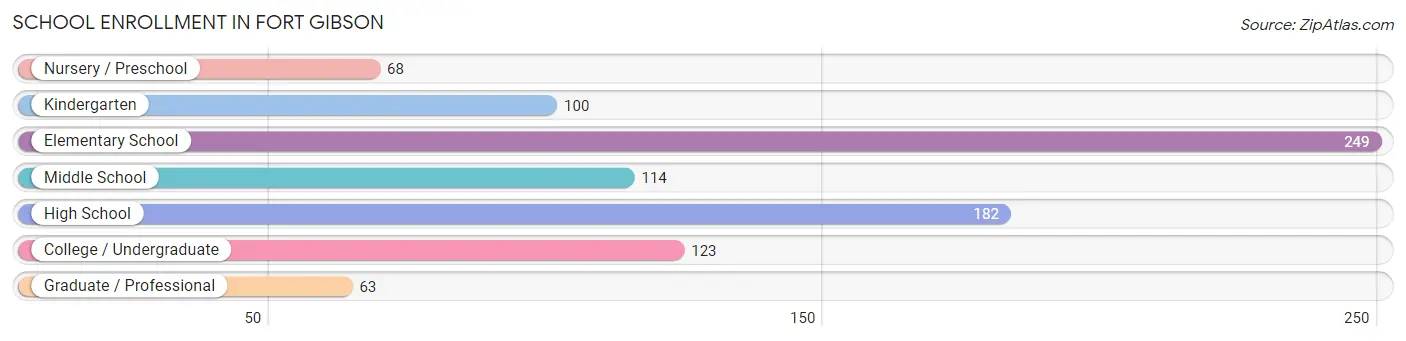
School Enrollment in Fort Gibson
The most common levels of schooling among the 899 students in Fort Gibson are elementary school (249 | 27.7%), high school (182 | 20.2%), and college / undergraduate (123 | 13.7%).
| School Level | # Students | % Students |
| Nursery / Preschool | 68 | 7.6% |
| Kindergarten | 100 | 11.1% |
| Elementary School | 249 | 27.7% |
| Middle School | 114 | 12.7% |
| High School | 182 | 20.2% |
| College / Undergraduate | 123 | 13.7% |
| Graduate / Professional | 63 | 7.0% |
| Total | 899 | 100.0% |
School Enrollment by Age by Funding Source in Fort Gibson
Out of a total of 899 students who are enrolled in schools in Fort Gibson, 55 (6.1%) attend a private institution, while the remaining 844 (93.9%) are enrolled in public schools. The age group of 3 to 4 year olds has the highest likelihood of being enrolled in private schools, with 8 (33.3% in the age bracket) enrolled. Conversely, the age group of 5 to 9 year old has the lowest likelihood of being enrolled in a private school, with 307 (100.0% in the age bracket) attending a public institution.
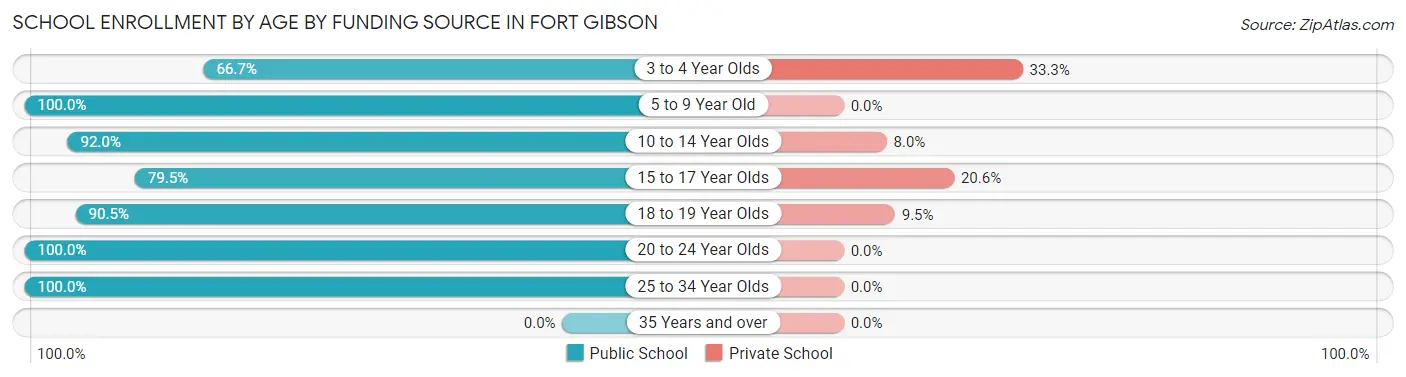
| Age Bracket | Public School | Private School |
| 3 to 4 Year Olds | 16 (66.7%) | 8 (33.3%) |
| 5 to 9 Year Old | 307 (100.0%) | 0 (0.0%) |
| 10 to 14 Year Olds | 184 (92.0%) | 16 (8.0%) |
| 15 to 17 Year Olds | 58 (79.4%) | 15 (20.5%) |
| 18 to 19 Year Olds | 152 (90.5%) | 16 (9.5%) |
| 20 to 24 Year Olds | 84 (100.0%) | 0 (0.0%) |
| 25 to 34 Year Olds | 43 (100.0%) | 0 (0.0%) |
| 35 Years and over | 0 (0.0%) | 0 (0.0%) |
| Total | 844 (93.9%) | 55 (6.1%) |
Educational Attainment by Field of Study in Fort Gibson
Education (360 | 34.0%), business (275 | 26.0%), arts & humanities (163 | 15.4%), computers & mathematics (69 | 6.5%), and science & technology (64 | 6.0%) are the most common fields of study among 1,059 individuals in Fort Gibson who have obtained a bachelor's degree or higher.
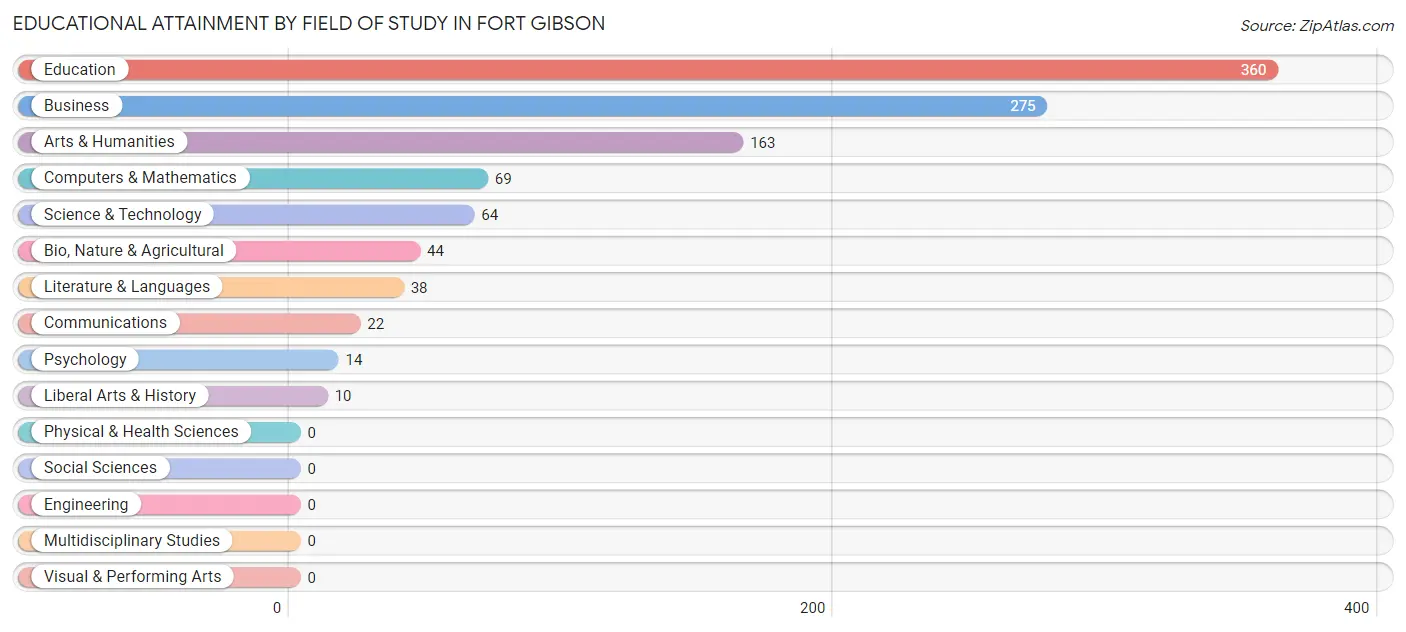
| Field of Study | # Graduates | % Graduates |
| Computers & Mathematics | 69 | 6.5% |
| Bio, Nature & Agricultural | 44 | 4.2% |
| Physical & Health Sciences | 0 | 0.0% |
| Psychology | 14 | 1.3% |
| Social Sciences | 0 | 0.0% |
| Engineering | 0 | 0.0% |
| Multidisciplinary Studies | 0 | 0.0% |
| Science & Technology | 64 | 6.0% |
| Business | 275 | 26.0% |
| Education | 360 | 34.0% |
| Literature & Languages | 38 | 3.6% |
| Liberal Arts & History | 10 | 0.9% |
| Visual & Performing Arts | 0 | 0.0% |
| Communications | 22 | 2.1% |
| Arts & Humanities | 163 | 15.4% |
| Total | 1,059 | 100.0% |
Transportation & Commute in Fort Gibson
Vehicle Availability by Sex in Fort Gibson
The most prevalent vehicle ownership categories in Fort Gibson are males with 2 vehicles (385, accounting for 44.5%) and females with 2 vehicles (355, making up 39.6%).
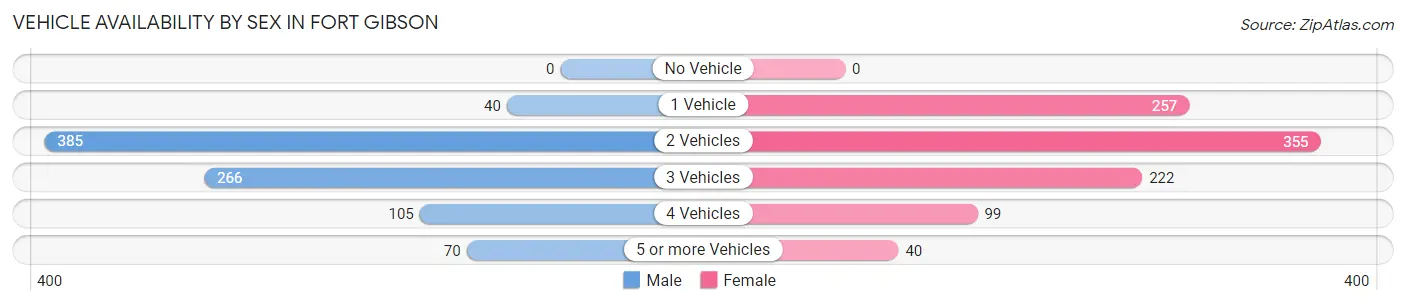
| Vehicles Available | Male | Female |
| No Vehicle | 0 (0.0%) | 0 (0.0%) |
| 1 Vehicle | 40 (4.6%) | 257 (26.4%) |
| 2 Vehicles | 385 (44.5%) | 355 (36.5%) |
| 3 Vehicles | 266 (30.7%) | 222 (22.8%) |
| 4 Vehicles | 105 (12.1%) | 99 (10.2%) |
| 5 or more Vehicles | 70 (8.1%) | 40 (4.1%) |
| Total | 866 (100.0%) | 973 (100.0%) |
Commute Time in Fort Gibson
The most frequently occuring commute durations in Fort Gibson are 15 to 19 minutes (374 commuters, 22.9%), 5 to 9 minutes (250 commuters, 15.3%), and 45 to 59 minutes (176 commuters, 10.8%).
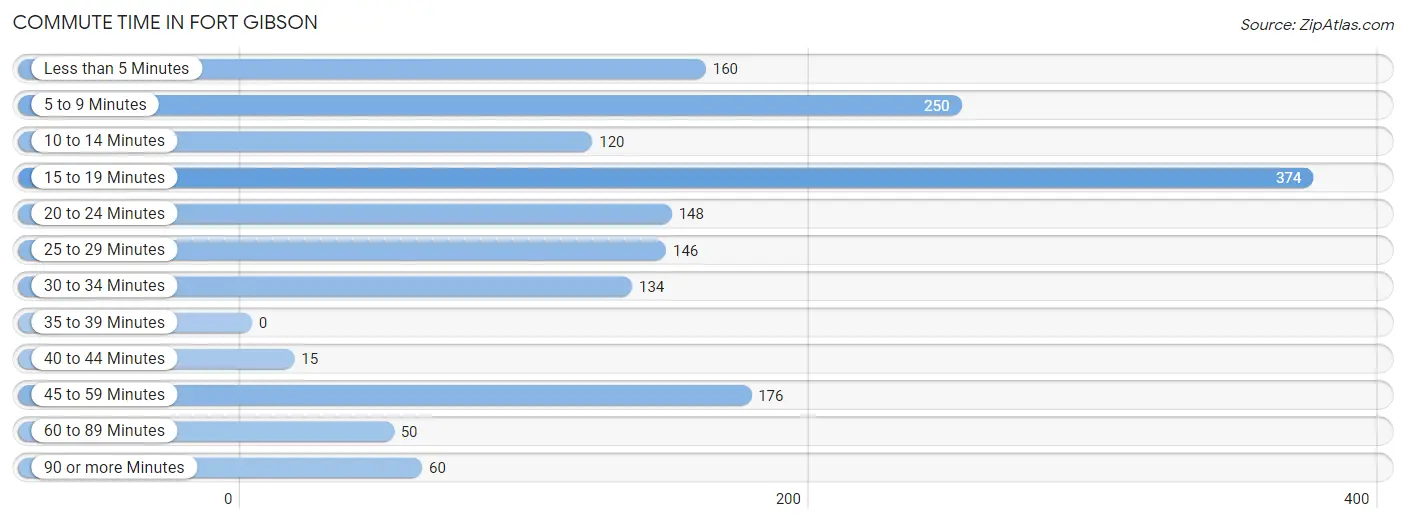
| Commute Time | # Commuters | % Commuters |
| Less than 5 Minutes | 160 | 9.8% |
| 5 to 9 Minutes | 250 | 15.3% |
| 10 to 14 Minutes | 120 | 7.3% |
| 15 to 19 Minutes | 374 | 22.9% |
| 20 to 24 Minutes | 148 | 9.1% |
| 25 to 29 Minutes | 146 | 8.9% |
| 30 to 34 Minutes | 134 | 8.2% |
| 35 to 39 Minutes | 0 | 0.0% |
| 40 to 44 Minutes | 15 | 0.9% |
| 45 to 59 Minutes | 176 | 10.8% |
| 60 to 89 Minutes | 50 | 3.1% |
| 90 or more Minutes | 60 | 3.7% |
Commute Time by Sex in Fort Gibson
The most common commute times in Fort Gibson are 15 to 19 minutes (243 commuters, 30.5%) for males and 15 to 19 minutes (131 commuters, 15.7%) for females.
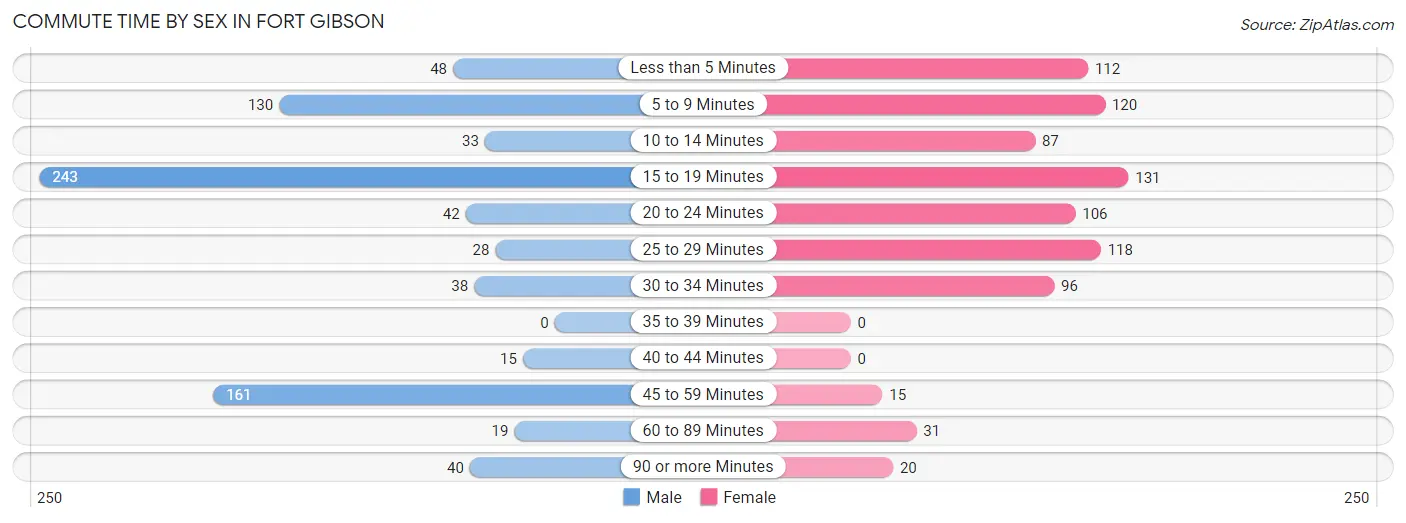
| Commute Time | Male | Female |
| Less than 5 Minutes | 48 (6.0%) | 112 (13.4%) |
| 5 to 9 Minutes | 130 (16.3%) | 120 (14.3%) |
| 10 to 14 Minutes | 33 (4.1%) | 87 (10.4%) |
| 15 to 19 Minutes | 243 (30.5%) | 131 (15.7%) |
| 20 to 24 Minutes | 42 (5.3%) | 106 (12.7%) |
| 25 to 29 Minutes | 28 (3.5%) | 118 (14.1%) |
| 30 to 34 Minutes | 38 (4.8%) | 96 (11.5%) |
| 35 to 39 Minutes | 0 (0.0%) | 0 (0.0%) |
| 40 to 44 Minutes | 15 (1.9%) | 0 (0.0%) |
| 45 to 59 Minutes | 161 (20.2%) | 15 (1.8%) |
| 60 to 89 Minutes | 19 (2.4%) | 31 (3.7%) |
| 90 or more Minutes | 40 (5.0%) | 20 (2.4%) |
Time of Departure to Work by Sex in Fort Gibson
The most frequent times of departure to work in Fort Gibson are 6:00 AM to 6:29 AM (185, 23.2%) for males and 7:00 AM to 7:29 AM (268, 32.1%) for females.
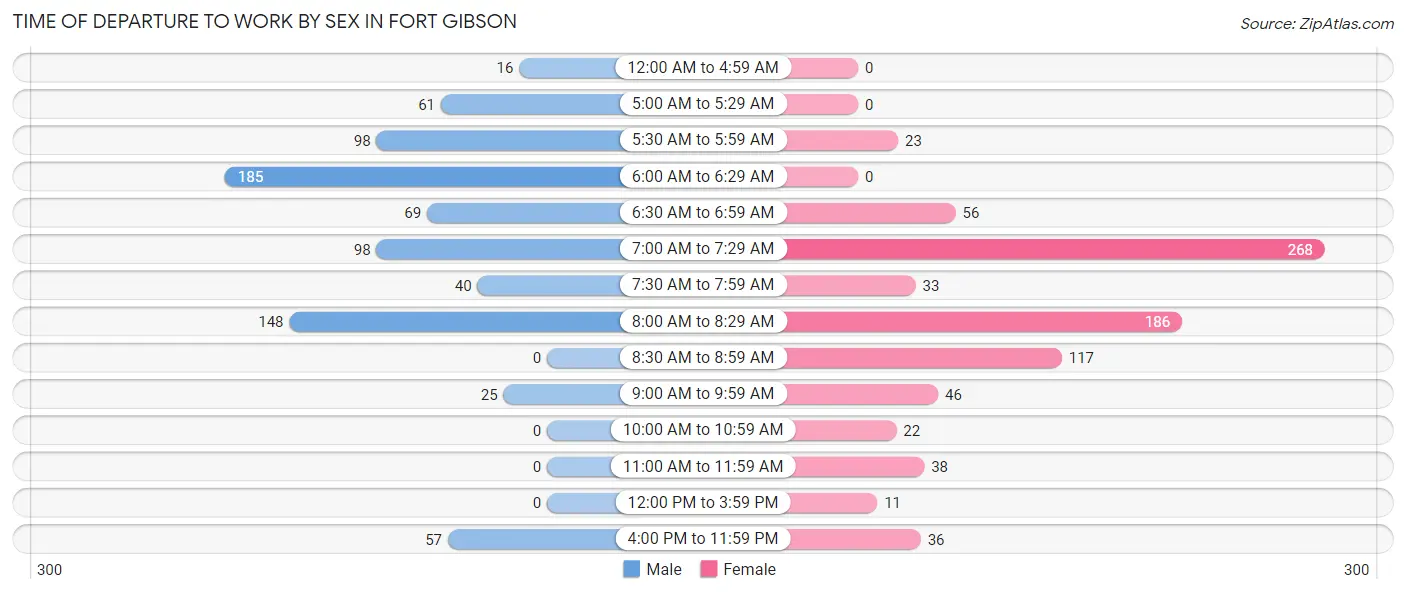
| Time of Departure | Male | Female |
| 12:00 AM to 4:59 AM | 16 (2.0%) | 0 (0.0%) |
| 5:00 AM to 5:29 AM | 61 (7.6%) | 0 (0.0%) |
| 5:30 AM to 5:59 AM | 98 (12.3%) | 23 (2.8%) |
| 6:00 AM to 6:29 AM | 185 (23.2%) | 0 (0.0%) |
| 6:30 AM to 6:59 AM | 69 (8.7%) | 56 (6.7%) |
| 7:00 AM to 7:29 AM | 98 (12.3%) | 268 (32.1%) |
| 7:30 AM to 7:59 AM | 40 (5.0%) | 33 (4.0%) |
| 8:00 AM to 8:29 AM | 148 (18.6%) | 186 (22.3%) |
| 8:30 AM to 8:59 AM | 0 (0.0%) | 117 (14.0%) |
| 9:00 AM to 9:59 AM | 25 (3.1%) | 46 (5.5%) |
| 10:00 AM to 10:59 AM | 0 (0.0%) | 22 (2.6%) |
| 11:00 AM to 11:59 AM | 0 (0.0%) | 38 (4.5%) |
| 12:00 PM to 3:59 PM | 0 (0.0%) | 11 (1.3%) |
| 4:00 PM to 11:59 PM | 57 (7.1%) | 36 (4.3%) |
| Total | 797 (100.0%) | 836 (100.0%) |
Housing Occupancy in Fort Gibson
Occupancy by Ownership in Fort Gibson
Of the total 1,680 dwellings in Fort Gibson, owner-occupied units account for 1,121 (66.7%), while renter-occupied units make up 559 (33.3%).
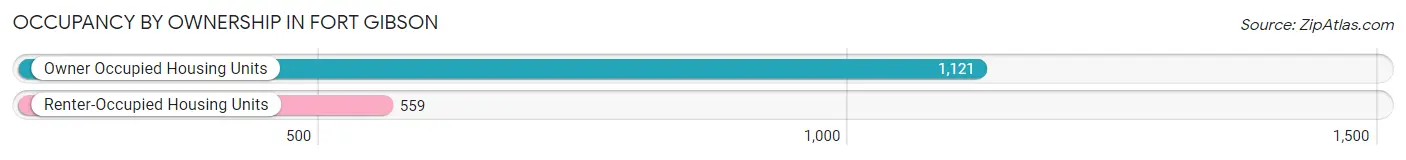
| Occupancy | # Housing Units | % Housing Units |
| Owner Occupied Housing Units | 1,121 | 66.7% |
| Renter-Occupied Housing Units | 559 | 33.3% |
| Total Occupied Housing Units | 1,680 | 100.0% |
Occupancy by Household Size in Fort Gibson
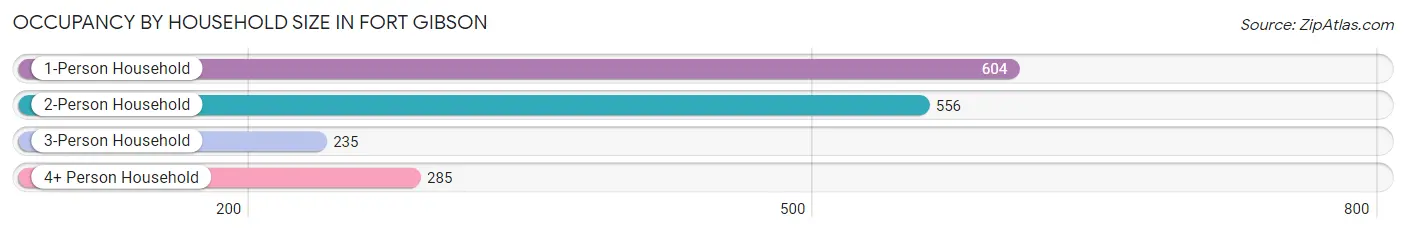
| Household Size | # Housing Units | % Housing Units |
| 1-Person Household | 604 | 35.9% |
| 2-Person Household | 556 | 33.1% |
| 3-Person Household | 235 | 14.0% |
| 4+ Person Household | 285 | 17.0% |
| Total Housing Units | 1,680 | 100.0% |
Occupancy by Ownership by Household Size in Fort Gibson
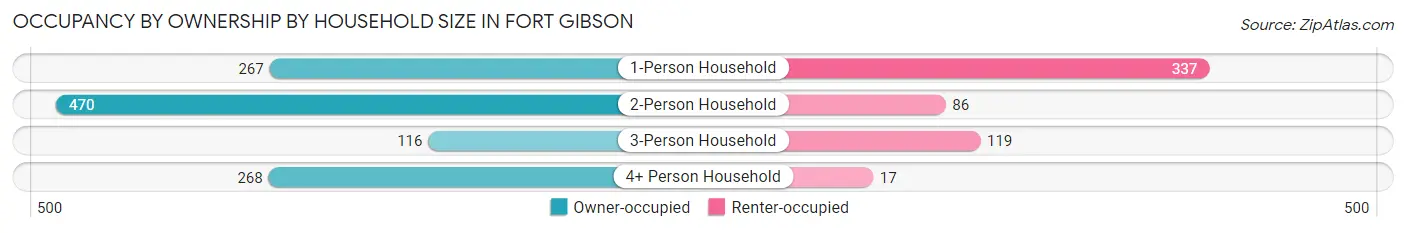
| Household Size | Owner-occupied | Renter-occupied |
| 1-Person Household | 267 (44.2%) | 337 (55.8%) |
| 2-Person Household | 470 (84.5%) | 86 (15.5%) |
| 3-Person Household | 116 (49.4%) | 119 (50.6%) |
| 4+ Person Household | 268 (94.0%) | 17 (6.0%) |
| Total Housing Units | 1,121 (66.7%) | 559 (33.3%) |
Occupancy by Educational Attainment in Fort Gibson
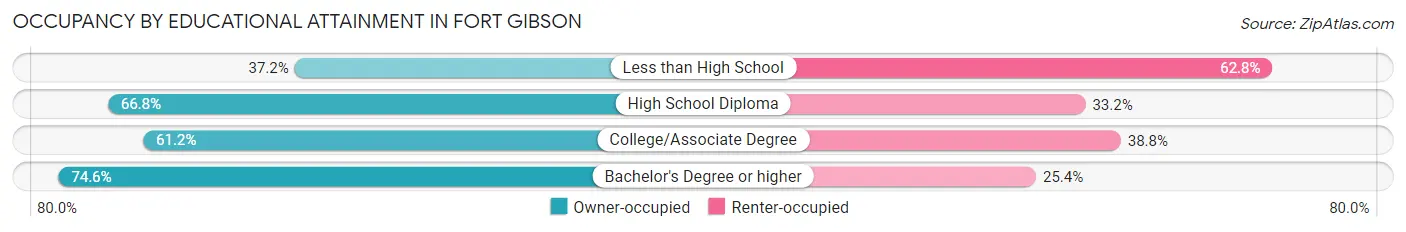
| Household Size | Owner-occupied | Renter-occupied |
| Less than High School | 29 (37.2%) | 49 (62.8%) |
| High School Diploma | 332 (66.8%) | 165 (33.2%) |
| College/Associate Degree | 295 (61.2%) | 187 (38.8%) |
| Bachelor's Degree or higher | 465 (74.6%) | 158 (25.4%) |
Occupancy by Age of Householder in Fort Gibson
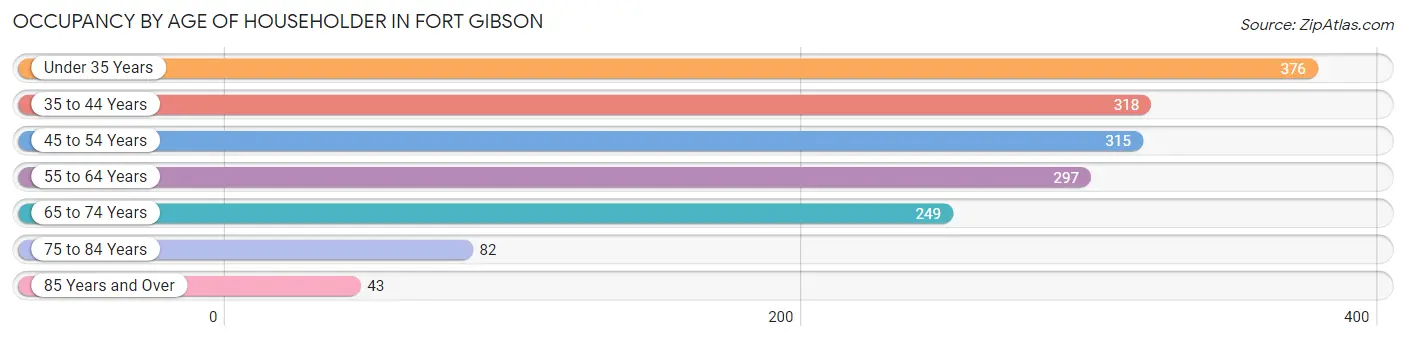
| Age Bracket | # Households | % Households |
| Under 35 Years | 376 | 22.4% |
| 35 to 44 Years | 318 | 18.9% |
| 45 to 54 Years | 315 | 18.8% |
| 55 to 64 Years | 297 | 17.7% |
| 65 to 74 Years | 249 | 14.8% |
| 75 to 84 Years | 82 | 4.9% |
| 85 Years and Over | 43 | 2.6% |
| Total | 1,680 | 100.0% |
Housing Finances in Fort Gibson
Median Income by Occupancy in Fort Gibson
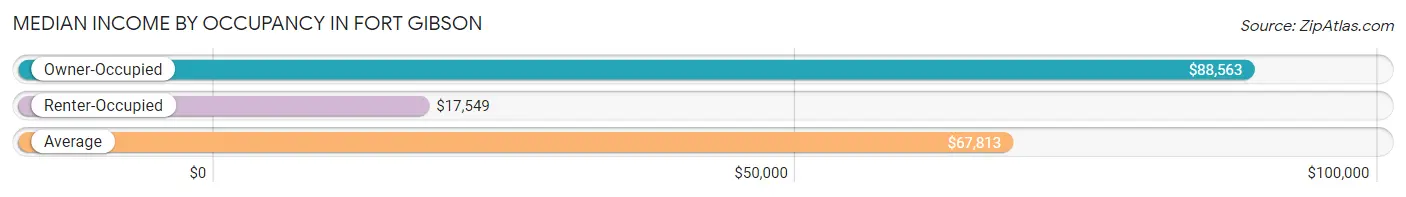
| Occupancy Type | # Households | Median Income |
| Owner-Occupied | 1,121 (66.7%) | $88,563 |
| Renter-Occupied | 559 (33.3%) | $17,549 |
| Average | 1,680 (100.0%) | $67,813 |
Occupancy by Householder Income Bracket in Fort Gibson
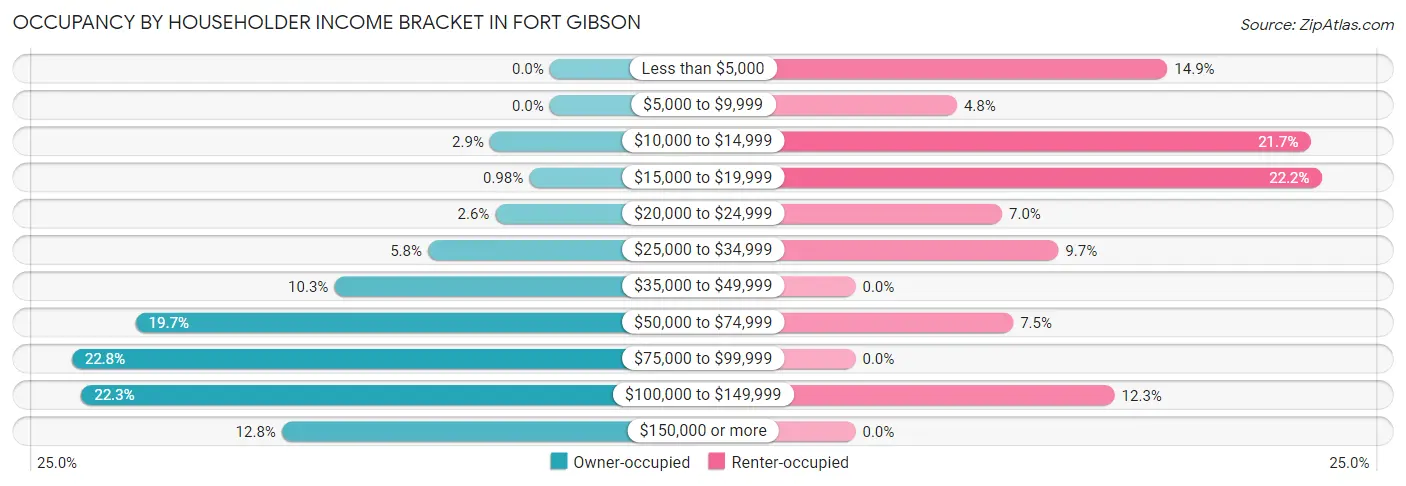
| Income Bracket | Owner-occupied | Renter-occupied |
| Less than $5,000 | 0 (0.0%) | 83 (14.8%) |
| $5,000 to $9,999 | 0 (0.0%) | 27 (4.8%) |
| $10,000 to $14,999 | 32 (2.9%) | 121 (21.6%) |
| $15,000 to $19,999 | 11 (1.0%) | 124 (22.2%) |
| $20,000 to $24,999 | 29 (2.6%) | 39 (7.0%) |
| $25,000 to $34,999 | 65 (5.8%) | 54 (9.7%) |
| $35,000 to $49,999 | 115 (10.3%) | 0 (0.0%) |
| $50,000 to $74,999 | 221 (19.7%) | 42 (7.5%) |
| $75,000 to $99,999 | 255 (22.8%) | 0 (0.0%) |
| $100,000 to $149,999 | 250 (22.3%) | 69 (12.3%) |
| $150,000 or more | 143 (12.8%) | 0 (0.0%) |
| Total | 1,121 (100.0%) | 559 (100.0%) |
Monthly Housing Cost Tiers in Fort Gibson
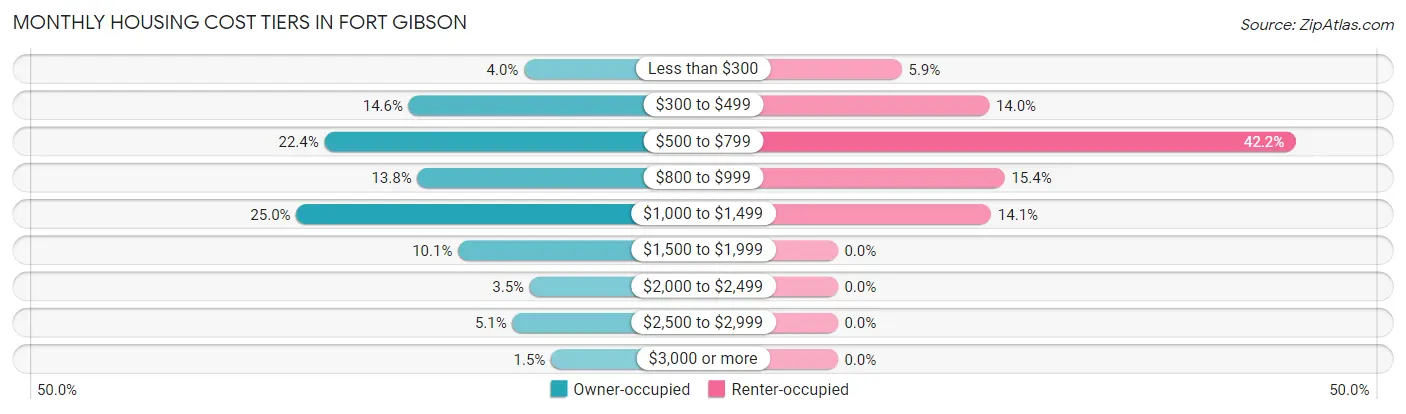
| Monthly Cost | Owner-occupied | Renter-occupied |
| Less than $300 | 45 (4.0%) | 33 (5.9%) |
| $300 to $499 | 164 (14.6%) | 78 (14.0%) |
| $500 to $799 | 251 (22.4%) | 236 (42.2%) |
| $800 to $999 | 155 (13.8%) | 86 (15.4%) |
| $1,000 to $1,499 | 280 (25.0%) | 79 (14.1%) |
| $1,500 to $1,999 | 113 (10.1%) | 0 (0.0%) |
| $2,000 to $2,499 | 39 (3.5%) | 0 (0.0%) |
| $2,500 to $2,999 | 57 (5.1%) | 0 (0.0%) |
| $3,000 or more | 17 (1.5%) | 0 (0.0%) |
| Total | 1,121 (100.0%) | 559 (100.0%) |
Physical Housing Characteristics in Fort Gibson
Housing Structures in Fort Gibson
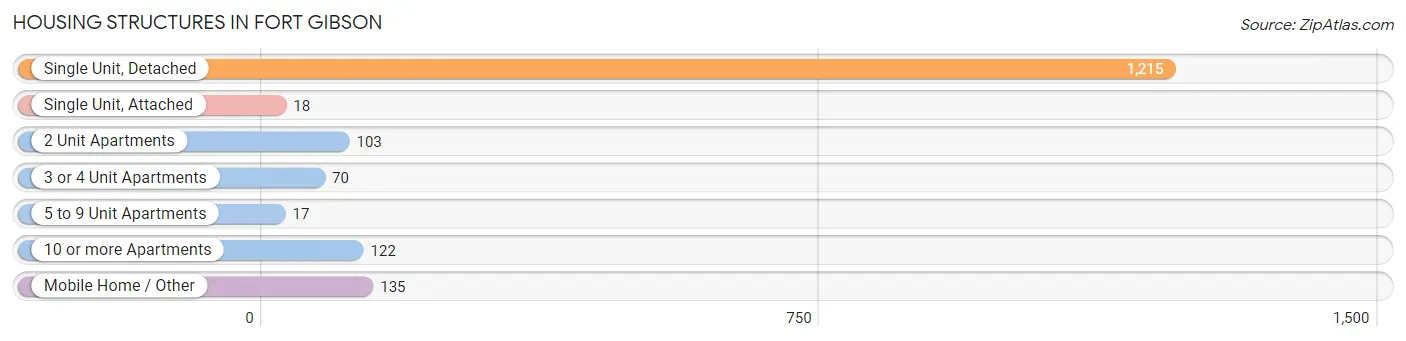
| Structure Type | # Housing Units | % Housing Units |
| Single Unit, Detached | 1,215 | 72.3% |
| Single Unit, Attached | 18 | 1.1% |
| 2 Unit Apartments | 103 | 6.1% |
| 3 or 4 Unit Apartments | 70 | 4.2% |
| 5 to 9 Unit Apartments | 17 | 1.0% |
| 10 or more Apartments | 122 | 7.3% |
| Mobile Home / Other | 135 | 8.0% |
| Total | 1,680 | 100.0% |
Housing Structures by Occupancy in Fort Gibson
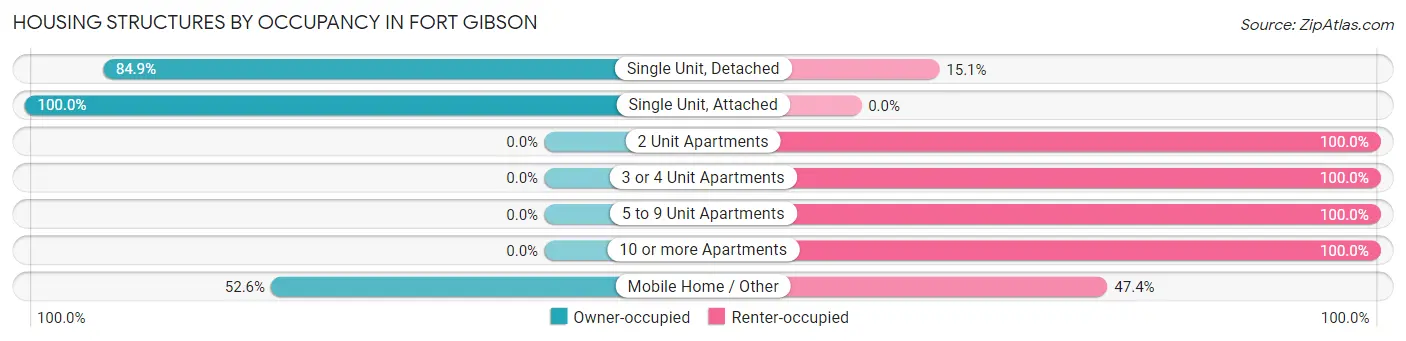
| Structure Type | Owner-occupied | Renter-occupied |
| Single Unit, Detached | 1,032 (84.9%) | 183 (15.1%) |
| Single Unit, Attached | 18 (100.0%) | 0 (0.0%) |
| 2 Unit Apartments | 0 (0.0%) | 103 (100.0%) |
| 3 or 4 Unit Apartments | 0 (0.0%) | 70 (100.0%) |
| 5 to 9 Unit Apartments | 0 (0.0%) | 17 (100.0%) |
| 10 or more Apartments | 0 (0.0%) | 122 (100.0%) |
| Mobile Home / Other | 71 (52.6%) | 64 (47.4%) |
| Total | 1,121 (66.7%) | 559 (33.3%) |
Housing Structures by Number of Rooms in Fort Gibson
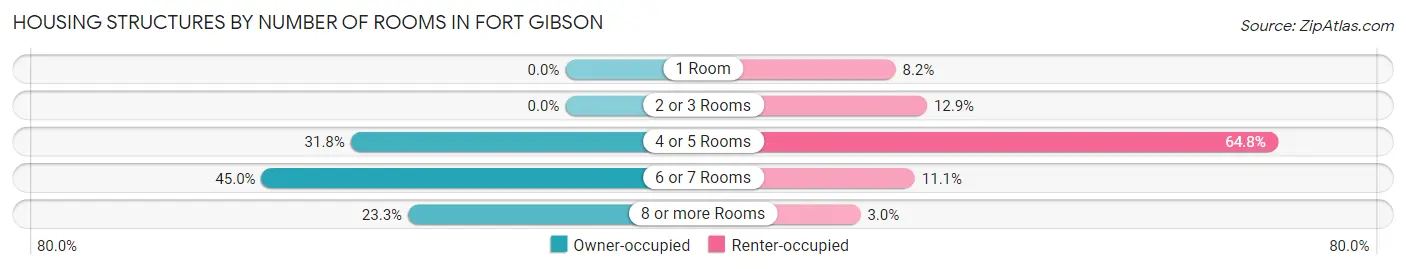
| Number of Rooms | Owner-occupied | Renter-occupied |
| 1 Room | 0 (0.0%) | 46 (8.2%) |
| 2 or 3 Rooms | 0 (0.0%) | 72 (12.9%) |
| 4 or 5 Rooms | 356 (31.8%) | 362 (64.8%) |
| 6 or 7 Rooms | 504 (45.0%) | 62 (11.1%) |
| 8 or more Rooms | 261 (23.3%) | 17 (3.0%) |
| Total | 1,121 (100.0%) | 559 (100.0%) |
Housing Structure by Heating Type in Fort Gibson
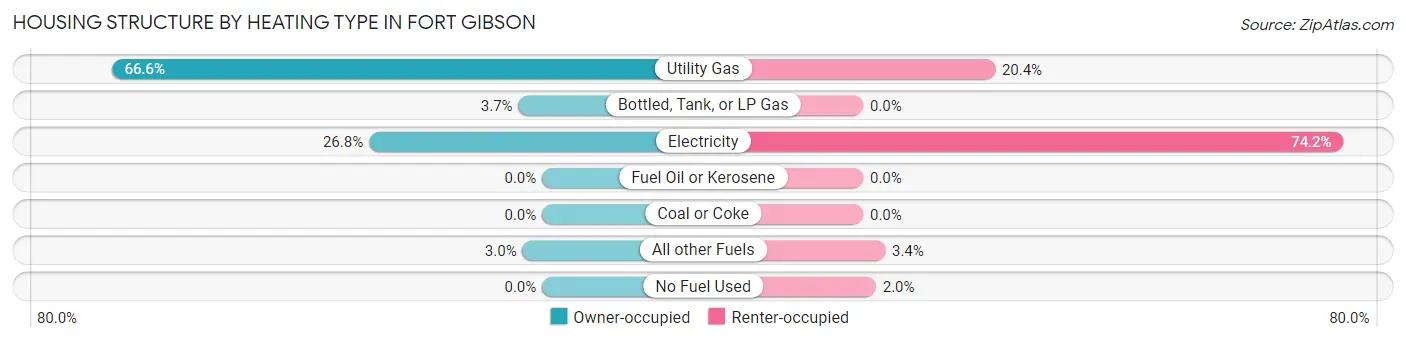
| Heating Type | Owner-occupied | Renter-occupied |
| Utility Gas | 746 (66.5%) | 114 (20.4%) |
| Bottled, Tank, or LP Gas | 41 (3.7%) | 0 (0.0%) |
| Electricity | 300 (26.8%) | 415 (74.2%) |
| Fuel Oil or Kerosene | 0 (0.0%) | 0 (0.0%) |
| Coal or Coke | 0 (0.0%) | 0 (0.0%) |
| All other Fuels | 34 (3.0%) | 19 (3.4%) |
| No Fuel Used | 0 (0.0%) | 11 (2.0%) |
| Total | 1,121 (100.0%) | 559 (100.0%) |
Household Vehicle Usage in Fort Gibson
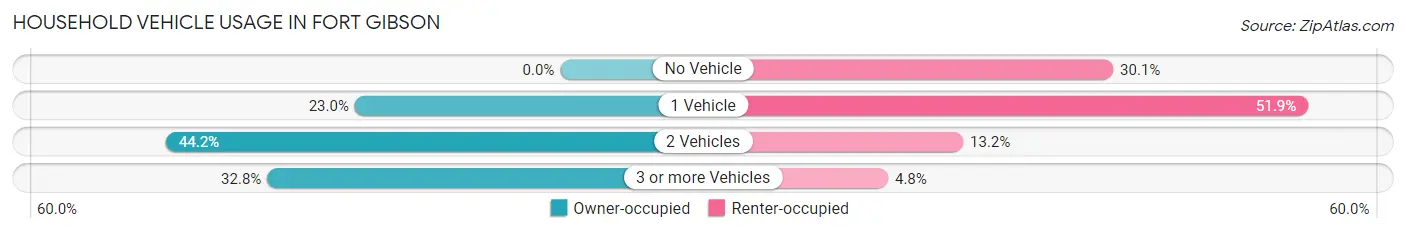
| Vehicles per Household | Owner-occupied | Renter-occupied |
| No Vehicle | 0 (0.0%) | 168 (30.0%) |
| 1 Vehicle | 258 (23.0%) | 290 (51.9%) |
| 2 Vehicles | 495 (44.2%) | 74 (13.2%) |
| 3 or more Vehicles | 368 (32.8%) | 27 (4.8%) |
| Total | 1,121 (100.0%) | 559 (100.0%) |
Real Estate & Mortgages in Fort Gibson
Real Estate and Mortgage Overview in Fort Gibson
| Characteristic | Without Mortgage | With Mortgage |
| Housing Units | 309 | 812 |
| Median Property Value | $180,300 | $147,600 |
| Median Household Income | $66,950 | $120 |
| Monthly Housing Costs | $448 | $17 |
| Real Estate Taxes | $1,143 | $53 |
Property Value by Mortgage Status in Fort Gibson
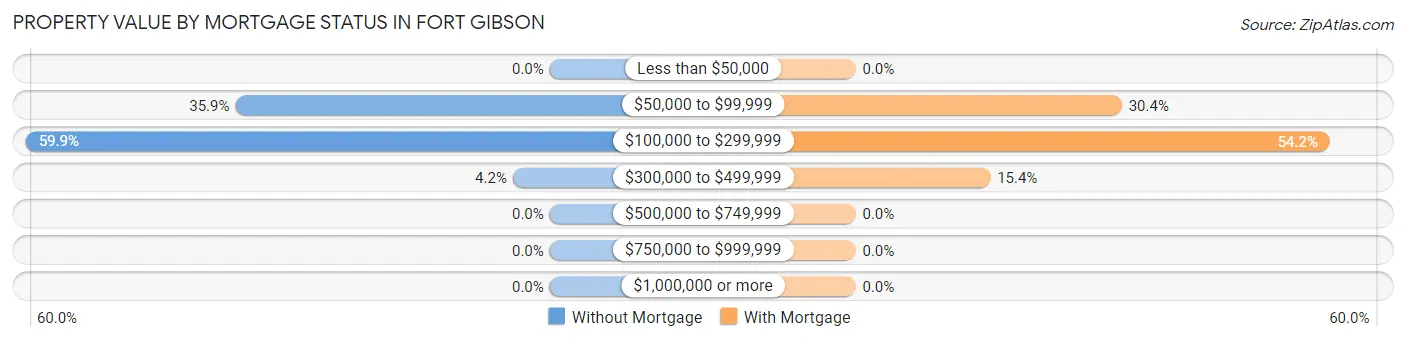
| Property Value | Without Mortgage | With Mortgage |
| Less than $50,000 | 0 (0.0%) | 0 (0.0%) |
| $50,000 to $99,999 | 111 (35.9%) | 247 (30.4%) |
| $100,000 to $299,999 | 185 (59.9%) | 440 (54.2%) |
| $300,000 to $499,999 | 13 (4.2%) | 125 (15.4%) |
| $500,000 to $749,999 | 0 (0.0%) | 0 (0.0%) |
| $750,000 to $999,999 | 0 (0.0%) | 0 (0.0%) |
| $1,000,000 or more | 0 (0.0%) | 0 (0.0%) |
| Total | 309 (100.0%) | 812 (100.0%) |
Household Income by Mortgage Status in Fort Gibson
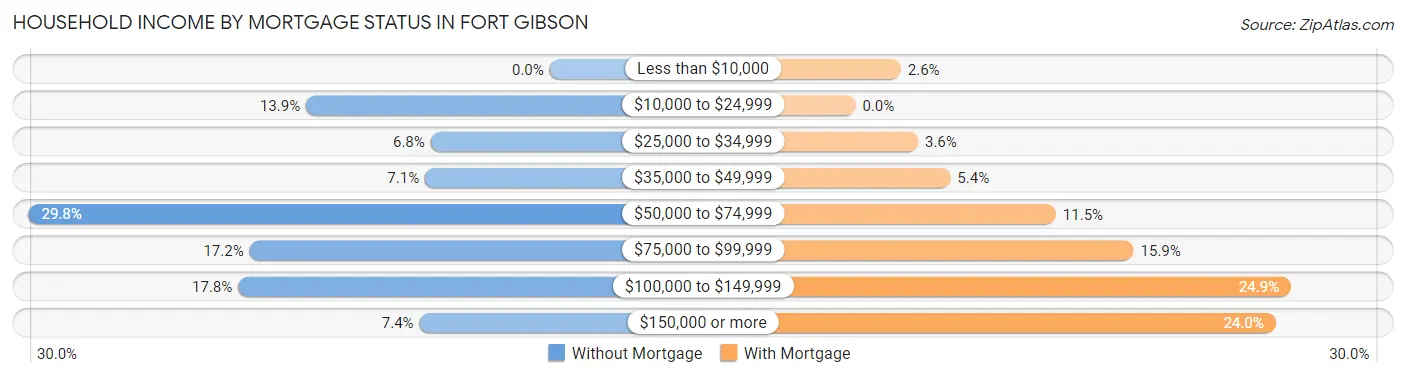
| Household Income | Without Mortgage | With Mortgage |
| Less than $10,000 | 0 (0.0%) | 21 (2.6%) |
| $10,000 to $24,999 | 43 (13.9%) | 0 (0.0%) |
| $25,000 to $34,999 | 21 (6.8%) | 29 (3.6%) |
| $35,000 to $49,999 | 22 (7.1%) | 44 (5.4%) |
| $50,000 to $74,999 | 92 (29.8%) | 93 (11.5%) |
| $75,000 to $99,999 | 53 (17.2%) | 129 (15.9%) |
| $100,000 to $149,999 | 55 (17.8%) | 202 (24.9%) |
| $150,000 or more | 23 (7.4%) | 195 (24.0%) |
| Total | 309 (100.0%) | 812 (100.0%) |
Property Value to Household Income Ratio in Fort Gibson
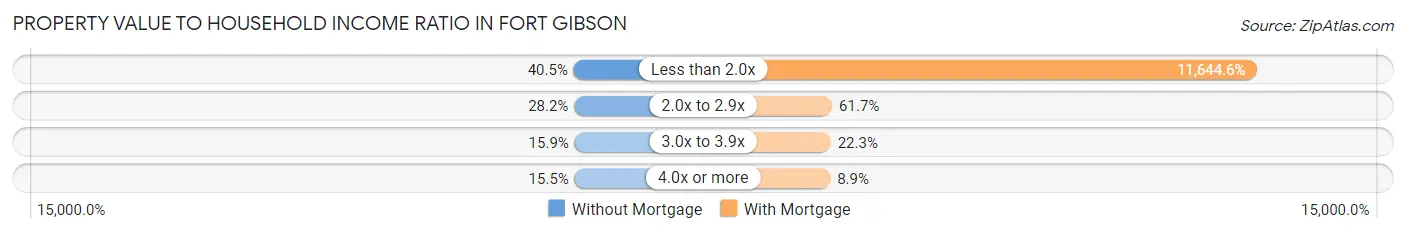
| Value-to-Income Ratio | Without Mortgage | With Mortgage |
| Less than 2.0x | 125 (40.5%) | 94,554 (11,644.6%) |
| 2.0x to 2.9x | 87 (28.2%) | 501 (61.7%) |
| 3.0x to 3.9x | 49 (15.9%) | 181 (22.3%) |
| 4.0x or more | 48 (15.5%) | 72 (8.9%) |
| Total | 309 (100.0%) | 812 (100.0%) |
Real Estate Taxes by Mortgage Status in Fort Gibson
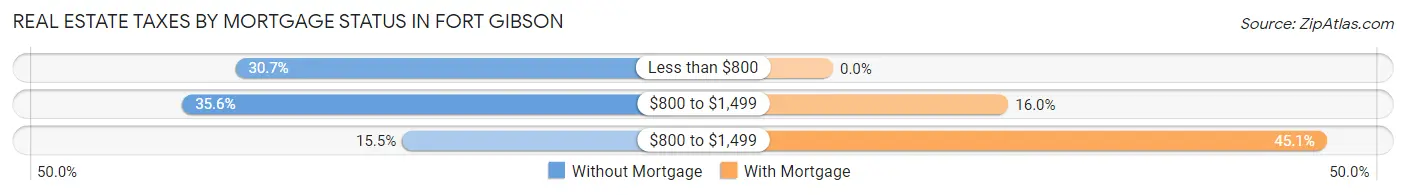
| Property Taxes | Without Mortgage | With Mortgage |
| Less than $800 | 95 (30.7%) | 0 (0.0%) |
| $800 to $1,499 | 110 (35.6%) | 130 (16.0%) |
| $800 to $1,499 | 48 (15.5%) | 366 (45.1%) |
| Total | 309 (100.0%) | 812 (100.0%) |
Health & Disability in Fort Gibson
Health Insurance Coverage by Age in Fort Gibson
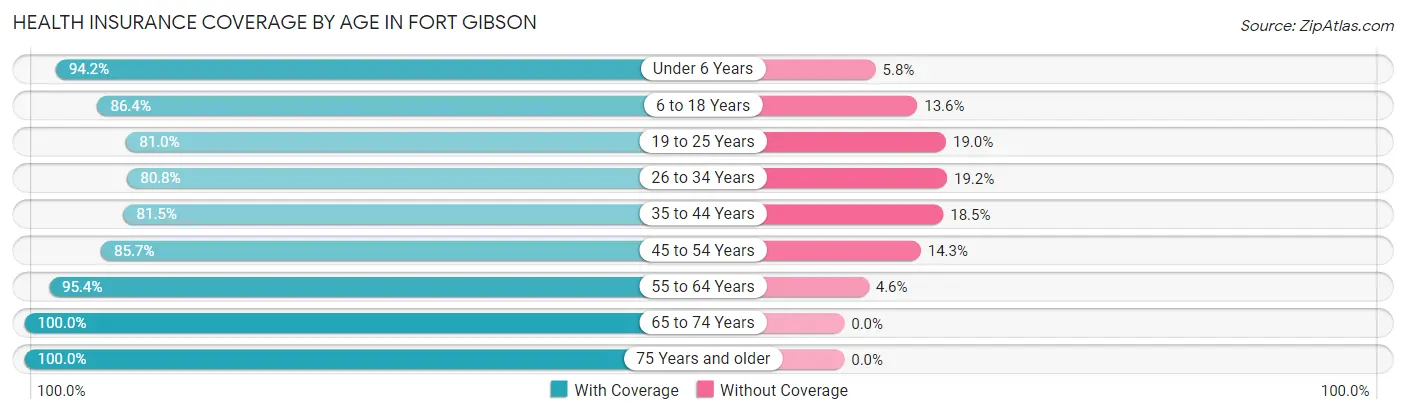
| Age Bracket | With Coverage | Without Coverage |
| Under 6 Years | 258 (94.2%) | 16 (5.8%) |
| 6 to 18 Years | 584 (86.4%) | 92 (13.6%) |
| 19 to 25 Years | 286 (81.0%) | 67 (19.0%) |
| 26 to 34 Years | 367 (80.8%) | 87 (19.2%) |
| 35 to 44 Years | 433 (81.5%) | 98 (18.5%) |
| 45 to 54 Years | 415 (85.7%) | 69 (14.3%) |
| 55 to 64 Years | 418 (95.4%) | 20 (4.6%) |
| 65 to 74 Years | 373 (100.0%) | 0 (0.0%) |
| 75 Years and older | 171 (100.0%) | 0 (0.0%) |
| Total | 3,305 (88.0%) | 449 (12.0%) |
Health Insurance Coverage by Citizenship Status in Fort Gibson
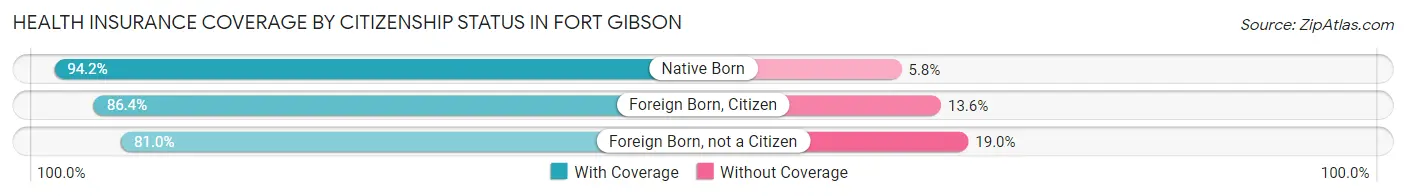
| Citizenship Status | With Coverage | Without Coverage |
| Native Born | 258 (94.2%) | 16 (5.8%) |
| Foreign Born, Citizen | 584 (86.4%) | 92 (13.6%) |
| Foreign Born, not a Citizen | 286 (81.0%) | 67 (19.0%) |
Health Insurance Coverage by Household Income in Fort Gibson
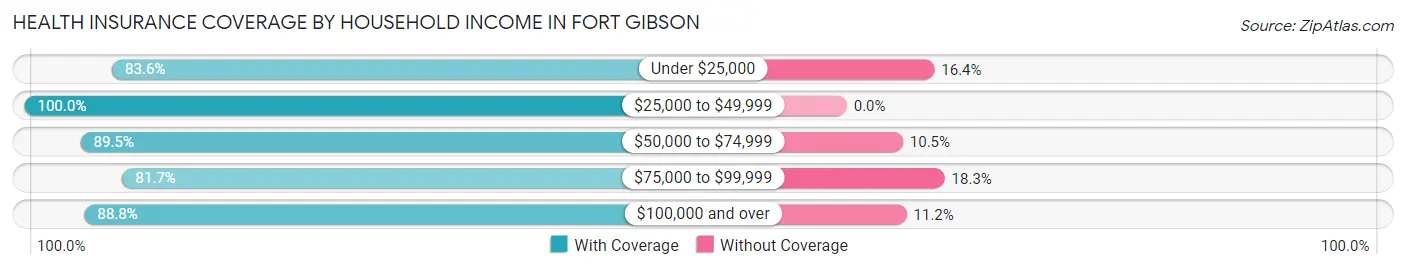
| Household Income | With Coverage | Without Coverage |
| Under $25,000 | 535 (83.6%) | 105 (16.4%) |
| $25,000 to $49,999 | 433 (100.0%) | 0 (0.0%) |
| $50,000 to $74,999 | 537 (89.5%) | 63 (10.5%) |
| $75,000 to $99,999 | 548 (81.7%) | 123 (18.3%) |
| $100,000 and over | 1,252 (88.8%) | 158 (11.2%) |
Public vs Private Health Insurance Coverage by Age in Fort Gibson
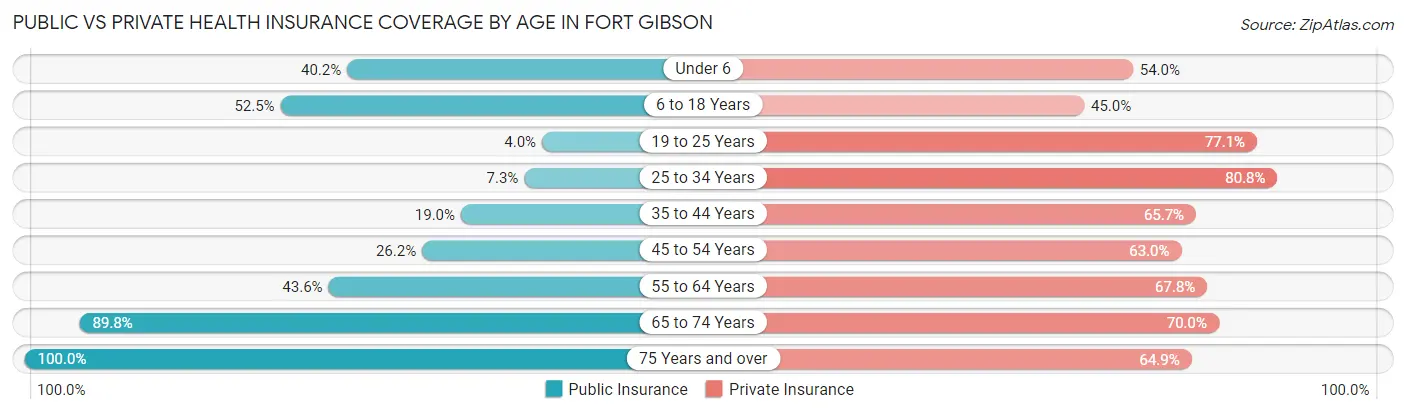
| Age Bracket | Public Insurance | Private Insurance |
| Under 6 | 110 (40.2%) | 148 (54.0%) |
| 6 to 18 Years | 355 (52.5%) | 304 (45.0%) |
| 19 to 25 Years | 14 (4.0%) | 272 (77.0%) |
| 25 to 34 Years | 33 (7.3%) | 367 (80.8%) |
| 35 to 44 Years | 101 (19.0%) | 349 (65.7%) |
| 45 to 54 Years | 127 (26.2%) | 305 (63.0%) |
| 55 to 64 Years | 191 (43.6%) | 297 (67.8%) |
| 65 to 74 Years | 335 (89.8%) | 261 (70.0%) |
| 75 Years and over | 171 (100.0%) | 111 (64.9%) |
| Total | 1,437 (38.3%) | 2,414 (64.3%) |
Disability Status by Sex by Age in Fort Gibson
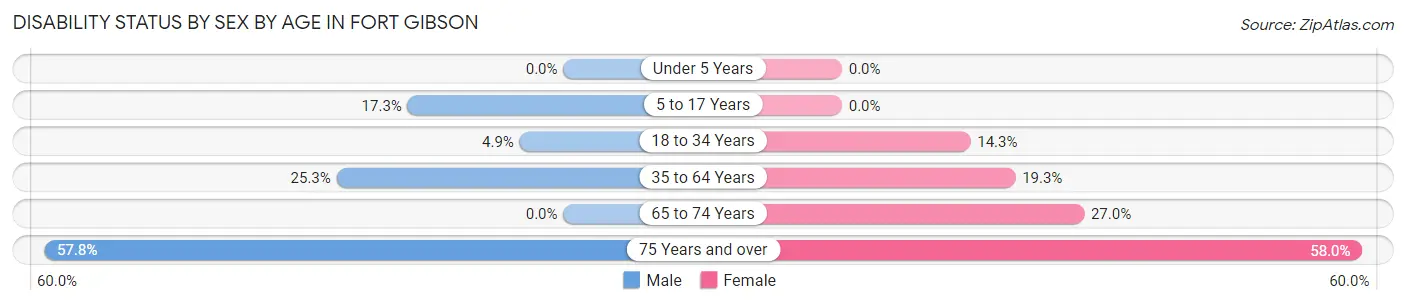
| Age Bracket | Male | Female |
| Under 5 Years | 0 (0.0%) | 0 (0.0%) |
| 5 to 17 Years | 64 (17.3%) | 0 (0.0%) |
| 18 to 34 Years | 18 (4.9%) | 82 (14.3%) |
| 35 to 64 Years | 176 (25.3%) | 146 (19.3%) |
| 65 to 74 Years | 0 (0.0%) | 72 (27.0%) |
| 75 Years and over | 59 (57.8%) | 40 (58.0%) |
Disability Class by Sex by Age in Fort Gibson
Disability Class: Hearing Difficulty
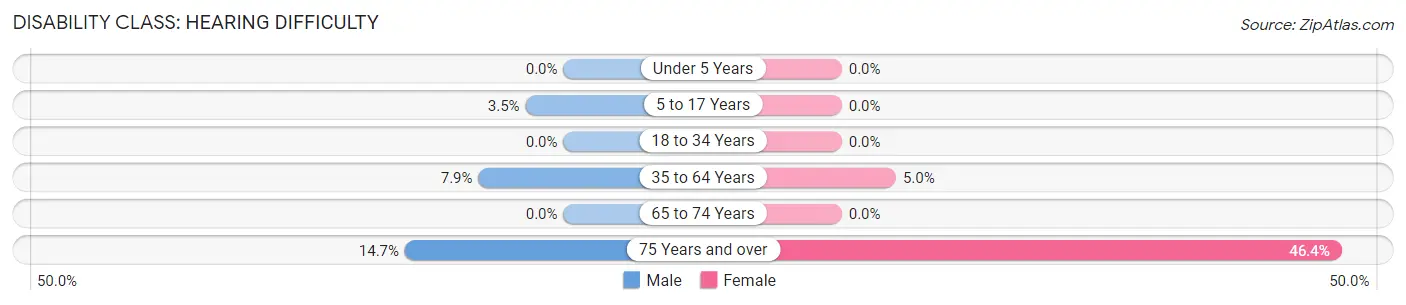
| Age Bracket | Male | Female |
| Under 5 Years | 0 (0.0%) | 0 (0.0%) |
| 5 to 17 Years | 13 (3.5%) | 0 (0.0%) |
| 18 to 34 Years | 0 (0.0%) | 0 (0.0%) |
| 35 to 64 Years | 55 (7.9%) | 38 (5.0%) |
| 65 to 74 Years | 0 (0.0%) | 0 (0.0%) |
| 75 Years and over | 15 (14.7%) | 32 (46.4%) |
Disability Class: Vision Difficulty
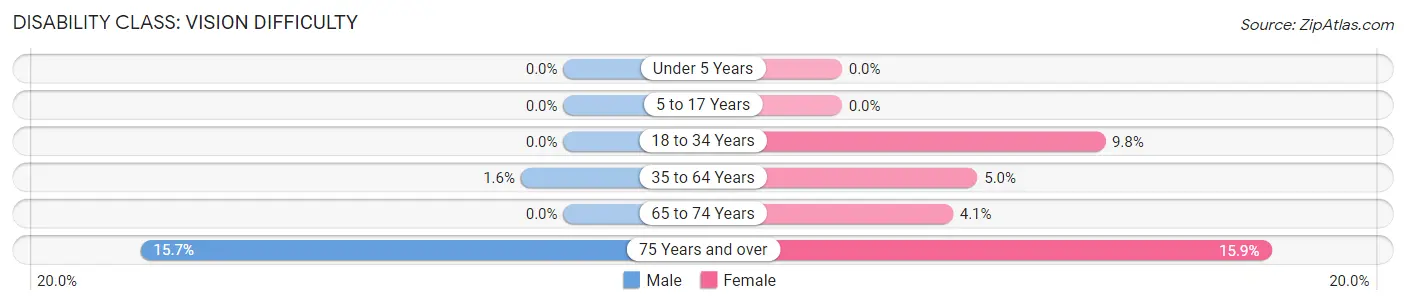
| Age Bracket | Male | Female |
| Under 5 Years | 0 (0.0%) | 0 (0.0%) |
| 5 to 17 Years | 0 (0.0%) | 0 (0.0%) |
| 18 to 34 Years | 0 (0.0%) | 56 (9.8%) |
| 35 to 64 Years | 11 (1.6%) | 38 (5.0%) |
| 65 to 74 Years | 0 (0.0%) | 11 (4.1%) |
| 75 Years and over | 16 (15.7%) | 11 (15.9%) |
Disability Class: Cognitive Difficulty

| Age Bracket | Male | Female |
| 5 to 17 Years | 51 (13.8%) | 0 (0.0%) |
| 18 to 34 Years | 18 (4.9%) | 26 (4.5%) |
| 35 to 64 Years | 84 (12.0%) | 62 (8.2%) |
| 65 to 74 Years | 0 (0.0%) | 22 (8.2%) |
| 75 Years and over | 43 (42.2%) | 12 (17.4%) |
Disability Class: Ambulatory Difficulty
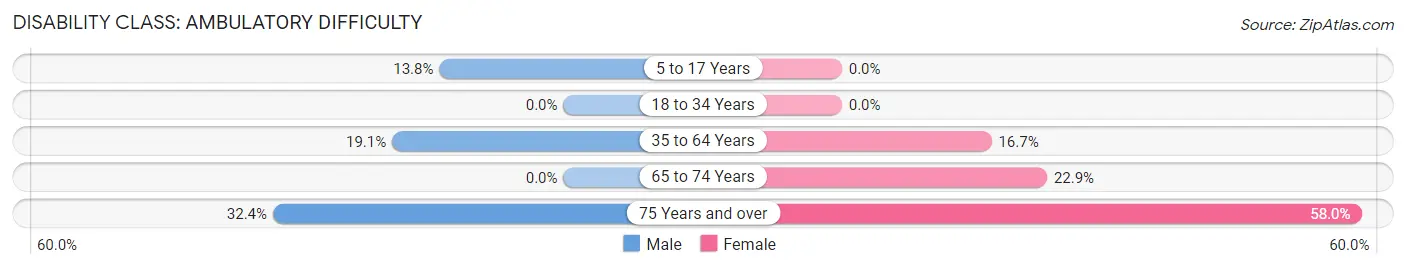
| Age Bracket | Male | Female |
| 5 to 17 Years | 51 (13.8%) | 0 (0.0%) |
| 18 to 34 Years | 0 (0.0%) | 0 (0.0%) |
| 35 to 64 Years | 133 (19.1%) | 126 (16.7%) |
| 65 to 74 Years | 0 (0.0%) | 61 (22.9%) |
| 75 Years and over | 33 (32.4%) | 40 (58.0%) |
Disability Class: Self-Care Difficulty
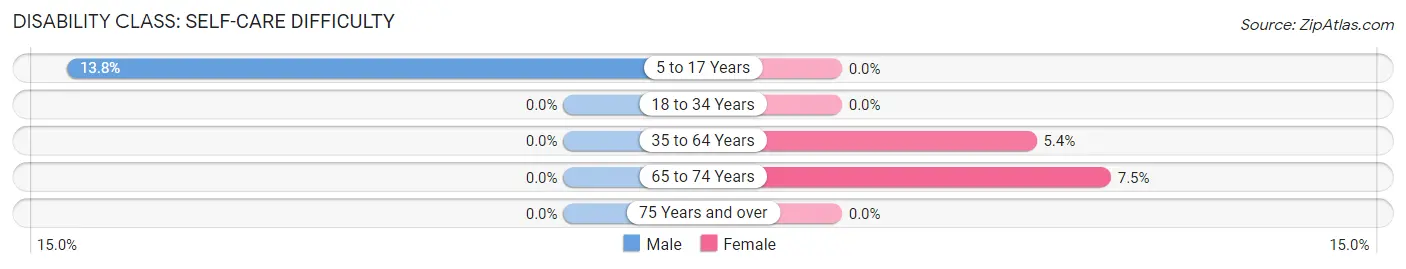
| Age Bracket | Male | Female |
| 5 to 17 Years | 51 (13.8%) | 0 (0.0%) |
| 18 to 34 Years | 0 (0.0%) | 0 (0.0%) |
| 35 to 64 Years | 0 (0.0%) | 41 (5.4%) |
| 65 to 74 Years | 0 (0.0%) | 20 (7.5%) |
| 75 Years and over | 0 (0.0%) | 0 (0.0%) |
Technology Access in Fort Gibson
Computing Device Access in Fort Gibson
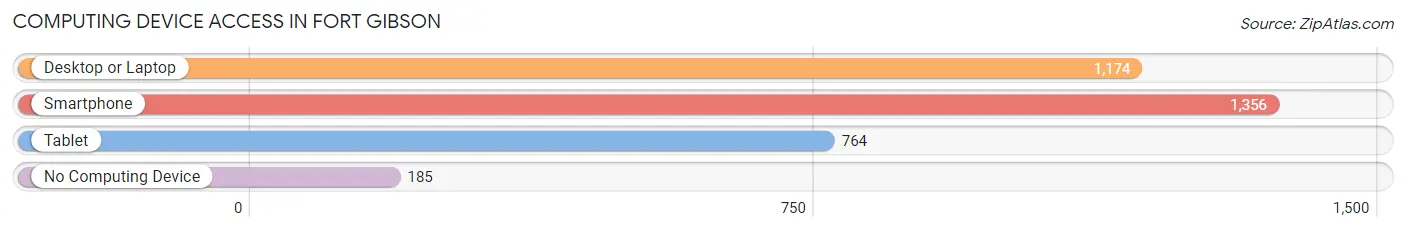
| Device Type | # Households | % Households |
| Desktop or Laptop | 1,174 | 69.9% |
| Smartphone | 1,356 | 80.7% |
| Tablet | 764 | 45.5% |
| No Computing Device | 185 | 11.0% |
| Total | 1,680 | 100.0% |
Internet Access in Fort Gibson
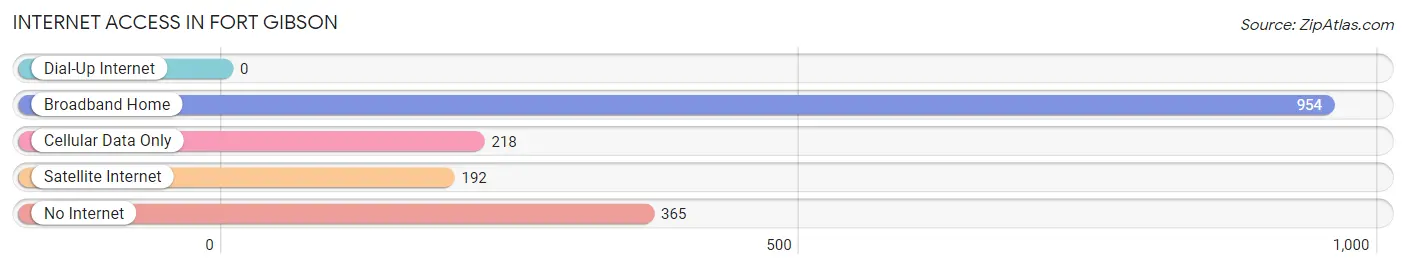
| Internet Type | # Households | % Households |
| Dial-Up Internet | 0 | 0.0% |
| Broadband Home | 954 | 56.8% |
| Cellular Data Only | 218 | 13.0% |
| Satellite Internet | 192 | 11.4% |
| No Internet | 365 | 21.7% |
| Total | 1,680 | 100.0% |
Fort Gibson Summary
Geography
Fort Gibson is a town located in Muskogee County, Oklahoma. It is situated on the Grand River, near the Arkansas border. The town is located in the foothills of the Ozark Mountains, and is surrounded by rolling hills and wooded areas. The town is located approximately 25 miles southeast of Muskogee, and is part of the Muskogee, Oklahoma Metropolitan Statistical Area.
History
Fort Gibson was established in 1824 as a military post by the United States Army. The fort was built to protect the Cherokee Nation from hostile Native American tribes, and to provide a base of operations for the U.S. Army in the area. The fort was named after General George Gibson, who was the commander of the U.S. Army in the area at the time.
The fort was abandoned in 1857, and the town of Fort Gibson was established in 1872. The town was incorporated in 1875, and the first mayor was elected in 1876.
The town grew rapidly in the late 19th century, and by the early 20th century, it had become a major trading center for the surrounding area. The town was also home to a number of businesses, including a cotton gin, a flour mill, and a lumber mill.
Economy
The economy of Fort Gibson is largely based on agriculture and tourism. The town is home to a number of farms, which produce a variety of crops, including corn, soybeans, wheat, and hay. The town is also home to a number of tourist attractions, including the Fort Gibson Historic Site, the Fort Gibson National Cemetery, and the Fort Gibson Lake.
The town is also home to a number of businesses, including a number of restaurants, retail stores, and service providers. The town is also home to a number of manufacturing companies, including a furniture manufacturer, a plastics manufacturer, and a metal fabrication company.
Demographics
As of the 2010 census, the population of Fort Gibson was 4,154. The racial makeup of the town was 79.2% White, 15.2% Native American, 0.7% Asian, 0.2% African American, 0.1% Pacific Islander, and 4.7% from other races. The median household income was $31,944, and the median family income was $37,813.
Conclusion
Fort Gibson is a small town located in Muskogee County, Oklahoma. It was established in 1824 as a military post, and was later incorporated in 1875. The town is largely based on agriculture and tourism, and is home to a number of businesses, including a number of restaurants, retail stores, and service providers. The population of Fort Gibson was 4,154 as of the 2010 census, and the median household income was $31,944.
Common Questions
What is Per Capita Income in Fort Gibson?
Per Capita income in Fort Gibson is $33,736.
What is the Median Family Income in Fort Gibson?
Median Family Income in Fort Gibson is $96,895.
What is the Median Household income in Fort Gibson?
Median Household Income in Fort Gibson is $67,813.
What is Income or Wage Gap in Fort Gibson?
Income or Wage Gap in Fort Gibson is 39.3%.
Women in Fort Gibson earn 60.7 cents for every dollar earned by a man.
What is Family Income Deficit in Fort Gibson?
Family Income Deficit in Fort Gibson is $10,837.
Families that are below poverty line in Fort Gibson earn $10,837 less on average than the poverty threshold level.
What is Inequality or Gini Index in Fort Gibson?
Inequality or Gini Index in Fort Gibson is 0.45.
What is the Total Population of Fort Gibson?
Total Population of Fort Gibson is 3,810.
What is the Total Male Population of Fort Gibson?
Total Male Population of Fort Gibson is 1,797.
What is the Total Female Population of Fort Gibson?
Total Female Population of Fort Gibson is 2,013.
What is the Ratio of Males per 100 Females in Fort Gibson?
There are 89.27 Males per 100 Females in Fort Gibson.
What is the Ratio of Females per 100 Males in Fort Gibson?
There are 112.02 Females per 100 Males in Fort Gibson.
What is the Median Population Age in Fort Gibson?
Median Population Age in Fort Gibson is 38.3 Years.
What is the Average Family Size in Fort Gibson
Average Family Size in Fort Gibson is 3.0 People.
What is the Average Household Size in Fort Gibson
Average Household Size in Fort Gibson is 2.2 People.
How Large is the Labor Force in Fort Gibson?
There are 1,905 People in the Labor Forcein in Fort Gibson.
What is the Percentage of People in the Labor Force in Fort Gibson?
62.1% of People are in the Labor Force in Fort Gibson.
What is the Unemployment Rate in Fort Gibson?
Unemployment Rate in Fort Gibson is 2.8%.