St Louis, OK Map & Demographics
St Louis Map
St Louis Overview
$31,728
PER CAPITA INCOME
$65,000
AVG FAMILY INCOME
$44,167
AVG HOUSEHOLD INCOME
69.2%
WAGE / INCOME GAP [ % ]
30.8¢/ $1
WAGE / INCOME GAP [ $ ]
$7,620
FAMILY INCOME DEFICIT
0.47
INEQUALITY / GINI INDEX
85
TOTAL POPULATION
41
MALE POPULATION
44
FEMALE POPULATION
93.18
MALES / 100 FEMALES
107.32
FEMALES / 100 MALES
51.5
MEDIAN AGE
2.6
AVG FAMILY SIZE
2.0
AVG HOUSEHOLD SIZE
44
LABOR FORCE [ PEOPLE ]
57.1%
PERCENT IN LABOR FORCE
11.4%
UNEMPLOYMENT RATE
Income in St Louis
Income Overview in St Louis
Per Capita Income in St Louis is $31,728, while median incomes of families and households are $65,000 and $44,167 respectively.
| Characteristic | Number | Measure |
| Per Capita Income | 85 | $31,728 |
| Median Family Income | 26 | $65,000 |
| Mean Family Income | 26 | $82,123 |
| Median Household Income | 42 | $44,167 |
| Mean Household Income | 42 | $63,255 |
| Income Deficit | 26 | $7,620 |
| Wage / Income Gap (%) | 85 | 69.16% |
| Wage / Income Gap ($) | 85 | 30.84¢ per $1 |
| Gini / Inequality Index | 85 | 0.47 |
Earnings by Sex in St Louis
Average Earnings in St Louis are $32,500, $66,875 for men and $20,625 for women, a difference of 69.2%.
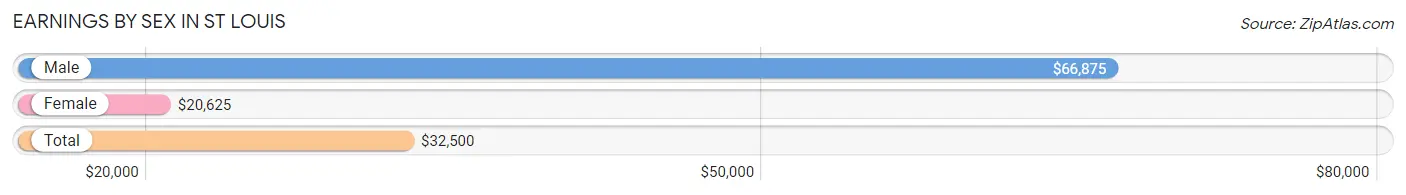
| Sex | Number | Average Earnings |
| Male | 17 (40.5%) | $66,875 |
| Female | 25 (59.5%) | $20,625 |
| Total | 42 (100.0%) | $32,500 |
Earnings by Sex by Income Bracket in St Louis
The most common earnings brackets in St Louis are $75,000 to $99,999 for men (6 | 35.3%) and $7,500 to $9,999 for women (6 | 24.0%).
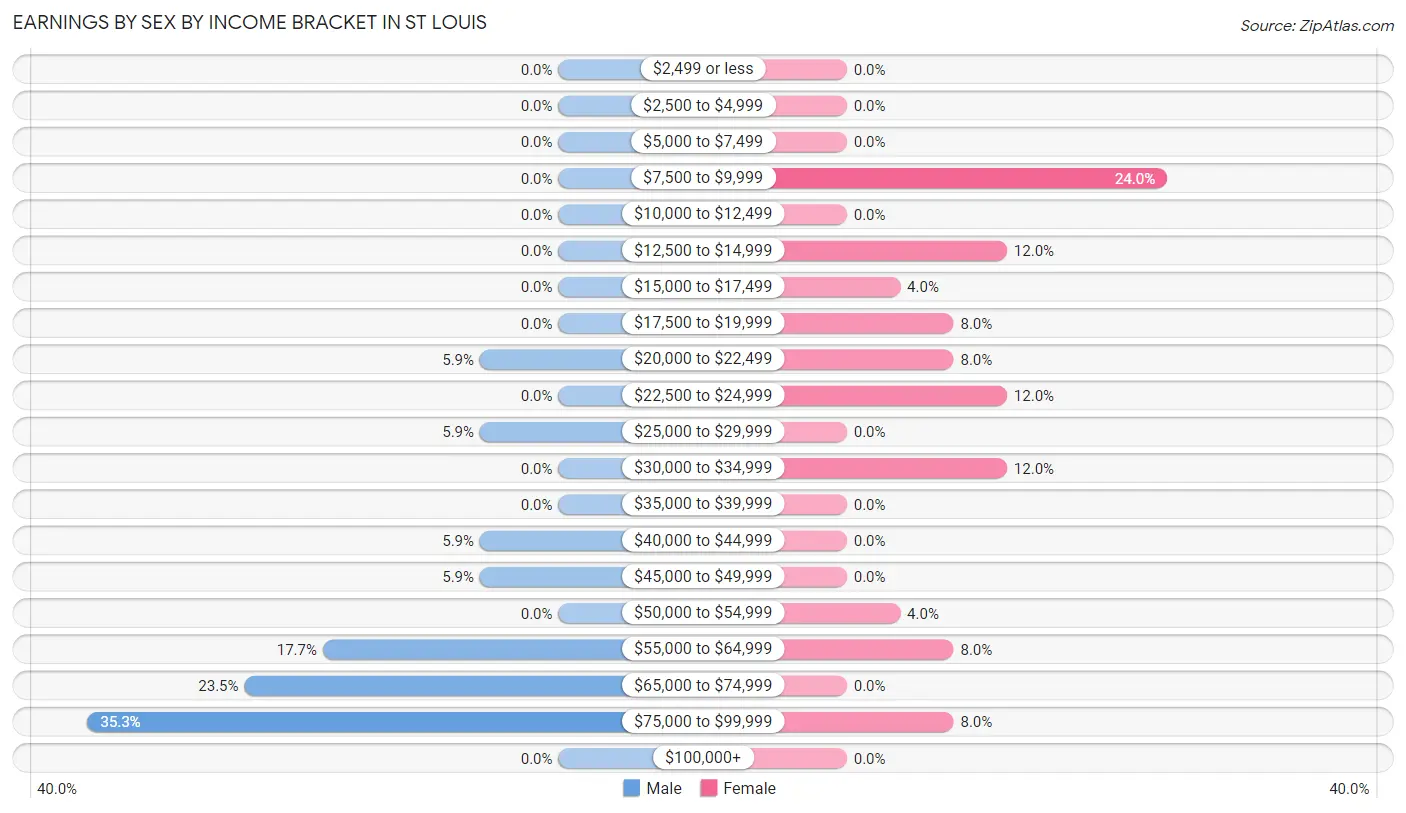
| Income | Male | Female |
| $2,499 or less | 0 (0.0%) | 0 (0.0%) |
| $2,500 to $4,999 | 0 (0.0%) | 0 (0.0%) |
| $5,000 to $7,499 | 0 (0.0%) | 0 (0.0%) |
| $7,500 to $9,999 | 0 (0.0%) | 6 (24.0%) |
| $10,000 to $12,499 | 0 (0.0%) | 0 (0.0%) |
| $12,500 to $14,999 | 0 (0.0%) | 3 (12.0%) |
| $15,000 to $17,499 | 0 (0.0%) | 1 (4.0%) |
| $17,500 to $19,999 | 0 (0.0%) | 2 (8.0%) |
| $20,000 to $22,499 | 1 (5.9%) | 2 (8.0%) |
| $22,500 to $24,999 | 0 (0.0%) | 3 (12.0%) |
| $25,000 to $29,999 | 1 (5.9%) | 0 (0.0%) |
| $30,000 to $34,999 | 0 (0.0%) | 3 (12.0%) |
| $35,000 to $39,999 | 0 (0.0%) | 0 (0.0%) |
| $40,000 to $44,999 | 1 (5.9%) | 0 (0.0%) |
| $45,000 to $49,999 | 1 (5.9%) | 0 (0.0%) |
| $50,000 to $54,999 | 0 (0.0%) | 1 (4.0%) |
| $55,000 to $64,999 | 3 (17.6%) | 2 (8.0%) |
| $65,000 to $74,999 | 4 (23.5%) | 0 (0.0%) |
| $75,000 to $99,999 | 6 (35.3%) | 2 (8.0%) |
| $100,000+ | 0 (0.0%) | 0 (0.0%) |
| Total | 17 (100.0%) | 25 (100.0%) |
Earnings by Sex by Educational Attainment in St Louis
Average earnings in St Louis are $66,875 for men and $22,917 for women, a difference of 65.7%. Men with an educational attainment of college or associate's degree enjoy the highest average annual earnings of $75,250, while those with high school diploma education earn the least with $60,000. Women with an educational attainment of college or associate's degree earn the most with the average annual earnings of $42,500, while those with high school diploma education have the smallest earnings of $20,625.
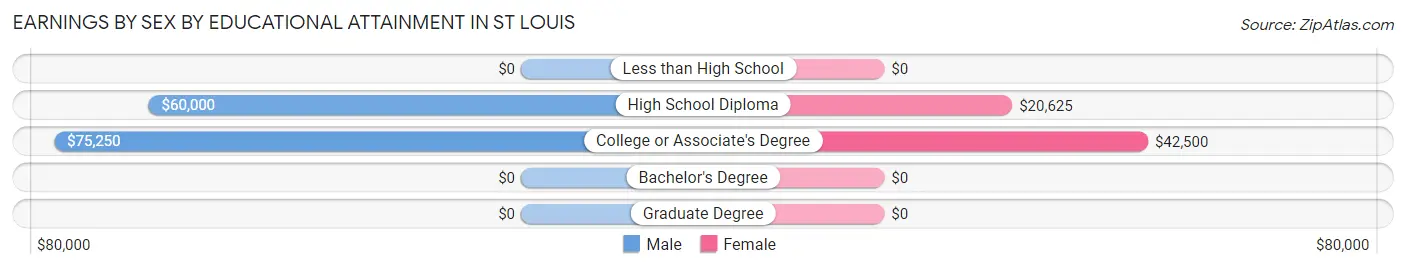
| Educational Attainment | Male Income | Female Income |
| Less than High School | - | - |
| High School Diploma | $60,000 | $20,625 |
| College or Associate's Degree | $75,250 | $42,500 |
| Bachelor's Degree | - | - |
| Graduate Degree | - | - |
| Total | $66,875 | $22,917 |
Family Income in St Louis
Family Income Brackets in St Louis
According to the St Louis family income data, there are 5 families falling into the $150,000 to $199,999 income range, which is the most common income bracket and makes up 19.2% of all families.
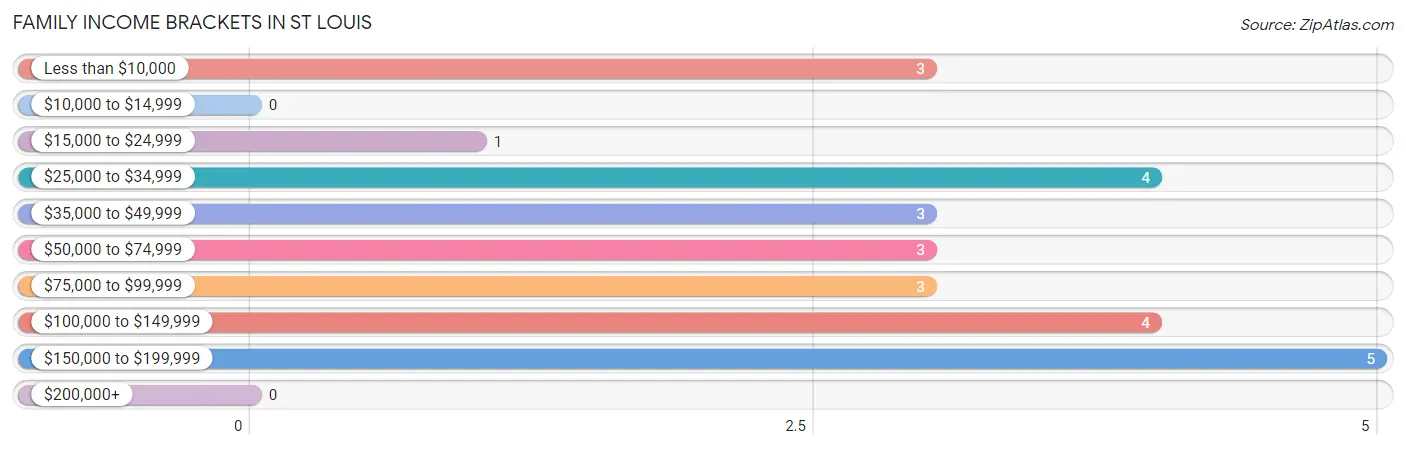
| Income Bracket | # Families | % Families |
| Less than $10,000 | 3 | 11.5% |
| $10,000 to $14,999 | 0 | 0.0% |
| $15,000 to $24,999 | 1 | 3.8% |
| $25,000 to $34,999 | 4 | 15.4% |
| $35,000 to $49,999 | 3 | 11.5% |
| $50,000 to $74,999 | 3 | 11.5% |
| $75,000 to $99,999 | 3 | 11.5% |
| $100,000 to $149,999 | 4 | 15.4% |
| $150,000 to $199,999 | 5 | 19.2% |
| $200,000+ | 0 | 0.0% |
Family Income by Famaliy Size in St Louis
3-person families (3 | 11.5%) account for the highest median family income in St Louis with $118,750 per family, while 3-person families (3 | 11.5%) have the highest median income of $39,583 per family member.
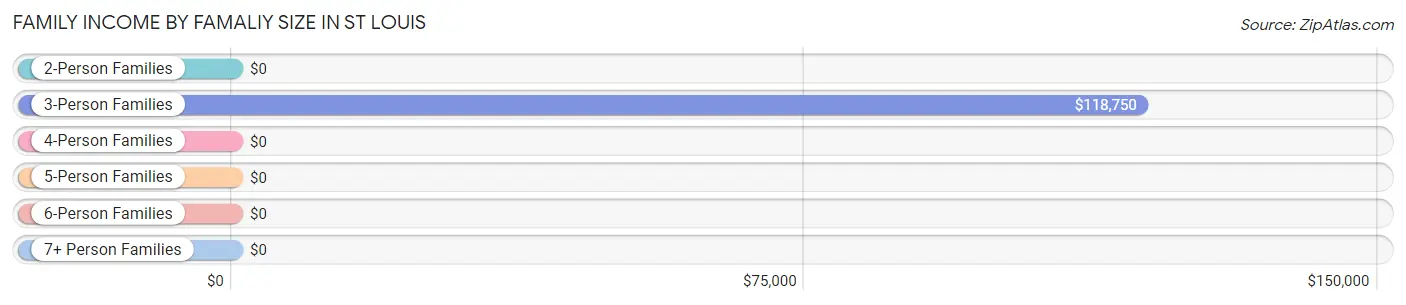
| Income Bracket | # Families | Median Income |
| 2-Person Families | 19 (73.1%) | $0 |
| 3-Person Families | 3 (11.5%) | $118,750 |
| 4-Person Families | 3 (11.5%) | $0 |
| 5-Person Families | 0 (0.0%) | $0 |
| 6-Person Families | 0 (0.0%) | $0 |
| 7+ Person Families | 1 (3.8%) | $0 |
| Total | 26 (100.0%) | $65,000 |
Family Income by Number of Earners in St Louis
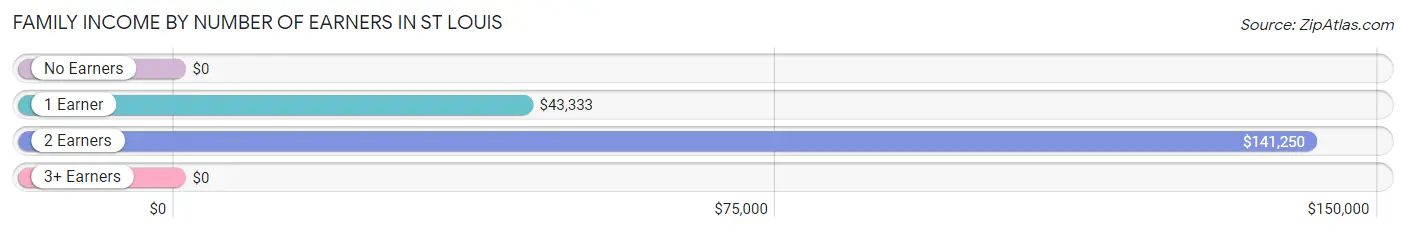
| Number of Earners | # Families | Median Income |
| No Earners | 4 (15.4%) | $0 |
| 1 Earner | 10 (38.5%) | $43,333 |
| 2 Earners | 11 (42.3%) | $141,250 |
| 3+ Earners | 1 (3.8%) | $0 |
| Total | 26 (100.0%) | $65,000 |
Household Income in St Louis
Household Income Brackets in St Louis
With 7 households falling in the category, the less than $10,000 income range is the most frequent in St Louis, accounting for 16.7% of all households.
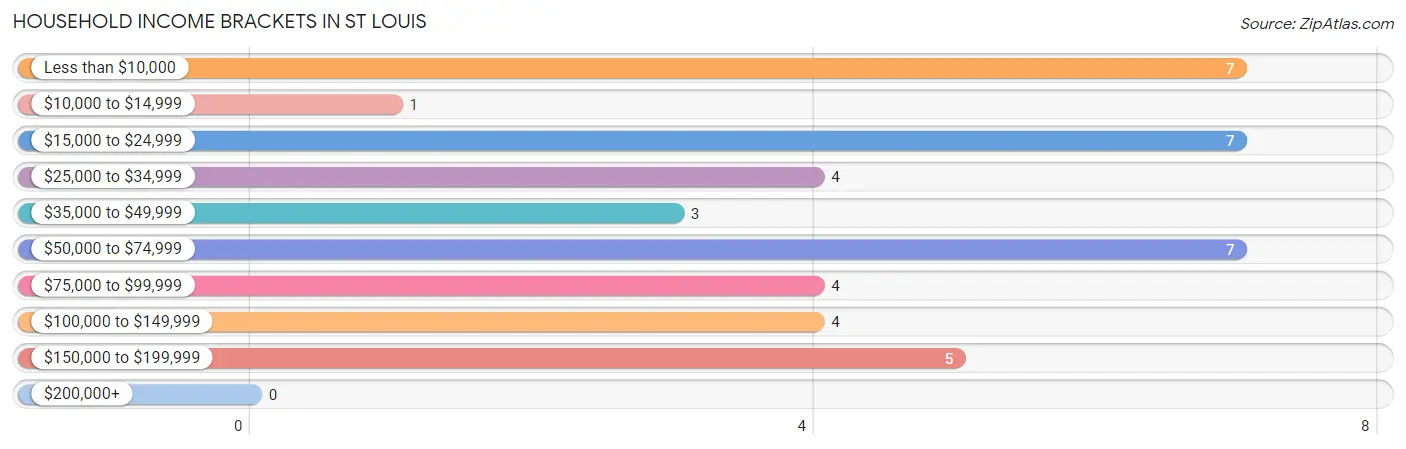
| Income Bracket | # Households | % Households |
| Less than $10,000 | 7 | 16.7% |
| $10,000 to $14,999 | 1 | 2.4% |
| $15,000 to $24,999 | 7 | 16.7% |
| $25,000 to $34,999 | 4 | 9.5% |
| $35,000 to $49,999 | 3 | 7.1% |
| $50,000 to $74,999 | 7 | 16.7% |
| $75,000 to $99,999 | 4 | 9.5% |
| $100,000 to $149,999 | 4 | 9.5% |
| $150,000 to $199,999 | 5 | 11.9% |
| $200,000+ | 0 | 0.0% |
Household Income by Householder Age in St Louis
The median household income in St Louis is $44,167, with the highest median household income of $87,500 found in the 25 to 44 years age bracket for the primary householder. A total of 6 households (14.3%) fall into this category. Meanwhile, the 15 to 24 years age bracket for the primary householder has the lowest median household income of $0, with 3 households (7.1%) in this group.
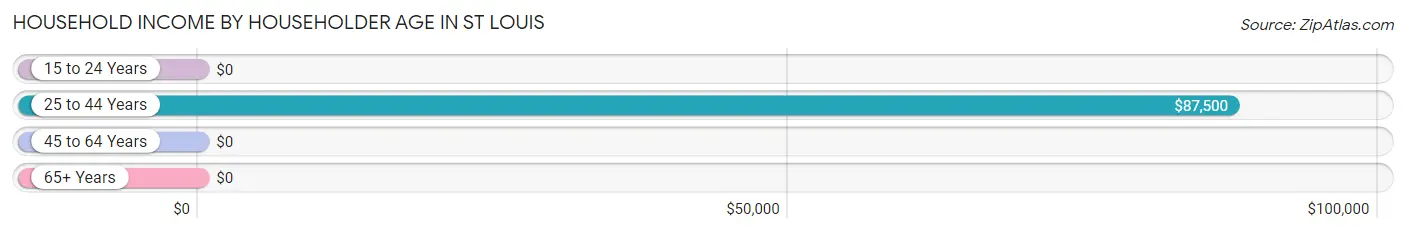
| Income Bracket | # Households | Median Income |
| 15 to 24 Years | 3 (7.1%) | $0 |
| 25 to 44 Years | 6 (14.3%) | $87,500 |
| 45 to 64 Years | 12 (28.6%) | $0 |
| 65+ Years | 21 (50.0%) | $0 |
| Total | 42 (100.0%) | $44,167 |
Poverty in St Louis
Income Below Poverty by Sex and Age in St Louis
With 14.6% poverty level for males and 25.0% for females among the residents of St Louis, 6 to 11 year old males and 12 to 14 year old females are the most vulnerable to poverty, with 1 males (50.0%) and 1 females (50.0%) in their respective age groups living below the poverty level.
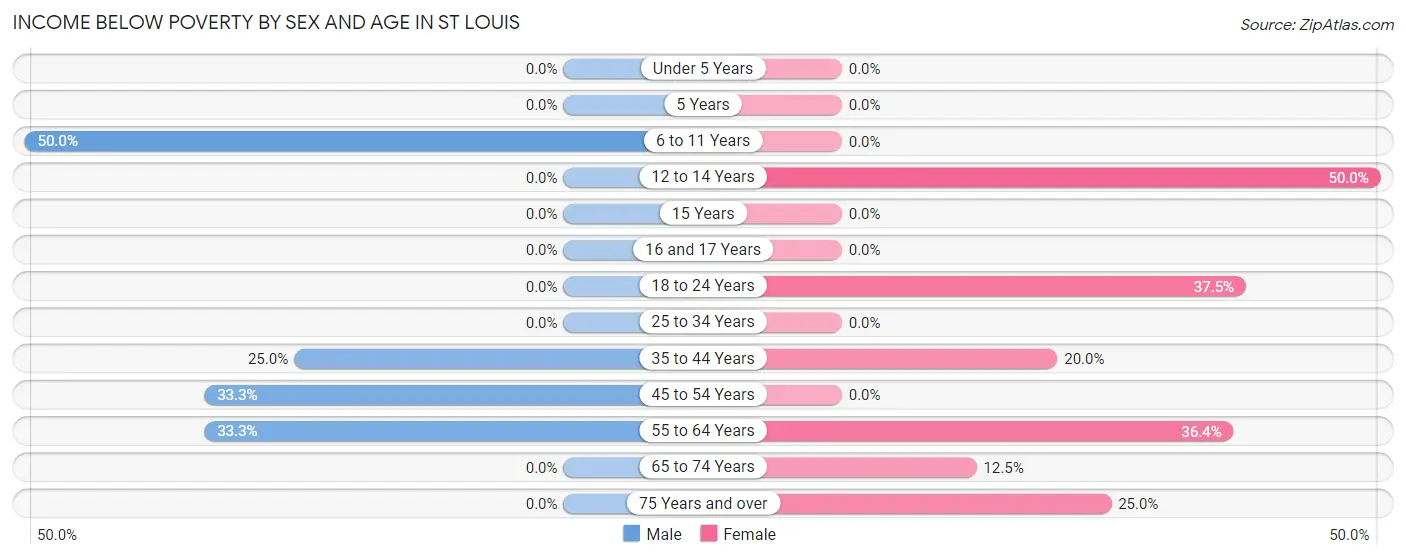
| Age Bracket | Male | Female |
| Under 5 Years | 0 (0.0%) | 0 (0.0%) |
| 5 Years | 0 (0.0%) | 0 (0.0%) |
| 6 to 11 Years | 1 (50.0%) | 0 (0.0%) |
| 12 to 14 Years | 0 (0.0%) | 1 (50.0%) |
| 15 Years | 0 (0.0%) | 0 (0.0%) |
| 16 and 17 Years | 0 (0.0%) | 0 (0.0%) |
| 18 to 24 Years | 0 (0.0%) | 3 (37.5%) |
| 25 to 34 Years | 0 (0.0%) | 0 (0.0%) |
| 35 to 44 Years | 1 (25.0%) | 1 (20.0%) |
| 45 to 54 Years | 3 (33.3%) | 0 (0.0%) |
| 55 to 64 Years | 1 (33.3%) | 4 (36.4%) |
| 65 to 74 Years | 0 (0.0%) | 1 (12.5%) |
| 75 Years and over | 0 (0.0%) | 1 (25.0%) |
| Total | 6 (14.6%) | 11 (25.0%) |
Income Above Poverty by Sex and Age in St Louis
According to the poverty statistics in St Louis, males aged 12 to 14 years and females aged under 5 years are the age groups that are most secure financially, with 100.0% of males and 100.0% of females in these age groups living above the poverty line.
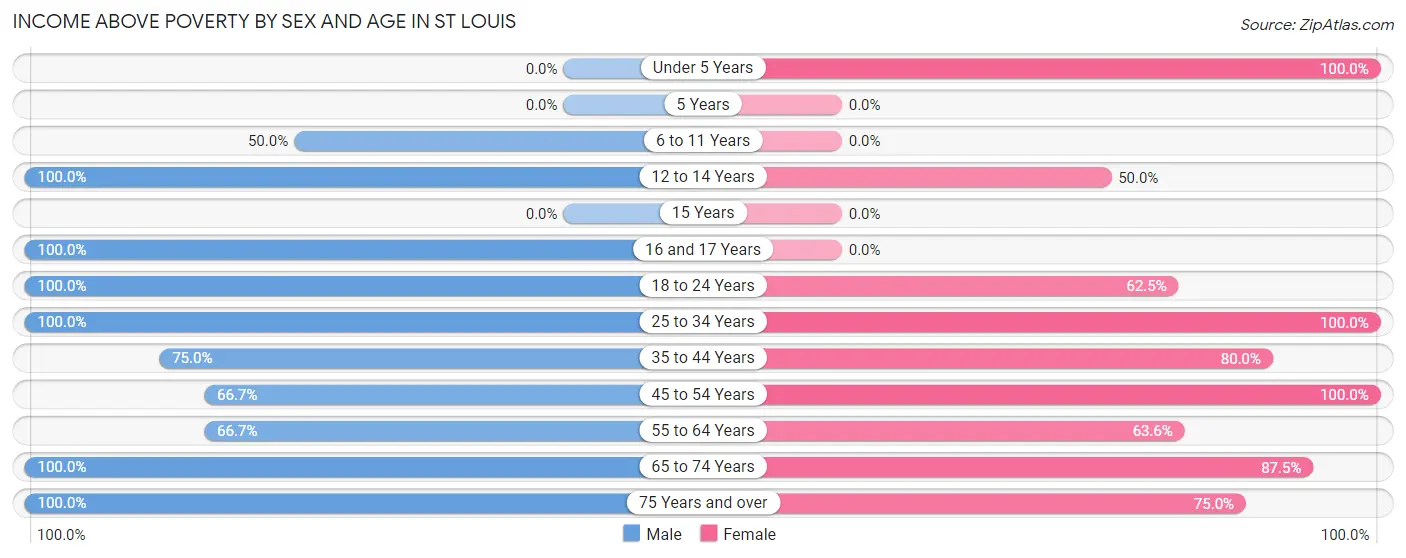
| Age Bracket | Male | Female |
| Under 5 Years | 0 (0.0%) | 2 (100.0%) |
| 5 Years | 0 (0.0%) | 0 (0.0%) |
| 6 to 11 Years | 1 (50.0%) | 0 (0.0%) |
| 12 to 14 Years | 2 (100.0%) | 1 (50.0%) |
| 15 Years | 0 (0.0%) | 0 (0.0%) |
| 16 and 17 Years | 1 (100.0%) | 0 (0.0%) |
| 18 to 24 Years | 2 (100.0%) | 5 (62.5%) |
| 25 to 34 Years | 4 (100.0%) | 3 (100.0%) |
| 35 to 44 Years | 3 (75.0%) | 4 (80.0%) |
| 45 to 54 Years | 6 (66.7%) | 1 (100.0%) |
| 55 to 64 Years | 2 (66.7%) | 7 (63.6%) |
| 65 to 74 Years | 10 (100.0%) | 7 (87.5%) |
| 75 Years and over | 4 (100.0%) | 3 (75.0%) |
| Total | 35 (85.4%) | 33 (75.0%) |
Income Below Poverty Among Married-Couple Families in St Louis
The poverty statistics for married-couple families in St Louis show that 20.0% or 5 of the total 25 families live below the poverty line. Families with 1 or 2 children have the highest poverty rate of 33.3%, comprising of 1 families. On the other hand, families with 3 or 4 children have the lowest poverty rate of 0.0%, which includes 0 families.
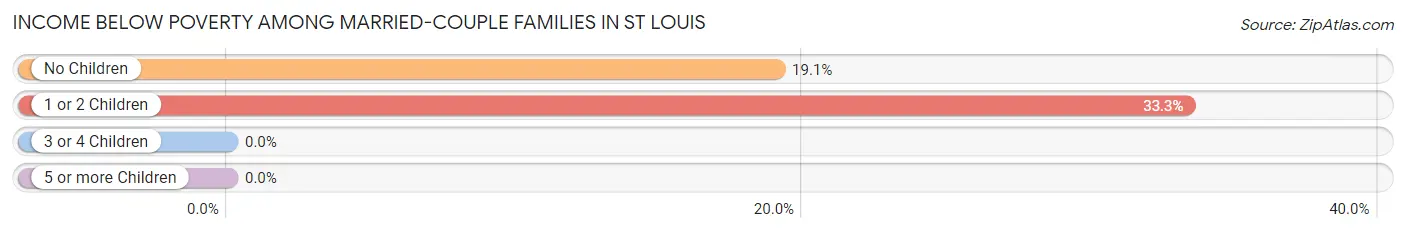
| Children | Above Poverty | Below Poverty |
| No Children | 17 (80.9%) | 4 (19.1%) |
| 1 or 2 Children | 2 (66.7%) | 1 (33.3%) |
| 3 or 4 Children | 1 (100.0%) | 0 (0.0%) |
| 5 or more Children | 0 (0.0%) | 0 (0.0%) |
| Total | 20 (80.0%) | 5 (20.0%) |
Income Below Poverty Among Single-Parent Households in St Louis
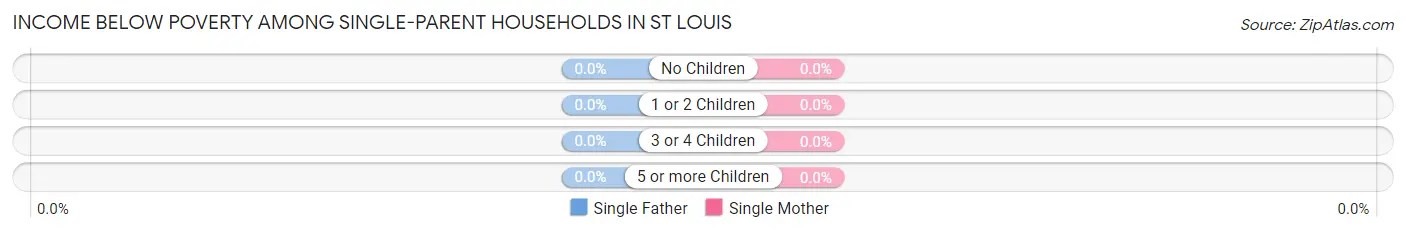
| Children | Single Father | Single Mother |
| No Children | 0 (0.0%) | 0 (0.0%) |
| 1 or 2 Children | 0 (0.0%) | 0 (0.0%) |
| 3 or 4 Children | 0 (0.0%) | 0 (0.0%) |
| 5 or more Children | 0 (0.0%) | 0 (0.0%) |
| Total | 0 (0.0%) | 0 (0.0%) |
Income Below Poverty Among Married-Couple vs Single-Parent Households in St Louis
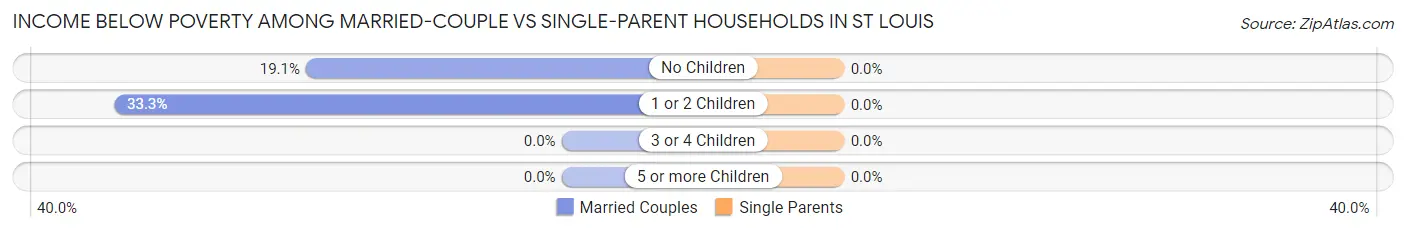
| Children | Married-Couple Families | Single-Parent Households |
| No Children | 4 (19.1%) | 0 (0.0%) |
| 1 or 2 Children | 1 (33.3%) | 0 (0.0%) |
| 3 or 4 Children | 0 (0.0%) | 0 (0.0%) |
| 5 or more Children | 0 (0.0%) | 0 (0.0%) |
| Total | 5 (20.0%) | 0 (0.0%) |
Race in St Louis
The most populous races in St Louis are White / Caucasian (63 | 74.1%), Two or more Races (17 | 20.0%), and Native / Alaskan (5 | 5.9%).
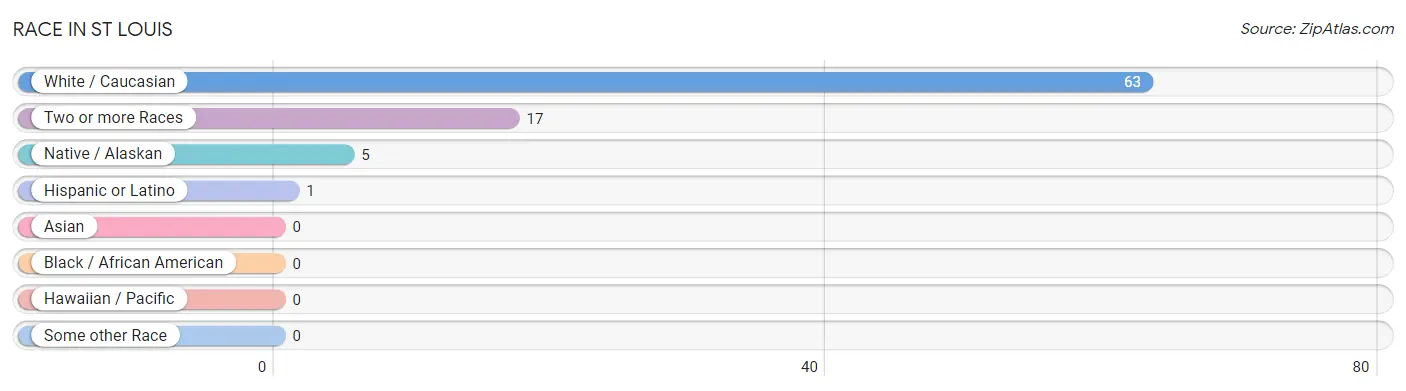
| Race | # Population | % Population |
| Asian | 0 | 0.0% |
| Black / African American | 0 | 0.0% |
| Hawaiian / Pacific | 0 | 0.0% |
| Hispanic or Latino | 1 | 1.2% |
| Native / Alaskan | 5 | 5.9% |
| White / Caucasian | 63 | 74.1% |
| Two or more Races | 17 | 20.0% |
| Some other Race | 0 | 0.0% |
| Total | 85 | 100.0% |
Ancestry in St Louis
The most populous ancestries reported in St Louis are Irish (12 | 14.1%), American (8 | 9.4%), Cherokee (7 | 8.2%), English (5 | 5.9%), and Potawatomi (5 | 5.9%), together accounting for 43.5% of all St Louis residents.
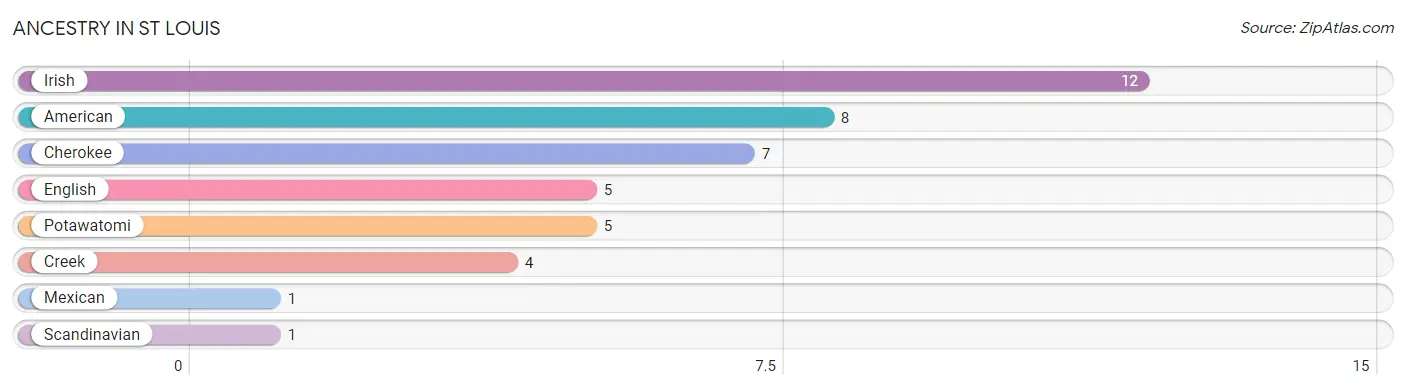
| Ancestry | # Population | % Population |
| American | 8 | 9.4% |
| Cherokee | 7 | 8.2% |
| Creek | 4 | 4.7% |
| English | 5 | 5.9% |
| Irish | 12 | 14.1% |
| Mexican | 1 | 1.2% |
| Potawatomi | 5 | 5.9% |
| Scandinavian | 1 | 1.2% | View All 8 Rows |
Immigrants in St Louis

| Immigration Origin | # Population | % Population | View All 0 Rows |
Sex and Age in St Louis
Sex and Age in St Louis
The most populous age groups in St Louis are 70 to 74 Years (7 | 17.1%) for men and 55 to 59 Years (7 | 15.9%) for women.
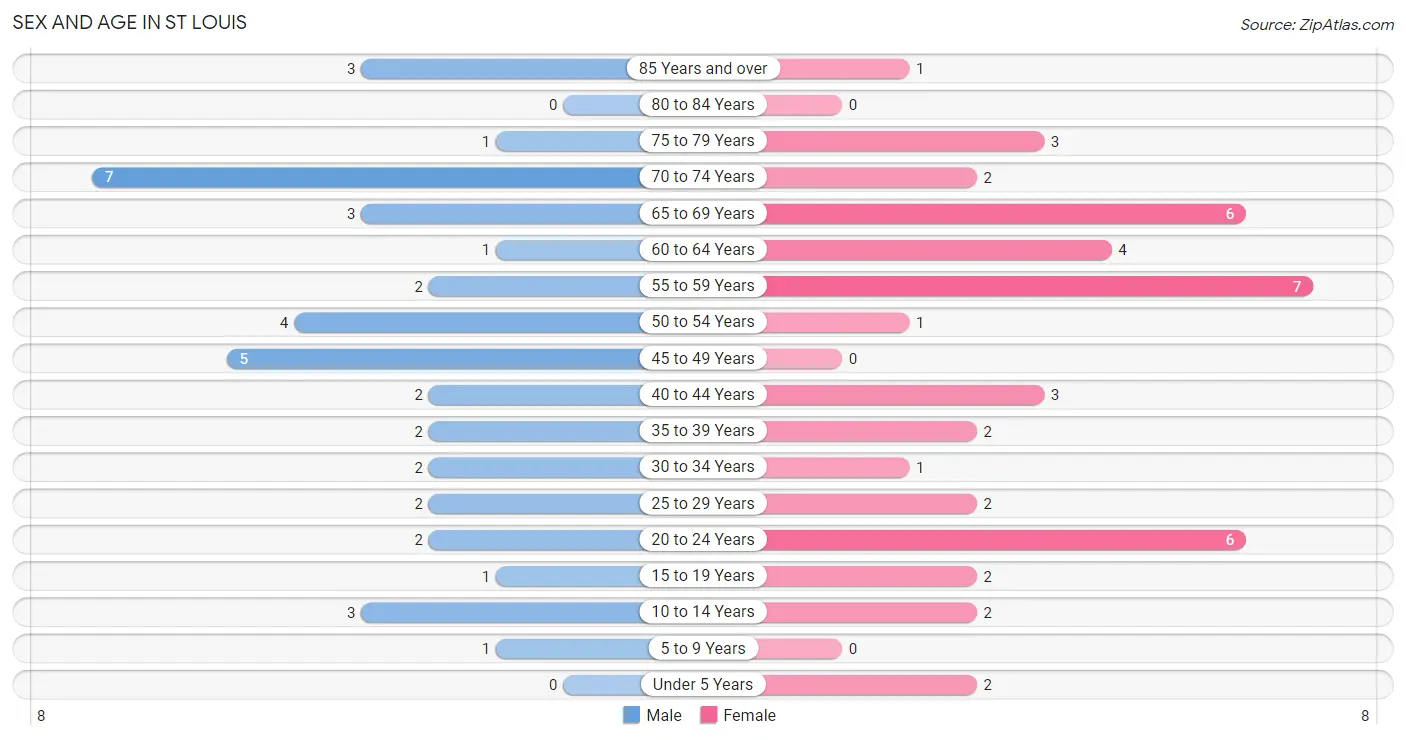
| Age Bracket | Male | Female |
| Under 5 Years | 0 (0.0%) | 2 (4.5%) |
| 5 to 9 Years | 1 (2.4%) | 0 (0.0%) |
| 10 to 14 Years | 3 (7.3%) | 2 (4.5%) |
| 15 to 19 Years | 1 (2.4%) | 2 (4.5%) |
| 20 to 24 Years | 2 (4.9%) | 6 (13.6%) |
| 25 to 29 Years | 2 (4.9%) | 2 (4.5%) |
| 30 to 34 Years | 2 (4.9%) | 1 (2.3%) |
| 35 to 39 Years | 2 (4.9%) | 2 (4.5%) |
| 40 to 44 Years | 2 (4.9%) | 3 (6.8%) |
| 45 to 49 Years | 5 (12.2%) | 0 (0.0%) |
| 50 to 54 Years | 4 (9.8%) | 1 (2.3%) |
| 55 to 59 Years | 2 (4.9%) | 7 (15.9%) |
| 60 to 64 Years | 1 (2.4%) | 4 (9.1%) |
| 65 to 69 Years | 3 (7.3%) | 6 (13.6%) |
| 70 to 74 Years | 7 (17.1%) | 2 (4.5%) |
| 75 to 79 Years | 1 (2.4%) | 3 (6.8%) |
| 80 to 84 Years | 0 (0.0%) | 0 (0.0%) |
| 85 Years and over | 3 (7.3%) | 1 (2.3%) |
| Total | 41 (100.0%) | 44 (100.0%) |
Families and Households in St Louis
Median Family Size in St Louis
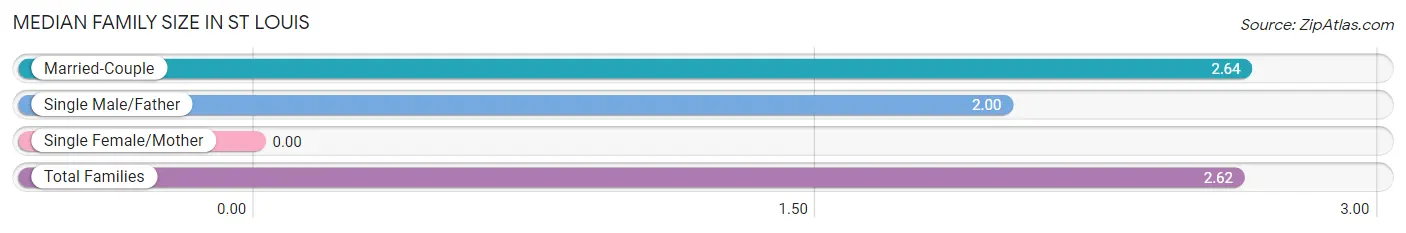
| Family Type | # Families | Family Size |
| Married-Couple | 25 (96.2%) | 2.64 |
| Single Male/Father | 1 (3.8%) | 2.00 |
| Single Female/Mother | 0 (0.0%) | - |
| Total Families | 26 (100.0%) | 2.62 |
Median Household Size in St Louis
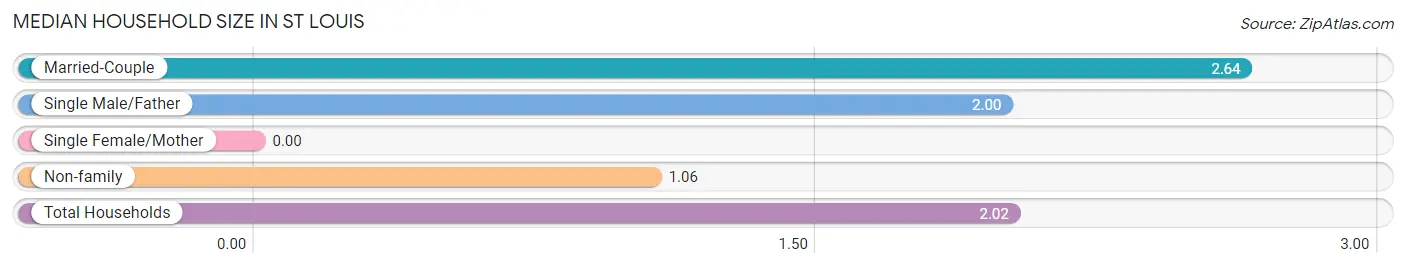
| Household Type | # Households | Household Size |
| Married-Couple | 25 (59.5%) | 2.64 |
| Single Male/Father | 1 (2.4%) | 2.00 |
| Single Female/Mother | 0 (0.0%) | - |
| Non-family | 16 (38.1%) | 1.06 |
| Total Households | 42 (100.0%) | 2.02 |
Household Size by Marriage Status in St Louis
Out of a total of 42 households in St Louis, 26 (61.9%) are family households, while 16 (38.1%) are nonfamily households. The most numerous type of family households are 2-person households, comprising 19, and the most common type of nonfamily households are 1-person households, comprising 15.
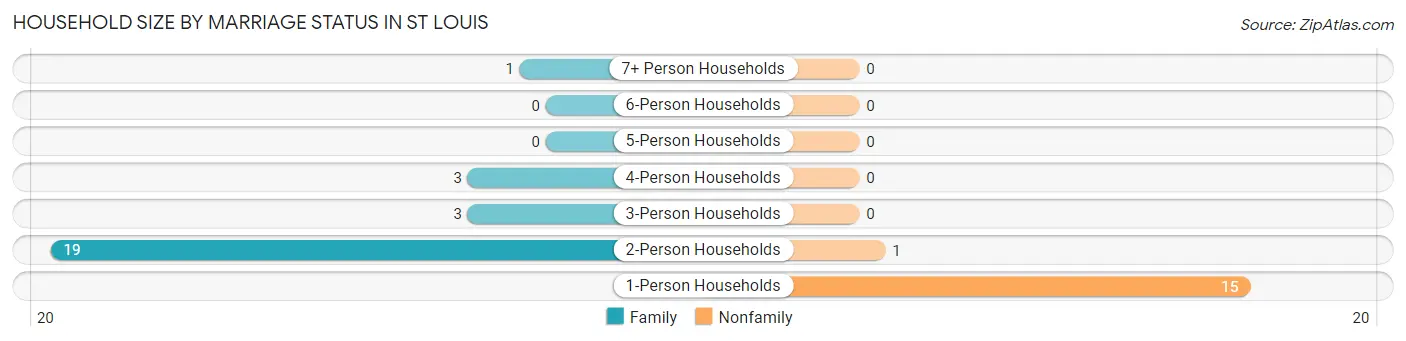
| Household Size | Family Households | Nonfamily Households |
| 1-Person Households | - | 15 (35.7%) |
| 2-Person Households | 19 (45.2%) | 1 (2.4%) |
| 3-Person Households | 3 (7.1%) | 0 (0.0%) |
| 4-Person Households | 3 (7.1%) | 0 (0.0%) |
| 5-Person Households | 0 (0.0%) | 0 (0.0%) |
| 6-Person Households | 0 (0.0%) | 0 (0.0%) |
| 7+ Person Households | 1 (2.4%) | 0 (0.0%) |
| Total | 26 (61.9%) | 16 (38.1%) |
Female Fertility in St Louis
Fertility by Age in St Louis
Average fertility rate in St Louis is 63.0 births per 1,000 women. Women in the age bracket of 20 to 34 years have the highest fertility rate with 111.0 births per 1,000 women. Women in the age bracket of 20 to 34 years acount for 100.0% of all women with births.
| Age Bracket | Women with Births | Births / 1,000 Women |
| 15 to 19 years | 0 (0.0%) | 0.0 |
| 20 to 34 years | 1 (100.0%) | 111.0 |
| 35 to 50 years | 0 (0.0%) | 0.0 |
| Total | 1 (100.0%) | 63.0 |
Fertility by Age by Marriage Status in St Louis
| Age Bracket | Married | Unmarried |
| 15 to 19 years | 0 (0.0%) | 0 (0.0%) |
| 20 to 34 years | 1 (100.0%) | 0 (0.0%) |
| 35 to 50 years | 0 (0.0%) | 0 (0.0%) |
| Total | 1 (100.0%) | 0 (0.0%) |
Fertility by Education in St Louis
| Educational Attainment | Women with Births | Births / 1,000 Women |
| Less than High School | 0 (0.0%) | 0.0 |
| High School Diploma | 0 (0.0%) | 0.0 |
| College or Associate's Degree | 1 (100.0%) | 167.0 |
| Bachelor's Degree | 0 (0.0%) | 0.0 |
| Graduate Degree | 0 (0.0%) | 0.0 |
| Total | 1 (100.0%) | 63.0 |
Fertility by Education by Marriage Status in St Louis
| Educational Attainment | Married | Unmarried |
| Less than High School | 0 (0.0%) | 0 (0.0%) |
| High School Diploma | 0 (0.0%) | 0 (0.0%) |
| College or Associate's Degree | 1 (100.0%) | 0 (0.0%) |
| Bachelor's Degree | 0 (0.0%) | 0 (0.0%) |
| Graduate Degree | 0 (0.0%) | 0 (0.0%) |
| Total | 1 (100.0%) | 0 (0.0%) |
Employment Characteristics in St Louis
Employment by Class of Employer in St Louis
Among the 39 employed individuals in St Louis, private company employees (19 | 48.7%), federal government employees (12 | 30.8%), and state government employees (5 | 12.8%) make up the most common classes of employment.
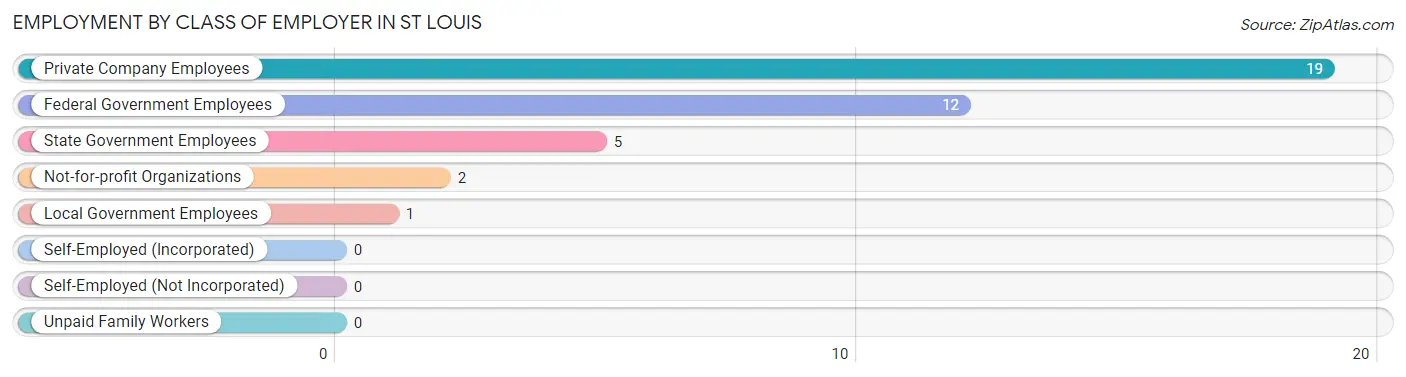
| Employer Class | # Employees | % Employees |
| Private Company Employees | 19 | 48.7% |
| Self-Employed (Incorporated) | 0 | 0.0% |
| Self-Employed (Not Incorporated) | 0 | 0.0% |
| Not-for-profit Organizations | 2 | 5.1% |
| Local Government Employees | 1 | 2.6% |
| State Government Employees | 5 | 12.8% |
| Federal Government Employees | 12 | 30.8% |
| Unpaid Family Workers | 0 | 0.0% |
| Total | 39 | 100.0% |
Employment Status by Age in St Louis
According to the labor force statistics for St Louis, out of the total population over 16 years of age (77), 57.1% or 44 individuals are in the labor force, with 11.4% or 5 of them unemployed. The age group with the highest labor force participation rate is 20 to 24 years, with 100.0% or 8 individuals in the labor force. Within the labor force, the 45 to 54 years age range has the highest percentage of unemployed individuals, with 42.9% or 3 of them being unemployed.
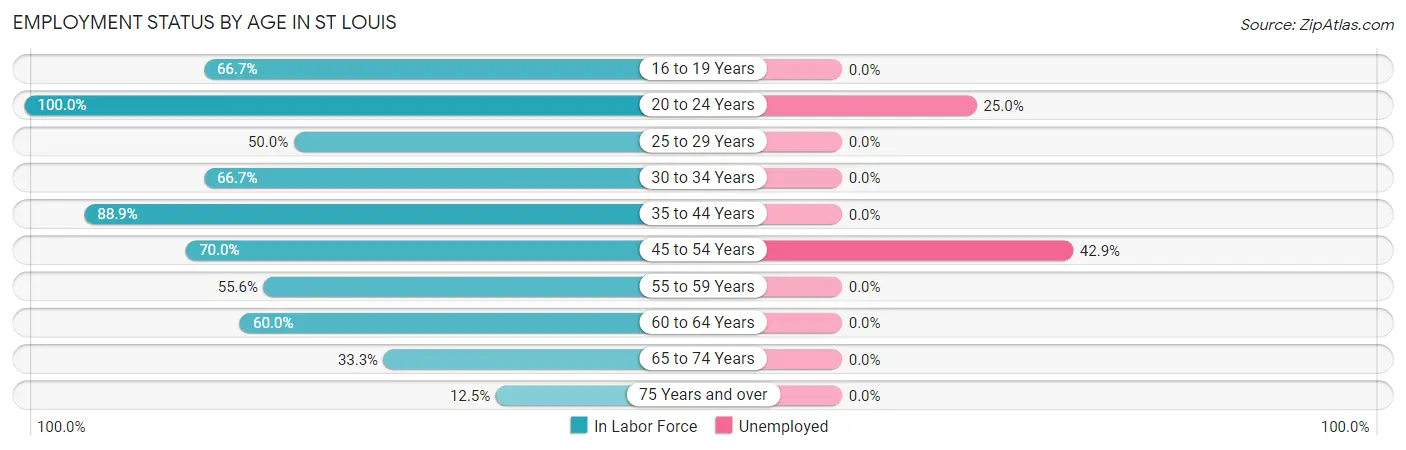
| Age Bracket | In Labor Force | Unemployed |
| 16 to 19 Years | 2 (66.7%) | 0 (0.0%) |
| 20 to 24 Years | 8 (100.0%) | 2 (25.0%) |
| 25 to 29 Years | 2 (50.0%) | 0 (0.0%) |
| 30 to 34 Years | 2 (66.7%) | 0 (0.0%) |
| 35 to 44 Years | 8 (88.9%) | 0 (0.0%) |
| 45 to 54 Years | 7 (70.0%) | 3 (42.9%) |
| 55 to 59 Years | 5 (55.6%) | 0 (0.0%) |
| 60 to 64 Years | 3 (60.0%) | 0 (0.0%) |
| 65 to 74 Years | 6 (33.3%) | 0 (0.0%) |
| 75 Years and over | 1 (12.5%) | 0 (0.0%) |
| Total | 44 (57.1%) | 5 (11.4%) |
Employment Status by Educational Attainment in St Louis
According to labor force statistics for St Louis, 67.5% of individuals (27) out of the total population between 25 and 64 years of age (40) are in the labor force, with 11.1% or 3 of them being unemployed. The group with the highest labor force participation rate are those with the educational attainment of less than high school, with 100.0% or 1 individuals in the labor force. Within the labor force, individuals with high school diploma education have the highest percentage of unemployment, with 21.4% or 3 of them being unemployed.
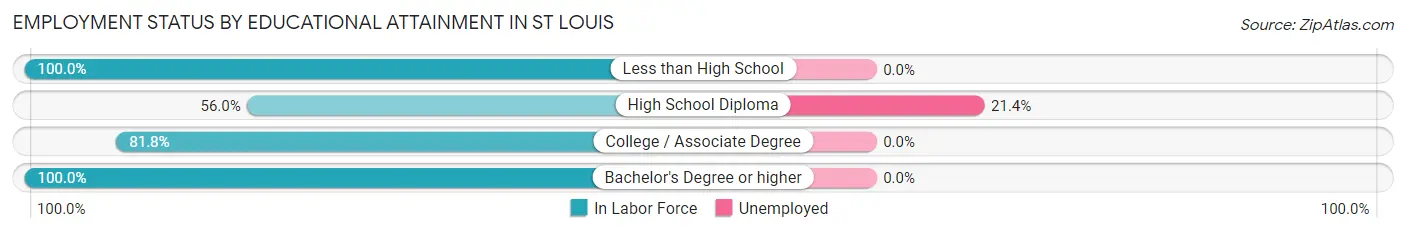
| Educational Attainment | In Labor Force | Unemployed |
| Less than High School | 1 (100.0%) | 0 (0.0%) |
| High School Diploma | 14 (56.0%) | 5 (21.4%) |
| College / Associate Degree | 9 (81.8%) | 0 (0.0%) |
| Bachelor's Degree or higher | 3 (100.0%) | 0 (0.0%) |
| Total | 27 (67.5%) | 4 (11.1%) |
Employment Occupations by Sex in St Louis
Management, Business, Science and Arts Occupations
The most common Management, Business, Science and Arts occupations in St Louis are Management (8 | 20.5%), Computers, Engineering & Science (1 | 2.6%), Life, Physical & Social Science (1 | 2.6%), Health Diagnosing & Treating (1 | 2.6%), and Health Technologists (1 | 2.6%).
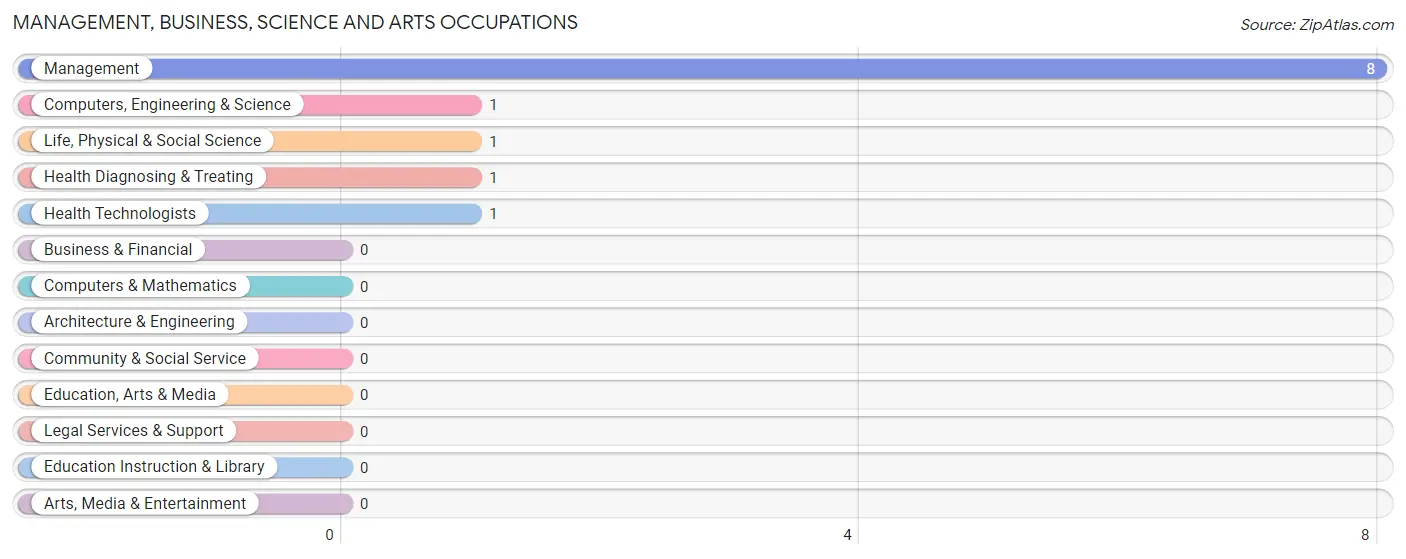
Management, Business, Science and Arts Occupations by Sex
Within the Management, Business, Science and Arts occupations in St Louis, the most male-oriented occupations are Computers, Engineering & Science (100.0%), Life, Physical & Social Science (100.0%), and Management (62.5%), while the most female-oriented occupations are Health Diagnosing & Treating (100.0%), Health Technologists (100.0%), and Management (37.5%).
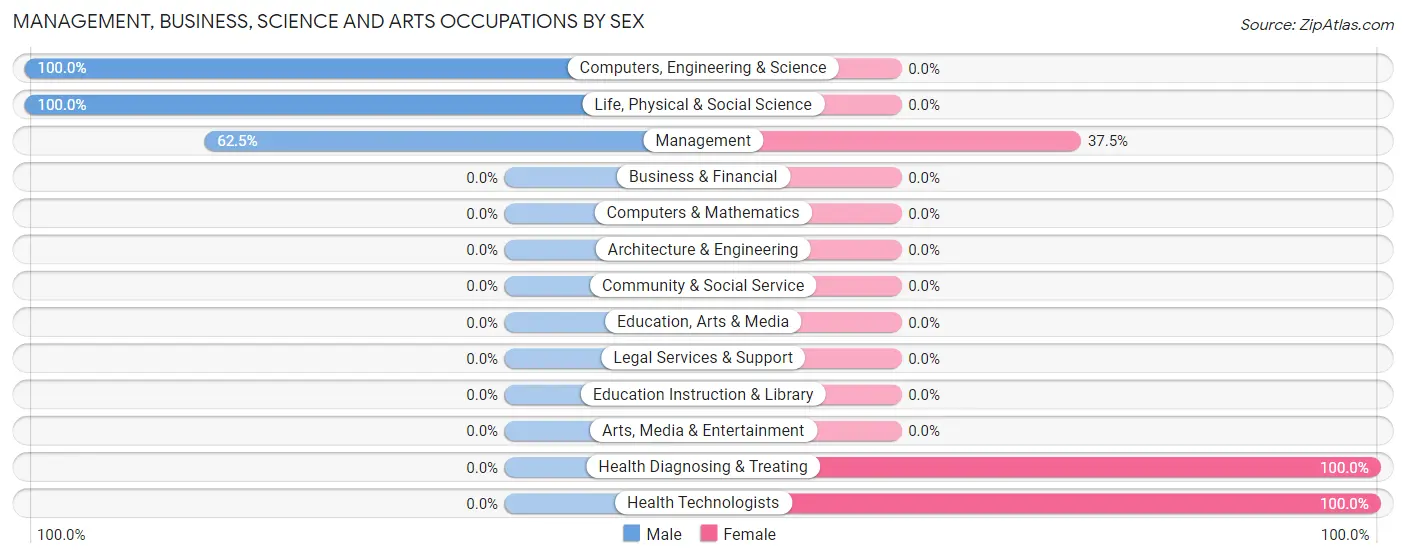
| Occupation | Male | Female |
| Management | 5 (62.5%) | 3 (37.5%) |
| Business & Financial | 0 (0.0%) | 0 (0.0%) |
| Computers, Engineering & Science | 1 (100.0%) | 0 (0.0%) |
| Computers & Mathematics | 0 (0.0%) | 0 (0.0%) |
| Architecture & Engineering | 0 (0.0%) | 0 (0.0%) |
| Life, Physical & Social Science | 1 (100.0%) | 0 (0.0%) |
| Community & Social Service | 0 (0.0%) | 0 (0.0%) |
| Education, Arts & Media | 0 (0.0%) | 0 (0.0%) |
| Legal Services & Support | 0 (0.0%) | 0 (0.0%) |
| Education Instruction & Library | 0 (0.0%) | 0 (0.0%) |
| Arts, Media & Entertainment | 0 (0.0%) | 0 (0.0%) |
| Health Diagnosing & Treating | 0 (0.0%) | 1 (100.0%) |
| Health Technologists | 0 (0.0%) | 1 (100.0%) |
| Total (Category) | 6 (60.0%) | 4 (40.0%) |
| Total (Overall) | 17 (43.6%) | 22 (56.4%) |
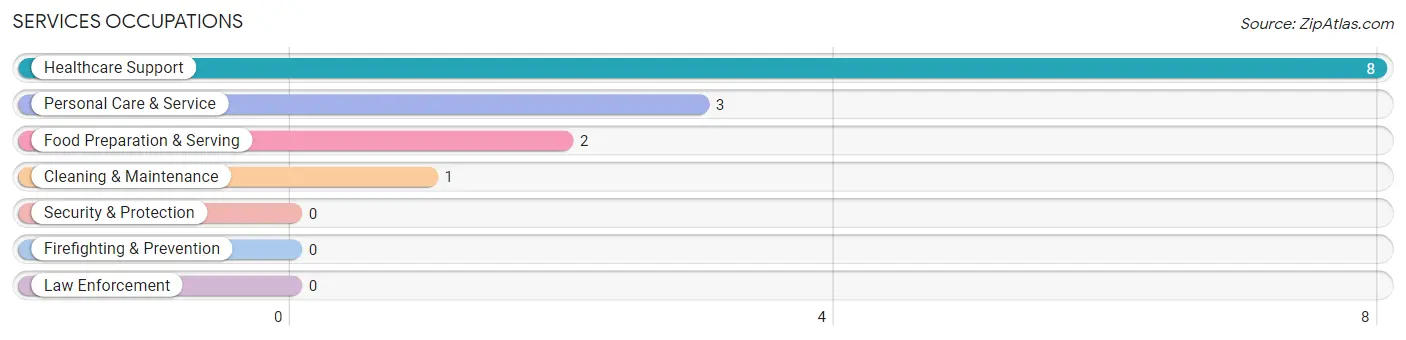
Services Occupations
The most common Services occupations in St Louis are Healthcare Support (8 | 20.5%), Personal Care & Service (3 | 7.7%), Food Preparation & Serving (2 | 5.1%), and Cleaning & Maintenance (1 | 2.6%).
Services Occupations by Sex
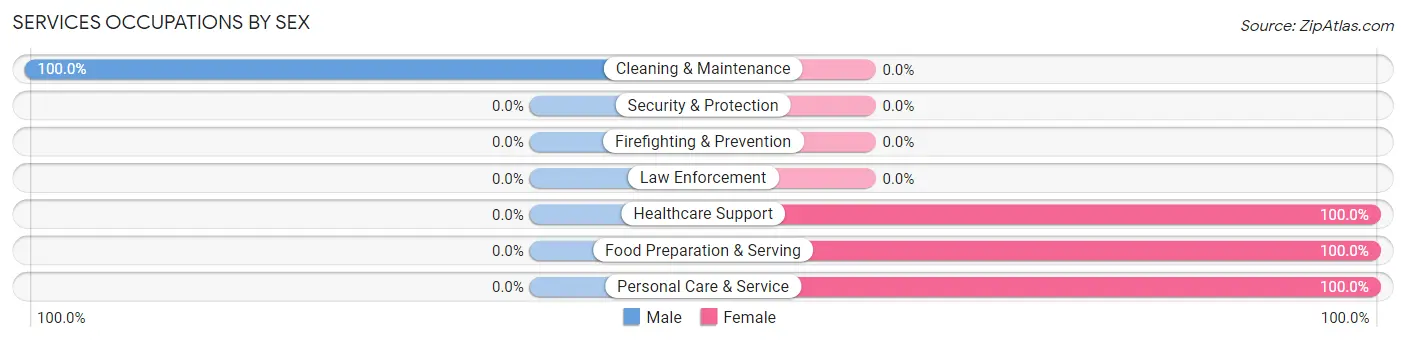
| Occupation | Male | Female |
| Healthcare Support | 0 (0.0%) | 8 (100.0%) |
| Security & Protection | 0 (0.0%) | 0 (0.0%) |
| Firefighting & Prevention | 0 (0.0%) | 0 (0.0%) |
| Law Enforcement | 0 (0.0%) | 0 (0.0%) |
| Food Preparation & Serving | 0 (0.0%) | 2 (100.0%) |
| Cleaning & Maintenance | 1 (100.0%) | 0 (0.0%) |
| Personal Care & Service | 0 (0.0%) | 3 (100.0%) |
| Total (Category) | 1 (7.1%) | 13 (92.9%) |
| Total (Overall) | 17 (43.6%) | 22 (56.4%) |
Sales and Office Occupations
The most common Sales and Office occupations in St Louis are , and Office & Administration (5 | 12.8%).

Sales and Office Occupations by Sex
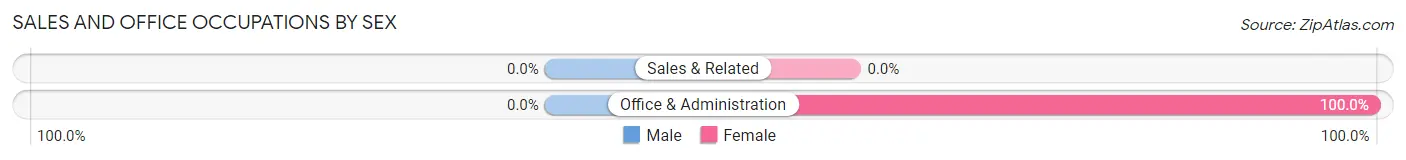
| Occupation | Male | Female |
| Sales & Related | 0 (0.0%) | 0 (0.0%) |
| Office & Administration | 0 (0.0%) | 5 (100.0%) |
| Total (Category) | 0 (0.0%) | 5 (100.0%) |
| Total (Overall) | 17 (43.6%) | 22 (56.4%) |
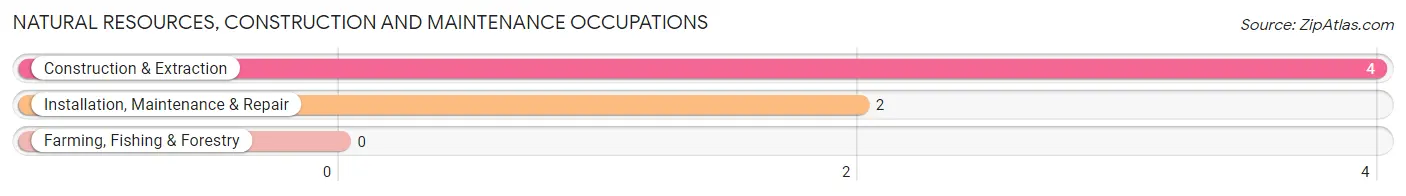
Natural Resources, Construction and Maintenance Occupations
The most common Natural Resources, Construction and Maintenance occupations in St Louis are Construction & Extraction (4 | 10.3%), and Installation, Maintenance & Repair (2 | 5.1%).
Natural Resources, Construction and Maintenance Occupations by Sex
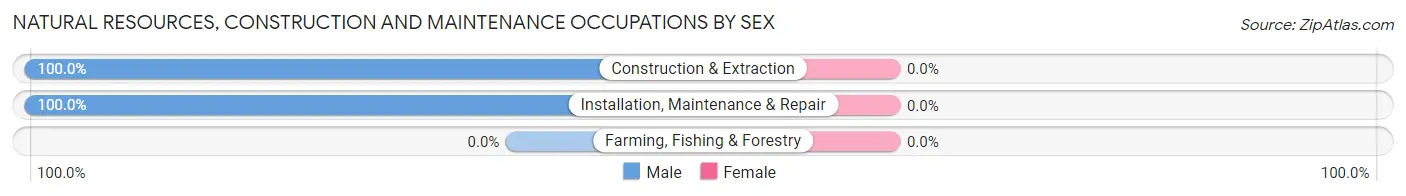
| Occupation | Male | Female |
| Farming, Fishing & Forestry | 0 (0.0%) | 0 (0.0%) |
| Construction & Extraction | 4 (100.0%) | 0 (0.0%) |
| Installation, Maintenance & Repair | 2 (100.0%) | 0 (0.0%) |
| Total (Category) | 6 (100.0%) | 0 (0.0%) |
| Total (Overall) | 17 (43.6%) | 22 (56.4%) |
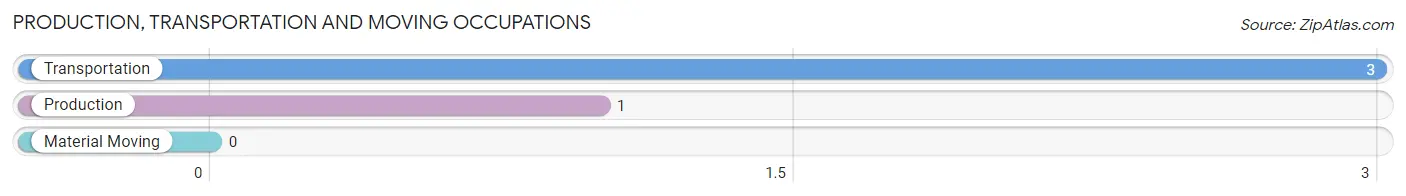
Production, Transportation and Moving Occupations
The most common Production, Transportation and Moving occupations in St Louis are Transportation (3 | 7.7%), and Production (1 | 2.6%).
Production, Transportation and Moving Occupations by Sex
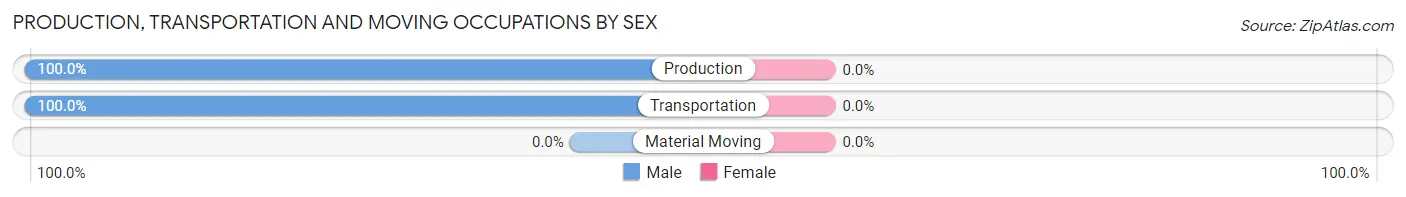
| Occupation | Male | Female |
| Production | 1 (100.0%) | 0 (0.0%) |
| Transportation | 3 (100.0%) | 0 (0.0%) |
| Material Moving | 0 (0.0%) | 0 (0.0%) |
| Total (Category) | 4 (100.0%) | 0 (0.0%) |
| Total (Overall) | 17 (43.6%) | 22 (56.4%) |
Employment Industries by Sex in St Louis
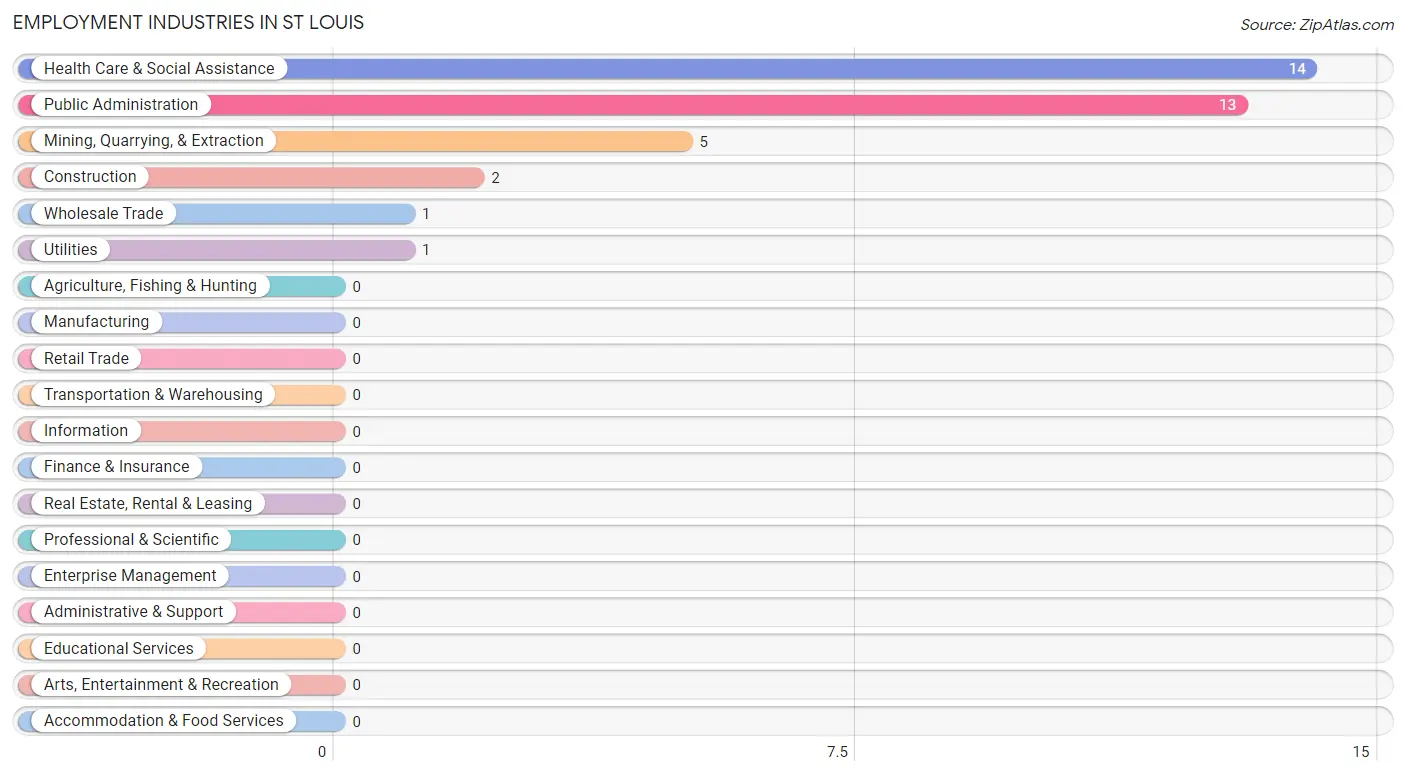
Employment Industries in St Louis
The major employment industries in St Louis include Health Care & Social Assistance (14 | 35.9%), Public Administration (13 | 33.3%), Mining, Quarrying, & Extraction (5 | 12.8%), Construction (2 | 5.1%), and Wholesale Trade (1 | 2.6%).
Employment Industries by Sex in St Louis
The St Louis industries that see more men than women are Mining, Quarrying, & Extraction (100.0%), Construction (100.0%), and Wholesale Trade (100.0%), whereas the industries that tend to have a higher number of women are Health Care & Social Assistance (100.0%), and Public Administration (38.5%).
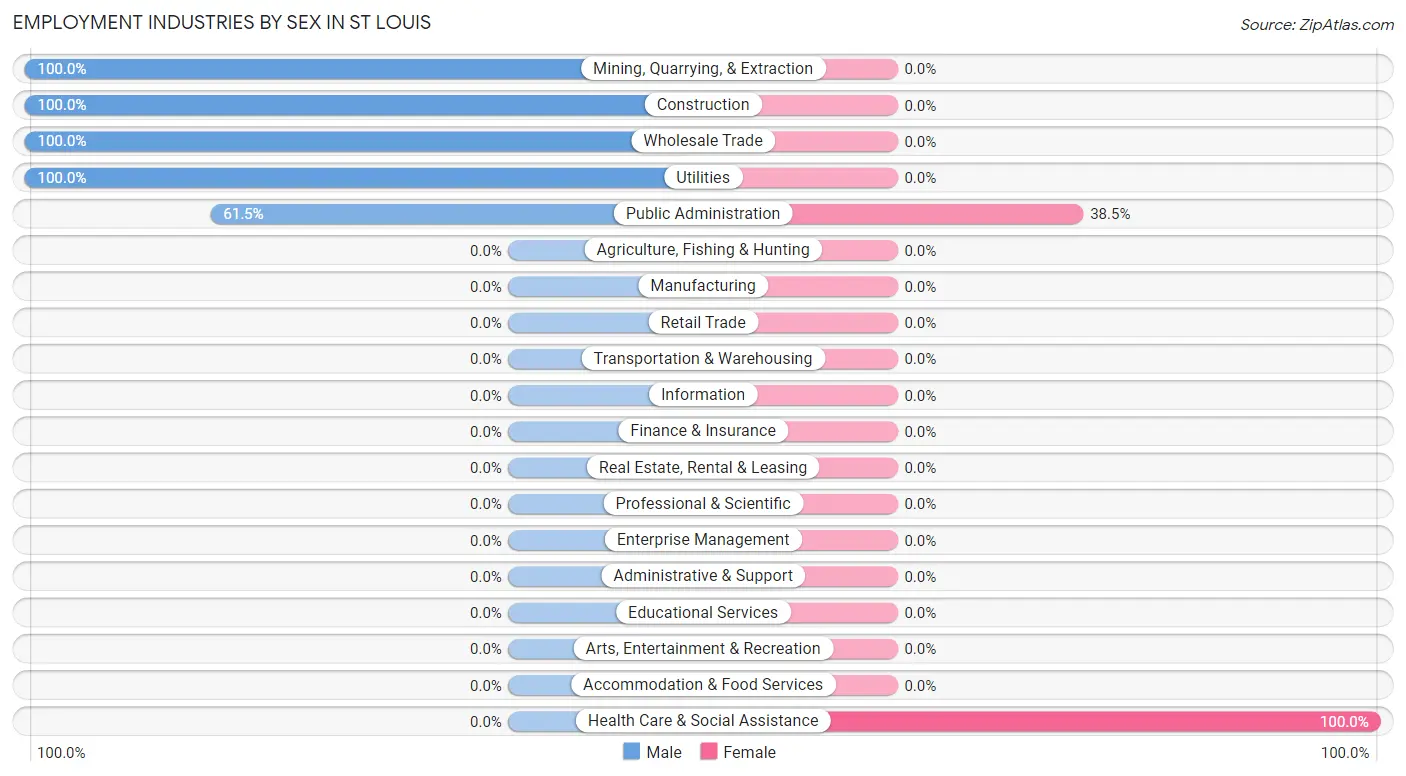
| Industry | Male | Female |
| Agriculture, Fishing & Hunting | 0 (0.0%) | 0 (0.0%) |
| Mining, Quarrying, & Extraction | 5 (100.0%) | 0 (0.0%) |
| Construction | 2 (100.0%) | 0 (0.0%) |
| Manufacturing | 0 (0.0%) | 0 (0.0%) |
| Wholesale Trade | 1 (100.0%) | 0 (0.0%) |
| Retail Trade | 0 (0.0%) | 0 (0.0%) |
| Transportation & Warehousing | 0 (0.0%) | 0 (0.0%) |
| Utilities | 1 (100.0%) | 0 (0.0%) |
| Information | 0 (0.0%) | 0 (0.0%) |
| Finance & Insurance | 0 (0.0%) | 0 (0.0%) |
| Real Estate, Rental & Leasing | 0 (0.0%) | 0 (0.0%) |
| Professional & Scientific | 0 (0.0%) | 0 (0.0%) |
| Enterprise Management | 0 (0.0%) | 0 (0.0%) |
| Administrative & Support | 0 (0.0%) | 0 (0.0%) |
| Educational Services | 0 (0.0%) | 0 (0.0%) |
| Health Care & Social Assistance | 0 (0.0%) | 14 (100.0%) |
| Arts, Entertainment & Recreation | 0 (0.0%) | 0 (0.0%) |
| Accommodation & Food Services | 0 (0.0%) | 0 (0.0%) |
| Public Administration | 8 (61.5%) | 5 (38.5%) |
| Total | 17 (43.6%) | 22 (56.4%) |
Education in St Louis
School Enrollment in St Louis
The most common levels of schooling among the 9 students in St Louis are middle school (5 | 55.6%), college / undergraduate (2 | 22.2%), and elementary school (1 | 11.1%).
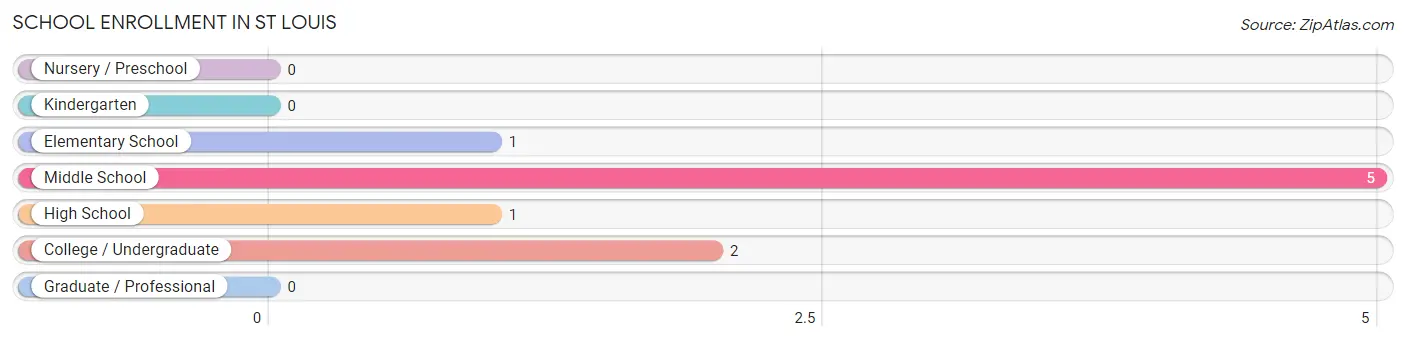
| School Level | # Students | % Students |
| Nursery / Preschool | 0 | 0.0% |
| Kindergarten | 0 | 0.0% |
| Elementary School | 1 | 11.1% |
| Middle School | 5 | 55.6% |
| High School | 1 | 11.1% |
| College / Undergraduate | 2 | 22.2% |
| Graduate / Professional | 0 | 0.0% |
| Total | 9 | 100.0% |
School Enrollment by Age by Funding Source in St Louis
Out of a total of 9 students who are enrolled in schools in St Louis, 2 (22.2%) attend a private institution, while the remaining 7 (77.8%) are enrolled in public schools. The age group of 5 to 9 year old has the highest likelihood of being enrolled in private schools, with 1 (100.0% in the age bracket) enrolled. Conversely, the age group of 15 to 17 year olds has the lowest likelihood of being enrolled in a private school, with 1 (100.0% in the age bracket) attending a public institution.
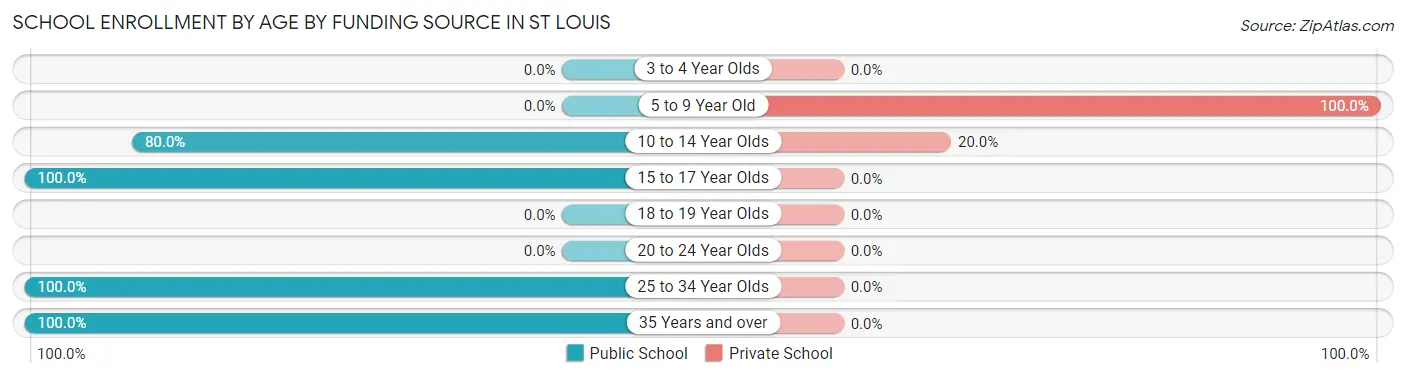
| Age Bracket | Public School | Private School |
| 3 to 4 Year Olds | 0 (0.0%) | 0 (0.0%) |
| 5 to 9 Year Old | 0 (0.0%) | 1 (100.0%) |
| 10 to 14 Year Olds | 4 (80.0%) | 1 (20.0%) |
| 15 to 17 Year Olds | 1 (100.0%) | 0 (0.0%) |
| 18 to 19 Year Olds | 0 (0.0%) | 0 (0.0%) |
| 20 to 24 Year Olds | 0 (0.0%) | 0 (0.0%) |
| 25 to 34 Year Olds | 1 (100.0%) | 0 (0.0%) |
| 35 Years and over | 1 (100.0%) | 0 (0.0%) |
| Total | 7 (77.8%) | 2 (22.2%) |
Educational Attainment by Field of Study in St Louis
Education (3 | 50.0%), bio, nature & agricultural (2 | 33.3%), and physical & health sciences (1 | 16.7%) are the most common fields of study among 6 individuals in St Louis who have obtained a bachelor's degree or higher.
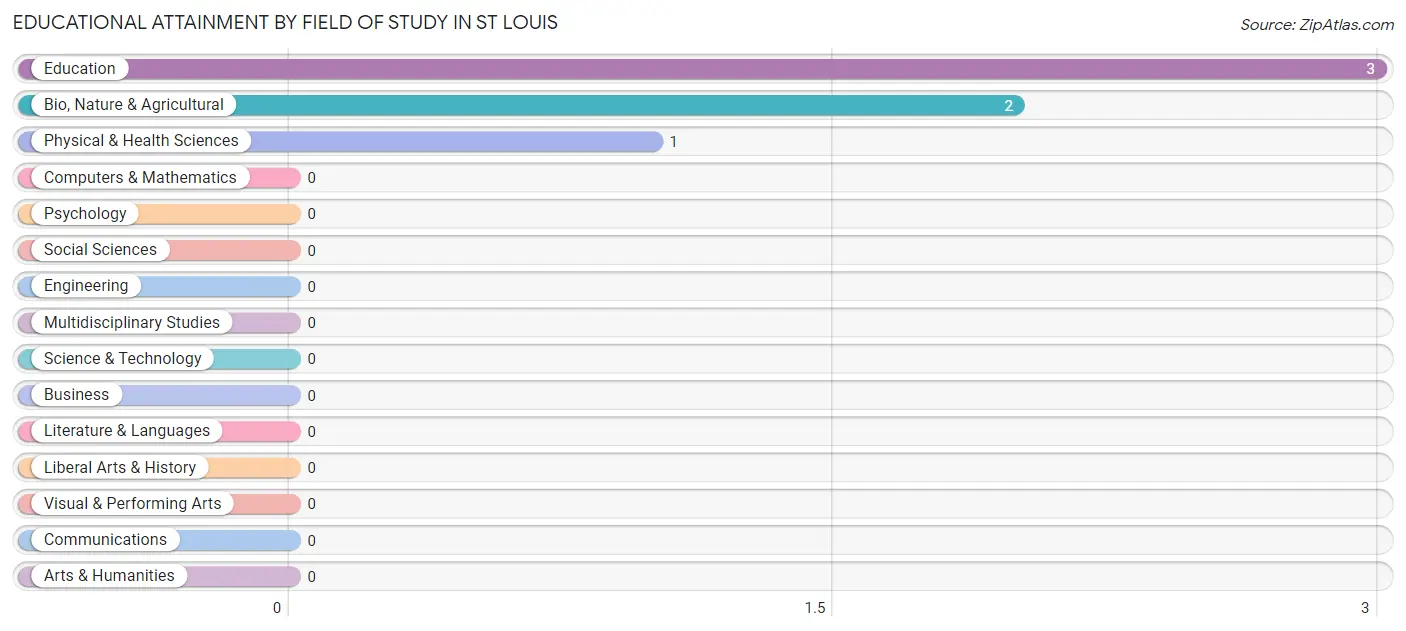
| Field of Study | # Graduates | % Graduates |
| Computers & Mathematics | 0 | 0.0% |
| Bio, Nature & Agricultural | 2 | 33.3% |
| Physical & Health Sciences | 1 | 16.7% |
| Psychology | 0 | 0.0% |
| Social Sciences | 0 | 0.0% |
| Engineering | 0 | 0.0% |
| Multidisciplinary Studies | 0 | 0.0% |
| Science & Technology | 0 | 0.0% |
| Business | 0 | 0.0% |
| Education | 3 | 50.0% |
| Literature & Languages | 0 | 0.0% |
| Liberal Arts & History | 0 | 0.0% |
| Visual & Performing Arts | 0 | 0.0% |
| Communications | 0 | 0.0% |
| Arts & Humanities | 0 | 0.0% |
| Total | 6 | 100.0% |
Transportation & Commute in St Louis
Vehicle Availability by Sex in St Louis
The most prevalent vehicle ownership categories in St Louis are males with 2 vehicles (7, accounting for 41.2%) and females with 2 vehicles (6, making up 31.8%).
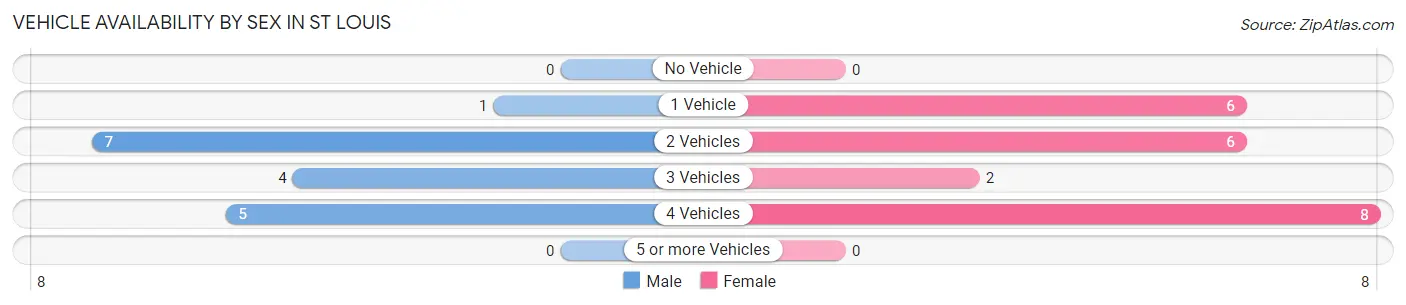
| Vehicles Available | Male | Female |
| No Vehicle | 0 (0.0%) | 0 (0.0%) |
| 1 Vehicle | 1 (5.9%) | 6 (27.3%) |
| 2 Vehicles | 7 (41.2%) | 6 (27.3%) |
| 3 Vehicles | 4 (23.5%) | 2 (9.1%) |
| 4 Vehicles | 5 (29.4%) | 8 (36.4%) |
| 5 or more Vehicles | 0 (0.0%) | 0 (0.0%) |
| Total | 17 (100.0%) | 22 (100.0%) |
Commute Time in St Louis
The most frequently occuring commute durations in St Louis are 20 to 24 minutes (8 commuters, 20.5%), 30 to 34 minutes (7 commuters, 17.9%), and 25 to 29 minutes (5 commuters, 12.8%).
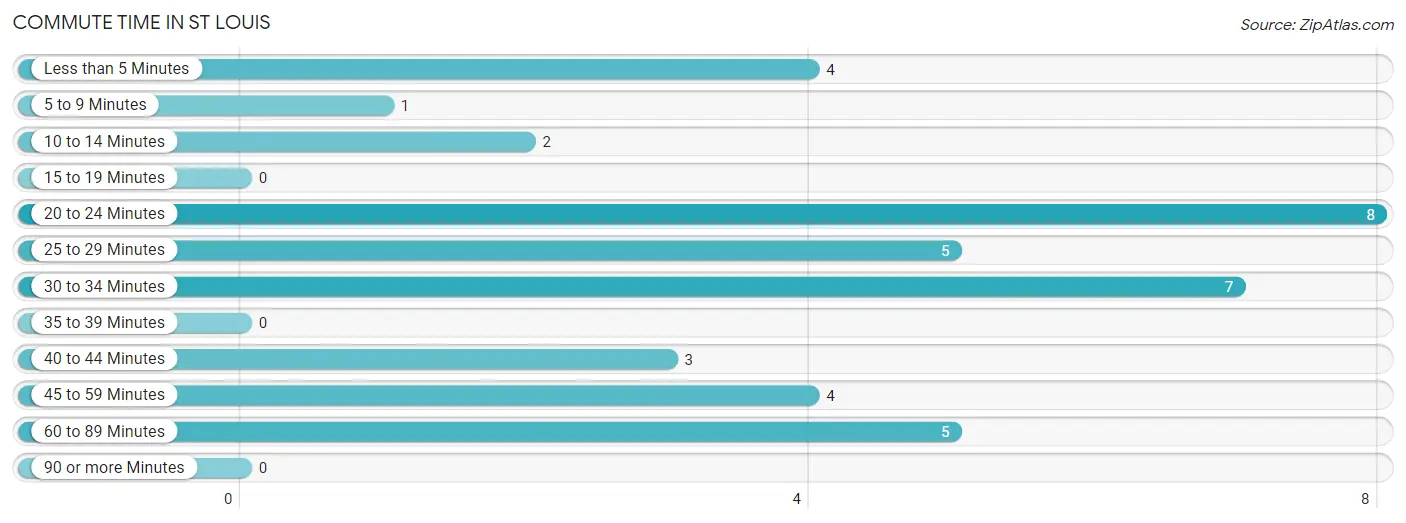
| Commute Time | # Commuters | % Commuters |
| Less than 5 Minutes | 4 | 10.3% |
| 5 to 9 Minutes | 1 | 2.6% |
| 10 to 14 Minutes | 2 | 5.1% |
| 15 to 19 Minutes | 0 | 0.0% |
| 20 to 24 Minutes | 8 | 20.5% |
| 25 to 29 Minutes | 5 | 12.8% |
| 30 to 34 Minutes | 7 | 17.9% |
| 35 to 39 Minutes | 0 | 0.0% |
| 40 to 44 Minutes | 3 | 7.7% |
| 45 to 59 Minutes | 4 | 10.3% |
| 60 to 89 Minutes | 5 | 12.8% |
| 90 or more Minutes | 0 | 0.0% |
Commute Time by Sex in St Louis
The most common commute times in St Louis are 20 to 24 minutes (6 commuters, 35.3%) for males and 30 to 34 minutes (6 commuters, 27.3%) for females.
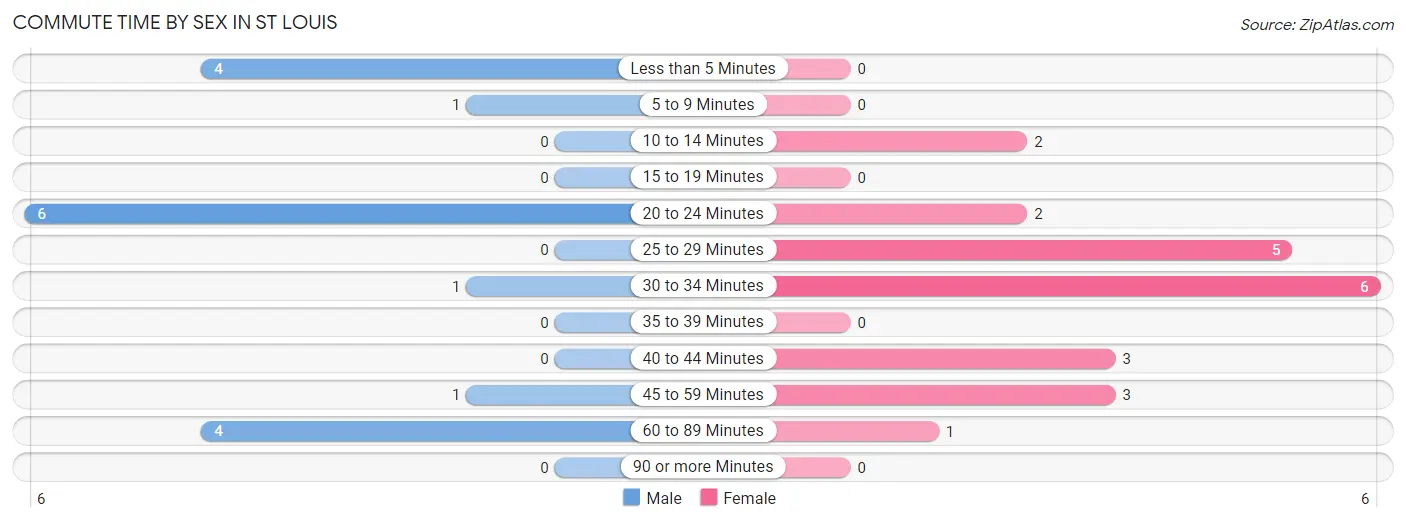
| Commute Time | Male | Female |
| Less than 5 Minutes | 4 (23.5%) | 0 (0.0%) |
| 5 to 9 Minutes | 1 (5.9%) | 0 (0.0%) |
| 10 to 14 Minutes | 0 (0.0%) | 2 (9.1%) |
| 15 to 19 Minutes | 0 (0.0%) | 0 (0.0%) |
| 20 to 24 Minutes | 6 (35.3%) | 2 (9.1%) |
| 25 to 29 Minutes | 0 (0.0%) | 5 (22.7%) |
| 30 to 34 Minutes | 1 (5.9%) | 6 (27.3%) |
| 35 to 39 Minutes | 0 (0.0%) | 0 (0.0%) |
| 40 to 44 Minutes | 0 (0.0%) | 3 (13.6%) |
| 45 to 59 Minutes | 1 (5.9%) | 3 (13.6%) |
| 60 to 89 Minutes | 4 (23.5%) | 1 (4.5%) |
| 90 or more Minutes | 0 (0.0%) | 0 (0.0%) |
Time of Departure to Work by Sex in St Louis
The most frequent times of departure to work in St Louis are 6:30 AM to 6:59 AM (11, 64.7%) for males and 7:00 AM to 7:29 AM (11, 50.0%) for females.
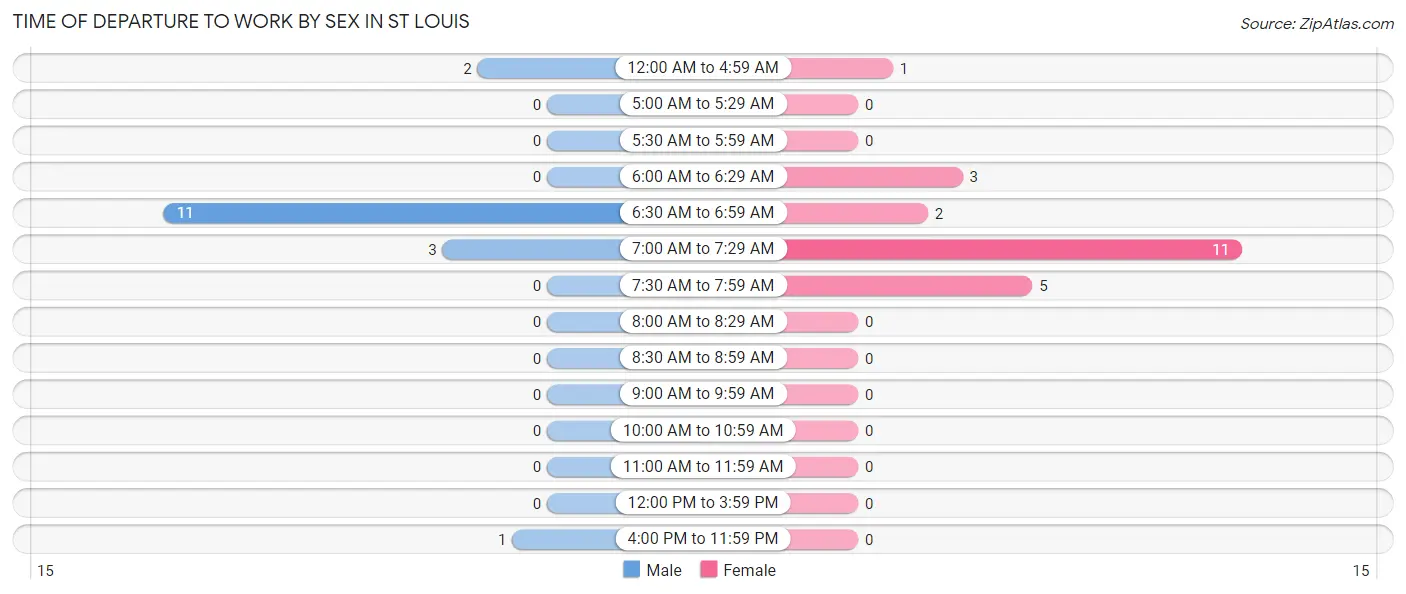
| Time of Departure | Male | Female |
| 12:00 AM to 4:59 AM | 2 (11.8%) | 1 (4.5%) |
| 5:00 AM to 5:29 AM | 0 (0.0%) | 0 (0.0%) |
| 5:30 AM to 5:59 AM | 0 (0.0%) | 0 (0.0%) |
| 6:00 AM to 6:29 AM | 0 (0.0%) | 3 (13.6%) |
| 6:30 AM to 6:59 AM | 11 (64.7%) | 2 (9.1%) |
| 7:00 AM to 7:29 AM | 3 (17.6%) | 11 (50.0%) |
| 7:30 AM to 7:59 AM | 0 (0.0%) | 5 (22.7%) |
| 8:00 AM to 8:29 AM | 0 (0.0%) | 0 (0.0%) |
| 8:30 AM to 8:59 AM | 0 (0.0%) | 0 (0.0%) |
| 9:00 AM to 9:59 AM | 0 (0.0%) | 0 (0.0%) |
| 10:00 AM to 10:59 AM | 0 (0.0%) | 0 (0.0%) |
| 11:00 AM to 11:59 AM | 0 (0.0%) | 0 (0.0%) |
| 12:00 PM to 3:59 PM | 0 (0.0%) | 0 (0.0%) |
| 4:00 PM to 11:59 PM | 1 (5.9%) | 0 (0.0%) |
| Total | 17 (100.0%) | 22 (100.0%) |
Housing Occupancy in St Louis
Occupancy by Ownership in St Louis
Of the total 42 dwellings in St Louis, owner-occupied units account for 38 (90.5%), while renter-occupied units make up 4 (9.5%).
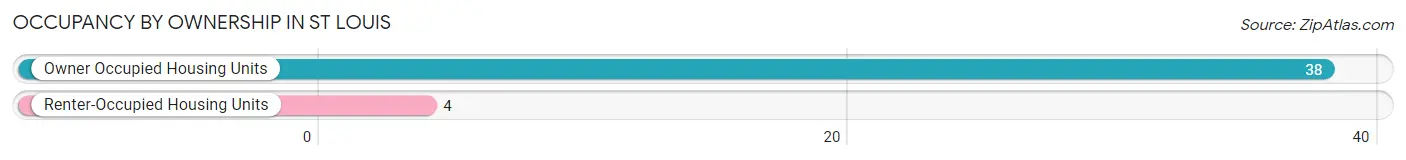
| Occupancy | # Housing Units | % Housing Units |
| Owner Occupied Housing Units | 38 | 90.5% |
| Renter-Occupied Housing Units | 4 | 9.5% |
| Total Occupied Housing Units | 42 | 100.0% |
Occupancy by Household Size in St Louis
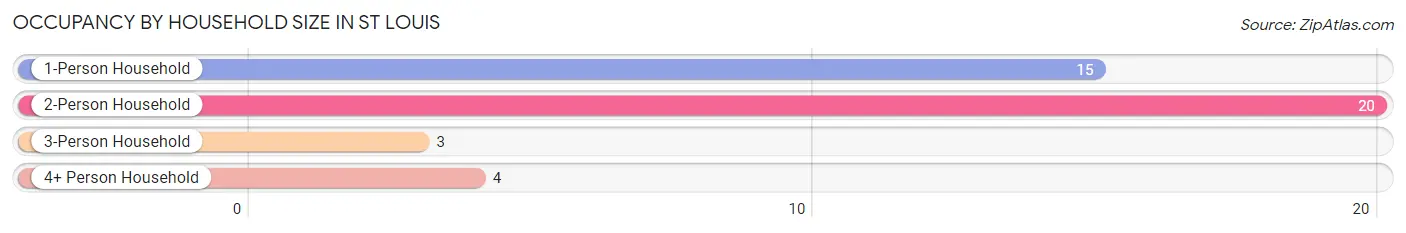
| Household Size | # Housing Units | % Housing Units |
| 1-Person Household | 15 | 35.7% |
| 2-Person Household | 20 | 47.6% |
| 3-Person Household | 3 | 7.1% |
| 4+ Person Household | 4 | 9.5% |
| Total Housing Units | 42 | 100.0% |
Occupancy by Ownership by Household Size in St Louis
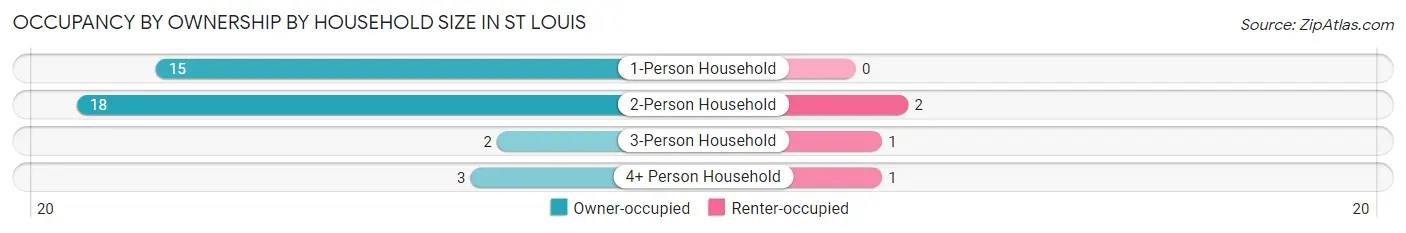
| Household Size | Owner-occupied | Renter-occupied |
| 1-Person Household | 15 (100.0%) | 0 (0.0%) |
| 2-Person Household | 18 (90.0%) | 2 (10.0%) |
| 3-Person Household | 2 (66.7%) | 1 (33.3%) |
| 4+ Person Household | 3 (75.0%) | 1 (25.0%) |
| Total Housing Units | 38 (90.5%) | 4 (9.5%) |
Occupancy by Educational Attainment in St Louis
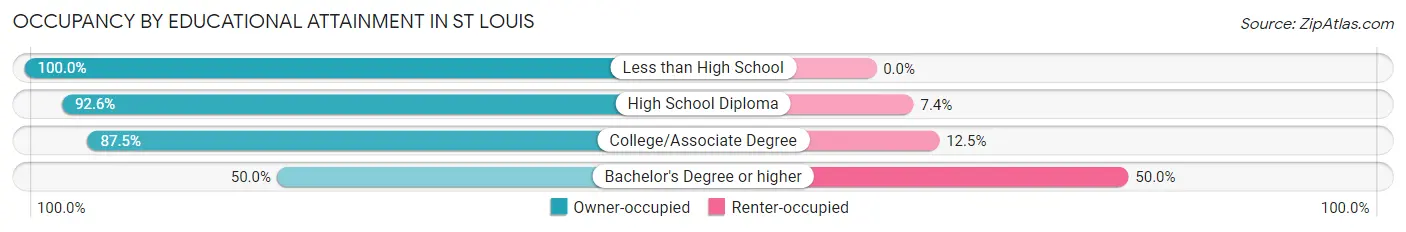
| Household Size | Owner-occupied | Renter-occupied |
| Less than High School | 5 (100.0%) | 0 (0.0%) |
| High School Diploma | 25 (92.6%) | 2 (7.4%) |
| College/Associate Degree | 7 (87.5%) | 1 (12.5%) |
| Bachelor's Degree or higher | 1 (50.0%) | 1 (50.0%) |
Occupancy by Age of Householder in St Louis
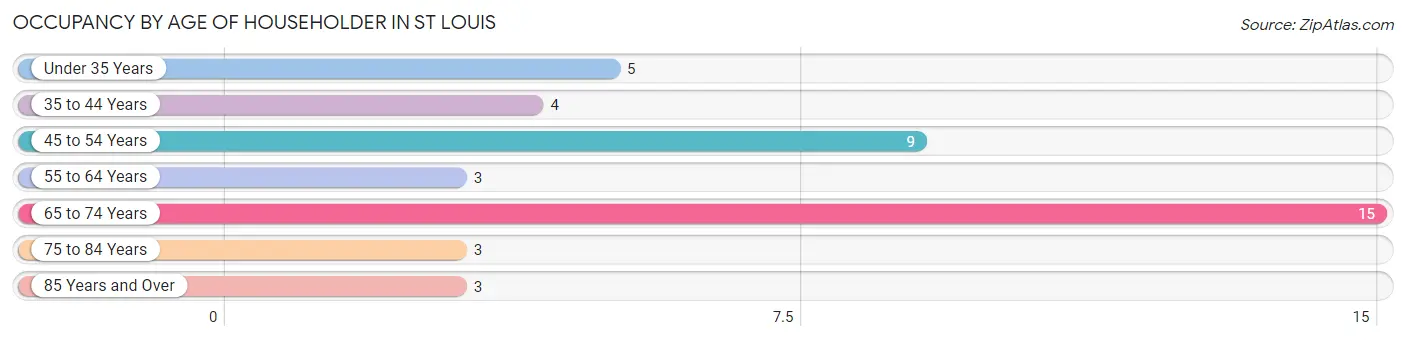
| Age Bracket | # Households | % Households |
| Under 35 Years | 5 | 11.9% |
| 35 to 44 Years | 4 | 9.5% |
| 45 to 54 Years | 9 | 21.4% |
| 55 to 64 Years | 3 | 7.1% |
| 65 to 74 Years | 15 | 35.7% |
| 75 to 84 Years | 3 | 7.1% |
| 85 Years and Over | 3 | 7.1% |
| Total | 42 | 100.0% |
Housing Finances in St Louis
Median Income by Occupancy in St Louis
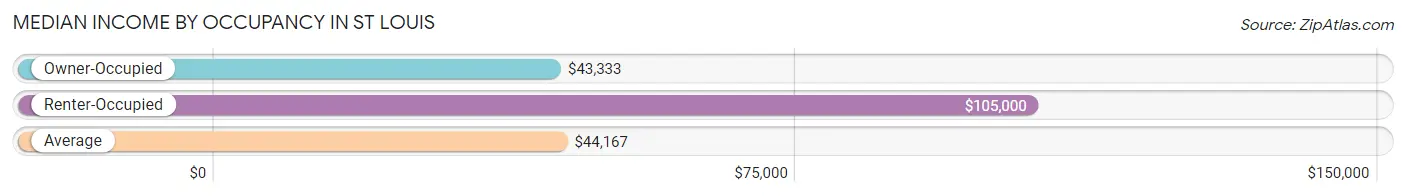
| Occupancy Type | # Households | Median Income |
| Owner-Occupied | 38 (90.5%) | $43,333 |
| Renter-Occupied | 4 (9.5%) | $105,000 |
| Average | 42 (100.0%) | $44,167 |
Occupancy by Householder Income Bracket in St Louis
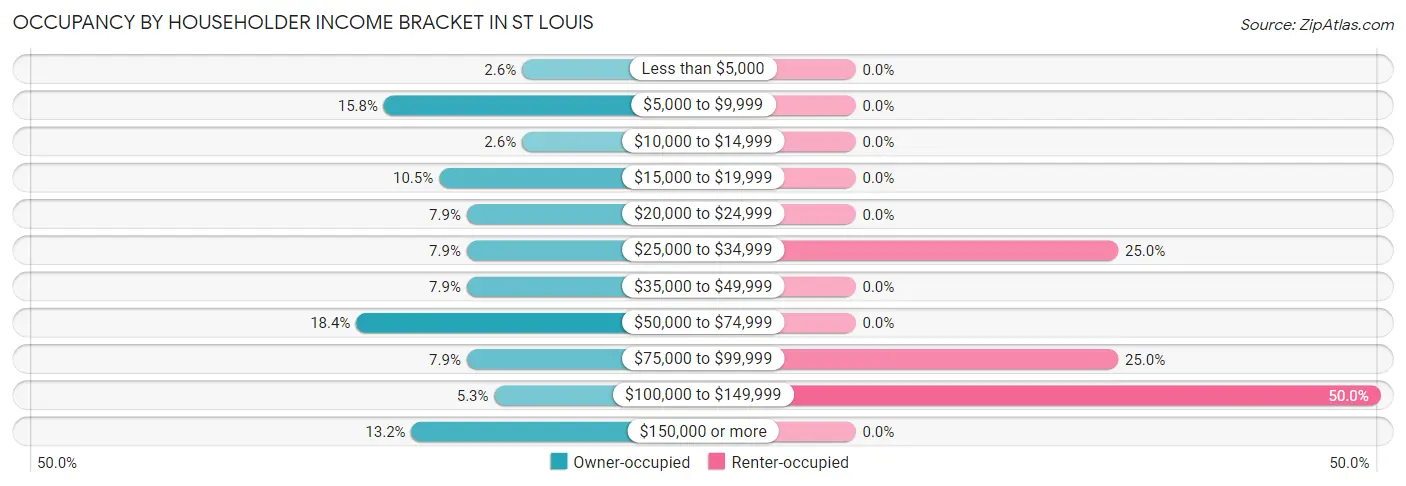
| Income Bracket | Owner-occupied | Renter-occupied |
| Less than $5,000 | 1 (2.6%) | 0 (0.0%) |
| $5,000 to $9,999 | 6 (15.8%) | 0 (0.0%) |
| $10,000 to $14,999 | 1 (2.6%) | 0 (0.0%) |
| $15,000 to $19,999 | 4 (10.5%) | 0 (0.0%) |
| $20,000 to $24,999 | 3 (7.9%) | 0 (0.0%) |
| $25,000 to $34,999 | 3 (7.9%) | 1 (25.0%) |
| $35,000 to $49,999 | 3 (7.9%) | 0 (0.0%) |
| $50,000 to $74,999 | 7 (18.4%) | 0 (0.0%) |
| $75,000 to $99,999 | 3 (7.9%) | 1 (25.0%) |
| $100,000 to $149,999 | 2 (5.3%) | 2 (50.0%) |
| $150,000 or more | 5 (13.2%) | 0 (0.0%) |
| Total | 38 (100.0%) | 4 (100.0%) |
Monthly Housing Cost Tiers in St Louis
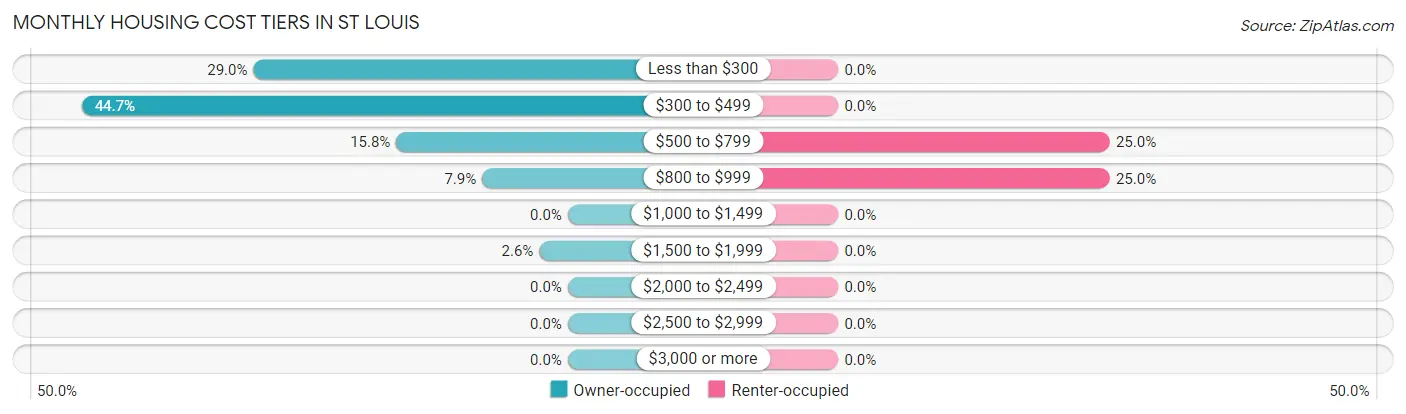
| Monthly Cost | Owner-occupied | Renter-occupied |
| Less than $300 | 11 (28.9%) | 0 (0.0%) |
| $300 to $499 | 17 (44.7%) | 0 (0.0%) |
| $500 to $799 | 6 (15.8%) | 1 (25.0%) |
| $800 to $999 | 3 (7.9%) | 1 (25.0%) |
| $1,000 to $1,499 | 0 (0.0%) | 0 (0.0%) |
| $1,500 to $1,999 | 1 (2.6%) | 0 (0.0%) |
| $2,000 to $2,499 | 0 (0.0%) | 0 (0.0%) |
| $2,500 to $2,999 | 0 (0.0%) | 0 (0.0%) |
| $3,000 or more | 0 (0.0%) | 0 (0.0%) |
| Total | 38 (100.0%) | 4 (100.0%) |
Physical Housing Characteristics in St Louis
Housing Structures in St Louis
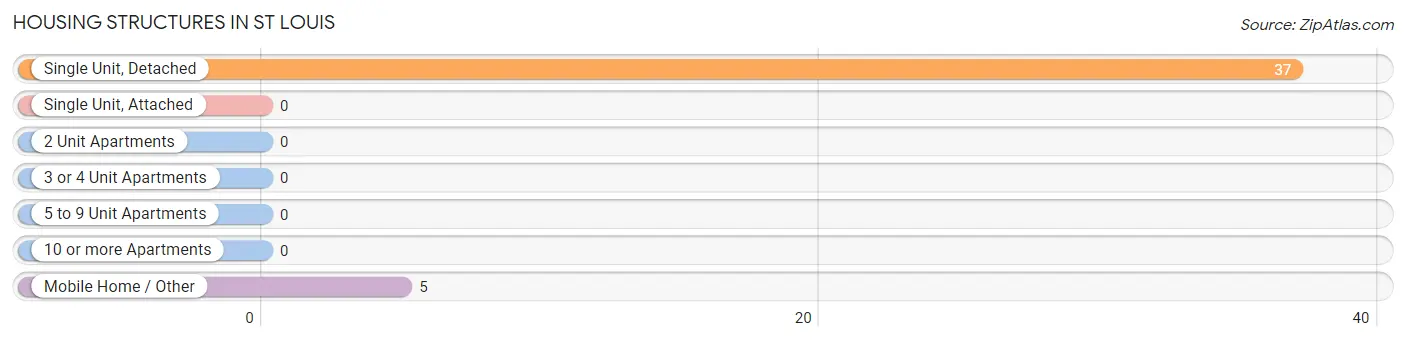
| Structure Type | # Housing Units | % Housing Units |
| Single Unit, Detached | 37 | 88.1% |
| Single Unit, Attached | 0 | 0.0% |
| 2 Unit Apartments | 0 | 0.0% |
| 3 or 4 Unit Apartments | 0 | 0.0% |
| 5 to 9 Unit Apartments | 0 | 0.0% |
| 10 or more Apartments | 0 | 0.0% |
| Mobile Home / Other | 5 | 11.9% |
| Total | 42 | 100.0% |
Housing Structures by Occupancy in St Louis
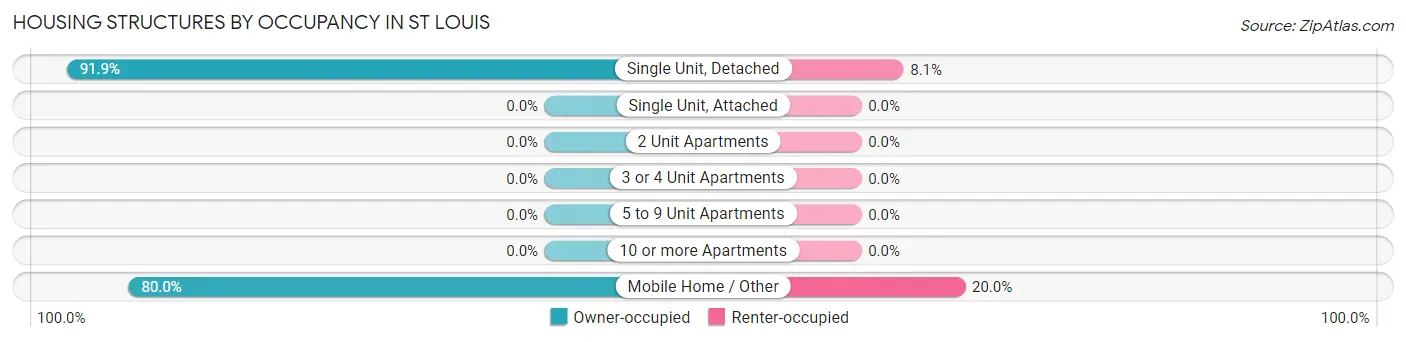
| Structure Type | Owner-occupied | Renter-occupied |
| Single Unit, Detached | 34 (91.9%) | 3 (8.1%) |
| Single Unit, Attached | 0 (0.0%) | 0 (0.0%) |
| 2 Unit Apartments | 0 (0.0%) | 0 (0.0%) |
| 3 or 4 Unit Apartments | 0 (0.0%) | 0 (0.0%) |
| 5 to 9 Unit Apartments | 0 (0.0%) | 0 (0.0%) |
| 10 or more Apartments | 0 (0.0%) | 0 (0.0%) |
| Mobile Home / Other | 4 (80.0%) | 1 (20.0%) |
| Total | 38 (90.5%) | 4 (9.5%) |
Housing Structures by Number of Rooms in St Louis
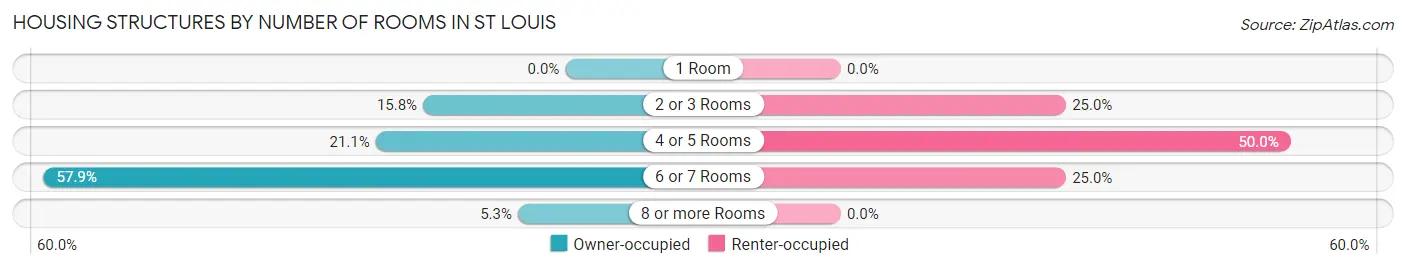
| Number of Rooms | Owner-occupied | Renter-occupied |
| 1 Room | 0 (0.0%) | 0 (0.0%) |
| 2 or 3 Rooms | 6 (15.8%) | 1 (25.0%) |
| 4 or 5 Rooms | 8 (21.0%) | 2 (50.0%) |
| 6 or 7 Rooms | 22 (57.9%) | 1 (25.0%) |
| 8 or more Rooms | 2 (5.3%) | 0 (0.0%) |
| Total | 38 (100.0%) | 4 (100.0%) |
Housing Structure by Heating Type in St Louis
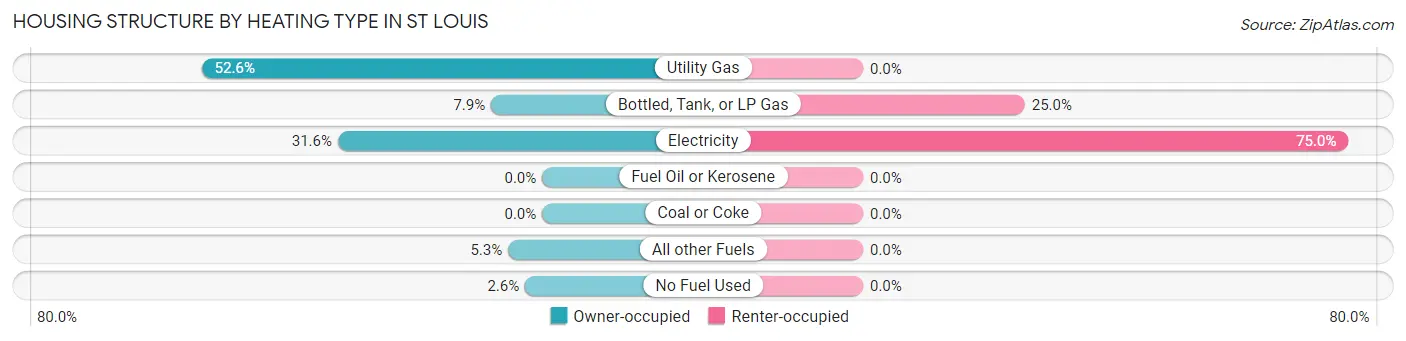
| Heating Type | Owner-occupied | Renter-occupied |
| Utility Gas | 20 (52.6%) | 0 (0.0%) |
| Bottled, Tank, or LP Gas | 3 (7.9%) | 1 (25.0%) |
| Electricity | 12 (31.6%) | 3 (75.0%) |
| Fuel Oil or Kerosene | 0 (0.0%) | 0 (0.0%) |
| Coal or Coke | 0 (0.0%) | 0 (0.0%) |
| All other Fuels | 2 (5.3%) | 0 (0.0%) |
| No Fuel Used | 1 (2.6%) | 0 (0.0%) |
| Total | 38 (100.0%) | 4 (100.0%) |
Household Vehicle Usage in St Louis
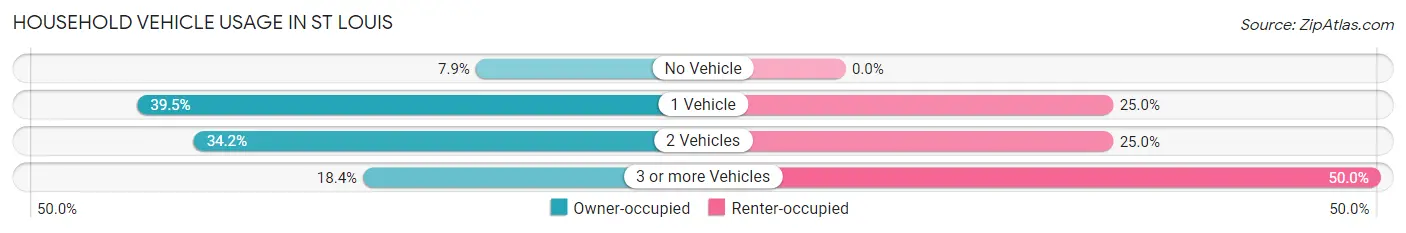
| Vehicles per Household | Owner-occupied | Renter-occupied |
| No Vehicle | 3 (7.9%) | 0 (0.0%) |
| 1 Vehicle | 15 (39.5%) | 1 (25.0%) |
| 2 Vehicles | 13 (34.2%) | 1 (25.0%) |
| 3 or more Vehicles | 7 (18.4%) | 2 (50.0%) |
| Total | 38 (100.0%) | 4 (100.0%) |
Real Estate & Mortgages in St Louis
Real Estate and Mortgage Overview in St Louis
| Characteristic | Without Mortgage | With Mortgage |
| Housing Units | 30 | 8 |
| Median Property Value | $98,300 | $63,300 |
| Median Household Income | - | - |
| Monthly Housing Costs | $369 | $0 |
| Real Estate Taxes | $643 | $0 |
Property Value by Mortgage Status in St Louis
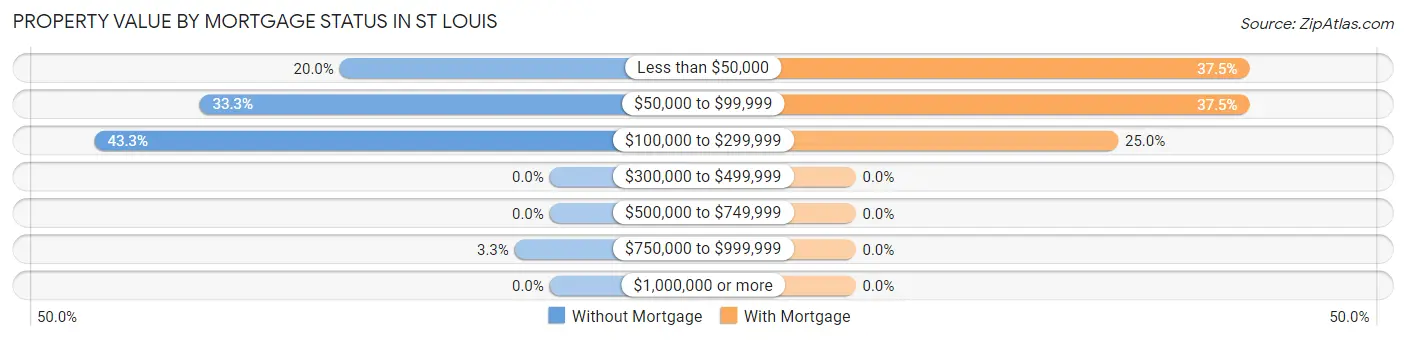
| Property Value | Without Mortgage | With Mortgage |
| Less than $50,000 | 6 (20.0%) | 3 (37.5%) |
| $50,000 to $99,999 | 10 (33.3%) | 3 (37.5%) |
| $100,000 to $299,999 | 13 (43.3%) | 2 (25.0%) |
| $300,000 to $499,999 | 0 (0.0%) | 0 (0.0%) |
| $500,000 to $749,999 | 0 (0.0%) | 0 (0.0%) |
| $750,000 to $999,999 | 1 (3.3%) | 0 (0.0%) |
| $1,000,000 or more | 0 (0.0%) | 0 (0.0%) |
| Total | 30 (100.0%) | 8 (100.0%) |
Household Income by Mortgage Status in St Louis
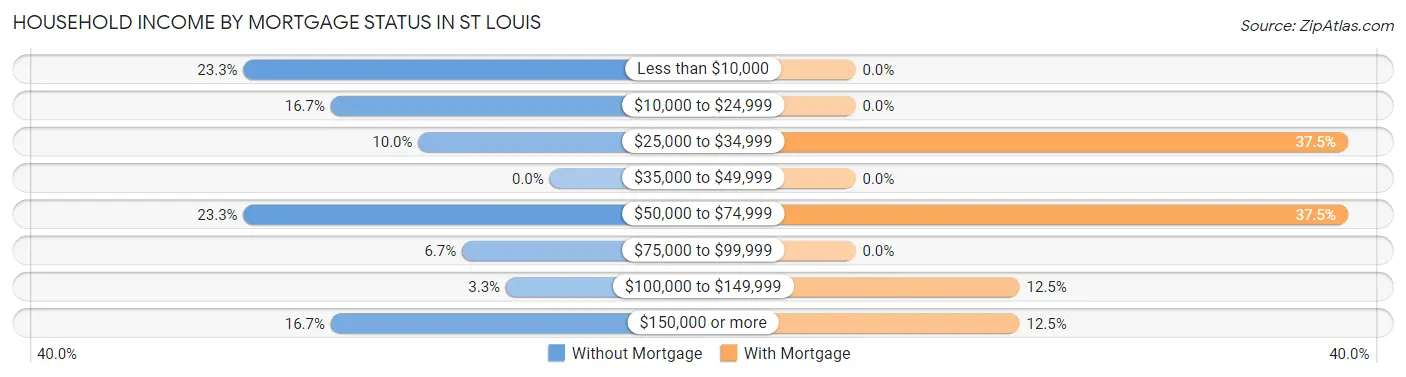
| Household Income | Without Mortgage | With Mortgage |
| Less than $10,000 | 7 (23.3%) | 0 (0.0%) |
| $10,000 to $24,999 | 5 (16.7%) | 0 (0.0%) |
| $25,000 to $34,999 | 3 (10.0%) | 3 (37.5%) |
| $35,000 to $49,999 | 0 (0.0%) | 0 (0.0%) |
| $50,000 to $74,999 | 7 (23.3%) | 3 (37.5%) |
| $75,000 to $99,999 | 2 (6.7%) | 0 (0.0%) |
| $100,000 to $149,999 | 1 (3.3%) | 1 (12.5%) |
| $150,000 or more | 5 (16.7%) | 1 (12.5%) |
| Total | 30 (100.0%) | 8 (100.0%) |
Property Value to Household Income Ratio in St Louis
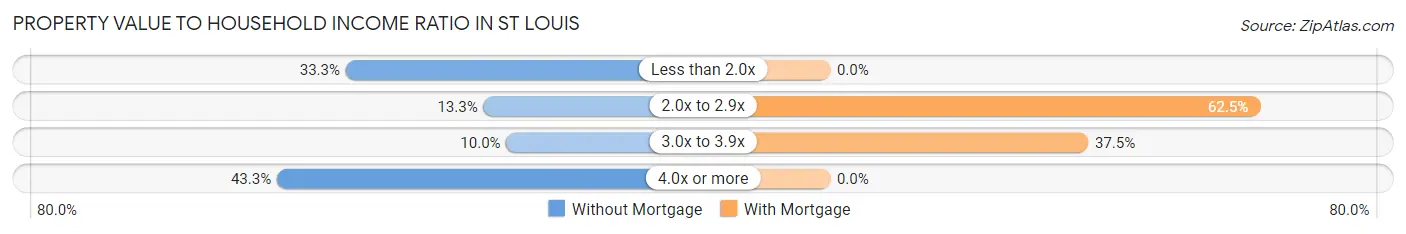
| Value-to-Income Ratio | Without Mortgage | With Mortgage |
| Less than 2.0x | 10 (33.3%) | 0 (0.0%) |
| 2.0x to 2.9x | 4 (13.3%) | 5 (62.5%) |
| 3.0x to 3.9x | 3 (10.0%) | 3 (37.5%) |
| 4.0x or more | 13 (43.3%) | 0 (0.0%) |
| Total | 30 (100.0%) | 8 (100.0%) |
Real Estate Taxes by Mortgage Status in St Louis
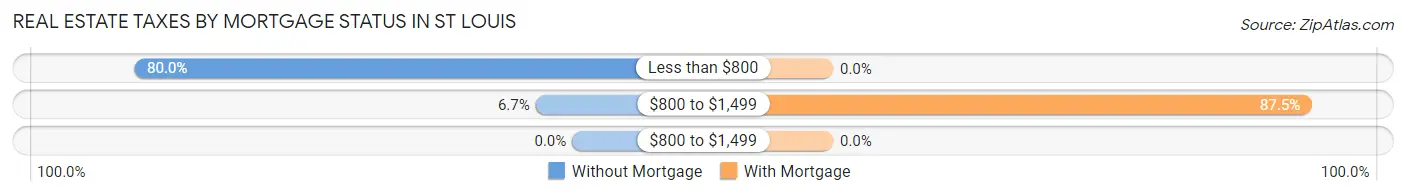
| Property Taxes | Without Mortgage | With Mortgage |
| Less than $800 | 24 (80.0%) | 0 (0.0%) |
| $800 to $1,499 | 2 (6.7%) | 7 (87.5%) |
| $800 to $1,499 | 0 (0.0%) | 0 (0.0%) |
| Total | 30 (100.0%) | 8 (100.0%) |
Health & Disability in St Louis
Health Insurance Coverage by Age in St Louis
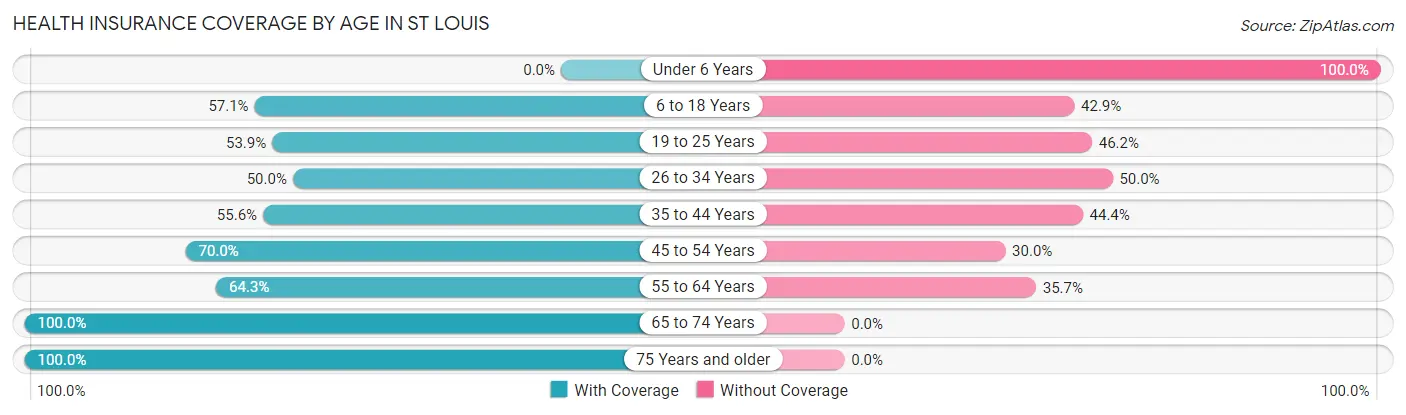
| Age Bracket | With Coverage | Without Coverage |
| Under 6 Years | 0 (0.0%) | 2 (100.0%) |
| 6 to 18 Years | 4 (57.1%) | 3 (42.9%) |
| 19 to 25 Years | 7 (53.8%) | 6 (46.2%) |
| 26 to 34 Years | 2 (50.0%) | 2 (50.0%) |
| 35 to 44 Years | 5 (55.6%) | 4 (44.4%) |
| 45 to 54 Years | 7 (70.0%) | 3 (30.0%) |
| 55 to 64 Years | 9 (64.3%) | 5 (35.7%) |
| 65 to 74 Years | 18 (100.0%) | 0 (0.0%) |
| 75 Years and older | 8 (100.0%) | 0 (0.0%) |
| Total | 60 (70.6%) | 25 (29.4%) |
Health Insurance Coverage by Citizenship Status in St Louis
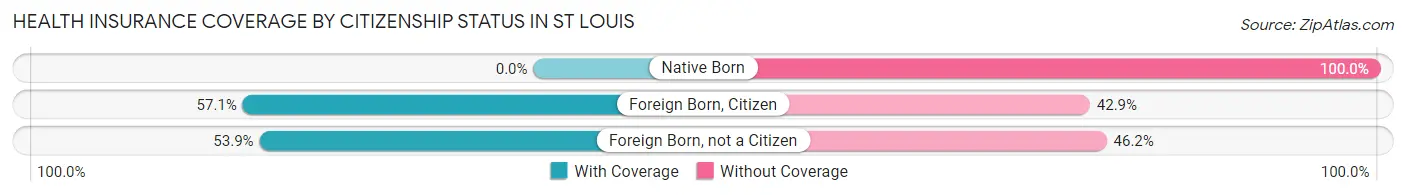
| Citizenship Status | With Coverage | Without Coverage |
| Native Born | 0 (0.0%) | 2 (100.0%) |
| Foreign Born, Citizen | 4 (57.1%) | 3 (42.9%) |
| Foreign Born, not a Citizen | 7 (53.8%) | 6 (46.2%) |
Health Insurance Coverage by Household Income in St Louis
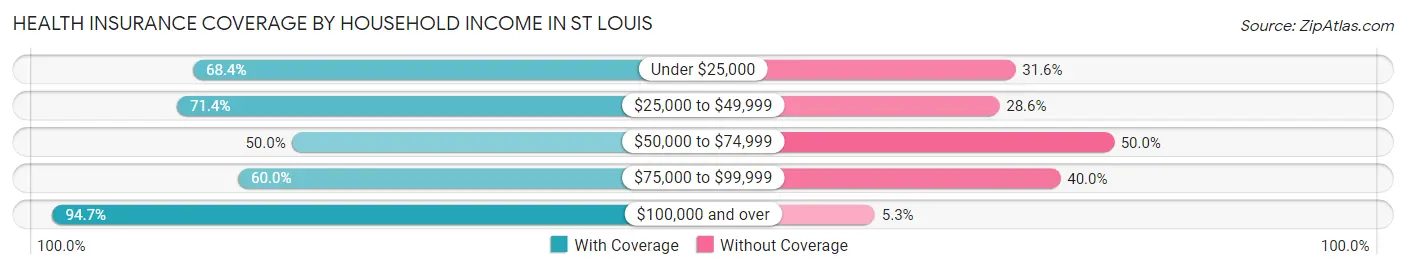
| Household Income | With Coverage | Without Coverage |
| Under $25,000 | 13 (68.4%) | 6 (31.6%) |
| $25,000 to $49,999 | 15 (71.4%) | 6 (28.6%) |
| $50,000 to $74,999 | 8 (50.0%) | 8 (50.0%) |
| $75,000 to $99,999 | 6 (60.0%) | 4 (40.0%) |
| $100,000 and over | 18 (94.7%) | 1 (5.3%) |
Public vs Private Health Insurance Coverage by Age in St Louis
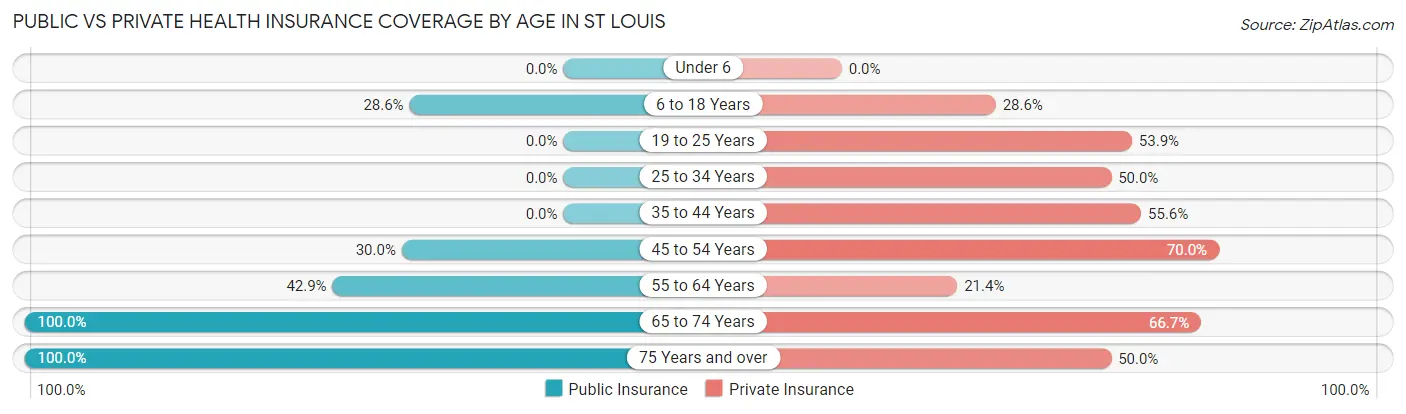
| Age Bracket | Public Insurance | Private Insurance |
| Under 6 | 0 (0.0%) | 0 (0.0%) |
| 6 to 18 Years | 2 (28.6%) | 2 (28.6%) |
| 19 to 25 Years | 0 (0.0%) | 7 (53.8%) |
| 25 to 34 Years | 0 (0.0%) | 2 (50.0%) |
| 35 to 44 Years | 0 (0.0%) | 5 (55.6%) |
| 45 to 54 Years | 3 (30.0%) | 7 (70.0%) |
| 55 to 64 Years | 6 (42.9%) | 3 (21.4%) |
| 65 to 74 Years | 18 (100.0%) | 12 (66.7%) |
| 75 Years and over | 8 (100.0%) | 4 (50.0%) |
| Total | 37 (43.5%) | 42 (49.4%) |
Disability Status by Sex by Age in St Louis
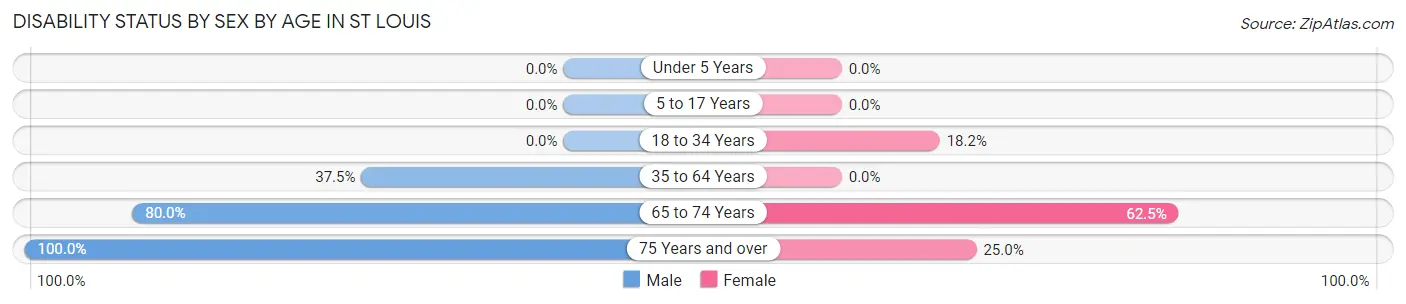
| Age Bracket | Male | Female |
| Under 5 Years | 0 (0.0%) | 0 (0.0%) |
| 5 to 17 Years | 0 (0.0%) | 0 (0.0%) |
| 18 to 34 Years | 0 (0.0%) | 2 (18.2%) |
| 35 to 64 Years | 6 (37.5%) | 0 (0.0%) |
| 65 to 74 Years | 8 (80.0%) | 5 (62.5%) |
| 75 Years and over | 4 (100.0%) | 1 (25.0%) |
Disability Class by Sex by Age in St Louis
Disability Class: Hearing Difficulty
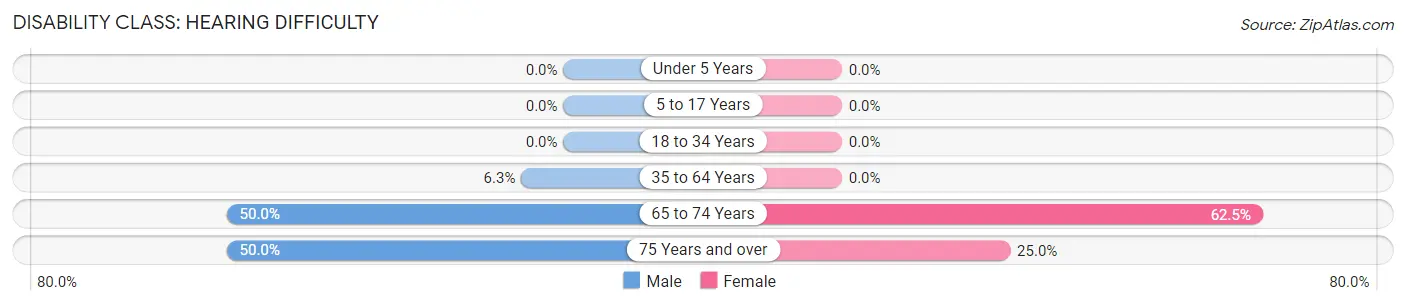
| Age Bracket | Male | Female |
| Under 5 Years | 0 (0.0%) | 0 (0.0%) |
| 5 to 17 Years | 0 (0.0%) | 0 (0.0%) |
| 18 to 34 Years | 0 (0.0%) | 0 (0.0%) |
| 35 to 64 Years | 1 (6.2%) | 0 (0.0%) |
| 65 to 74 Years | 5 (50.0%) | 5 (62.5%) |
| 75 Years and over | 2 (50.0%) | 1 (25.0%) |
Disability Class: Vision Difficulty
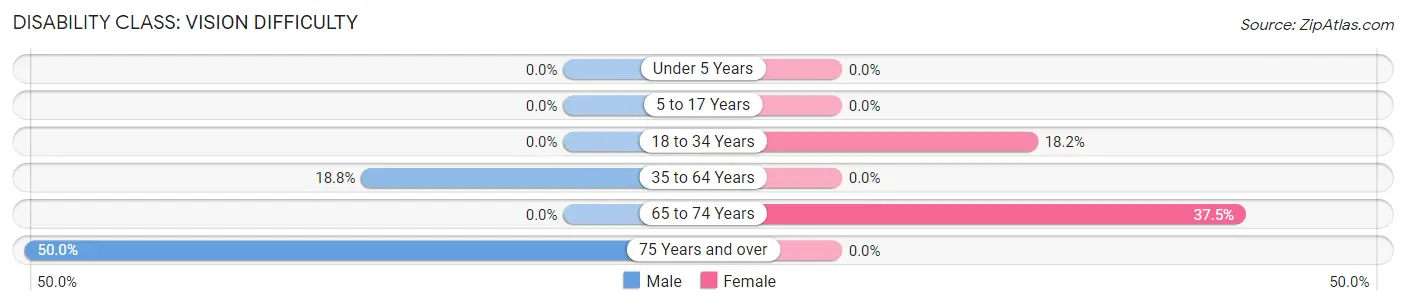
| Age Bracket | Male | Female |
| Under 5 Years | 0 (0.0%) | 0 (0.0%) |
| 5 to 17 Years | 0 (0.0%) | 0 (0.0%) |
| 18 to 34 Years | 0 (0.0%) | 2 (18.2%) |
| 35 to 64 Years | 3 (18.8%) | 0 (0.0%) |
| 65 to 74 Years | 0 (0.0%) | 3 (37.5%) |
| 75 Years and over | 2 (50.0%) | 0 (0.0%) |
Disability Class: Cognitive Difficulty
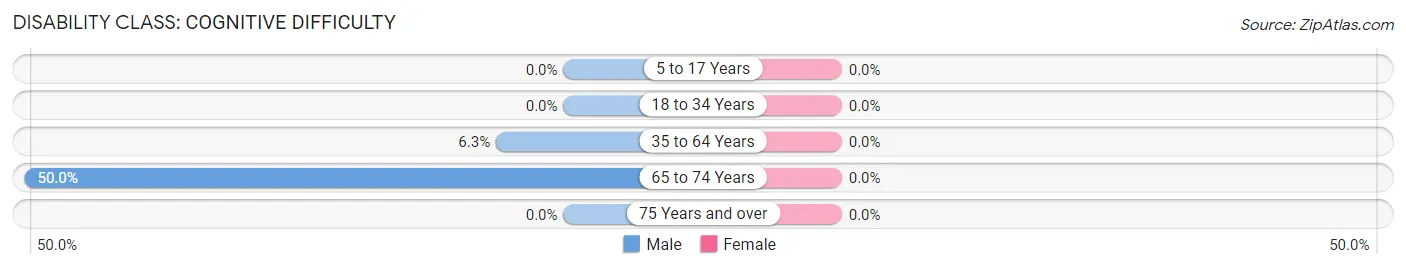
| Age Bracket | Male | Female |
| 5 to 17 Years | 0 (0.0%) | 0 (0.0%) |
| 18 to 34 Years | 0 (0.0%) | 0 (0.0%) |
| 35 to 64 Years | 1 (6.2%) | 0 (0.0%) |
| 65 to 74 Years | 5 (50.0%) | 0 (0.0%) |
| 75 Years and over | 0 (0.0%) | 0 (0.0%) |
Disability Class: Ambulatory Difficulty
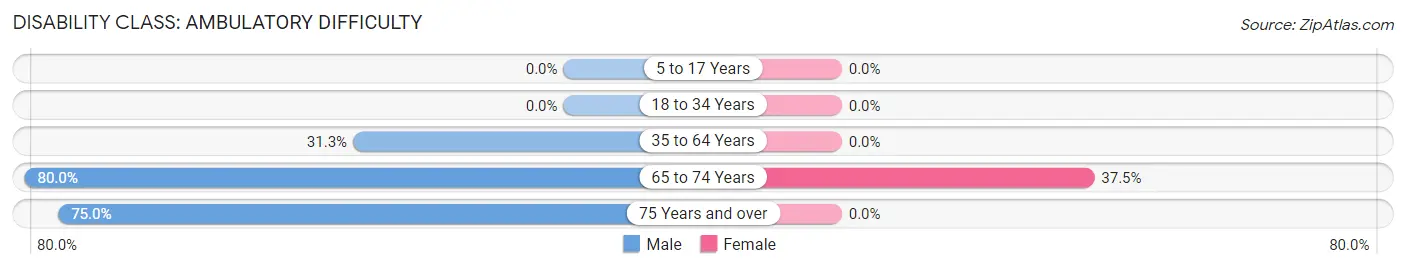
| Age Bracket | Male | Female |
| 5 to 17 Years | 0 (0.0%) | 0 (0.0%) |
| 18 to 34 Years | 0 (0.0%) | 0 (0.0%) |
| 35 to 64 Years | 5 (31.2%) | 0 (0.0%) |
| 65 to 74 Years | 8 (80.0%) | 3 (37.5%) |
| 75 Years and over | 3 (75.0%) | 0 (0.0%) |
Disability Class: Self-Care Difficulty
| Age Bracket | Male | Female |
| 5 to 17 Years | 0 (0.0%) | 0 (0.0%) |
| 18 to 34 Years | 0 (0.0%) | 0 (0.0%) |
| 35 to 64 Years | 0 (0.0%) | 0 (0.0%) |
| 65 to 74 Years | 0 (0.0%) | 0 (0.0%) |
| 75 Years and over | 0 (0.0%) | 0 (0.0%) |
Technology Access in St Louis
Computing Device Access in St Louis
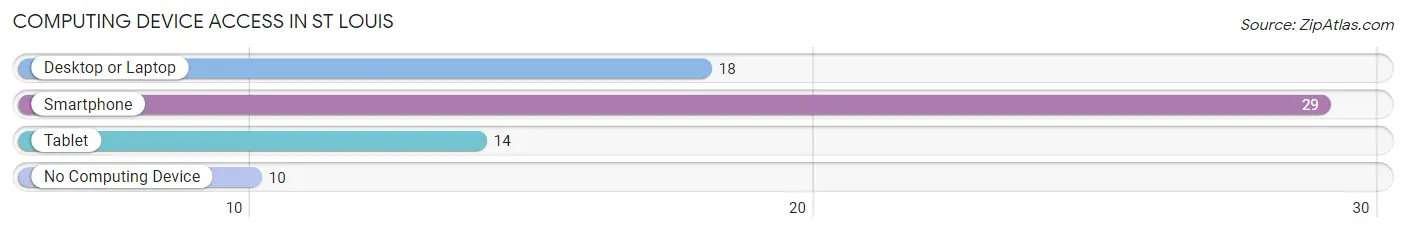
| Device Type | # Households | % Households |
| Desktop or Laptop | 18 | 42.9% |
| Smartphone | 29 | 69.1% |
| Tablet | 14 | 33.3% |
| No Computing Device | 10 | 23.8% |
| Total | 42 | 100.0% |
Internet Access in St Louis
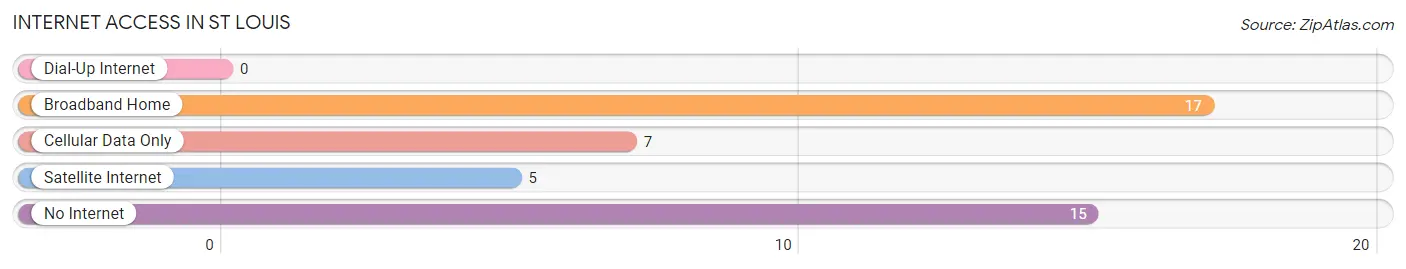
| Internet Type | # Households | % Households |
| Dial-Up Internet | 0 | 0.0% |
| Broadband Home | 17 | 40.5% |
| Cellular Data Only | 7 | 16.7% |
| Satellite Internet | 5 | 11.9% |
| No Internet | 15 | 35.7% |
| Total | 42 | 100.0% |
St Louis Summary
St. Louis is a small town located in the northeast corner of Oklahoma, in the foothills of the Ozark Mountains. It is situated in the county of Adair, and is part of the Tahlequah Micropolitan Statistical Area. The town has a population of just over 1,000 people, and is known for its rural charm and friendly atmosphere.
History
St. Louis was founded in 1891 by a group of settlers from St. Louis, Missouri. The town was named after the city in Missouri, and was originally intended to be a trading post for the local Native American tribes. The town quickly grew, and by the early 1900s, it had become a thriving community.
The town was incorporated in 1907, and the first mayor was elected in 1908. The town continued to grow, and by the 1920s, it had become a popular tourist destination. The town was known for its beautiful scenery, and was a popular spot for fishing and hunting.
During the Great Depression, the town suffered economically, and many of the businesses closed. However, the town was able to recover, and by the 1950s, it had become a popular destination for tourists once again.
Geography
St. Louis is located in the northeast corner of Oklahoma, in the foothills of the Ozark Mountains. The town is situated in the county of Adair, and is part of the Tahlequah Micropolitan Statistical Area. The town is located at the intersection of US Highway 59 and State Highway 10.
The town is situated on the banks of the Illinois River, and is surrounded by rolling hills and lush forests. The town is located in a temperate climate, and experiences mild winters and hot summers.
Economy
The economy of St. Louis is largely based on tourism and agriculture. The town is home to several tourist attractions, including the St. Louis Museum, the St. Louis Zoo, and the St. Louis Aquarium. The town is also home to several wineries, and is a popular destination for wine tasting.
Agriculture is also an important part of the local economy. The town is home to several farms, and produces a variety of crops, including corn, soybeans, and wheat. The town is also home to several livestock farms, and is a popular destination for hunting and fishing.
Demographics
As of the 2010 census, the population of St. Louis was 1,037. The town has a population density of 5.3 people per square mile. The median age of the population is 41.7 years, and the median household income is $35,000.
The town is predominantly white, with 92.3% of the population identifying as such. The town is also home to a small Hispanic population, with 4.2% of the population identifying as such. The town is also home to a small Native American population, with 1.2% of the population identifying as such.
Conclusion
St. Louis is a small town located in the northeast corner of Oklahoma, in the foothills of the Ozark Mountains. The town has a population of just over 1,000 people, and is known for its rural charm and friendly atmosphere. The town is largely based on tourism and agriculture, and is home to several tourist attractions, wineries, and farms. The town is predominantly white, with 92.3% of the population identifying as such. The town is also home to a small Hispanic and Native American population.
Common Questions
What is Per Capita Income in St Louis?
Per Capita income in St Louis is $31,728.
What is the Median Family Income in St Louis?
Median Family Income in St Louis is $65,000.
What is the Median Household income in St Louis?
Median Household Income in St Louis is $44,167.
What is Income or Wage Gap in St Louis?
Income or Wage Gap in St Louis is 69.2%.
Women in St Louis earn 30.8 cents for every dollar earned by a man.
What is Family Income Deficit in St Louis?
Family Income Deficit in St Louis is $7,620.
Families that are below poverty line in St Louis earn $7,620 less on average than the poverty threshold level.
What is Inequality or Gini Index in St Louis?
Inequality or Gini Index in St Louis is 0.47.
What is the Total Population of St Louis?
Total Population of St Louis is 85.
What is the Total Male Population of St Louis?
Total Male Population of St Louis is 41.
What is the Total Female Population of St Louis?
Total Female Population of St Louis is 44.
What is the Ratio of Males per 100 Females in St Louis?
There are 93.18 Males per 100 Females in St Louis.
What is the Ratio of Females per 100 Males in St Louis?
There are 107.32 Females per 100 Males in St Louis.
What is the Median Population Age in St Louis?
Median Population Age in St Louis is 51.5 Years.
What is the Average Family Size in St Louis
Average Family Size in St Louis is 2.6 People.
What is the Average Household Size in St Louis
Average Household Size in St Louis is 2.0 People.
How Large is the Labor Force in St Louis?
There are 44 People in the Labor Forcein in St Louis.
What is the Percentage of People in the Labor Force in St Louis?
57.1% of People are in the Labor Force in St Louis.
What is the Unemployment Rate in St Louis?
Unemployment Rate in St Louis is 11.4%.