Medford, OK Map & Demographics
Medford Map

Medford Overview
$29,468
PER CAPITA INCOME
$89,097
AVG FAMILY INCOME
$51,154
AVG HOUSEHOLD INCOME
36.8%
WAGE / INCOME GAP [ % ]
63.2¢/ $1
WAGE / INCOME GAP [ $ ]
$3,556
FAMILY INCOME DEFICIT
0.44
INEQUALITY / GINI INDEX
949
TOTAL POPULATION
503
MALE POPULATION
446
FEMALE POPULATION
112.78
MALES / 100 FEMALES
88.67
FEMALES / 100 MALES
41.2
MEDIAN AGE
3.4
AVG FAMILY SIZE
2.4
AVG HOUSEHOLD SIZE
421
LABOR FORCE [ PEOPLE ]
55.1%
PERCENT IN LABOR FORCE
0.2%
UNEMPLOYMENT RATE
Medford Zip Codes
Medford Area Codes
Income in Medford
Income Overview in Medford
Per Capita Income in Medford is $29,468, while median incomes of families and households are $89,097 and $51,154 respectively.
| Characteristic | Number | Measure |
| Per Capita Income | 949 | $29,468 |
| Median Family Income | 181 | $89,097 |
| Mean Family Income | 181 | $89,258 |
| Median Household Income | 372 | $51,154 |
| Mean Household Income | 372 | $64,493 |
| Income Deficit | 181 | $3,556 |
| Wage / Income Gap (%) | 949 | 36.82% |
| Wage / Income Gap ($) | 949 | 63.18¢ per $1 |
| Gini / Inequality Index | 949 | 0.44 |
Earnings by Sex in Medford
Average Earnings in Medford are $42,609, $48,140 for men and $30,417 for women, a difference of 36.8%.
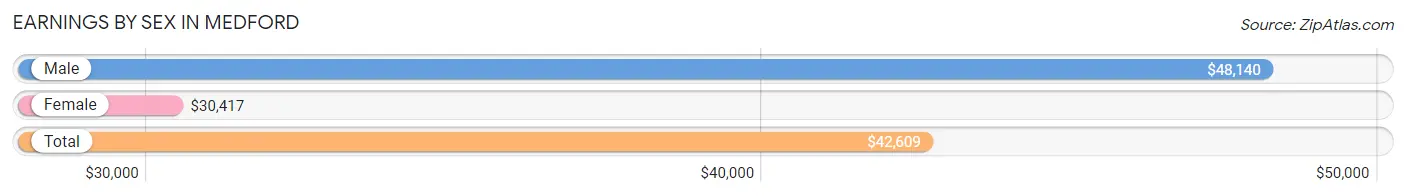
| Sex | Number | Average Earnings |
| Male | 263 (57.9%) | $48,140 |
| Female | 191 (42.1%) | $30,417 |
| Total | 454 (100.0%) | $42,609 |
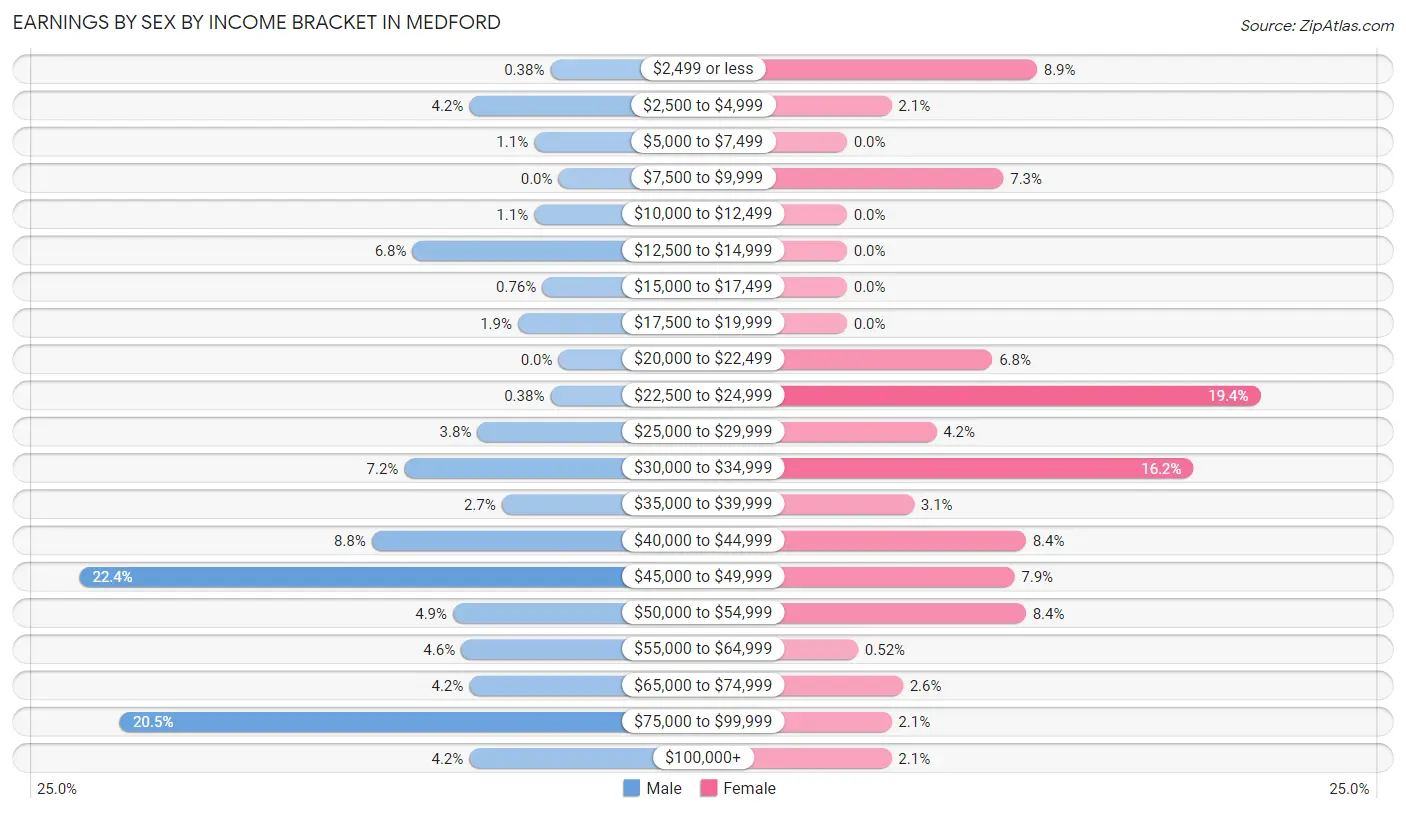
Earnings by Sex by Income Bracket in Medford
The most common earnings brackets in Medford are $45,000 to $49,999 for men (59 | 22.4%) and $22,500 to $24,999 for women (37 | 19.4%).
| Income | Male | Female |
| $2,499 or less | 1 (0.4%) | 17 (8.9%) |
| $2,500 to $4,999 | 11 (4.2%) | 4 (2.1%) |
| $5,000 to $7,499 | 3 (1.1%) | 0 (0.0%) |
| $7,500 to $9,999 | 0 (0.0%) | 14 (7.3%) |
| $10,000 to $12,499 | 3 (1.1%) | 0 (0.0%) |
| $12,500 to $14,999 | 18 (6.8%) | 0 (0.0%) |
| $15,000 to $17,499 | 2 (0.8%) | 0 (0.0%) |
| $17,500 to $19,999 | 5 (1.9%) | 0 (0.0%) |
| $20,000 to $22,499 | 0 (0.0%) | 13 (6.8%) |
| $22,500 to $24,999 | 1 (0.4%) | 37 (19.4%) |
| $25,000 to $29,999 | 10 (3.8%) | 8 (4.2%) |
| $30,000 to $34,999 | 19 (7.2%) | 31 (16.2%) |
| $35,000 to $39,999 | 7 (2.7%) | 6 (3.1%) |
| $40,000 to $44,999 | 23 (8.7%) | 16 (8.4%) |
| $45,000 to $49,999 | 59 (22.4%) | 15 (7.9%) |
| $50,000 to $54,999 | 13 (4.9%) | 16 (8.4%) |
| $55,000 to $64,999 | 12 (4.6%) | 1 (0.5%) |
| $65,000 to $74,999 | 11 (4.2%) | 5 (2.6%) |
| $75,000 to $99,999 | 54 (20.5%) | 4 (2.1%) |
| $100,000+ | 11 (4.2%) | 4 (2.1%) |
| Total | 263 (100.0%) | 191 (100.0%) |
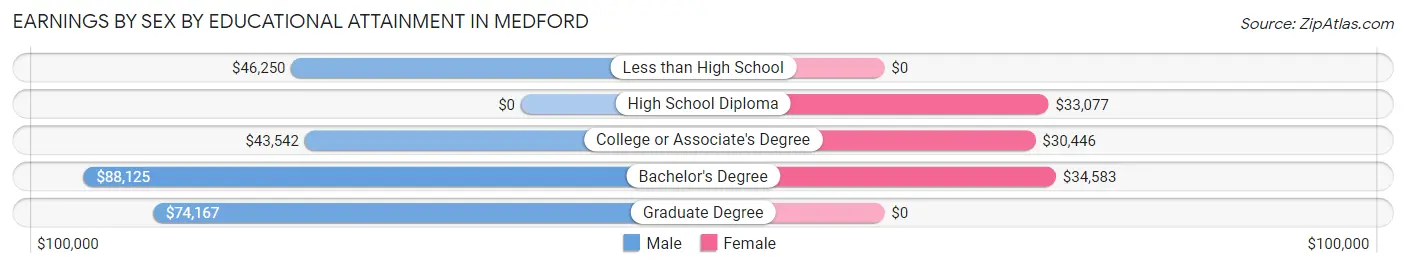
Earnings by Sex by Educational Attainment in Medford
Average earnings in Medford are $46,389 for men and $32,083 for women, a difference of 30.8%. Men with an educational attainment of bachelor's degree enjoy the highest average annual earnings of $88,125, while those with college or associate's degree education earn the least with $43,542. Women with an educational attainment of bachelor's degree earn the most with the average annual earnings of $34,583, while those with college or associate's degree education have the smallest earnings of $30,446.
| Educational Attainment | Male Income | Female Income |
| Less than High School | $46,250 | $0 |
| High School Diploma | - | - |
| College or Associate's Degree | $43,542 | $30,446 |
| Bachelor's Degree | $88,125 | $34,583 |
| Graduate Degree | $74,167 | $0 |
| Total | $46,389 | $32,083 |
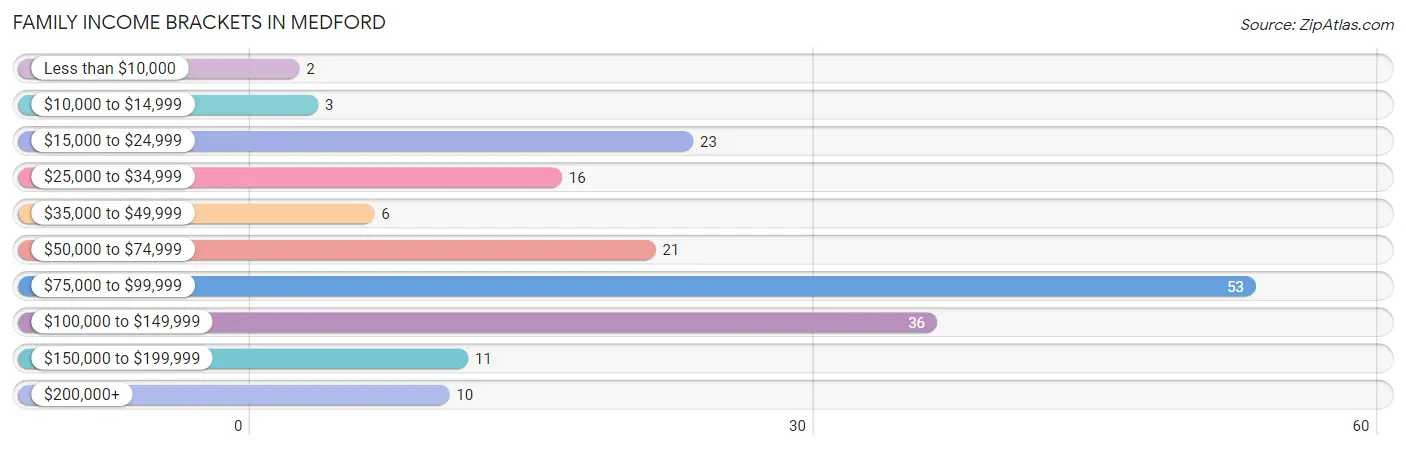
Family Income in Medford
Family Income Brackets in Medford
According to the Medford family income data, there are 53 families falling into the $75,000 to $99,999 income range, which is the most common income bracket and makes up 29.3% of all families. Conversely, the less than $10,000 income bracket is the least frequent group with only 2 families (1.1%) belonging to this category.
| Income Bracket | # Families | % Families |
| Less than $10,000 | 2 | 1.1% |
| $10,000 to $14,999 | 3 | 1.7% |
| $15,000 to $24,999 | 23 | 12.7% |
| $25,000 to $34,999 | 16 | 8.8% |
| $35,000 to $49,999 | 6 | 3.3% |
| $50,000 to $74,999 | 21 | 11.6% |
| $75,000 to $99,999 | 53 | 29.3% |
| $100,000 to $149,999 | 36 | 19.9% |
| $150,000 to $199,999 | 11 | 6.1% |
| $200,000+ | 10 | 5.5% |
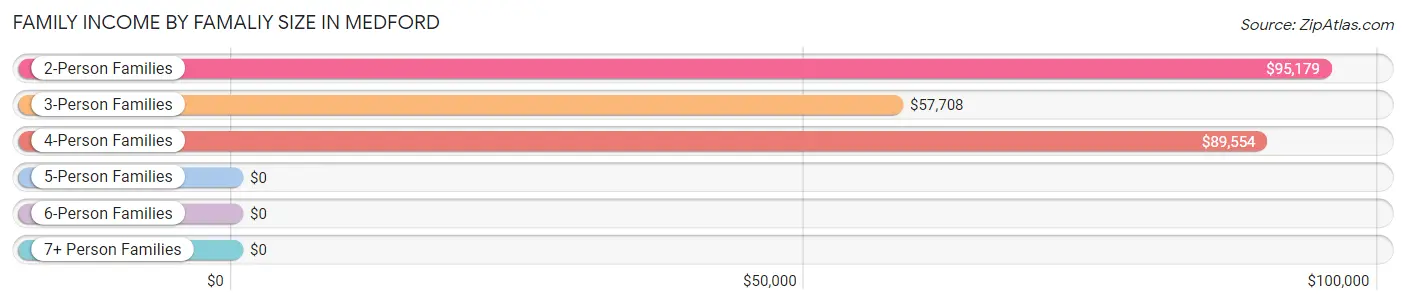
Family Income by Famaliy Size in Medford
2-person families (117 | 64.6%) account for the highest median family income in Medford with $95,179 per family, while 2-person families (117 | 64.6%) have the highest median income of $47,590 per family member.
| Income Bracket | # Families | Median Income |
| 2-Person Families | 117 (64.6%) | $95,179 |
| 3-Person Families | 19 (10.5%) | $57,708 |
| 4-Person Families | 31 (17.1%) | $89,554 |
| 5-Person Families | 4 (2.2%) | $0 |
| 6-Person Families | 0 (0.0%) | $0 |
| 7+ Person Families | 10 (5.5%) | $0 |
| Total | 181 (100.0%) | $89,097 |
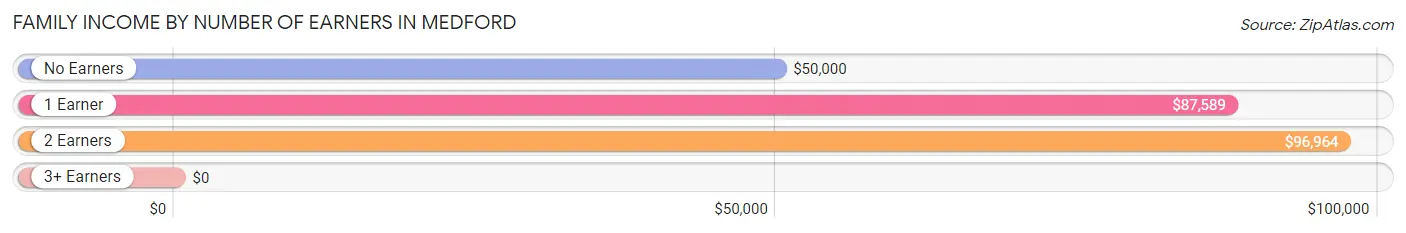
Family Income by Number of Earners in Medford
| Number of Earners | # Families | Median Income |
| No Earners | 38 (21.0%) | $50,000 |
| 1 Earner | 77 (42.5%) | $87,589 |
| 2 Earners | 58 (32.0%) | $96,964 |
| 3+ Earners | 8 (4.4%) | $0 |
| Total | 181 (100.0%) | $89,097 |
Household Income in Medford
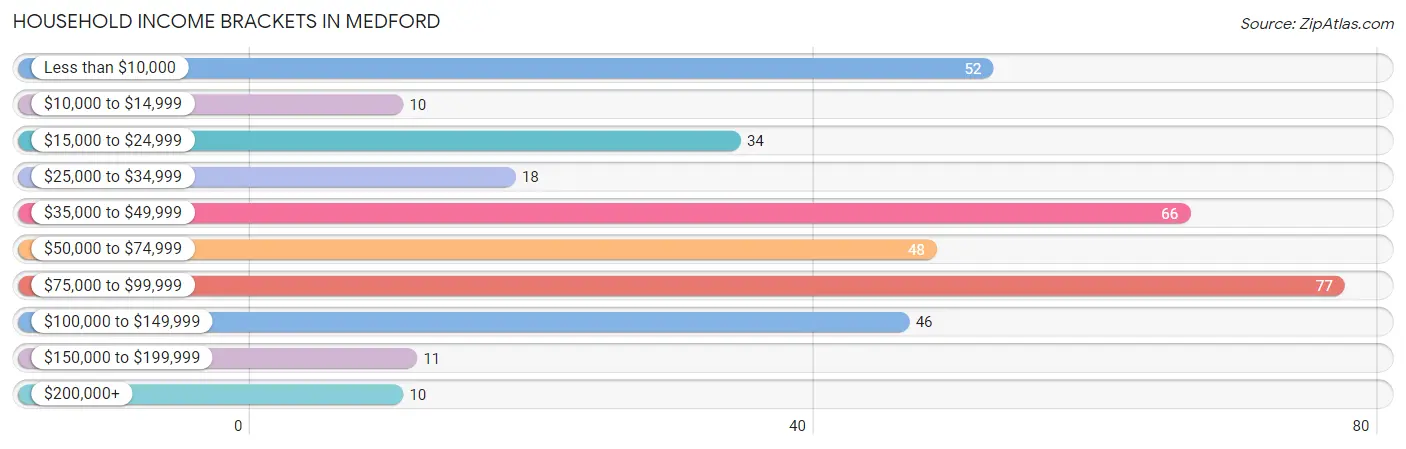
Household Income Brackets in Medford
With 77 households falling in the category, the $75,000 to $99,999 income range is the most frequent in Medford, accounting for 20.7% of all households. In contrast, only 10 households (2.7%) fall into the $10,000 to $14,999 income bracket, making it the least populous group.
| Income Bracket | # Households | % Households |
| Less than $10,000 | 52 | 14.0% |
| $10,000 to $14,999 | 10 | 2.7% |
| $15,000 to $24,999 | 34 | 9.1% |
| $25,000 to $34,999 | 18 | 4.8% |
| $35,000 to $49,999 | 66 | 17.7% |
| $50,000 to $74,999 | 48 | 12.9% |
| $75,000 to $99,999 | 77 | 20.7% |
| $100,000 to $149,999 | 46 | 12.4% |
| $150,000 to $199,999 | 11 | 3.0% |
| $200,000+ | 10 | 2.7% |
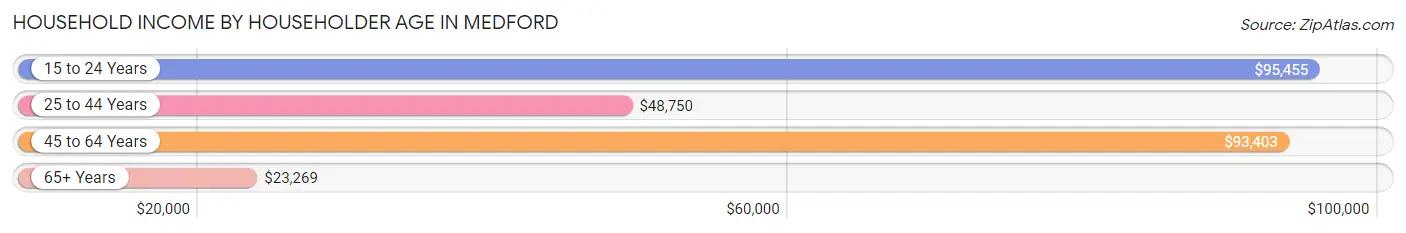
Household Income by Householder Age in Medford
The median household income in Medford is $51,154, with the highest median household income of $95,455 found in the 15 to 24 years age bracket for the primary householder. A total of 18 households (4.8%) fall into this category. Meanwhile, the 65+ years age bracket for the primary householder has the lowest median household income of $23,269, with 142 households (38.2%) in this group.
| Income Bracket | # Households | Median Income |
| 15 to 24 Years | 18 (4.8%) | $95,455 |
| 25 to 44 Years | 107 (28.8%) | $48,750 |
| 45 to 64 Years | 105 (28.2%) | $93,403 |
| 65+ Years | 142 (38.2%) | $23,269 |
| Total | 372 (100.0%) | $51,154 |
Poverty in Medford
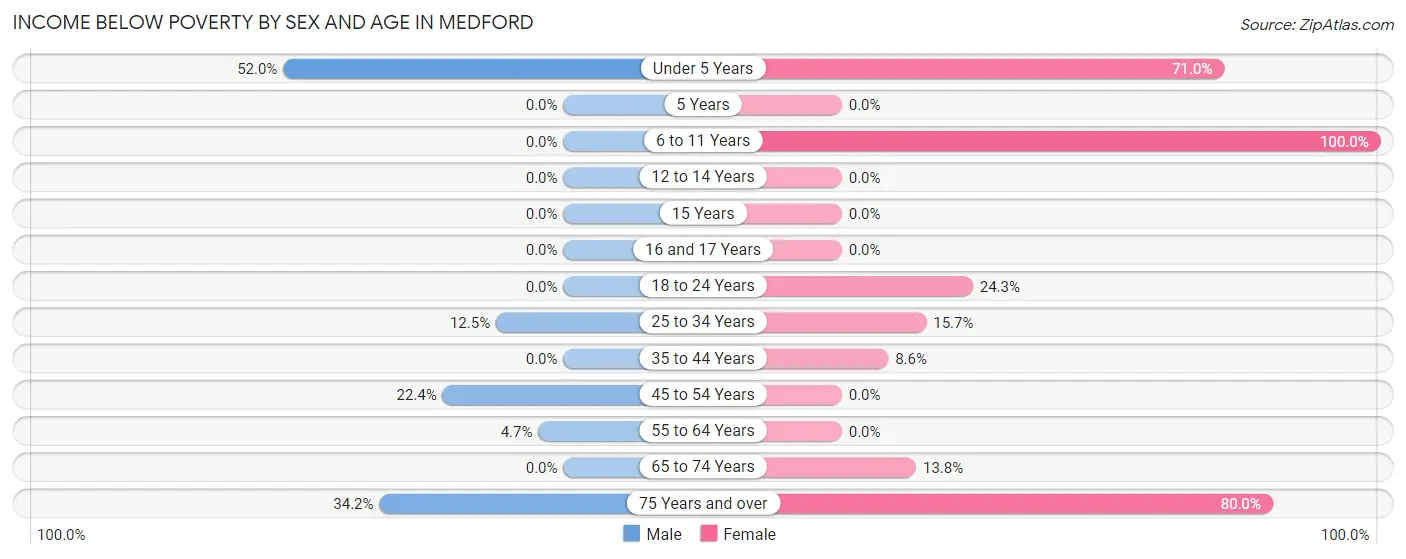
Income Below Poverty by Sex and Age in Medford
With 10.6% poverty level for males and 25.2% for females among the residents of Medford, under 5 year old males and 6 to 11 year old females are the most vulnerable to poverty, with 13 males (52.0%) and 5 females (100.0%) in their respective age groups living below the poverty level.
| Age Bracket | Male | Female |
| Under 5 Years | 13 (52.0%) | 22 (71.0%) |
| 5 Years | 0 (0.0%) | 0 (0.0%) |
| 6 to 11 Years | 0 (0.0%) | 5 (100.0%) |
| 12 to 14 Years | 0 (0.0%) | 0 (0.0%) |
| 15 Years | 0 (0.0%) | 0 (0.0%) |
| 16 and 17 Years | 0 (0.0%) | 0 (0.0%) |
| 18 to 24 Years | 0 (0.0%) | 9 (24.3%) |
| 25 to 34 Years | 7 (12.5%) | 8 (15.7%) |
| 35 to 44 Years | 0 (0.0%) | 5 (8.6%) |
| 45 to 54 Years | 13 (22.4%) | 0 (0.0%) |
| 55 to 64 Years | 2 (4.6%) | 0 (0.0%) |
| 65 to 74 Years | 0 (0.0%) | 4 (13.8%) |
| 75 Years and over | 14 (34.2%) | 52 (80.0%) |
| Total | 49 (10.6%) | 105 (25.2%) |
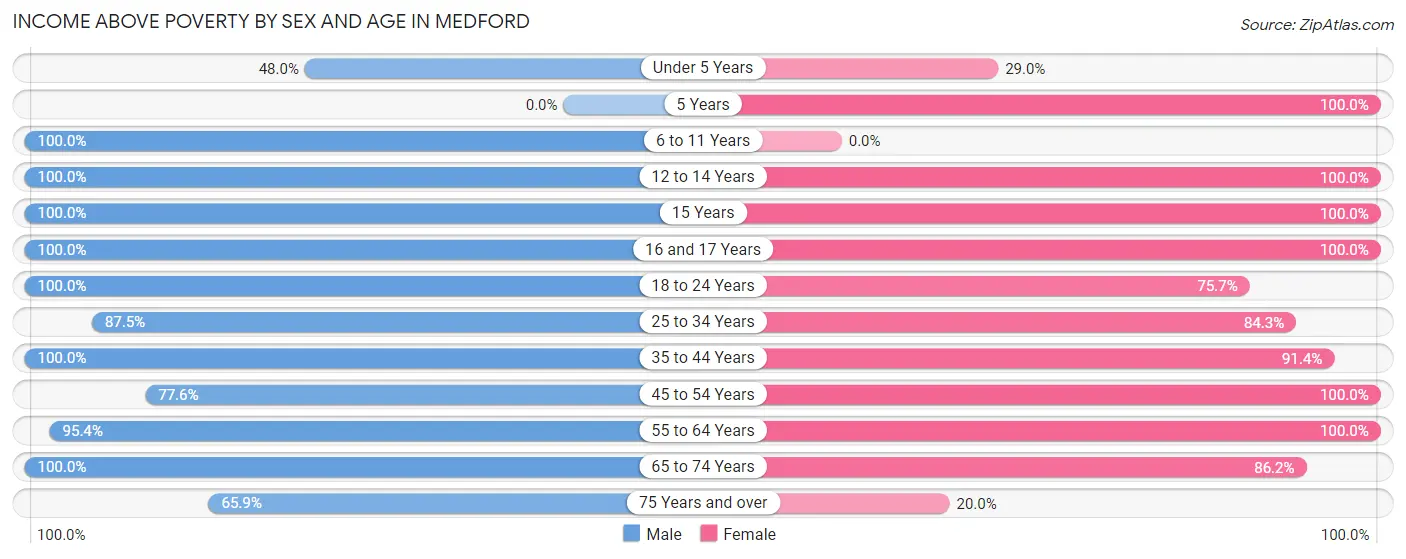
Income Above Poverty by Sex and Age in Medford
According to the poverty statistics in Medford, males aged 6 to 11 years and females aged 5 years are the age groups that are most secure financially, with 100.0% of males and 100.0% of females in these age groups living above the poverty line.
| Age Bracket | Male | Female |
| Under 5 Years | 12 (48.0%) | 9 (29.0%) |
| 5 Years | 0 (0.0%) | 6 (100.0%) |
| 6 to 11 Years | 27 (100.0%) | 0 (0.0%) |
| 12 to 14 Years | 29 (100.0%) | 32 (100.0%) |
| 15 Years | 13 (100.0%) | 5 (100.0%) |
| 16 and 17 Years | 2 (100.0%) | 15 (100.0%) |
| 18 to 24 Years | 49 (100.0%) | 28 (75.7%) |
| 25 to 34 Years | 49 (87.5%) | 43 (84.3%) |
| 35 to 44 Years | 60 (100.0%) | 53 (91.4%) |
| 45 to 54 Years | 45 (77.6%) | 35 (100.0%) |
| 55 to 64 Years | 41 (95.4%) | 47 (100.0%) |
| 65 to 74 Years | 60 (100.0%) | 25 (86.2%) |
| 75 Years and over | 27 (65.8%) | 13 (20.0%) |
| Total | 414 (89.4%) | 311 (74.8%) |
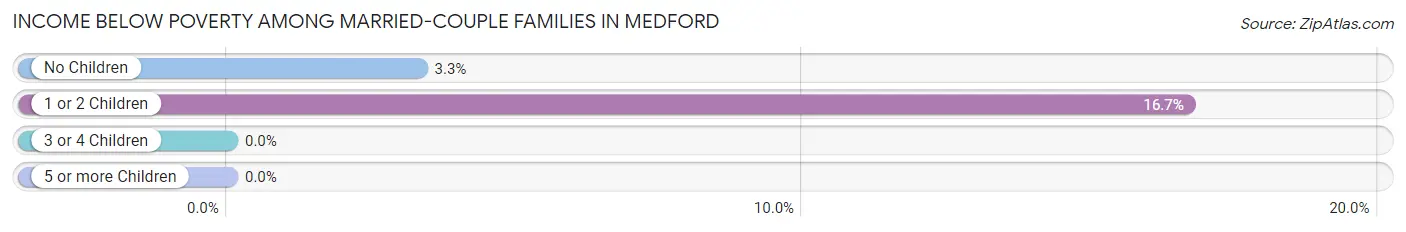
Income Below Poverty Among Married-Couple Families in Medford
The poverty statistics for married-couple families in Medford show that 7.4% or 11 of the total 149 families live below the poverty line. Families with 1 or 2 children have the highest poverty rate of 16.7%, comprising of 8 families. On the other hand, families with 5 or more children have the lowest poverty rate of 0.0%, which includes 0 families.
| Children | Above Poverty | Below Poverty |
| No Children | 88 (96.7%) | 3 (3.3%) |
| 1 or 2 Children | 40 (83.3%) | 8 (16.7%) |
| 3 or 4 Children | 0 (0.0%) | 0 (0.0%) |
| 5 or more Children | 10 (100.0%) | 0 (0.0%) |
| Total | 138 (92.6%) | 11 (7.4%) |
Income Below Poverty Among Single-Parent Households in Medford
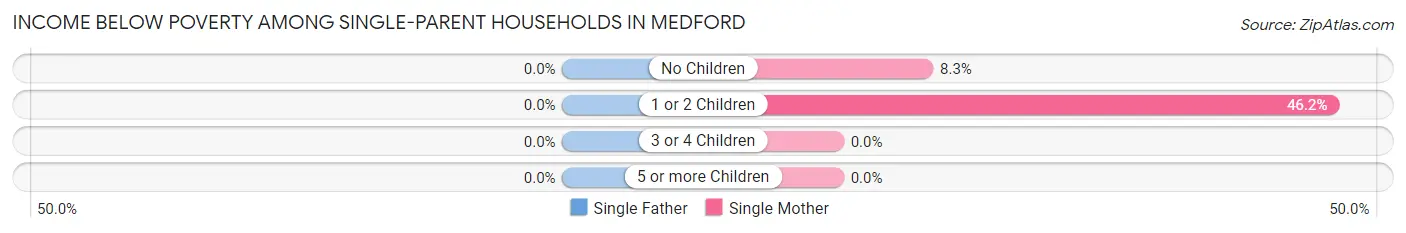
| Children | Single Father | Single Mother |
| No Children | 0 (0.0%) | 1 (8.3%) |
| 1 or 2 Children | 0 (0.0%) | 6 (46.2%) |
| 3 or 4 Children | 0 (0.0%) | 0 (0.0%) |
| 5 or more Children | 0 (0.0%) | 0 (0.0%) |
| Total | 0 (0.0%) | 7 (28.0%) |
Income Below Poverty Among Married-Couple vs Single-Parent Households in Medford
The poverty data for Medford shows that 11 of the married-couple family households (7.4%) and 7 of the single-parent households (21.9%) are living below the poverty level. Within the married-couple family households, those with 1 or 2 children have the highest poverty rate, with 8 households (16.7%) falling below the poverty line. Among the single-parent households, those with 1 or 2 children have the highest poverty rate, with 6 household (40.0%) living below poverty.
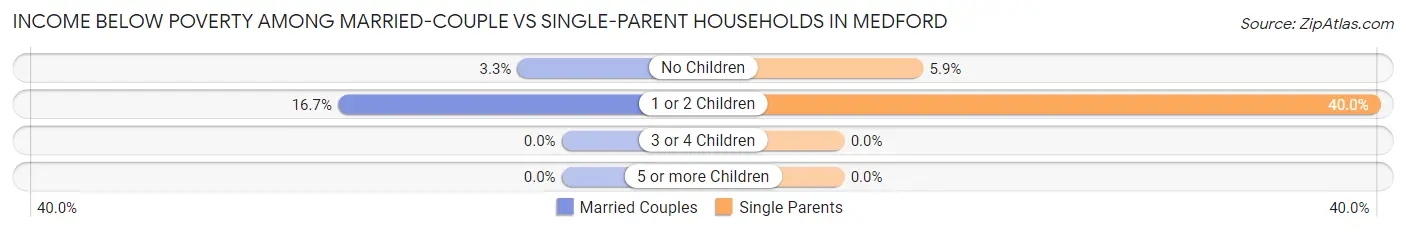
| Children | Married-Couple Families | Single-Parent Households |
| No Children | 3 (3.3%) | 1 (5.9%) |
| 1 or 2 Children | 8 (16.7%) | 6 (40.0%) |
| 3 or 4 Children | 0 (0.0%) | 0 (0.0%) |
| 5 or more Children | 0 (0.0%) | 0 (0.0%) |
| Total | 11 (7.4%) | 7 (21.9%) |
Race in Medford
The most populous races in Medford are White / Caucasian (815 | 85.9%), Hispanic or Latino (63 | 6.6%), and Two or more Races (49 | 5.2%).
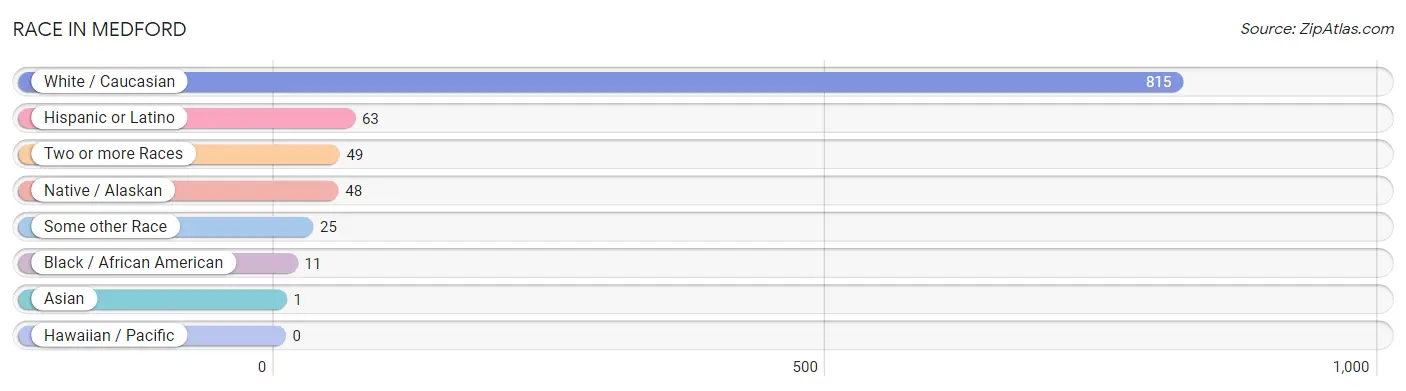
| Race | # Population | % Population |
| Asian | 1 | 0.1% |
| Black / African American | 11 | 1.2% |
| Hawaiian / Pacific | 0 | 0.0% |
| Hispanic or Latino | 63 | 6.6% |
| Native / Alaskan | 48 | 5.1% |
| White / Caucasian | 815 | 85.9% |
| Two or more Races | 49 | 5.2% |
| Some other Race | 25 | 2.6% |
| Total | 949 | 100.0% |
Ancestry in Medford
The most populous ancestries reported in Medford are German (150 | 15.8%), Irish (75 | 7.9%), English (68 | 7.2%), Mexican (63 | 6.6%), and American (57 | 6.0%), together accounting for 43.5% of all Medford residents.
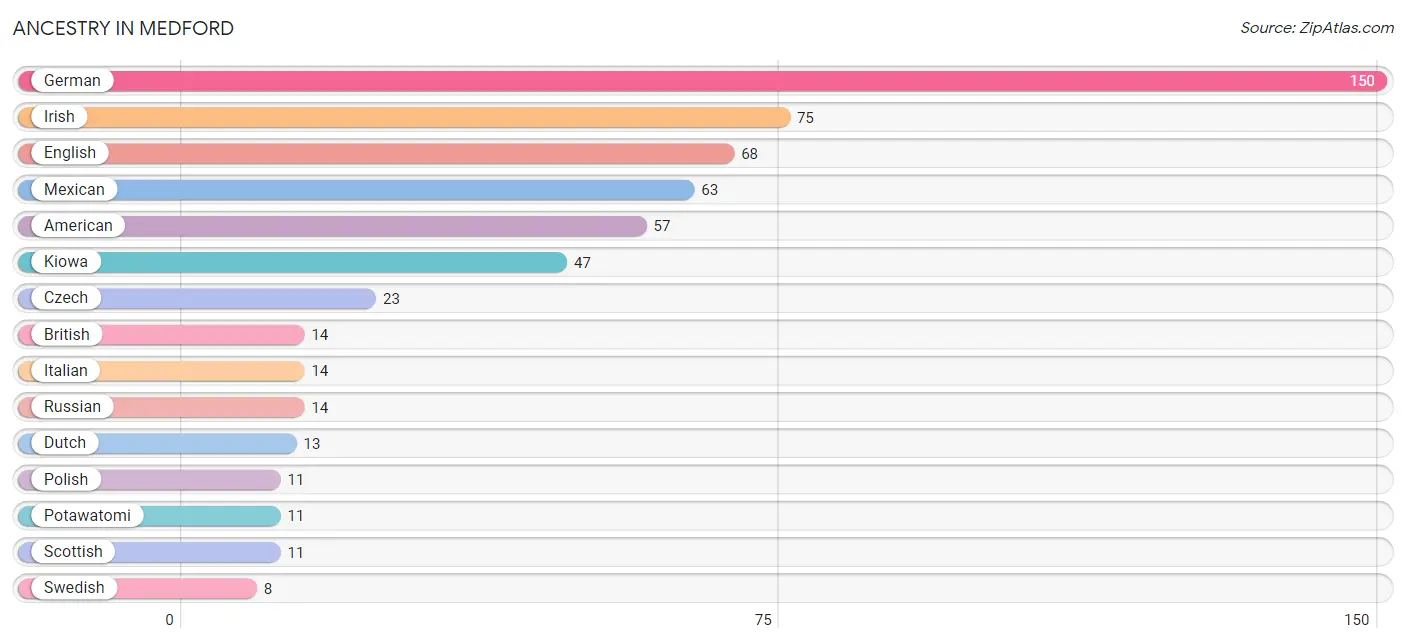
| Ancestry | # Population | % Population |
| American | 57 | 6.0% |
| British | 14 | 1.5% |
| Cherokee | 3 | 0.3% |
| Czech | 23 | 2.4% |
| Dutch | 13 | 1.4% |
| Dutch West Indian | 5 | 0.5% |
| English | 68 | 7.2% |
| French | 2 | 0.2% |
| German | 150 | 15.8% |
| Irish | 75 | 7.9% |
| Italian | 14 | 1.5% |
| Kiowa | 47 | 5.0% |
| Mexican | 63 | 6.6% |
| Pakistani | 1 | 0.1% |
| Polish | 11 | 1.2% |
| Potawatomi | 11 | 1.2% |
| Russian | 14 | 1.5% |
| Scotch-Irish | 1 | 0.1% |
| Scottish | 11 | 1.2% |
| Swedish | 8 | 0.8% | View All 20 Rows |
Immigrants in Medford
The most numerous immigrant groups reported in Medford came from Central America (3 | 0.3%), Latin America (3 | 0.3%), Mexico (3 | 0.3%), Asia (1 | 0.1%), and South Eastern Asia (1 | 0.1%), together accounting for 1.2% of all Medford residents.
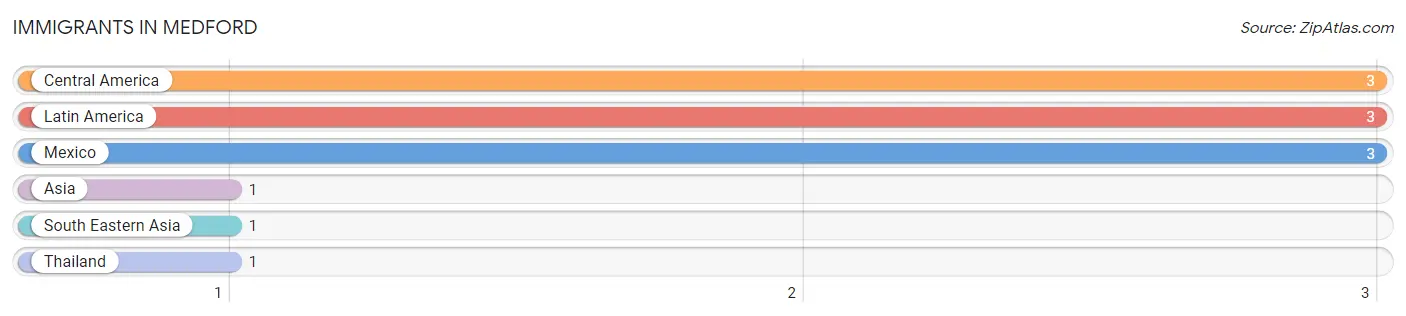
| Immigration Origin | # Population | % Population |
| Asia | 1 | 0.1% |
| Central America | 3 | 0.3% |
| Latin America | 3 | 0.3% |
| Mexico | 3 | 0.3% |
| South Eastern Asia | 1 | 0.1% |
| Thailand | 1 | 0.1% | View All 6 Rows |
Sex and Age in Medford
Sex and Age in Medford
The most populous age groups in Medford are 20 to 24 Years (44 | 8.7%) for men and 85 Years and over (78 | 17.5%) for women.
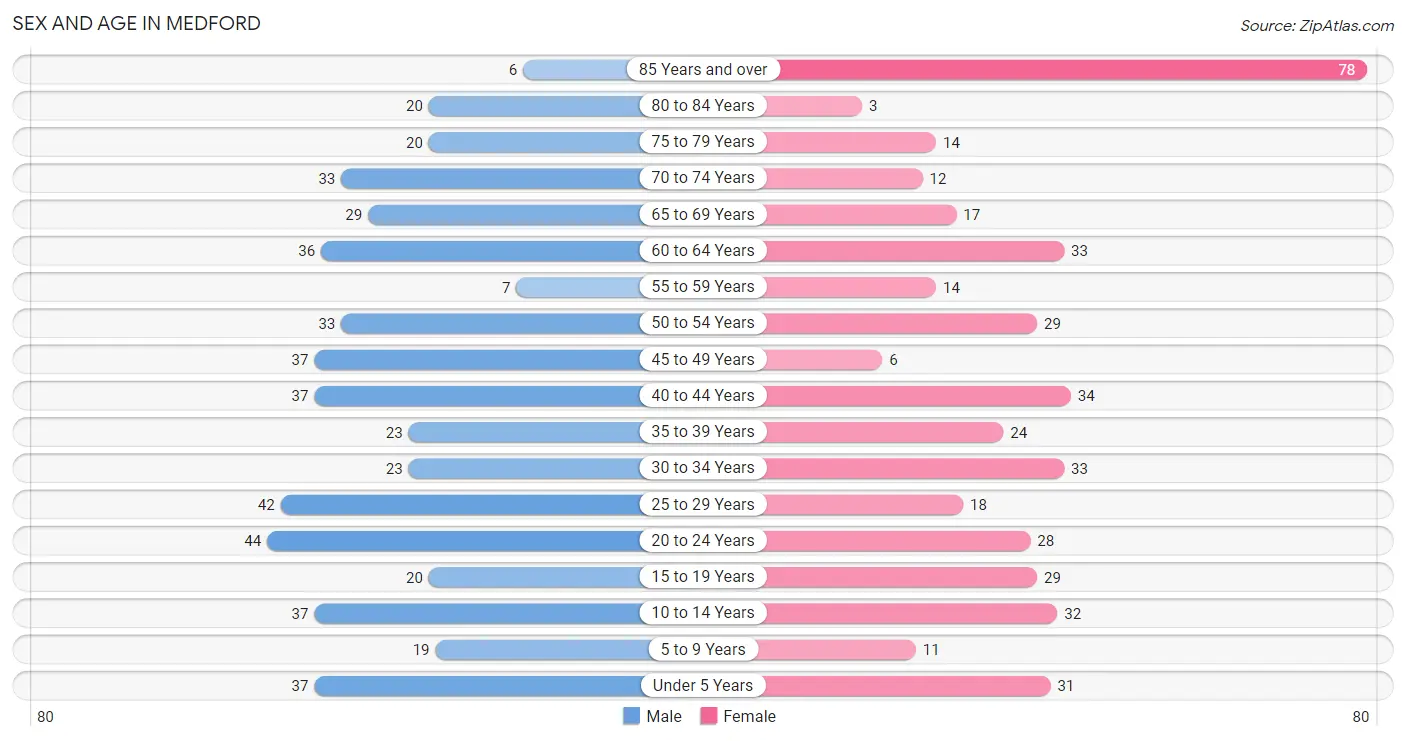
| Age Bracket | Male | Female |
| Under 5 Years | 37 (7.4%) | 31 (7.0%) |
| 5 to 9 Years | 19 (3.8%) | 11 (2.5%) |
| 10 to 14 Years | 37 (7.4%) | 32 (7.2%) |
| 15 to 19 Years | 20 (4.0%) | 29 (6.5%) |
| 20 to 24 Years | 44 (8.7%) | 28 (6.3%) |
| 25 to 29 Years | 42 (8.4%) | 18 (4.0%) |
| 30 to 34 Years | 23 (4.6%) | 33 (7.4%) |
| 35 to 39 Years | 23 (4.6%) | 24 (5.4%) |
| 40 to 44 Years | 37 (7.4%) | 34 (7.6%) |
| 45 to 49 Years | 37 (7.4%) | 6 (1.3%) |
| 50 to 54 Years | 33 (6.6%) | 29 (6.5%) |
| 55 to 59 Years | 7 (1.4%) | 14 (3.1%) |
| 60 to 64 Years | 36 (7.2%) | 33 (7.4%) |
| 65 to 69 Years | 29 (5.8%) | 17 (3.8%) |
| 70 to 74 Years | 33 (6.6%) | 12 (2.7%) |
| 75 to 79 Years | 20 (4.0%) | 14 (3.1%) |
| 80 to 84 Years | 20 (4.0%) | 3 (0.7%) |
| 85 Years and over | 6 (1.2%) | 78 (17.5%) |
| Total | 503 (100.0%) | 446 (100.0%) |
Families and Households in Medford
Median Family Size in Medford
The median family size in Medford is 3.40 persons per family, with single male/father families (7 | 3.9%) accounting for the largest median family size of 5.14 persons per family. On the other hand, married-couple families (149 | 82.3%) represent the smallest median family size with 3.22 persons per family.
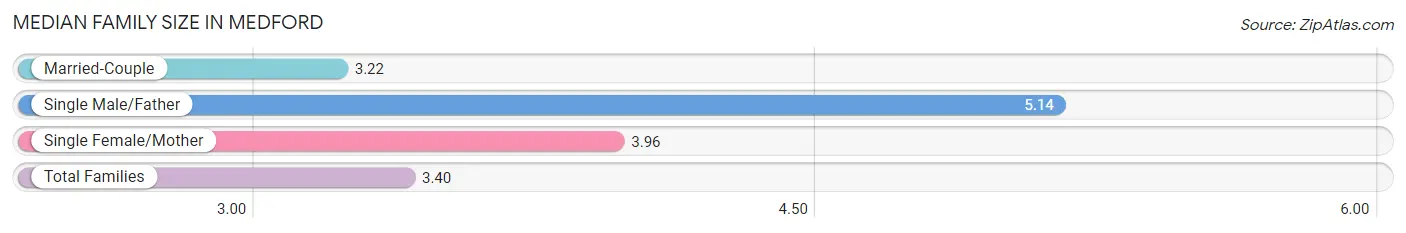
| Family Type | # Families | Family Size |
| Married-Couple | 149 (82.3%) | 3.22 |
| Single Male/Father | 7 (3.9%) | 5.14 |
| Single Female/Mother | 25 (13.8%) | 3.96 |
| Total Families | 181 (100.0%) | 3.40 |
Median Household Size in Medford
The median household size in Medford is 2.40 persons per household, with single female/mother households (25 | 6.7%) accounting for the largest median household size of 6 persons per household. non-family households (191 | 51.3%) represent the smallest median household size with 1.10 persons per household.
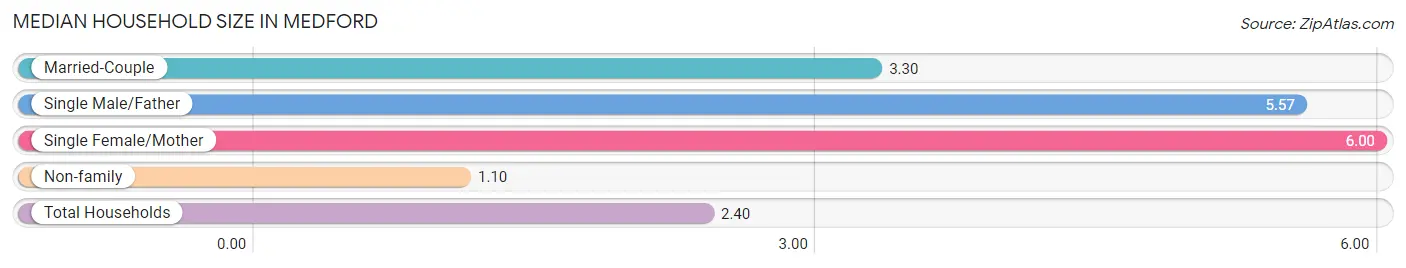
| Household Type | # Households | Household Size |
| Married-Couple | 149 (40.1%) | 3.30 |
| Single Male/Father | 7 (1.9%) | 5.57 |
| Single Female/Mother | 25 (6.7%) | 6.00 |
| Non-family | 191 (51.3%) | 1.10 |
| Total Households | 372 (100.0%) | 2.40 |
Household Size by Marriage Status in Medford
Out of a total of 372 households in Medford, 181 (48.7%) are family households, while 191 (51.3%) are nonfamily households. The most numerous type of family households are 2-person households, comprising 105, and the most common type of nonfamily households are 1-person households, comprising 176.
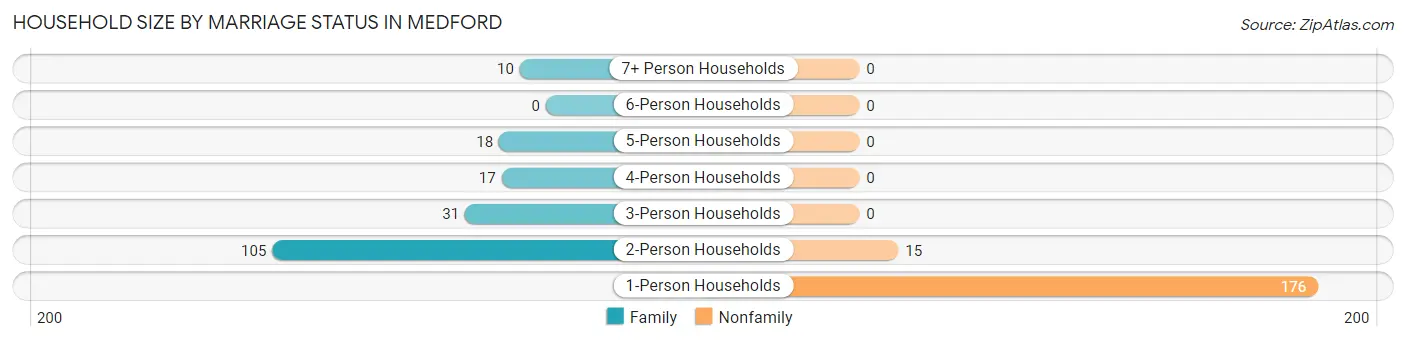
| Household Size | Family Households | Nonfamily Households |
| 1-Person Households | - | 176 (47.3%) |
| 2-Person Households | 105 (28.2%) | 15 (4.0%) |
| 3-Person Households | 31 (8.3%) | 0 (0.0%) |
| 4-Person Households | 17 (4.6%) | 0 (0.0%) |
| 5-Person Households | 18 (4.8%) | 0 (0.0%) |
| 6-Person Households | 0 (0.0%) | 0 (0.0%) |
| 7+ Person Households | 10 (2.7%) | 0 (0.0%) |
| Total | 181 (48.7%) | 191 (51.3%) |
Female Fertility in Medford
Fertility by Age in Medford
Average fertility rate in Medford is 12.0 births per 1,000 women. Women in the age bracket of 20 to 34 years have the highest fertility rate with 25.0 births per 1,000 women. Women in the age bracket of 20 to 34 years acount for 100.0% of all women with births.
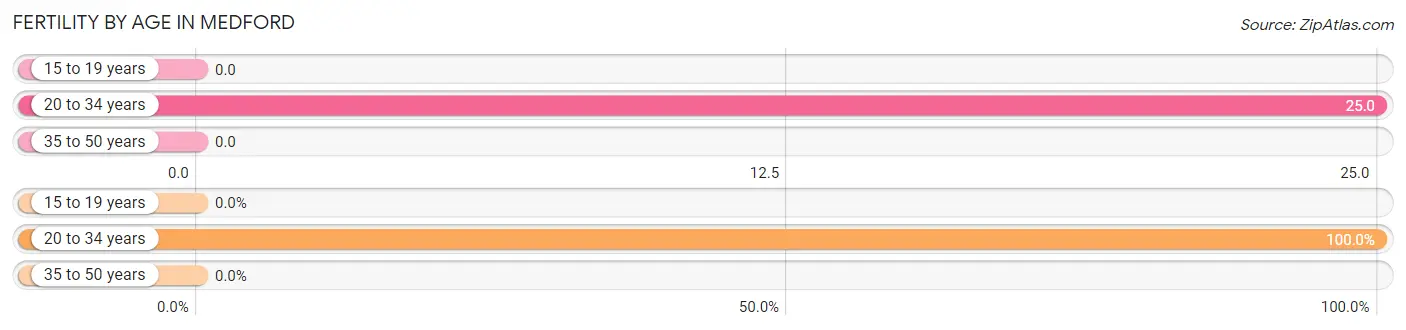
| Age Bracket | Women with Births | Births / 1,000 Women |
| 15 to 19 years | 0 (0.0%) | 0.0 |
| 20 to 34 years | 2 (100.0%) | 25.0 |
| 35 to 50 years | 0 (0.0%) | 0.0 |
| Total | 2 (100.0%) | 12.0 |
Fertility by Age by Marriage Status in Medford
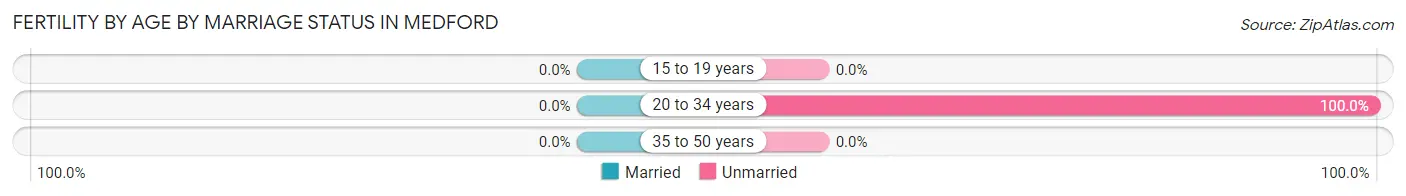
| Age Bracket | Married | Unmarried |
| 15 to 19 years | 0 (0.0%) | 0 (0.0%) |
| 20 to 34 years | 0 (0.0%) | 2 (100.0%) |
| 35 to 50 years | 0 (0.0%) | 0 (0.0%) |
| Total | 0 (0.0%) | 2 (100.0%) |
Fertility by Education in Medford
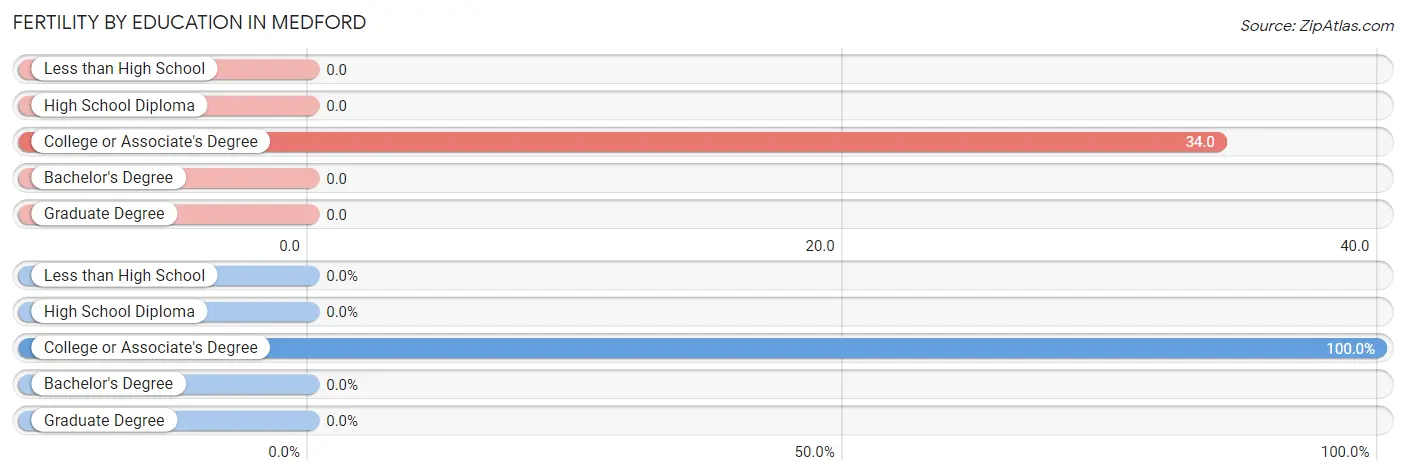
| Educational Attainment | Women with Births | Births / 1,000 Women |
| Less than High School | 0 (0.0%) | 0.0 |
| High School Diploma | 0 (0.0%) | 0.0 |
| College or Associate's Degree | 2 (100.0%) | 34.0 |
| Bachelor's Degree | 0 (0.0%) | 0.0 |
| Graduate Degree | 0 (0.0%) | 0.0 |
| Total | 2 (100.0%) | 12.0 |
Fertility by Education by Marriage Status in Medford
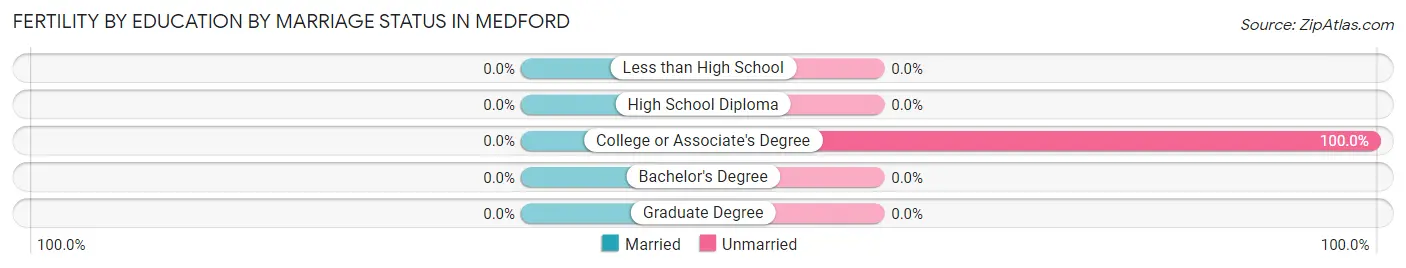
| Educational Attainment | Married | Unmarried |
| Less than High School | 0 (0.0%) | 0 (0.0%) |
| High School Diploma | 0 (0.0%) | 0 (0.0%) |
| College or Associate's Degree | 0 (0.0%) | 2 (100.0%) |
| Bachelor's Degree | 0 (0.0%) | 0 (0.0%) |
| Graduate Degree | 0 (0.0%) | 0 (0.0%) |
| Total | 0 (0.0%) | 2 (100.0%) |
Employment Characteristics in Medford
Employment by Class of Employer in Medford
Among the 415 employed individuals in Medford, private company employees (231 | 55.7%), local government employees (89 | 21.4%), and state government employees (58 | 14.0%) make up the most common classes of employment.
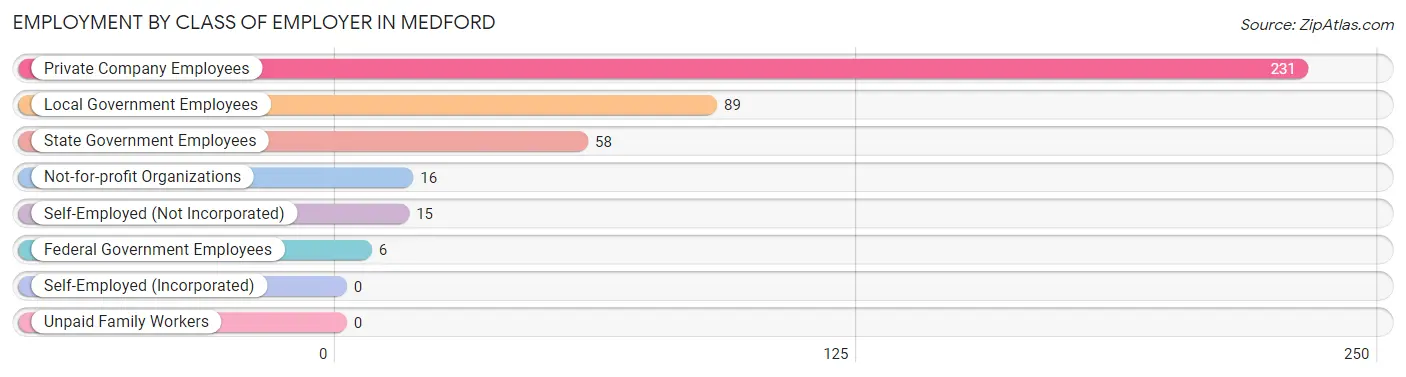
| Employer Class | # Employees | % Employees |
| Private Company Employees | 231 | 55.7% |
| Self-Employed (Incorporated) | 0 | 0.0% |
| Self-Employed (Not Incorporated) | 15 | 3.6% |
| Not-for-profit Organizations | 16 | 3.9% |
| Local Government Employees | 89 | 21.4% |
| State Government Employees | 58 | 14.0% |
| Federal Government Employees | 6 | 1.5% |
| Unpaid Family Workers | 0 | 0.0% |
| Total | 415 | 100.0% |
Employment Status by Age in Medford
According to the labor force statistics for Medford, out of the total population over 16 years of age (764), 55.1% or 421 individuals are in the labor force, with 0.2% or 1 of them unemployed. The age group with the highest labor force participation rate is 20 to 24 years, with 95.8% or 69 individuals in the labor force. Within the labor force, the 65 to 74 years age range has the highest percentage of unemployed individuals, with 5.6% or 1 of them being unemployed.
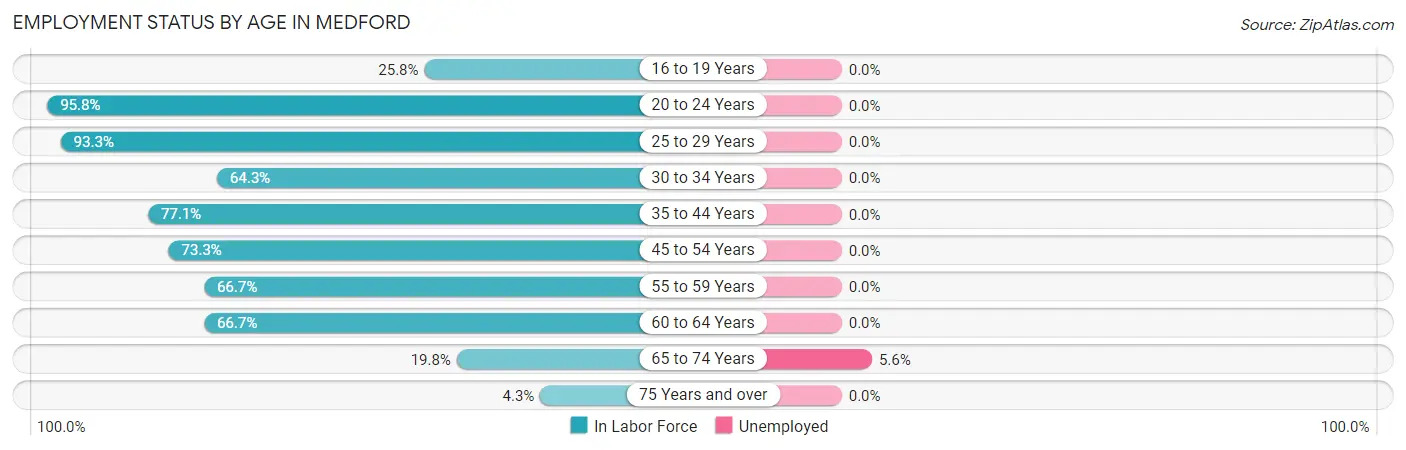
| Age Bracket | In Labor Force | Unemployed |
| 16 to 19 Years | 8 (25.8%) | 0 (0.0%) |
| 20 to 24 Years | 69 (95.8%) | 0 (0.0%) |
| 25 to 29 Years | 56 (93.3%) | 0 (0.0%) |
| 30 to 34 Years | 36 (64.3%) | 0 (0.0%) |
| 35 to 44 Years | 91 (77.1%) | 0 (0.0%) |
| 45 to 54 Years | 77 (73.3%) | 0 (0.0%) |
| 55 to 59 Years | 14 (66.7%) | 0 (0.0%) |
| 60 to 64 Years | 46 (66.7%) | 0 (0.0%) |
| 65 to 74 Years | 18 (19.8%) | 1 (5.6%) |
| 75 Years and over | 6 (4.3%) | 0 (0.0%) |
| Total | 421 (55.1%) | 1 (0.2%) |
Employment Status by Educational Attainment in Medford
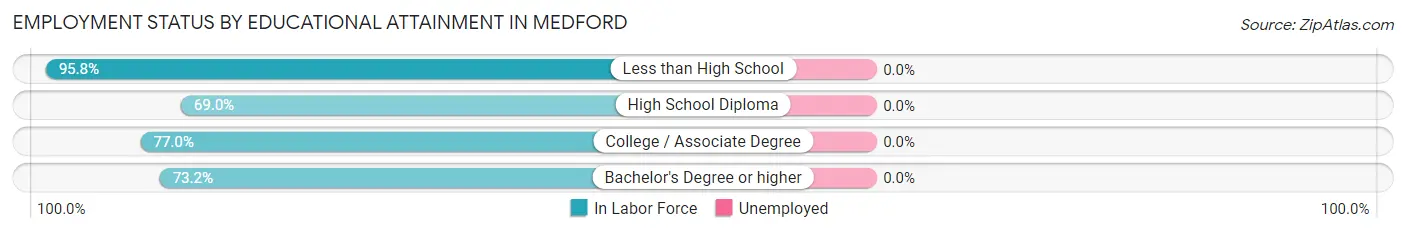
| Educational Attainment | In Labor Force | Unemployed |
| Less than High School | 23 (95.8%) | 0 (0.0%) |
| High School Diploma | 100 (69.0%) | 0 (0.0%) |
| College / Associate Degree | 137 (77.0%) | 0 (0.0%) |
| Bachelor's Degree or higher | 60 (73.2%) | 0 (0.0%) |
| Total | 320 (74.6%) | 0 (0.0%) |
Employment Occupations by Sex in Medford
Management, Business, Science and Arts Occupations
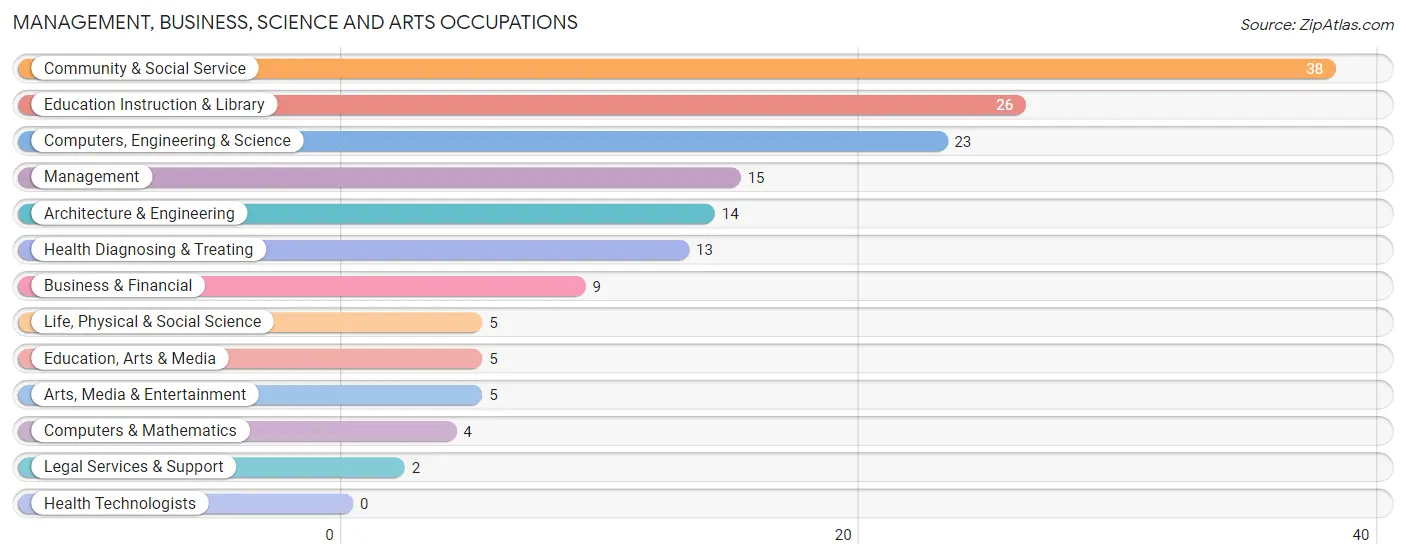
The most common Management, Business, Science and Arts occupations in Medford are Community & Social Service (38 | 9.0%), Education Instruction & Library (26 | 6.2%), Computers, Engineering & Science (23 | 5.5%), Management (15 | 3.6%), and Architecture & Engineering (14 | 3.3%).
Management, Business, Science and Arts Occupations by Sex
Within the Management, Business, Science and Arts occupations in Medford, the most male-oriented occupations are Management (100.0%), Computers & Mathematics (100.0%), and Life, Physical & Social Science (100.0%), while the most female-oriented occupations are Business & Financial (100.0%), Architecture & Engineering (100.0%), and Education, Arts & Media (100.0%).
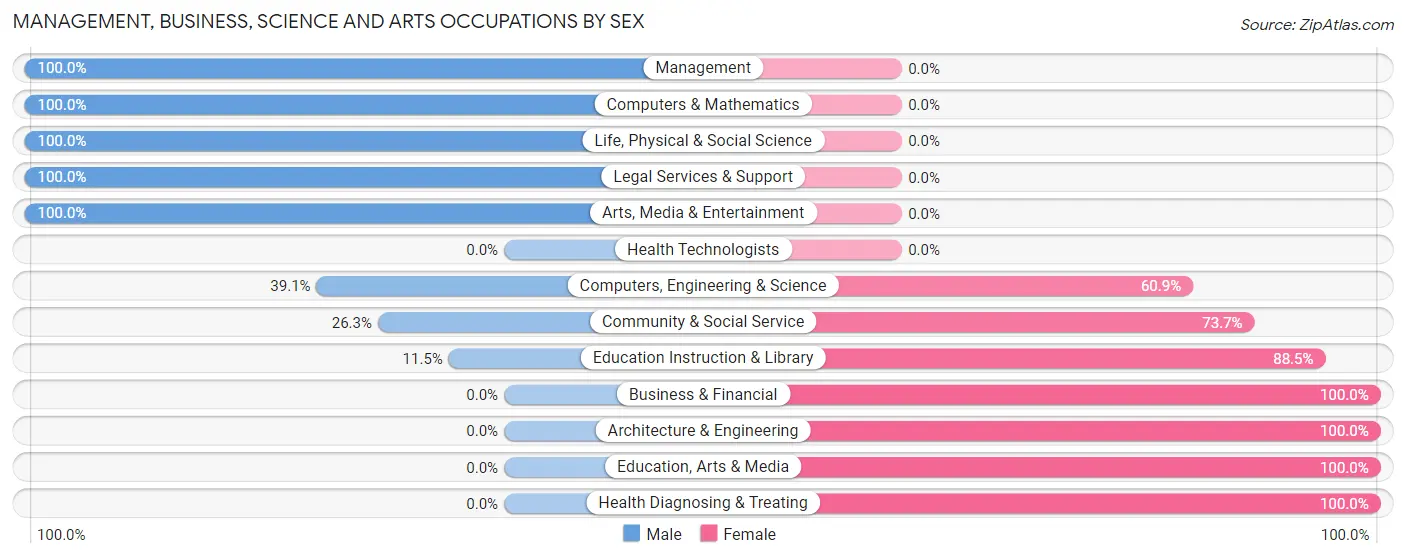
| Occupation | Male | Female |
| Management | 15 (100.0%) | 0 (0.0%) |
| Business & Financial | 0 (0.0%) | 9 (100.0%) |
| Computers, Engineering & Science | 9 (39.1%) | 14 (60.9%) |
| Computers & Mathematics | 4 (100.0%) | 0 (0.0%) |
| Architecture & Engineering | 0 (0.0%) | 14 (100.0%) |
| Life, Physical & Social Science | 5 (100.0%) | 0 (0.0%) |
| Community & Social Service | 10 (26.3%) | 28 (73.7%) |
| Education, Arts & Media | 0 (0.0%) | 5 (100.0%) |
| Legal Services & Support | 2 (100.0%) | 0 (0.0%) |
| Education Instruction & Library | 3 (11.5%) | 23 (88.5%) |
| Arts, Media & Entertainment | 5 (100.0%) | 0 (0.0%) |
| Health Diagnosing & Treating | 0 (0.0%) | 13 (100.0%) |
| Health Technologists | 0 (0.0%) | 0 (0.0%) |
| Total (Category) | 34 (34.7%) | 64 (65.3%) |
| Total (Overall) | 247 (58.8%) | 173 (41.2%) |
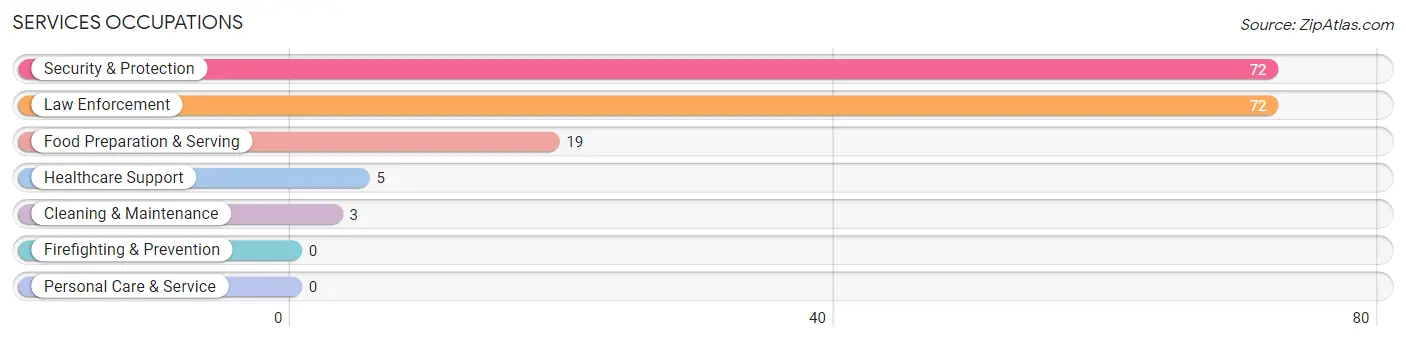
Services Occupations
The most common Services occupations in Medford are Security & Protection (72 | 17.1%), Law Enforcement (72 | 17.1%), Food Preparation & Serving (19 | 4.5%), Healthcare Support (5 | 1.2%), and Cleaning & Maintenance (3 | 0.7%).
Services Occupations by Sex
Within the Services occupations in Medford, the most male-oriented occupations are Security & Protection (100.0%), Law Enforcement (100.0%), and Cleaning & Maintenance (100.0%), while the most female-oriented occupations are Healthcare Support (100.0%), and Food Preparation & Serving (31.6%).
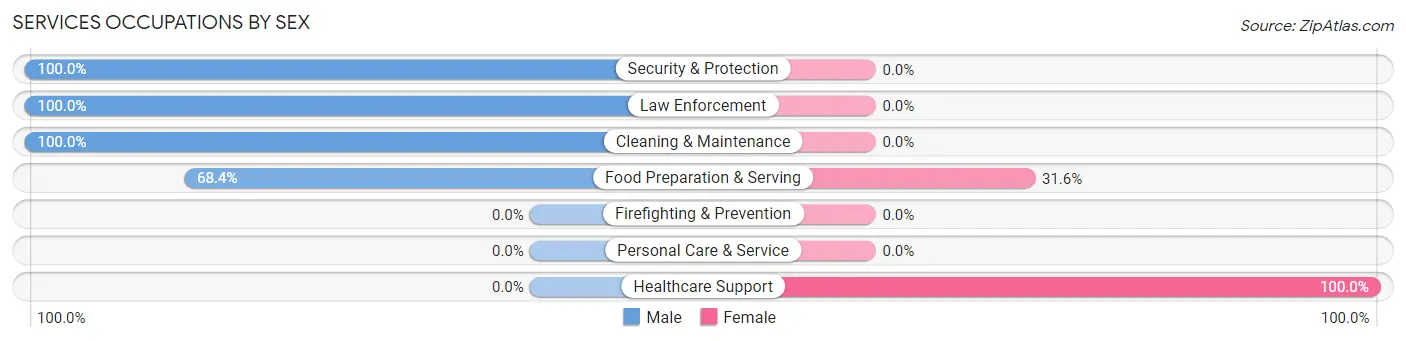
| Occupation | Male | Female |
| Healthcare Support | 0 (0.0%) | 5 (100.0%) |
| Security & Protection | 72 (100.0%) | 0 (0.0%) |
| Firefighting & Prevention | 0 (0.0%) | 0 (0.0%) |
| Law Enforcement | 72 (100.0%) | 0 (0.0%) |
| Food Preparation & Serving | 13 (68.4%) | 6 (31.6%) |
| Cleaning & Maintenance | 3 (100.0%) | 0 (0.0%) |
| Personal Care & Service | 0 (0.0%) | 0 (0.0%) |
| Total (Category) | 88 (88.9%) | 11 (11.1%) |
| Total (Overall) | 247 (58.8%) | 173 (41.2%) |
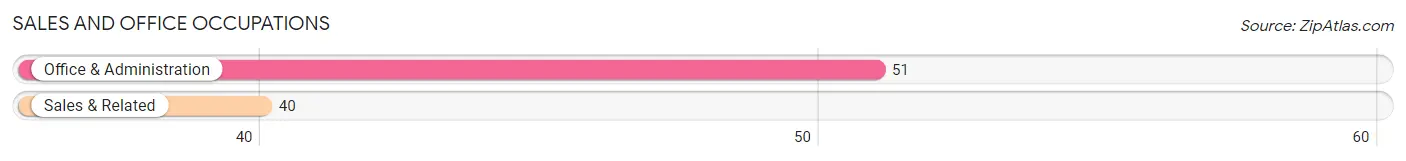
Sales and Office Occupations
The most common Sales and Office occupations in Medford are Office & Administration (51 | 12.1%), and Sales & Related (40 | 9.5%).
Sales and Office Occupations by Sex
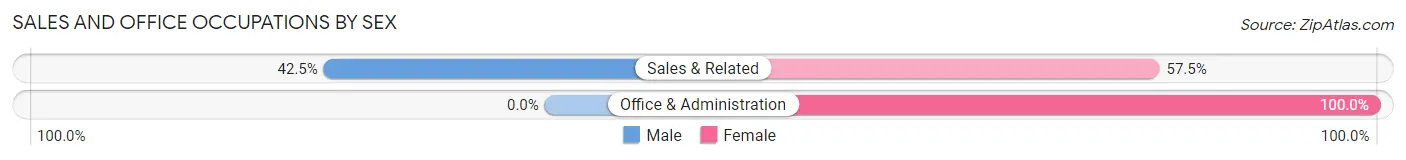
| Occupation | Male | Female |
| Sales & Related | 17 (42.5%) | 23 (57.5%) |
| Office & Administration | 0 (0.0%) | 51 (100.0%) |
| Total (Category) | 17 (18.7%) | 74 (81.3%) |
| Total (Overall) | 247 (58.8%) | 173 (41.2%) |
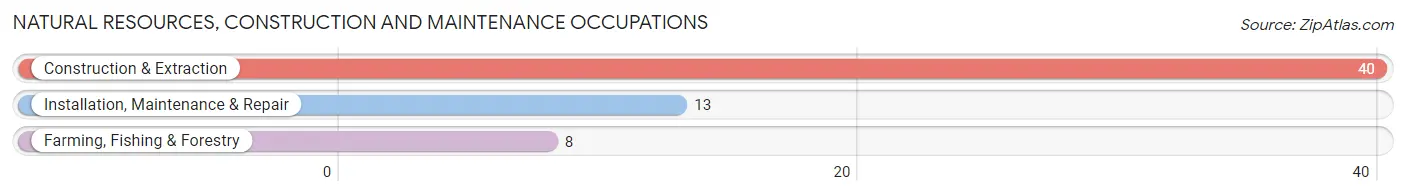
Natural Resources, Construction and Maintenance Occupations
The most common Natural Resources, Construction and Maintenance occupations in Medford are Construction & Extraction (40 | 9.5%), Installation, Maintenance & Repair (13 | 3.1%), and Farming, Fishing & Forestry (8 | 1.9%).
Natural Resources, Construction and Maintenance Occupations by Sex
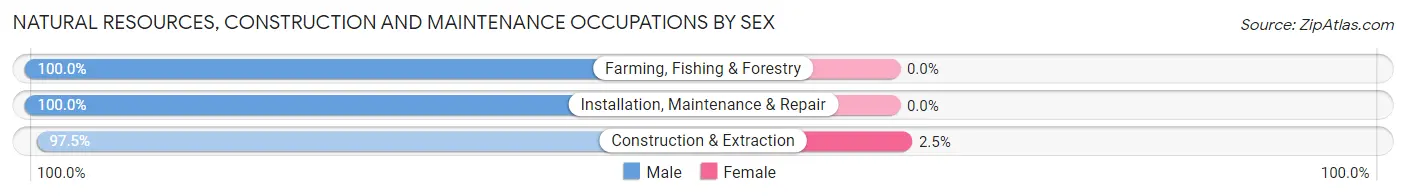
| Occupation | Male | Female |
| Farming, Fishing & Forestry | 8 (100.0%) | 0 (0.0%) |
| Construction & Extraction | 39 (97.5%) | 1 (2.5%) |
| Installation, Maintenance & Repair | 13 (100.0%) | 0 (0.0%) |
| Total (Category) | 60 (98.4%) | 1 (1.6%) |
| Total (Overall) | 247 (58.8%) | 173 (41.2%) |
Production, Transportation and Moving Occupations
The most common Production, Transportation and Moving occupations in Medford are Transportation (39 | 9.3%), Material Moving (17 | 4.1%), and Production (15 | 3.6%).
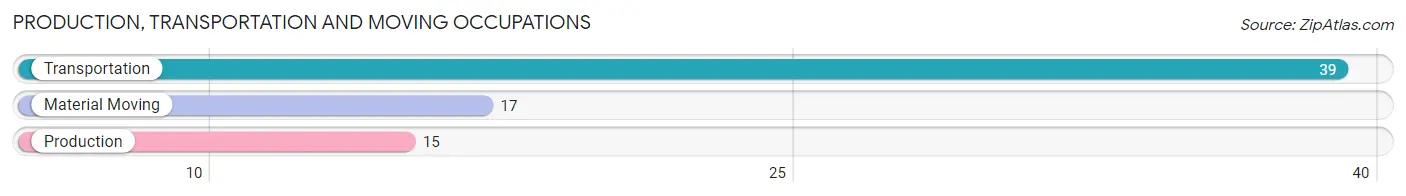
Production, Transportation and Moving Occupations by Sex
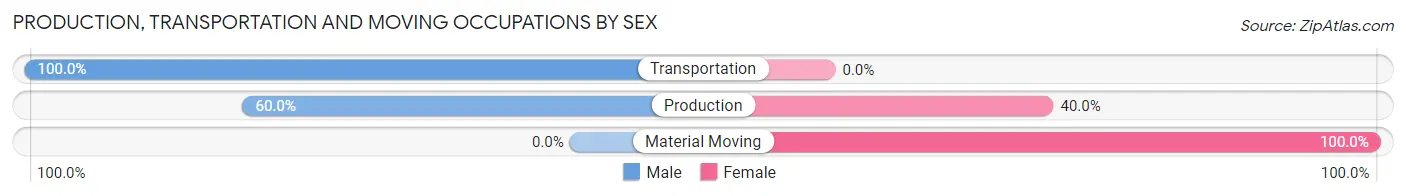
| Occupation | Male | Female |
| Production | 9 (60.0%) | 6 (40.0%) |
| Transportation | 39 (100.0%) | 0 (0.0%) |
| Material Moving | 0 (0.0%) | 17 (100.0%) |
| Total (Category) | 48 (67.6%) | 23 (32.4%) |
| Total (Overall) | 247 (58.8%) | 173 (41.2%) |
Employment Industries by Sex in Medford
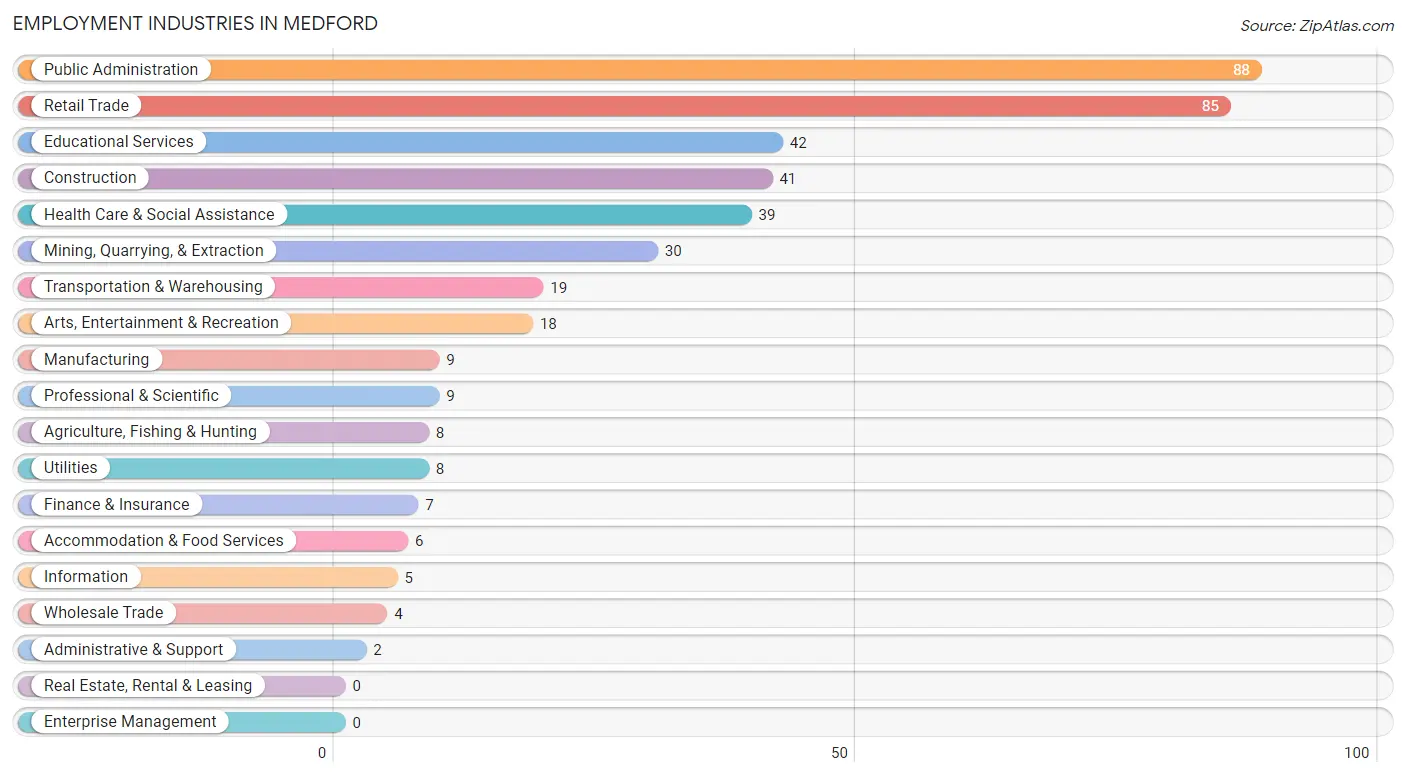
Employment Industries in Medford
The major employment industries in Medford include Public Administration (88 | 20.9%), Retail Trade (85 | 20.2%), Educational Services (42 | 10.0%), Construction (41 | 9.8%), and Health Care & Social Assistance (39 | 9.3%).
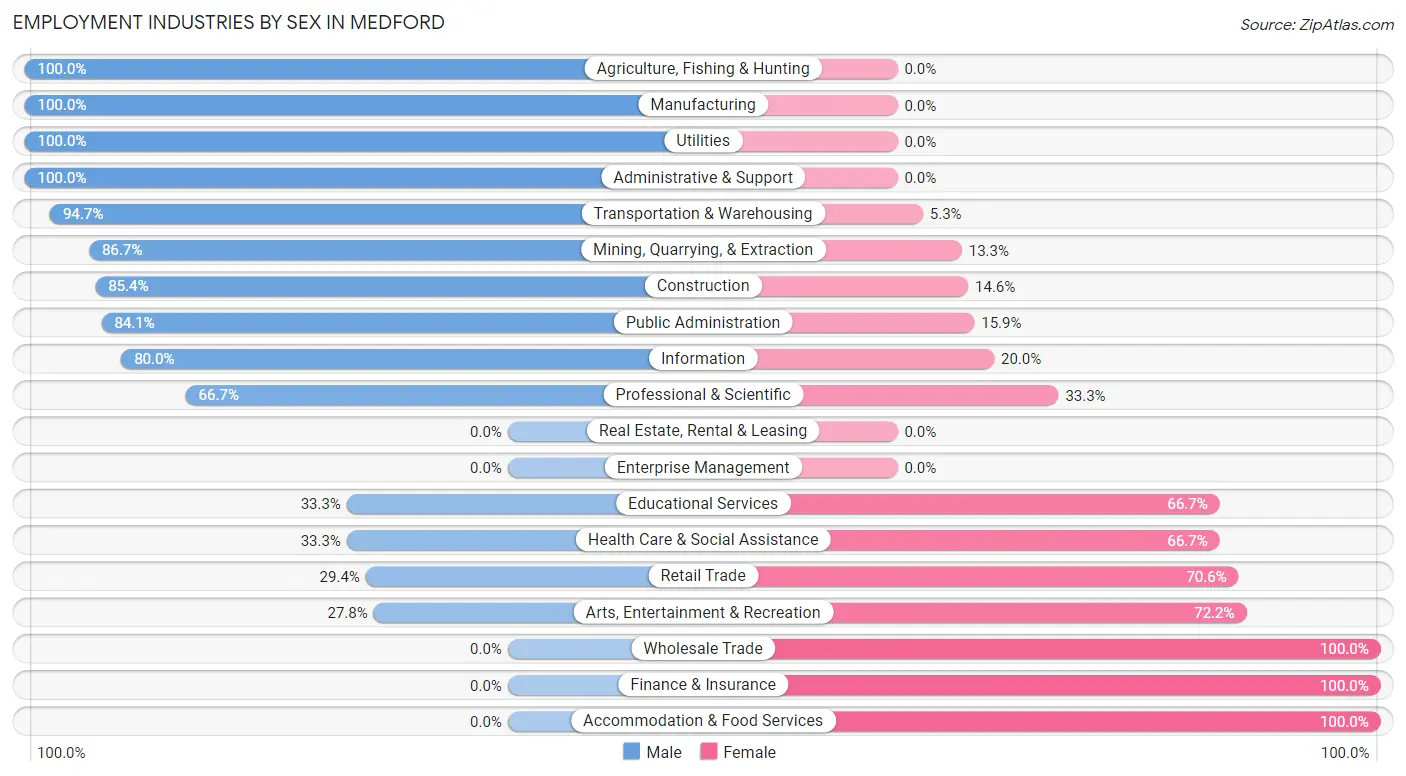
Employment Industries by Sex in Medford
The Medford industries that see more men than women are Agriculture, Fishing & Hunting (100.0%), Manufacturing (100.0%), and Utilities (100.0%), whereas the industries that tend to have a higher number of women are Wholesale Trade (100.0%), Finance & Insurance (100.0%), and Accommodation & Food Services (100.0%).
| Industry | Male | Female |
| Agriculture, Fishing & Hunting | 8 (100.0%) | 0 (0.0%) |
| Mining, Quarrying, & Extraction | 26 (86.7%) | 4 (13.3%) |
| Construction | 35 (85.4%) | 6 (14.6%) |
| Manufacturing | 9 (100.0%) | 0 (0.0%) |
| Wholesale Trade | 0 (0.0%) | 4 (100.0%) |
| Retail Trade | 25 (29.4%) | 60 (70.6%) |
| Transportation & Warehousing | 18 (94.7%) | 1 (5.3%) |
| Utilities | 8 (100.0%) | 0 (0.0%) |
| Information | 4 (80.0%) | 1 (20.0%) |
| Finance & Insurance | 0 (0.0%) | 7 (100.0%) |
| Real Estate, Rental & Leasing | 0 (0.0%) | 0 (0.0%) |
| Professional & Scientific | 6 (66.7%) | 3 (33.3%) |
| Enterprise Management | 0 (0.0%) | 0 (0.0%) |
| Administrative & Support | 2 (100.0%) | 0 (0.0%) |
| Educational Services | 14 (33.3%) | 28 (66.7%) |
| Health Care & Social Assistance | 13 (33.3%) | 26 (66.7%) |
| Arts, Entertainment & Recreation | 5 (27.8%) | 13 (72.2%) |
| Accommodation & Food Services | 0 (0.0%) | 6 (100.0%) |
| Public Administration | 74 (84.1%) | 14 (15.9%) |
| Total | 247 (58.8%) | 173 (41.2%) |
Education in Medford
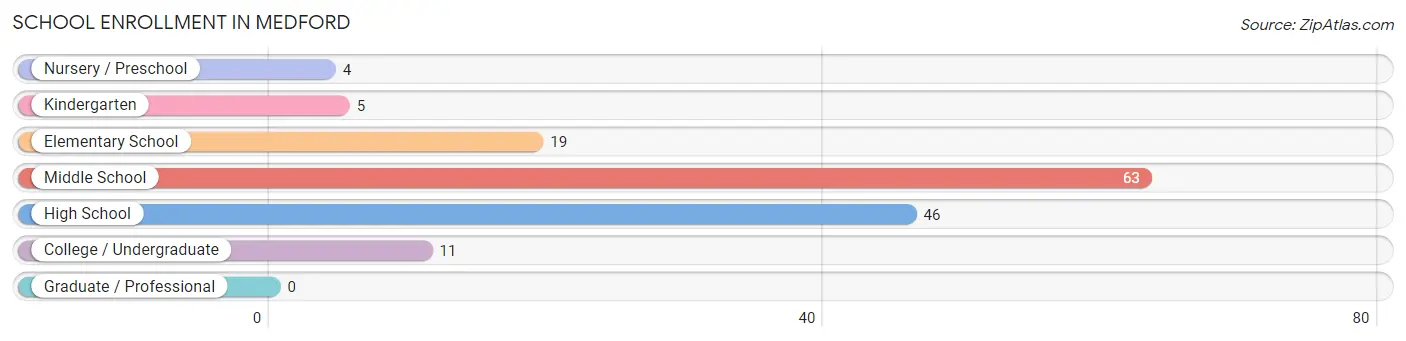
School Enrollment in Medford
The most common levels of schooling among the 148 students in Medford are middle school (63 | 42.6%), high school (46 | 31.1%), and elementary school (19 | 12.8%).
| School Level | # Students | % Students |
| Nursery / Preschool | 4 | 2.7% |
| Kindergarten | 5 | 3.4% |
| Elementary School | 19 | 12.8% |
| Middle School | 63 | 42.6% |
| High School | 46 | 31.1% |
| College / Undergraduate | 11 | 7.4% |
| Graduate / Professional | 0 | 0.0% |
| Total | 148 | 100.0% |
School Enrollment by Age by Funding Source in Medford
Out of a total of 148 students who are enrolled in schools in Medford, 4 (2.7%) attend a private institution, while the remaining 144 (97.3%) are enrolled in public schools. The age group of 3 to 4 year olds has the highest likelihood of being enrolled in private schools, with 4 (100.0% in the age bracket) enrolled. Conversely, the age group of 5 to 9 year old has the lowest likelihood of being enrolled in a private school, with 24 (100.0% in the age bracket) attending a public institution.
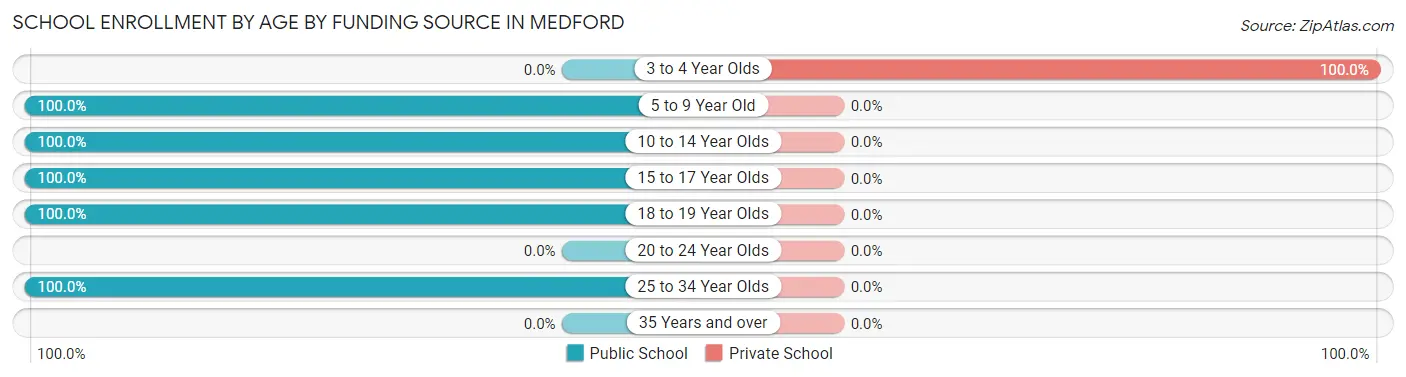
| Age Bracket | Public School | Private School |
| 3 to 4 Year Olds | 0 (0.0%) | 4 (100.0%) |
| 5 to 9 Year Old | 24 (100.0%) | 0 (0.0%) |
| 10 to 14 Year Olds | 60 (100.0%) | 0 (0.0%) |
| 15 to 17 Year Olds | 35 (100.0%) | 0 (0.0%) |
| 18 to 19 Year Olds | 14 (100.0%) | 0 (0.0%) |
| 20 to 24 Year Olds | 0 (0.0%) | 0 (0.0%) |
| 25 to 34 Year Olds | 11 (100.0%) | 0 (0.0%) |
| 35 Years and over | 0 (0.0%) | 0 (0.0%) |
| Total | 144 (97.3%) | 4 (2.7%) |
Educational Attainment by Field of Study in Medford
Education (37 | 26.6%), business (25 | 18.0%), bio, nature & agricultural (18 | 13.0%), communications (15 | 10.8%), and arts & humanities (14 | 10.1%) are the most common fields of study among 139 individuals in Medford who have obtained a bachelor's degree or higher.
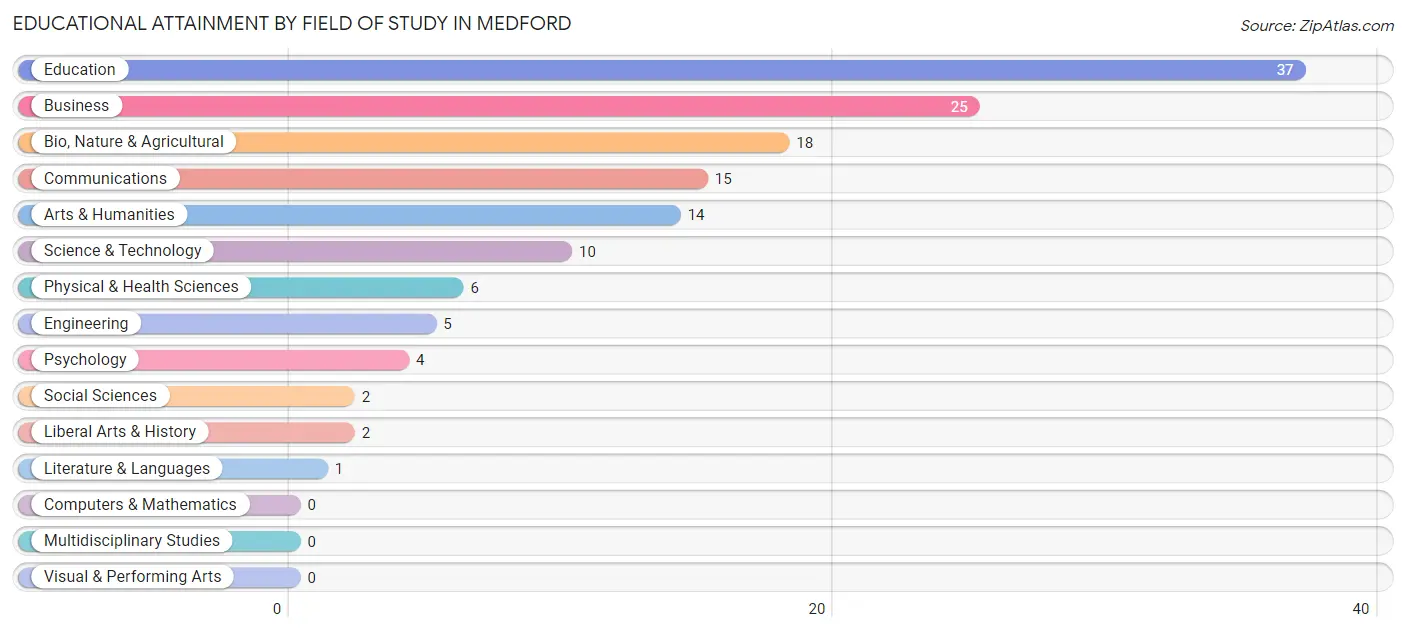
| Field of Study | # Graduates | % Graduates |
| Computers & Mathematics | 0 | 0.0% |
| Bio, Nature & Agricultural | 18 | 13.0% |
| Physical & Health Sciences | 6 | 4.3% |
| Psychology | 4 | 2.9% |
| Social Sciences | 2 | 1.4% |
| Engineering | 5 | 3.6% |
| Multidisciplinary Studies | 0 | 0.0% |
| Science & Technology | 10 | 7.2% |
| Business | 25 | 18.0% |
| Education | 37 | 26.6% |
| Literature & Languages | 1 | 0.7% |
| Liberal Arts & History | 2 | 1.4% |
| Visual & Performing Arts | 0 | 0.0% |
| Communications | 15 | 10.8% |
| Arts & Humanities | 14 | 10.1% |
| Total | 139 | 100.0% |
Transportation & Commute in Medford
Vehicle Availability by Sex in Medford
The most prevalent vehicle ownership categories in Medford are males with 2 vehicles (68, accounting for 27.5%) and females with 2 vehicles (57, making up 40.5%).
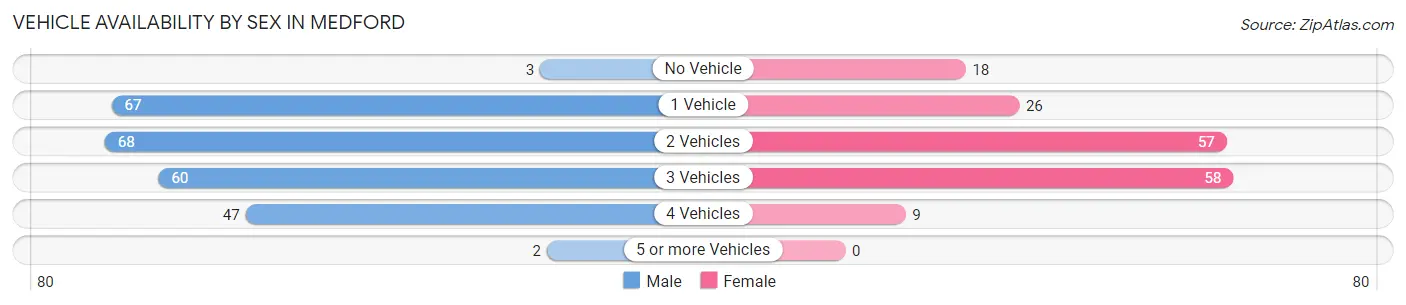
| Vehicles Available | Male | Female |
| No Vehicle | 3 (1.2%) | 18 (10.7%) |
| 1 Vehicle | 67 (27.1%) | 26 (15.5%) |
| 2 Vehicles | 68 (27.5%) | 57 (33.9%) |
| 3 Vehicles | 60 (24.3%) | 58 (34.5%) |
| 4 Vehicles | 47 (19.0%) | 9 (5.4%) |
| 5 or more Vehicles | 2 (0.8%) | 0 (0.0%) |
| Total | 247 (100.0%) | 168 (100.0%) |
Commute Time in Medford
The most frequently occuring commute durations in Medford are 5 to 9 minutes (136 commuters, 33.1%), less than 5 minutes (76 commuters, 18.5%), and 45 to 59 minutes (35 commuters, 8.5%).
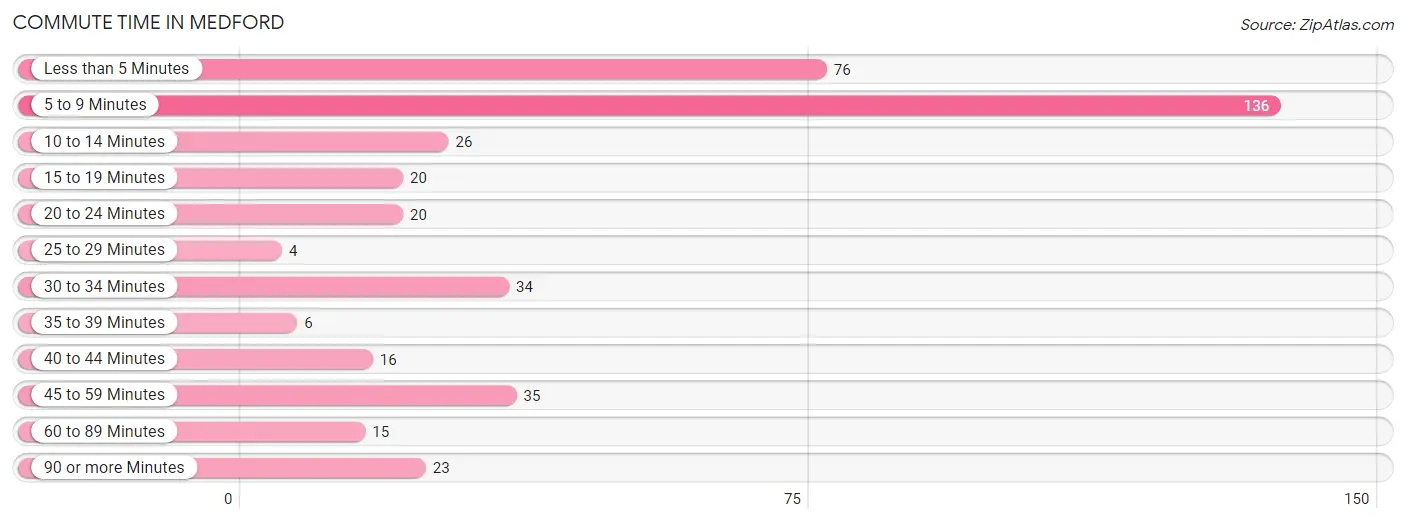
| Commute Time | # Commuters | % Commuters |
| Less than 5 Minutes | 76 | 18.5% |
| 5 to 9 Minutes | 136 | 33.1% |
| 10 to 14 Minutes | 26 | 6.3% |
| 15 to 19 Minutes | 20 | 4.9% |
| 20 to 24 Minutes | 20 | 4.9% |
| 25 to 29 Minutes | 4 | 1.0% |
| 30 to 34 Minutes | 34 | 8.3% |
| 35 to 39 Minutes | 6 | 1.5% |
| 40 to 44 Minutes | 16 | 3.9% |
| 45 to 59 Minutes | 35 | 8.5% |
| 60 to 89 Minutes | 15 | 3.6% |
| 90 or more Minutes | 23 | 5.6% |
Commute Time by Sex in Medford
The most common commute times in Medford are 5 to 9 minutes (73 commuters, 29.5%) for males and 5 to 9 minutes (63 commuters, 38.4%) for females.
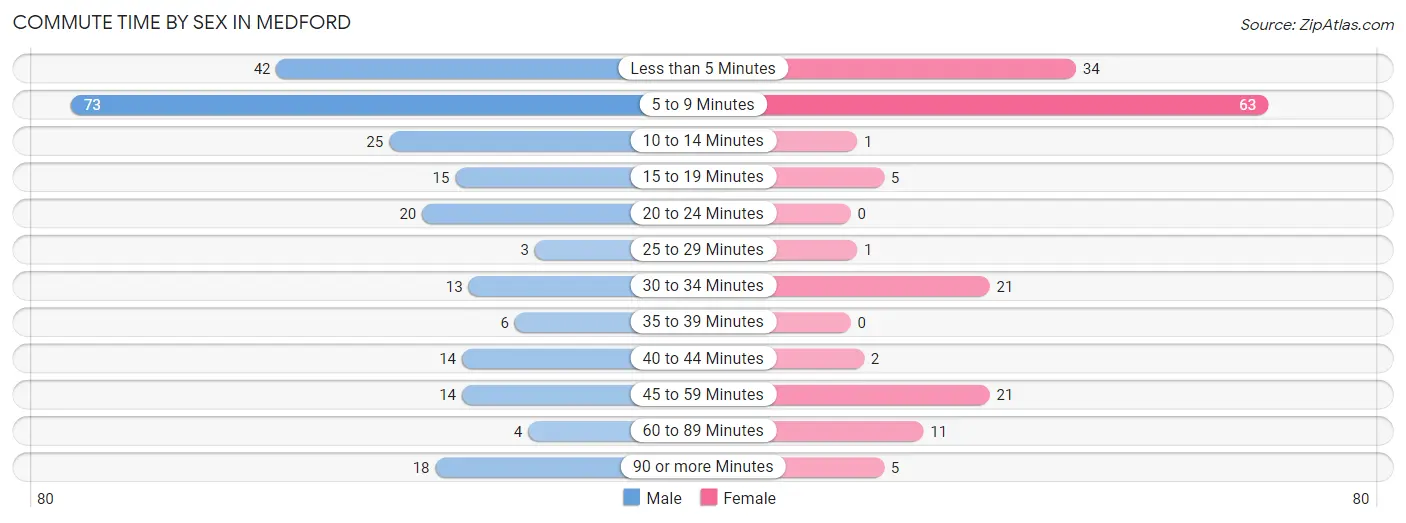
| Commute Time | Male | Female |
| Less than 5 Minutes | 42 (17.0%) | 34 (20.7%) |
| 5 to 9 Minutes | 73 (29.5%) | 63 (38.4%) |
| 10 to 14 Minutes | 25 (10.1%) | 1 (0.6%) |
| 15 to 19 Minutes | 15 (6.1%) | 5 (3.0%) |
| 20 to 24 Minutes | 20 (8.1%) | 0 (0.0%) |
| 25 to 29 Minutes | 3 (1.2%) | 1 (0.6%) |
| 30 to 34 Minutes | 13 (5.3%) | 21 (12.8%) |
| 35 to 39 Minutes | 6 (2.4%) | 0 (0.0%) |
| 40 to 44 Minutes | 14 (5.7%) | 2 (1.2%) |
| 45 to 59 Minutes | 14 (5.7%) | 21 (12.8%) |
| 60 to 89 Minutes | 4 (1.6%) | 11 (6.7%) |
| 90 or more Minutes | 18 (7.3%) | 5 (3.0%) |
Time of Departure to Work by Sex in Medford
The most frequent times of departure to work in Medford are 7:00 AM to 7:29 AM (66, 26.7%) for males and 7:30 AM to 7:59 AM (34, 20.7%) for females.
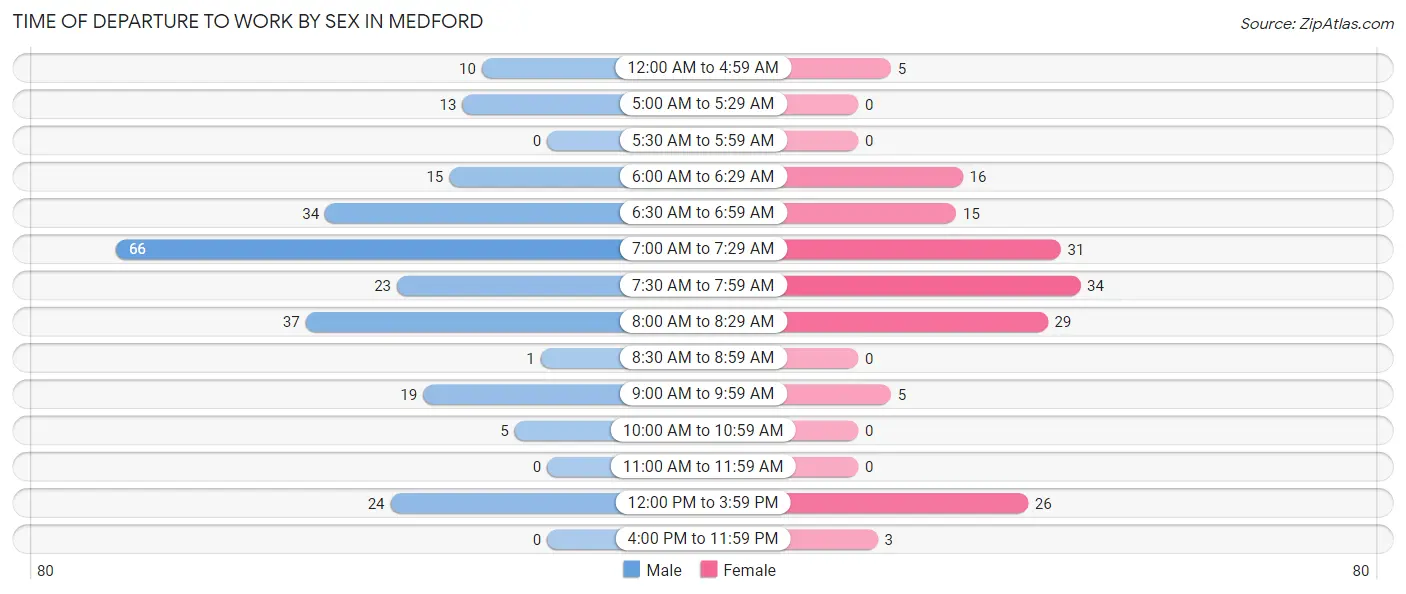
| Time of Departure | Male | Female |
| 12:00 AM to 4:59 AM | 10 (4.1%) | 5 (3.0%) |
| 5:00 AM to 5:29 AM | 13 (5.3%) | 0 (0.0%) |
| 5:30 AM to 5:59 AM | 0 (0.0%) | 0 (0.0%) |
| 6:00 AM to 6:29 AM | 15 (6.1%) | 16 (9.8%) |
| 6:30 AM to 6:59 AM | 34 (13.8%) | 15 (9.1%) |
| 7:00 AM to 7:29 AM | 66 (26.7%) | 31 (18.9%) |
| 7:30 AM to 7:59 AM | 23 (9.3%) | 34 (20.7%) |
| 8:00 AM to 8:29 AM | 37 (15.0%) | 29 (17.7%) |
| 8:30 AM to 8:59 AM | 1 (0.4%) | 0 (0.0%) |
| 9:00 AM to 9:59 AM | 19 (7.7%) | 5 (3.0%) |
| 10:00 AM to 10:59 AM | 5 (2.0%) | 0 (0.0%) |
| 11:00 AM to 11:59 AM | 0 (0.0%) | 0 (0.0%) |
| 12:00 PM to 3:59 PM | 24 (9.7%) | 26 (15.9%) |
| 4:00 PM to 11:59 PM | 0 (0.0%) | 3 (1.8%) |
| Total | 247 (100.0%) | 164 (100.0%) |
Housing Occupancy in Medford
Occupancy by Ownership in Medford
Of the total 372 dwellings in Medford, owner-occupied units account for 303 (81.5%), while renter-occupied units make up 69 (18.5%).
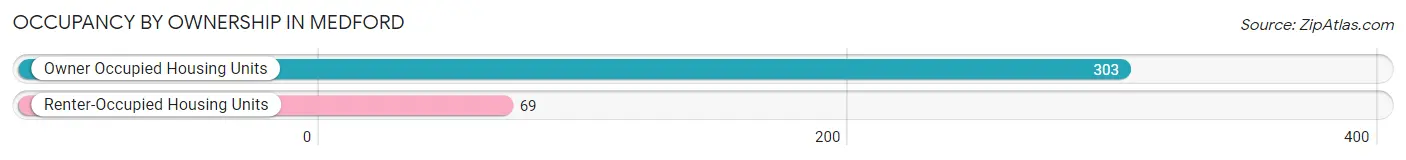
| Occupancy | # Housing Units | % Housing Units |
| Owner Occupied Housing Units | 303 | 81.5% |
| Renter-Occupied Housing Units | 69 | 18.5% |
| Total Occupied Housing Units | 372 | 100.0% |
Occupancy by Household Size in Medford
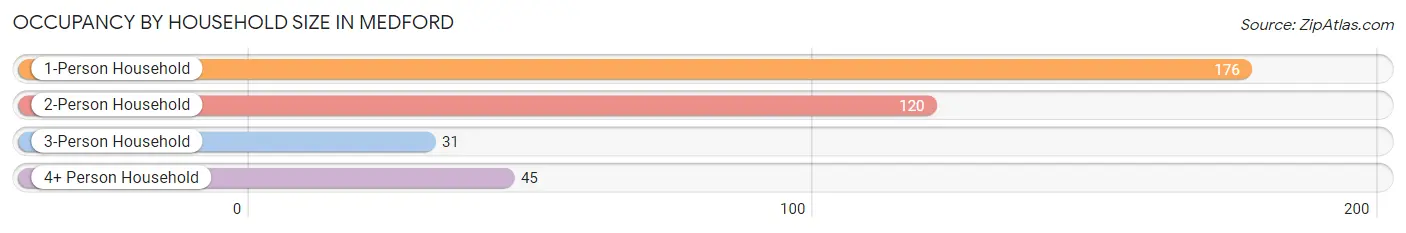
| Household Size | # Housing Units | % Housing Units |
| 1-Person Household | 176 | 47.3% |
| 2-Person Household | 120 | 32.3% |
| 3-Person Household | 31 | 8.3% |
| 4+ Person Household | 45 | 12.1% |
| Total Housing Units | 372 | 100.0% |
Occupancy by Ownership by Household Size in Medford
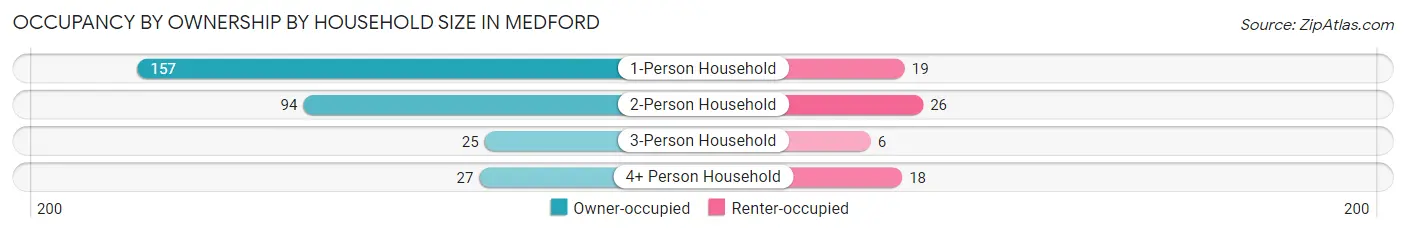
| Household Size | Owner-occupied | Renter-occupied |
| 1-Person Household | 157 (89.2%) | 19 (10.8%) |
| 2-Person Household | 94 (78.3%) | 26 (21.7%) |
| 3-Person Household | 25 (80.6%) | 6 (19.4%) |
| 4+ Person Household | 27 (60.0%) | 18 (40.0%) |
| Total Housing Units | 303 (81.5%) | 69 (18.5%) |
Occupancy by Educational Attainment in Medford
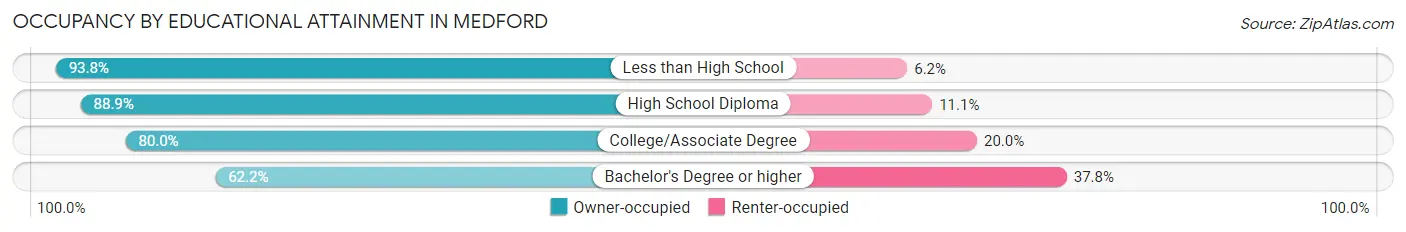
| Household Size | Owner-occupied | Renter-occupied |
| Less than High School | 76 (93.8%) | 5 (6.2%) |
| High School Diploma | 88 (88.9%) | 11 (11.1%) |
| College/Associate Degree | 88 (80.0%) | 22 (20.0%) |
| Bachelor's Degree or higher | 51 (62.2%) | 31 (37.8%) |
Occupancy by Age of Householder in Medford
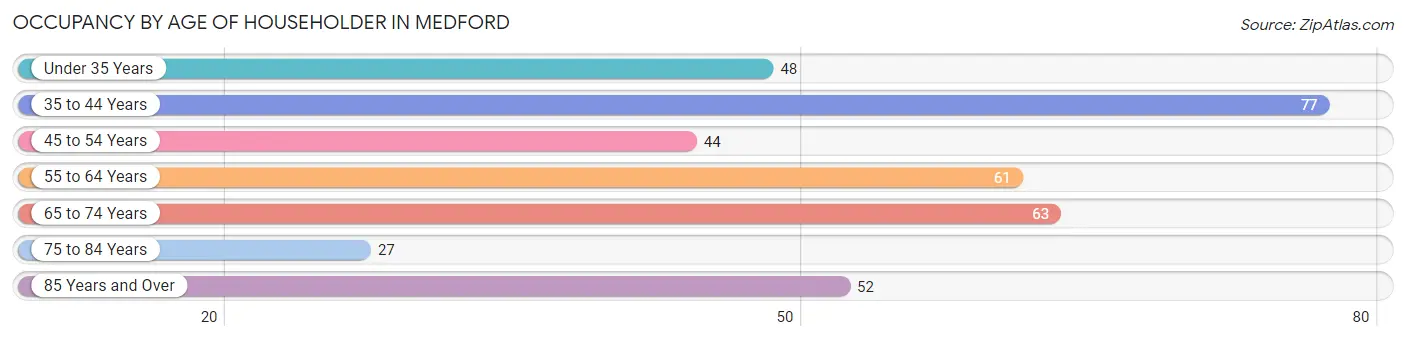
| Age Bracket | # Households | % Households |
| Under 35 Years | 48 | 12.9% |
| 35 to 44 Years | 77 | 20.7% |
| 45 to 54 Years | 44 | 11.8% |
| 55 to 64 Years | 61 | 16.4% |
| 65 to 74 Years | 63 | 16.9% |
| 75 to 84 Years | 27 | 7.3% |
| 85 Years and Over | 52 | 14.0% |
| Total | 372 | 100.0% |
Housing Finances in Medford
Median Income by Occupancy in Medford
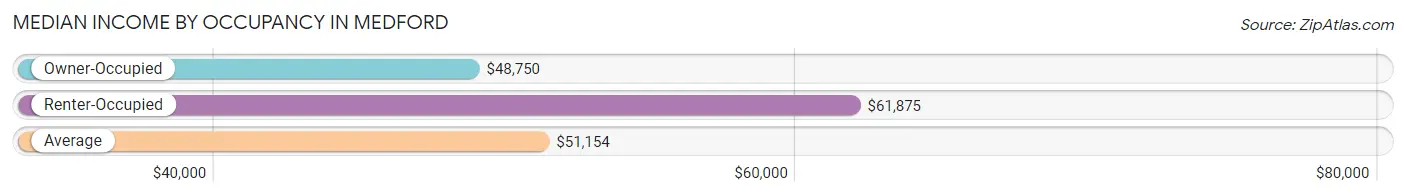
| Occupancy Type | # Households | Median Income |
| Owner-Occupied | 303 (81.5%) | $48,750 |
| Renter-Occupied | 69 (18.5%) | $61,875 |
| Average | 372 (100.0%) | $51,154 |
Occupancy by Householder Income Bracket in Medford
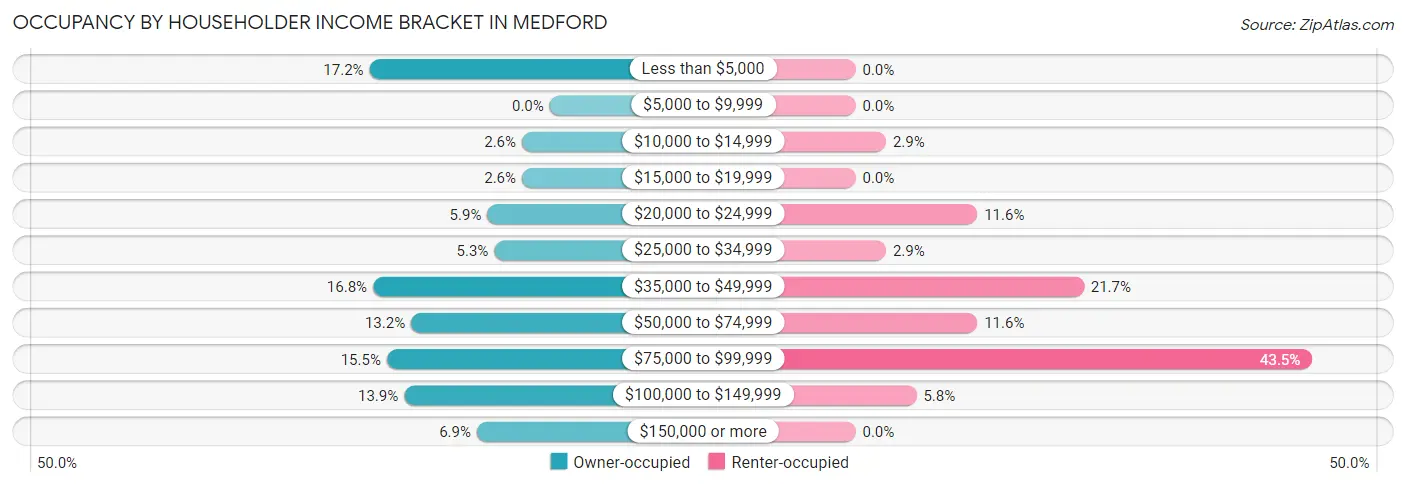
| Income Bracket | Owner-occupied | Renter-occupied |
| Less than $5,000 | 52 (17.2%) | 0 (0.0%) |
| $5,000 to $9,999 | 0 (0.0%) | 0 (0.0%) |
| $10,000 to $14,999 | 8 (2.6%) | 2 (2.9%) |
| $15,000 to $19,999 | 8 (2.6%) | 0 (0.0%) |
| $20,000 to $24,999 | 18 (5.9%) | 8 (11.6%) |
| $25,000 to $34,999 | 16 (5.3%) | 2 (2.9%) |
| $35,000 to $49,999 | 51 (16.8%) | 15 (21.7%) |
| $50,000 to $74,999 | 40 (13.2%) | 8 (11.6%) |
| $75,000 to $99,999 | 47 (15.5%) | 30 (43.5%) |
| $100,000 to $149,999 | 42 (13.9%) | 4 (5.8%) |
| $150,000 or more | 21 (6.9%) | 0 (0.0%) |
| Total | 303 (100.0%) | 69 (100.0%) |
Monthly Housing Cost Tiers in Medford
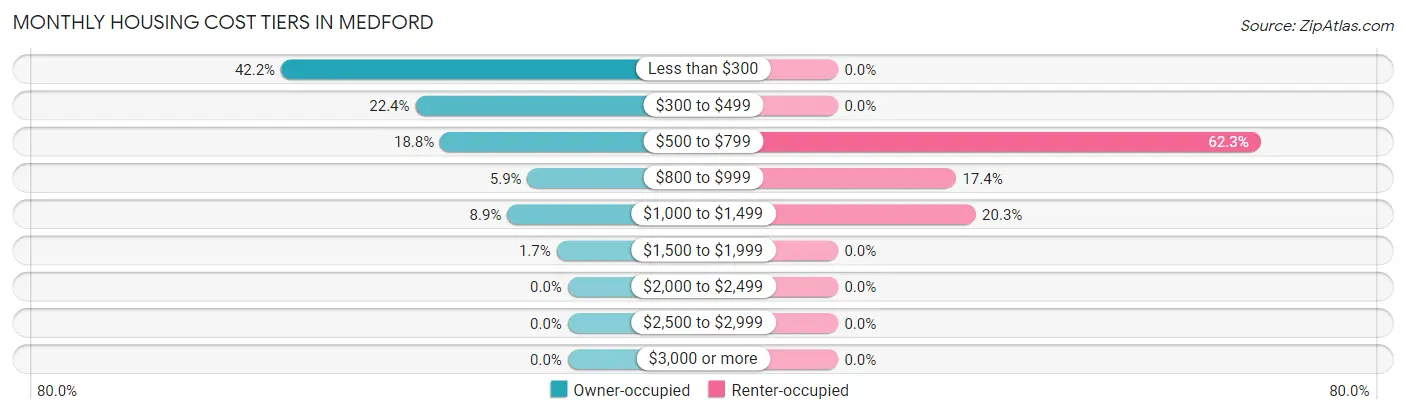
| Monthly Cost | Owner-occupied | Renter-occupied |
| Less than $300 | 128 (42.2%) | 0 (0.0%) |
| $300 to $499 | 68 (22.4%) | 0 (0.0%) |
| $500 to $799 | 57 (18.8%) | 43 (62.3%) |
| $800 to $999 | 18 (5.9%) | 12 (17.4%) |
| $1,000 to $1,499 | 27 (8.9%) | 14 (20.3%) |
| $1,500 to $1,999 | 5 (1.7%) | 0 (0.0%) |
| $2,000 to $2,499 | 0 (0.0%) | 0 (0.0%) |
| $2,500 to $2,999 | 0 (0.0%) | 0 (0.0%) |
| $3,000 or more | 0 (0.0%) | 0 (0.0%) |
| Total | 303 (100.0%) | 69 (100.0%) |
Physical Housing Characteristics in Medford
Housing Structures in Medford
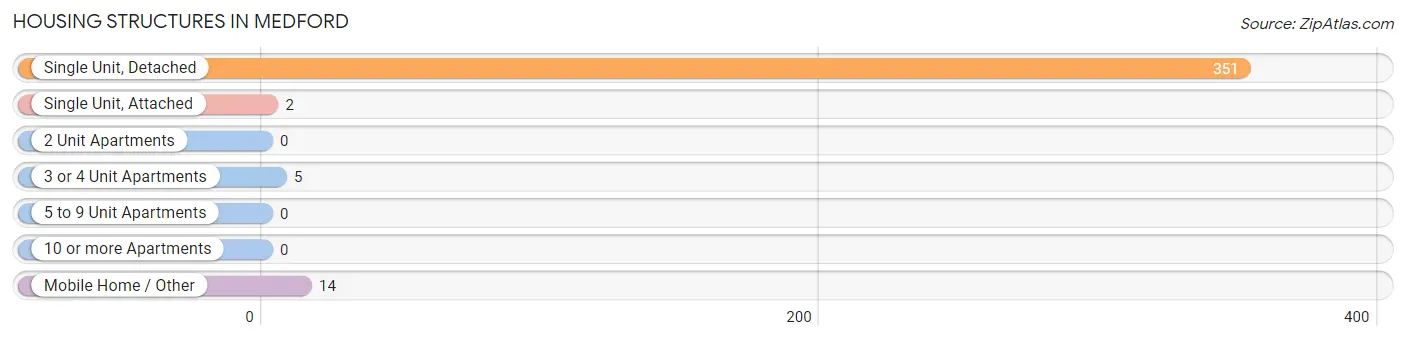
| Structure Type | # Housing Units | % Housing Units |
| Single Unit, Detached | 351 | 94.4% |
| Single Unit, Attached | 2 | 0.5% |
| 2 Unit Apartments | 0 | 0.0% |
| 3 or 4 Unit Apartments | 5 | 1.3% |
| 5 to 9 Unit Apartments | 0 | 0.0% |
| 10 or more Apartments | 0 | 0.0% |
| Mobile Home / Other | 14 | 3.8% |
| Total | 372 | 100.0% |
Housing Structures by Occupancy in Medford
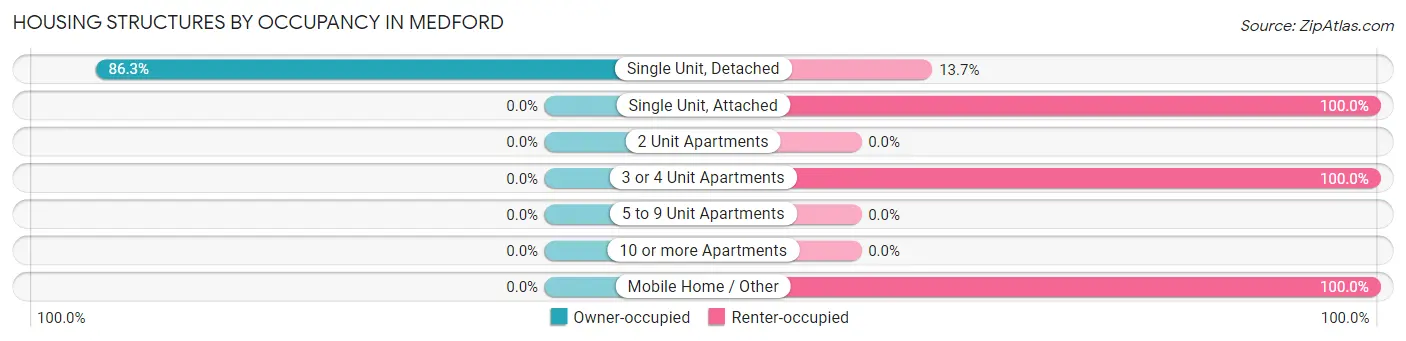
| Structure Type | Owner-occupied | Renter-occupied |
| Single Unit, Detached | 303 (86.3%) | 48 (13.7%) |
| Single Unit, Attached | 0 (0.0%) | 2 (100.0%) |
| 2 Unit Apartments | 0 (0.0%) | 0 (0.0%) |
| 3 or 4 Unit Apartments | 0 (0.0%) | 5 (100.0%) |
| 5 to 9 Unit Apartments | 0 (0.0%) | 0 (0.0%) |
| 10 or more Apartments | 0 (0.0%) | 0 (0.0%) |
| Mobile Home / Other | 0 (0.0%) | 14 (100.0%) |
| Total | 303 (81.5%) | 69 (18.5%) |
Housing Structures by Number of Rooms in Medford
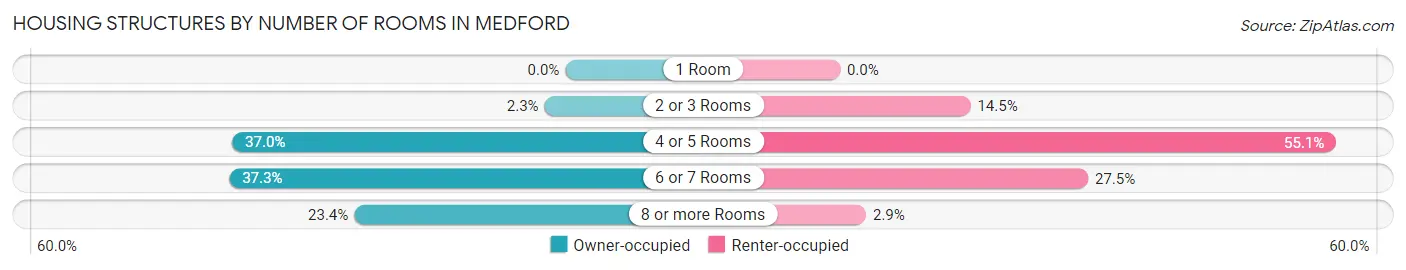
| Number of Rooms | Owner-occupied | Renter-occupied |
| 1 Room | 0 (0.0%) | 0 (0.0%) |
| 2 or 3 Rooms | 7 (2.3%) | 10 (14.5%) |
| 4 or 5 Rooms | 112 (37.0%) | 38 (55.1%) |
| 6 or 7 Rooms | 113 (37.3%) | 19 (27.5%) |
| 8 or more Rooms | 71 (23.4%) | 2 (2.9%) |
| Total | 303 (100.0%) | 69 (100.0%) |
Housing Structure by Heating Type in Medford
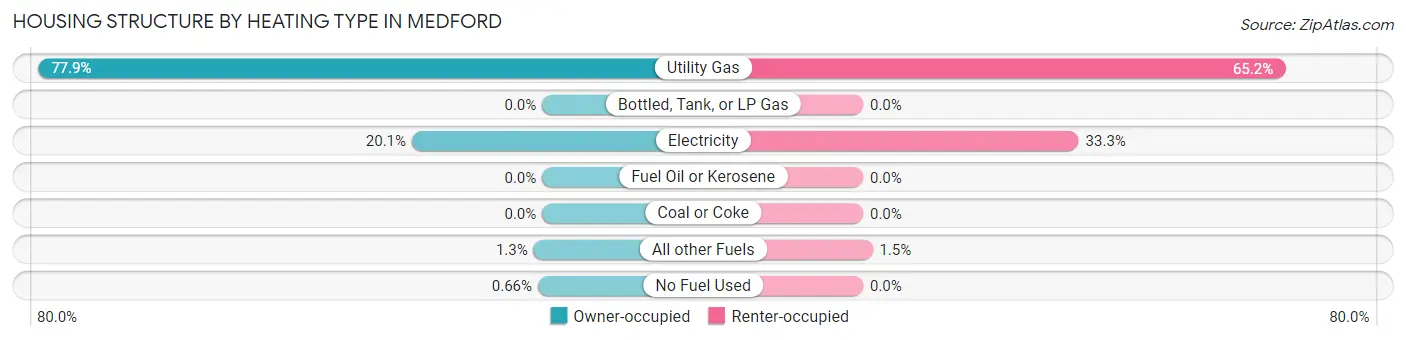
| Heating Type | Owner-occupied | Renter-occupied |
| Utility Gas | 236 (77.9%) | 45 (65.2%) |
| Bottled, Tank, or LP Gas | 0 (0.0%) | 0 (0.0%) |
| Electricity | 61 (20.1%) | 23 (33.3%) |
| Fuel Oil or Kerosene | 0 (0.0%) | 0 (0.0%) |
| Coal or Coke | 0 (0.0%) | 0 (0.0%) |
| All other Fuels | 4 (1.3%) | 1 (1.5%) |
| No Fuel Used | 2 (0.7%) | 0 (0.0%) |
| Total | 303 (100.0%) | 69 (100.0%) |
Household Vehicle Usage in Medford
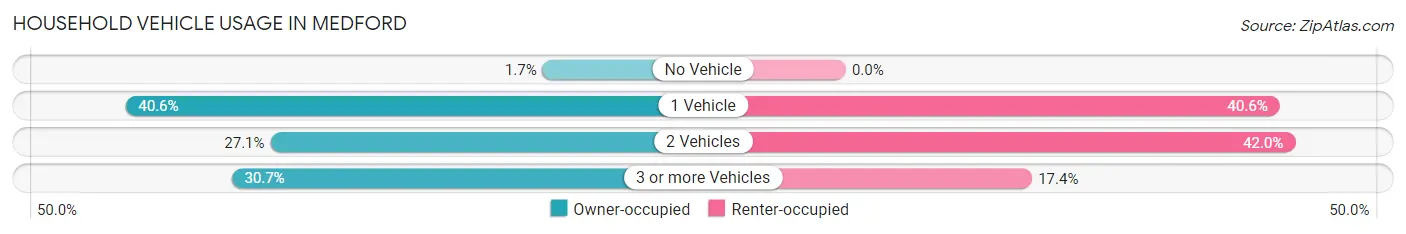
| Vehicles per Household | Owner-occupied | Renter-occupied |
| No Vehicle | 5 (1.7%) | 0 (0.0%) |
| 1 Vehicle | 123 (40.6%) | 28 (40.6%) |
| 2 Vehicles | 82 (27.1%) | 29 (42.0%) |
| 3 or more Vehicles | 93 (30.7%) | 12 (17.4%) |
| Total | 303 (100.0%) | 69 (100.0%) |
Real Estate & Mortgages in Medford
Real Estate and Mortgage Overview in Medford
| Characteristic | Without Mortgage | With Mortgage |
| Housing Units | 251 | 52 |
| Median Property Value | $53,600 | $109,600 |
| Median Household Income | $46,776 | $4 |
| Monthly Housing Costs | $293 | $0 |
| Real Estate Taxes | $261 | $0 |
Property Value by Mortgage Status in Medford
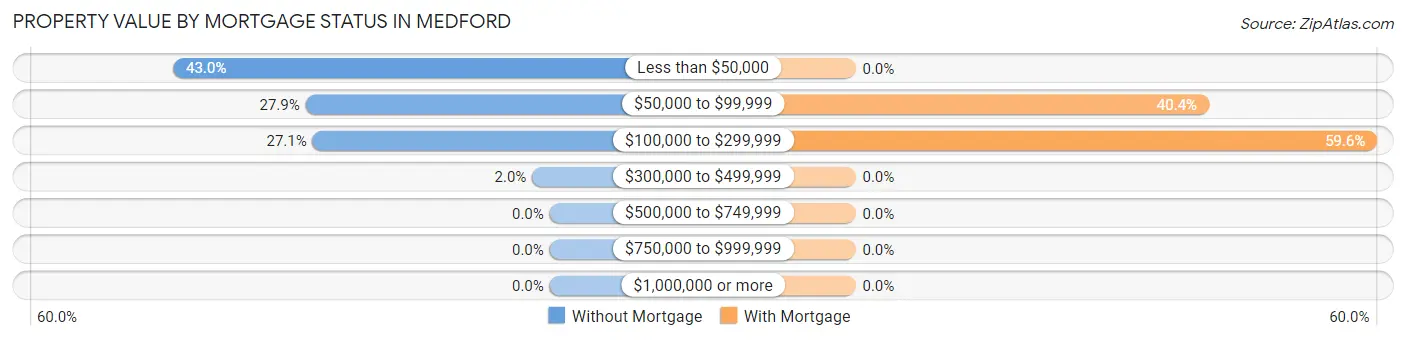
| Property Value | Without Mortgage | With Mortgage |
| Less than $50,000 | 108 (43.0%) | 0 (0.0%) |
| $50,000 to $99,999 | 70 (27.9%) | 21 (40.4%) |
| $100,000 to $299,999 | 68 (27.1%) | 31 (59.6%) |
| $300,000 to $499,999 | 5 (2.0%) | 0 (0.0%) |
| $500,000 to $749,999 | 0 (0.0%) | 0 (0.0%) |
| $750,000 to $999,999 | 0 (0.0%) | 0 (0.0%) |
| $1,000,000 or more | 0 (0.0%) | 0 (0.0%) |
| Total | 251 (100.0%) | 52 (100.0%) |
Household Income by Mortgage Status in Medford
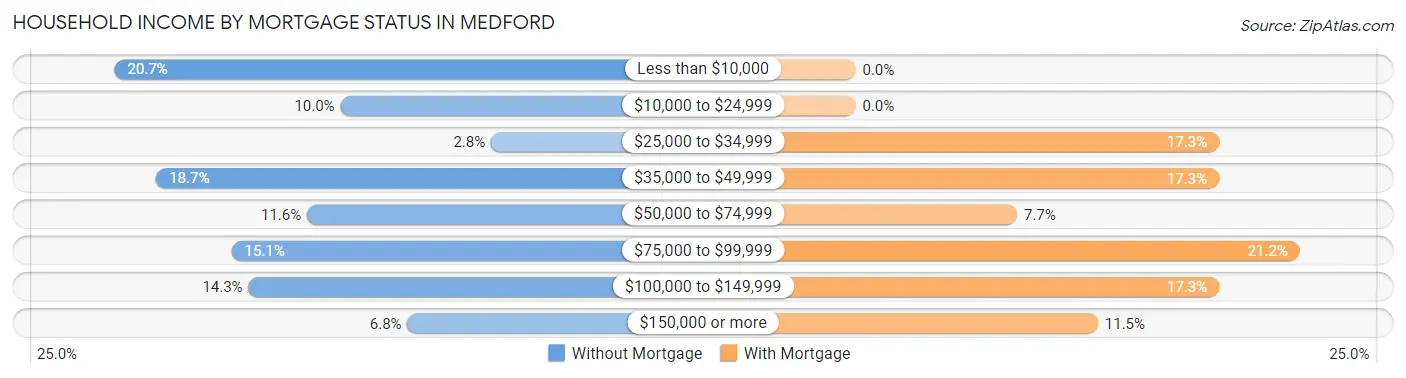
| Household Income | Without Mortgage | With Mortgage |
| Less than $10,000 | 52 (20.7%) | 0 (0.0%) |
| $10,000 to $24,999 | 25 (10.0%) | 0 (0.0%) |
| $25,000 to $34,999 | 7 (2.8%) | 9 (17.3%) |
| $35,000 to $49,999 | 47 (18.7%) | 9 (17.3%) |
| $50,000 to $74,999 | 29 (11.6%) | 4 (7.7%) |
| $75,000 to $99,999 | 38 (15.1%) | 11 (21.1%) |
| $100,000 to $149,999 | 36 (14.3%) | 9 (17.3%) |
| $150,000 or more | 17 (6.8%) | 6 (11.5%) |
| Total | 251 (100.0%) | 52 (100.0%) |
Property Value to Household Income Ratio in Medford
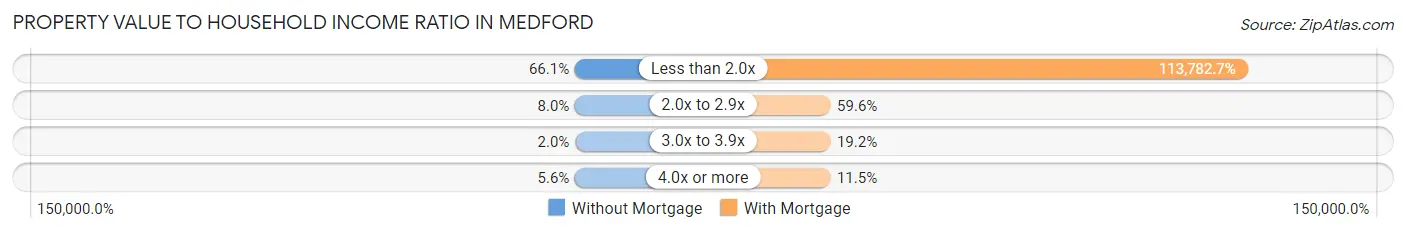
| Value-to-Income Ratio | Without Mortgage | With Mortgage |
| Less than 2.0x | 166 (66.1%) | 59,167 (113,782.7%) |
| 2.0x to 2.9x | 20 (8.0%) | 31 (59.6%) |
| 3.0x to 3.9x | 5 (2.0%) | 10 (19.2%) |
| 4.0x or more | 14 (5.6%) | 6 (11.5%) |
| Total | 251 (100.0%) | 52 (100.0%) |
Real Estate Taxes by Mortgage Status in Medford
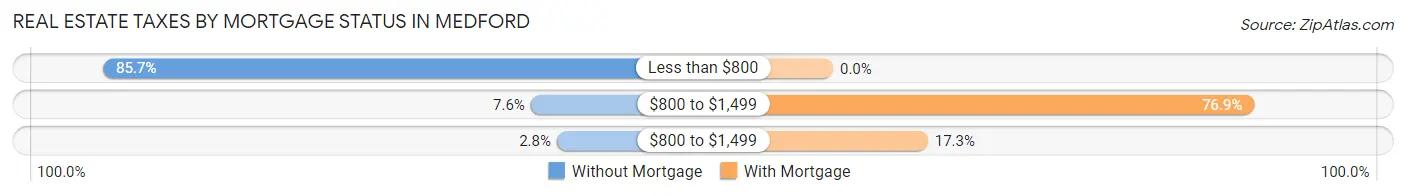
| Property Taxes | Without Mortgage | With Mortgage |
| Less than $800 | 215 (85.7%) | 0 (0.0%) |
| $800 to $1,499 | 19 (7.6%) | 40 (76.9%) |
| $800 to $1,499 | 7 (2.8%) | 9 (17.3%) |
| Total | 251 (100.0%) | 52 (100.0%) |
Health & Disability in Medford
Health Insurance Coverage by Age in Medford
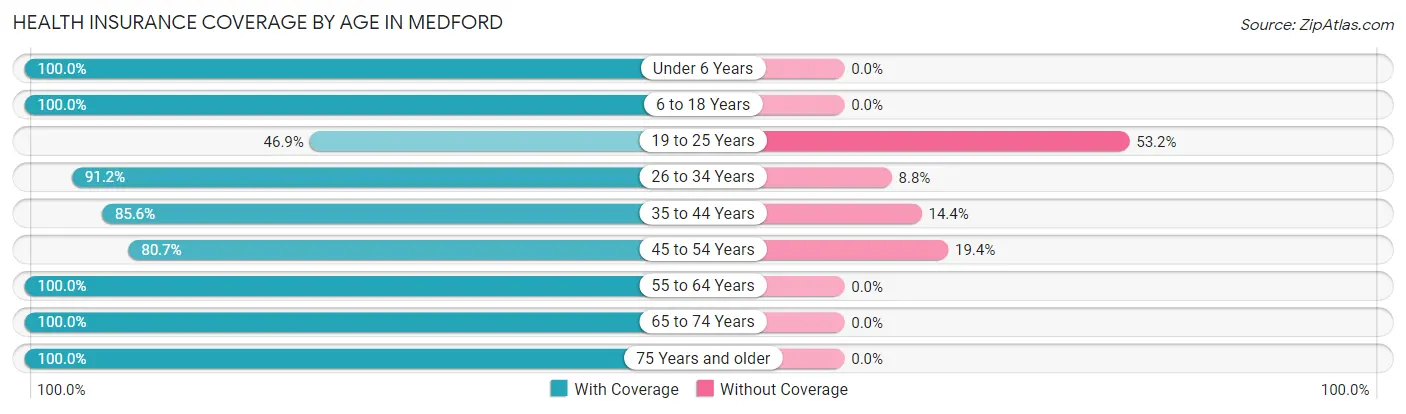
| Age Bracket | With Coverage | Without Coverage |
| Under 6 Years | 74 (100.0%) | 0 (0.0%) |
| 6 to 18 Years | 142 (100.0%) | 0 (0.0%) |
| 19 to 25 Years | 52 (46.9%) | 59 (53.1%) |
| 26 to 34 Years | 62 (91.2%) | 6 (8.8%) |
| 35 to 44 Years | 101 (85.6%) | 17 (14.4%) |
| 45 to 54 Years | 75 (80.6%) | 18 (19.4%) |
| 55 to 64 Years | 90 (100.0%) | 0 (0.0%) |
| 65 to 74 Years | 89 (100.0%) | 0 (0.0%) |
| 75 Years and older | 106 (100.0%) | 0 (0.0%) |
| Total | 791 (88.8%) | 100 (11.2%) |
Health Insurance Coverage by Citizenship Status in Medford
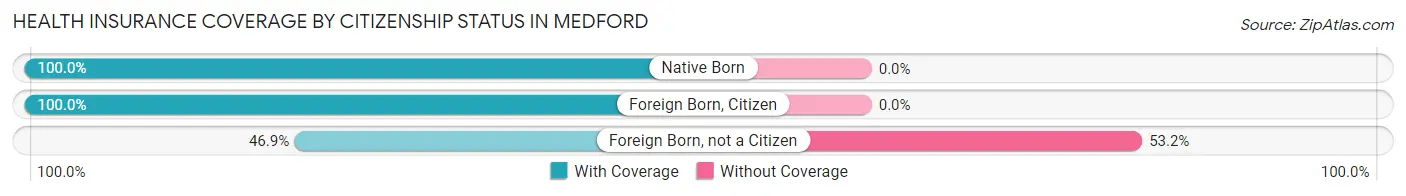
| Citizenship Status | With Coverage | Without Coverage |
| Native Born | 74 (100.0%) | 0 (0.0%) |
| Foreign Born, Citizen | 142 (100.0%) | 0 (0.0%) |
| Foreign Born, not a Citizen | 52 (46.9%) | 59 (53.1%) |
Health Insurance Coverage by Household Income in Medford
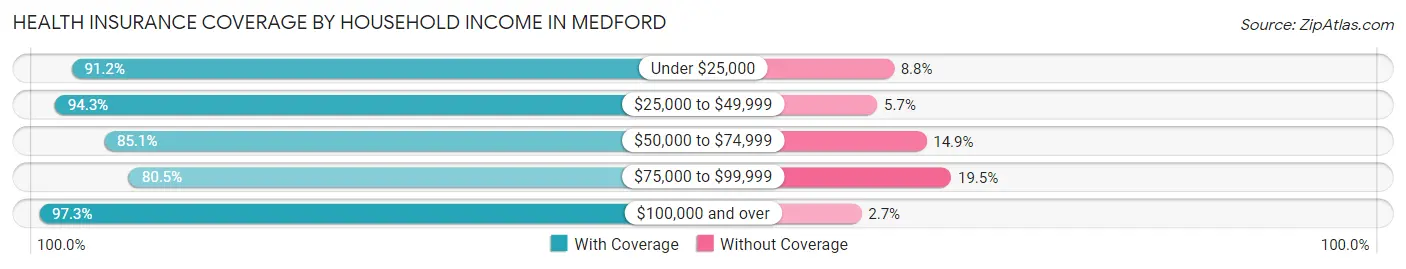
| Household Income | With Coverage | Without Coverage |
| Under $25,000 | 166 (91.2%) | 16 (8.8%) |
| $25,000 to $49,999 | 116 (94.3%) | 7 (5.7%) |
| $50,000 to $74,999 | 120 (85.1%) | 21 (14.9%) |
| $75,000 to $99,999 | 210 (80.5%) | 51 (19.5%) |
| $100,000 and over | 179 (97.3%) | 5 (2.7%) |
Public vs Private Health Insurance Coverage by Age in Medford
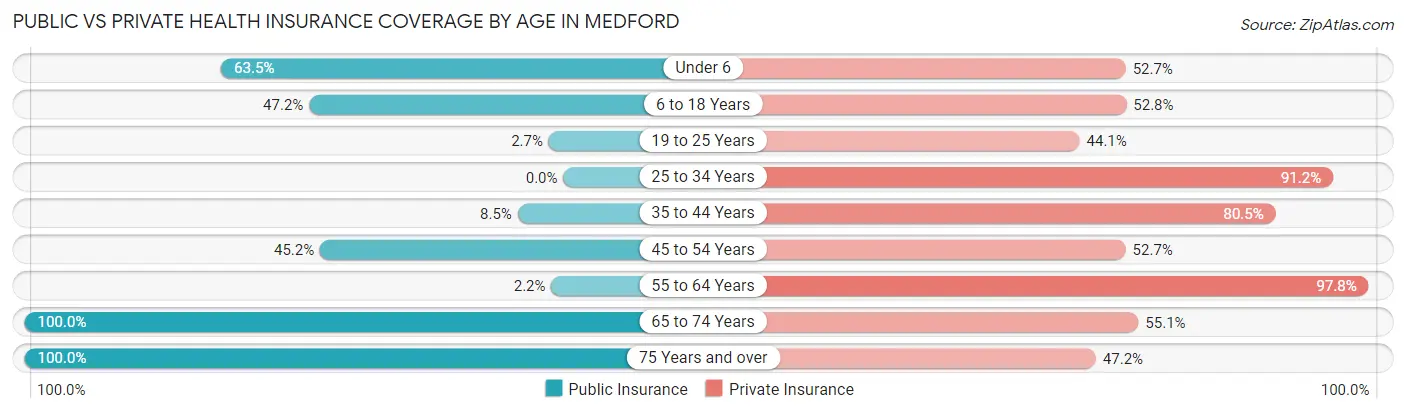
| Age Bracket | Public Insurance | Private Insurance |
| Under 6 | 47 (63.5%) | 39 (52.7%) |
| 6 to 18 Years | 67 (47.2%) | 75 (52.8%) |
| 19 to 25 Years | 3 (2.7%) | 49 (44.1%) |
| 25 to 34 Years | 0 (0.0%) | 62 (91.2%) |
| 35 to 44 Years | 10 (8.5%) | 95 (80.5%) |
| 45 to 54 Years | 42 (45.2%) | 49 (52.7%) |
| 55 to 64 Years | 2 (2.2%) | 88 (97.8%) |
| 65 to 74 Years | 89 (100.0%) | 49 (55.1%) |
| 75 Years and over | 106 (100.0%) | 50 (47.2%) |
| Total | 366 (41.1%) | 556 (62.4%) |
Disability Status by Sex by Age in Medford
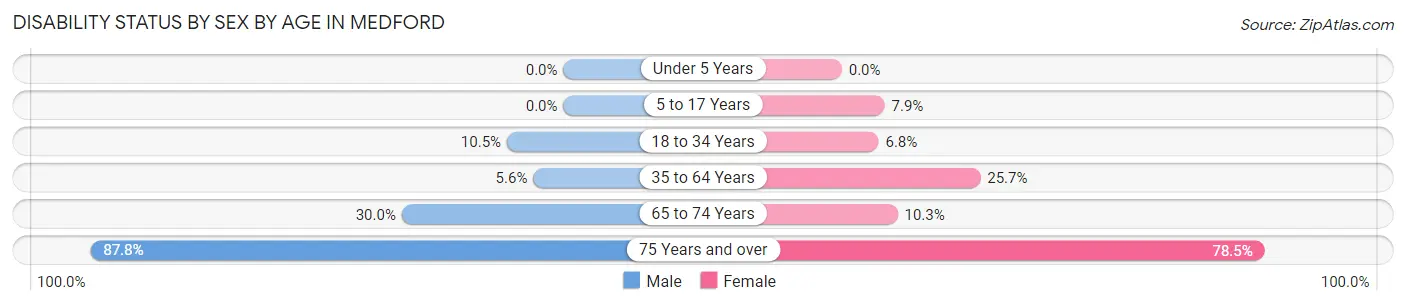
| Age Bracket | Male | Female |
| Under 5 Years | 0 (0.0%) | 0 (0.0%) |
| 5 to 17 Years | 0 (0.0%) | 5 (7.9%) |
| 18 to 34 Years | 11 (10.5%) | 6 (6.8%) |
| 35 to 64 Years | 9 (5.6%) | 36 (25.7%) |
| 65 to 74 Years | 18 (30.0%) | 3 (10.3%) |
| 75 Years and over | 36 (87.8%) | 51 (78.5%) |
Disability Class by Sex by Age in Medford
Disability Class: Hearing Difficulty
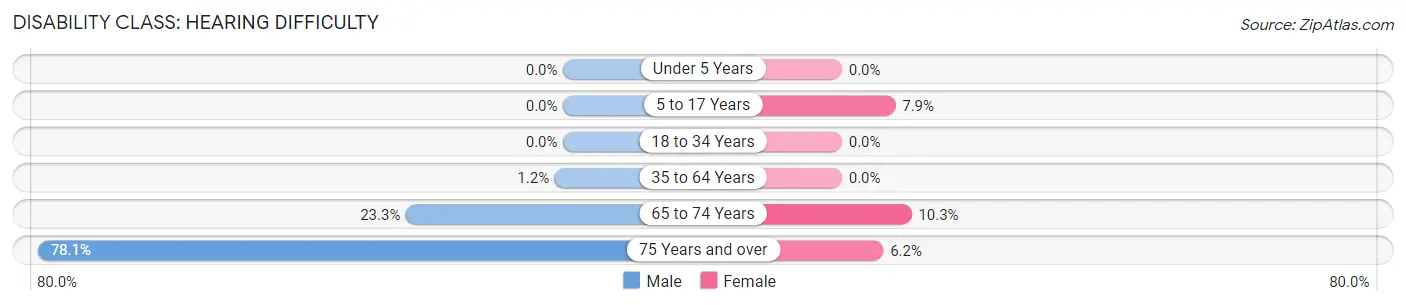
| Age Bracket | Male | Female |
| Under 5 Years | 0 (0.0%) | 0 (0.0%) |
| 5 to 17 Years | 0 (0.0%) | 5 (7.9%) |
| 18 to 34 Years | 0 (0.0%) | 0 (0.0%) |
| 35 to 64 Years | 2 (1.2%) | 0 (0.0%) |
| 65 to 74 Years | 14 (23.3%) | 3 (10.3%) |
| 75 Years and over | 32 (78.0%) | 4 (6.1%) |
Disability Class: Vision Difficulty
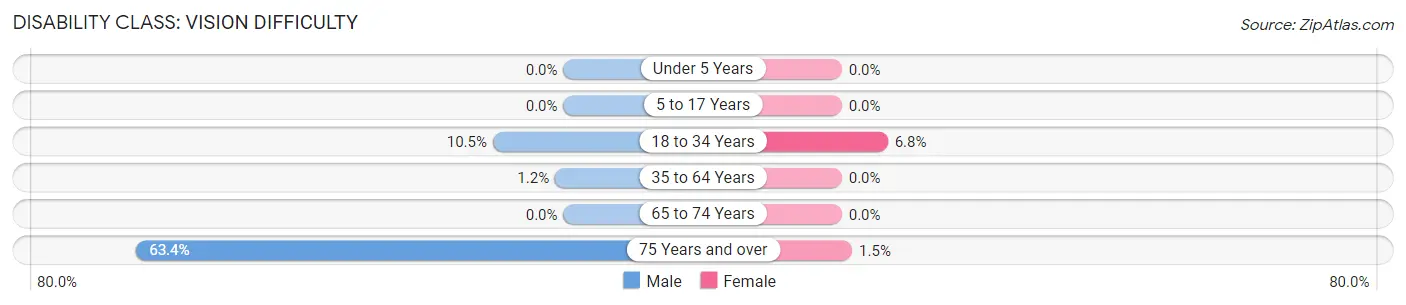
| Age Bracket | Male | Female |
| Under 5 Years | 0 (0.0%) | 0 (0.0%) |
| 5 to 17 Years | 0 (0.0%) | 0 (0.0%) |
| 18 to 34 Years | 11 (10.5%) | 6 (6.8%) |
| 35 to 64 Years | 2 (1.2%) | 0 (0.0%) |
| 65 to 74 Years | 0 (0.0%) | 0 (0.0%) |
| 75 Years and over | 26 (63.4%) | 1 (1.5%) |
Disability Class: Cognitive Difficulty
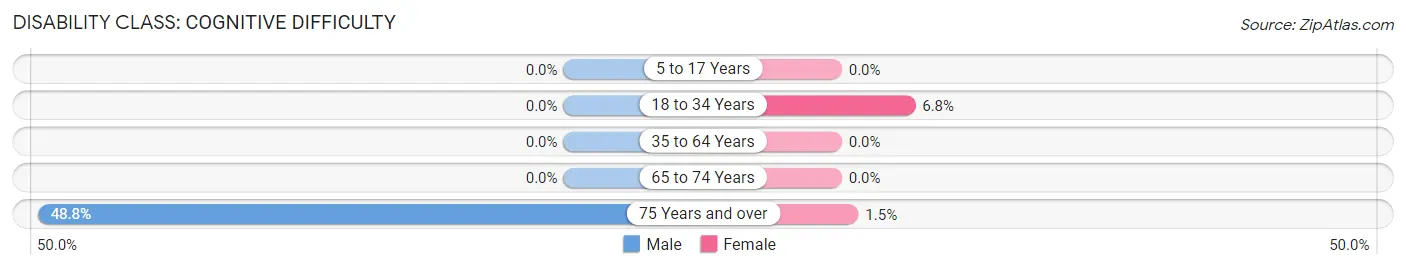
| Age Bracket | Male | Female |
| 5 to 17 Years | 0 (0.0%) | 0 (0.0%) |
| 18 to 34 Years | 0 (0.0%) | 6 (6.8%) |
| 35 to 64 Years | 0 (0.0%) | 0 (0.0%) |
| 65 to 74 Years | 0 (0.0%) | 0 (0.0%) |
| 75 Years and over | 20 (48.8%) | 1 (1.5%) |
Disability Class: Ambulatory Difficulty
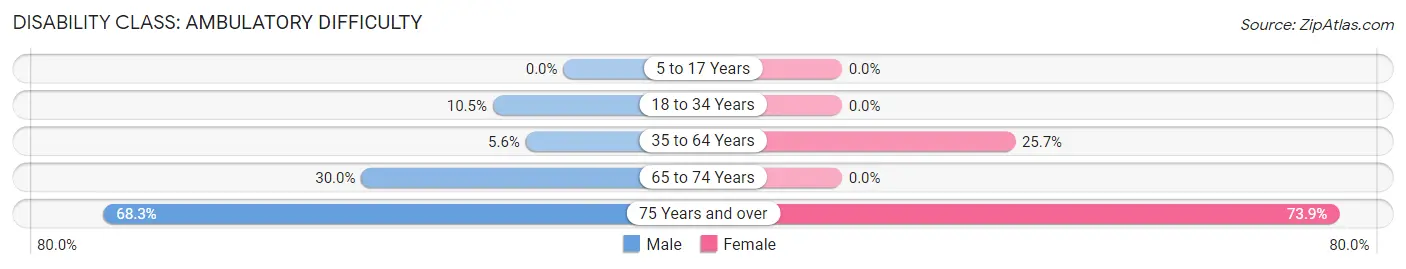
| Age Bracket | Male | Female |
| 5 to 17 Years | 0 (0.0%) | 0 (0.0%) |
| 18 to 34 Years | 11 (10.5%) | 0 (0.0%) |
| 35 to 64 Years | 9 (5.6%) | 36 (25.7%) |
| 65 to 74 Years | 18 (30.0%) | 0 (0.0%) |
| 75 Years and over | 28 (68.3%) | 48 (73.9%) |
Disability Class: Self-Care Difficulty
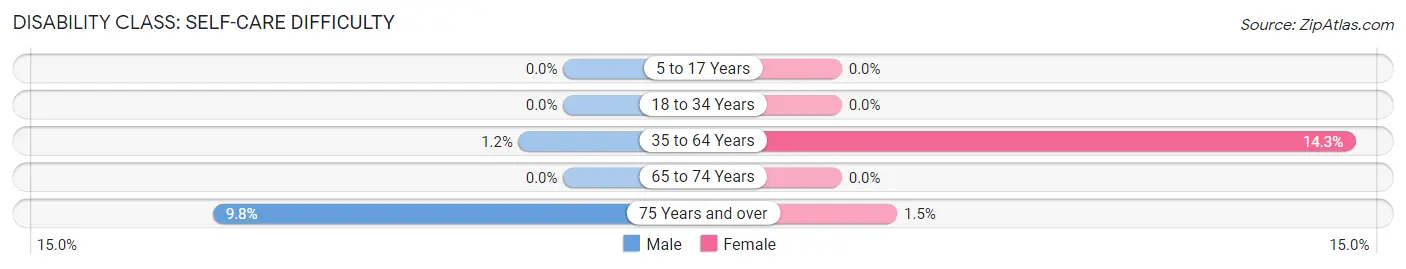
| Age Bracket | Male | Female |
| 5 to 17 Years | 0 (0.0%) | 0 (0.0%) |
| 18 to 34 Years | 0 (0.0%) | 0 (0.0%) |
| 35 to 64 Years | 2 (1.2%) | 20 (14.3%) |
| 65 to 74 Years | 0 (0.0%) | 0 (0.0%) |
| 75 Years and over | 4 (9.8%) | 1 (1.5%) |
Technology Access in Medford
Computing Device Access in Medford
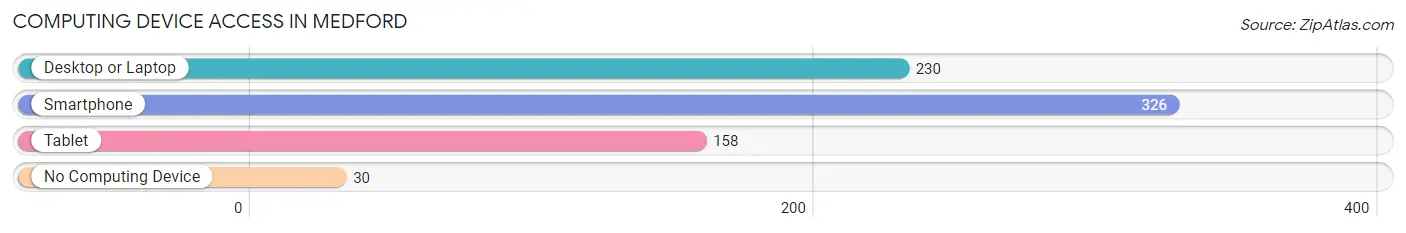
| Device Type | # Households | % Households |
| Desktop or Laptop | 230 | 61.8% |
| Smartphone | 326 | 87.6% |
| Tablet | 158 | 42.5% |
| No Computing Device | 30 | 8.1% |
| Total | 372 | 100.0% |
Internet Access in Medford
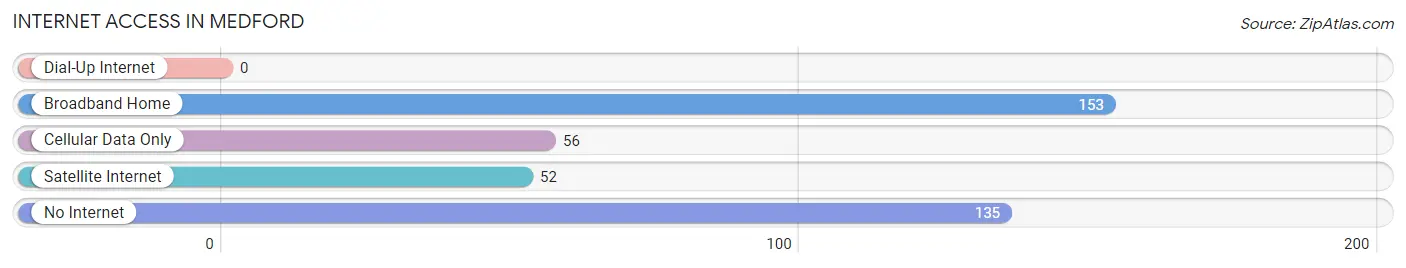
| Internet Type | # Households | % Households |
| Dial-Up Internet | 0 | 0.0% |
| Broadband Home | 153 | 41.1% |
| Cellular Data Only | 56 | 15.0% |
| Satellite Internet | 52 | 14.0% |
| No Internet | 135 | 36.3% |
| Total | 372 | 100.0% |
Medford Summary
Medford is a small town located in Grant County, Oklahoma. It is situated in the southwestern part of the state, about 25 miles south of Enid. The town was founded in 1891 and was named after Medford, Massachusetts. The population of Medford was 1,093 at the 2010 census.
History
The town of Medford was founded in 1891 by a group of settlers from Massachusetts. The town was named after Medford, Massachusetts, and was originally intended to be a farming community. The first post office was established in 1892 and the town was incorporated in 1901.
The town grew slowly but steadily over the years, and by the 1930s it had become a thriving agricultural center. The town was home to several businesses, including a bank, a hotel, a general store, and a movie theater.
In the 1950s, the town began to decline as many of its residents moved away in search of better economic opportunities. The population of Medford dropped from 1,500 in 1950 to just over 1,000 in 2010.
Geography
Medford is located in southwestern Oklahoma, about 25 miles south of Enid. The town is situated in the Red Bed Plains region of the state, which is characterized by flat terrain and sandy soils. The town is located at the intersection of State Highway 74 and County Road E-14.
The climate in Medford is semi-arid, with hot summers and mild winters. The average annual temperature is around 64°F, and the average annual precipitation is around 24 inches.
Economy
The economy of Medford is largely based on agriculture. The town is home to several farms, which produce a variety of crops, including wheat, corn, soybeans, and cotton. The town is also home to several businesses, including a bank, a hotel, a general store, and a movie theater.
Demographics
As of the 2010 census, the population of Medford was 1,093. The racial makeup of the town was 95.3% White, 0.7% African American, 0.7% Native American, 0.3% Asian, and 2.9% from other races. The median household income was $35,625, and the median family income was $41,250.
The town is served by the Medford Public School District, which includes an elementary school, a middle school, and a high school. The town is also home to a branch of the Oklahoma State University system.
Conclusion
Medford is a small town located in Grant County, Oklahoma. It was founded in 1891 and was named after Medford, Massachusetts. The town has a population of 1,093 and is largely based on agriculture. The town is served by the Medford Public School District and is home to a branch of the Oklahoma State University system.
Common Questions
What is Per Capita Income in Medford?
Per Capita income in Medford is $29,468.
What is the Median Family Income in Medford?
Median Family Income in Medford is $89,097.
What is the Median Household income in Medford?
Median Household Income in Medford is $51,154.
What is Income or Wage Gap in Medford?
Income or Wage Gap in Medford is 36.8%.
Women in Medford earn 63.2 cents for every dollar earned by a man.
What is Family Income Deficit in Medford?
Family Income Deficit in Medford is $3,556.
Families that are below poverty line in Medford earn $3,556 less on average than the poverty threshold level.
What is Inequality or Gini Index in Medford?
Inequality or Gini Index in Medford is 0.44.
What is the Total Population of Medford?
Total Population of Medford is 949.
What is the Total Male Population of Medford?
Total Male Population of Medford is 503.
What is the Total Female Population of Medford?
Total Female Population of Medford is 446.
What is the Ratio of Males per 100 Females in Medford?
There are 112.78 Males per 100 Females in Medford.
What is the Ratio of Females per 100 Males in Medford?
There are 88.67 Females per 100 Males in Medford.
What is the Median Population Age in Medford?
Median Population Age in Medford is 41.2 Years.
What is the Average Family Size in Medford
Average Family Size in Medford is 3.4 People.
What is the Average Household Size in Medford
Average Household Size in Medford is 2.4 People.
How Large is the Labor Force in Medford?
There are 421 People in the Labor Forcein in Medford.
What is the Percentage of People in the Labor Force in Medford?
55.1% of People are in the Labor Force in Medford.
What is the Unemployment Rate in Medford?
Unemployment Rate in Medford is 0.2%.