Zip Codes with the Highest Percentage of Population Employed in Life, Physical & Social Science in Oklahoma
RELATED REPORTS & OPTIONS
Life, Physical & Social Science
Oklahoma
Compare Zip Codes
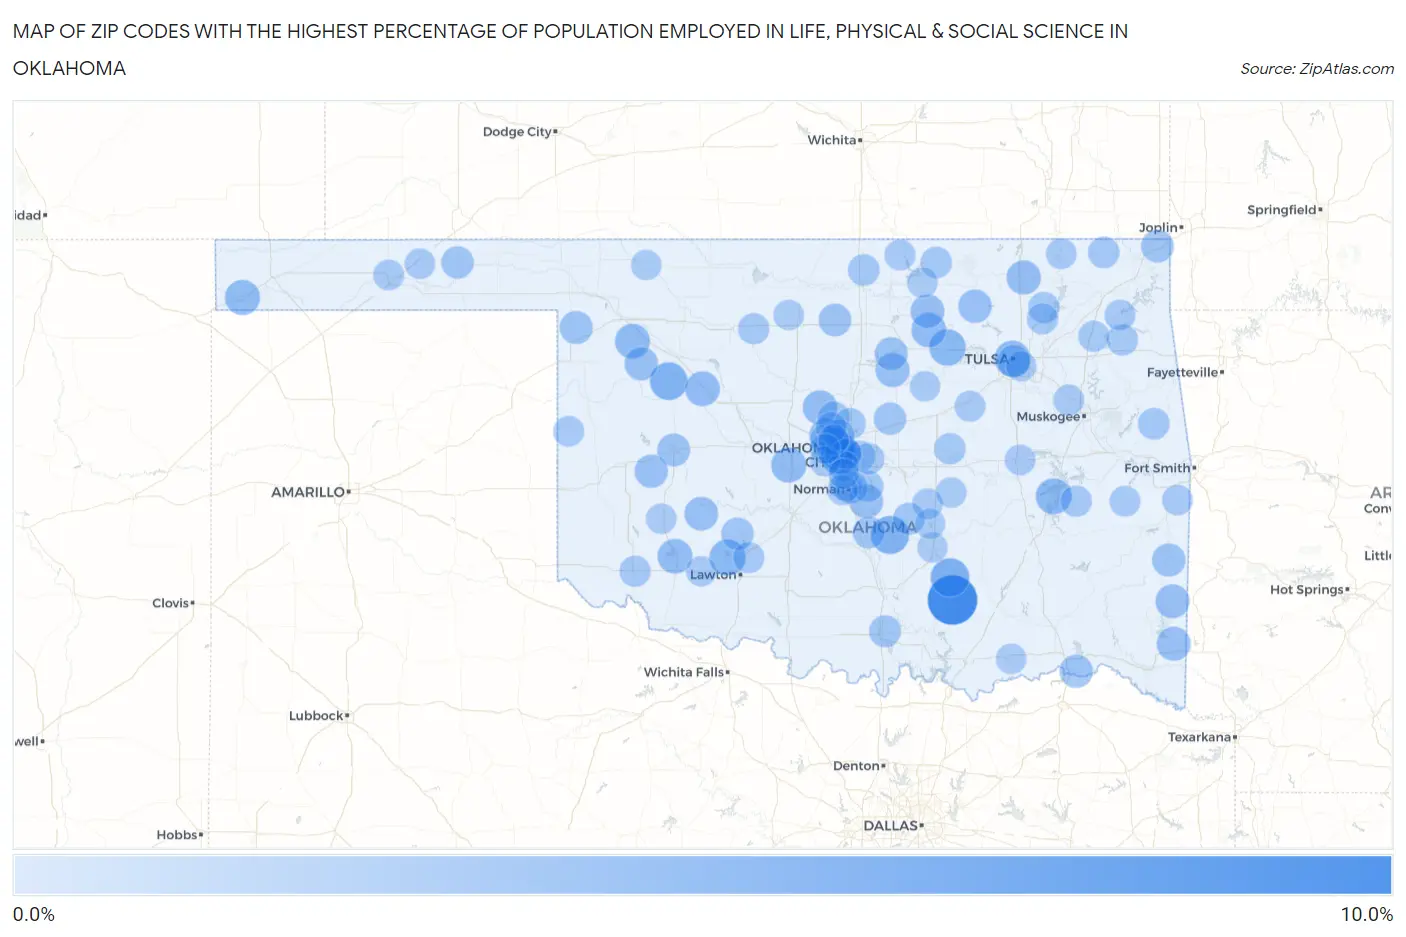
Map of Zip Codes with the Highest Percentage of Population Employed in Life, Physical & Social Science in Oklahoma
0.0%
10.0%
Zip Codes with the Highest Percentage of Population Employed in Life, Physical & Social Science in Oklahoma
| Zip Code | % Employed | vs State | vs National | |
| 1. | 74530 | 9.2% | 0.76%(+8.47)#1 | 1.1%(+8.14)#242 |
| 2. | 73104 | 4.7% | 0.76%(+3.95)#2 | 1.1%(+3.62)#848 |
| 3. | 74871 | 4.5% | 0.76%(+3.77)#3 | 1.1%(+3.44)#917 |
| 4. | 74831 | 4.3% | 0.76%(+3.53)#4 | 1.1%(+3.20)#1,009 |
| 5. | 73102 | 4.3% | 0.76%(+3.49)#5 | 1.1%(+3.16)#1,024 |
| 6. | 73667 | 4.1% | 0.76%(+3.36)#6 | 1.1%(+3.03)#1,087 |
| 7. | 74034 | 3.6% | 0.76%(+2.81)#7 | 1.1%(+2.48)#1,383 |
| 8. | 73557 | 3.5% | 0.76%(+2.72)#8 | 1.1%(+2.39)#1,442 |
| 9. | 74103 | 3.4% | 0.76%(+2.66)#9 | 1.1%(+2.33)#1,483 |
| 10. | 74425 | 3.3% | 0.76%(+2.58)#10 | 1.1%(+2.25)#1,538 |
| 11. | 73090 | 3.1% | 0.76%(+2.29)#11 | 1.1%(+1.96)#1,815 |
| 12. | 73937 | 3.1% | 0.76%(+2.29)#12 | 1.1%(+1.96)#1,817 |
| 13. | 73857 | 2.9% | 0.76%(+2.19)#13 | 1.1%(+1.86)#1,937 |
| 14. | 73658 | 2.9% | 0.76%(+2.12)#14 | 1.1%(+1.79)#2,010 |
| 15. | 73118 | 2.9% | 0.76%(+2.12)#15 | 1.1%(+1.79)#2,016 |
| 16. | 74058 | 2.9% | 0.76%(+2.12)#16 | 1.1%(+1.79)#2,020 |
| 17. | 73559 | 2.9% | 0.76%(+2.12)#17 | 1.1%(+1.79)#2,021 |
| 18. | 73016 | 2.7% | 0.76%(+1.99)#18 | 1.1%(+1.66)#2,180 |
| 19. | 74006 | 2.7% | 0.76%(+1.90)#19 | 1.1%(+1.57)#2,303 |
| 20. | 74074 | 2.6% | 0.76%(+1.83)#20 | 1.1%(+1.50)#2,411 |
| 21. | 74734 | 2.6% | 0.76%(+1.82)#21 | 1.1%(+1.49)#2,432 |
| 22. | 74963 | 2.6% | 0.76%(+1.80)#22 | 1.1%(+1.47)#2,455 |
| 23. | 73068 | 2.5% | 0.76%(+1.75)#23 | 1.1%(+1.42)#2,558 |
| 24. | 74650 | 2.5% | 0.76%(+1.71)#24 | 1.1%(+1.38)#2,613 |
| 25. | 73062 | 2.5% | 0.76%(+1.70)#25 | 1.1%(+1.37)#2,641 |
| 26. | 73142 | 2.4% | 0.76%(+1.67)#26 | 1.1%(+1.34)#2,701 |
| 27. | 73859 | 2.3% | 0.76%(+1.58)#27 | 1.1%(+1.25)#2,862 |
| 28. | 74084 | 2.3% | 0.76%(+1.55)#28 | 1.1%(+1.22)#2,930 |
| 29. | 73624 | 2.3% | 0.76%(+1.52)#29 | 1.1%(+1.19)#3,000 |
| 30. | 74939 | 2.3% | 0.76%(+1.51)#30 | 1.1%(+1.18)#3,016 |
| 31. | 74738 | 2.2% | 0.76%(+1.47)#31 | 1.1%(+1.14)#3,100 |
| 32. | 73106 | 2.2% | 0.76%(+1.44)#32 | 1.1%(+1.11)#3,172 |
| 33. | 74075 | 2.2% | 0.76%(+1.44)#33 | 1.1%(+1.11)#3,179 |
| 34. | 73843 | 2.2% | 0.76%(+1.41)#34 | 1.1%(+1.08)#3,262 |
| 35. | 73601 | 2.1% | 0.76%(+1.34)#35 | 1.1%(+1.01)#3,414 |
| 36. | 73738 | 2.0% | 0.76%(+1.28)#36 | 1.1%(+0.946)#3,577 |
| 37. | 74363 | 2.0% | 0.76%(+1.26)#37 | 1.1%(+0.928)#3,635 |
| 38. | 74119 | 1.9% | 0.76%(+1.18)#38 | 1.1%(+0.851)#3,852 |
| 39. | 73950 | 1.9% | 0.76%(+1.17)#39 | 1.1%(+0.839)#3,888 |
| 40. | 74881 | 1.9% | 0.76%(+1.15)#40 | 1.1%(+0.824)#3,927 |
| 41. | 73006 | 1.9% | 0.76%(+1.14)#41 | 1.1%(+0.806)#3,985 |
| 42. | 73071 | 1.9% | 0.76%(+1.12)#42 | 1.1%(+0.786)#4,052 |
| 43. | 73095 | 1.8% | 0.76%(+1.02)#43 | 1.1%(+0.690)#4,395 |
| 44. | 73025 | 1.8% | 0.76%(+1.01)#44 | 1.1%(+0.684)#4,426 |
| 45. | 73162 | 1.8% | 0.76%(+1.01)#45 | 1.1%(+0.683)#4,429 |
| 46. | 73069 | 1.7% | 0.76%(+0.979)#46 | 1.1%(+0.649)#4,554 |
| 47. | 73401 | 1.7% | 0.76%(+0.940)#47 | 1.1%(+0.610)#4,724 |
| 48. | 74826 | 1.7% | 0.76%(+0.899)#48 | 1.1%(+0.569)#4,897 |
| 49. | 73026 | 1.6% | 0.76%(+0.886)#49 | 1.1%(+0.556)#4,963 |
| 50. | 74931 | 1.6% | 0.76%(+0.836)#50 | 1.1%(+0.506)#5,174 |
| 51. | 74631 | 1.6% | 0.76%(+0.822)#51 | 1.1%(+0.492)#5,238 |
| 52. | 73034 | 1.6% | 0.76%(+0.808)#52 | 1.1%(+0.477)#5,300 |
| 53. | 73105 | 1.5% | 0.76%(+0.782)#53 | 1.1%(+0.452)#5,425 |
| 54. | 73116 | 1.5% | 0.76%(+0.775)#54 | 1.1%(+0.445)#5,469 |
| 55. | 74369 | 1.5% | 0.76%(+0.757)#55 | 1.1%(+0.427)#5,556 |
| 56. | 74652 | 1.5% | 0.76%(+0.719)#56 | 1.1%(+0.388)#5,773 |
| 57. | 74860 | 1.5% | 0.76%(+0.693)#57 | 1.1%(+0.363)#5,901 |
| 58. | 74561 | 1.4% | 0.76%(+0.680)#58 | 1.1%(+0.350)#5,957 |
| 59. | 73538 | 1.4% | 0.76%(+0.664)#59 | 1.1%(+0.334)#6,057 |
| 60. | 73103 | 1.4% | 0.76%(+0.659)#60 | 1.1%(+0.329)#6,084 |
| 61. | 73768 | 1.4% | 0.76%(+0.656)#61 | 1.1%(+0.326)#6,102 |
| 62. | 73020 | 1.4% | 0.76%(+0.643)#62 | 1.1%(+0.313)#6,167 |
| 63. | 73013 | 1.4% | 0.76%(+0.640)#63 | 1.1%(+0.310)#6,184 |
| 64. | 73521 | 1.4% | 0.76%(+0.622)#64 | 1.1%(+0.292)#6,283 |
| 65. | 74080 | 1.4% | 0.76%(+0.609)#65 | 1.1%(+0.279)#6,349 |
| 66. | 74053 | 1.4% | 0.76%(+0.601)#66 | 1.1%(+0.271)#6,410 |
| 67. | 74365 | 1.3% | 0.76%(+0.578)#67 | 1.1%(+0.248)#6,545 |
| 68. | 74361 | 1.3% | 0.76%(+0.553)#68 | 1.1%(+0.223)#6,714 |
| 69. | 73130 | 1.3% | 0.76%(+0.545)#69 | 1.1%(+0.215)#6,769 |
| 70. | 74010 | 1.3% | 0.76%(+0.535)#70 | 1.1%(+0.205)#6,832 |
| 71. | 74944 | 1.3% | 0.76%(+0.512)#71 | 1.1%(+0.181)#6,984 |
| 72. | 74454 | 1.3% | 0.76%(+0.499)#72 | 1.1%(+0.169)#7,065 |
| 73. | 74647 | 1.3% | 0.76%(+0.490)#73 | 1.1%(+0.160)#7,125 |
| 74. | 73660 | 1.3% | 0.76%(+0.489)#74 | 1.1%(+0.159)#7,134 |
| 75. | 73117 | 1.2% | 0.76%(+0.482)#75 | 1.1%(+0.152)#7,186 |
| 76. | 74350 | 1.2% | 0.76%(+0.474)#76 | 1.1%(+0.144)#7,234 |
| 77. | 73012 | 1.2% | 0.76%(+0.459)#77 | 1.1%(+0.129)#7,338 |
| 78. | 73942 | 1.2% | 0.76%(+0.451)#78 | 1.1%(+0.121)#7,401 |
| 79. | 73149 | 1.2% | 0.76%(+0.444)#79 | 1.1%(+0.113)#7,465 |
| 80. | 74854 | 1.2% | 0.76%(+0.437)#80 | 1.1%(+0.107)#7,511 |
| 81. | 73945 | 1.2% | 0.76%(+0.426)#81 | 1.1%(+0.096)#7,586 |
| 82. | 74042 | 1.2% | 0.76%(+0.416)#82 | 1.1%(+0.086)#7,668 |
| 83. | 73120 | 1.2% | 0.76%(+0.408)#83 | 1.1%(+0.078)#7,738 |
| 84. | 74932 | 1.2% | 0.76%(+0.399)#84 | 1.1%(+0.069)#7,794 |
| 85. | 74884 | 1.2% | 0.76%(+0.398)#85 | 1.1%(+0.067)#7,805 |
| 86. | 74437 | 1.1% | 0.76%(+0.376)#86 | 1.1%(+0.045)#7,962 |
| 87. | 73651 | 1.1% | 0.76%(+0.372)#87 | 1.1%(+0.042)#7,985 |
| 88. | 73072 | 1.1% | 0.76%(+0.368)#88 | 1.1%(+0.038)#8,016 |
| 89. | 73179 | 1.1% | 0.76%(+0.361)#89 | 1.1%(+0.031)#8,061 |
| 90. | 73842 | 1.1% | 0.76%(+0.344)#90 | 1.1%(+0.014)#8,190 |
| 91. | 74723 | 1.1% | 0.76%(+0.338)#91 | 1.1%(+0.008)#8,227 |
| 92. | 74633 | 1.1% | 0.76%(+0.338)#92 | 1.1%(+0.008)#8,230 |
| 93. | 73703 | 1.1% | 0.76%(+0.332)#93 | 1.1%(+0.002)#8,281 |
| 94. | 73160 | 1.1% | 0.76%(+0.318)#94 | 1.1%(-0.012)#8,403 |
| 95. | 73552 | 1.1% | 0.76%(+0.311)#95 | 1.1%(-0.019)#8,460 |
| 96. | 74135 | 1.1% | 0.76%(+0.304)#96 | 1.1%(-0.026)#8,516 |
| 97. | 74820 | 1.1% | 0.76%(+0.298)#97 | 1.1%(-0.033)#8,562 |
| 98. | 74849 | 1.1% | 0.76%(+0.296)#98 | 1.1%(-0.034)#8,569 |
| 99. | 73008 | 1.1% | 0.76%(+0.293)#99 | 1.1%(-0.037)#8,589 |
| 100. | 74023 | 1.1% | 0.76%(+0.290)#100 | 1.1%(-0.040)#8,617 |
Common Questions
What are the Top 10 Zip Codes with the Highest Percentage of Population Employed in Life, Physical & Social Science in Oklahoma?
Top 10 Zip Codes with the Highest Percentage of Population Employed in Life, Physical & Social Science in Oklahoma are:
What zip code has the Highest Percentage of Population Employed in Life, Physical & Social Science in Oklahoma?
74530 has the Highest Percentage of Population Employed in Life, Physical & Social Science in Oklahoma with 9.2%.
What is the Percentage of Population Employed in Life, Physical & Social Science in the State of Oklahoma?
Percentage of Population Employed in Life, Physical & Social Science in Oklahoma is 0.76%.
What is the Percentage of Population Employed in Life, Physical & Social Science in the United States?
Percentage of Population Employed in Life, Physical & Social Science in the United States is 1.1%.