Oakwood, OK Map & Demographics
Oakwood Map
Oakwood Overview
$32,592
PER CAPITA INCOME
$78,393
AVG FAMILY INCOME
$77,679
AVG HOUSEHOLD INCOME
0.34
INEQUALITY / GINI INDEX
61
TOTAL POPULATION
34
MALE POPULATION
27
FEMALE POPULATION
125.93
MALES / 100 FEMALES
79.41
FEMALES / 100 MALES
65.5
MEDIAN AGE
2.4
AVG FAMILY SIZE
2.0
AVG HOUSEHOLD SIZE
36
LABOR FORCE [ PEOPLE ]
61.0%
PERCENT IN LABOR FORCE
2.8%
UNEMPLOYMENT RATE
Oakwood Zip Codes
Oakwood Area Codes
Income in Oakwood
Income Overview in Oakwood
Per Capita Income in Oakwood is $32,592, while median incomes of families and households are $78,393 and $77,679 respectively.
| Characteristic | Number | Measure |
| Per Capita Income | 61 | $32,592 |
| Median Family Income | 21 | $78,393 |
| Mean Family Income | 21 | $73,500 |
| Median Household Income | 31 | $77,679 |
| Mean Household Income | 31 | $64,571 |
| Income Deficit | 21 | $0 |
| Wage / Income Gap (%) | 61 | 0.00% |
| Wage / Income Gap ($) | 61 | 100.00¢ per $1 |
| Gini / Inequality Index | 61 | 0.34 |
Earnings by Sex in Oakwood
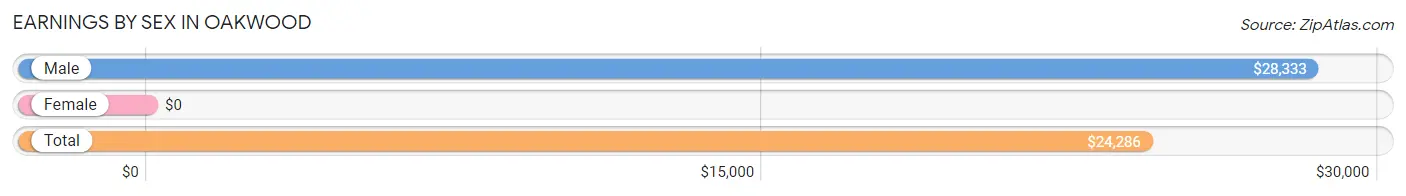
| Sex | Number | Average Earnings |
| Male | 24 (60.0%) | $28,333 |
| Female | 16 (40.0%) | $0 |
| Total | 40 (100.0%) | $24,286 |
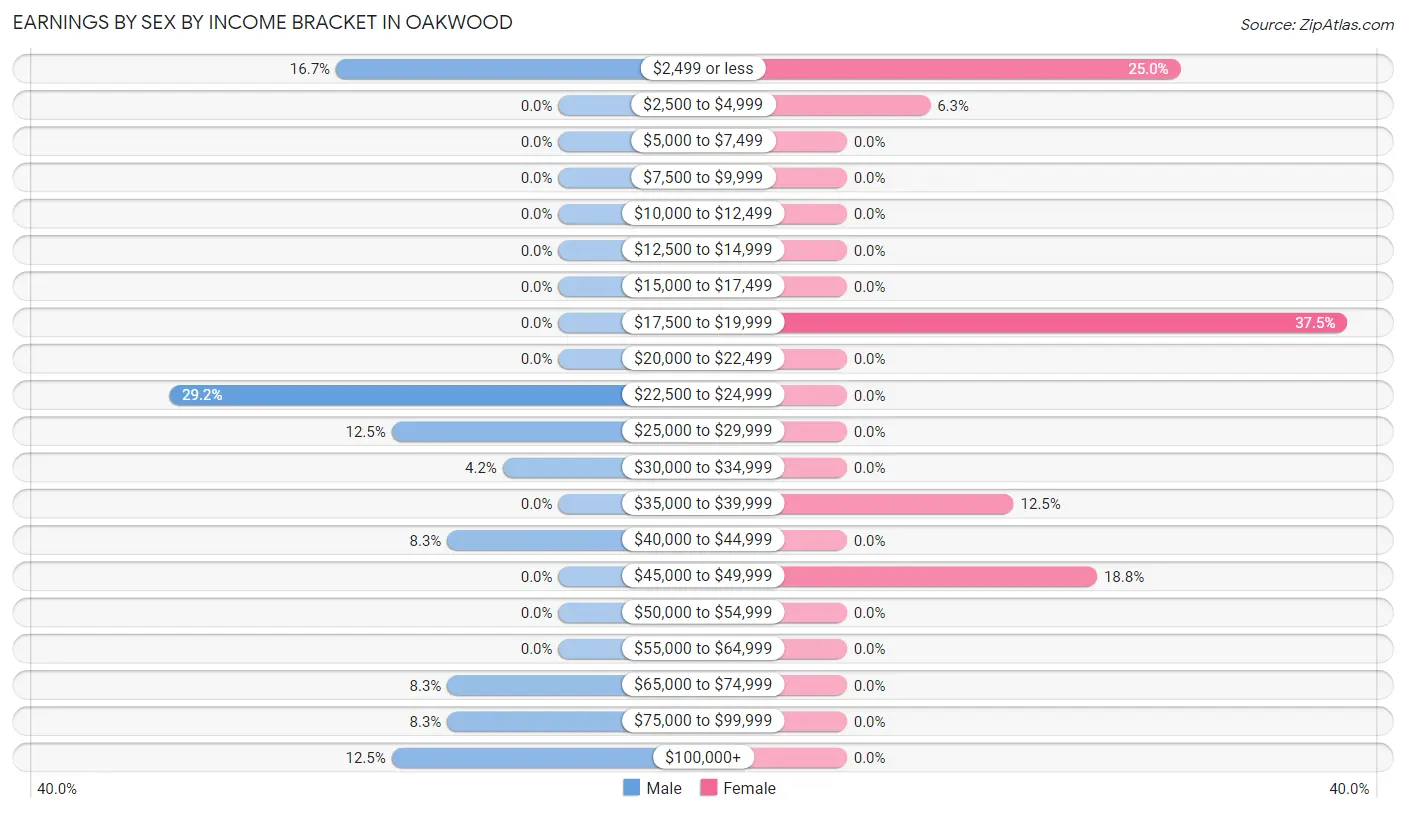
Earnings by Sex by Income Bracket in Oakwood
The most common earnings brackets in Oakwood are $22,500 to $24,999 for men (7 | 29.2%) and $17,500 to $19,999 for women (6 | 37.5%).
| Income | Male | Female |
| $2,499 or less | 4 (16.7%) | 4 (25.0%) |
| $2,500 to $4,999 | 0 (0.0%) | 1 (6.2%) |
| $5,000 to $7,499 | 0 (0.0%) | 0 (0.0%) |
| $7,500 to $9,999 | 0 (0.0%) | 0 (0.0%) |
| $10,000 to $12,499 | 0 (0.0%) | 0 (0.0%) |
| $12,500 to $14,999 | 0 (0.0%) | 0 (0.0%) |
| $15,000 to $17,499 | 0 (0.0%) | 0 (0.0%) |
| $17,500 to $19,999 | 0 (0.0%) | 6 (37.5%) |
| $20,000 to $22,499 | 0 (0.0%) | 0 (0.0%) |
| $22,500 to $24,999 | 7 (29.2%) | 0 (0.0%) |
| $25,000 to $29,999 | 3 (12.5%) | 0 (0.0%) |
| $30,000 to $34,999 | 1 (4.2%) | 0 (0.0%) |
| $35,000 to $39,999 | 0 (0.0%) | 2 (12.5%) |
| $40,000 to $44,999 | 2 (8.3%) | 0 (0.0%) |
| $45,000 to $49,999 | 0 (0.0%) | 3 (18.8%) |
| $50,000 to $54,999 | 0 (0.0%) | 0 (0.0%) |
| $55,000 to $64,999 | 0 (0.0%) | 0 (0.0%) |
| $65,000 to $74,999 | 2 (8.3%) | 0 (0.0%) |
| $75,000 to $99,999 | 2 (8.3%) | 0 (0.0%) |
| $100,000+ | 3 (12.5%) | 0 (0.0%) |
| Total | 24 (100.0%) | 16 (100.0%) |
Earnings by Sex by Educational Attainment in Oakwood
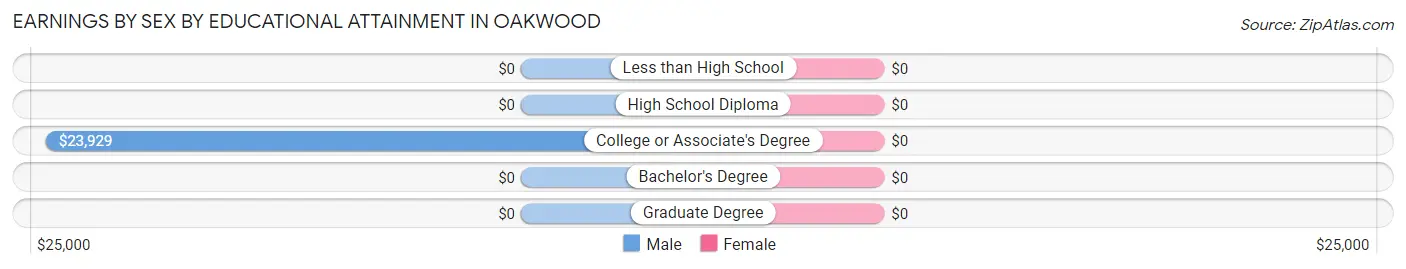
| Educational Attainment | Male Income | Female Income |
| Less than High School | - | - |
| High School Diploma | - | - |
| College or Associate's Degree | $23,929 | $0 |
| Bachelor's Degree | - | - |
| Graduate Degree | - | - |
| Total | $26,250 | $0 |
Family Income in Oakwood
Family Income Brackets in Oakwood
According to the Oakwood family income data, there are 9 families falling into the $75,000 to $99,999 income range, which is the most common income bracket and makes up 42.9% of all families.
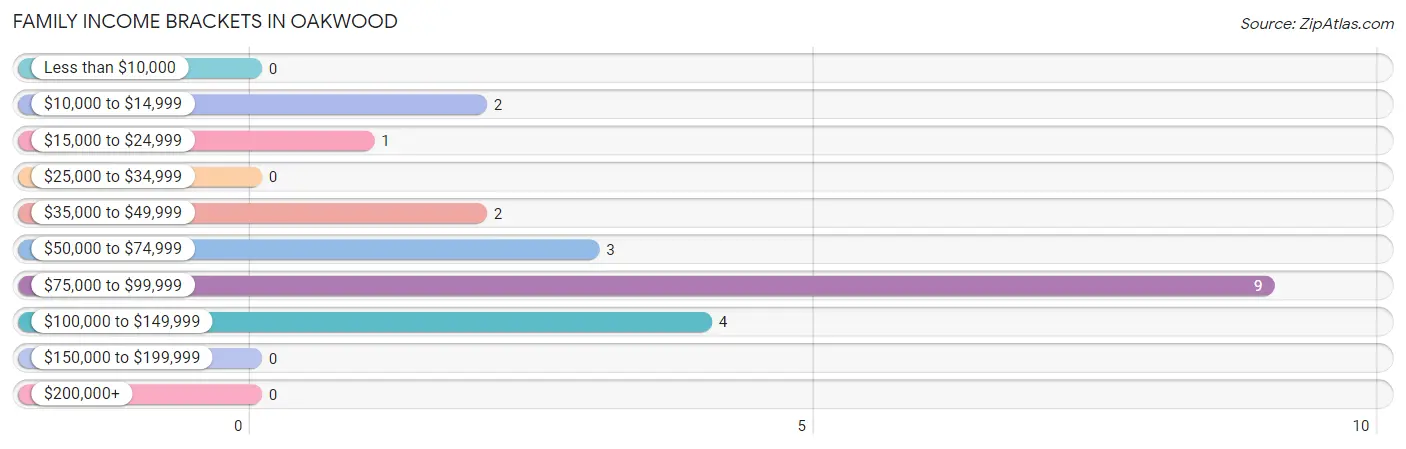
| Income Bracket | # Families | % Families |
| Less than $10,000 | 0 | 0.0% |
| $10,000 to $14,999 | 2 | 9.5% |
| $15,000 to $24,999 | 1 | 4.8% |
| $25,000 to $34,999 | 0 | 0.0% |
| $35,000 to $49,999 | 2 | 9.5% |
| $50,000 to $74,999 | 3 | 14.3% |
| $75,000 to $99,999 | 9 | 42.9% |
| $100,000 to $149,999 | 4 | 19.0% |
| $150,000 to $199,999 | 0 | 0.0% |
| $200,000+ | 0 | 0.0% |
Family Income by Famaliy Size in Oakwood
2-person families (9 | 42.9%) account for the highest median family income in Oakwood with $50,417 per family, while 2-person families (9 | 42.9%) have the highest median income of $25,208 per family member.
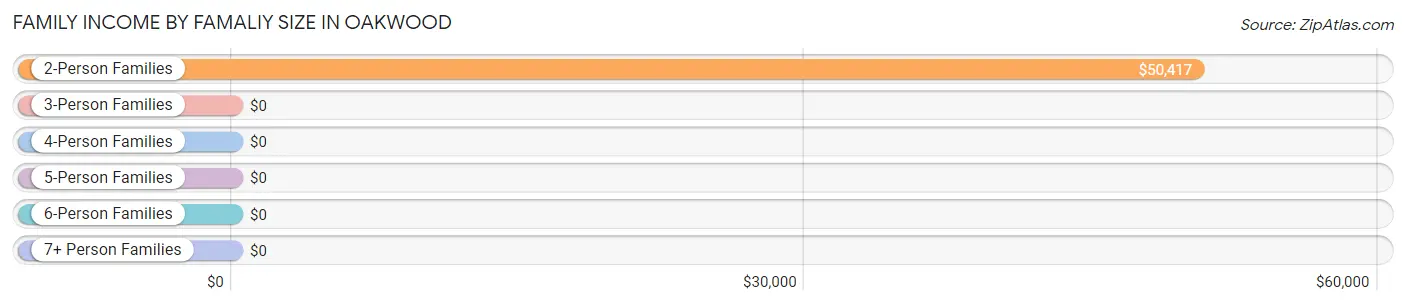
| Income Bracket | # Families | Median Income |
| 2-Person Families | 9 (42.9%) | $50,417 |
| 3-Person Families | 10 (47.6%) | $0 |
| 4-Person Families | 2 (9.5%) | $0 |
| 5-Person Families | 0 (0.0%) | $0 |
| 6-Person Families | 0 (0.0%) | $0 |
| 7+ Person Families | 0 (0.0%) | $0 |
| Total | 21 (100.0%) | $78,393 |
Family Income by Number of Earners in Oakwood
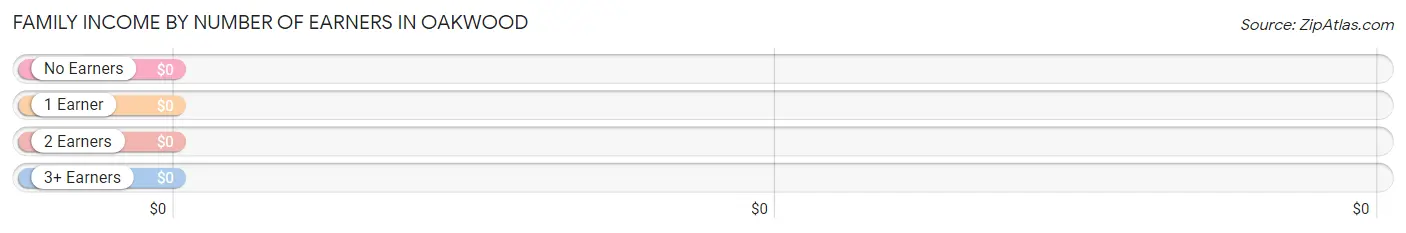
| Number of Earners | # Families | Median Income |
| No Earners | 3 (14.3%) | $0 |
| 1 Earner | 6 (28.6%) | $0 |
| 2 Earners | 2 (9.5%) | $0 |
| 3+ Earners | 10 (47.6%) | $0 |
| Total | 21 (100.0%) | $78,393 |
Household Income in Oakwood
Household Income Brackets in Oakwood
With 9 households falling in the category, the $75,000 to $99,999 income range is the most frequent in Oakwood, accounting for 29.0% of all households.
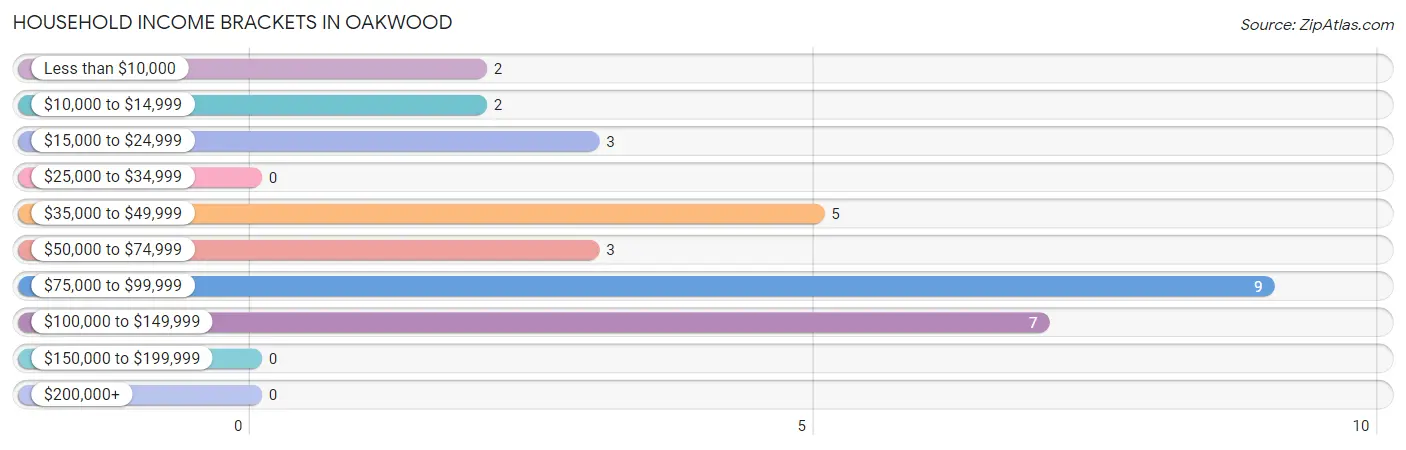
| Income Bracket | # Households | % Households |
| Less than $10,000 | 2 | 6.5% |
| $10,000 to $14,999 | 2 | 6.5% |
| $15,000 to $24,999 | 3 | 9.7% |
| $25,000 to $34,999 | 0 | 0.0% |
| $35,000 to $49,999 | 5 | 16.1% |
| $50,000 to $74,999 | 3 | 9.7% |
| $75,000 to $99,999 | 9 | 29.0% |
| $100,000 to $149,999 | 7 | 22.6% |
| $150,000 to $199,999 | 0 | 0.0% |
| $200,000+ | 0 | 0.0% |
Household Income by Householder Age in Oakwood
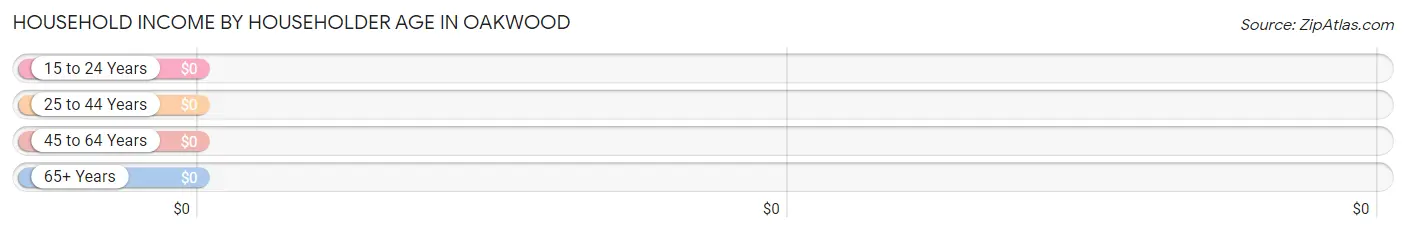
| Income Bracket | # Households | Median Income |
| 15 to 24 Years | 3 (9.7%) | $0 |
| 25 to 44 Years | 3 (9.7%) | $0 |
| 45 to 64 Years | 10 (32.3%) | $0 |
| 65+ Years | 15 (48.4%) | $0 |
| Total | 31 (100.0%) | $77,679 |
Poverty in Oakwood
Income Below Poverty by Sex and Age in Oakwood
With 20.6% poverty level for males and 22.2% for females among the residents of Oakwood, 12 to 14 year old males and 18 to 24 year old females are the most vulnerable to poverty, with 2 males (100.0%) and 1 females (100.0%) in their respective age groups living below the poverty level.
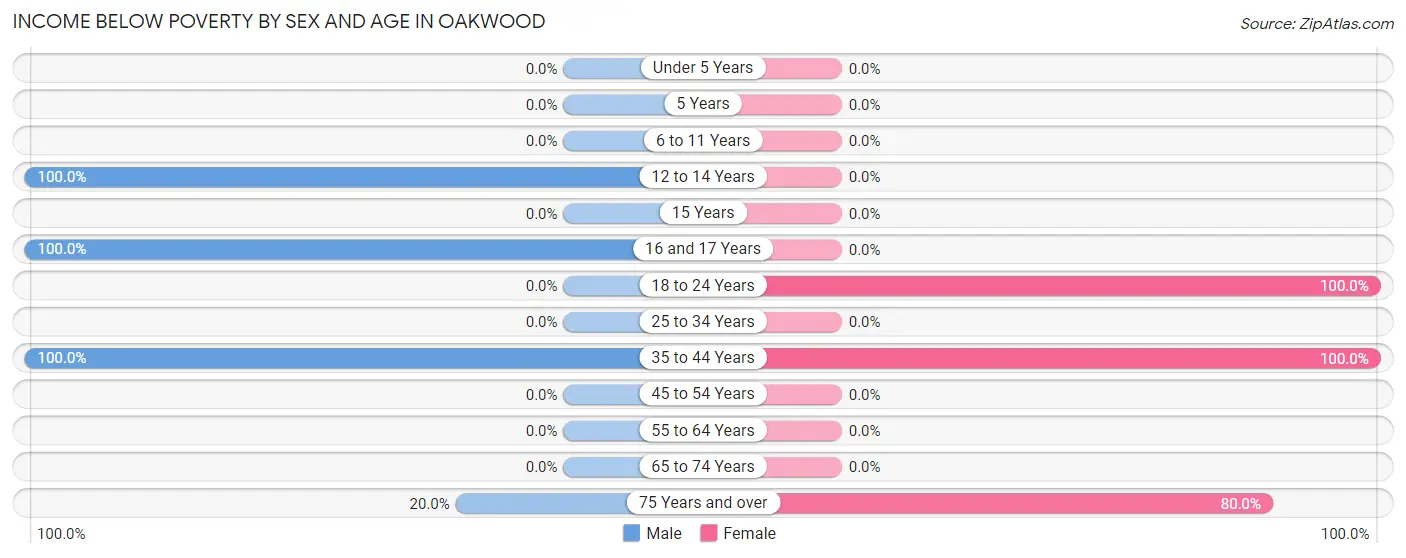
| Age Bracket | Male | Female |
| Under 5 Years | 0 (0.0%) | 0 (0.0%) |
| 5 Years | 0 (0.0%) | 0 (0.0%) |
| 6 to 11 Years | 0 (0.0%) | 0 (0.0%) |
| 12 to 14 Years | 2 (100.0%) | 0 (0.0%) |
| 15 Years | 0 (0.0%) | 0 (0.0%) |
| 16 and 17 Years | 1 (100.0%) | 0 (0.0%) |
| 18 to 24 Years | 0 (0.0%) | 1 (100.0%) |
| 25 to 34 Years | 0 (0.0%) | 0 (0.0%) |
| 35 to 44 Years | 2 (100.0%) | 1 (100.0%) |
| 45 to 54 Years | 0 (0.0%) | 0 (0.0%) |
| 55 to 64 Years | 0 (0.0%) | 0 (0.0%) |
| 65 to 74 Years | 0 (0.0%) | 0 (0.0%) |
| 75 Years and over | 2 (20.0%) | 4 (80.0%) |
| Total | 7 (20.6%) | 6 (22.2%) |
Income Above Poverty by Sex and Age in Oakwood
According to the poverty statistics in Oakwood, males aged 18 to 24 years and females aged 16 and 17 years are the age groups that are most secure financially, with 100.0% of males and 100.0% of females in these age groups living above the poverty line.
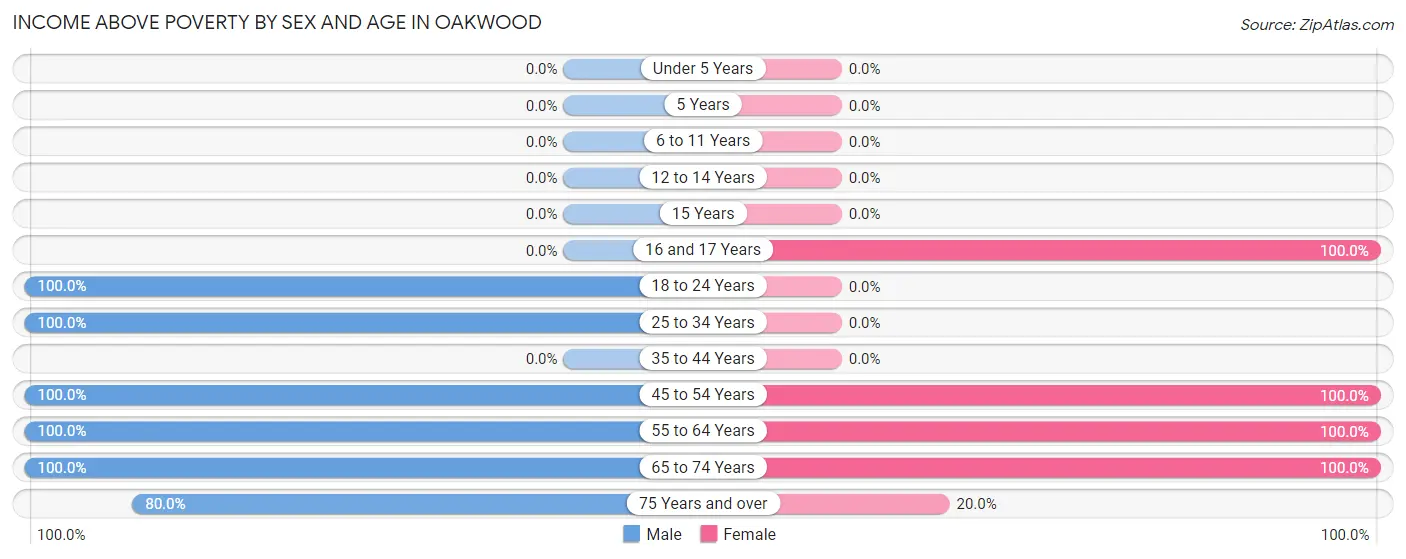
| Age Bracket | Male | Female |
| Under 5 Years | 0 (0.0%) | 0 (0.0%) |
| 5 Years | 0 (0.0%) | 0 (0.0%) |
| 6 to 11 Years | 0 (0.0%) | 0 (0.0%) |
| 12 to 14 Years | 0 (0.0%) | 0 (0.0%) |
| 15 Years | 0 (0.0%) | 0 (0.0%) |
| 16 and 17 Years | 0 (0.0%) | 1 (100.0%) |
| 18 to 24 Years | 3 (100.0%) | 0 (0.0%) |
| 25 to 34 Years | 2 (100.0%) | 0 (0.0%) |
| 35 to 44 Years | 0 (0.0%) | 0 (0.0%) |
| 45 to 54 Years | 2 (100.0%) | 8 (100.0%) |
| 55 to 64 Years | 4 (100.0%) | 3 (100.0%) |
| 65 to 74 Years | 8 (100.0%) | 8 (100.0%) |
| 75 Years and over | 8 (80.0%) | 1 (20.0%) |
| Total | 27 (79.4%) | 21 (77.8%) |
Income Below Poverty Among Married-Couple Families in Oakwood
The poverty statistics for married-couple families in Oakwood show that 10.0% or 2 of the total 20 families live below the poverty line. Families with no children have the highest poverty rate of 15.4%, comprising of 2 families. On the other hand, families with 1 or 2 children have the lowest poverty rate of 0.0%, which includes 0 families.
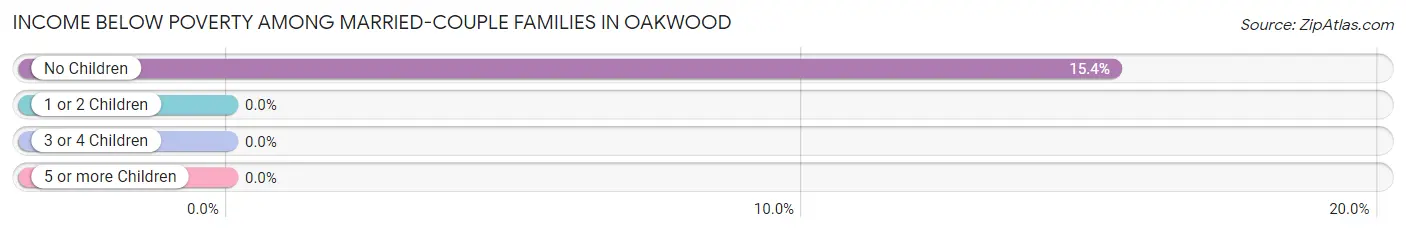
| Children | Above Poverty | Below Poverty |
| No Children | 11 (84.6%) | 2 (15.4%) |
| 1 or 2 Children | 7 (100.0%) | 0 (0.0%) |
| 3 or 4 Children | 0 (0.0%) | 0 (0.0%) |
| 5 or more Children | 0 (0.0%) | 0 (0.0%) |
| Total | 18 (90.0%) | 2 (10.0%) |
Income Below Poverty Among Single-Parent Households in Oakwood
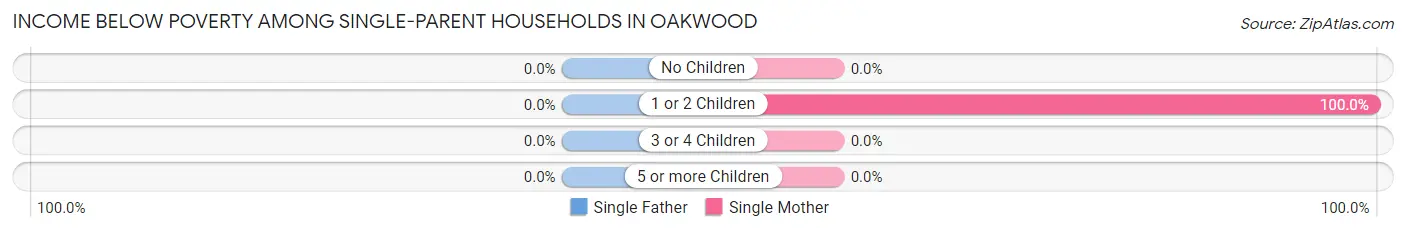
| Children | Single Father | Single Mother |
| No Children | 0 (0.0%) | 0 (0.0%) |
| 1 or 2 Children | 0 (0.0%) | 1 (100.0%) |
| 3 or 4 Children | 0 (0.0%) | 0 (0.0%) |
| 5 or more Children | 0 (0.0%) | 0 (0.0%) |
| Total | 0 (0.0%) | 1 (100.0%) |
Income Below Poverty Among Married-Couple vs Single-Parent Households in Oakwood
The poverty data for Oakwood shows that 2 of the married-couple family households (10.0%) and 1 of the single-parent households (100.0%) are living below the poverty level. Within the married-couple family households, those with no children have the highest poverty rate, with 2 households (15.4%) falling below the poverty line. Among the single-parent households, those with 1 or 2 children have the highest poverty rate, with 1 household (100.0%) living below poverty.
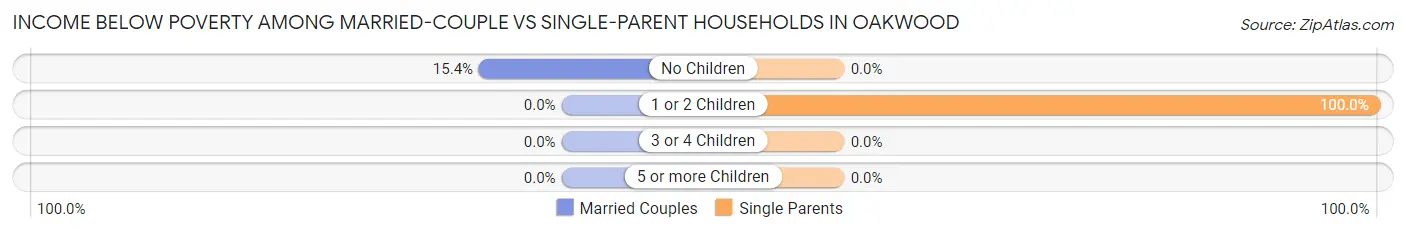
| Children | Married-Couple Families | Single-Parent Households |
| No Children | 2 (15.4%) | 0 (0.0%) |
| 1 or 2 Children | 0 (0.0%) | 1 (100.0%) |
| 3 or 4 Children | 0 (0.0%) | 0 (0.0%) |
| 5 or more Children | 0 (0.0%) | 0 (0.0%) |
| Total | 2 (10.0%) | 1 (100.0%) |
Race in Oakwood
The most populous races in Oakwood are White / Caucasian (48 | 78.7%), Native / Alaskan (7 | 11.5%), and Hispanic or Latino (6 | 9.8%).
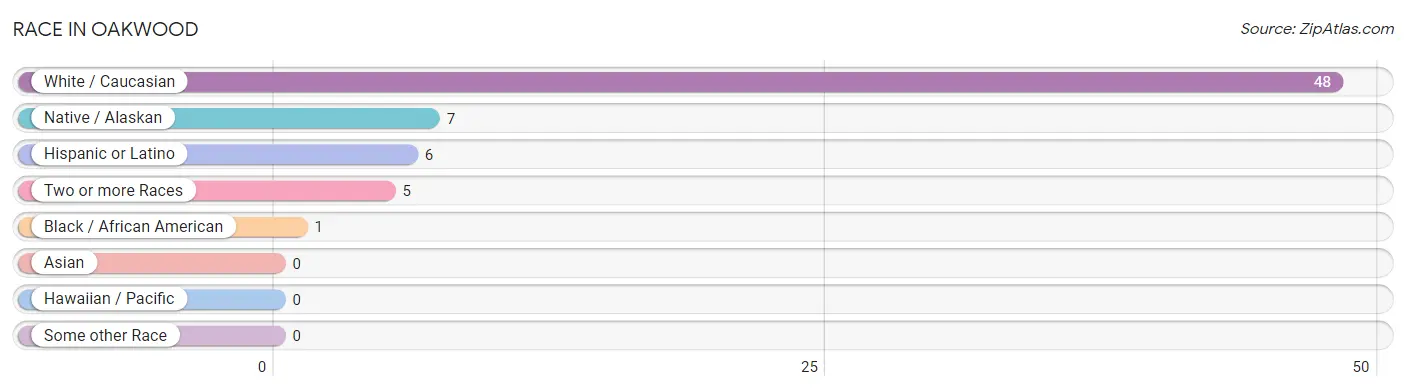
| Race | # Population | % Population |
| Asian | 0 | 0.0% |
| Black / African American | 1 | 1.6% |
| Hawaiian / Pacific | 0 | 0.0% |
| Hispanic or Latino | 6 | 9.8% |
| Native / Alaskan | 7 | 11.5% |
| White / Caucasian | 48 | 78.7% |
| Two or more Races | 5 | 8.2% |
| Some other Race | 0 | 0.0% |
| Total | 61 | 100.0% |
Ancestry in Oakwood
The most populous ancestries reported in Oakwood are German (11 | 18.0%), European (10 | 16.4%), Apache (3 | 4.9%), Dutch (3 | 4.9%), and Spanish (3 | 4.9%), together accounting for 49.2% of all Oakwood residents.
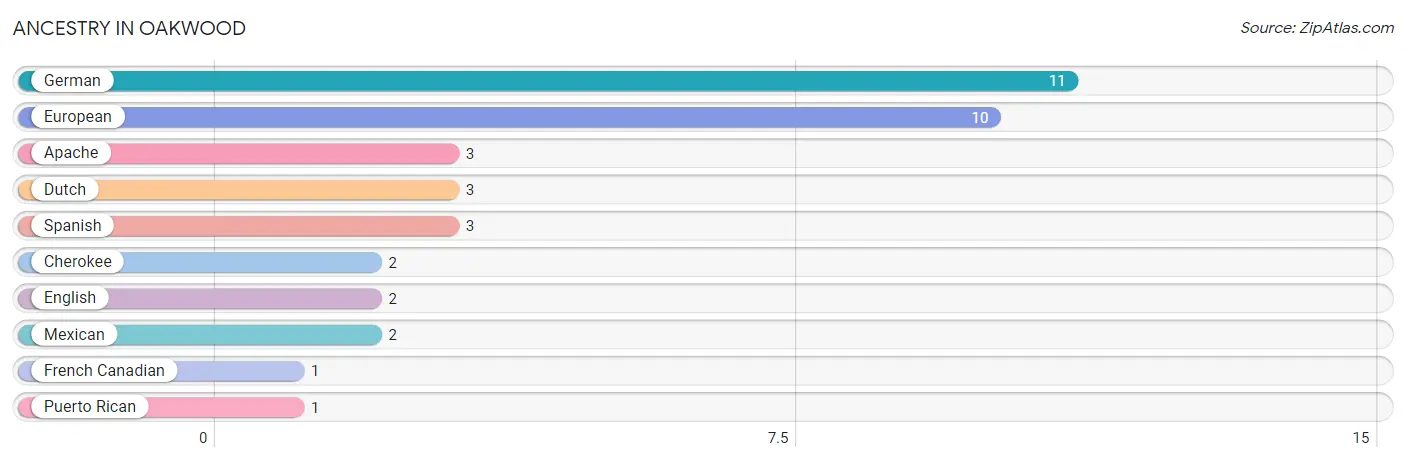
| Ancestry | # Population | % Population |
| Apache | 3 | 4.9% |
| Cherokee | 2 | 3.3% |
| Dutch | 3 | 4.9% |
| English | 2 | 3.3% |
| European | 10 | 16.4% |
| French Canadian | 1 | 1.6% |
| German | 11 | 18.0% |
| Mexican | 2 | 3.3% |
| Puerto Rican | 1 | 1.6% |
| Spanish | 3 | 4.9% | View All 10 Rows |
Immigrants in Oakwood

| Immigration Origin | # Population | % Population | View All 0 Rows |
Sex and Age in Oakwood
Sex and Age in Oakwood
The most populous age groups in Oakwood are 75 to 79 Years (7 | 20.6%) for men and 70 to 74 Years (6 | 22.2%) for women.
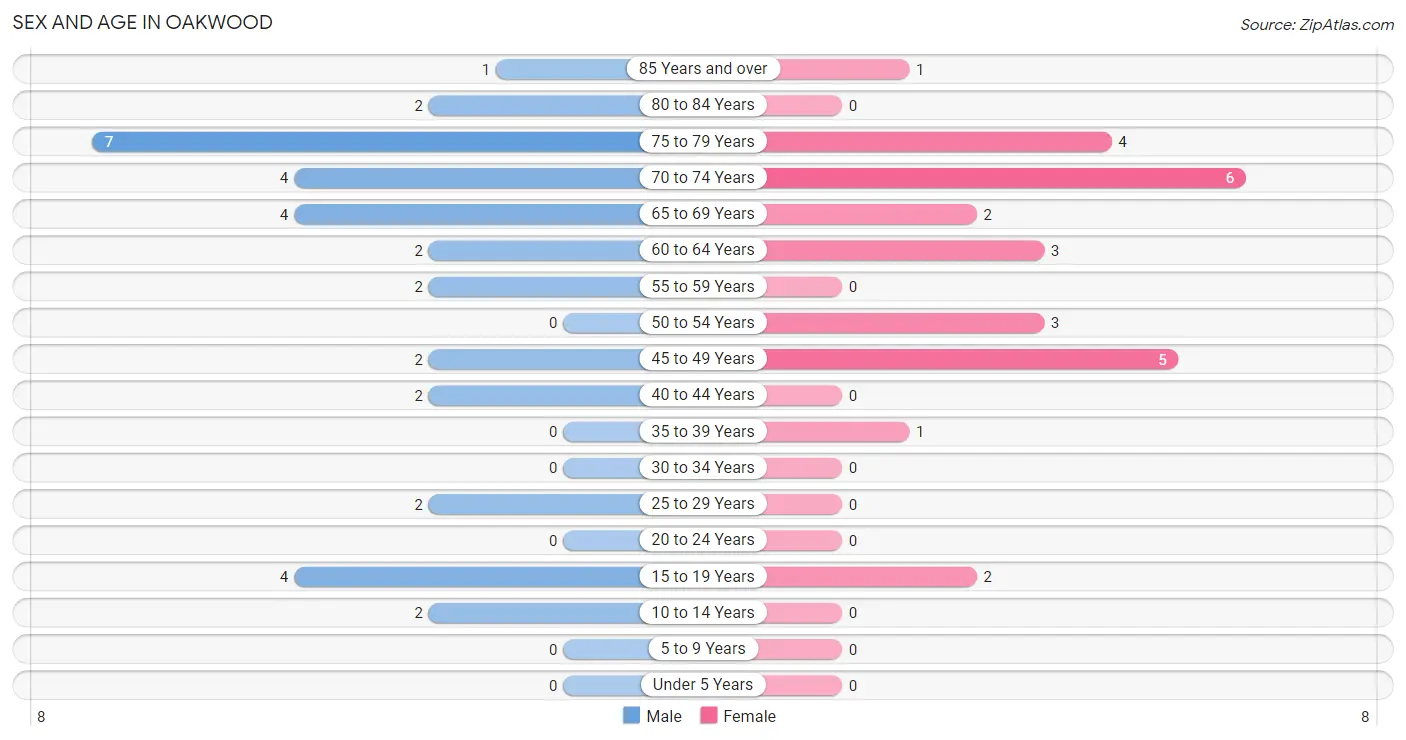
| Age Bracket | Male | Female |
| Under 5 Years | 0 (0.0%) | 0 (0.0%) |
| 5 to 9 Years | 0 (0.0%) | 0 (0.0%) |
| 10 to 14 Years | 2 (5.9%) | 0 (0.0%) |
| 15 to 19 Years | 4 (11.8%) | 2 (7.4%) |
| 20 to 24 Years | 0 (0.0%) | 0 (0.0%) |
| 25 to 29 Years | 2 (5.9%) | 0 (0.0%) |
| 30 to 34 Years | 0 (0.0%) | 0 (0.0%) |
| 35 to 39 Years | 0 (0.0%) | 1 (3.7%) |
| 40 to 44 Years | 2 (5.9%) | 0 (0.0%) |
| 45 to 49 Years | 2 (5.9%) | 5 (18.5%) |
| 50 to 54 Years | 0 (0.0%) | 3 (11.1%) |
| 55 to 59 Years | 2 (5.9%) | 0 (0.0%) |
| 60 to 64 Years | 2 (5.9%) | 3 (11.1%) |
| 65 to 69 Years | 4 (11.8%) | 2 (7.4%) |
| 70 to 74 Years | 4 (11.8%) | 6 (22.2%) |
| 75 to 79 Years | 7 (20.6%) | 4 (14.8%) |
| 80 to 84 Years | 2 (5.9%) | 0 (0.0%) |
| 85 Years and over | 1 (2.9%) | 1 (3.7%) |
| Total | 34 (100.0%) | 27 (100.0%) |
Families and Households in Oakwood
Median Family Size in Oakwood
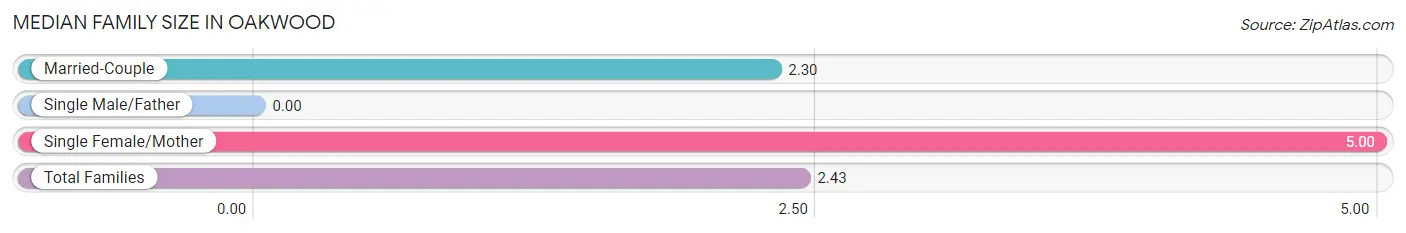
| Family Type | # Families | Family Size |
| Married-Couple | 20 (95.2%) | 2.30 |
| Single Male/Father | 0 (0.0%) | - |
| Single Female/Mother | 1 (4.8%) | 5.00 |
| Total Families | 21 (100.0%) | 2.43 |
Median Household Size in Oakwood
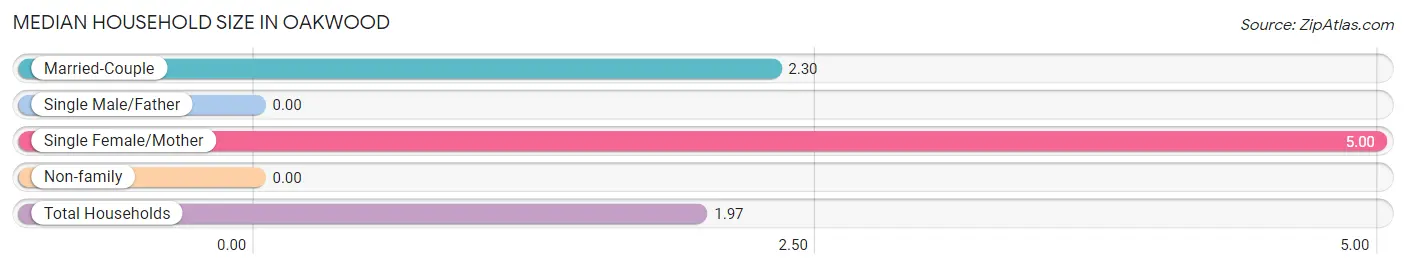
| Household Type | # Households | Household Size |
| Married-Couple | 20 (64.5%) | 2.30 |
| Single Male/Father | 0 (0.0%) | - |
| Single Female/Mother | 1 (3.2%) | 5.00 |
| Non-family | 10 (32.3%) | - |
| Total Households | 31 (100.0%) | 1.97 |
Household Size by Marriage Status in Oakwood
Out of a total of 31 households in Oakwood, 21 (67.7%) are family households, while 10 (32.3%) are nonfamily households. The most numerous type of family households are 3-person households, comprising 10, and the most common type of nonfamily households are 1-person households, comprising 10.
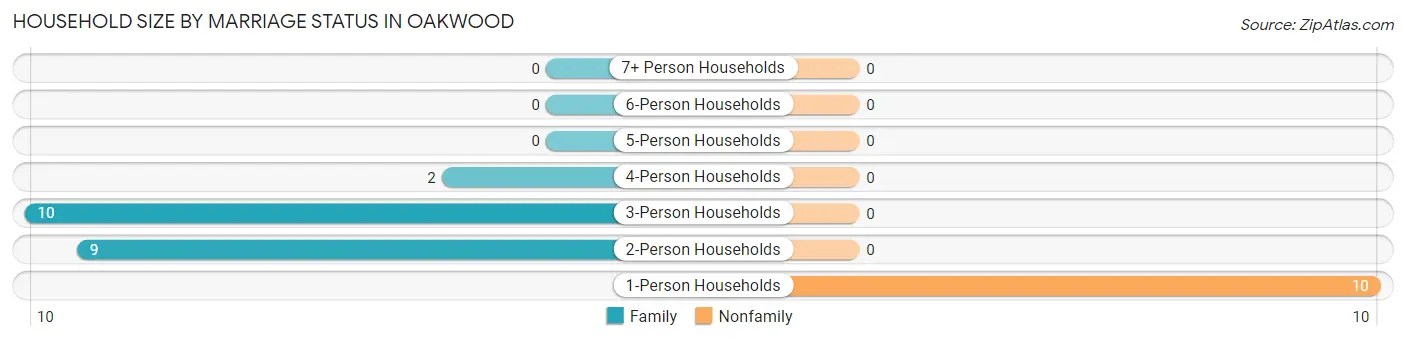
| Household Size | Family Households | Nonfamily Households |
| 1-Person Households | - | 10 (32.3%) |
| 2-Person Households | 9 (29.0%) | 0 (0.0%) |
| 3-Person Households | 10 (32.3%) | 0 (0.0%) |
| 4-Person Households | 2 (6.5%) | 0 (0.0%) |
| 5-Person Households | 0 (0.0%) | 0 (0.0%) |
| 6-Person Households | 0 (0.0%) | 0 (0.0%) |
| 7+ Person Households | 0 (0.0%) | 0 (0.0%) |
| Total | 21 (67.7%) | 10 (32.3%) |
Female Fertility in Oakwood
Fertility by Age in Oakwood
| Age Bracket | Women with Births | Births / 1,000 Women |
| 15 to 19 years | 0 (0.0%) | 0.0 |
| 20 to 34 years | 0 (0.0%) | 0.0 |
| 35 to 50 years | 0 (0.0%) | 0.0 |
| Total | 0 (0.0%) | 0.0 |
Fertility by Age by Marriage Status in Oakwood
| Age Bracket | Married | Unmarried |
| 15 to 19 years | 0 (0.0%) | 0 (0.0%) |
| 20 to 34 years | 0 (0.0%) | 0 (0.0%) |
| 35 to 50 years | 0 (0.0%) | 0 (0.0%) |
| Total | 0 (0.0%) | 0 (0.0%) |
Fertility by Education in Oakwood
| Educational Attainment | Women with Births | Births / 1,000 Women |
| Less than High School | 0 (0.0%) | 0.0 |
| High School Diploma | 0 (0.0%) | 0.0 |
| College or Associate's Degree | 0 (0.0%) | 0.0 |
| Bachelor's Degree | 0 (0.0%) | 0.0 |
| Graduate Degree | 0 (0.0%) | 0.0 |
| Total | 0 (0.0%) | 0.0 |
Fertility by Education by Marriage Status in Oakwood
| Educational Attainment | Married | Unmarried |
| Less than High School | 0 (0.0%) | 0 (0.0%) |
| High School Diploma | 0 (0.0%) | 0 (0.0%) |
| College or Associate's Degree | 0 (0.0%) | 0 (0.0%) |
| Bachelor's Degree | 0 (0.0%) | 0 (0.0%) |
| Graduate Degree | 0 (0.0%) | 0 (0.0%) |
| Total | 0 (0.0%) | 0 (0.0%) |
Employment Characteristics in Oakwood
Employment by Class of Employer in Oakwood
Among the 32 employed individuals in Oakwood, local government employees (14 | 43.8%), private company employees (13 | 40.6%), and not-for-profit organizations (2 | 6.2%) make up the most common classes of employment.
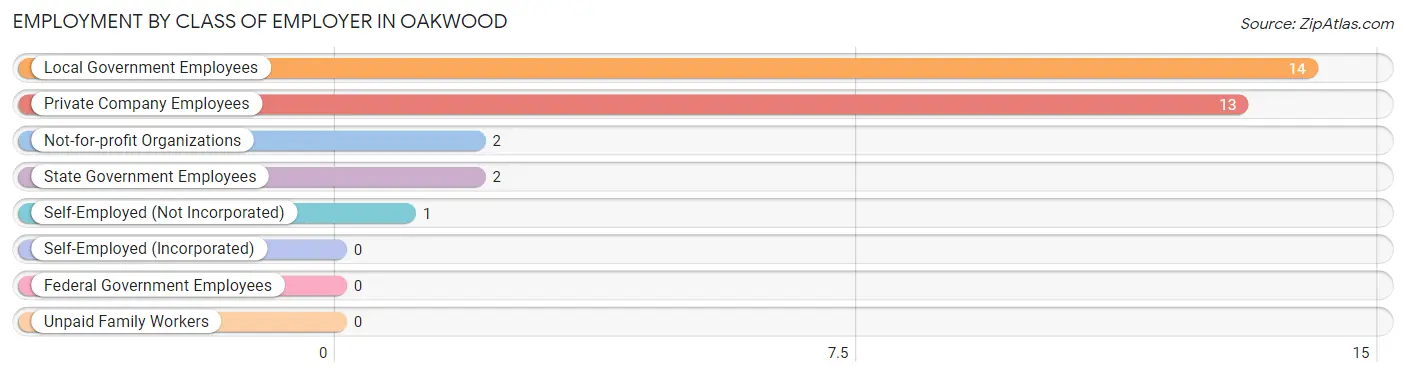
| Employer Class | # Employees | % Employees |
| Private Company Employees | 13 | 40.6% |
| Self-Employed (Incorporated) | 0 | 0.0% |
| Self-Employed (Not Incorporated) | 1 | 3.1% |
| Not-for-profit Organizations | 2 | 6.2% |
| Local Government Employees | 14 | 43.8% |
| State Government Employees | 2 | 6.2% |
| Federal Government Employees | 0 | 0.0% |
| Unpaid Family Workers | 0 | 0.0% |
| Total | 32 | 100.0% |
Employment Status by Age in Oakwood
According to the labor force statistics for Oakwood, out of the total population over 16 years of age (59), 61.0% or 36 individuals are in the labor force, with 2.8% or 1 of them unemployed. The age group with the highest labor force participation rate is 25 to 29 years, with 100.0% or 2 individuals in the labor force. Within the labor force, the 16 to 19 years age range has the highest percentage of unemployed individuals, with 20.0% or 1 of them being unemployed.
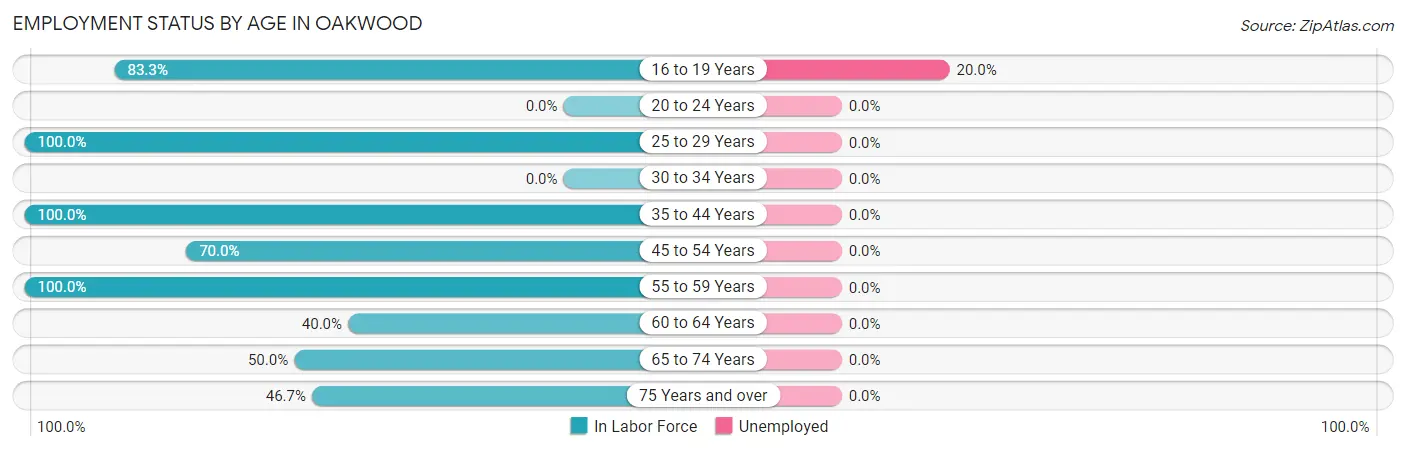
| Age Bracket | In Labor Force | Unemployed |
| 16 to 19 Years | 5 (83.3%) | 1 (20.0%) |
| 20 to 24 Years | 0 (0.0%) | 0 (0.0%) |
| 25 to 29 Years | 2 (100.0%) | 0 (0.0%) |
| 30 to 34 Years | 0 (0.0%) | 0 (0.0%) |
| 35 to 44 Years | 3 (100.0%) | 0 (0.0%) |
| 45 to 54 Years | 7 (70.0%) | 0 (0.0%) |
| 55 to 59 Years | 2 (100.0%) | 0 (0.0%) |
| 60 to 64 Years | 2 (40.0%) | 0 (0.0%) |
| 65 to 74 Years | 8 (50.0%) | 0 (0.0%) |
| 75 Years and over | 7 (46.7%) | 0 (0.0%) |
| Total | 36 (61.0%) | 1 (2.8%) |
Employment Status by Educational Attainment in Oakwood
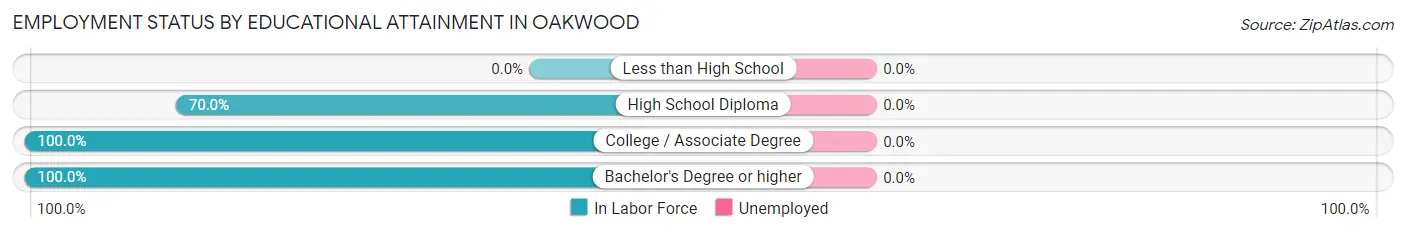
| Educational Attainment | In Labor Force | Unemployed |
| Less than High School | 0 (0.0%) | 0 (0.0%) |
| High School Diploma | 7 (70.0%) | 0 (0.0%) |
| College / Associate Degree | 7 (100.0%) | 0 (0.0%) |
| Bachelor's Degree or higher | 2 (100.0%) | 0 (0.0%) |
| Total | 16 (72.7%) | 0 (0.0%) |
Employment Occupations by Sex in Oakwood
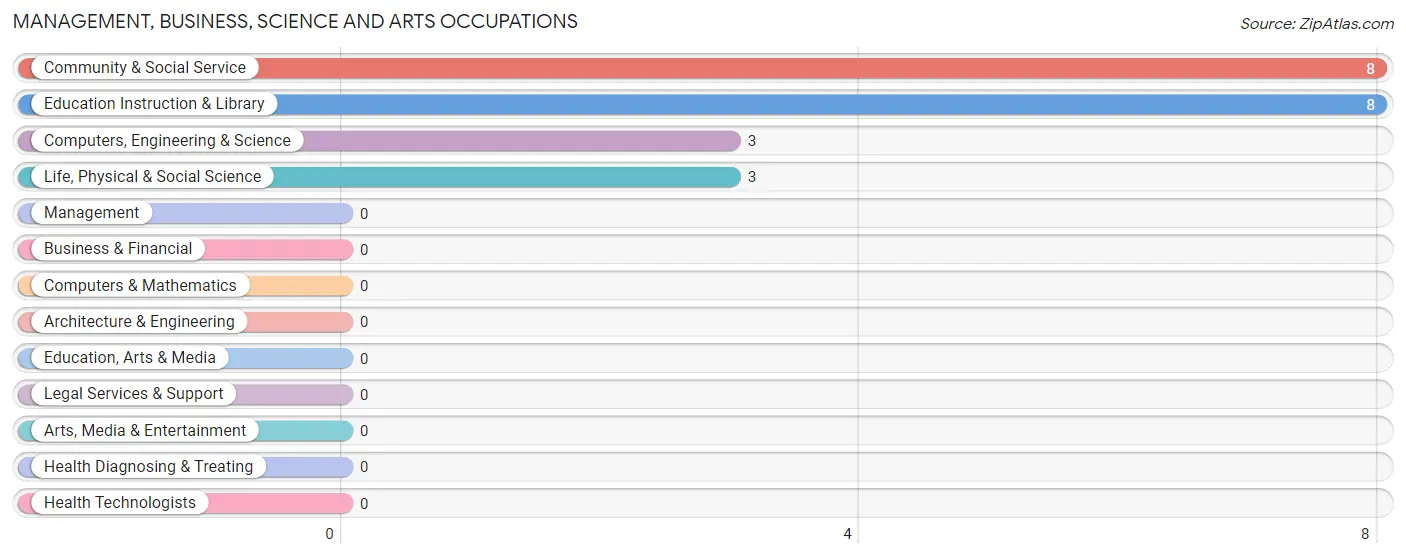
Management, Business, Science and Arts Occupations
The most common Management, Business, Science and Arts occupations in Oakwood are Community & Social Service (8 | 22.9%), Education Instruction & Library (8 | 22.9%), Computers, Engineering & Science (3 | 8.6%), and Life, Physical & Social Science (3 | 8.6%).
Management, Business, Science and Arts Occupations by Sex
Within the Management, Business, Science and Arts occupations in Oakwood, the most male-oriented occupations are Community & Social Service (25.0%), and Education Instruction & Library (25.0%), while the most female-oriented occupations are Computers, Engineering & Science (100.0%), Life, Physical & Social Science (100.0%), and Community & Social Service (75.0%).
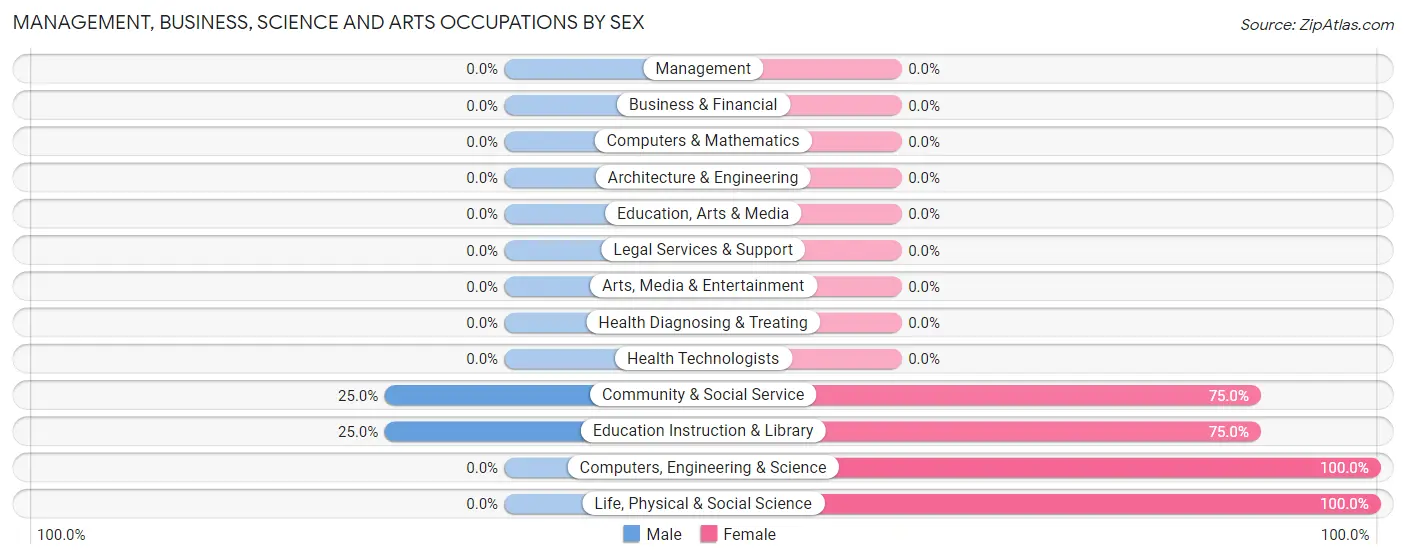
| Occupation | Male | Female |
| Management | 0 (0.0%) | 0 (0.0%) |
| Business & Financial | 0 (0.0%) | 0 (0.0%) |
| Computers, Engineering & Science | 0 (0.0%) | 3 (100.0%) |
| Computers & Mathematics | 0 (0.0%) | 0 (0.0%) |
| Architecture & Engineering | 0 (0.0%) | 0 (0.0%) |
| Life, Physical & Social Science | 0 (0.0%) | 3 (100.0%) |
| Community & Social Service | 2 (25.0%) | 6 (75.0%) |
| Education, Arts & Media | 0 (0.0%) | 0 (0.0%) |
| Legal Services & Support | 0 (0.0%) | 0 (0.0%) |
| Education Instruction & Library | 2 (25.0%) | 6 (75.0%) |
| Arts, Media & Entertainment | 0 (0.0%) | 0 (0.0%) |
| Health Diagnosing & Treating | 0 (0.0%) | 0 (0.0%) |
| Health Technologists | 0 (0.0%) | 0 (0.0%) |
| Total (Category) | 2 (18.2%) | 9 (81.8%) |
| Total (Overall) | 23 (65.7%) | 12 (34.3%) |
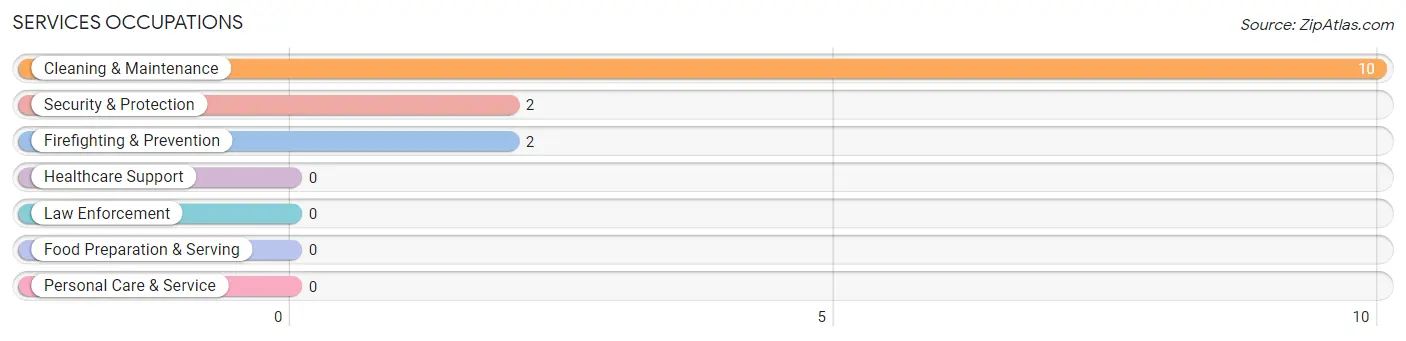
Services Occupations
The most common Services occupations in Oakwood are Cleaning & Maintenance (10 | 28.6%), Security & Protection (2 | 5.7%), and Firefighting & Prevention (2 | 5.7%).
Services Occupations by Sex
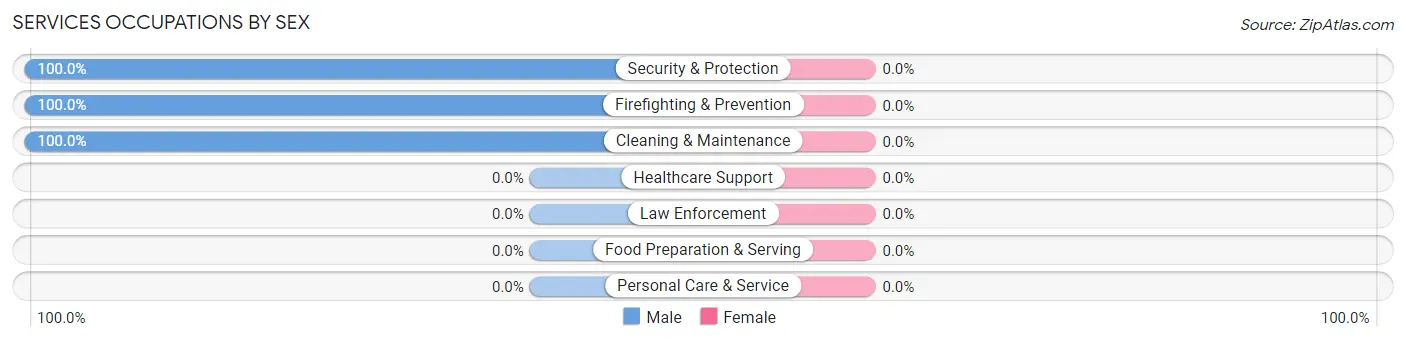
| Occupation | Male | Female |
| Healthcare Support | 0 (0.0%) | 0 (0.0%) |
| Security & Protection | 2 (100.0%) | 0 (0.0%) |
| Firefighting & Prevention | 2 (100.0%) | 0 (0.0%) |
| Law Enforcement | 0 (0.0%) | 0 (0.0%) |
| Food Preparation & Serving | 0 (0.0%) | 0 (0.0%) |
| Cleaning & Maintenance | 10 (100.0%) | 0 (0.0%) |
| Personal Care & Service | 0 (0.0%) | 0 (0.0%) |
| Total (Category) | 12 (100.0%) | 0 (0.0%) |
| Total (Overall) | 23 (65.7%) | 12 (34.3%) |
Sales and Office Occupations
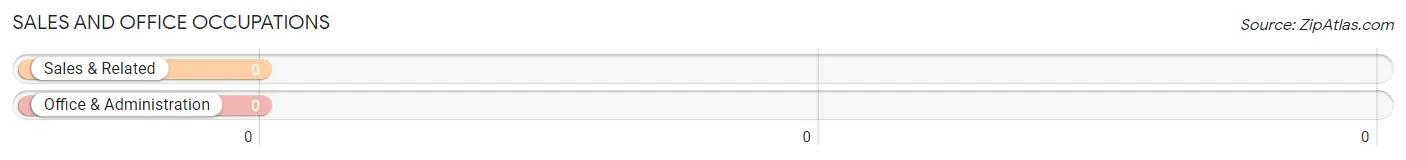
Sales and Office Occupations by Sex
| Occupation | Male | Female |
| Sales & Related | 0 (0.0%) | 0 (0.0%) |
| Office & Administration | 0 (0.0%) | 0 (0.0%) |
| Total (Category) | 0 (0.0%) | 0 (0.0%) |
| Total (Overall) | 23 (65.7%) | 12 (34.3%) |
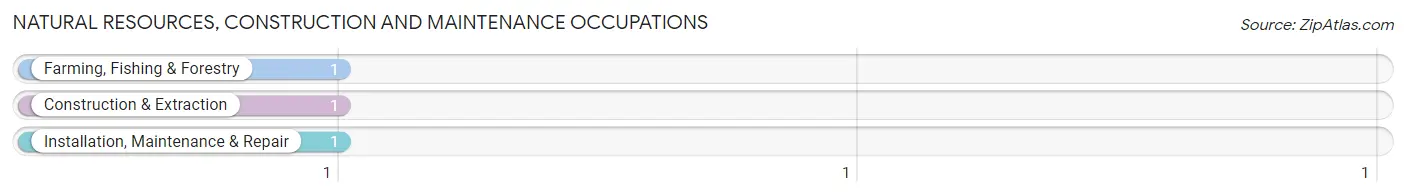
Natural Resources, Construction and Maintenance Occupations
The most common Natural Resources, Construction and Maintenance occupations in Oakwood are Farming, Fishing & Forestry (1 | 2.9%), Construction & Extraction (1 | 2.9%), and Installation, Maintenance & Repair (1 | 2.9%).
Natural Resources, Construction and Maintenance Occupations by Sex
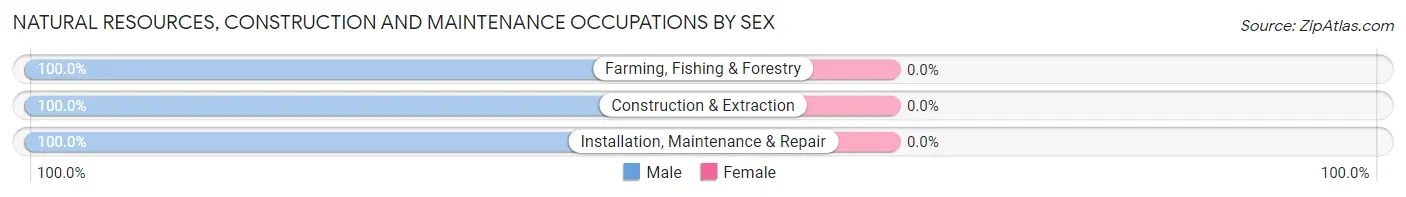
| Occupation | Male | Female |
| Farming, Fishing & Forestry | 1 (100.0%) | 0 (0.0%) |
| Construction & Extraction | 1 (100.0%) | 0 (0.0%) |
| Installation, Maintenance & Repair | 1 (100.0%) | 0 (0.0%) |
| Total (Category) | 3 (100.0%) | 0 (0.0%) |
| Total (Overall) | 23 (65.7%) | 12 (34.3%) |
Production, Transportation and Moving Occupations
The most common Production, Transportation and Moving occupations in Oakwood are Material Moving (5 | 14.3%), and Transportation (4 | 11.4%).
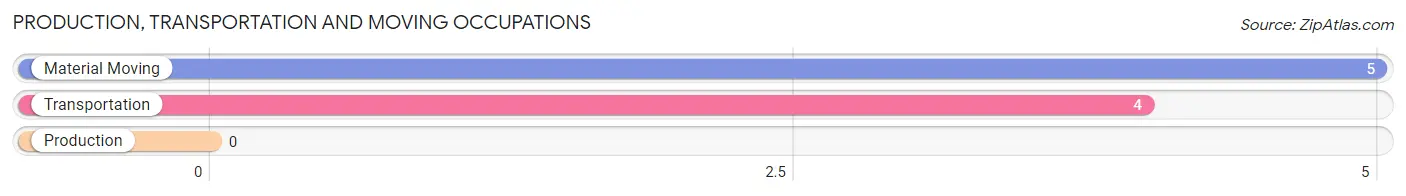
Production, Transportation and Moving Occupations by Sex
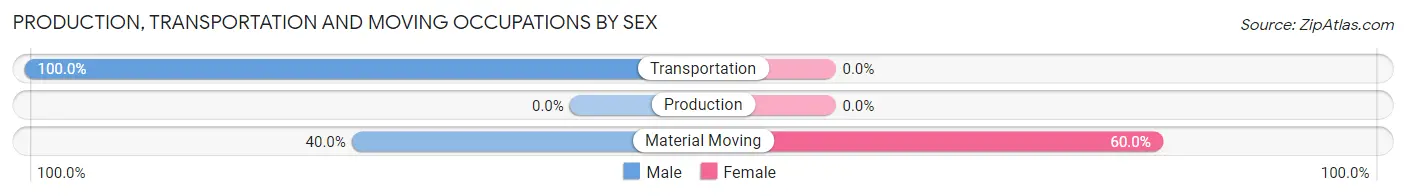
| Occupation | Male | Female |
| Production | 0 (0.0%) | 0 (0.0%) |
| Transportation | 4 (100.0%) | 0 (0.0%) |
| Material Moving | 2 (40.0%) | 3 (60.0%) |
| Total (Category) | 6 (66.7%) | 3 (33.3%) |
| Total (Overall) | 23 (65.7%) | 12 (34.3%) |
Employment Industries by Sex in Oakwood
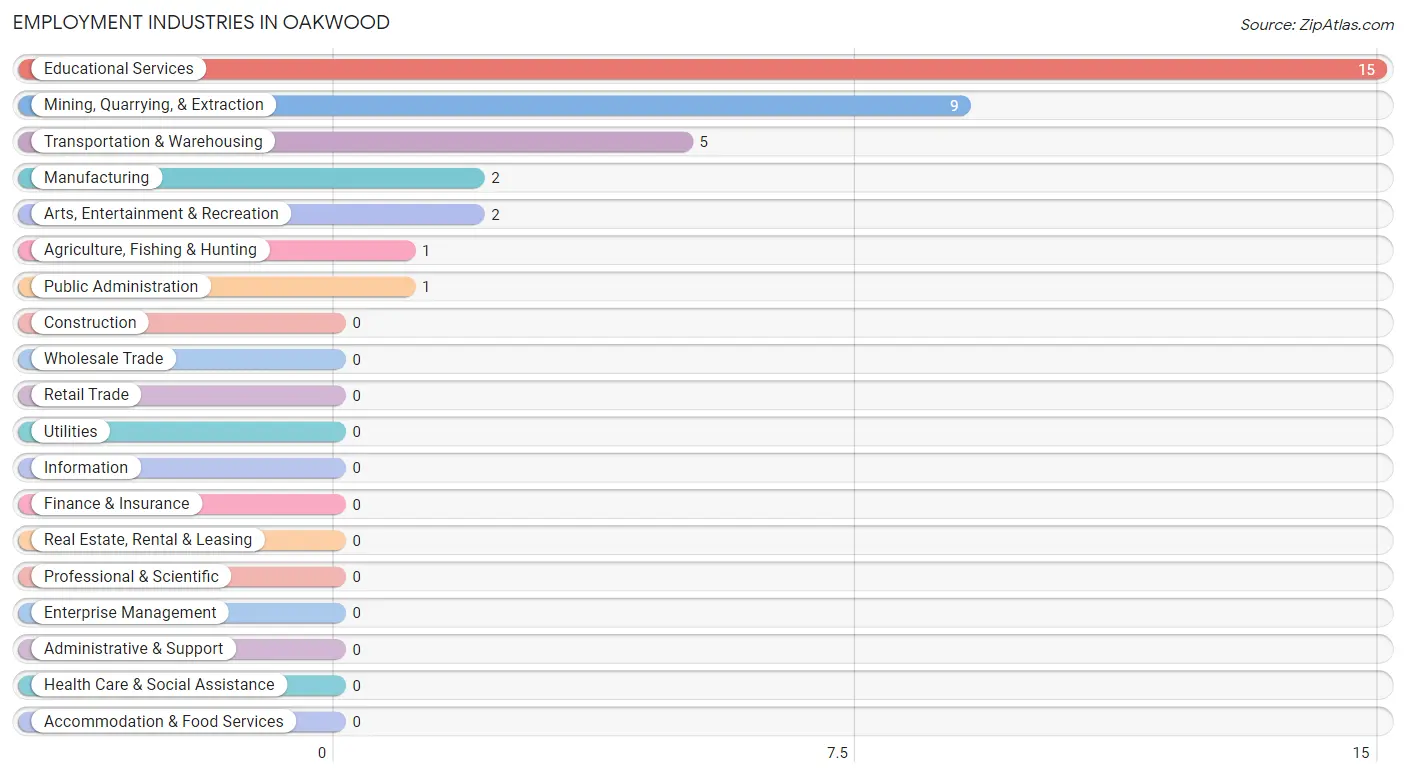
Employment Industries in Oakwood
The major employment industries in Oakwood include Educational Services (15 | 42.9%), Mining, Quarrying, & Extraction (9 | 25.7%), Transportation & Warehousing (5 | 14.3%), Manufacturing (2 | 5.7%), and Arts, Entertainment & Recreation (2 | 5.7%).
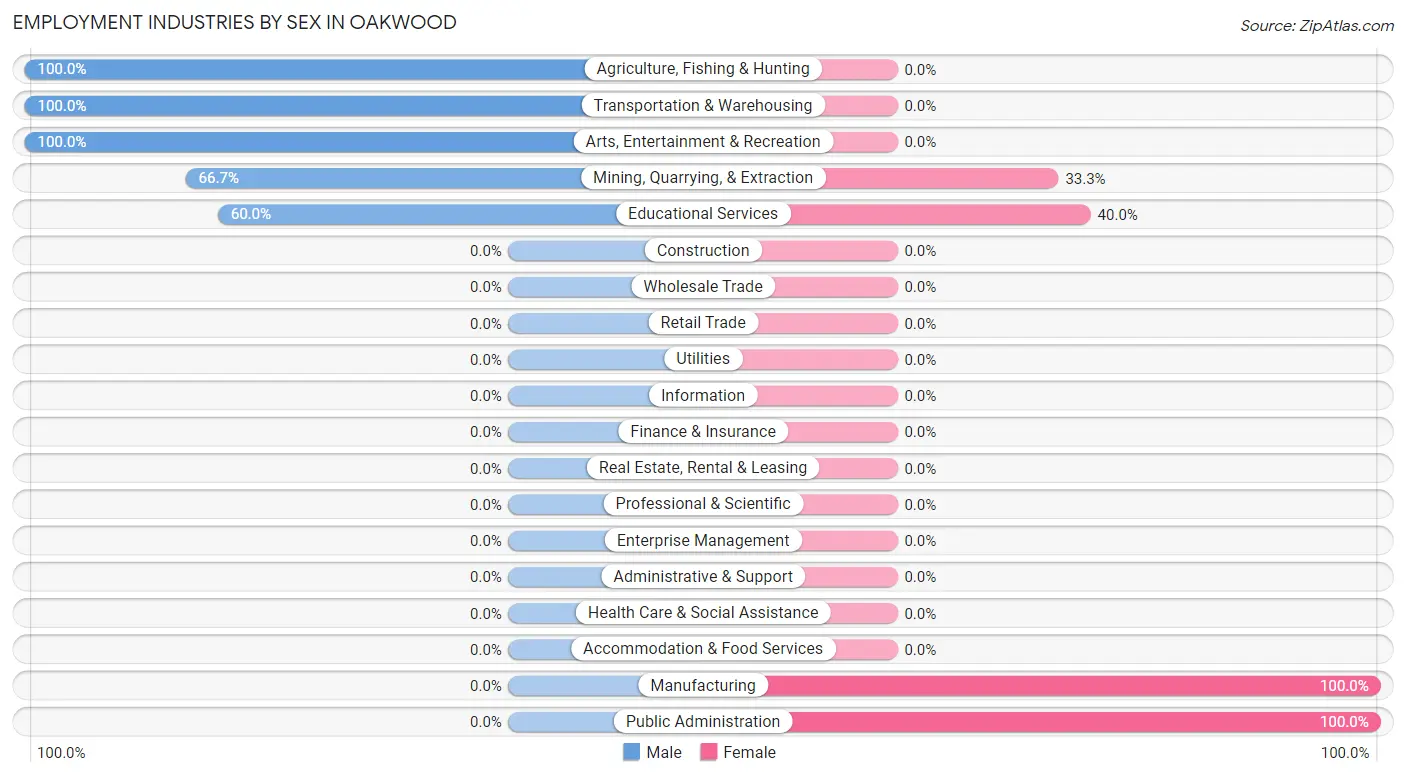
Employment Industries by Sex in Oakwood
The Oakwood industries that see more men than women are Agriculture, Fishing & Hunting (100.0%), Transportation & Warehousing (100.0%), and Arts, Entertainment & Recreation (100.0%), whereas the industries that tend to have a higher number of women are Manufacturing (100.0%), Public Administration (100.0%), and Educational Services (40.0%).
| Industry | Male | Female |
| Agriculture, Fishing & Hunting | 1 (100.0%) | 0 (0.0%) |
| Mining, Quarrying, & Extraction | 6 (66.7%) | 3 (33.3%) |
| Construction | 0 (0.0%) | 0 (0.0%) |
| Manufacturing | 0 (0.0%) | 2 (100.0%) |
| Wholesale Trade | 0 (0.0%) | 0 (0.0%) |
| Retail Trade | 0 (0.0%) | 0 (0.0%) |
| Transportation & Warehousing | 5 (100.0%) | 0 (0.0%) |
| Utilities | 0 (0.0%) | 0 (0.0%) |
| Information | 0 (0.0%) | 0 (0.0%) |
| Finance & Insurance | 0 (0.0%) | 0 (0.0%) |
| Real Estate, Rental & Leasing | 0 (0.0%) | 0 (0.0%) |
| Professional & Scientific | 0 (0.0%) | 0 (0.0%) |
| Enterprise Management | 0 (0.0%) | 0 (0.0%) |
| Administrative & Support | 0 (0.0%) | 0 (0.0%) |
| Educational Services | 9 (60.0%) | 6 (40.0%) |
| Health Care & Social Assistance | 0 (0.0%) | 0 (0.0%) |
| Arts, Entertainment & Recreation | 2 (100.0%) | 0 (0.0%) |
| Accommodation & Food Services | 0 (0.0%) | 0 (0.0%) |
| Public Administration | 0 (0.0%) | 1 (100.0%) |
| Total | 23 (65.7%) | 12 (34.3%) |
Education in Oakwood
School Enrollment in Oakwood
The most common levels of schooling among the 4 students in Oakwood are middle school (3 | 75.0%), and high school (1 | 25.0%).
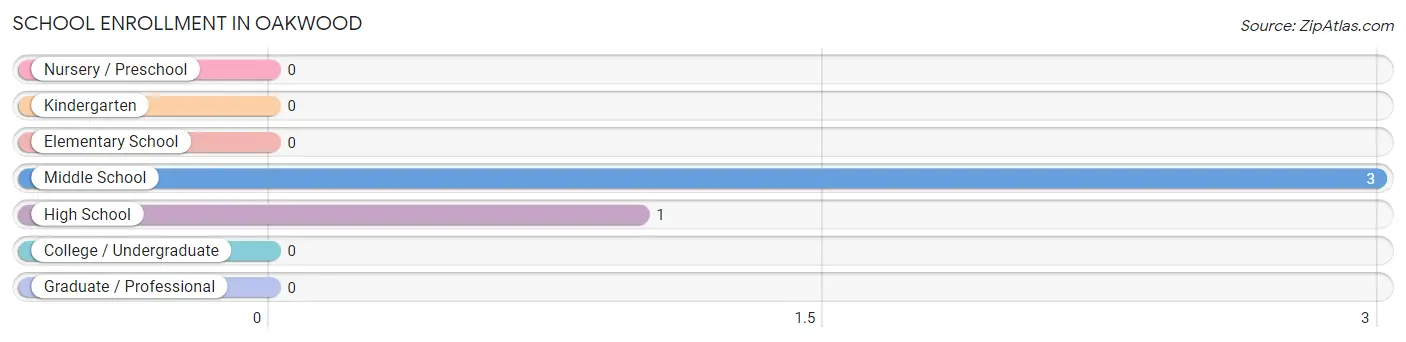
| School Level | # Students | % Students |
| Nursery / Preschool | 0 | 0.0% |
| Kindergarten | 0 | 0.0% |
| Elementary School | 0 | 0.0% |
| Middle School | 3 | 75.0% |
| High School | 1 | 25.0% |
| College / Undergraduate | 0 | 0.0% |
| Graduate / Professional | 0 | 0.0% |
| Total | 4 | 100.0% |
School Enrollment by Age by Funding Source in Oakwood
Out of a total of 4 students who are enrolled in schools in Oakwood, 3 (75.0%) attend a private institution, while the remaining 1 (25.0%) are enrolled in public schools. The age group of 10 to 14 year olds has the highest likelihood of being enrolled in private schools, with 2 (100.0% in the age bracket) enrolled. Conversely, the age group of 15 to 17 year olds has the lowest likelihood of being enrolled in a private school, with 1 (50.0% in the age bracket) attending a public institution.
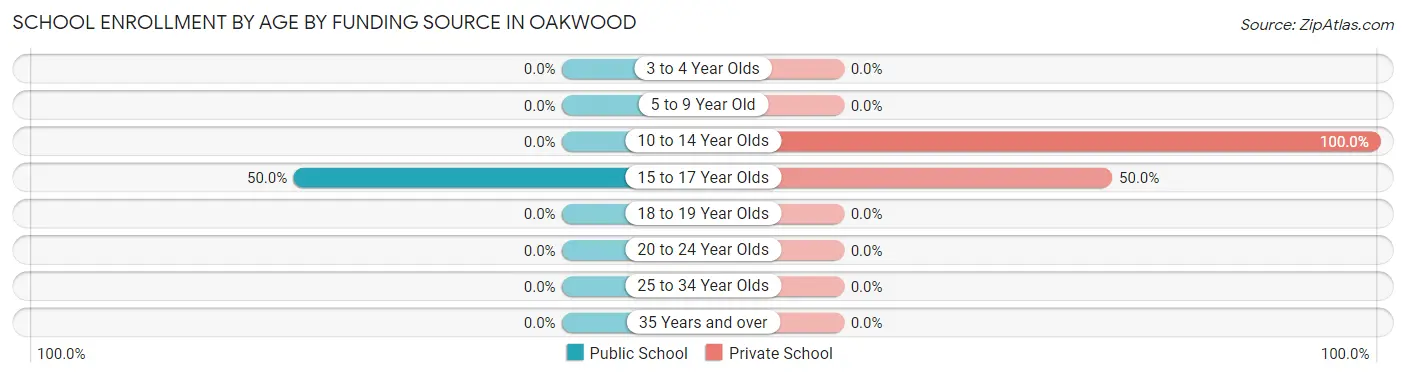
| Age Bracket | Public School | Private School |
| 3 to 4 Year Olds | 0 (0.0%) | 0 (0.0%) |
| 5 to 9 Year Old | 0 (0.0%) | 0 (0.0%) |
| 10 to 14 Year Olds | 0 (0.0%) | 2 (100.0%) |
| 15 to 17 Year Olds | 1 (50.0%) | 1 (50.0%) |
| 18 to 19 Year Olds | 0 (0.0%) | 0 (0.0%) |
| 20 to 24 Year Olds | 0 (0.0%) | 0 (0.0%) |
| 25 to 34 Year Olds | 0 (0.0%) | 0 (0.0%) |
| 35 Years and over | 0 (0.0%) | 0 (0.0%) |
| Total | 1 (25.0%) | 3 (75.0%) |
Educational Attainment by Field of Study in Oakwood
Bio, nature & agricultural (2 | 33.3%), physical & health sciences (2 | 33.3%), and education (2 | 33.3%) are the most common fields of study among 6 individuals in Oakwood who have obtained a bachelor's degree or higher.
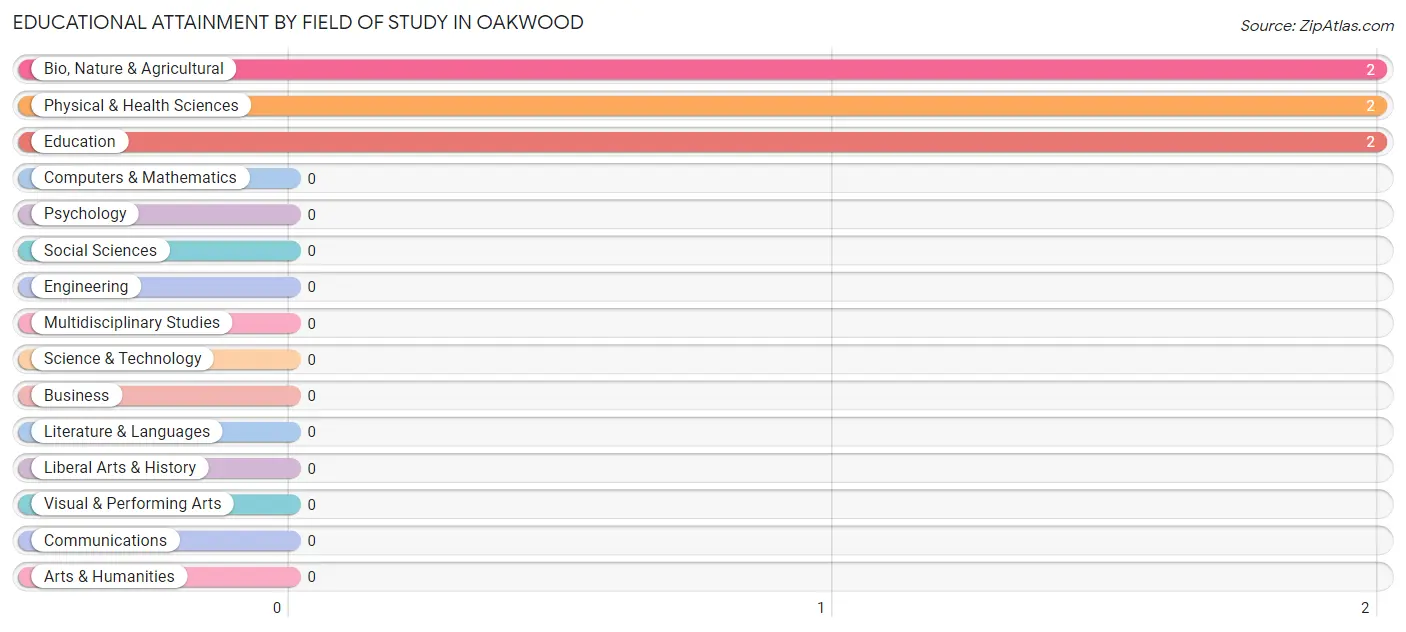
| Field of Study | # Graduates | % Graduates |
| Computers & Mathematics | 0 | 0.0% |
| Bio, Nature & Agricultural | 2 | 33.3% |
| Physical & Health Sciences | 2 | 33.3% |
| Psychology | 0 | 0.0% |
| Social Sciences | 0 | 0.0% |
| Engineering | 0 | 0.0% |
| Multidisciplinary Studies | 0 | 0.0% |
| Science & Technology | 0 | 0.0% |
| Business | 0 | 0.0% |
| Education | 2 | 33.3% |
| Literature & Languages | 0 | 0.0% |
| Liberal Arts & History | 0 | 0.0% |
| Visual & Performing Arts | 0 | 0.0% |
| Communications | 0 | 0.0% |
| Arts & Humanities | 0 | 0.0% |
| Total | 6 | 100.0% |
Transportation & Commute in Oakwood
Vehicle Availability by Sex in Oakwood
The most prevalent vehicle ownership categories in Oakwood are males with 4 vehicles (11, accounting for 47.8%) and females with 4 vehicles (6, making up 122.2%).
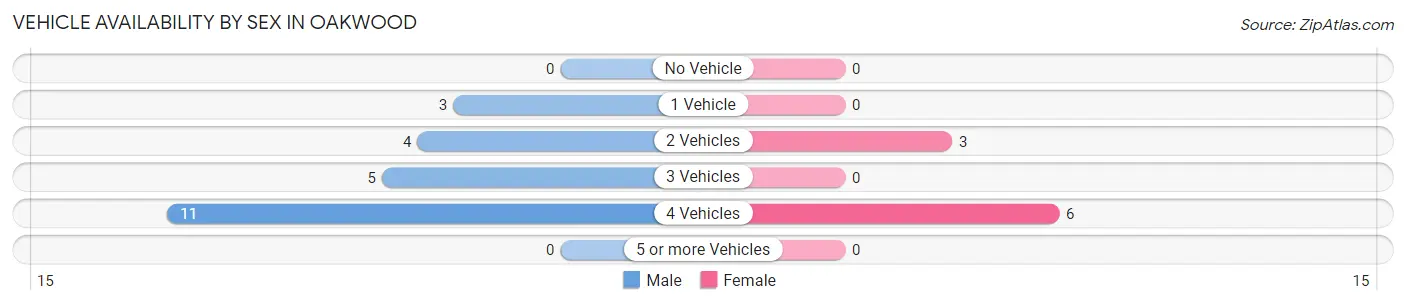
| Vehicles Available | Male | Female |
| No Vehicle | 0 (0.0%) | 0 (0.0%) |
| 1 Vehicle | 3 (13.0%) | 0 (0.0%) |
| 2 Vehicles | 4 (17.4%) | 3 (33.3%) |
| 3 Vehicles | 5 (21.7%) | 0 (0.0%) |
| 4 Vehicles | 11 (47.8%) | 6 (66.7%) |
| 5 or more Vehicles | 0 (0.0%) | 0 (0.0%) |
| Total | 23 (100.0%) | 9 (100.0%) |
Commute Time in Oakwood
The most frequently occuring commute durations in Oakwood are 20 to 24 minutes (18 commuters, 56.2%), 5 to 9 minutes (7 commuters, 21.9%), and 25 to 29 minutes (2 commuters, 6.2%).
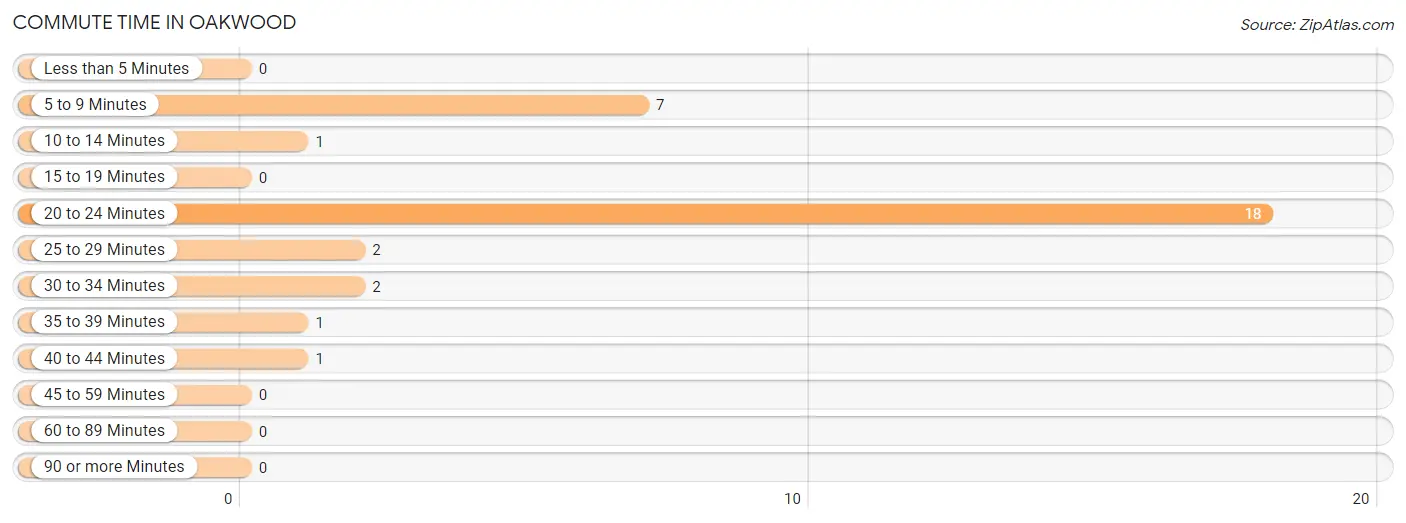
| Commute Time | # Commuters | % Commuters |
| Less than 5 Minutes | 0 | 0.0% |
| 5 to 9 Minutes | 7 | 21.9% |
| 10 to 14 Minutes | 1 | 3.1% |
| 15 to 19 Minutes | 0 | 0.0% |
| 20 to 24 Minutes | 18 | 56.2% |
| 25 to 29 Minutes | 2 | 6.2% |
| 30 to 34 Minutes | 2 | 6.2% |
| 35 to 39 Minutes | 1 | 3.1% |
| 40 to 44 Minutes | 1 | 3.1% |
| 45 to 59 Minutes | 0 | 0.0% |
| 60 to 89 Minutes | 0 | 0.0% |
| 90 or more Minutes | 0 | 0.0% |
Commute Time by Sex in Oakwood
The most common commute times in Oakwood are 20 to 24 minutes (11 commuters, 47.8%) for males and 20 to 24 minutes (7 commuters, 77.8%) for females.
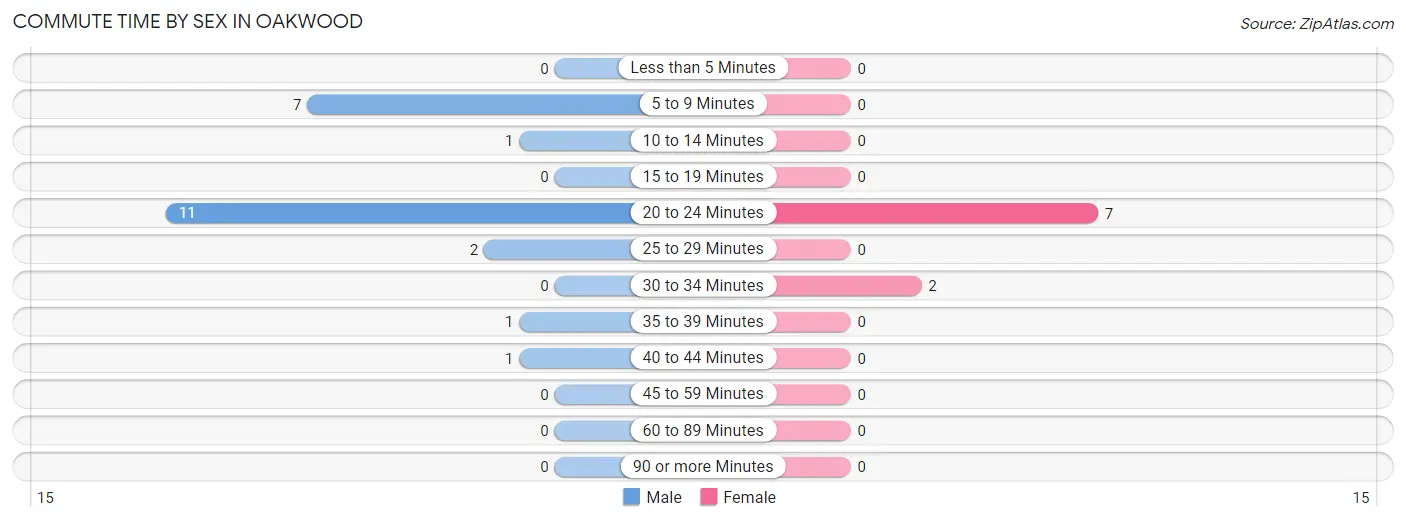
| Commute Time | Male | Female |
| Less than 5 Minutes | 0 (0.0%) | 0 (0.0%) |
| 5 to 9 Minutes | 7 (30.4%) | 0 (0.0%) |
| 10 to 14 Minutes | 1 (4.3%) | 0 (0.0%) |
| 15 to 19 Minutes | 0 (0.0%) | 0 (0.0%) |
| 20 to 24 Minutes | 11 (47.8%) | 7 (77.8%) |
| 25 to 29 Minutes | 2 (8.7%) | 0 (0.0%) |
| 30 to 34 Minutes | 0 (0.0%) | 2 (22.2%) |
| 35 to 39 Minutes | 1 (4.3%) | 0 (0.0%) |
| 40 to 44 Minutes | 1 (4.3%) | 0 (0.0%) |
| 45 to 59 Minutes | 0 (0.0%) | 0 (0.0%) |
| 60 to 89 Minutes | 0 (0.0%) | 0 (0.0%) |
| 90 or more Minutes | 0 (0.0%) | 0 (0.0%) |
Time of Departure to Work by Sex in Oakwood
The most frequent times of departure to work in Oakwood are 12:00 AM to 4:59 AM (10, 43.5%) for males and 7:00 AM to 7:29 AM (6, 66.7%) for females.
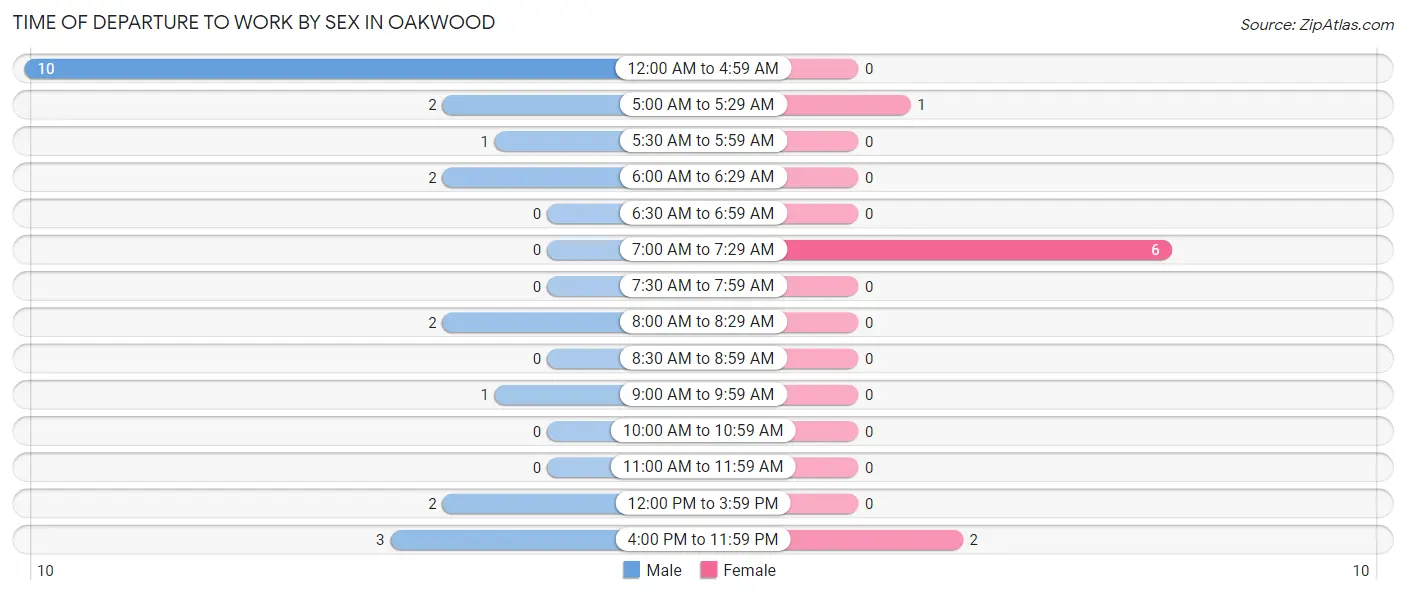
| Time of Departure | Male | Female |
| 12:00 AM to 4:59 AM | 10 (43.5%) | 0 (0.0%) |
| 5:00 AM to 5:29 AM | 2 (8.7%) | 1 (11.1%) |
| 5:30 AM to 5:59 AM | 1 (4.3%) | 0 (0.0%) |
| 6:00 AM to 6:29 AM | 2 (8.7%) | 0 (0.0%) |
| 6:30 AM to 6:59 AM | 0 (0.0%) | 0 (0.0%) |
| 7:00 AM to 7:29 AM | 0 (0.0%) | 6 (66.7%) |
| 7:30 AM to 7:59 AM | 0 (0.0%) | 0 (0.0%) |
| 8:00 AM to 8:29 AM | 2 (8.7%) | 0 (0.0%) |
| 8:30 AM to 8:59 AM | 0 (0.0%) | 0 (0.0%) |
| 9:00 AM to 9:59 AM | 1 (4.3%) | 0 (0.0%) |
| 10:00 AM to 10:59 AM | 0 (0.0%) | 0 (0.0%) |
| 11:00 AM to 11:59 AM | 0 (0.0%) | 0 (0.0%) |
| 12:00 PM to 3:59 PM | 2 (8.7%) | 0 (0.0%) |
| 4:00 PM to 11:59 PM | 3 (13.0%) | 2 (22.2%) |
| Total | 23 (100.0%) | 9 (100.0%) |
Housing Occupancy in Oakwood
Occupancy by Ownership in Oakwood
Of the total 31 dwellings in Oakwood, owner-occupied units account for 28 (90.3%), while renter-occupied units make up 3 (9.7%).
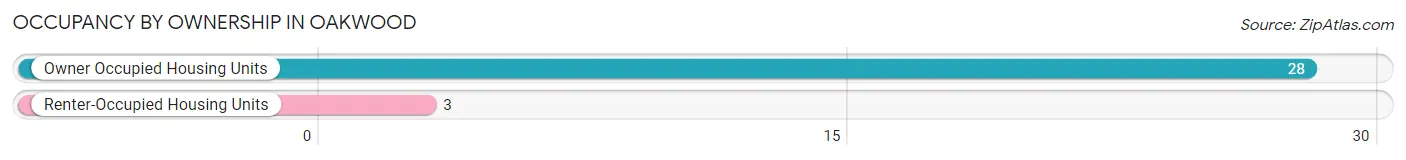
| Occupancy | # Housing Units | % Housing Units |
| Owner Occupied Housing Units | 28 | 90.3% |
| Renter-Occupied Housing Units | 3 | 9.7% |
| Total Occupied Housing Units | 31 | 100.0% |
Occupancy by Household Size in Oakwood
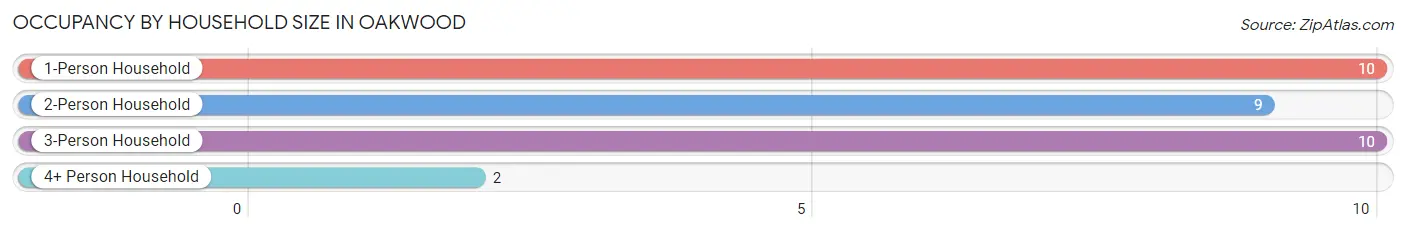
| Household Size | # Housing Units | % Housing Units |
| 1-Person Household | 10 | 32.3% |
| 2-Person Household | 9 | 29.0% |
| 3-Person Household | 10 | 32.3% |
| 4+ Person Household | 2 | 6.5% |
| Total Housing Units | 31 | 100.0% |
Occupancy by Ownership by Household Size in Oakwood
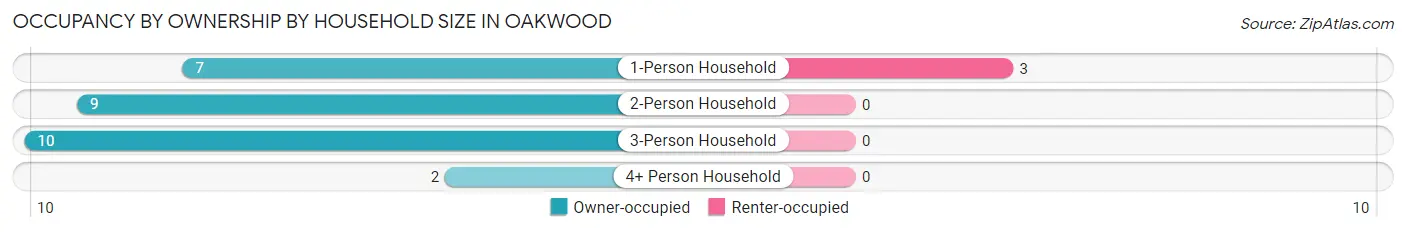
| Household Size | Owner-occupied | Renter-occupied |
| 1-Person Household | 7 (70.0%) | 3 (30.0%) |
| 2-Person Household | 9 (100.0%) | 0 (0.0%) |
| 3-Person Household | 10 (100.0%) | 0 (0.0%) |
| 4+ Person Household | 2 (100.0%) | 0 (0.0%) |
| Total Housing Units | 28 (90.3%) | 3 (9.7%) |
Occupancy by Educational Attainment in Oakwood
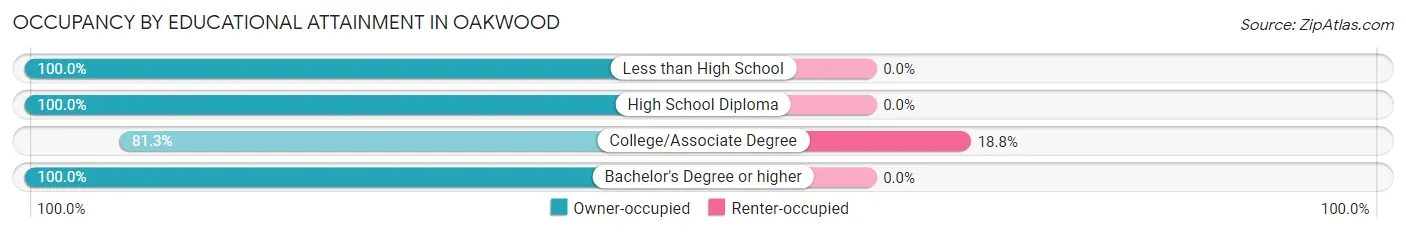
| Household Size | Owner-occupied | Renter-occupied |
| Less than High School | 1 (100.0%) | 0 (0.0%) |
| High School Diploma | 11 (100.0%) | 0 (0.0%) |
| College/Associate Degree | 13 (81.2%) | 3 (18.8%) |
| Bachelor's Degree or higher | 3 (100.0%) | 0 (0.0%) |
Occupancy by Age of Householder in Oakwood
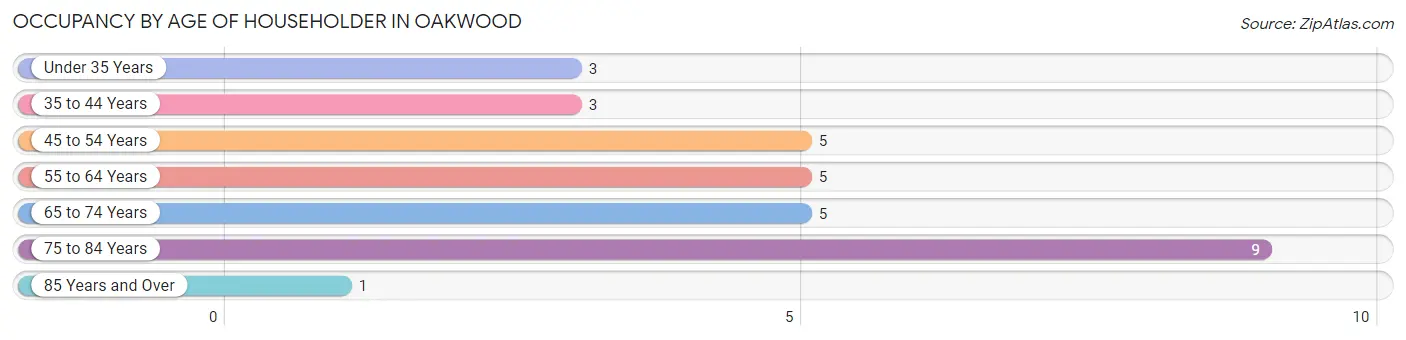
| Age Bracket | # Households | % Households |
| Under 35 Years | 3 | 9.7% |
| 35 to 44 Years | 3 | 9.7% |
| 45 to 54 Years | 5 | 16.1% |
| 55 to 64 Years | 5 | 16.1% |
| 65 to 74 Years | 5 | 16.1% |
| 75 to 84 Years | 9 | 29.0% |
| 85 Years and Over | 1 | 3.2% |
| Total | 31 | 100.0% |
Housing Finances in Oakwood
Median Income by Occupancy in Oakwood
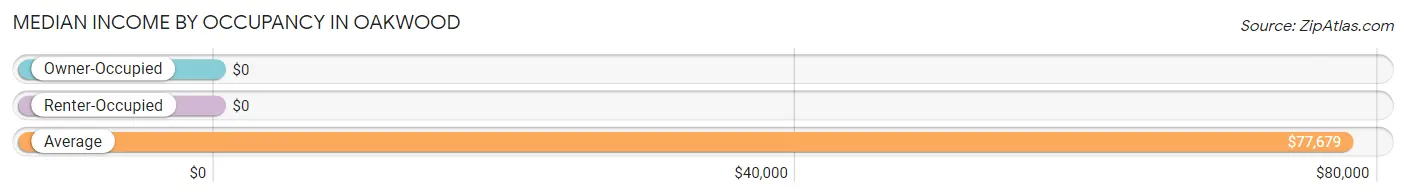
| Occupancy Type | # Households | Median Income |
| Owner-Occupied | 28 (90.3%) | $0 |
| Renter-Occupied | 3 (9.7%) | $0 |
| Average | 31 (100.0%) | $77,679 |
Occupancy by Householder Income Bracket in Oakwood
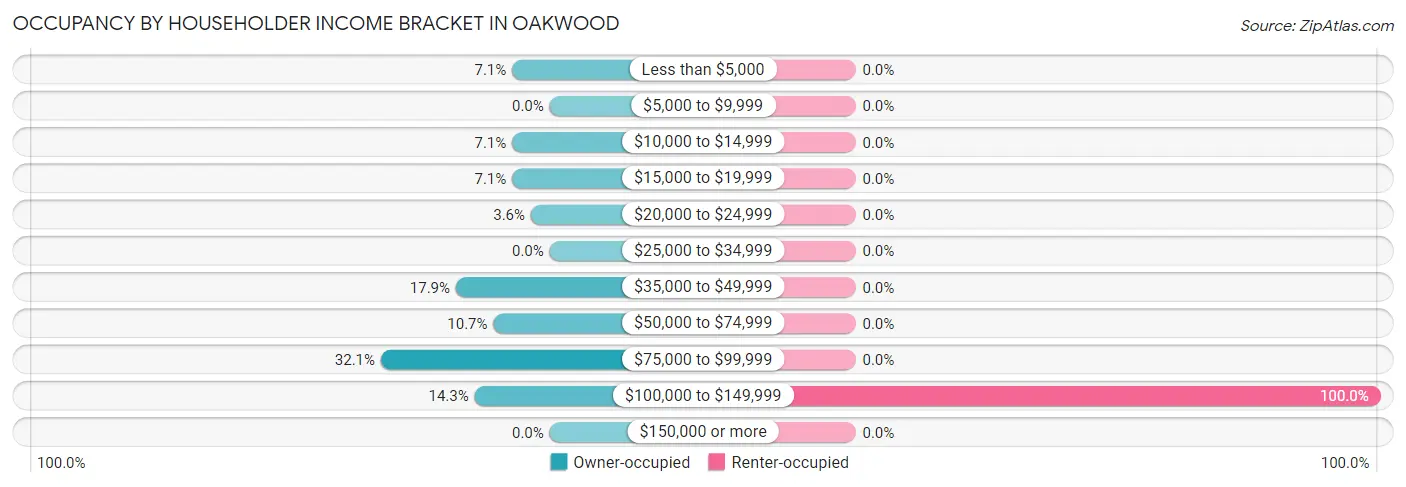
| Income Bracket | Owner-occupied | Renter-occupied |
| Less than $5,000 | 2 (7.1%) | 0 (0.0%) |
| $5,000 to $9,999 | 0 (0.0%) | 0 (0.0%) |
| $10,000 to $14,999 | 2 (7.1%) | 0 (0.0%) |
| $15,000 to $19,999 | 2 (7.1%) | 0 (0.0%) |
| $20,000 to $24,999 | 1 (3.6%) | 0 (0.0%) |
| $25,000 to $34,999 | 0 (0.0%) | 0 (0.0%) |
| $35,000 to $49,999 | 5 (17.9%) | 0 (0.0%) |
| $50,000 to $74,999 | 3 (10.7%) | 0 (0.0%) |
| $75,000 to $99,999 | 9 (32.1%) | 0 (0.0%) |
| $100,000 to $149,999 | 4 (14.3%) | 3 (100.0%) |
| $150,000 or more | 0 (0.0%) | 0 (0.0%) |
| Total | 28 (100.0%) | 3 (100.0%) |
Monthly Housing Cost Tiers in Oakwood
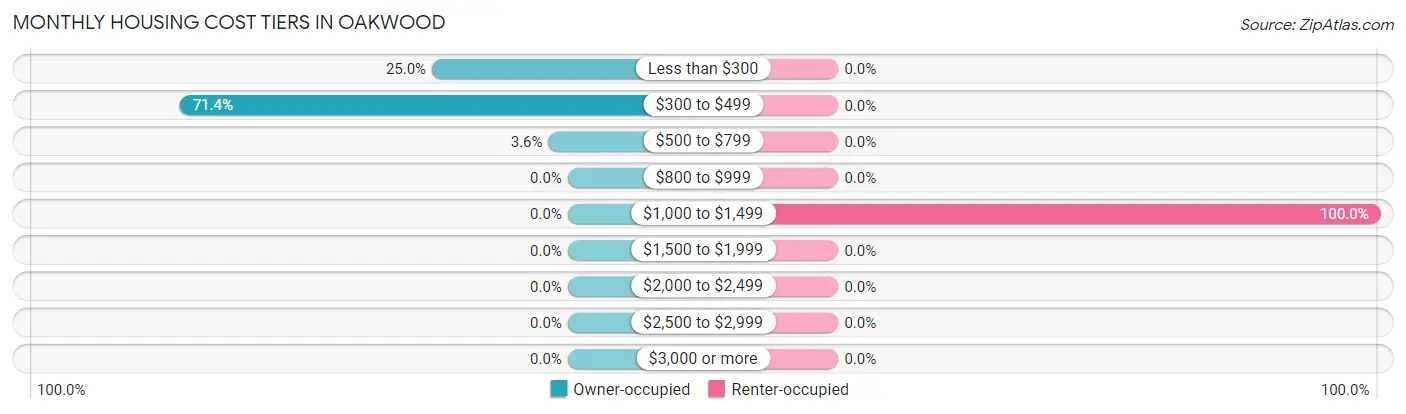
| Monthly Cost | Owner-occupied | Renter-occupied |
| Less than $300 | 7 (25.0%) | 0 (0.0%) |
| $300 to $499 | 20 (71.4%) | 0 (0.0%) |
| $500 to $799 | 1 (3.6%) | 0 (0.0%) |
| $800 to $999 | 0 (0.0%) | 0 (0.0%) |
| $1,000 to $1,499 | 0 (0.0%) | 3 (100.0%) |
| $1,500 to $1,999 | 0 (0.0%) | 0 (0.0%) |
| $2,000 to $2,499 | 0 (0.0%) | 0 (0.0%) |
| $2,500 to $2,999 | 0 (0.0%) | 0 (0.0%) |
| $3,000 or more | 0 (0.0%) | 0 (0.0%) |
| Total | 28 (100.0%) | 3 (100.0%) |
Physical Housing Characteristics in Oakwood
Housing Structures in Oakwood
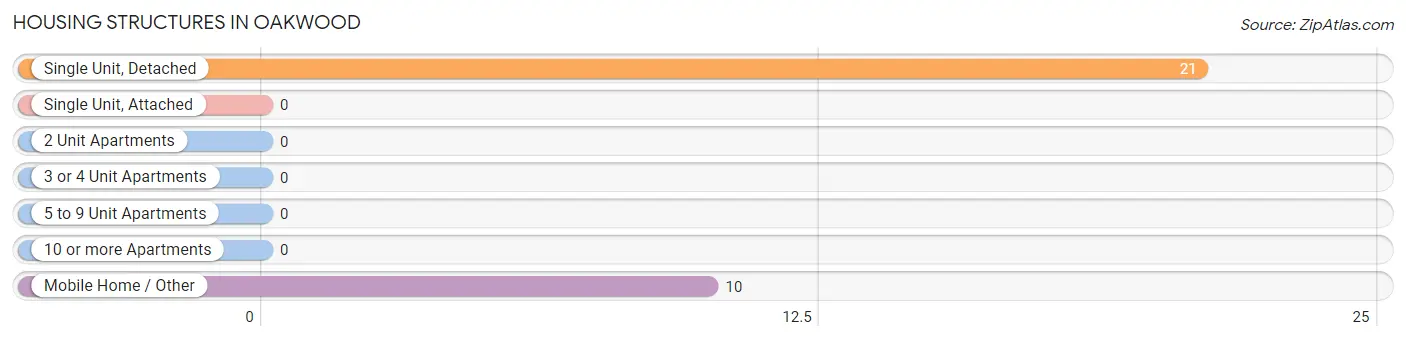
| Structure Type | # Housing Units | % Housing Units |
| Single Unit, Detached | 21 | 67.7% |
| Single Unit, Attached | 0 | 0.0% |
| 2 Unit Apartments | 0 | 0.0% |
| 3 or 4 Unit Apartments | 0 | 0.0% |
| 5 to 9 Unit Apartments | 0 | 0.0% |
| 10 or more Apartments | 0 | 0.0% |
| Mobile Home / Other | 10 | 32.3% |
| Total | 31 | 100.0% |
Housing Structures by Occupancy in Oakwood
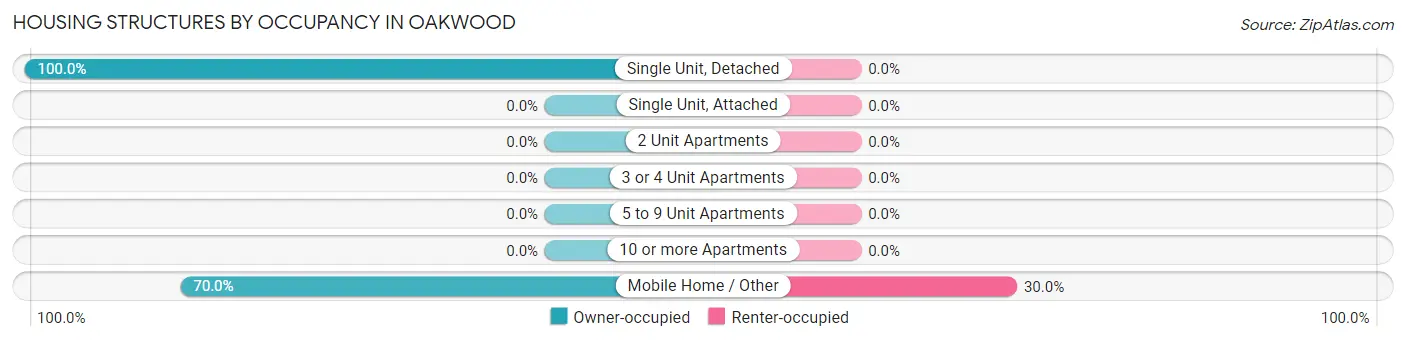
| Structure Type | Owner-occupied | Renter-occupied |
| Single Unit, Detached | 21 (100.0%) | 0 (0.0%) |
| Single Unit, Attached | 0 (0.0%) | 0 (0.0%) |
| 2 Unit Apartments | 0 (0.0%) | 0 (0.0%) |
| 3 or 4 Unit Apartments | 0 (0.0%) | 0 (0.0%) |
| 5 to 9 Unit Apartments | 0 (0.0%) | 0 (0.0%) |
| 10 or more Apartments | 0 (0.0%) | 0 (0.0%) |
| Mobile Home / Other | 7 (70.0%) | 3 (30.0%) |
| Total | 28 (90.3%) | 3 (9.7%) |
Housing Structures by Number of Rooms in Oakwood
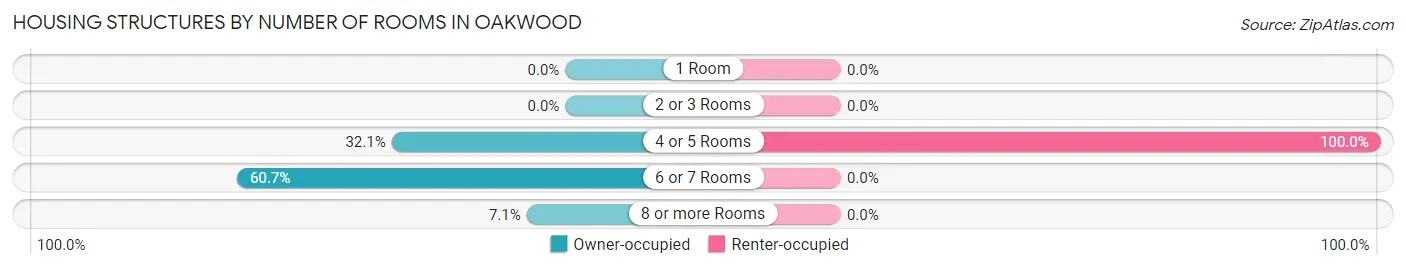
| Number of Rooms | Owner-occupied | Renter-occupied |
| 1 Room | 0 (0.0%) | 0 (0.0%) |
| 2 or 3 Rooms | 0 (0.0%) | 0 (0.0%) |
| 4 or 5 Rooms | 9 (32.1%) | 3 (100.0%) |
| 6 or 7 Rooms | 17 (60.7%) | 0 (0.0%) |
| 8 or more Rooms | 2 (7.1%) | 0 (0.0%) |
| Total | 28 (100.0%) | 3 (100.0%) |
Housing Structure by Heating Type in Oakwood
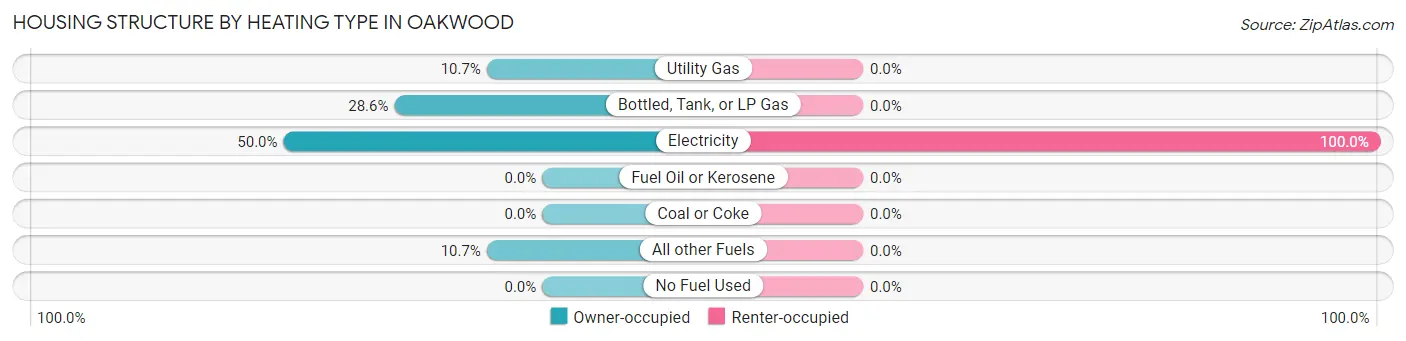
| Heating Type | Owner-occupied | Renter-occupied |
| Utility Gas | 3 (10.7%) | 0 (0.0%) |
| Bottled, Tank, or LP Gas | 8 (28.6%) | 0 (0.0%) |
| Electricity | 14 (50.0%) | 3 (100.0%) |
| Fuel Oil or Kerosene | 0 (0.0%) | 0 (0.0%) |
| Coal or Coke | 0 (0.0%) | 0 (0.0%) |
| All other Fuels | 3 (10.7%) | 0 (0.0%) |
| No Fuel Used | 0 (0.0%) | 0 (0.0%) |
| Total | 28 (100.0%) | 3 (100.0%) |
Household Vehicle Usage in Oakwood
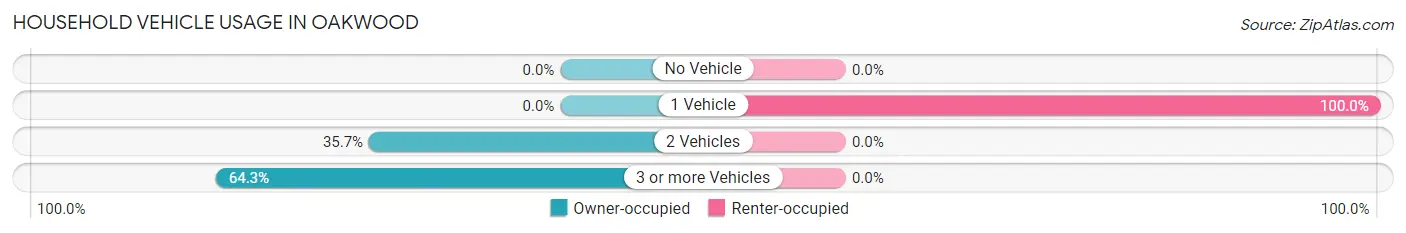
| Vehicles per Household | Owner-occupied | Renter-occupied |
| No Vehicle | 0 (0.0%) | 0 (0.0%) |
| 1 Vehicle | 0 (0.0%) | 3 (100.0%) |
| 2 Vehicles | 10 (35.7%) | 0 (0.0%) |
| 3 or more Vehicles | 18 (64.3%) | 0 (0.0%) |
| Total | 28 (100.0%) | 3 (100.0%) |
Real Estate & Mortgages in Oakwood
Real Estate and Mortgage Overview in Oakwood
| Characteristic | Without Mortgage | With Mortgage |
| Housing Units | 25 | 3 |
| Median Property Value | $91,700 | $0 |
| Median Household Income | $77,679 | $0 |
| Monthly Housing Costs | $339 | $0 |
| Real Estate Taxes | - | - |
Property Value by Mortgage Status in Oakwood
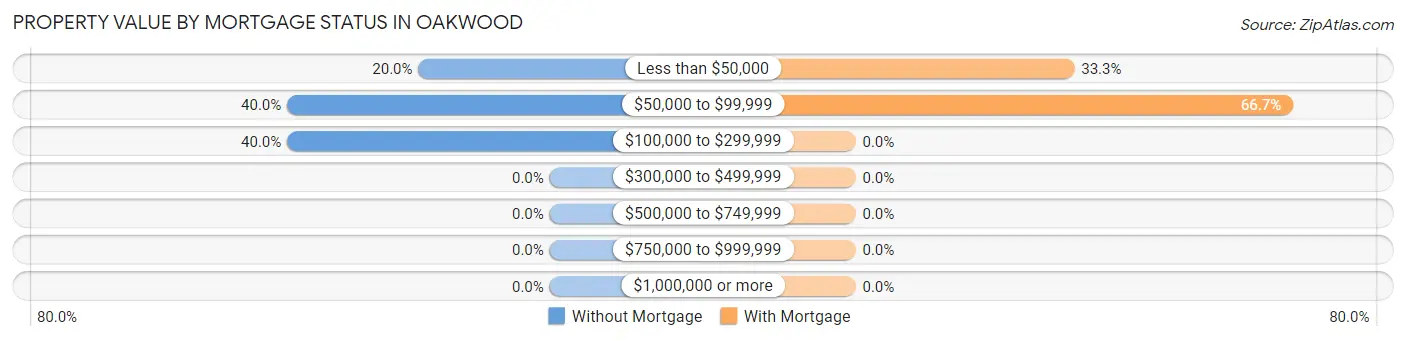
| Property Value | Without Mortgage | With Mortgage |
| Less than $50,000 | 5 (20.0%) | 1 (33.3%) |
| $50,000 to $99,999 | 10 (40.0%) | 2 (66.7%) |
| $100,000 to $299,999 | 10 (40.0%) | 0 (0.0%) |
| $300,000 to $499,999 | 0 (0.0%) | 0 (0.0%) |
| $500,000 to $749,999 | 0 (0.0%) | 0 (0.0%) |
| $750,000 to $999,999 | 0 (0.0%) | 0 (0.0%) |
| $1,000,000 or more | 0 (0.0%) | 0 (0.0%) |
| Total | 25 (100.0%) | 3 (100.0%) |
Household Income by Mortgage Status in Oakwood
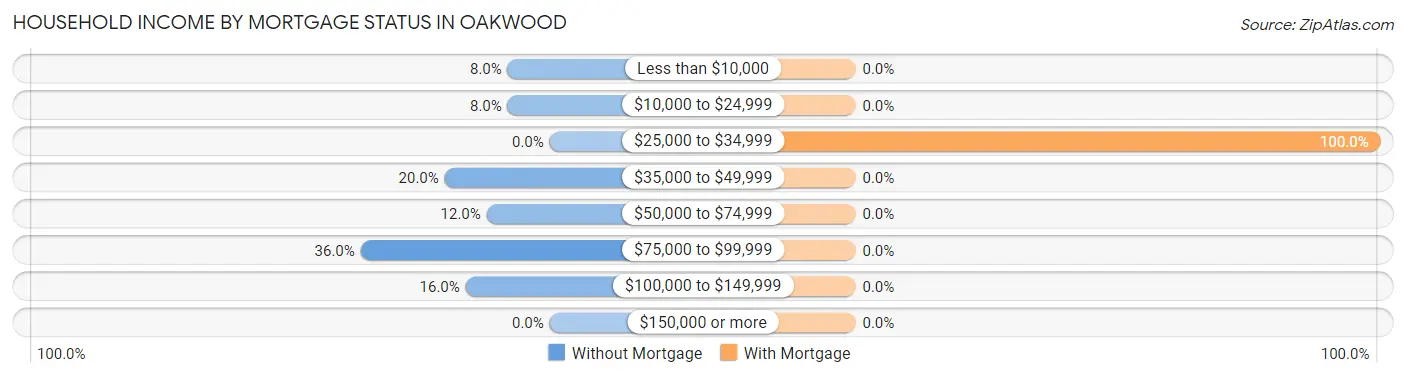
| Household Income | Without Mortgage | With Mortgage |
| Less than $10,000 | 2 (8.0%) | 0 (0.0%) |
| $10,000 to $24,999 | 2 (8.0%) | 0 (0.0%) |
| $25,000 to $34,999 | 0 (0.0%) | 3 (100.0%) |
| $35,000 to $49,999 | 5 (20.0%) | 0 (0.0%) |
| $50,000 to $74,999 | 3 (12.0%) | 0 (0.0%) |
| $75,000 to $99,999 | 9 (36.0%) | 0 (0.0%) |
| $100,000 to $149,999 | 4 (16.0%) | 0 (0.0%) |
| $150,000 or more | 0 (0.0%) | 0 (0.0%) |
| Total | 25 (100.0%) | 3 (100.0%) |
Property Value to Household Income Ratio in Oakwood
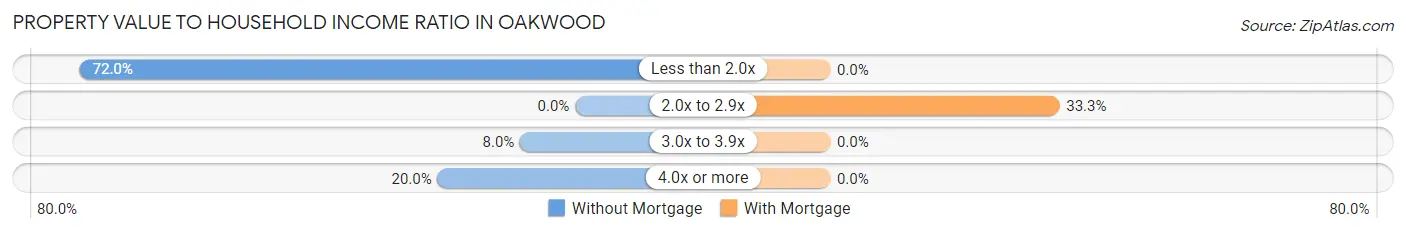
| Value-to-Income Ratio | Without Mortgage | With Mortgage |
| Less than 2.0x | 18 (72.0%) | 0 (0.0%) |
| 2.0x to 2.9x | 0 (0.0%) | 1 (33.3%) |
| 3.0x to 3.9x | 2 (8.0%) | 0 (0.0%) |
| 4.0x or more | 5 (20.0%) | 0 (0.0%) |
| Total | 25 (100.0%) | 3 (100.0%) |
Real Estate Taxes by Mortgage Status in Oakwood
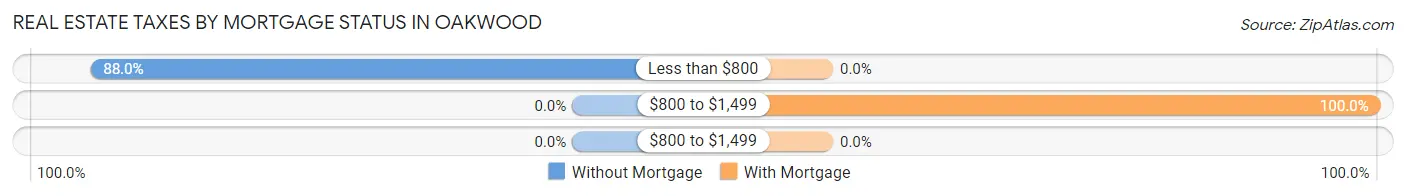
| Property Taxes | Without Mortgage | With Mortgage |
| Less than $800 | 22 (88.0%) | 0 (0.0%) |
| $800 to $1,499 | 0 (0.0%) | 3 (100.0%) |
| $800 to $1,499 | 0 (0.0%) | 0 (0.0%) |
| Total | 25 (100.0%) | 3 (100.0%) |
Health & Disability in Oakwood
Health Insurance Coverage by Age in Oakwood
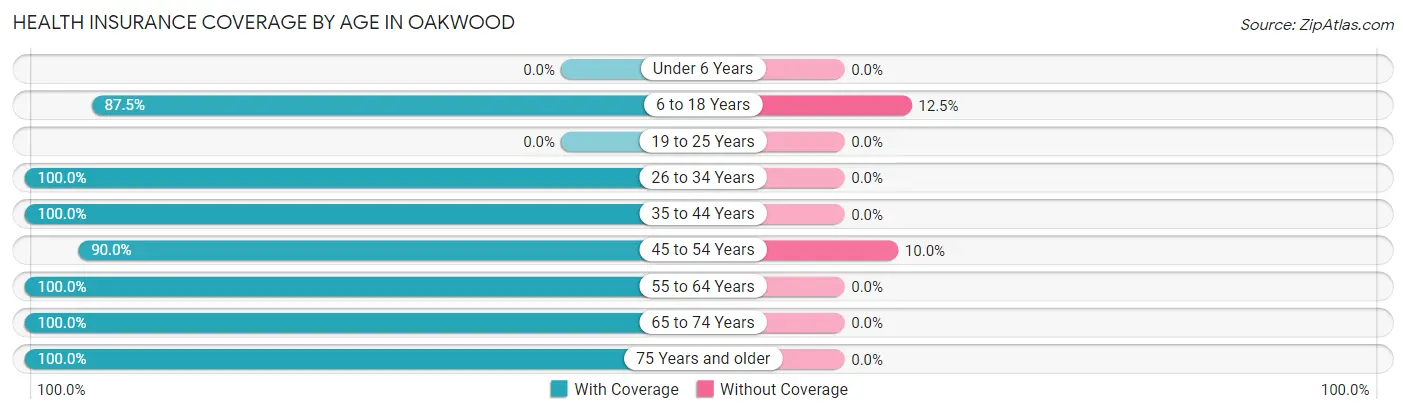
| Age Bracket | With Coverage | Without Coverage |
| Under 6 Years | 0 (0.0%) | 0 (0.0%) |
| 6 to 18 Years | 7 (87.5%) | 1 (12.5%) |
| 19 to 25 Years | 0 (0.0%) | 0 (0.0%) |
| 26 to 34 Years | 2 (100.0%) | 0 (0.0%) |
| 35 to 44 Years | 3 (100.0%) | 0 (0.0%) |
| 45 to 54 Years | 9 (90.0%) | 1 (10.0%) |
| 55 to 64 Years | 7 (100.0%) | 0 (0.0%) |
| 65 to 74 Years | 16 (100.0%) | 0 (0.0%) |
| 75 Years and older | 15 (100.0%) | 0 (0.0%) |
| Total | 59 (96.7%) | 2 (3.3%) |
Health Insurance Coverage by Citizenship Status in Oakwood
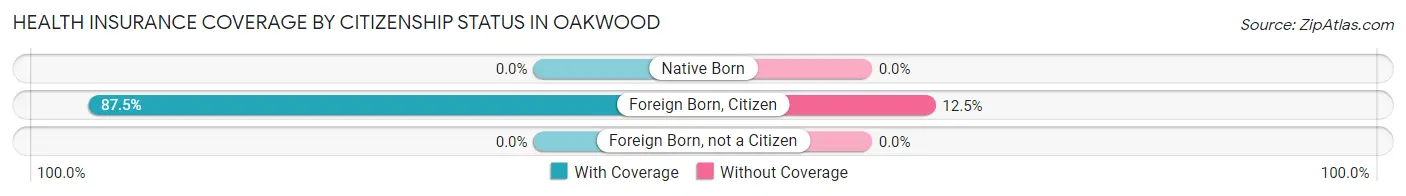
| Citizenship Status | With Coverage | Without Coverage |
| Native Born | 0 (0.0%) | 0 (0.0%) |
| Foreign Born, Citizen | 7 (87.5%) | 1 (12.5%) |
| Foreign Born, not a Citizen | 0 (0.0%) | 0 (0.0%) |
Health Insurance Coverage by Household Income in Oakwood
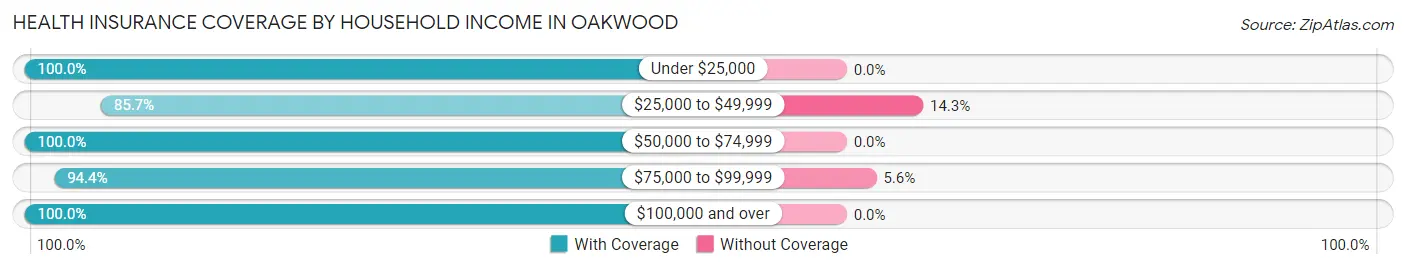
| Household Income | With Coverage | Without Coverage |
| Under $25,000 | 15 (100.0%) | 0 (0.0%) |
| $25,000 to $49,999 | 6 (85.7%) | 1 (14.3%) |
| $50,000 to $74,999 | 6 (100.0%) | 0 (0.0%) |
| $75,000 to $99,999 | 17 (94.4%) | 1 (5.6%) |
| $100,000 and over | 15 (100.0%) | 0 (0.0%) |
Public vs Private Health Insurance Coverage by Age in Oakwood
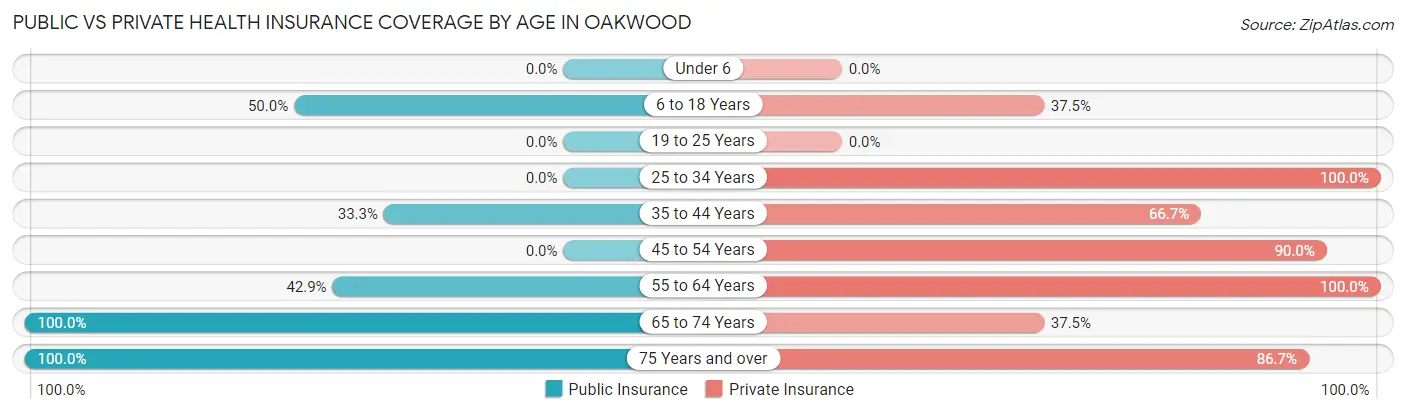
| Age Bracket | Public Insurance | Private Insurance |
| Under 6 | 0 (0.0%) | 0 (0.0%) |
| 6 to 18 Years | 4 (50.0%) | 3 (37.5%) |
| 19 to 25 Years | 0 (0.0%) | 0 (0.0%) |
| 25 to 34 Years | 0 (0.0%) | 2 (100.0%) |
| 35 to 44 Years | 1 (33.3%) | 2 (66.7%) |
| 45 to 54 Years | 0 (0.0%) | 9 (90.0%) |
| 55 to 64 Years | 3 (42.9%) | 7 (100.0%) |
| 65 to 74 Years | 16 (100.0%) | 6 (37.5%) |
| 75 Years and over | 15 (100.0%) | 13 (86.7%) |
| Total | 39 (63.9%) | 42 (68.9%) |
Disability Status by Sex by Age in Oakwood
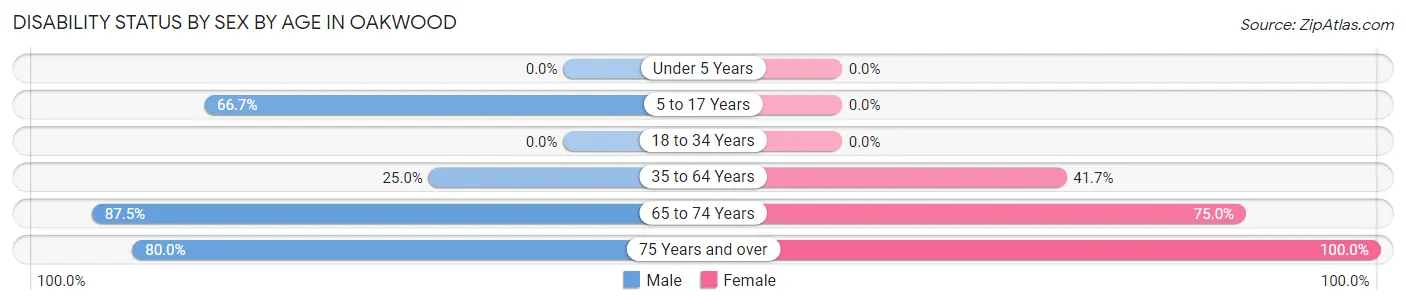
| Age Bracket | Male | Female |
| Under 5 Years | 0 (0.0%) | 0 (0.0%) |
| 5 to 17 Years | 2 (66.7%) | 0 (0.0%) |
| 18 to 34 Years | 0 (0.0%) | 0 (0.0%) |
| 35 to 64 Years | 2 (25.0%) | 5 (41.7%) |
| 65 to 74 Years | 7 (87.5%) | 6 (75.0%) |
| 75 Years and over | 8 (80.0%) | 5 (100.0%) |
Disability Class by Sex by Age in Oakwood
Disability Class: Hearing Difficulty
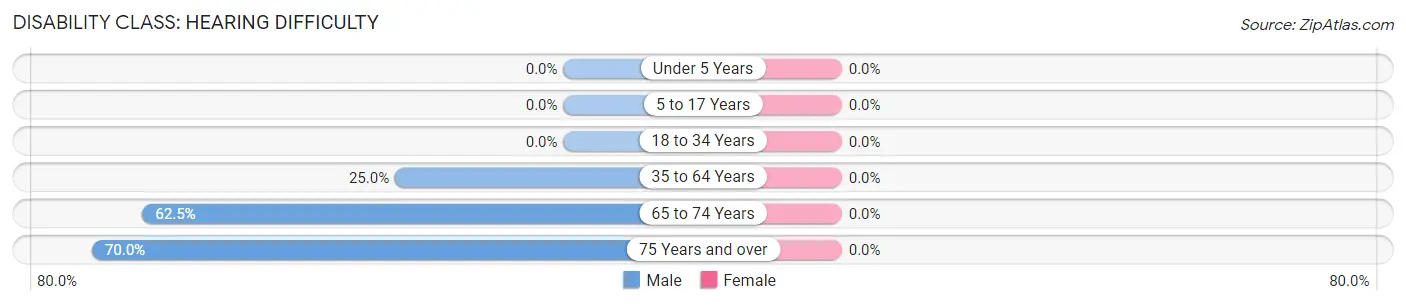
| Age Bracket | Male | Female |
| Under 5 Years | 0 (0.0%) | 0 (0.0%) |
| 5 to 17 Years | 0 (0.0%) | 0 (0.0%) |
| 18 to 34 Years | 0 (0.0%) | 0 (0.0%) |
| 35 to 64 Years | 2 (25.0%) | 0 (0.0%) |
| 65 to 74 Years | 5 (62.5%) | 0 (0.0%) |
| 75 Years and over | 7 (70.0%) | 0 (0.0%) |
Disability Class: Vision Difficulty
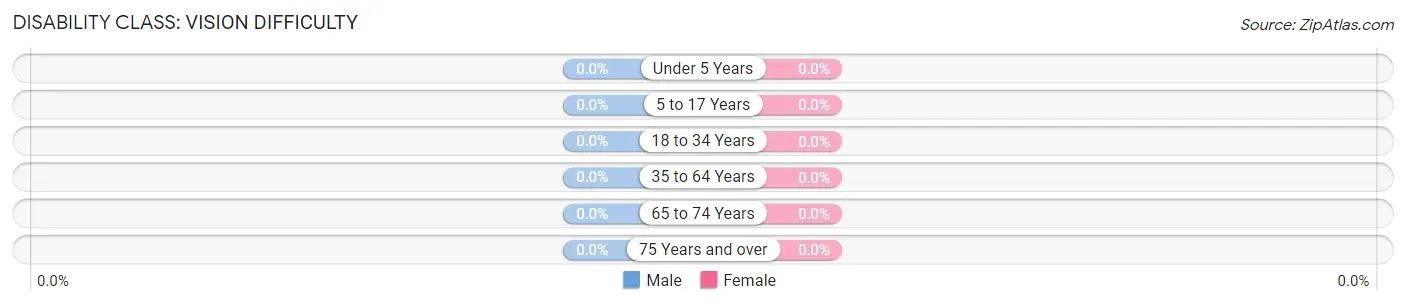
| Age Bracket | Male | Female |
| Under 5 Years | 0 (0.0%) | 0 (0.0%) |
| 5 to 17 Years | 0 (0.0%) | 0 (0.0%) |
| 18 to 34 Years | 0 (0.0%) | 0 (0.0%) |
| 35 to 64 Years | 0 (0.0%) | 0 (0.0%) |
| 65 to 74 Years | 0 (0.0%) | 0 (0.0%) |
| 75 Years and over | 0 (0.0%) | 0 (0.0%) |
Disability Class: Cognitive Difficulty
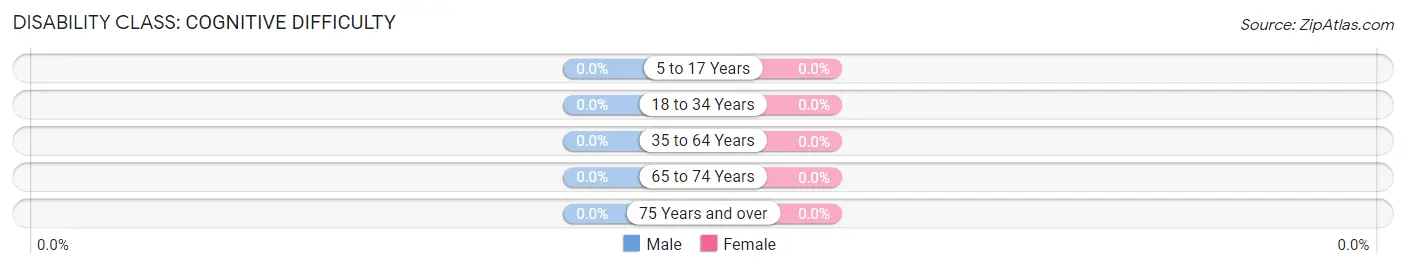
| Age Bracket | Male | Female |
| 5 to 17 Years | 0 (0.0%) | 0 (0.0%) |
| 18 to 34 Years | 0 (0.0%) | 0 (0.0%) |
| 35 to 64 Years | 0 (0.0%) | 0 (0.0%) |
| 65 to 74 Years | 0 (0.0%) | 0 (0.0%) |
| 75 Years and over | 0 (0.0%) | 0 (0.0%) |
Disability Class: Ambulatory Difficulty
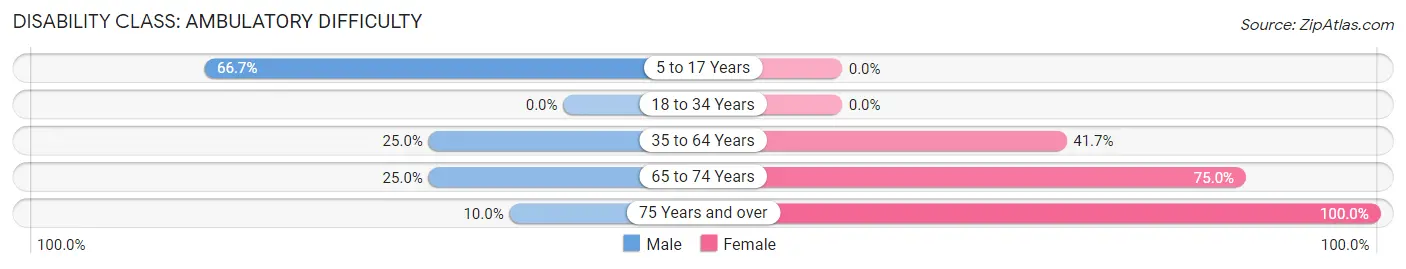
| Age Bracket | Male | Female |
| 5 to 17 Years | 2 (66.7%) | 0 (0.0%) |
| 18 to 34 Years | 0 (0.0%) | 0 (0.0%) |
| 35 to 64 Years | 2 (25.0%) | 5 (41.7%) |
| 65 to 74 Years | 2 (25.0%) | 6 (75.0%) |
| 75 Years and over | 1 (10.0%) | 5 (100.0%) |
Disability Class: Self-Care Difficulty
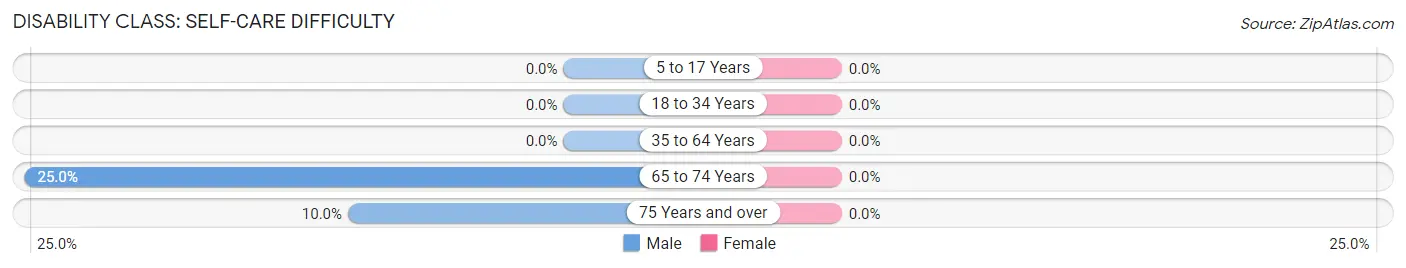
| Age Bracket | Male | Female |
| 5 to 17 Years | 0 (0.0%) | 0 (0.0%) |
| 18 to 34 Years | 0 (0.0%) | 0 (0.0%) |
| 35 to 64 Years | 0 (0.0%) | 0 (0.0%) |
| 65 to 74 Years | 2 (25.0%) | 0 (0.0%) |
| 75 Years and over | 1 (10.0%) | 0 (0.0%) |
Technology Access in Oakwood
Computing Device Access in Oakwood
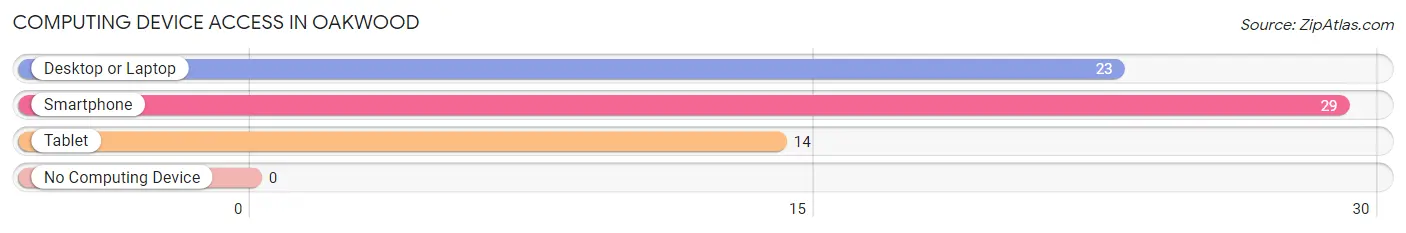
| Device Type | # Households | % Households |
| Desktop or Laptop | 23 | 74.2% |
| Smartphone | 29 | 93.5% |
| Tablet | 14 | 45.2% |
| No Computing Device | 0 | 0.0% |
| Total | 31 | 100.0% |
Internet Access in Oakwood
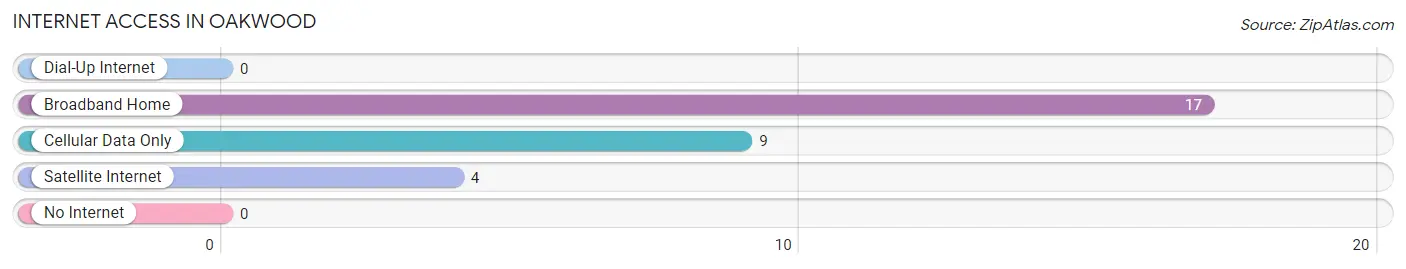
| Internet Type | # Households | % Households |
| Dial-Up Internet | 0 | 0.0% |
| Broadband Home | 17 | 54.8% |
| Cellular Data Only | 9 | 29.0% |
| Satellite Internet | 4 | 12.9% |
| No Internet | 0 | 0.0% |
| Total | 31 | 100.0% |
Oakwood Summary
Oakwood is a small town located in the state of Oklahoma, in the United States. It is situated in the northeastern part of the state, in the county of Pawnee. The town has a population of just over 500 people, and is located about 30 miles south of Tulsa.
History
Oakwood was founded in 1891 by a group of settlers from the nearby town of Pawnee. The town was originally called Oakwood Station, and was a stop on the Missouri, Kansas and Texas Railroad. The town was officially incorporated in 1901, and the name was changed to Oakwood.
The town grew slowly over the years, and by the 1950s, it had a population of around 500 people. The town was largely agricultural, with many of the residents working in the local cotton and wheat fields.
Geography
Oakwood is located in the northeastern part of Oklahoma, in the county of Pawnee. The town is situated on the banks of the Arkansas River, and is surrounded by rolling hills and wooded areas. The town is located about 30 miles south of Tulsa, and is accessible by both highway and rail.
The climate in Oakwood is generally mild, with temperatures ranging from the mid-30s in the winter to the mid-90s in the summer. The town receives an average of about 40 inches of precipitation each year, with most of it falling in the spring and summer months.
Economy
The economy of Oakwood is largely based on agriculture. The town is home to several farms, which produce cotton, wheat, and other crops. The town also has a few small businesses, including a grocery store, a hardware store, and a few restaurants.
The town is also home to a few manufacturing companies, which produce a variety of products, including furniture, clothing, and automotive parts.
Demographics
As of the 2010 census, the population of Oakwood was 514 people. The racial makeup of the town was 95.3% White, 0.6% African American, 0.4% Native American, 0.2% Asian, and 3.5% from other races. The median household income was $35,000, and the median age was 40 years.
Conclusion
Oakwood is a small town located in the northeastern part of Oklahoma. It has a population of just over 500 people, and is largely agricultural in nature. The town is home to several farms, as well as a few small businesses. The town is also home to a few manufacturing companies, which produce a variety of products. The town has a median household income of $35,000, and the median age is 40 years.
Common Questions
What is Per Capita Income in Oakwood?
Per Capita income in Oakwood is $32,592.
What is the Median Family Income in Oakwood?
Median Family Income in Oakwood is $78,393.
What is the Median Household income in Oakwood?
Median Household Income in Oakwood is $77,679.
What is Inequality or Gini Index in Oakwood?
Inequality or Gini Index in Oakwood is 0.34.
What is the Total Population of Oakwood?
Total Population of Oakwood is 61.
What is the Total Male Population of Oakwood?
Total Male Population of Oakwood is 34.
What is the Total Female Population of Oakwood?
Total Female Population of Oakwood is 27.
What is the Ratio of Males per 100 Females in Oakwood?
There are 125.93 Males per 100 Females in Oakwood.
What is the Ratio of Females per 100 Males in Oakwood?
There are 79.41 Females per 100 Males in Oakwood.
What is the Median Population Age in Oakwood?
Median Population Age in Oakwood is 65.5 Years.
What is the Average Family Size in Oakwood
Average Family Size in Oakwood is 2.4 People.
What is the Average Household Size in Oakwood
Average Household Size in Oakwood is 2.0 People.
How Large is the Labor Force in Oakwood?
There are 36 People in the Labor Forcein in Oakwood.
What is the Percentage of People in the Labor Force in Oakwood?
61.0% of People are in the Labor Force in Oakwood.
What is the Unemployment Rate in Oakwood?
Unemployment Rate in Oakwood is 2.8%.