Apache, OK Map & Demographics
Apache Map
Apache Overview
$24,831
PER CAPITA INCOME
$60,625
AVG FAMILY INCOME
$58,203
AVG HOUSEHOLD INCOME
42.6%
WAGE / INCOME GAP [ % ]
57.4¢/ $1
WAGE / INCOME GAP [ $ ]
0.39
INEQUALITY / GINI INDEX
1,065
TOTAL POPULATION
494
MALE POPULATION
571
FEMALE POPULATION
86.51
MALES / 100 FEMALES
115.59
FEMALES / 100 MALES
36.8
MEDIAN AGE
3.0
AVG FAMILY SIZE
2.6
AVG HOUSEHOLD SIZE
464
LABOR FORCE [ PEOPLE ]
51.0%
PERCENT IN LABOR FORCE
7.5%
UNEMPLOYMENT RATE
Apache Zip Codes
Apache Area Codes
Income in Apache
Income Overview in Apache
Per Capita Income in Apache is $24,831, while median incomes of families and households are $60,625 and $58,203 respectively.
| Characteristic | Number | Measure |
| Per Capita Income | 1,065 | $24,831 |
| Median Family Income | 301 | $60,625 |
| Mean Family Income | 301 | $66,823 |
| Median Household Income | 403 | $58,203 |
| Mean Household Income | 403 | $61,510 |
| Income Deficit | 301 | $0 |
| Wage / Income Gap (%) | 1,065 | 42.56% |
| Wage / Income Gap ($) | 1,065 | 57.44¢ per $1 |
| Gini / Inequality Index | 1,065 | 0.39 |
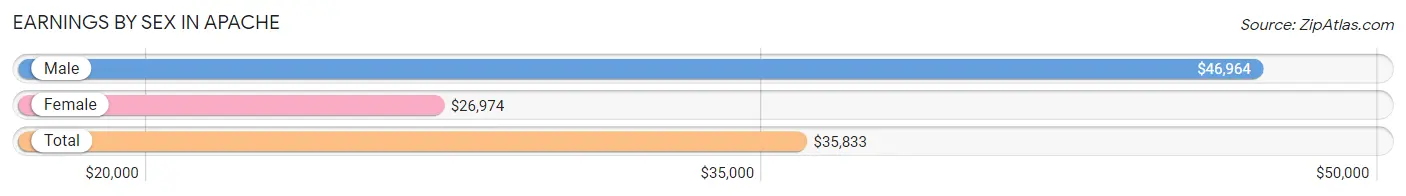
Earnings by Sex in Apache
Average Earnings in Apache are $35,833, $46,964 for men and $26,974 for women, a difference of 42.6%.
| Sex | Number | Average Earnings |
| Male | 190 (40.6%) | $46,964 |
| Female | 278 (59.4%) | $26,974 |
| Total | 468 (100.0%) | $35,833 |
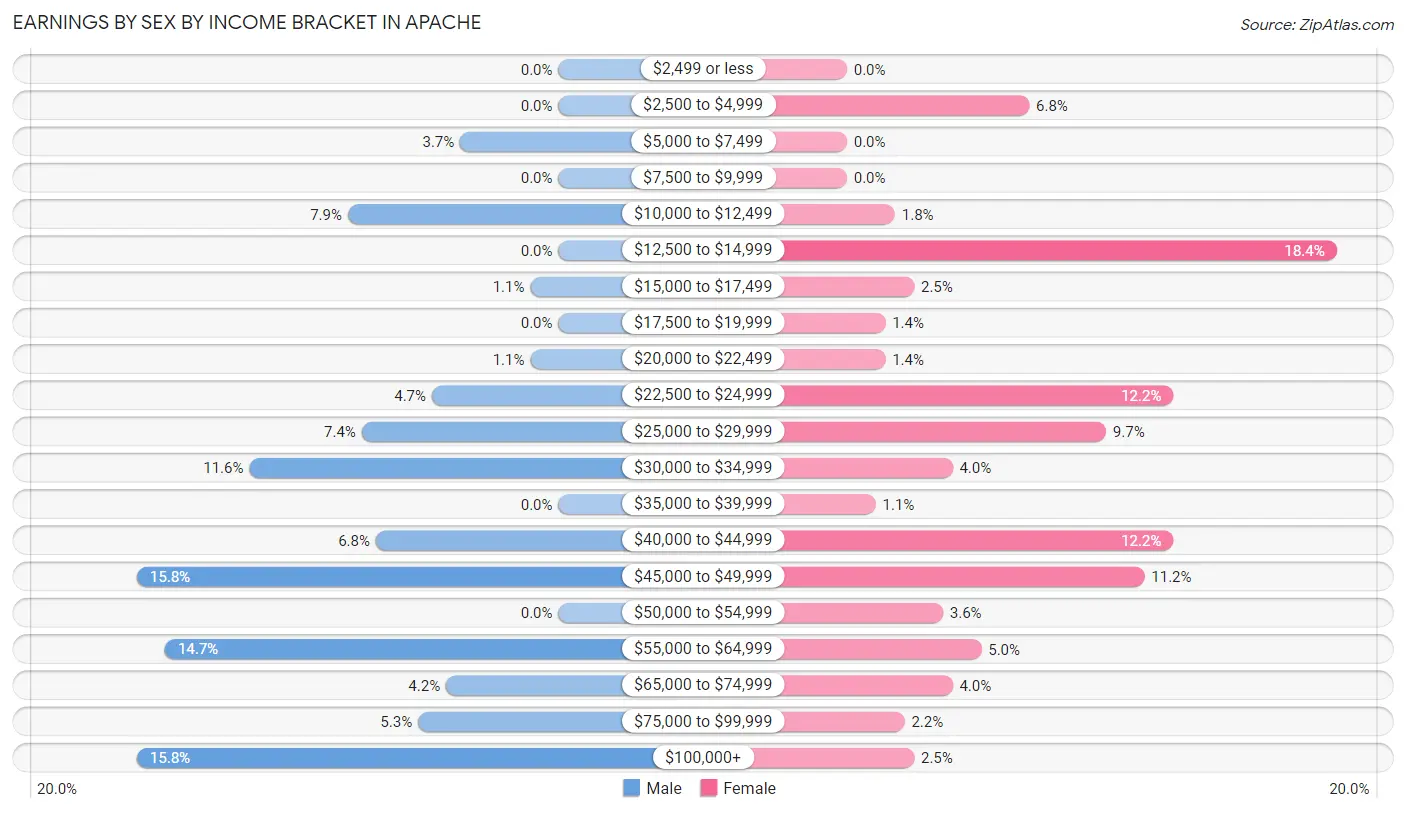
Earnings by Sex by Income Bracket in Apache
The most common earnings brackets in Apache are $45,000 to $49,999 for men (30 | 15.8%) and $12,500 to $14,999 for women (51 | 18.3%).
| Income | Male | Female |
| $2,499 or less | 0 (0.0%) | 0 (0.0%) |
| $2,500 to $4,999 | 0 (0.0%) | 19 (6.8%) |
| $5,000 to $7,499 | 7 (3.7%) | 0 (0.0%) |
| $7,500 to $9,999 | 0 (0.0%) | 0 (0.0%) |
| $10,000 to $12,499 | 15 (7.9%) | 5 (1.8%) |
| $12,500 to $14,999 | 0 (0.0%) | 51 (18.3%) |
| $15,000 to $17,499 | 2 (1.1%) | 7 (2.5%) |
| $17,500 to $19,999 | 0 (0.0%) | 4 (1.4%) |
| $20,000 to $22,499 | 2 (1.1%) | 4 (1.4%) |
| $22,500 to $24,999 | 9 (4.7%) | 34 (12.2%) |
| $25,000 to $29,999 | 14 (7.4%) | 27 (9.7%) |
| $30,000 to $34,999 | 22 (11.6%) | 11 (4.0%) |
| $35,000 to $39,999 | 0 (0.0%) | 3 (1.1%) |
| $40,000 to $44,999 | 13 (6.8%) | 34 (12.2%) |
| $45,000 to $49,999 | 30 (15.8%) | 31 (11.2%) |
| $50,000 to $54,999 | 0 (0.0%) | 10 (3.6%) |
| $55,000 to $64,999 | 28 (14.7%) | 14 (5.0%) |
| $65,000 to $74,999 | 8 (4.2%) | 11 (4.0%) |
| $75,000 to $99,999 | 10 (5.3%) | 6 (2.2%) |
| $100,000+ | 30 (15.8%) | 7 (2.5%) |
| Total | 190 (100.0%) | 278 (100.0%) |
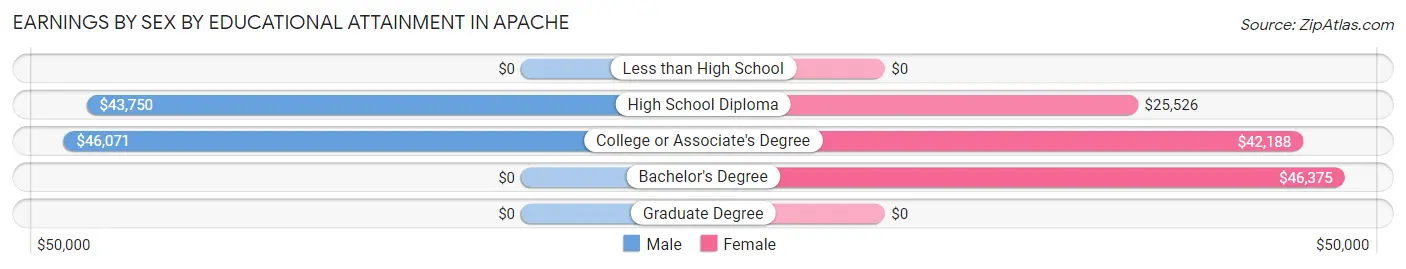
Earnings by Sex by Educational Attainment in Apache
Average earnings in Apache are $48,203 for men and $33,409 for women, a difference of 30.7%. Men with an educational attainment of college or associate's degree enjoy the highest average annual earnings of $46,071, while those with high school diploma education earn the least with $43,750. Women with an educational attainment of bachelor's degree earn the most with the average annual earnings of $46,375, while those with high school diploma education have the smallest earnings of $25,526.
| Educational Attainment | Male Income | Female Income |
| Less than High School | - | - |
| High School Diploma | $43,750 | $25,526 |
| College or Associate's Degree | $46,071 | $42,188 |
| Bachelor's Degree | - | - |
| Graduate Degree | - | - |
| Total | $48,203 | $33,409 |
Family Income in Apache
Family Income Brackets in Apache
According to the Apache family income data, there are 73 families falling into the $50,000 to $74,999 income range, which is the most common income bracket and makes up 24.2% of all families.
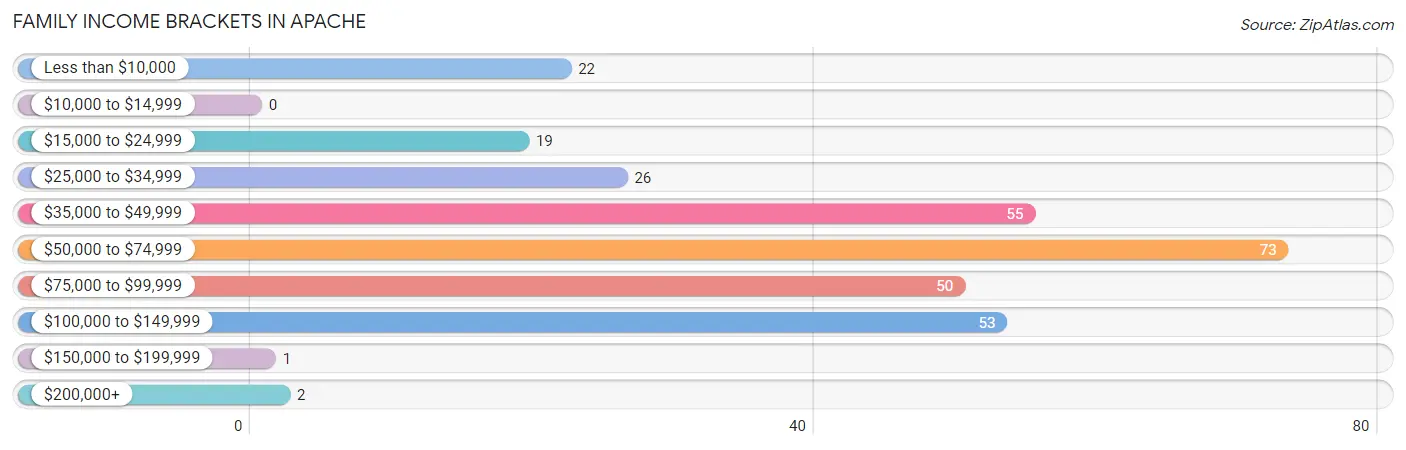
| Income Bracket | # Families | % Families |
| Less than $10,000 | 22 | 7.3% |
| $10,000 to $14,999 | 0 | 0.0% |
| $15,000 to $24,999 | 19 | 6.3% |
| $25,000 to $34,999 | 26 | 8.6% |
| $35,000 to $49,999 | 55 | 18.3% |
| $50,000 to $74,999 | 73 | 24.3% |
| $75,000 to $99,999 | 50 | 16.6% |
| $100,000 to $149,999 | 53 | 17.6% |
| $150,000 to $199,999 | 1 | 0.3% |
| $200,000+ | 2 | 0.7% |
Family Income by Famaliy Size in Apache
2-person families (170 | 56.5%) account for the highest median family income in Apache with $64,107 per family, while 2-person families (170 | 56.5%) have the highest median income of $32,054 per family member.
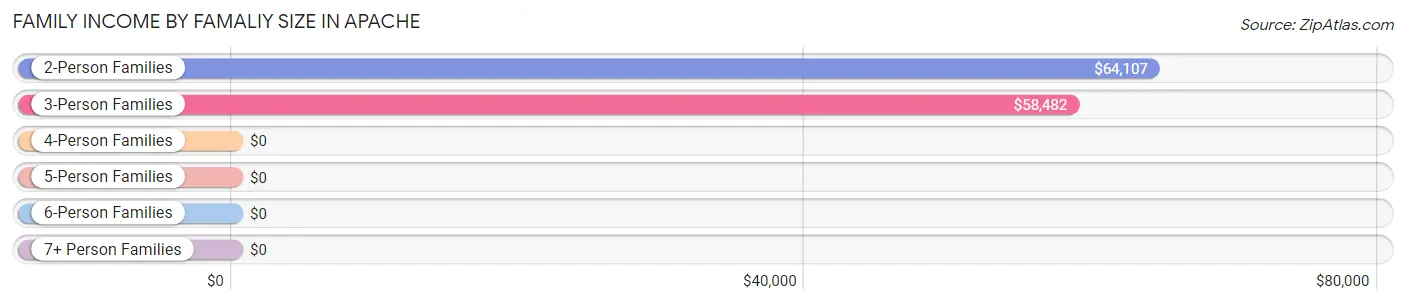
| Income Bracket | # Families | Median Income |
| 2-Person Families | 170 (56.5%) | $64,107 |
| 3-Person Families | 89 (29.6%) | $58,482 |
| 4-Person Families | 26 (8.6%) | $0 |
| 5-Person Families | 9 (3.0%) | $0 |
| 6-Person Families | 7 (2.3%) | $0 |
| 7+ Person Families | 0 (0.0%) | $0 |
| Total | 301 (100.0%) | $60,625 |
Family Income by Number of Earners in Apache
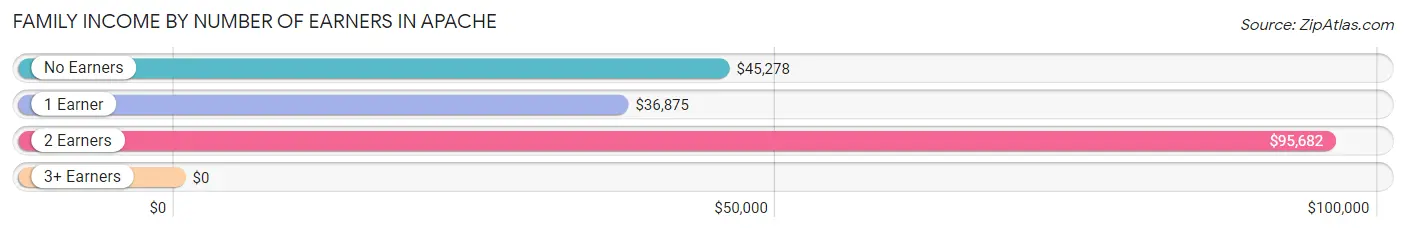
| Number of Earners | # Families | Median Income |
| No Earners | 82 (27.2%) | $45,278 |
| 1 Earner | 77 (25.6%) | $36,875 |
| 2 Earners | 140 (46.5%) | $95,682 |
| 3+ Earners | 2 (0.7%) | $0 |
| Total | 301 (100.0%) | $60,625 |
Household Income in Apache
Household Income Brackets in Apache
With 87 households falling in the category, the $50,000 to $74,999 income range is the most frequent in Apache, accounting for 21.6% of all households. In contrast, only 1 households (0.3%) fall into the $150,000 to $199,999 income bracket, making it the least populous group.
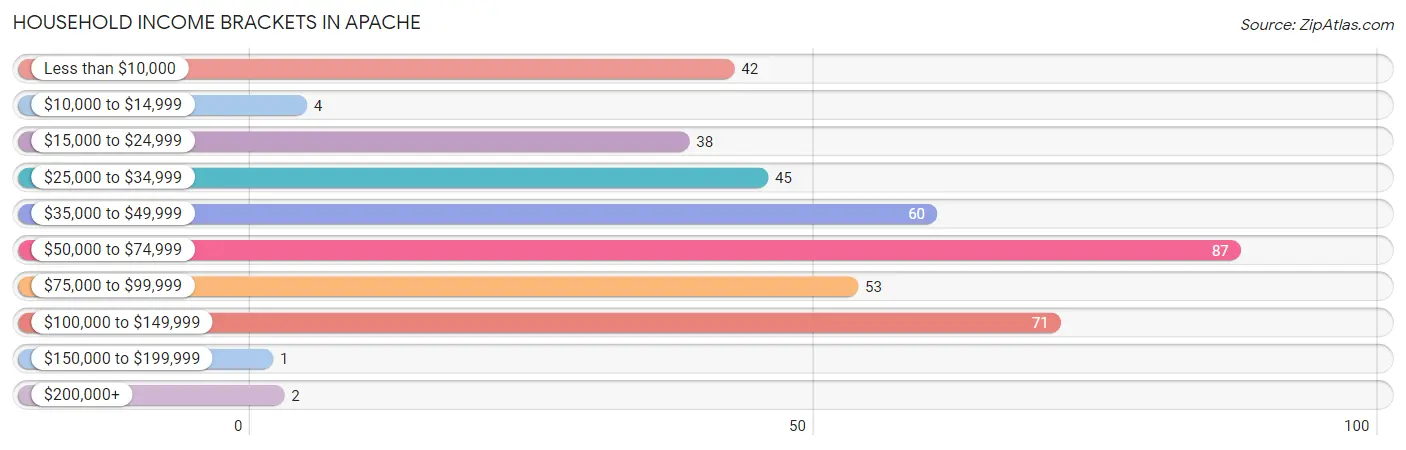
| Income Bracket | # Households | % Households |
| Less than $10,000 | 42 | 10.4% |
| $10,000 to $14,999 | 4 | 1.0% |
| $15,000 to $24,999 | 38 | 9.4% |
| $25,000 to $34,999 | 45 | 11.2% |
| $35,000 to $49,999 | 60 | 14.9% |
| $50,000 to $74,999 | 87 | 21.6% |
| $75,000 to $99,999 | 53 | 13.2% |
| $100,000 to $149,999 | 71 | 17.6% |
| $150,000 to $199,999 | 1 | 0.2% |
| $200,000+ | 2 | 0.5% |
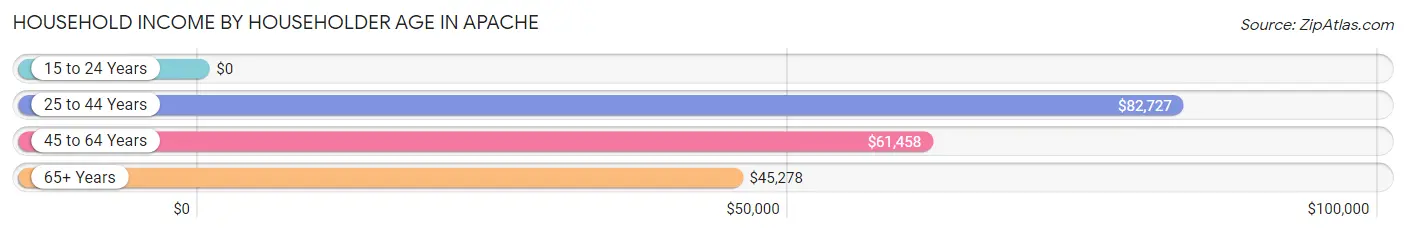
Household Income by Householder Age in Apache
The median household income in Apache is $58,203, with the highest median household income of $82,727 found in the 25 to 44 years age bracket for the primary householder. A total of 112 households (27.8%) fall into this category.
| Income Bracket | # Households | Median Income |
| 15 to 24 Years | 0 (0.0%) | $0 |
| 25 to 44 Years | 112 (27.8%) | $82,727 |
| 45 to 64 Years | 175 (43.4%) | $61,458 |
| 65+ Years | 116 (28.8%) | $45,278 |
| Total | 403 (100.0%) | $58,203 |
Poverty in Apache
Income Below Poverty by Sex and Age in Apache
With 28.5% poverty level for males and 19.8% for females among the residents of Apache, 16 and 17 year old males and 15 year old females are the most vulnerable to poverty, with 20 males (100.0%) and 10 females (100.0%) in their respective age groups living below the poverty level.
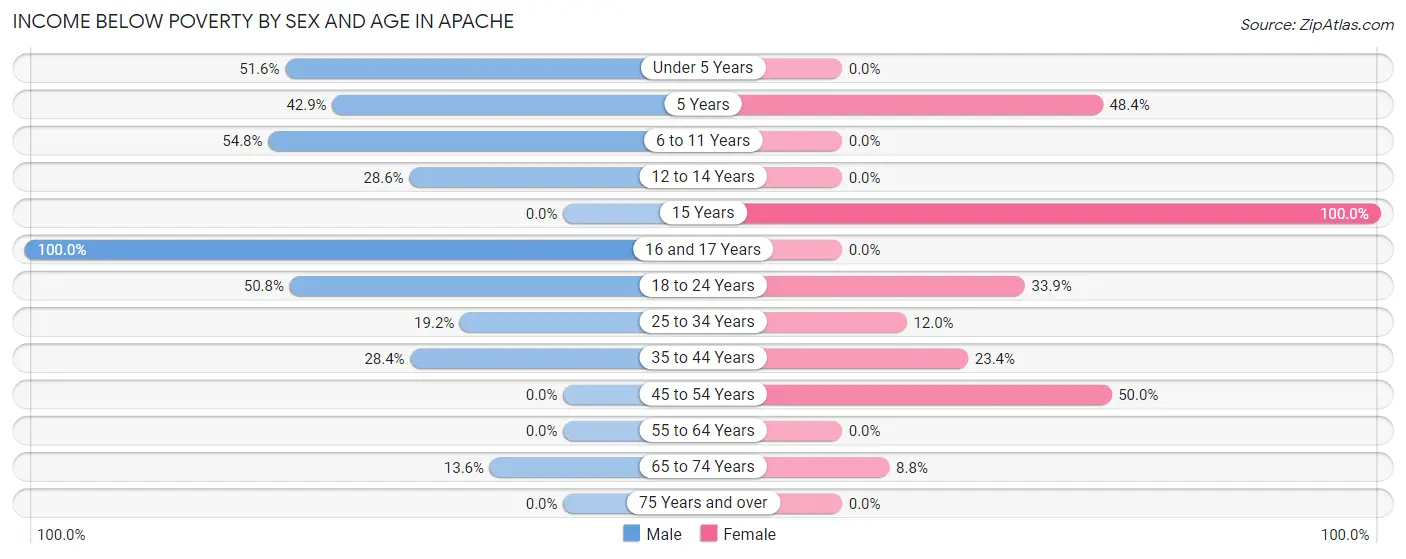
| Age Bracket | Male | Female |
| Under 5 Years | 16 (51.6%) | 0 (0.0%) |
| 5 Years | 3 (42.9%) | 15 (48.4%) |
| 6 to 11 Years | 23 (54.8%) | 0 (0.0%) |
| 12 to 14 Years | 4 (28.6%) | 0 (0.0%) |
| 15 Years | 0 (0.0%) | 10 (100.0%) |
| 16 and 17 Years | 20 (100.0%) | 0 (0.0%) |
| 18 to 24 Years | 33 (50.8%) | 19 (33.9%) |
| 25 to 34 Years | 18 (19.2%) | 15 (12.0%) |
| 35 to 44 Years | 21 (28.4%) | 11 (23.4%) |
| 45 to 54 Years | 0 (0.0%) | 35 (50.0%) |
| 55 to 64 Years | 0 (0.0%) | 0 (0.0%) |
| 65 to 74 Years | 3 (13.6%) | 8 (8.8%) |
| 75 Years and over | 0 (0.0%) | 0 (0.0%) |
| Total | 141 (28.5%) | 113 (19.8%) |
Income Above Poverty by Sex and Age in Apache
According to the poverty statistics in Apache, males aged 45 to 54 years and females aged under 5 years are the age groups that are most secure financially, with 100.0% of males and 100.0% of females in these age groups living above the poverty line.
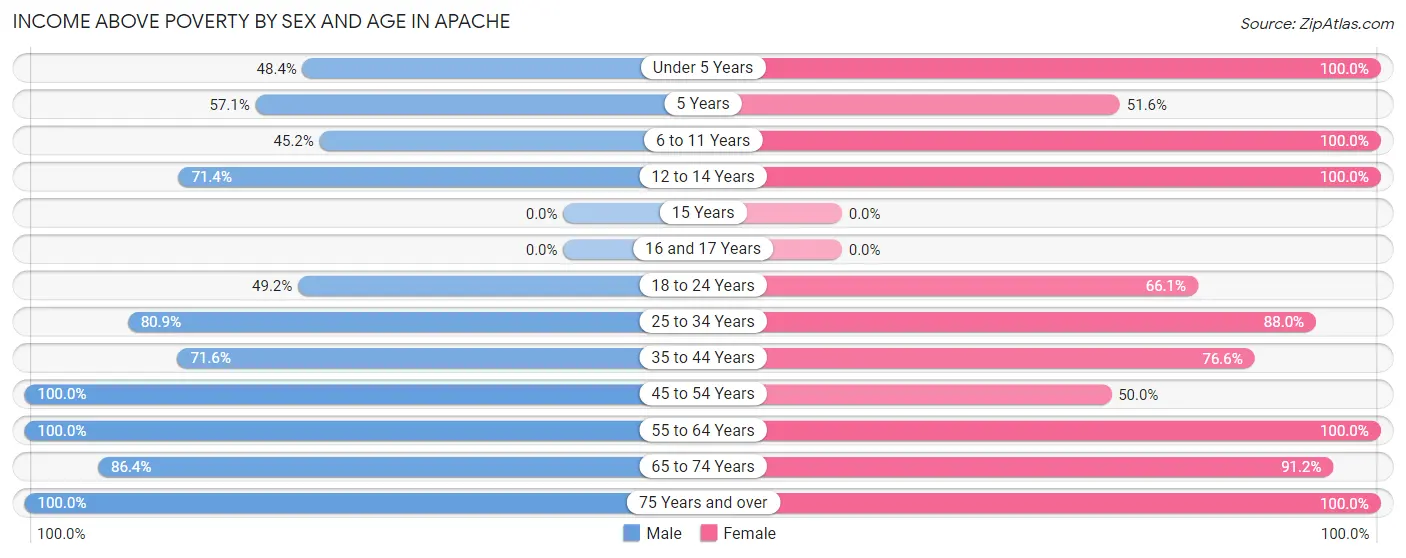
| Age Bracket | Male | Female |
| Under 5 Years | 15 (48.4%) | 8 (100.0%) |
| 5 Years | 4 (57.1%) | 16 (51.6%) |
| 6 to 11 Years | 19 (45.2%) | 6 (100.0%) |
| 12 to 14 Years | 10 (71.4%) | 7 (100.0%) |
| 15 Years | 0 (0.0%) | 0 (0.0%) |
| 16 and 17 Years | 0 (0.0%) | 0 (0.0%) |
| 18 to 24 Years | 32 (49.2%) | 37 (66.1%) |
| 25 to 34 Years | 76 (80.8%) | 110 (88.0%) |
| 35 to 44 Years | 53 (71.6%) | 36 (76.6%) |
| 45 to 54 Years | 48 (100.0%) | 35 (50.0%) |
| 55 to 64 Years | 49 (100.0%) | 69 (100.0%) |
| 65 to 74 Years | 19 (86.4%) | 83 (91.2%) |
| 75 Years and over | 28 (100.0%) | 51 (100.0%) |
| Total | 353 (71.5%) | 458 (80.2%) |
Income Below Poverty Among Married-Couple Families in Apache
The poverty statistics for married-couple families in Apache show that 9.7% or 19 of the total 195 families live below the poverty line. Families with 3 or 4 children have the highest poverty rate of 50.0%, comprising of 7 families. On the other hand, families with 1 or 2 children have the lowest poverty rate of 0.0%, which includes 0 families.
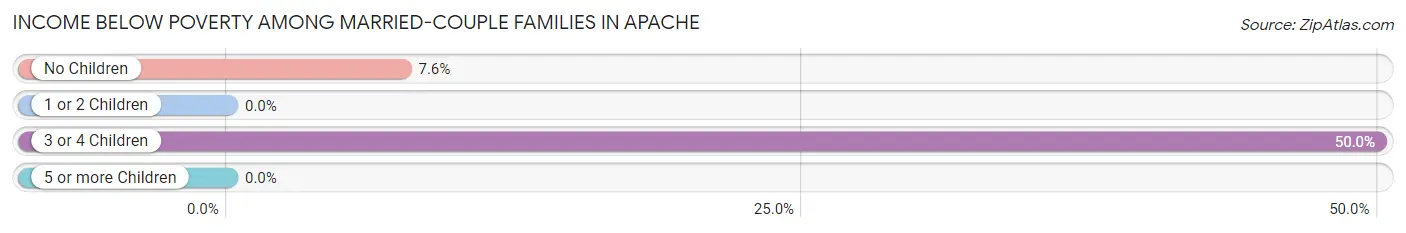
| Children | Above Poverty | Below Poverty |
| No Children | 147 (92.4%) | 12 (7.5%) |
| 1 or 2 Children | 22 (100.0%) | 0 (0.0%) |
| 3 or 4 Children | 7 (50.0%) | 7 (50.0%) |
| 5 or more Children | 0 (0.0%) | 0 (0.0%) |
| Total | 176 (90.3%) | 19 (9.7%) |
Income Below Poverty Among Single-Parent Households in Apache
According to the poverty data in Apache, 40.9% or 9 single-father households and 23.8% or 20 single-mother households are living below the poverty line. Among single-father households, those with 1 or 2 children have the highest poverty rate, with 9 households (100.0%) experiencing poverty. Likewise, among single-mother households, those with 3 or 4 children have the highest poverty rate, with 7 households (100.0%) falling below the poverty line.
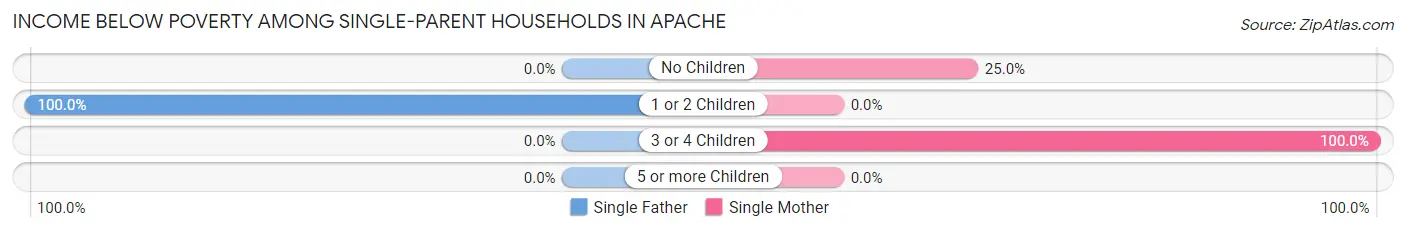
| Children | Single Father | Single Mother |
| No Children | 0 (0.0%) | 13 (25.0%) |
| 1 or 2 Children | 9 (100.0%) | 0 (0.0%) |
| 3 or 4 Children | 0 (0.0%) | 7 (100.0%) |
| 5 or more Children | 0 (0.0%) | 0 (0.0%) |
| Total | 9 (40.9%) | 20 (23.8%) |
Income Below Poverty Among Married-Couple vs Single-Parent Households in Apache
The poverty data for Apache shows that 19 of the married-couple family households (9.7%) and 29 of the single-parent households (27.4%) are living below the poverty level. Within the married-couple family households, those with 3 or 4 children have the highest poverty rate, with 7 households (50.0%) falling below the poverty line. Among the single-parent households, those with 3 or 4 children have the highest poverty rate, with 7 household (63.6%) living below poverty.
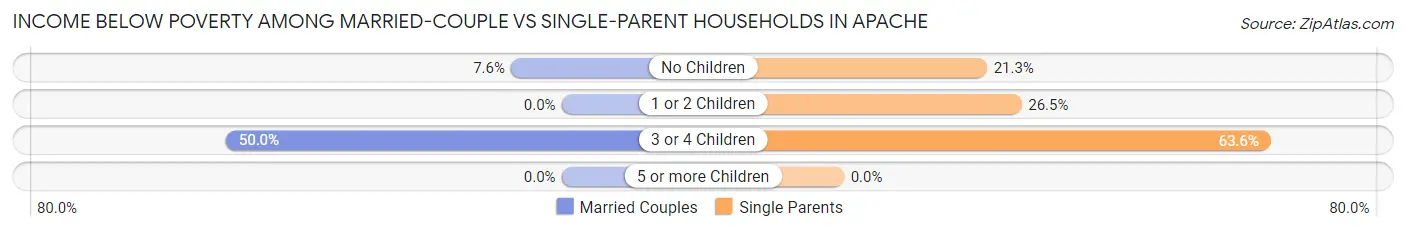
| Children | Married-Couple Families | Single-Parent Households |
| No Children | 12 (7.5%) | 13 (21.3%) |
| 1 or 2 Children | 0 (0.0%) | 9 (26.5%) |
| 3 or 4 Children | 7 (50.0%) | 7 (63.6%) |
| 5 or more Children | 0 (0.0%) | 0 (0.0%) |
| Total | 19 (9.7%) | 29 (27.4%) |
Race in Apache
The most populous races in Apache are White / Caucasian (589 | 55.3%), Native / Alaskan (424 | 39.8%), and Hispanic or Latino (40 | 3.8%).
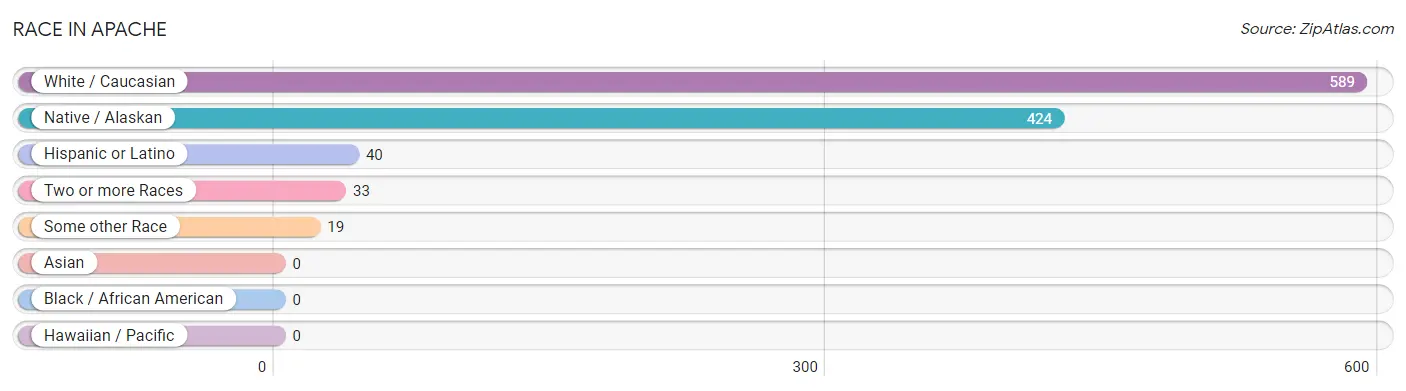
| Race | # Population | % Population |
| Asian | 0 | 0.0% |
| Black / African American | 0 | 0.0% |
| Hawaiian / Pacific | 0 | 0.0% |
| Hispanic or Latino | 40 | 3.8% |
| Native / Alaskan | 424 | 39.8% |
| White / Caucasian | 589 | 55.3% |
| Two or more Races | 33 | 3.1% |
| Some other Race | 19 | 1.8% |
| Total | 1,065 | 100.0% |
Ancestry in Apache
The most populous ancestries reported in Apache are Comanche (186 | 17.5%), Apache (175 | 16.4%), German (129 | 12.1%), English (63 | 5.9%), and Irish (62 | 5.8%), together accounting for 57.7% of all Apache residents.
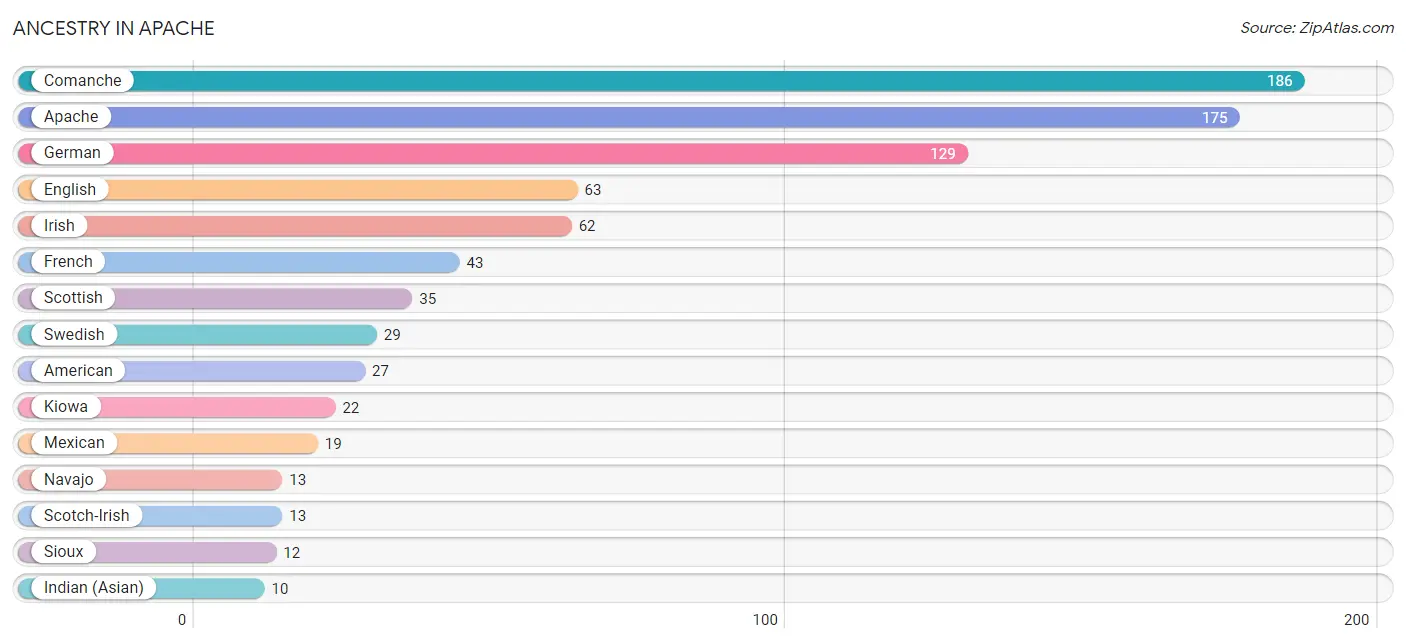
| Ancestry | # Population | % Population |
| American | 27 | 2.5% |
| Apache | 175 | 16.4% |
| Cherokee | 3 | 0.3% |
| Chickasaw | 2 | 0.2% |
| Choctaw | 9 | 0.9% |
| Comanche | 186 | 17.5% |
| Czech | 4 | 0.4% |
| Delaware | 2 | 0.2% |
| Dutch | 6 | 0.6% |
| English | 63 | 5.9% |
| French | 43 | 4.0% |
| German | 129 | 12.1% |
| Hopi | 7 | 0.7% |
| Indian (Asian) | 10 | 0.9% |
| Irish | 62 | 5.8% |
| Kiowa | 22 | 2.1% |
| Mexican | 19 | 1.8% |
| Navajo | 13 | 1.2% |
| Scotch-Irish | 13 | 1.2% |
| Scottish | 35 | 3.3% |
| Sioux | 12 | 1.1% |
| Swedish | 29 | 2.7% |
| Swiss | 8 | 0.7% |
| Welsh | 3 | 0.3% | View All 24 Rows |
Immigrants in Apache

| Immigration Origin | # Population | % Population | View All 0 Rows |
Sex and Age in Apache
Sex and Age in Apache
The most populous age groups in Apache are 25 to 29 Years (73 | 14.8%) for men and 25 to 29 Years (70 | 12.3%) for women.
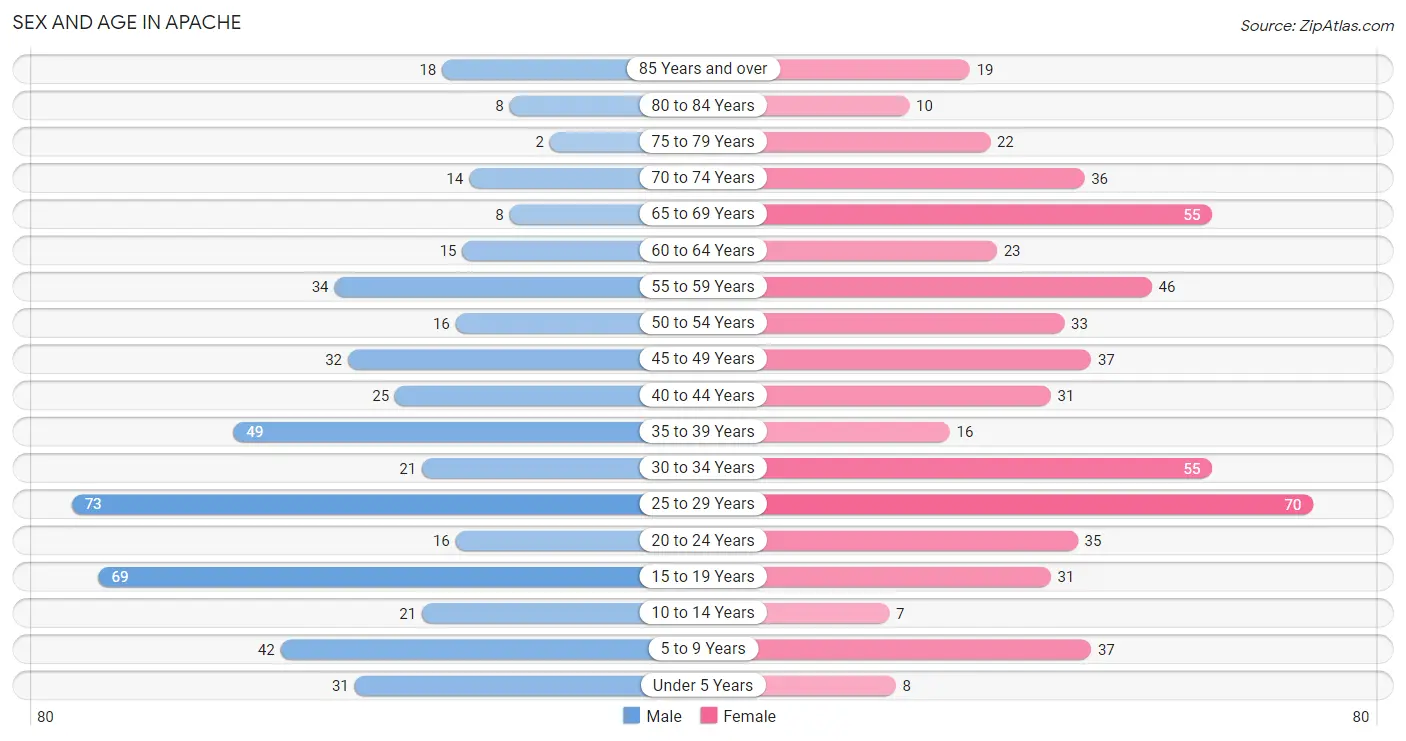
| Age Bracket | Male | Female |
| Under 5 Years | 31 (6.3%) | 8 (1.4%) |
| 5 to 9 Years | 42 (8.5%) | 37 (6.5%) |
| 10 to 14 Years | 21 (4.3%) | 7 (1.2%) |
| 15 to 19 Years | 69 (14.0%) | 31 (5.4%) |
| 20 to 24 Years | 16 (3.2%) | 35 (6.1%) |
| 25 to 29 Years | 73 (14.8%) | 70 (12.3%) |
| 30 to 34 Years | 21 (4.3%) | 55 (9.6%) |
| 35 to 39 Years | 49 (9.9%) | 16 (2.8%) |
| 40 to 44 Years | 25 (5.1%) | 31 (5.4%) |
| 45 to 49 Years | 32 (6.5%) | 37 (6.5%) |
| 50 to 54 Years | 16 (3.2%) | 33 (5.8%) |
| 55 to 59 Years | 34 (6.9%) | 46 (8.1%) |
| 60 to 64 Years | 15 (3.0%) | 23 (4.0%) |
| 65 to 69 Years | 8 (1.6%) | 55 (9.6%) |
| 70 to 74 Years | 14 (2.8%) | 36 (6.3%) |
| 75 to 79 Years | 2 (0.4%) | 22 (3.8%) |
| 80 to 84 Years | 8 (1.6%) | 10 (1.8%) |
| 85 Years and over | 18 (3.6%) | 19 (3.3%) |
| Total | 494 (100.0%) | 571 (100.0%) |
Families and Households in Apache
Median Family Size in Apache
The median family size in Apache is 3.05 persons per family, with single female/mother families (84 | 27.9%) accounting for the largest median family size of 3.54 persons per family. On the other hand, married-couple families (195 | 64.8%) represent the smallest median family size with 2.85 persons per family.
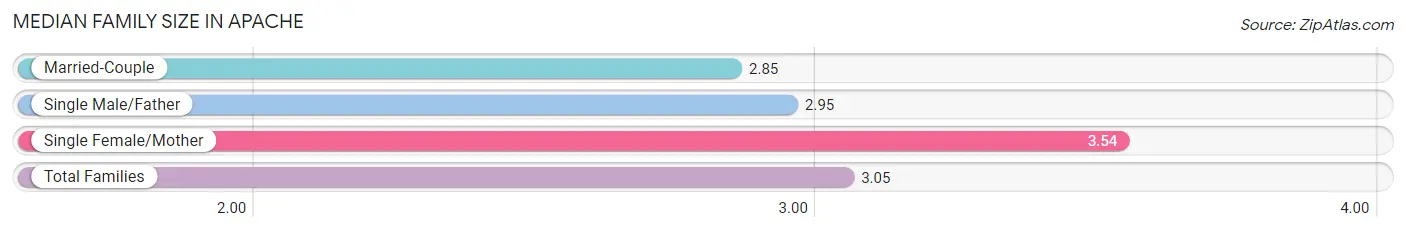
| Family Type | # Families | Family Size |
| Married-Couple | 195 (64.8%) | 2.85 |
| Single Male/Father | 22 (7.3%) | 2.95 |
| Single Female/Mother | 84 (27.9%) | 3.54 |
| Total Families | 301 (100.0%) | 3.05 |
Median Household Size in Apache
The median household size in Apache is 2.64 persons per household, with single female/mother households (84 | 20.8%) accounting for the largest median household size of 3.54 persons per household. non-family households (102 | 25.3%) represent the smallest median household size with 1.33 persons per household.
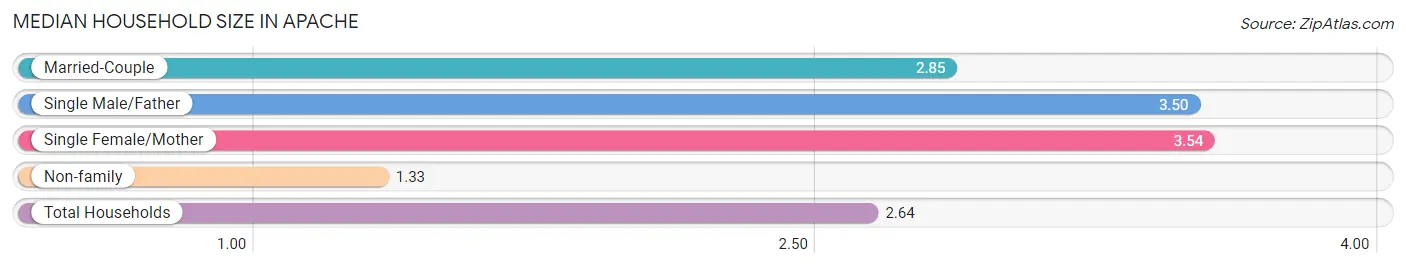
| Household Type | # Households | Household Size |
| Married-Couple | 195 (48.4%) | 2.85 |
| Single Male/Father | 22 (5.5%) | 3.50 |
| Single Female/Mother | 84 (20.8%) | 3.54 |
| Non-family | 102 (25.3%) | 1.33 |
| Total Households | 403 (100.0%) | 2.64 |
Household Size by Marriage Status in Apache
Out of a total of 403 households in Apache, 301 (74.7%) are family households, while 102 (25.3%) are nonfamily households. The most numerous type of family households are 2-person households, comprising 170, and the most common type of nonfamily households are 1-person households, comprising 80.
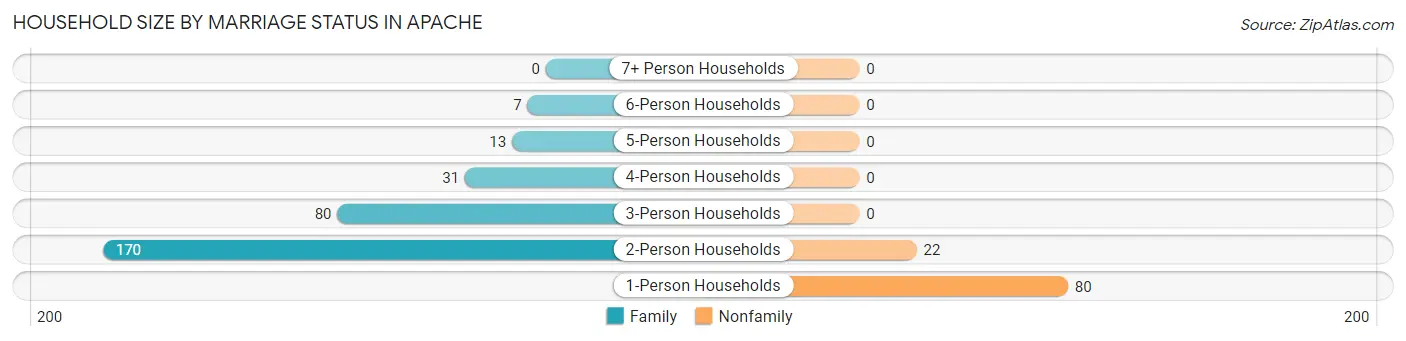
| Household Size | Family Households | Nonfamily Households |
| 1-Person Households | - | 80 (19.9%) |
| 2-Person Households | 170 (42.2%) | 22 (5.5%) |
| 3-Person Households | 80 (19.9%) | 0 (0.0%) |
| 4-Person Households | 31 (7.7%) | 0 (0.0%) |
| 5-Person Households | 13 (3.2%) | 0 (0.0%) |
| 6-Person Households | 7 (1.7%) | 0 (0.0%) |
| 7+ Person Households | 0 (0.0%) | 0 (0.0%) |
| Total | 301 (74.7%) | 102 (25.3%) |
Female Fertility in Apache
Fertility by Age in Apache
Average fertility rate in Apache is 126.0 births per 1,000 women. Women in the age bracket of 20 to 34 years have the highest fertility rate with 225.0 births per 1,000 women. Women in the age bracket of 20 to 34 years acount for 100.0% of all women with births.
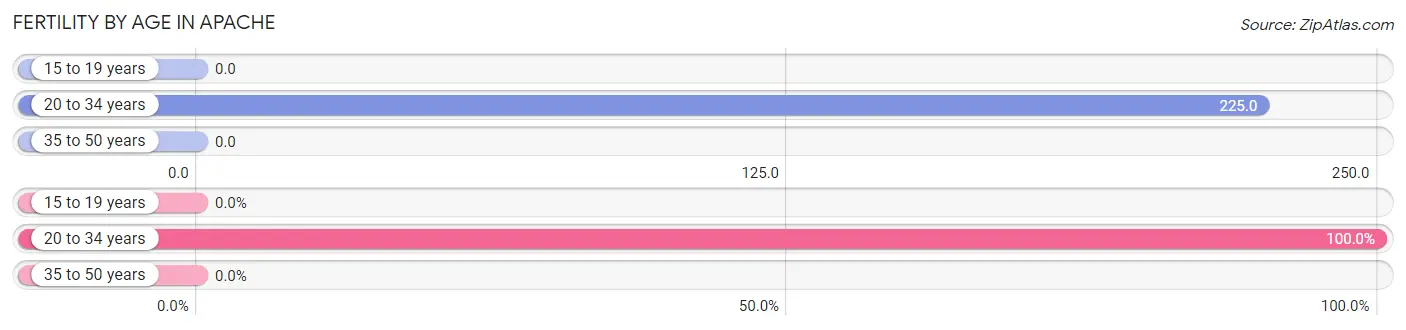
| Age Bracket | Women with Births | Births / 1,000 Women |
| 15 to 19 years | 0 (0.0%) | 0.0 |
| 20 to 34 years | 36 (100.0%) | 225.0 |
| 35 to 50 years | 0 (0.0%) | 0.0 |
| Total | 36 (100.0%) | 126.0 |
Fertility by Age by Marriage Status in Apache
94.4% of women with births (36) in Apache are married. The highest percentage of unmarried women with births falls into 20 to 34 years age bracket with 5.6% of them unmarried at the time of birth, while the lowest percentage of unmarried women with births belong to 20 to 34 years age bracket with 5.6% of them unmarried.
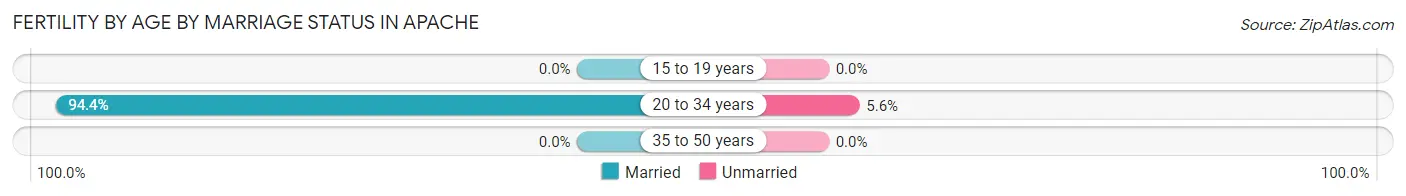
| Age Bracket | Married | Unmarried |
| 15 to 19 years | 0 (0.0%) | 0 (0.0%) |
| 20 to 34 years | 34 (94.4%) | 2 (5.6%) |
| 35 to 50 years | 0 (0.0%) | 0 (0.0%) |
| Total | 34 (94.4%) | 2 (5.6%) |
Fertility by Education in Apache
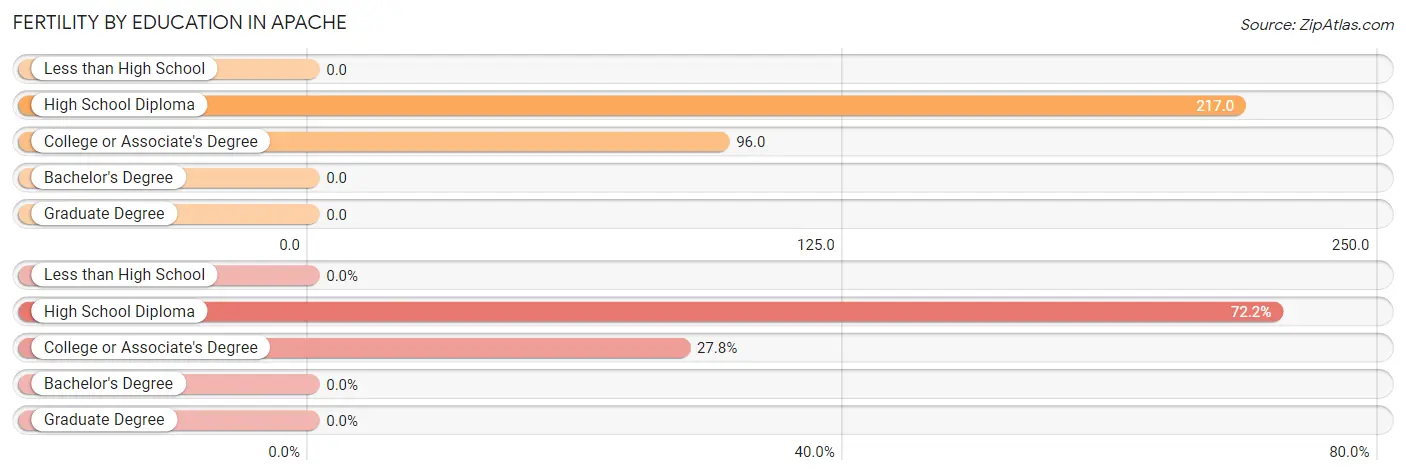
| Educational Attainment | Women with Births | Births / 1,000 Women |
| Less than High School | 0 (0.0%) | 0.0 |
| High School Diploma | 26 (72.2%) | 217.0 |
| College or Associate's Degree | 10 (27.8%) | 96.0 |
| Bachelor's Degree | 0 (0.0%) | 0.0 |
| Graduate Degree | 0 (0.0%) | 0.0 |
| Total | 36 (100.0%) | 126.0 |
Fertility by Education by Marriage Status in Apache
5.6% of women with births in Apache are unmarried. Women with the educational attainment of high school diploma are most likely to be married with 100.0% of them married at childbirth, while women with the educational attainment of college or associate's degree are least likely to be married with 20.0% of them unmarried at childbirth.
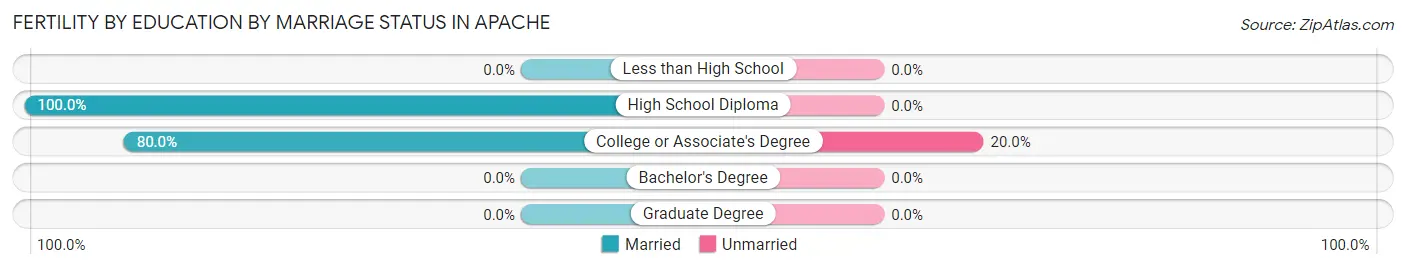
| Educational Attainment | Married | Unmarried |
| Less than High School | 0 (0.0%) | 0 (0.0%) |
| High School Diploma | 26 (100.0%) | 0 (0.0%) |
| College or Associate's Degree | 8 (80.0%) | 2 (20.0%) |
| Bachelor's Degree | 0 (0.0%) | 0 (0.0%) |
| Graduate Degree | 0 (0.0%) | 0 (0.0%) |
| Total | 34 (94.4%) | 2 (5.6%) |
Employment Characteristics in Apache
Employment by Class of Employer in Apache
Among the 420 employed individuals in Apache, private company employees (227 | 54.0%), local government employees (82 | 19.5%), and state government employees (50 | 11.9%) make up the most common classes of employment.
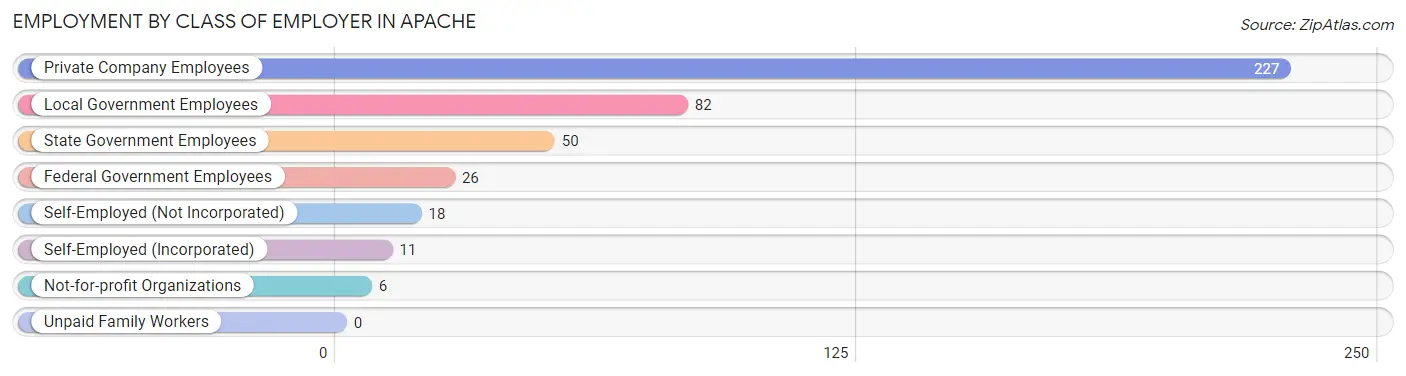
| Employer Class | # Employees | % Employees |
| Private Company Employees | 227 | 54.0% |
| Self-Employed (Incorporated) | 11 | 2.6% |
| Self-Employed (Not Incorporated) | 18 | 4.3% |
| Not-for-profit Organizations | 6 | 1.4% |
| Local Government Employees | 82 | 19.5% |
| State Government Employees | 50 | 11.9% |
| Federal Government Employees | 26 | 6.2% |
| Unpaid Family Workers | 0 | 0.0% |
| Total | 420 | 100.0% |
Employment Status by Age in Apache
According to the labor force statistics for Apache, out of the total population over 16 years of age (909), 51.0% or 464 individuals are in the labor force, with 7.5% or 35 of them unemployed. The age group with the highest labor force participation rate is 25 to 29 years, with 95.1% or 136 individuals in the labor force. Within the labor force, the 25 to 29 years age range has the highest percentage of unemployed individuals, with 17.6% or 24 of them being unemployed.
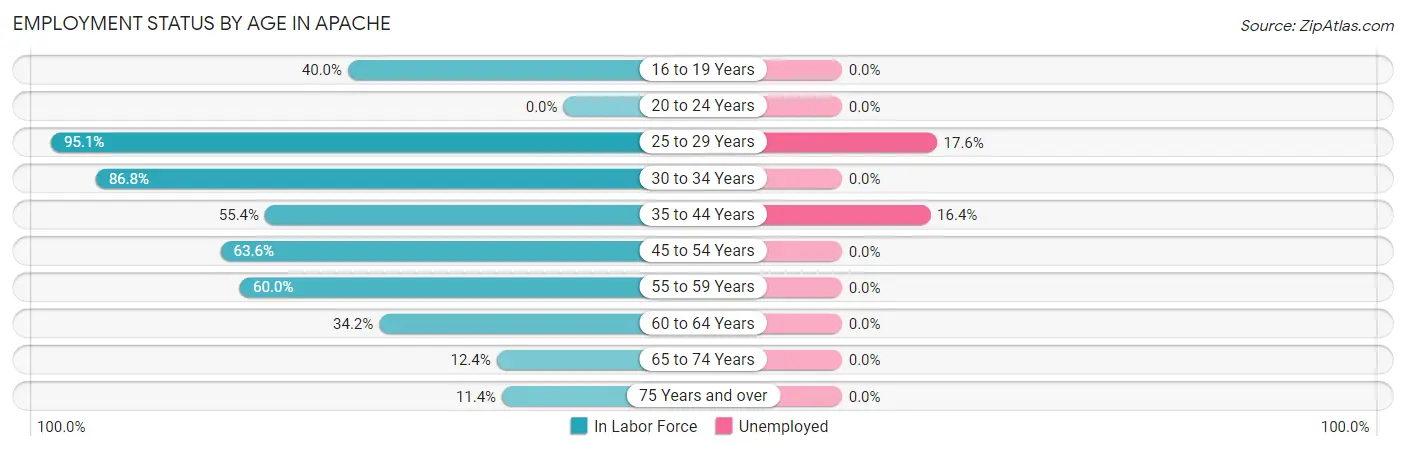
| Age Bracket | In Labor Force | Unemployed |
| 16 to 19 Years | 36 (40.0%) | 0 (0.0%) |
| 20 to 24 Years | 0 (0.0%) | 0 (0.0%) |
| 25 to 29 Years | 136 (95.1%) | 24 (17.6%) |
| 30 to 34 Years | 66 (86.8%) | 0 (0.0%) |
| 35 to 44 Years | 67 (55.4%) | 11 (16.4%) |
| 45 to 54 Years | 75 (63.6%) | 0 (0.0%) |
| 55 to 59 Years | 48 (60.0%) | 0 (0.0%) |
| 60 to 64 Years | 13 (34.2%) | 0 (0.0%) |
| 65 to 74 Years | 14 (12.4%) | 0 (0.0%) |
| 75 Years and over | 9 (11.4%) | 0 (0.0%) |
| Total | 464 (51.0%) | 35 (7.5%) |
Employment Status by Educational Attainment in Apache
According to labor force statistics for Apache, 70.3% of individuals (405) out of the total population between 25 and 64 years of age (576) are in the labor force, with 8.6% or 35 of them being unemployed. The group with the highest labor force participation rate are those with the educational attainment of bachelor's degree or higher, with 93.3% or 56 individuals in the labor force. Within the labor force, individuals with less than high school education have the highest percentage of unemployment, with 100.0% or 11 of them being unemployed.
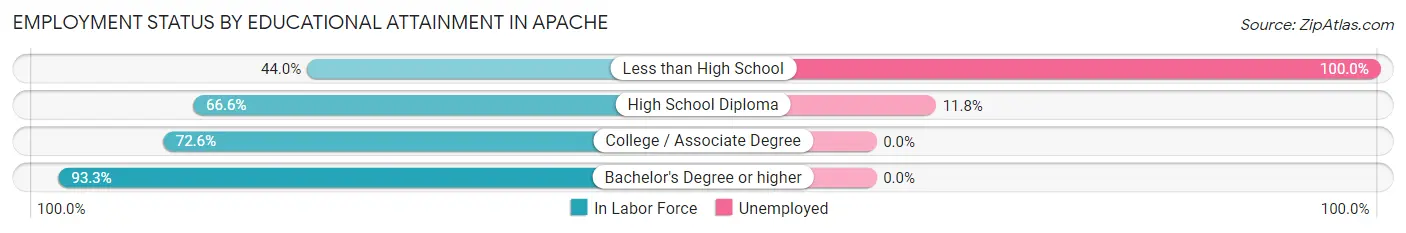
| Educational Attainment | In Labor Force | Unemployed |
| Less than High School | 11 (44.0%) | 25 (100.0%) |
| High School Diploma | 203 (66.6%) | 36 (11.8%) |
| College / Associate Degree | 135 (72.6%) | 0 (0.0%) |
| Bachelor's Degree or higher | 56 (93.3%) | 0 (0.0%) |
| Total | 405 (70.3%) | 50 (8.6%) |
Employment Occupations by Sex in Apache
Management, Business, Science and Arts Occupations
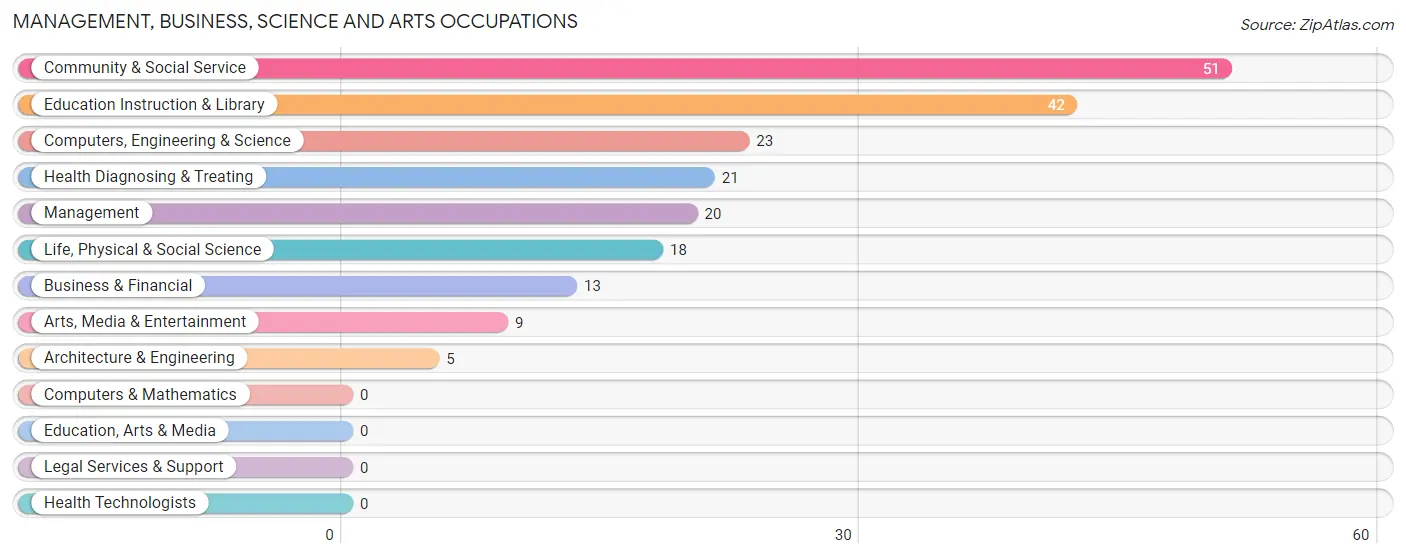
The most common Management, Business, Science and Arts occupations in Apache are Community & Social Service (51 | 11.9%), Education Instruction & Library (42 | 9.8%), Computers, Engineering & Science (23 | 5.4%), Health Diagnosing & Treating (21 | 4.9%), and Management (20 | 4.7%).
Management, Business, Science and Arts Occupations by Sex
Within the Management, Business, Science and Arts occupations in Apache, the most male-oriented occupations are Computers, Engineering & Science (100.0%), Architecture & Engineering (100.0%), and Life, Physical & Social Science (100.0%), while the most female-oriented occupations are Business & Financial (100.0%), Health Diagnosing & Treating (100.0%), and Education Instruction & Library (59.5%).
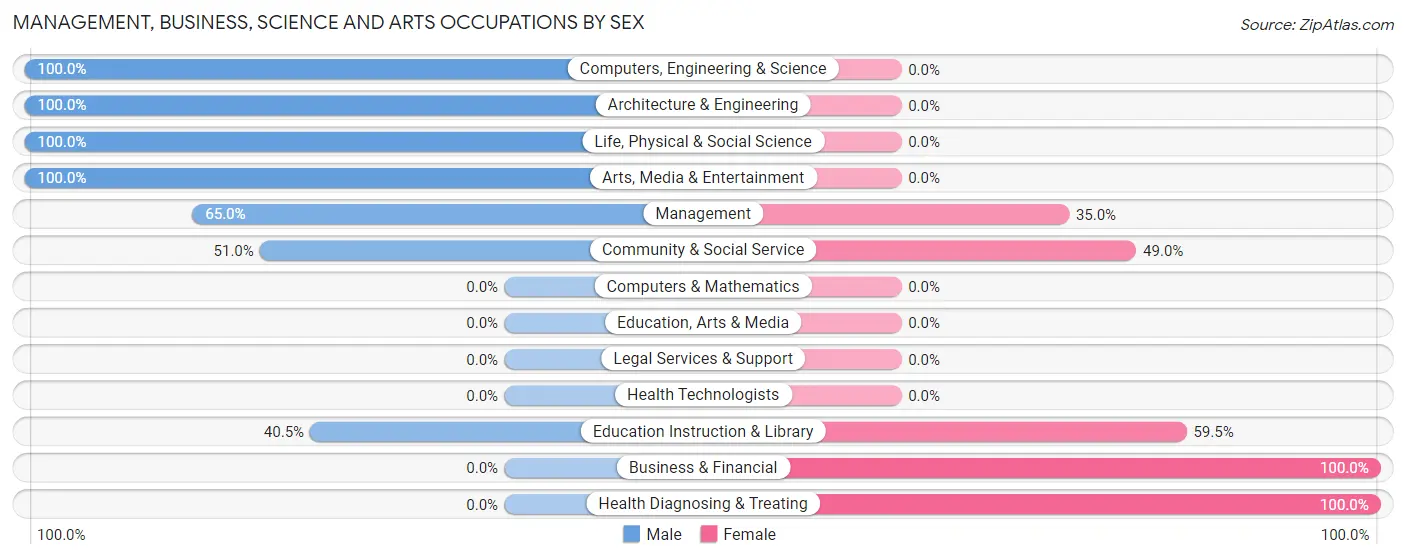
| Occupation | Male | Female |
| Management | 13 (65.0%) | 7 (35.0%) |
| Business & Financial | 0 (0.0%) | 13 (100.0%) |
| Computers, Engineering & Science | 23 (100.0%) | 0 (0.0%) |
| Computers & Mathematics | 0 (0.0%) | 0 (0.0%) |
| Architecture & Engineering | 5 (100.0%) | 0 (0.0%) |
| Life, Physical & Social Science | 18 (100.0%) | 0 (0.0%) |
| Community & Social Service | 26 (51.0%) | 25 (49.0%) |
| Education, Arts & Media | 0 (0.0%) | 0 (0.0%) |
| Legal Services & Support | 0 (0.0%) | 0 (0.0%) |
| Education Instruction & Library | 17 (40.5%) | 25 (59.5%) |
| Arts, Media & Entertainment | 9 (100.0%) | 0 (0.0%) |
| Health Diagnosing & Treating | 0 (0.0%) | 21 (100.0%) |
| Health Technologists | 0 (0.0%) | 0 (0.0%) |
| Total (Category) | 62 (48.4%) | 66 (51.6%) |
| Total (Overall) | 190 (44.3%) | 239 (55.7%) |
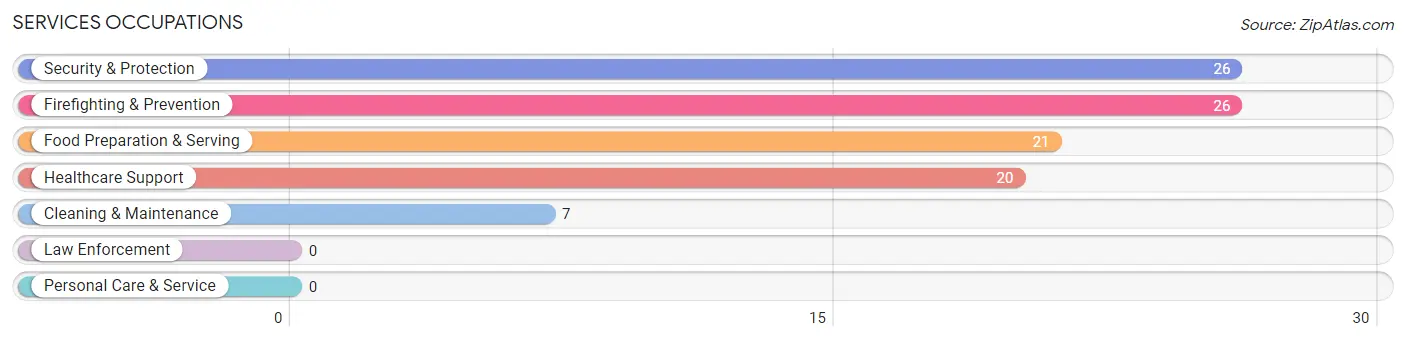
Services Occupations
The most common Services occupations in Apache are Security & Protection (26 | 6.1%), Firefighting & Prevention (26 | 6.1%), Food Preparation & Serving (21 | 4.9%), Healthcare Support (20 | 4.7%), and Cleaning & Maintenance (7 | 1.6%).
Services Occupations by Sex
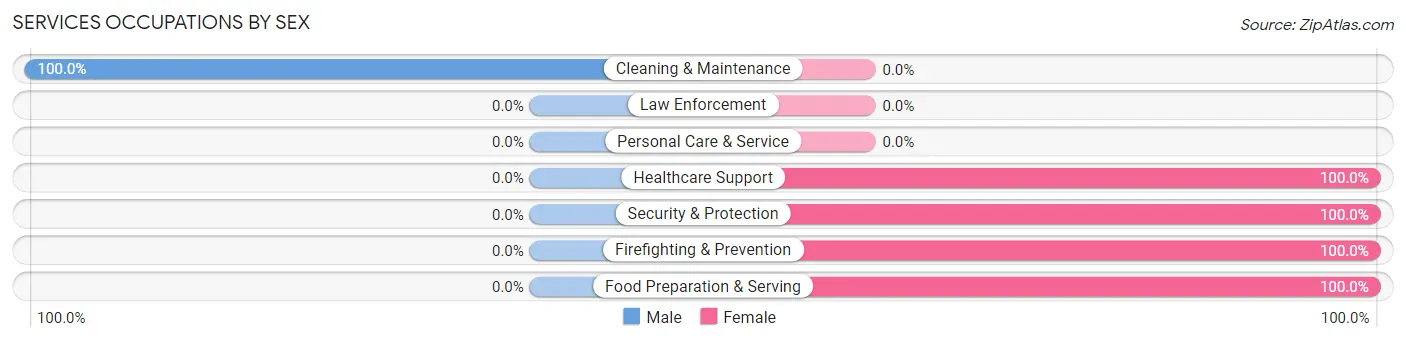
| Occupation | Male | Female |
| Healthcare Support | 0 (0.0%) | 20 (100.0%) |
| Security & Protection | 0 (0.0%) | 26 (100.0%) |
| Firefighting & Prevention | 0 (0.0%) | 26 (100.0%) |
| Law Enforcement | 0 (0.0%) | 0 (0.0%) |
| Food Preparation & Serving | 0 (0.0%) | 21 (100.0%) |
| Cleaning & Maintenance | 7 (100.0%) | 0 (0.0%) |
| Personal Care & Service | 0 (0.0%) | 0 (0.0%) |
| Total (Category) | 7 (9.5%) | 67 (90.5%) |
| Total (Overall) | 190 (44.3%) | 239 (55.7%) |
Sales and Office Occupations
The most common Sales and Office occupations in Apache are Office & Administration (88 | 20.5%), and Sales & Related (19 | 4.4%).
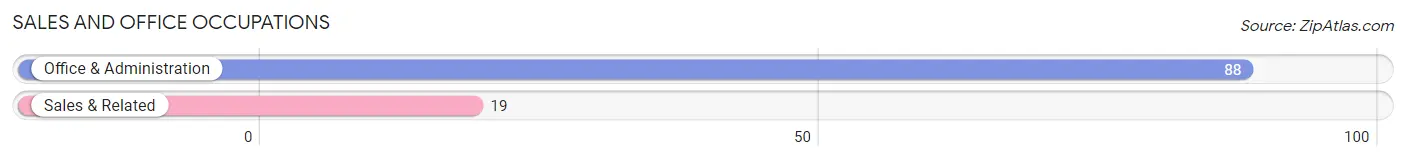
Sales and Office Occupations by Sex
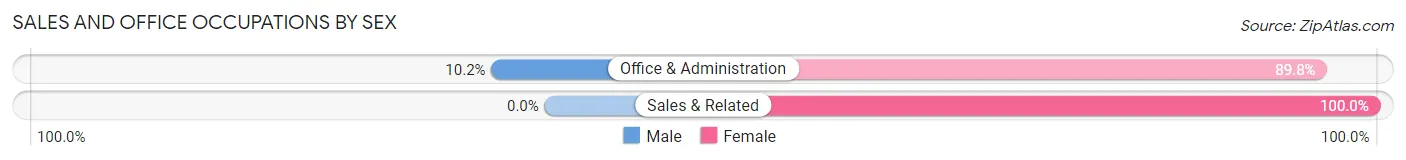
| Occupation | Male | Female |
| Sales & Related | 0 (0.0%) | 19 (100.0%) |
| Office & Administration | 9 (10.2%) | 79 (89.8%) |
| Total (Category) | 9 (8.4%) | 98 (91.6%) |
| Total (Overall) | 190 (44.3%) | 239 (55.7%) |
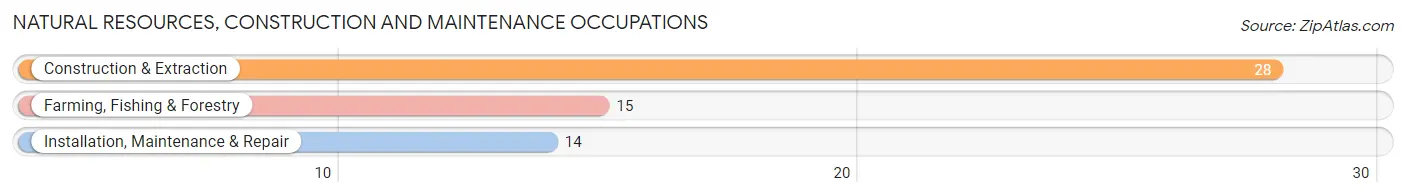
Natural Resources, Construction and Maintenance Occupations
The most common Natural Resources, Construction and Maintenance occupations in Apache are Construction & Extraction (28 | 6.5%), Farming, Fishing & Forestry (15 | 3.5%), and Installation, Maintenance & Repair (14 | 3.3%).
Natural Resources, Construction and Maintenance Occupations by Sex
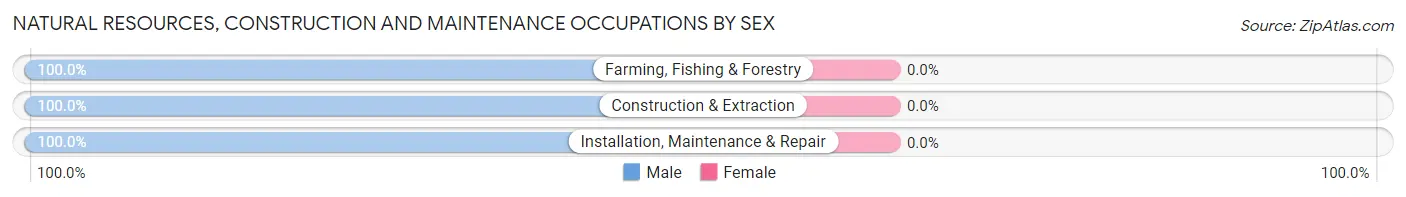
| Occupation | Male | Female |
| Farming, Fishing & Forestry | 15 (100.0%) | 0 (0.0%) |
| Construction & Extraction | 28 (100.0%) | 0 (0.0%) |
| Installation, Maintenance & Repair | 14 (100.0%) | 0 (0.0%) |
| Total (Category) | 57 (100.0%) | 0 (0.0%) |
| Total (Overall) | 190 (44.3%) | 239 (55.7%) |
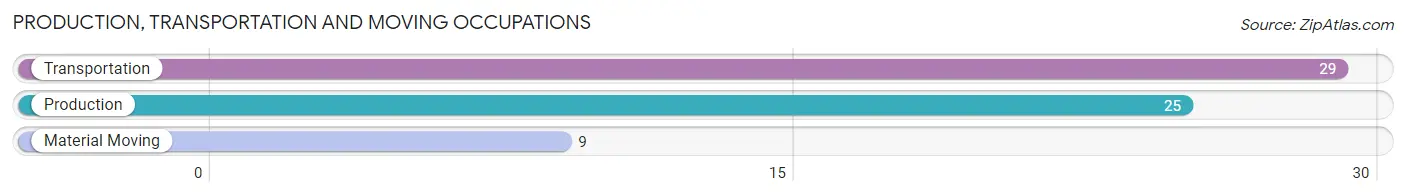
Production, Transportation and Moving Occupations
The most common Production, Transportation and Moving occupations in Apache are Transportation (29 | 6.8%), Production (25 | 5.8%), and Material Moving (9 | 2.1%).
Production, Transportation and Moving Occupations by Sex
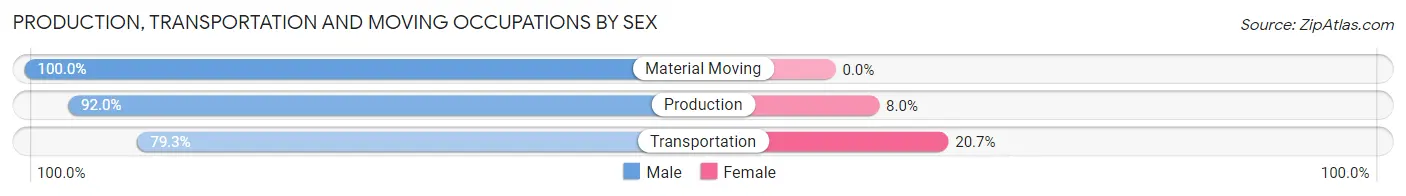
| Occupation | Male | Female |
| Production | 23 (92.0%) | 2 (8.0%) |
| Transportation | 23 (79.3%) | 6 (20.7%) |
| Material Moving | 9 (100.0%) | 0 (0.0%) |
| Total (Category) | 55 (87.3%) | 8 (12.7%) |
| Total (Overall) | 190 (44.3%) | 239 (55.7%) |
Employment Industries by Sex in Apache
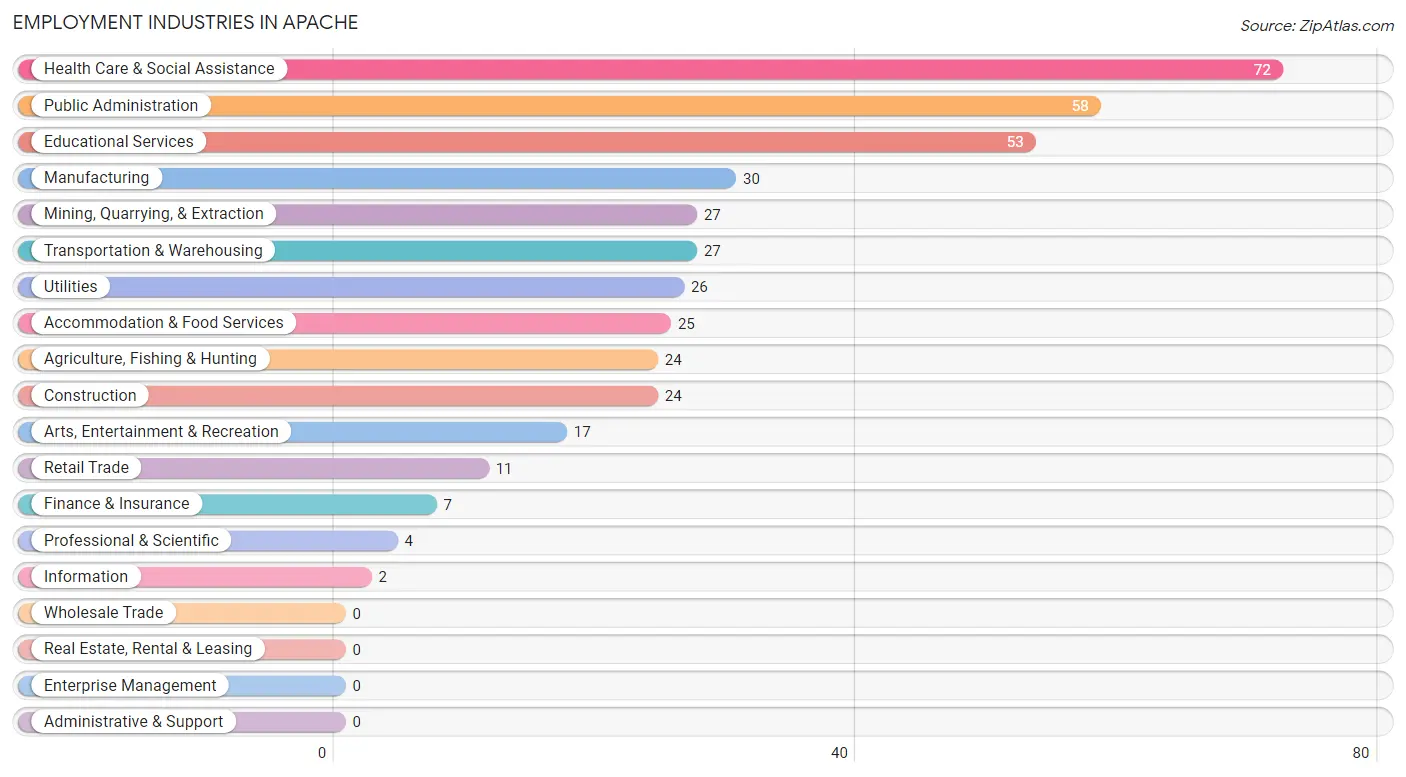
Employment Industries in Apache
The major employment industries in Apache include Health Care & Social Assistance (72 | 16.8%), Public Administration (58 | 13.5%), Educational Services (53 | 12.3%), Manufacturing (30 | 7.0%), and Mining, Quarrying, & Extraction (27 | 6.3%).
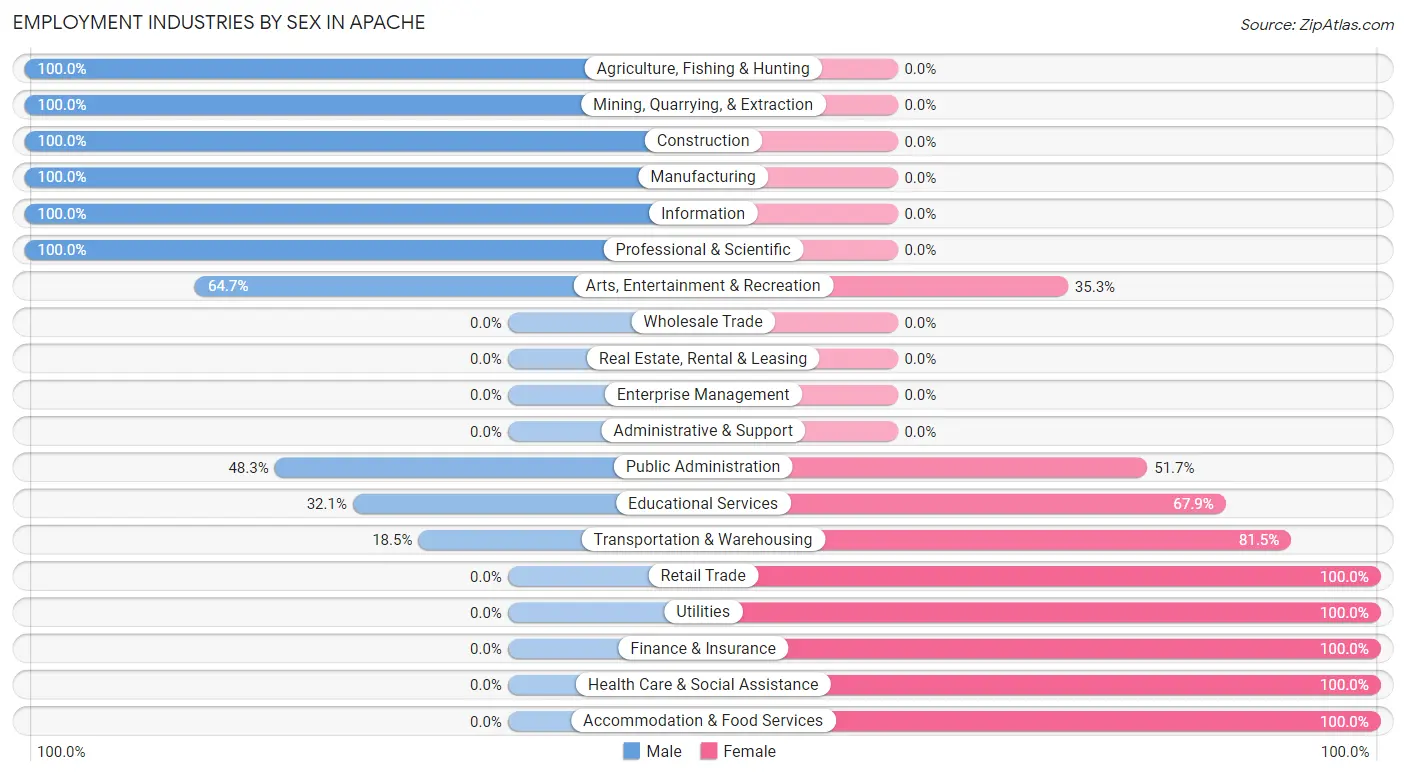
Employment Industries by Sex in Apache
The Apache industries that see more men than women are Agriculture, Fishing & Hunting (100.0%), Mining, Quarrying, & Extraction (100.0%), and Construction (100.0%), whereas the industries that tend to have a higher number of women are Retail Trade (100.0%), Utilities (100.0%), and Finance & Insurance (100.0%).
| Industry | Male | Female |
| Agriculture, Fishing & Hunting | 24 (100.0%) | 0 (0.0%) |
| Mining, Quarrying, & Extraction | 27 (100.0%) | 0 (0.0%) |
| Construction | 24 (100.0%) | 0 (0.0%) |
| Manufacturing | 30 (100.0%) | 0 (0.0%) |
| Wholesale Trade | 0 (0.0%) | 0 (0.0%) |
| Retail Trade | 0 (0.0%) | 11 (100.0%) |
| Transportation & Warehousing | 5 (18.5%) | 22 (81.5%) |
| Utilities | 0 (0.0%) | 26 (100.0%) |
| Information | 2 (100.0%) | 0 (0.0%) |
| Finance & Insurance | 0 (0.0%) | 7 (100.0%) |
| Real Estate, Rental & Leasing | 0 (0.0%) | 0 (0.0%) |
| Professional & Scientific | 4 (100.0%) | 0 (0.0%) |
| Enterprise Management | 0 (0.0%) | 0 (0.0%) |
| Administrative & Support | 0 (0.0%) | 0 (0.0%) |
| Educational Services | 17 (32.1%) | 36 (67.9%) |
| Health Care & Social Assistance | 0 (0.0%) | 72 (100.0%) |
| Arts, Entertainment & Recreation | 11 (64.7%) | 6 (35.3%) |
| Accommodation & Food Services | 0 (0.0%) | 25 (100.0%) |
| Public Administration | 28 (48.3%) | 30 (51.7%) |
| Total | 190 (44.3%) | 239 (55.7%) |
Education in Apache
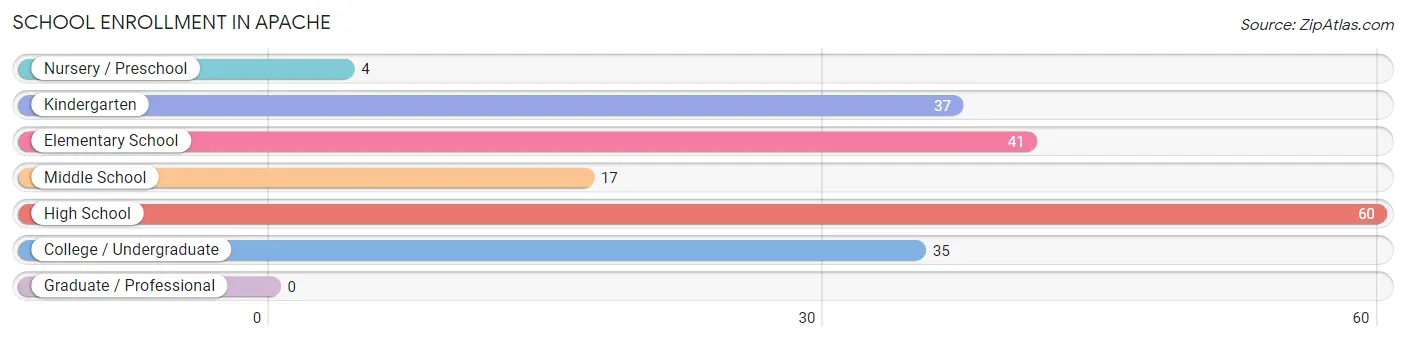
School Enrollment in Apache
The most common levels of schooling among the 194 students in Apache are high school (60 | 30.9%), elementary school (41 | 21.1%), and kindergarten (37 | 19.1%).
| School Level | # Students | % Students |
| Nursery / Preschool | 4 | 2.1% |
| Kindergarten | 37 | 19.1% |
| Elementary School | 41 | 21.1% |
| Middle School | 17 | 8.8% |
| High School | 60 | 30.9% |
| College / Undergraduate | 35 | 18.0% |
| Graduate / Professional | 0 | 0.0% |
| Total | 194 | 100.0% |
School Enrollment by Age by Funding Source in Apache

| Age Bracket | Public School | Private School |
| 3 to 4 Year Olds | 3 (100.0%) | 0 (0.0%) |
| 5 to 9 Year Old | 79 (100.0%) | 0 (0.0%) |
| 10 to 14 Year Olds | 20 (100.0%) | 0 (0.0%) |
| 15 to 17 Year Olds | 30 (100.0%) | 0 (0.0%) |
| 18 to 19 Year Olds | 27 (100.0%) | 0 (0.0%) |
| 20 to 24 Year Olds | 35 (100.0%) | 0 (0.0%) |
| 25 to 34 Year Olds | 0 (0.0%) | 0 (0.0%) |
| 35 Years and over | 0 (0.0%) | 0 (0.0%) |
| Total | 194 (100.0%) | 0 (0.0%) |
Educational Attainment by Field of Study in Apache
Business (19 | 21.6%), education (19 | 21.6%), bio, nature & agricultural (18 | 20.4%), computers & mathematics (11 | 12.5%), and physical & health sciences (11 | 12.5%) are the most common fields of study among 88 individuals in Apache who have obtained a bachelor's degree or higher.
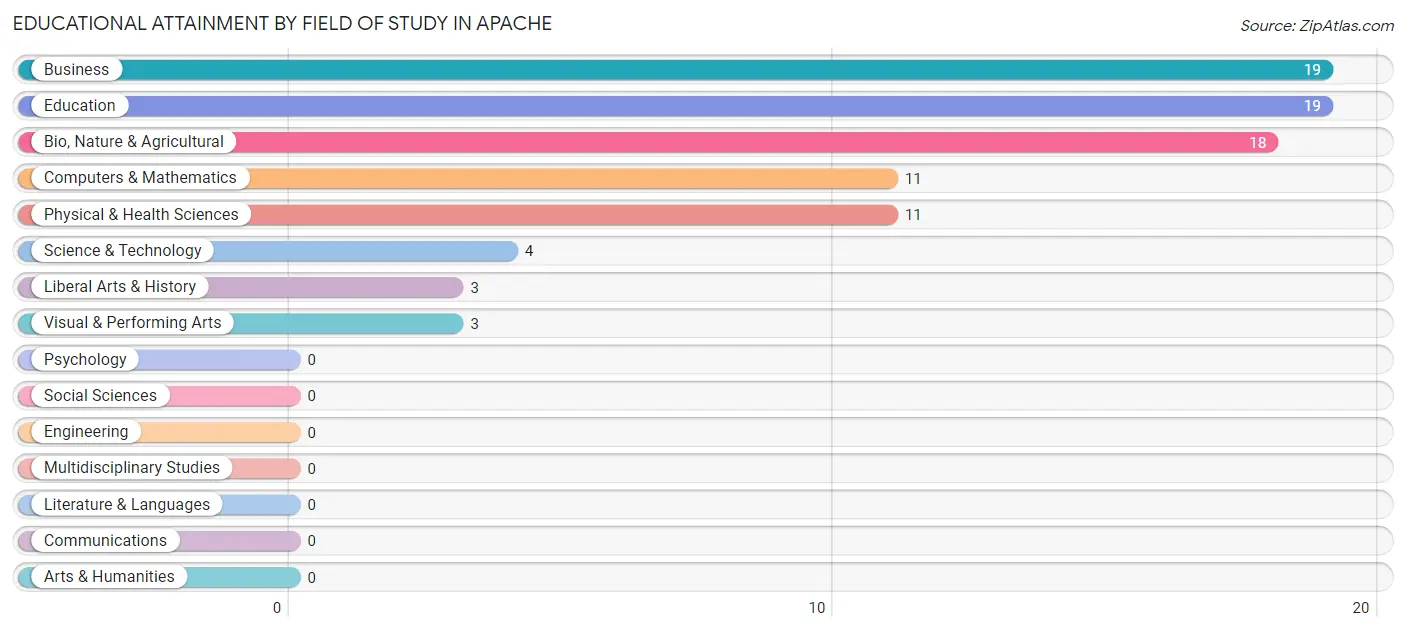
| Field of Study | # Graduates | % Graduates |
| Computers & Mathematics | 11 | 12.5% |
| Bio, Nature & Agricultural | 18 | 20.4% |
| Physical & Health Sciences | 11 | 12.5% |
| Psychology | 0 | 0.0% |
| Social Sciences | 0 | 0.0% |
| Engineering | 0 | 0.0% |
| Multidisciplinary Studies | 0 | 0.0% |
| Science & Technology | 4 | 4.5% |
| Business | 19 | 21.6% |
| Education | 19 | 21.6% |
| Literature & Languages | 0 | 0.0% |
| Liberal Arts & History | 3 | 3.4% |
| Visual & Performing Arts | 3 | 3.4% |
| Communications | 0 | 0.0% |
| Arts & Humanities | 0 | 0.0% |
| Total | 88 | 100.0% |
Transportation & Commute in Apache
Vehicle Availability by Sex in Apache
The most prevalent vehicle ownership categories in Apache are males with 2 vehicles (79, accounting for 41.6%) and females with 2 vehicles (135, making up 34.4%).
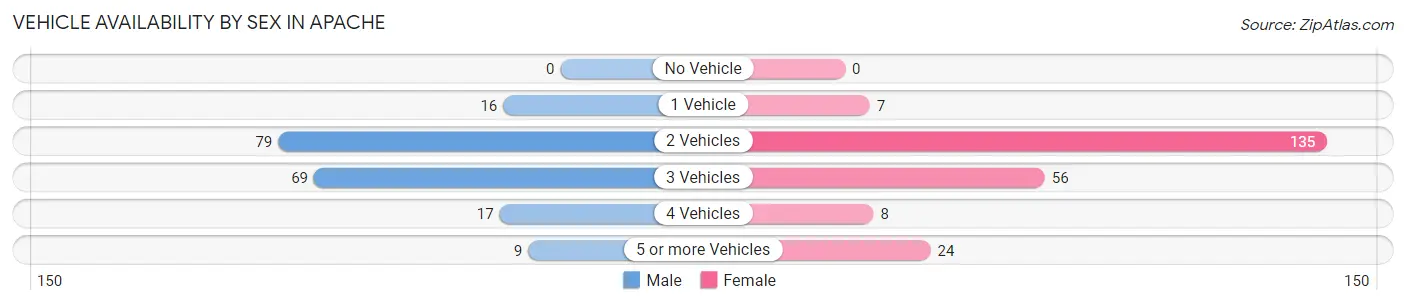
| Vehicles Available | Male | Female |
| No Vehicle | 0 (0.0%) | 0 (0.0%) |
| 1 Vehicle | 16 (8.4%) | 7 (3.0%) |
| 2 Vehicles | 79 (41.6%) | 135 (58.7%) |
| 3 Vehicles | 69 (36.3%) | 56 (24.3%) |
| 4 Vehicles | 17 (8.9%) | 8 (3.5%) |
| 5 or more Vehicles | 9 (4.7%) | 24 (10.4%) |
| Total | 190 (100.0%) | 230 (100.0%) |
Commute Time in Apache
The most frequently occuring commute durations in Apache are 30 to 34 minutes (111 commuters, 27.4%), less than 5 minutes (73 commuters, 18.0%), and 15 to 19 minutes (41 commuters, 10.1%).
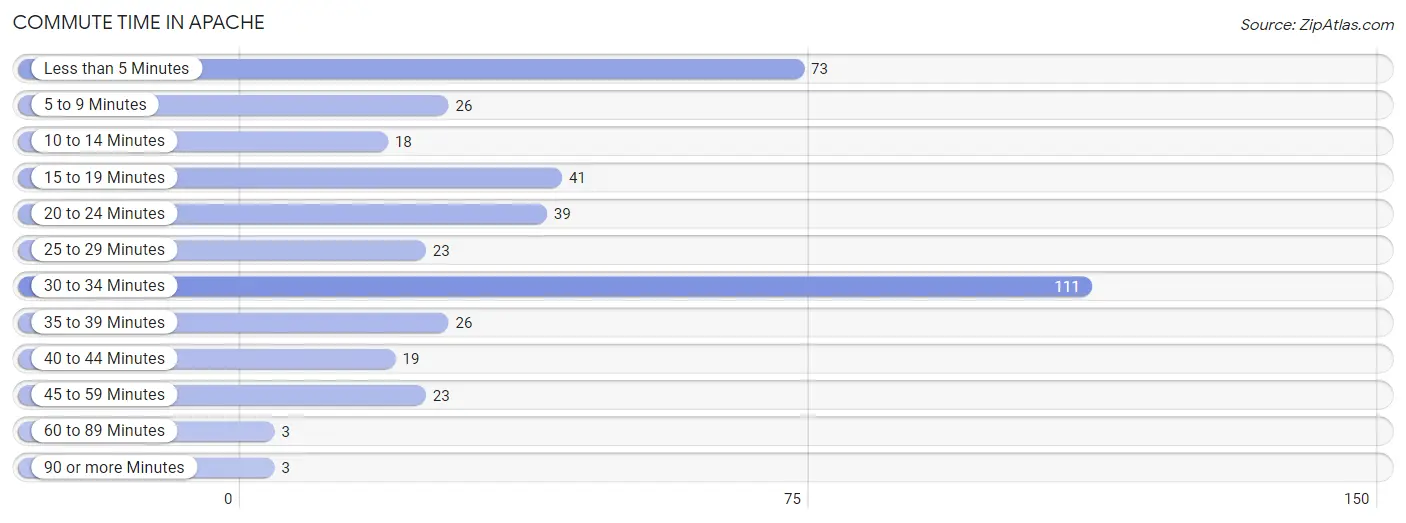
| Commute Time | # Commuters | % Commuters |
| Less than 5 Minutes | 73 | 18.0% |
| 5 to 9 Minutes | 26 | 6.4% |
| 10 to 14 Minutes | 18 | 4.4% |
| 15 to 19 Minutes | 41 | 10.1% |
| 20 to 24 Minutes | 39 | 9.6% |
| 25 to 29 Minutes | 23 | 5.7% |
| 30 to 34 Minutes | 111 | 27.4% |
| 35 to 39 Minutes | 26 | 6.4% |
| 40 to 44 Minutes | 19 | 4.7% |
| 45 to 59 Minutes | 23 | 5.7% |
| 60 to 89 Minutes | 3 | 0.7% |
| 90 or more Minutes | 3 | 0.7% |
Commute Time by Sex in Apache
The most common commute times in Apache are 30 to 34 minutes (72 commuters, 39.8%) for males and less than 5 minutes (39 commuters, 17.4%) for females.
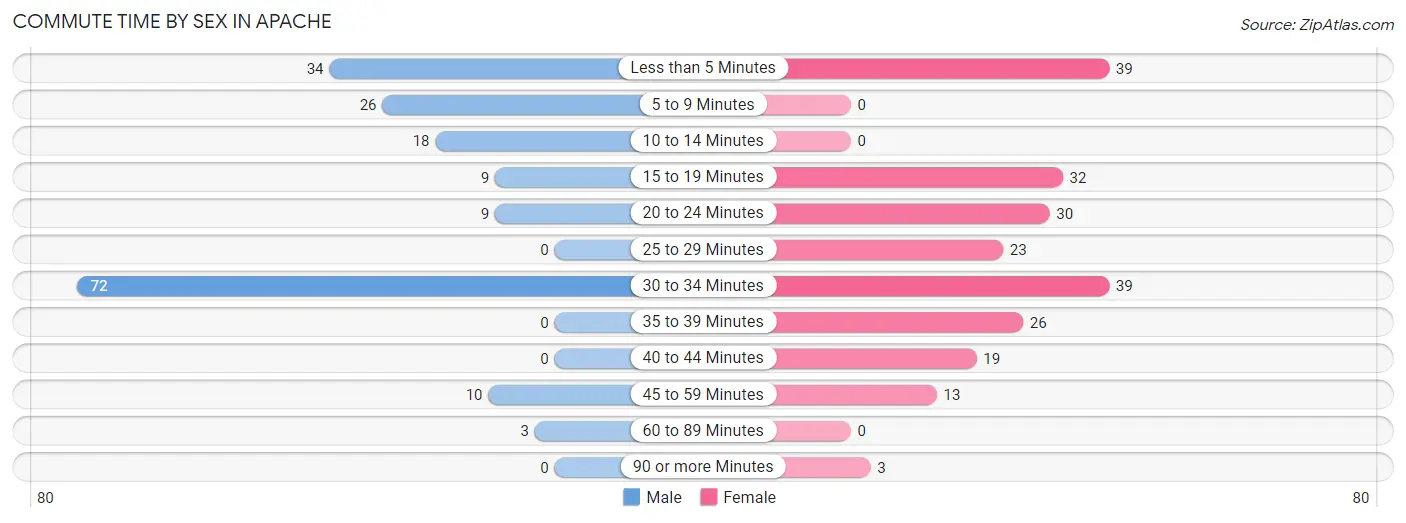
| Commute Time | Male | Female |
| Less than 5 Minutes | 34 (18.8%) | 39 (17.4%) |
| 5 to 9 Minutes | 26 (14.4%) | 0 (0.0%) |
| 10 to 14 Minutes | 18 (9.9%) | 0 (0.0%) |
| 15 to 19 Minutes | 9 (5.0%) | 32 (14.3%) |
| 20 to 24 Minutes | 9 (5.0%) | 30 (13.4%) |
| 25 to 29 Minutes | 0 (0.0%) | 23 (10.3%) |
| 30 to 34 Minutes | 72 (39.8%) | 39 (17.4%) |
| 35 to 39 Minutes | 0 (0.0%) | 26 (11.6%) |
| 40 to 44 Minutes | 0 (0.0%) | 19 (8.5%) |
| 45 to 59 Minutes | 10 (5.5%) | 13 (5.8%) |
| 60 to 89 Minutes | 3 (1.7%) | 0 (0.0%) |
| 90 or more Minutes | 0 (0.0%) | 3 (1.3%) |
Time of Departure to Work by Sex in Apache
The most frequent times of departure to work in Apache are 7:00 AM to 7:29 AM (96, 53.0%) for males and 7:00 AM to 7:29 AM (59, 26.3%) for females.
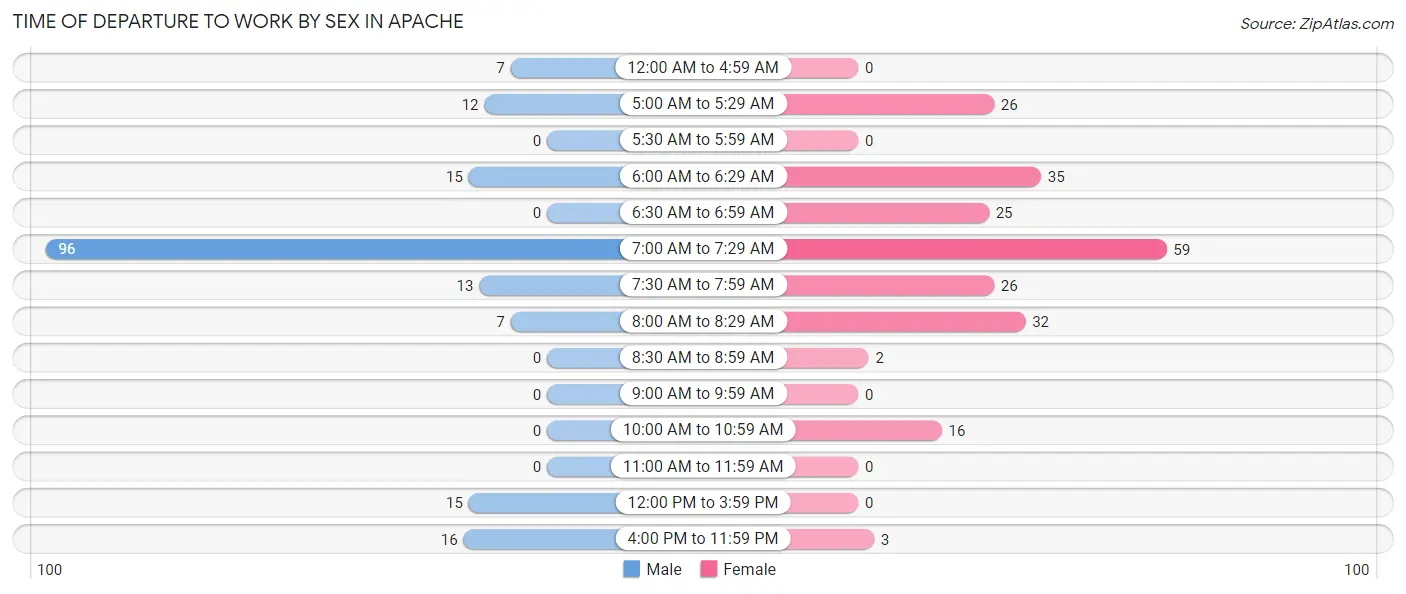
| Time of Departure | Male | Female |
| 12:00 AM to 4:59 AM | 7 (3.9%) | 0 (0.0%) |
| 5:00 AM to 5:29 AM | 12 (6.6%) | 26 (11.6%) |
| 5:30 AM to 5:59 AM | 0 (0.0%) | 0 (0.0%) |
| 6:00 AM to 6:29 AM | 15 (8.3%) | 35 (15.6%) |
| 6:30 AM to 6:59 AM | 0 (0.0%) | 25 (11.2%) |
| 7:00 AM to 7:29 AM | 96 (53.0%) | 59 (26.3%) |
| 7:30 AM to 7:59 AM | 13 (7.2%) | 26 (11.6%) |
| 8:00 AM to 8:29 AM | 7 (3.9%) | 32 (14.3%) |
| 8:30 AM to 8:59 AM | 0 (0.0%) | 2 (0.9%) |
| 9:00 AM to 9:59 AM | 0 (0.0%) | 0 (0.0%) |
| 10:00 AM to 10:59 AM | 0 (0.0%) | 16 (7.1%) |
| 11:00 AM to 11:59 AM | 0 (0.0%) | 0 (0.0%) |
| 12:00 PM to 3:59 PM | 15 (8.3%) | 0 (0.0%) |
| 4:00 PM to 11:59 PM | 16 (8.8%) | 3 (1.3%) |
| Total | 181 (100.0%) | 224 (100.0%) |
Housing Occupancy in Apache
Occupancy by Ownership in Apache
Of the total 403 dwellings in Apache, owner-occupied units account for 260 (64.5%), while renter-occupied units make up 143 (35.5%).
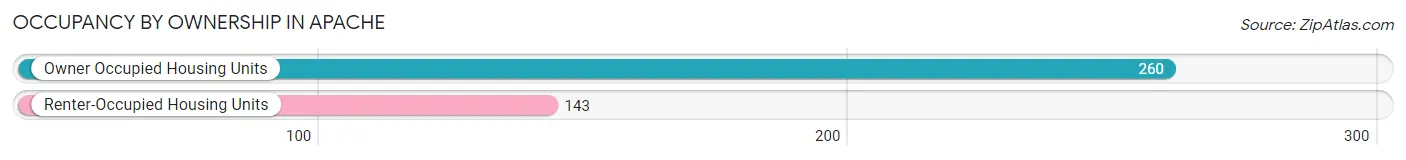
| Occupancy | # Housing Units | % Housing Units |
| Owner Occupied Housing Units | 260 | 64.5% |
| Renter-Occupied Housing Units | 143 | 35.5% |
| Total Occupied Housing Units | 403 | 100.0% |
Occupancy by Household Size in Apache
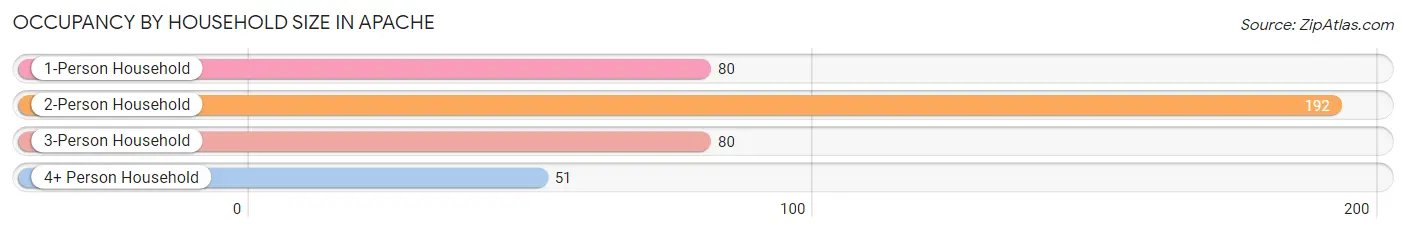
| Household Size | # Housing Units | % Housing Units |
| 1-Person Household | 80 | 19.9% |
| 2-Person Household | 192 | 47.6% |
| 3-Person Household | 80 | 19.9% |
| 4+ Person Household | 51 | 12.7% |
| Total Housing Units | 403 | 100.0% |
Occupancy by Ownership by Household Size in Apache
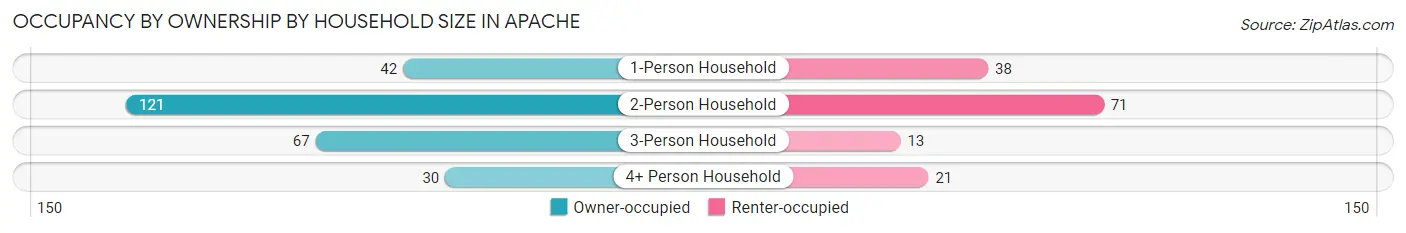
| Household Size | Owner-occupied | Renter-occupied |
| 1-Person Household | 42 (52.5%) | 38 (47.5%) |
| 2-Person Household | 121 (63.0%) | 71 (37.0%) |
| 3-Person Household | 67 (83.8%) | 13 (16.3%) |
| 4+ Person Household | 30 (58.8%) | 21 (41.2%) |
| Total Housing Units | 260 (64.5%) | 143 (35.5%) |
Occupancy by Educational Attainment in Apache
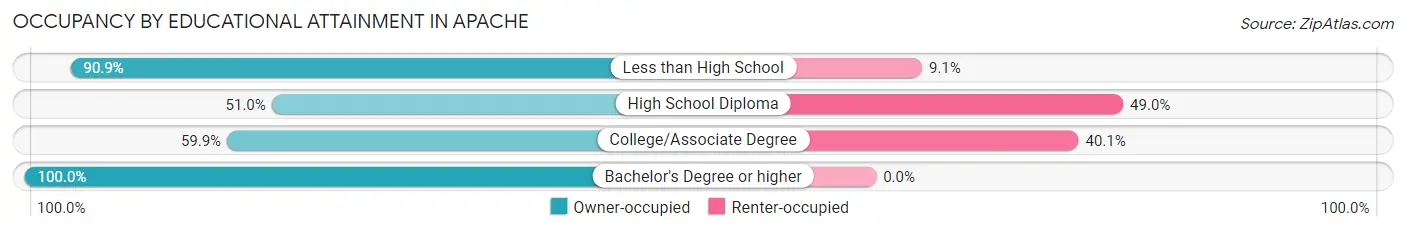
| Household Size | Owner-occupied | Renter-occupied |
| Less than High School | 30 (90.9%) | 3 (9.1%) |
| High School Diploma | 74 (51.0%) | 71 (49.0%) |
| College/Associate Degree | 103 (59.9%) | 69 (40.1%) |
| Bachelor's Degree or higher | 53 (100.0%) | 0 (0.0%) |
Occupancy by Age of Householder in Apache
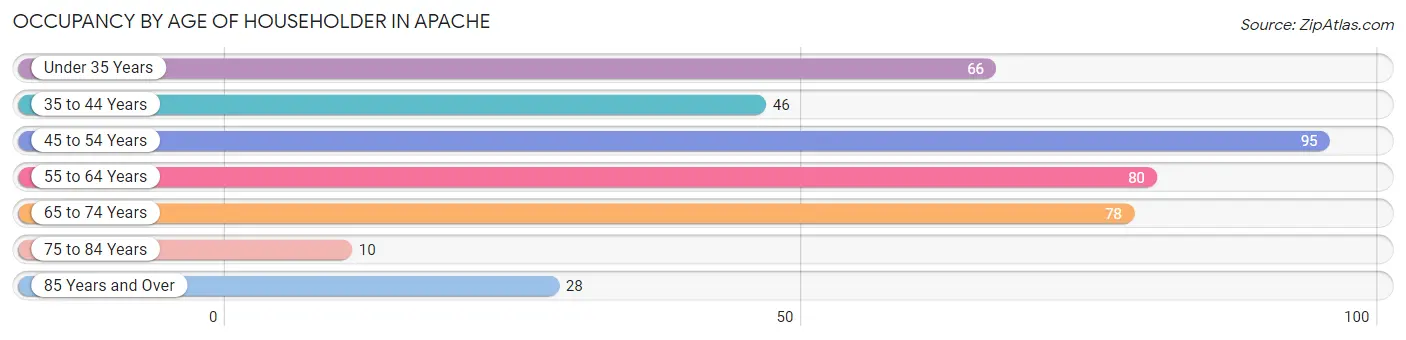
| Age Bracket | # Households | % Households |
| Under 35 Years | 66 | 16.4% |
| 35 to 44 Years | 46 | 11.4% |
| 45 to 54 Years | 95 | 23.6% |
| 55 to 64 Years | 80 | 19.9% |
| 65 to 74 Years | 78 | 19.4% |
| 75 to 84 Years | 10 | 2.5% |
| 85 Years and Over | 28 | 7.0% |
| Total | 403 | 100.0% |
Housing Finances in Apache
Median Income by Occupancy in Apache
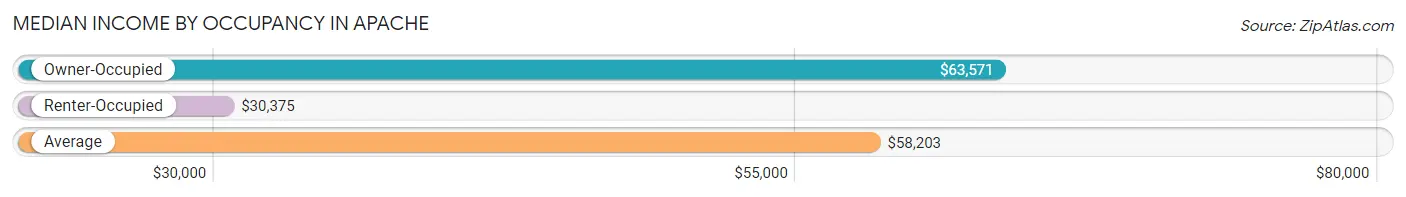
| Occupancy Type | # Households | Median Income |
| Owner-Occupied | 260 (64.5%) | $63,571 |
| Renter-Occupied | 143 (35.5%) | $30,375 |
| Average | 403 (100.0%) | $58,203 |
Occupancy by Householder Income Bracket in Apache
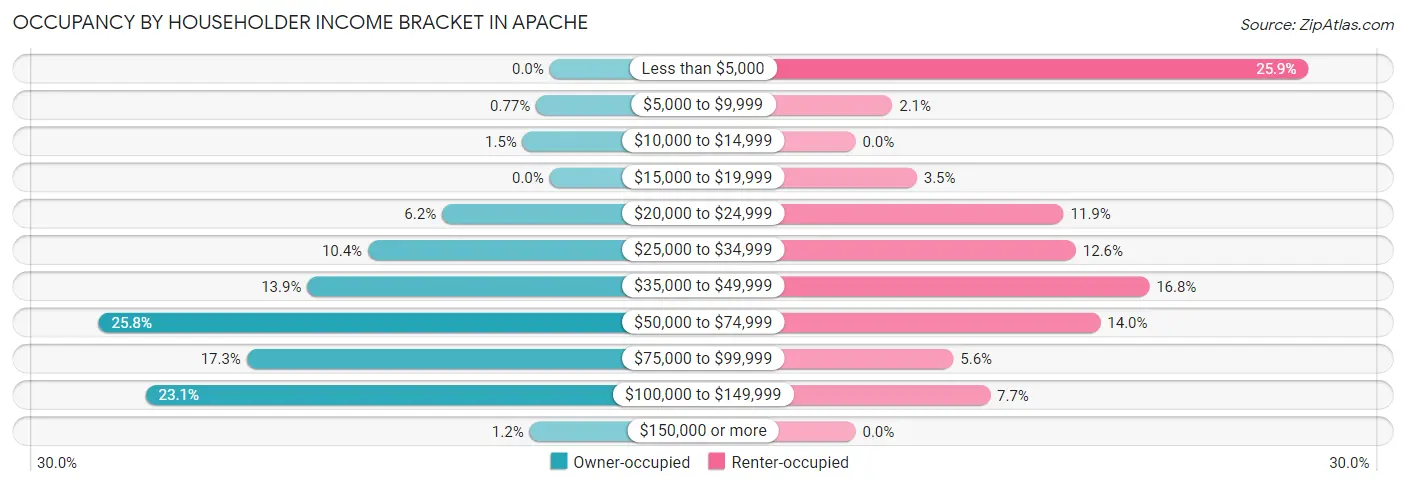
| Income Bracket | Owner-occupied | Renter-occupied |
| Less than $5,000 | 0 (0.0%) | 37 (25.9%) |
| $5,000 to $9,999 | 2 (0.8%) | 3 (2.1%) |
| $10,000 to $14,999 | 4 (1.5%) | 0 (0.0%) |
| $15,000 to $19,999 | 0 (0.0%) | 5 (3.5%) |
| $20,000 to $24,999 | 16 (6.1%) | 17 (11.9%) |
| $25,000 to $34,999 | 27 (10.4%) | 18 (12.6%) |
| $35,000 to $49,999 | 36 (13.9%) | 24 (16.8%) |
| $50,000 to $74,999 | 67 (25.8%) | 20 (14.0%) |
| $75,000 to $99,999 | 45 (17.3%) | 8 (5.6%) |
| $100,000 to $149,999 | 60 (23.1%) | 11 (7.7%) |
| $150,000 or more | 3 (1.1%) | 0 (0.0%) |
| Total | 260 (100.0%) | 143 (100.0%) |
Monthly Housing Cost Tiers in Apache
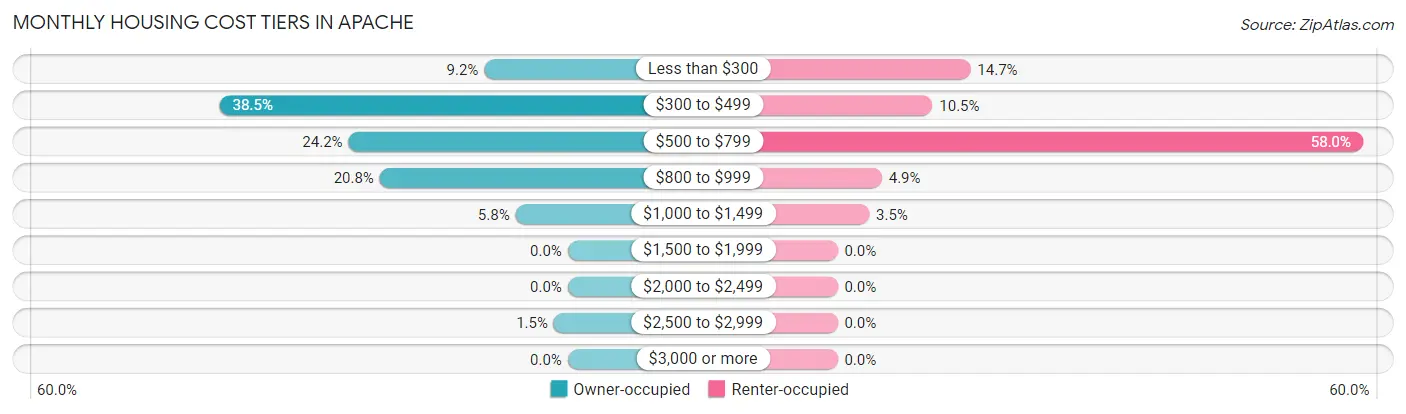
| Monthly Cost | Owner-occupied | Renter-occupied |
| Less than $300 | 24 (9.2%) | 21 (14.7%) |
| $300 to $499 | 100 (38.5%) | 15 (10.5%) |
| $500 to $799 | 63 (24.2%) | 83 (58.0%) |
| $800 to $999 | 54 (20.8%) | 7 (4.9%) |
| $1,000 to $1,499 | 15 (5.8%) | 5 (3.5%) |
| $1,500 to $1,999 | 0 (0.0%) | 0 (0.0%) |
| $2,000 to $2,499 | 0 (0.0%) | 0 (0.0%) |
| $2,500 to $2,999 | 4 (1.5%) | 0 (0.0%) |
| $3,000 or more | 0 (0.0%) | 0 (0.0%) |
| Total | 260 (100.0%) | 143 (100.0%) |
Physical Housing Characteristics in Apache
Housing Structures in Apache
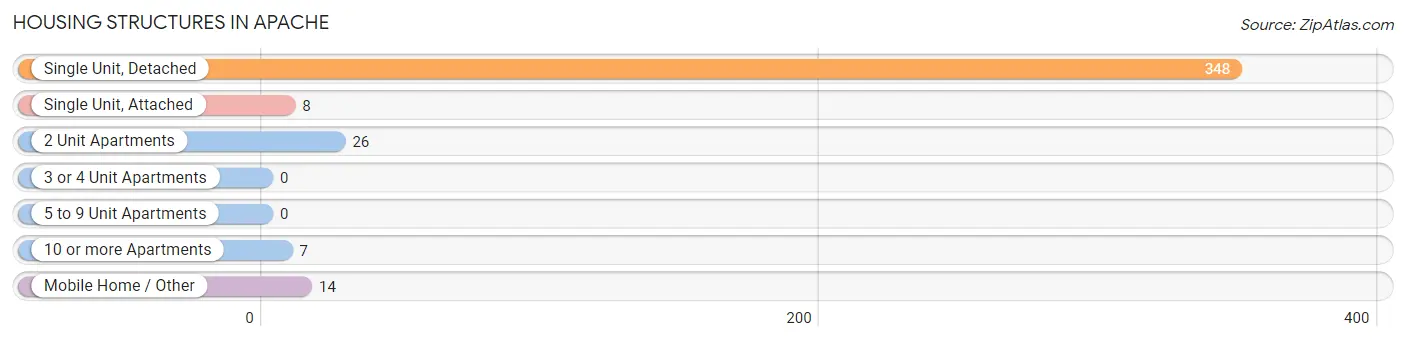
| Structure Type | # Housing Units | % Housing Units |
| Single Unit, Detached | 348 | 86.4% |
| Single Unit, Attached | 8 | 2.0% |
| 2 Unit Apartments | 26 | 6.5% |
| 3 or 4 Unit Apartments | 0 | 0.0% |
| 5 to 9 Unit Apartments | 0 | 0.0% |
| 10 or more Apartments | 7 | 1.7% |
| Mobile Home / Other | 14 | 3.5% |
| Total | 403 | 100.0% |
Housing Structures by Occupancy in Apache
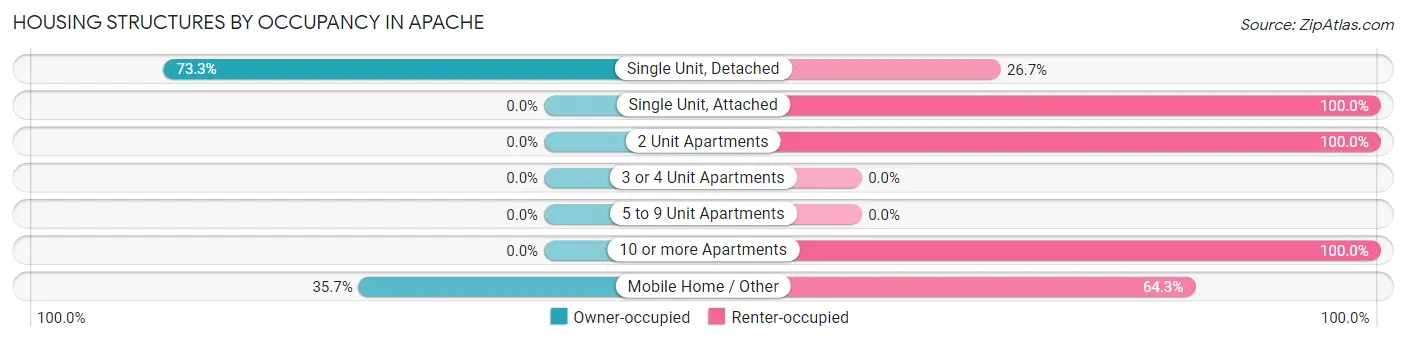
| Structure Type | Owner-occupied | Renter-occupied |
| Single Unit, Detached | 255 (73.3%) | 93 (26.7%) |
| Single Unit, Attached | 0 (0.0%) | 8 (100.0%) |
| 2 Unit Apartments | 0 (0.0%) | 26 (100.0%) |
| 3 or 4 Unit Apartments | 0 (0.0%) | 0 (0.0%) |
| 5 to 9 Unit Apartments | 0 (0.0%) | 0 (0.0%) |
| 10 or more Apartments | 0 (0.0%) | 7 (100.0%) |
| Mobile Home / Other | 5 (35.7%) | 9 (64.3%) |
| Total | 260 (64.5%) | 143 (35.5%) |
Housing Structures by Number of Rooms in Apache
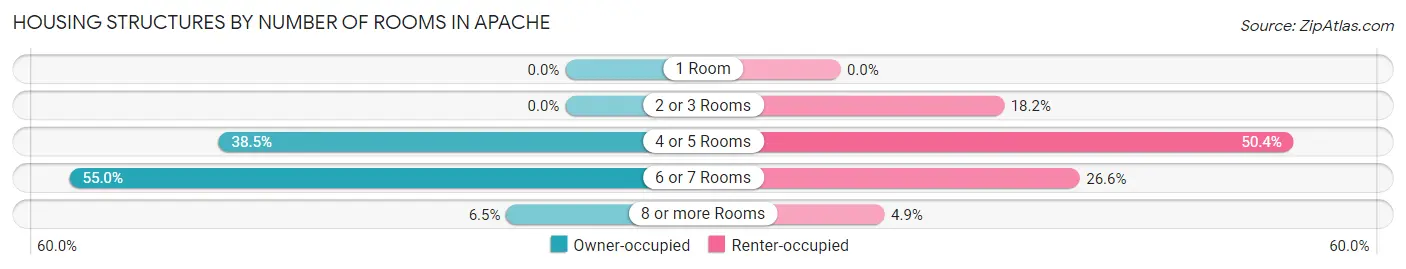
| Number of Rooms | Owner-occupied | Renter-occupied |
| 1 Room | 0 (0.0%) | 0 (0.0%) |
| 2 or 3 Rooms | 0 (0.0%) | 26 (18.2%) |
| 4 or 5 Rooms | 100 (38.5%) | 72 (50.3%) |
| 6 or 7 Rooms | 143 (55.0%) | 38 (26.6%) |
| 8 or more Rooms | 17 (6.5%) | 7 (4.9%) |
| Total | 260 (100.0%) | 143 (100.0%) |
Housing Structure by Heating Type in Apache
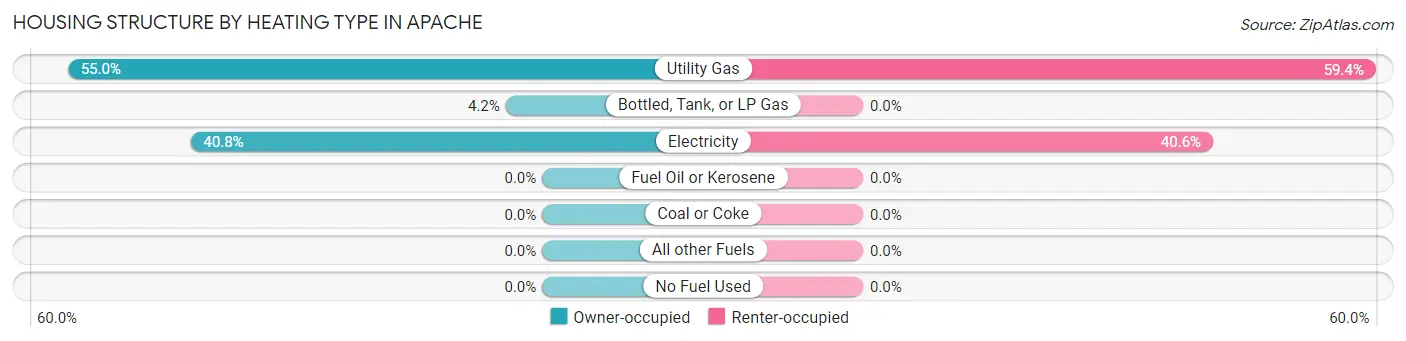
| Heating Type | Owner-occupied | Renter-occupied |
| Utility Gas | 143 (55.0%) | 85 (59.4%) |
| Bottled, Tank, or LP Gas | 11 (4.2%) | 0 (0.0%) |
| Electricity | 106 (40.8%) | 58 (40.6%) |
| Fuel Oil or Kerosene | 0 (0.0%) | 0 (0.0%) |
| Coal or Coke | 0 (0.0%) | 0 (0.0%) |
| All other Fuels | 0 (0.0%) | 0 (0.0%) |
| No Fuel Used | 0 (0.0%) | 0 (0.0%) |
| Total | 260 (100.0%) | 143 (100.0%) |
Household Vehicle Usage in Apache
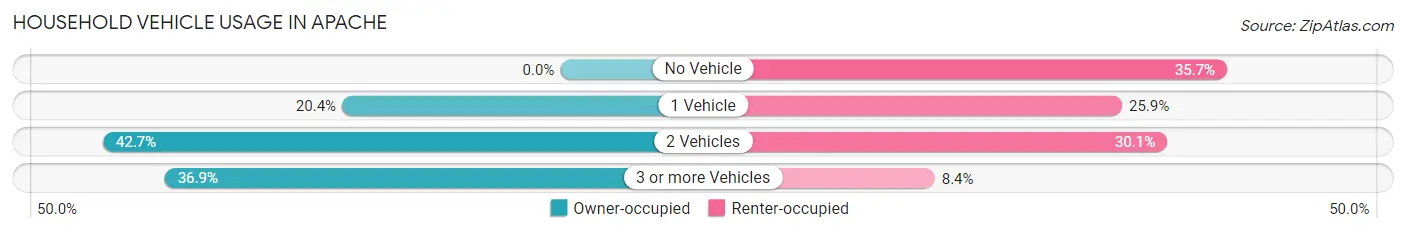
| Vehicles per Household | Owner-occupied | Renter-occupied |
| No Vehicle | 0 (0.0%) | 51 (35.7%) |
| 1 Vehicle | 53 (20.4%) | 37 (25.9%) |
| 2 Vehicles | 111 (42.7%) | 43 (30.1%) |
| 3 or more Vehicles | 96 (36.9%) | 12 (8.4%) |
| Total | 260 (100.0%) | 143 (100.0%) |
Real Estate & Mortgages in Apache
Real Estate and Mortgage Overview in Apache
| Characteristic | Without Mortgage | With Mortgage |
| Housing Units | 142 | 118 |
| Median Property Value | $81,800 | $96,700 |
| Median Household Income | $56,250 | $3 |
| Monthly Housing Costs | $417 | $0 |
| Real Estate Taxes | $417 | $20 |
Property Value by Mortgage Status in Apache
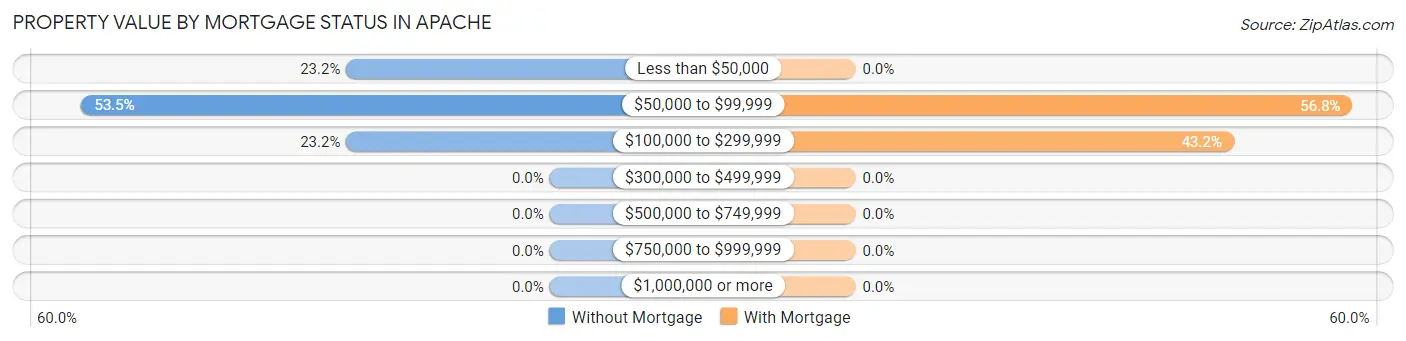
| Property Value | Without Mortgage | With Mortgage |
| Less than $50,000 | 33 (23.2%) | 0 (0.0%) |
| $50,000 to $99,999 | 76 (53.5%) | 67 (56.8%) |
| $100,000 to $299,999 | 33 (23.2%) | 51 (43.2%) |
| $300,000 to $499,999 | 0 (0.0%) | 0 (0.0%) |
| $500,000 to $749,999 | 0 (0.0%) | 0 (0.0%) |
| $750,000 to $999,999 | 0 (0.0%) | 0 (0.0%) |
| $1,000,000 or more | 0 (0.0%) | 0 (0.0%) |
| Total | 142 (100.0%) | 118 (100.0%) |
Household Income by Mortgage Status in Apache
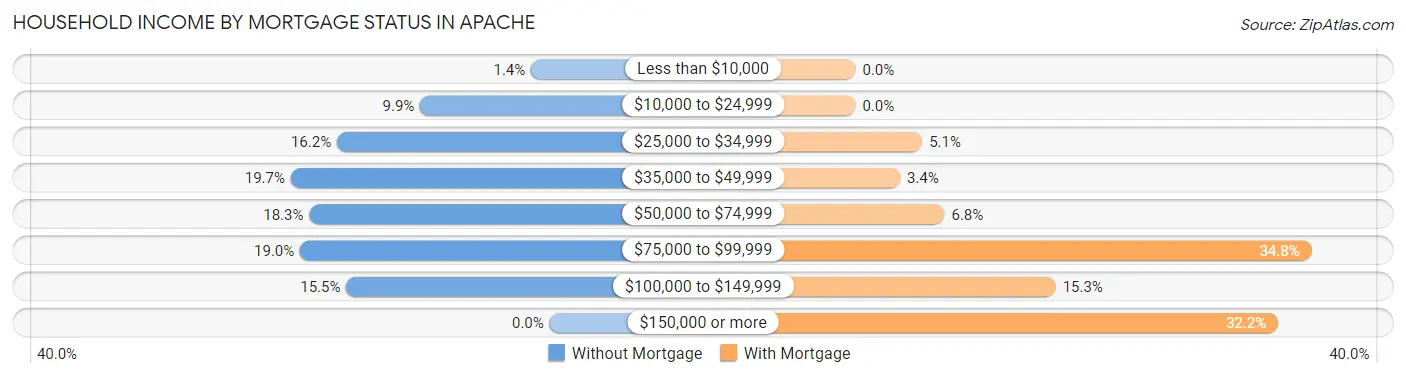
| Household Income | Without Mortgage | With Mortgage |
| Less than $10,000 | 2 (1.4%) | 0 (0.0%) |
| $10,000 to $24,999 | 14 (9.9%) | 0 (0.0%) |
| $25,000 to $34,999 | 23 (16.2%) | 6 (5.1%) |
| $35,000 to $49,999 | 28 (19.7%) | 4 (3.4%) |
| $50,000 to $74,999 | 26 (18.3%) | 8 (6.8%) |
| $75,000 to $99,999 | 27 (19.0%) | 41 (34.7%) |
| $100,000 to $149,999 | 22 (15.5%) | 18 (15.2%) |
| $150,000 or more | 0 (0.0%) | 38 (32.2%) |
| Total | 142 (100.0%) | 118 (100.0%) |
Property Value to Household Income Ratio in Apache
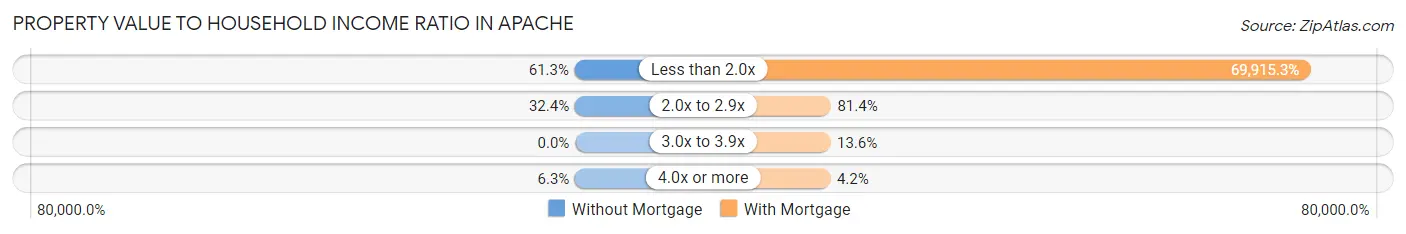
| Value-to-Income Ratio | Without Mortgage | With Mortgage |
| Less than 2.0x | 87 (61.3%) | 82,500 (69,915.3%) |
| 2.0x to 2.9x | 46 (32.4%) | 96 (81.4%) |
| 3.0x to 3.9x | 0 (0.0%) | 16 (13.6%) |
| 4.0x or more | 9 (6.3%) | 5 (4.2%) |
| Total | 142 (100.0%) | 118 (100.0%) |
Real Estate Taxes by Mortgage Status in Apache
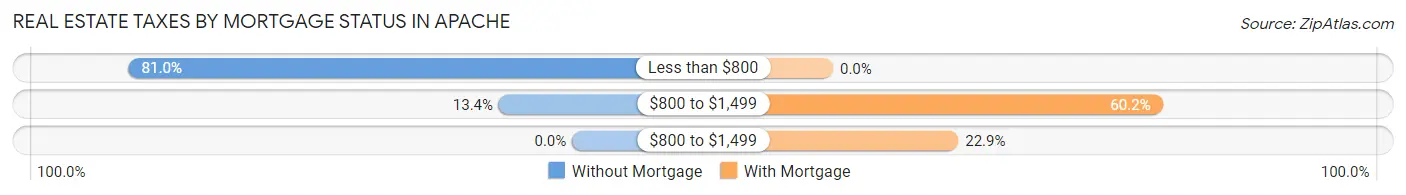
| Property Taxes | Without Mortgage | With Mortgage |
| Less than $800 | 115 (81.0%) | 0 (0.0%) |
| $800 to $1,499 | 19 (13.4%) | 71 (60.2%) |
| $800 to $1,499 | 0 (0.0%) | 27 (22.9%) |
| Total | 142 (100.0%) | 118 (100.0%) |
Health & Disability in Apache
Health Insurance Coverage by Age in Apache
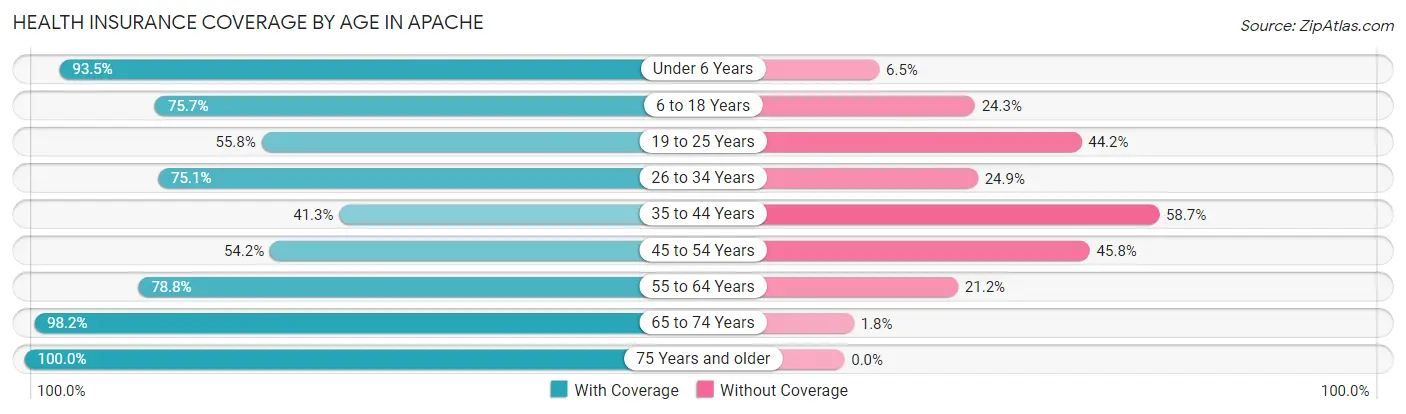
| Age Bracket | With Coverage | Without Coverage |
| Under 6 Years | 72 (93.5%) | 5 (6.5%) |
| 6 to 18 Years | 112 (75.7%) | 36 (24.3%) |
| 19 to 25 Years | 48 (55.8%) | 38 (44.2%) |
| 26 to 34 Years | 154 (75.1%) | 51 (24.9%) |
| 35 to 44 Years | 50 (41.3%) | 71 (58.7%) |
| 45 to 54 Years | 64 (54.2%) | 54 (45.8%) |
| 55 to 64 Years | 93 (78.8%) | 25 (21.2%) |
| 65 to 74 Years | 111 (98.2%) | 2 (1.8%) |
| 75 Years and older | 79 (100.0%) | 0 (0.0%) |
| Total | 783 (73.5%) | 282 (26.5%) |
Health Insurance Coverage by Citizenship Status in Apache
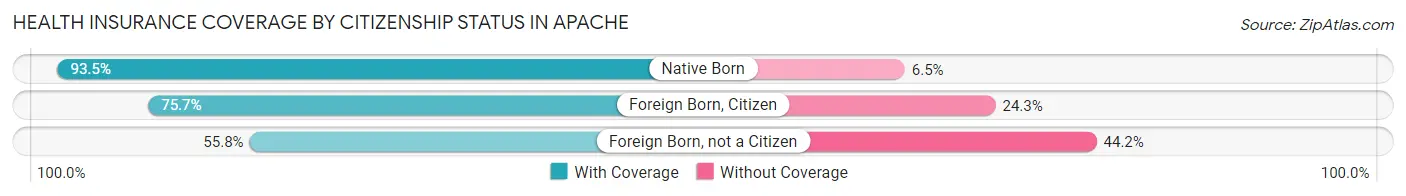
| Citizenship Status | With Coverage | Without Coverage |
| Native Born | 72 (93.5%) | 5 (6.5%) |
| Foreign Born, Citizen | 112 (75.7%) | 36 (24.3%) |
| Foreign Born, not a Citizen | 48 (55.8%) | 38 (44.2%) |
Health Insurance Coverage by Household Income in Apache
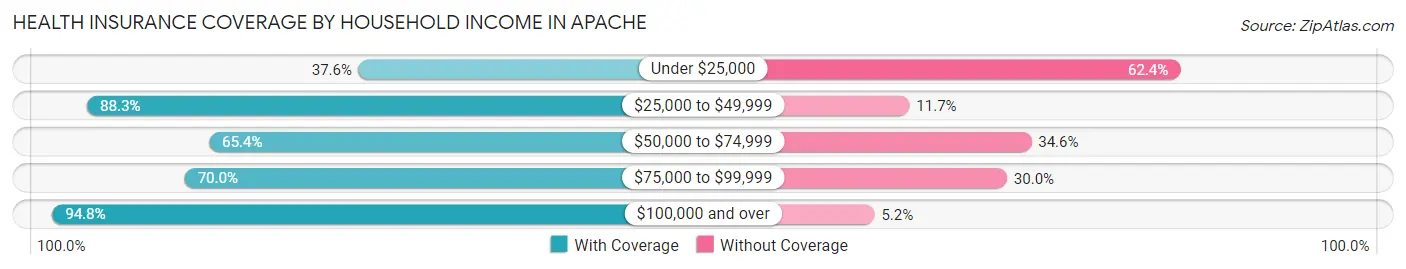
| Household Income | With Coverage | Without Coverage |
| Under $25,000 | 71 (37.6%) | 118 (62.4%) |
| $25,000 to $49,999 | 271 (88.3%) | 36 (11.7%) |
| $50,000 to $74,999 | 142 (65.4%) | 75 (34.6%) |
| $75,000 to $99,999 | 98 (70.0%) | 42 (30.0%) |
| $100,000 and over | 201 (94.8%) | 11 (5.2%) |
Public vs Private Health Insurance Coverage by Age in Apache
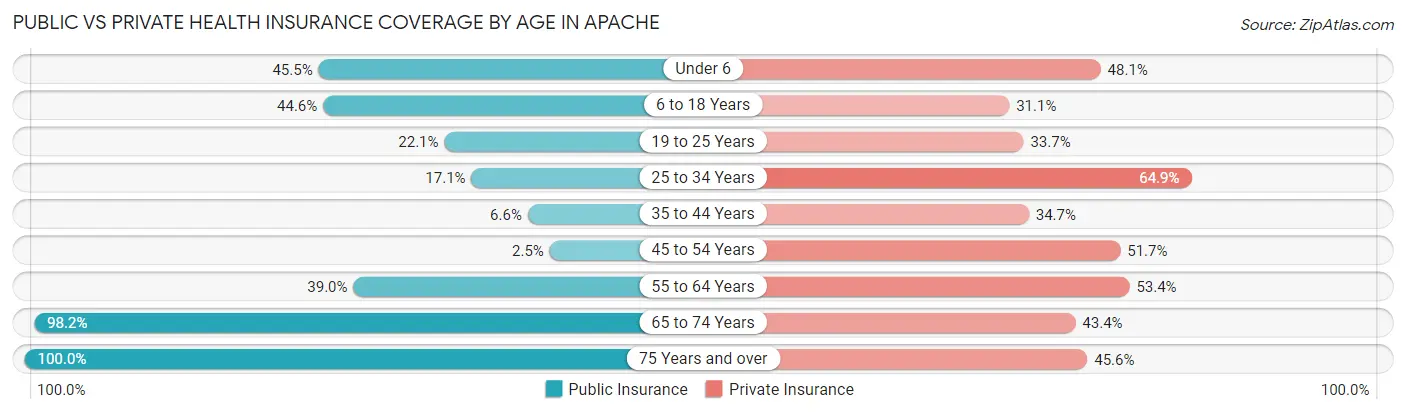
| Age Bracket | Public Insurance | Private Insurance |
| Under 6 | 35 (45.5%) | 37 (48.0%) |
| 6 to 18 Years | 66 (44.6%) | 46 (31.1%) |
| 19 to 25 Years | 19 (22.1%) | 29 (33.7%) |
| 25 to 34 Years | 35 (17.1%) | 133 (64.9%) |
| 35 to 44 Years | 8 (6.6%) | 42 (34.7%) |
| 45 to 54 Years | 3 (2.5%) | 61 (51.7%) |
| 55 to 64 Years | 46 (39.0%) | 63 (53.4%) |
| 65 to 74 Years | 111 (98.2%) | 49 (43.4%) |
| 75 Years and over | 79 (100.0%) | 36 (45.6%) |
| Total | 402 (37.8%) | 496 (46.6%) |
Disability Status by Sex by Age in Apache
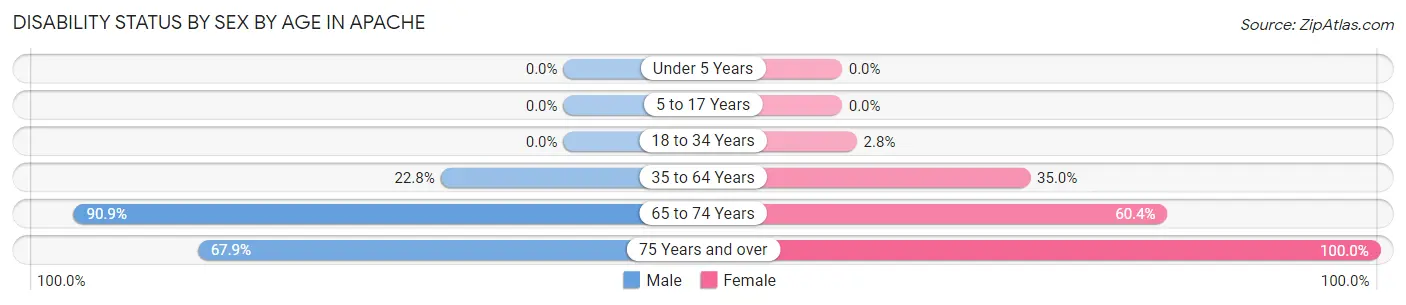
| Age Bracket | Male | Female |
| Under 5 Years | 0 (0.0%) | 0 (0.0%) |
| 5 to 17 Years | 0 (0.0%) | 0 (0.0%) |
| 18 to 34 Years | 0 (0.0%) | 5 (2.8%) |
| 35 to 64 Years | 39 (22.8%) | 65 (34.9%) |
| 65 to 74 Years | 20 (90.9%) | 55 (60.4%) |
| 75 Years and over | 19 (67.9%) | 51 (100.0%) |
Disability Class by Sex by Age in Apache
Disability Class: Hearing Difficulty
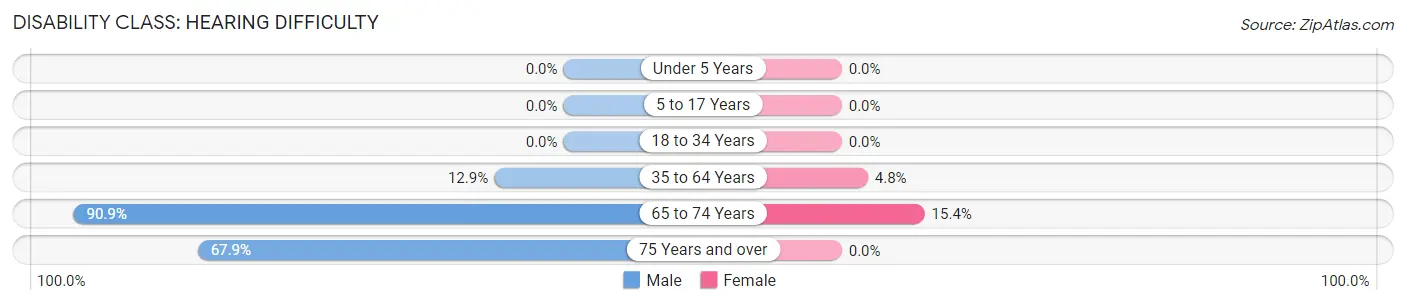
| Age Bracket | Male | Female |
| Under 5 Years | 0 (0.0%) | 0 (0.0%) |
| 5 to 17 Years | 0 (0.0%) | 0 (0.0%) |
| 18 to 34 Years | 0 (0.0%) | 0 (0.0%) |
| 35 to 64 Years | 22 (12.9%) | 9 (4.8%) |
| 65 to 74 Years | 20 (90.9%) | 14 (15.4%) |
| 75 Years and over | 19 (67.9%) | 0 (0.0%) |
Disability Class: Vision Difficulty
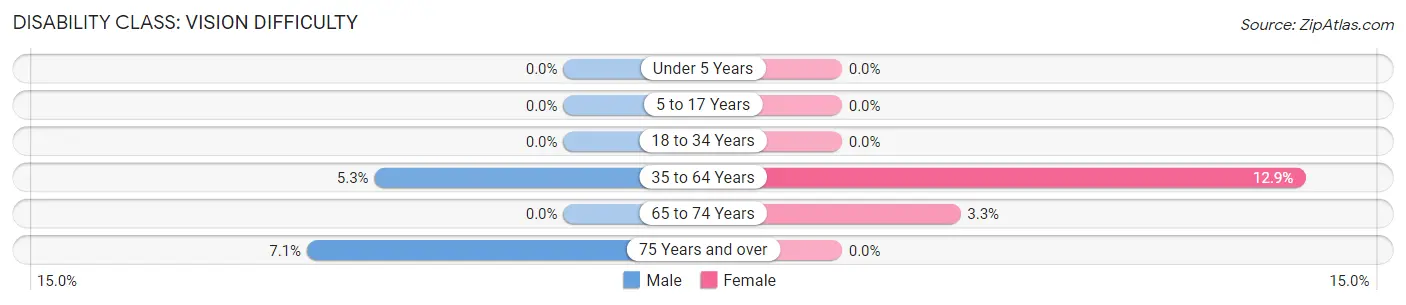
| Age Bracket | Male | Female |
| Under 5 Years | 0 (0.0%) | 0 (0.0%) |
| 5 to 17 Years | 0 (0.0%) | 0 (0.0%) |
| 18 to 34 Years | 0 (0.0%) | 0 (0.0%) |
| 35 to 64 Years | 9 (5.3%) | 24 (12.9%) |
| 65 to 74 Years | 0 (0.0%) | 3 (3.3%) |
| 75 Years and over | 2 (7.1%) | 0 (0.0%) |
Disability Class: Cognitive Difficulty
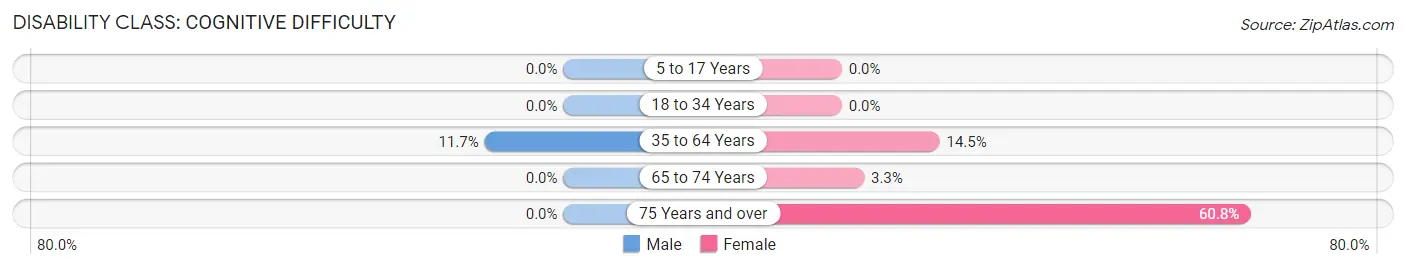
| Age Bracket | Male | Female |
| 5 to 17 Years | 0 (0.0%) | 0 (0.0%) |
| 18 to 34 Years | 0 (0.0%) | 0 (0.0%) |
| 35 to 64 Years | 20 (11.7%) | 27 (14.5%) |
| 65 to 74 Years | 0 (0.0%) | 3 (3.3%) |
| 75 Years and over | 0 (0.0%) | 31 (60.8%) |
Disability Class: Ambulatory Difficulty
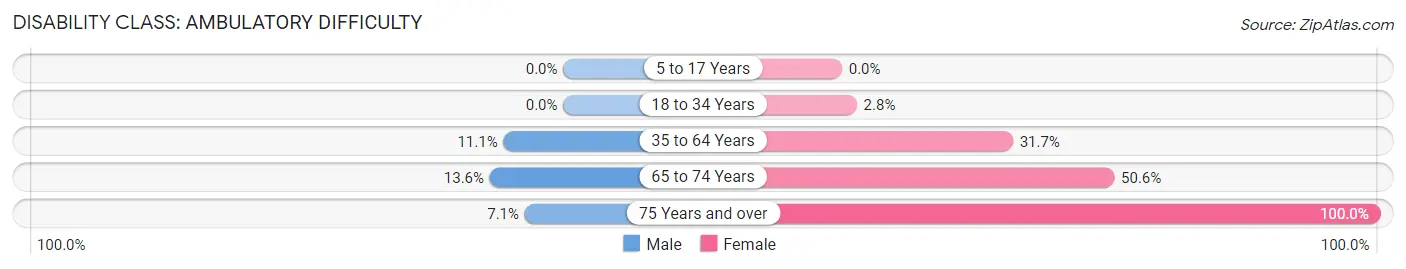
| Age Bracket | Male | Female |
| 5 to 17 Years | 0 (0.0%) | 0 (0.0%) |
| 18 to 34 Years | 0 (0.0%) | 5 (2.8%) |
| 35 to 64 Years | 19 (11.1%) | 59 (31.7%) |
| 65 to 74 Years | 3 (13.6%) | 46 (50.5%) |
| 75 Years and over | 2 (7.1%) | 51 (100.0%) |
Disability Class: Self-Care Difficulty
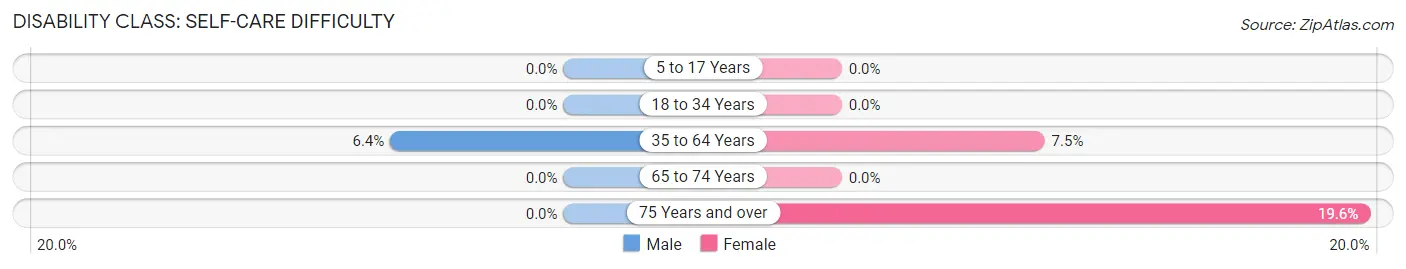
| Age Bracket | Male | Female |
| 5 to 17 Years | 0 (0.0%) | 0 (0.0%) |
| 18 to 34 Years | 0 (0.0%) | 0 (0.0%) |
| 35 to 64 Years | 11 (6.4%) | 14 (7.5%) |
| 65 to 74 Years | 0 (0.0%) | 0 (0.0%) |
| 75 Years and over | 0 (0.0%) | 10 (19.6%) |
Technology Access in Apache
Computing Device Access in Apache
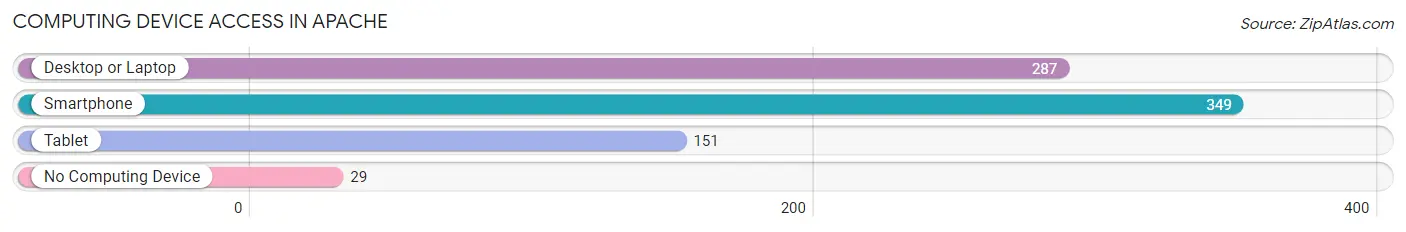
| Device Type | # Households | % Households |
| Desktop or Laptop | 287 | 71.2% |
| Smartphone | 349 | 86.6% |
| Tablet | 151 | 37.5% |
| No Computing Device | 29 | 7.2% |
| Total | 403 | 100.0% |
Internet Access in Apache
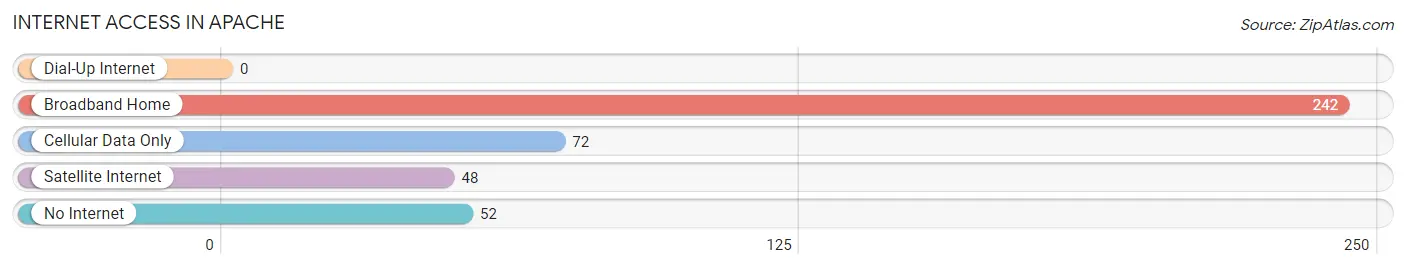
| Internet Type | # Households | % Households |
| Dial-Up Internet | 0 | 0.0% |
| Broadband Home | 242 | 60.1% |
| Cellular Data Only | 72 | 17.9% |
| Satellite Internet | 48 | 11.9% |
| No Internet | 52 | 12.9% |
| Total | 403 | 100.0% |
Apache Summary
Apache is a small town located in Caddo County, Oklahoma. It is situated in the southwestern part of the state, about 25 miles east of Lawton. The town was founded in 1901 and was named after the Apache tribe of Native Americans who lived in the area. Apache is a rural community with a population of 1,845 as of the 2010 census.
History
The area around Apache was originally inhabited by the Apache tribe of Native Americans. The tribe was forced to move to the Fort Sill Indian Reservation in 1875. In 1901, the town of Apache was founded by the Choctaw and Chickasaw Nations. The town was named after the Apache tribe and was incorporated in 1906.
In the early 1900s, Apache was a thriving agricultural community. The town was home to several cotton gins, a flour mill, and a cottonseed oil mill. The town also had a bank, a hotel, and several stores.
In the 1920s, the town began to decline as the agricultural industry in the area declined. The Great Depression further hurt the town's economy. In the 1940s, the town began to recover as oil was discovered in the area. The oil industry provided jobs and economic stability to the town.
Geography
Apache is located in southwestern Oklahoma, about 25 miles east of Lawton. The town is situated in the Red Bed Plains region of the state. The terrain is mostly flat with some rolling hills. The town is located near the Washita River.
The climate in Apache is semi-arid with hot summers and mild winters. The average annual temperature is around 65 degrees Fahrenheit. The average annual precipitation is around 30 inches.
Economy
The economy of Apache is largely based on agriculture and oil production. The town is home to several cotton gins, a flour mill, and a cottonseed oil mill. The town also has several stores and restaurants.
The oil industry is a major employer in Apache. The town is home to several oil and gas companies, including Apache Corporation, which is the largest employer in the town.
Demographics
As of the 2010 census, Apache had a population of 1,845. The racial makeup of the town was 79.3% White, 0.7% African American, 0.7% Native American, 0.2% Asian, 0.1% Pacific Islander, and 18.1% from other races. Hispanic or Latino of any race were 4.2% of the population.
The median household income in Apache was $30,938, and the median family income was $35,938. The per capita income was $15,938. About 17.2% of the population was below the poverty line.
Common Questions
What is Per Capita Income in Apache?
Per Capita income in Apache is $24,831.
What is the Median Family Income in Apache?
Median Family Income in Apache is $60,625.
What is the Median Household income in Apache?
Median Household Income in Apache is $58,203.
What is Income or Wage Gap in Apache?
Income or Wage Gap in Apache is 42.6%.
Women in Apache earn 57.4 cents for every dollar earned by a man.
What is Inequality or Gini Index in Apache?
Inequality or Gini Index in Apache is 0.39.
What is the Total Population of Apache?
Total Population of Apache is 1,065.
What is the Total Male Population of Apache?
Total Male Population of Apache is 494.
What is the Total Female Population of Apache?
Total Female Population of Apache is 571.
What is the Ratio of Males per 100 Females in Apache?
There are 86.51 Males per 100 Females in Apache.
What is the Ratio of Females per 100 Males in Apache?
There are 115.59 Females per 100 Males in Apache.
What is the Median Population Age in Apache?
Median Population Age in Apache is 36.8 Years.
What is the Average Family Size in Apache
Average Family Size in Apache is 3.0 People.
What is the Average Household Size in Apache
Average Household Size in Apache is 2.6 People.
How Large is the Labor Force in Apache?
There are 464 People in the Labor Forcein in Apache.
What is the Percentage of People in the Labor Force in Apache?
51.0% of People are in the Labor Force in Apache.
What is the Unemployment Rate in Apache?
Unemployment Rate in Apache is 7.5%.