Zip Codes with the Highest Percentage of Population Employed in Life, Physical & Social Science in Oklahoma City, OK

RELATED REPORTS & OPTIONS

Life, Physical & Social Science
Population
Families and Households
Female Fertility
Female Fertility (Unmarried)
Race (Community Size)
Race (Percentage)
Ancestry (Community Size)
AfricanAlaska NativeAlbanianAmericanApacheArabArapahoArgentineanArmenianAustralianAustrianBahamianBangladeshiBarbadianBasqueBelgianBhutaneseBlackfeetBolivianBrazilianBritishBritish West IndianBulgarianBurmeseCajunCambodianCanadianCelticCentral AmericanCentral American IndianCherokeeCheyenneChickasawChileanChippewaChoctawColombianComancheCreeCreekCroatianCubanCzechCzechoslovakianDanishDelawareDominicanDutchDutch West IndianEastern EuropeanEcuadorianEgyptianEnglishEstonianEthiopianEuropeanFijianFilipinoFinnishFrenchFrench American IndianFrench CanadianGermanGerman RussianGhanaianGreekGuamanian / ChamorroGuatemalanGuyaneseHaitianHonduranHopiHungarianIcelanderIndian (Asian)IndonesianInupiatIranianIraqiIrishIroquoisIsraeliItalianJamaicanJapaneseJordanianKenyanKiowaKoreanLaotianLatvianLebaneseLiberianLithuanianLuxembourgerMalaysianMexicanMexican American IndianMongolianMoroccanNative HawaiianNavajoNew ZealanderNicaraguanNigerianNorthern EuropeanNorwegianOkinawanOsagePakistaniPalestinianPanamanianPennsylvania GermanPeruvianPimaPolishPortuguesePotawatomiPuebloPuerto RicanRomanianRussianSalvadoranSamoanScandinavianScotch-IrishScottishSeminoleSerbianSiouxSlavicSlovakSloveneSouth AfricanSouth AmericanSouth American IndianSpaniardSpanishSpanish American IndianSri LankanSubsaharan AfricanSudaneseSwedishSwissSyrianThaiTlingit-HaidaTonganTrinidadian and TobagonianTurkishU.S. Virgin IslanderUkrainianUruguayanVenezuelanVietnameseWelshWest IndianYugoslavianZimbabwean
Ancestry (Percentage)
AfricanAlaska NativeAlbanianAmericanApacheArabArapahoArgentineanArmenianAustralianAustrianBahamianBangladeshiBarbadianBasqueBelgianBhutaneseBlackfeetBolivianBrazilianBritishBritish West IndianBulgarianBurmeseCajunCambodianCanadianCelticCentral AmericanCentral American IndianCherokeeCheyenneChickasawChileanChippewaChoctawColombianComancheCreeCreekCroatianCubanCzechCzechoslovakianDanishDelawareDominicanDutchDutch West IndianEastern EuropeanEcuadorianEgyptianEnglishEstonianEthiopianEuropeanFijianFilipinoFinnishFrenchFrench American IndianFrench CanadianGermanGerman RussianGhanaianGreekGuamanian / ChamorroGuatemalanGuyaneseHaitianHonduranHopiHungarianIcelanderIndian (Asian)IndonesianInupiatIranianIraqiIrishIroquoisIsraeliItalianJamaicanJapaneseJordanianKenyanKiowaKoreanLaotianLatvianLebaneseLiberianLithuanianLuxembourgerMalaysianMexicanMexican American IndianMongolianMoroccanNative HawaiianNavajoNew ZealanderNicaraguanNigerianNorthern EuropeanNorwegianOkinawanOsagePakistaniPalestinianPanamanianPennsylvania GermanPeruvianPimaPolishPortuguesePotawatomiPuebloPuerto RicanRomanianRussianSalvadoranSamoanScandinavianScotch-IrishScottishSeminoleSerbianSiouxSlavicSlovakSloveneSouth AfricanSouth AmericanSouth American IndianSpaniardSpanishSpanish American IndianSri LankanSubsaharan AfricanSudaneseSwedishSwissSyrianThaiTlingit-HaidaTonganTrinidadian and TobagonianTurkishU.S. Virgin IslanderUkrainianUruguayanVenezuelanVietnameseWelshWest IndianYugoslavianZimbabwean
Immigrant Origin (Total)
AfricaArgentinaAsiaAustraliaAustriaBahamasBangladeshBosnia and HerzegovinaBrazilBulgariaBurma / MyanmarCambodiaCameroonCanadaCaribbeanCentral AmericaChileChinaColombiaCubaDominican RepublicEastern AfricaEastern AsiaEastern EuropeEcuadorEgyptEl SalvadorEnglandEritreaEthiopiaEuropeFranceGermanyGhanaGreeceGuatemalaHondurasHong KongIndiaIndonesiaIranIraqIrelandItalyJamaicaJapanJordanKazakhstanKenyaKoreaKuwaitLaosLatin AmericaLebanonLiberiaMalaysiaMexicoMiddle AfricaMoroccoNepalNetherlandsNicaraguaNigeriaNorthern AfricaNorthern EuropeNorwayOceaniaPakistanPanamaPeruPhilippinesPolandPortugalRussiaSaudi ArabiaScotlandSingaporeSouth AfricaSouth AmericaSouth Central AsiaSouth Eastern AsiaSouthern EuropeSpainSudanSyriaTaiwanThailandTrinidad and TobagoTurkeyUkraineVenezuelaVietnamWestern AfricaWestern AsiaWestern EuropeZaireZimbabwe
Immigrant Origin (Percentage)
AfricaArgentinaAsiaAustraliaAustriaBahamasBangladeshBosnia and HerzegovinaBrazilBulgariaBurma / MyanmarCambodiaCameroonCanadaCaribbeanCentral AmericaChileChinaColombiaCubaDominican RepublicEastern AfricaEastern AsiaEastern EuropeEcuadorEgyptEl SalvadorEnglandEritreaEthiopiaEuropeFranceGermanyGhanaGreeceGuatemalaHondurasHong KongIndiaIndonesiaIranIraqIrelandItalyJamaicaJapanJordanKazakhstanKenyaKoreaKuwaitLaosLatin AmericaLebanonLiberiaMalaysiaMexicoMiddle AfricaMoroccoNepalNetherlandsNicaraguaNigeriaNorthern AfricaNorthern EuropeNorwayOceaniaPakistanPanamaPeruPhilippinesPolandPortugalRussiaSaudi ArabiaScotlandSingaporeSouth AfricaSouth AmericaSouth Central AsiaSouth Eastern AsiaSouthern EuropeSpainSudanSyriaTaiwanThailandTrinidad and TobagoTurkeyUkraineVenezuelaVietnamWestern AfricaWestern AsiaWestern EuropeZaireZimbabwe
Income
Income (Families)
Income (Households)
Poverty
Poverty (Families)
Unemployment
Employment Occupations
Employment Industries
Employer Class
Commute Time
Commute Means
School Enrollment
Education by Degree Field
Occupancy
Finances
Physical Characteristics
Oklahoma City
Compare Zip Codes
Comparison Subject

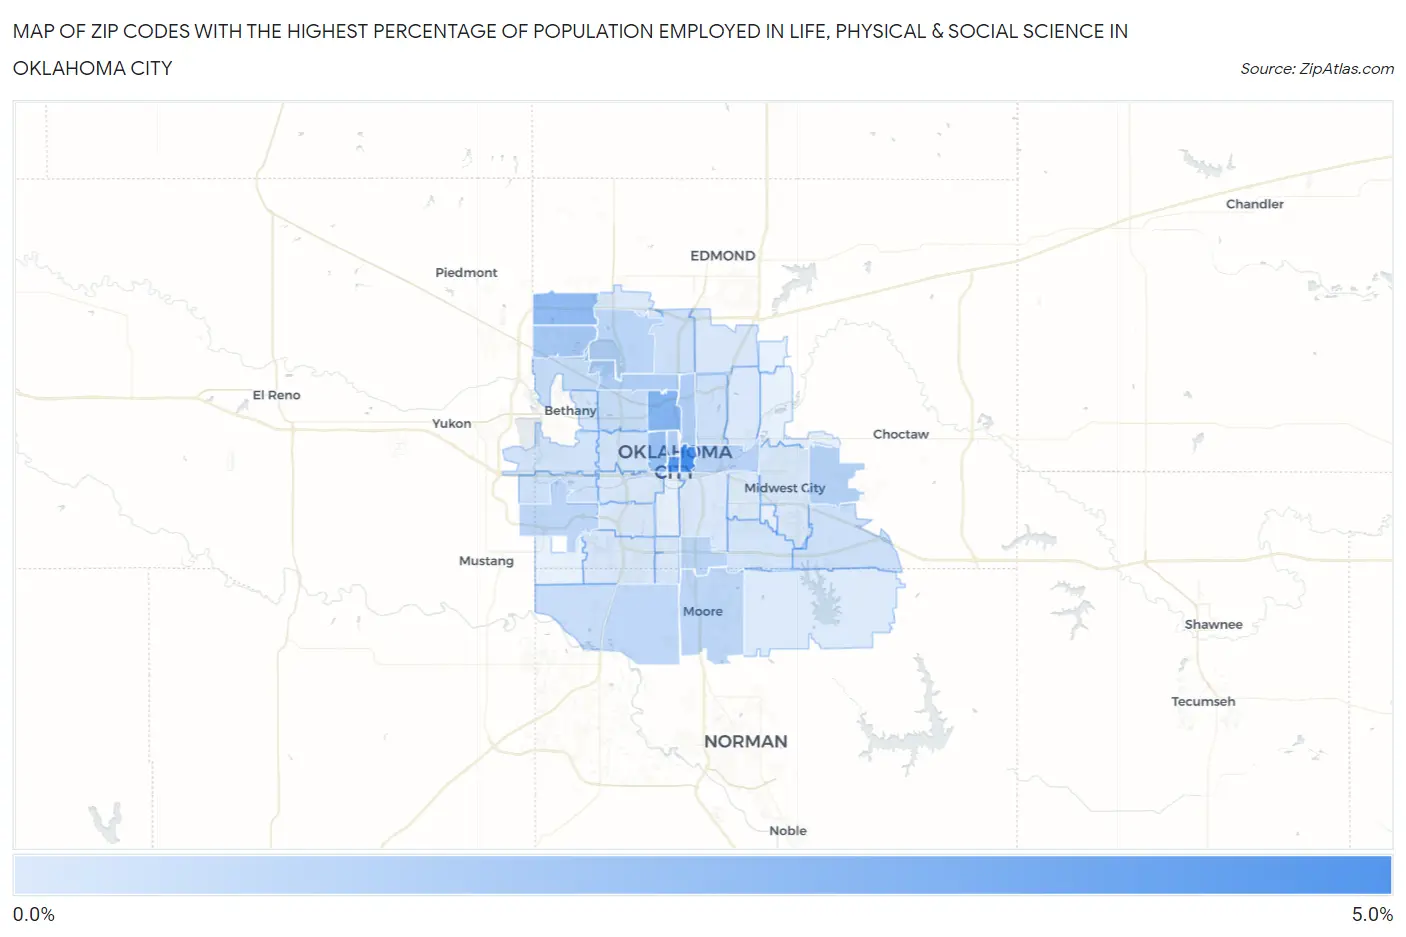
Map of Zip Codes with the Highest Percentage of Population Employed in Life, Physical & Social Science in Oklahoma City

0.0%
5.0%
Zip Codes with the Highest Percentage of Population Employed in Life, Physical & Social Science in Oklahoma City Map

Zip Codes with the Highest Percentage of Population Employed in Life, Physical & Social Science in Oklahoma City, OK

Zip Code % Employed vs State vs National
1.731044.7%0.76%(+3.95)#21.1%(+3.62)#848
2.731024.3%0.76%(+3.49)#51.1%(+3.16)#1,024
3.731182.9%0.76%(+2.12)#151.1%(+1.79)#2,016
4.731422.4%0.76%(+1.67)#261.1%(+1.34)#2,701
5.731062.2%0.76%(+1.44)#321.1%(+1.11)#3,172
6.731621.8%0.76%(+1.01)#451.1%(+0.683)#4,429
7.731051.5%0.76%(+0.782)#531.1%(+0.452)#5,425
8.731161.5%0.76%(+0.775)#541.1%(+0.445)#5,469
9.731031.4%0.76%(+0.659)#601.1%(+0.329)#6,084
10.731301.3%0.76%(+0.545)#691.1%(+0.215)#6,769
11.731171.2%0.76%(+0.482)#751.1%(+0.152)#7,186
12.731491.2%0.76%(+0.444)#791.1%(+0.113)#7,465
13.731201.2%0.76%(+0.408)#831.1%(+0.078)#7,738
14.731791.1%0.76%(+0.361)#891.1%(+0.031)#8,061
15.731601.1%0.76%(+0.318)#941.1%(-0.012)#8,403
16.731701.0%0.76%(+0.260)#1031.1%(-0.070)#8,876
17.731120.82%0.76%(+0.057)#1371.1%(-0.273)#10,823
18.731320.80%0.76%(+0.036)#1431.1%(-0.294)#11,029
19.731730.76%0.76%(-0.004)#1451.1%(-0.334)#11,434
20.731500.64%0.76%(-0.120)#1731.1%(-0.450)#12,772
21.731110.62%0.76%(-0.140)#1771.1%(-0.470)#13,031
22.731140.62%0.76%(-0.143)#1781.1%(-0.473)#13,072
23.731280.52%0.76%(-0.240)#2091.1%(-0.570)#14,261
24.731070.51%0.76%(-0.254)#2131.1%(-0.584)#14,421
25.731270.48%0.76%(-0.277)#2231.1%(-0.607)#14,701
26.731350.43%0.76%(-0.334)#2371.1%(-0.664)#15,407
27.731220.42%0.76%(-0.344)#2411.1%(-0.674)#15,541
28.731080.28%0.76%(-0.477)#2721.1%(-0.808)#17,250
29.731100.27%0.76%(-0.487)#2751.1%(-0.817)#17,367
30.731310.27%0.76%(-0.495)#2781.1%(-0.825)#17,464
31.731590.26%0.76%(-0.497)#2801.1%(-0.827)#17,488
32.731390.24%0.76%(-0.521)#2881.1%(-0.851)#17,755
33.731340.21%0.76%(-0.555)#3021.1%(-0.885)#18,139
34.731210.20%0.76%(-0.562)#3051.1%(-0.892)#18,214
35.731290.20%0.76%(-0.565)#3061.1%(-0.895)#18,238
36.731190.19%0.76%(-0.567)#3071.1%(-0.898)#18,270
37.731650.15%0.76%(-0.613)#3121.1%(-0.943)#18,698
38.731150.13%0.76%(-0.627)#3141.1%(-0.957)#18,814

Common Questions

What are the Top 10 Zip Codes with the Highest Percentage of Population Employed in Life, Physical & Social Science in Oklahoma City, OK?
Top 10 Zip Codes with the Highest Percentage of Population Employed in Life, Physical & Social Science in Oklahoma City, OK are:
#1
4.7%
#2
4.3%
#3
2.9%
#4
2.4%
#5
2.2%
#6
1.8%
#7
1.5%
#8
1.5%
#9
1.4%
#10
1.3%
What zip code has the Highest Percentage of Population Employed in Life, Physical & Social Science in Oklahoma City, OK?
73104 has the Highest Percentage of Population Employed in Life, Physical & Social Science in Oklahoma City, OK with 4.7%.
What is the Percentage of Population Employed in Life, Physical & Social Science in Oklahoma City, OK?
Percentage of Population Employed in Life, Physical & Social Science in Oklahoma City is 0.93%.
What is the Percentage of Population Employed in Life, Physical & Social Science in Oklahoma?
Percentage of Population Employed in Life, Physical & Social Science in Oklahoma is 0.76%.
What is the Percentage of Population Employed in Life, Physical & Social Science in the United States?
Percentage of Population Employed in Life, Physical & Social Science in the United States is 1.1%.