Cushing, OK Map & Demographics
Cushing Map
Cushing Overview
$24,561
PER CAPITA INCOME
$56,832
AVG FAMILY INCOME
$46,602
AVG HOUSEHOLD INCOME
20.8%
WAGE / INCOME GAP [ % ]
79.2¢/ $1
WAGE / INCOME GAP [ $ ]
$13,185
FAMILY INCOME DEFICIT
0.46
INEQUALITY / GINI INDEX
8,336
TOTAL POPULATION
4,673
MALE POPULATION
3,663
FEMALE POPULATION
127.57
MALES / 100 FEMALES
78.39
FEMALES / 100 MALES
35.8
MEDIAN AGE
3.1
AVG FAMILY SIZE
2.4
AVG HOUSEHOLD SIZE
3,696
LABOR FORCE [ PEOPLE ]
54.3%
PERCENT IN LABOR FORCE
4.5%
UNEMPLOYMENT RATE
Cushing Zip Codes
Cushing Area Codes
Income in Cushing
Income Overview in Cushing
Per Capita Income in Cushing is $24,561, while median incomes of families and households are $56,832 and $46,602 respectively.
| Characteristic | Number | Measure |
| Per Capita Income | 8,336 | $24,561 |
| Median Family Income | 1,815 | $56,832 |
| Mean Family Income | 1,815 | $79,608 |
| Median Household Income | 3,034 | $46,602 |
| Mean Household Income | 3,034 | $63,332 |
| Income Deficit | 1,815 | $13,185 |
| Wage / Income Gap (%) | 8,336 | 20.83% |
| Wage / Income Gap ($) | 8,336 | 79.17¢ per $1 |
| Gini / Inequality Index | 8,336 | 0.46 |
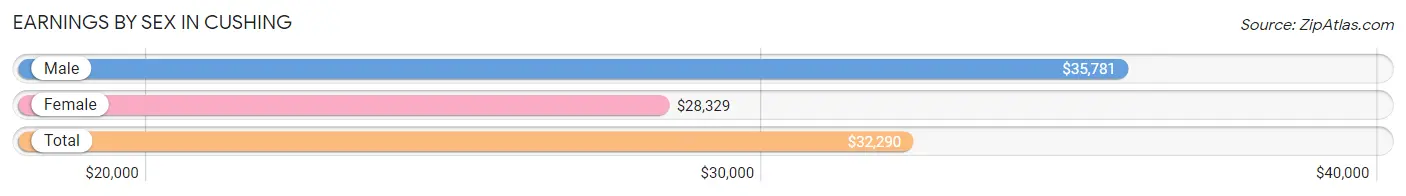
Earnings by Sex in Cushing
Average Earnings in Cushing are $32,290, $35,781 for men and $28,329 for women, a difference of 20.8%.
| Sex | Number | Average Earnings |
| Male | 2,301 (56.8%) | $35,781 |
| Female | 1,749 (43.2%) | $28,329 |
| Total | 4,050 (100.0%) | $32,290 |
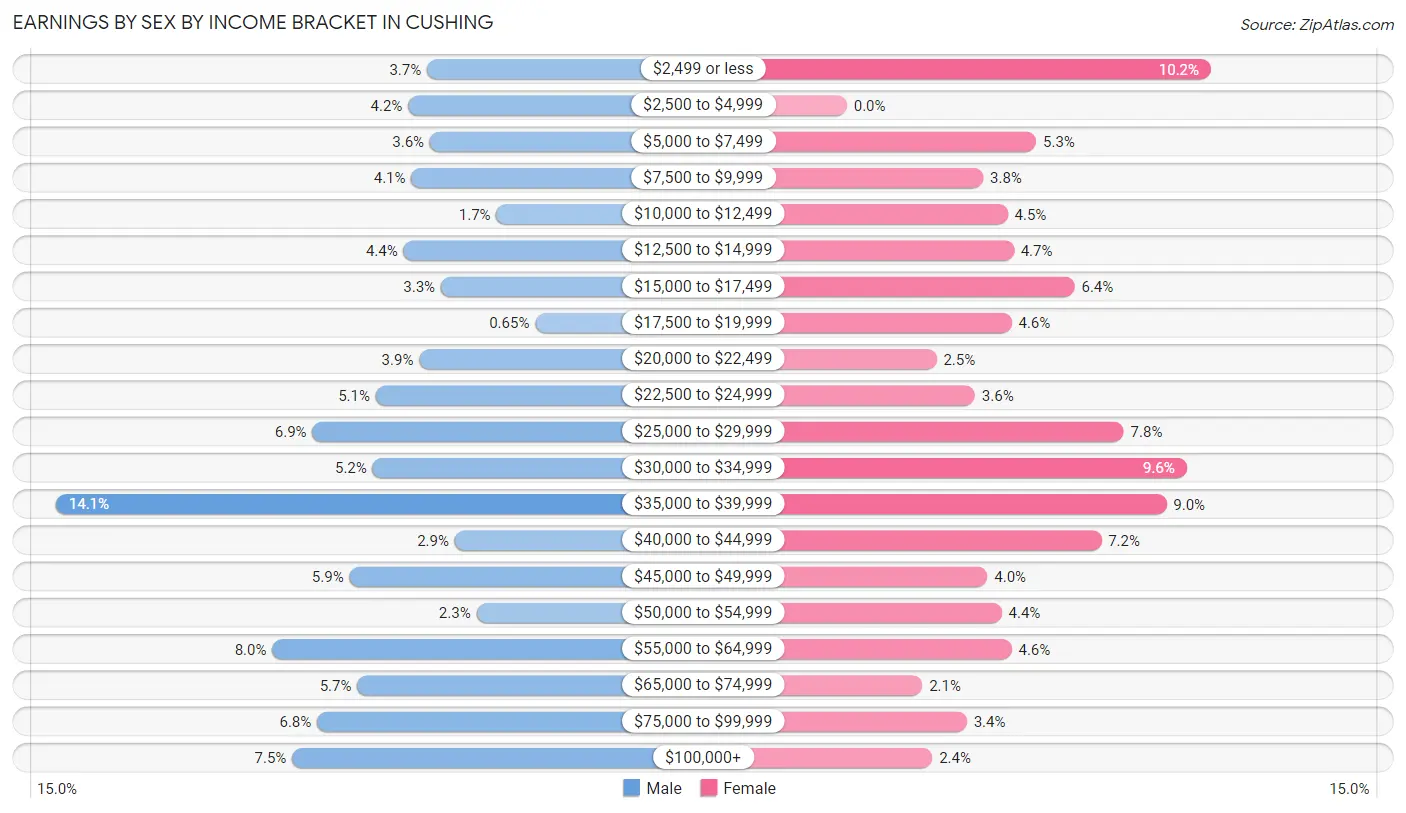
Earnings by Sex by Income Bracket in Cushing
The most common earnings brackets in Cushing are $35,000 to $39,999 for men (325 | 14.1%) and $2,499 or less for women (179 | 10.2%).
| Income | Male | Female |
| $2,499 or less | 85 (3.7%) | 179 (10.2%) |
| $2,500 to $4,999 | 97 (4.2%) | 0 (0.0%) |
| $5,000 to $7,499 | 83 (3.6%) | 93 (5.3%) |
| $7,500 to $9,999 | 95 (4.1%) | 67 (3.8%) |
| $10,000 to $12,499 | 40 (1.7%) | 79 (4.5%) |
| $12,500 to $14,999 | 100 (4.3%) | 82 (4.7%) |
| $15,000 to $17,499 | 76 (3.3%) | 112 (6.4%) |
| $17,500 to $19,999 | 15 (0.6%) | 81 (4.6%) |
| $20,000 to $22,499 | 90 (3.9%) | 44 (2.5%) |
| $22,500 to $24,999 | 118 (5.1%) | 63 (3.6%) |
| $25,000 to $29,999 | 159 (6.9%) | 136 (7.8%) |
| $30,000 to $34,999 | 120 (5.2%) | 167 (9.6%) |
| $35,000 to $39,999 | 325 (14.1%) | 157 (9.0%) |
| $40,000 to $44,999 | 67 (2.9%) | 125 (7.1%) |
| $45,000 to $49,999 | 135 (5.9%) | 69 (4.0%) |
| $50,000 to $54,999 | 53 (2.3%) | 76 (4.3%) |
| $55,000 to $64,999 | 185 (8.0%) | 81 (4.6%) |
| $65,000 to $74,999 | 130 (5.7%) | 37 (2.1%) |
| $75,000 to $99,999 | 156 (6.8%) | 59 (3.4%) |
| $100,000+ | 172 (7.5%) | 42 (2.4%) |
| Total | 2,301 (100.0%) | 1,749 (100.0%) |
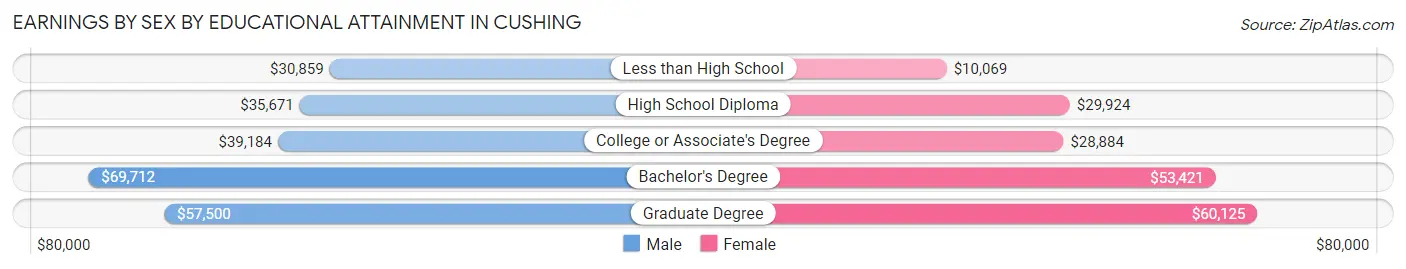
Earnings by Sex by Educational Attainment in Cushing
Average earnings in Cushing are $37,384 for men and $30,725 for women, a difference of 17.8%. Men with an educational attainment of bachelor's degree enjoy the highest average annual earnings of $69,712, while those with less than high school education earn the least with $30,859. Women with an educational attainment of graduate degree earn the most with the average annual earnings of $60,125, while those with less than high school education have the smallest earnings of $10,069.
| Educational Attainment | Male Income | Female Income |
| Less than High School | $30,859 | $10,069 |
| High School Diploma | $35,671 | $29,924 |
| College or Associate's Degree | $39,184 | $28,884 |
| Bachelor's Degree | $69,712 | $53,421 |
| Graduate Degree | $57,500 | $60,125 |
| Total | $37,384 | $30,725 |
Family Income in Cushing
Family Income Brackets in Cushing
According to the Cushing family income data, there are 416 families falling into the $50,000 to $74,999 income range, which is the most common income bracket and makes up 22.9% of all families. Conversely, the $10,000 to $14,999 income bracket is the least frequent group with only 27 families (1.5%) belonging to this category.
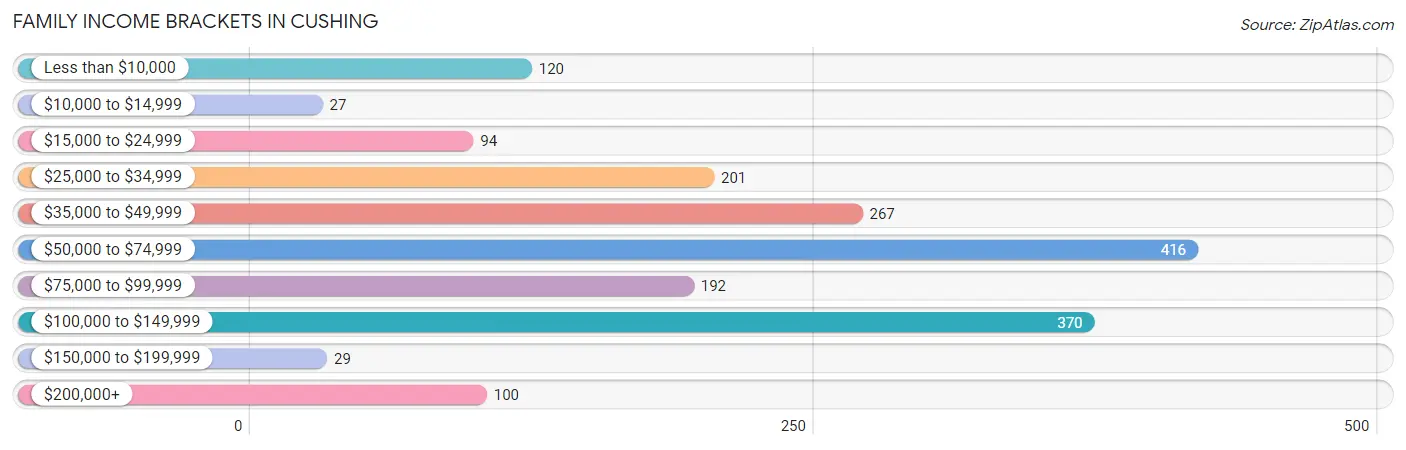
| Income Bracket | # Families | % Families |
| Less than $10,000 | 120 | 6.6% |
| $10,000 to $14,999 | 27 | 1.5% |
| $15,000 to $24,999 | 94 | 5.2% |
| $25,000 to $34,999 | 201 | 11.1% |
| $35,000 to $49,999 | 267 | 14.7% |
| $50,000 to $74,999 | 416 | 22.9% |
| $75,000 to $99,999 | 192 | 10.6% |
| $100,000 to $149,999 | 370 | 20.4% |
| $150,000 to $199,999 | 29 | 1.6% |
| $200,000+ | 100 | 5.5% |
Family Income by Famaliy Size in Cushing
4-person families (371 | 20.4%) account for the highest median family income in Cushing with $88,036 per family, while 2-person families (723 | 39.8%) have the highest median income of $29,726 per family member.
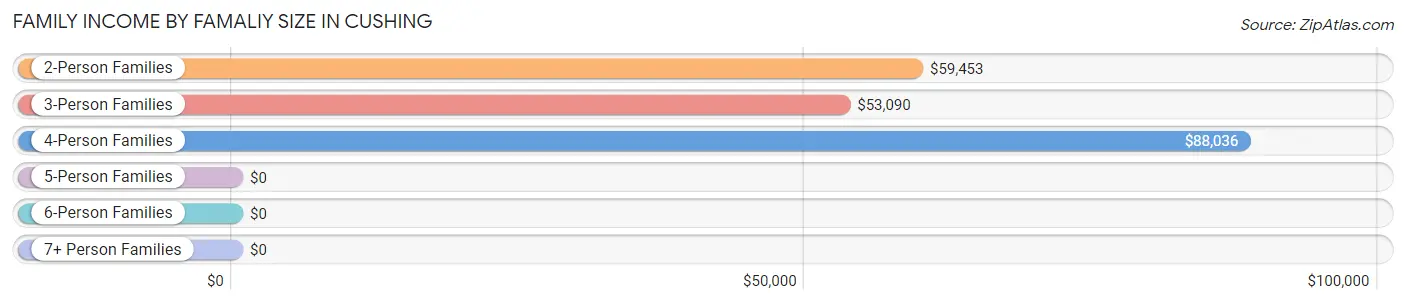
| Income Bracket | # Families | Median Income |
| 2-Person Families | 723 (39.8%) | $59,453 |
| 3-Person Families | 543 (29.9%) | $53,090 |
| 4-Person Families | 371 (20.4%) | $88,036 |
| 5-Person Families | 108 (5.9%) | $0 |
| 6-Person Families | 26 (1.4%) | $0 |
| 7+ Person Families | 44 (2.4%) | $0 |
| Total | 1,815 (100.0%) | $56,832 |
Family Income by Number of Earners in Cushing
The median family income in Cushing is $56,832, with families comprising 3+ earners (181) having the highest median family income of $103,967, while families with no earners (352) have the lowest median family income of $32,151, accounting for 10.0% and 19.4% of families, respectively.
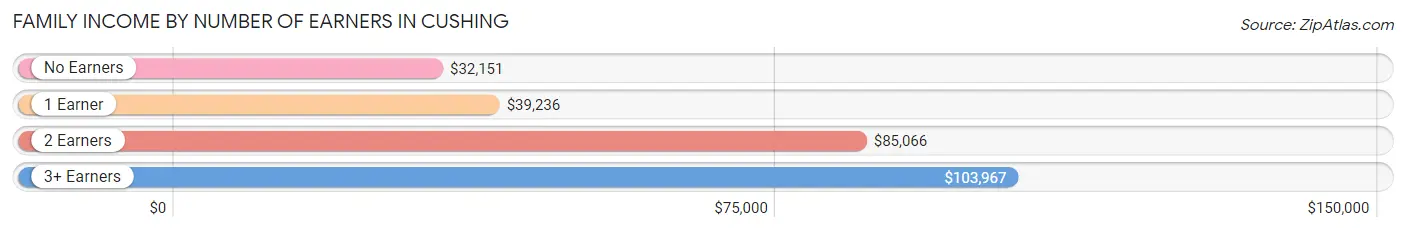
| Number of Earners | # Families | Median Income |
| No Earners | 352 (19.4%) | $32,151 |
| 1 Earner | 487 (26.8%) | $39,236 |
| 2 Earners | 795 (43.8%) | $85,066 |
| 3+ Earners | 181 (10.0%) | $103,967 |
| Total | 1,815 (100.0%) | $56,832 |
Household Income in Cushing
Household Income Brackets in Cushing
With 640 households falling in the category, the $50,000 to $74,999 income range is the most frequent in Cushing, accounting for 21.1% of all households. In contrast, only 30 households (1.0%) fall into the $150,000 to $199,999 income bracket, making it the least populous group.
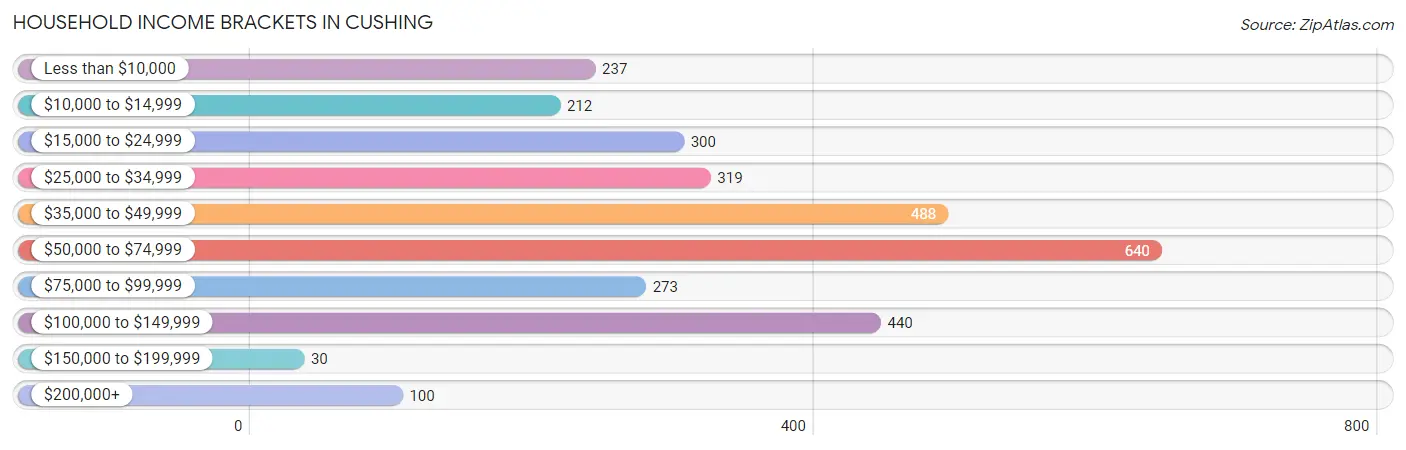
| Income Bracket | # Households | % Households |
| Less than $10,000 | 237 | 7.8% |
| $10,000 to $14,999 | 212 | 7.0% |
| $15,000 to $24,999 | 300 | 9.9% |
| $25,000 to $34,999 | 319 | 10.5% |
| $35,000 to $49,999 | 488 | 16.1% |
| $50,000 to $74,999 | 640 | 21.1% |
| $75,000 to $99,999 | 273 | 9.0% |
| $100,000 to $149,999 | 440 | 14.5% |
| $150,000 to $199,999 | 30 | 1.0% |
| $200,000+ | 100 | 3.3% |
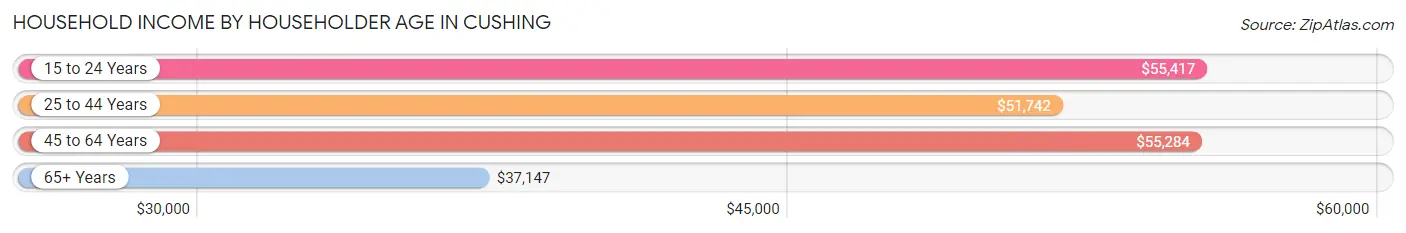
Household Income by Householder Age in Cushing
The median household income in Cushing is $46,602, with the highest median household income of $55,417 found in the 15 to 24 years age bracket for the primary householder. A total of 153 households (5.0%) fall into this category. Meanwhile, the 65+ years age bracket for the primary householder has the lowest median household income of $37,147, with 833 households (27.5%) in this group.
| Income Bracket | # Households | Median Income |
| 15 to 24 Years | 153 (5.0%) | $55,417 |
| 25 to 44 Years | 977 (32.2%) | $51,742 |
| 45 to 64 Years | 1,071 (35.3%) | $55,284 |
| 65+ Years | 833 (27.5%) | $37,147 |
| Total | 3,034 (100.0%) | $46,602 |
Poverty in Cushing
Income Below Poverty by Sex and Age in Cushing
With 17.4% poverty level for males and 19.4% for females among the residents of Cushing, 5 year old males and under 5 year old females are the most vulnerable to poverty, with 49 males (100.0%) and 53 females (32.3%) in their respective age groups living below the poverty level.
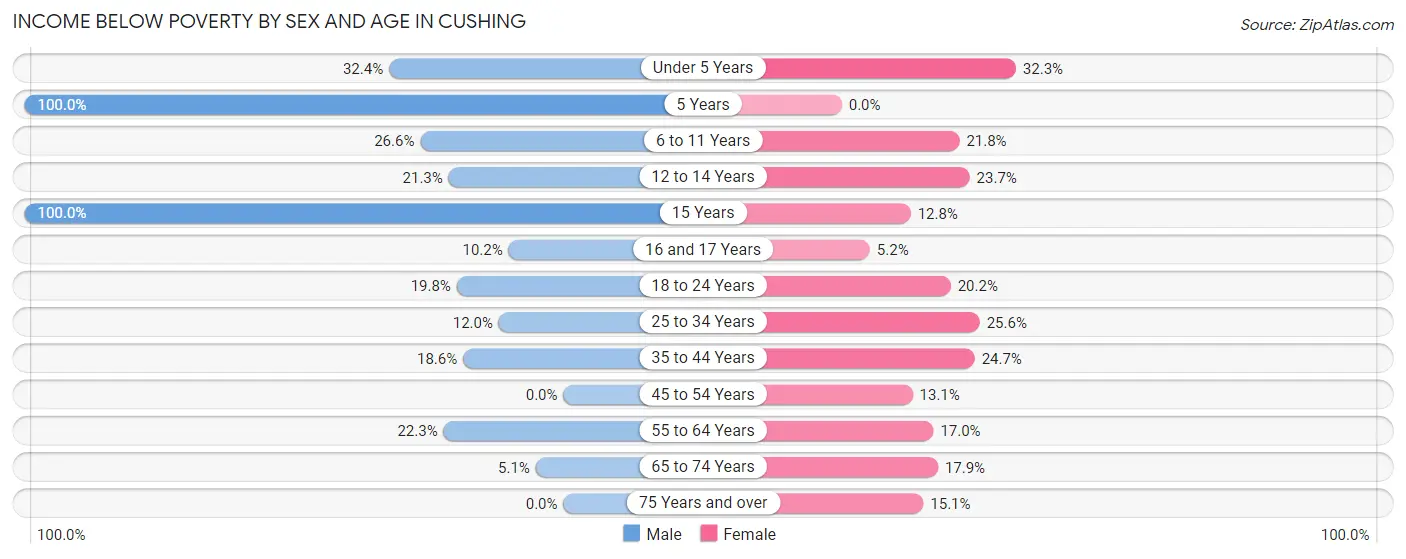
| Age Bracket | Male | Female |
| Under 5 Years | 90 (32.4%) | 53 (32.3%) |
| 5 Years | 49 (100.0%) | 0 (0.0%) |
| 6 to 11 Years | 98 (26.6%) | 57 (21.8%) |
| 12 to 14 Years | 23 (21.3%) | 28 (23.7%) |
| 15 Years | 23 (100.0%) | 11 (12.8%) |
| 16 and 17 Years | 12 (10.2%) | 6 (5.2%) |
| 18 to 24 Years | 81 (19.8%) | 54 (20.2%) |
| 25 to 34 Years | 72 (12.0%) | 129 (25.6%) |
| 35 to 44 Years | 81 (18.6%) | 113 (24.7%) |
| 45 to 54 Years | 0 (0.0%) | 51 (13.1%) |
| 55 to 64 Years | 107 (22.3%) | 82 (17.0%) |
| 65 to 74 Years | 14 (5.1%) | 58 (17.8%) |
| 75 Years and over | 0 (0.0%) | 53 (15.1%) |
| Total | 650 (17.4%) | 695 (19.4%) |
Income Above Poverty by Sex and Age in Cushing
According to the poverty statistics in Cushing, males aged 45 to 54 years and females aged 5 years are the age groups that are most secure financially, with 100.0% of males and 100.0% of females in these age groups living above the poverty line.
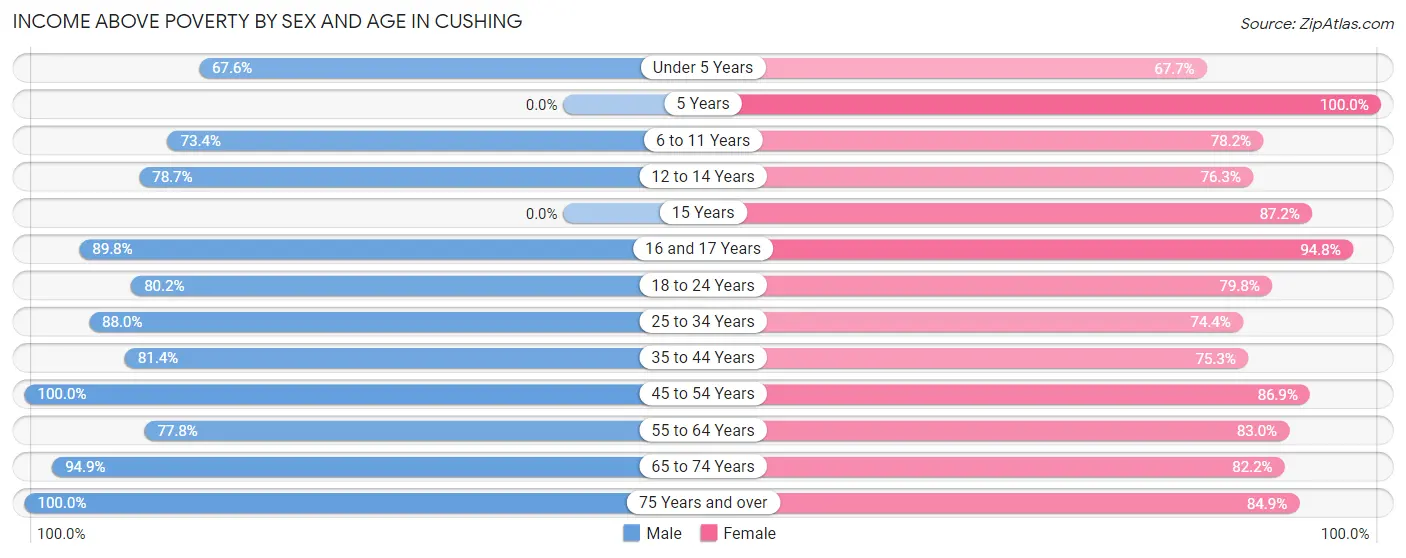
| Age Bracket | Male | Female |
| Under 5 Years | 188 (67.6%) | 111 (67.7%) |
| 5 Years | 0 (0.0%) | 69 (100.0%) |
| 6 to 11 Years | 271 (73.4%) | 204 (78.2%) |
| 12 to 14 Years | 85 (78.7%) | 90 (76.3%) |
| 15 Years | 0 (0.0%) | 75 (87.2%) |
| 16 and 17 Years | 106 (89.8%) | 109 (94.8%) |
| 18 to 24 Years | 328 (80.2%) | 213 (79.8%) |
| 25 to 34 Years | 529 (88.0%) | 375 (74.4%) |
| 35 to 44 Years | 354 (81.4%) | 345 (75.3%) |
| 45 to 54 Years | 384 (100.0%) | 337 (86.9%) |
| 55 to 64 Years | 374 (77.7%) | 400 (83.0%) |
| 65 to 74 Years | 259 (94.9%) | 267 (82.2%) |
| 75 Years and over | 202 (100.0%) | 297 (84.9%) |
| Total | 3,080 (82.6%) | 2,892 (80.6%) |
Income Below Poverty Among Married-Couple Families in Cushing
The poverty statistics for married-couple families in Cushing show that 4.5% or 56 of the total 1,248 families live below the poverty line. Families with 5 or more children have the highest poverty rate of 100.0%, comprising of 11 families. On the other hand, families with no children have the lowest poverty rate of 1.8%, which includes 13 families.
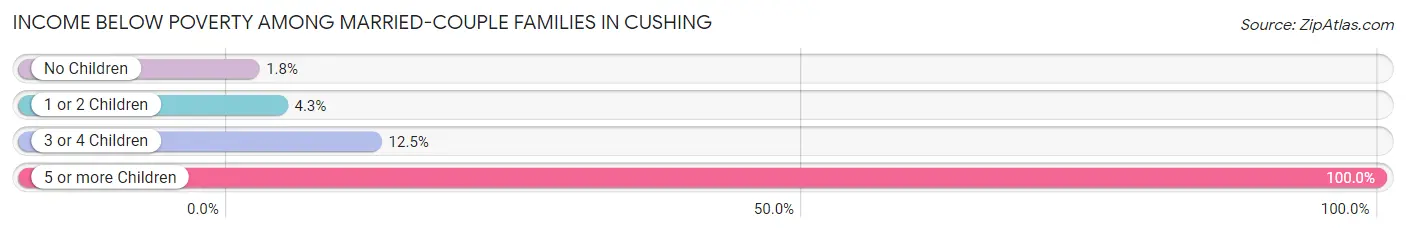
| Children | Above Poverty | Below Poverty |
| No Children | 694 (98.2%) | 13 (1.8%) |
| 1 or 2 Children | 400 (95.7%) | 18 (4.3%) |
| 3 or 4 Children | 98 (87.5%) | 14 (12.5%) |
| 5 or more Children | 0 (0.0%) | 11 (100.0%) |
| Total | 1,192 (95.5%) | 56 (4.5%) |
Income Below Poverty Among Single-Parent Households in Cushing
According to the poverty data in Cushing, 16.3% or 34 single-father households and 43.3% or 155 single-mother households are living below the poverty line. Among single-father households, those with 1 or 2 children have the highest poverty rate, with 34 households (26.4%) experiencing poverty. Likewise, among single-mother households, those with 3 or 4 children have the highest poverty rate, with 10 households (100.0%) falling below the poverty line.
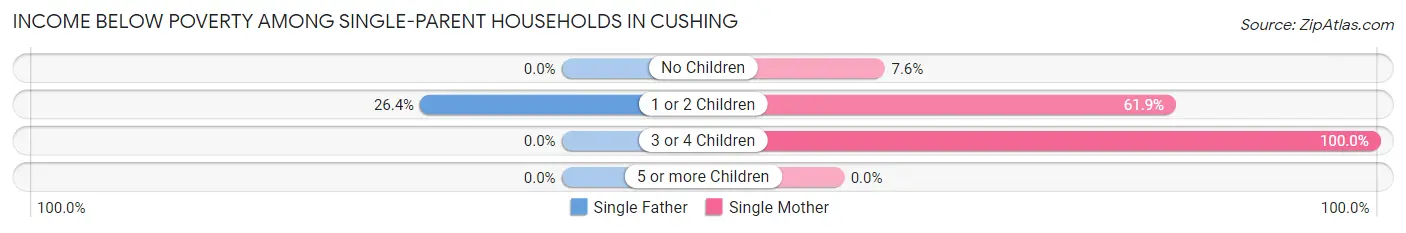
| Children | Single Father | Single Mother |
| No Children | 0 (0.0%) | 7 (7.6%) |
| 1 or 2 Children | 34 (26.4%) | 138 (61.9%) |
| 3 or 4 Children | 0 (0.0%) | 10 (100.0%) |
| 5 or more Children | 0 (0.0%) | 0 (0.0%) |
| Total | 34 (16.3%) | 155 (43.3%) |
Income Below Poverty Among Married-Couple vs Single-Parent Households in Cushing
The poverty data for Cushing shows that 56 of the married-couple family households (4.5%) and 189 of the single-parent households (33.3%) are living below the poverty level. Within the married-couple family households, those with 5 or more children have the highest poverty rate, with 11 households (100.0%) falling below the poverty line. Among the single-parent households, those with 1 or 2 children have the highest poverty rate, with 172 household (48.9%) living below poverty.
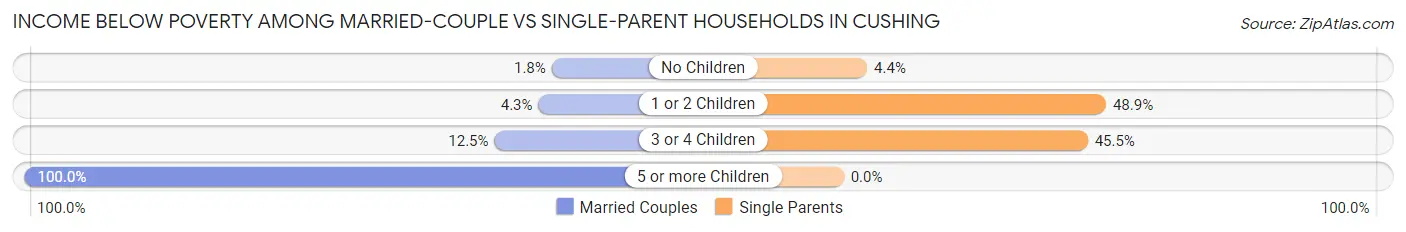
| Children | Married-Couple Families | Single-Parent Households |
| No Children | 13 (1.8%) | 7 (4.4%) |
| 1 or 2 Children | 18 (4.3%) | 172 (48.9%) |
| 3 or 4 Children | 14 (12.5%) | 10 (45.5%) |
| 5 or more Children | 11 (100.0%) | 0 (0.0%) |
| Total | 56 (4.5%) | 189 (33.3%) |
Race in Cushing
The most populous races in Cushing are White / Caucasian (6,260 | 75.1%), Native / Alaskan (737 | 8.8%), and Two or more Races (716 | 8.6%).
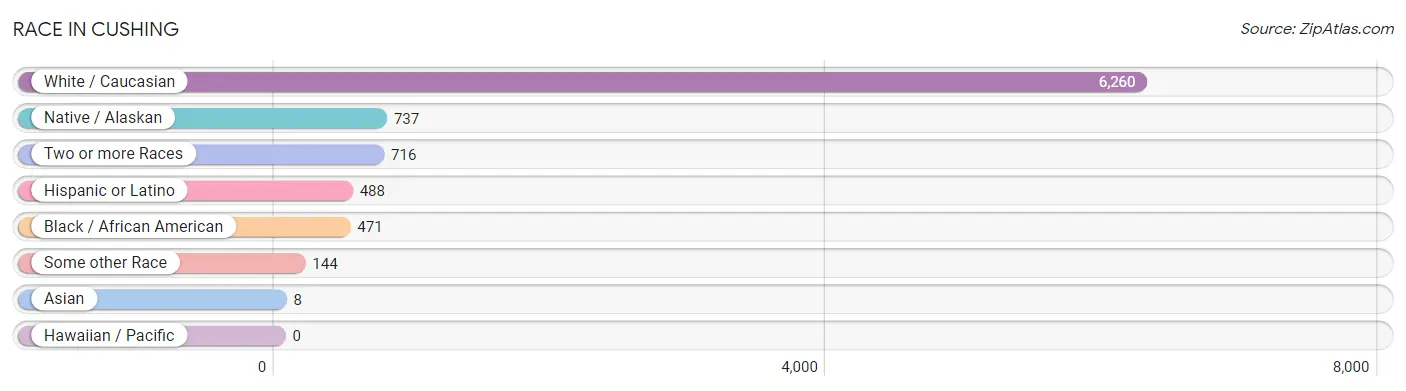
| Race | # Population | % Population |
| Asian | 8 | 0.1% |
| Black / African American | 471 | 5.7% |
| Hawaiian / Pacific | 0 | 0.0% |
| Hispanic or Latino | 488 | 5.9% |
| Native / Alaskan | 737 | 8.8% |
| White / Caucasian | 6,260 | 75.1% |
| Two or more Races | 716 | 8.6% |
| Some other Race | 144 | 1.7% |
| Total | 8,336 | 100.0% |
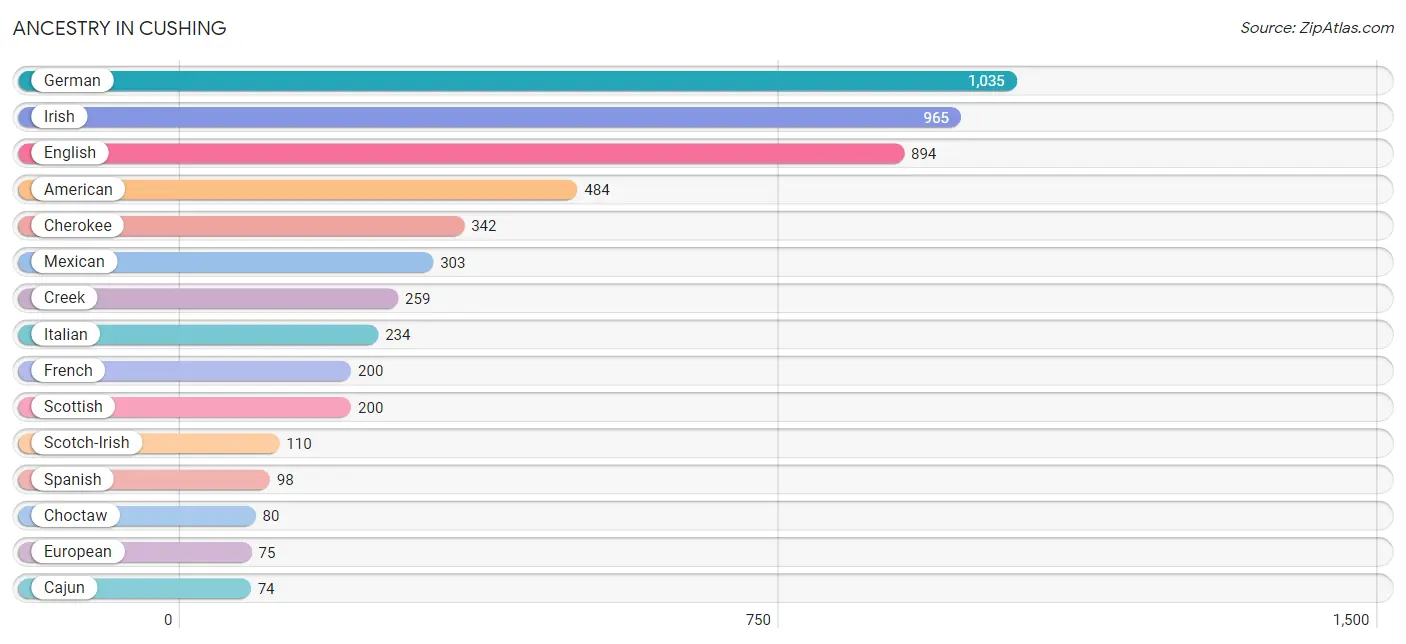
Ancestry in Cushing
The most populous ancestries reported in Cushing are German (1,035 | 12.4%), Irish (965 | 11.6%), English (894 | 10.7%), American (484 | 5.8%), and Cherokee (342 | 4.1%), together accounting for 44.6% of all Cushing residents.
| Ancestry | # Population | % Population |
| American | 484 | 5.8% |
| Apache | 14 | 0.2% |
| Arab | 27 | 0.3% |
| Belgian | 11 | 0.1% |
| Blackfeet | 13 | 0.2% |
| Brazilian | 6 | 0.1% |
| British | 67 | 0.8% |
| Cajun | 74 | 0.9% |
| Central American | 32 | 0.4% |
| Central American Indian | 32 | 0.4% |
| Cherokee | 342 | 4.1% |
| Chickasaw | 44 | 0.5% |
| Choctaw | 80 | 1.0% |
| Colombian | 18 | 0.2% |
| Comanche | 38 | 0.5% |
| Creek | 259 | 3.1% |
| Czech | 2 | 0.0% |
| Czechoslovakian | 5 | 0.1% |
| Danish | 9 | 0.1% |
| Delaware | 3 | 0.0% |
| Dutch | 63 | 0.8% |
| Dutch West Indian | 51 | 0.6% |
| Eastern European | 18 | 0.2% |
| English | 894 | 10.7% |
| European | 75 | 0.9% |
| French | 200 | 2.4% |
| German | 1,035 | 12.4% |
| Ghanaian | 18 | 0.2% |
| Guatemalan | 32 | 0.4% |
| Irish | 965 | 11.6% |
| Italian | 234 | 2.8% |
| Kiowa | 4 | 0.1% |
| Korean | 8 | 0.1% |
| Lebanese | 23 | 0.3% |
| Mexican | 303 | 3.6% |
| Moroccan | 4 | 0.1% |
| Northern European | 25 | 0.3% |
| Norwegian | 33 | 0.4% |
| Polish | 15 | 0.2% |
| Portuguese | 13 | 0.2% |
| Puerto Rican | 21 | 0.3% |
| Romanian | 5 | 0.1% |
| Russian | 15 | 0.2% |
| Scandinavian | 47 | 0.6% |
| Scotch-Irish | 110 | 1.3% |
| Scottish | 200 | 2.4% |
| Seminole | 28 | 0.3% |
| South American | 18 | 0.2% |
| Spaniard | 15 | 0.2% |
| Spanish | 98 | 1.2% |
| Sri Lankan | 23 | 0.3% |
| Subsaharan African | 27 | 0.3% |
| Swedish | 4 | 0.1% | View All 53 Rows |
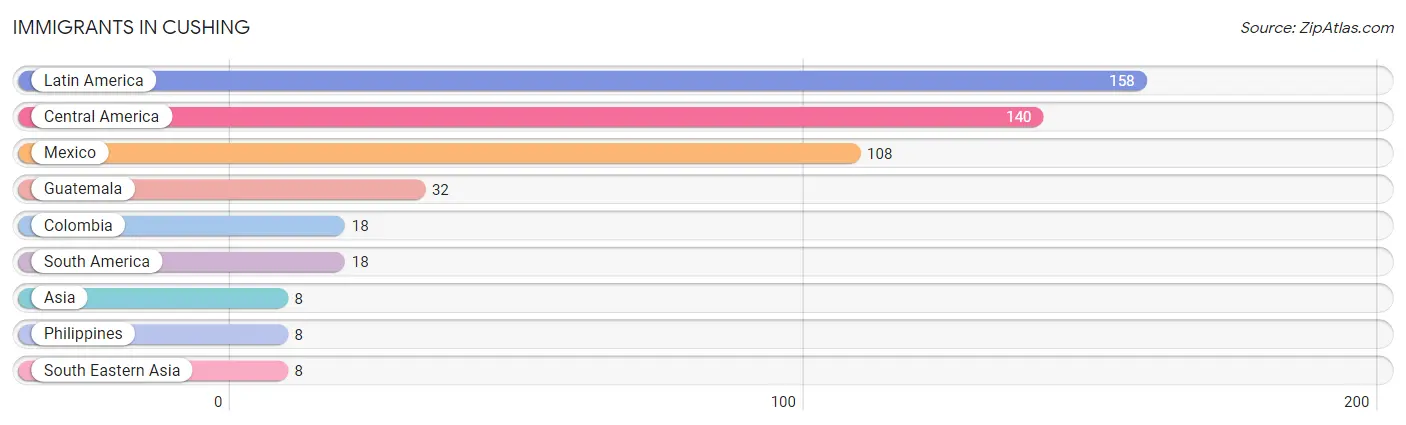
Immigrants in Cushing
The most numerous immigrant groups reported in Cushing came from Latin America (158 | 1.9%), Central America (140 | 1.7%), Mexico (108 | 1.3%), Guatemala (32 | 0.4%), and Colombia (18 | 0.2%), together accounting for 5.5% of all Cushing residents.
| Immigration Origin | # Population | % Population |
| Asia | 8 | 0.1% |
| Central America | 140 | 1.7% |
| Colombia | 18 | 0.2% |
| Guatemala | 32 | 0.4% |
| Latin America | 158 | 1.9% |
| Mexico | 108 | 1.3% |
| Philippines | 8 | 0.1% |
| South America | 18 | 0.2% |
| South Eastern Asia | 8 | 0.1% | View All 9 Rows |
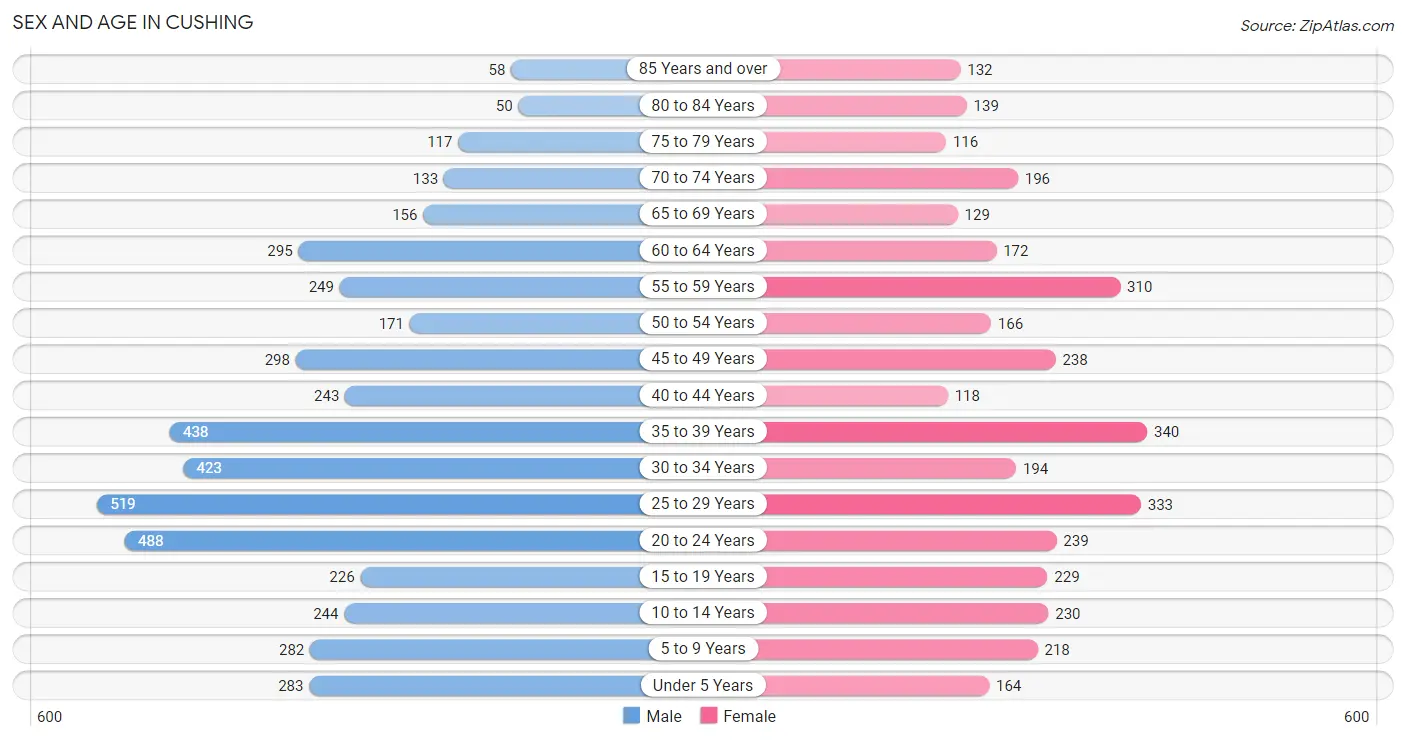
Sex and Age in Cushing
Sex and Age in Cushing
The most populous age groups in Cushing are 25 to 29 Years (519 | 11.1%) for men and 35 to 39 Years (340 | 9.3%) for women.
| Age Bracket | Male | Female |
| Under 5 Years | 283 (6.1%) | 164 (4.5%) |
| 5 to 9 Years | 282 (6.0%) | 218 (5.9%) |
| 10 to 14 Years | 244 (5.2%) | 230 (6.3%) |
| 15 to 19 Years | 226 (4.8%) | 229 (6.2%) |
| 20 to 24 Years | 488 (10.4%) | 239 (6.5%) |
| 25 to 29 Years | 519 (11.1%) | 333 (9.1%) |
| 30 to 34 Years | 423 (9.0%) | 194 (5.3%) |
| 35 to 39 Years | 438 (9.4%) | 340 (9.3%) |
| 40 to 44 Years | 243 (5.2%) | 118 (3.2%) |
| 45 to 49 Years | 298 (6.4%) | 238 (6.5%) |
| 50 to 54 Years | 171 (3.7%) | 166 (4.5%) |
| 55 to 59 Years | 249 (5.3%) | 310 (8.5%) |
| 60 to 64 Years | 295 (6.3%) | 172 (4.7%) |
| 65 to 69 Years | 156 (3.3%) | 129 (3.5%) |
| 70 to 74 Years | 133 (2.9%) | 196 (5.3%) |
| 75 to 79 Years | 117 (2.5%) | 116 (3.2%) |
| 80 to 84 Years | 50 (1.1%) | 139 (3.8%) |
| 85 Years and over | 58 (1.2%) | 132 (3.6%) |
| Total | 4,673 (100.0%) | 3,663 (100.0%) |
Families and Households in Cushing
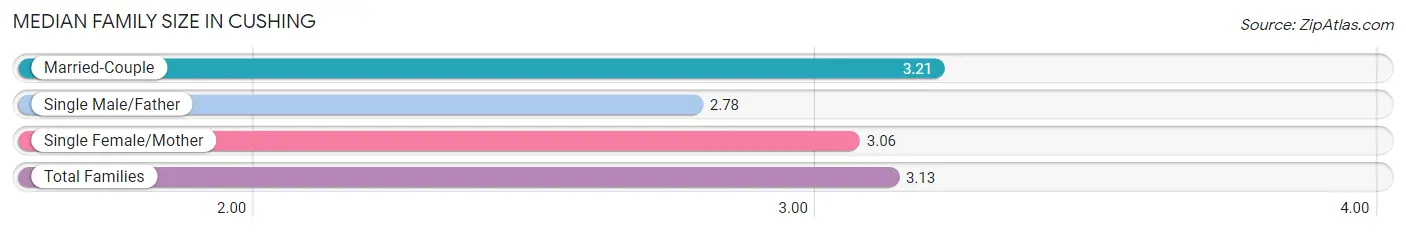
Median Family Size in Cushing
The median family size in Cushing is 3.13 persons per family, with married-couple families (1,248 | 68.8%) accounting for the largest median family size of 3.21 persons per family. On the other hand, single male/father families (209 | 11.5%) represent the smallest median family size with 2.78 persons per family.
| Family Type | # Families | Family Size |
| Married-Couple | 1,248 (68.8%) | 3.21 |
| Single Male/Father | 209 (11.5%) | 2.78 |
| Single Female/Mother | 358 (19.7%) | 3.06 |
| Total Families | 1,815 (100.0%) | 3.13 |
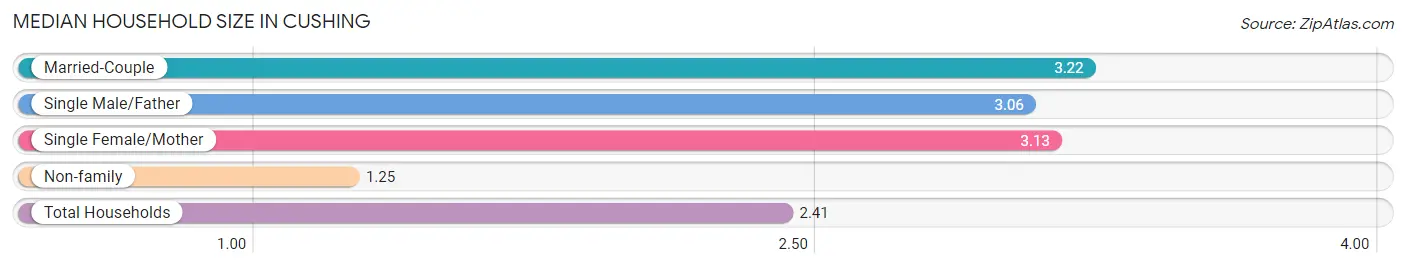
Median Household Size in Cushing
The median household size in Cushing is 2.41 persons per household, with married-couple households (1,248 | 41.1%) accounting for the largest median household size of 3.22 persons per household. non-family households (1,219 | 40.2%) represent the smallest median household size with 1.25 persons per household.
| Household Type | # Households | Household Size |
| Married-Couple | 1,248 (41.1%) | 3.22 |
| Single Male/Father | 209 (6.9%) | 3.06 |
| Single Female/Mother | 358 (11.8%) | 3.13 |
| Non-family | 1,219 (40.2%) | 1.25 |
| Total Households | 3,034 (100.0%) | 2.41 |
Household Size by Marriage Status in Cushing
Out of a total of 3,034 households in Cushing, 1,815 (59.8%) are family households, while 1,219 (40.2%) are nonfamily households. The most numerous type of family households are 2-person households, comprising 708, and the most common type of nonfamily households are 1-person households, comprising 970.
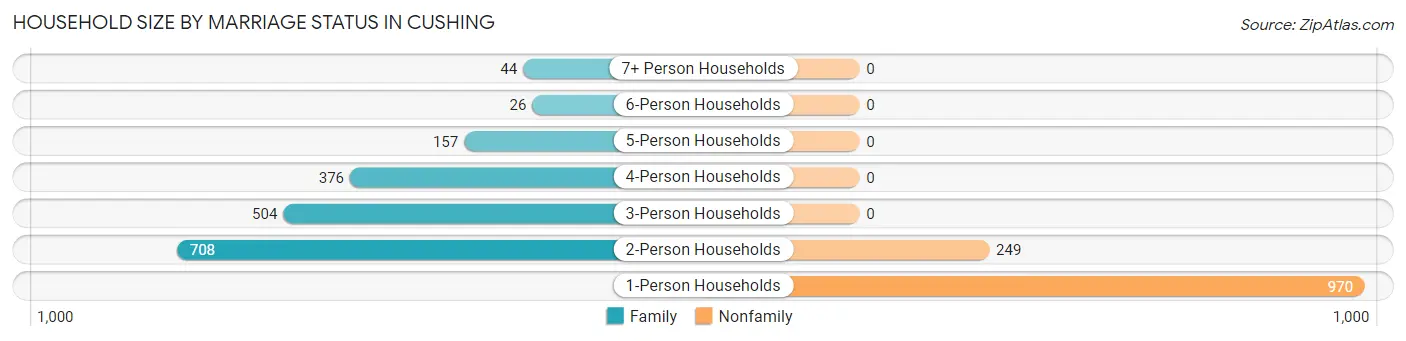
| Household Size | Family Households | Nonfamily Households |
| 1-Person Households | - | 970 (32.0%) |
| 2-Person Households | 708 (23.3%) | 249 (8.2%) |
| 3-Person Households | 504 (16.6%) | 0 (0.0%) |
| 4-Person Households | 376 (12.4%) | 0 (0.0%) |
| 5-Person Households | 157 (5.2%) | 0 (0.0%) |
| 6-Person Households | 26 (0.9%) | 0 (0.0%) |
| 7+ Person Households | 44 (1.5%) | 0 (0.0%) |
| Total | 1,815 (59.8%) | 1,219 (40.2%) |
Female Fertility in Cushing
Fertility by Age in Cushing
Average fertility rate in Cushing is 45.0 births per 1,000 women. Women in the age bracket of 20 to 34 years have the highest fertility rate with 61.0 births per 1,000 women. Women in the age bracket of 20 to 34 years acount for 61.8% of all women with births.
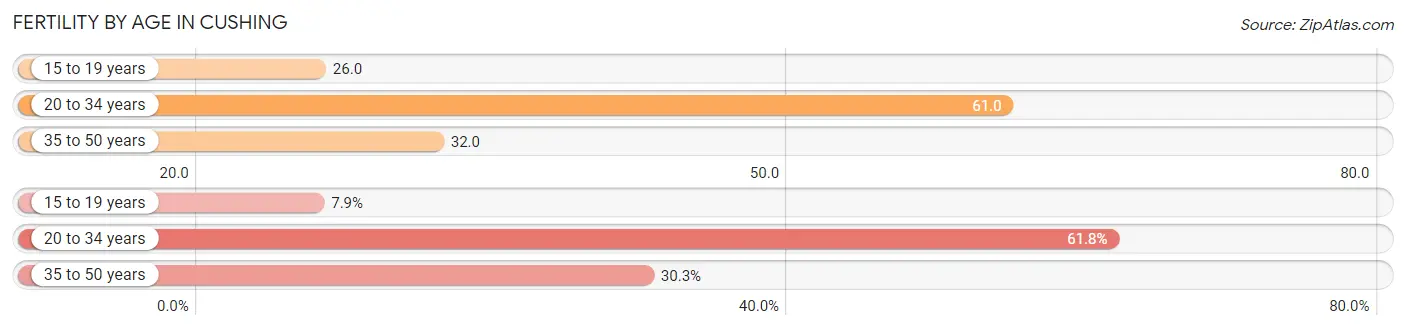
| Age Bracket | Women with Births | Births / 1,000 Women |
| 15 to 19 years | 6 (7.9%) | 26.0 |
| 20 to 34 years | 47 (61.8%) | 61.0 |
| 35 to 50 years | 23 (30.3%) | 32.0 |
| Total | 76 (100.0%) | 45.0 |
Fertility by Age by Marriage Status in Cushing
89.5% of women with births (76) in Cushing are married. The highest percentage of unmarried women with births falls into 15 to 19 years age bracket with 100.0% of them unmarried at the time of birth, while the lowest percentage of unmarried women with births belong to 20 to 34 years age bracket with 0.0% of them unmarried.
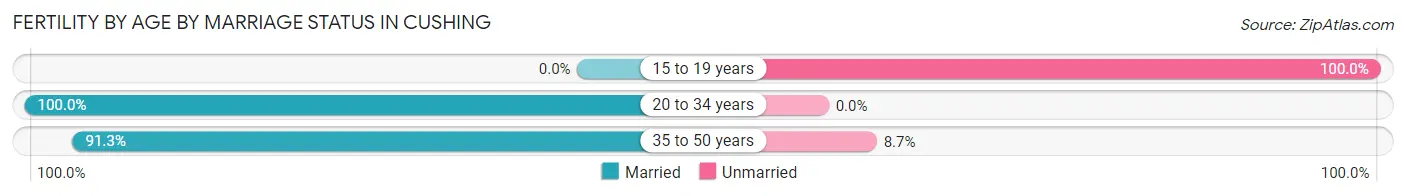
| Age Bracket | Married | Unmarried |
| 15 to 19 years | 0 (0.0%) | 6 (100.0%) |
| 20 to 34 years | 47 (100.0%) | 0 (0.0%) |
| 35 to 50 years | 21 (91.3%) | 2 (8.7%) |
| Total | 68 (89.5%) | 8 (10.5%) |
Fertility by Education in Cushing
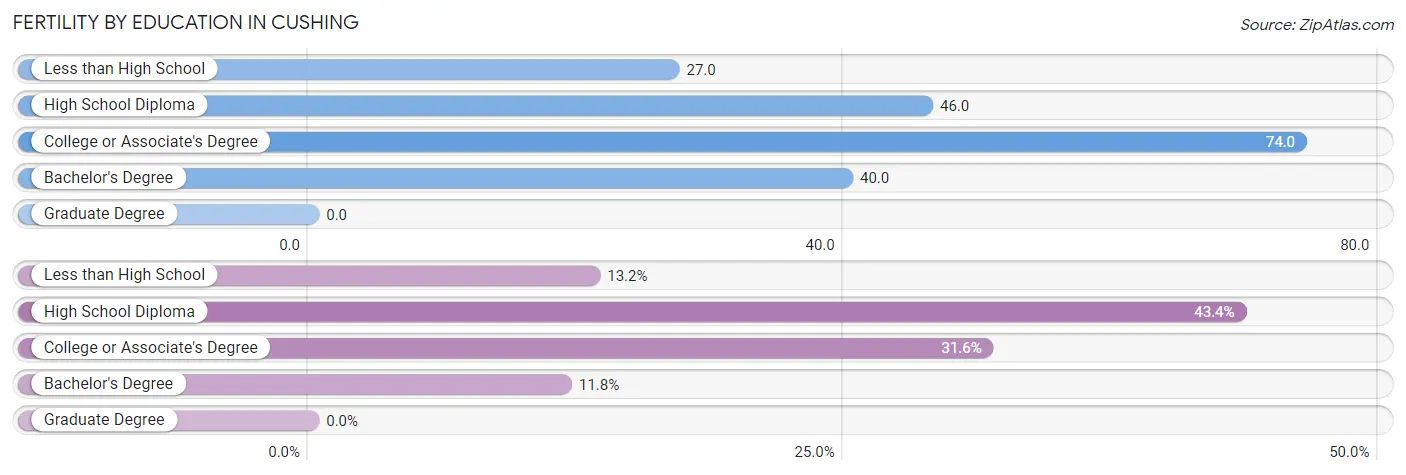
| Educational Attainment | Women with Births | Births / 1,000 Women |
| Less than High School | 10 (13.2%) | 27.0 |
| High School Diploma | 33 (43.4%) | 46.0 |
| College or Associate's Degree | 24 (31.6%) | 74.0 |
| Bachelor's Degree | 9 (11.8%) | 40.0 |
| Graduate Degree | 0 (0.0%) | 0.0 |
| Total | 76 (100.0%) | 45.0 |
Fertility by Education by Marriage Status in Cushing
10.5% of women with births in Cushing are unmarried. Women with the educational attainment of less than high school are most likely to be married with 100.0% of them married at childbirth, while women with the educational attainment of high school diploma are least likely to be married with 24.2% of them unmarried at childbirth.
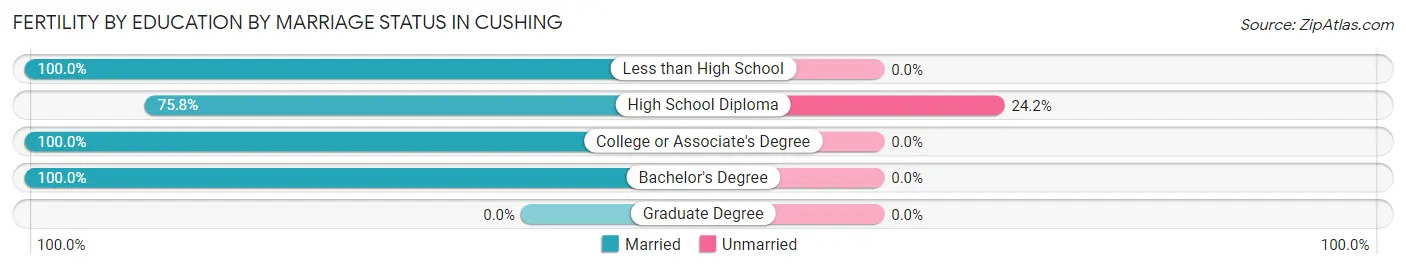
| Educational Attainment | Married | Unmarried |
| Less than High School | 10 (100.0%) | 0 (0.0%) |
| High School Diploma | 25 (75.8%) | 8 (24.2%) |
| College or Associate's Degree | 24 (100.0%) | 0 (0.0%) |
| Bachelor's Degree | 9 (100.0%) | 0 (0.0%) |
| Graduate Degree | 0 (0.0%) | 0 (0.0%) |
| Total | 68 (89.5%) | 8 (10.5%) |
Employment Characteristics in Cushing
Employment by Class of Employer in Cushing
Among the 3,444 employed individuals in Cushing, private company employees (2,281 | 66.2%), local government employees (427 | 12.4%), and state government employees (292 | 8.5%) make up the most common classes of employment.
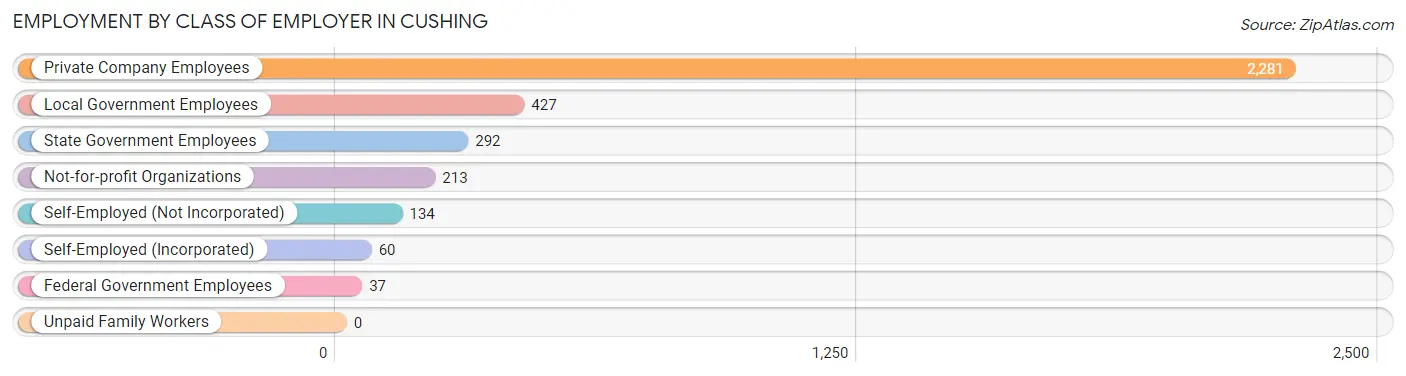
| Employer Class | # Employees | % Employees |
| Private Company Employees | 2,281 | 66.2% |
| Self-Employed (Incorporated) | 60 | 1.7% |
| Self-Employed (Not Incorporated) | 134 | 3.9% |
| Not-for-profit Organizations | 213 | 6.2% |
| Local Government Employees | 427 | 12.4% |
| State Government Employees | 292 | 8.5% |
| Federal Government Employees | 37 | 1.1% |
| Unpaid Family Workers | 0 | 0.0% |
| Total | 3,444 | 100.0% |
Employment Status by Age in Cushing
According to the labor force statistics for Cushing, out of the total population over 16 years of age (6,806), 54.3% or 3,696 individuals are in the labor force, with 4.5% or 166 of them unemployed. The age group with the highest labor force participation rate is 45 to 54 years, with 78.7% or 687 individuals in the labor force. Within the labor force, the 25 to 29 years age range has the highest percentage of unemployed individuals, with 13.0% or 64 of them being unemployed.
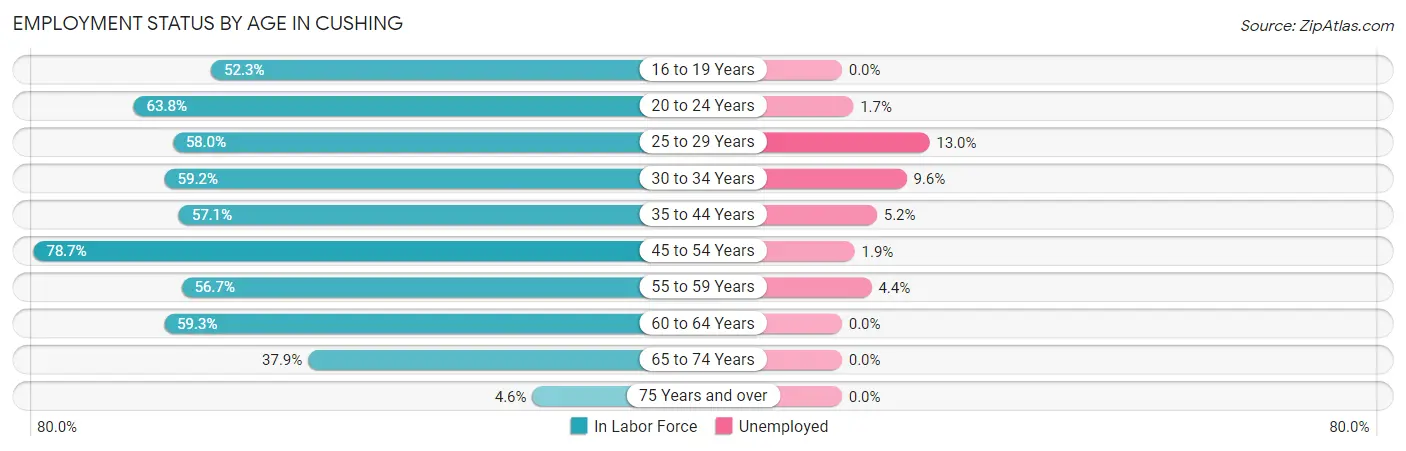
| Age Bracket | In Labor Force | Unemployed |
| 16 to 19 Years | 181 (52.3%) | 0 (0.0%) |
| 20 to 24 Years | 464 (63.8%) | 8 (1.7%) |
| 25 to 29 Years | 494 (58.0%) | 64 (13.0%) |
| 30 to 34 Years | 365 (59.2%) | 35 (9.6%) |
| 35 to 44 Years | 650 (57.1%) | 34 (5.2%) |
| 45 to 54 Years | 687 (78.7%) | 13 (1.9%) |
| 55 to 59 Years | 317 (56.7%) | 14 (4.4%) |
| 60 to 64 Years | 277 (59.3%) | 0 (0.0%) |
| 65 to 74 Years | 233 (37.9%) | 0 (0.0%) |
| 75 Years and over | 28 (4.6%) | 0 (0.0%) |
| Total | 3,696 (54.3%) | 166 (4.5%) |
Employment Status by Educational Attainment in Cushing
According to labor force statistics for Cushing, 61.9% of individuals (2,790) out of the total population between 25 and 64 years of age (4,507) are in the labor force, with 5.7% or 159 of them being unemployed. The group with the highest labor force participation rate are those with the educational attainment of bachelor's degree or higher, with 84.2% or 630 individuals in the labor force. Within the labor force, individuals with less than high school education have the highest percentage of unemployment, with 18.9% or 37 of them being unemployed.
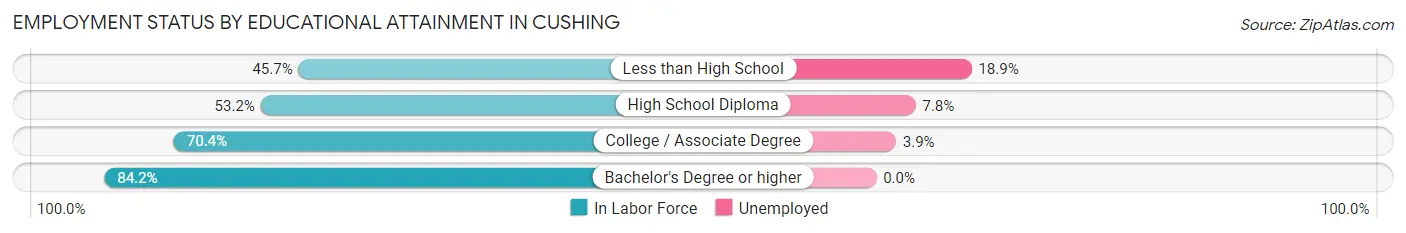
| Educational Attainment | In Labor Force | Unemployed |
| Less than High School | 196 (45.7%) | 81 (18.9%) |
| High School Diploma | 1,178 (53.2%) | 173 (7.8%) |
| College / Associate Degree | 785 (70.4%) | 43 (3.9%) |
| Bachelor's Degree or higher | 630 (84.2%) | 0 (0.0%) |
| Total | 2,790 (61.9%) | 257 (5.7%) |
Employment Occupations by Sex in Cushing
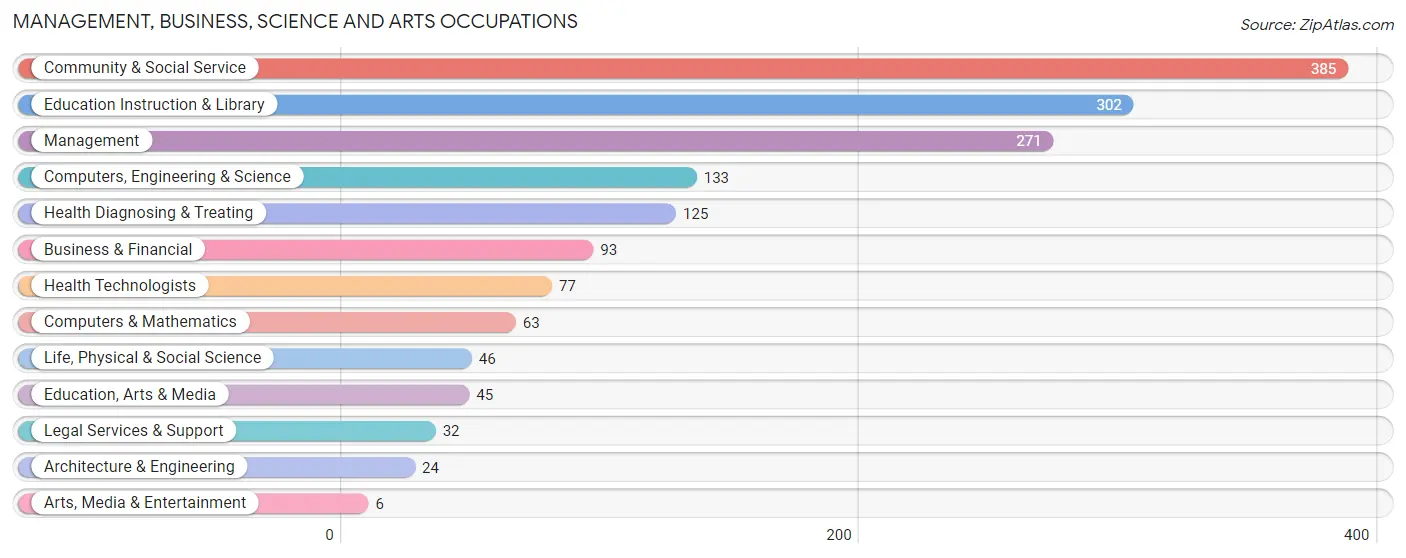
Management, Business, Science and Arts Occupations
The most common Management, Business, Science and Arts occupations in Cushing are Community & Social Service (385 | 10.9%), Education Instruction & Library (302 | 8.6%), Management (271 | 7.7%), Computers, Engineering & Science (133 | 3.8%), and Health Diagnosing & Treating (125 | 3.5%).
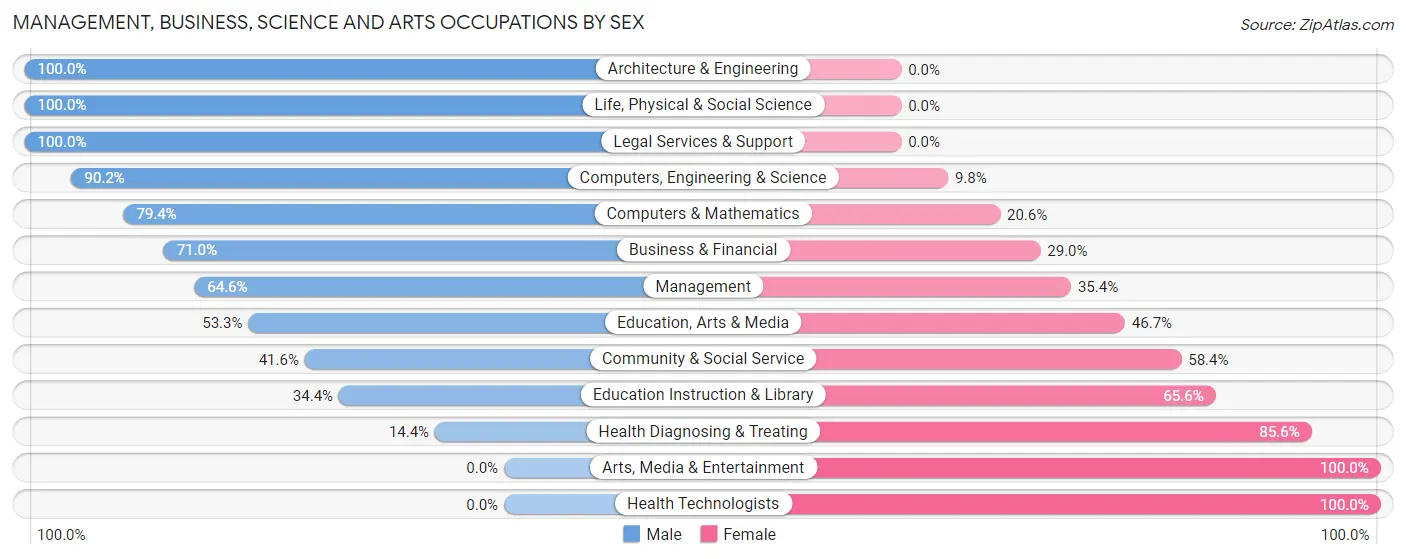
Management, Business, Science and Arts Occupations by Sex
Within the Management, Business, Science and Arts occupations in Cushing, the most male-oriented occupations are Architecture & Engineering (100.0%), Life, Physical & Social Science (100.0%), and Legal Services & Support (100.0%), while the most female-oriented occupations are Arts, Media & Entertainment (100.0%), Health Technologists (100.0%), and Health Diagnosing & Treating (85.6%).
| Occupation | Male | Female |
| Management | 175 (64.6%) | 96 (35.4%) |
| Business & Financial | 66 (71.0%) | 27 (29.0%) |
| Computers, Engineering & Science | 120 (90.2%) | 13 (9.8%) |
| Computers & Mathematics | 50 (79.4%) | 13 (20.6%) |
| Architecture & Engineering | 24 (100.0%) | 0 (0.0%) |
| Life, Physical & Social Science | 46 (100.0%) | 0 (0.0%) |
| Community & Social Service | 160 (41.6%) | 225 (58.4%) |
| Education, Arts & Media | 24 (53.3%) | 21 (46.7%) |
| Legal Services & Support | 32 (100.0%) | 0 (0.0%) |
| Education Instruction & Library | 104 (34.4%) | 198 (65.6%) |
| Arts, Media & Entertainment | 0 (0.0%) | 6 (100.0%) |
| Health Diagnosing & Treating | 18 (14.4%) | 107 (85.6%) |
| Health Technologists | 0 (0.0%) | 77 (100.0%) |
| Total (Category) | 539 (53.5%) | 468 (46.5%) |
| Total (Overall) | 1,990 (56.4%) | 1,538 (43.6%) |
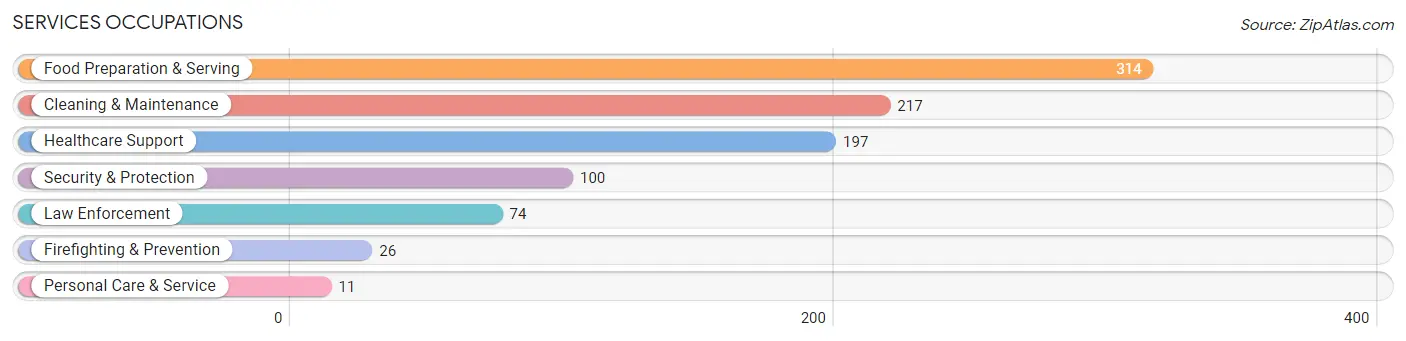
Services Occupations
The most common Services occupations in Cushing are Food Preparation & Serving (314 | 8.9%), Cleaning & Maintenance (217 | 6.1%), Healthcare Support (197 | 5.6%), Security & Protection (100 | 2.8%), and Law Enforcement (74 | 2.1%).
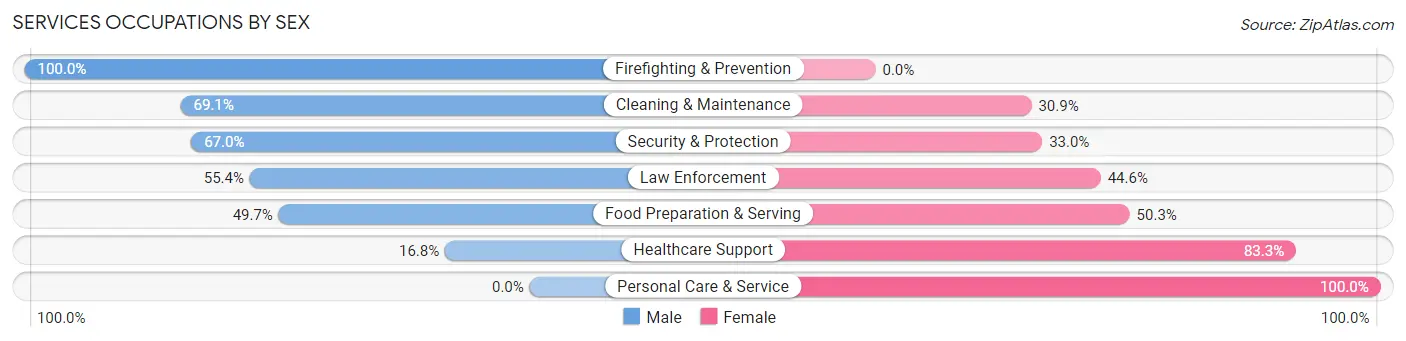
Services Occupations by Sex
Within the Services occupations in Cushing, the most male-oriented occupations are Firefighting & Prevention (100.0%), Cleaning & Maintenance (69.1%), and Security & Protection (67.0%), while the most female-oriented occupations are Personal Care & Service (100.0%), Healthcare Support (83.3%), and Food Preparation & Serving (50.3%).
| Occupation | Male | Female |
| Healthcare Support | 33 (16.8%) | 164 (83.3%) |
| Security & Protection | 67 (67.0%) | 33 (33.0%) |
| Firefighting & Prevention | 26 (100.0%) | 0 (0.0%) |
| Law Enforcement | 41 (55.4%) | 33 (44.6%) |
| Food Preparation & Serving | 156 (49.7%) | 158 (50.3%) |
| Cleaning & Maintenance | 150 (69.1%) | 67 (30.9%) |
| Personal Care & Service | 0 (0.0%) | 11 (100.0%) |
| Total (Category) | 406 (48.4%) | 433 (51.6%) |
| Total (Overall) | 1,990 (56.4%) | 1,538 (43.6%) |
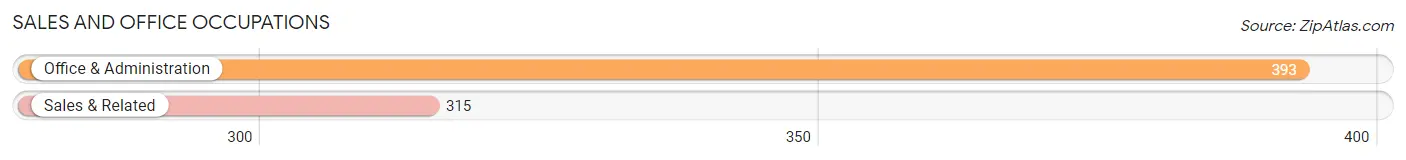
Sales and Office Occupations
The most common Sales and Office occupations in Cushing are Office & Administration (393 | 11.1%), and Sales & Related (315 | 8.9%).
Sales and Office Occupations by Sex

| Occupation | Male | Female |
| Sales & Related | 100 (31.8%) | 215 (68.2%) |
| Office & Administration | 63 (16.0%) | 330 (84.0%) |
| Total (Category) | 163 (23.0%) | 545 (77.0%) |
| Total (Overall) | 1,990 (56.4%) | 1,538 (43.6%) |
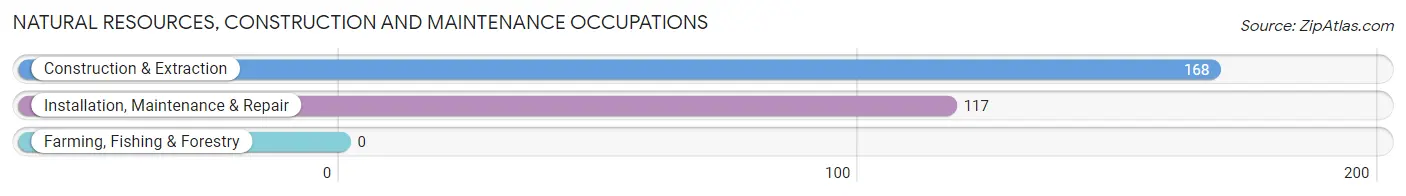
Natural Resources, Construction and Maintenance Occupations
The most common Natural Resources, Construction and Maintenance occupations in Cushing are Construction & Extraction (168 | 4.8%), and Installation, Maintenance & Repair (117 | 3.3%).
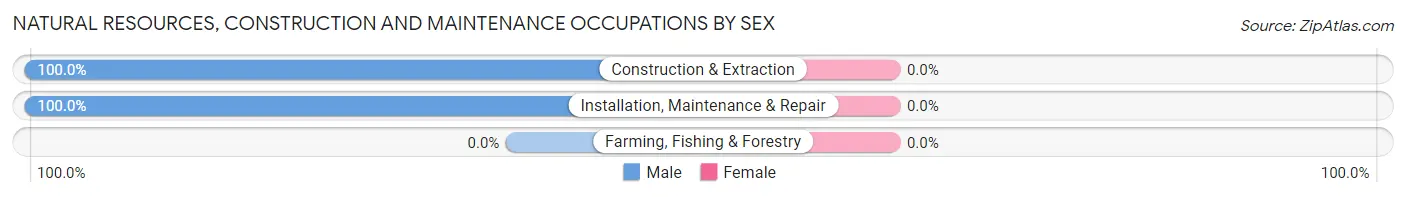
Natural Resources, Construction and Maintenance Occupations by Sex
| Occupation | Male | Female |
| Farming, Fishing & Forestry | 0 (0.0%) | 0 (0.0%) |
| Construction & Extraction | 168 (100.0%) | 0 (0.0%) |
| Installation, Maintenance & Repair | 117 (100.0%) | 0 (0.0%) |
| Total (Category) | 285 (100.0%) | 0 (0.0%) |
| Total (Overall) | 1,990 (56.4%) | 1,538 (43.6%) |
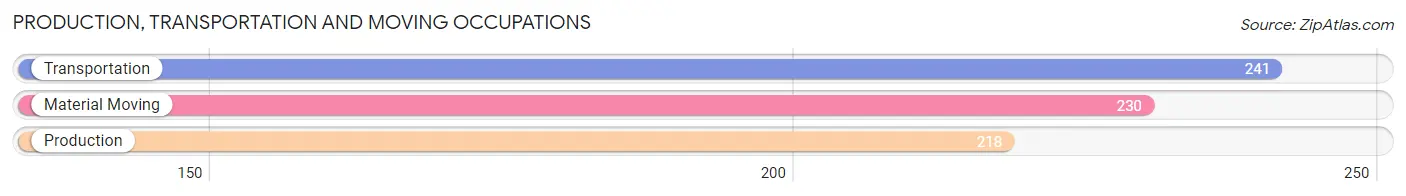
Production, Transportation and Moving Occupations
The most common Production, Transportation and Moving occupations in Cushing are Transportation (241 | 6.8%), Material Moving (230 | 6.5%), and Production (218 | 6.2%).
Production, Transportation and Moving Occupations by Sex
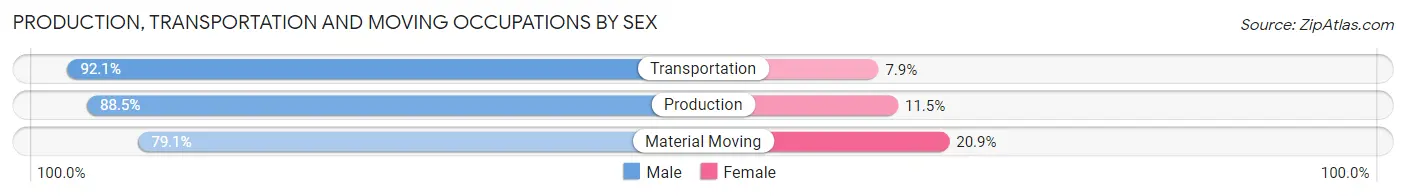
| Occupation | Male | Female |
| Production | 193 (88.5%) | 25 (11.5%) |
| Transportation | 222 (92.1%) | 19 (7.9%) |
| Material Moving | 182 (79.1%) | 48 (20.9%) |
| Total (Category) | 597 (86.7%) | 92 (13.4%) |
| Total (Overall) | 1,990 (56.4%) | 1,538 (43.6%) |
Employment Industries by Sex in Cushing
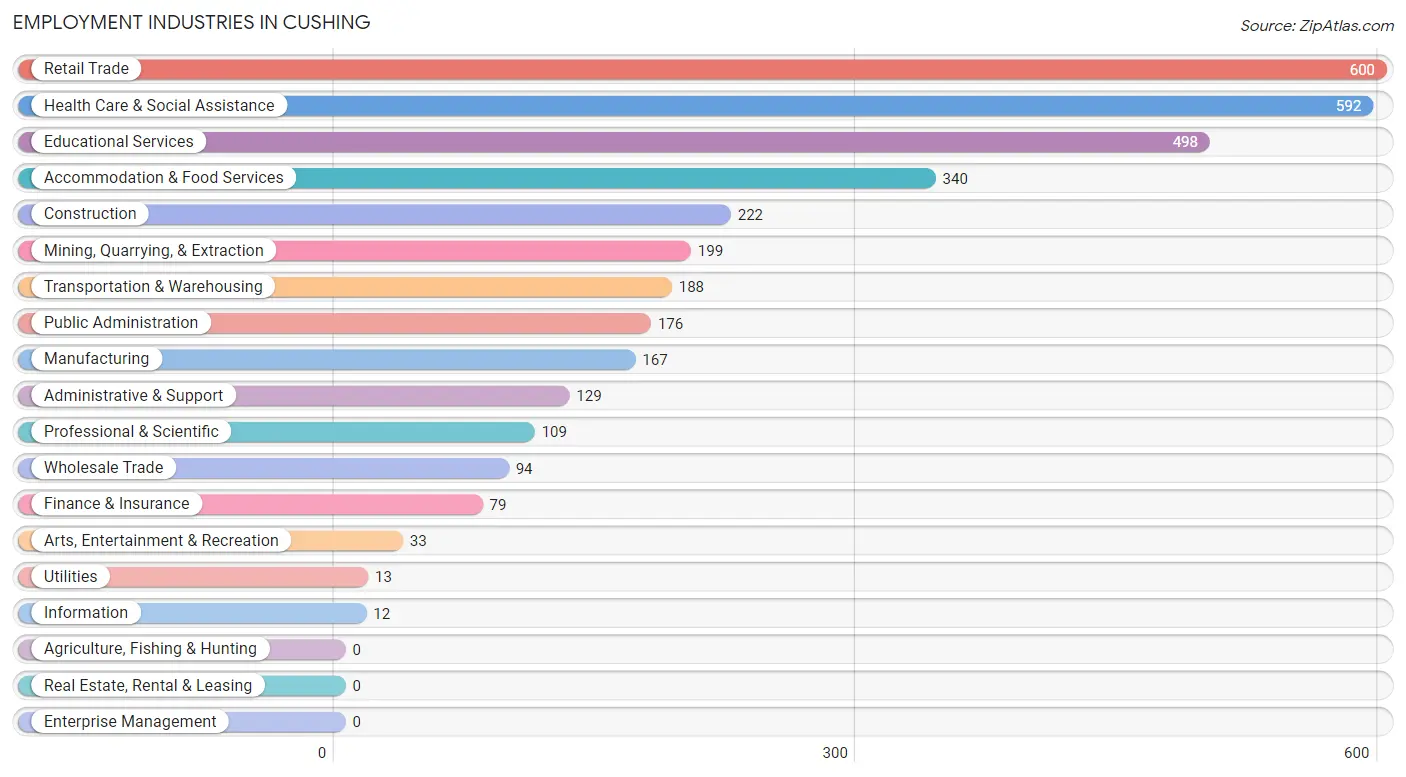
Employment Industries in Cushing
The major employment industries in Cushing include Retail Trade (600 | 17.0%), Health Care & Social Assistance (592 | 16.8%), Educational Services (498 | 14.1%), Accommodation & Food Services (340 | 9.6%), and Construction (222 | 6.3%).
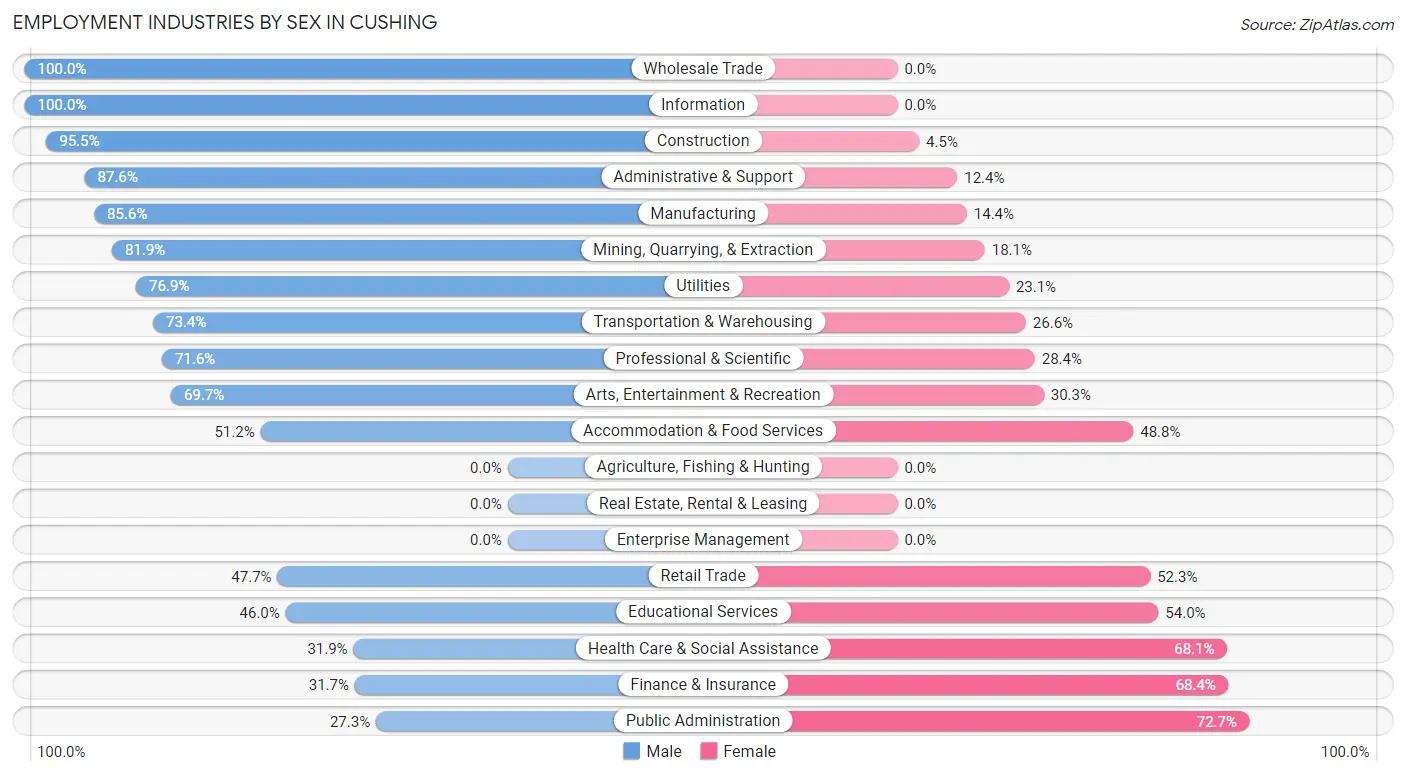
Employment Industries by Sex in Cushing
The Cushing industries that see more men than women are Wholesale Trade (100.0%), Information (100.0%), and Construction (95.5%), whereas the industries that tend to have a higher number of women are Public Administration (72.7%), Finance & Insurance (68.3%), and Health Care & Social Assistance (68.1%).
| Industry | Male | Female |
| Agriculture, Fishing & Hunting | 0 (0.0%) | 0 (0.0%) |
| Mining, Quarrying, & Extraction | 163 (81.9%) | 36 (18.1%) |
| Construction | 212 (95.5%) | 10 (4.5%) |
| Manufacturing | 143 (85.6%) | 24 (14.4%) |
| Wholesale Trade | 94 (100.0%) | 0 (0.0%) |
| Retail Trade | 286 (47.7%) | 314 (52.3%) |
| Transportation & Warehousing | 138 (73.4%) | 50 (26.6%) |
| Utilities | 10 (76.9%) | 3 (23.1%) |
| Information | 12 (100.0%) | 0 (0.0%) |
| Finance & Insurance | 25 (31.7%) | 54 (68.3%) |
| Real Estate, Rental & Leasing | 0 (0.0%) | 0 (0.0%) |
| Professional & Scientific | 78 (71.6%) | 31 (28.4%) |
| Enterprise Management | 0 (0.0%) | 0 (0.0%) |
| Administrative & Support | 113 (87.6%) | 16 (12.4%) |
| Educational Services | 229 (46.0%) | 269 (54.0%) |
| Health Care & Social Assistance | 189 (31.9%) | 403 (68.1%) |
| Arts, Entertainment & Recreation | 23 (69.7%) | 10 (30.3%) |
| Accommodation & Food Services | 174 (51.2%) | 166 (48.8%) |
| Public Administration | 48 (27.3%) | 128 (72.7%) |
| Total | 1,990 (56.4%) | 1,538 (43.6%) |
Education in Cushing
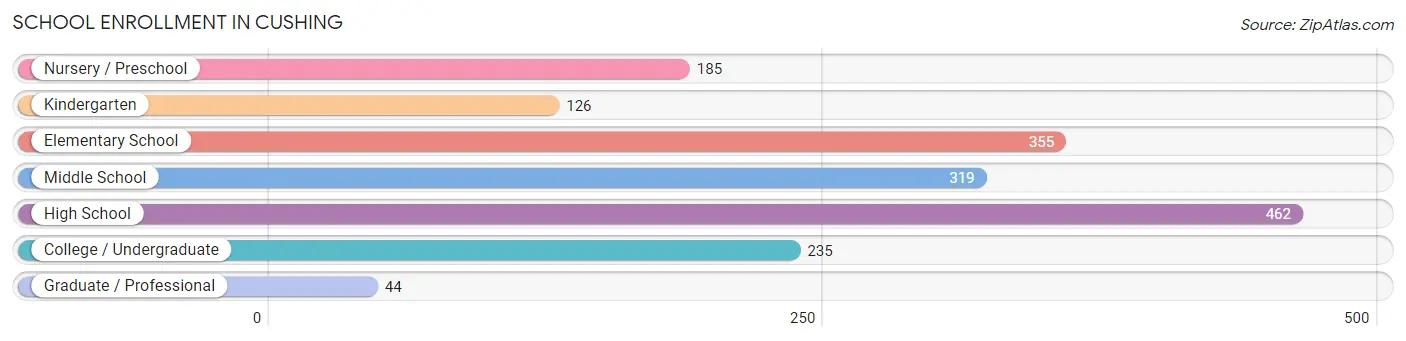
School Enrollment in Cushing
The most common levels of schooling among the 1,726 students in Cushing are high school (462 | 26.8%), elementary school (355 | 20.6%), and middle school (319 | 18.5%).
| School Level | # Students | % Students |
| Nursery / Preschool | 185 | 10.7% |
| Kindergarten | 126 | 7.3% |
| Elementary School | 355 | 20.6% |
| Middle School | 319 | 18.5% |
| High School | 462 | 26.8% |
| College / Undergraduate | 235 | 13.6% |
| Graduate / Professional | 44 | 2.5% |
| Total | 1,726 | 100.0% |
School Enrollment by Age by Funding Source in Cushing
Out of a total of 1,726 students who are enrolled in schools in Cushing, 197 (11.4%) attend a private institution, while the remaining 1,529 (88.6%) are enrolled in public schools. The age group of 35 years and over has the highest likelihood of being enrolled in private schools, with 42 (51.2% in the age bracket) enrolled. Conversely, the age group of 3 to 4 year olds has the lowest likelihood of being enrolled in a private school, with 109 (100.0% in the age bracket) attending a public institution.
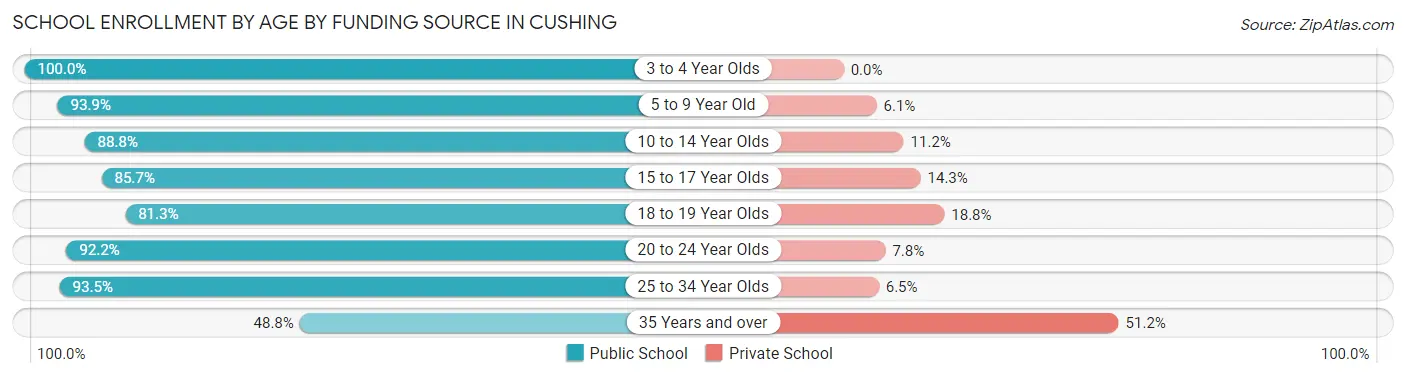
| Age Bracket | Public School | Private School |
| 3 to 4 Year Olds | 109 (100.0%) | 0 (0.0%) |
| 5 to 9 Year Old | 428 (93.9%) | 28 (6.1%) |
| 10 to 14 Year Olds | 366 (88.8%) | 46 (11.2%) |
| 15 to 17 Year Olds | 293 (85.7%) | 49 (14.3%) |
| 18 to 19 Year Olds | 52 (81.2%) | 12 (18.8%) |
| 20 to 24 Year Olds | 142 (92.2%) | 12 (7.8%) |
| 25 to 34 Year Olds | 100 (93.5%) | 7 (6.5%) |
| 35 Years and over | 40 (48.8%) | 42 (51.2%) |
| Total | 1,529 (88.6%) | 197 (11.4%) |
Educational Attainment by Field of Study in Cushing
Education (260 | 27.6%), business (176 | 18.7%), science & technology (143 | 15.2%), arts & humanities (62 | 6.6%), and psychology (55 | 5.8%) are the most common fields of study among 942 individuals in Cushing who have obtained a bachelor's degree or higher.
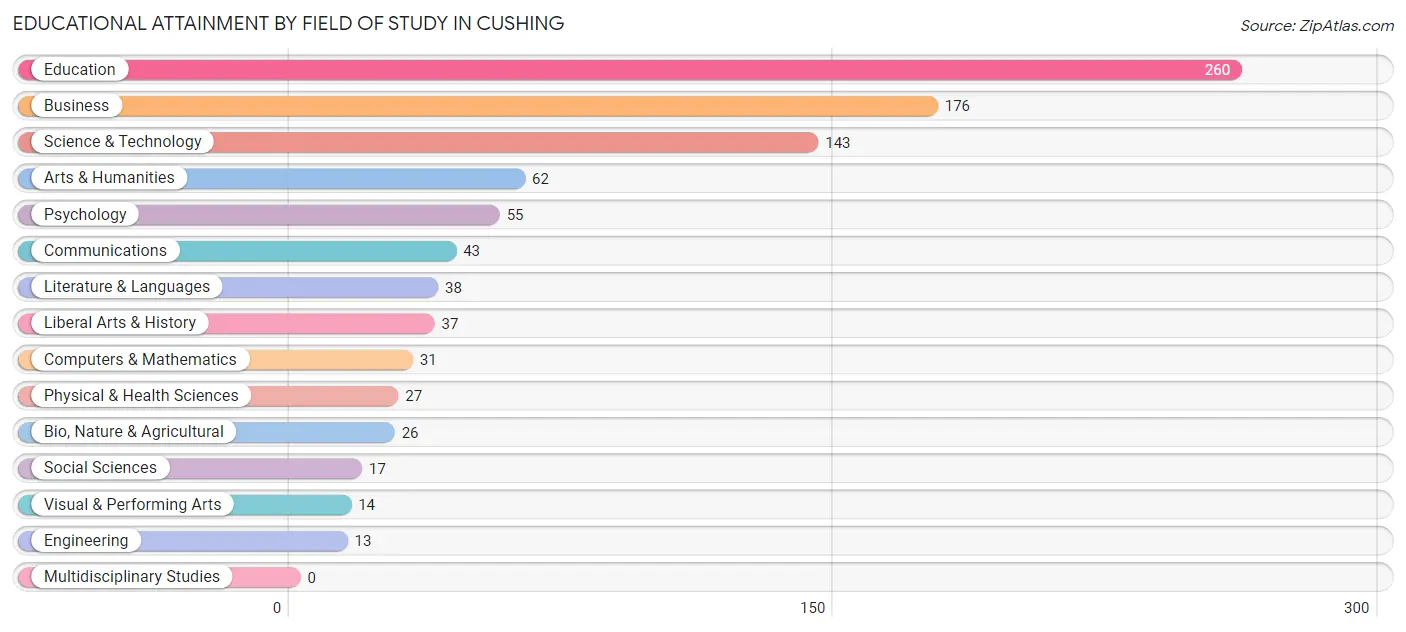
| Field of Study | # Graduates | % Graduates |
| Computers & Mathematics | 31 | 3.3% |
| Bio, Nature & Agricultural | 26 | 2.8% |
| Physical & Health Sciences | 27 | 2.9% |
| Psychology | 55 | 5.8% |
| Social Sciences | 17 | 1.8% |
| Engineering | 13 | 1.4% |
| Multidisciplinary Studies | 0 | 0.0% |
| Science & Technology | 143 | 15.2% |
| Business | 176 | 18.7% |
| Education | 260 | 27.6% |
| Literature & Languages | 38 | 4.0% |
| Liberal Arts & History | 37 | 3.9% |
| Visual & Performing Arts | 14 | 1.5% |
| Communications | 43 | 4.6% |
| Arts & Humanities | 62 | 6.6% |
| Total | 942 | 100.0% |
Transportation & Commute in Cushing
Vehicle Availability by Sex in Cushing
The most prevalent vehicle ownership categories in Cushing are males with 2 vehicles (871, accounting for 44.0%) and females with 2 vehicles (696, making up 59.5%).
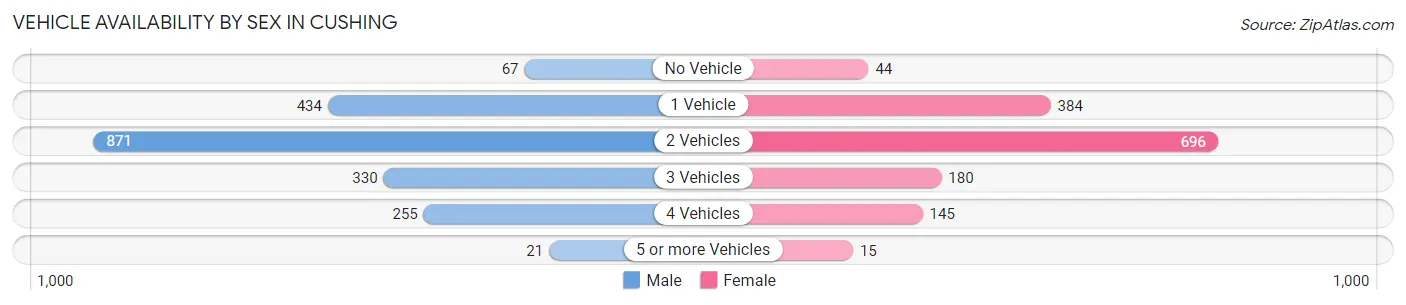
| Vehicles Available | Male | Female |
| No Vehicle | 67 (3.4%) | 44 (3.0%) |
| 1 Vehicle | 434 (21.9%) | 384 (26.2%) |
| 2 Vehicles | 871 (44.0%) | 696 (47.5%) |
| 3 Vehicles | 330 (16.7%) | 180 (12.3%) |
| 4 Vehicles | 255 (12.9%) | 145 (9.9%) |
| 5 or more Vehicles | 21 (1.1%) | 15 (1.0%) |
| Total | 1,978 (100.0%) | 1,464 (100.0%) |
Commute Time in Cushing
The most frequently occuring commute durations in Cushing are 5 to 9 minutes (1,098 commuters, 33.0%), 10 to 14 minutes (515 commuters, 15.5%), and 30 to 34 minutes (400 commuters, 12.0%).
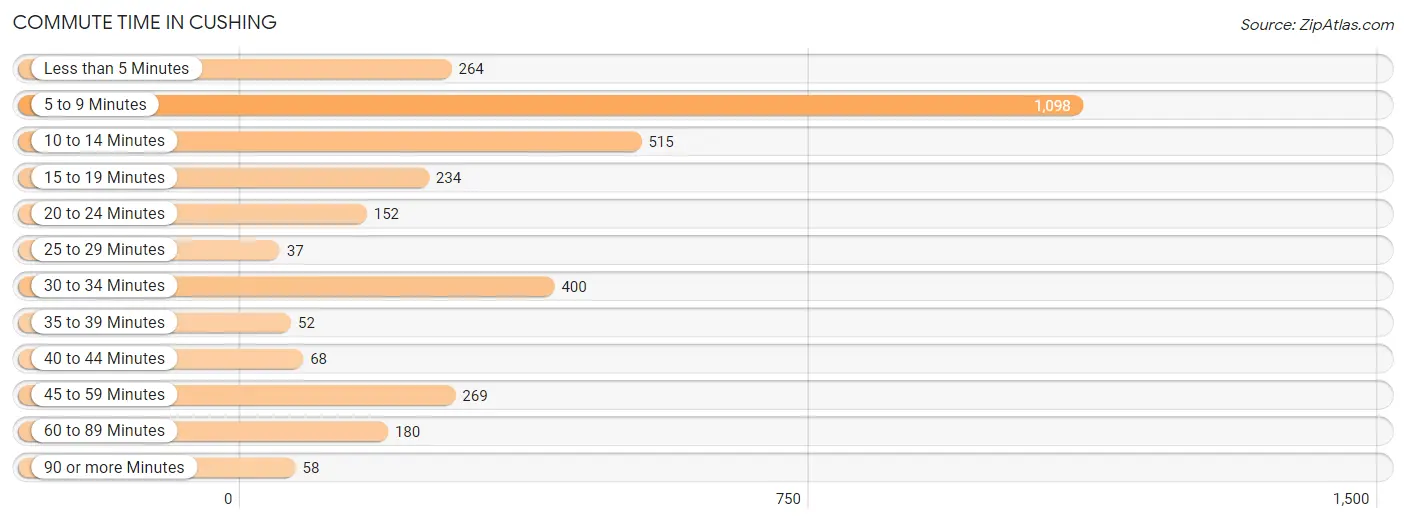
| Commute Time | # Commuters | % Commuters |
| Less than 5 Minutes | 264 | 7.9% |
| 5 to 9 Minutes | 1,098 | 33.0% |
| 10 to 14 Minutes | 515 | 15.5% |
| 15 to 19 Minutes | 234 | 7.0% |
| 20 to 24 Minutes | 152 | 4.6% |
| 25 to 29 Minutes | 37 | 1.1% |
| 30 to 34 Minutes | 400 | 12.0% |
| 35 to 39 Minutes | 52 | 1.6% |
| 40 to 44 Minutes | 68 | 2.0% |
| 45 to 59 Minutes | 269 | 8.1% |
| 60 to 89 Minutes | 180 | 5.4% |
| 90 or more Minutes | 58 | 1.7% |
Commute Time by Sex in Cushing
The most common commute times in Cushing are 5 to 9 minutes (587 commuters, 30.0%) for males and 5 to 9 minutes (511 commuters, 37.3%) for females.
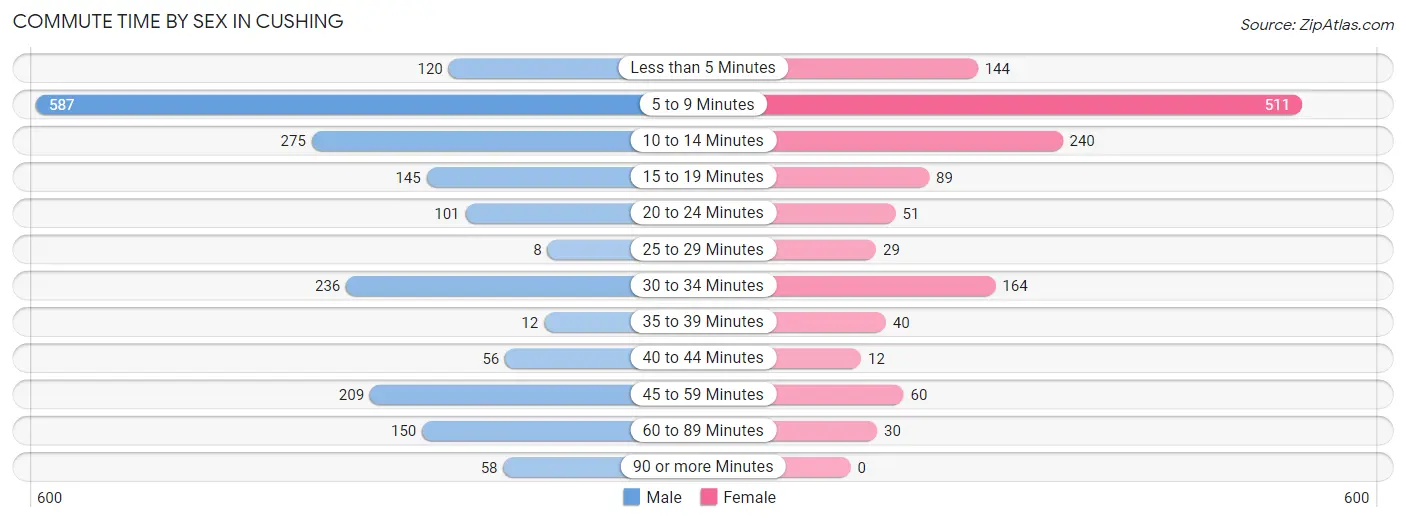
| Commute Time | Male | Female |
| Less than 5 Minutes | 120 (6.1%) | 144 (10.5%) |
| 5 to 9 Minutes | 587 (30.0%) | 511 (37.3%) |
| 10 to 14 Minutes | 275 (14.1%) | 240 (17.5%) |
| 15 to 19 Minutes | 145 (7.4%) | 89 (6.5%) |
| 20 to 24 Minutes | 101 (5.2%) | 51 (3.7%) |
| 25 to 29 Minutes | 8 (0.4%) | 29 (2.1%) |
| 30 to 34 Minutes | 236 (12.1%) | 164 (12.0%) |
| 35 to 39 Minutes | 12 (0.6%) | 40 (2.9%) |
| 40 to 44 Minutes | 56 (2.9%) | 12 (0.9%) |
| 45 to 59 Minutes | 209 (10.7%) | 60 (4.4%) |
| 60 to 89 Minutes | 150 (7.7%) | 30 (2.2%) |
| 90 or more Minutes | 58 (3.0%) | 0 (0.0%) |
Time of Departure to Work by Sex in Cushing
The most frequent times of departure to work in Cushing are 7:00 AM to 7:29 AM (410, 20.9%) for males and 7:30 AM to 7:59 AM (248, 18.1%) for females.
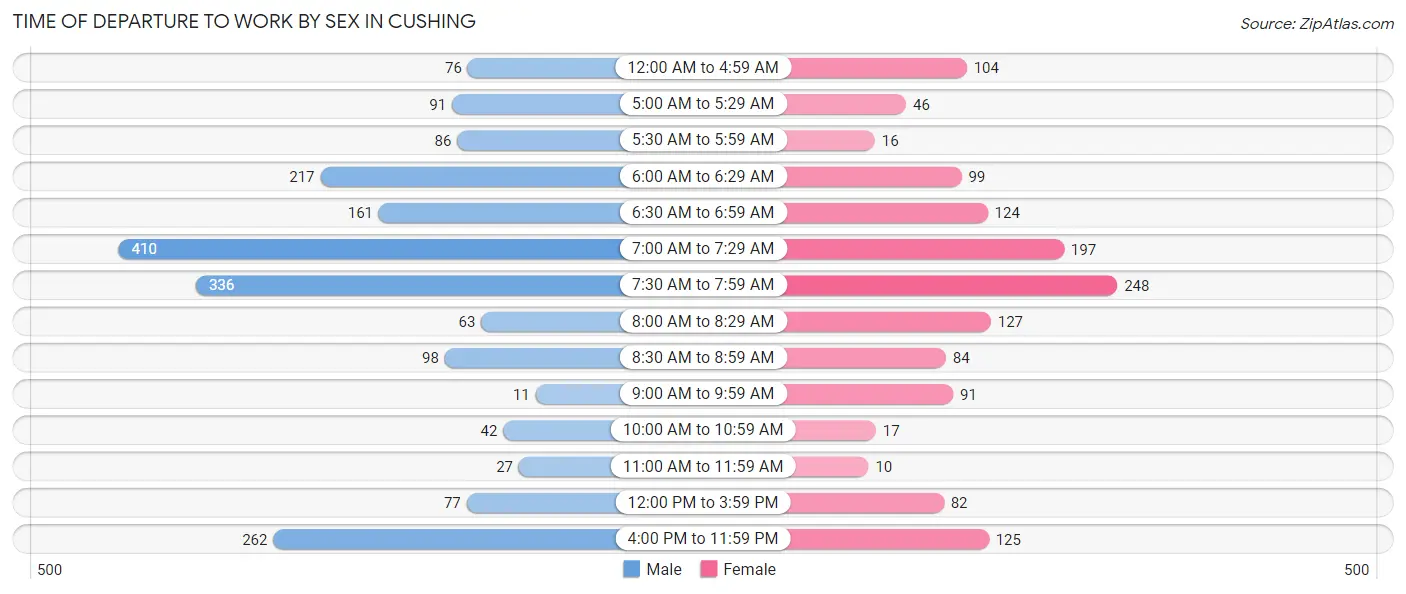
| Time of Departure | Male | Female |
| 12:00 AM to 4:59 AM | 76 (3.9%) | 104 (7.6%) |
| 5:00 AM to 5:29 AM | 91 (4.6%) | 46 (3.4%) |
| 5:30 AM to 5:59 AM | 86 (4.4%) | 16 (1.2%) |
| 6:00 AM to 6:29 AM | 217 (11.1%) | 99 (7.2%) |
| 6:30 AM to 6:59 AM | 161 (8.2%) | 124 (9.0%) |
| 7:00 AM to 7:29 AM | 410 (20.9%) | 197 (14.4%) |
| 7:30 AM to 7:59 AM | 336 (17.2%) | 248 (18.1%) |
| 8:00 AM to 8:29 AM | 63 (3.2%) | 127 (9.3%) |
| 8:30 AM to 8:59 AM | 98 (5.0%) | 84 (6.1%) |
| 9:00 AM to 9:59 AM | 11 (0.6%) | 91 (6.6%) |
| 10:00 AM to 10:59 AM | 42 (2.1%) | 17 (1.2%) |
| 11:00 AM to 11:59 AM | 27 (1.4%) | 10 (0.7%) |
| 12:00 PM to 3:59 PM | 77 (3.9%) | 82 (6.0%) |
| 4:00 PM to 11:59 PM | 262 (13.4%) | 125 (9.1%) |
| Total | 1,957 (100.0%) | 1,370 (100.0%) |
Housing Occupancy in Cushing
Occupancy by Ownership in Cushing
Of the total 3,034 dwellings in Cushing, owner-occupied units account for 1,591 (52.4%), while renter-occupied units make up 1,443 (47.6%).
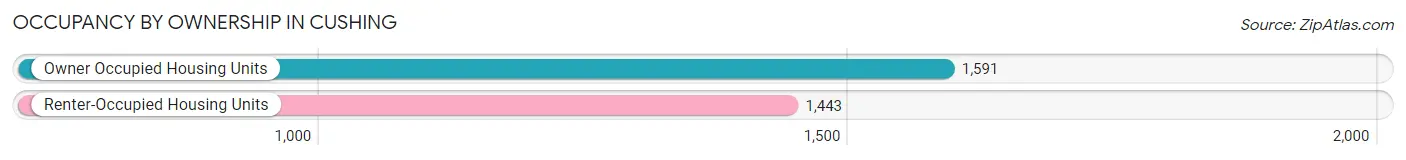
| Occupancy | # Housing Units | % Housing Units |
| Owner Occupied Housing Units | 1,591 | 52.4% |
| Renter-Occupied Housing Units | 1,443 | 47.6% |
| Total Occupied Housing Units | 3,034 | 100.0% |
Occupancy by Household Size in Cushing
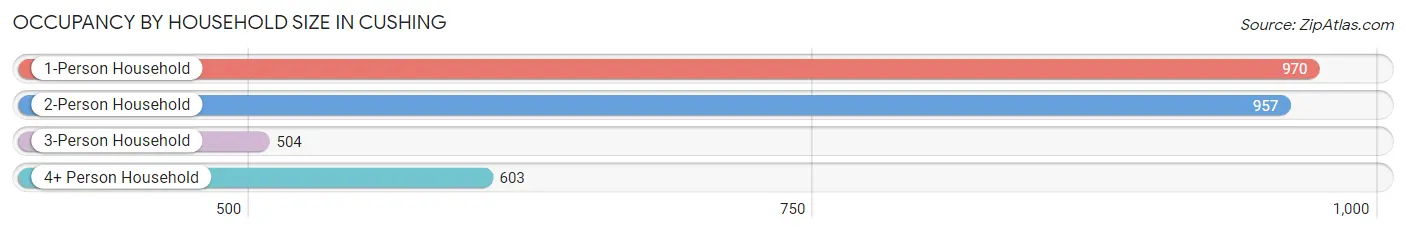
| Household Size | # Housing Units | % Housing Units |
| 1-Person Household | 970 | 32.0% |
| 2-Person Household | 957 | 31.5% |
| 3-Person Household | 504 | 16.6% |
| 4+ Person Household | 603 | 19.9% |
| Total Housing Units | 3,034 | 100.0% |
Occupancy by Ownership by Household Size in Cushing
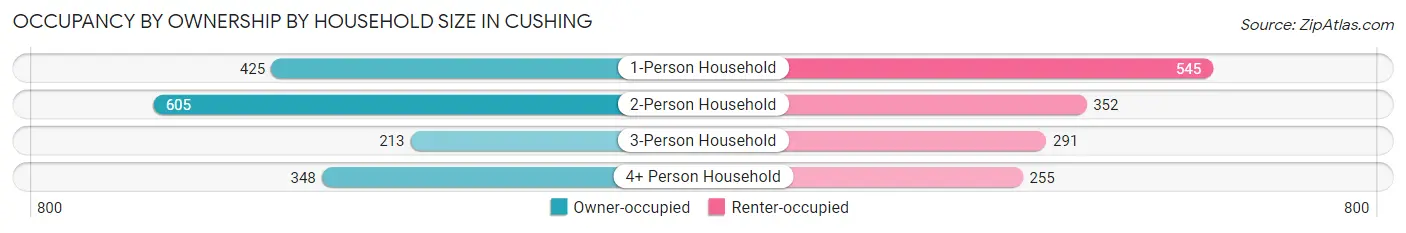
| Household Size | Owner-occupied | Renter-occupied |
| 1-Person Household | 425 (43.8%) | 545 (56.2%) |
| 2-Person Household | 605 (63.2%) | 352 (36.8%) |
| 3-Person Household | 213 (42.3%) | 291 (57.7%) |
| 4+ Person Household | 348 (57.7%) | 255 (42.3%) |
| Total Housing Units | 1,591 (52.4%) | 1,443 (47.6%) |
Occupancy by Educational Attainment in Cushing
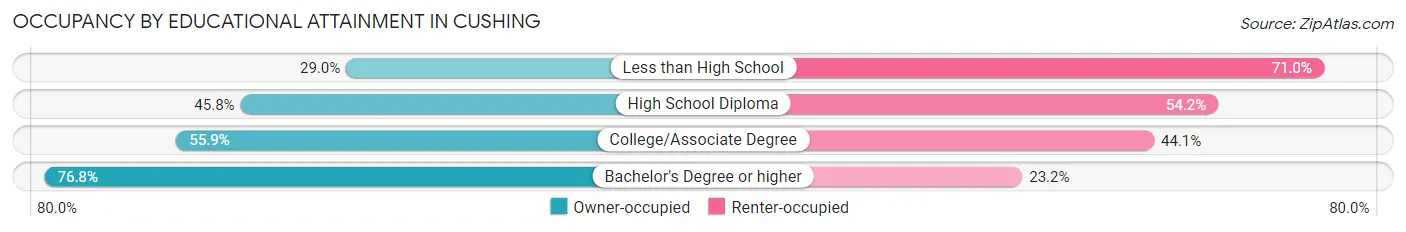
| Household Size | Owner-occupied | Renter-occupied |
| Less than High School | 87 (29.0%) | 213 (71.0%) |
| High School Diploma | 616 (45.8%) | 730 (54.2%) |
| College/Associate Degree | 477 (55.9%) | 376 (44.1%) |
| Bachelor's Degree or higher | 411 (76.8%) | 124 (23.2%) |
Occupancy by Age of Householder in Cushing
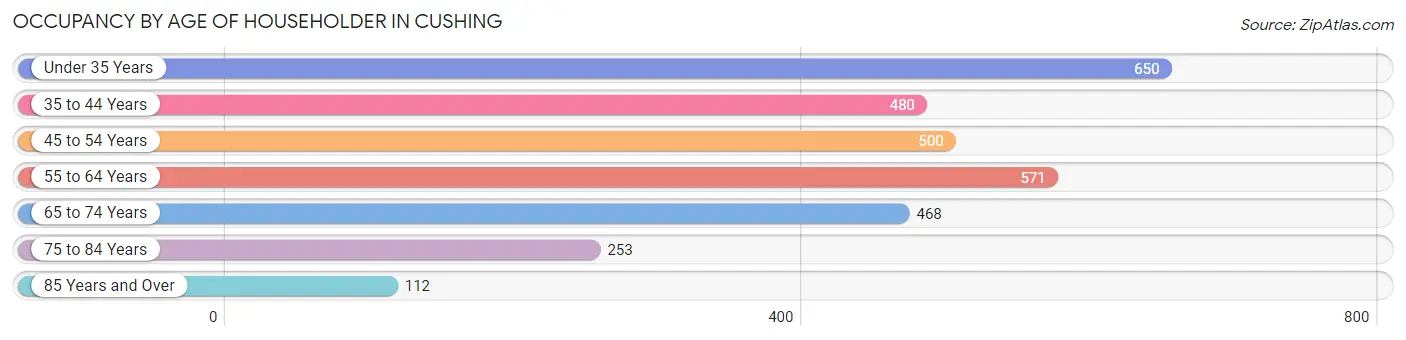
| Age Bracket | # Households | % Households |
| Under 35 Years | 650 | 21.4% |
| 35 to 44 Years | 480 | 15.8% |
| 45 to 54 Years | 500 | 16.5% |
| 55 to 64 Years | 571 | 18.8% |
| 65 to 74 Years | 468 | 15.4% |
| 75 to 84 Years | 253 | 8.3% |
| 85 Years and Over | 112 | 3.7% |
| Total | 3,034 | 100.0% |
Housing Finances in Cushing
Median Income by Occupancy in Cushing
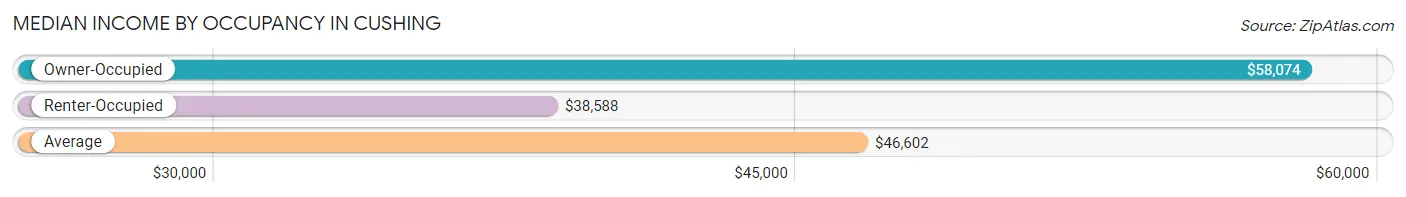
| Occupancy Type | # Households | Median Income |
| Owner-Occupied | 1,591 (52.4%) | $58,074 |
| Renter-Occupied | 1,443 (47.6%) | $38,588 |
| Average | 3,034 (100.0%) | $46,602 |
Occupancy by Householder Income Bracket in Cushing
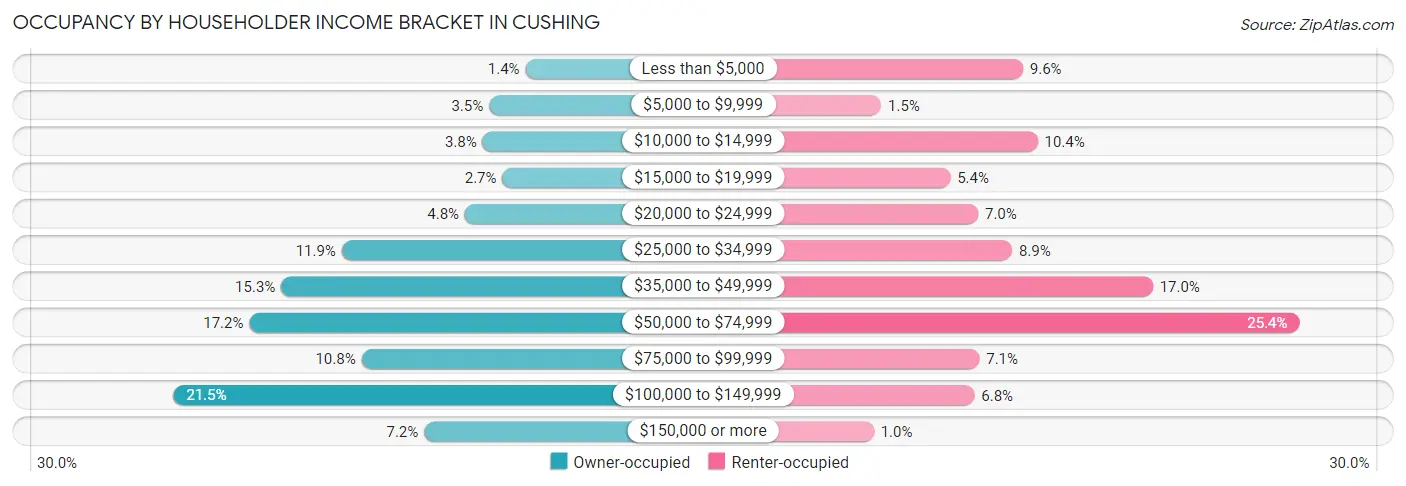
| Income Bracket | Owner-occupied | Renter-occupied |
| Less than $5,000 | 22 (1.4%) | 138 (9.6%) |
| $5,000 to $9,999 | 55 (3.5%) | 21 (1.5%) |
| $10,000 to $14,999 | 61 (3.8%) | 150 (10.4%) |
| $15,000 to $19,999 | 43 (2.7%) | 78 (5.4%) |
| $20,000 to $24,999 | 77 (4.8%) | 101 (7.0%) |
| $25,000 to $34,999 | 189 (11.9%) | 129 (8.9%) |
| $35,000 to $49,999 | 244 (15.3%) | 245 (17.0%) |
| $50,000 to $74,999 | 273 (17.2%) | 366 (25.4%) |
| $75,000 to $99,999 | 171 (10.7%) | 102 (7.1%) |
| $100,000 to $149,999 | 342 (21.5%) | 98 (6.8%) |
| $150,000 or more | 114 (7.2%) | 15 (1.0%) |
| Total | 1,591 (100.0%) | 1,443 (100.0%) |
Monthly Housing Cost Tiers in Cushing
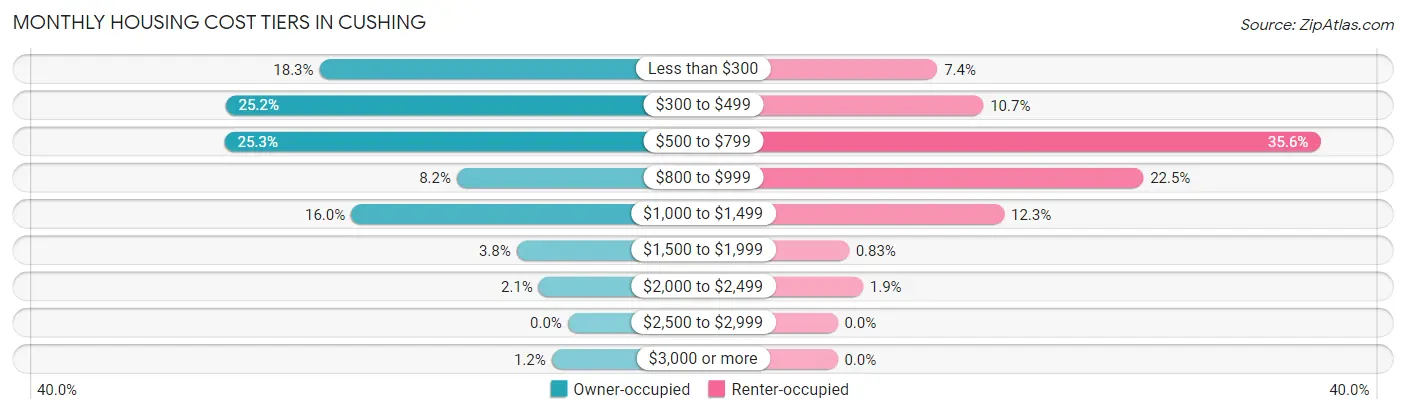
| Monthly Cost | Owner-occupied | Renter-occupied |
| Less than $300 | 291 (18.3%) | 106 (7.3%) |
| $300 to $499 | 401 (25.2%) | 155 (10.7%) |
| $500 to $799 | 402 (25.3%) | 513 (35.5%) |
| $800 to $999 | 130 (8.2%) | 325 (22.5%) |
| $1,000 to $1,499 | 254 (16.0%) | 177 (12.3%) |
| $1,500 to $1,999 | 60 (3.8%) | 12 (0.8%) |
| $2,000 to $2,499 | 34 (2.1%) | 27 (1.9%) |
| $2,500 to $2,999 | 0 (0.0%) | 0 (0.0%) |
| $3,000 or more | 19 (1.2%) | 0 (0.0%) |
| Total | 1,591 (100.0%) | 1,443 (100.0%) |
Physical Housing Characteristics in Cushing
Housing Structures in Cushing
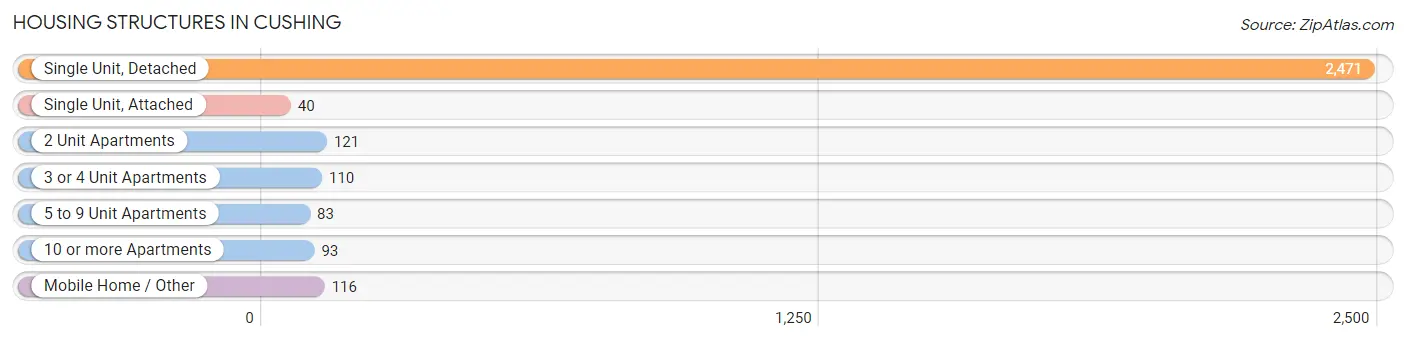
| Structure Type | # Housing Units | % Housing Units |
| Single Unit, Detached | 2,471 | 81.4% |
| Single Unit, Attached | 40 | 1.3% |
| 2 Unit Apartments | 121 | 4.0% |
| 3 or 4 Unit Apartments | 110 | 3.6% |
| 5 to 9 Unit Apartments | 83 | 2.7% |
| 10 or more Apartments | 93 | 3.1% |
| Mobile Home / Other | 116 | 3.8% |
| Total | 3,034 | 100.0% |
Housing Structures by Occupancy in Cushing
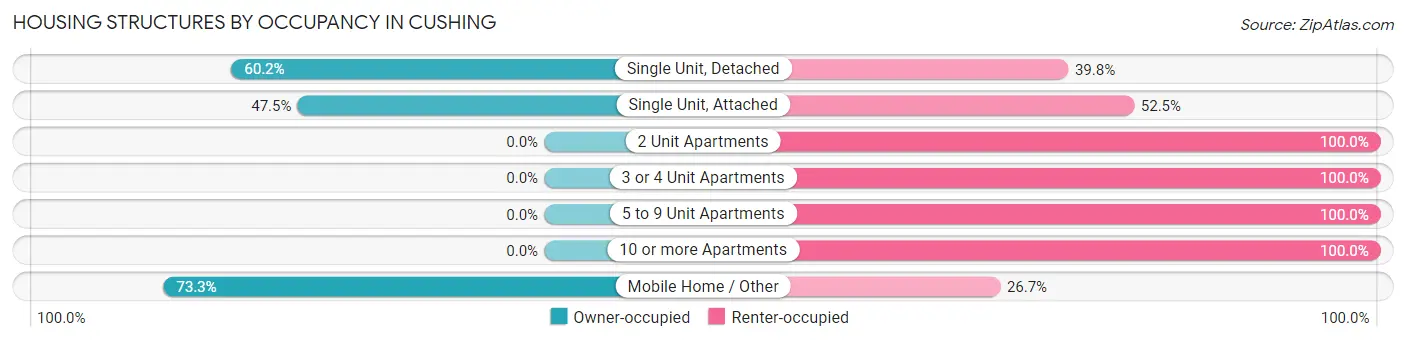
| Structure Type | Owner-occupied | Renter-occupied |
| Single Unit, Detached | 1,487 (60.2%) | 984 (39.8%) |
| Single Unit, Attached | 19 (47.5%) | 21 (52.5%) |
| 2 Unit Apartments | 0 (0.0%) | 121 (100.0%) |
| 3 or 4 Unit Apartments | 0 (0.0%) | 110 (100.0%) |
| 5 to 9 Unit Apartments | 0 (0.0%) | 83 (100.0%) |
| 10 or more Apartments | 0 (0.0%) | 93 (100.0%) |
| Mobile Home / Other | 85 (73.3%) | 31 (26.7%) |
| Total | 1,591 (52.4%) | 1,443 (47.6%) |
Housing Structures by Number of Rooms in Cushing
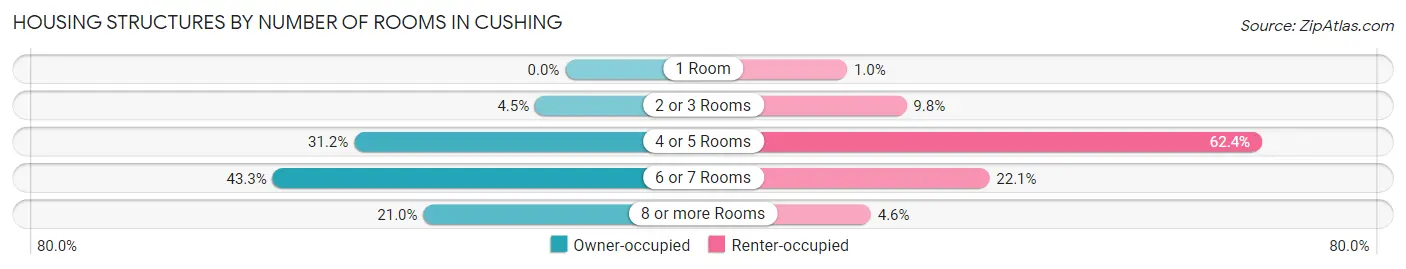
| Number of Rooms | Owner-occupied | Renter-occupied |
| 1 Room | 0 (0.0%) | 15 (1.0%) |
| 2 or 3 Rooms | 71 (4.5%) | 142 (9.8%) |
| 4 or 5 Rooms | 497 (31.2%) | 901 (62.4%) |
| 6 or 7 Rooms | 689 (43.3%) | 319 (22.1%) |
| 8 or more Rooms | 334 (21.0%) | 66 (4.6%) |
| Total | 1,591 (100.0%) | 1,443 (100.0%) |
Housing Structure by Heating Type in Cushing
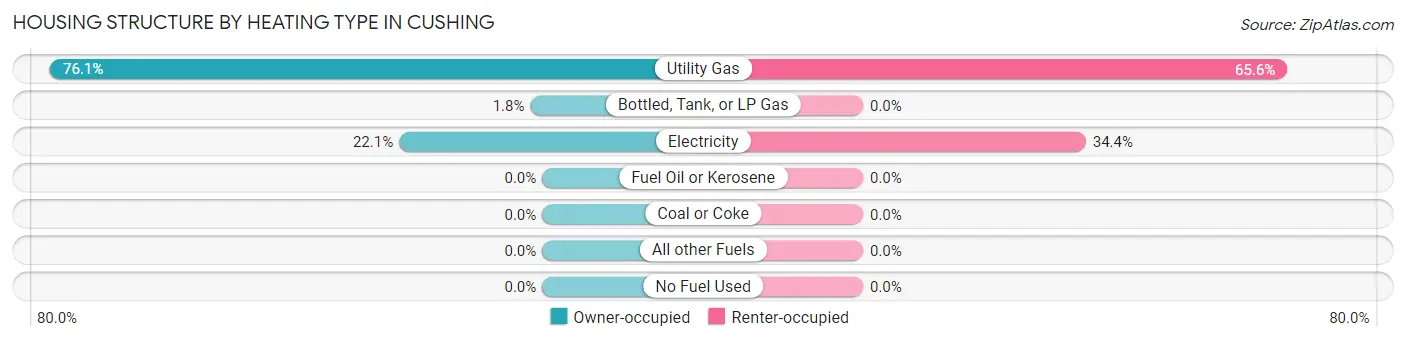
| Heating Type | Owner-occupied | Renter-occupied |
| Utility Gas | 1,210 (76.0%) | 946 (65.6%) |
| Bottled, Tank, or LP Gas | 29 (1.8%) | 0 (0.0%) |
| Electricity | 352 (22.1%) | 497 (34.4%) |
| Fuel Oil or Kerosene | 0 (0.0%) | 0 (0.0%) |
| Coal or Coke | 0 (0.0%) | 0 (0.0%) |
| All other Fuels | 0 (0.0%) | 0 (0.0%) |
| No Fuel Used | 0 (0.0%) | 0 (0.0%) |
| Total | 1,591 (100.0%) | 1,443 (100.0%) |
Household Vehicle Usage in Cushing
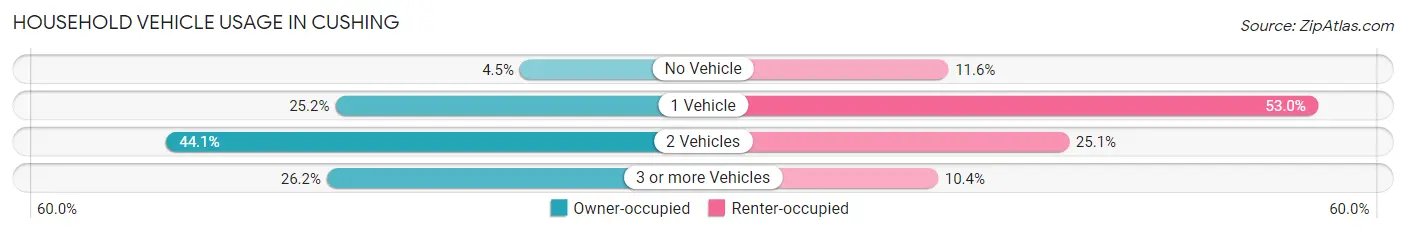
| Vehicles per Household | Owner-occupied | Renter-occupied |
| No Vehicle | 72 (4.5%) | 167 (11.6%) |
| 1 Vehicle | 401 (25.2%) | 764 (52.9%) |
| 2 Vehicles | 702 (44.1%) | 362 (25.1%) |
| 3 or more Vehicles | 416 (26.2%) | 150 (10.4%) |
| Total | 1,591 (100.0%) | 1,443 (100.0%) |
Real Estate & Mortgages in Cushing
Real Estate and Mortgage Overview in Cushing
| Characteristic | Without Mortgage | With Mortgage |
| Housing Units | 1,003 | 588 |
| Median Property Value | $92,000 | $127,500 |
| Median Household Income | $42,964 | $69 |
| Monthly Housing Costs | $395 | $19 |
| Real Estate Taxes | $517 | $13 |
Property Value by Mortgage Status in Cushing
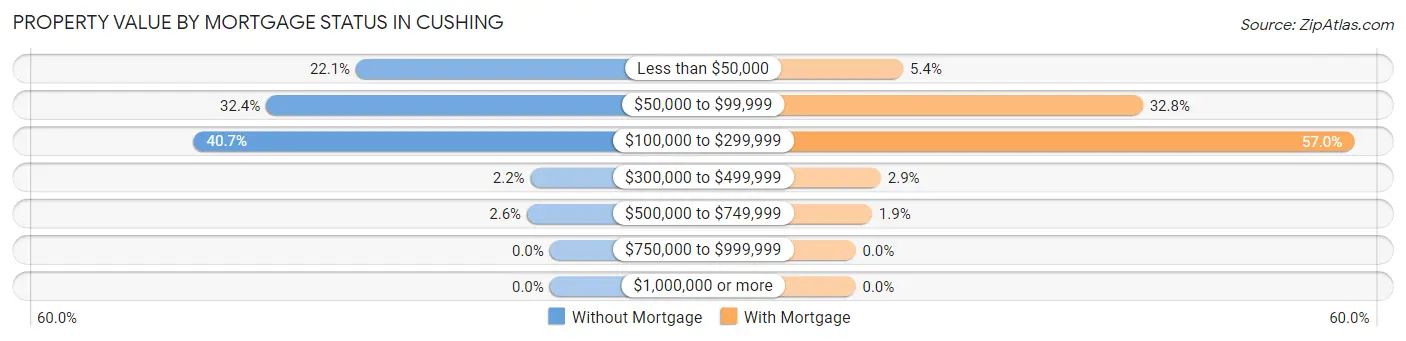
| Property Value | Without Mortgage | With Mortgage |
| Less than $50,000 | 222 (22.1%) | 32 (5.4%) |
| $50,000 to $99,999 | 325 (32.4%) | 193 (32.8%) |
| $100,000 to $299,999 | 408 (40.7%) | 335 (57.0%) |
| $300,000 to $499,999 | 22 (2.2%) | 17 (2.9%) |
| $500,000 to $749,999 | 26 (2.6%) | 11 (1.9%) |
| $750,000 to $999,999 | 0 (0.0%) | 0 (0.0%) |
| $1,000,000 or more | 0 (0.0%) | 0 (0.0%) |
| Total | 1,003 (100.0%) | 588 (100.0%) |
Household Income by Mortgage Status in Cushing
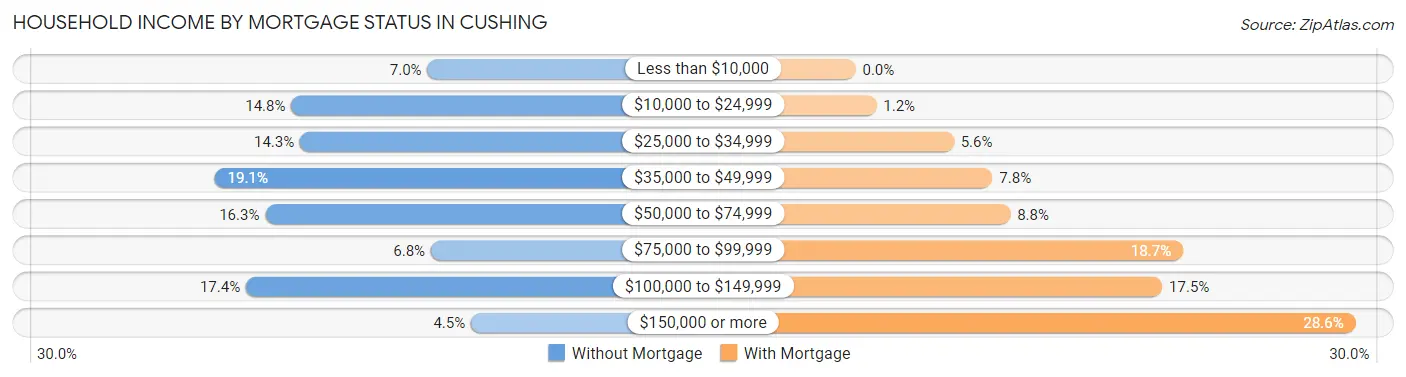
| Household Income | Without Mortgage | With Mortgage |
| Less than $10,000 | 70 (7.0%) | 0 (0.0%) |
| $10,000 to $24,999 | 148 (14.8%) | 7 (1.2%) |
| $25,000 to $34,999 | 143 (14.3%) | 33 (5.6%) |
| $35,000 to $49,999 | 192 (19.1%) | 46 (7.8%) |
| $50,000 to $74,999 | 163 (16.3%) | 52 (8.8%) |
| $75,000 to $99,999 | 68 (6.8%) | 110 (18.7%) |
| $100,000 to $149,999 | 174 (17.3%) | 103 (17.5%) |
| $150,000 or more | 45 (4.5%) | 168 (28.6%) |
| Total | 1,003 (100.0%) | 588 (100.0%) |
Property Value to Household Income Ratio in Cushing
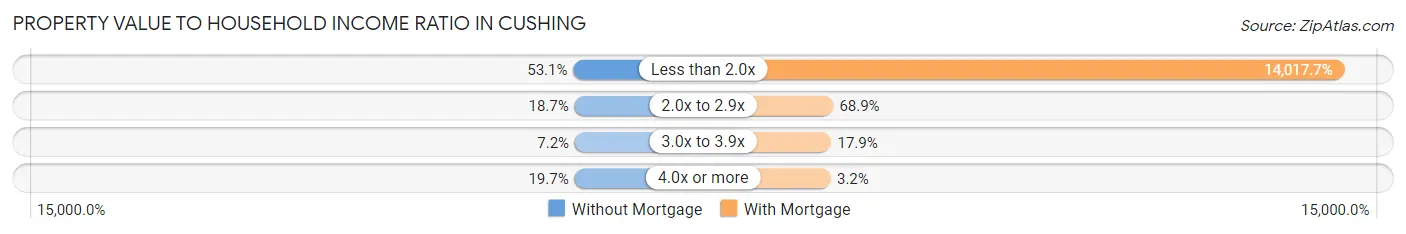
| Value-to-Income Ratio | Without Mortgage | With Mortgage |
| Less than 2.0x | 533 (53.1%) | 82,424 (14,017.7%) |
| 2.0x to 2.9x | 188 (18.7%) | 405 (68.9%) |
| 3.0x to 3.9x | 72 (7.2%) | 105 (17.9%) |
| 4.0x or more | 198 (19.7%) | 19 (3.2%) |
| Total | 1,003 (100.0%) | 588 (100.0%) |
Real Estate Taxes by Mortgage Status in Cushing
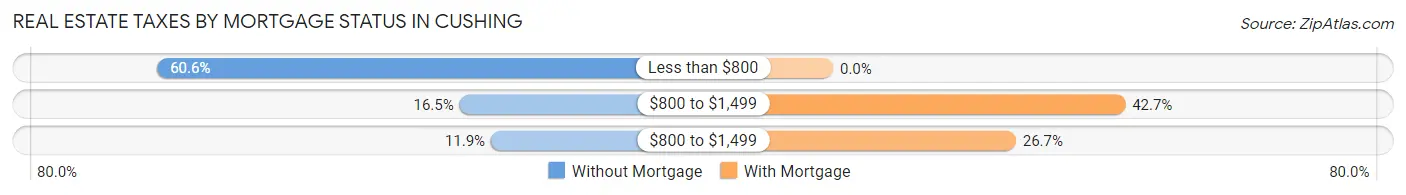
| Property Taxes | Without Mortgage | With Mortgage |
| Less than $800 | 608 (60.6%) | 0 (0.0%) |
| $800 to $1,499 | 165 (16.5%) | 251 (42.7%) |
| $800 to $1,499 | 119 (11.9%) | 157 (26.7%) |
| Total | 1,003 (100.0%) | 588 (100.0%) |
Health & Disability in Cushing
Health Insurance Coverage by Age in Cushing
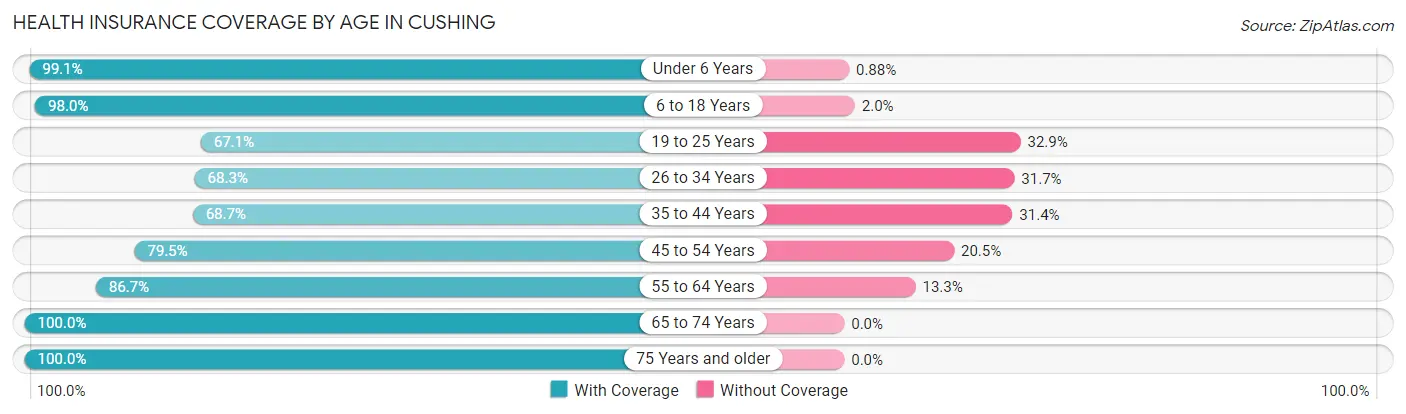
| Age Bracket | With Coverage | Without Coverage |
| Under 6 Years | 560 (99.1%) | 5 (0.9%) |
| 6 to 18 Years | 1,242 (98.0%) | 25 (2.0%) |
| 19 to 25 Years | 468 (67.1%) | 229 (32.9%) |
| 26 to 34 Years | 693 (68.3%) | 322 (31.7%) |
| 35 to 44 Years | 613 (68.6%) | 280 (31.4%) |
| 45 to 54 Years | 614 (79.5%) | 158 (20.5%) |
| 55 to 64 Years | 835 (86.7%) | 128 (13.3%) |
| 65 to 74 Years | 598 (100.0%) | 0 (0.0%) |
| 75 Years and older | 552 (100.0%) | 0 (0.0%) |
| Total | 6,175 (84.3%) | 1,147 (15.7%) |
Health Insurance Coverage by Citizenship Status in Cushing
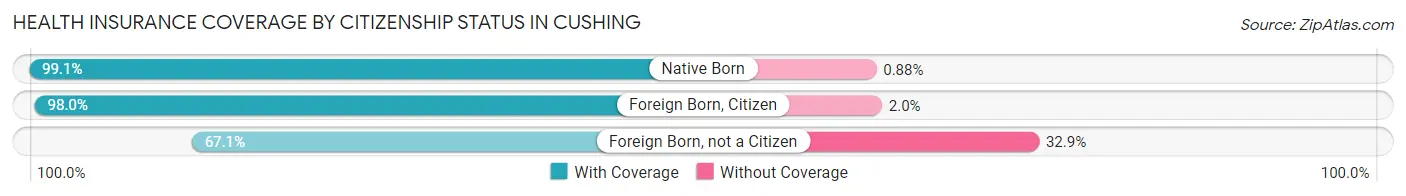
| Citizenship Status | With Coverage | Without Coverage |
| Native Born | 560 (99.1%) | 5 (0.9%) |
| Foreign Born, Citizen | 1,242 (98.0%) | 25 (2.0%) |
| Foreign Born, not a Citizen | 468 (67.1%) | 229 (32.9%) |
Health Insurance Coverage by Household Income in Cushing
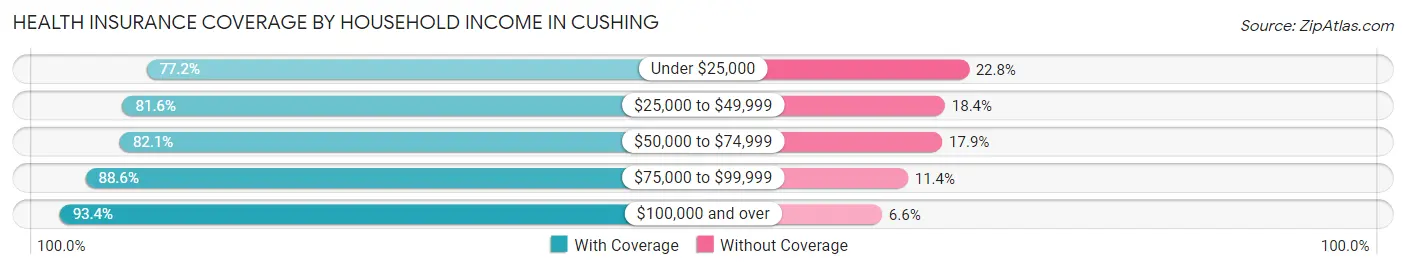
| Household Income | With Coverage | Without Coverage |
| Under $25,000 | 1,034 (77.2%) | 306 (22.8%) |
| $25,000 to $49,999 | 1,498 (81.6%) | 337 (18.4%) |
| $50,000 to $74,999 | 1,360 (82.1%) | 296 (17.9%) |
| $75,000 to $99,999 | 744 (88.6%) | 96 (11.4%) |
| $100,000 and over | 1,533 (93.4%) | 108 (6.6%) |
Public vs Private Health Insurance Coverage by Age in Cushing
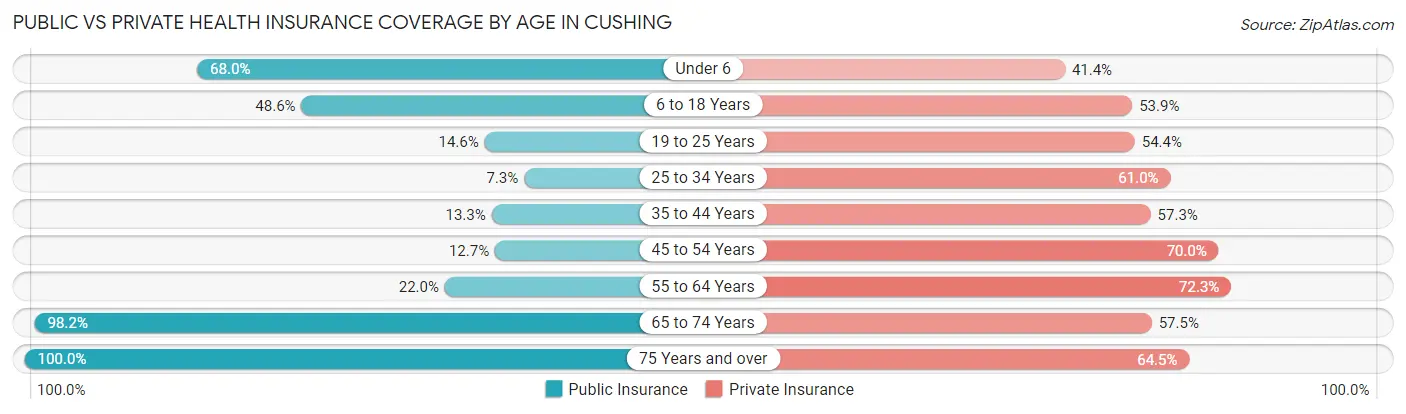
| Age Bracket | Public Insurance | Private Insurance |
| Under 6 | 384 (68.0%) | 234 (41.4%) |
| 6 to 18 Years | 616 (48.6%) | 683 (53.9%) |
| 19 to 25 Years | 102 (14.6%) | 379 (54.4%) |
| 25 to 34 Years | 74 (7.3%) | 619 (61.0%) |
| 35 to 44 Years | 119 (13.3%) | 512 (57.3%) |
| 45 to 54 Years | 98 (12.7%) | 540 (70.0%) |
| 55 to 64 Years | 212 (22.0%) | 696 (72.3%) |
| 65 to 74 Years | 587 (98.2%) | 344 (57.5%) |
| 75 Years and over | 552 (100.0%) | 356 (64.5%) |
| Total | 2,744 (37.5%) | 4,363 (59.6%) |
Disability Status by Sex by Age in Cushing
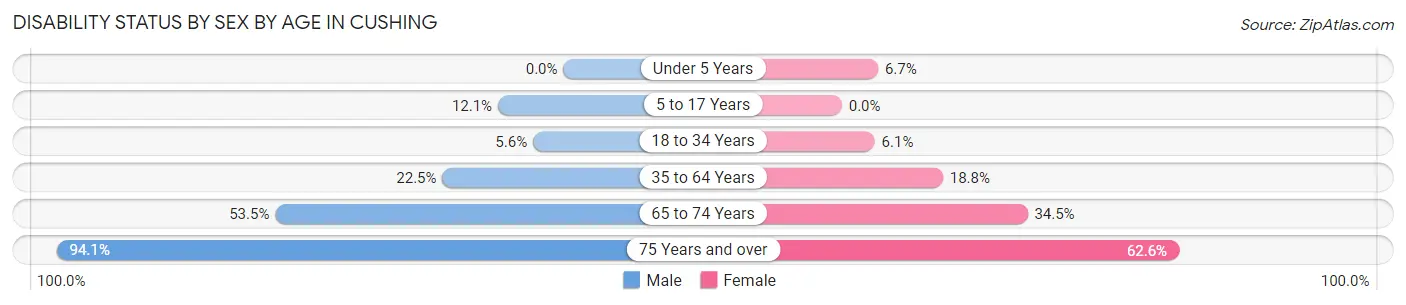
| Age Bracket | Male | Female |
| Under 5 Years | 0 (0.0%) | 11 (6.7%) |
| 5 to 17 Years | 81 (12.1%) | 0 (0.0%) |
| 18 to 34 Years | 57 (5.6%) | 47 (6.1%) |
| 35 to 64 Years | 292 (22.5%) | 249 (18.8%) |
| 65 to 74 Years | 146 (53.5%) | 112 (34.5%) |
| 75 Years and over | 190 (94.1%) | 219 (62.6%) |
Disability Class by Sex by Age in Cushing
Disability Class: Hearing Difficulty
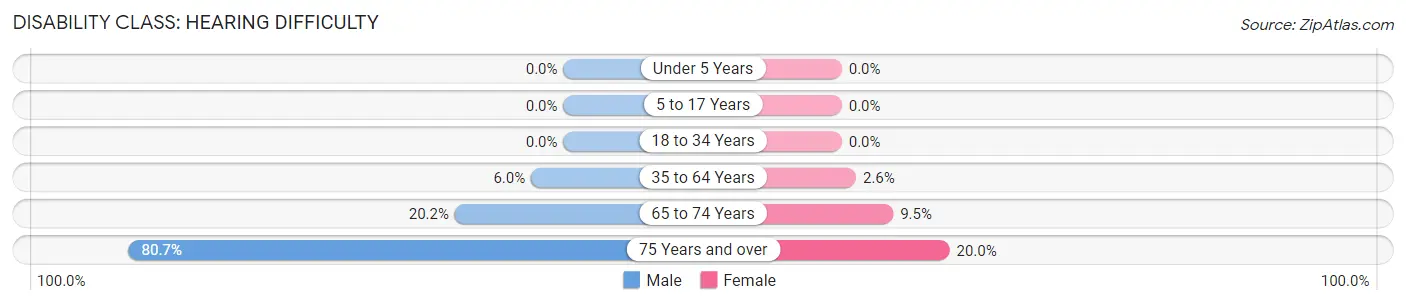
| Age Bracket | Male | Female |
| Under 5 Years | 0 (0.0%) | 0 (0.0%) |
| 5 to 17 Years | 0 (0.0%) | 0 (0.0%) |
| 18 to 34 Years | 0 (0.0%) | 0 (0.0%) |
| 35 to 64 Years | 78 (6.0%) | 35 (2.6%) |
| 65 to 74 Years | 55 (20.2%) | 31 (9.5%) |
| 75 Years and over | 163 (80.7%) | 70 (20.0%) |
Disability Class: Vision Difficulty
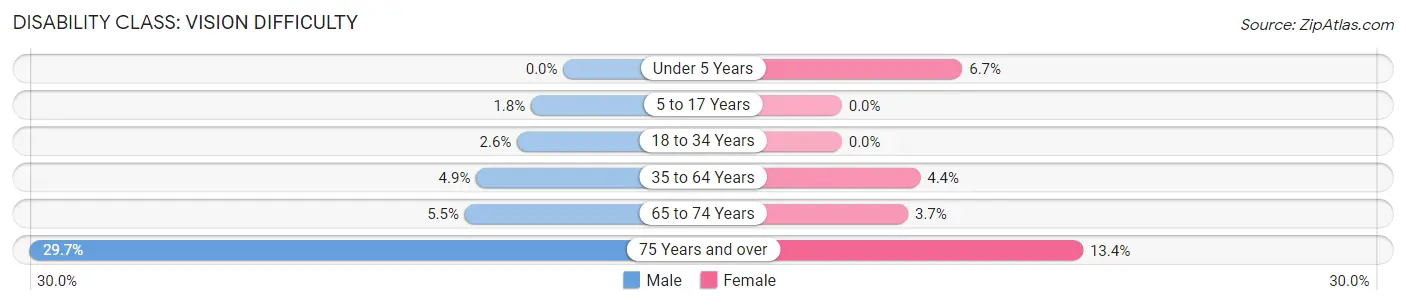
| Age Bracket | Male | Female |
| Under 5 Years | 0 (0.0%) | 11 (6.7%) |
| 5 to 17 Years | 12 (1.8%) | 0 (0.0%) |
| 18 to 34 Years | 26 (2.6%) | 0 (0.0%) |
| 35 to 64 Years | 63 (4.9%) | 58 (4.4%) |
| 65 to 74 Years | 15 (5.5%) | 12 (3.7%) |
| 75 Years and over | 60 (29.7%) | 47 (13.4%) |
Disability Class: Cognitive Difficulty
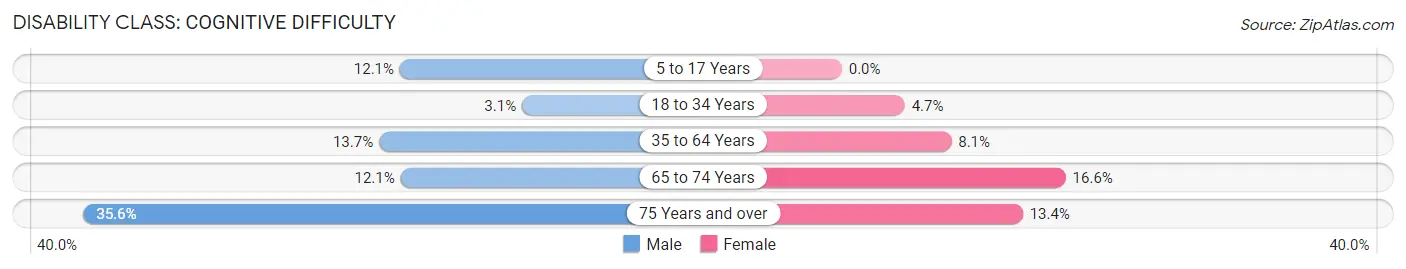
| Age Bracket | Male | Female |
| 5 to 17 Years | 81 (12.1%) | 0 (0.0%) |
| 18 to 34 Years | 31 (3.1%) | 36 (4.7%) |
| 35 to 64 Years | 178 (13.7%) | 108 (8.1%) |
| 65 to 74 Years | 33 (12.1%) | 54 (16.6%) |
| 75 Years and over | 72 (35.6%) | 47 (13.4%) |
Disability Class: Ambulatory Difficulty
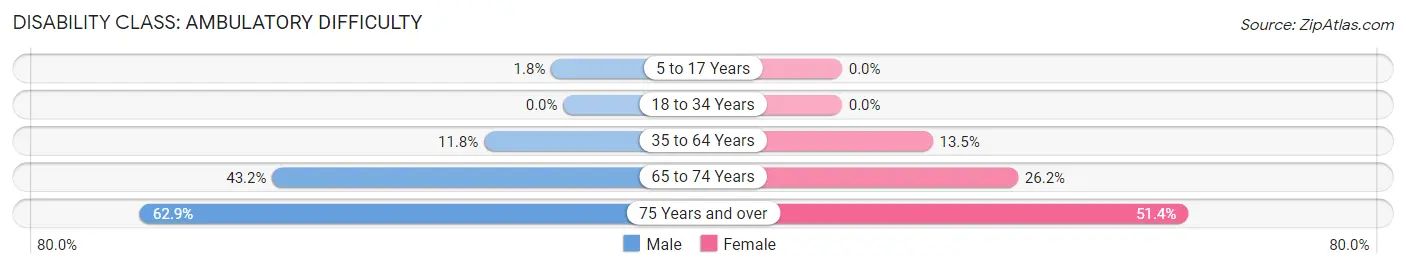
| Age Bracket | Male | Female |
| 5 to 17 Years | 12 (1.8%) | 0 (0.0%) |
| 18 to 34 Years | 0 (0.0%) | 0 (0.0%) |
| 35 to 64 Years | 153 (11.8%) | 179 (13.5%) |
| 65 to 74 Years | 118 (43.2%) | 85 (26.2%) |
| 75 Years and over | 127 (62.9%) | 180 (51.4%) |
Disability Class: Self-Care Difficulty
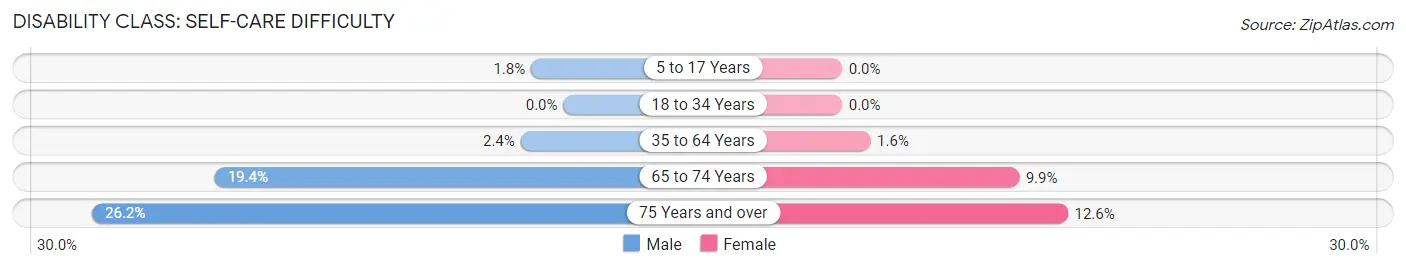
| Age Bracket | Male | Female |
| 5 to 17 Years | 12 (1.8%) | 0 (0.0%) |
| 18 to 34 Years | 0 (0.0%) | 0 (0.0%) |
| 35 to 64 Years | 31 (2.4%) | 21 (1.6%) |
| 65 to 74 Years | 53 (19.4%) | 32 (9.9%) |
| 75 Years and over | 53 (26.2%) | 44 (12.6%) |
Technology Access in Cushing
Computing Device Access in Cushing
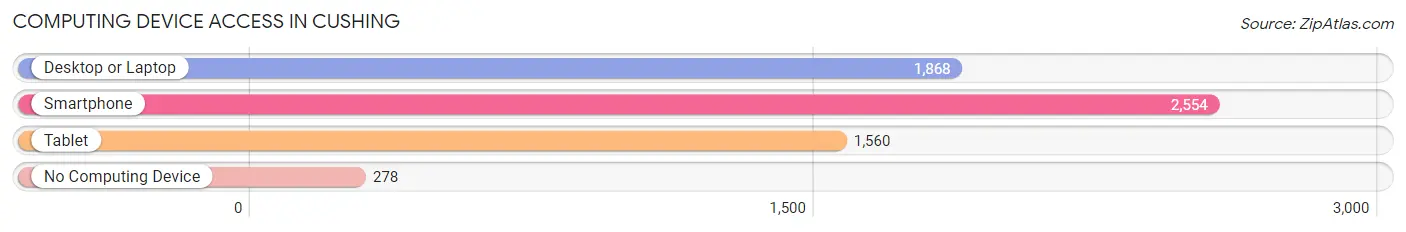
| Device Type | # Households | % Households |
| Desktop or Laptop | 1,868 | 61.6% |
| Smartphone | 2,554 | 84.2% |
| Tablet | 1,560 | 51.4% |
| No Computing Device | 278 | 9.2% |
| Total | 3,034 | 100.0% |
Internet Access in Cushing
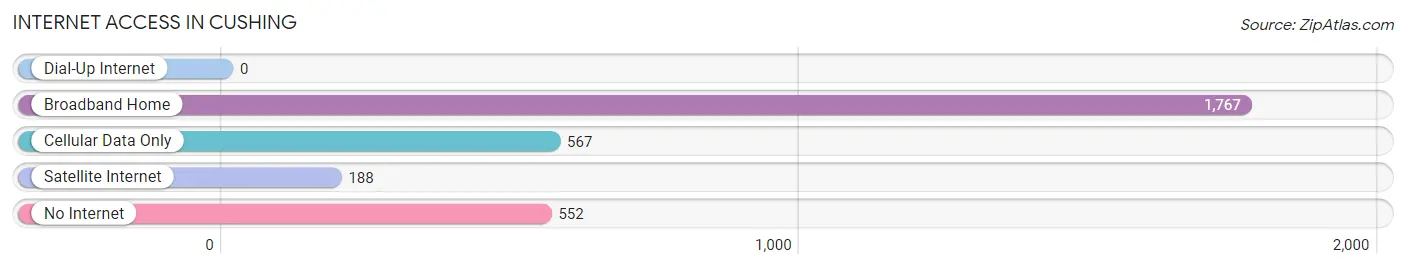
| Internet Type | # Households | % Households |
| Dial-Up Internet | 0 | 0.0% |
| Broadband Home | 1,767 | 58.2% |
| Cellular Data Only | 567 | 18.7% |
| Satellite Internet | 188 | 6.2% |
| No Internet | 552 | 18.2% |
| Total | 3,034 | 100.0% |
Cushing Summary
Cushing, Oklahoma is a small city located in Payne County, Oklahoma. It is situated in the heart of the state, approximately 70 miles northeast of Oklahoma City. The city is known as the “Pipeline Crossroads of the World” due to its location at the intersection of several major oil pipelines. Cushing has a population of approximately 8,000 people and is the county seat of Payne County.
History
Cushing was founded in 1891 by William C. Rogers, a rancher and businessman from Kansas. He named the town after his friend, Marshall Cushing, who was a prominent lawyer in Kansas. The town was originally a stop on the Atchison, Topeka and Santa Fe Railway. In 1895, the first oil well was drilled in the area, and the town quickly became a center for the oil industry. By the early 1900s, Cushing had become a major oil hub, with dozens of oil companies operating in the area.
In the 1920s, Cushing was the site of a major oil boom. The population of the town grew rapidly, and the city was soon home to several large oil refineries. The city also became a major center for the oil industry, with several major oil companies having offices in the city.
Geography
Cushing is located in the central part of Oklahoma, approximately 70 miles northeast of Oklahoma City. The city is situated in the Osage Plains, a region of rolling hills and prairies. The Cimarron River runs through the city, and the city is surrounded by several small lakes. The climate in Cushing is generally mild, with hot summers and cold winters.
Economy
Cushing’s economy is largely based on the oil industry. The city is home to several major oil companies, including Chevron, ConocoPhillips, and Marathon Oil. The city is also home to several oil refineries, and is a major hub for the transportation of oil and gas. In addition to the oil industry, Cushing is also home to several manufacturing companies, including a steel mill and a paper mill.
Demographics
As of the 2010 census, Cushing had a population of 8,371 people. The racial makeup of the city was 79.3% White, 15.2% African American, 0.7% Native American, 0.5% Asian, 0.1% Pacific Islander, and 3.2% from other races. The median household income in Cushing was $37,945, and the median family income was $45,945. The per capita income in Cushing was $19,945.
Cushing is a small city with a rich history and a vibrant economy. The city is home to several major oil companies, and is a major hub for the transportation of oil and gas. The city is also home to several manufacturing companies, and has a diverse population. Cushing is a great place to live and work, and is a great example of the success of the oil industry in Oklahoma.
Common Questions
What is Per Capita Income in Cushing?
Per Capita income in Cushing is $24,561.
What is the Median Family Income in Cushing?
Median Family Income in Cushing is $56,832.
What is the Median Household income in Cushing?
Median Household Income in Cushing is $46,602.
What is Income or Wage Gap in Cushing?
Income or Wage Gap in Cushing is 20.8%.
Women in Cushing earn 79.2 cents for every dollar earned by a man.
What is Family Income Deficit in Cushing?
Family Income Deficit in Cushing is $13,185.
Families that are below poverty line in Cushing earn $13,185 less on average than the poverty threshold level.
What is Inequality or Gini Index in Cushing?
Inequality or Gini Index in Cushing is 0.46.
What is the Total Population of Cushing?
Total Population of Cushing is 8,336.
What is the Total Male Population of Cushing?
Total Male Population of Cushing is 4,673.
What is the Total Female Population of Cushing?
Total Female Population of Cushing is 3,663.
What is the Ratio of Males per 100 Females in Cushing?
There are 127.57 Males per 100 Females in Cushing.
What is the Ratio of Females per 100 Males in Cushing?
There are 78.39 Females per 100 Males in Cushing.
What is the Median Population Age in Cushing?
Median Population Age in Cushing is 35.8 Years.
What is the Average Family Size in Cushing
Average Family Size in Cushing is 3.1 People.
What is the Average Household Size in Cushing
Average Household Size in Cushing is 2.4 People.
How Large is the Labor Force in Cushing?
There are 3,696 People in the Labor Forcein in Cushing.
What is the Percentage of People in the Labor Force in Cushing?
54.3% of People are in the Labor Force in Cushing.
What is the Unemployment Rate in Cushing?
Unemployment Rate in Cushing is 4.5%.