Wewoka, OK Map & Demographics
Wewoka Map
Wewoka Overview
$18,702
PER CAPITA INCOME
$47,917
AVG FAMILY INCOME
$34,120
AVG HOUSEHOLD INCOME
23.2%
WAGE / INCOME GAP [ % ]
76.8¢/ $1
WAGE / INCOME GAP [ $ ]
$12,668
FAMILY INCOME DEFICIT
0.42
INEQUALITY / GINI INDEX
3,124
TOTAL POPULATION
1,621
MALE POPULATION
1,503
FEMALE POPULATION
107.85
MALES / 100 FEMALES
92.72
FEMALES / 100 MALES
38.9
MEDIAN AGE
3.5
AVG FAMILY SIZE
2.6
AVG HOUSEHOLD SIZE
959
LABOR FORCE [ PEOPLE ]
39.0%
PERCENT IN LABOR FORCE
10.2%
UNEMPLOYMENT RATE
Wewoka Zip Codes
Wewoka Area Codes
Income in Wewoka
Income Overview in Wewoka
Per Capita Income in Wewoka is $18,702, while median incomes of families and households are $47,917 and $34,120 respectively.
| Characteristic | Number | Measure |
| Per Capita Income | 3,124 | $18,702 |
| Median Family Income | 645 | $47,917 |
| Mean Family Income | 645 | $52,612 |
| Median Household Income | 1,089 | $34,120 |
| Mean Household Income | 1,089 | $44,989 |
| Income Deficit | 645 | $12,668 |
| Wage / Income Gap (%) | 3,124 | 23.23% |
| Wage / Income Gap ($) | 3,124 | 76.77¢ per $1 |
| Gini / Inequality Index | 3,124 | 0.42 |
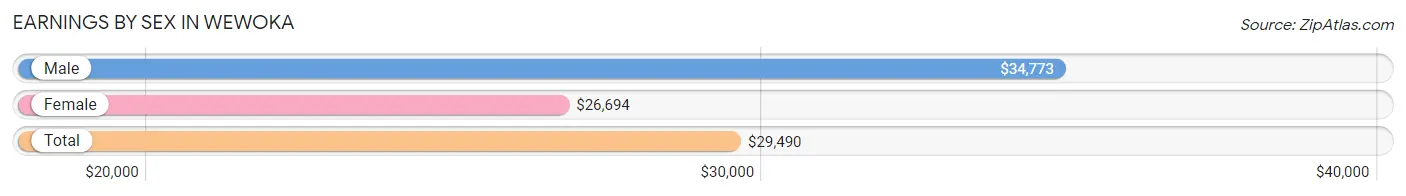
Earnings by Sex in Wewoka
Average Earnings in Wewoka are $29,490, $34,773 for men and $26,694 for women, a difference of 23.2%.
| Sex | Number | Average Earnings |
| Male | 564 (54.9%) | $34,773 |
| Female | 464 (45.1%) | $26,694 |
| Total | 1,028 (100.0%) | $29,490 |
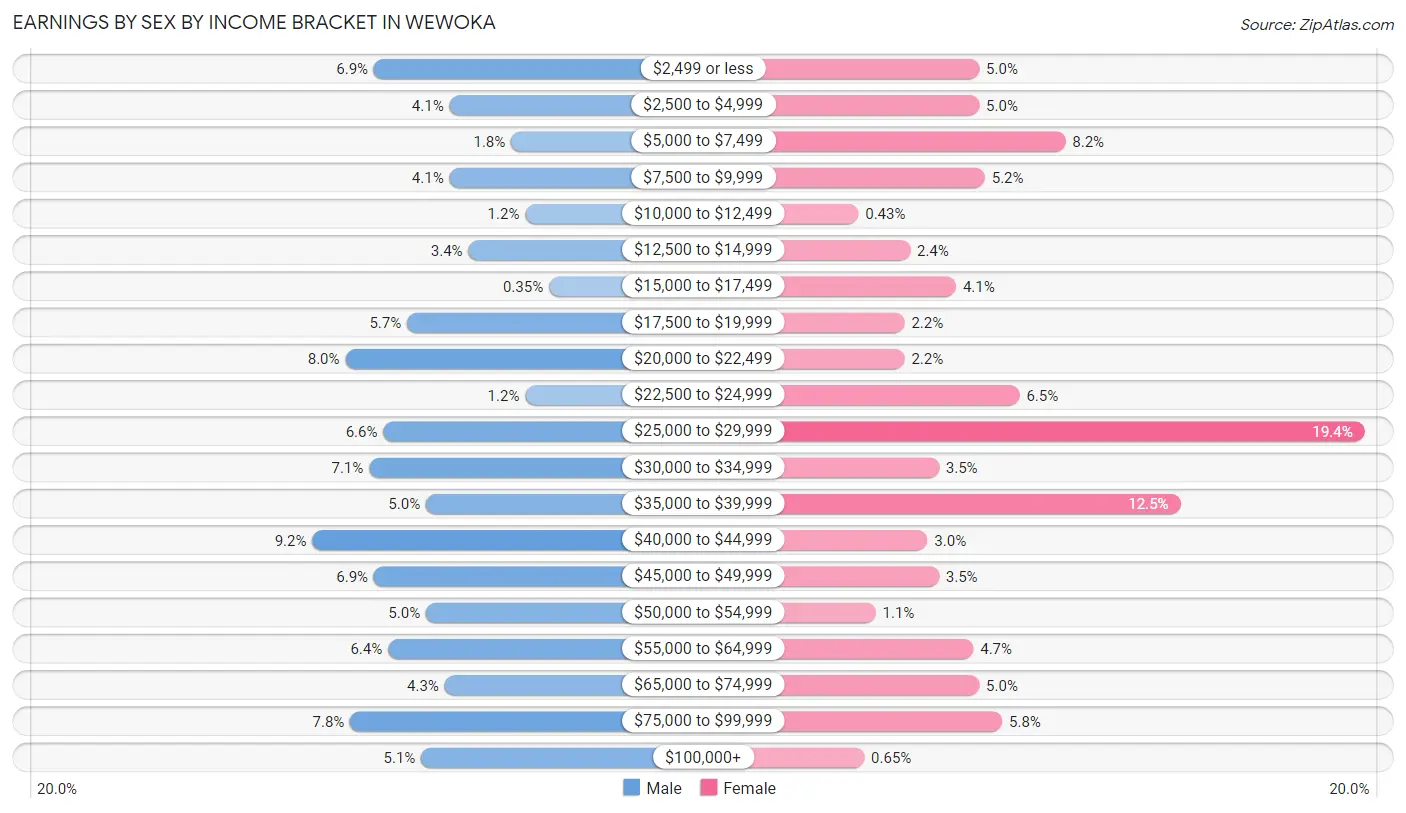
Earnings by Sex by Income Bracket in Wewoka
The most common earnings brackets in Wewoka are $40,000 to $44,999 for men (52 | 9.2%) and $25,000 to $29,999 for women (90 | 19.4%).
| Income | Male | Female |
| $2,499 or less | 39 (6.9%) | 23 (5.0%) |
| $2,500 to $4,999 | 23 (4.1%) | 23 (5.0%) |
| $5,000 to $7,499 | 10 (1.8%) | 38 (8.2%) |
| $7,500 to $9,999 | 23 (4.1%) | 24 (5.2%) |
| $10,000 to $12,499 | 7 (1.2%) | 2 (0.4%) |
| $12,500 to $14,999 | 19 (3.4%) | 11 (2.4%) |
| $15,000 to $17,499 | 2 (0.4%) | 19 (4.1%) |
| $17,500 to $19,999 | 32 (5.7%) | 10 (2.2%) |
| $20,000 to $22,499 | 45 (8.0%) | 10 (2.2%) |
| $22,500 to $24,999 | 7 (1.2%) | 30 (6.5%) |
| $25,000 to $29,999 | 37 (6.6%) | 90 (19.4%) |
| $30,000 to $34,999 | 40 (7.1%) | 16 (3.5%) |
| $35,000 to $39,999 | 28 (5.0%) | 58 (12.5%) |
| $40,000 to $44,999 | 52 (9.2%) | 14 (3.0%) |
| $45,000 to $49,999 | 39 (6.9%) | 16 (3.5%) |
| $50,000 to $54,999 | 28 (5.0%) | 5 (1.1%) |
| $55,000 to $64,999 | 36 (6.4%) | 22 (4.7%) |
| $65,000 to $74,999 | 24 (4.3%) | 23 (5.0%) |
| $75,000 to $99,999 | 44 (7.8%) | 27 (5.8%) |
| $100,000+ | 29 (5.1%) | 3 (0.6%) |
| Total | 564 (100.0%) | 464 (100.0%) |
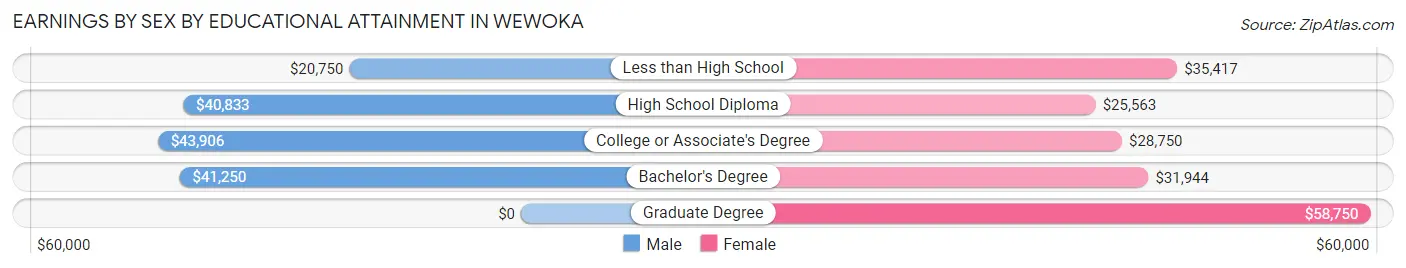
Earnings by Sex by Educational Attainment in Wewoka
Average earnings in Wewoka are $40,357 for men and $27,193 for women, a difference of 32.6%. Men with an educational attainment of college or associate's degree enjoy the highest average annual earnings of $43,906, while those with less than high school education earn the least with $20,750. Women with an educational attainment of graduate degree earn the most with the average annual earnings of $58,750, while those with high school diploma education have the smallest earnings of $25,563.
| Educational Attainment | Male Income | Female Income |
| Less than High School | $20,750 | $35,417 |
| High School Diploma | $40,833 | $25,563 |
| College or Associate's Degree | $43,906 | $28,750 |
| Bachelor's Degree | $41,250 | $31,944 |
| Graduate Degree | - | - |
| Total | $40,357 | $27,193 |
Family Income in Wewoka
Family Income Brackets in Wewoka
According to the Wewoka family income data, there are 189 families falling into the $50,000 to $74,999 income range, which is the most common income bracket and makes up 29.3% of all families. Conversely, the $200,000+ income bracket is the least frequent group with only 2 families (0.3%) belonging to this category.
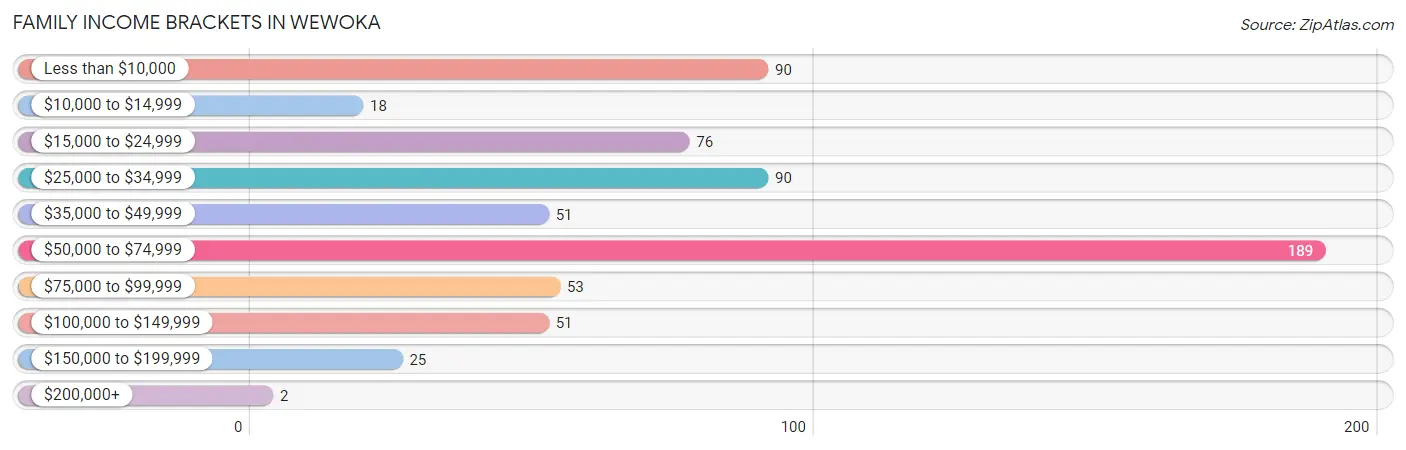
| Income Bracket | # Families | % Families |
| Less than $10,000 | 90 | 14.0% |
| $10,000 to $14,999 | 18 | 2.8% |
| $15,000 to $24,999 | 76 | 11.8% |
| $25,000 to $34,999 | 90 | 14.0% |
| $35,000 to $49,999 | 51 | 7.9% |
| $50,000 to $74,999 | 189 | 29.3% |
| $75,000 to $99,999 | 53 | 8.2% |
| $100,000 to $149,999 | 51 | 7.9% |
| $150,000 to $199,999 | 25 | 3.9% |
| $200,000+ | 2 | 0.3% |
Family Income by Famaliy Size in Wewoka
7+ person families (26 | 4.0%) account for the highest median family income in Wewoka with $59,500 per family, while 3-person families (153 | 23.7%) have the highest median income of $17,808 per family member.
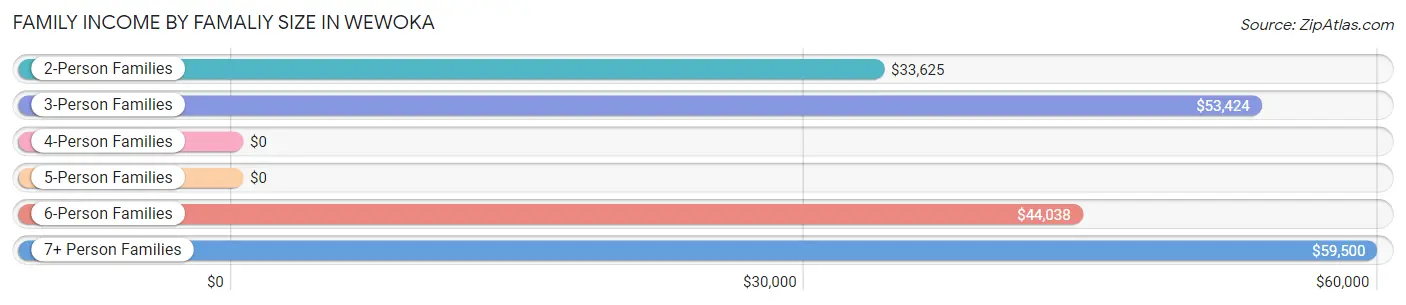
| Income Bracket | # Families | Median Income |
| 2-Person Families | 251 (38.9%) | $33,625 |
| 3-Person Families | 153 (23.7%) | $53,424 |
| 4-Person Families | 160 (24.8%) | $0 |
| 5-Person Families | 35 (5.4%) | $0 |
| 6-Person Families | 20 (3.1%) | $44,038 |
| 7+ Person Families | 26 (4.0%) | $59,500 |
| Total | 645 (100.0%) | $47,917 |
Family Income by Number of Earners in Wewoka
The median family income in Wewoka is $47,917, with families comprising 3+ earners (28) having the highest median family income of $92,500, while families with no earners (225) have the lowest median family income of $19,028, accounting for 4.3% and 34.9% of families, respectively.
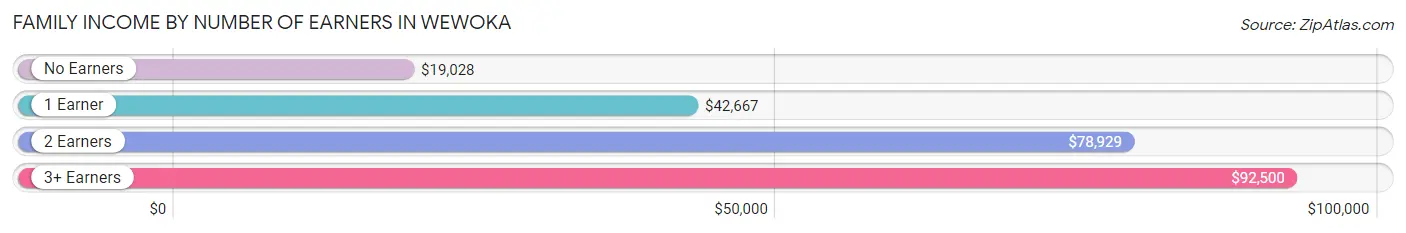
| Number of Earners | # Families | Median Income |
| No Earners | 225 (34.9%) | $19,028 |
| 1 Earner | 254 (39.4%) | $42,667 |
| 2 Earners | 138 (21.4%) | $78,929 |
| 3+ Earners | 28 (4.3%) | $92,500 |
| Total | 645 (100.0%) | $47,917 |
Household Income in Wewoka
Household Income Brackets in Wewoka
With 260 households falling in the category, the $50,000 to $74,999 income range is the most frequent in Wewoka, accounting for 23.9% of all households. In contrast, only 3 households (0.3%) fall into the $200,000+ income bracket, making it the least populous group.
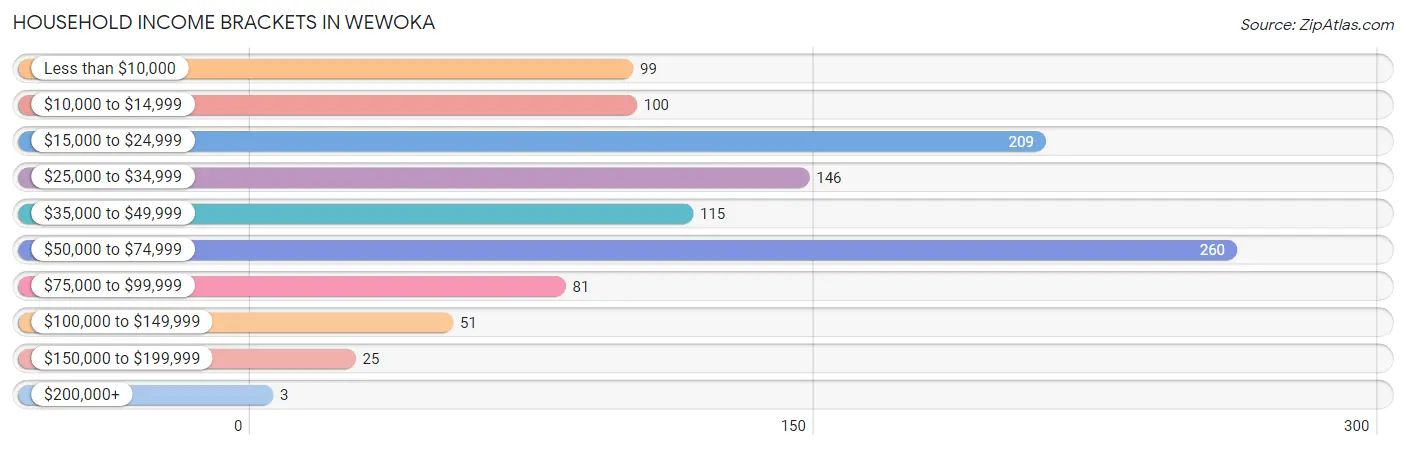
| Income Bracket | # Households | % Households |
| Less than $10,000 | 99 | 9.1% |
| $10,000 to $14,999 | 100 | 9.2% |
| $15,000 to $24,999 | 209 | 19.2% |
| $25,000 to $34,999 | 146 | 13.4% |
| $35,000 to $49,999 | 115 | 10.6% |
| $50,000 to $74,999 | 260 | 23.9% |
| $75,000 to $99,999 | 81 | 7.4% |
| $100,000 to $149,999 | 51 | 4.7% |
| $150,000 to $199,999 | 25 | 2.3% |
| $200,000+ | 3 | 0.3% |
Household Income by Householder Age in Wewoka
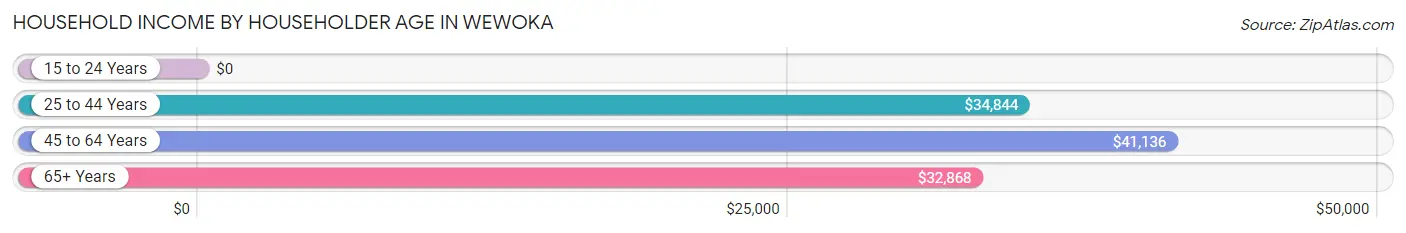
The median household income in Wewoka is $34,120, with the highest median household income of $41,136 found in the 45 to 64 years age bracket for the primary householder. A total of 340 households (31.2%) fall into this category. Meanwhile, the 15 to 24 years age bracket for the primary householder has the lowest median household income of $0, with 23 households (2.1%) in this group.
| Income Bracket | # Households | Median Income |
| 15 to 24 Years | 23 (2.1%) | $0 |
| 25 to 44 Years | 339 (31.1%) | $34,844 |
| 45 to 64 Years | 340 (31.2%) | $41,136 |
| 65+ Years | 387 (35.5%) | $32,868 |
| Total | 1,089 (100.0%) | $34,120 |
Poverty in Wewoka
Income Below Poverty by Sex and Age in Wewoka
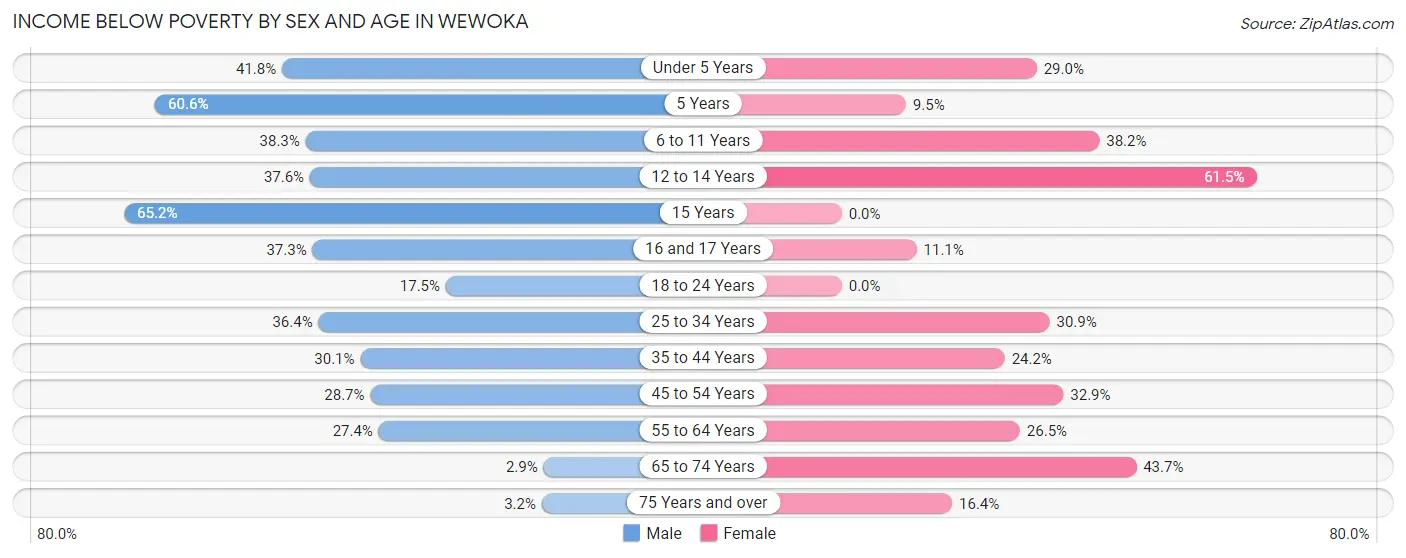
With 28.6% poverty level for males and 29.3% for females among the residents of Wewoka, 15 year old males and 12 to 14 year old females are the most vulnerable to poverty, with 15 males (65.2%) and 24 females (61.5%) in their respective age groups living below the poverty level.
| Age Bracket | Male | Female |
| Under 5 Years | 33 (41.8%) | 22 (28.9%) |
| 5 Years | 20 (60.6%) | 2 (9.5%) |
| 6 to 11 Years | 75 (38.3%) | 39 (38.2%) |
| 12 to 14 Years | 35 (37.6%) | 24 (61.5%) |
| 15 Years | 15 (65.2%) | 0 (0.0%) |
| 16 and 17 Years | 19 (37.2%) | 2 (11.1%) |
| 18 to 24 Years | 26 (17.4%) | 0 (0.0%) |
| 25 to 34 Years | 52 (36.4%) | 62 (30.8%) |
| 35 to 44 Years | 63 (30.1%) | 60 (24.2%) |
| 45 to 54 Years | 47 (28.7%) | 51 (32.9%) |
| 55 to 64 Years | 34 (27.4%) | 32 (26.5%) |
| 65 to 74 Years | 3 (2.9%) | 80 (43.7%) |
| 75 Years and over | 4 (3.2%) | 19 (16.4%) |
| Total | 426 (28.6%) | 393 (29.3%) |
Income Above Poverty by Sex and Age in Wewoka
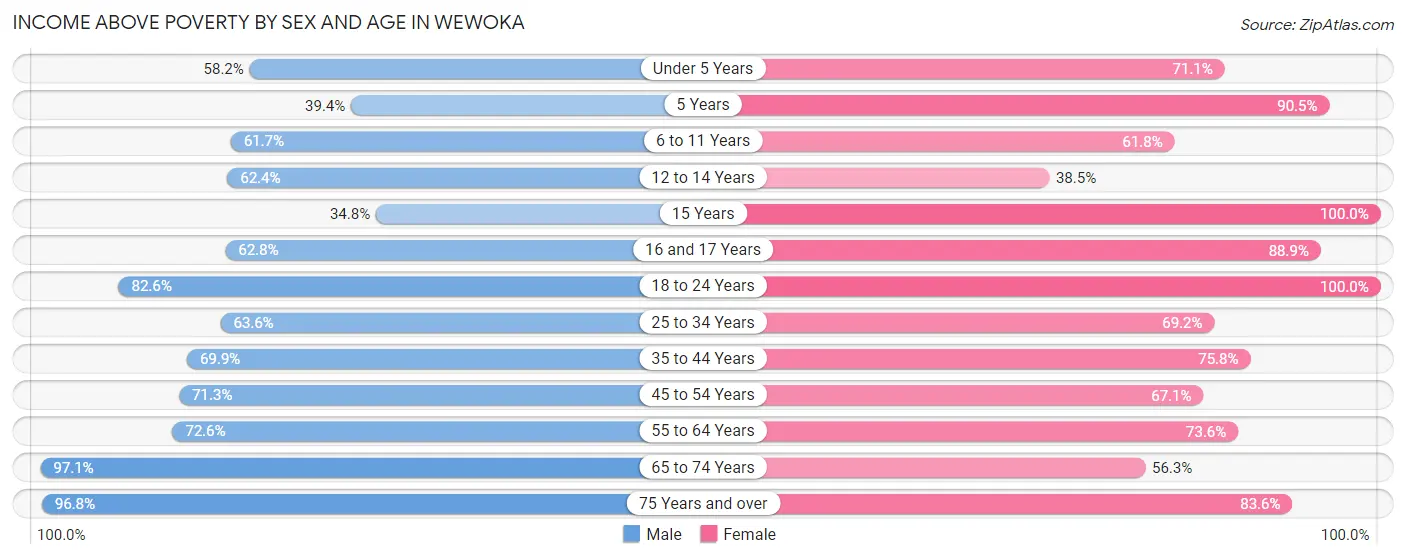
According to the poverty statistics in Wewoka, males aged 65 to 74 years and females aged 15 years are the age groups that are most secure financially, with 97.1% of males and 100.0% of females in these age groups living above the poverty line.
| Age Bracket | Male | Female |
| Under 5 Years | 46 (58.2%) | 54 (71.1%) |
| 5 Years | 13 (39.4%) | 19 (90.5%) |
| 6 to 11 Years | 121 (61.7%) | 63 (61.8%) |
| 12 to 14 Years | 58 (62.4%) | 15 (38.5%) |
| 15 Years | 8 (34.8%) | 2 (100.0%) |
| 16 and 17 Years | 32 (62.7%) | 16 (88.9%) |
| 18 to 24 Years | 123 (82.6%) | 60 (100.0%) |
| 25 to 34 Years | 91 (63.6%) | 139 (69.2%) |
| 35 to 44 Years | 146 (69.9%) | 188 (75.8%) |
| 45 to 54 Years | 117 (71.3%) | 104 (67.1%) |
| 55 to 64 Years | 90 (72.6%) | 89 (73.6%) |
| 65 to 74 Years | 99 (97.1%) | 103 (56.3%) |
| 75 Years and over | 121 (96.8%) | 97 (83.6%) |
| Total | 1,065 (71.4%) | 949 (70.7%) |
Income Below Poverty Among Married-Couple Families in Wewoka
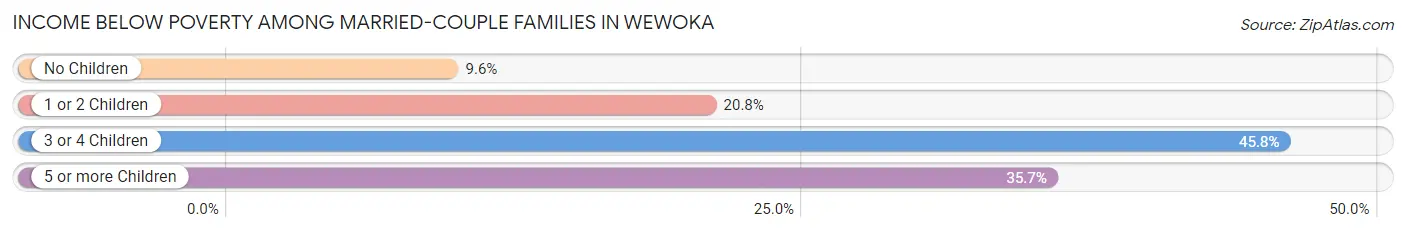
The poverty statistics for married-couple families in Wewoka show that 16.9% or 60 of the total 356 families live below the poverty line. Families with 3 or 4 children have the highest poverty rate of 45.8%, comprising of 11 families. On the other hand, families with no children have the lowest poverty rate of 9.6%, which includes 19 families.
| Children | Above Poverty | Below Poverty |
| No Children | 179 (90.4%) | 19 (9.6%) |
| 1 or 2 Children | 95 (79.2%) | 25 (20.8%) |
| 3 or 4 Children | 13 (54.2%) | 11 (45.8%) |
| 5 or more Children | 9 (64.3%) | 5 (35.7%) |
| Total | 296 (83.2%) | 60 (16.9%) |
Income Below Poverty Among Single-Parent Households in Wewoka
According to the poverty data in Wewoka, 36.0% or 32 single-father households and 51.5% or 103 single-mother households are living below the poverty line. Among single-father households, those with 3 or 4 children have the highest poverty rate, with 3 households (100.0%) experiencing poverty. Likewise, among single-mother households, those with 3 or 4 children have the highest poverty rate, with 21 households (84.0%) falling below the poverty line.
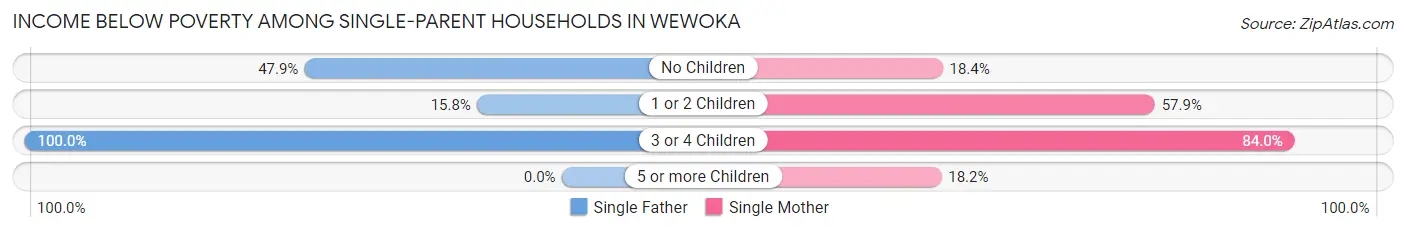
| Children | Single Father | Single Mother |
| No Children | 23 (47.9%) | 7 (18.4%) |
| 1 or 2 Children | 6 (15.8%) | 73 (57.9%) |
| 3 or 4 Children | 3 (100.0%) | 21 (84.0%) |
| 5 or more Children | 0 (0.0%) | 2 (18.2%) |
| Total | 32 (36.0%) | 103 (51.5%) |
Income Below Poverty Among Married-Couple vs Single-Parent Households in Wewoka
The poverty data for Wewoka shows that 60 of the married-couple family households (16.9%) and 135 of the single-parent households (46.7%) are living below the poverty level. Within the married-couple family households, those with 3 or 4 children have the highest poverty rate, with 11 households (45.8%) falling below the poverty line. Among the single-parent households, those with 3 or 4 children have the highest poverty rate, with 24 household (85.7%) living below poverty.
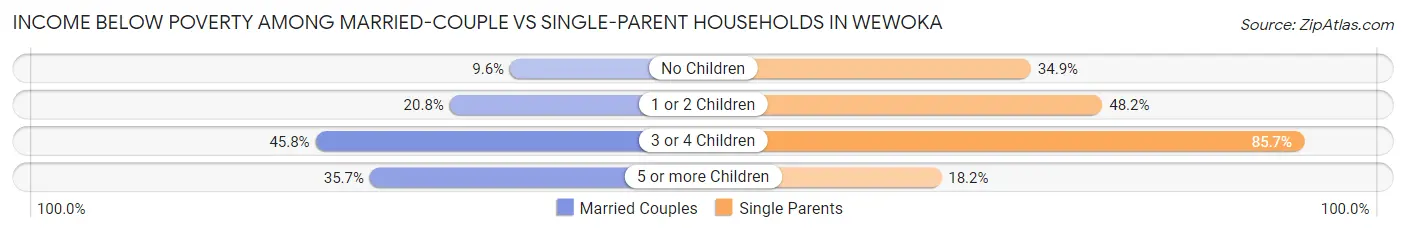
| Children | Married-Couple Families | Single-Parent Households |
| No Children | 19 (9.6%) | 30 (34.9%) |
| 1 or 2 Children | 25 (20.8%) | 79 (48.2%) |
| 3 or 4 Children | 11 (45.8%) | 24 (85.7%) |
| 5 or more Children | 5 (35.7%) | 2 (18.2%) |
| Total | 60 (16.9%) | 135 (46.7%) |
Race in Wewoka
The most populous races in Wewoka are White / Caucasian (1,748 | 55.9%), Native / Alaskan (767 | 24.5%), and Two or more Races (325 | 10.4%).
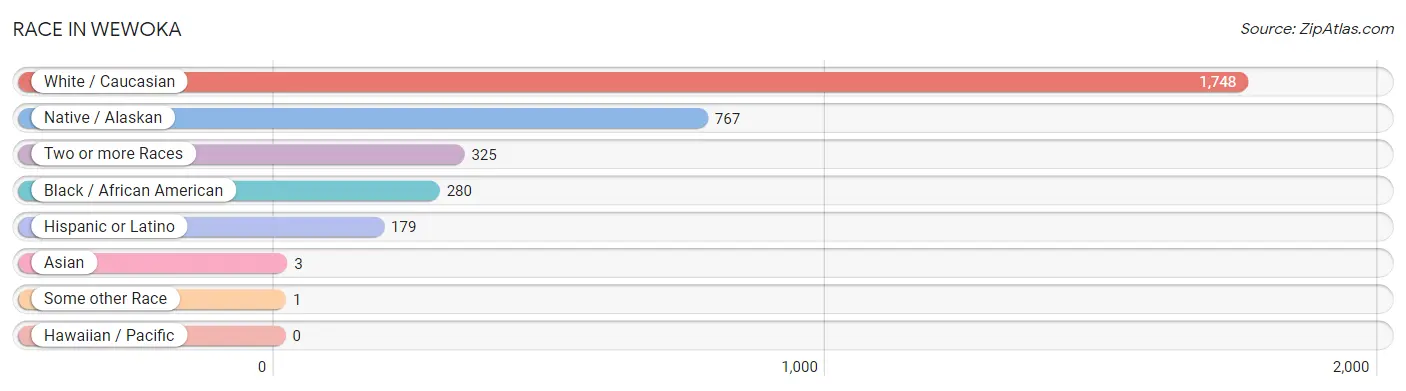
| Race | # Population | % Population |
| Asian | 3 | 0.1% |
| Black / African American | 280 | 9.0% |
| Hawaiian / Pacific | 0 | 0.0% |
| Hispanic or Latino | 179 | 5.7% |
| Native / Alaskan | 767 | 24.5% |
| White / Caucasian | 1,748 | 55.9% |
| Two or more Races | 325 | 10.4% |
| Some other Race | 1 | 0.0% |
| Total | 3,124 | 100.0% |
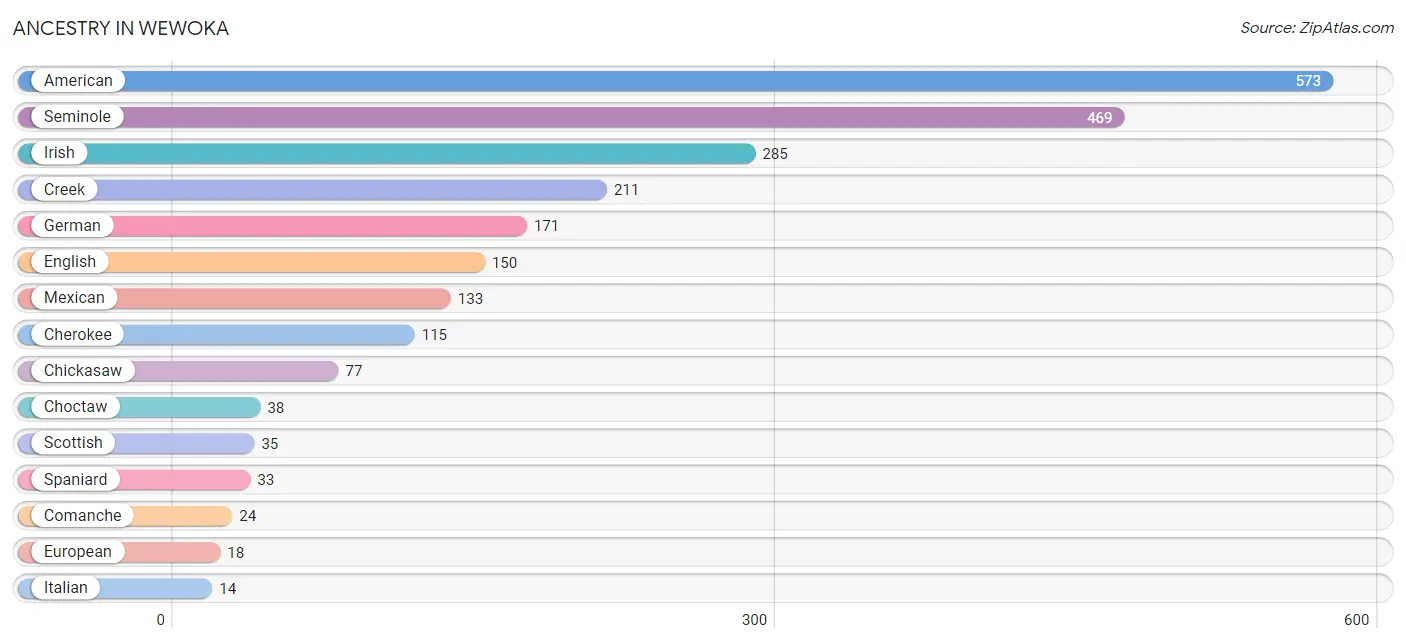
Ancestry in Wewoka
The most populous ancestries reported in Wewoka are American (573 | 18.3%), Seminole (469 | 15.0%), Irish (285 | 9.1%), Creek (211 | 6.8%), and German (171 | 5.5%), together accounting for 54.7% of all Wewoka residents.
| Ancestry | # Population | % Population |
| African | 6 | 0.2% |
| American | 573 | 18.3% |
| Apache | 12 | 0.4% |
| Cherokee | 115 | 3.7% |
| Chickasaw | 77 | 2.5% |
| Choctaw | 38 | 1.2% |
| Comanche | 24 | 0.8% |
| Creek | 211 | 6.8% |
| Crow | 12 | 0.4% |
| Czech | 3 | 0.1% |
| Dutch | 3 | 0.1% |
| Dutch West Indian | 2 | 0.1% |
| English | 150 | 4.8% |
| European | 18 | 0.6% |
| French | 13 | 0.4% |
| German | 171 | 5.5% |
| Irish | 285 | 9.1% |
| Italian | 14 | 0.4% |
| Kiowa | 1 | 0.0% |
| Mexican | 133 | 4.3% |
| Native Hawaiian | 14 | 0.4% |
| Norwegian | 12 | 0.4% |
| Portuguese | 5 | 0.2% |
| Scotch-Irish | 11 | 0.4% |
| Scottish | 35 | 1.1% |
| Seminole | 469 | 15.0% |
| Spaniard | 33 | 1.1% |
| Spanish | 1 | 0.0% |
| Subsaharan African | 6 | 0.2% |
| Thai | 12 | 0.4% |
| Welsh | 2 | 0.1% | View All 31 Rows |
Immigrants in Wewoka
The most numerous immigrant groups reported in Wewoka came from Africa (11 | 0.4%), Eastern Africa (11 | 0.4%), Kenya (11 | 0.4%), Central America (7 | 0.2%), and Latin America (7 | 0.2%), together accounting for 1.5% of all Wewoka residents.
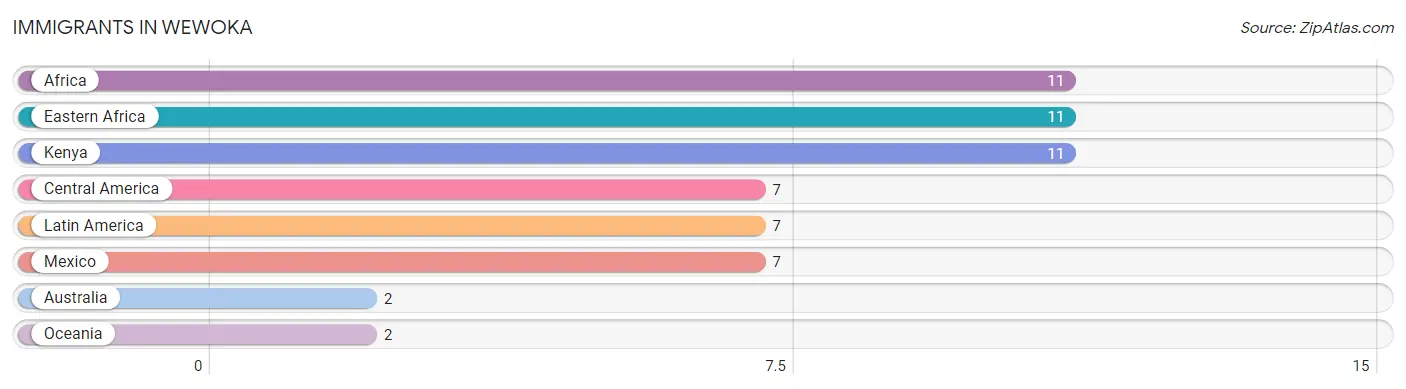
| Immigration Origin | # Population | % Population |
| Africa | 11 | 0.4% |
| Australia | 2 | 0.1% |
| Central America | 7 | 0.2% |
| Eastern Africa | 11 | 0.4% |
| Kenya | 11 | 0.4% |
| Latin America | 7 | 0.2% |
| Mexico | 7 | 0.2% |
| Oceania | 2 | 0.1% | View All 8 Rows |
Sex and Age in Wewoka
Sex and Age in Wewoka
The most populous age groups in Wewoka are 10 to 14 Years (172 | 10.6%) for men and 35 to 39 Years (175 | 11.6%) for women.
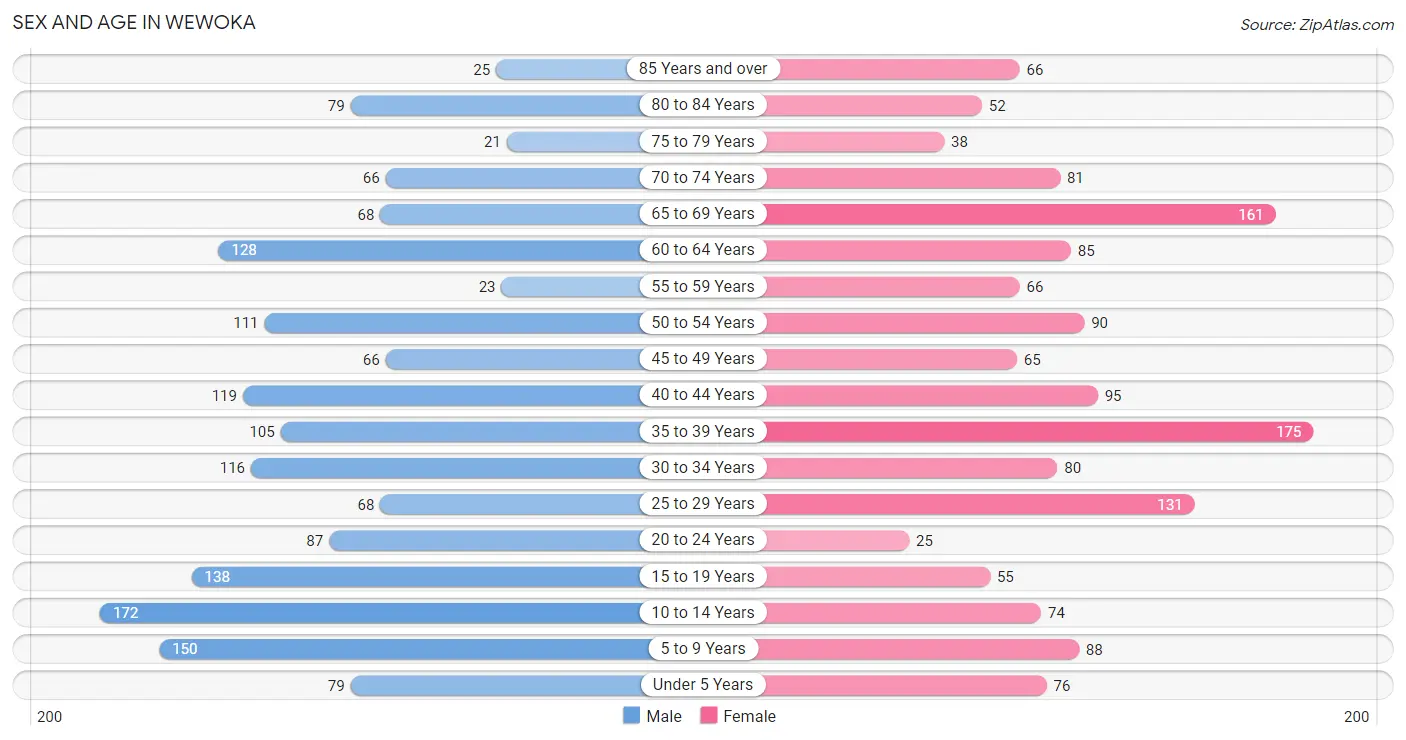
| Age Bracket | Male | Female |
| Under 5 Years | 79 (4.9%) | 76 (5.1%) |
| 5 to 9 Years | 150 (9.2%) | 88 (5.9%) |
| 10 to 14 Years | 172 (10.6%) | 74 (4.9%) |
| 15 to 19 Years | 138 (8.5%) | 55 (3.7%) |
| 20 to 24 Years | 87 (5.4%) | 25 (1.7%) |
| 25 to 29 Years | 68 (4.2%) | 131 (8.7%) |
| 30 to 34 Years | 116 (7.2%) | 80 (5.3%) |
| 35 to 39 Years | 105 (6.5%) | 175 (11.6%) |
| 40 to 44 Years | 119 (7.3%) | 95 (6.3%) |
| 45 to 49 Years | 66 (4.1%) | 65 (4.3%) |
| 50 to 54 Years | 111 (6.9%) | 90 (6.0%) |
| 55 to 59 Years | 23 (1.4%) | 66 (4.4%) |
| 60 to 64 Years | 128 (7.9%) | 85 (5.7%) |
| 65 to 69 Years | 68 (4.2%) | 161 (10.7%) |
| 70 to 74 Years | 66 (4.1%) | 81 (5.4%) |
| 75 to 79 Years | 21 (1.3%) | 38 (2.5%) |
| 80 to 84 Years | 79 (4.9%) | 52 (3.5%) |
| 85 Years and over | 25 (1.5%) | 66 (4.4%) |
| Total | 1,621 (100.0%) | 1,503 (100.0%) |
Families and Households in Wewoka
Median Family Size in Wewoka
The median family size in Wewoka is 3.54 persons per family, with single female/mother families (200 | 31.0%) accounting for the largest median family size of 3.64 persons per family. On the other hand, single male/father families (89 | 13.8%) represent the smallest median family size with 3.22 persons per family.
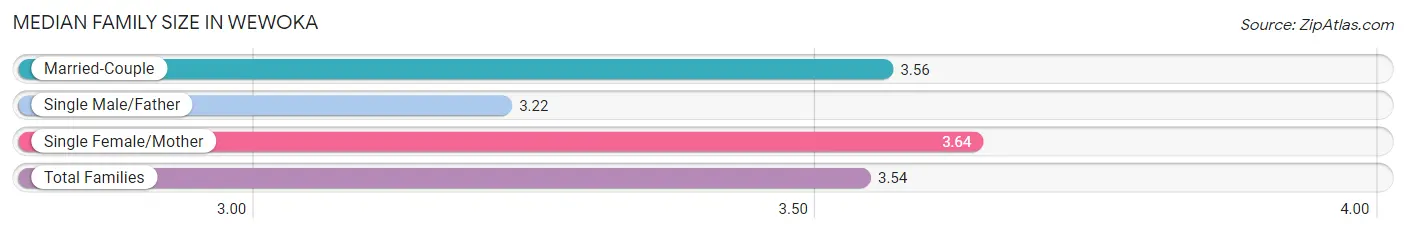
| Family Type | # Families | Family Size |
| Married-Couple | 356 (55.2%) | 3.56 |
| Single Male/Father | 89 (13.8%) | 3.22 |
| Single Female/Mother | 200 (31.0%) | 3.64 |
| Total Families | 645 (100.0%) | 3.54 |
Median Household Size in Wewoka
The median household size in Wewoka is 2.60 persons per household, with single female/mother households (200 | 18.4%) accounting for the largest median household size of 3.88 persons per household. non-family households (444 | 40.8%) represent the smallest median household size with 1.09 persons per household.
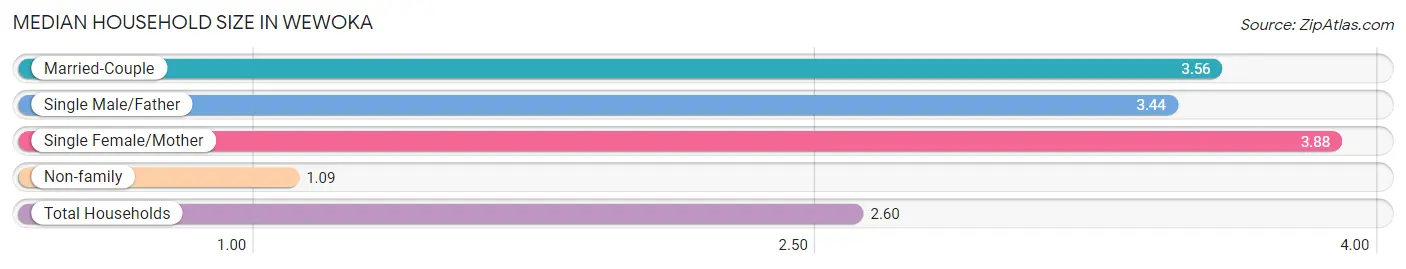
| Household Type | # Households | Household Size |
| Married-Couple | 356 (32.7%) | 3.56 |
| Single Male/Father | 89 (8.2%) | 3.44 |
| Single Female/Mother | 200 (18.4%) | 3.88 |
| Non-family | 444 (40.8%) | 1.09 |
| Total Households | 1,089 (100.0%) | 2.60 |
Household Size by Marriage Status in Wewoka
Out of a total of 1,089 households in Wewoka, 645 (59.2%) are family households, while 444 (40.8%) are nonfamily households. The most numerous type of family households are 2-person households, comprising 234, and the most common type of nonfamily households are 1-person households, comprising 402.
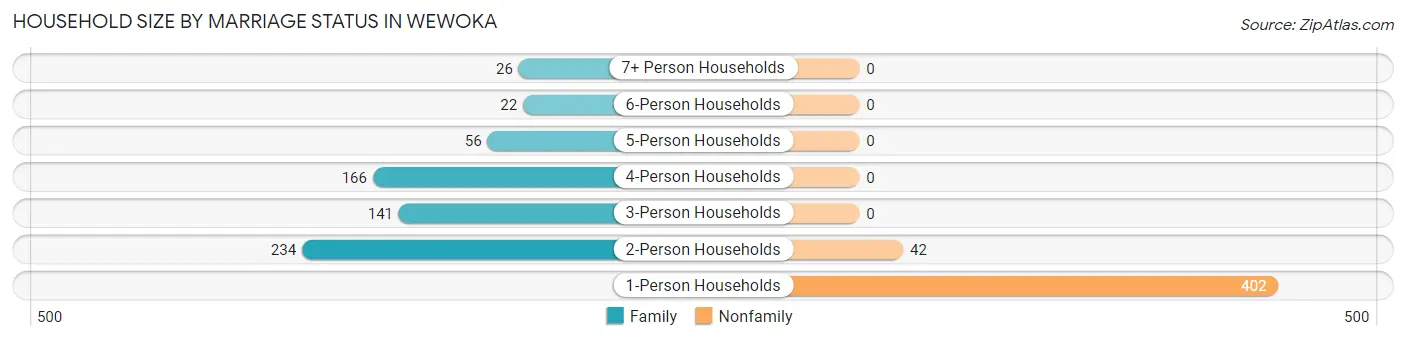
| Household Size | Family Households | Nonfamily Households |
| 1-Person Households | - | 402 (36.9%) |
| 2-Person Households | 234 (21.5%) | 42 (3.9%) |
| 3-Person Households | 141 (13.0%) | 0 (0.0%) |
| 4-Person Households | 166 (15.2%) | 0 (0.0%) |
| 5-Person Households | 56 (5.1%) | 0 (0.0%) |
| 6-Person Households | 22 (2.0%) | 0 (0.0%) |
| 7+ Person Households | 26 (2.4%) | 0 (0.0%) |
| Total | 645 (59.2%) | 444 (40.8%) |
Female Fertility in Wewoka
Fertility by Age in Wewoka
Average fertility rate in Wewoka is 97.0 births per 1,000 women. Women in the age bracket of 35 to 50 years have the highest fertility rate with 109.0 births per 1,000 women. Women in the age bracket of 35 to 50 years acount for 62.5% of all women with births.
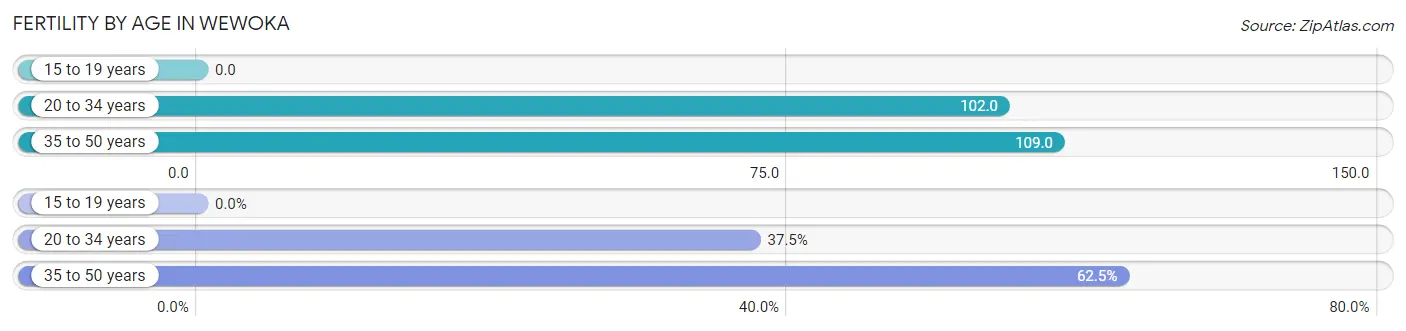
| Age Bracket | Women with Births | Births / 1,000 Women |
| 15 to 19 years | 0 (0.0%) | 0.0 |
| 20 to 34 years | 24 (37.5%) | 102.0 |
| 35 to 50 years | 40 (62.5%) | 109.0 |
| Total | 64 (100.0%) | 97.0 |
Fertility by Age by Marriage Status in Wewoka
42.2% of women with births (64) in Wewoka are married. The highest percentage of unmarried women with births falls into 20 to 34 years age bracket with 62.5% of them unmarried at the time of birth, while the lowest percentage of unmarried women with births belong to 35 to 50 years age bracket with 55.0% of them unmarried.
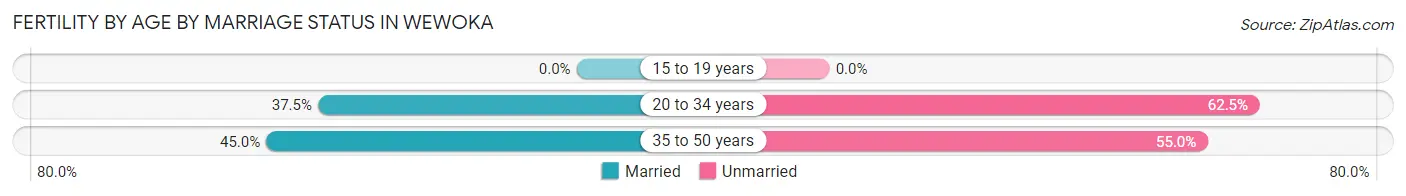
| Age Bracket | Married | Unmarried |
| 15 to 19 years | 0 (0.0%) | 0 (0.0%) |
| 20 to 34 years | 9 (37.5%) | 15 (62.5%) |
| 35 to 50 years | 18 (45.0%) | 22 (55.0%) |
| Total | 27 (42.2%) | 37 (57.8%) |
Fertility by Education in Wewoka
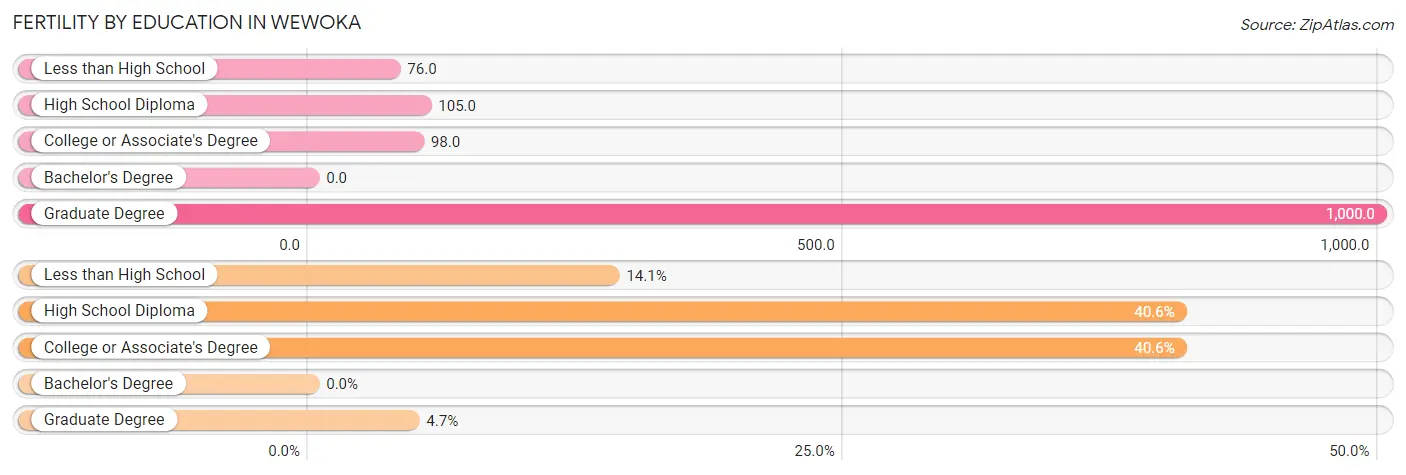
| Educational Attainment | Women with Births | Births / 1,000 Women |
| Less than High School | 9 (14.1%) | 76.0 |
| High School Diploma | 26 (40.6%) | 105.0 |
| College or Associate's Degree | 26 (40.6%) | 98.0 |
| Bachelor's Degree | 0 (0.0%) | 0.0 |
| Graduate Degree | 3 (4.7%) | 1,000.0 |
| Total | 64 (100.0%) | 97.0 |
Fertility by Education by Marriage Status in Wewoka
57.8% of women with births in Wewoka are unmarried. Women with the educational attainment of college or associate's degree are most likely to be married with 76.9% of them married at childbirth, while women with the educational attainment of less than high school are least likely to be married with 100.0% of them unmarried at childbirth.
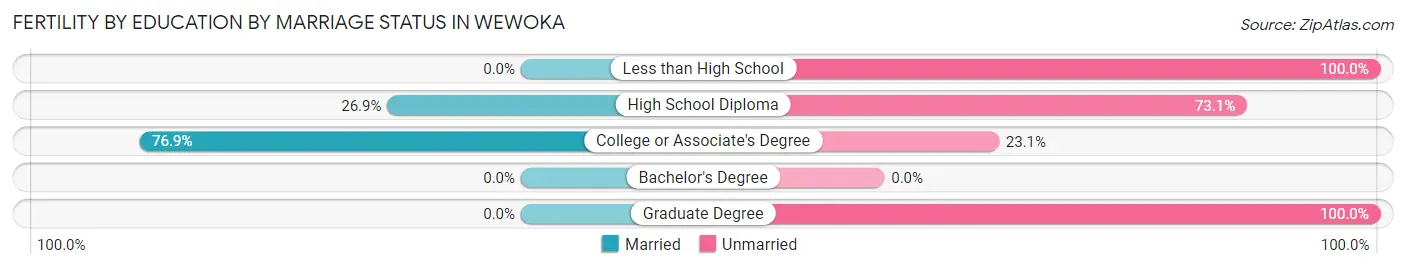
| Educational Attainment | Married | Unmarried |
| Less than High School | 0 (0.0%) | 9 (100.0%) |
| High School Diploma | 7 (26.9%) | 19 (73.1%) |
| College or Associate's Degree | 20 (76.9%) | 6 (23.1%) |
| Bachelor's Degree | 0 (0.0%) | 0 (0.0%) |
| Graduate Degree | 0 (0.0%) | 3 (100.0%) |
| Total | 27 (42.2%) | 37 (57.8%) |
Employment Characteristics in Wewoka
Employment by Class of Employer in Wewoka
Among the 848 employed individuals in Wewoka, private company employees (521 | 61.4%), local government employees (108 | 12.7%), and state government employees (67 | 7.9%) make up the most common classes of employment.
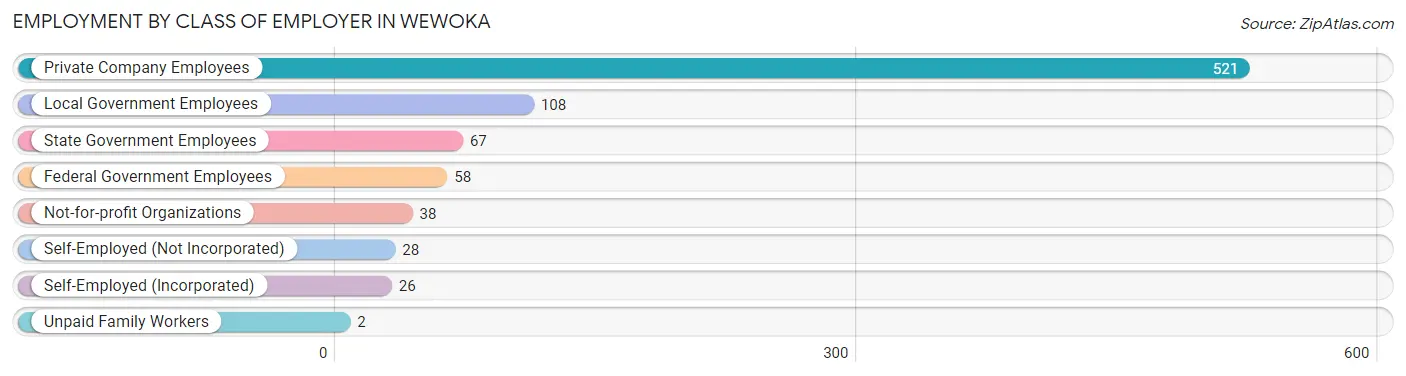
| Employer Class | # Employees | % Employees |
| Private Company Employees | 521 | 61.4% |
| Self-Employed (Incorporated) | 26 | 3.1% |
| Self-Employed (Not Incorporated) | 28 | 3.3% |
| Not-for-profit Organizations | 38 | 4.5% |
| Local Government Employees | 108 | 12.7% |
| State Government Employees | 67 | 7.9% |
| Federal Government Employees | 58 | 6.8% |
| Unpaid Family Workers | 2 | 0.2% |
| Total | 848 | 100.0% |
Employment Status by Age in Wewoka
According to the labor force statistics for Wewoka, out of the total population over 16 years of age (2,460), 39.0% or 959 individuals are in the labor force, with 10.2% or 98 of them unemployed. The age group with the highest labor force participation rate is 25 to 29 years, with 69.3% or 138 individuals in the labor force. Within the labor force, the 16 to 19 years age range has the highest percentage of unemployed individuals, with 32.7% or 18 of them being unemployed.
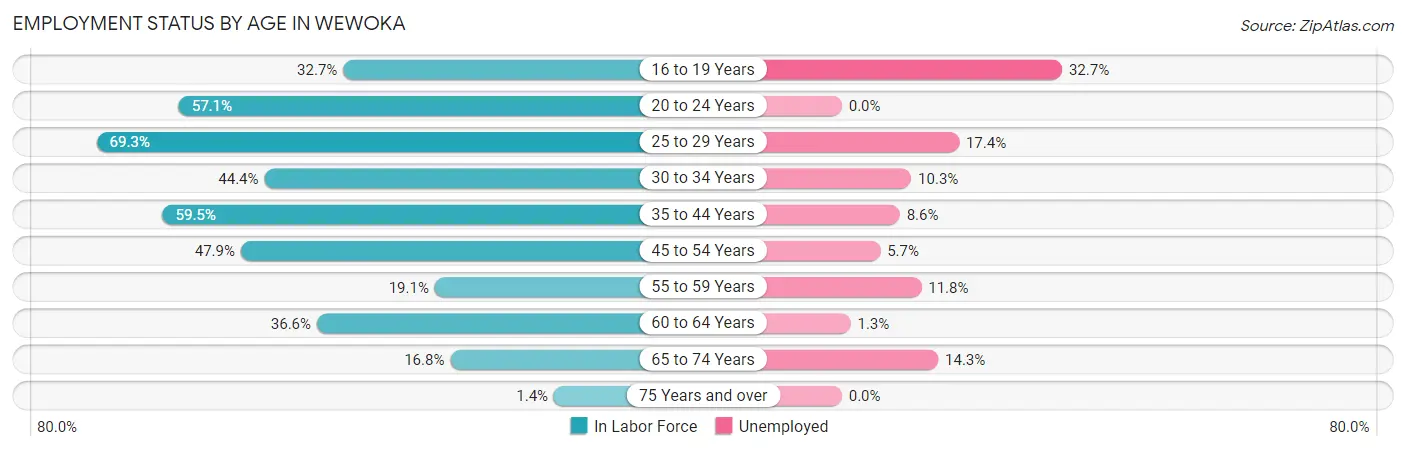
| Age Bracket | In Labor Force | Unemployed |
| 16 to 19 Years | 55 (32.7%) | 18 (32.7%) |
| 20 to 24 Years | 64 (57.1%) | 0 (0.0%) |
| 25 to 29 Years | 138 (69.3%) | 24 (17.4%) |
| 30 to 34 Years | 87 (44.4%) | 9 (10.3%) |
| 35 to 44 Years | 294 (59.5%) | 25 (8.6%) |
| 45 to 54 Years | 159 (47.9%) | 9 (5.7%) |
| 55 to 59 Years | 17 (19.1%) | 2 (11.8%) |
| 60 to 64 Years | 78 (36.6%) | 1 (1.3%) |
| 65 to 74 Years | 63 (16.8%) | 9 (14.3%) |
| 75 Years and over | 4 (1.4%) | 0 (0.0%) |
| Total | 959 (39.0%) | 98 (10.2%) |
Employment Status by Educational Attainment in Wewoka
According to labor force statistics for Wewoka, 50.8% of individuals (774) out of the total population between 25 and 64 years of age (1,523) are in the labor force, with 9.1% or 70 of them being unemployed. The group with the highest labor force participation rate are those with the educational attainment of college / associate degree, with 61.2% or 350 individuals in the labor force. Within the labor force, individuals with high school diploma education have the highest percentage of unemployment, with 11.2% or 30 of them being unemployed.
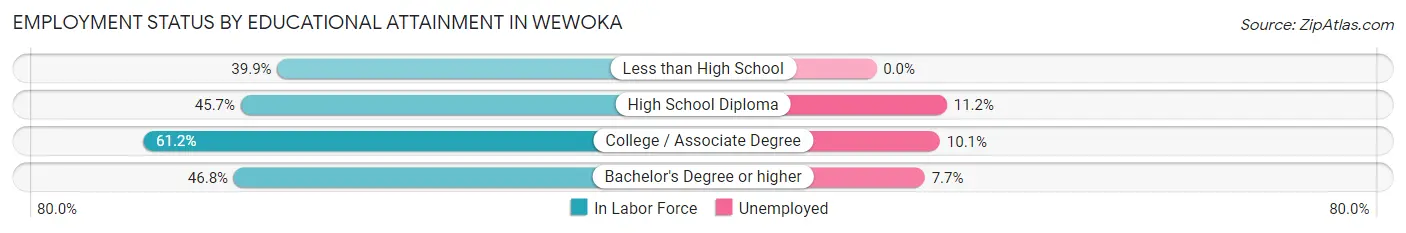
| Educational Attainment | In Labor Force | Unemployed |
| Less than High School | 89 (39.9%) | 0 (0.0%) |
| High School Diploma | 269 (45.7%) | 66 (11.2%) |
| College / Associate Degree | 350 (61.2%) | 58 (10.1%) |
| Bachelor's Degree or higher | 65 (46.8%) | 11 (7.7%) |
| Total | 774 (50.8%) | 139 (9.1%) |
Employment Occupations by Sex in Wewoka
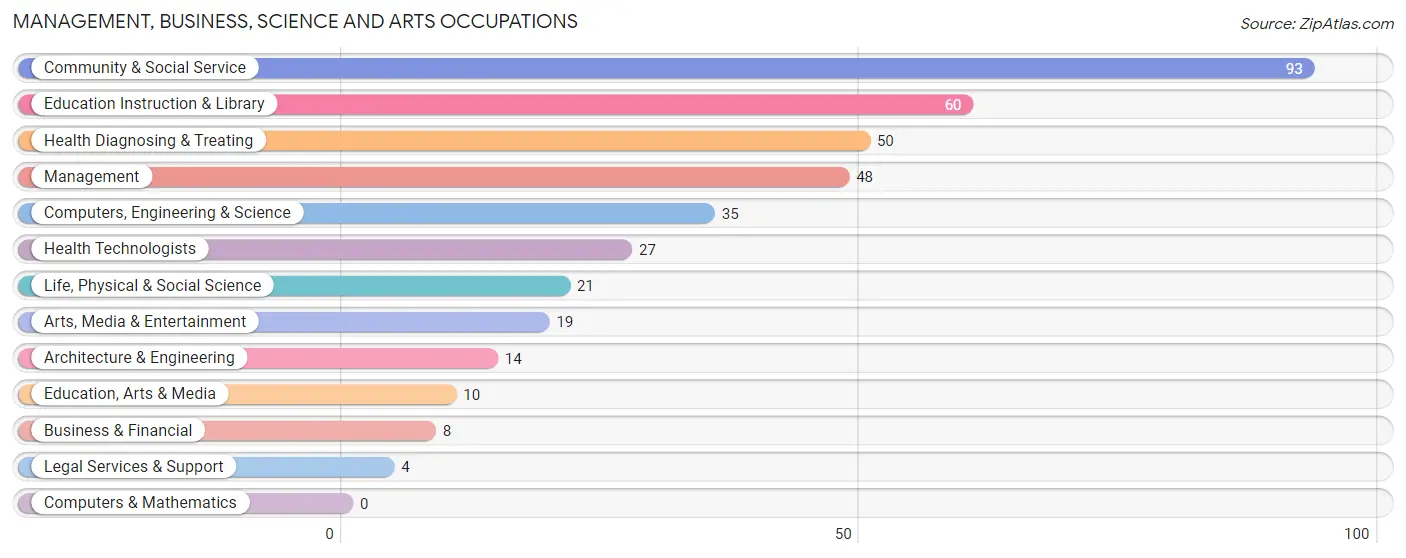
Management, Business, Science and Arts Occupations
The most common Management, Business, Science and Arts occupations in Wewoka are Community & Social Service (93 | 10.8%), Education Instruction & Library (60 | 7.0%), Health Diagnosing & Treating (50 | 5.8%), Management (48 | 5.6%), and Computers, Engineering & Science (35 | 4.1%).
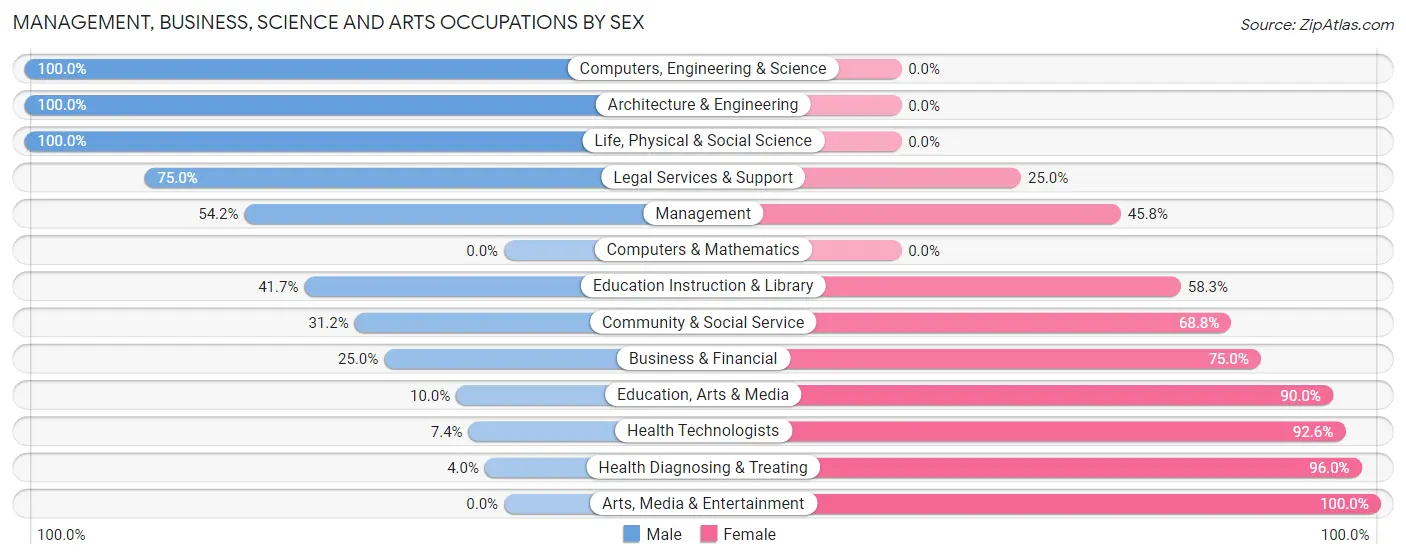
Management, Business, Science and Arts Occupations by Sex
Within the Management, Business, Science and Arts occupations in Wewoka, the most male-oriented occupations are Computers, Engineering & Science (100.0%), Architecture & Engineering (100.0%), and Life, Physical & Social Science (100.0%), while the most female-oriented occupations are Arts, Media & Entertainment (100.0%), Health Diagnosing & Treating (96.0%), and Health Technologists (92.6%).
| Occupation | Male | Female |
| Management | 26 (54.2%) | 22 (45.8%) |
| Business & Financial | 2 (25.0%) | 6 (75.0%) |
| Computers, Engineering & Science | 35 (100.0%) | 0 (0.0%) |
| Computers & Mathematics | 0 (0.0%) | 0 (0.0%) |
| Architecture & Engineering | 14 (100.0%) | 0 (0.0%) |
| Life, Physical & Social Science | 21 (100.0%) | 0 (0.0%) |
| Community & Social Service | 29 (31.2%) | 64 (68.8%) |
| Education, Arts & Media | 1 (10.0%) | 9 (90.0%) |
| Legal Services & Support | 3 (75.0%) | 1 (25.0%) |
| Education Instruction & Library | 25 (41.7%) | 35 (58.3%) |
| Arts, Media & Entertainment | 0 (0.0%) | 19 (100.0%) |
| Health Diagnosing & Treating | 2 (4.0%) | 48 (96.0%) |
| Health Technologists | 2 (7.4%) | 25 (92.6%) |
| Total (Category) | 94 (40.2%) | 140 (59.8%) |
| Total (Overall) | 450 (52.4%) | 408 (47.5%) |
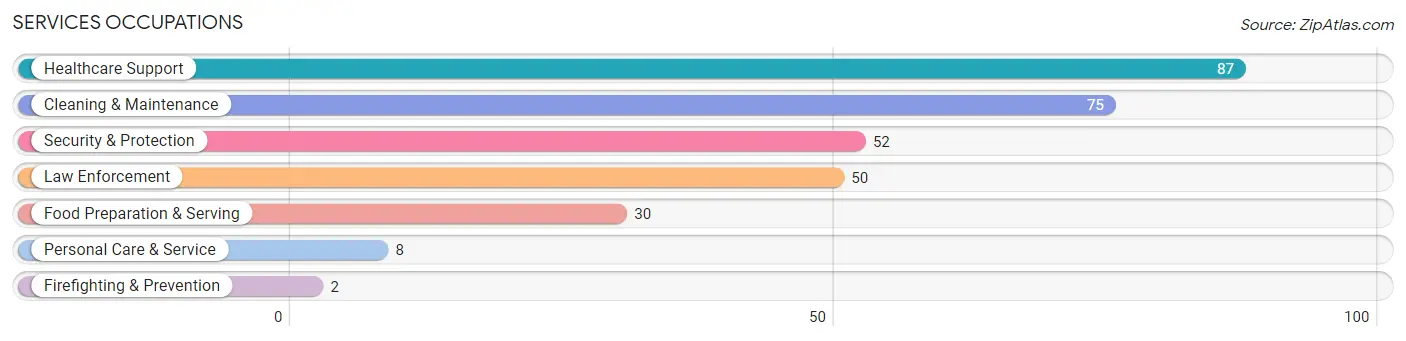
Services Occupations
The most common Services occupations in Wewoka are Healthcare Support (87 | 10.1%), Cleaning & Maintenance (75 | 8.7%), Security & Protection (52 | 6.1%), Law Enforcement (50 | 5.8%), and Food Preparation & Serving (30 | 3.5%).
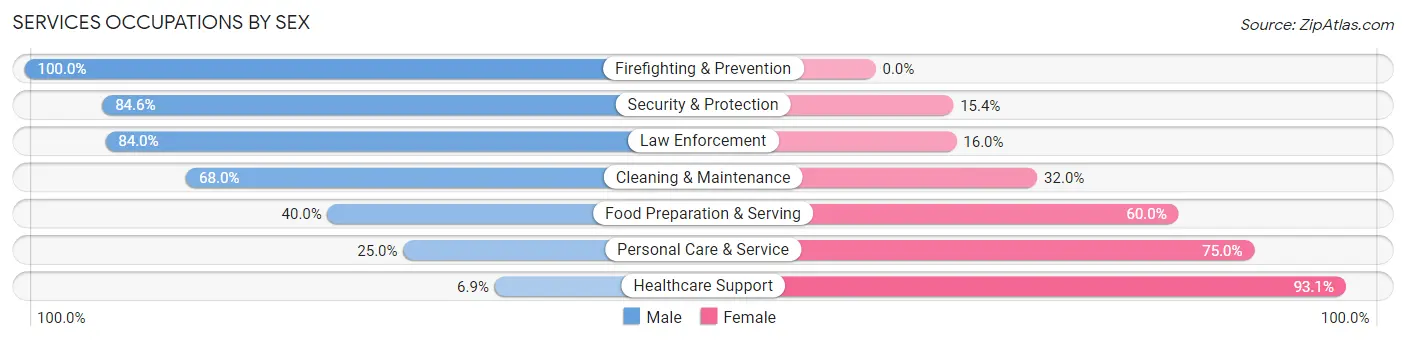
Services Occupations by Sex
Within the Services occupations in Wewoka, the most male-oriented occupations are Firefighting & Prevention (100.0%), Security & Protection (84.6%), and Law Enforcement (84.0%), while the most female-oriented occupations are Healthcare Support (93.1%), Personal Care & Service (75.0%), and Food Preparation & Serving (60.0%).
| Occupation | Male | Female |
| Healthcare Support | 6 (6.9%) | 81 (93.1%) |
| Security & Protection | 44 (84.6%) | 8 (15.4%) |
| Firefighting & Prevention | 2 (100.0%) | 0 (0.0%) |
| Law Enforcement | 42 (84.0%) | 8 (16.0%) |
| Food Preparation & Serving | 12 (40.0%) | 18 (60.0%) |
| Cleaning & Maintenance | 51 (68.0%) | 24 (32.0%) |
| Personal Care & Service | 2 (25.0%) | 6 (75.0%) |
| Total (Category) | 115 (45.6%) | 137 (54.4%) |
| Total (Overall) | 450 (52.4%) | 408 (47.5%) |
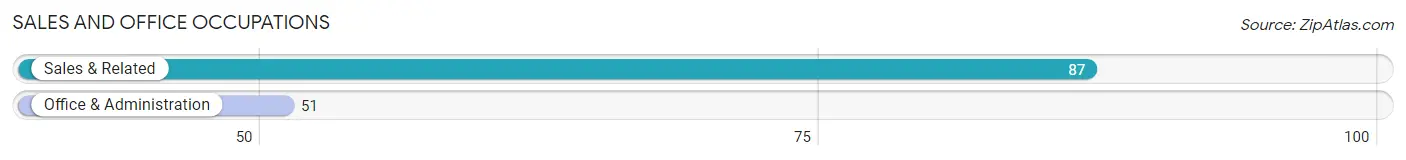
Sales and Office Occupations
The most common Sales and Office occupations in Wewoka are Sales & Related (87 | 10.1%), and Office & Administration (51 | 5.9%).
Sales and Office Occupations by Sex
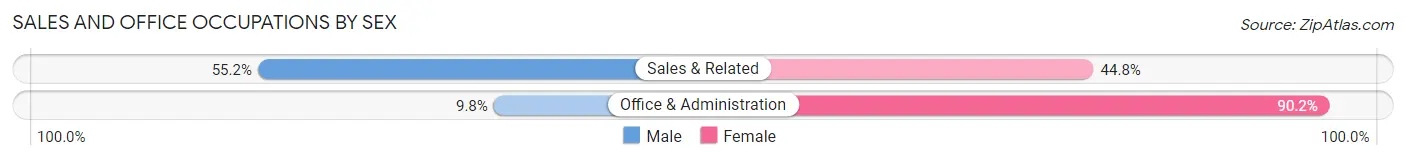
| Occupation | Male | Female |
| Sales & Related | 48 (55.2%) | 39 (44.8%) |
| Office & Administration | 5 (9.8%) | 46 (90.2%) |
| Total (Category) | 53 (38.4%) | 85 (61.6%) |
| Total (Overall) | 450 (52.4%) | 408 (47.5%) |
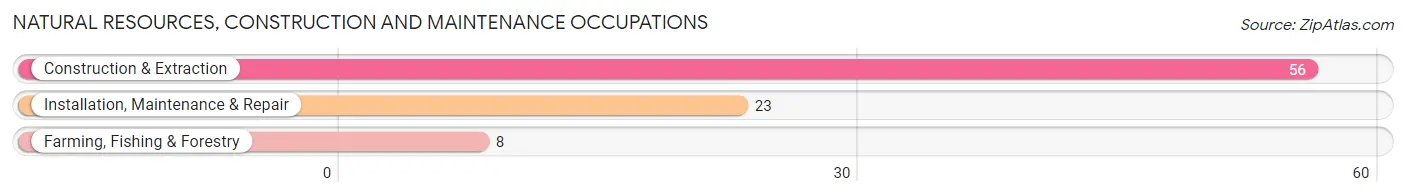
Natural Resources, Construction and Maintenance Occupations
The most common Natural Resources, Construction and Maintenance occupations in Wewoka are Construction & Extraction (56 | 6.5%), Installation, Maintenance & Repair (23 | 2.7%), and Farming, Fishing & Forestry (8 | 0.9%).
Natural Resources, Construction and Maintenance Occupations by Sex
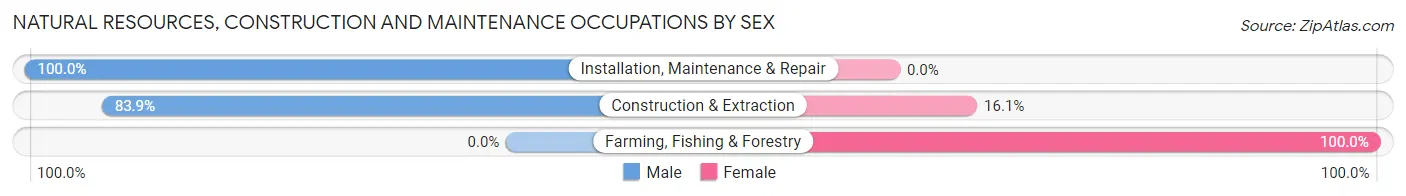
| Occupation | Male | Female |
| Farming, Fishing & Forestry | 0 (0.0%) | 8 (100.0%) |
| Construction & Extraction | 47 (83.9%) | 9 (16.1%) |
| Installation, Maintenance & Repair | 23 (100.0%) | 0 (0.0%) |
| Total (Category) | 70 (80.5%) | 17 (19.5%) |
| Total (Overall) | 450 (52.4%) | 408 (47.5%) |
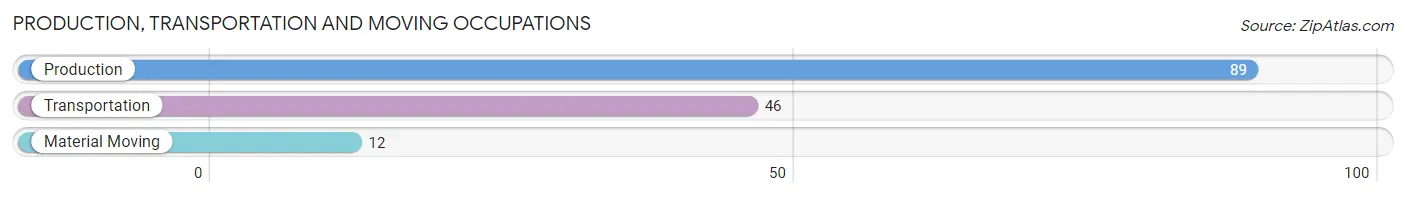
Production, Transportation and Moving Occupations
The most common Production, Transportation and Moving occupations in Wewoka are Production (89 | 10.4%), Transportation (46 | 5.4%), and Material Moving (12 | 1.4%).
Production, Transportation and Moving Occupations by Sex
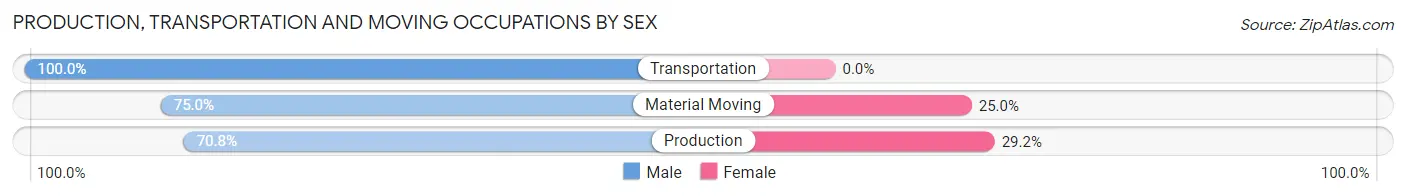
| Occupation | Male | Female |
| Production | 63 (70.8%) | 26 (29.2%) |
| Transportation | 46 (100.0%) | 0 (0.0%) |
| Material Moving | 9 (75.0%) | 3 (25.0%) |
| Total (Category) | 118 (80.3%) | 29 (19.7%) |
| Total (Overall) | 450 (52.4%) | 408 (47.5%) |
Employment Industries by Sex in Wewoka
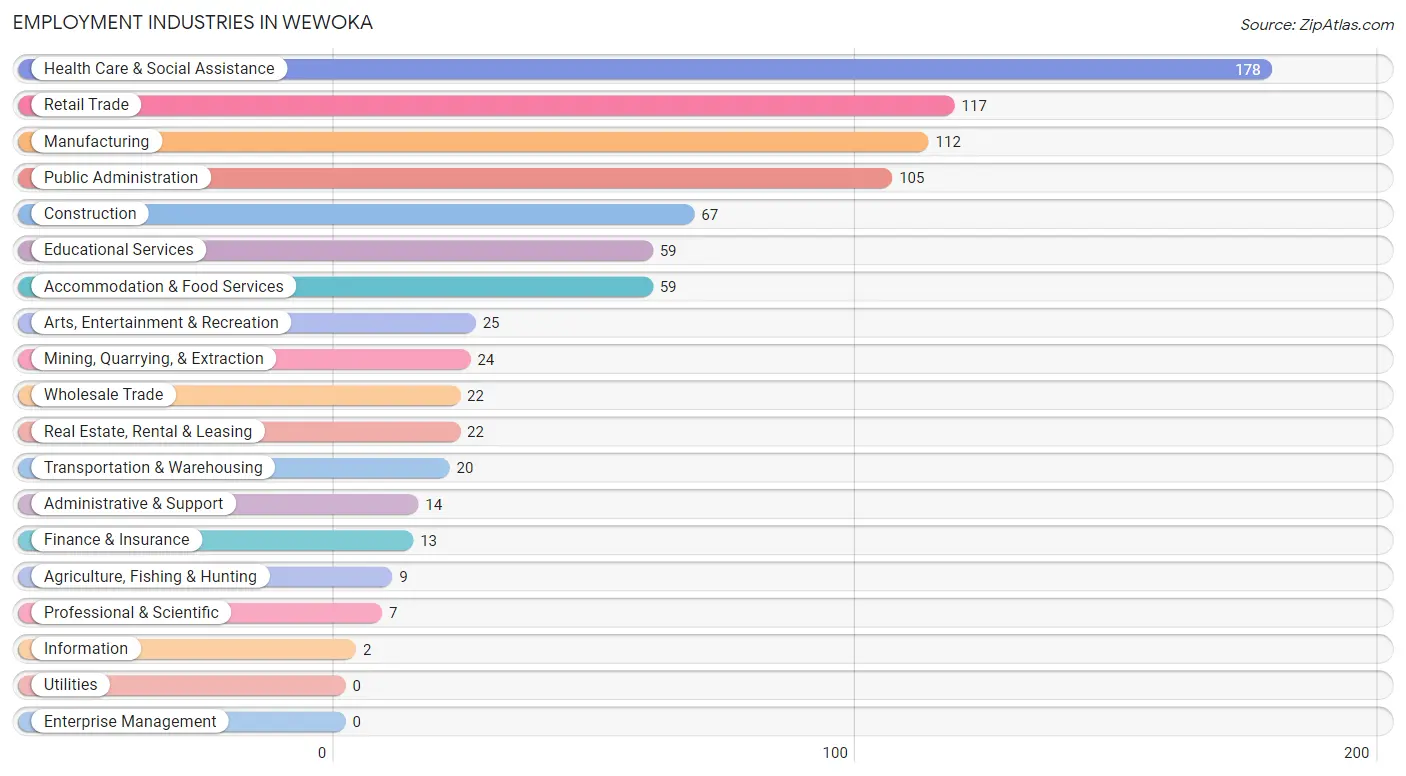
Employment Industries in Wewoka
The major employment industries in Wewoka include Health Care & Social Assistance (178 | 20.7%), Retail Trade (117 | 13.6%), Manufacturing (112 | 13.1%), Public Administration (105 | 12.2%), and Construction (67 | 7.8%).
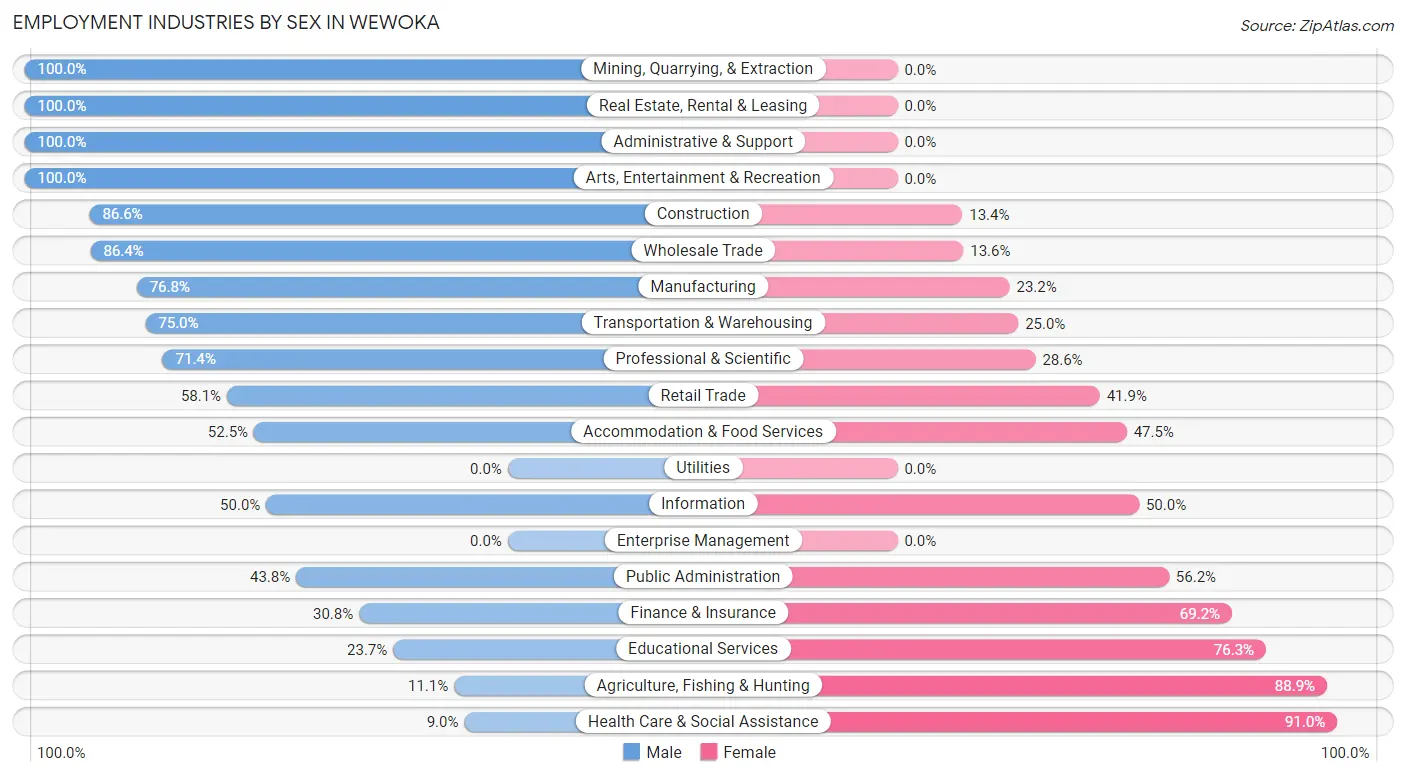
Employment Industries by Sex in Wewoka
The Wewoka industries that see more men than women are Mining, Quarrying, & Extraction (100.0%), Real Estate, Rental & Leasing (100.0%), and Administrative & Support (100.0%), whereas the industries that tend to have a higher number of women are Health Care & Social Assistance (91.0%), Agriculture, Fishing & Hunting (88.9%), and Educational Services (76.3%).
| Industry | Male | Female |
| Agriculture, Fishing & Hunting | 1 (11.1%) | 8 (88.9%) |
| Mining, Quarrying, & Extraction | 24 (100.0%) | 0 (0.0%) |
| Construction | 58 (86.6%) | 9 (13.4%) |
| Manufacturing | 86 (76.8%) | 26 (23.2%) |
| Wholesale Trade | 19 (86.4%) | 3 (13.6%) |
| Retail Trade | 68 (58.1%) | 49 (41.9%) |
| Transportation & Warehousing | 15 (75.0%) | 5 (25.0%) |
| Utilities | 0 (0.0%) | 0 (0.0%) |
| Information | 1 (50.0%) | 1 (50.0%) |
| Finance & Insurance | 4 (30.8%) | 9 (69.2%) |
| Real Estate, Rental & Leasing | 22 (100.0%) | 0 (0.0%) |
| Professional & Scientific | 5 (71.4%) | 2 (28.6%) |
| Enterprise Management | 0 (0.0%) | 0 (0.0%) |
| Administrative & Support | 14 (100.0%) | 0 (0.0%) |
| Educational Services | 14 (23.7%) | 45 (76.3%) |
| Health Care & Social Assistance | 16 (9.0%) | 162 (91.0%) |
| Arts, Entertainment & Recreation | 25 (100.0%) | 0 (0.0%) |
| Accommodation & Food Services | 31 (52.5%) | 28 (47.5%) |
| Public Administration | 46 (43.8%) | 59 (56.2%) |
| Total | 450 (52.4%) | 408 (47.5%) |
Education in Wewoka
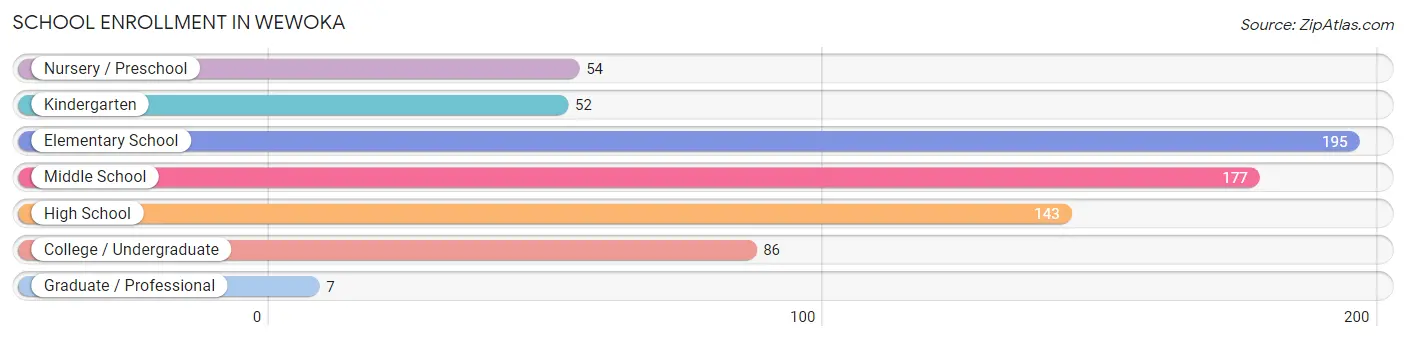
School Enrollment in Wewoka
The most common levels of schooling among the 714 students in Wewoka are elementary school (195 | 27.3%), middle school (177 | 24.8%), and high school (143 | 20.0%).
| School Level | # Students | % Students |
| Nursery / Preschool | 54 | 7.6% |
| Kindergarten | 52 | 7.3% |
| Elementary School | 195 | 27.3% |
| Middle School | 177 | 24.8% |
| High School | 143 | 20.0% |
| College / Undergraduate | 86 | 12.0% |
| Graduate / Professional | 7 | 1.0% |
| Total | 714 | 100.0% |
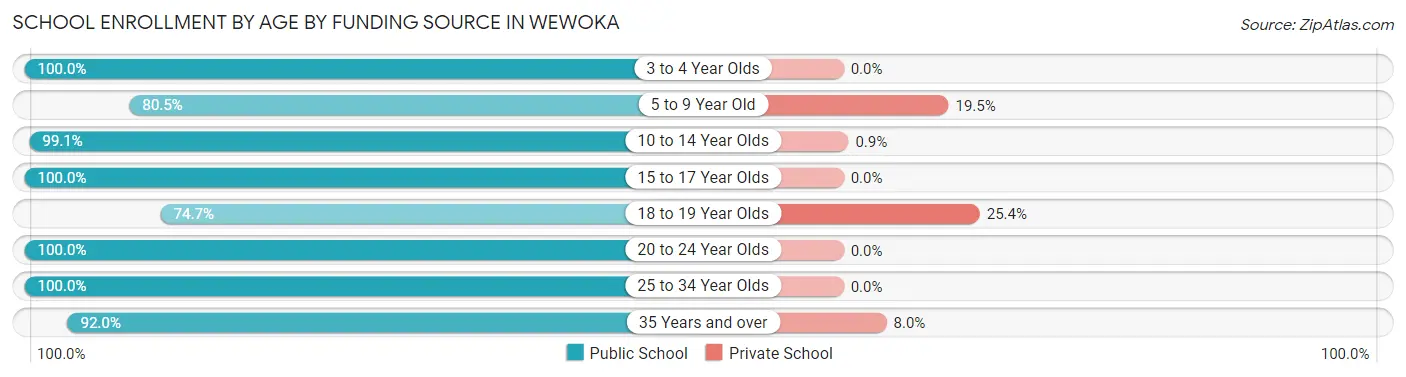
School Enrollment by Age by Funding Source in Wewoka
Out of a total of 714 students who are enrolled in schools in Wewoka, 66 (9.2%) attend a private institution, while the remaining 648 (90.8%) are enrolled in public schools. The age group of 18 to 19 year olds has the highest likelihood of being enrolled in private schools, with 18 (25.4% in the age bracket) enrolled. Conversely, the age group of 3 to 4 year olds has the lowest likelihood of being enrolled in a private school, with 42 (100.0% in the age bracket) attending a public institution.
| Age Bracket | Public School | Private School |
| 3 to 4 Year Olds | 42 (100.0%) | 0 (0.0%) |
| 5 to 9 Year Old | 173 (80.5%) | 42 (19.5%) |
| 10 to 14 Year Olds | 219 (99.1%) | 2 (0.9%) |
| 15 to 17 Year Olds | 94 (100.0%) | 0 (0.0%) |
| 18 to 19 Year Olds | 53 (74.7%) | 18 (25.4%) |
| 20 to 24 Year Olds | 11 (100.0%) | 0 (0.0%) |
| 25 to 34 Year Olds | 10 (100.0%) | 0 (0.0%) |
| 35 Years and over | 46 (92.0%) | 4 (8.0%) |
| Total | 648 (90.8%) | 66 (9.2%) |
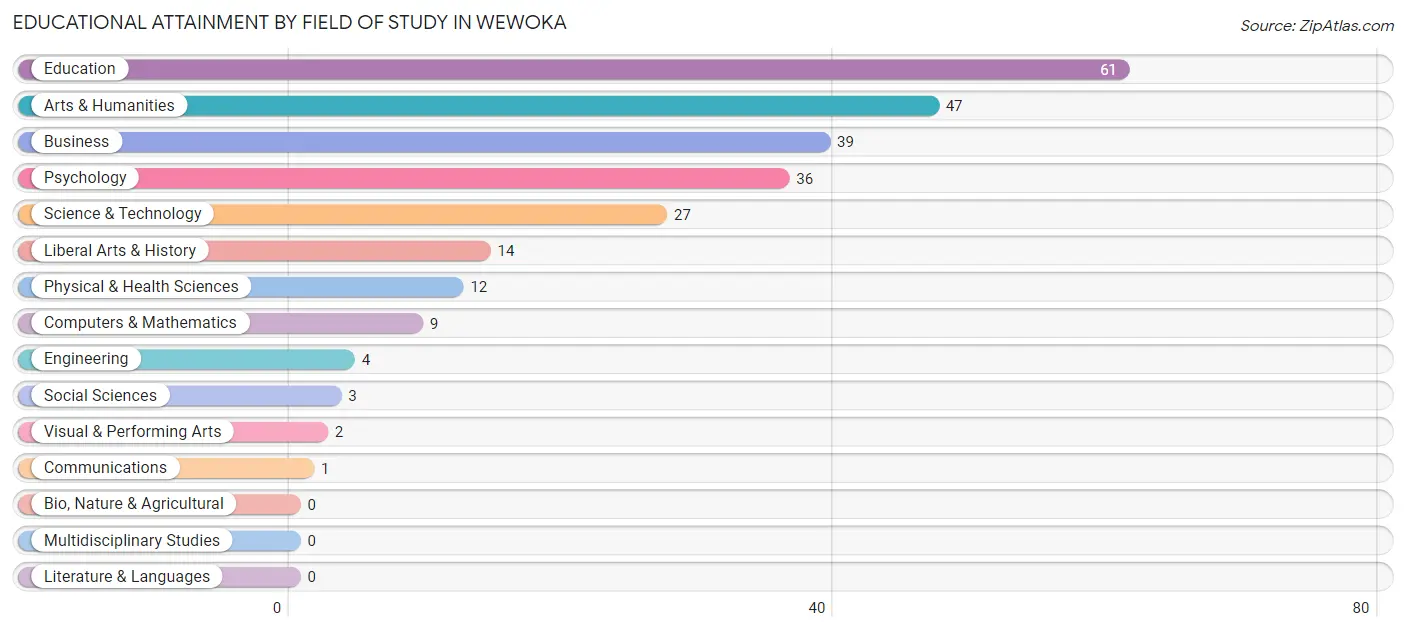
Educational Attainment by Field of Study in Wewoka
Education (61 | 23.9%), arts & humanities (47 | 18.4%), business (39 | 15.3%), psychology (36 | 14.1%), and science & technology (27 | 10.6%) are the most common fields of study among 255 individuals in Wewoka who have obtained a bachelor's degree or higher.
| Field of Study | # Graduates | % Graduates |
| Computers & Mathematics | 9 | 3.5% |
| Bio, Nature & Agricultural | 0 | 0.0% |
| Physical & Health Sciences | 12 | 4.7% |
| Psychology | 36 | 14.1% |
| Social Sciences | 3 | 1.2% |
| Engineering | 4 | 1.6% |
| Multidisciplinary Studies | 0 | 0.0% |
| Science & Technology | 27 | 10.6% |
| Business | 39 | 15.3% |
| Education | 61 | 23.9% |
| Literature & Languages | 0 | 0.0% |
| Liberal Arts & History | 14 | 5.5% |
| Visual & Performing Arts | 2 | 0.8% |
| Communications | 1 | 0.4% |
| Arts & Humanities | 47 | 18.4% |
| Total | 255 | 100.0% |
Transportation & Commute in Wewoka
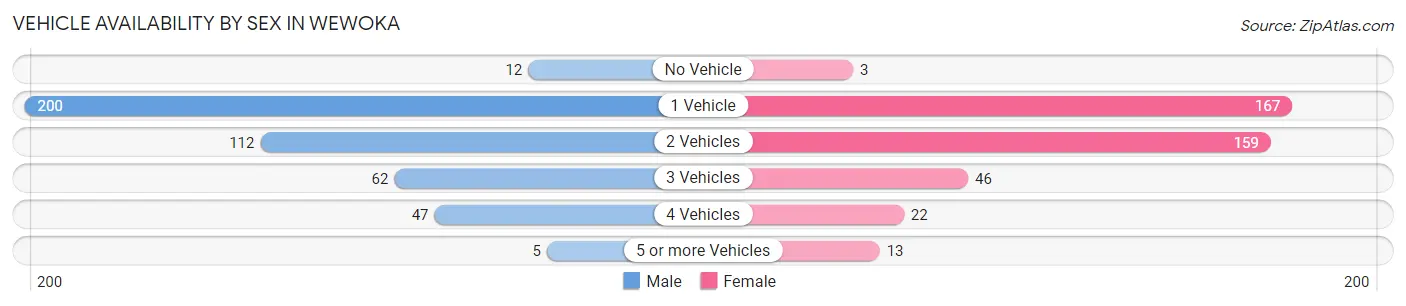
Vehicle Availability by Sex in Wewoka
The most prevalent vehicle ownership categories in Wewoka are males with 1 vehicle (200, accounting for 45.7%) and females with 1 vehicle (167, making up 48.8%).
| Vehicles Available | Male | Female |
| No Vehicle | 12 (2.7%) | 3 (0.7%) |
| 1 Vehicle | 200 (45.7%) | 167 (40.7%) |
| 2 Vehicles | 112 (25.6%) | 159 (38.8%) |
| 3 Vehicles | 62 (14.2%) | 46 (11.2%) |
| 4 Vehicles | 47 (10.7%) | 22 (5.4%) |
| 5 or more Vehicles | 5 (1.1%) | 13 (3.2%) |
| Total | 438 (100.0%) | 410 (100.0%) |
Commute Time in Wewoka
The most frequently occuring commute durations in Wewoka are 5 to 9 minutes (203 commuters, 25.3%), 20 to 24 minutes (105 commuters, 13.1%), and 15 to 19 minutes (102 commuters, 12.7%).
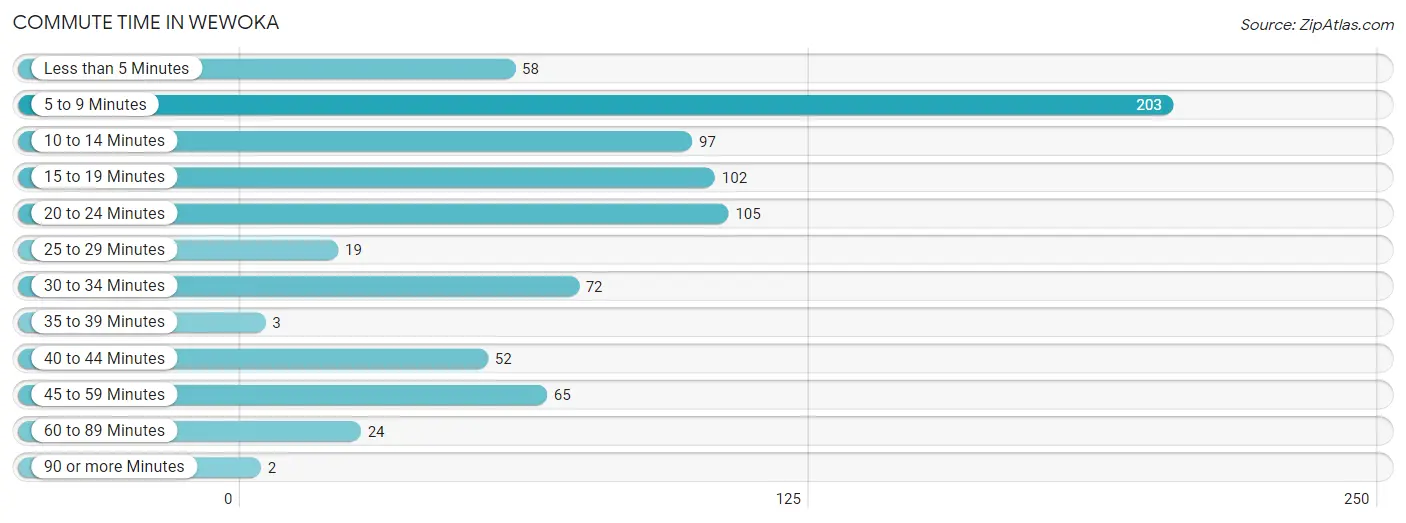
| Commute Time | # Commuters | % Commuters |
| Less than 5 Minutes | 58 | 7.2% |
| 5 to 9 Minutes | 203 | 25.3% |
| 10 to 14 Minutes | 97 | 12.1% |
| 15 to 19 Minutes | 102 | 12.7% |
| 20 to 24 Minutes | 105 | 13.1% |
| 25 to 29 Minutes | 19 | 2.4% |
| 30 to 34 Minutes | 72 | 9.0% |
| 35 to 39 Minutes | 3 | 0.4% |
| 40 to 44 Minutes | 52 | 6.5% |
| 45 to 59 Minutes | 65 | 8.1% |
| 60 to 89 Minutes | 24 | 3.0% |
| 90 or more Minutes | 2 | 0.3% |
Commute Time by Sex in Wewoka
The most common commute times in Wewoka are 5 to 9 minutes (114 commuters, 28.1%) for males and 5 to 9 minutes (89 commuters, 22.4%) for females.
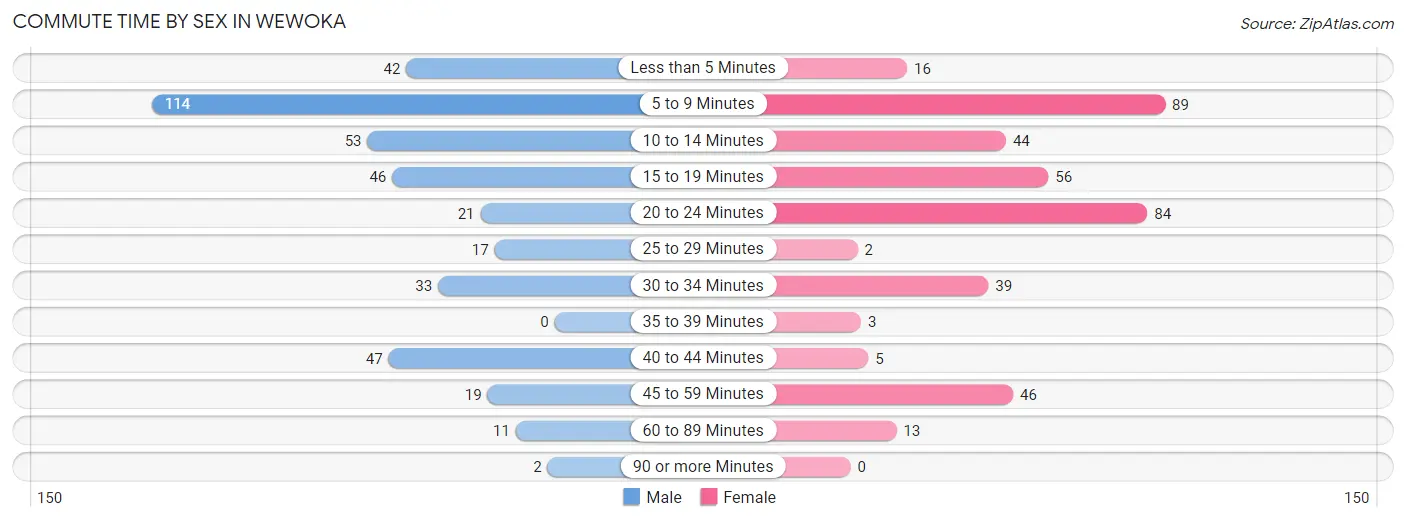
| Commute Time | Male | Female |
| Less than 5 Minutes | 42 (10.4%) | 16 (4.0%) |
| 5 to 9 Minutes | 114 (28.1%) | 89 (22.4%) |
| 10 to 14 Minutes | 53 (13.1%) | 44 (11.1%) |
| 15 to 19 Minutes | 46 (11.4%) | 56 (14.1%) |
| 20 to 24 Minutes | 21 (5.2%) | 84 (21.2%) |
| 25 to 29 Minutes | 17 (4.2%) | 2 (0.5%) |
| 30 to 34 Minutes | 33 (8.2%) | 39 (9.8%) |
| 35 to 39 Minutes | 0 (0.0%) | 3 (0.8%) |
| 40 to 44 Minutes | 47 (11.6%) | 5 (1.3%) |
| 45 to 59 Minutes | 19 (4.7%) | 46 (11.6%) |
| 60 to 89 Minutes | 11 (2.7%) | 13 (3.3%) |
| 90 or more Minutes | 2 (0.5%) | 0 (0.0%) |
Time of Departure to Work by Sex in Wewoka
The most frequent times of departure to work in Wewoka are 7:00 AM to 7:29 AM (82, 20.3%) for males and 7:30 AM to 7:59 AM (95, 23.9%) for females.
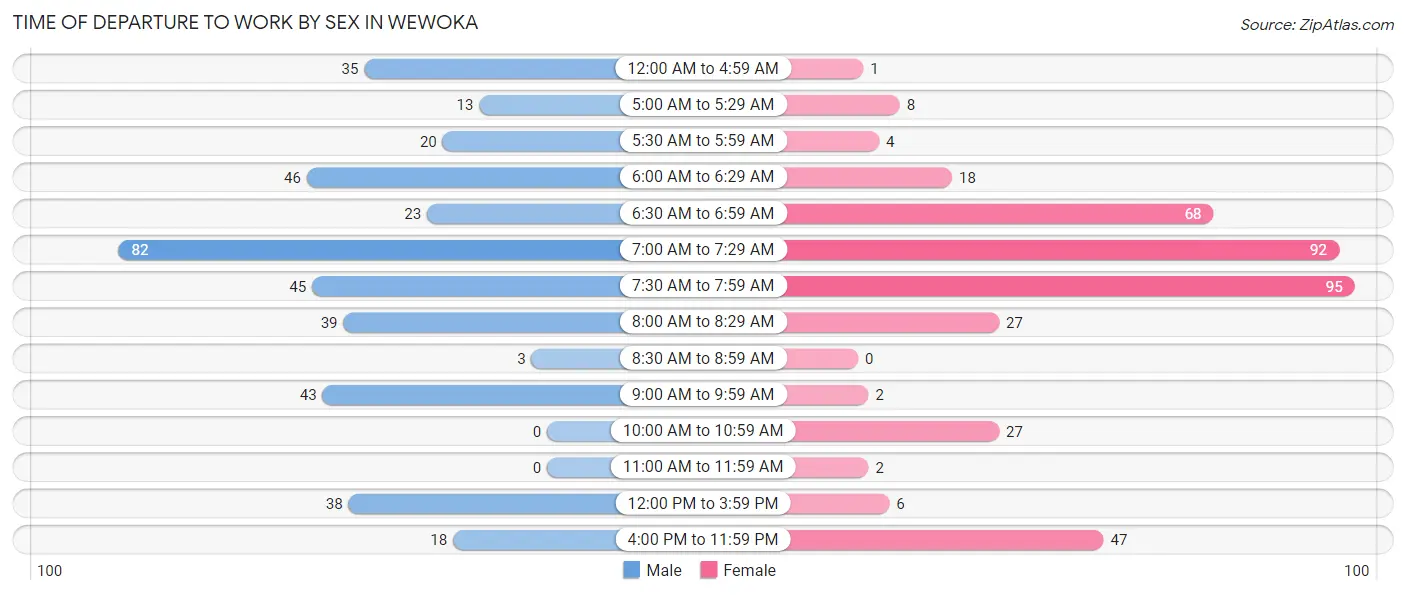
| Time of Departure | Male | Female |
| 12:00 AM to 4:59 AM | 35 (8.6%) | 1 (0.3%) |
| 5:00 AM to 5:29 AM | 13 (3.2%) | 8 (2.0%) |
| 5:30 AM to 5:59 AM | 20 (4.9%) | 4 (1.0%) |
| 6:00 AM to 6:29 AM | 46 (11.4%) | 18 (4.5%) |
| 6:30 AM to 6:59 AM | 23 (5.7%) | 68 (17.1%) |
| 7:00 AM to 7:29 AM | 82 (20.3%) | 92 (23.2%) |
| 7:30 AM to 7:59 AM | 45 (11.1%) | 95 (23.9%) |
| 8:00 AM to 8:29 AM | 39 (9.6%) | 27 (6.8%) |
| 8:30 AM to 8:59 AM | 3 (0.7%) | 0 (0.0%) |
| 9:00 AM to 9:59 AM | 43 (10.6%) | 2 (0.5%) |
| 10:00 AM to 10:59 AM | 0 (0.0%) | 27 (6.8%) |
| 11:00 AM to 11:59 AM | 0 (0.0%) | 2 (0.5%) |
| 12:00 PM to 3:59 PM | 38 (9.4%) | 6 (1.5%) |
| 4:00 PM to 11:59 PM | 18 (4.4%) | 47 (11.8%) |
| Total | 405 (100.0%) | 397 (100.0%) |
Housing Occupancy in Wewoka
Occupancy by Ownership in Wewoka
Of the total 1,089 dwellings in Wewoka, owner-occupied units account for 545 (50.0%), while renter-occupied units make up 544 (49.9%).
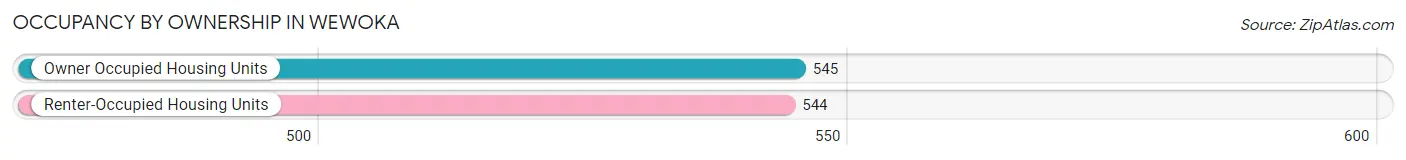
| Occupancy | # Housing Units | % Housing Units |
| Owner Occupied Housing Units | 545 | 50.0% |
| Renter-Occupied Housing Units | 544 | 49.9% |
| Total Occupied Housing Units | 1,089 | 100.0% |
Occupancy by Household Size in Wewoka
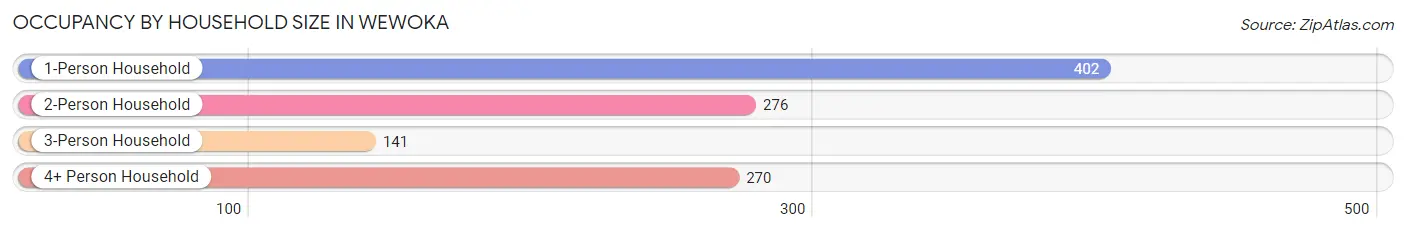
| Household Size | # Housing Units | % Housing Units |
| 1-Person Household | 402 | 36.9% |
| 2-Person Household | 276 | 25.3% |
| 3-Person Household | 141 | 13.0% |
| 4+ Person Household | 270 | 24.8% |
| Total Housing Units | 1,089 | 100.0% |
Occupancy by Ownership by Household Size in Wewoka
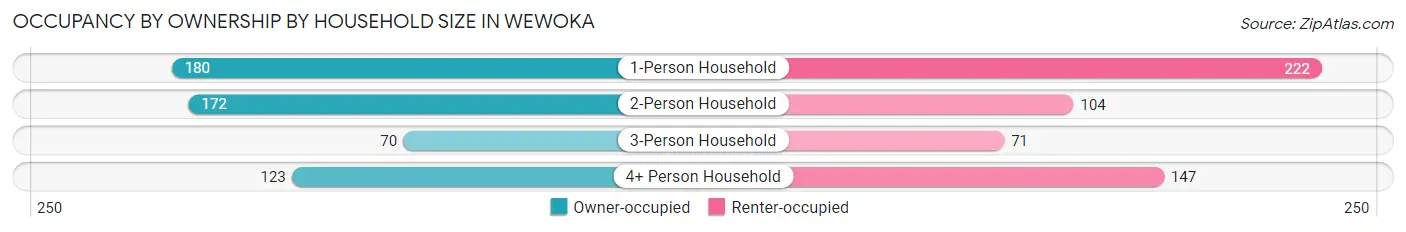
| Household Size | Owner-occupied | Renter-occupied |
| 1-Person Household | 180 (44.8%) | 222 (55.2%) |
| 2-Person Household | 172 (62.3%) | 104 (37.7%) |
| 3-Person Household | 70 (49.6%) | 71 (50.3%) |
| 4+ Person Household | 123 (45.6%) | 147 (54.4%) |
| Total Housing Units | 545 (50.0%) | 544 (49.9%) |
Occupancy by Educational Attainment in Wewoka
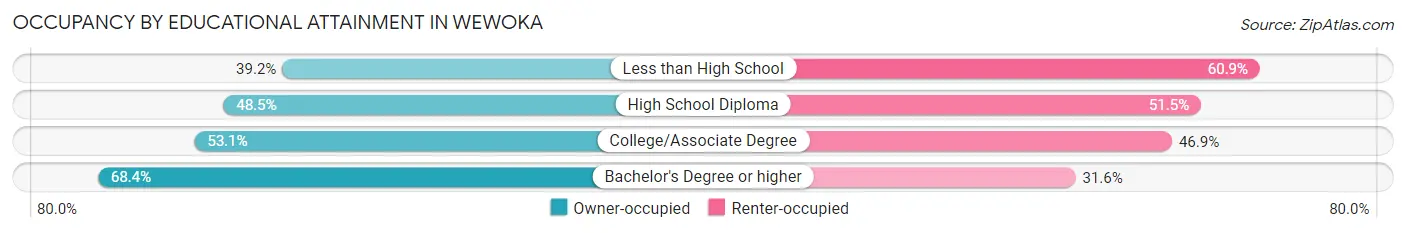
| Household Size | Owner-occupied | Renter-occupied |
| Less than High School | 92 (39.2%) | 143 (60.9%) |
| High School Diploma | 192 (48.5%) | 204 (51.5%) |
| College/Associate Degree | 181 (53.1%) | 160 (46.9%) |
| Bachelor's Degree or higher | 80 (68.4%) | 37 (31.6%) |
Occupancy by Age of Householder in Wewoka
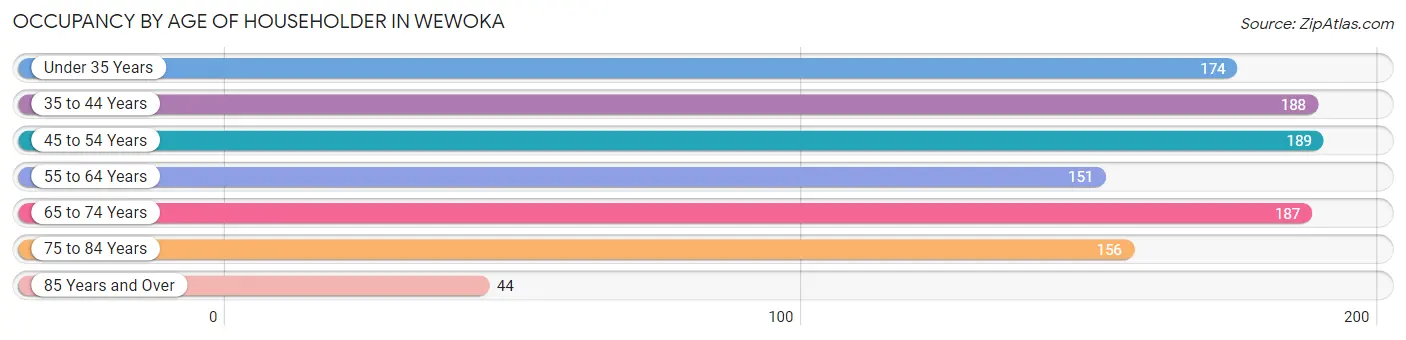
| Age Bracket | # Households | % Households |
| Under 35 Years | 174 | 16.0% |
| 35 to 44 Years | 188 | 17.3% |
| 45 to 54 Years | 189 | 17.4% |
| 55 to 64 Years | 151 | 13.9% |
| 65 to 74 Years | 187 | 17.2% |
| 75 to 84 Years | 156 | 14.3% |
| 85 Years and Over | 44 | 4.0% |
| Total | 1,089 | 100.0% |
Housing Finances in Wewoka
Median Income by Occupancy in Wewoka
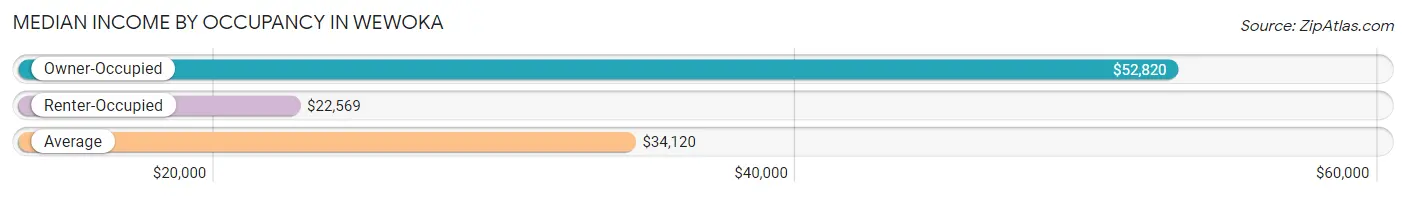
| Occupancy Type | # Households | Median Income |
| Owner-Occupied | 545 (50.0%) | $52,820 |
| Renter-Occupied | 544 (49.9%) | $22,569 |
| Average | 1,089 (100.0%) | $34,120 |
Occupancy by Householder Income Bracket in Wewoka
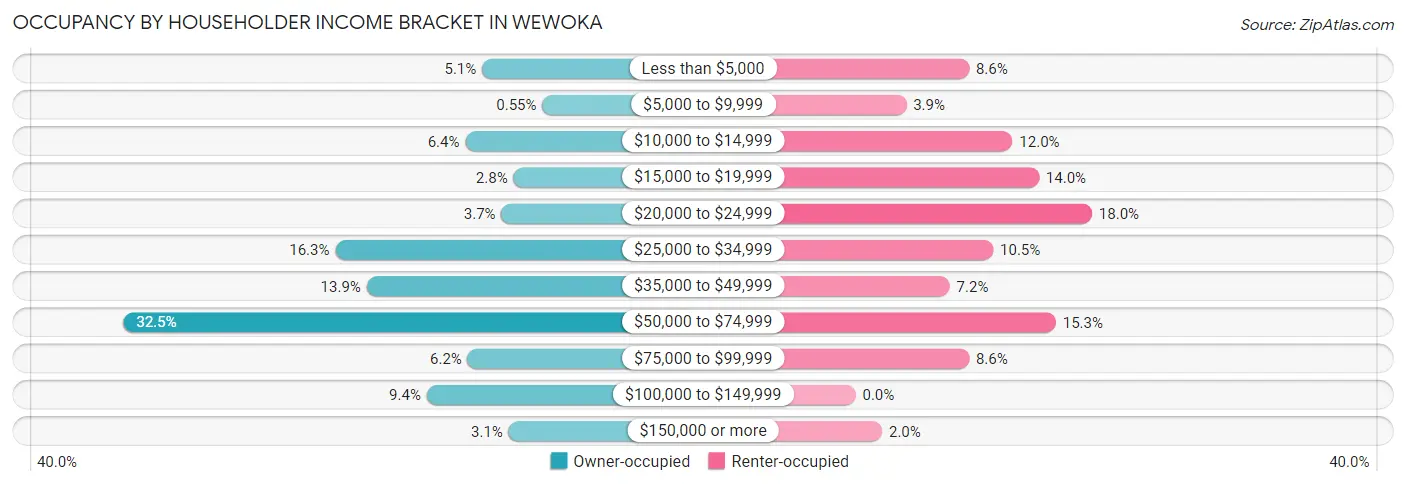
| Income Bracket | Owner-occupied | Renter-occupied |
| Less than $5,000 | 28 (5.1%) | 47 (8.6%) |
| $5,000 to $9,999 | 3 (0.5%) | 21 (3.9%) |
| $10,000 to $14,999 | 35 (6.4%) | 65 (11.9%) |
| $15,000 to $19,999 | 15 (2.8%) | 76 (14.0%) |
| $20,000 to $24,999 | 20 (3.7%) | 98 (18.0%) |
| $25,000 to $34,999 | 89 (16.3%) | 57 (10.5%) |
| $35,000 to $49,999 | 76 (13.9%) | 39 (7.2%) |
| $50,000 to $74,999 | 177 (32.5%) | 83 (15.3%) |
| $75,000 to $99,999 | 34 (6.2%) | 47 (8.6%) |
| $100,000 to $149,999 | 51 (9.4%) | 0 (0.0%) |
| $150,000 or more | 17 (3.1%) | 11 (2.0%) |
| Total | 545 (100.0%) | 544 (100.0%) |
Monthly Housing Cost Tiers in Wewoka
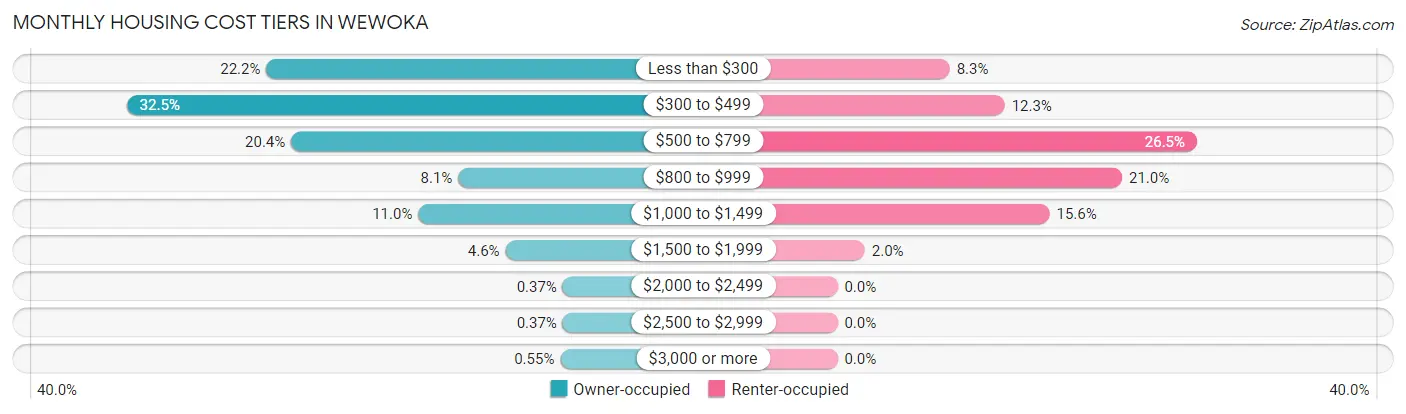
| Monthly Cost | Owner-occupied | Renter-occupied |
| Less than $300 | 121 (22.2%) | 45 (8.3%) |
| $300 to $499 | 177 (32.5%) | 67 (12.3%) |
| $500 to $799 | 111 (20.4%) | 144 (26.5%) |
| $800 to $999 | 44 (8.1%) | 114 (21.0%) |
| $1,000 to $1,499 | 60 (11.0%) | 85 (15.6%) |
| $1,500 to $1,999 | 25 (4.6%) | 11 (2.0%) |
| $2,000 to $2,499 | 2 (0.4%) | 0 (0.0%) |
| $2,500 to $2,999 | 2 (0.4%) | 0 (0.0%) |
| $3,000 or more | 3 (0.5%) | 0 (0.0%) |
| Total | 545 (100.0%) | 544 (100.0%) |
Physical Housing Characteristics in Wewoka
Housing Structures in Wewoka
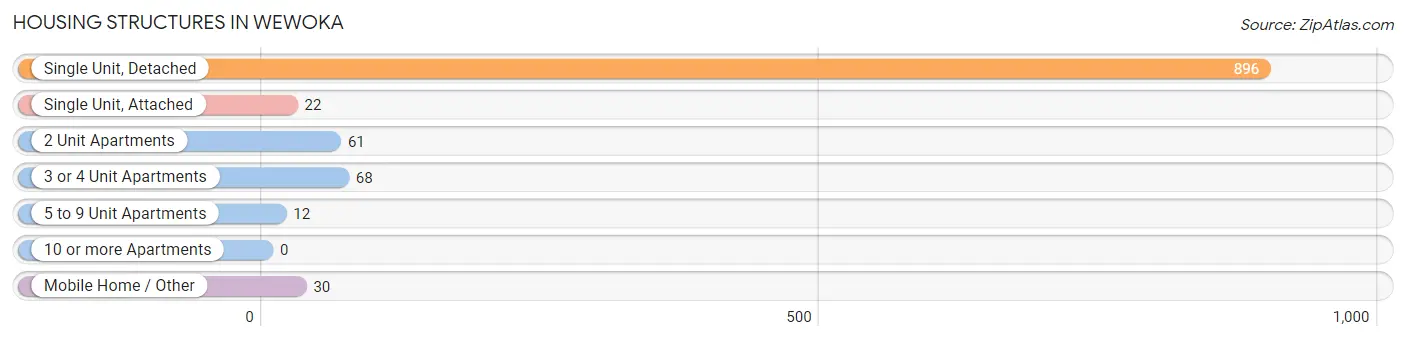
| Structure Type | # Housing Units | % Housing Units |
| Single Unit, Detached | 896 | 82.3% |
| Single Unit, Attached | 22 | 2.0% |
| 2 Unit Apartments | 61 | 5.6% |
| 3 or 4 Unit Apartments | 68 | 6.2% |
| 5 to 9 Unit Apartments | 12 | 1.1% |
| 10 or more Apartments | 0 | 0.0% |
| Mobile Home / Other | 30 | 2.8% |
| Total | 1,089 | 100.0% |
Housing Structures by Occupancy in Wewoka
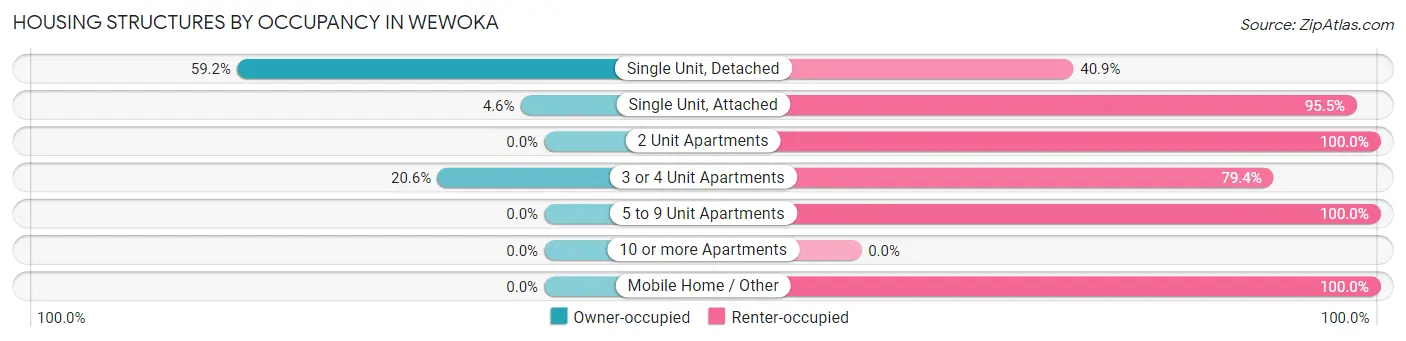
| Structure Type | Owner-occupied | Renter-occupied |
| Single Unit, Detached | 530 (59.2%) | 366 (40.8%) |
| Single Unit, Attached | 1 (4.5%) | 21 (95.5%) |
| 2 Unit Apartments | 0 (0.0%) | 61 (100.0%) |
| 3 or 4 Unit Apartments | 14 (20.6%) | 54 (79.4%) |
| 5 to 9 Unit Apartments | 0 (0.0%) | 12 (100.0%) |
| 10 or more Apartments | 0 (0.0%) | 0 (0.0%) |
| Mobile Home / Other | 0 (0.0%) | 30 (100.0%) |
| Total | 545 (50.0%) | 544 (49.9%) |
Housing Structures by Number of Rooms in Wewoka
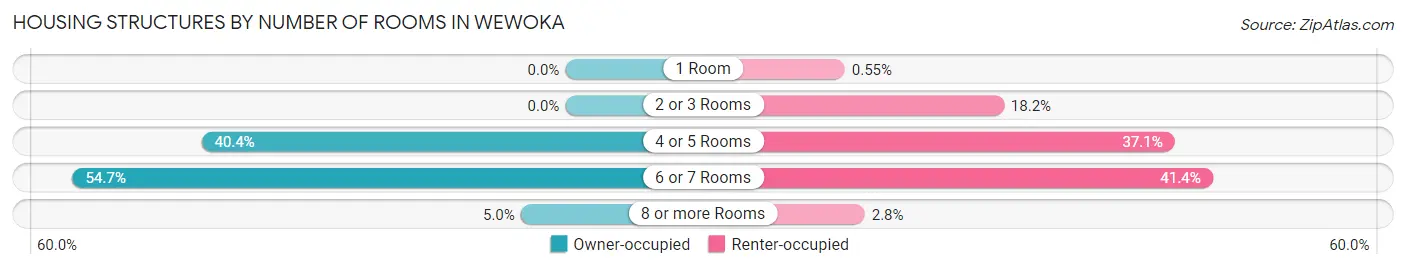
| Number of Rooms | Owner-occupied | Renter-occupied |
| 1 Room | 0 (0.0%) | 3 (0.5%) |
| 2 or 3 Rooms | 0 (0.0%) | 99 (18.2%) |
| 4 or 5 Rooms | 220 (40.4%) | 202 (37.1%) |
| 6 or 7 Rooms | 298 (54.7%) | 225 (41.4%) |
| 8 or more Rooms | 27 (5.0%) | 15 (2.8%) |
| Total | 545 (100.0%) | 544 (100.0%) |
Housing Structure by Heating Type in Wewoka
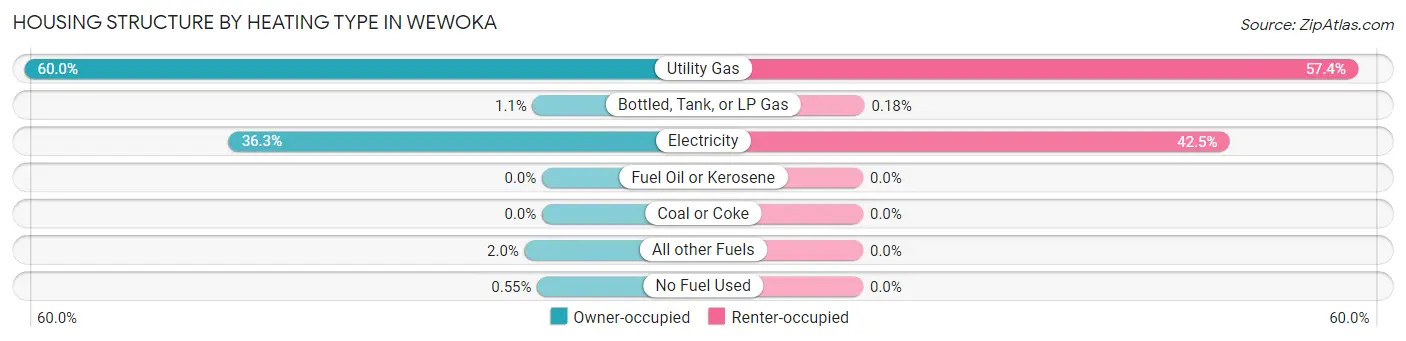
| Heating Type | Owner-occupied | Renter-occupied |
| Utility Gas | 327 (60.0%) | 312 (57.4%) |
| Bottled, Tank, or LP Gas | 6 (1.1%) | 1 (0.2%) |
| Electricity | 198 (36.3%) | 231 (42.5%) |
| Fuel Oil or Kerosene | 0 (0.0%) | 0 (0.0%) |
| Coal or Coke | 0 (0.0%) | 0 (0.0%) |
| All other Fuels | 11 (2.0%) | 0 (0.0%) |
| No Fuel Used | 3 (0.5%) | 0 (0.0%) |
| Total | 545 (100.0%) | 544 (100.0%) |
Household Vehicle Usage in Wewoka
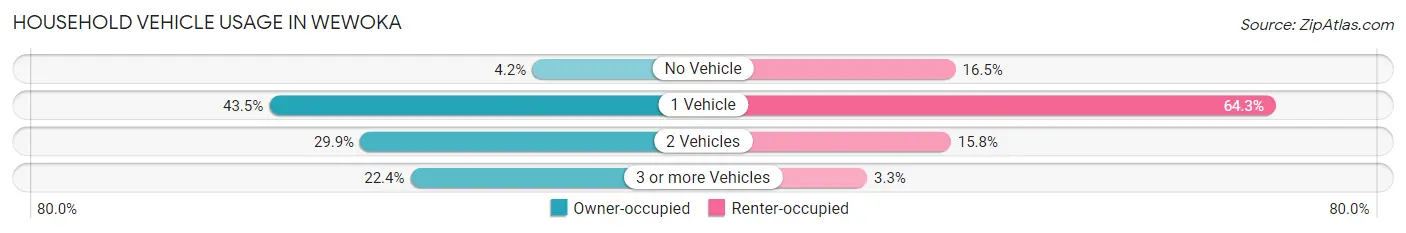
| Vehicles per Household | Owner-occupied | Renter-occupied |
| No Vehicle | 23 (4.2%) | 90 (16.5%) |
| 1 Vehicle | 237 (43.5%) | 350 (64.3%) |
| 2 Vehicles | 163 (29.9%) | 86 (15.8%) |
| 3 or more Vehicles | 122 (22.4%) | 18 (3.3%) |
| Total | 545 (100.0%) | 544 (100.0%) |
Real Estate & Mortgages in Wewoka
Real Estate and Mortgage Overview in Wewoka
| Characteristic | Without Mortgage | With Mortgage |
| Housing Units | 408 | 137 |
| Median Property Value | $61,300 | $108,600 |
| Median Household Income | $46,538 | $12 |
| Monthly Housing Costs | $417 | $1 |
| Real Estate Taxes | $386 | $0 |
Property Value by Mortgage Status in Wewoka
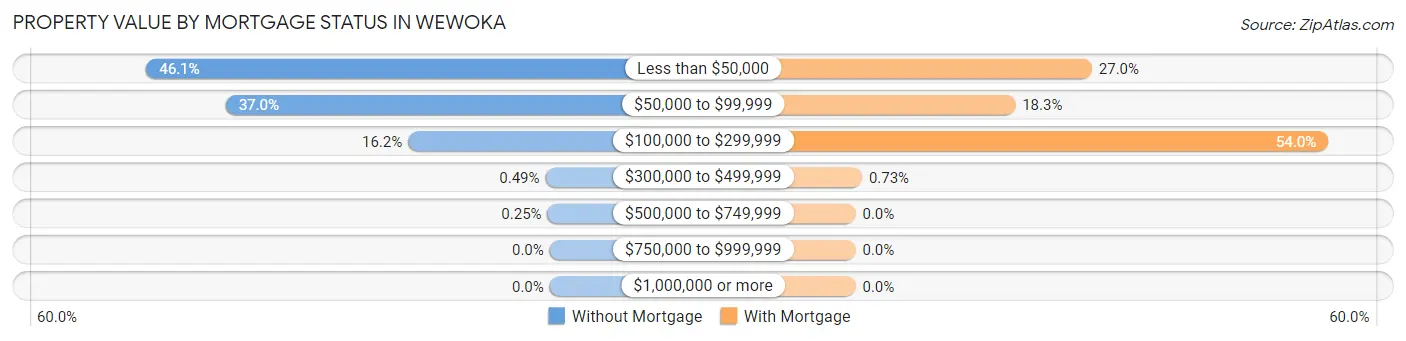
| Property Value | Without Mortgage | With Mortgage |
| Less than $50,000 | 188 (46.1%) | 37 (27.0%) |
| $50,000 to $99,999 | 151 (37.0%) | 25 (18.2%) |
| $100,000 to $299,999 | 66 (16.2%) | 74 (54.0%) |
| $300,000 to $499,999 | 2 (0.5%) | 1 (0.7%) |
| $500,000 to $749,999 | 1 (0.3%) | 0 (0.0%) |
| $750,000 to $999,999 | 0 (0.0%) | 0 (0.0%) |
| $1,000,000 or more | 0 (0.0%) | 0 (0.0%) |
| Total | 408 (100.0%) | 137 (100.0%) |
Household Income by Mortgage Status in Wewoka
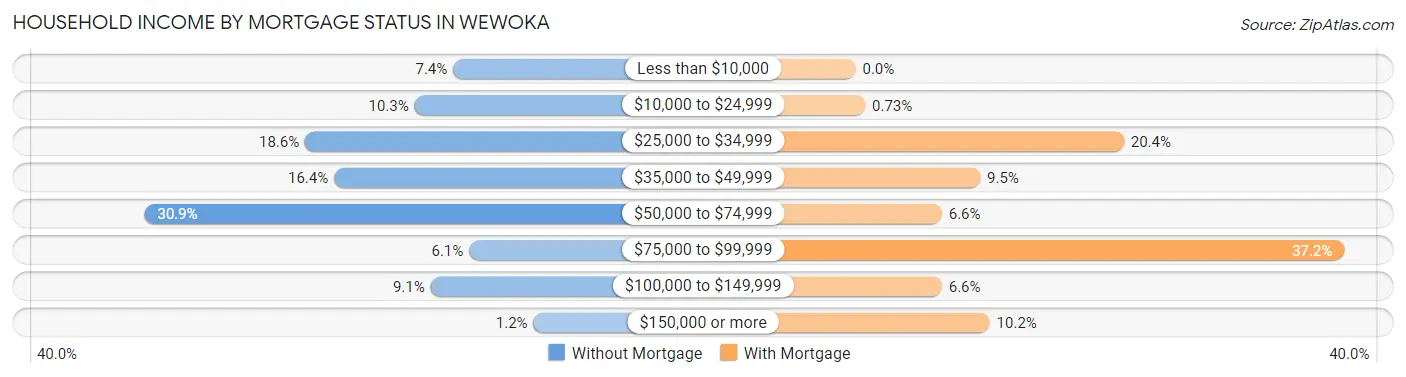
| Household Income | Without Mortgage | With Mortgage |
| Less than $10,000 | 30 (7.3%) | 0 (0.0%) |
| $10,000 to $24,999 | 42 (10.3%) | 1 (0.7%) |
| $25,000 to $34,999 | 76 (18.6%) | 28 (20.4%) |
| $35,000 to $49,999 | 67 (16.4%) | 13 (9.5%) |
| $50,000 to $74,999 | 126 (30.9%) | 9 (6.6%) |
| $75,000 to $99,999 | 25 (6.1%) | 51 (37.2%) |
| $100,000 to $149,999 | 37 (9.1%) | 9 (6.6%) |
| $150,000 or more | 5 (1.2%) | 14 (10.2%) |
| Total | 408 (100.0%) | 137 (100.0%) |
Property Value to Household Income Ratio in Wewoka
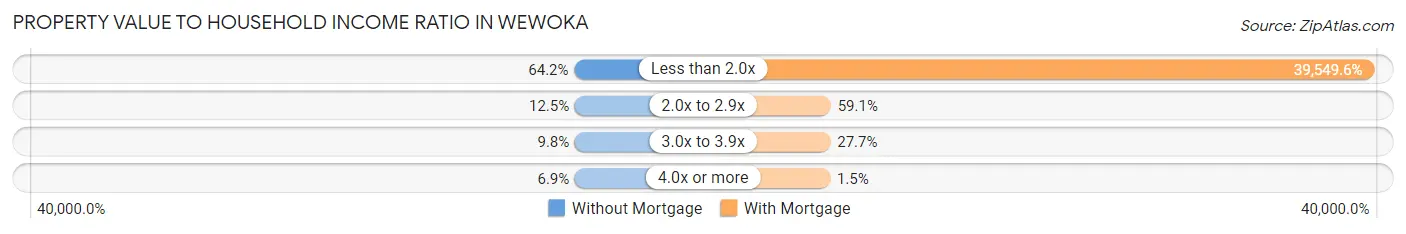
| Value-to-Income Ratio | Without Mortgage | With Mortgage |
| Less than 2.0x | 262 (64.2%) | 54,183 (39,549.6%) |
| 2.0x to 2.9x | 51 (12.5%) | 81 (59.1%) |
| 3.0x to 3.9x | 40 (9.8%) | 38 (27.7%) |
| 4.0x or more | 28 (6.9%) | 2 (1.5%) |
| Total | 408 (100.0%) | 137 (100.0%) |
Real Estate Taxes by Mortgage Status in Wewoka
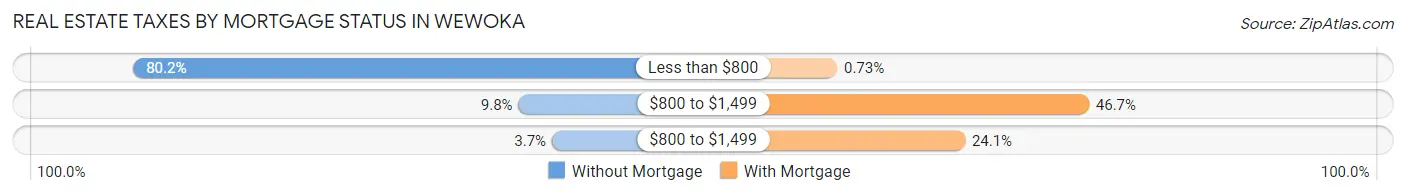
| Property Taxes | Without Mortgage | With Mortgage |
| Less than $800 | 327 (80.1%) | 1 (0.7%) |
| $800 to $1,499 | 40 (9.8%) | 64 (46.7%) |
| $800 to $1,499 | 15 (3.7%) | 33 (24.1%) |
| Total | 408 (100.0%) | 137 (100.0%) |
Health & Disability in Wewoka
Health Insurance Coverage by Age in Wewoka
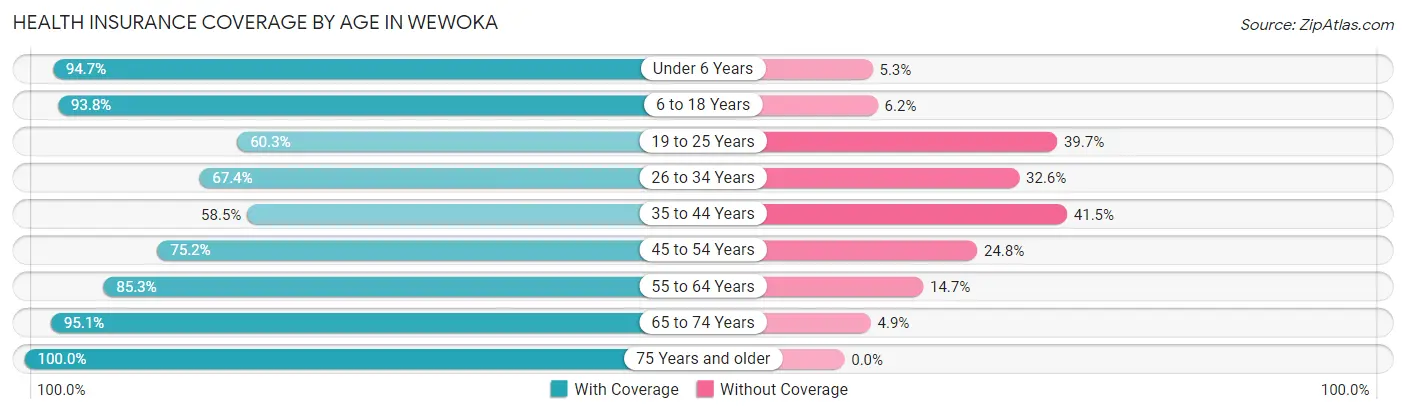
| Age Bracket | With Coverage | Without Coverage |
| Under 6 Years | 198 (94.7%) | 11 (5.3%) |
| 6 to 18 Years | 543 (93.8%) | 36 (6.2%) |
| 19 to 25 Years | 108 (60.3%) | 71 (39.7%) |
| 26 to 34 Years | 215 (67.4%) | 104 (32.6%) |
| 35 to 44 Years | 265 (58.5%) | 188 (41.5%) |
| 45 to 54 Years | 240 (75.2%) | 79 (24.8%) |
| 55 to 64 Years | 209 (85.3%) | 36 (14.7%) |
| 65 to 74 Years | 271 (95.1%) | 14 (4.9%) |
| 75 Years and older | 241 (100.0%) | 0 (0.0%) |
| Total | 2,290 (80.9%) | 539 (19.1%) |
Health Insurance Coverage by Citizenship Status in Wewoka
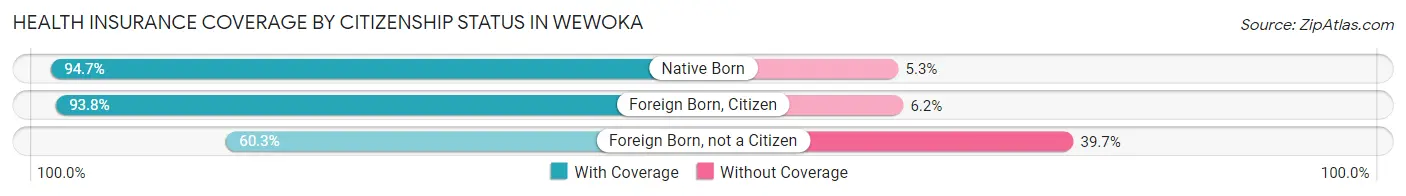
| Citizenship Status | With Coverage | Without Coverage |
| Native Born | 198 (94.7%) | 11 (5.3%) |
| Foreign Born, Citizen | 543 (93.8%) | 36 (6.2%) |
| Foreign Born, not a Citizen | 108 (60.3%) | 71 (39.7%) |
Health Insurance Coverage by Household Income in Wewoka
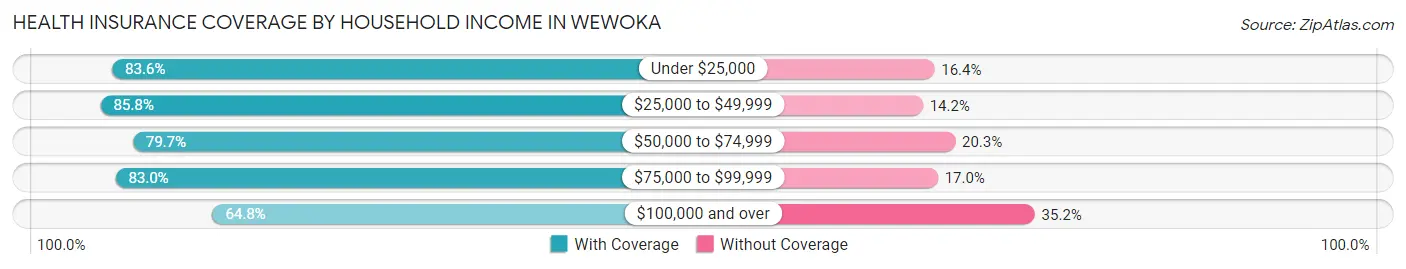
| Household Income | With Coverage | Without Coverage |
| Under $25,000 | 632 (83.6%) | 124 (16.4%) |
| $25,000 to $49,999 | 573 (85.8%) | 95 (14.2%) |
| $50,000 to $74,999 | 625 (79.7%) | 159 (20.3%) |
| $75,000 to $99,999 | 263 (83.0%) | 54 (17.0%) |
| $100,000 and over | 197 (64.8%) | 107 (35.2%) |
Public vs Private Health Insurance Coverage by Age in Wewoka
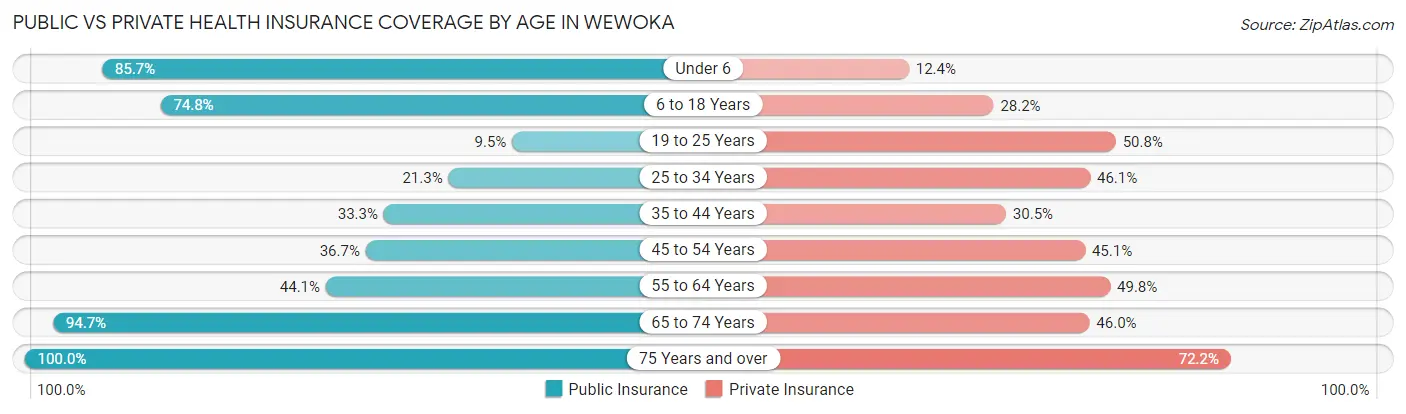
| Age Bracket | Public Insurance | Private Insurance |
| Under 6 | 179 (85.7%) | 26 (12.4%) |
| 6 to 18 Years | 433 (74.8%) | 163 (28.1%) |
| 19 to 25 Years | 17 (9.5%) | 91 (50.8%) |
| 25 to 34 Years | 68 (21.3%) | 147 (46.1%) |
| 35 to 44 Years | 151 (33.3%) | 138 (30.5%) |
| 45 to 54 Years | 117 (36.7%) | 144 (45.1%) |
| 55 to 64 Years | 108 (44.1%) | 122 (49.8%) |
| 65 to 74 Years | 270 (94.7%) | 131 (46.0%) |
| 75 Years and over | 241 (100.0%) | 174 (72.2%) |
| Total | 1,584 (56.0%) | 1,136 (40.2%) |
Disability Status by Sex by Age in Wewoka
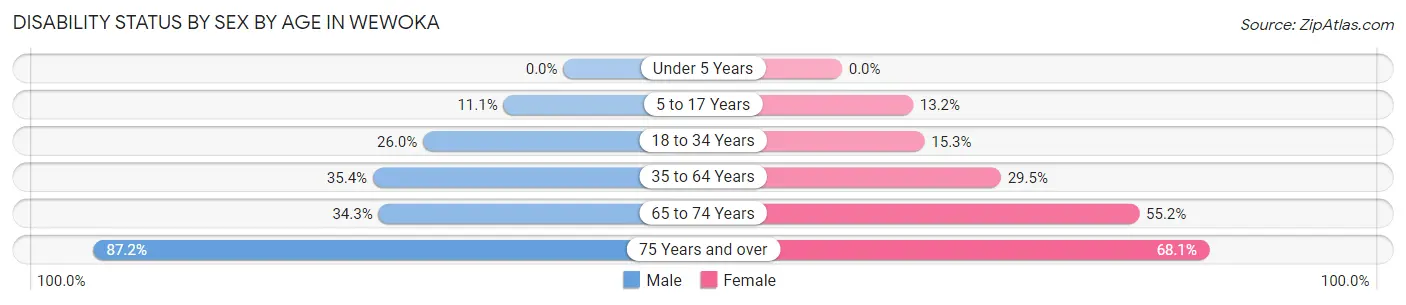
| Age Bracket | Male | Female |
| Under 5 Years | 0 (0.0%) | 0 (0.0%) |
| 5 to 17 Years | 44 (11.1%) | 24 (13.2%) |
| 18 to 34 Years | 76 (26.0%) | 40 (15.3%) |
| 35 to 64 Years | 175 (35.3%) | 154 (29.5%) |
| 65 to 74 Years | 35 (34.3%) | 101 (55.2%) |
| 75 Years and over | 109 (87.2%) | 79 (68.1%) |
Disability Class by Sex by Age in Wewoka
Disability Class: Hearing Difficulty
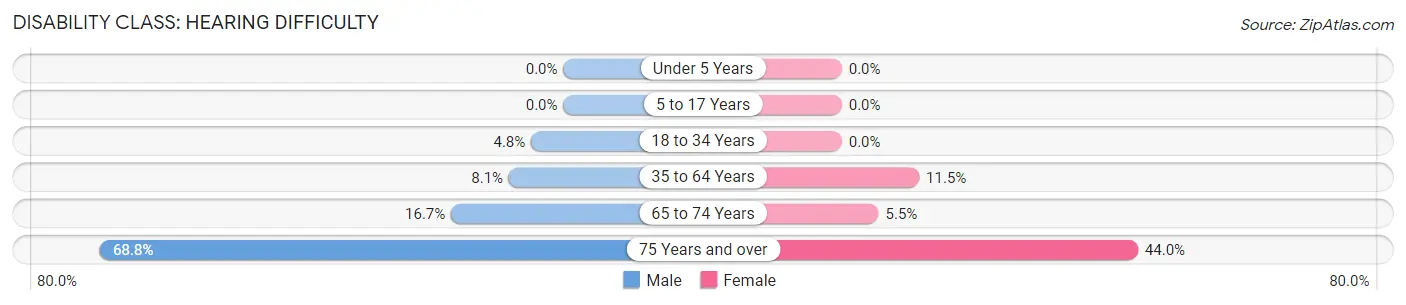
| Age Bracket | Male | Female |
| Under 5 Years | 0 (0.0%) | 0 (0.0%) |
| 5 to 17 Years | 0 (0.0%) | 0 (0.0%) |
| 18 to 34 Years | 14 (4.8%) | 0 (0.0%) |
| 35 to 64 Years | 40 (8.1%) | 60 (11.5%) |
| 65 to 74 Years | 17 (16.7%) | 10 (5.5%) |
| 75 Years and over | 86 (68.8%) | 51 (44.0%) |
Disability Class: Vision Difficulty
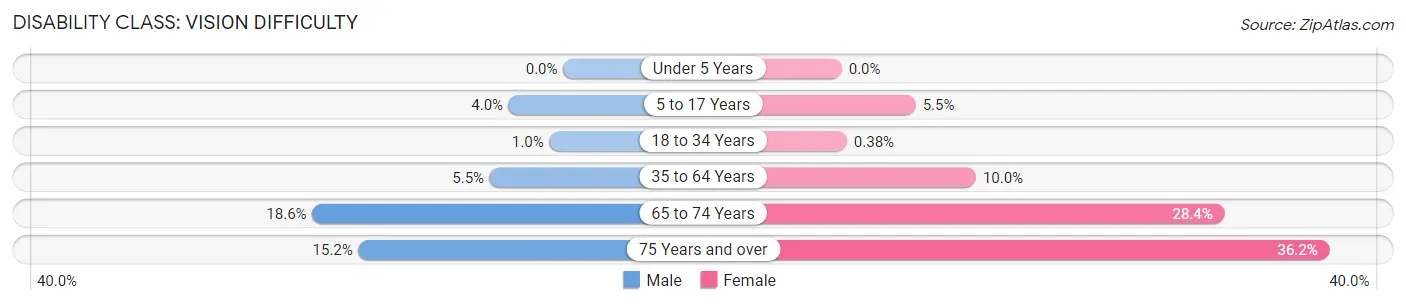
| Age Bracket | Male | Female |
| Under 5 Years | 0 (0.0%) | 0 (0.0%) |
| 5 to 17 Years | 16 (4.0%) | 10 (5.5%) |
| 18 to 34 Years | 3 (1.0%) | 1 (0.4%) |
| 35 to 64 Years | 27 (5.4%) | 52 (10.0%) |
| 65 to 74 Years | 19 (18.6%) | 52 (28.4%) |
| 75 Years and over | 19 (15.2%) | 42 (36.2%) |
Disability Class: Cognitive Difficulty
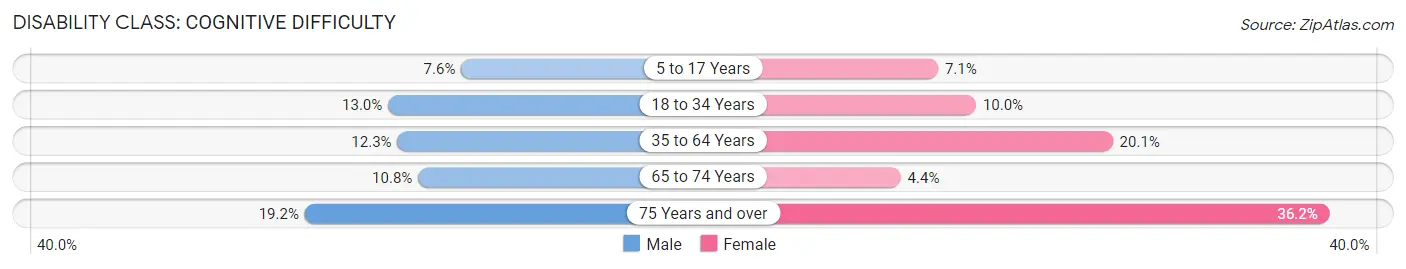
| Age Bracket | Male | Female |
| 5 to 17 Years | 30 (7.6%) | 13 (7.1%) |
| 18 to 34 Years | 38 (13.0%) | 26 (10.0%) |
| 35 to 64 Years | 61 (12.3%) | 105 (20.1%) |
| 65 to 74 Years | 11 (10.8%) | 8 (4.4%) |
| 75 Years and over | 24 (19.2%) | 42 (36.2%) |
Disability Class: Ambulatory Difficulty
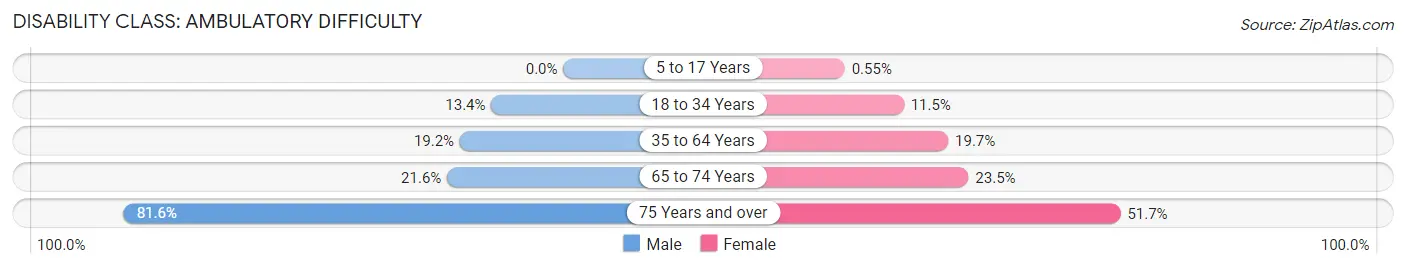
| Age Bracket | Male | Female |
| 5 to 17 Years | 0 (0.0%) | 1 (0.5%) |
| 18 to 34 Years | 39 (13.4%) | 30 (11.5%) |
| 35 to 64 Years | 95 (19.2%) | 103 (19.7%) |
| 65 to 74 Years | 22 (21.6%) | 43 (23.5%) |
| 75 Years and over | 102 (81.6%) | 60 (51.7%) |
Disability Class: Self-Care Difficulty
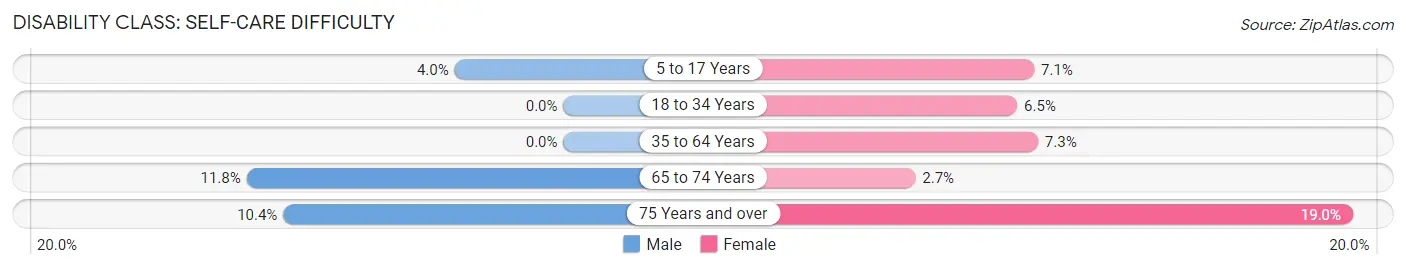
| Age Bracket | Male | Female |
| 5 to 17 Years | 16 (4.0%) | 13 (7.1%) |
| 18 to 34 Years | 0 (0.0%) | 17 (6.5%) |
| 35 to 64 Years | 0 (0.0%) | 38 (7.3%) |
| 65 to 74 Years | 12 (11.8%) | 5 (2.7%) |
| 75 Years and over | 13 (10.4%) | 22 (19.0%) |
Technology Access in Wewoka
Computing Device Access in Wewoka
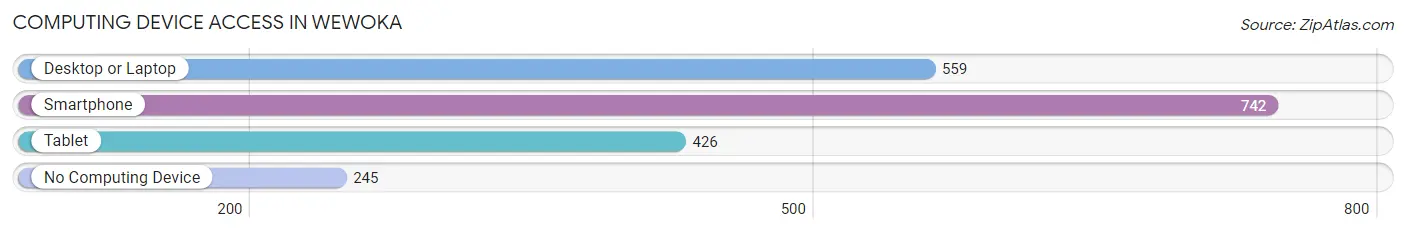
| Device Type | # Households | % Households |
| Desktop or Laptop | 559 | 51.3% |
| Smartphone | 742 | 68.1% |
| Tablet | 426 | 39.1% |
| No Computing Device | 245 | 22.5% |
| Total | 1,089 | 100.0% |
Internet Access in Wewoka
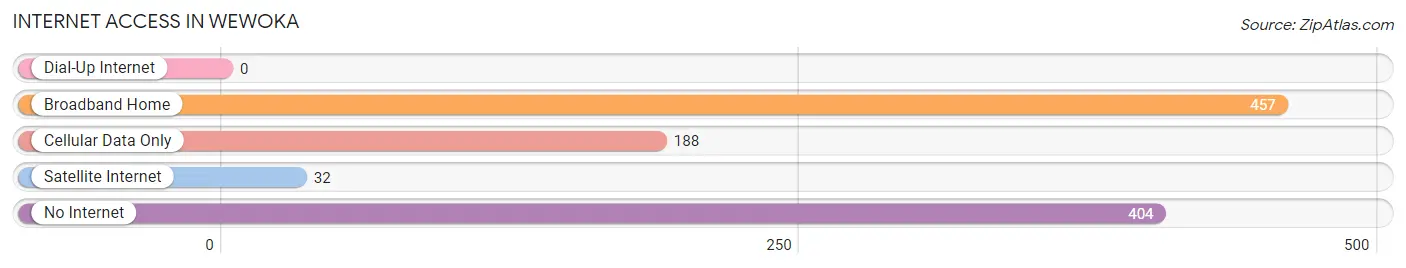
| Internet Type | # Households | % Households |
| Dial-Up Internet | 0 | 0.0% |
| Broadband Home | 457 | 42.0% |
| Cellular Data Only | 188 | 17.3% |
| Satellite Internet | 32 | 2.9% |
| No Internet | 404 | 37.1% |
| Total | 1,089 | 100.0% |
Wewoka Summary
Wewoka is a city located in Seminole County, Oklahoma. It is the county seat of Seminole County and is located approximately 50 miles east of Oklahoma City. The population of Wewoka was 3,430 at the 2010 census, an increase of 4.3% from the 2000 census.
History
The area that is now Wewoka was originally inhabited by the Seminole people. The city was founded in 1866 by the Creek Nation, who named it Wewoka, which means “barking water” in the Creek language. The city was incorporated in 1891 and was designated as the county seat of Seminole County in 1907.
In the early 1900s, Wewoka was a thriving agricultural center, with cotton, corn, and peanuts being the main crops. The city was also home to several sawmills and lumber companies. In the 1920s, oil was discovered in the area, and Wewoka became a major oil-producing center.
Geography
Wewoka is located at 35°25'25" North, 96°25'25" West (35.423, -96.423). The city is situated in the rolling hills of the Cross Timbers region of Oklahoma. The city is located approximately 50 miles east of Oklahoma City and is bordered by the North Canadian River to the east.
The climate in Wewoka is characterized by hot, humid summers and mild winters. The average annual temperature is 64°F, with an average high of 90°F in July and an average low of 37°F in January. The average annual precipitation is 40 inches.
Economy
The economy of Wewoka is largely based on agriculture and oil production. The city is home to several agricultural businesses, including cotton gins, feed mills, and grain elevators. The city is also home to several oil and gas companies, as well as a number of manufacturing companies.
The city is also home to several retail businesses, including grocery stores, restaurants, and clothing stores. The city is also home to a number of service businesses, including banks, insurance companies, and medical offices.
Demographics
As of the 2010 census, the population of Wewoka was 3,430, an increase of 4.3% from the 2000 census. The racial makeup of the city was 73.3% White, 15.2% Native American, 0.7% African American, 0.3% Asian, 0.1% Pacific Islander, and 8.4% from other races. Hispanic or Latino of any race were 4.2% of the population.
The median household income in Wewoka was $30,938, and the median family income was $37,813. The per capita income was $15,945. About 17.2% of families and 20.7% of the population were below the poverty line, including 28.3% of those under age 18 and 11.2% of those age 65 or over.
Conclusion
Wewoka is a city located in Seminole County, Oklahoma. It is the county seat of Seminole County and is located approximately 50 miles east of Oklahoma City. The city was founded in 1866 by the Creek Nation and was incorporated in 1891. The economy of Wewoka is largely based on agriculture and oil production. The population of Wewoka was 3,430 at the 2010 census, an increase of 4.3% from the 2000 census. The racial makeup of the city was 73.3% White, 15.2% Native American, 0.7% African American, 0.3% Asian, 0.1% Pacific Islander, and 8.4% from other races. The median household income in Wewoka was $30,938, and the median family income was $37,813.
Common Questions
What is Per Capita Income in Wewoka?
Per Capita income in Wewoka is $18,702.
What is the Median Family Income in Wewoka?
Median Family Income in Wewoka is $47,917.
What is the Median Household income in Wewoka?
Median Household Income in Wewoka is $34,120.
What is Income or Wage Gap in Wewoka?
Income or Wage Gap in Wewoka is 23.2%.
Women in Wewoka earn 76.8 cents for every dollar earned by a man.
What is Family Income Deficit in Wewoka?
Family Income Deficit in Wewoka is $12,668.
Families that are below poverty line in Wewoka earn $12,668 less on average than the poverty threshold level.
What is Inequality or Gini Index in Wewoka?
Inequality or Gini Index in Wewoka is 0.42.
What is the Total Population of Wewoka?
Total Population of Wewoka is 3,124.
What is the Total Male Population of Wewoka?
Total Male Population of Wewoka is 1,621.
What is the Total Female Population of Wewoka?
Total Female Population of Wewoka is 1,503.
What is the Ratio of Males per 100 Females in Wewoka?
There are 107.85 Males per 100 Females in Wewoka.
What is the Ratio of Females per 100 Males in Wewoka?
There are 92.72 Females per 100 Males in Wewoka.
What is the Median Population Age in Wewoka?
Median Population Age in Wewoka is 38.9 Years.
What is the Average Family Size in Wewoka
Average Family Size in Wewoka is 3.5 People.
What is the Average Household Size in Wewoka
Average Household Size in Wewoka is 2.6 People.
How Large is the Labor Force in Wewoka?
There are 959 People in the Labor Forcein in Wewoka.
What is the Percentage of People in the Labor Force in Wewoka?
39.0% of People are in the Labor Force in Wewoka.
What is the Unemployment Rate in Wewoka?
Unemployment Rate in Wewoka is 10.2%.