Barnsdall, OK Map & Demographics
Barnsdall Map
Barnsdall Overview
$23,458
PER CAPITA INCOME
$67,625
AVG FAMILY INCOME
$56,500
AVG HOUSEHOLD INCOME
22.9%
WAGE / INCOME GAP [ % ]
77.1¢/ $1
WAGE / INCOME GAP [ $ ]
0.36
INEQUALITY / GINI INDEX
1,019
TOTAL POPULATION
537
MALE POPULATION
482
FEMALE POPULATION
111.41
MALES / 100 FEMALES
89.76
FEMALES / 100 MALES
36.8
MEDIAN AGE
3.4
AVG FAMILY SIZE
2.7
AVG HOUSEHOLD SIZE
436
LABOR FORCE [ PEOPLE ]
53.2%
PERCENT IN LABOR FORCE
6.2%
UNEMPLOYMENT RATE
Barnsdall Zip Codes
Barnsdall Area Codes
Income in Barnsdall
Income Overview in Barnsdall
Per Capita Income in Barnsdall is $23,458, while median incomes of families and households are $67,625 and $56,500 respectively.
| Characteristic | Number | Measure |
| Per Capita Income | 1,019 | $23,458 |
| Median Family Income | 239 | $67,625 |
| Mean Family Income | 239 | $73,495 |
| Median Household Income | 360 | $56,500 |
| Mean Household Income | 360 | $61,796 |
| Income Deficit | 239 | $0 |
| Wage / Income Gap (%) | 1,019 | 22.86% |
| Wage / Income Gap ($) | 1,019 | 77.14¢ per $1 |
| Gini / Inequality Index | 1,019 | 0.36 |
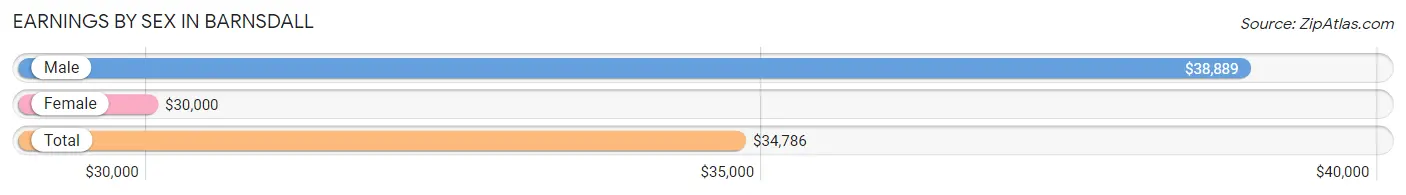
Earnings by Sex in Barnsdall
Average Earnings in Barnsdall are $34,786, $38,889 for men and $30,000 for women, a difference of 22.9%.
| Sex | Number | Average Earnings |
| Male | 252 (57.0%) | $38,889 |
| Female | 190 (43.0%) | $30,000 |
| Total | 442 (100.0%) | $34,786 |
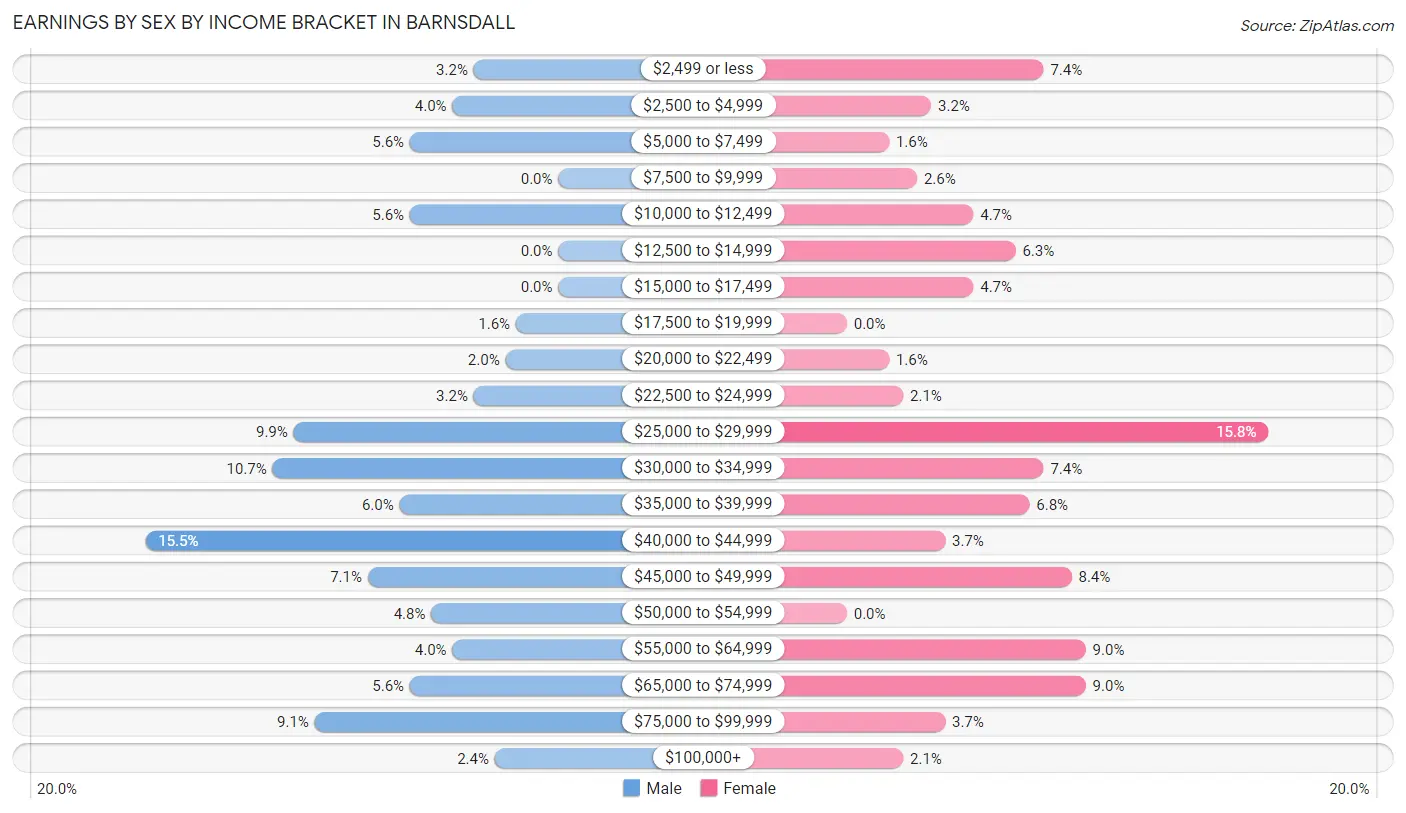
Earnings by Sex by Income Bracket in Barnsdall
The most common earnings brackets in Barnsdall are $40,000 to $44,999 for men (39 | 15.5%) and $25,000 to $29,999 for women (30 | 15.8%).
| Income | Male | Female |
| $2,499 or less | 8 (3.2%) | 14 (7.4%) |
| $2,500 to $4,999 | 10 (4.0%) | 6 (3.2%) |
| $5,000 to $7,499 | 14 (5.6%) | 3 (1.6%) |
| $7,500 to $9,999 | 0 (0.0%) | 5 (2.6%) |
| $10,000 to $12,499 | 14 (5.6%) | 9 (4.7%) |
| $12,500 to $14,999 | 0 (0.0%) | 12 (6.3%) |
| $15,000 to $17,499 | 0 (0.0%) | 9 (4.7%) |
| $17,500 to $19,999 | 4 (1.6%) | 0 (0.0%) |
| $20,000 to $22,499 | 5 (2.0%) | 3 (1.6%) |
| $22,500 to $24,999 | 8 (3.2%) | 4 (2.1%) |
| $25,000 to $29,999 | 25 (9.9%) | 30 (15.8%) |
| $30,000 to $34,999 | 27 (10.7%) | 14 (7.4%) |
| $35,000 to $39,999 | 15 (5.9%) | 13 (6.8%) |
| $40,000 to $44,999 | 39 (15.5%) | 7 (3.7%) |
| $45,000 to $49,999 | 18 (7.1%) | 16 (8.4%) |
| $50,000 to $54,999 | 12 (4.8%) | 0 (0.0%) |
| $55,000 to $64,999 | 10 (4.0%) | 17 (8.9%) |
| $65,000 to $74,999 | 14 (5.6%) | 17 (8.9%) |
| $75,000 to $99,999 | 23 (9.1%) | 7 (3.7%) |
| $100,000+ | 6 (2.4%) | 4 (2.1%) |
| Total | 252 (100.0%) | 190 (100.0%) |
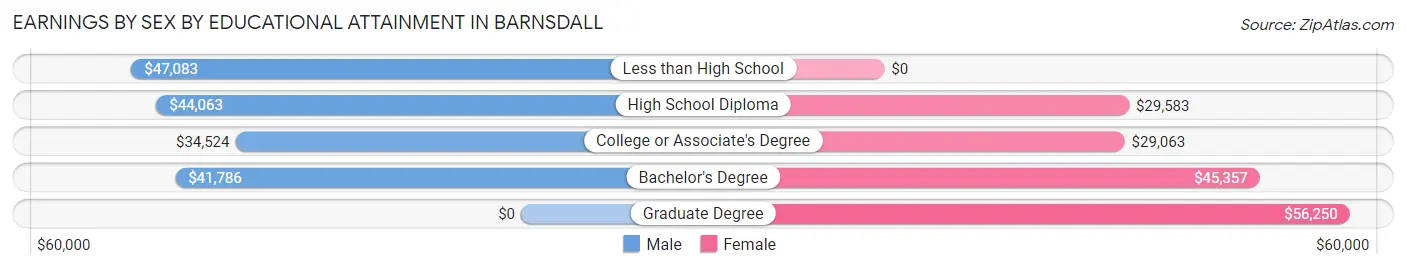
Earnings by Sex by Educational Attainment in Barnsdall
Average earnings in Barnsdall are $41,438 for men and $32,813 for women, a difference of 20.8%. Men with an educational attainment of less than high school enjoy the highest average annual earnings of $47,083, while those with college or associate's degree education earn the least with $34,524. Women with an educational attainment of graduate degree earn the most with the average annual earnings of $56,250, while those with college or associate's degree education have the smallest earnings of $29,063.
| Educational Attainment | Male Income | Female Income |
| Less than High School | $47,083 | $0 |
| High School Diploma | $44,063 | $29,583 |
| College or Associate's Degree | $34,524 | $29,063 |
| Bachelor's Degree | $41,786 | $45,357 |
| Graduate Degree | - | - |
| Total | $41,438 | $32,813 |
Family Income in Barnsdall
Family Income Brackets in Barnsdall
According to the Barnsdall family income data, there are 62 families falling into the $50,000 to $74,999 income range, which is the most common income bracket and makes up 25.9% of all families.
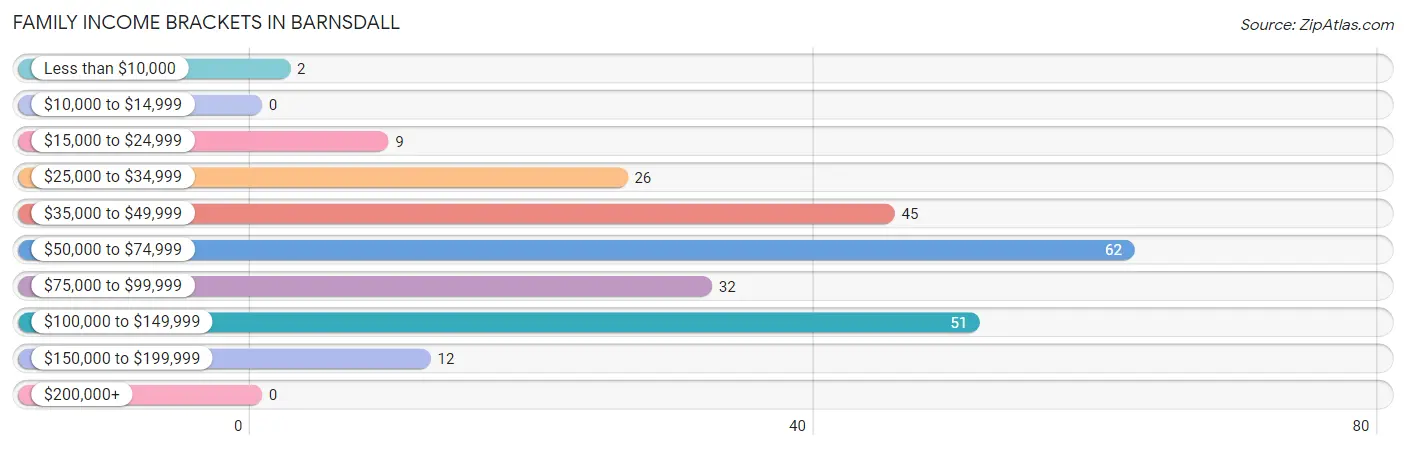
| Income Bracket | # Families | % Families |
| Less than $10,000 | 2 | 0.8% |
| $10,000 to $14,999 | 0 | 0.0% |
| $15,000 to $24,999 | 9 | 3.8% |
| $25,000 to $34,999 | 26 | 10.9% |
| $35,000 to $49,999 | 45 | 18.8% |
| $50,000 to $74,999 | 62 | 25.9% |
| $75,000 to $99,999 | 32 | 13.4% |
| $100,000 to $149,999 | 51 | 21.3% |
| $150,000 to $199,999 | 12 | 5.0% |
| $200,000+ | 0 | 0.0% |
Family Income by Famaliy Size in Barnsdall
5-person families (17 | 7.1%) account for the highest median family income in Barnsdall with $107,083 per family, while 2-person families (125 | 52.3%) have the highest median income of $31,625 per family member.
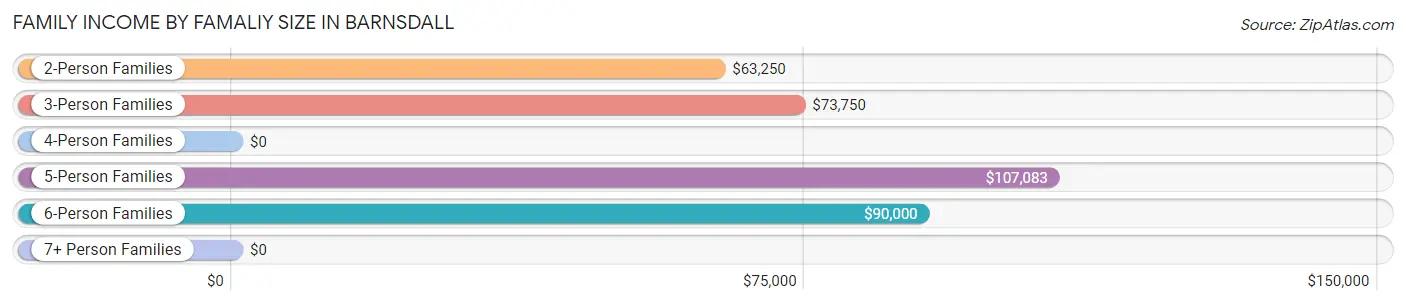
| Income Bracket | # Families | Median Income |
| 2-Person Families | 125 (52.3%) | $63,250 |
| 3-Person Families | 64 (26.8%) | $73,750 |
| 4-Person Families | 9 (3.8%) | $0 |
| 5-Person Families | 17 (7.1%) | $107,083 |
| 6-Person Families | 20 (8.4%) | $90,000 |
| 7+ Person Families | 4 (1.7%) | $0 |
| Total | 239 (100.0%) | $67,625 |
Family Income by Number of Earners in Barnsdall
The median family income in Barnsdall is $67,625, with families comprising 3+ earners (17) having the highest median family income of $114,063, while families with 1 earner (62) have the lowest median family income of $45,000, accounting for 7.1% and 25.9% of families, respectively.
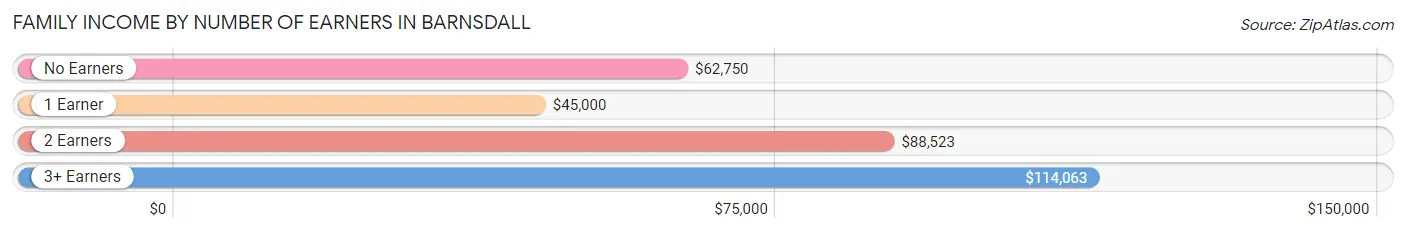
| Number of Earners | # Families | Median Income |
| No Earners | 51 (21.3%) | $62,750 |
| 1 Earner | 62 (25.9%) | $45,000 |
| 2 Earners | 109 (45.6%) | $88,523 |
| 3+ Earners | 17 (7.1%) | $114,063 |
| Total | 239 (100.0%) | $67,625 |
Household Income in Barnsdall
Household Income Brackets in Barnsdall
With 81 households falling in the category, the $50,000 to $74,999 income range is the most frequent in Barnsdall, accounting for 22.5% of all households.
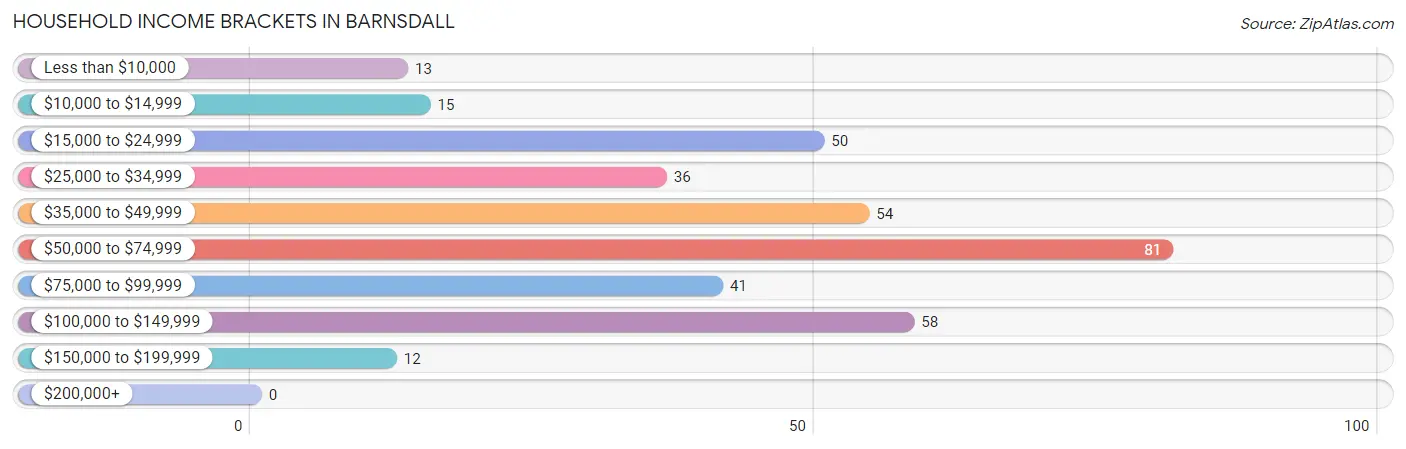
| Income Bracket | # Households | % Households |
| Less than $10,000 | 13 | 3.6% |
| $10,000 to $14,999 | 15 | 4.2% |
| $15,000 to $24,999 | 50 | 13.9% |
| $25,000 to $34,999 | 36 | 10.0% |
| $35,000 to $49,999 | 54 | 15.0% |
| $50,000 to $74,999 | 81 | 22.5% |
| $75,000 to $99,999 | 41 | 11.4% |
| $100,000 to $149,999 | 58 | 16.1% |
| $150,000 to $199,999 | 12 | 3.3% |
| $200,000+ | 0 | 0.0% |
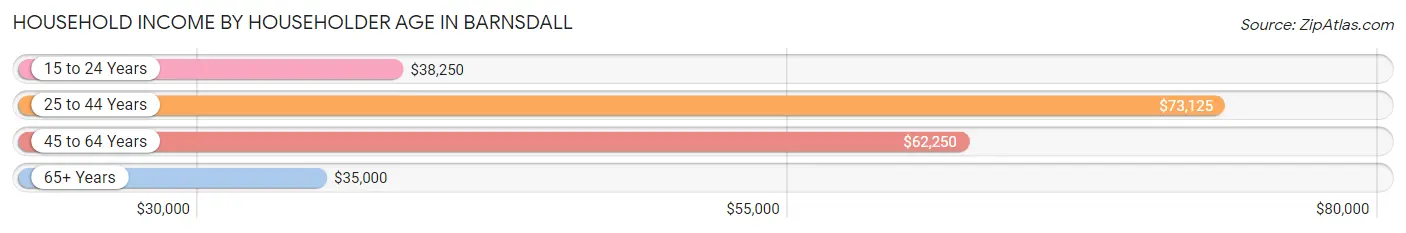
Household Income by Householder Age in Barnsdall
The median household income in Barnsdall is $56,500, with the highest median household income of $73,125 found in the 25 to 44 years age bracket for the primary householder. A total of 107 households (29.7%) fall into this category. Meanwhile, the 65+ years age bracket for the primary householder has the lowest median household income of $35,000, with 124 households (34.4%) in this group.
| Income Bracket | # Households | Median Income |
| 15 to 24 Years | 25 (6.9%) | $38,250 |
| 25 to 44 Years | 107 (29.7%) | $73,125 |
| 45 to 64 Years | 104 (28.9%) | $62,250 |
| 65+ Years | 124 (34.4%) | $35,000 |
| Total | 360 (100.0%) | $56,500 |
Poverty in Barnsdall
Income Below Poverty by Sex and Age in Barnsdall
With 5.5% poverty level for males and 7.7% for females among the residents of Barnsdall, 25 to 34 year old males and 15 year old females are the most vulnerable to poverty, with 10 males (20.0%) and 2 females (28.6%) in their respective age groups living below the poverty level.
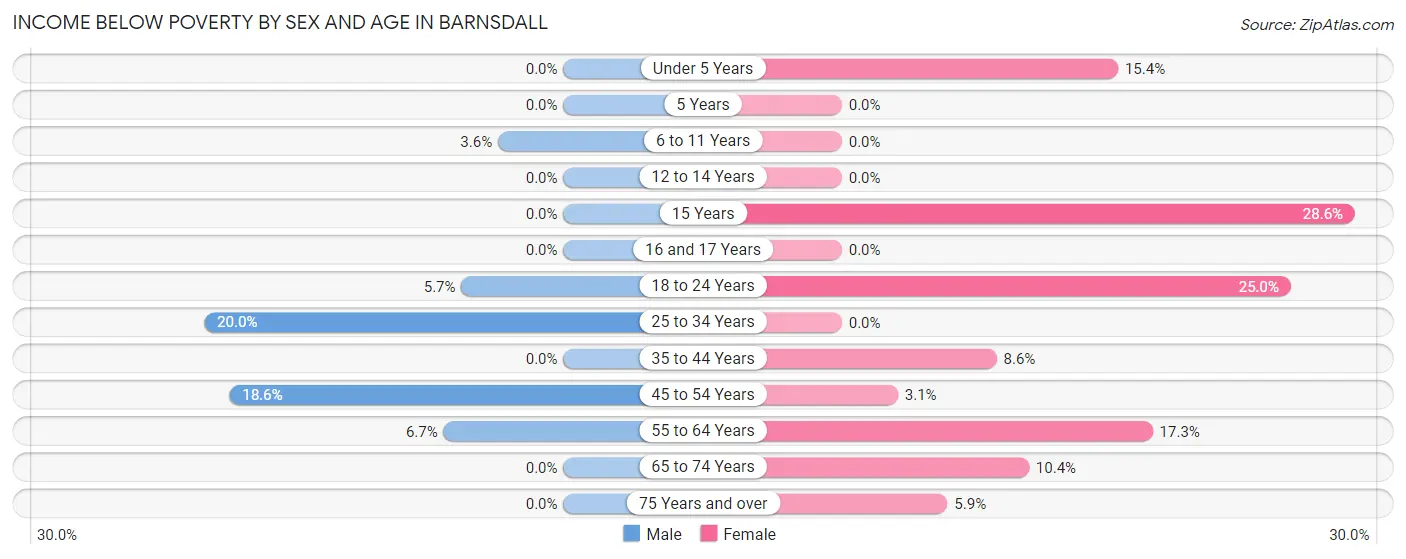
| Age Bracket | Male | Female |
| Under 5 Years | 0 (0.0%) | 2 (15.4%) |
| 5 Years | 0 (0.0%) | 0 (0.0%) |
| 6 to 11 Years | 2 (3.6%) | 0 (0.0%) |
| 12 to 14 Years | 0 (0.0%) | 0 (0.0%) |
| 15 Years | 0 (0.0%) | 2 (28.6%) |
| 16 and 17 Years | 0 (0.0%) | 0 (0.0%) |
| 18 to 24 Years | 5 (5.7%) | 7 (25.0%) |
| 25 to 34 Years | 10 (20.0%) | 0 (0.0%) |
| 35 to 44 Years | 0 (0.0%) | 5 (8.6%) |
| 45 to 54 Years | 8 (18.6%) | 2 (3.1%) |
| 55 to 64 Years | 4 (6.7%) | 9 (17.3%) |
| 65 to 74 Years | 0 (0.0%) | 5 (10.4%) |
| 75 Years and over | 0 (0.0%) | 3 (5.9%) |
| Total | 29 (5.5%) | 35 (7.7%) |
Income Above Poverty by Sex and Age in Barnsdall
According to the poverty statistics in Barnsdall, males aged under 5 years and females aged 5 years are the age groups that are most secure financially, with 100.0% of males and 100.0% of females in these age groups living above the poverty line.
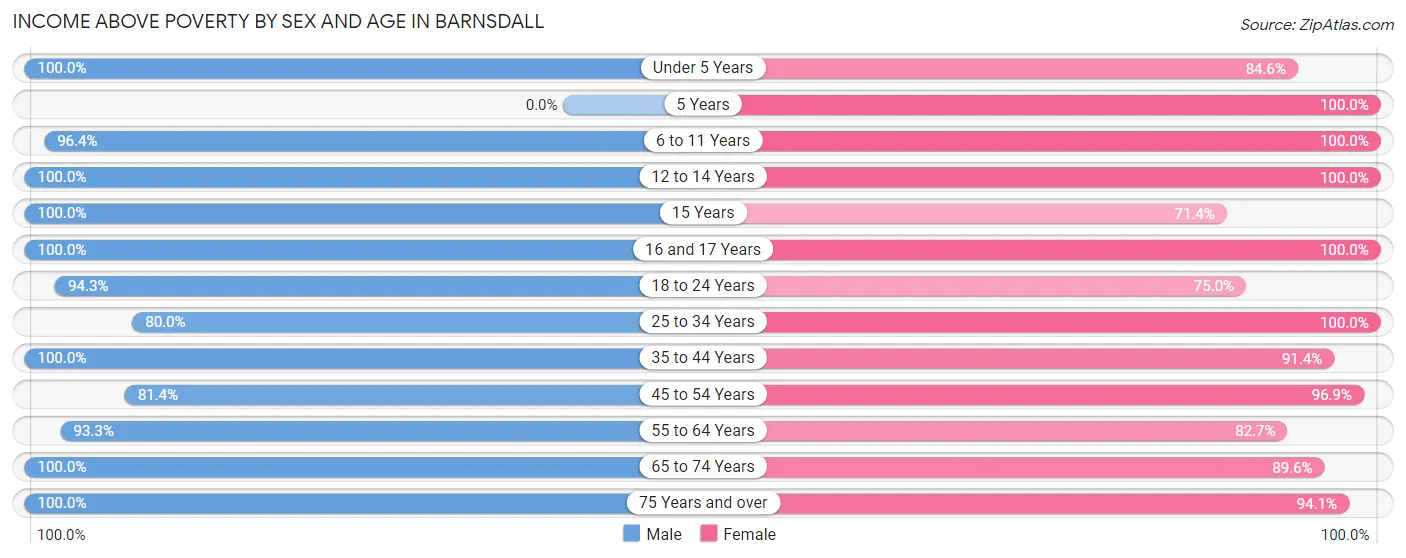
| Age Bracket | Male | Female |
| Under 5 Years | 7 (100.0%) | 11 (84.6%) |
| 5 Years | 0 (0.0%) | 8 (100.0%) |
| 6 to 11 Years | 53 (96.4%) | 57 (100.0%) |
| 12 to 14 Years | 30 (100.0%) | 14 (100.0%) |
| 15 Years | 3 (100.0%) | 5 (71.4%) |
| 16 and 17 Years | 78 (100.0%) | 7 (100.0%) |
| 18 to 24 Years | 83 (94.3%) | 21 (75.0%) |
| 25 to 34 Years | 40 (80.0%) | 49 (100.0%) |
| 35 to 44 Years | 37 (100.0%) | 53 (91.4%) |
| 45 to 54 Years | 35 (81.4%) | 62 (96.9%) |
| 55 to 64 Years | 56 (93.3%) | 43 (82.7%) |
| 65 to 74 Years | 30 (100.0%) | 43 (89.6%) |
| 75 Years and over | 45 (100.0%) | 48 (94.1%) |
| Total | 497 (94.5%) | 421 (92.3%) |
Income Below Poverty Among Married-Couple Families in Barnsdall
The poverty statistics for married-couple families in Barnsdall show that 1.0% or 2 of the total 195 families live below the poverty line. Families with 1 or 2 children have the highest poverty rate of 4.8%, comprising of 2 families. On the other hand, families with no children have the lowest poverty rate of 0.0%, which includes 0 families.
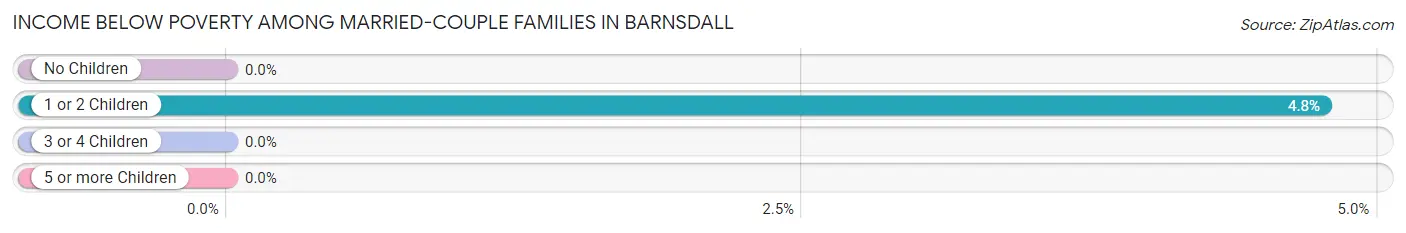
| Children | Above Poverty | Below Poverty |
| No Children | 120 (100.0%) | 0 (0.0%) |
| 1 or 2 Children | 40 (95.2%) | 2 (4.8%) |
| 3 or 4 Children | 33 (100.0%) | 0 (0.0%) |
| 5 or more Children | 0 (0.0%) | 0 (0.0%) |
| Total | 193 (99.0%) | 2 (1.0%) |
Income Below Poverty Among Single-Parent Households in Barnsdall
According to the poverty data in Barnsdall, 33.3% or 3 single-father households and 8.6% or 3 single-mother households are living below the poverty line. Among single-father households, those with 1 or 2 children have the highest poverty rate, with 3 households (50.0%) experiencing poverty. Likewise, among single-mother households, those with no children have the highest poverty rate, with 3 households (14.3%) falling below the poverty line.
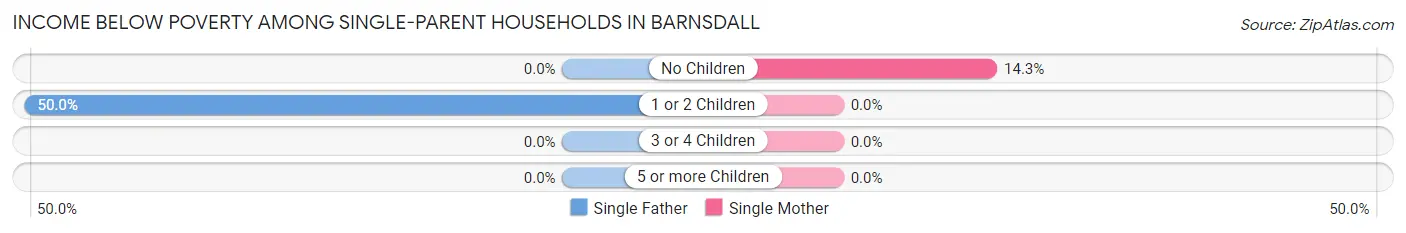
| Children | Single Father | Single Mother |
| No Children | 0 (0.0%) | 3 (14.3%) |
| 1 or 2 Children | 3 (50.0%) | 0 (0.0%) |
| 3 or 4 Children | 0 (0.0%) | 0 (0.0%) |
| 5 or more Children | 0 (0.0%) | 0 (0.0%) |
| Total | 3 (33.3%) | 3 (8.6%) |
Income Below Poverty Among Married-Couple vs Single-Parent Households in Barnsdall
The poverty data for Barnsdall shows that 2 of the married-couple family households (1.0%) and 6 of the single-parent households (13.6%) are living below the poverty level. Within the married-couple family households, those with 1 or 2 children have the highest poverty rate, with 2 households (4.8%) falling below the poverty line. Among the single-parent households, those with 1 or 2 children have the highest poverty rate, with 3 household (20.0%) living below poverty.
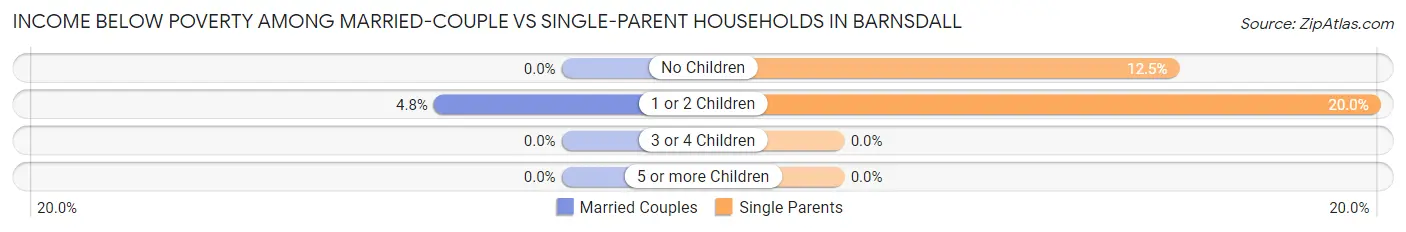
| Children | Married-Couple Families | Single-Parent Households |
| No Children | 0 (0.0%) | 3 (12.5%) |
| 1 or 2 Children | 2 (4.8%) | 3 (20.0%) |
| 3 or 4 Children | 0 (0.0%) | 0 (0.0%) |
| 5 or more Children | 0 (0.0%) | 0 (0.0%) |
| Total | 2 (1.0%) | 6 (13.6%) |
Race in Barnsdall
The most populous races in Barnsdall are White / Caucasian (668 | 65.5%), Native / Alaskan (201 | 19.7%), and Two or more Races (143 | 14.0%).
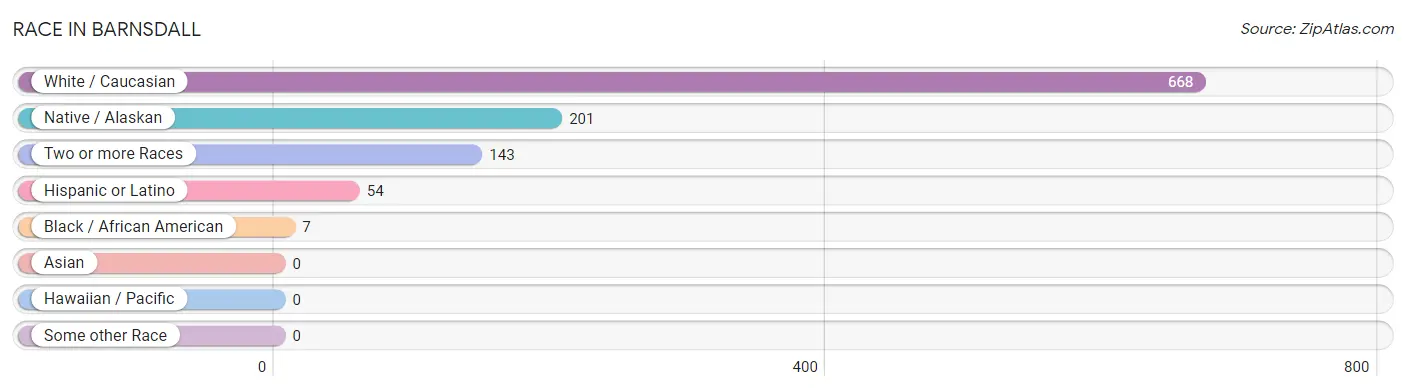
| Race | # Population | % Population |
| Asian | 0 | 0.0% |
| Black / African American | 7 | 0.7% |
| Hawaiian / Pacific | 0 | 0.0% |
| Hispanic or Latino | 54 | 5.3% |
| Native / Alaskan | 201 | 19.7% |
| White / Caucasian | 668 | 65.5% |
| Two or more Races | 143 | 14.0% |
| Some other Race | 0 | 0.0% |
| Total | 1,019 | 100.0% |
Ancestry in Barnsdall
The most populous ancestries reported in Barnsdall are German (163 | 16.0%), Cherokee (150 | 14.7%), Irish (150 | 14.7%), Osage (141 | 13.8%), and American (94 | 9.2%), together accounting for 68.5% of all Barnsdall residents.
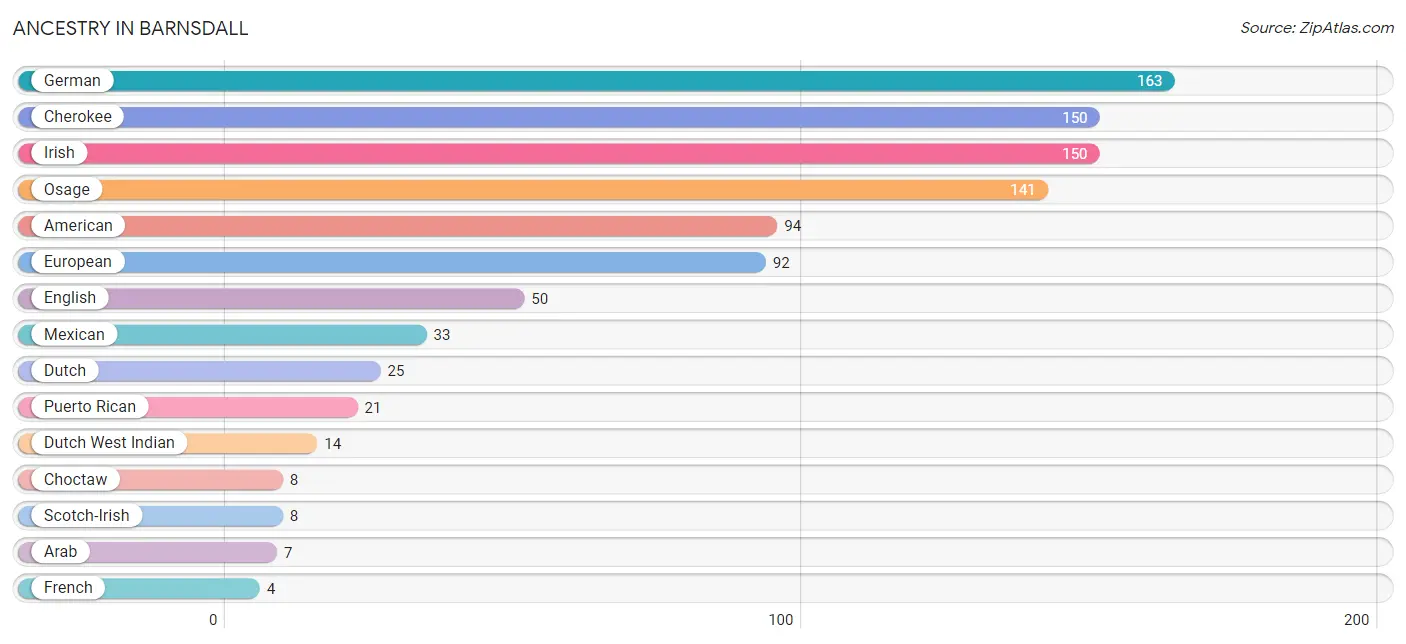
| Ancestry | # Population | % Population |
| American | 94 | 9.2% |
| Apache | 2 | 0.2% |
| Arab | 7 | 0.7% |
| Australian | 3 | 0.3% |
| Cherokee | 150 | 14.7% |
| Choctaw | 8 | 0.8% |
| Creek | 3 | 0.3% |
| Delaware | 2 | 0.2% |
| Dutch | 25 | 2.5% |
| Dutch West Indian | 14 | 1.4% |
| English | 50 | 4.9% |
| European | 92 | 9.0% |
| French | 4 | 0.4% |
| German | 163 | 16.0% |
| Hungarian | 2 | 0.2% |
| Irish | 150 | 14.7% |
| Italian | 2 | 0.2% |
| Mexican | 33 | 3.2% |
| Osage | 141 | 13.8% |
| Puerto Rican | 21 | 2.1% |
| Scotch-Irish | 8 | 0.8% |
| Scottish | 1 | 0.1% |
| Swedish | 3 | 0.3% |
| Welsh | 4 | 0.4% | View All 24 Rows |
Immigrants in Barnsdall
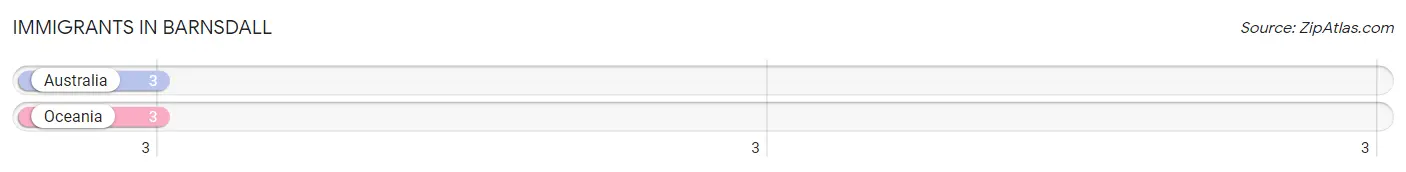
The most numerous immigrant groups reported in Barnsdall came from Australia (3 | 0.3%), and Oceania (3 | 0.3%), together accounting for 0.6% of all Barnsdall residents.
| Immigration Origin | # Population | % Population |
| Australia | 3 | 0.3% |
| Oceania | 3 | 0.3% | View All 2 Rows |
Sex and Age in Barnsdall
Sex and Age in Barnsdall
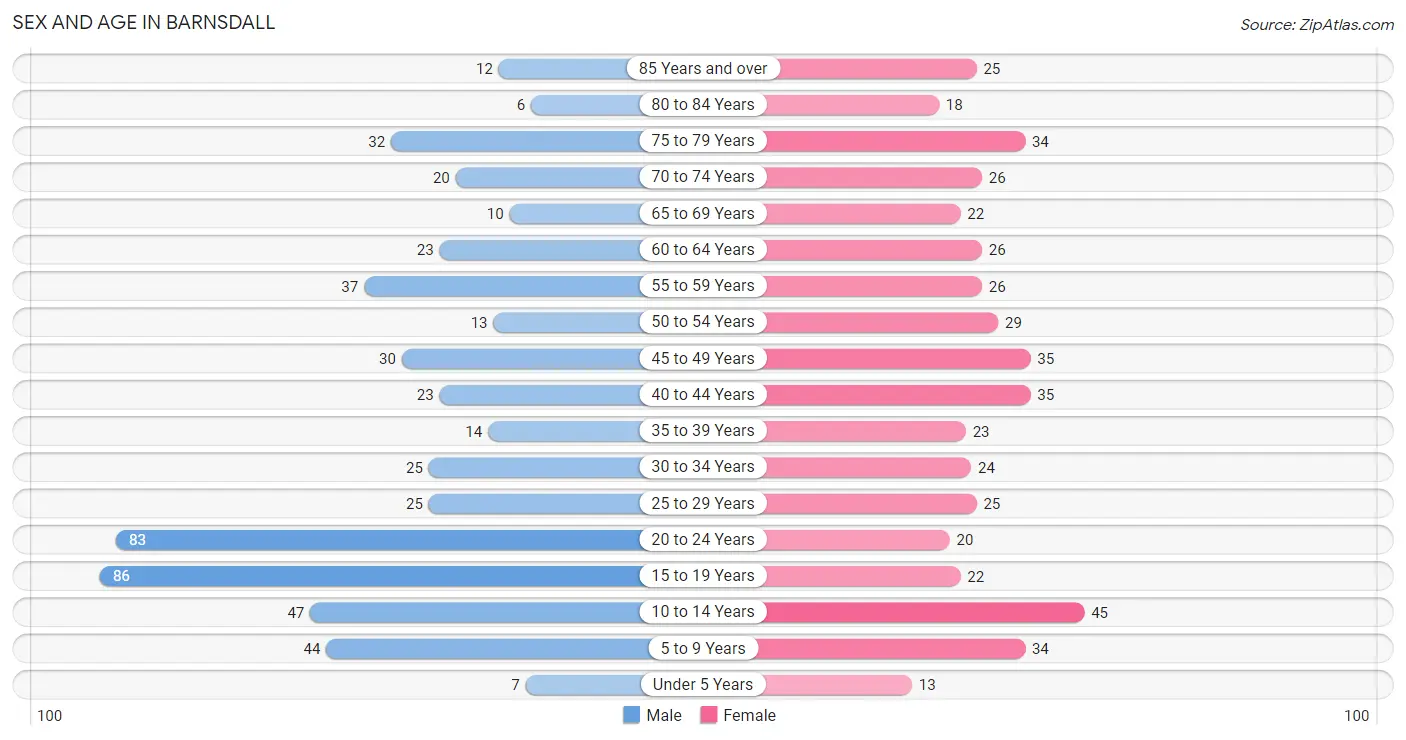
The most populous age groups in Barnsdall are 15 to 19 Years (86 | 16.0%) for men and 10 to 14 Years (45 | 9.3%) for women.
| Age Bracket | Male | Female |
| Under 5 Years | 7 (1.3%) | 13 (2.7%) |
| 5 to 9 Years | 44 (8.2%) | 34 (7.0%) |
| 10 to 14 Years | 47 (8.7%) | 45 (9.3%) |
| 15 to 19 Years | 86 (16.0%) | 22 (4.6%) |
| 20 to 24 Years | 83 (15.5%) | 20 (4.2%) |
| 25 to 29 Years | 25 (4.7%) | 25 (5.2%) |
| 30 to 34 Years | 25 (4.7%) | 24 (5.0%) |
| 35 to 39 Years | 14 (2.6%) | 23 (4.8%) |
| 40 to 44 Years | 23 (4.3%) | 35 (7.3%) |
| 45 to 49 Years | 30 (5.6%) | 35 (7.3%) |
| 50 to 54 Years | 13 (2.4%) | 29 (6.0%) |
| 55 to 59 Years | 37 (6.9%) | 26 (5.4%) |
| 60 to 64 Years | 23 (4.3%) | 26 (5.4%) |
| 65 to 69 Years | 10 (1.9%) | 22 (4.6%) |
| 70 to 74 Years | 20 (3.7%) | 26 (5.4%) |
| 75 to 79 Years | 32 (6.0%) | 34 (7.0%) |
| 80 to 84 Years | 6 (1.1%) | 18 (3.7%) |
| 85 Years and over | 12 (2.2%) | 25 (5.2%) |
| Total | 537 (100.0%) | 482 (100.0%) |
Families and Households in Barnsdall
Median Family Size in Barnsdall
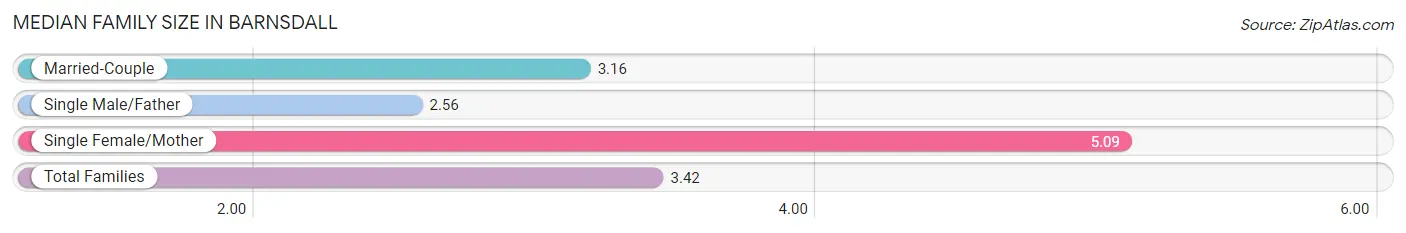
The median family size in Barnsdall is 3.42 persons per family, with single female/mother families (35 | 14.6%) accounting for the largest median family size of 5.09 persons per family. On the other hand, single male/father families (9 | 3.8%) represent the smallest median family size with 2.56 persons per family.
| Family Type | # Families | Family Size |
| Married-Couple | 195 (81.6%) | 3.16 |
| Single Male/Father | 9 (3.8%) | 2.56 |
| Single Female/Mother | 35 (14.6%) | 5.09 |
| Total Families | 239 (100.0%) | 3.42 |
Median Household Size in Barnsdall
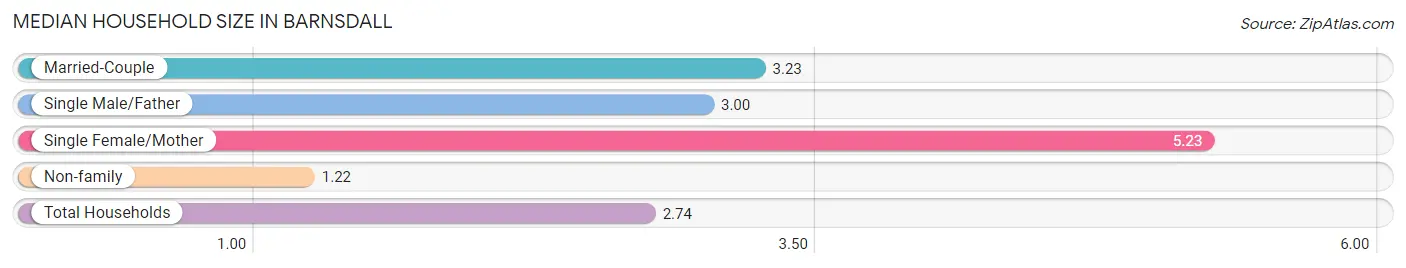
The median household size in Barnsdall is 2.74 persons per household, with single female/mother households (35 | 9.7%) accounting for the largest median household size of 5.23 persons per household. non-family households (121 | 33.6%) represent the smallest median household size with 1.22 persons per household.
| Household Type | # Households | Household Size |
| Married-Couple | 195 (54.2%) | 3.23 |
| Single Male/Father | 9 (2.5%) | 3.00 |
| Single Female/Mother | 35 (9.7%) | 5.23 |
| Non-family | 121 (33.6%) | 1.22 |
| Total Households | 360 (100.0%) | 2.74 |
Household Size by Marriage Status in Barnsdall
Out of a total of 360 households in Barnsdall, 239 (66.4%) are family households, while 121 (33.6%) are nonfamily households. The most numerous type of family households are 2-person households, comprising 119, and the most common type of nonfamily households are 1-person households, comprising 103.
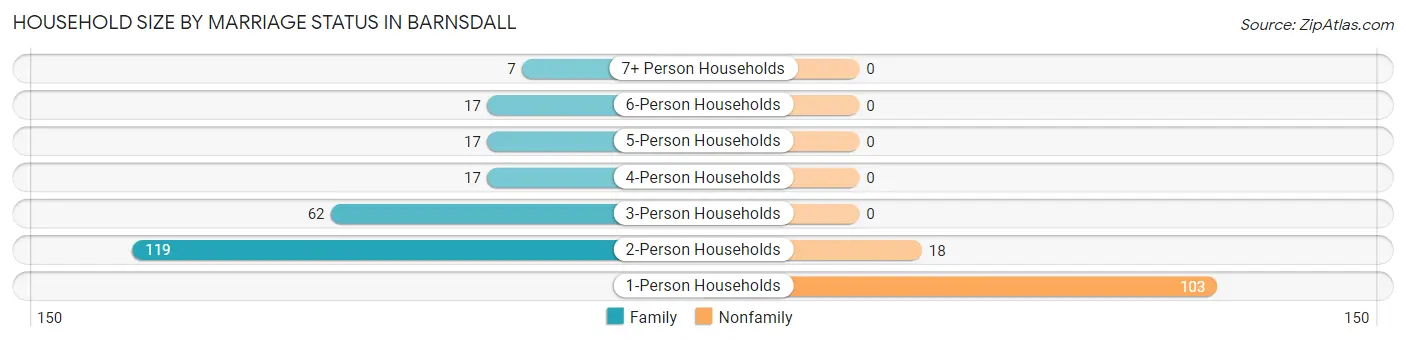
| Household Size | Family Households | Nonfamily Households |
| 1-Person Households | - | 103 (28.6%) |
| 2-Person Households | 119 (33.1%) | 18 (5.0%) |
| 3-Person Households | 62 (17.2%) | 0 (0.0%) |
| 4-Person Households | 17 (4.7%) | 0 (0.0%) |
| 5-Person Households | 17 (4.7%) | 0 (0.0%) |
| 6-Person Households | 17 (4.7%) | 0 (0.0%) |
| 7+ Person Households | 7 (1.9%) | 0 (0.0%) |
| Total | 239 (66.4%) | 121 (33.6%) |
Female Fertility in Barnsdall
Fertility by Age in Barnsdall
Average fertility rate in Barnsdall is 58.0 births per 1,000 women. Women in the age bracket of 20 to 34 years have the highest fertility rate with 116.0 births per 1,000 women. Women in the age bracket of 20 to 34 years acount for 72.7% of all women with births.
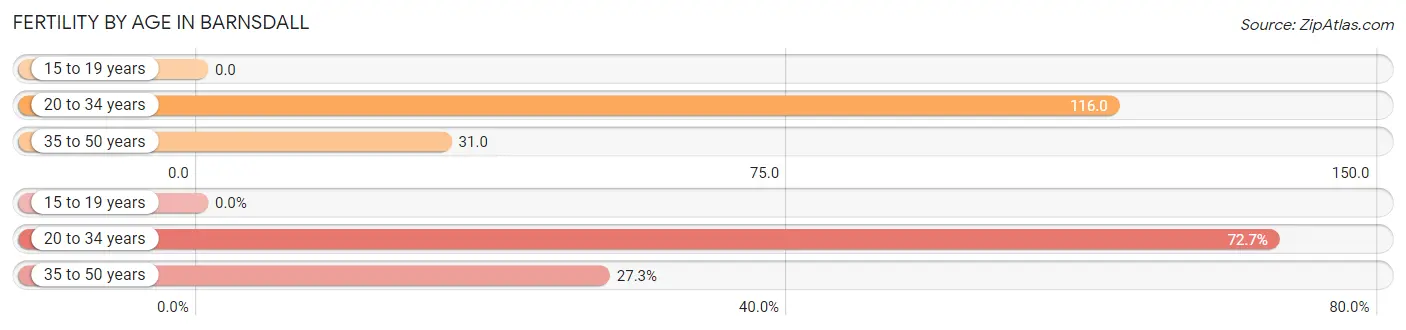
| Age Bracket | Women with Births | Births / 1,000 Women |
| 15 to 19 years | 0 (0.0%) | 0.0 |
| 20 to 34 years | 8 (72.7%) | 116.0 |
| 35 to 50 years | 3 (27.3%) | 31.0 |
| Total | 11 (100.0%) | 58.0 |
Fertility by Age by Marriage Status in Barnsdall
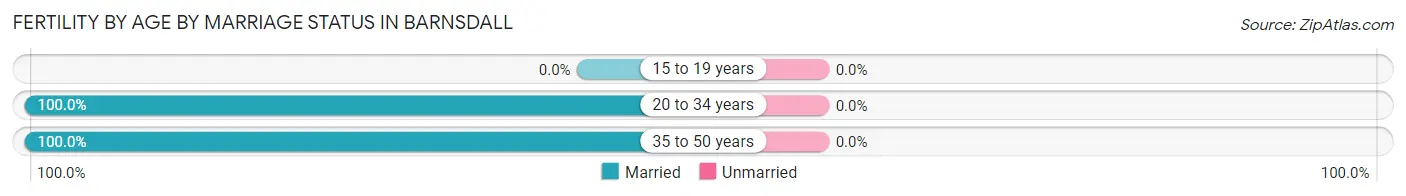
| Age Bracket | Married | Unmarried |
| 15 to 19 years | 0 (0.0%) | 0 (0.0%) |
| 20 to 34 years | 8 (100.0%) | 0 (0.0%) |
| 35 to 50 years | 3 (100.0%) | 0 (0.0%) |
| Total | 11 (100.0%) | 0 (0.0%) |
Fertility by Education in Barnsdall
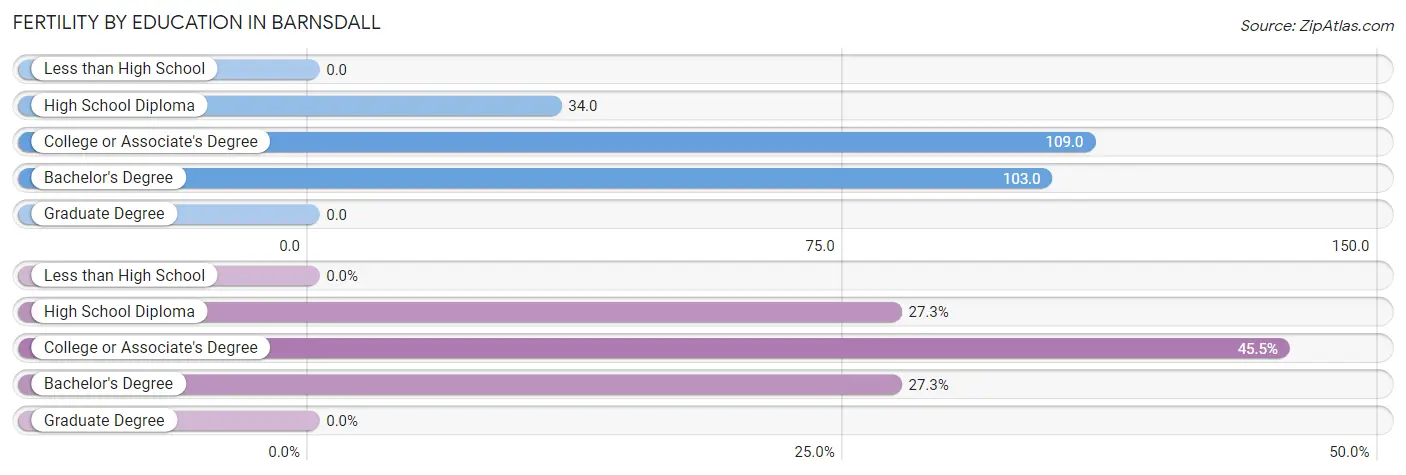
| Educational Attainment | Women with Births | Births / 1,000 Women |
| Less than High School | 0 (0.0%) | 0.0 |
| High School Diploma | 3 (27.3%) | 34.0 |
| College or Associate's Degree | 5 (45.5%) | 109.0 |
| Bachelor's Degree | 3 (27.3%) | 103.0 |
| Graduate Degree | 0 (0.0%) | 0.0 |
| Total | 11 (100.0%) | 58.0 |
Fertility by Education by Marriage Status in Barnsdall
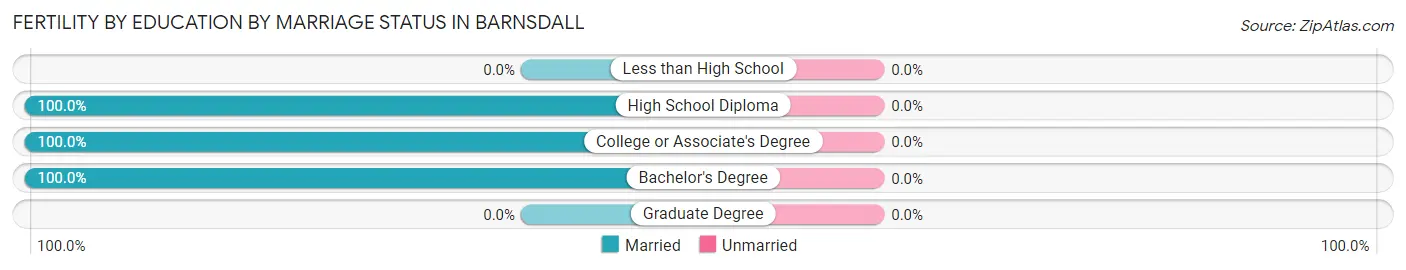
| Educational Attainment | Married | Unmarried |
| Less than High School | 0 (0.0%) | 0 (0.0%) |
| High School Diploma | 3 (100.0%) | 0 (0.0%) |
| College or Associate's Degree | 5 (100.0%) | 0 (0.0%) |
| Bachelor's Degree | 3 (100.0%) | 0 (0.0%) |
| Graduate Degree | 0 (0.0%) | 0 (0.0%) |
| Total | 11 (100.0%) | 0 (0.0%) |
Employment Characteristics in Barnsdall
Employment by Class of Employer in Barnsdall
Among the 400 employed individuals in Barnsdall, private company employees (273 | 68.2%), local government employees (31 | 7.7%), and state government employees (29 | 7.2%) make up the most common classes of employment.
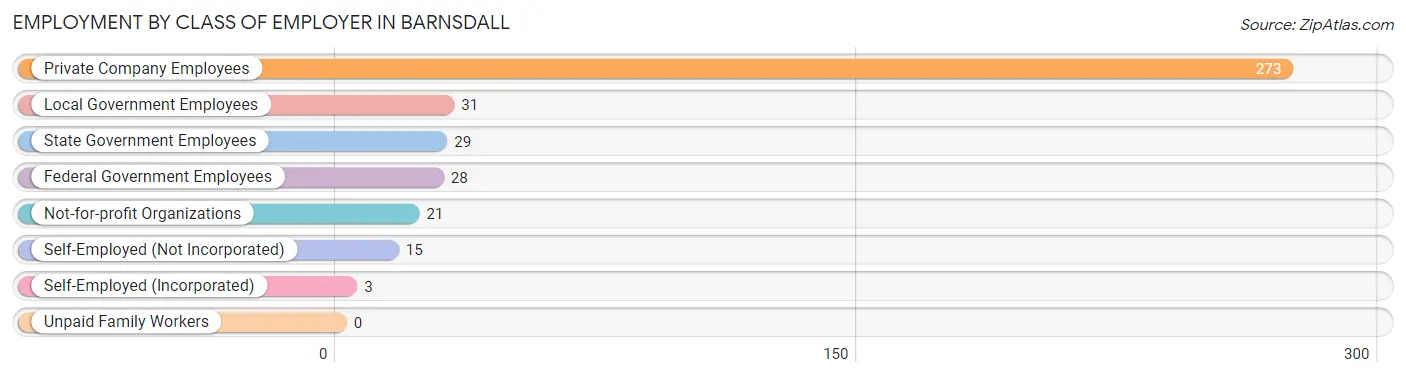
| Employer Class | # Employees | % Employees |
| Private Company Employees | 273 | 68.2% |
| Self-Employed (Incorporated) | 3 | 0.7% |
| Self-Employed (Not Incorporated) | 15 | 3.7% |
| Not-for-profit Organizations | 21 | 5.2% |
| Local Government Employees | 31 | 7.7% |
| State Government Employees | 29 | 7.2% |
| Federal Government Employees | 28 | 7.0% |
| Unpaid Family Workers | 0 | 0.0% |
| Total | 400 | 100.0% |
Employment Status by Age in Barnsdall
According to the labor force statistics for Barnsdall, out of the total population over 16 years of age (819), 53.2% or 436 individuals are in the labor force, with 6.2% or 27 of them unemployed. The age group with the highest labor force participation rate is 20 to 24 years, with 96.1% or 99 individuals in the labor force. Within the labor force, the 16 to 19 years age range has the highest percentage of unemployed individuals, with 42.1% or 8 of them being unemployed.
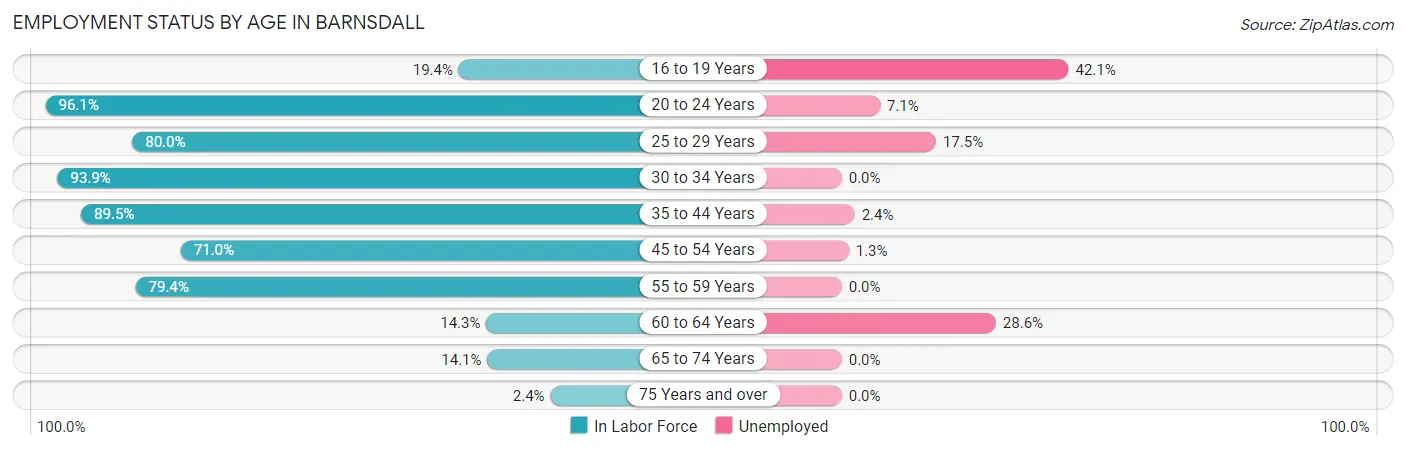
| Age Bracket | In Labor Force | Unemployed |
| 16 to 19 Years | 19 (19.4%) | 8 (42.1%) |
| 20 to 24 Years | 99 (96.1%) | 7 (7.1%) |
| 25 to 29 Years | 40 (80.0%) | 7 (17.5%) |
| 30 to 34 Years | 46 (93.9%) | 0 (0.0%) |
| 35 to 44 Years | 85 (89.5%) | 2 (2.4%) |
| 45 to 54 Years | 76 (71.0%) | 1 (1.3%) |
| 55 to 59 Years | 50 (79.4%) | 0 (0.0%) |
| 60 to 64 Years | 7 (14.3%) | 2 (28.6%) |
| 65 to 74 Years | 11 (14.1%) | 0 (0.0%) |
| 75 Years and over | 3 (2.4%) | 0 (0.0%) |
| Total | 436 (53.2%) | 27 (6.2%) |
Employment Status by Educational Attainment in Barnsdall
According to labor force statistics for Barnsdall, 73.6% of individuals (304) out of the total population between 25 and 64 years of age (413) are in the labor force, with 3.9% or 12 of them being unemployed. The group with the highest labor force participation rate are those with the educational attainment of bachelor's degree or higher, with 92.2% or 59 individuals in the labor force. Within the labor force, individuals with less than high school education have the highest percentage of unemployment, with 16.7% or 3 of them being unemployed.
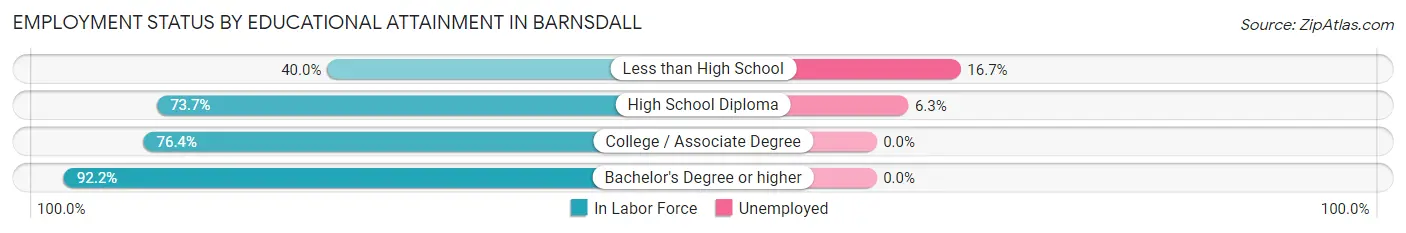
| Educational Attainment | In Labor Force | Unemployed |
| Less than High School | 18 (40.0%) | 8 (16.7%) |
| High School Diploma | 143 (73.7%) | 12 (6.3%) |
| College / Associate Degree | 84 (76.4%) | 0 (0.0%) |
| Bachelor's Degree or higher | 59 (92.2%) | 0 (0.0%) |
| Total | 304 (73.6%) | 16 (3.9%) |
Employment Occupations by Sex in Barnsdall
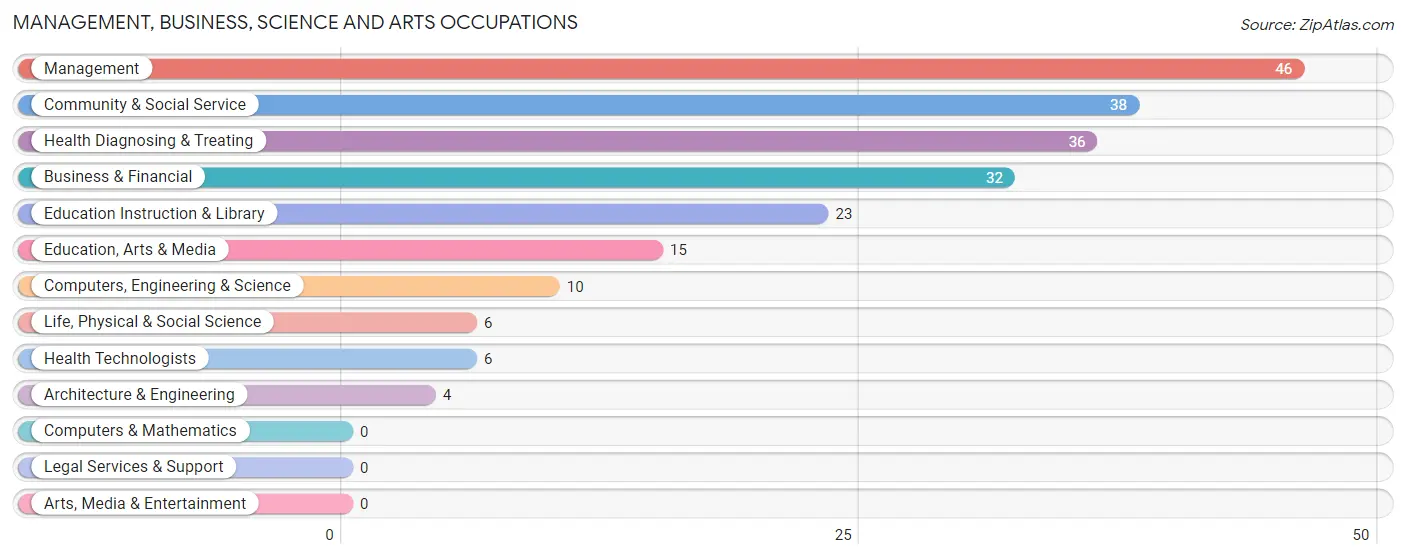
Management, Business, Science and Arts Occupations
The most common Management, Business, Science and Arts occupations in Barnsdall are Management (46 | 11.3%), Community & Social Service (38 | 9.3%), Health Diagnosing & Treating (36 | 8.8%), Business & Financial (32 | 7.8%), and Education Instruction & Library (23 | 5.6%).
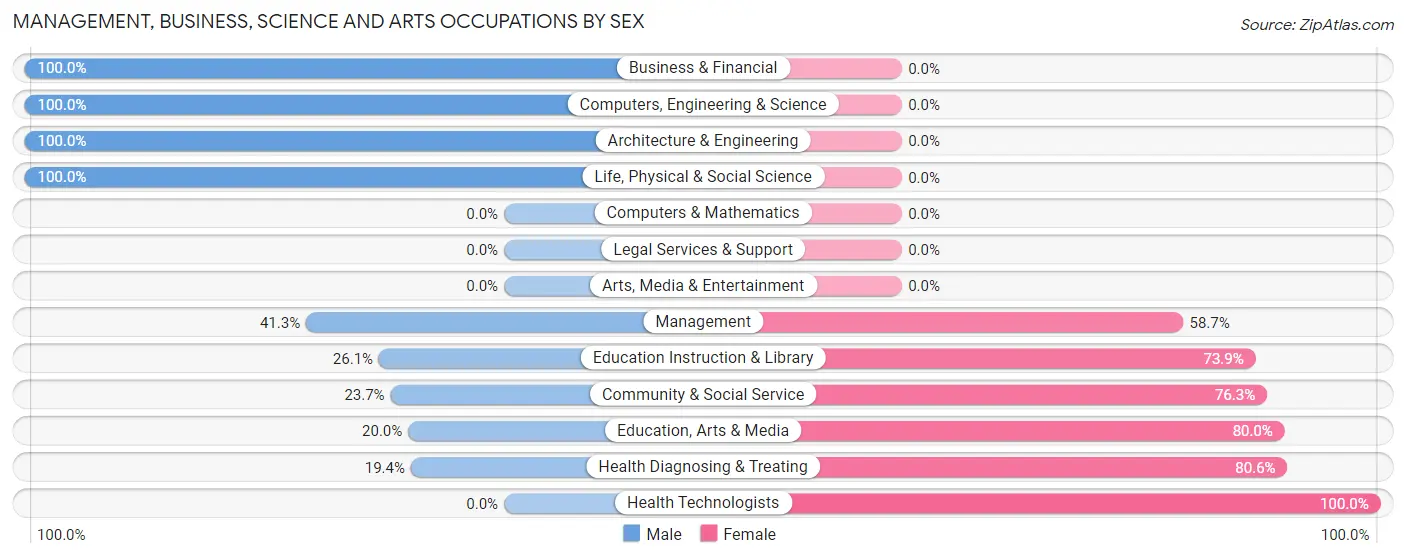
Management, Business, Science and Arts Occupations by Sex
Within the Management, Business, Science and Arts occupations in Barnsdall, the most male-oriented occupations are Business & Financial (100.0%), Computers, Engineering & Science (100.0%), and Architecture & Engineering (100.0%), while the most female-oriented occupations are Health Technologists (100.0%), Health Diagnosing & Treating (80.6%), and Education, Arts & Media (80.0%).
| Occupation | Male | Female |
| Management | 19 (41.3%) | 27 (58.7%) |
| Business & Financial | 32 (100.0%) | 0 (0.0%) |
| Computers, Engineering & Science | 10 (100.0%) | 0 (0.0%) |
| Computers & Mathematics | 0 (0.0%) | 0 (0.0%) |
| Architecture & Engineering | 4 (100.0%) | 0 (0.0%) |
| Life, Physical & Social Science | 6 (100.0%) | 0 (0.0%) |
| Community & Social Service | 9 (23.7%) | 29 (76.3%) |
| Education, Arts & Media | 3 (20.0%) | 12 (80.0%) |
| Legal Services & Support | 0 (0.0%) | 0 (0.0%) |
| Education Instruction & Library | 6 (26.1%) | 17 (73.9%) |
| Arts, Media & Entertainment | 0 (0.0%) | 0 (0.0%) |
| Health Diagnosing & Treating | 7 (19.4%) | 29 (80.6%) |
| Health Technologists | 0 (0.0%) | 6 (100.0%) |
| Total (Category) | 77 (47.5%) | 85 (52.5%) |
| Total (Overall) | 234 (57.2%) | 175 (42.8%) |
Services Occupations
The most common Services occupations in Barnsdall are Food Preparation & Serving (20 | 4.9%), Cleaning & Maintenance (20 | 4.9%), Personal Care & Service (20 | 4.9%), Security & Protection (16 | 3.9%), and Firefighting & Prevention (16 | 3.9%).

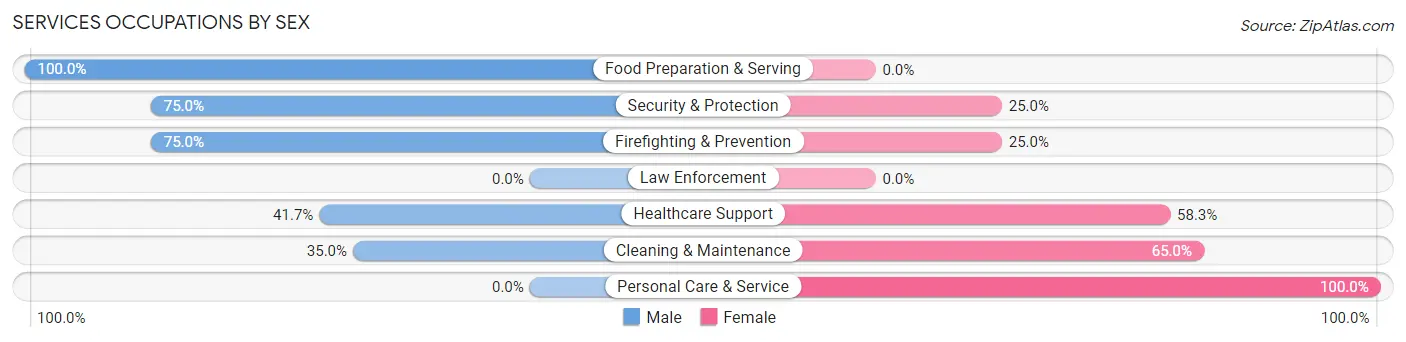
Services Occupations by Sex
Within the Services occupations in Barnsdall, the most male-oriented occupations are Food Preparation & Serving (100.0%), Security & Protection (75.0%), and Firefighting & Prevention (75.0%), while the most female-oriented occupations are Personal Care & Service (100.0%), Cleaning & Maintenance (65.0%), and Healthcare Support (58.3%).
| Occupation | Male | Female |
| Healthcare Support | 5 (41.7%) | 7 (58.3%) |
| Security & Protection | 12 (75.0%) | 4 (25.0%) |
| Firefighting & Prevention | 12 (75.0%) | 4 (25.0%) |
| Law Enforcement | 0 (0.0%) | 0 (0.0%) |
| Food Preparation & Serving | 20 (100.0%) | 0 (0.0%) |
| Cleaning & Maintenance | 7 (35.0%) | 13 (65.0%) |
| Personal Care & Service | 0 (0.0%) | 20 (100.0%) |
| Total (Category) | 44 (50.0%) | 44 (50.0%) |
| Total (Overall) | 234 (57.2%) | 175 (42.8%) |
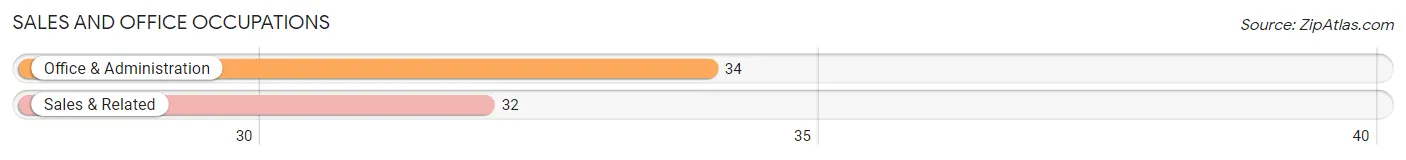
Sales and Office Occupations
The most common Sales and Office occupations in Barnsdall are Office & Administration (34 | 8.3%), and Sales & Related (32 | 7.8%).
Sales and Office Occupations by Sex
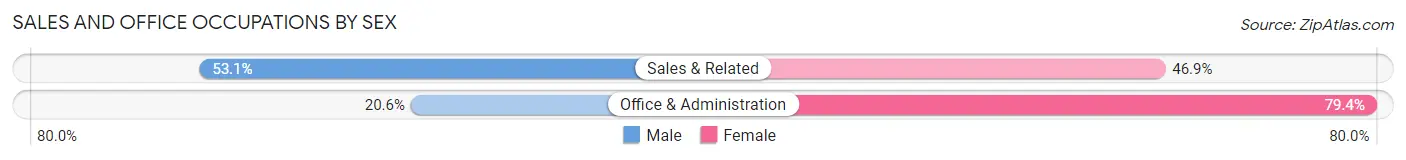
| Occupation | Male | Female |
| Sales & Related | 17 (53.1%) | 15 (46.9%) |
| Office & Administration | 7 (20.6%) | 27 (79.4%) |
| Total (Category) | 24 (36.4%) | 42 (63.6%) |
| Total (Overall) | 234 (57.2%) | 175 (42.8%) |
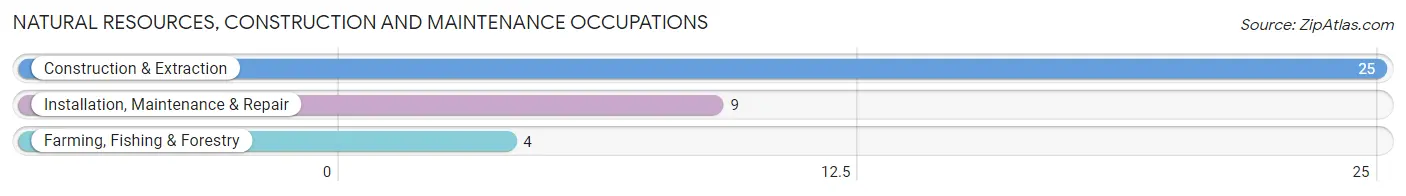
Natural Resources, Construction and Maintenance Occupations
The most common Natural Resources, Construction and Maintenance occupations in Barnsdall are Construction & Extraction (25 | 6.1%), Installation, Maintenance & Repair (9 | 2.2%), and Farming, Fishing & Forestry (4 | 1.0%).
Natural Resources, Construction and Maintenance Occupations by Sex
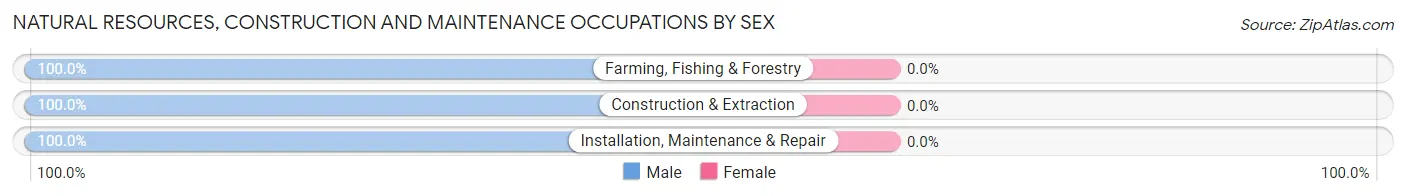
| Occupation | Male | Female |
| Farming, Fishing & Forestry | 4 (100.0%) | 0 (0.0%) |
| Construction & Extraction | 25 (100.0%) | 0 (0.0%) |
| Installation, Maintenance & Repair | 9 (100.0%) | 0 (0.0%) |
| Total (Category) | 38 (100.0%) | 0 (0.0%) |
| Total (Overall) | 234 (57.2%) | 175 (42.8%) |
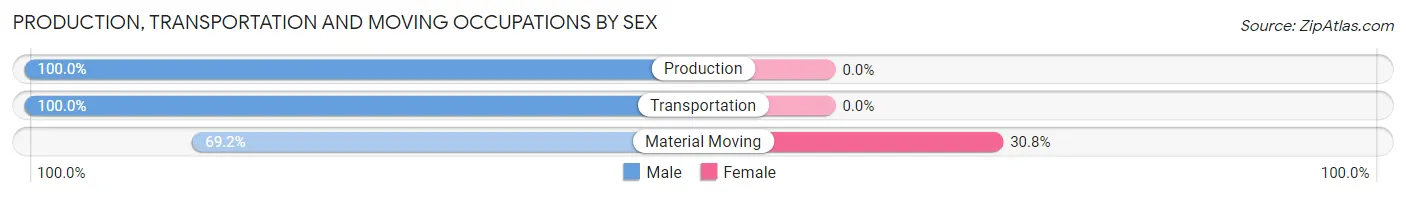
Production, Transportation and Moving Occupations
The most common Production, Transportation and Moving occupations in Barnsdall are Production (34 | 8.3%), Material Moving (13 | 3.2%), and Transportation (8 | 2.0%).
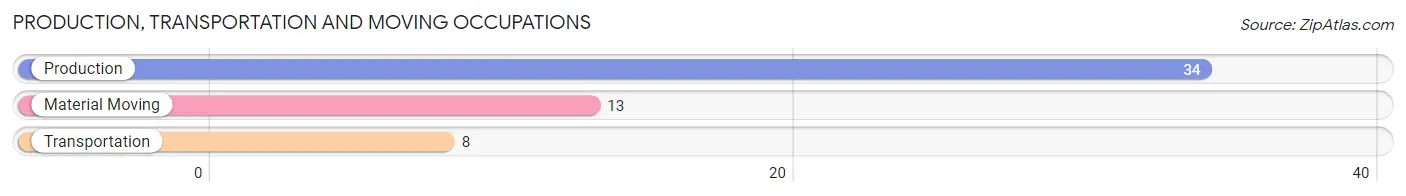
Production, Transportation and Moving Occupations by Sex
| Occupation | Male | Female |
| Production | 34 (100.0%) | 0 (0.0%) |
| Transportation | 8 (100.0%) | 0 (0.0%) |
| Material Moving | 9 (69.2%) | 4 (30.8%) |
| Total (Category) | 51 (92.7%) | 4 (7.3%) |
| Total (Overall) | 234 (57.2%) | 175 (42.8%) |
Employment Industries by Sex in Barnsdall
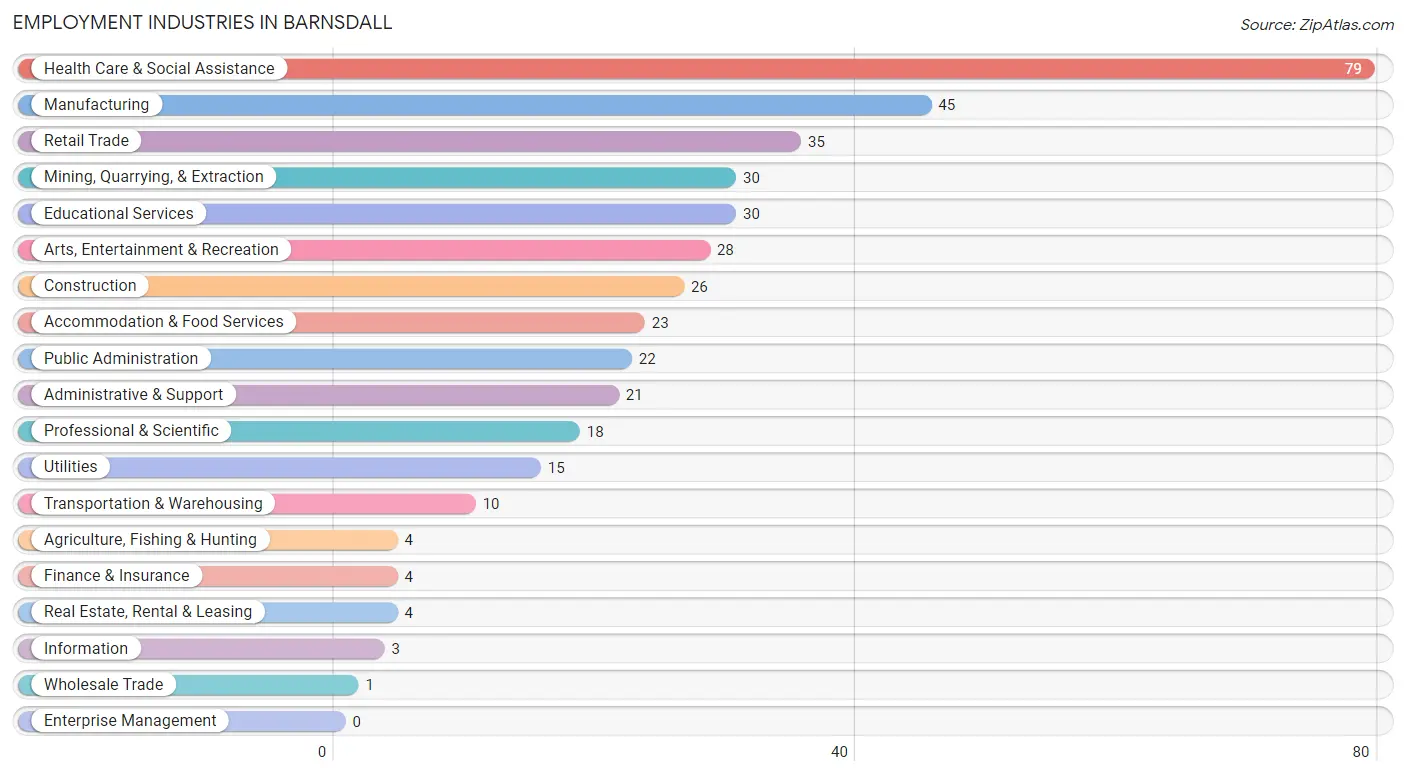
Employment Industries in Barnsdall
The major employment industries in Barnsdall include Health Care & Social Assistance (79 | 19.3%), Manufacturing (45 | 11.0%), Retail Trade (35 | 8.6%), Mining, Quarrying, & Extraction (30 | 7.3%), and Educational Services (30 | 7.3%).
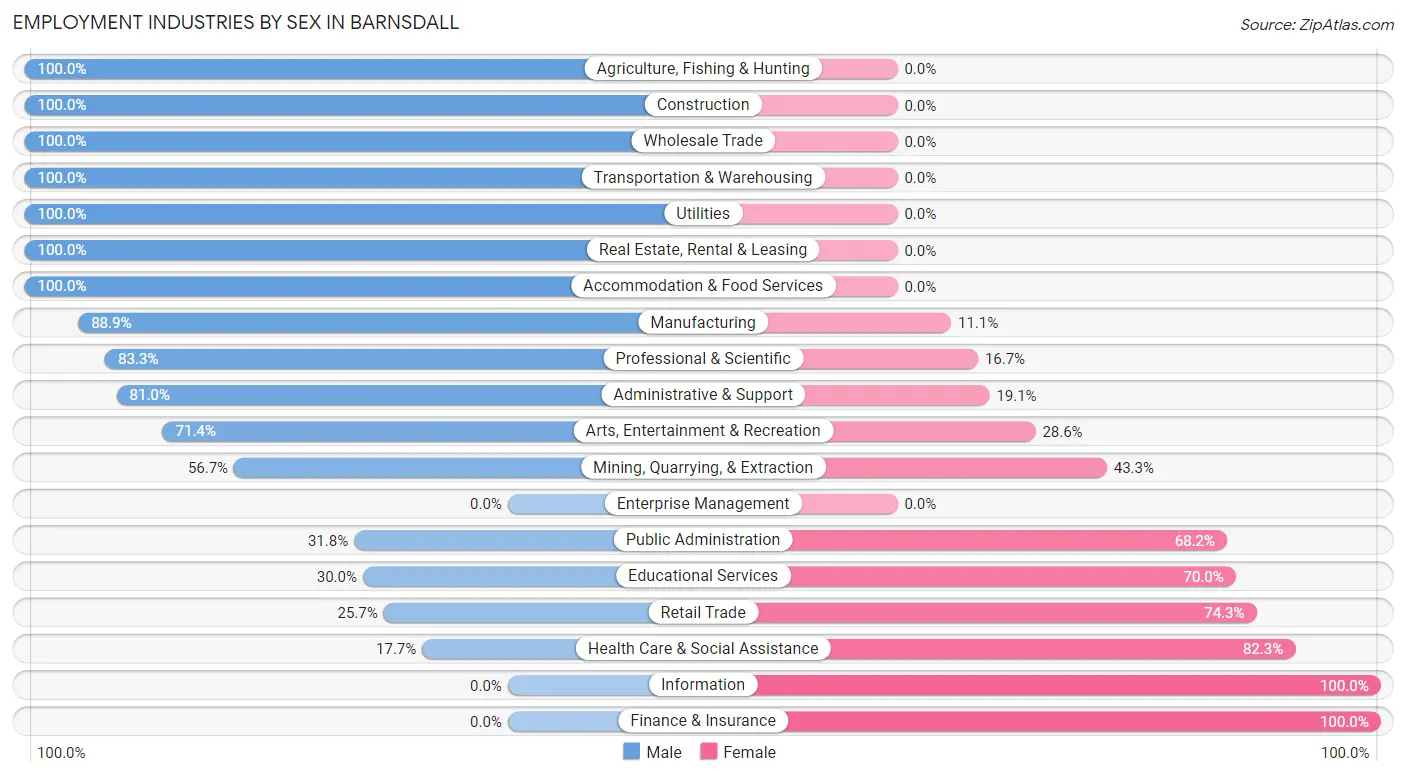
Employment Industries by Sex in Barnsdall
The Barnsdall industries that see more men than women are Agriculture, Fishing & Hunting (100.0%), Construction (100.0%), and Wholesale Trade (100.0%), whereas the industries that tend to have a higher number of women are Information (100.0%), Finance & Insurance (100.0%), and Health Care & Social Assistance (82.3%).
| Industry | Male | Female |
| Agriculture, Fishing & Hunting | 4 (100.0%) | 0 (0.0%) |
| Mining, Quarrying, & Extraction | 17 (56.7%) | 13 (43.3%) |
| Construction | 26 (100.0%) | 0 (0.0%) |
| Manufacturing | 40 (88.9%) | 5 (11.1%) |
| Wholesale Trade | 1 (100.0%) | 0 (0.0%) |
| Retail Trade | 9 (25.7%) | 26 (74.3%) |
| Transportation & Warehousing | 10 (100.0%) | 0 (0.0%) |
| Utilities | 15 (100.0%) | 0 (0.0%) |
| Information | 0 (0.0%) | 3 (100.0%) |
| Finance & Insurance | 0 (0.0%) | 4 (100.0%) |
| Real Estate, Rental & Leasing | 4 (100.0%) | 0 (0.0%) |
| Professional & Scientific | 15 (83.3%) | 3 (16.7%) |
| Enterprise Management | 0 (0.0%) | 0 (0.0%) |
| Administrative & Support | 17 (80.9%) | 4 (19.1%) |
| Educational Services | 9 (30.0%) | 21 (70.0%) |
| Health Care & Social Assistance | 14 (17.7%) | 65 (82.3%) |
| Arts, Entertainment & Recreation | 20 (71.4%) | 8 (28.6%) |
| Accommodation & Food Services | 23 (100.0%) | 0 (0.0%) |
| Public Administration | 7 (31.8%) | 15 (68.2%) |
| Total | 234 (57.2%) | 175 (42.8%) |
Education in Barnsdall
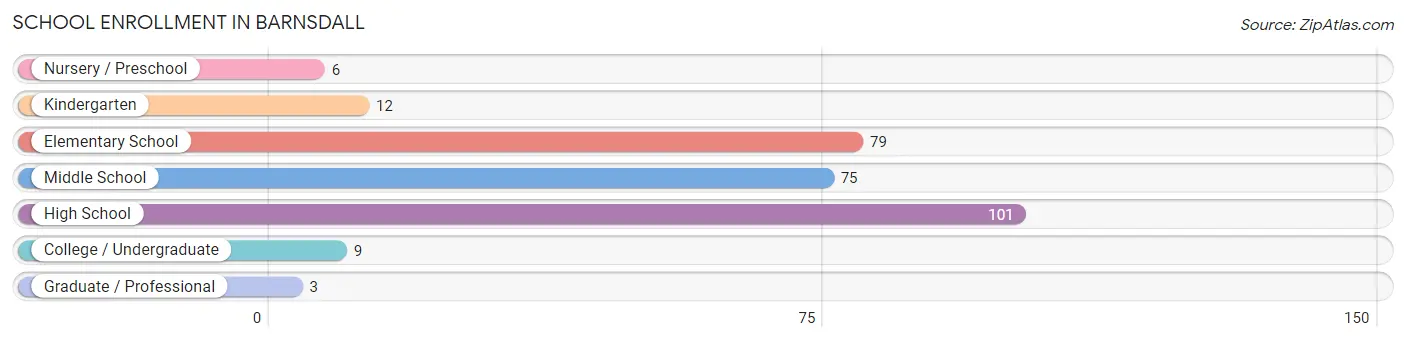
School Enrollment in Barnsdall
The most common levels of schooling among the 285 students in Barnsdall are high school (101 | 35.4%), elementary school (79 | 27.7%), and middle school (75 | 26.3%).
| School Level | # Students | % Students |
| Nursery / Preschool | 6 | 2.1% |
| Kindergarten | 12 | 4.2% |
| Elementary School | 79 | 27.7% |
| Middle School | 75 | 26.3% |
| High School | 101 | 35.4% |
| College / Undergraduate | 9 | 3.2% |
| Graduate / Professional | 3 | 1.1% |
| Total | 285 | 100.0% |
School Enrollment by Age by Funding Source in Barnsdall
Out of a total of 285 students who are enrolled in schools in Barnsdall, 12 (4.2%) attend a private institution, while the remaining 273 (95.8%) are enrolled in public schools. The age group of 35 years and over has the highest likelihood of being enrolled in private schools, with 7 (70.0% in the age bracket) enrolled. Conversely, the age group of 3 to 4 year olds has the lowest likelihood of being enrolled in a private school, with 2 (100.0% in the age bracket) attending a public institution.
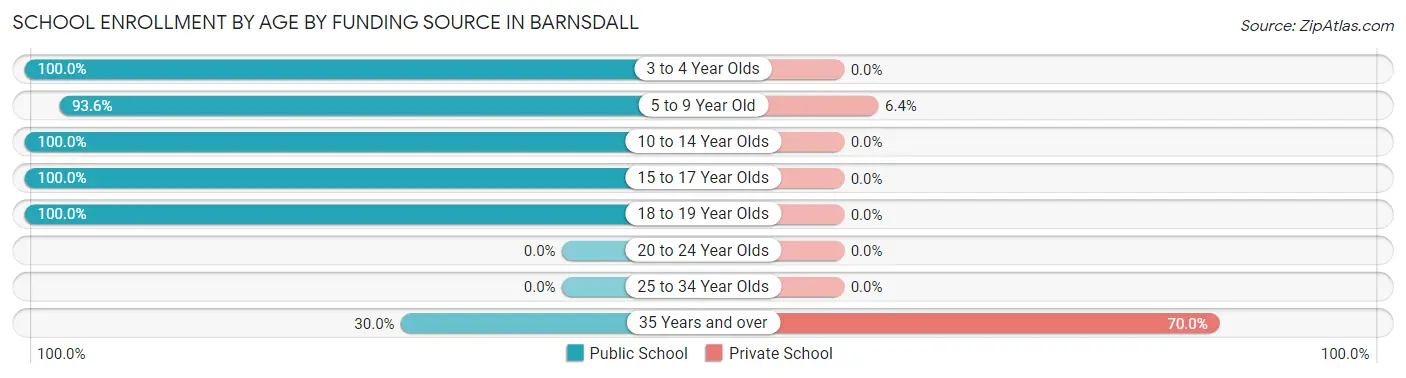
| Age Bracket | Public School | Private School |
| 3 to 4 Year Olds | 2 (100.0%) | 0 (0.0%) |
| 5 to 9 Year Old | 73 (93.6%) | 5 (6.4%) |
| 10 to 14 Year Olds | 92 (100.0%) | 0 (0.0%) |
| 15 to 17 Year Olds | 95 (100.0%) | 0 (0.0%) |
| 18 to 19 Year Olds | 8 (100.0%) | 0 (0.0%) |
| 20 to 24 Year Olds | 0 (0.0%) | 0 (0.0%) |
| 25 to 34 Year Olds | 0 (0.0%) | 0 (0.0%) |
| 35 Years and over | 3 (30.0%) | 7 (70.0%) |
| Total | 273 (95.8%) | 12 (4.2%) |
Educational Attainment by Field of Study in Barnsdall
Education (44 | 37.6%), business (38 | 32.5%), literature & languages (10 | 8.6%), psychology (5 | 4.3%), and arts & humanities (5 | 4.3%) are the most common fields of study among 117 individuals in Barnsdall who have obtained a bachelor's degree or higher.
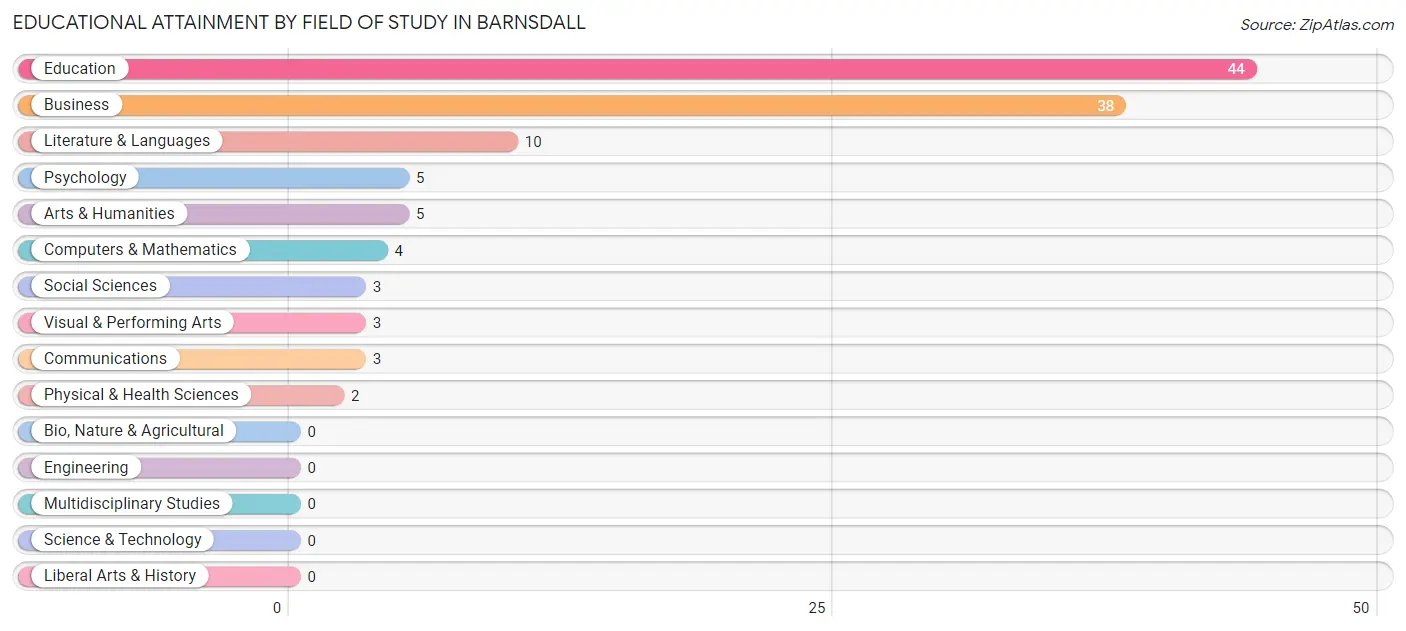
| Field of Study | # Graduates | % Graduates |
| Computers & Mathematics | 4 | 3.4% |
| Bio, Nature & Agricultural | 0 | 0.0% |
| Physical & Health Sciences | 2 | 1.7% |
| Psychology | 5 | 4.3% |
| Social Sciences | 3 | 2.6% |
| Engineering | 0 | 0.0% |
| Multidisciplinary Studies | 0 | 0.0% |
| Science & Technology | 0 | 0.0% |
| Business | 38 | 32.5% |
| Education | 44 | 37.6% |
| Literature & Languages | 10 | 8.6% |
| Liberal Arts & History | 0 | 0.0% |
| Visual & Performing Arts | 3 | 2.6% |
| Communications | 3 | 2.6% |
| Arts & Humanities | 5 | 4.3% |
| Total | 117 | 100.0% |
Transportation & Commute in Barnsdall
Vehicle Availability by Sex in Barnsdall
The most prevalent vehicle ownership categories in Barnsdall are males with 2 vehicles (121, accounting for 53.1%) and females with 2 vehicles (84, making up 70.4%).
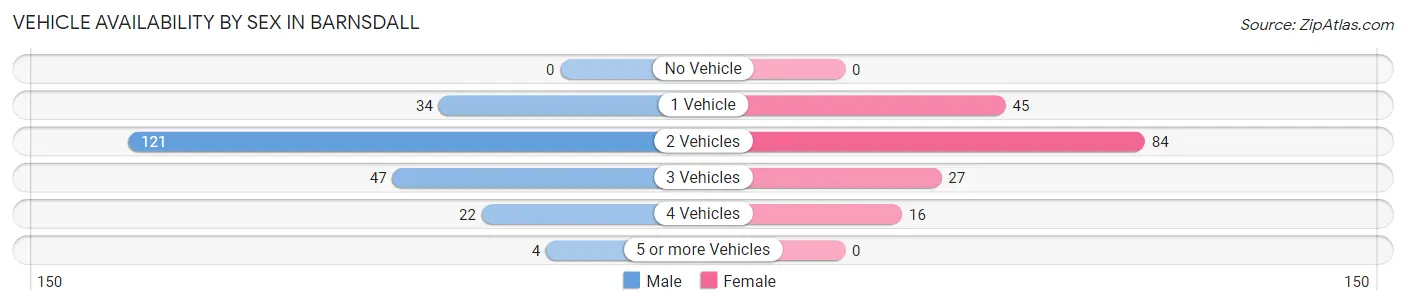
| Vehicles Available | Male | Female |
| No Vehicle | 0 (0.0%) | 0 (0.0%) |
| 1 Vehicle | 34 (14.9%) | 45 (26.2%) |
| 2 Vehicles | 121 (53.1%) | 84 (48.8%) |
| 3 Vehicles | 47 (20.6%) | 27 (15.7%) |
| 4 Vehicles | 22 (9.7%) | 16 (9.3%) |
| 5 or more Vehicles | 4 (1.8%) | 0 (0.0%) |
| Total | 228 (100.0%) | 172 (100.0%) |
Commute Time in Barnsdall
The most frequently occuring commute durations in Barnsdall are less than 5 minutes (100 commuters, 25.9%), 5 to 9 minutes (65 commuters, 16.8%), and 30 to 34 minutes (54 commuters, 14.0%).
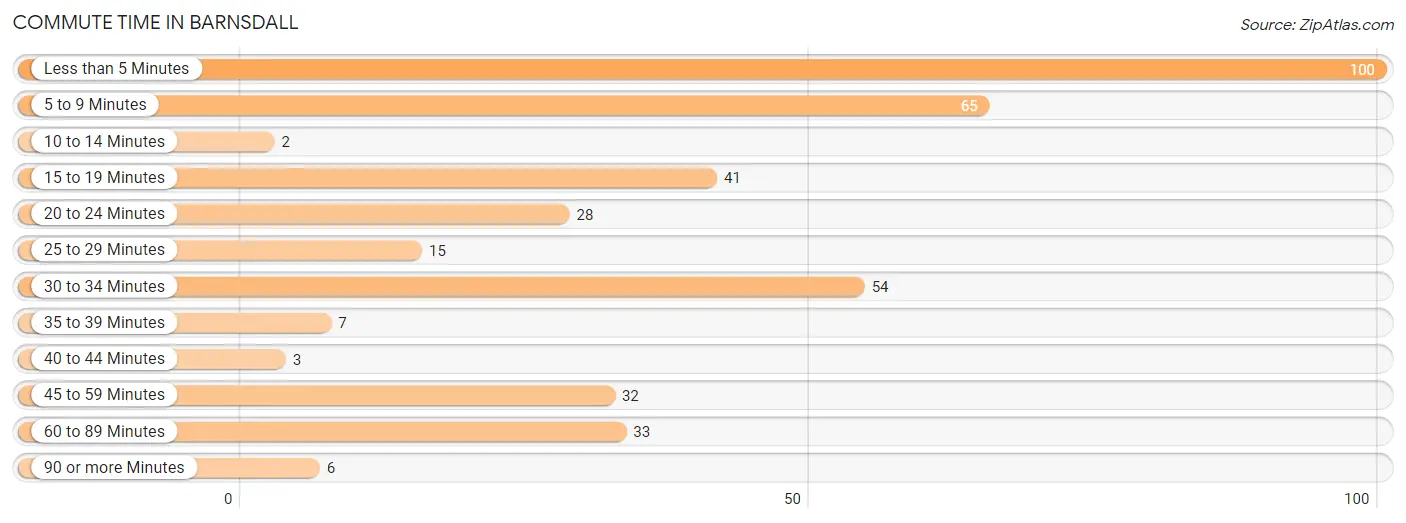
| Commute Time | # Commuters | % Commuters |
| Less than 5 Minutes | 100 | 25.9% |
| 5 to 9 Minutes | 65 | 16.8% |
| 10 to 14 Minutes | 2 | 0.5% |
| 15 to 19 Minutes | 41 | 10.6% |
| 20 to 24 Minutes | 28 | 7.2% |
| 25 to 29 Minutes | 15 | 3.9% |
| 30 to 34 Minutes | 54 | 14.0% |
| 35 to 39 Minutes | 7 | 1.8% |
| 40 to 44 Minutes | 3 | 0.8% |
| 45 to 59 Minutes | 32 | 8.3% |
| 60 to 89 Minutes | 33 | 8.6% |
| 90 or more Minutes | 6 | 1.5% |
Commute Time by Sex in Barnsdall
The most common commute times in Barnsdall are less than 5 minutes (63 commuters, 28.2%) for males and less than 5 minutes (37 commuters, 22.7%) for females.
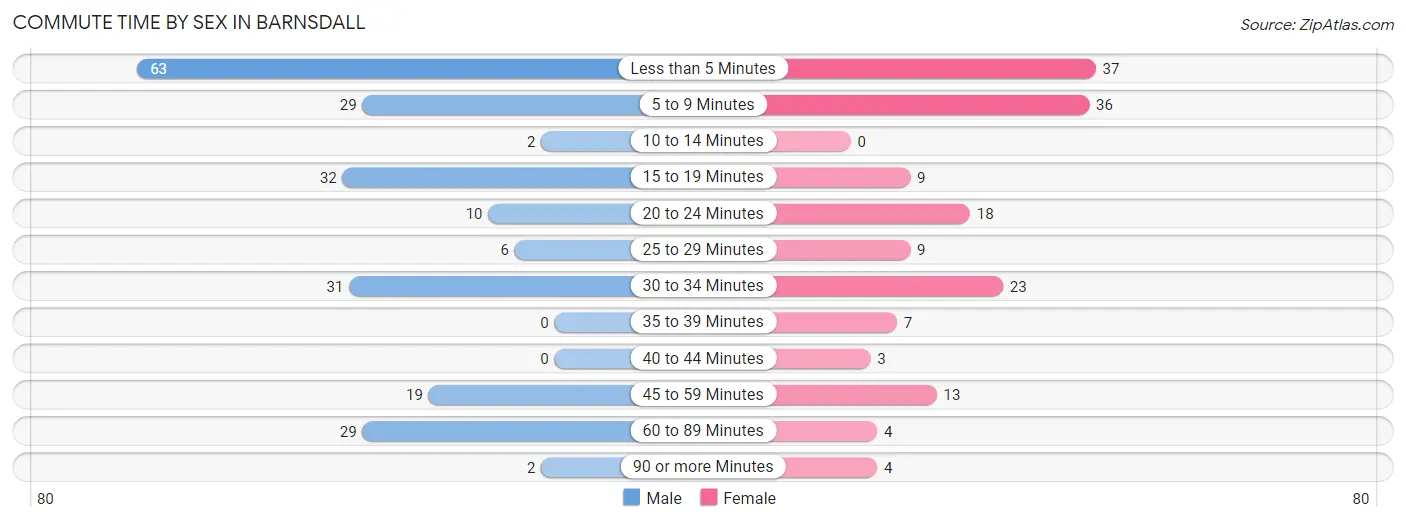
| Commute Time | Male | Female |
| Less than 5 Minutes | 63 (28.2%) | 37 (22.7%) |
| 5 to 9 Minutes | 29 (13.0%) | 36 (22.1%) |
| 10 to 14 Minutes | 2 (0.9%) | 0 (0.0%) |
| 15 to 19 Minutes | 32 (14.3%) | 9 (5.5%) |
| 20 to 24 Minutes | 10 (4.5%) | 18 (11.0%) |
| 25 to 29 Minutes | 6 (2.7%) | 9 (5.5%) |
| 30 to 34 Minutes | 31 (13.9%) | 23 (14.1%) |
| 35 to 39 Minutes | 0 (0.0%) | 7 (4.3%) |
| 40 to 44 Minutes | 0 (0.0%) | 3 (1.8%) |
| 45 to 59 Minutes | 19 (8.5%) | 13 (8.0%) |
| 60 to 89 Minutes | 29 (13.0%) | 4 (2.5%) |
| 90 or more Minutes | 2 (0.9%) | 4 (2.5%) |
Time of Departure to Work by Sex in Barnsdall
The most frequent times of departure to work in Barnsdall are 12:00 PM to 3:59 PM (42, 18.8%) for males and 7:00 AM to 7:29 AM (49, 30.1%) for females.
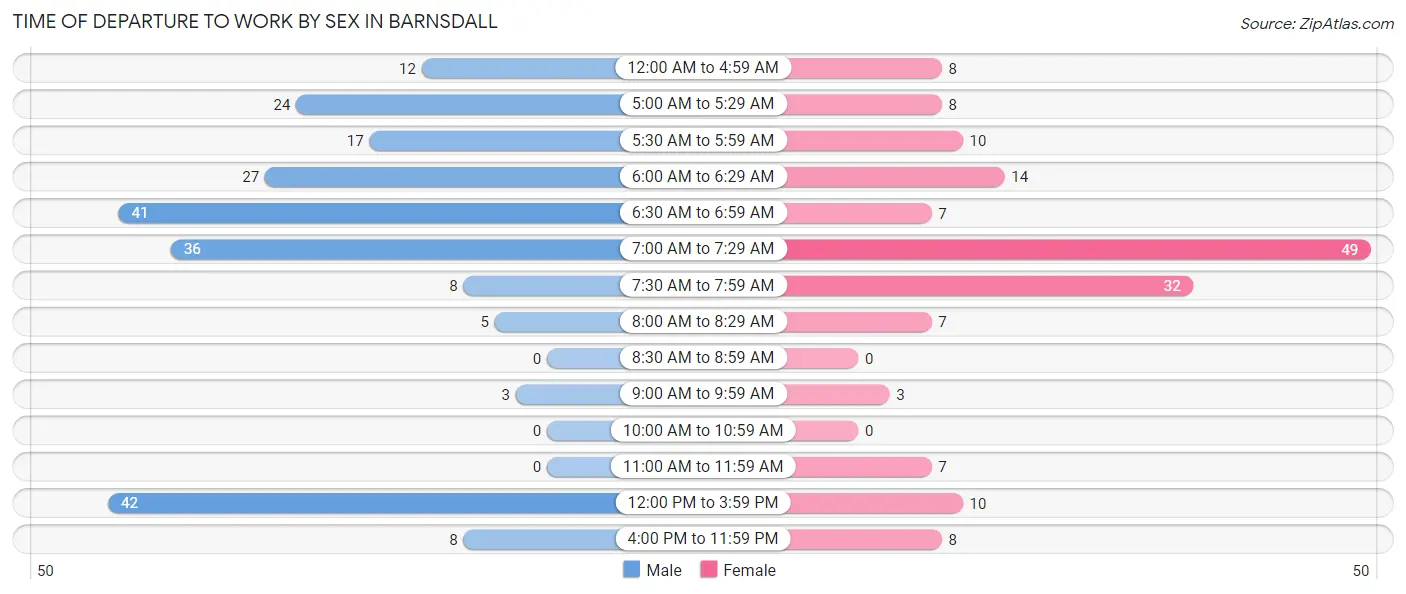
| Time of Departure | Male | Female |
| 12:00 AM to 4:59 AM | 12 (5.4%) | 8 (4.9%) |
| 5:00 AM to 5:29 AM | 24 (10.8%) | 8 (4.9%) |
| 5:30 AM to 5:59 AM | 17 (7.6%) | 10 (6.1%) |
| 6:00 AM to 6:29 AM | 27 (12.1%) | 14 (8.6%) |
| 6:30 AM to 6:59 AM | 41 (18.4%) | 7 (4.3%) |
| 7:00 AM to 7:29 AM | 36 (16.1%) | 49 (30.1%) |
| 7:30 AM to 7:59 AM | 8 (3.6%) | 32 (19.6%) |
| 8:00 AM to 8:29 AM | 5 (2.2%) | 7 (4.3%) |
| 8:30 AM to 8:59 AM | 0 (0.0%) | 0 (0.0%) |
| 9:00 AM to 9:59 AM | 3 (1.3%) | 3 (1.8%) |
| 10:00 AM to 10:59 AM | 0 (0.0%) | 0 (0.0%) |
| 11:00 AM to 11:59 AM | 0 (0.0%) | 7 (4.3%) |
| 12:00 PM to 3:59 PM | 42 (18.8%) | 10 (6.1%) |
| 4:00 PM to 11:59 PM | 8 (3.6%) | 8 (4.9%) |
| Total | 223 (100.0%) | 163 (100.0%) |
Housing Occupancy in Barnsdall
Occupancy by Ownership in Barnsdall
Of the total 360 dwellings in Barnsdall, owner-occupied units account for 247 (68.6%), while renter-occupied units make up 113 (31.4%).
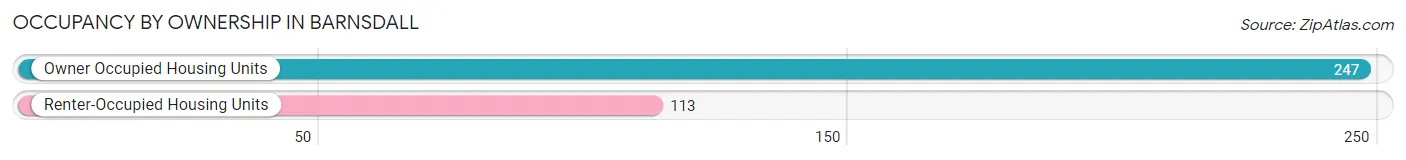
| Occupancy | # Housing Units | % Housing Units |
| Owner Occupied Housing Units | 247 | 68.6% |
| Renter-Occupied Housing Units | 113 | 31.4% |
| Total Occupied Housing Units | 360 | 100.0% |
Occupancy by Household Size in Barnsdall
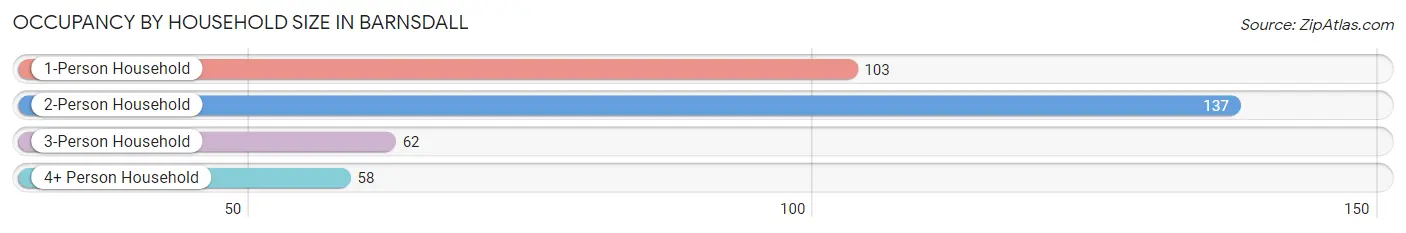
| Household Size | # Housing Units | % Housing Units |
| 1-Person Household | 103 | 28.6% |
| 2-Person Household | 137 | 38.1% |
| 3-Person Household | 62 | 17.2% |
| 4+ Person Household | 58 | 16.1% |
| Total Housing Units | 360 | 100.0% |
Occupancy by Ownership by Household Size in Barnsdall
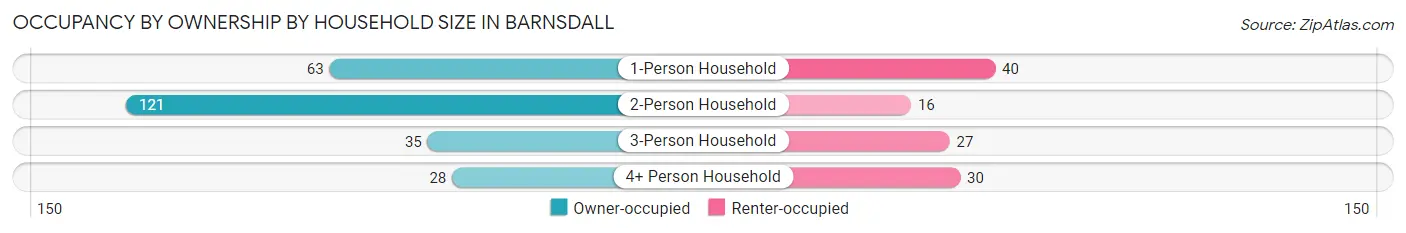
| Household Size | Owner-occupied | Renter-occupied |
| 1-Person Household | 63 (61.2%) | 40 (38.8%) |
| 2-Person Household | 121 (88.3%) | 16 (11.7%) |
| 3-Person Household | 35 (56.5%) | 27 (43.5%) |
| 4+ Person Household | 28 (48.3%) | 30 (51.7%) |
| Total Housing Units | 247 (68.6%) | 113 (31.4%) |
Occupancy by Educational Attainment in Barnsdall
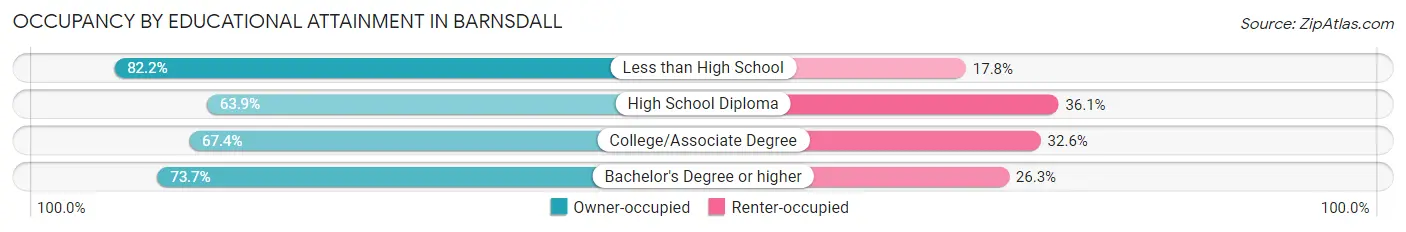
| Household Size | Owner-occupied | Renter-occupied |
| Less than High School | 37 (82.2%) | 8 (17.8%) |
| High School Diploma | 106 (63.9%) | 60 (36.1%) |
| College/Associate Degree | 62 (67.4%) | 30 (32.6%) |
| Bachelor's Degree or higher | 42 (73.7%) | 15 (26.3%) |
Occupancy by Age of Householder in Barnsdall
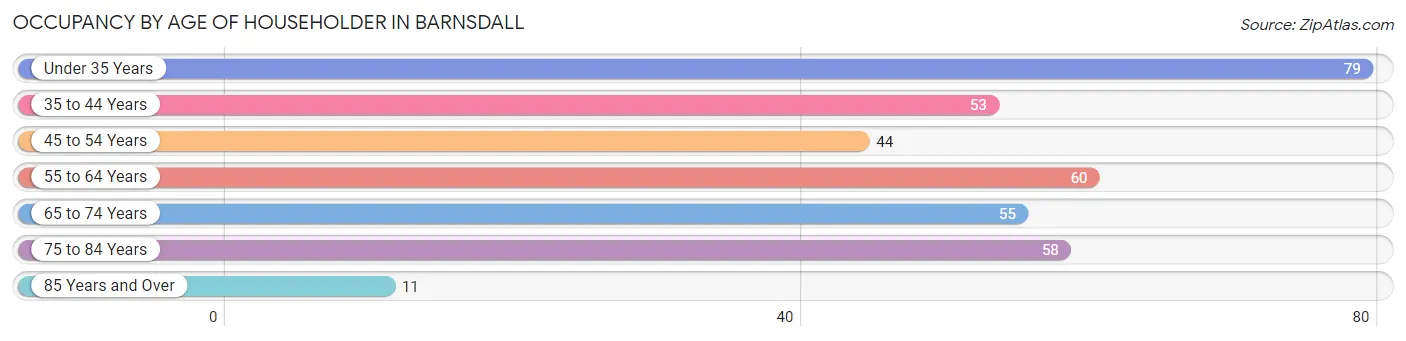
| Age Bracket | # Households | % Households |
| Under 35 Years | 79 | 21.9% |
| 35 to 44 Years | 53 | 14.7% |
| 45 to 54 Years | 44 | 12.2% |
| 55 to 64 Years | 60 | 16.7% |
| 65 to 74 Years | 55 | 15.3% |
| 75 to 84 Years | 58 | 16.1% |
| 85 Years and Over | 11 | 3.1% |
| Total | 360 | 100.0% |
Housing Finances in Barnsdall
Median Income by Occupancy in Barnsdall
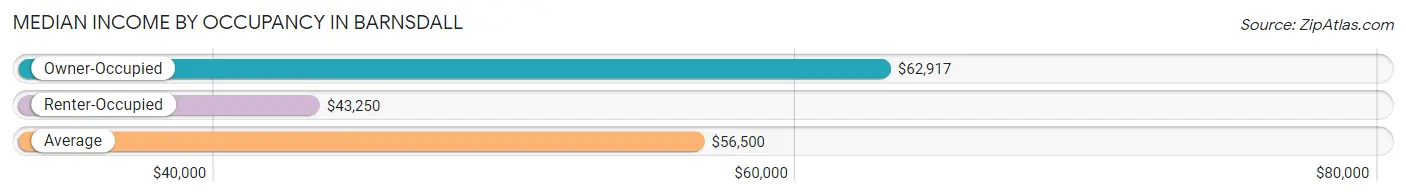
| Occupancy Type | # Households | Median Income |
| Owner-Occupied | 247 (68.6%) | $62,917 |
| Renter-Occupied | 113 (31.4%) | $43,250 |
| Average | 360 (100.0%) | $56,500 |
Occupancy by Householder Income Bracket in Barnsdall
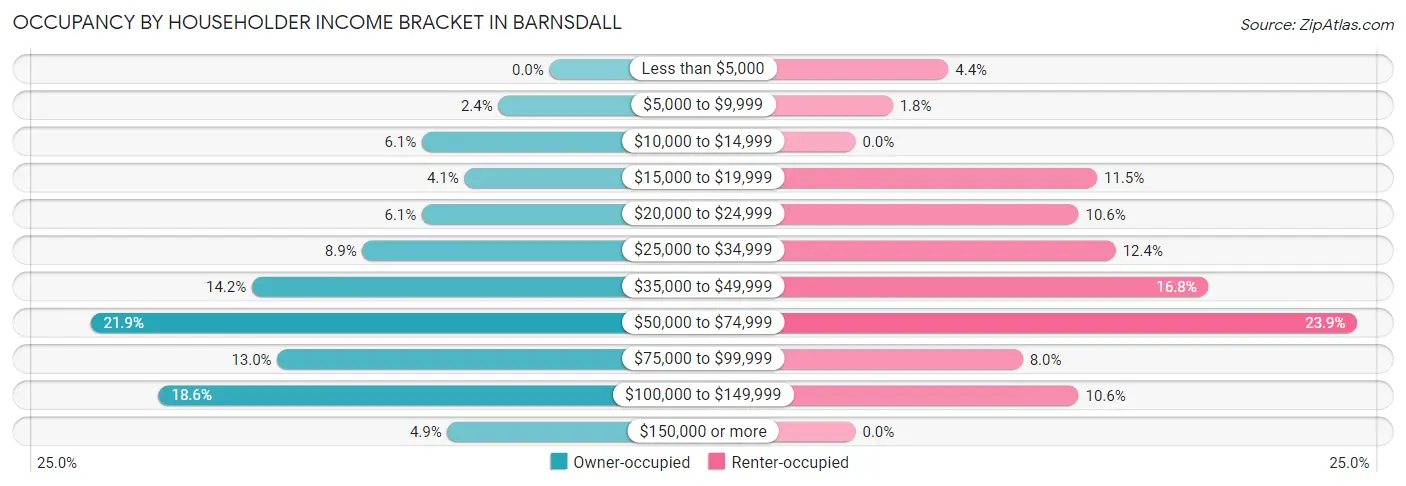
| Income Bracket | Owner-occupied | Renter-occupied |
| Less than $5,000 | 0 (0.0%) | 5 (4.4%) |
| $5,000 to $9,999 | 6 (2.4%) | 2 (1.8%) |
| $10,000 to $14,999 | 15 (6.1%) | 0 (0.0%) |
| $15,000 to $19,999 | 10 (4.1%) | 13 (11.5%) |
| $20,000 to $24,999 | 15 (6.1%) | 12 (10.6%) |
| $25,000 to $34,999 | 22 (8.9%) | 14 (12.4%) |
| $35,000 to $49,999 | 35 (14.2%) | 19 (16.8%) |
| $50,000 to $74,999 | 54 (21.9%) | 27 (23.9%) |
| $75,000 to $99,999 | 32 (13.0%) | 9 (8.0%) |
| $100,000 to $149,999 | 46 (18.6%) | 12 (10.6%) |
| $150,000 or more | 12 (4.9%) | 0 (0.0%) |
| Total | 247 (100.0%) | 113 (100.0%) |
Monthly Housing Cost Tiers in Barnsdall
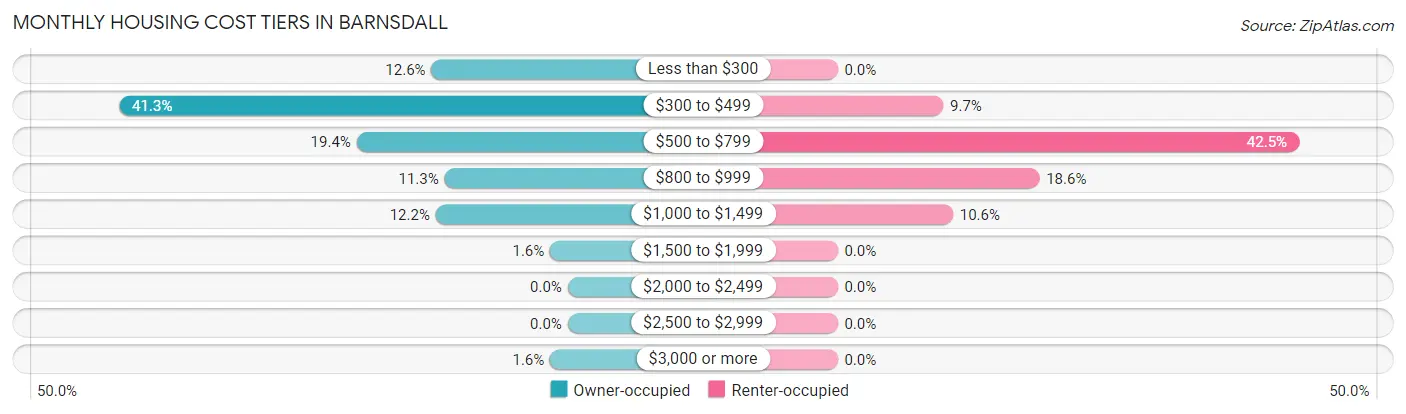
| Monthly Cost | Owner-occupied | Renter-occupied |
| Less than $300 | 31 (12.6%) | 0 (0.0%) |
| $300 to $499 | 102 (41.3%) | 11 (9.7%) |
| $500 to $799 | 48 (19.4%) | 48 (42.5%) |
| $800 to $999 | 28 (11.3%) | 21 (18.6%) |
| $1,000 to $1,499 | 30 (12.1%) | 12 (10.6%) |
| $1,500 to $1,999 | 4 (1.6%) | 0 (0.0%) |
| $2,000 to $2,499 | 0 (0.0%) | 0 (0.0%) |
| $2,500 to $2,999 | 0 (0.0%) | 0 (0.0%) |
| $3,000 or more | 4 (1.6%) | 0 (0.0%) |
| Total | 247 (100.0%) | 113 (100.0%) |
Physical Housing Characteristics in Barnsdall
Housing Structures in Barnsdall
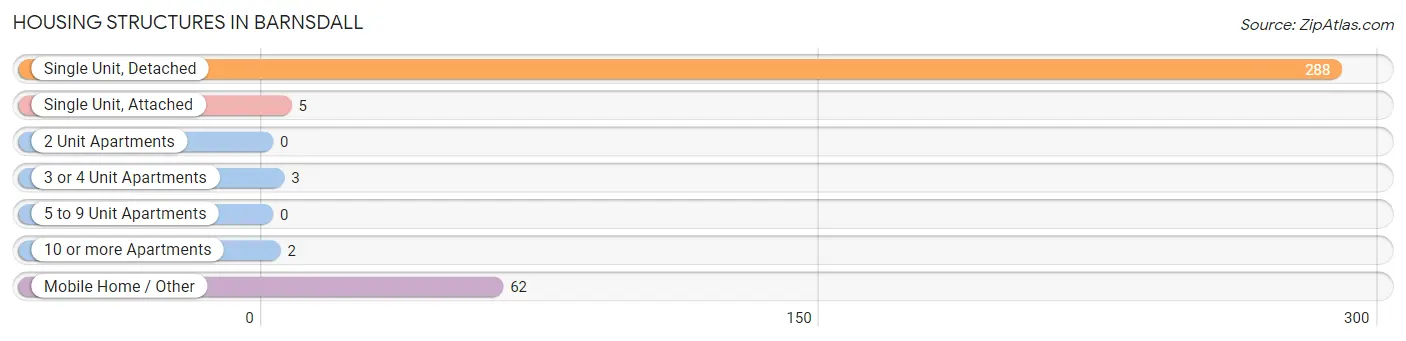
| Structure Type | # Housing Units | % Housing Units |
| Single Unit, Detached | 288 | 80.0% |
| Single Unit, Attached | 5 | 1.4% |
| 2 Unit Apartments | 0 | 0.0% |
| 3 or 4 Unit Apartments | 3 | 0.8% |
| 5 to 9 Unit Apartments | 0 | 0.0% |
| 10 or more Apartments | 2 | 0.6% |
| Mobile Home / Other | 62 | 17.2% |
| Total | 360 | 100.0% |
Housing Structures by Occupancy in Barnsdall
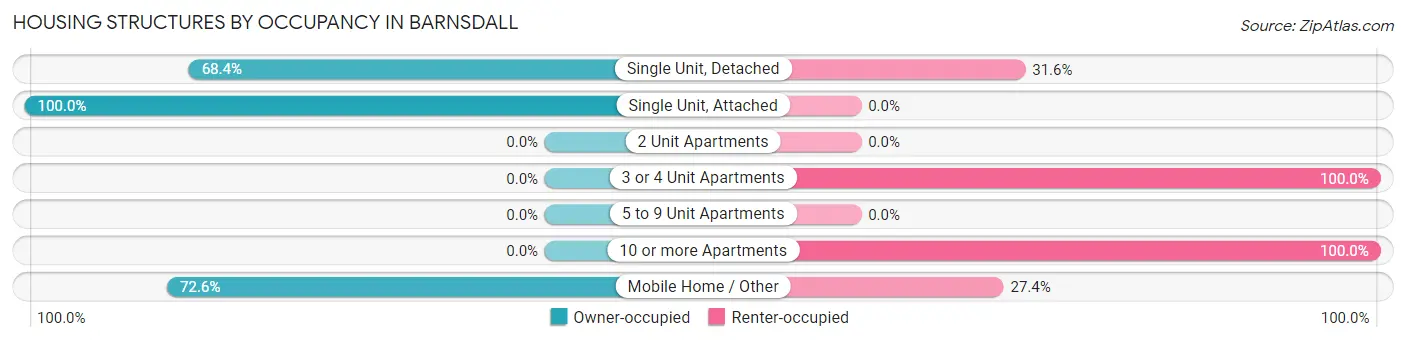
| Structure Type | Owner-occupied | Renter-occupied |
| Single Unit, Detached | 197 (68.4%) | 91 (31.6%) |
| Single Unit, Attached | 5 (100.0%) | 0 (0.0%) |
| 2 Unit Apartments | 0 (0.0%) | 0 (0.0%) |
| 3 or 4 Unit Apartments | 0 (0.0%) | 3 (100.0%) |
| 5 to 9 Unit Apartments | 0 (0.0%) | 0 (0.0%) |
| 10 or more Apartments | 0 (0.0%) | 2 (100.0%) |
| Mobile Home / Other | 45 (72.6%) | 17 (27.4%) |
| Total | 247 (68.6%) | 113 (31.4%) |
Housing Structures by Number of Rooms in Barnsdall
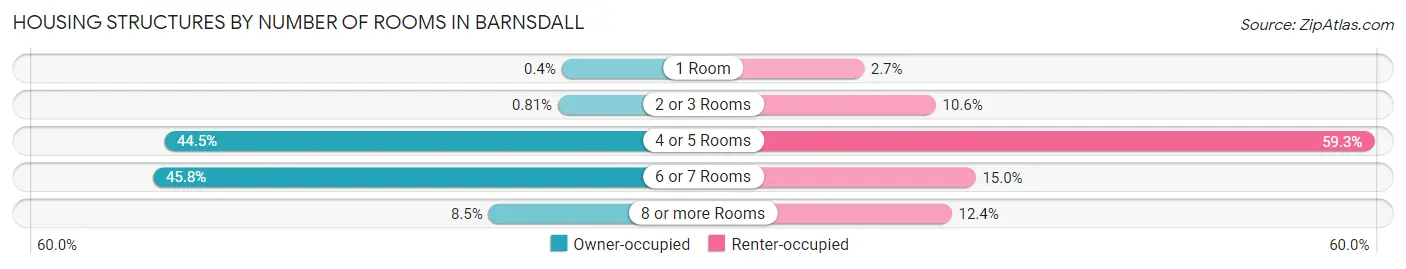
| Number of Rooms | Owner-occupied | Renter-occupied |
| 1 Room | 1 (0.4%) | 3 (2.6%) |
| 2 or 3 Rooms | 2 (0.8%) | 12 (10.6%) |
| 4 or 5 Rooms | 110 (44.5%) | 67 (59.3%) |
| 6 or 7 Rooms | 113 (45.8%) | 17 (15.0%) |
| 8 or more Rooms | 21 (8.5%) | 14 (12.4%) |
| Total | 247 (100.0%) | 113 (100.0%) |
Housing Structure by Heating Type in Barnsdall
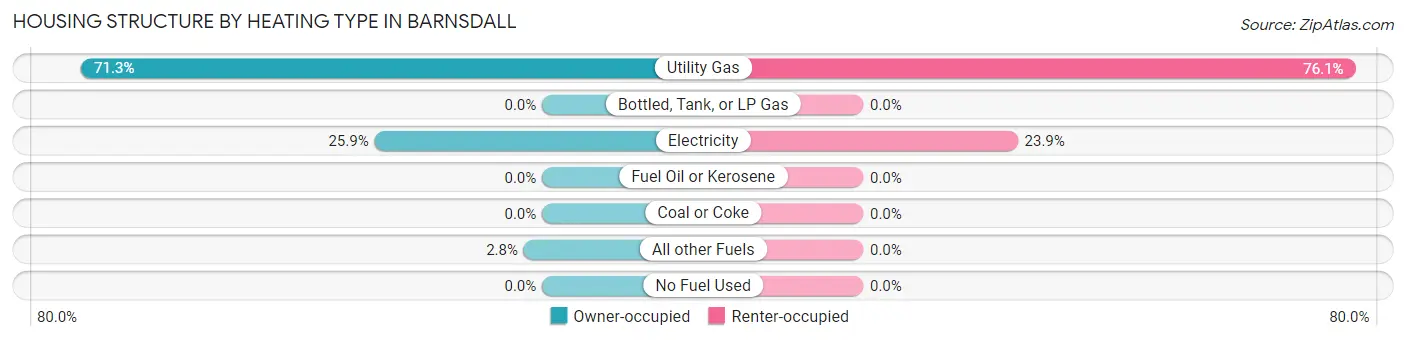
| Heating Type | Owner-occupied | Renter-occupied |
| Utility Gas | 176 (71.3%) | 86 (76.1%) |
| Bottled, Tank, or LP Gas | 0 (0.0%) | 0 (0.0%) |
| Electricity | 64 (25.9%) | 27 (23.9%) |
| Fuel Oil or Kerosene | 0 (0.0%) | 0 (0.0%) |
| Coal or Coke | 0 (0.0%) | 0 (0.0%) |
| All other Fuels | 7 (2.8%) | 0 (0.0%) |
| No Fuel Used | 0 (0.0%) | 0 (0.0%) |
| Total | 247 (100.0%) | 113 (100.0%) |
Household Vehicle Usage in Barnsdall
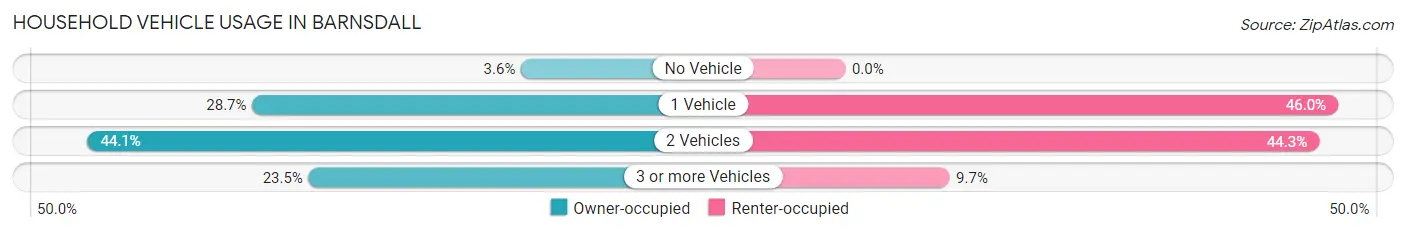
| Vehicles per Household | Owner-occupied | Renter-occupied |
| No Vehicle | 9 (3.6%) | 0 (0.0%) |
| 1 Vehicle | 71 (28.7%) | 52 (46.0%) |
| 2 Vehicles | 109 (44.1%) | 50 (44.3%) |
| 3 or more Vehicles | 58 (23.5%) | 11 (9.7%) |
| Total | 247 (100.0%) | 113 (100.0%) |
Real Estate & Mortgages in Barnsdall
Real Estate and Mortgage Overview in Barnsdall
| Characteristic | Without Mortgage | With Mortgage |
| Housing Units | 159 | 88 |
| Median Property Value | $52,900 | $92,500 |
| Median Household Income | $49,821 | $2 |
| Monthly Housing Costs | $375 | $4 |
| Real Estate Taxes | $285 | $6 |
Property Value by Mortgage Status in Barnsdall
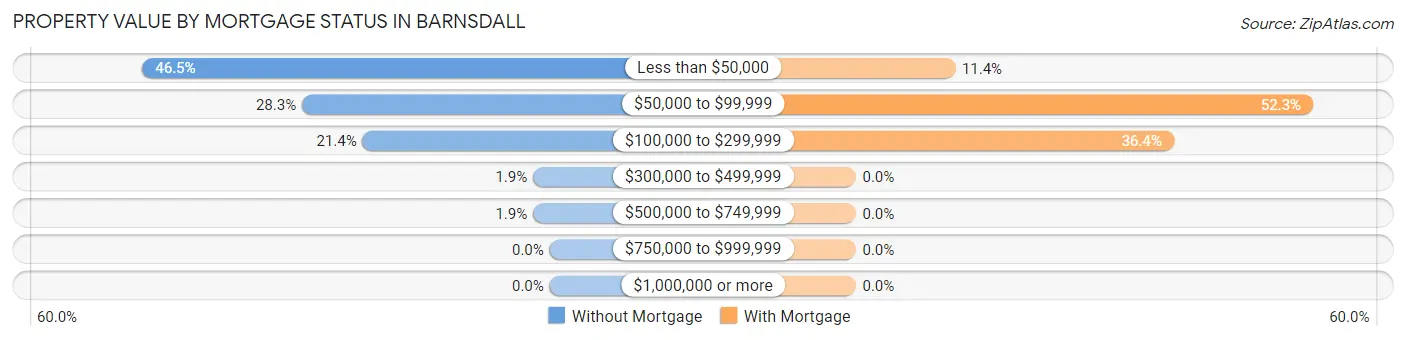
| Property Value | Without Mortgage | With Mortgage |
| Less than $50,000 | 74 (46.5%) | 10 (11.4%) |
| $50,000 to $99,999 | 45 (28.3%) | 46 (52.3%) |
| $100,000 to $299,999 | 34 (21.4%) | 32 (36.4%) |
| $300,000 to $499,999 | 3 (1.9%) | 0 (0.0%) |
| $500,000 to $749,999 | 3 (1.9%) | 0 (0.0%) |
| $750,000 to $999,999 | 0 (0.0%) | 0 (0.0%) |
| $1,000,000 or more | 0 (0.0%) | 0 (0.0%) |
| Total | 159 (100.0%) | 88 (100.0%) |
Household Income by Mortgage Status in Barnsdall
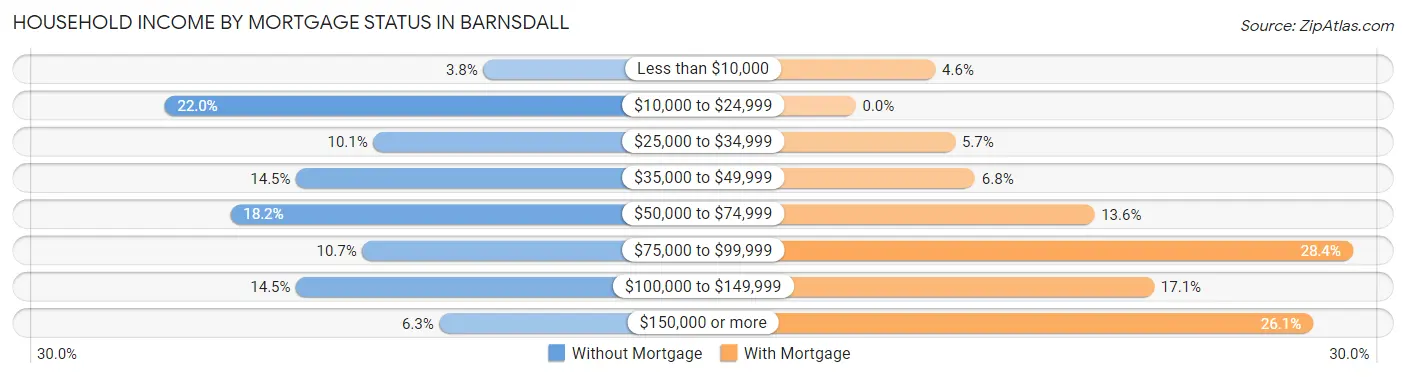
| Household Income | Without Mortgage | With Mortgage |
| Less than $10,000 | 6 (3.8%) | 4 (4.5%) |
| $10,000 to $24,999 | 35 (22.0%) | 0 (0.0%) |
| $25,000 to $34,999 | 16 (10.1%) | 5 (5.7%) |
| $35,000 to $49,999 | 23 (14.5%) | 6 (6.8%) |
| $50,000 to $74,999 | 29 (18.2%) | 12 (13.6%) |
| $75,000 to $99,999 | 17 (10.7%) | 25 (28.4%) |
| $100,000 to $149,999 | 23 (14.5%) | 15 (17.1%) |
| $150,000 or more | 10 (6.3%) | 23 (26.1%) |
| Total | 159 (100.0%) | 88 (100.0%) |
Property Value to Household Income Ratio in Barnsdall
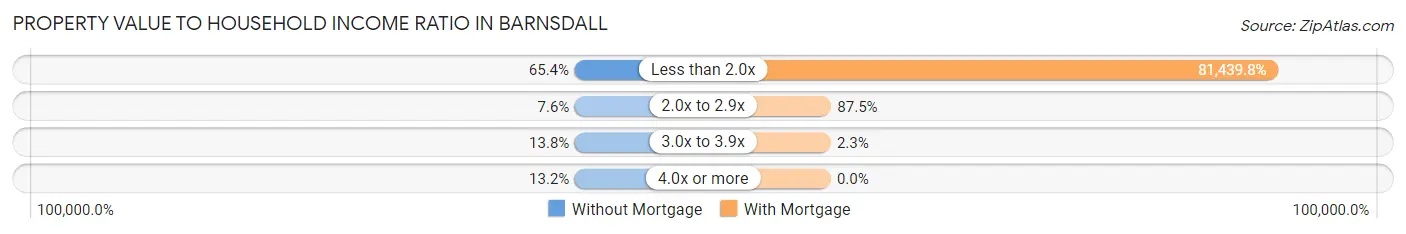
| Value-to-Income Ratio | Without Mortgage | With Mortgage |
| Less than 2.0x | 104 (65.4%) | 71,667 (81,439.8%) |
| 2.0x to 2.9x | 12 (7.5%) | 77 (87.5%) |
| 3.0x to 3.9x | 22 (13.8%) | 2 (2.3%) |
| 4.0x or more | 21 (13.2%) | 0 (0.0%) |
| Total | 159 (100.0%) | 88 (100.0%) |
Real Estate Taxes by Mortgage Status in Barnsdall
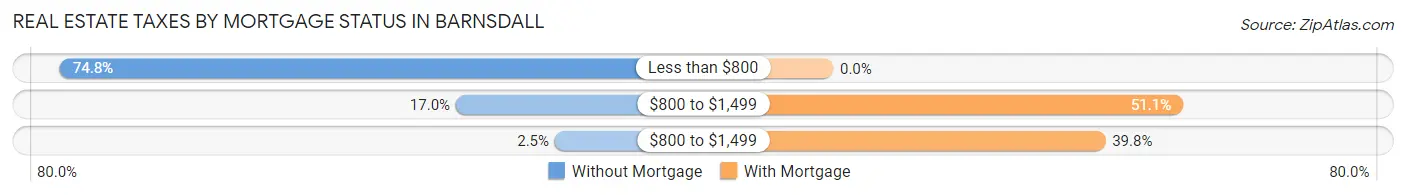
| Property Taxes | Without Mortgage | With Mortgage |
| Less than $800 | 119 (74.8%) | 0 (0.0%) |
| $800 to $1,499 | 27 (17.0%) | 45 (51.1%) |
| $800 to $1,499 | 4 (2.5%) | 35 (39.8%) |
| Total | 159 (100.0%) | 88 (100.0%) |
Health & Disability in Barnsdall
Health Insurance Coverage by Age in Barnsdall
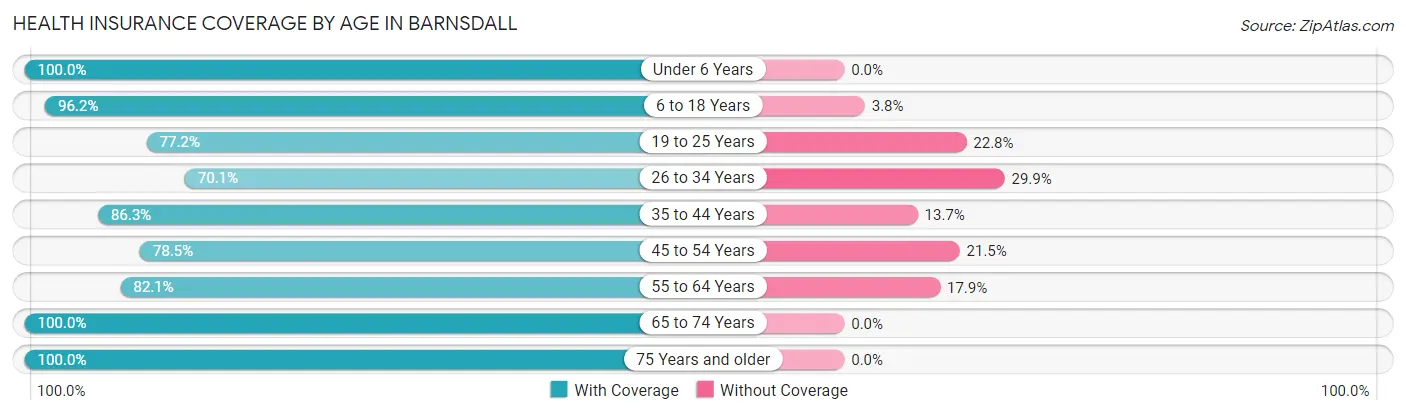
| Age Bracket | With Coverage | Without Coverage |
| Under 6 Years | 28 (100.0%) | 0 (0.0%) |
| 6 to 18 Years | 252 (96.2%) | 10 (3.8%) |
| 19 to 25 Years | 95 (77.2%) | 28 (22.8%) |
| 26 to 34 Years | 61 (70.1%) | 26 (29.9%) |
| 35 to 44 Years | 82 (86.3%) | 13 (13.7%) |
| 45 to 54 Years | 84 (78.5%) | 23 (21.5%) |
| 55 to 64 Years | 92 (82.1%) | 20 (17.9%) |
| 65 to 74 Years | 78 (100.0%) | 0 (0.0%) |
| 75 Years and older | 96 (100.0%) | 0 (0.0%) |
| Total | 868 (87.8%) | 120 (12.1%) |
Health Insurance Coverage by Citizenship Status in Barnsdall
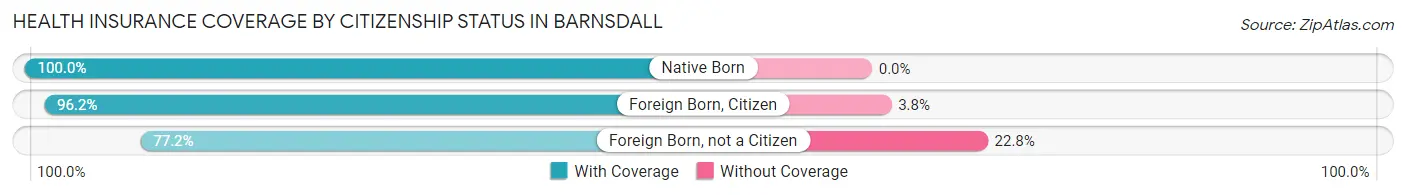
| Citizenship Status | With Coverage | Without Coverage |
| Native Born | 28 (100.0%) | 0 (0.0%) |
| Foreign Born, Citizen | 252 (96.2%) | 10 (3.8%) |
| Foreign Born, not a Citizen | 95 (77.2%) | 28 (22.8%) |
Health Insurance Coverage by Household Income in Barnsdall
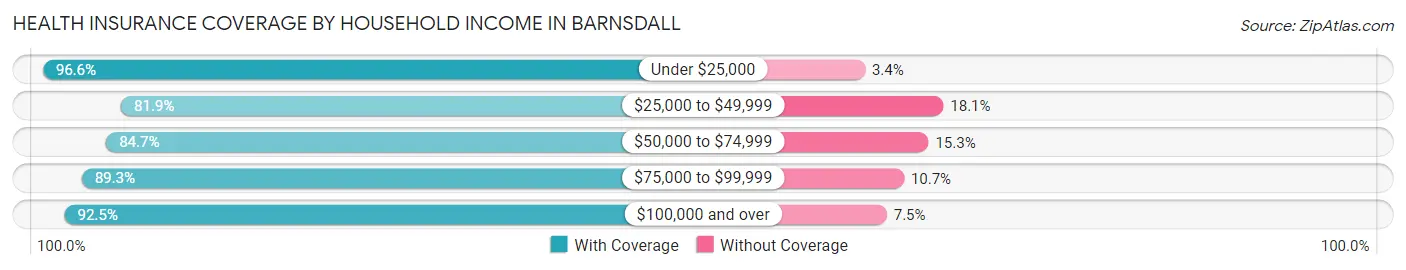
| Household Income | With Coverage | Without Coverage |
| Under $25,000 | 85 (96.6%) | 3 (3.4%) |
| $25,000 to $49,999 | 231 (81.9%) | 51 (18.1%) |
| $50,000 to $74,999 | 155 (84.7%) | 28 (15.3%) |
| $75,000 to $99,999 | 150 (89.3%) | 18 (10.7%) |
| $100,000 and over | 247 (92.5%) | 20 (7.5%) |
Public vs Private Health Insurance Coverage by Age in Barnsdall
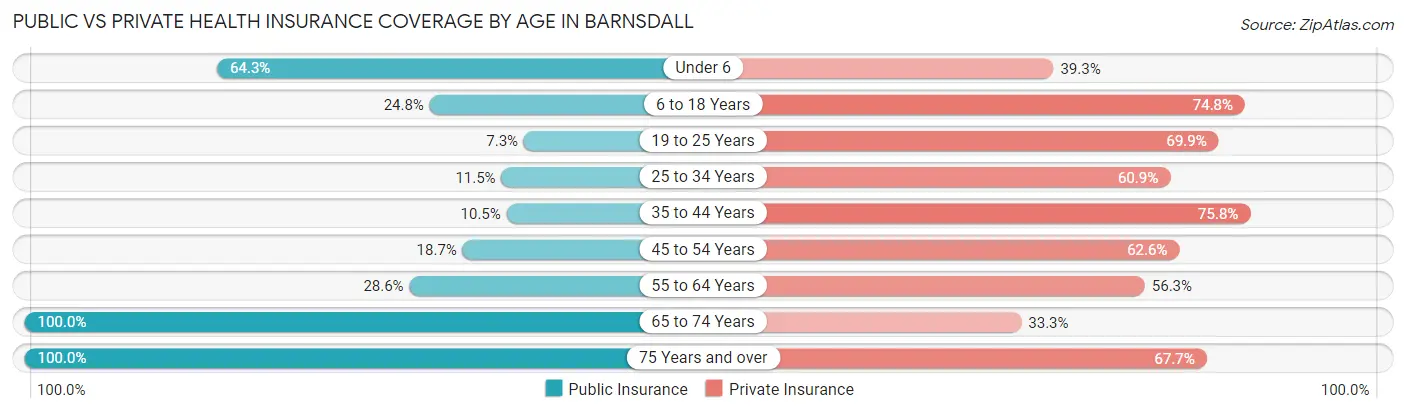
| Age Bracket | Public Insurance | Private Insurance |
| Under 6 | 18 (64.3%) | 11 (39.3%) |
| 6 to 18 Years | 65 (24.8%) | 196 (74.8%) |
| 19 to 25 Years | 9 (7.3%) | 86 (69.9%) |
| 25 to 34 Years | 10 (11.5%) | 53 (60.9%) |
| 35 to 44 Years | 10 (10.5%) | 72 (75.8%) |
| 45 to 54 Years | 20 (18.7%) | 67 (62.6%) |
| 55 to 64 Years | 32 (28.6%) | 63 (56.2%) |
| 65 to 74 Years | 78 (100.0%) | 26 (33.3%) |
| 75 Years and over | 96 (100.0%) | 65 (67.7%) |
| Total | 338 (34.2%) | 639 (64.7%) |
Disability Status by Sex by Age in Barnsdall
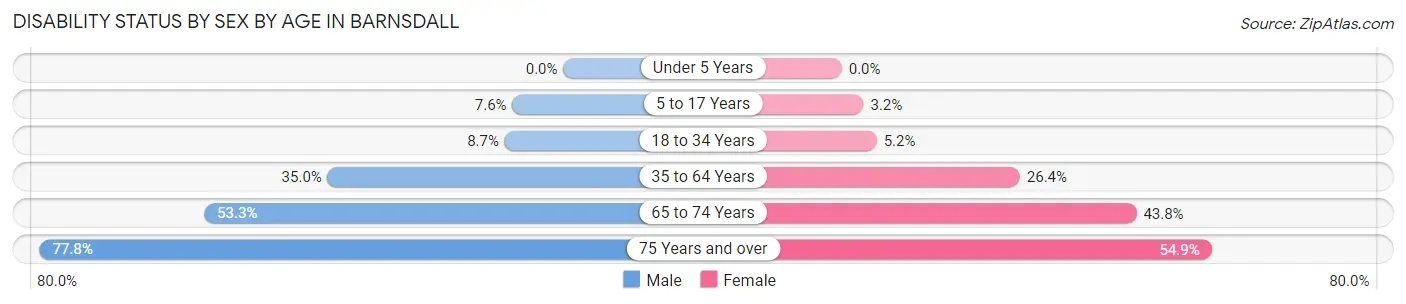
| Age Bracket | Male | Female |
| Under 5 Years | 0 (0.0%) | 0 (0.0%) |
| 5 to 17 Years | 13 (7.6%) | 3 (3.2%) |
| 18 to 34 Years | 12 (8.7%) | 4 (5.2%) |
| 35 to 64 Years | 49 (35.0%) | 46 (26.4%) |
| 65 to 74 Years | 16 (53.3%) | 21 (43.8%) |
| 75 Years and over | 35 (77.8%) | 28 (54.9%) |
Disability Class by Sex by Age in Barnsdall
Disability Class: Hearing Difficulty
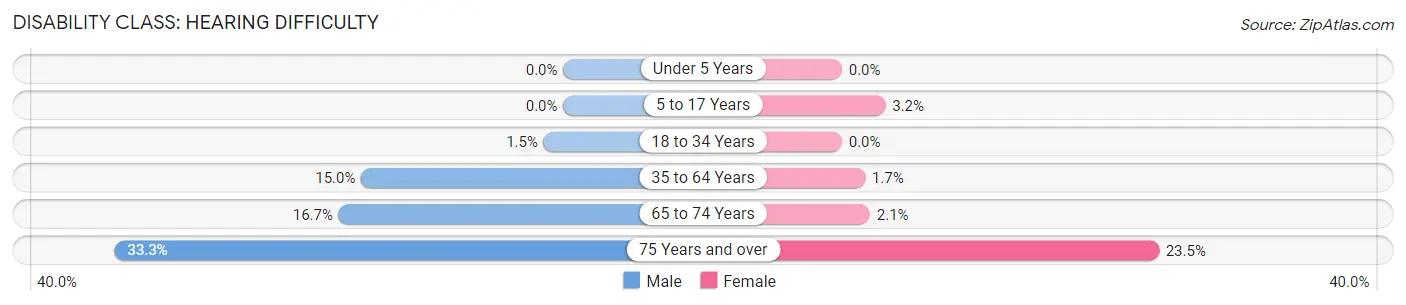
| Age Bracket | Male | Female |
| Under 5 Years | 0 (0.0%) | 0 (0.0%) |
| 5 to 17 Years | 0 (0.0%) | 3 (3.2%) |
| 18 to 34 Years | 2 (1.5%) | 0 (0.0%) |
| 35 to 64 Years | 21 (15.0%) | 3 (1.7%) |
| 65 to 74 Years | 5 (16.7%) | 1 (2.1%) |
| 75 Years and over | 15 (33.3%) | 12 (23.5%) |
Disability Class: Vision Difficulty
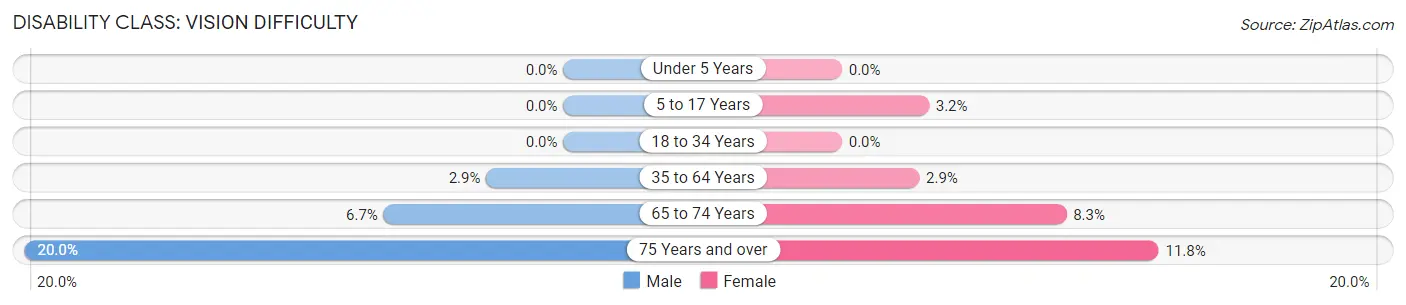
| Age Bracket | Male | Female |
| Under 5 Years | 0 (0.0%) | 0 (0.0%) |
| 5 to 17 Years | 0 (0.0%) | 3 (3.2%) |
| 18 to 34 Years | 0 (0.0%) | 0 (0.0%) |
| 35 to 64 Years | 4 (2.9%) | 5 (2.9%) |
| 65 to 74 Years | 2 (6.7%) | 4 (8.3%) |
| 75 Years and over | 9 (20.0%) | 6 (11.8%) |
Disability Class: Cognitive Difficulty
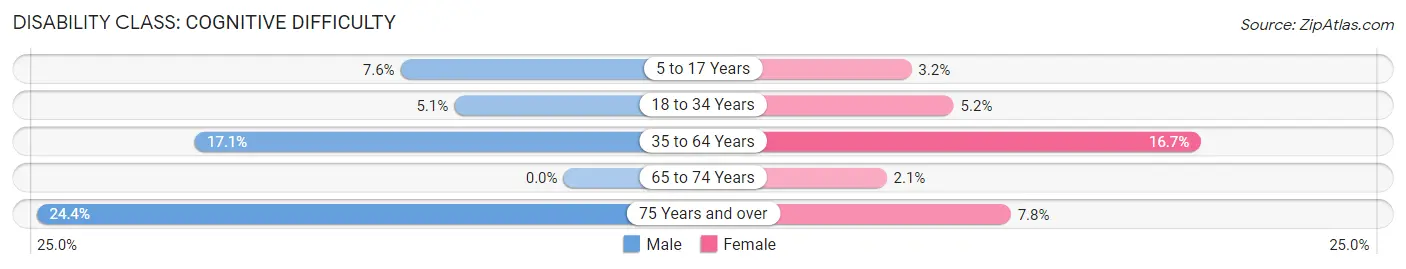
| Age Bracket | Male | Female |
| 5 to 17 Years | 13 (7.6%) | 3 (3.2%) |
| 18 to 34 Years | 7 (5.1%) | 4 (5.2%) |
| 35 to 64 Years | 24 (17.1%) | 29 (16.7%) |
| 65 to 74 Years | 0 (0.0%) | 1 (2.1%) |
| 75 Years and over | 11 (24.4%) | 4 (7.8%) |
Disability Class: Ambulatory Difficulty
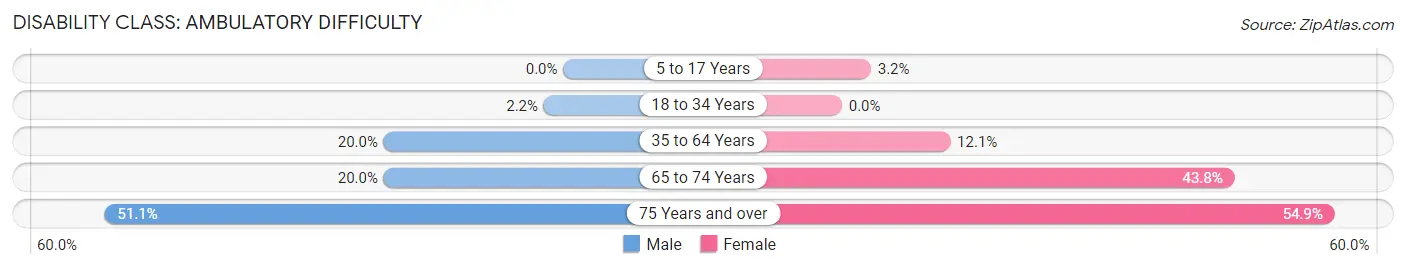
| Age Bracket | Male | Female |
| 5 to 17 Years | 0 (0.0%) | 3 (3.2%) |
| 18 to 34 Years | 3 (2.2%) | 0 (0.0%) |
| 35 to 64 Years | 28 (20.0%) | 21 (12.1%) |
| 65 to 74 Years | 6 (20.0%) | 21 (43.8%) |
| 75 Years and over | 23 (51.1%) | 28 (54.9%) |
Disability Class: Self-Care Difficulty
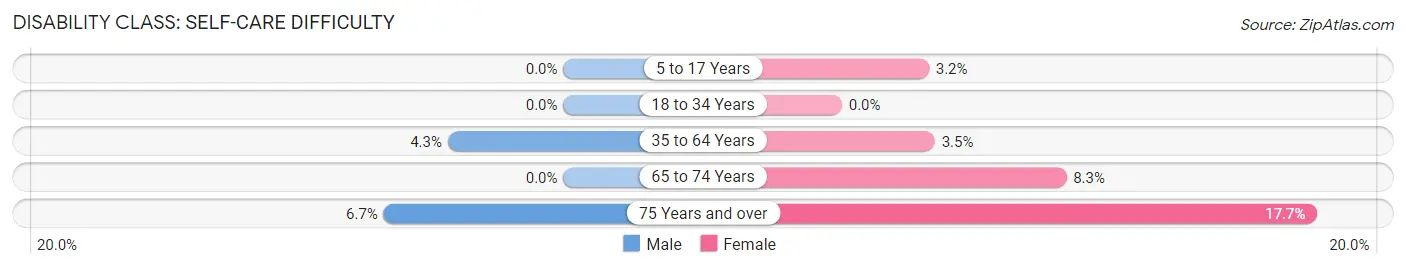
| Age Bracket | Male | Female |
| 5 to 17 Years | 0 (0.0%) | 3 (3.2%) |
| 18 to 34 Years | 0 (0.0%) | 0 (0.0%) |
| 35 to 64 Years | 6 (4.3%) | 6 (3.5%) |
| 65 to 74 Years | 0 (0.0%) | 4 (8.3%) |
| 75 Years and over | 3 (6.7%) | 9 (17.6%) |
Technology Access in Barnsdall
Computing Device Access in Barnsdall
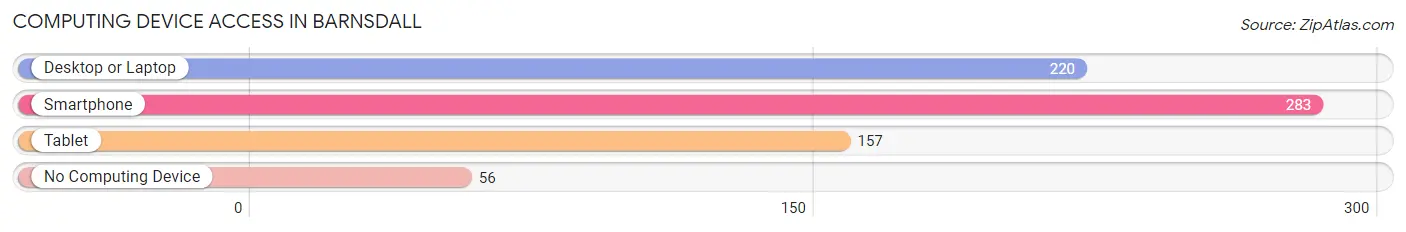
| Device Type | # Households | % Households |
| Desktop or Laptop | 220 | 61.1% |
| Smartphone | 283 | 78.6% |
| Tablet | 157 | 43.6% |
| No Computing Device | 56 | 15.6% |
| Total | 360 | 100.0% |
Internet Access in Barnsdall
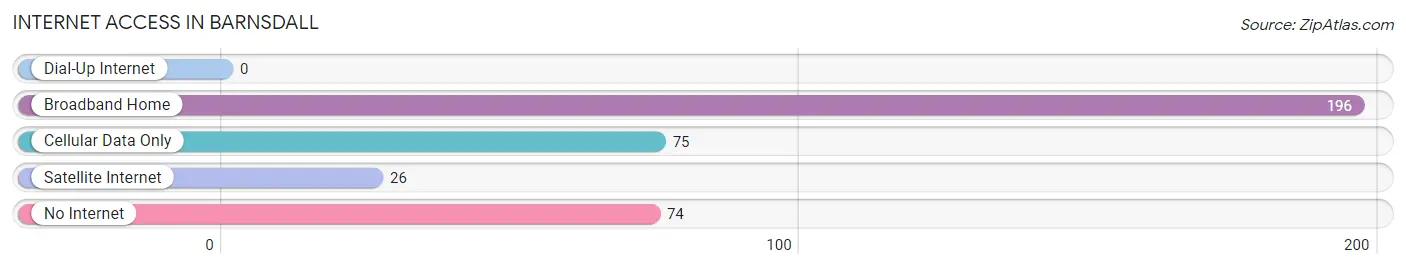
| Internet Type | # Households | % Households |
| Dial-Up Internet | 0 | 0.0% |
| Broadband Home | 196 | 54.4% |
| Cellular Data Only | 75 | 20.8% |
| Satellite Internet | 26 | 7.2% |
| No Internet | 74 | 20.6% |
| Total | 360 | 100.0% |
Barnsdall Summary
Barnsdall is a small town located in Osage County, Oklahoma. It is situated in the northeastern part of the state, about 20 miles south of Tulsa. The town was founded in 1902 and named after oilman Frank Barnsdall, who owned the land at the time. The population of Barnsdall was 1,845 at the 2010 census, making it the second-largest town in Osage County.
Geography
Barnsdall is located at 36°37'25" North, 96°14'17" West (36.623, -96.238). It is situated in the Osage Plains, a region of rolling hills and prairies. The town is located on the banks of the Cimarron River, which flows through the area. The town is surrounded by agricultural land, with the nearest major city being Tulsa, located about 20 miles to the north.
Climate
Barnsdall has a humid subtropical climate, with hot summers and mild winters. The average annual temperature is 61°F, with an average high of 79°F in July and an average low of 43°F in January. The average annual precipitation is 37.5 inches, with the wettest month being May, when an average of 5.2 inches of rain falls.
Demographics
As of the 2010 census, there were 1,845 people, 717 households, and 486 families residing in Barnsdall. The population density was 1,072.3 people per square mile. The racial makeup of the town was 81.2% White, 0.7% African American, 8.2% Native American, 0.2% Asian, 0.1% Pacific Islander, 0.2% from other races, and 9.6% from two or more races. Hispanic or Latino of any race were 1.7% of the population.
Economy
Barnsdall is a small, rural town with a primarily agricultural economy. The town is home to several farms, as well as a few small businesses. The town is also home to a few oil and gas wells, which provide some employment opportunities. The town is served by the Barnsdall Public School District, which provides education to the local children.
History
Barnsdall was founded in 1902 by oilman Frank Barnsdall, who owned the land at the time. The town was originally called "Barnsdall City," but the name was later shortened to "Barnsdall." The town grew rapidly in the early 20th century, due to the discovery of oil in the area. By the 1920s, Barnsdall had become a thriving oil town, with a population of over 2,000.
In the 1930s, the Great Depression hit Barnsdall hard, and the population began to decline. The town was further affected by the Dust Bowl of the 1930s, which caused many of the local farms to fail. By the 1940s, the population had dropped to just over 1,000.
In the 1950s, the town began to recover, and the population began to grow again. The town was further revitalized in the 1960s, when the nearby Tulsa International Airport was built. The airport provided a boost to the local economy, and the population of Barnsdall continued to grow.
Today, Barnsdall is a small, rural town with a population of just over 1,800. The town is still primarily agricultural, but it is also home to a few small businesses and oil and gas wells. The town is served by the Barnsdall Public School District, which provides education to the local children.
Common Questions
What is Per Capita Income in Barnsdall?
Per Capita income in Barnsdall is $23,458.
What is the Median Family Income in Barnsdall?
Median Family Income in Barnsdall is $67,625.
What is the Median Household income in Barnsdall?
Median Household Income in Barnsdall is $56,500.
What is Income or Wage Gap in Barnsdall?
Income or Wage Gap in Barnsdall is 22.9%.
Women in Barnsdall earn 77.1 cents for every dollar earned by a man.
What is Inequality or Gini Index in Barnsdall?
Inequality or Gini Index in Barnsdall is 0.36.
What is the Total Population of Barnsdall?
Total Population of Barnsdall is 1,019.
What is the Total Male Population of Barnsdall?
Total Male Population of Barnsdall is 537.
What is the Total Female Population of Barnsdall?
Total Female Population of Barnsdall is 482.
What is the Ratio of Males per 100 Females in Barnsdall?
There are 111.41 Males per 100 Females in Barnsdall.
What is the Ratio of Females per 100 Males in Barnsdall?
There are 89.76 Females per 100 Males in Barnsdall.
What is the Median Population Age in Barnsdall?
Median Population Age in Barnsdall is 36.8 Years.
What is the Average Family Size in Barnsdall
Average Family Size in Barnsdall is 3.4 People.
What is the Average Household Size in Barnsdall
Average Household Size in Barnsdall is 2.7 People.
How Large is the Labor Force in Barnsdall?
There are 436 People in the Labor Forcein in Barnsdall.
What is the Percentage of People in the Labor Force in Barnsdall?
53.2% of People are in the Labor Force in Barnsdall.
What is the Unemployment Rate in Barnsdall?
Unemployment Rate in Barnsdall is 6.2%.