Woodlawn Park, OK Map & Demographics
Woodlawn Park Map
Woodlawn Park Overview
$39,573
PER CAPITA INCOME
$105,000
AVG FAMILY INCOME
$88,125
AVG HOUSEHOLD INCOME
53.0%
WAGE / INCOME GAP [ % ]
47.0¢/ $1
WAGE / INCOME GAP [ $ ]
0.32
INEQUALITY / GINI INDEX
147
TOTAL POPULATION
60
MALE POPULATION
87
FEMALE POPULATION
68.97
MALES / 100 FEMALES
145.00
FEMALES / 100 MALES
57.3
MEDIAN AGE
3.5
AVG FAMILY SIZE
3.0
AVG HOUSEHOLD SIZE
53
LABOR FORCE [ PEOPLE ]
46.1%
PERCENT IN LABOR FORCE
Woodlawn Park Area Codes
Income in Woodlawn Park
Income Overview in Woodlawn Park
Per Capita Income in Woodlawn Park is $39,573, while median incomes of families and households are $105,000 and $88,125 respectively.
| Characteristic | Number | Measure |
| Per Capita Income | 147 | $39,573 |
| Median Family Income | 38 | $105,000 |
| Mean Family Income | 38 | $124,826 |
| Median Household Income | 49 | $88,125 |
| Mean Household Income | 49 | $109,178 |
| Income Deficit | 38 | $0 |
| Wage / Income Gap (%) | 147 | 52.97% |
| Wage / Income Gap ($) | 147 | 47.03¢ per $1 |
| Gini / Inequality Index | 147 | 0.32 |
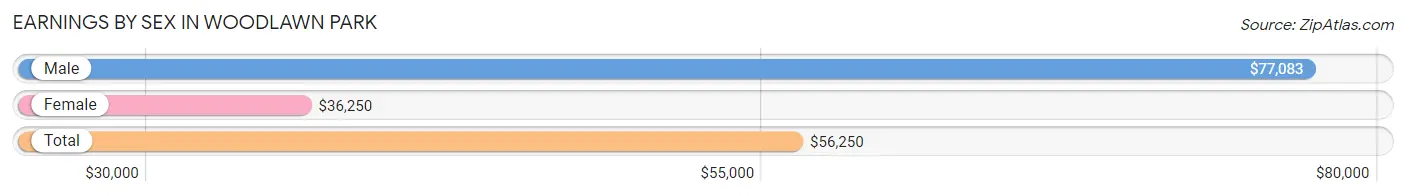
Earnings by Sex in Woodlawn Park
Average Earnings in Woodlawn Park are $56,250, $77,083 for men and $36,250 for women, a difference of 53.0%.
| Sex | Number | Average Earnings |
| Male | 29 (51.8%) | $77,083 |
| Female | 27 (48.2%) | $36,250 |
| Total | 56 (100.0%) | $56,250 |
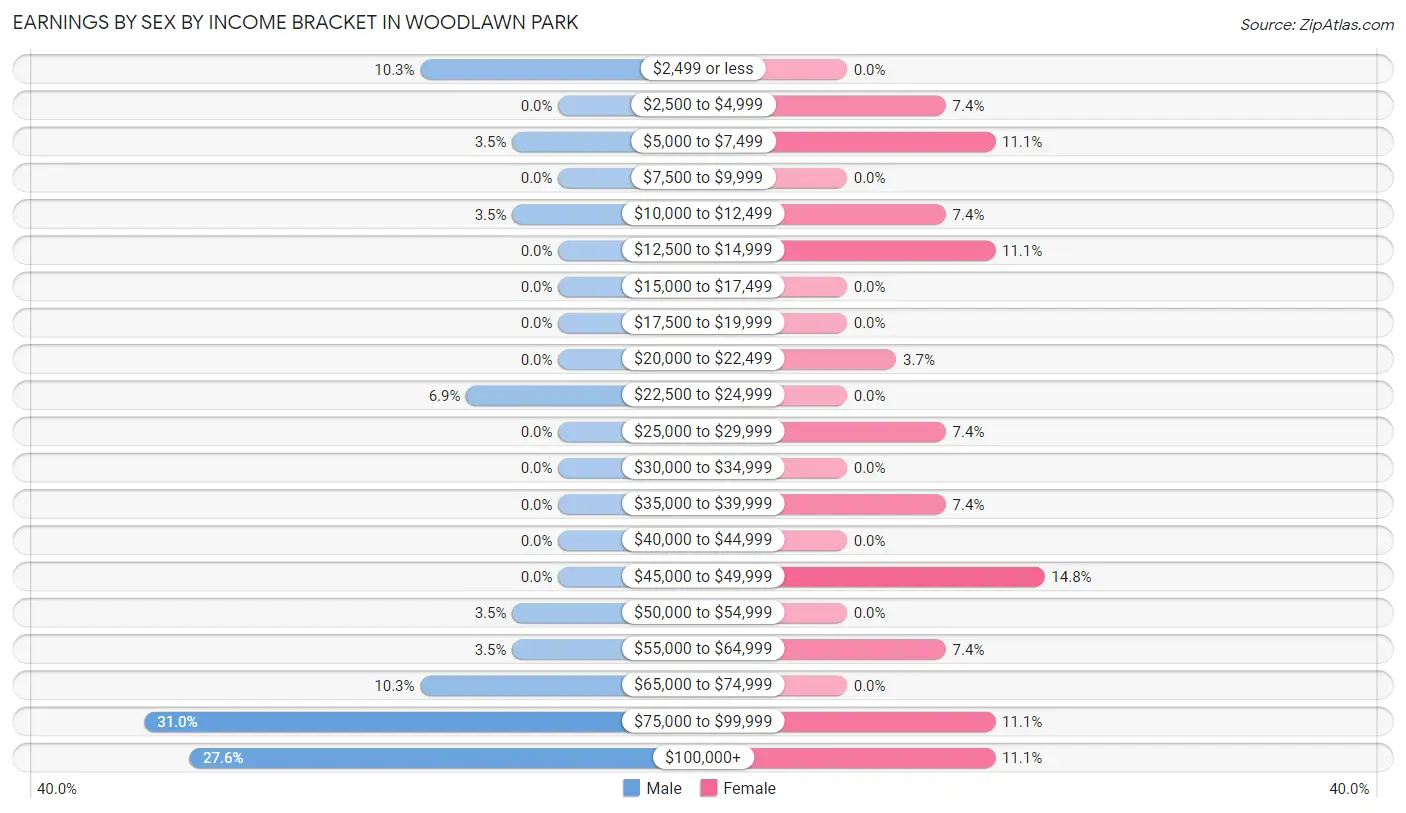
Earnings by Sex by Income Bracket in Woodlawn Park
The most common earnings brackets in Woodlawn Park are $75,000 to $99,999 for men (9 | 31.0%) and $45,000 to $49,999 for women (4 | 14.8%).
| Income | Male | Female |
| $2,499 or less | 3 (10.3%) | 0 (0.0%) |
| $2,500 to $4,999 | 0 (0.0%) | 2 (7.4%) |
| $5,000 to $7,499 | 1 (3.5%) | 3 (11.1%) |
| $7,500 to $9,999 | 0 (0.0%) | 0 (0.0%) |
| $10,000 to $12,499 | 1 (3.5%) | 2 (7.4%) |
| $12,500 to $14,999 | 0 (0.0%) | 3 (11.1%) |
| $15,000 to $17,499 | 0 (0.0%) | 0 (0.0%) |
| $17,500 to $19,999 | 0 (0.0%) | 0 (0.0%) |
| $20,000 to $22,499 | 0 (0.0%) | 1 (3.7%) |
| $22,500 to $24,999 | 2 (6.9%) | 0 (0.0%) |
| $25,000 to $29,999 | 0 (0.0%) | 2 (7.4%) |
| $30,000 to $34,999 | 0 (0.0%) | 0 (0.0%) |
| $35,000 to $39,999 | 0 (0.0%) | 2 (7.4%) |
| $40,000 to $44,999 | 0 (0.0%) | 0 (0.0%) |
| $45,000 to $49,999 | 0 (0.0%) | 4 (14.8%) |
| $50,000 to $54,999 | 1 (3.5%) | 0 (0.0%) |
| $55,000 to $64,999 | 1 (3.5%) | 2 (7.4%) |
| $65,000 to $74,999 | 3 (10.3%) | 0 (0.0%) |
| $75,000 to $99,999 | 9 (31.0%) | 3 (11.1%) |
| $100,000+ | 8 (27.6%) | 3 (11.1%) |
| Total | 29 (100.0%) | 27 (100.0%) |
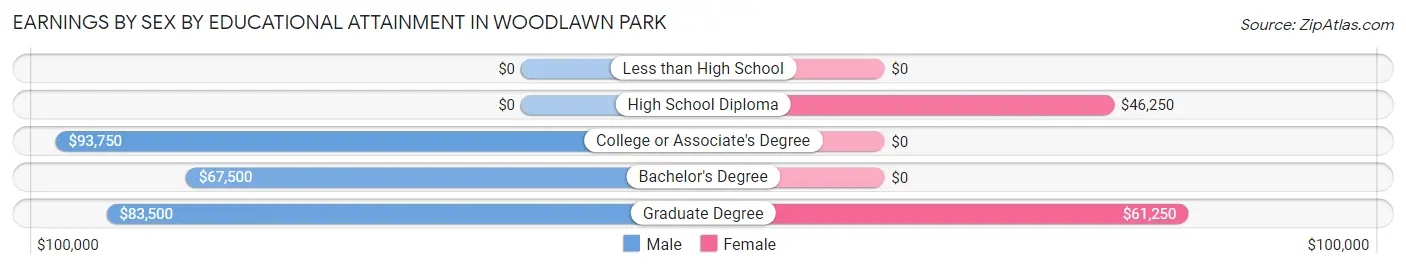
Earnings by Sex by Educational Attainment in Woodlawn Park
Average earnings in Woodlawn Park are $80,000 for men and $46,875 for women, a difference of 41.4%. Men with an educational attainment of college or associate's degree enjoy the highest average annual earnings of $93,750, while those with bachelor's degree education earn the least with $67,500. Women with an educational attainment of graduate degree earn the most with the average annual earnings of $61,250, while those with high school diploma education have the smallest earnings of $46,250.
| Educational Attainment | Male Income | Female Income |
| Less than High School | - | - |
| High School Diploma | - | - |
| College or Associate's Degree | $93,750 | $0 |
| Bachelor's Degree | $67,500 | $0 |
| Graduate Degree | $83,500 | $61,250 |
| Total | $80,000 | $46,875 |
Family Income in Woodlawn Park
Family Income Brackets in Woodlawn Park
According to the Woodlawn Park family income data, there are 10 families falling into the $75,000 to $99,999 income range, which is the most common income bracket and makes up 26.3% of all families.
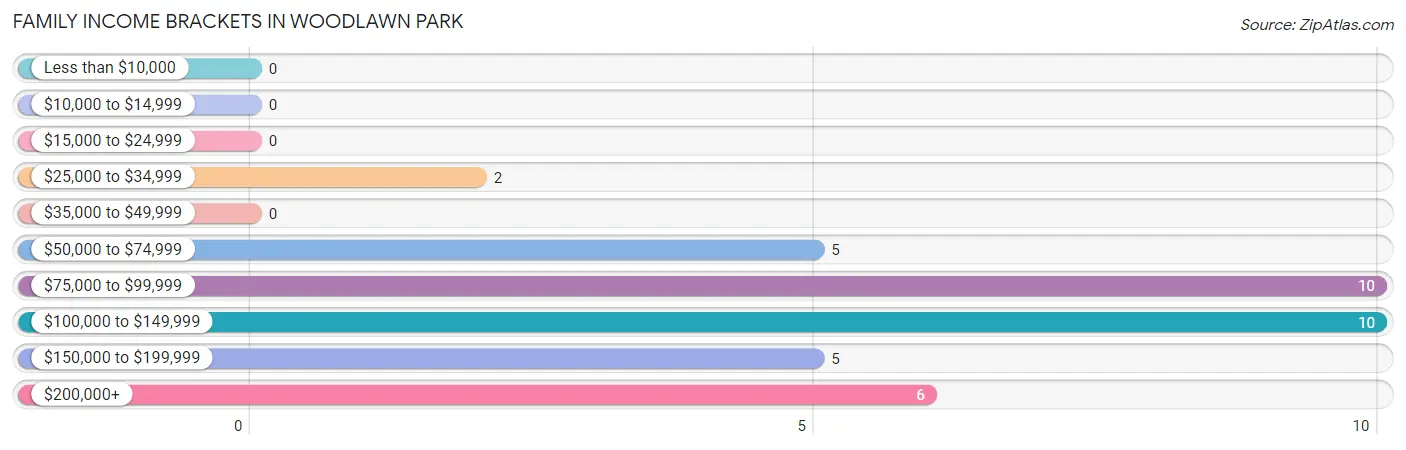
| Income Bracket | # Families | % Families |
| Less than $10,000 | 0 | 0.0% |
| $10,000 to $14,999 | 0 | 0.0% |
| $15,000 to $24,999 | 0 | 0.0% |
| $25,000 to $34,999 | 2 | 5.3% |
| $35,000 to $49,999 | 0 | 0.0% |
| $50,000 to $74,999 | 5 | 13.2% |
| $75,000 to $99,999 | 10 | 26.3% |
| $100,000 to $149,999 | 10 | 26.3% |
| $150,000 to $199,999 | 5 | 13.2% |
| $200,000+ | 6 | 15.8% |
Family Income by Famaliy Size in Woodlawn Park
3-person families (4 | 10.5%) account for the highest median family income in Woodlawn Park with $201,250 per family, while 3-person families (4 | 10.5%) have the highest median income of $67,083 per family member.
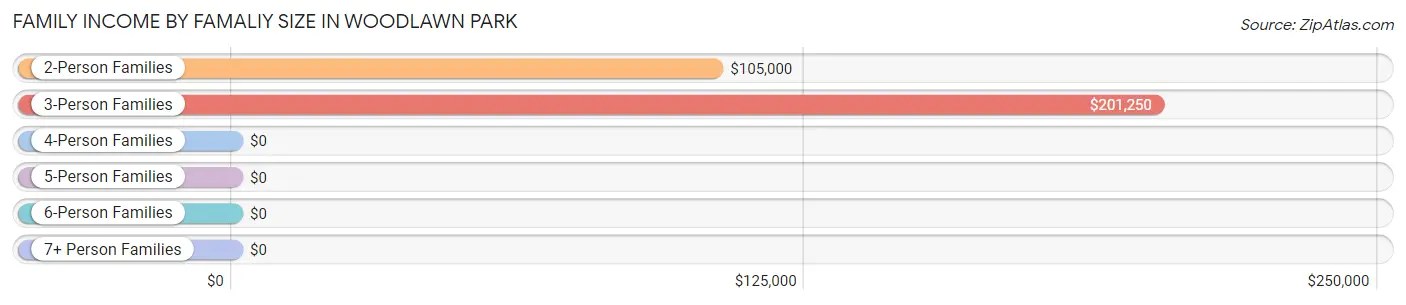
| Income Bracket | # Families | Median Income |
| 2-Person Families | 26 (68.4%) | $105,000 |
| 3-Person Families | 4 (10.5%) | $201,250 |
| 4-Person Families | 2 (5.3%) | $0 |
| 5-Person Families | 1 (2.6%) | $0 |
| 6-Person Families | 0 (0.0%) | $0 |
| 7+ Person Families | 5 (13.2%) | $0 |
| Total | 38 (100.0%) | $105,000 |
Family Income by Number of Earners in Woodlawn Park
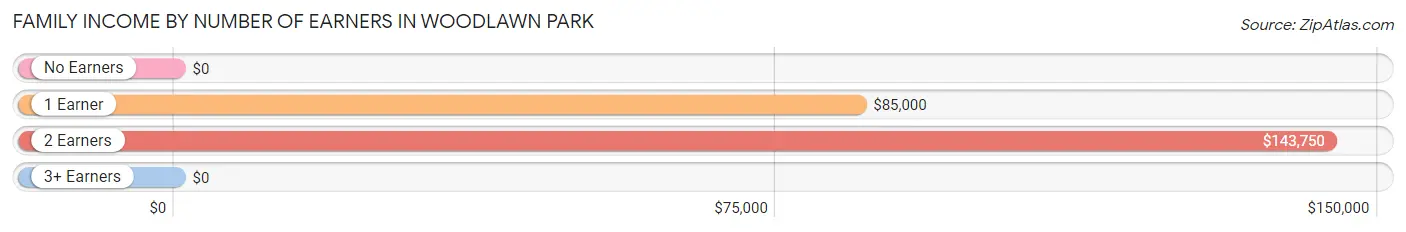
| Number of Earners | # Families | Median Income |
| No Earners | 8 (21.0%) | $0 |
| 1 Earner | 14 (36.8%) | $85,000 |
| 2 Earners | 14 (36.8%) | $143,750 |
| 3+ Earners | 2 (5.3%) | $0 |
| Total | 38 (100.0%) | $105,000 |
Household Income in Woodlawn Park
Household Income Brackets in Woodlawn Park
With 12 households falling in the category, the $100,000 to $149,999 income range is the most frequent in Woodlawn Park, accounting for 24.5% of all households.
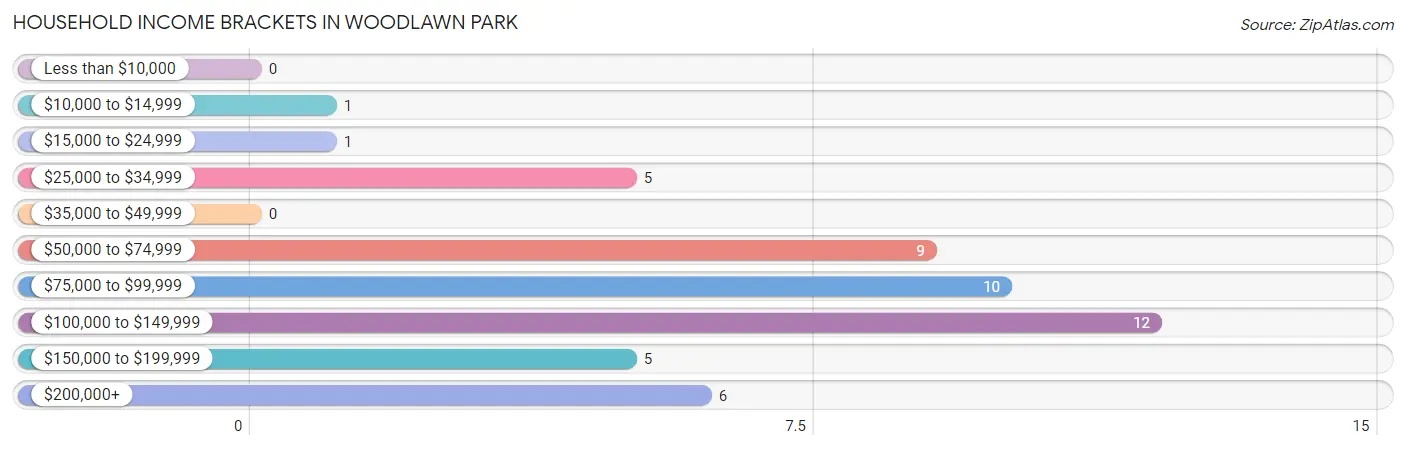
| Income Bracket | # Households | % Households |
| Less than $10,000 | 0 | 0.0% |
| $10,000 to $14,999 | 1 | 2.0% |
| $15,000 to $24,999 | 1 | 2.0% |
| $25,000 to $34,999 | 5 | 10.2% |
| $35,000 to $49,999 | 0 | 0.0% |
| $50,000 to $74,999 | 9 | 18.4% |
| $75,000 to $99,999 | 10 | 20.4% |
| $100,000 to $149,999 | 12 | 24.5% |
| $150,000 to $199,999 | 5 | 10.2% |
| $200,000+ | 6 | 12.2% |
Household Income by Householder Age in Woodlawn Park
The median household income in Woodlawn Park is $88,125, with the highest median household income of $142,500 found in the 45 to 64 years age bracket for the primary householder. A total of 14 households (28.6%) fall into this category.
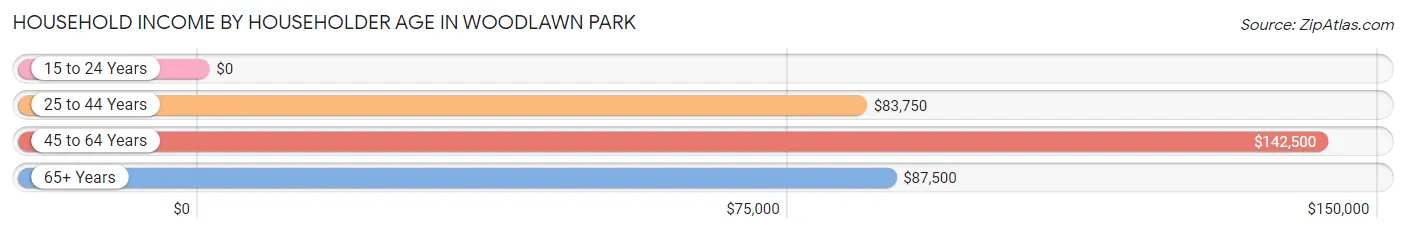
| Income Bracket | # Households | Median Income |
| 15 to 24 Years | 0 (0.0%) | $0 |
| 25 to 44 Years | 11 (22.5%) | $83,750 |
| 45 to 64 Years | 14 (28.6%) | $142,500 |
| 65+ Years | 24 (49.0%) | $87,500 |
| Total | 49 (100.0%) | $88,125 |
Poverty in Woodlawn Park
Income Below Poverty by Sex and Age in Woodlawn Park
With 1.7% poverty level for males and 1.1% for females among the residents of Woodlawn Park, 65 to 74 year old males and 75 year old and over females are the most vulnerable to poverty, with 1 males (16.7%) and 1 females (5.6%) in their respective age groups living below the poverty level.
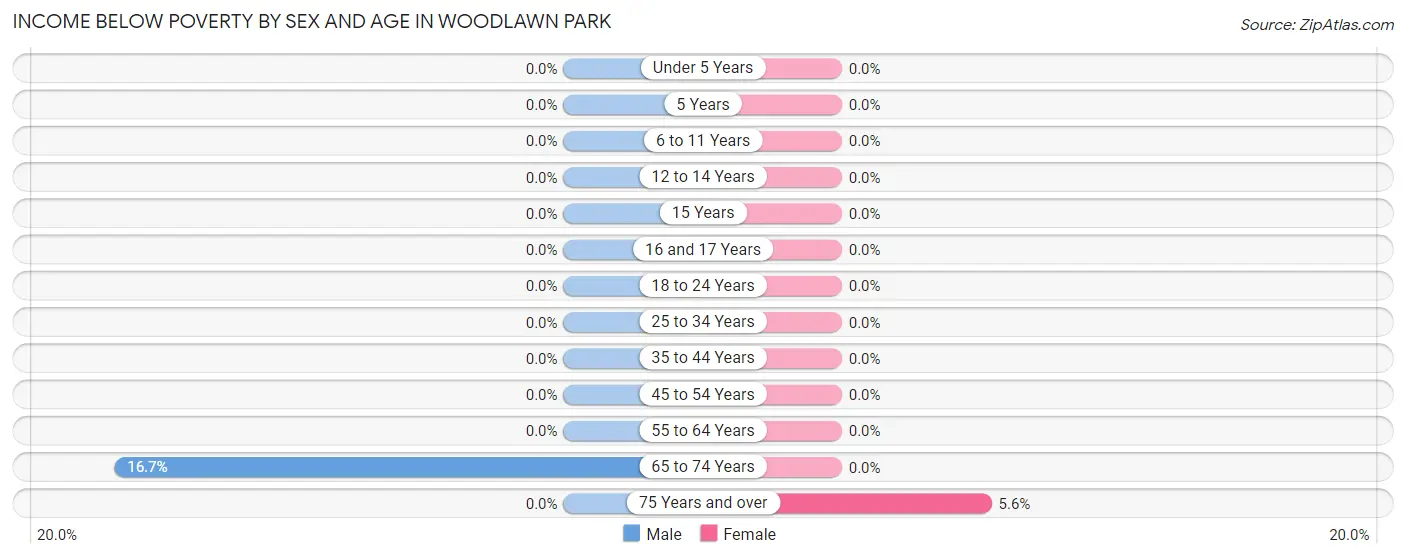
| Age Bracket | Male | Female |
| Under 5 Years | 0 (0.0%) | 0 (0.0%) |
| 5 Years | 0 (0.0%) | 0 (0.0%) |
| 6 to 11 Years | 0 (0.0%) | 0 (0.0%) |
| 12 to 14 Years | 0 (0.0%) | 0 (0.0%) |
| 15 Years | 0 (0.0%) | 0 (0.0%) |
| 16 and 17 Years | 0 (0.0%) | 0 (0.0%) |
| 18 to 24 Years | 0 (0.0%) | 0 (0.0%) |
| 25 to 34 Years | 0 (0.0%) | 0 (0.0%) |
| 35 to 44 Years | 0 (0.0%) | 0 (0.0%) |
| 45 to 54 Years | 0 (0.0%) | 0 (0.0%) |
| 55 to 64 Years | 0 (0.0%) | 0 (0.0%) |
| 65 to 74 Years | 1 (16.7%) | 0 (0.0%) |
| 75 Years and over | 0 (0.0%) | 1 (5.6%) |
| Total | 1 (1.7%) | 1 (1.1%) |
Income Above Poverty by Sex and Age in Woodlawn Park
According to the poverty statistics in Woodlawn Park, males aged under 5 years and females aged under 5 years are the age groups that are most secure financially, with 100.0% of males and 100.0% of females in these age groups living above the poverty line.
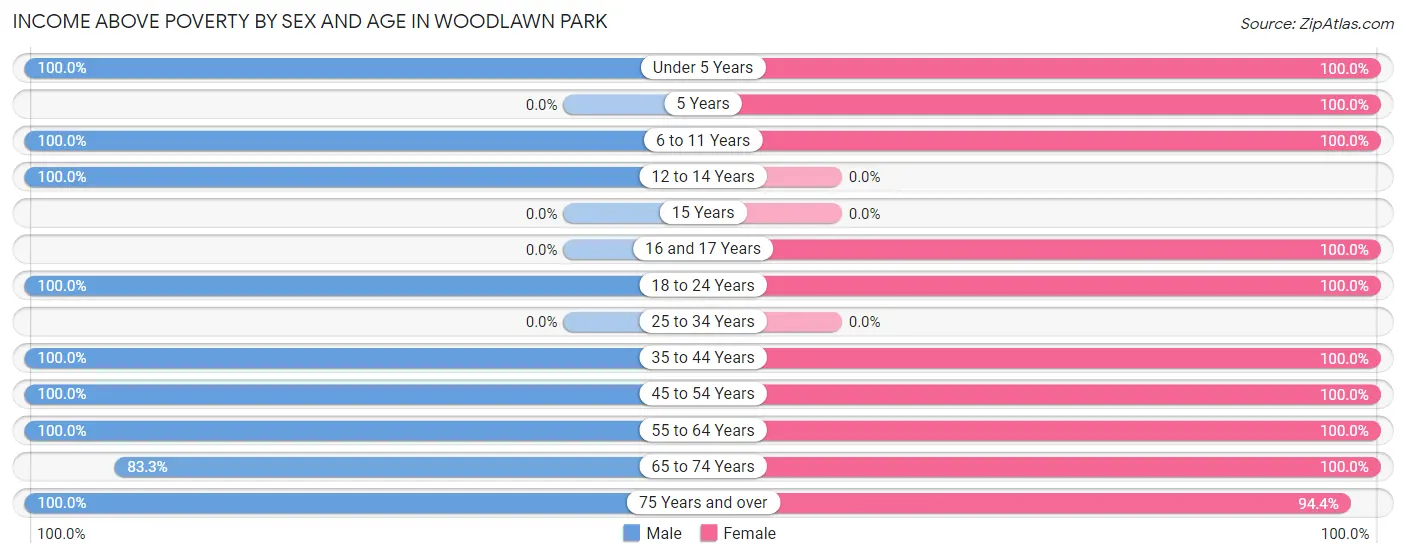
| Age Bracket | Male | Female |
| Under 5 Years | 2 (100.0%) | 7 (100.0%) |
| 5 Years | 0 (0.0%) | 2 (100.0%) |
| 6 to 11 Years | 5 (100.0%) | 7 (100.0%) |
| 12 to 14 Years | 9 (100.0%) | 0 (0.0%) |
| 15 Years | 0 (0.0%) | 0 (0.0%) |
| 16 and 17 Years | 0 (0.0%) | 7 (100.0%) |
| 18 to 24 Years | 1 (100.0%) | 4 (100.0%) |
| 25 to 34 Years | 0 (0.0%) | 0 (0.0%) |
| 35 to 44 Years | 11 (100.0%) | 10 (100.0%) |
| 45 to 54 Years | 2 (100.0%) | 2 (100.0%) |
| 55 to 64 Years | 13 (100.0%) | 12 (100.0%) |
| 65 to 74 Years | 5 (83.3%) | 18 (100.0%) |
| 75 Years and over | 11 (100.0%) | 17 (94.4%) |
| Total | 59 (98.3%) | 86 (98.9%) |
Income Below Poverty Among Married-Couple Families in Woodlawn Park
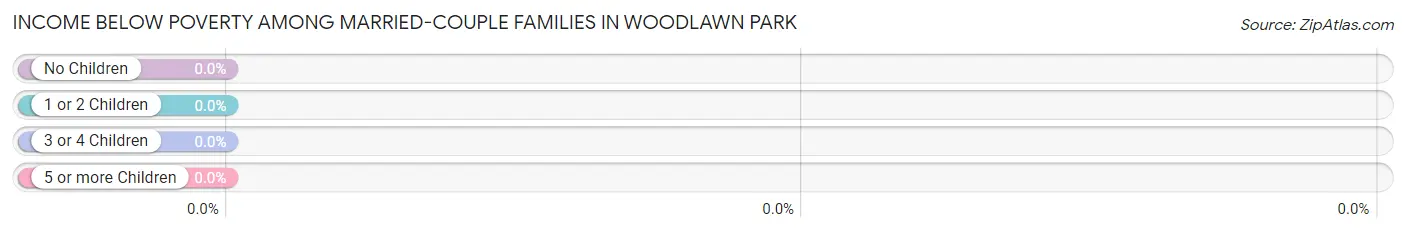
| Children | Above Poverty | Below Poverty |
| No Children | 25 (100.0%) | 0 (0.0%) |
| 1 or 2 Children | 4 (100.0%) | 0 (0.0%) |
| 3 or 4 Children | 1 (100.0%) | 0 (0.0%) |
| 5 or more Children | 5 (100.0%) | 0 (0.0%) |
| Total | 35 (100.0%) | 0 (0.0%) |
Income Below Poverty Among Single-Parent Households in Woodlawn Park
| Children | Single Father | Single Mother |
| No Children | 0 (0.0%) | 0 (0.0%) |
| 1 or 2 Children | 0 (0.0%) | 0 (0.0%) |
| 3 or 4 Children | 0 (0.0%) | 0 (0.0%) |
| 5 or more Children | 0 (0.0%) | 0 (0.0%) |
| Total | 0 (0.0%) | 0 (0.0%) |
Income Below Poverty Among Married-Couple vs Single-Parent Households in Woodlawn Park
| Children | Married-Couple Families | Single-Parent Households |
| No Children | 0 (0.0%) | 0 (0.0%) |
| 1 or 2 Children | 0 (0.0%) | 0 (0.0%) |
| 3 or 4 Children | 0 (0.0%) | 0 (0.0%) |
| 5 or more Children | 0 (0.0%) | 0 (0.0%) |
| Total | 0 (0.0%) | 0 (0.0%) |
Race in Woodlawn Park
The most populous races in Woodlawn Park are White / Caucasian (145 | 98.6%), and Two or more Races (2 | 1.4%).
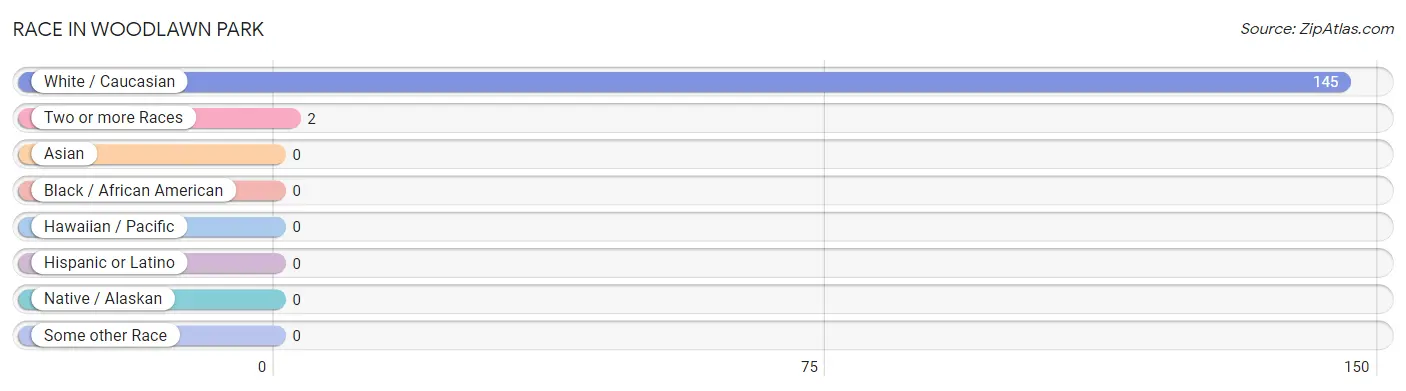
| Race | # Population | % Population |
| Asian | 0 | 0.0% |
| Black / African American | 0 | 0.0% |
| Hawaiian / Pacific | 0 | 0.0% |
| Hispanic or Latino | 0 | 0.0% |
| Native / Alaskan | 0 | 0.0% |
| White / Caucasian | 145 | 98.6% |
| Two or more Races | 2 | 1.4% |
| Some other Race | 0 | 0.0% |
| Total | 147 | 100.0% |
Ancestry in Woodlawn Park
The most populous ancestries reported in Woodlawn Park are English (79 | 53.7%), Dutch (34 | 23.1%), German (24 | 16.3%), Irish (24 | 16.3%), and American (5 | 3.4%), together accounting for 112.9% of all Woodlawn Park residents.
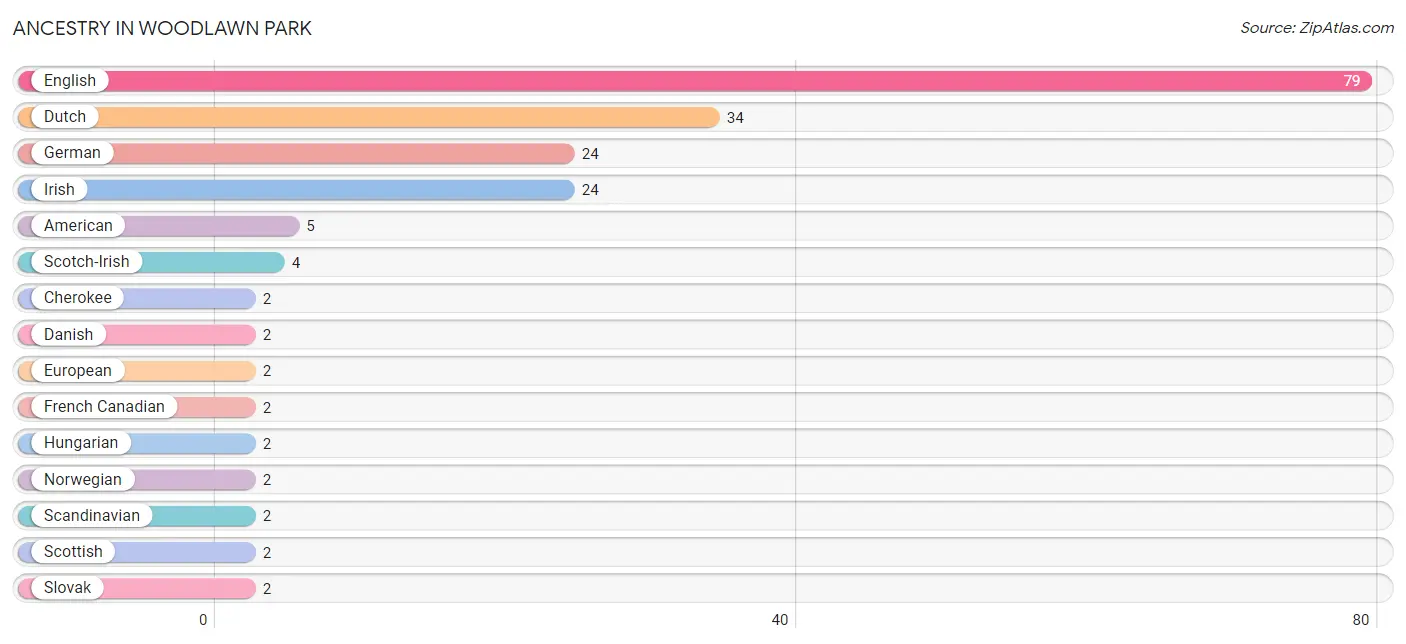
| Ancestry | # Population | % Population |
| American | 5 | 3.4% |
| Cherokee | 2 | 1.4% |
| Danish | 2 | 1.4% |
| Dutch | 34 | 23.1% |
| English | 79 | 53.7% |
| European | 2 | 1.4% |
| French Canadian | 2 | 1.4% |
| German | 24 | 16.3% |
| Greek | 1 | 0.7% |
| Hungarian | 2 | 1.4% |
| Irish | 24 | 16.3% |
| Northern European | 1 | 0.7% |
| Norwegian | 2 | 1.4% |
| Scandinavian | 2 | 1.4% |
| Scotch-Irish | 4 | 2.7% |
| Scottish | 2 | 1.4% |
| Slovak | 2 | 1.4% |
| Swiss | 2 | 1.4% |
| Welsh | 2 | 1.4% | View All 19 Rows |
Immigrants in Woodlawn Park

| Immigration Origin | # Population | % Population | View All 0 Rows |
Sex and Age in Woodlawn Park
Sex and Age in Woodlawn Park
The most populous age groups in Woodlawn Park are 10 to 14 Years (14 | 23.3%) for men and 65 to 69 Years (15 | 17.2%) for women.
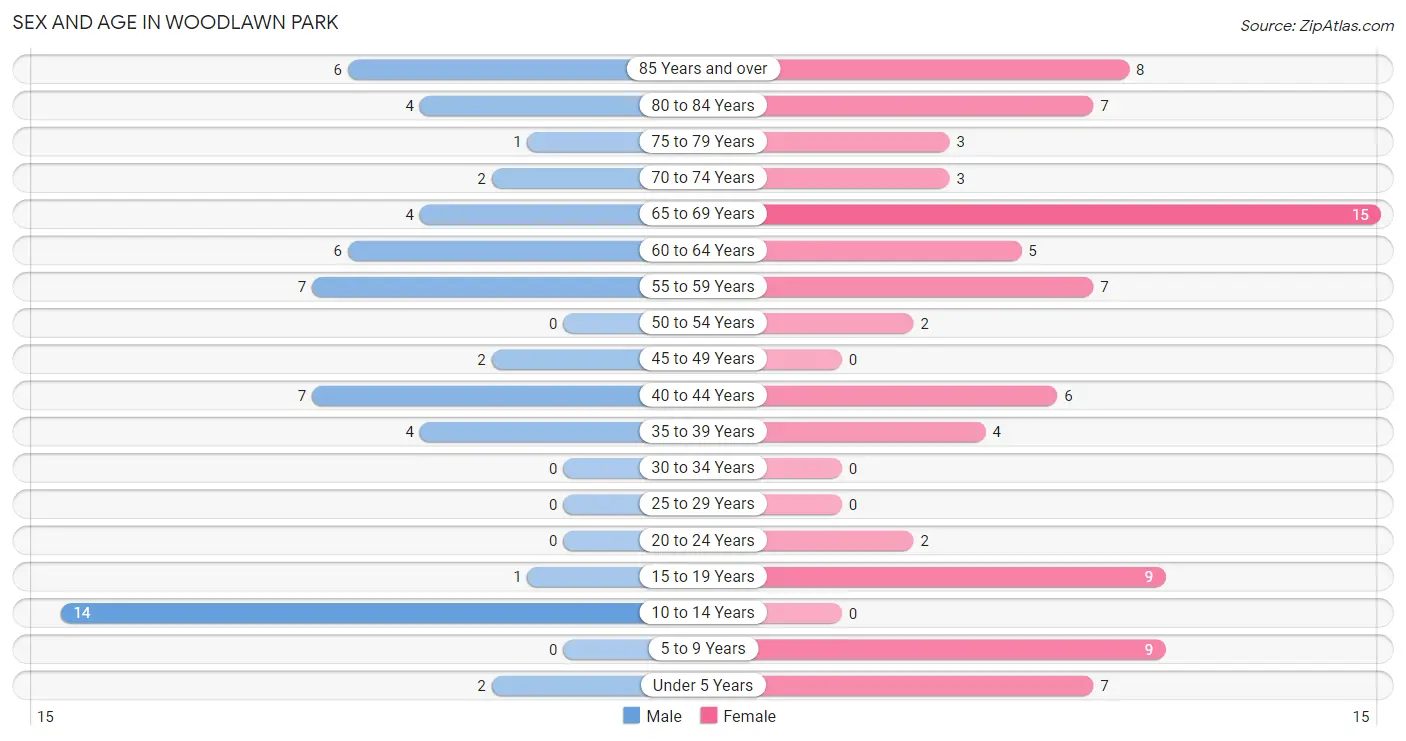
| Age Bracket | Male | Female |
| Under 5 Years | 2 (3.3%) | 7 (8.1%) |
| 5 to 9 Years | 0 (0.0%) | 9 (10.3%) |
| 10 to 14 Years | 14 (23.3%) | 0 (0.0%) |
| 15 to 19 Years | 1 (1.7%) | 9 (10.3%) |
| 20 to 24 Years | 0 (0.0%) | 2 (2.3%) |
| 25 to 29 Years | 0 (0.0%) | 0 (0.0%) |
| 30 to 34 Years | 0 (0.0%) | 0 (0.0%) |
| 35 to 39 Years | 4 (6.7%) | 4 (4.6%) |
| 40 to 44 Years | 7 (11.7%) | 6 (6.9%) |
| 45 to 49 Years | 2 (3.3%) | 0 (0.0%) |
| 50 to 54 Years | 0 (0.0%) | 2 (2.3%) |
| 55 to 59 Years | 7 (11.7%) | 7 (8.1%) |
| 60 to 64 Years | 6 (10.0%) | 5 (5.8%) |
| 65 to 69 Years | 4 (6.7%) | 15 (17.2%) |
| 70 to 74 Years | 2 (3.3%) | 3 (3.5%) |
| 75 to 79 Years | 1 (1.7%) | 3 (3.5%) |
| 80 to 84 Years | 4 (6.7%) | 7 (8.1%) |
| 85 Years and over | 6 (10.0%) | 8 (9.2%) |
| Total | 60 (100.0%) | 87 (100.0%) |
Families and Households in Woodlawn Park
Median Family Size in Woodlawn Park
The median family size in Woodlawn Park is 3.53 persons per family, with married-couple families (35 | 92.1%) accounting for the largest median family size of 3.63 persons per family. On the other hand, single male/father families (1 | 2.6%) represent the smallest median family size with 2.00 persons per family.
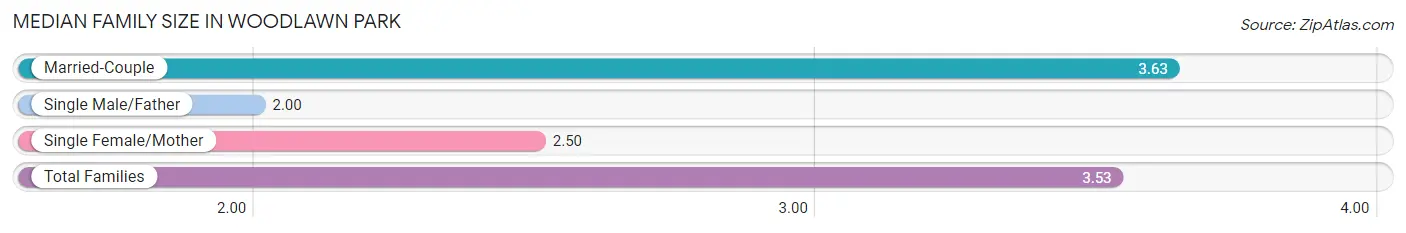
| Family Type | # Families | Family Size |
| Married-Couple | 35 (92.1%) | 3.63 |
| Single Male/Father | 1 (2.6%) | 2.00 |
| Single Female/Mother | 2 (5.3%) | 2.50 |
| Total Families | 38 (100.0%) | 3.53 |
Median Household Size in Woodlawn Park
The median household size in Woodlawn Park is 3.00 persons per household, with married-couple households (35 | 71.4%) accounting for the largest median household size of 3.63 persons per household. non-family households (11 | 22.5%) represent the smallest median household size with 1.09 persons per household.
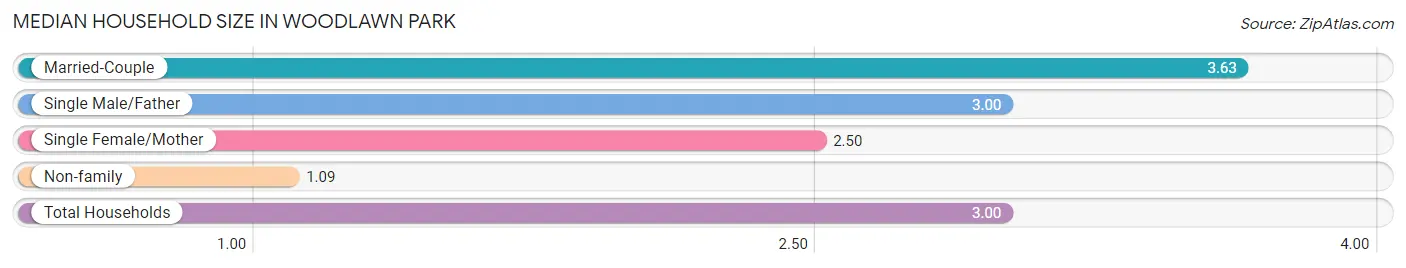
| Household Type | # Households | Household Size |
| Married-Couple | 35 (71.4%) | 3.63 |
| Single Male/Father | 1 (2.0%) | 3.00 |
| Single Female/Mother | 2 (4.1%) | 2.50 |
| Non-family | 11 (22.5%) | 1.09 |
| Total Households | 49 (100.0%) | 3.00 |
Household Size by Marriage Status in Woodlawn Park
Out of a total of 49 households in Woodlawn Park, 38 (77.5%) are family households, while 11 (22.5%) are nonfamily households. The most numerous type of family households are 2-person households, comprising 25, and the most common type of nonfamily households are 1-person households, comprising 10.
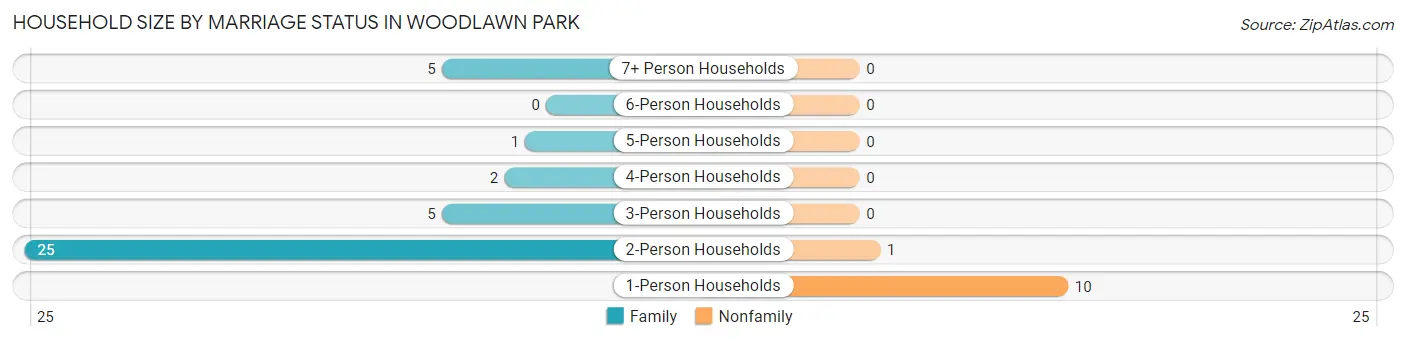
| Household Size | Family Households | Nonfamily Households |
| 1-Person Households | - | 10 (20.4%) |
| 2-Person Households | 25 (51.0%) | 1 (2.0%) |
| 3-Person Households | 5 (10.2%) | 0 (0.0%) |
| 4-Person Households | 2 (4.1%) | 0 (0.0%) |
| 5-Person Households | 1 (2.0%) | 0 (0.0%) |
| 6-Person Households | 0 (0.0%) | 0 (0.0%) |
| 7+ Person Households | 5 (10.2%) | 0 (0.0%) |
| Total | 38 (77.5%) | 11 (22.5%) |
Female Fertility in Woodlawn Park
Fertility by Age in Woodlawn Park
Average fertility rate in Woodlawn Park is 143.0 births per 1,000 women. Women in the age bracket of 20 to 34 years have the highest fertility rate with 500.0 births per 1,000 women. Women in the age bracket of 35 to 50 years acount for 66.7% of all women with births.
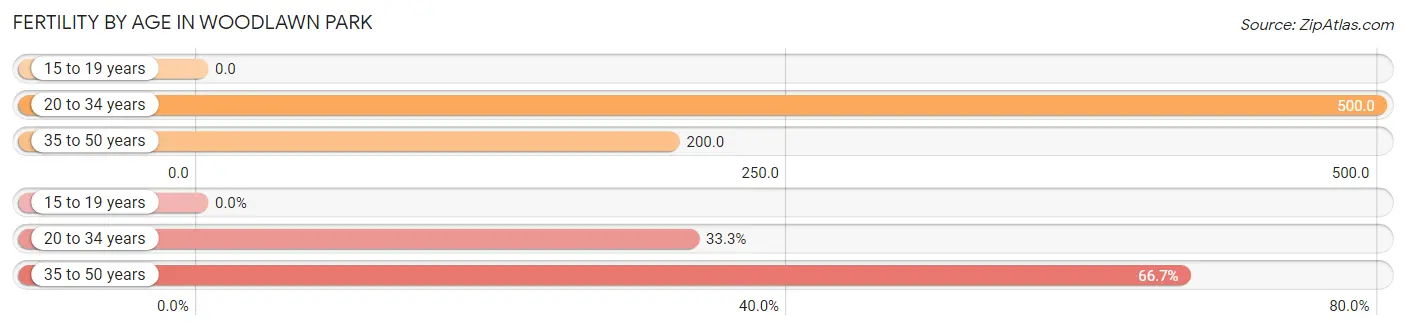
| Age Bracket | Women with Births | Births / 1,000 Women |
| 15 to 19 years | 0 (0.0%) | 0.0 |
| 20 to 34 years | 1 (33.3%) | 500.0 |
| 35 to 50 years | 2 (66.7%) | 200.0 |
| Total | 3 (100.0%) | 143.0 |
Fertility by Age by Marriage Status in Woodlawn Park
66.7% of women with births (3) in Woodlawn Park are married. The highest percentage of unmarried women with births falls into 20 to 34 years age bracket with 100.0% of them unmarried at the time of birth, while the lowest percentage of unmarried women with births belong to 35 to 50 years age bracket with 0.0% of them unmarried.
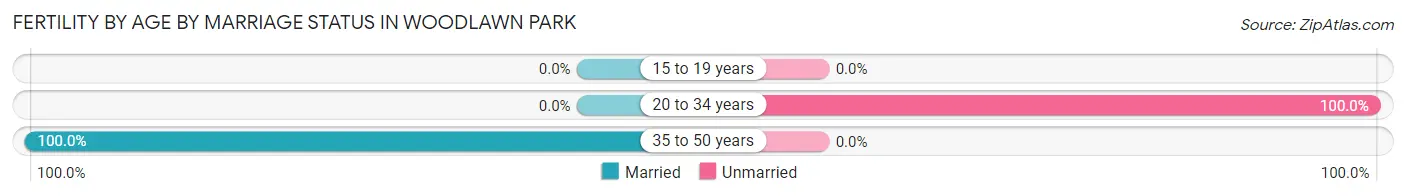
| Age Bracket | Married | Unmarried |
| 15 to 19 years | 0 (0.0%) | 0 (0.0%) |
| 20 to 34 years | 0 (0.0%) | 1 (100.0%) |
| 35 to 50 years | 2 (100.0%) | 0 (0.0%) |
| Total | 2 (66.7%) | 1 (33.3%) |
Fertility by Education in Woodlawn Park
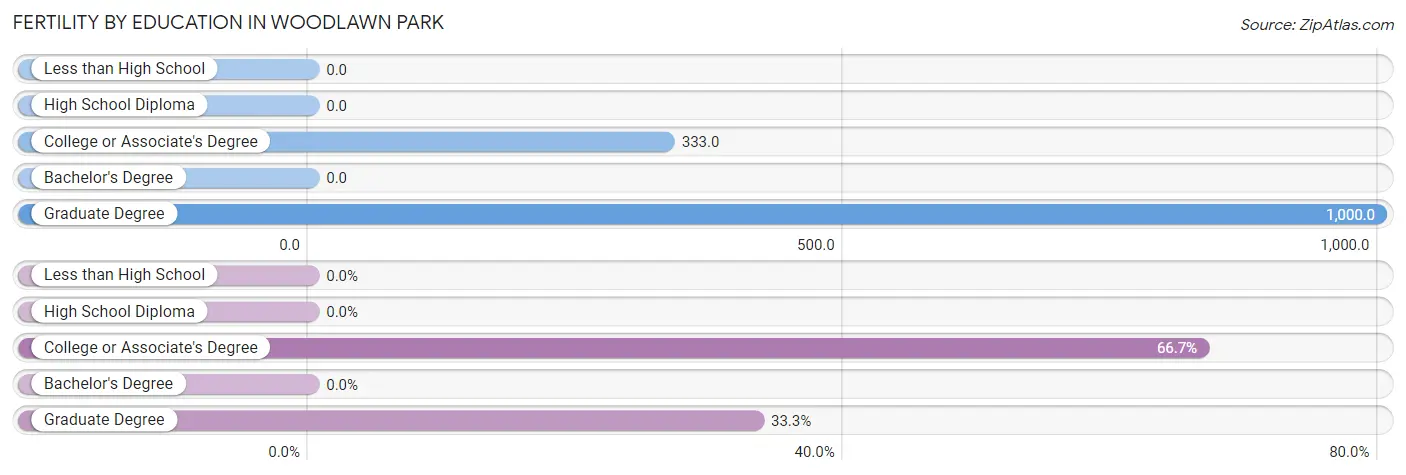
| Educational Attainment | Women with Births | Births / 1,000 Women |
| Less than High School | 0 (0.0%) | 0.0 |
| High School Diploma | 0 (0.0%) | 0.0 |
| College or Associate's Degree | 2 (66.7%) | 333.0 |
| Bachelor's Degree | 0 (0.0%) | 0.0 |
| Graduate Degree | 1 (33.3%) | 1,000.0 |
| Total | 3 (100.0%) | 143.0 |
Fertility by Education by Marriage Status in Woodlawn Park
33.3% of women with births in Woodlawn Park are unmarried. Women with the educational attainment of graduate degree are most likely to be married with 100.0% of them married at childbirth, while women with the educational attainment of college or associate's degree are least likely to be married with 50.0% of them unmarried at childbirth.
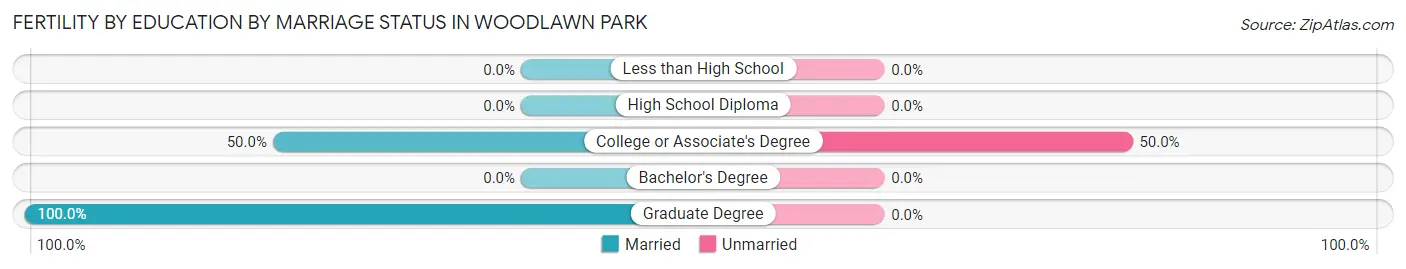
| Educational Attainment | Married | Unmarried |
| Less than High School | 0 (0.0%) | 0 (0.0%) |
| High School Diploma | 0 (0.0%) | 0 (0.0%) |
| College or Associate's Degree | 1 (50.0%) | 1 (50.0%) |
| Bachelor's Degree | 0 (0.0%) | 0 (0.0%) |
| Graduate Degree | 1 (100.0%) | 0 (0.0%) |
| Total | 2 (66.7%) | 1 (33.3%) |
Employment Characteristics in Woodlawn Park
Employment by Class of Employer in Woodlawn Park
Among the 53 employed individuals in Woodlawn Park, private company employees (27 | 50.9%), self-employed (incorporated) (8 | 15.1%), and self-employed (not incorporated) (7 | 13.2%) make up the most common classes of employment.
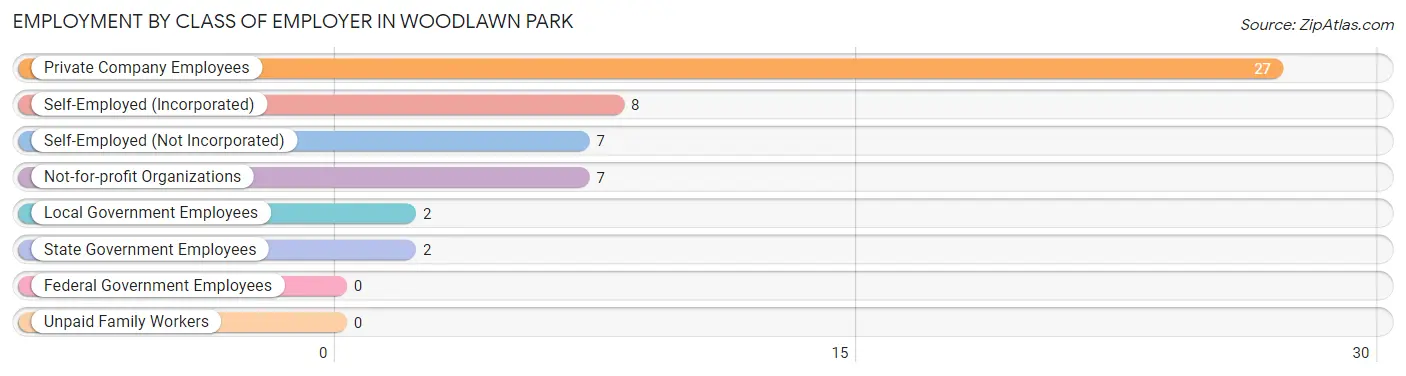
| Employer Class | # Employees | % Employees |
| Private Company Employees | 27 | 50.9% |
| Self-Employed (Incorporated) | 8 | 15.1% |
| Self-Employed (Not Incorporated) | 7 | 13.2% |
| Not-for-profit Organizations | 7 | 13.2% |
| Local Government Employees | 2 | 3.8% |
| State Government Employees | 2 | 3.8% |
| Federal Government Employees | 0 | 0.0% |
| Unpaid Family Workers | 0 | 0.0% |
| Total | 53 | 100.0% |
Employment Status by Age in Woodlawn Park
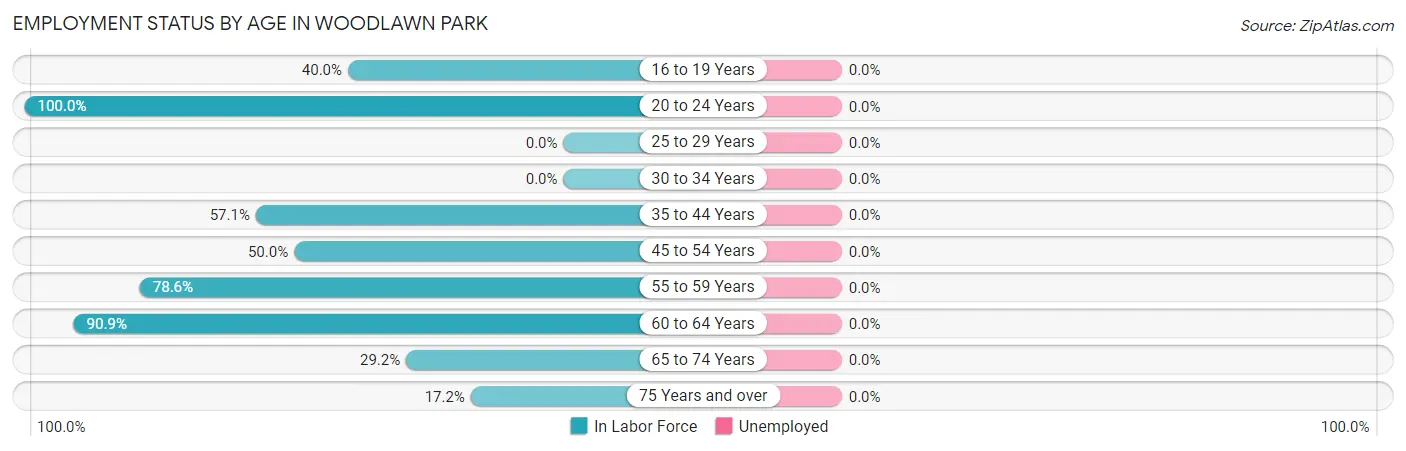
| Age Bracket | In Labor Force | Unemployed |
| 16 to 19 Years | 4 (40.0%) | 0 (0.0%) |
| 20 to 24 Years | 2 (100.0%) | 0 (0.0%) |
| 25 to 29 Years | 0 (0.0%) | 0 (0.0%) |
| 30 to 34 Years | 0 (0.0%) | 0 (0.0%) |
| 35 to 44 Years | 12 (57.1%) | 0 (0.0%) |
| 45 to 54 Years | 2 (50.0%) | 0 (0.0%) |
| 55 to 59 Years | 11 (78.6%) | 0 (0.0%) |
| 60 to 64 Years | 10 (90.9%) | 0 (0.0%) |
| 65 to 74 Years | 7 (29.2%) | 0 (0.0%) |
| 75 Years and over | 5 (17.2%) | 0 (0.0%) |
| Total | 53 (46.1%) | 0 (0.0%) |
Employment Status by Educational Attainment in Woodlawn Park
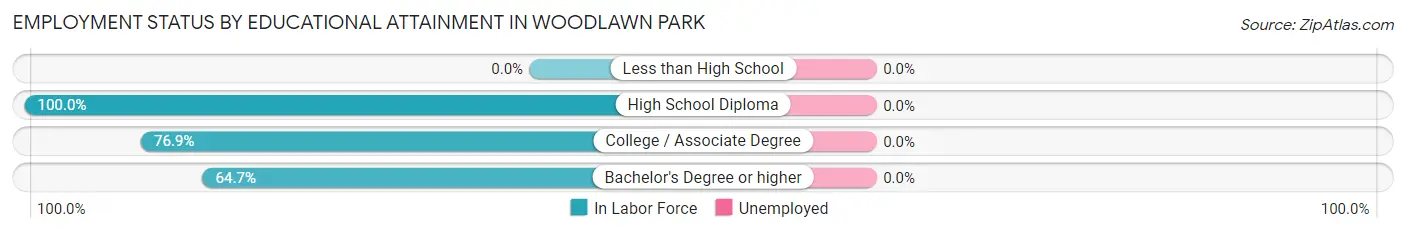
| Educational Attainment | In Labor Force | Unemployed |
| Less than High School | 0 (0.0%) | 0 (0.0%) |
| High School Diploma | 3 (100.0%) | 0 (0.0%) |
| College / Associate Degree | 10 (76.9%) | 0 (0.0%) |
| Bachelor's Degree or higher | 22 (64.7%) | 0 (0.0%) |
| Total | 35 (70.0%) | 0 (0.0%) |
Employment Occupations by Sex in Woodlawn Park
Management, Business, Science and Arts Occupations
The most common Management, Business, Science and Arts occupations in Woodlawn Park are Community & Social Service (14 | 26.4%), Management (6 | 11.3%), Health Diagnosing & Treating (6 | 11.3%), Health Technologists (6 | 11.3%), and Computers, Engineering & Science (5 | 9.4%).
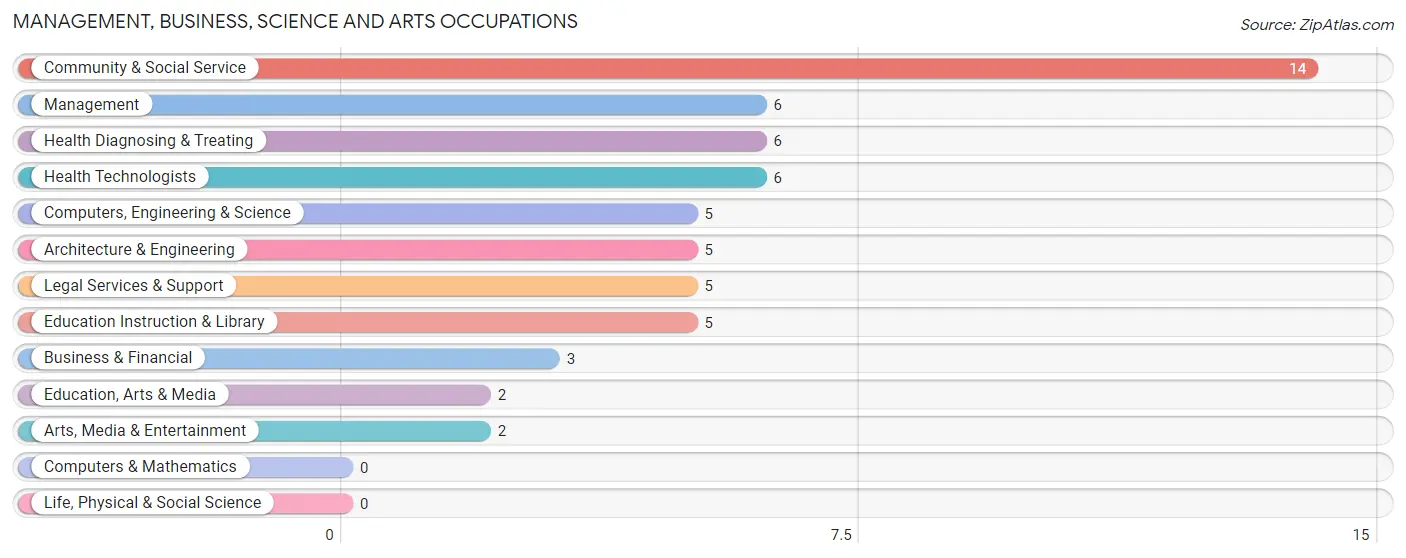
Management, Business, Science and Arts Occupations by Sex
Within the Management, Business, Science and Arts occupations in Woodlawn Park, the most male-oriented occupations are Computers, Engineering & Science (100.0%), Architecture & Engineering (100.0%), and Education, Arts & Media (100.0%), while the most female-oriented occupations are Business & Financial (100.0%), Education Instruction & Library (100.0%), and Arts, Media & Entertainment (100.0%).
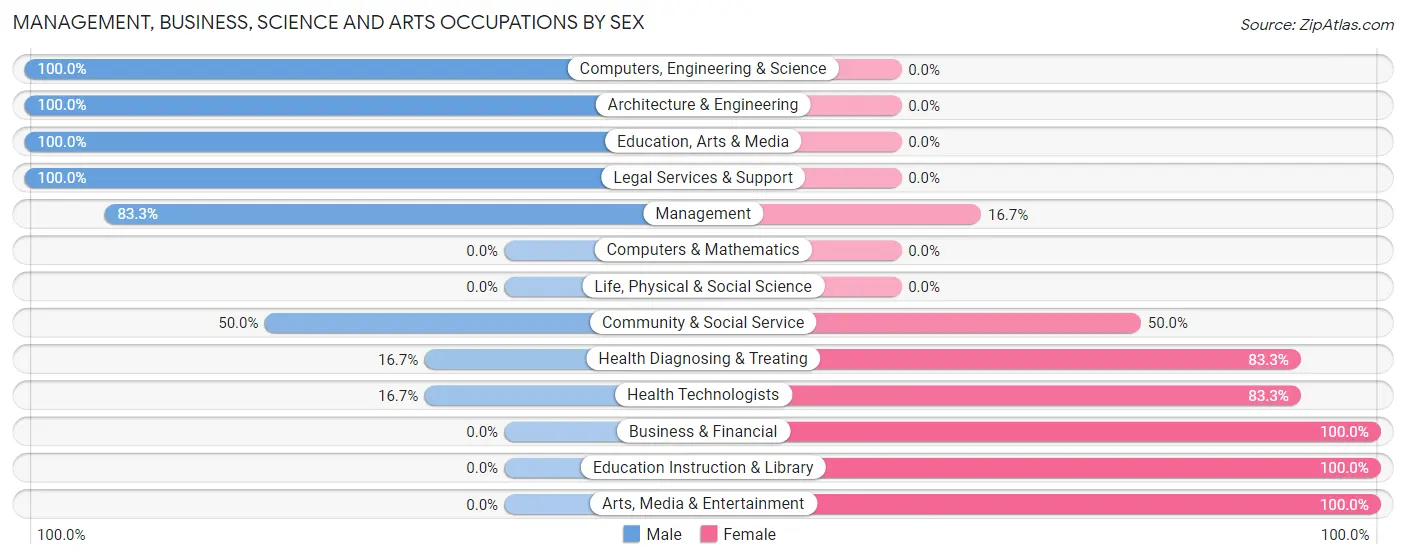
| Occupation | Male | Female |
| Management | 5 (83.3%) | 1 (16.7%) |
| Business & Financial | 0 (0.0%) | 3 (100.0%) |
| Computers, Engineering & Science | 5 (100.0%) | 0 (0.0%) |
| Computers & Mathematics | 0 (0.0%) | 0 (0.0%) |
| Architecture & Engineering | 5 (100.0%) | 0 (0.0%) |
| Life, Physical & Social Science | 0 (0.0%) | 0 (0.0%) |
| Community & Social Service | 7 (50.0%) | 7 (50.0%) |
| Education, Arts & Media | 2 (100.0%) | 0 (0.0%) |
| Legal Services & Support | 5 (100.0%) | 0 (0.0%) |
| Education Instruction & Library | 0 (0.0%) | 5 (100.0%) |
| Arts, Media & Entertainment | 0 (0.0%) | 2 (100.0%) |
| Health Diagnosing & Treating | 1 (16.7%) | 5 (83.3%) |
| Health Technologists | 1 (16.7%) | 5 (83.3%) |
| Total (Category) | 18 (52.9%) | 16 (47.1%) |
| Total (Overall) | 26 (49.1%) | 27 (50.9%) |
Services Occupations
The most common Services occupations in Woodlawn Park are Food Preparation & Serving (3 | 5.7%), Cleaning & Maintenance (3 | 5.7%), and Personal Care & Service (3 | 5.7%).
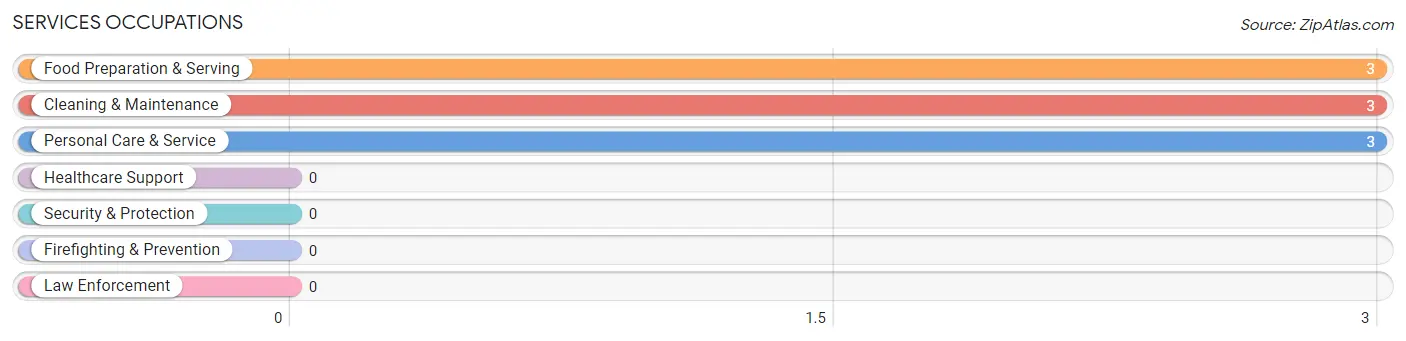
Services Occupations by Sex
Within the Services occupations in Woodlawn Park, the most male-oriented occupations are Cleaning & Maintenance (33.3%), and Personal Care & Service (33.3%), while the most female-oriented occupations are Food Preparation & Serving (100.0%), Cleaning & Maintenance (66.7%), and Personal Care & Service (66.7%).
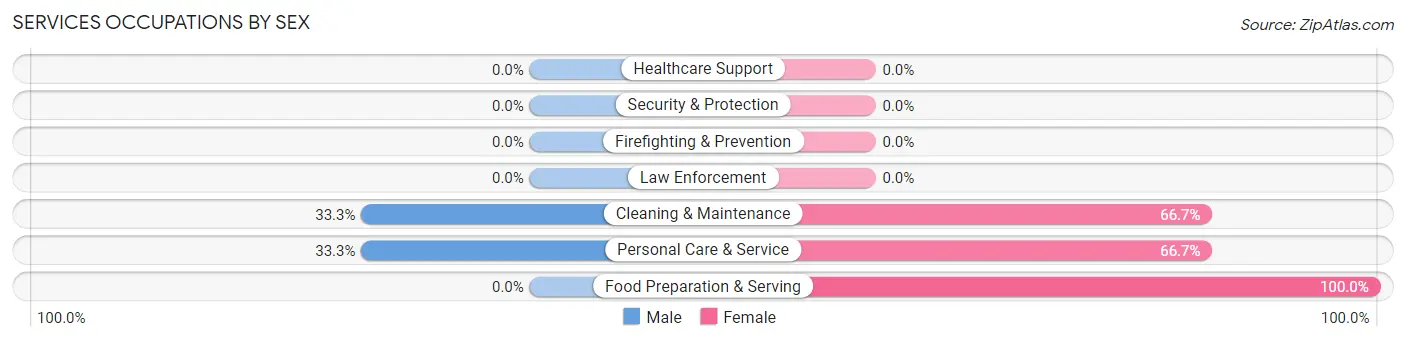
| Occupation | Male | Female |
| Healthcare Support | 0 (0.0%) | 0 (0.0%) |
| Security & Protection | 0 (0.0%) | 0 (0.0%) |
| Firefighting & Prevention | 0 (0.0%) | 0 (0.0%) |
| Law Enforcement | 0 (0.0%) | 0 (0.0%) |
| Food Preparation & Serving | 0 (0.0%) | 3 (100.0%) |
| Cleaning & Maintenance | 1 (33.3%) | 2 (66.7%) |
| Personal Care & Service | 1 (33.3%) | 2 (66.7%) |
| Total (Category) | 2 (22.2%) | 7 (77.8%) |
| Total (Overall) | 26 (49.1%) | 27 (50.9%) |
Sales and Office Occupations
The most common Sales and Office occupations in Woodlawn Park are Sales & Related (3 | 5.7%), and Office & Administration (3 | 5.7%).
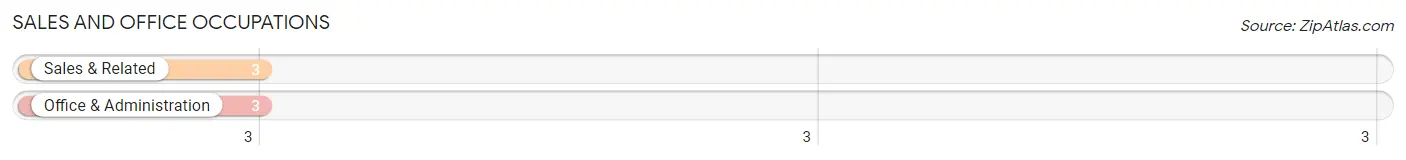
Sales and Office Occupations by Sex
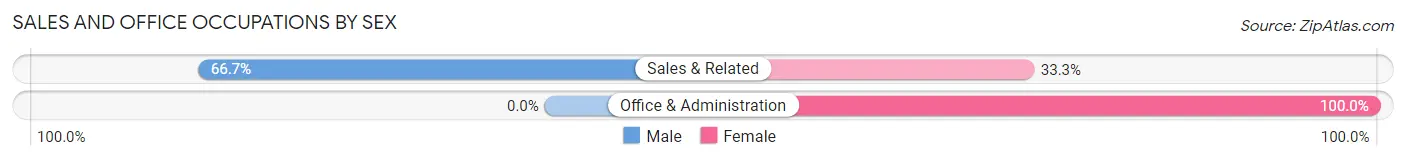
| Occupation | Male | Female |
| Sales & Related | 2 (66.7%) | 1 (33.3%) |
| Office & Administration | 0 (0.0%) | 3 (100.0%) |
| Total (Category) | 2 (33.3%) | 4 (66.7%) |
| Total (Overall) | 26 (49.1%) | 27 (50.9%) |
Natural Resources, Construction and Maintenance Occupations
The most common Natural Resources, Construction and Maintenance occupations in Woodlawn Park are , and Construction & Extraction (3 | 5.7%).
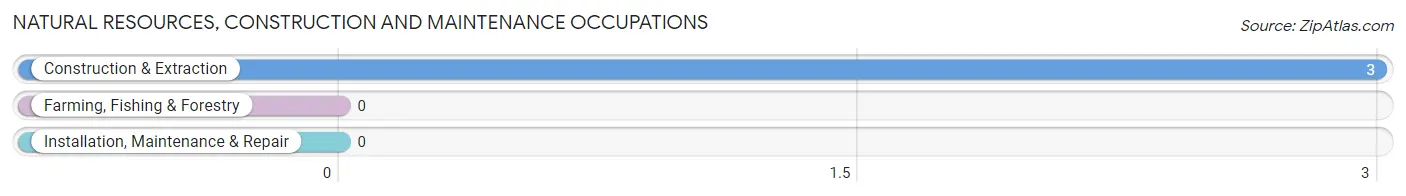
Natural Resources, Construction and Maintenance Occupations by Sex
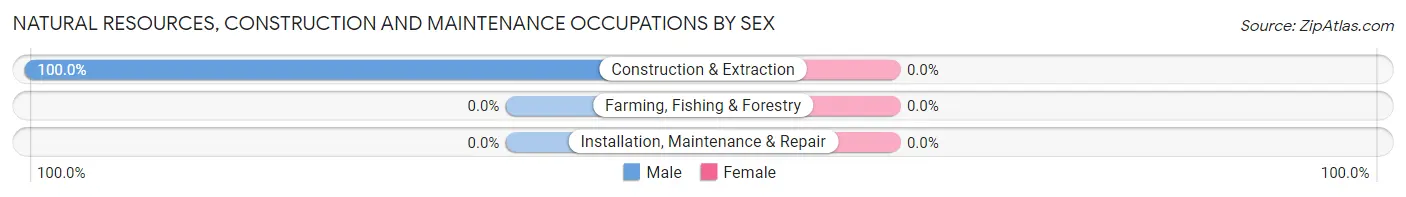
| Occupation | Male | Female |
| Farming, Fishing & Forestry | 0 (0.0%) | 0 (0.0%) |
| Construction & Extraction | 3 (100.0%) | 0 (0.0%) |
| Installation, Maintenance & Repair | 0 (0.0%) | 0 (0.0%) |
| Total (Category) | 3 (100.0%) | 0 (0.0%) |
| Total (Overall) | 26 (49.1%) | 27 (50.9%) |
Production, Transportation and Moving Occupations
The most common Production, Transportation and Moving occupations in Woodlawn Park are , and Production (1 | 1.9%).
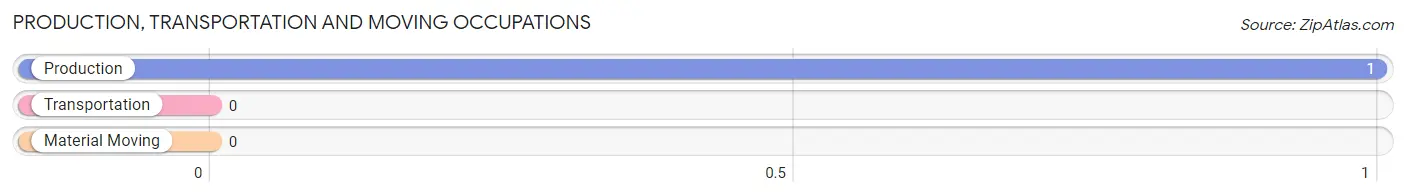
Production, Transportation and Moving Occupations by Sex
| Occupation | Male | Female |
| Production | 1 (100.0%) | 0 (0.0%) |
| Transportation | 0 (0.0%) | 0 (0.0%) |
| Material Moving | 0 (0.0%) | 0 (0.0%) |
| Total (Category) | 1 (100.0%) | 0 (0.0%) |
| Total (Overall) | 26 (49.1%) | 27 (50.9%) |
Employment Industries by Sex in Woodlawn Park
Employment Industries in Woodlawn Park
The major employment industries in Woodlawn Park include Professional & Scientific (10 | 18.9%), Educational Services (7 | 13.2%), Health Care & Social Assistance (5 | 9.4%), Construction (4 | 7.5%), and Retail Trade (3 | 5.7%).
Employment Industries by Sex in Woodlawn Park
The Woodlawn Park industries that see more men than women are Mining, Quarrying, & Extraction (100.0%), Wholesale Trade (100.0%), and Finance & Insurance (100.0%), whereas the industries that tend to have a higher number of women are Manufacturing (100.0%), Real Estate, Rental & Leasing (100.0%), and Arts, Entertainment & Recreation (100.0%).
| Industry | Male | Female |
| Agriculture, Fishing & Hunting | 0 (0.0%) | 0 (0.0%) |
| Mining, Quarrying, & Extraction | 2 (100.0%) | 0 (0.0%) |
| Construction | 3 (75.0%) | 1 (25.0%) |
| Manufacturing | 0 (0.0%) | 1 (100.0%) |
| Wholesale Trade | 2 (100.0%) | 0 (0.0%) |
| Retail Trade | 1 (33.3%) | 2 (66.7%) |
| Transportation & Warehousing | 0 (0.0%) | 0 (0.0%) |
| Utilities | 0 (0.0%) | 0 (0.0%) |
| Information | 0 (0.0%) | 0 (0.0%) |
| Finance & Insurance | 1 (100.0%) | 0 (0.0%) |
| Real Estate, Rental & Leasing | 0 (0.0%) | 1 (100.0%) |
| Professional & Scientific | 9 (90.0%) | 1 (10.0%) |
| Enterprise Management | 0 (0.0%) | 0 (0.0%) |
| Administrative & Support | 1 (100.0%) | 0 (0.0%) |
| Educational Services | 2 (28.6%) | 5 (71.4%) |
| Health Care & Social Assistance | 1 (20.0%) | 4 (80.0%) |
| Arts, Entertainment & Recreation | 0 (0.0%) | 3 (100.0%) |
| Accommodation & Food Services | 0 (0.0%) | 3 (100.0%) |
| Public Administration | 0 (0.0%) | 0 (0.0%) |
| Total | 26 (49.1%) | 27 (50.9%) |
Education in Woodlawn Park
School Enrollment in Woodlawn Park
The most common levels of schooling among the 33 students in Woodlawn Park are elementary school (12 | 36.4%), middle school (9 | 27.3%), and high school (8 | 24.2%).
| School Level | # Students | % Students |
| Nursery / Preschool | 1 | 3.0% |
| Kindergarten | 0 | 0.0% |
| Elementary School | 12 | 36.4% |
| Middle School | 9 | 27.3% |
| High School | 8 | 24.2% |
| College / Undergraduate | 3 | 9.1% |
| Graduate / Professional | 0 | 0.0% |
| Total | 33 | 100.0% |
School Enrollment by Age by Funding Source in Woodlawn Park
Out of a total of 33 students who are enrolled in schools in Woodlawn Park, 2 (6.1%) attend a private institution, while the remaining 31 (93.9%) are enrolled in public schools. The age group of 5 to 9 year old has the highest likelihood of being enrolled in private schools, with 2 (28.6% in the age bracket) enrolled. Conversely, the age group of 3 to 4 year olds has the lowest likelihood of being enrolled in a private school, with 1 (100.0% in the age bracket) attending a public institution.
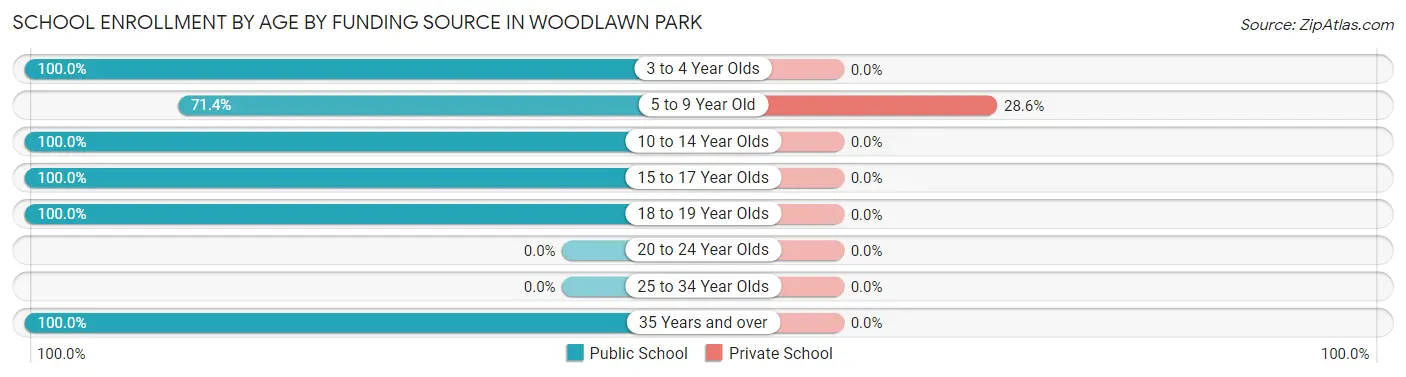
| Age Bracket | Public School | Private School |
| 3 to 4 Year Olds | 1 (100.0%) | 0 (0.0%) |
| 5 to 9 Year Old | 5 (71.4%) | 2 (28.6%) |
| 10 to 14 Year Olds | 14 (100.0%) | 0 (0.0%) |
| 15 to 17 Year Olds | 7 (100.0%) | 0 (0.0%) |
| 18 to 19 Year Olds | 3 (100.0%) | 0 (0.0%) |
| 20 to 24 Year Olds | 0 (0.0%) | 0 (0.0%) |
| 25 to 34 Year Olds | 0 (0.0%) | 0 (0.0%) |
| 35 Years and over | 1 (100.0%) | 0 (0.0%) |
| Total | 31 (93.9%) | 2 (6.1%) |
Educational Attainment by Field of Study in Woodlawn Park
Education (22 | 29.7%), business (16 | 21.6%), science & technology (8 | 10.8%), liberal arts & history (5 | 6.8%), and social sciences (4 | 5.4%) are the most common fields of study among 74 individuals in Woodlawn Park who have obtained a bachelor's degree or higher.
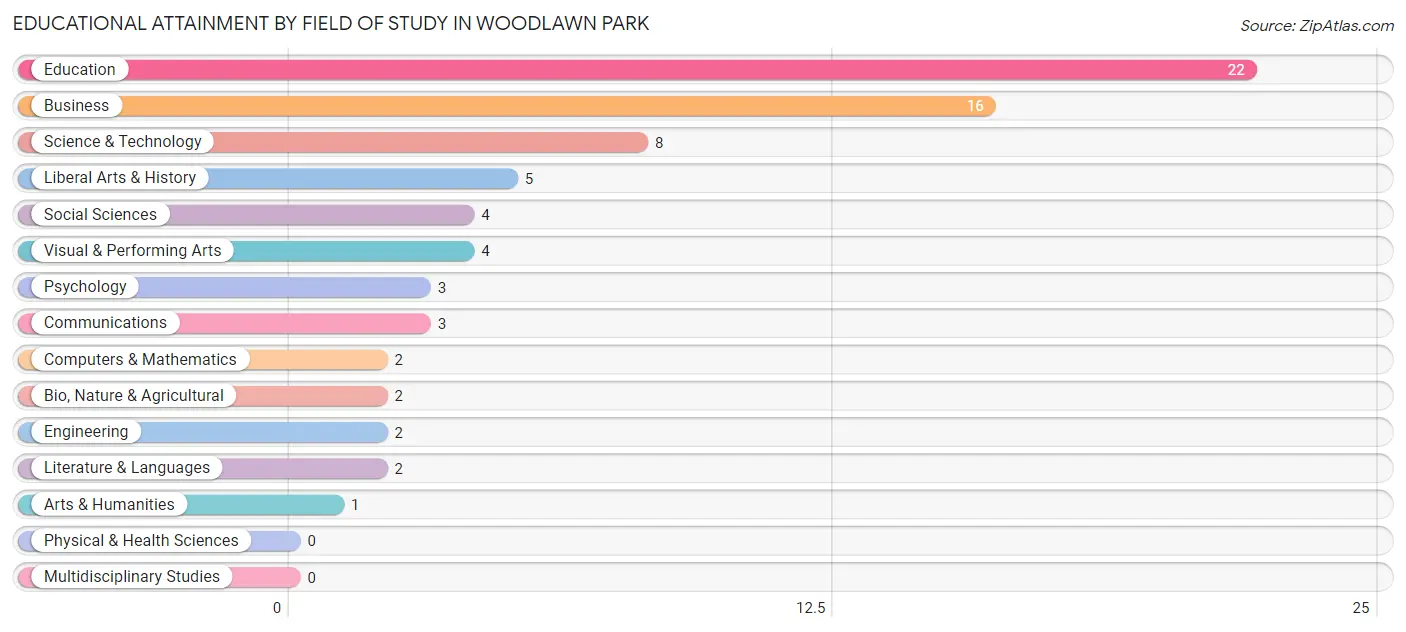
| Field of Study | # Graduates | % Graduates |
| Computers & Mathematics | 2 | 2.7% |
| Bio, Nature & Agricultural | 2 | 2.7% |
| Physical & Health Sciences | 0 | 0.0% |
| Psychology | 3 | 4.1% |
| Social Sciences | 4 | 5.4% |
| Engineering | 2 | 2.7% |
| Multidisciplinary Studies | 0 | 0.0% |
| Science & Technology | 8 | 10.8% |
| Business | 16 | 21.6% |
| Education | 22 | 29.7% |
| Literature & Languages | 2 | 2.7% |
| Liberal Arts & History | 5 | 6.8% |
| Visual & Performing Arts | 4 | 5.4% |
| Communications | 3 | 4.1% |
| Arts & Humanities | 1 | 1.3% |
| Total | 74 | 100.0% |
Transportation & Commute in Woodlawn Park
Vehicle Availability by Sex in Woodlawn Park
The most prevalent vehicle ownership categories in Woodlawn Park are males with 2 vehicles (15, accounting for 57.7%) and females with 2 vehicles (14, making up 55.6%).
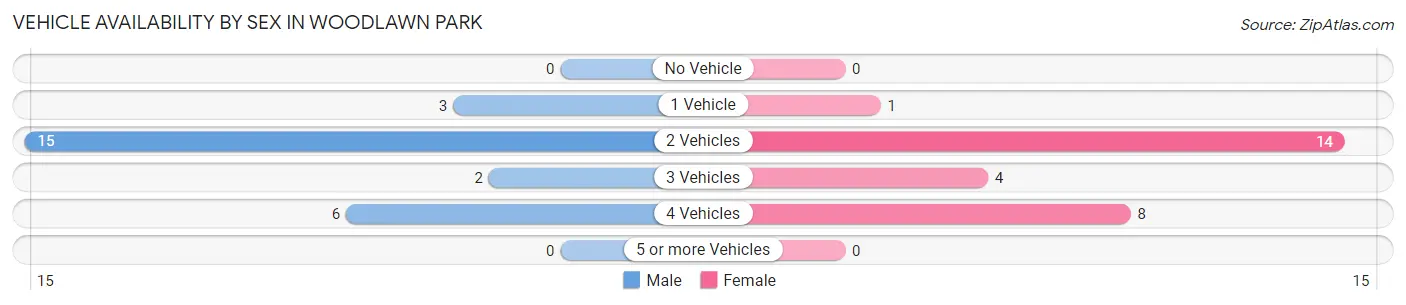
| Vehicles Available | Male | Female |
| No Vehicle | 0 (0.0%) | 0 (0.0%) |
| 1 Vehicle | 3 (11.5%) | 1 (3.7%) |
| 2 Vehicles | 15 (57.7%) | 14 (51.8%) |
| 3 Vehicles | 2 (7.7%) | 4 (14.8%) |
| 4 Vehicles | 6 (23.1%) | 8 (29.6%) |
| 5 or more Vehicles | 0 (0.0%) | 0 (0.0%) |
| Total | 26 (100.0%) | 27 (100.0%) |
Commute Time in Woodlawn Park
The most frequently occuring commute durations in Woodlawn Park are 20 to 24 minutes (13 commuters, 25.0%), 5 to 9 minutes (12 commuters, 23.1%), and 15 to 19 minutes (10 commuters, 19.2%).
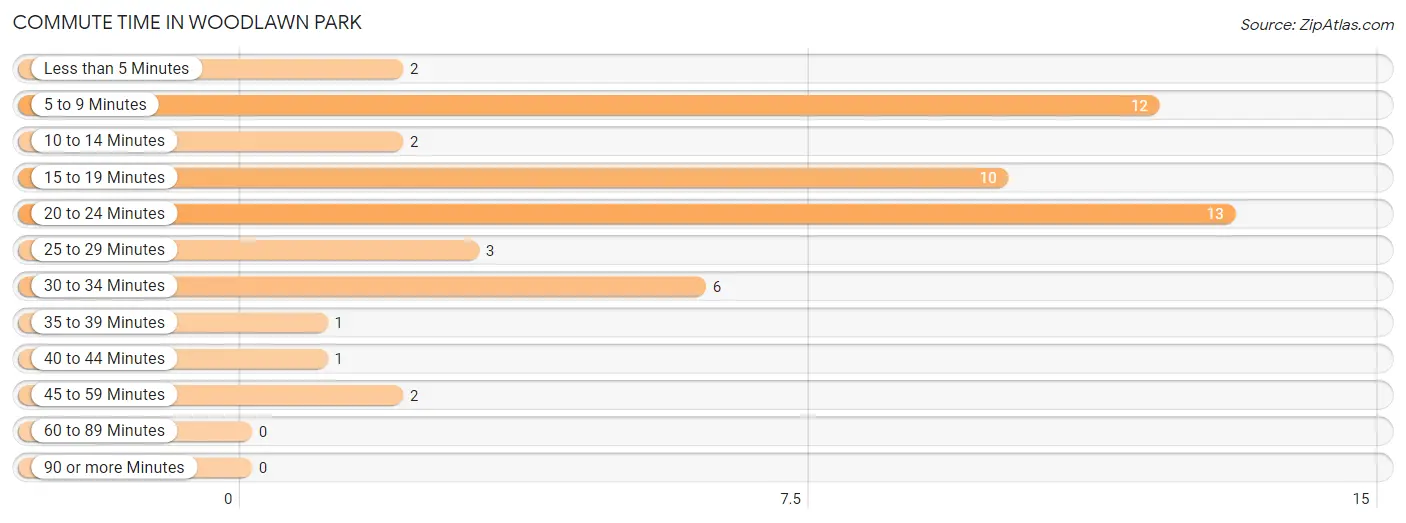
| Commute Time | # Commuters | % Commuters |
| Less than 5 Minutes | 2 | 3.8% |
| 5 to 9 Minutes | 12 | 23.1% |
| 10 to 14 Minutes | 2 | 3.8% |
| 15 to 19 Minutes | 10 | 19.2% |
| 20 to 24 Minutes | 13 | 25.0% |
| 25 to 29 Minutes | 3 | 5.8% |
| 30 to 34 Minutes | 6 | 11.5% |
| 35 to 39 Minutes | 1 | 1.9% |
| 40 to 44 Minutes | 1 | 1.9% |
| 45 to 59 Minutes | 2 | 3.8% |
| 60 to 89 Minutes | 0 | 0.0% |
| 90 or more Minutes | 0 | 0.0% |
Commute Time by Sex in Woodlawn Park
The most common commute times in Woodlawn Park are 20 to 24 minutes (10 commuters, 38.5%) for males and 15 to 19 minutes (8 commuters, 30.8%) for females.
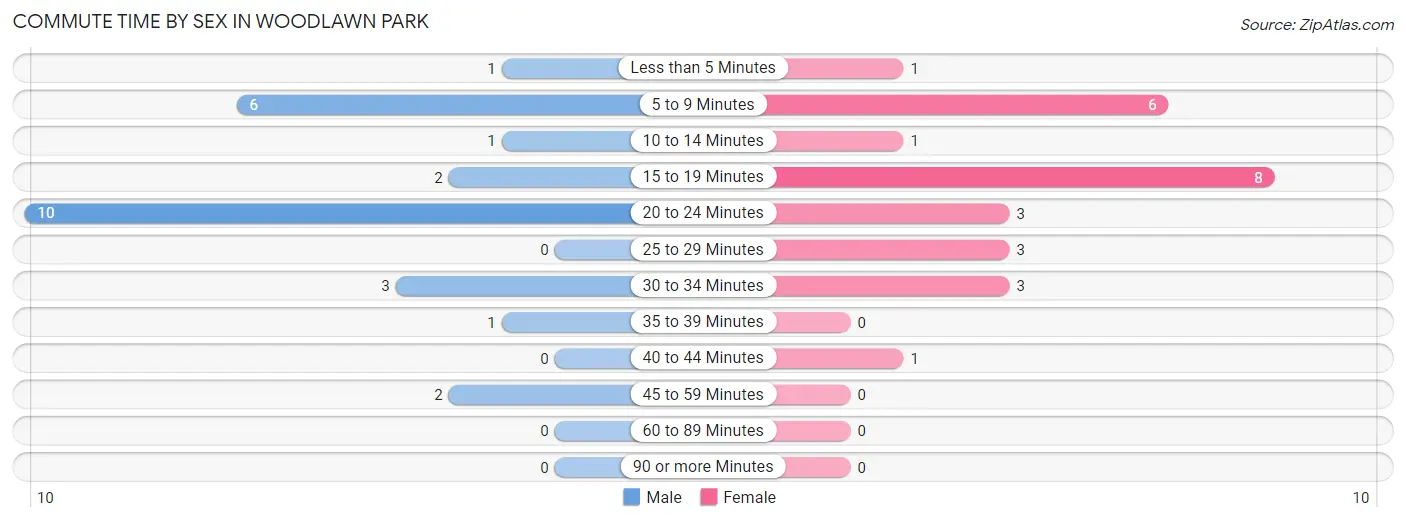
| Commute Time | Male | Female |
| Less than 5 Minutes | 1 (3.8%) | 1 (3.8%) |
| 5 to 9 Minutes | 6 (23.1%) | 6 (23.1%) |
| 10 to 14 Minutes | 1 (3.8%) | 1 (3.8%) |
| 15 to 19 Minutes | 2 (7.7%) | 8 (30.8%) |
| 20 to 24 Minutes | 10 (38.5%) | 3 (11.5%) |
| 25 to 29 Minutes | 0 (0.0%) | 3 (11.5%) |
| 30 to 34 Minutes | 3 (11.5%) | 3 (11.5%) |
| 35 to 39 Minutes | 1 (3.8%) | 0 (0.0%) |
| 40 to 44 Minutes | 0 (0.0%) | 1 (3.8%) |
| 45 to 59 Minutes | 2 (7.7%) | 0 (0.0%) |
| 60 to 89 Minutes | 0 (0.0%) | 0 (0.0%) |
| 90 or more Minutes | 0 (0.0%) | 0 (0.0%) |
Time of Departure to Work by Sex in Woodlawn Park
The most frequent times of departure to work in Woodlawn Park are 9:00 AM to 9:59 AM (7, 26.9%) for males and 8:00 AM to 8:29 AM (6, 23.1%) for females.
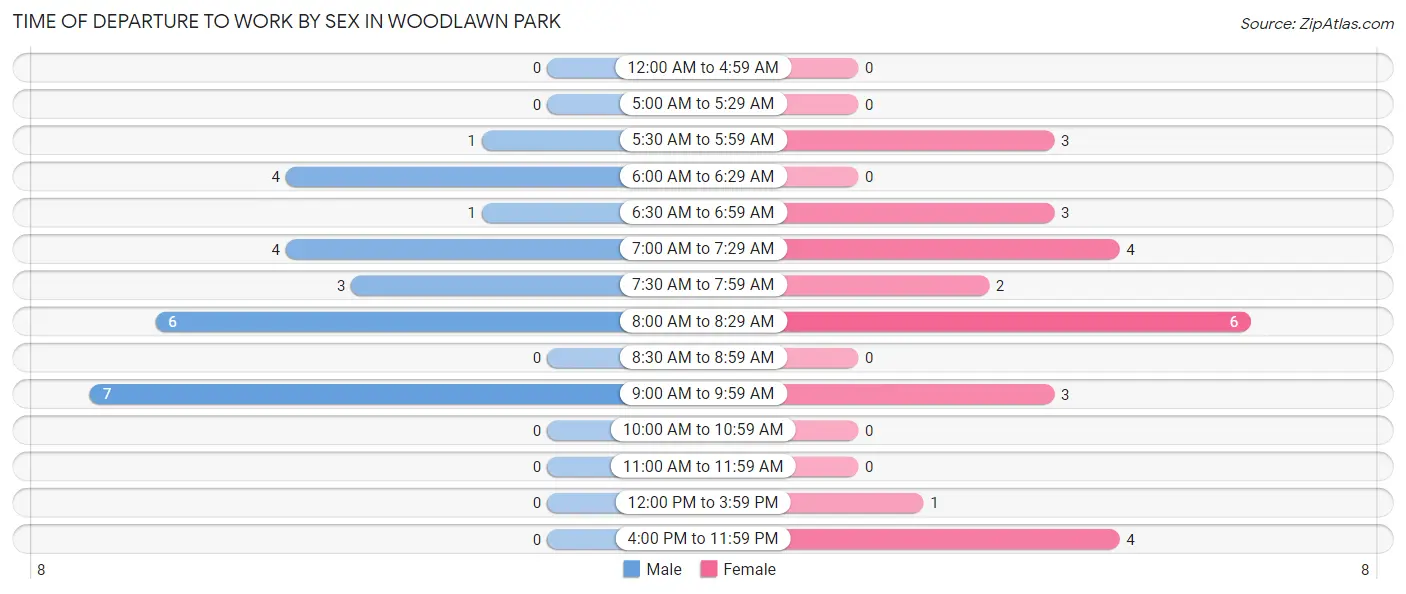
| Time of Departure | Male | Female |
| 12:00 AM to 4:59 AM | 0 (0.0%) | 0 (0.0%) |
| 5:00 AM to 5:29 AM | 0 (0.0%) | 0 (0.0%) |
| 5:30 AM to 5:59 AM | 1 (3.8%) | 3 (11.5%) |
| 6:00 AM to 6:29 AM | 4 (15.4%) | 0 (0.0%) |
| 6:30 AM to 6:59 AM | 1 (3.8%) | 3 (11.5%) |
| 7:00 AM to 7:29 AM | 4 (15.4%) | 4 (15.4%) |
| 7:30 AM to 7:59 AM | 3 (11.5%) | 2 (7.7%) |
| 8:00 AM to 8:29 AM | 6 (23.1%) | 6 (23.1%) |
| 8:30 AM to 8:59 AM | 0 (0.0%) | 0 (0.0%) |
| 9:00 AM to 9:59 AM | 7 (26.9%) | 3 (11.5%) |
| 10:00 AM to 10:59 AM | 0 (0.0%) | 0 (0.0%) |
| 11:00 AM to 11:59 AM | 0 (0.0%) | 0 (0.0%) |
| 12:00 PM to 3:59 PM | 0 (0.0%) | 1 (3.8%) |
| 4:00 PM to 11:59 PM | 0 (0.0%) | 4 (15.4%) |
| Total | 26 (100.0%) | 26 (100.0%) |
Housing Occupancy in Woodlawn Park
Occupancy by Ownership in Woodlawn Park
Of the total 49 dwellings in Woodlawn Park, owner-occupied units account for 41 (83.7%), while renter-occupied units make up 8 (16.3%).
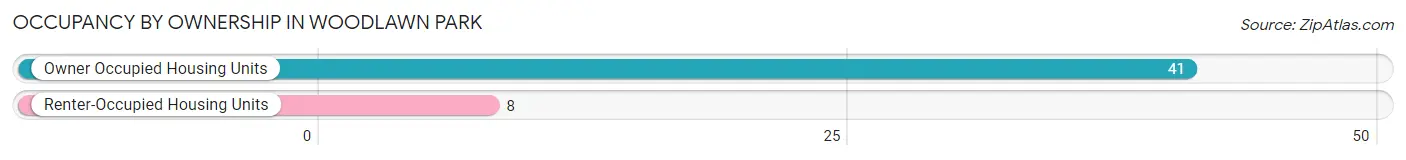
| Occupancy | # Housing Units | % Housing Units |
| Owner Occupied Housing Units | 41 | 83.7% |
| Renter-Occupied Housing Units | 8 | 16.3% |
| Total Occupied Housing Units | 49 | 100.0% |
Occupancy by Household Size in Woodlawn Park
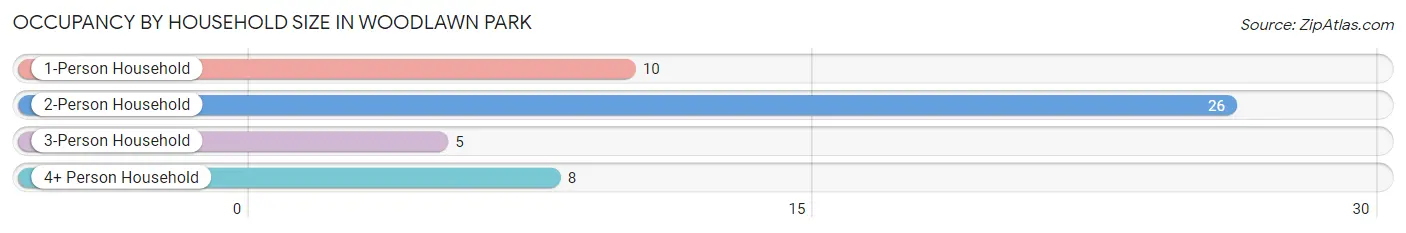
| Household Size | # Housing Units | % Housing Units |
| 1-Person Household | 10 | 20.4% |
| 2-Person Household | 26 | 53.1% |
| 3-Person Household | 5 | 10.2% |
| 4+ Person Household | 8 | 16.3% |
| Total Housing Units | 49 | 100.0% |
Occupancy by Ownership by Household Size in Woodlawn Park
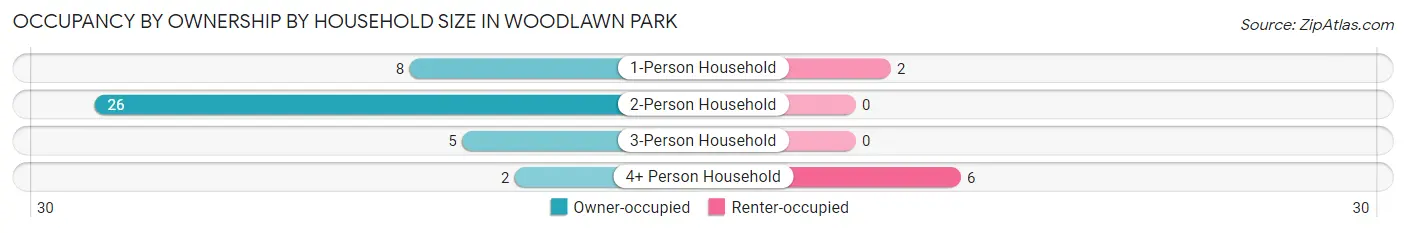
| Household Size | Owner-occupied | Renter-occupied |
| 1-Person Household | 8 (80.0%) | 2 (20.0%) |
| 2-Person Household | 26 (100.0%) | 0 (0.0%) |
| 3-Person Household | 5 (100.0%) | 0 (0.0%) |
| 4+ Person Household | 2 (25.0%) | 6 (75.0%) |
| Total Housing Units | 41 (83.7%) | 8 (16.3%) |
Occupancy by Educational Attainment in Woodlawn Park
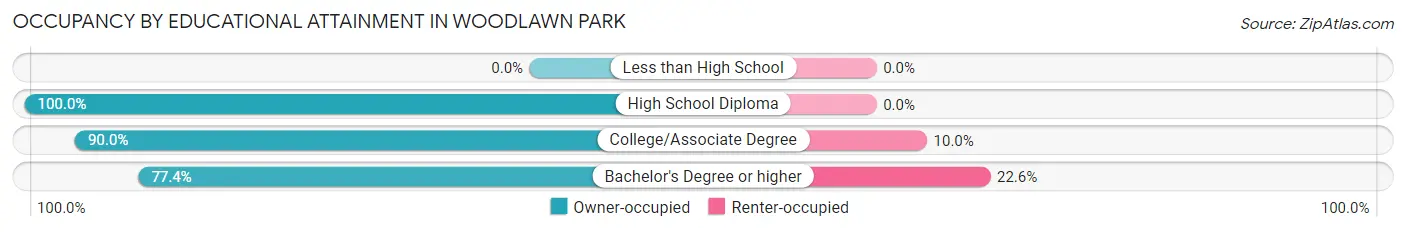
| Household Size | Owner-occupied | Renter-occupied |
| Less than High School | 0 (0.0%) | 0 (0.0%) |
| High School Diploma | 8 (100.0%) | 0 (0.0%) |
| College/Associate Degree | 9 (90.0%) | 1 (10.0%) |
| Bachelor's Degree or higher | 24 (77.4%) | 7 (22.6%) |
Occupancy by Age of Householder in Woodlawn Park
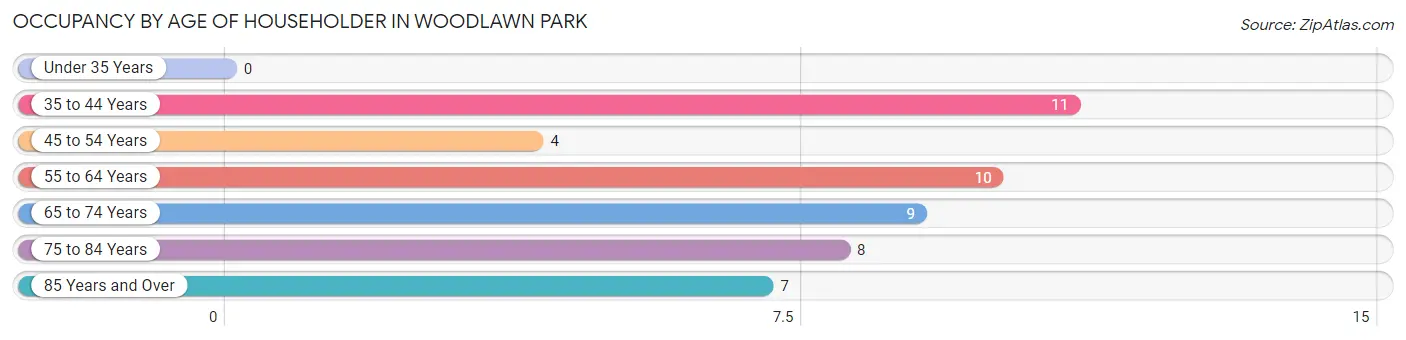
| Age Bracket | # Households | % Households |
| Under 35 Years | 0 | 0.0% |
| 35 to 44 Years | 11 | 22.5% |
| 45 to 54 Years | 4 | 8.2% |
| 55 to 64 Years | 10 | 20.4% |
| 65 to 74 Years | 9 | 18.4% |
| 75 to 84 Years | 8 | 16.3% |
| 85 Years and Over | 7 | 14.3% |
| Total | 49 | 100.0% |
Housing Finances in Woodlawn Park
Median Income by Occupancy in Woodlawn Park
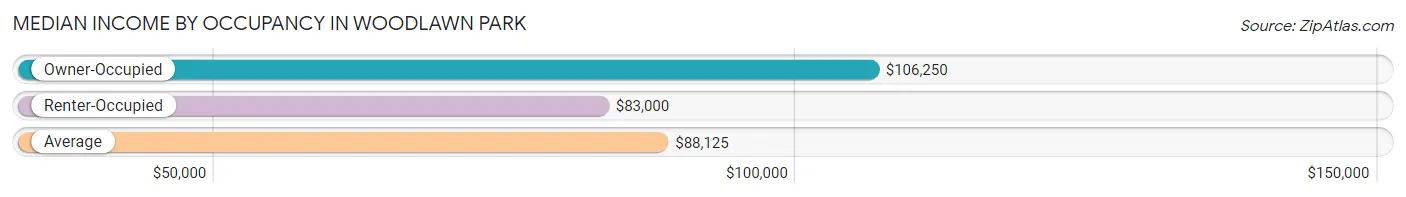
| Occupancy Type | # Households | Median Income |
| Owner-Occupied | 41 (83.7%) | $106,250 |
| Renter-Occupied | 8 (16.3%) | $83,000 |
| Average | 49 (100.0%) | $88,125 |
Occupancy by Householder Income Bracket in Woodlawn Park
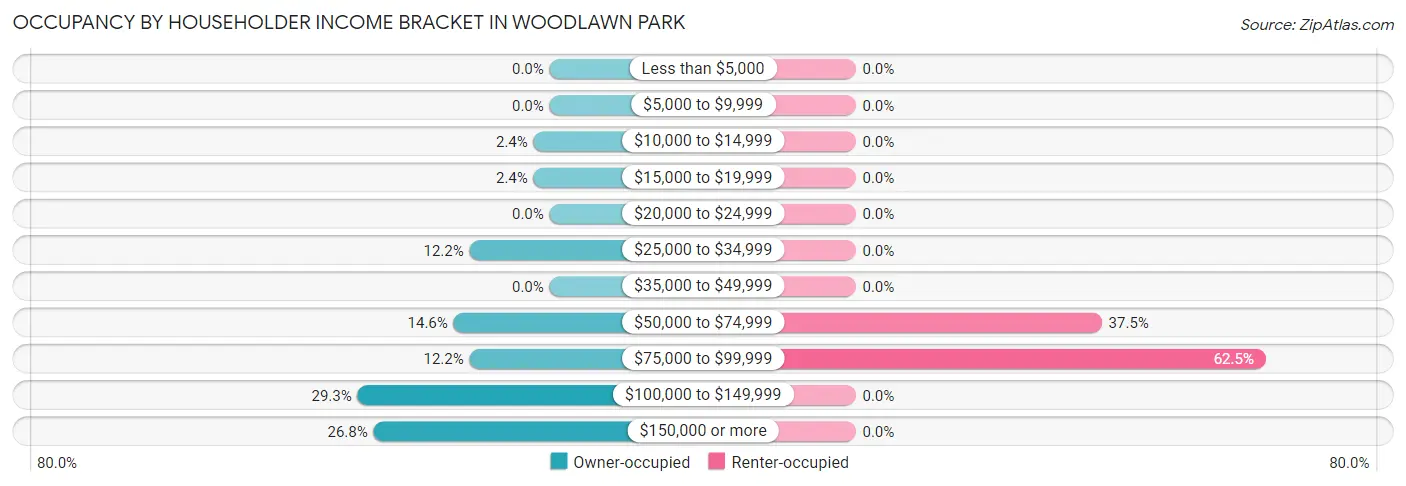
| Income Bracket | Owner-occupied | Renter-occupied |
| Less than $5,000 | 0 (0.0%) | 0 (0.0%) |
| $5,000 to $9,999 | 0 (0.0%) | 0 (0.0%) |
| $10,000 to $14,999 | 1 (2.4%) | 0 (0.0%) |
| $15,000 to $19,999 | 1 (2.4%) | 0 (0.0%) |
| $20,000 to $24,999 | 0 (0.0%) | 0 (0.0%) |
| $25,000 to $34,999 | 5 (12.2%) | 0 (0.0%) |
| $35,000 to $49,999 | 0 (0.0%) | 0 (0.0%) |
| $50,000 to $74,999 | 6 (14.6%) | 3 (37.5%) |
| $75,000 to $99,999 | 5 (12.2%) | 5 (62.5%) |
| $100,000 to $149,999 | 12 (29.3%) | 0 (0.0%) |
| $150,000 or more | 11 (26.8%) | 0 (0.0%) |
| Total | 41 (100.0%) | 8 (100.0%) |
Monthly Housing Cost Tiers in Woodlawn Park
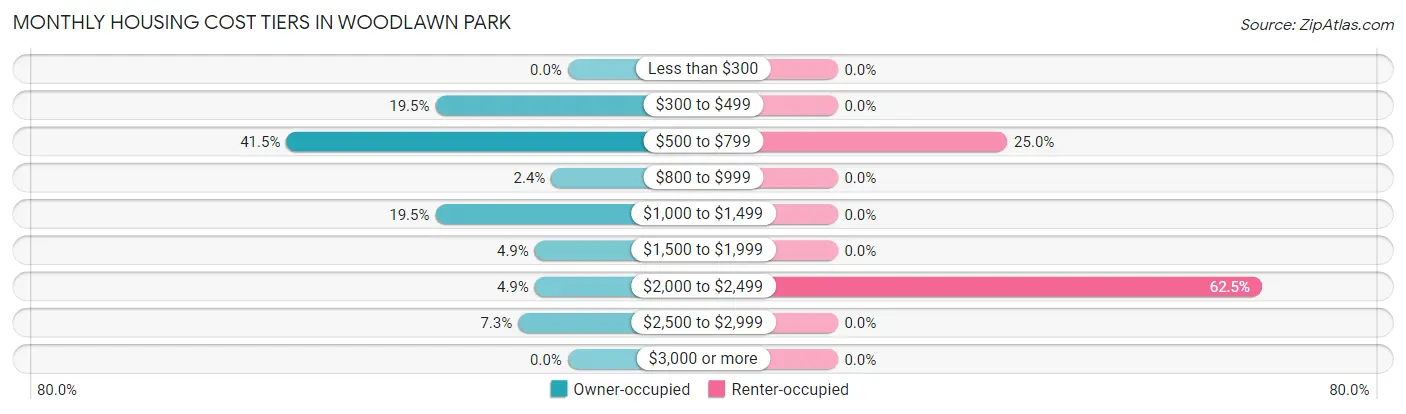
| Monthly Cost | Owner-occupied | Renter-occupied |
| Less than $300 | 0 (0.0%) | 0 (0.0%) |
| $300 to $499 | 8 (19.5%) | 0 (0.0%) |
| $500 to $799 | 17 (41.5%) | 2 (25.0%) |
| $800 to $999 | 1 (2.4%) | 0 (0.0%) |
| $1,000 to $1,499 | 8 (19.5%) | 0 (0.0%) |
| $1,500 to $1,999 | 2 (4.9%) | 0 (0.0%) |
| $2,000 to $2,499 | 2 (4.9%) | 5 (62.5%) |
| $2,500 to $2,999 | 3 (7.3%) | 0 (0.0%) |
| $3,000 or more | 0 (0.0%) | 0 (0.0%) |
| Total | 41 (100.0%) | 8 (100.0%) |
Physical Housing Characteristics in Woodlawn Park
Housing Structures in Woodlawn Park
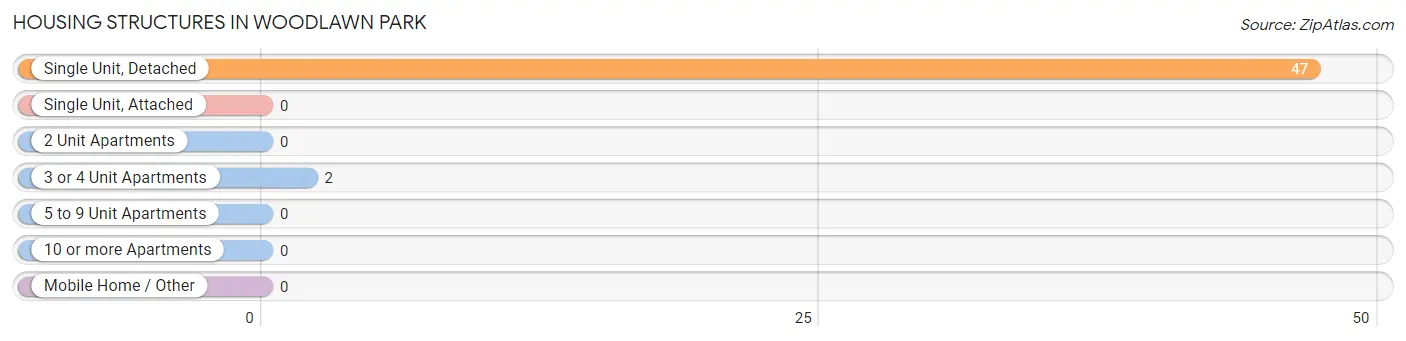
| Structure Type | # Housing Units | % Housing Units |
| Single Unit, Detached | 47 | 95.9% |
| Single Unit, Attached | 0 | 0.0% |
| 2 Unit Apartments | 0 | 0.0% |
| 3 or 4 Unit Apartments | 2 | 4.1% |
| 5 to 9 Unit Apartments | 0 | 0.0% |
| 10 or more Apartments | 0 | 0.0% |
| Mobile Home / Other | 0 | 0.0% |
| Total | 49 | 100.0% |
Housing Structures by Occupancy in Woodlawn Park
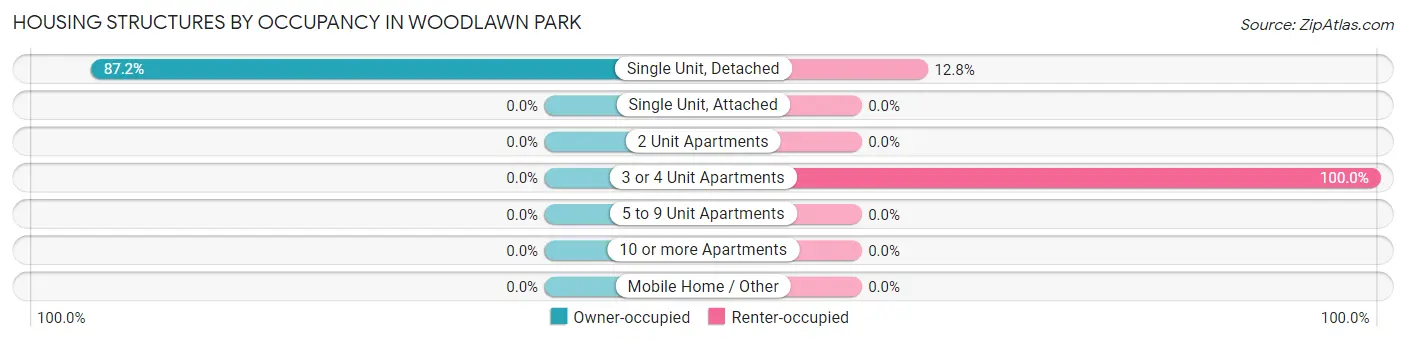
| Structure Type | Owner-occupied | Renter-occupied |
| Single Unit, Detached | 41 (87.2%) | 6 (12.8%) |
| Single Unit, Attached | 0 (0.0%) | 0 (0.0%) |
| 2 Unit Apartments | 0 (0.0%) | 0 (0.0%) |
| 3 or 4 Unit Apartments | 0 (0.0%) | 2 (100.0%) |
| 5 to 9 Unit Apartments | 0 (0.0%) | 0 (0.0%) |
| 10 or more Apartments | 0 (0.0%) | 0 (0.0%) |
| Mobile Home / Other | 0 (0.0%) | 0 (0.0%) |
| Total | 41 (83.7%) | 8 (16.3%) |
Housing Structures by Number of Rooms in Woodlawn Park
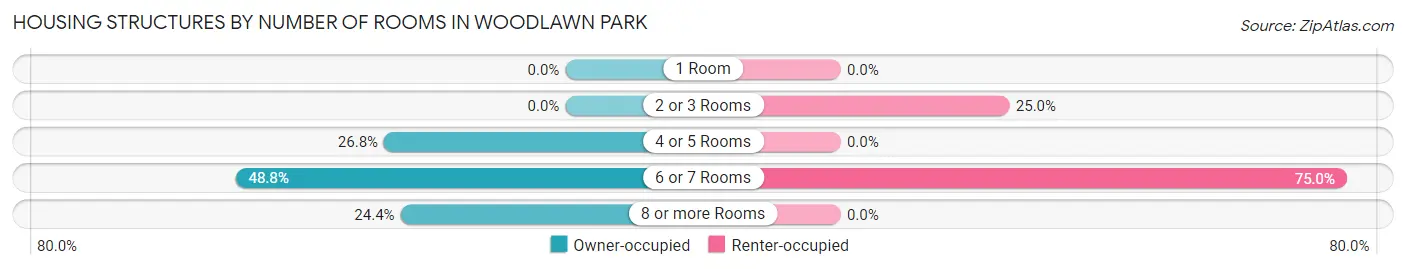
| Number of Rooms | Owner-occupied | Renter-occupied |
| 1 Room | 0 (0.0%) | 0 (0.0%) |
| 2 or 3 Rooms | 0 (0.0%) | 2 (25.0%) |
| 4 or 5 Rooms | 11 (26.8%) | 0 (0.0%) |
| 6 or 7 Rooms | 20 (48.8%) | 6 (75.0%) |
| 8 or more Rooms | 10 (24.4%) | 0 (0.0%) |
| Total | 41 (100.0%) | 8 (100.0%) |
Housing Structure by Heating Type in Woodlawn Park
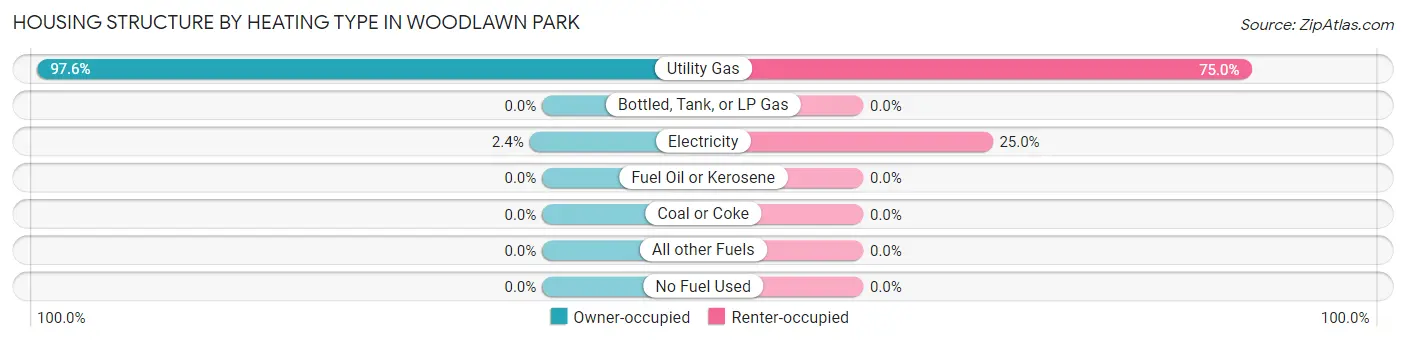
| Heating Type | Owner-occupied | Renter-occupied |
| Utility Gas | 40 (97.6%) | 6 (75.0%) |
| Bottled, Tank, or LP Gas | 0 (0.0%) | 0 (0.0%) |
| Electricity | 1 (2.4%) | 2 (25.0%) |
| Fuel Oil or Kerosene | 0 (0.0%) | 0 (0.0%) |
| Coal or Coke | 0 (0.0%) | 0 (0.0%) |
| All other Fuels | 0 (0.0%) | 0 (0.0%) |
| No Fuel Used | 0 (0.0%) | 0 (0.0%) |
| Total | 41 (100.0%) | 8 (100.0%) |
Household Vehicle Usage in Woodlawn Park
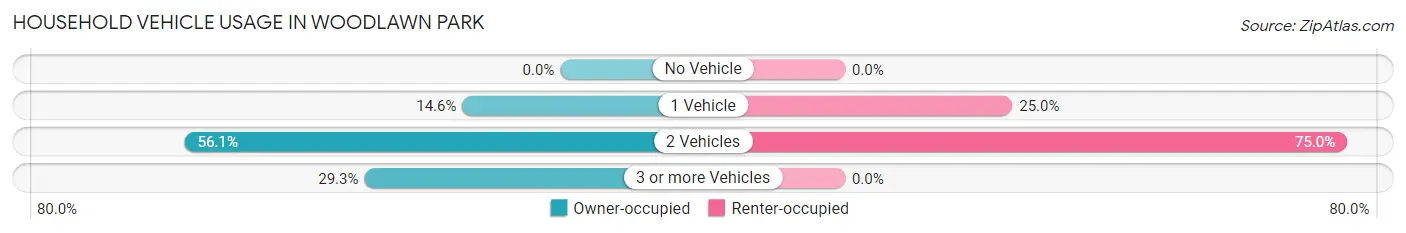
| Vehicles per Household | Owner-occupied | Renter-occupied |
| No Vehicle | 0 (0.0%) | 0 (0.0%) |
| 1 Vehicle | 6 (14.6%) | 2 (25.0%) |
| 2 Vehicles | 23 (56.1%) | 6 (75.0%) |
| 3 or more Vehicles | 12 (29.3%) | 0 (0.0%) |
| Total | 41 (100.0%) | 8 (100.0%) |
Real Estate & Mortgages in Woodlawn Park
Real Estate and Mortgage Overview in Woodlawn Park
| Characteristic | Without Mortgage | With Mortgage |
| Housing Units | 31 | 10 |
| Median Property Value | $267,500 | $237,500 |
| Median Household Income | $89,375 | $2 |
| Monthly Housing Costs | $617 | $0 |
| Real Estate Taxes | $2,250 | $0 |
Property Value by Mortgage Status in Woodlawn Park
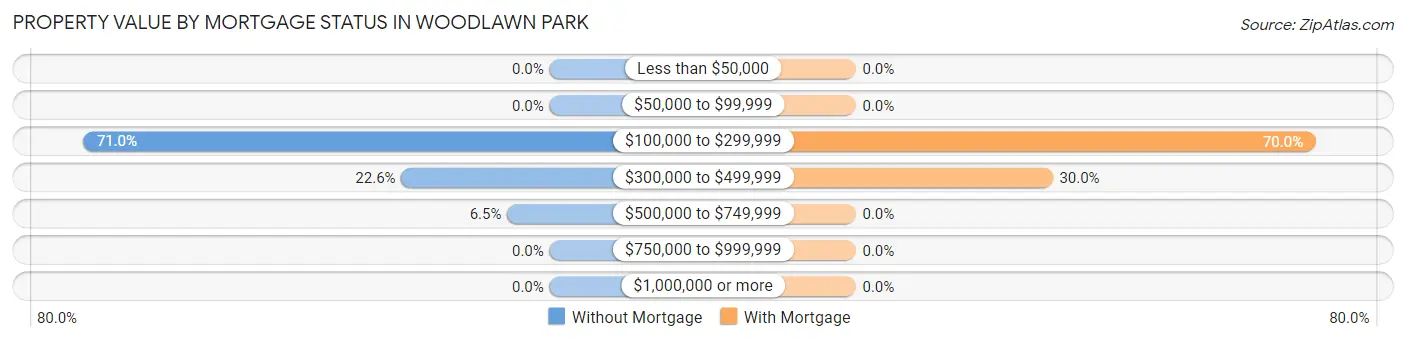
| Property Value | Without Mortgage | With Mortgage |
| Less than $50,000 | 0 (0.0%) | 0 (0.0%) |
| $50,000 to $99,999 | 0 (0.0%) | 0 (0.0%) |
| $100,000 to $299,999 | 22 (71.0%) | 7 (70.0%) |
| $300,000 to $499,999 | 7 (22.6%) | 3 (30.0%) |
| $500,000 to $749,999 | 2 (6.5%) | 0 (0.0%) |
| $750,000 to $999,999 | 0 (0.0%) | 0 (0.0%) |
| $1,000,000 or more | 0 (0.0%) | 0 (0.0%) |
| Total | 31 (100.0%) | 10 (100.0%) |
Household Income by Mortgage Status in Woodlawn Park
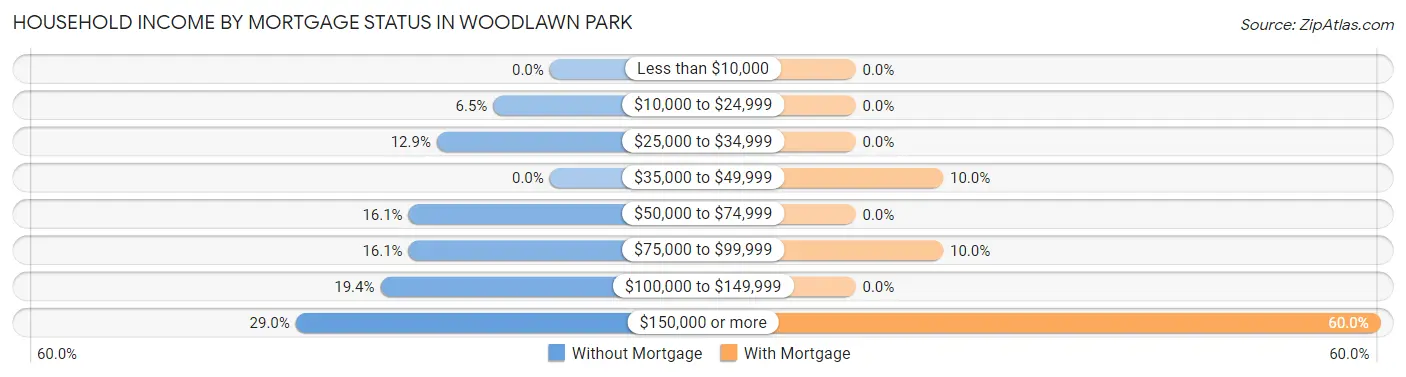
| Household Income | Without Mortgage | With Mortgage |
| Less than $10,000 | 0 (0.0%) | 0 (0.0%) |
| $10,000 to $24,999 | 2 (6.5%) | 0 (0.0%) |
| $25,000 to $34,999 | 4 (12.9%) | 0 (0.0%) |
| $35,000 to $49,999 | 0 (0.0%) | 1 (10.0%) |
| $50,000 to $74,999 | 5 (16.1%) | 0 (0.0%) |
| $75,000 to $99,999 | 5 (16.1%) | 1 (10.0%) |
| $100,000 to $149,999 | 6 (19.4%) | 0 (0.0%) |
| $150,000 or more | 9 (29.0%) | 6 (60.0%) |
| Total | 31 (100.0%) | 10 (100.0%) |
Property Value to Household Income Ratio in Woodlawn Park
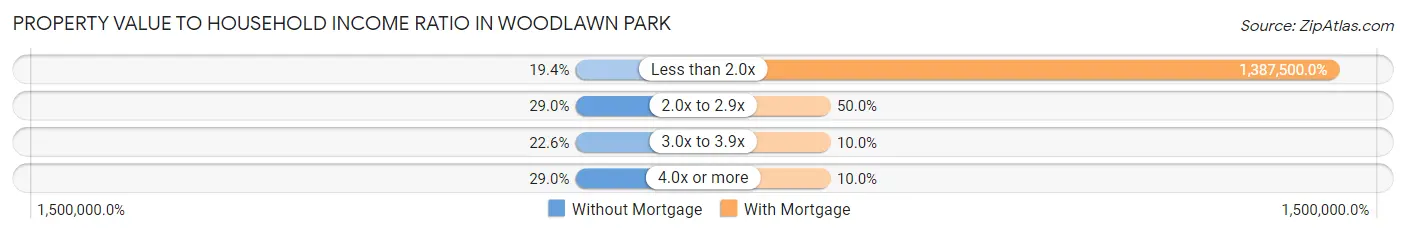
| Value-to-Income Ratio | Without Mortgage | With Mortgage |
| Less than 2.0x | 6 (19.4%) | 138,750 (1,387,500.0%) |
| 2.0x to 2.9x | 9 (29.0%) | 5 (50.0%) |
| 3.0x to 3.9x | 7 (22.6%) | 1 (10.0%) |
| 4.0x or more | 9 (29.0%) | 1 (10.0%) |
| Total | 31 (100.0%) | 10 (100.0%) |
Real Estate Taxes by Mortgage Status in Woodlawn Park
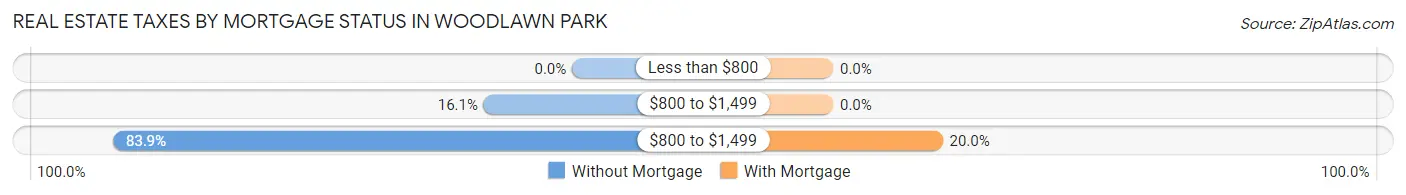
| Property Taxes | Without Mortgage | With Mortgage |
| Less than $800 | 0 (0.0%) | 0 (0.0%) |
| $800 to $1,499 | 5 (16.1%) | 0 (0.0%) |
| $800 to $1,499 | 26 (83.9%) | 2 (20.0%) |
| Total | 31 (100.0%) | 10 (100.0%) |
Health & Disability in Woodlawn Park
Health Insurance Coverage by Age in Woodlawn Park
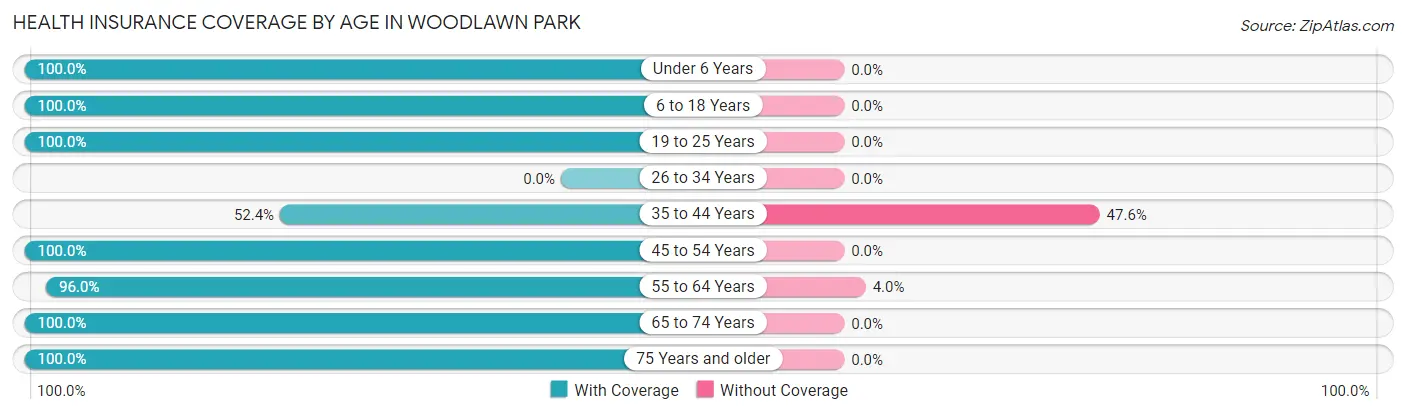
| Age Bracket | With Coverage | Without Coverage |
| Under 6 Years | 11 (100.0%) | 0 (0.0%) |
| 6 to 18 Years | 29 (100.0%) | 0 (0.0%) |
| 19 to 25 Years | 4 (100.0%) | 0 (0.0%) |
| 26 to 34 Years | 0 (0.0%) | 0 (0.0%) |
| 35 to 44 Years | 11 (52.4%) | 10 (47.6%) |
| 45 to 54 Years | 4 (100.0%) | 0 (0.0%) |
| 55 to 64 Years | 24 (96.0%) | 1 (4.0%) |
| 65 to 74 Years | 24 (100.0%) | 0 (0.0%) |
| 75 Years and older | 29 (100.0%) | 0 (0.0%) |
| Total | 136 (92.5%) | 11 (7.5%) |
Health Insurance Coverage by Citizenship Status in Woodlawn Park
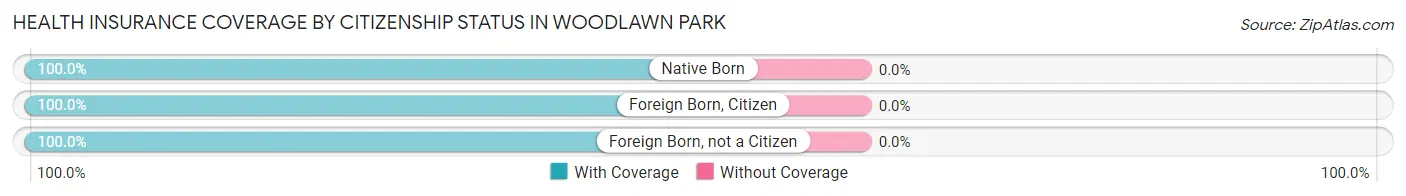
| Citizenship Status | With Coverage | Without Coverage |
| Native Born | 11 (100.0%) | 0 (0.0%) |
| Foreign Born, Citizen | 29 (100.0%) | 0 (0.0%) |
| Foreign Born, not a Citizen | 4 (100.0%) | 0 (0.0%) |
Health Insurance Coverage by Household Income in Woodlawn Park
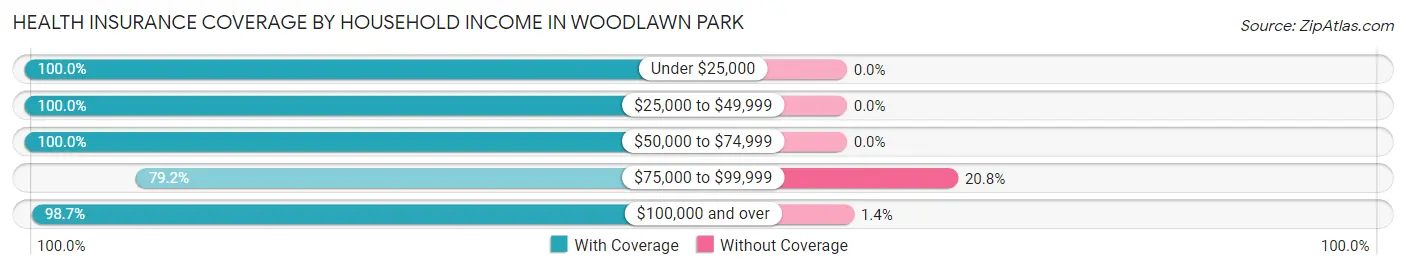
| Household Income | With Coverage | Without Coverage |
| Under $25,000 | 2 (100.0%) | 0 (0.0%) |
| $25,000 to $49,999 | 7 (100.0%) | 0 (0.0%) |
| $50,000 to $74,999 | 16 (100.0%) | 0 (0.0%) |
| $75,000 to $99,999 | 38 (79.2%) | 10 (20.8%) |
| $100,000 and over | 73 (98.7%) | 1 (1.3%) |
Public vs Private Health Insurance Coverage by Age in Woodlawn Park
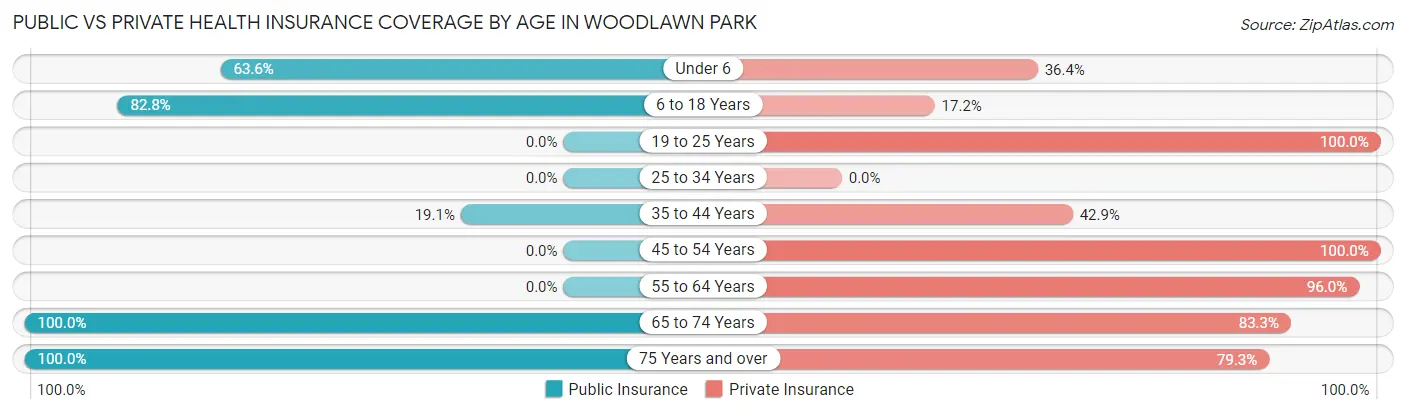
| Age Bracket | Public Insurance | Private Insurance |
| Under 6 | 7 (63.6%) | 4 (36.4%) |
| 6 to 18 Years | 24 (82.8%) | 5 (17.2%) |
| 19 to 25 Years | 0 (0.0%) | 4 (100.0%) |
| 25 to 34 Years | 0 (0.0%) | 0 (0.0%) |
| 35 to 44 Years | 4 (19.1%) | 9 (42.9%) |
| 45 to 54 Years | 0 (0.0%) | 4 (100.0%) |
| 55 to 64 Years | 0 (0.0%) | 24 (96.0%) |
| 65 to 74 Years | 24 (100.0%) | 20 (83.3%) |
| 75 Years and over | 29 (100.0%) | 23 (79.3%) |
| Total | 88 (59.9%) | 93 (63.3%) |
Disability Status by Sex by Age in Woodlawn Park
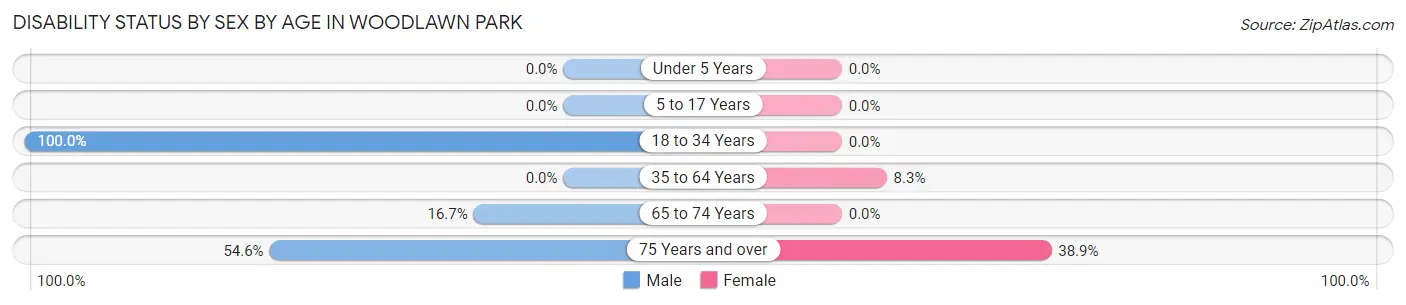
| Age Bracket | Male | Female |
| Under 5 Years | 0 (0.0%) | 0 (0.0%) |
| 5 to 17 Years | 0 (0.0%) | 0 (0.0%) |
| 18 to 34 Years | 1 (100.0%) | 0 (0.0%) |
| 35 to 64 Years | 0 (0.0%) | 2 (8.3%) |
| 65 to 74 Years | 1 (16.7%) | 0 (0.0%) |
| 75 Years and over | 6 (54.5%) | 7 (38.9%) |
Disability Class by Sex by Age in Woodlawn Park
Disability Class: Hearing Difficulty
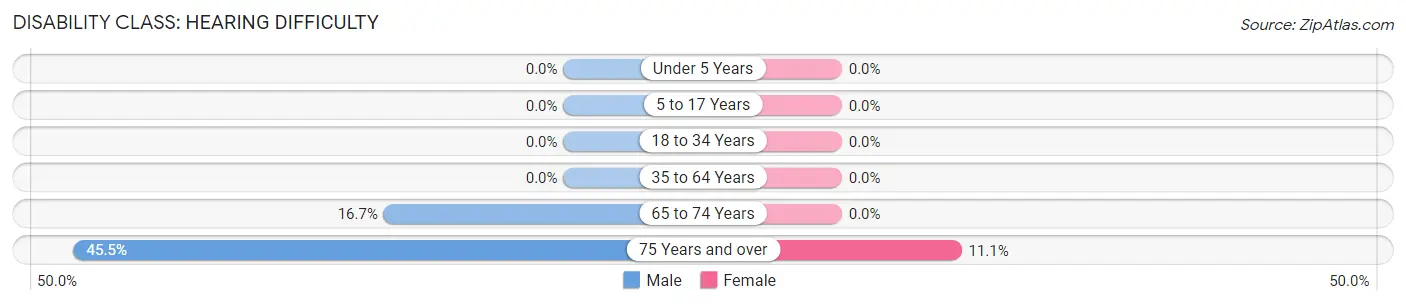
| Age Bracket | Male | Female |
| Under 5 Years | 0 (0.0%) | 0 (0.0%) |
| 5 to 17 Years | 0 (0.0%) | 0 (0.0%) |
| 18 to 34 Years | 0 (0.0%) | 0 (0.0%) |
| 35 to 64 Years | 0 (0.0%) | 0 (0.0%) |
| 65 to 74 Years | 1 (16.7%) | 0 (0.0%) |
| 75 Years and over | 5 (45.5%) | 2 (11.1%) |
Disability Class: Vision Difficulty
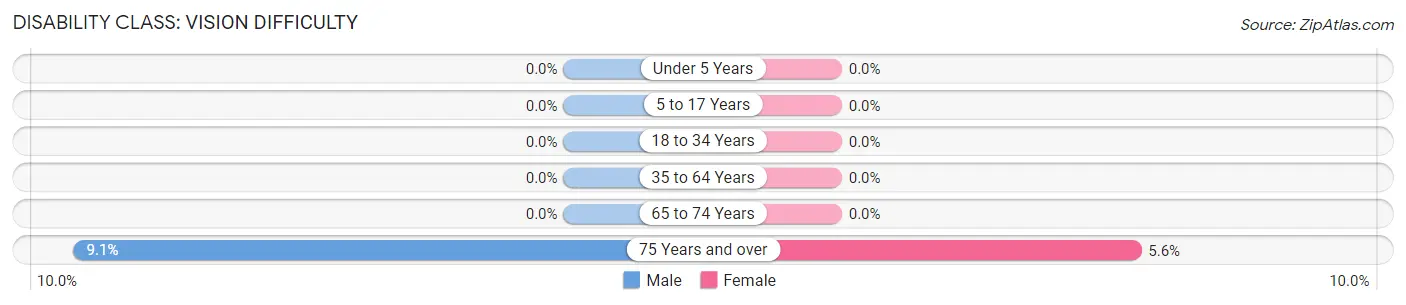
| Age Bracket | Male | Female |
| Under 5 Years | 0 (0.0%) | 0 (0.0%) |
| 5 to 17 Years | 0 (0.0%) | 0 (0.0%) |
| 18 to 34 Years | 0 (0.0%) | 0 (0.0%) |
| 35 to 64 Years | 0 (0.0%) | 0 (0.0%) |
| 65 to 74 Years | 0 (0.0%) | 0 (0.0%) |
| 75 Years and over | 1 (9.1%) | 1 (5.6%) |
Disability Class: Cognitive Difficulty
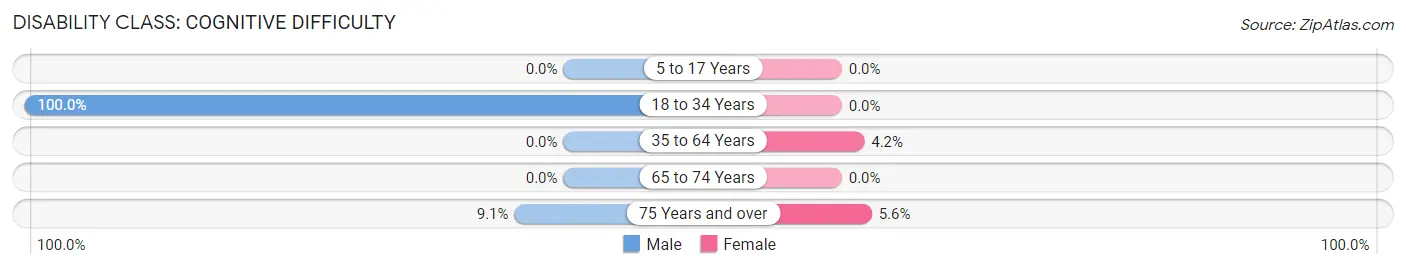
| Age Bracket | Male | Female |
| 5 to 17 Years | 0 (0.0%) | 0 (0.0%) |
| 18 to 34 Years | 1 (100.0%) | 0 (0.0%) |
| 35 to 64 Years | 0 (0.0%) | 1 (4.2%) |
| 65 to 74 Years | 0 (0.0%) | 0 (0.0%) |
| 75 Years and over | 1 (9.1%) | 1 (5.6%) |
Disability Class: Ambulatory Difficulty
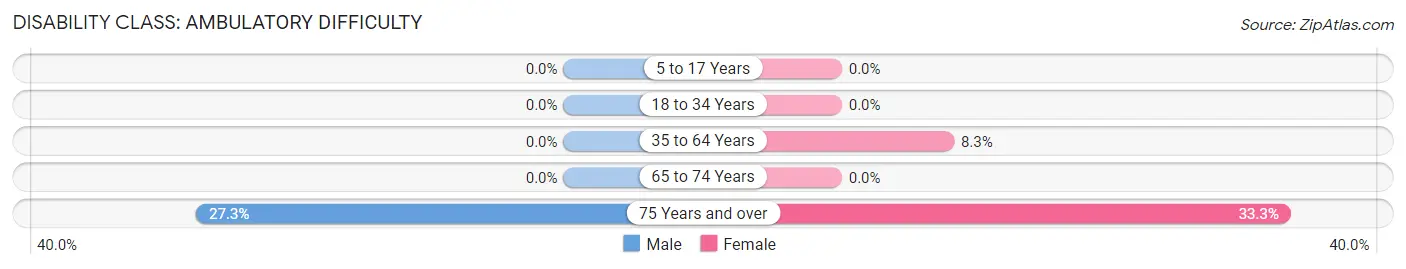
| Age Bracket | Male | Female |
| 5 to 17 Years | 0 (0.0%) | 0 (0.0%) |
| 18 to 34 Years | 0 (0.0%) | 0 (0.0%) |
| 35 to 64 Years | 0 (0.0%) | 2 (8.3%) |
| 65 to 74 Years | 0 (0.0%) | 0 (0.0%) |
| 75 Years and over | 3 (27.3%) | 6 (33.3%) |
Disability Class: Self-Care Difficulty
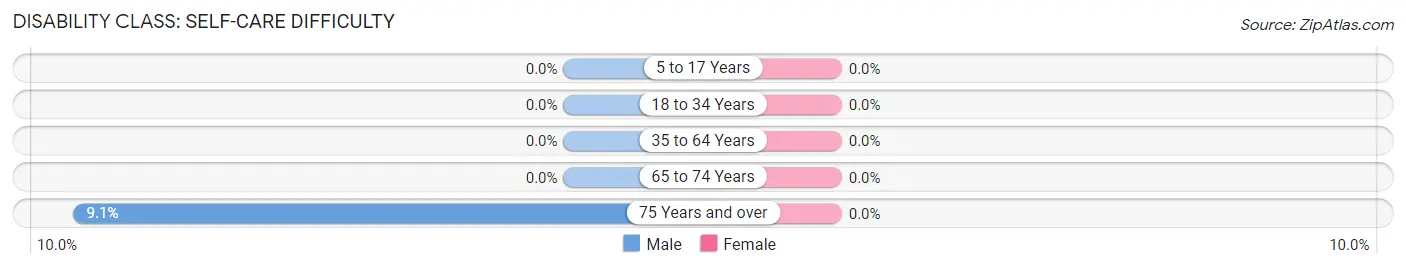
| Age Bracket | Male | Female |
| 5 to 17 Years | 0 (0.0%) | 0 (0.0%) |
| 18 to 34 Years | 0 (0.0%) | 0 (0.0%) |
| 35 to 64 Years | 0 (0.0%) | 0 (0.0%) |
| 65 to 74 Years | 0 (0.0%) | 0 (0.0%) |
| 75 Years and over | 1 (9.1%) | 0 (0.0%) |
Technology Access in Woodlawn Park
Computing Device Access in Woodlawn Park
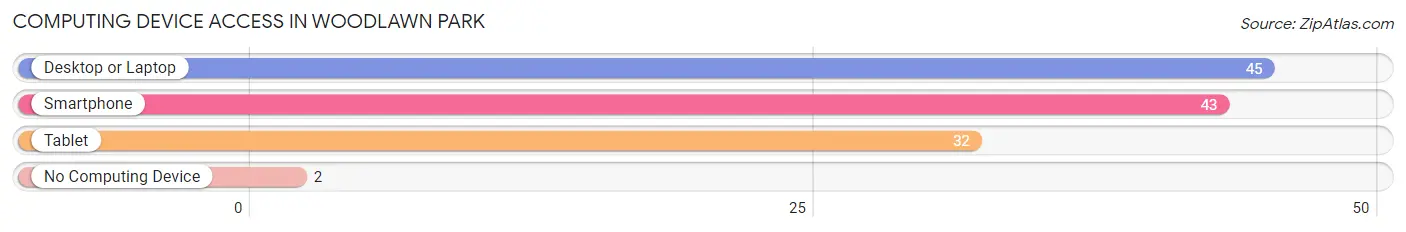
| Device Type | # Households | % Households |
| Desktop or Laptop | 45 | 91.8% |
| Smartphone | 43 | 87.8% |
| Tablet | 32 | 65.3% |
| No Computing Device | 2 | 4.1% |
| Total | 49 | 100.0% |
Internet Access in Woodlawn Park
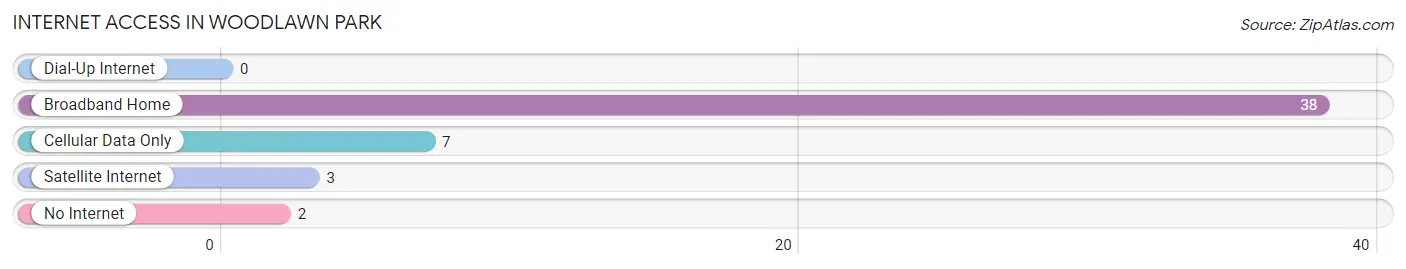
| Internet Type | # Households | % Households |
| Dial-Up Internet | 0 | 0.0% |
| Broadband Home | 38 | 77.5% |
| Cellular Data Only | 7 | 14.3% |
| Satellite Internet | 3 | 6.1% |
| No Internet | 2 | 4.1% |
| Total | 49 | 100.0% |
Woodlawn Park Summary
Woodlawn Park is a small unincorporated community located in Oklahoma County, Oklahoma. It is situated approximately 10 miles south of Oklahoma City and is part of the Oklahoma City metropolitan area. The population of Woodlawn Park was estimated to be around 1,000 in 2020.
History
Woodlawn Park was founded in the early 1900s by a group of settlers from the nearby town of Edmond. The settlers were looking for a place to settle and farm, and they chose the area that is now Woodlawn Park. The area was originally known as Woodlawn, but the name was changed to Woodlawn Park in the 1920s.
The area was primarily agricultural, with cotton and corn being the main crops. The area also had a few small businesses, including a general store, a blacksmith shop, and a post office.
In the 1950s, the area began to experience rapid growth due to the growth of Oklahoma City. The population of Woodlawn Park increased from around 500 in 1950 to over 1,000 in 2020.
Geography
Woodlawn Park is located in Oklahoma County, Oklahoma. It is situated approximately 10 miles south of Oklahoma City and is part of the Oklahoma City metropolitan area. The area is mostly flat, with some rolling hills in the area. The area is also home to several small lakes and ponds.
The climate in Woodlawn Park is typical of the Great Plains region, with hot summers and cold winters. The average annual temperature is around 60 degrees Fahrenheit. The area receives an average of around 35 inches of precipitation per year.
Economy
The economy of Woodlawn Park is primarily based on agriculture. Cotton and corn are the main crops grown in the area, and there are also several small businesses in the area. These businesses include a general store, a blacksmith shop, and a post office.
The area is also home to several small manufacturing companies, including a furniture factory and a plastics factory. The area is also home to several small retail stores, including a grocery store and a hardware store.
Demographics
The population of Woodlawn Park was estimated to be around 1,000 in 2020. The population is primarily white, with a small percentage of African Americans and Hispanics. The median household income in the area is around $50,000 per year. The area is also home to several churches, including Baptist, Methodist, and Catholic.
Conclusion
Woodlawn Park is a small unincorporated community located in Oklahoma County, Oklahoma. It is situated approximately 10 miles south of Oklahoma City and is part of the Oklahoma City metropolitan area. The population of Woodlawn Park was estimated to be around 1,000 in 2020. The economy of the area is primarily based on agriculture, with cotton and corn being the main crops. The area is also home to several small businesses, including a general store, a blacksmith shop, and a post office. The population of Woodlawn Park is primarily white, with a small percentage of African Americans and Hispanics. The median household income in the area is around $50,000 per year.
Common Questions
What is Per Capita Income in Woodlawn Park?
Per Capita income in Woodlawn Park is $39,573.
What is the Median Family Income in Woodlawn Park?
Median Family Income in Woodlawn Park is $105,000.
What is the Median Household income in Woodlawn Park?
Median Household Income in Woodlawn Park is $88,125.
What is Income or Wage Gap in Woodlawn Park?
Income or Wage Gap in Woodlawn Park is 53.0%.
Women in Woodlawn Park earn 47.0 cents for every dollar earned by a man.
What is Inequality or Gini Index in Woodlawn Park?
Inequality or Gini Index in Woodlawn Park is 0.32.
What is the Total Population of Woodlawn Park?
Total Population of Woodlawn Park is 147.
What is the Total Male Population of Woodlawn Park?
Total Male Population of Woodlawn Park is 60.
What is the Total Female Population of Woodlawn Park?
Total Female Population of Woodlawn Park is 87.
What is the Ratio of Males per 100 Females in Woodlawn Park?
There are 68.97 Males per 100 Females in Woodlawn Park.
What is the Ratio of Females per 100 Males in Woodlawn Park?
There are 145.00 Females per 100 Males in Woodlawn Park.
What is the Median Population Age in Woodlawn Park?
Median Population Age in Woodlawn Park is 57.3 Years.
What is the Average Family Size in Woodlawn Park
Average Family Size in Woodlawn Park is 3.5 People.
What is the Average Household Size in Woodlawn Park
Average Household Size in Woodlawn Park is 3.0 People.
How Large is the Labor Force in Woodlawn Park?
There are 53 People in the Labor Forcein in Woodlawn Park.
What is the Percentage of People in the Labor Force in Woodlawn Park?
46.1% of People are in the Labor Force in Woodlawn Park.