Notchietown, OK Map & Demographics
Notchietown Map
Notchietown Overview
$21,239
PER CAPITA INCOME
0.34
INEQUALITY / GINI INDEX
298
TOTAL POPULATION
169
MALE POPULATION
129
FEMALE POPULATION
131.01
MALES / 100 FEMALES
76.33
FEMALES / 100 MALES
40.0
MEDIAN AGE
3.4
AVG FAMILY SIZE
2.6
AVG HOUSEHOLD SIZE
124
LABOR FORCE [ PEOPLE ]
51.5%
PERCENT IN LABOR FORCE
18.5%
UNEMPLOYMENT RATE
Income in Notchietown
Income Overview in Notchietown
| Characteristic | Number | Measure |
| Per Capita Income | 298 | $21,239 |
| Median Family Income | 74 | $0 |
| Mean Family Income | 74 | $52,374 |
| Median Household Income | 115 | $0 |
| Mean Household Income | 115 | $49,143 |
| Income Deficit | 74 | $0 |
| Wage / Income Gap (%) | 298 | 0.00% |
| Wage / Income Gap ($) | 298 | 100.00¢ per $1 |
| Gini / Inequality Index | 298 | 0.34 |
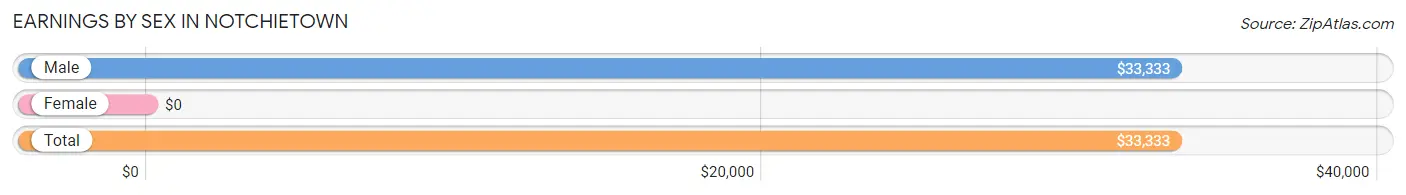
Earnings by Sex in Notchietown
| Sex | Number | Average Earnings |
| Male | 88 (71.0%) | $33,333 |
| Female | 36 (29.0%) | $0 |
| Total | 124 (100.0%) | $33,333 |
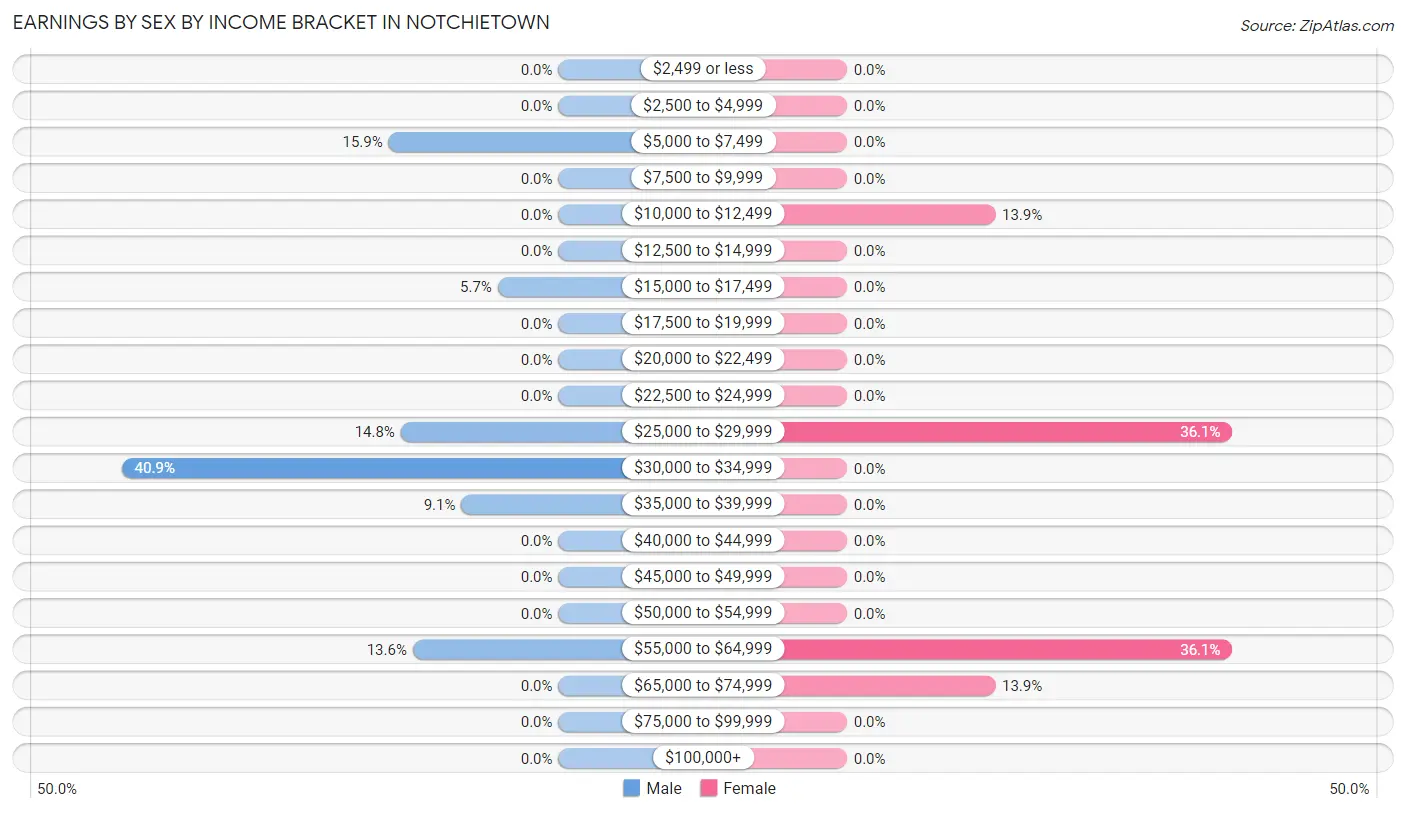
Earnings by Sex by Income Bracket in Notchietown
The most common earnings brackets in Notchietown are $30,000 to $34,999 for men (36 | 40.9%) and $25,000 to $29,999 for women (13 | 36.1%).
| Income | Male | Female |
| $2,499 or less | 0 (0.0%) | 0 (0.0%) |
| $2,500 to $4,999 | 0 (0.0%) | 0 (0.0%) |
| $5,000 to $7,499 | 14 (15.9%) | 0 (0.0%) |
| $7,500 to $9,999 | 0 (0.0%) | 0 (0.0%) |
| $10,000 to $12,499 | 0 (0.0%) | 5 (13.9%) |
| $12,500 to $14,999 | 0 (0.0%) | 0 (0.0%) |
| $15,000 to $17,499 | 5 (5.7%) | 0 (0.0%) |
| $17,500 to $19,999 | 0 (0.0%) | 0 (0.0%) |
| $20,000 to $22,499 | 0 (0.0%) | 0 (0.0%) |
| $22,500 to $24,999 | 0 (0.0%) | 0 (0.0%) |
| $25,000 to $29,999 | 13 (14.8%) | 13 (36.1%) |
| $30,000 to $34,999 | 36 (40.9%) | 0 (0.0%) |
| $35,000 to $39,999 | 8 (9.1%) | 0 (0.0%) |
| $40,000 to $44,999 | 0 (0.0%) | 0 (0.0%) |
| $45,000 to $49,999 | 0 (0.0%) | 0 (0.0%) |
| $50,000 to $54,999 | 0 (0.0%) | 0 (0.0%) |
| $55,000 to $64,999 | 12 (13.6%) | 13 (36.1%) |
| $65,000 to $74,999 | 0 (0.0%) | 5 (13.9%) |
| $75,000 to $99,999 | 0 (0.0%) | 0 (0.0%) |
| $100,000+ | 0 (0.0%) | 0 (0.0%) |
| Total | 88 (100.0%) | 36 (100.0%) |
Earnings by Sex by Educational Attainment in Notchietown
| Educational Attainment | Male Income | Female Income |
| Less than High School | - | - |
| High School Diploma | - | - |
| College or Associate's Degree | - | - |
| Bachelor's Degree | - | - |
| Graduate Degree | - | - |
| Total | $33,819 | $0 |
Family Income in Notchietown
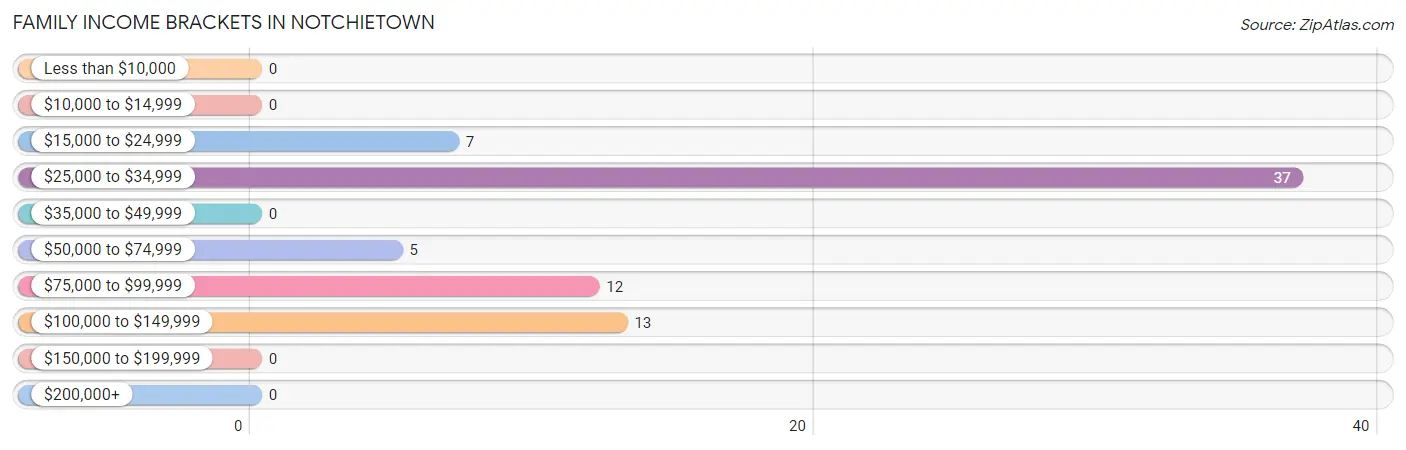
Family Income Brackets in Notchietown
According to the Notchietown family income data, there are 37 families falling into the $25,000 to $34,999 income range, which is the most common income bracket and makes up 50.0% of all families.
| Income Bracket | # Families | % Families |
| Less than $10,000 | 0 | 0.0% |
| $10,000 to $14,999 | 0 | 0.0% |
| $15,000 to $24,999 | 7 | 9.5% |
| $25,000 to $34,999 | 37 | 50.0% |
| $35,000 to $49,999 | 0 | 0.0% |
| $50,000 to $74,999 | 5 | 6.8% |
| $75,000 to $99,999 | 12 | 16.2% |
| $100,000 to $149,999 | 13 | 17.6% |
| $150,000 to $199,999 | 0 | 0.0% |
| $200,000+ | 0 | 0.0% |
Family Income by Famaliy Size in Notchietown
| Income Bracket | # Families | Median Income |
| 2-Person Families | 35 (47.3%) | $0 |
| 3-Person Families | 34 (46.0%) | $0 |
| 4-Person Families | 0 (0.0%) | $0 |
| 5-Person Families | 0 (0.0%) | $0 |
| 6-Person Families | 0 (0.0%) | $0 |
| 7+ Person Families | 5 (6.8%) | $0 |
| Total | 74 (100.0%) | $0 |
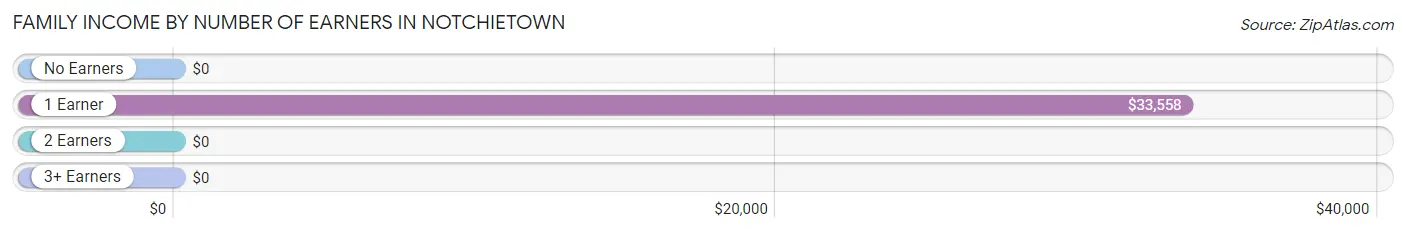
Family Income by Number of Earners in Notchietown
| Number of Earners | # Families | Median Income |
| No Earners | 24 (32.4%) | $0 |
| 1 Earner | 25 (33.8%) | $33,558 |
| 2 Earners | 25 (33.8%) | $0 |
| 3+ Earners | 0 (0.0%) | $0 |
| Total | 74 (100.0%) | $0 |
Household Income in Notchietown
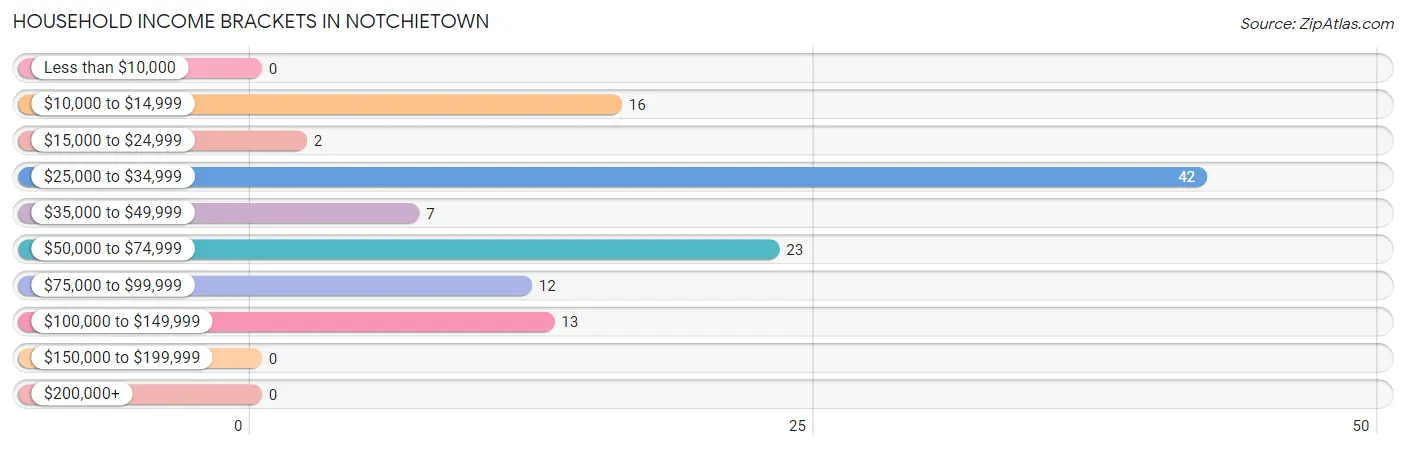
Household Income Brackets in Notchietown
With 42 households falling in the category, the $25,000 to $34,999 income range is the most frequent in Notchietown, accounting for 36.5% of all households.
| Income Bracket | # Households | % Households |
| Less than $10,000 | 0 | 0.0% |
| $10,000 to $14,999 | 16 | 13.9% |
| $15,000 to $24,999 | 2 | 1.7% |
| $25,000 to $34,999 | 42 | 36.5% |
| $35,000 to $49,999 | 7 | 6.1% |
| $50,000 to $74,999 | 23 | 20.0% |
| $75,000 to $99,999 | 12 | 10.4% |
| $100,000 to $149,999 | 13 | 11.3% |
| $150,000 to $199,999 | 0 | 0.0% |
| $200,000+ | 0 | 0.0% |
Household Income by Householder Age in Notchietown
The median household income in Notchietown is $0, with the highest median household income of $70,250 found in the 45 to 64 years age bracket for the primary householder. A total of 59 households (51.3%) fall into this category.
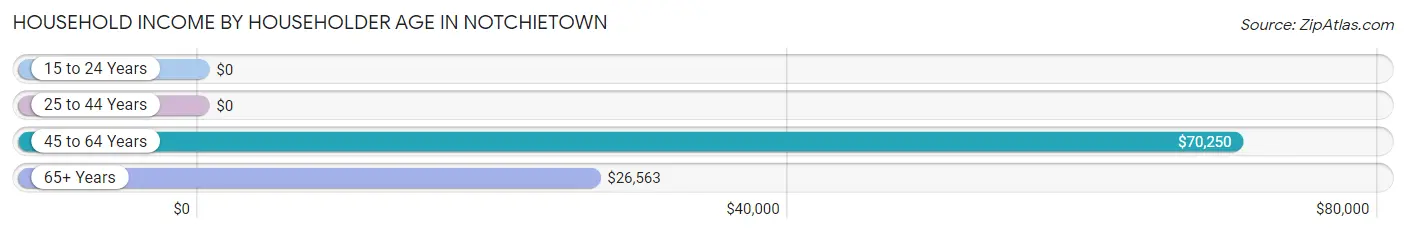
| Income Bracket | # Households | Median Income |
| 15 to 24 Years | 0 (0.0%) | $0 |
| 25 to 44 Years | 18 (15.7%) | $0 |
| 45 to 64 Years | 59 (51.3%) | $70,250 |
| 65+ Years | 38 (33.0%) | $26,563 |
| Total | 115 (100.0%) | $0 |
Poverty in Notchietown
Income Below Poverty by Sex and Age in Notchietown
With 19.5% poverty level for males and 12.4% for females among the residents of Notchietown, 18 to 24 year old males and under 5 year old females are the most vulnerable to poverty, with 14 males (100.0%) and 7 females (100.0%) in their respective age groups living below the poverty level.
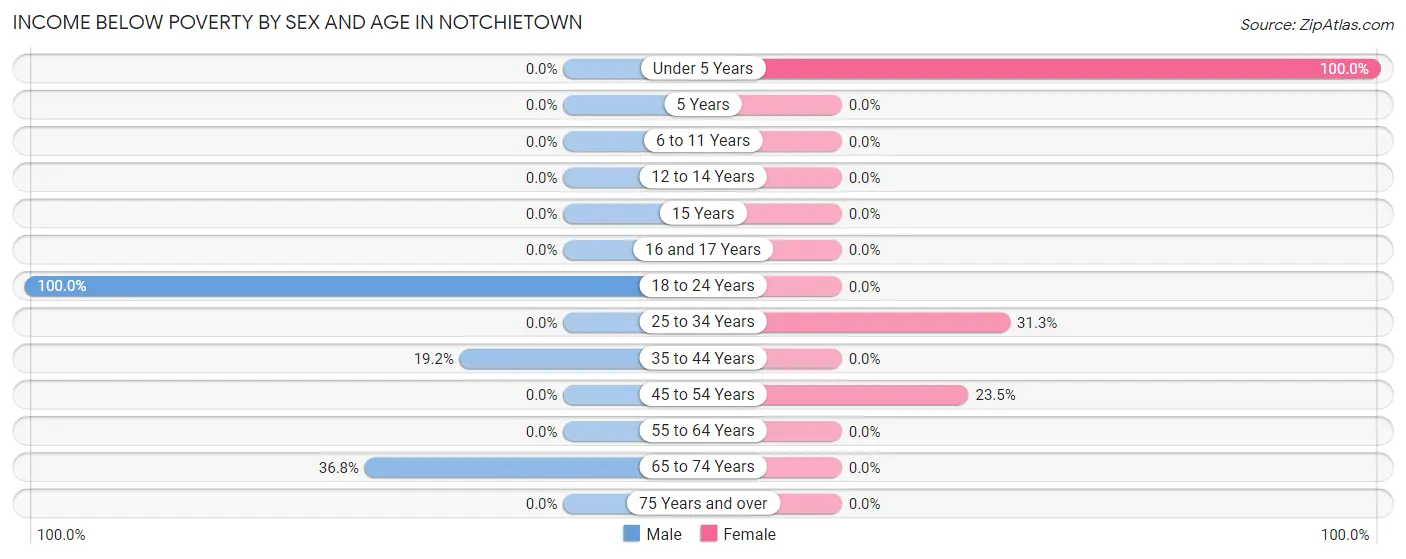
| Age Bracket | Male | Female |
| Under 5 Years | 0 (0.0%) | 7 (100.0%) |
| 5 Years | 0 (0.0%) | 0 (0.0%) |
| 6 to 11 Years | 0 (0.0%) | 0 (0.0%) |
| 12 to 14 Years | 0 (0.0%) | 0 (0.0%) |
| 15 Years | 0 (0.0%) | 0 (0.0%) |
| 16 and 17 Years | 0 (0.0%) | 0 (0.0%) |
| 18 to 24 Years | 14 (100.0%) | 0 (0.0%) |
| 25 to 34 Years | 0 (0.0%) | 5 (31.2%) |
| 35 to 44 Years | 5 (19.2%) | 0 (0.0%) |
| 45 to 54 Years | 0 (0.0%) | 4 (23.5%) |
| 55 to 64 Years | 0 (0.0%) | 0 (0.0%) |
| 65 to 74 Years | 14 (36.8%) | 0 (0.0%) |
| 75 Years and over | 0 (0.0%) | 0 (0.0%) |
| Total | 33 (19.5%) | 16 (12.4%) |
Income Above Poverty by Sex and Age in Notchietown
According to the poverty statistics in Notchietown, males aged under 5 years and females aged 5 years are the age groups that are most secure financially, with 100.0% of males and 100.0% of females in these age groups living above the poverty line.
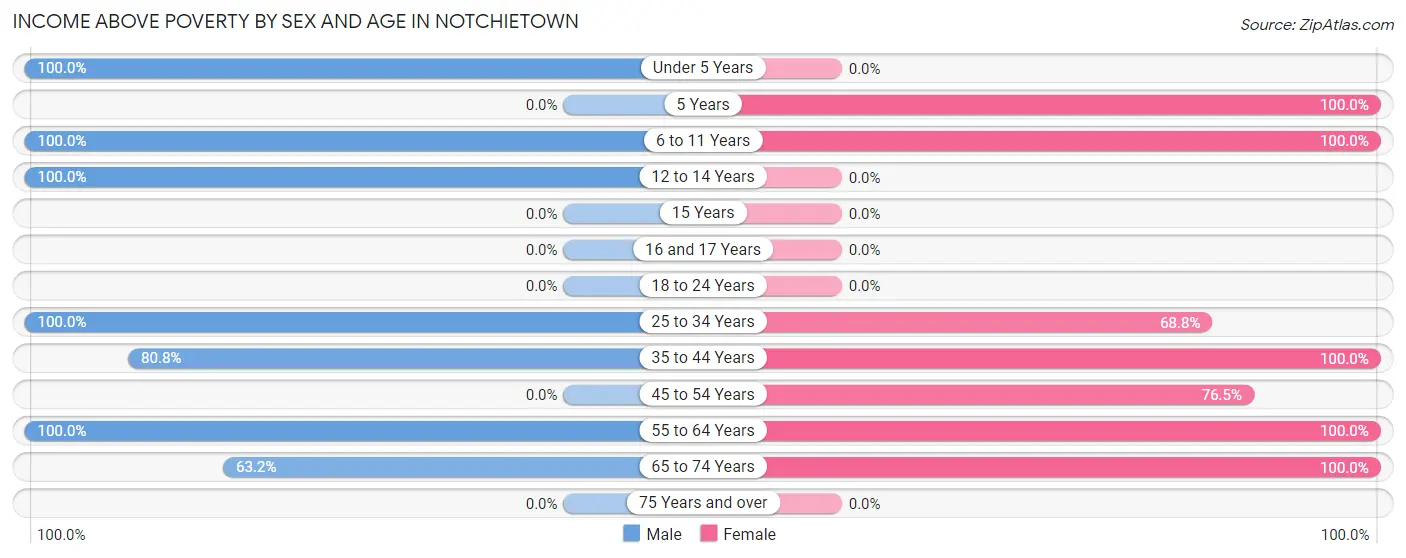
| Age Bracket | Male | Female |
| Under 5 Years | 27 (100.0%) | 0 (0.0%) |
| 5 Years | 0 (0.0%) | 6 (100.0%) |
| 6 to 11 Years | 6 (100.0%) | 6 (100.0%) |
| 12 to 14 Years | 5 (100.0%) | 0 (0.0%) |
| 15 Years | 0 (0.0%) | 0 (0.0%) |
| 16 and 17 Years | 0 (0.0%) | 0 (0.0%) |
| 18 to 24 Years | 0 (0.0%) | 0 (0.0%) |
| 25 to 34 Years | 23 (100.0%) | 11 (68.8%) |
| 35 to 44 Years | 21 (80.8%) | 21 (100.0%) |
| 45 to 54 Years | 0 (0.0%) | 13 (76.5%) |
| 55 to 64 Years | 30 (100.0%) | 38 (100.0%) |
| 65 to 74 Years | 24 (63.2%) | 18 (100.0%) |
| 75 Years and over | 0 (0.0%) | 0 (0.0%) |
| Total | 136 (80.5%) | 113 (87.6%) |
Income Below Poverty Among Married-Couple Families in Notchietown
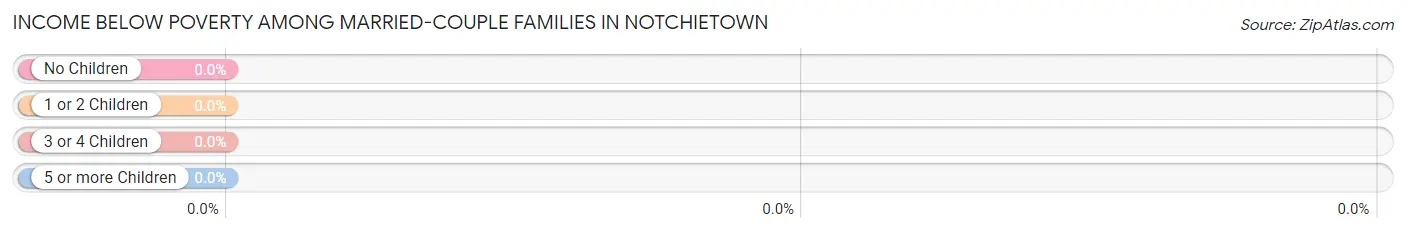
| Children | Above Poverty | Below Poverty |
| No Children | 41 (100.0%) | 0 (0.0%) |
| 1 or 2 Children | 13 (100.0%) | 0 (0.0%) |
| 3 or 4 Children | 0 (0.0%) | 0 (0.0%) |
| 5 or more Children | 0 (0.0%) | 0 (0.0%) |
| Total | 54 (100.0%) | 0 (0.0%) |
Income Below Poverty Among Single-Parent Households in Notchietown
According to the poverty data in Notchietown, 27.8% or 5 single-father households and 100.0% or 2 single-mother households are living below the poverty line. Among single-father households, those with 1 or 2 children have the highest poverty rate, with 5 households (38.5%) experiencing poverty. Likewise, among single-mother households, those with no children have the highest poverty rate, with 2 households (100.0%) falling below the poverty line.
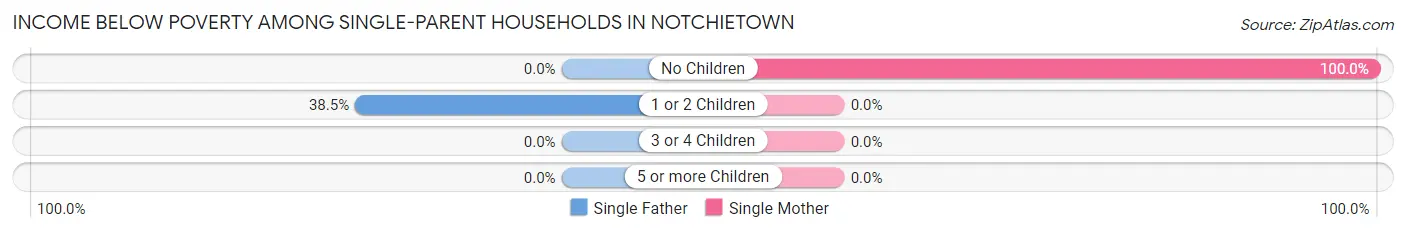
| Children | Single Father | Single Mother |
| No Children | 0 (0.0%) | 2 (100.0%) |
| 1 or 2 Children | 5 (38.5%) | 0 (0.0%) |
| 3 or 4 Children | 0 (0.0%) | 0 (0.0%) |
| 5 or more Children | 0 (0.0%) | 0 (0.0%) |
| Total | 5 (27.8%) | 2 (100.0%) |
Income Below Poverty Among Married-Couple vs Single-Parent Households in Notchietown
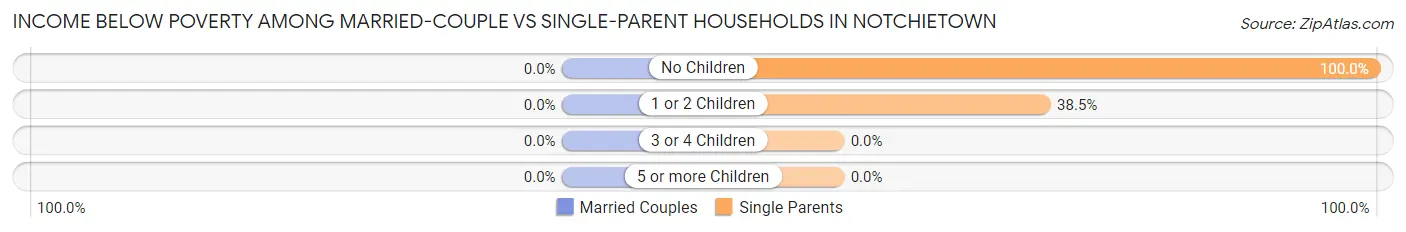
| Children | Married-Couple Families | Single-Parent Households |
| No Children | 0 (0.0%) | 2 (100.0%) |
| 1 or 2 Children | 0 (0.0%) | 5 (38.5%) |
| 3 or 4 Children | 0 (0.0%) | 0 (0.0%) |
| 5 or more Children | 0 (0.0%) | 0 (0.0%) |
| Total | 0 (0.0%) | 7 (35.0%) |
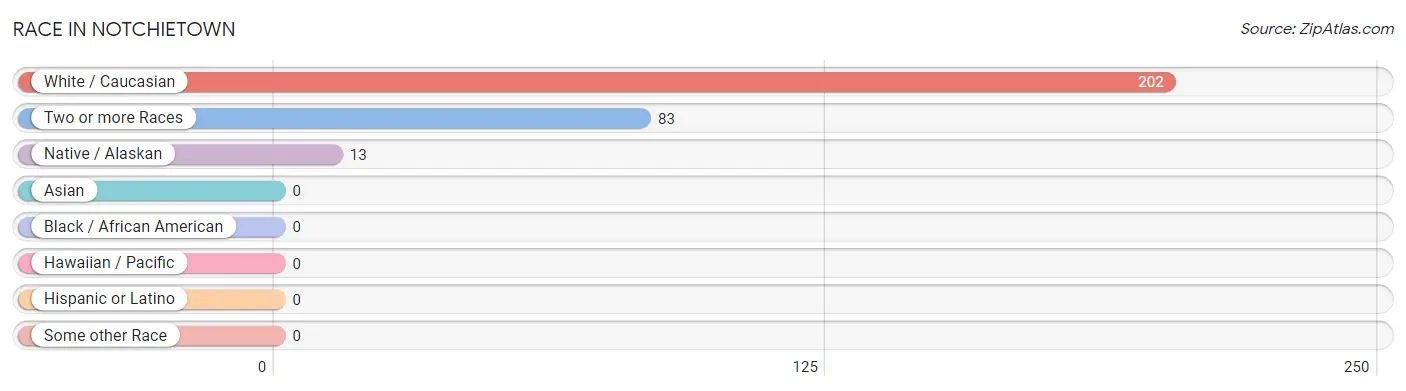
Race in Notchietown
The most populous races in Notchietown are White / Caucasian (202 | 67.8%), Two or more Races (83 | 27.9%), and Native / Alaskan (13 | 4.4%).
| Race | # Population | % Population |
| Asian | 0 | 0.0% |
| Black / African American | 0 | 0.0% |
| Hawaiian / Pacific | 0 | 0.0% |
| Hispanic or Latino | 0 | 0.0% |
| Native / Alaskan | 13 | 4.4% |
| White / Caucasian | 202 | 67.8% |
| Two or more Races | 83 | 27.9% |
| Some other Race | 0 | 0.0% |
| Total | 298 | 100.0% |
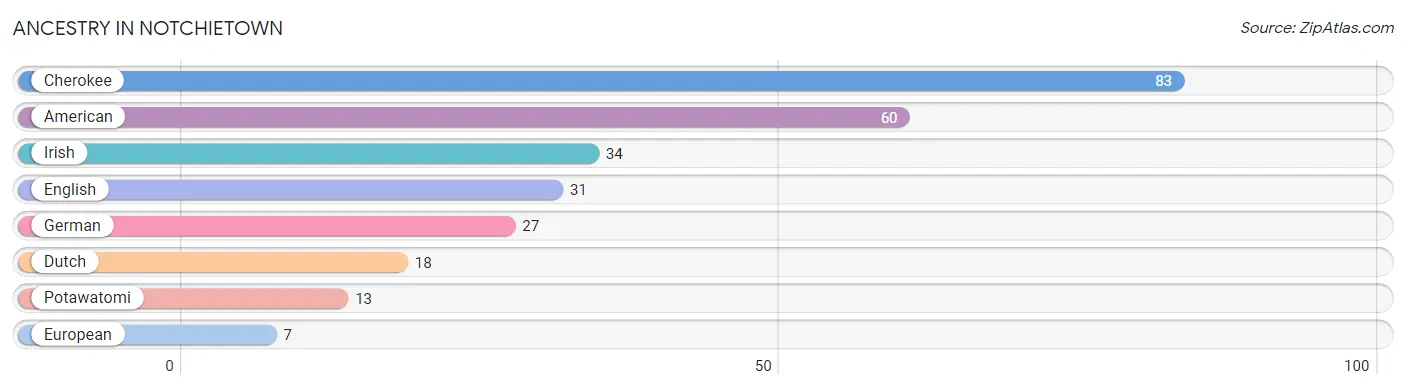
Ancestry in Notchietown
The most populous ancestries reported in Notchietown are Cherokee (83 | 27.9%), American (60 | 20.1%), Irish (34 | 11.4%), English (31 | 10.4%), and German (27 | 9.1%), together accounting for 78.8% of all Notchietown residents.
| Ancestry | # Population | % Population |
| American | 60 | 20.1% |
| Cherokee | 83 | 27.9% |
| Dutch | 18 | 6.0% |
| English | 31 | 10.4% |
| European | 7 | 2.4% |
| German | 27 | 9.1% |
| Irish | 34 | 11.4% |
| Potawatomi | 13 | 4.4% | View All 8 Rows |
Immigrants in Notchietown

| Immigration Origin | # Population | % Population | View All 0 Rows |
Sex and Age in Notchietown
Sex and Age in Notchietown
The most populous age groups in Notchietown are 60 to 64 Years (30 | 17.7%) for men and 55 to 59 Years (25 | 19.4%) for women.
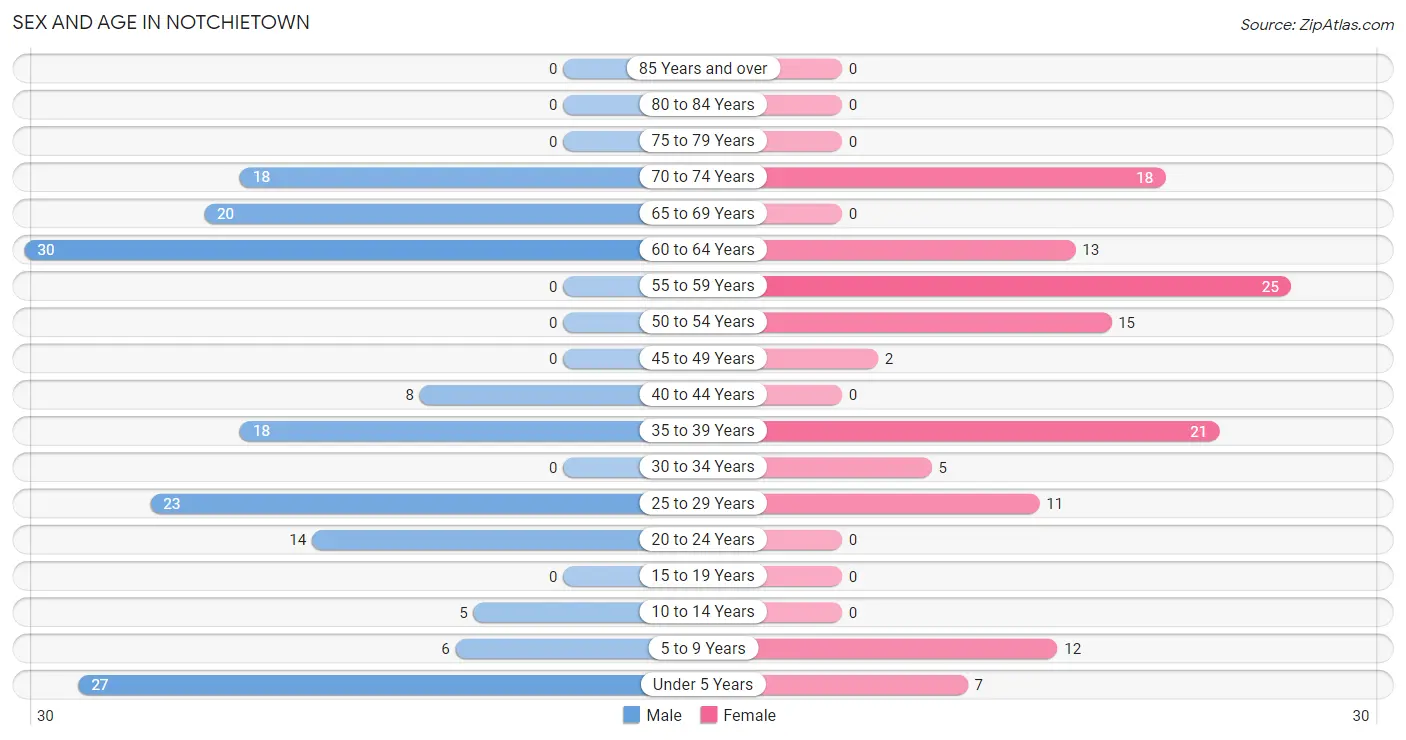
| Age Bracket | Male | Female |
| Under 5 Years | 27 (16.0%) | 7 (5.4%) |
| 5 to 9 Years | 6 (3.5%) | 12 (9.3%) |
| 10 to 14 Years | 5 (3.0%) | 0 (0.0%) |
| 15 to 19 Years | 0 (0.0%) | 0 (0.0%) |
| 20 to 24 Years | 14 (8.3%) | 0 (0.0%) |
| 25 to 29 Years | 23 (13.6%) | 11 (8.5%) |
| 30 to 34 Years | 0 (0.0%) | 5 (3.9%) |
| 35 to 39 Years | 18 (10.6%) | 21 (16.3%) |
| 40 to 44 Years | 8 (4.7%) | 0 (0.0%) |
| 45 to 49 Years | 0 (0.0%) | 2 (1.5%) |
| 50 to 54 Years | 0 (0.0%) | 15 (11.6%) |
| 55 to 59 Years | 0 (0.0%) | 25 (19.4%) |
| 60 to 64 Years | 30 (17.7%) | 13 (10.1%) |
| 65 to 69 Years | 20 (11.8%) | 0 (0.0%) |
| 70 to 74 Years | 18 (10.6%) | 18 (14.0%) |
| 75 to 79 Years | 0 (0.0%) | 0 (0.0%) |
| 80 to 84 Years | 0 (0.0%) | 0 (0.0%) |
| 85 Years and over | 0 (0.0%) | 0 (0.0%) |
| Total | 169 (100.0%) | 129 (100.0%) |
Families and Households in Notchietown
Median Family Size in Notchietown
The median family size in Notchietown is 3.41 persons per family, with single female/mother families (2 | 2.7%) accounting for the largest median family size of 8 persons per family. On the other hand, married-couple families (54 | 73.0%) represent the smallest median family size with 2.78 persons per family.
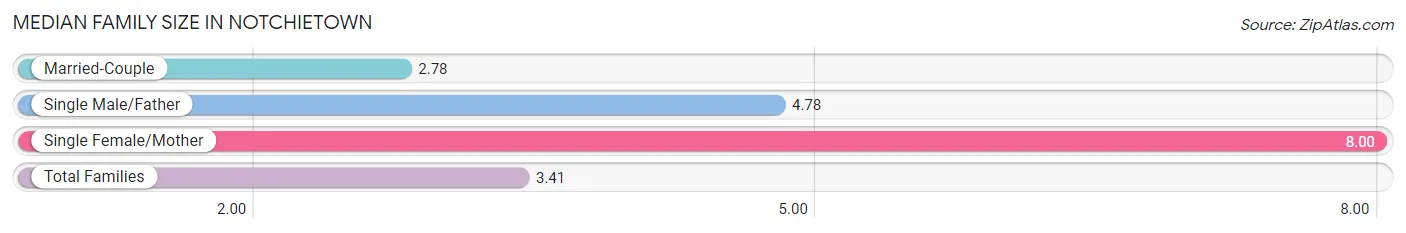
| Family Type | # Families | Family Size |
| Married-Couple | 54 (73.0%) | 2.78 |
| Single Male/Father | 18 (24.3%) | 4.78 |
| Single Female/Mother | 2 (2.7%) | 8.00 |
| Total Families | 74 (100.0%) | 3.41 |
Median Household Size in Notchietown
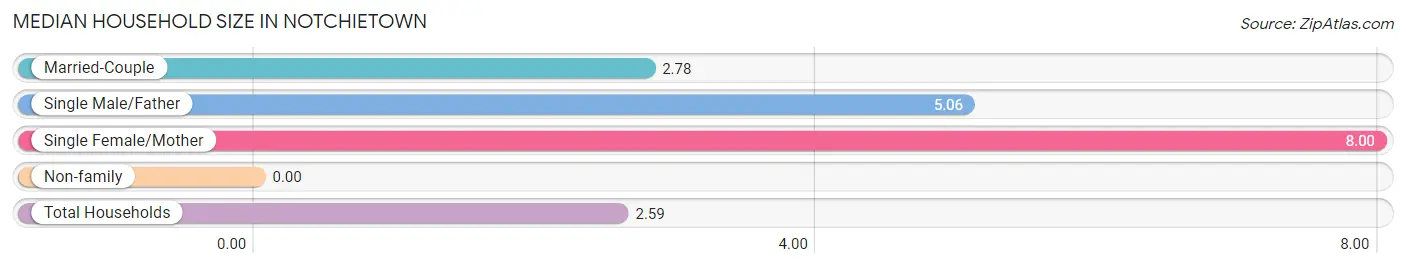
| Household Type | # Households | Household Size |
| Married-Couple | 54 (47.0%) | 2.78 |
| Single Male/Father | 18 (15.7%) | 5.06 |
| Single Female/Mother | 2 (1.7%) | 8.00 |
| Non-family | 41 (35.6%) | - |
| Total Households | 115 (100.0%) | 2.59 |
Household Size by Marriage Status in Notchietown
Out of a total of 115 households in Notchietown, 74 (64.3%) are family households, while 41 (35.6%) are nonfamily households. The most numerous type of family households are 3-person households, comprising 39, and the most common type of nonfamily households are 1-person households, comprising 41.
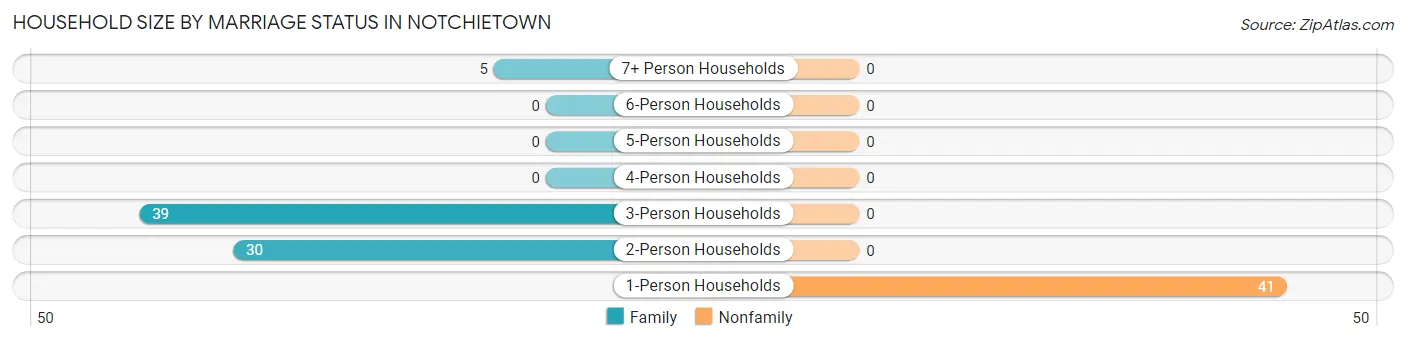
| Household Size | Family Households | Nonfamily Households |
| 1-Person Households | - | 41 (35.6%) |
| 2-Person Households | 30 (26.1%) | 0 (0.0%) |
| 3-Person Households | 39 (33.9%) | 0 (0.0%) |
| 4-Person Households | 0 (0.0%) | 0 (0.0%) |
| 5-Person Households | 0 (0.0%) | 0 (0.0%) |
| 6-Person Households | 0 (0.0%) | 0 (0.0%) |
| 7+ Person Households | 5 (4.3%) | 0 (0.0%) |
| Total | 74 (64.3%) | 41 (35.6%) |
Female Fertility in Notchietown
Fertility by Age in Notchietown
Average fertility rate in Notchietown is 205.0 births per 1,000 women. Women in the age bracket of 35 to 50 years have the highest fertility rate with 348.0 births per 1,000 women. Women in the age bracket of 35 to 50 years acount for 100.0% of all women with births.
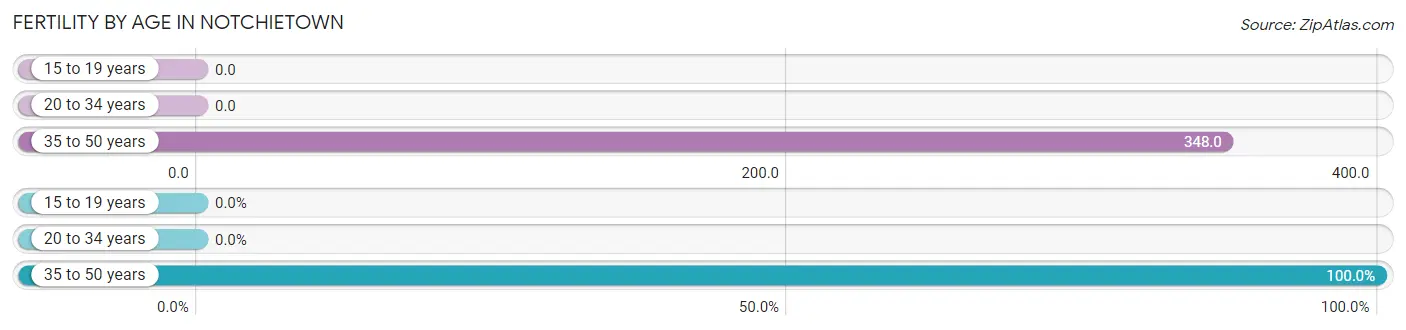
| Age Bracket | Women with Births | Births / 1,000 Women |
| 15 to 19 years | 0 (0.0%) | 0.0 |
| 20 to 34 years | 0 (0.0%) | 0.0 |
| 35 to 50 years | 8 (100.0%) | 348.0 |
| Total | 8 (100.0%) | 205.0 |
Fertility by Age by Marriage Status in Notchietown
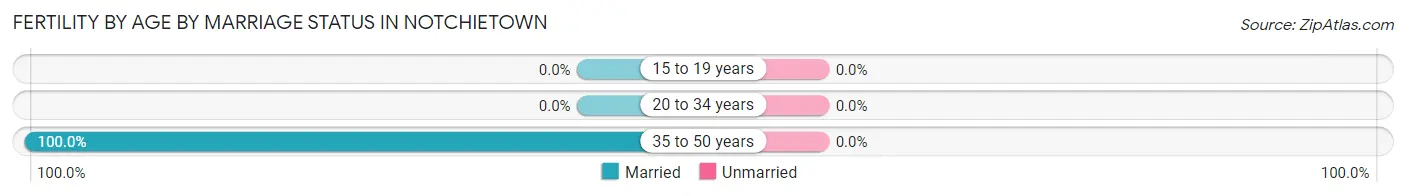
| Age Bracket | Married | Unmarried |
| 15 to 19 years | 0 (0.0%) | 0 (0.0%) |
| 20 to 34 years | 0 (0.0%) | 0 (0.0%) |
| 35 to 50 years | 8 (100.0%) | 0 (0.0%) |
| Total | 8 (100.0%) | 0 (0.0%) |
Fertility by Education in Notchietown
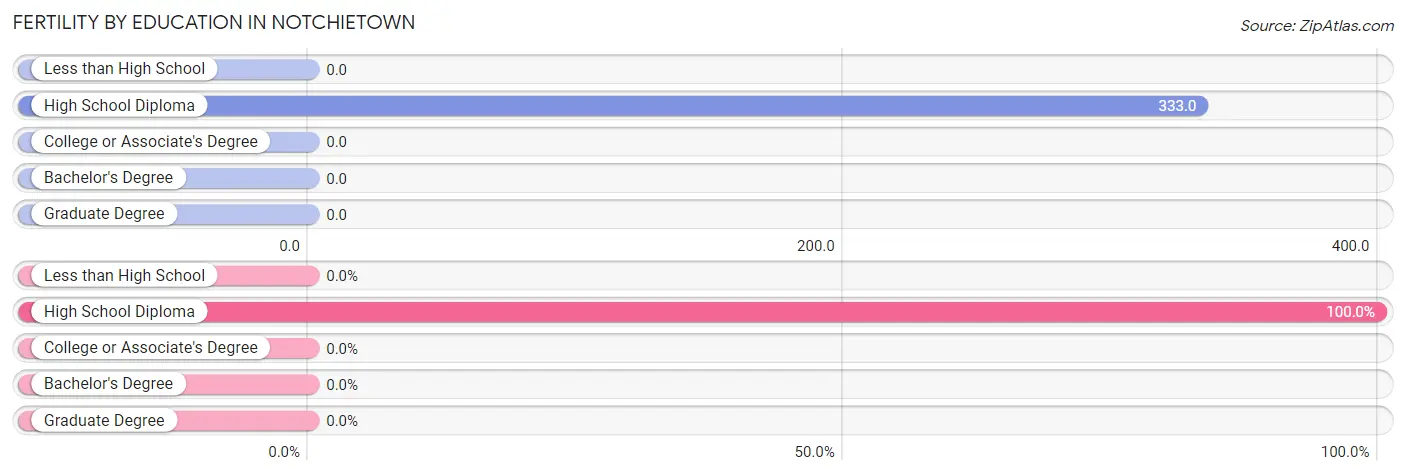
| Educational Attainment | Women with Births | Births / 1,000 Women |
| Less than High School | 0 (0.0%) | 0.0 |
| High School Diploma | 8 (100.0%) | 333.0 |
| College or Associate's Degree | 0 (0.0%) | 0.0 |
| Bachelor's Degree | 0 (0.0%) | 0.0 |
| Graduate Degree | 0 (0.0%) | 0.0 |
| Total | 8 (100.0%) | 205.0 |
Fertility by Education by Marriage Status in Notchietown
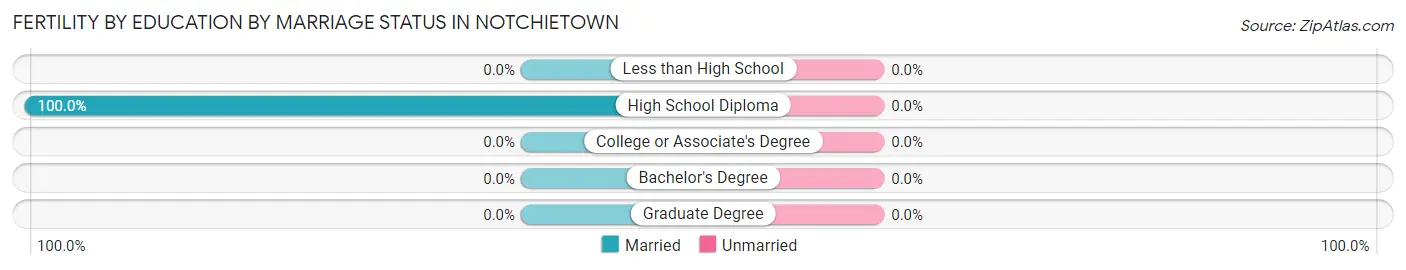
| Educational Attainment | Married | Unmarried |
| Less than High School | 0 (0.0%) | 0 (0.0%) |
| High School Diploma | 8 (100.0%) | 0 (0.0%) |
| College or Associate's Degree | 0 (0.0%) | 0 (0.0%) |
| Bachelor's Degree | 0 (0.0%) | 0 (0.0%) |
| Graduate Degree | 0 (0.0%) | 0 (0.0%) |
| Total | 8 (100.0%) | 0 (0.0%) |
Employment Characteristics in Notchietown
Employment by Class of Employer in Notchietown
Among the 101 employed individuals in Notchietown, private company employees (81 | 80.2%), self-employed (not incorporated) (12 | 11.9%), and local government employees (8 | 7.9%) make up the most common classes of employment.
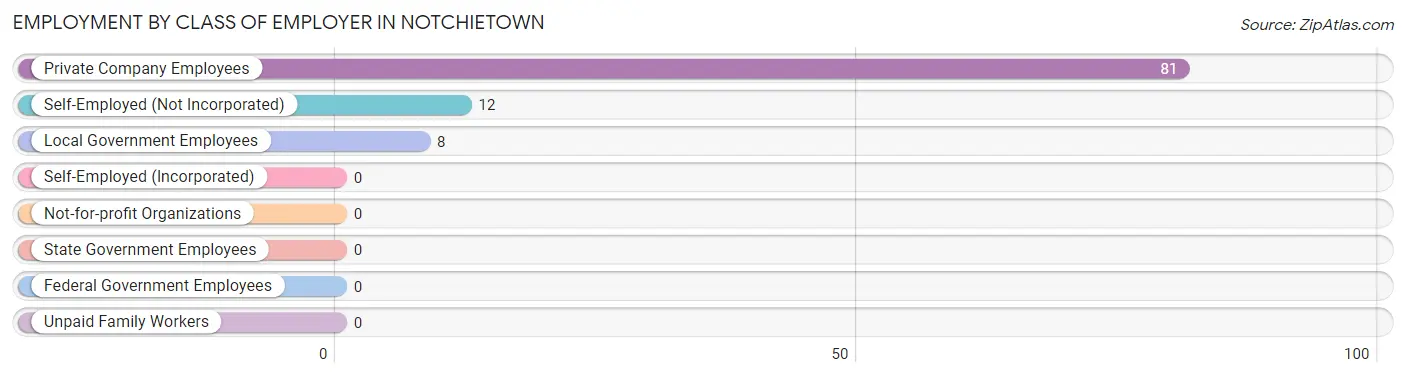
| Employer Class | # Employees | % Employees |
| Private Company Employees | 81 | 80.2% |
| Self-Employed (Incorporated) | 0 | 0.0% |
| Self-Employed (Not Incorporated) | 12 | 11.9% |
| Not-for-profit Organizations | 0 | 0.0% |
| Local Government Employees | 8 | 7.9% |
| State Government Employees | 0 | 0.0% |
| Federal Government Employees | 0 | 0.0% |
| Unpaid Family Workers | 0 | 0.0% |
| Total | 101 | 100.0% |
Employment Status by Age in Notchietown
According to the labor force statistics for Notchietown, out of the total population over 16 years of age (241), 51.5% or 124 individuals are in the labor force, with 18.5% or 23 of them unemployed. The age group with the highest labor force participation rate is 20 to 24 years, with 100.0% or 14 individuals in the labor force. Within the labor force, the 25 to 29 years age range has the highest percentage of unemployed individuals, with 100.0% or 23 of them being unemployed.
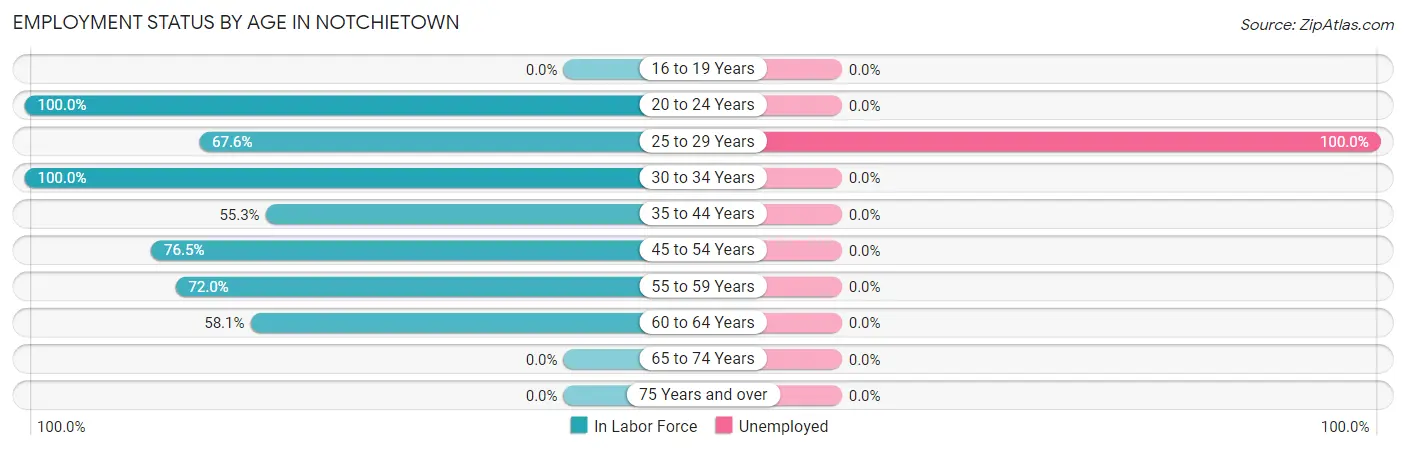
| Age Bracket | In Labor Force | Unemployed |
| 16 to 19 Years | 0 (0.0%) | 0 (0.0%) |
| 20 to 24 Years | 14 (100.0%) | 0 (0.0%) |
| 25 to 29 Years | 23 (67.6%) | 23 (100.0%) |
| 30 to 34 Years | 5 (100.0%) | 0 (0.0%) |
| 35 to 44 Years | 26 (55.3%) | 0 (0.0%) |
| 45 to 54 Years | 13 (76.5%) | 0 (0.0%) |
| 55 to 59 Years | 18 (72.0%) | 0 (0.0%) |
| 60 to 64 Years | 25 (58.1%) | 0 (0.0%) |
| 65 to 74 Years | 0 (0.0%) | 0 (0.0%) |
| 75 Years and over | 0 (0.0%) | 0 (0.0%) |
| Total | 124 (51.5%) | 23 (18.5%) |
Employment Status by Educational Attainment in Notchietown
According to labor force statistics for Notchietown, 64.3% of individuals (110) out of the total population between 25 and 64 years of age (171) are in the labor force, with 20.9% or 23 of them being unemployed. The group with the highest labor force participation rate are those with the educational attainment of less than high school, with 100.0% or 30 individuals in the labor force. Within the labor force, individuals with college / associate degree education have the highest percentage of unemployment, with 100.0% or 23 of them being unemployed.
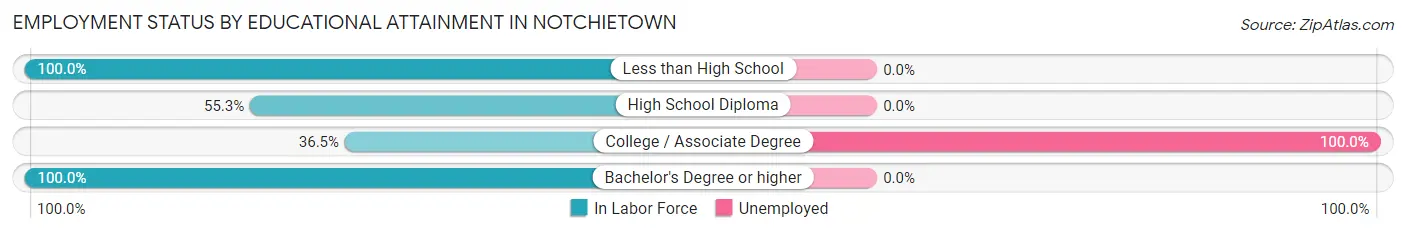
| Educational Attainment | In Labor Force | Unemployed |
| Less than High School | 30 (100.0%) | 0 (0.0%) |
| High School Diploma | 26 (55.3%) | 0 (0.0%) |
| College / Associate Degree | 23 (36.5%) | 63 (100.0%) |
| Bachelor's Degree or higher | 31 (100.0%) | 0 (0.0%) |
| Total | 110 (64.3%) | 36 (20.9%) |
Employment Occupations by Sex in Notchietown
Management, Business, Science and Arts Occupations
The most common Management, Business, Science and Arts occupations in Notchietown are Computers, Engineering & Science (13 | 12.9%), Architecture & Engineering (13 | 12.9%), and Management (5 | 5.0%).
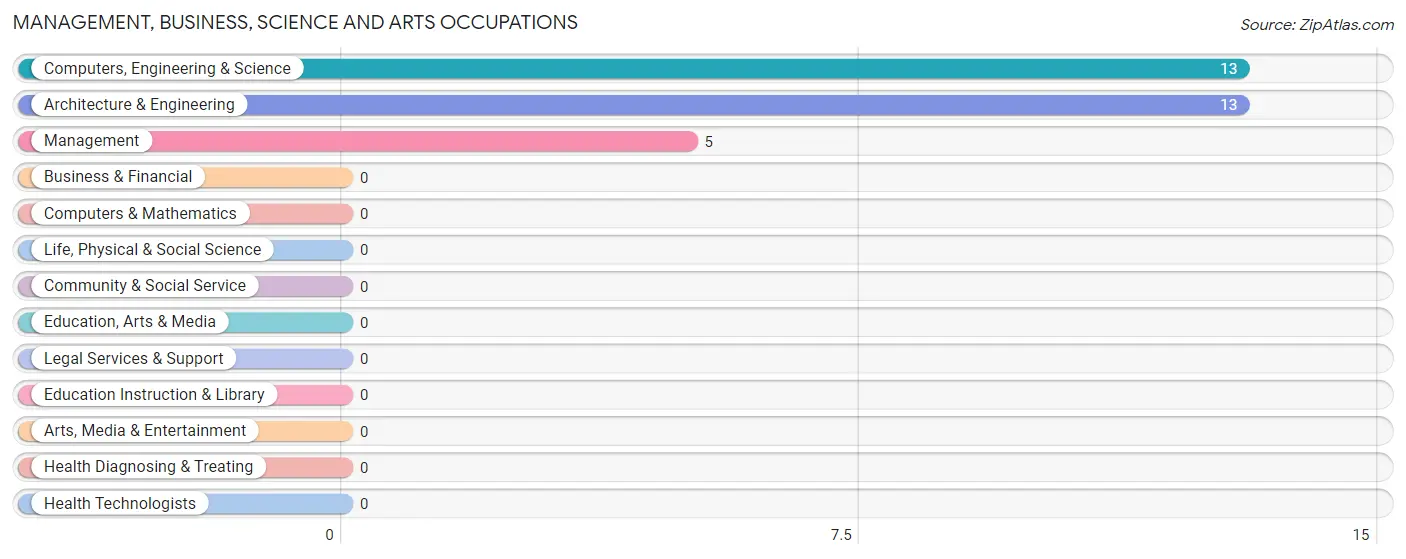
Management, Business, Science and Arts Occupations by Sex
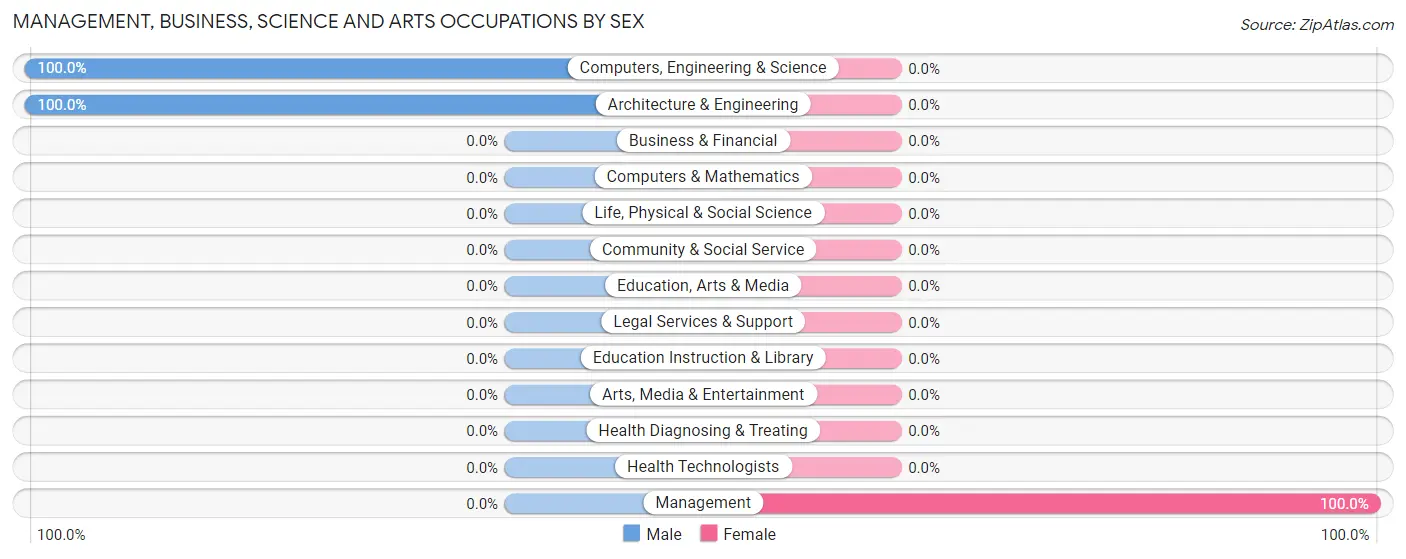
| Occupation | Male | Female |
| Management | 0 (0.0%) | 5 (100.0%) |
| Business & Financial | 0 (0.0%) | 0 (0.0%) |
| Computers, Engineering & Science | 13 (100.0%) | 0 (0.0%) |
| Computers & Mathematics | 0 (0.0%) | 0 (0.0%) |
| Architecture & Engineering | 13 (100.0%) | 0 (0.0%) |
| Life, Physical & Social Science | 0 (0.0%) | 0 (0.0%) |
| Community & Social Service | 0 (0.0%) | 0 (0.0%) |
| Education, Arts & Media | 0 (0.0%) | 0 (0.0%) |
| Legal Services & Support | 0 (0.0%) | 0 (0.0%) |
| Education Instruction & Library | 0 (0.0%) | 0 (0.0%) |
| Arts, Media & Entertainment | 0 (0.0%) | 0 (0.0%) |
| Health Diagnosing & Treating | 0 (0.0%) | 0 (0.0%) |
| Health Technologists | 0 (0.0%) | 0 (0.0%) |
| Total (Category) | 13 (72.2%) | 5 (27.8%) |
| Total (Overall) | 65 (64.4%) | 36 (35.6%) |
Services Occupations
Services Occupations by Sex
| Occupation | Male | Female |
| Healthcare Support | 0 (0.0%) | 0 (0.0%) |
| Security & Protection | 0 (0.0%) | 0 (0.0%) |
| Firefighting & Prevention | 0 (0.0%) | 0 (0.0%) |
| Law Enforcement | 0 (0.0%) | 0 (0.0%) |
| Food Preparation & Serving | 0 (0.0%) | 0 (0.0%) |
| Cleaning & Maintenance | 0 (0.0%) | 0 (0.0%) |
| Personal Care & Service | 0 (0.0%) | 0 (0.0%) |
| Total (Category) | 0 (0.0%) | 0 (0.0%) |
| Total (Overall) | 65 (64.4%) | 36 (35.6%) |
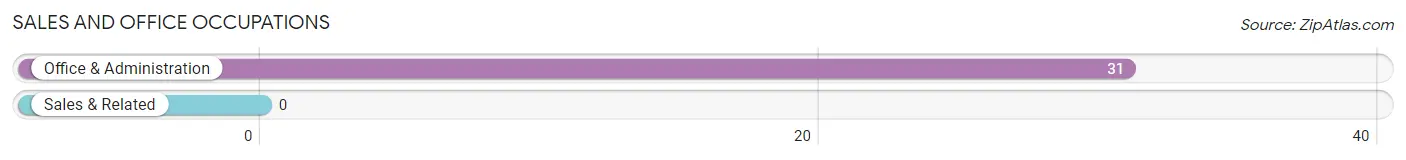
Sales and Office Occupations
The most common Sales and Office occupations in Notchietown are , and Office & Administration (31 | 30.7%).
Sales and Office Occupations by Sex
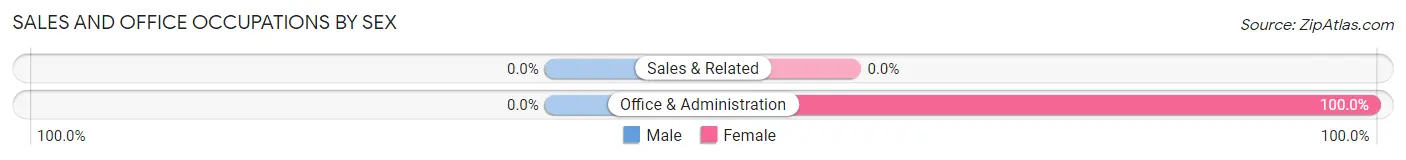
| Occupation | Male | Female |
| Sales & Related | 0 (0.0%) | 0 (0.0%) |
| Office & Administration | 0 (0.0%) | 31 (100.0%) |
| Total (Category) | 0 (0.0%) | 31 (100.0%) |
| Total (Overall) | 65 (64.4%) | 36 (35.6%) |
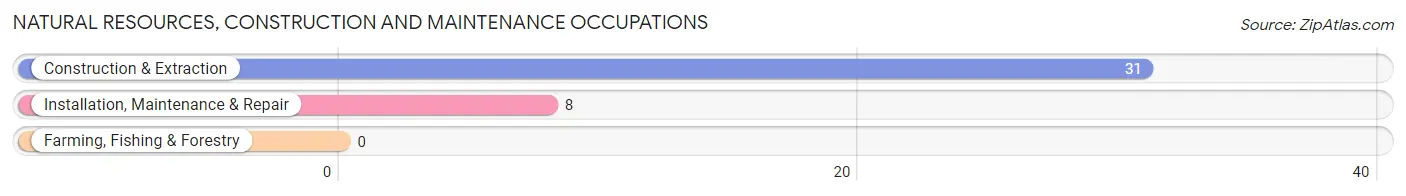
Natural Resources, Construction and Maintenance Occupations
The most common Natural Resources, Construction and Maintenance occupations in Notchietown are Construction & Extraction (31 | 30.7%), and Installation, Maintenance & Repair (8 | 7.9%).
Natural Resources, Construction and Maintenance Occupations by Sex
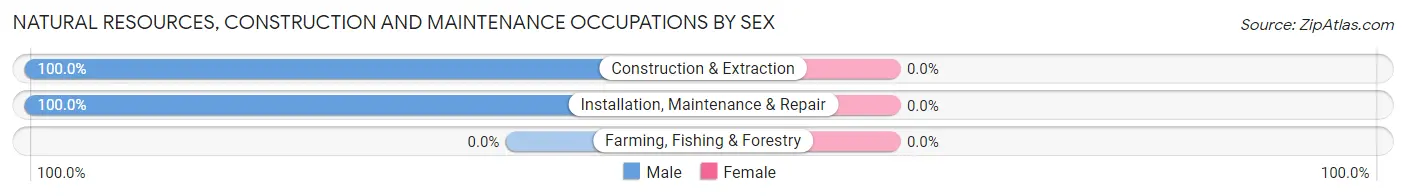
| Occupation | Male | Female |
| Farming, Fishing & Forestry | 0 (0.0%) | 0 (0.0%) |
| Construction & Extraction | 31 (100.0%) | 0 (0.0%) |
| Installation, Maintenance & Repair | 8 (100.0%) | 0 (0.0%) |
| Total (Category) | 39 (100.0%) | 0 (0.0%) |
| Total (Overall) | 65 (64.4%) | 36 (35.6%) |
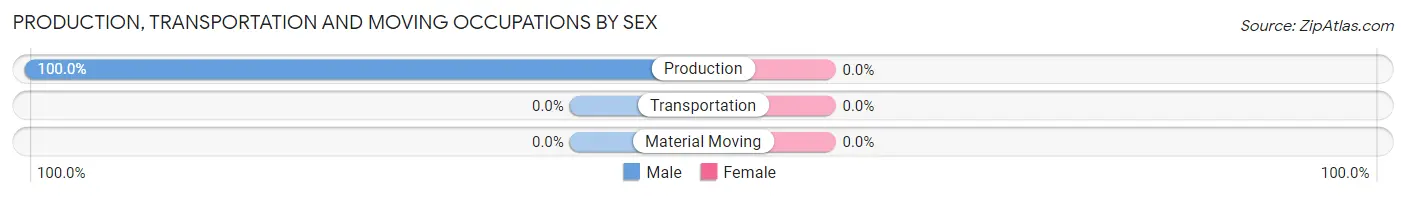
Production, Transportation and Moving Occupations
The most common Production, Transportation and Moving occupations in Notchietown are , and Production (13 | 12.9%).
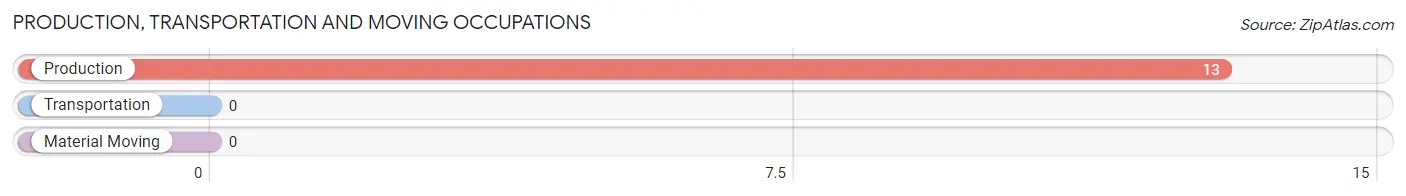
Production, Transportation and Moving Occupations by Sex
| Occupation | Male | Female |
| Production | 13 (100.0%) | 0 (0.0%) |
| Transportation | 0 (0.0%) | 0 (0.0%) |
| Material Moving | 0 (0.0%) | 0 (0.0%) |
| Total (Category) | 13 (100.0%) | 0 (0.0%) |
| Total (Overall) | 65 (64.4%) | 36 (35.6%) |
Employment Industries by Sex in Notchietown
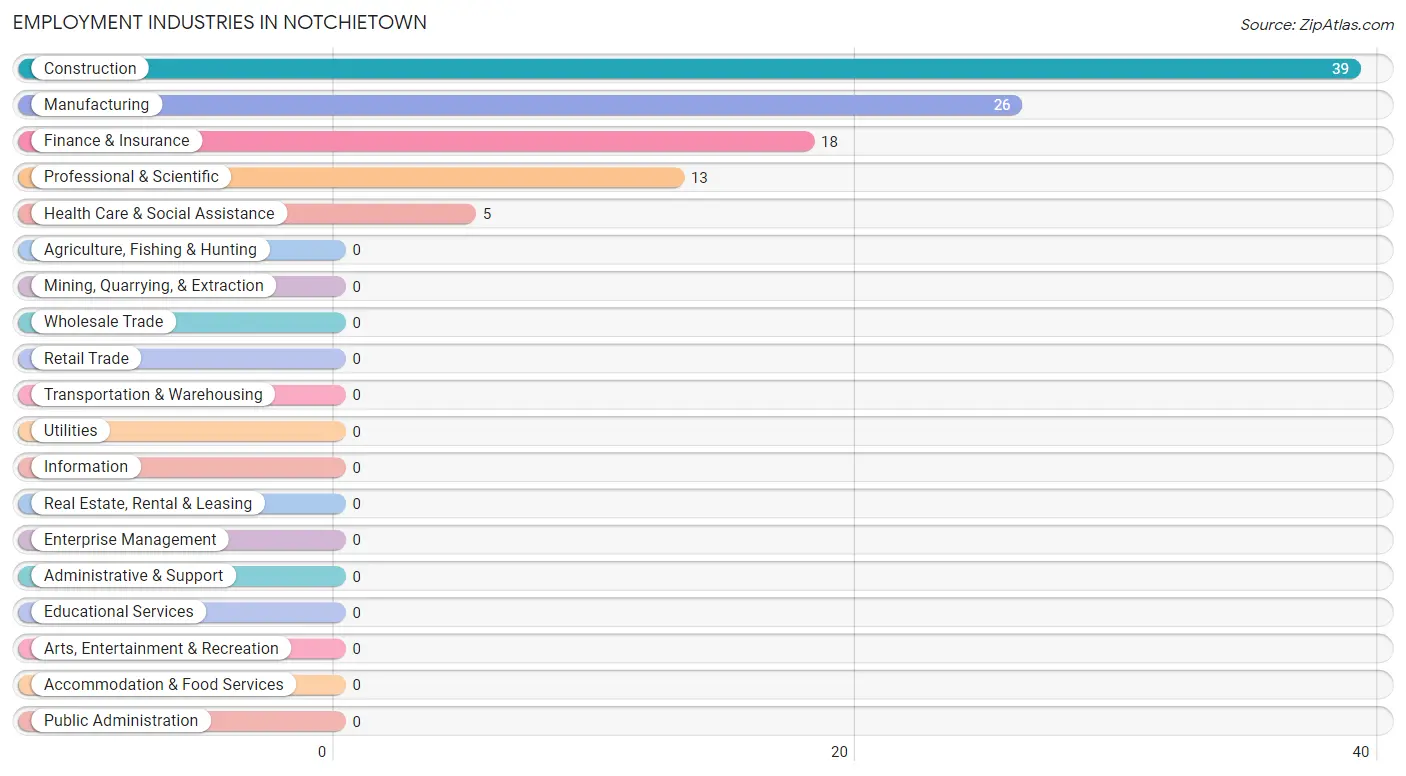
Employment Industries in Notchietown
The major employment industries in Notchietown include Construction (39 | 38.6%), Manufacturing (26 | 25.7%), Finance & Insurance (18 | 17.8%), Professional & Scientific (13 | 12.9%), and Health Care & Social Assistance (5 | 5.0%).
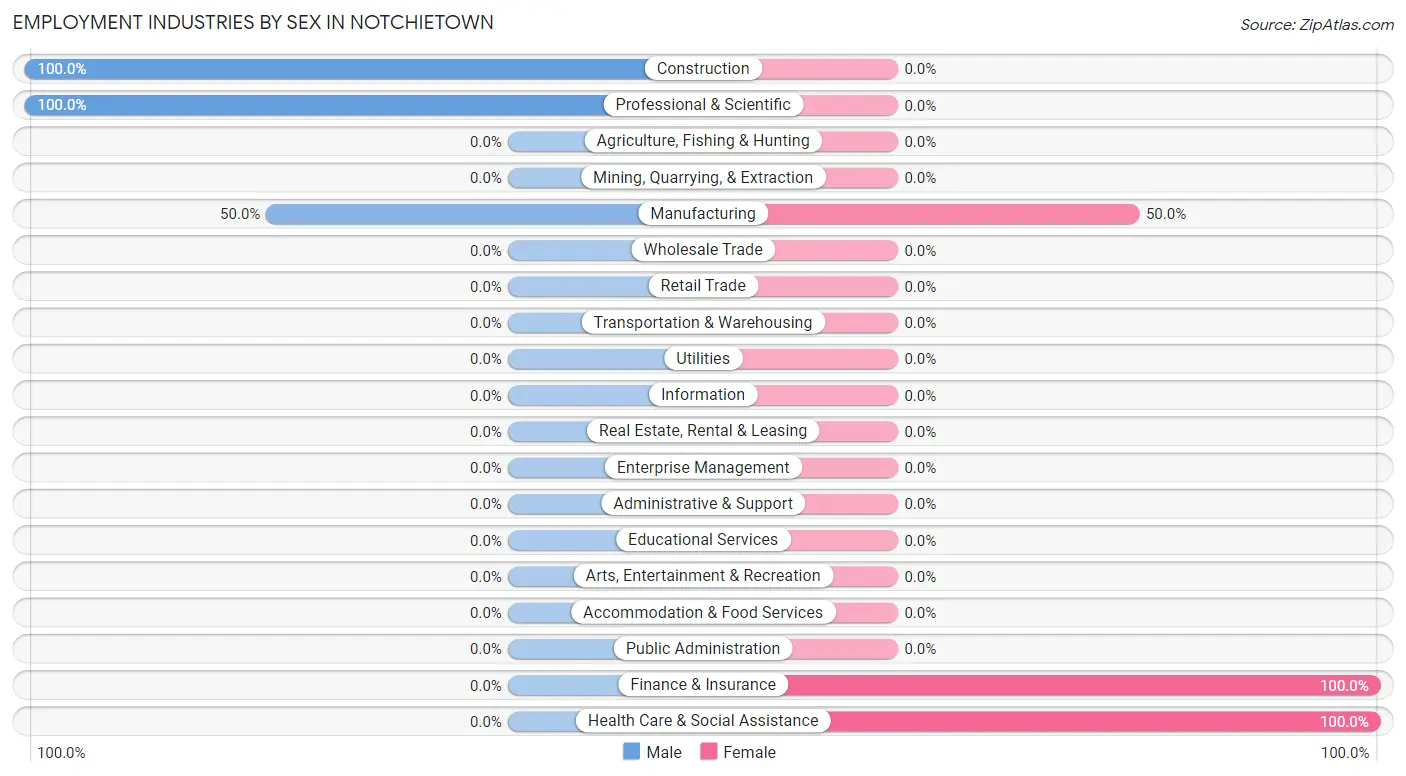
Employment Industries by Sex in Notchietown
The Notchietown industries that see more men than women are Construction (100.0%), Professional & Scientific (100.0%), and Manufacturing (50.0%), whereas the industries that tend to have a higher number of women are Finance & Insurance (100.0%), Health Care & Social Assistance (100.0%), and Manufacturing (50.0%).
| Industry | Male | Female |
| Agriculture, Fishing & Hunting | 0 (0.0%) | 0 (0.0%) |
| Mining, Quarrying, & Extraction | 0 (0.0%) | 0 (0.0%) |
| Construction | 39 (100.0%) | 0 (0.0%) |
| Manufacturing | 13 (50.0%) | 13 (50.0%) |
| Wholesale Trade | 0 (0.0%) | 0 (0.0%) |
| Retail Trade | 0 (0.0%) | 0 (0.0%) |
| Transportation & Warehousing | 0 (0.0%) | 0 (0.0%) |
| Utilities | 0 (0.0%) | 0 (0.0%) |
| Information | 0 (0.0%) | 0 (0.0%) |
| Finance & Insurance | 0 (0.0%) | 18 (100.0%) |
| Real Estate, Rental & Leasing | 0 (0.0%) | 0 (0.0%) |
| Professional & Scientific | 13 (100.0%) | 0 (0.0%) |
| Enterprise Management | 0 (0.0%) | 0 (0.0%) |
| Administrative & Support | 0 (0.0%) | 0 (0.0%) |
| Educational Services | 0 (0.0%) | 0 (0.0%) |
| Health Care & Social Assistance | 0 (0.0%) | 5 (100.0%) |
| Arts, Entertainment & Recreation | 0 (0.0%) | 0 (0.0%) |
| Accommodation & Food Services | 0 (0.0%) | 0 (0.0%) |
| Public Administration | 0 (0.0%) | 0 (0.0%) |
| Total | 65 (64.4%) | 36 (35.6%) |
Education in Notchietown
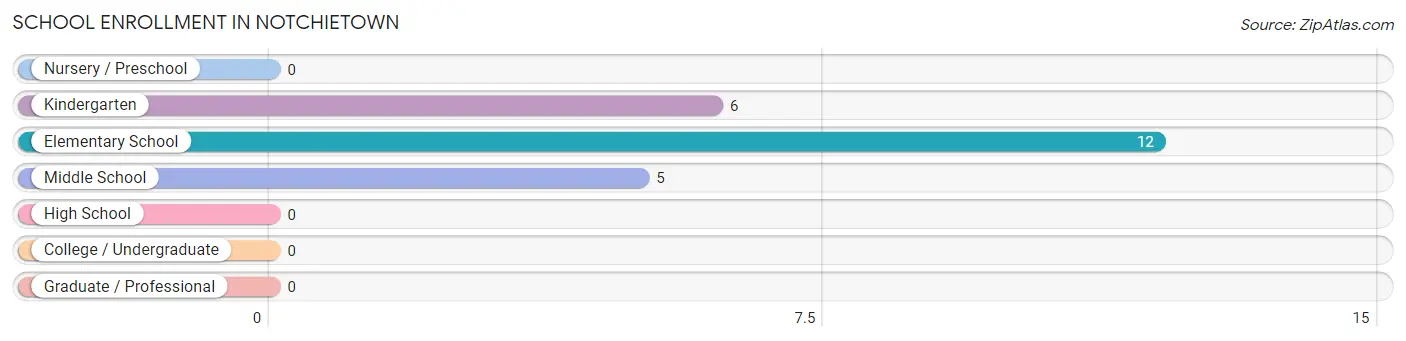
School Enrollment in Notchietown
The most common levels of schooling among the 23 students in Notchietown are elementary school (12 | 52.2%), kindergarten (6 | 26.1%), and middle school (5 | 21.7%).
| School Level | # Students | % Students |
| Nursery / Preschool | 0 | 0.0% |
| Kindergarten | 6 | 26.1% |
| Elementary School | 12 | 52.2% |
| Middle School | 5 | 21.7% |
| High School | 0 | 0.0% |
| College / Undergraduate | 0 | 0.0% |
| Graduate / Professional | 0 | 0.0% |
| Total | 23 | 100.0% |
School Enrollment by Age by Funding Source in Notchietown
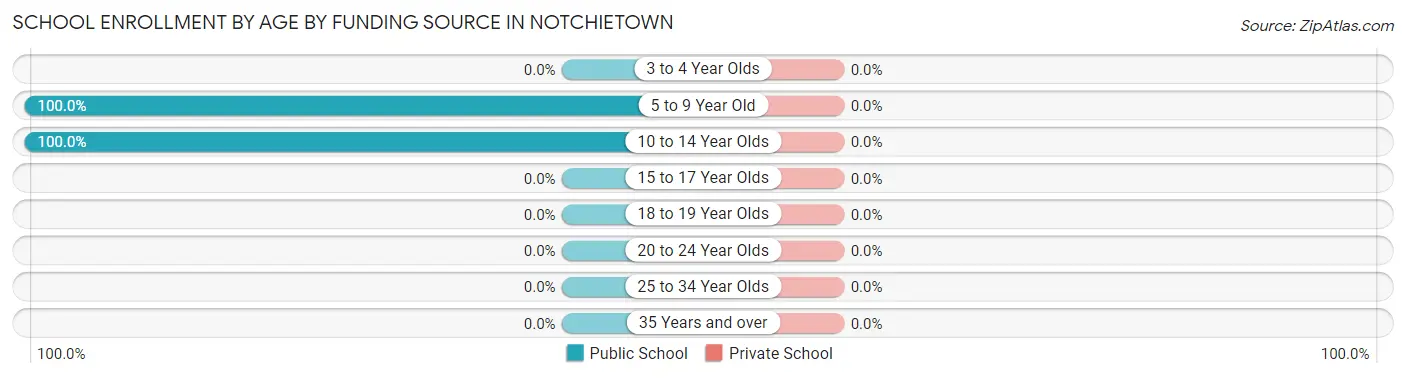
| Age Bracket | Public School | Private School |
| 3 to 4 Year Olds | 0 (0.0%) | 0 (0.0%) |
| 5 to 9 Year Old | 18 (100.0%) | 0 (0.0%) |
| 10 to 14 Year Olds | 5 (100.0%) | 0 (0.0%) |
| 15 to 17 Year Olds | 0 (0.0%) | 0 (0.0%) |
| 18 to 19 Year Olds | 0 (0.0%) | 0 (0.0%) |
| 20 to 24 Year Olds | 0 (0.0%) | 0 (0.0%) |
| 25 to 34 Year Olds | 0 (0.0%) | 0 (0.0%) |
| 35 Years and over | 0 (0.0%) | 0 (0.0%) |
| Total | 23 (100.0%) | 0 (0.0%) |
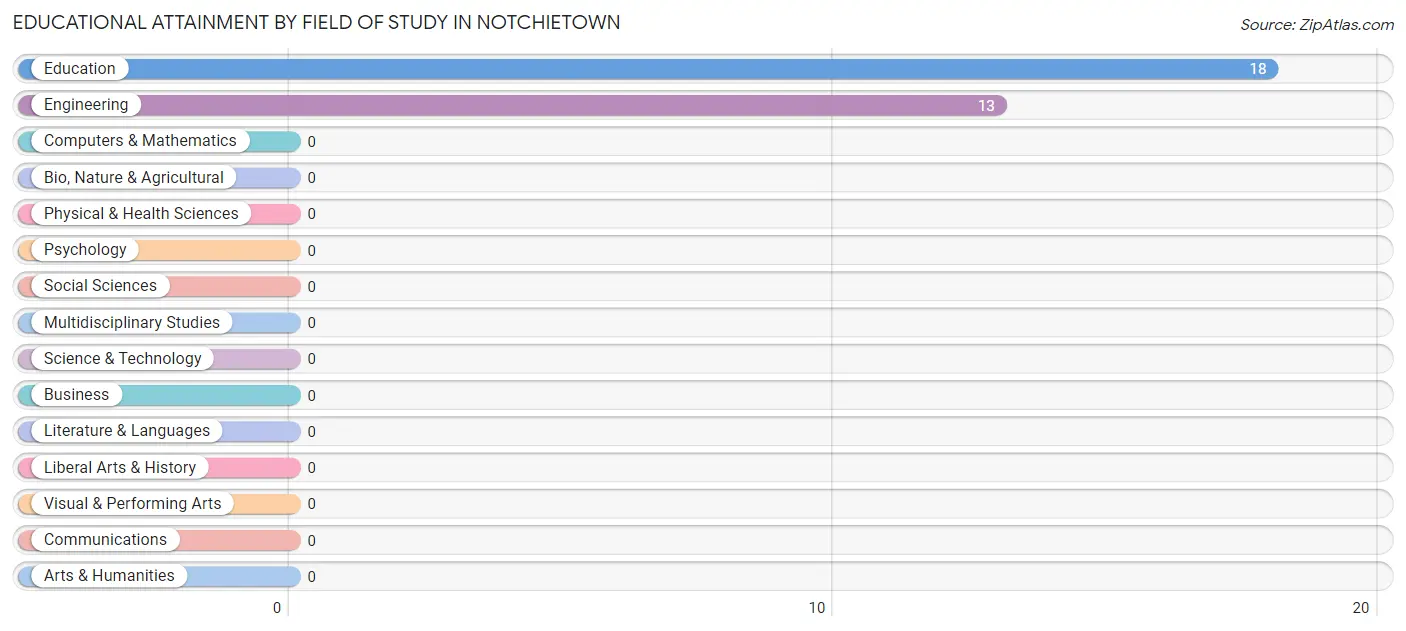
Educational Attainment by Field of Study in Notchietown
Education (18 | 58.1%), and engineering (13 | 41.9%) are the most common fields of study among 31 individuals in Notchietown who have obtained a bachelor's degree or higher.
| Field of Study | # Graduates | % Graduates |
| Computers & Mathematics | 0 | 0.0% |
| Bio, Nature & Agricultural | 0 | 0.0% |
| Physical & Health Sciences | 0 | 0.0% |
| Psychology | 0 | 0.0% |
| Social Sciences | 0 | 0.0% |
| Engineering | 13 | 41.9% |
| Multidisciplinary Studies | 0 | 0.0% |
| Science & Technology | 0 | 0.0% |
| Business | 0 | 0.0% |
| Education | 18 | 58.1% |
| Literature & Languages | 0 | 0.0% |
| Liberal Arts & History | 0 | 0.0% |
| Visual & Performing Arts | 0 | 0.0% |
| Communications | 0 | 0.0% |
| Arts & Humanities | 0 | 0.0% |
| Total | 31 | 100.0% |
Transportation & Commute in Notchietown
Vehicle Availability by Sex in Notchietown
The most prevalent vehicle ownership categories in Notchietown are males with 5 or more vehicles (33, accounting for 50.8%) and females with 5 or more vehicles (13, making up 91.7%).
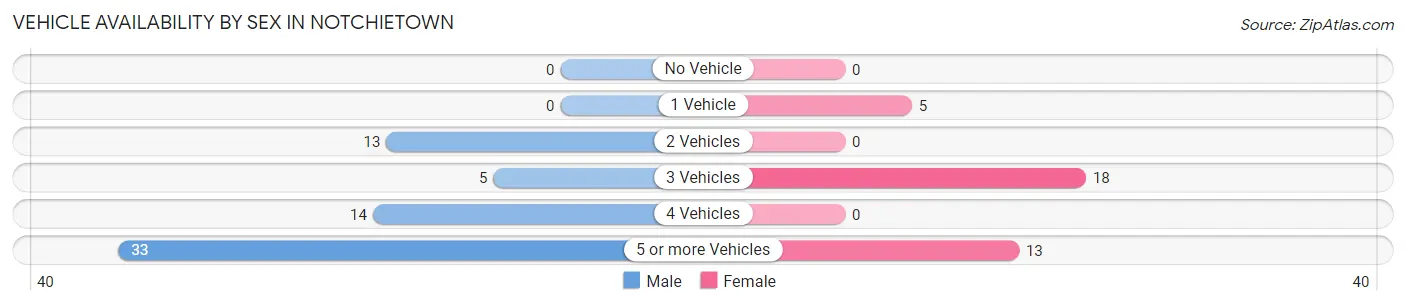
| Vehicles Available | Male | Female |
| No Vehicle | 0 (0.0%) | 0 (0.0%) |
| 1 Vehicle | 0 (0.0%) | 5 (13.9%) |
| 2 Vehicles | 13 (20.0%) | 0 (0.0%) |
| 3 Vehicles | 5 (7.7%) | 18 (50.0%) |
| 4 Vehicles | 14 (21.5%) | 0 (0.0%) |
| 5 or more Vehicles | 33 (50.8%) | 13 (36.1%) |
| Total | 65 (100.0%) | 36 (100.0%) |
Commute Time in Notchietown
The most frequently occuring commute durations in Notchietown are 45 to 59 minutes (25 commuters, 28.4%), 30 to 34 minutes (21 commuters, 23.9%), and 25 to 29 minutes (14 commuters, 15.9%).
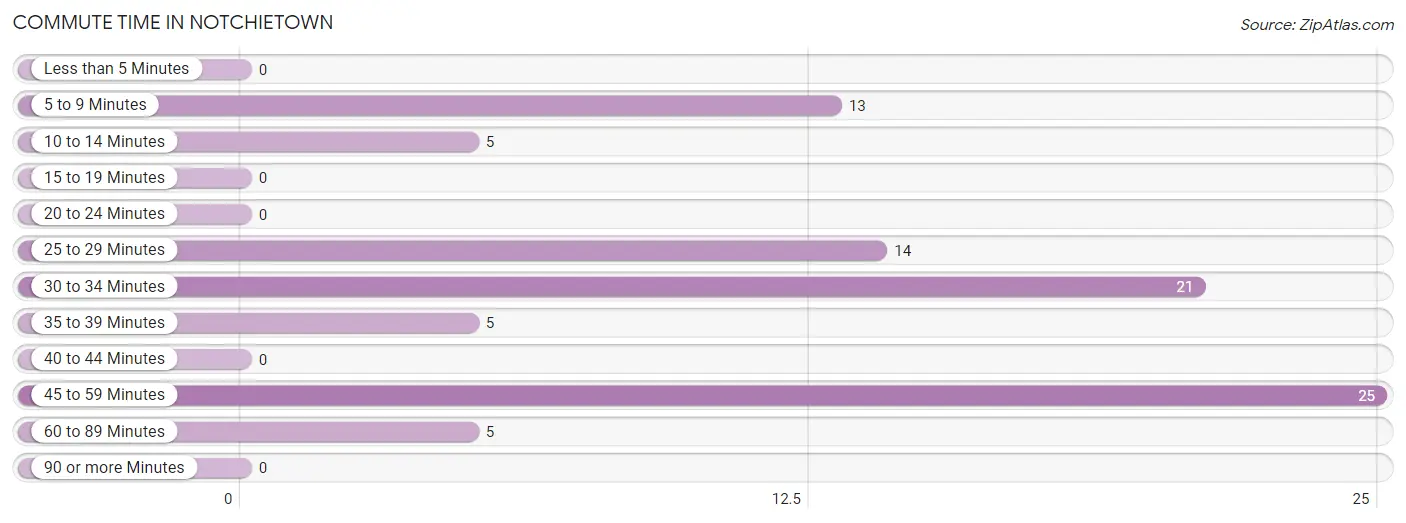
| Commute Time | # Commuters | % Commuters |
| Less than 5 Minutes | 0 | 0.0% |
| 5 to 9 Minutes | 13 | 14.8% |
| 10 to 14 Minutes | 5 | 5.7% |
| 15 to 19 Minutes | 0 | 0.0% |
| 20 to 24 Minutes | 0 | 0.0% |
| 25 to 29 Minutes | 14 | 15.9% |
| 30 to 34 Minutes | 21 | 23.9% |
| 35 to 39 Minutes | 5 | 5.7% |
| 40 to 44 Minutes | 0 | 0.0% |
| 45 to 59 Minutes | 25 | 28.4% |
| 60 to 89 Minutes | 5 | 5.7% |
| 90 or more Minutes | 0 | 0.0% |
Commute Time by Sex in Notchietown
The most common commute times in Notchietown are 30 to 34 minutes (21 commuters, 40.4%) for males and 5 to 9 minutes (13 commuters, 36.1%) for females.
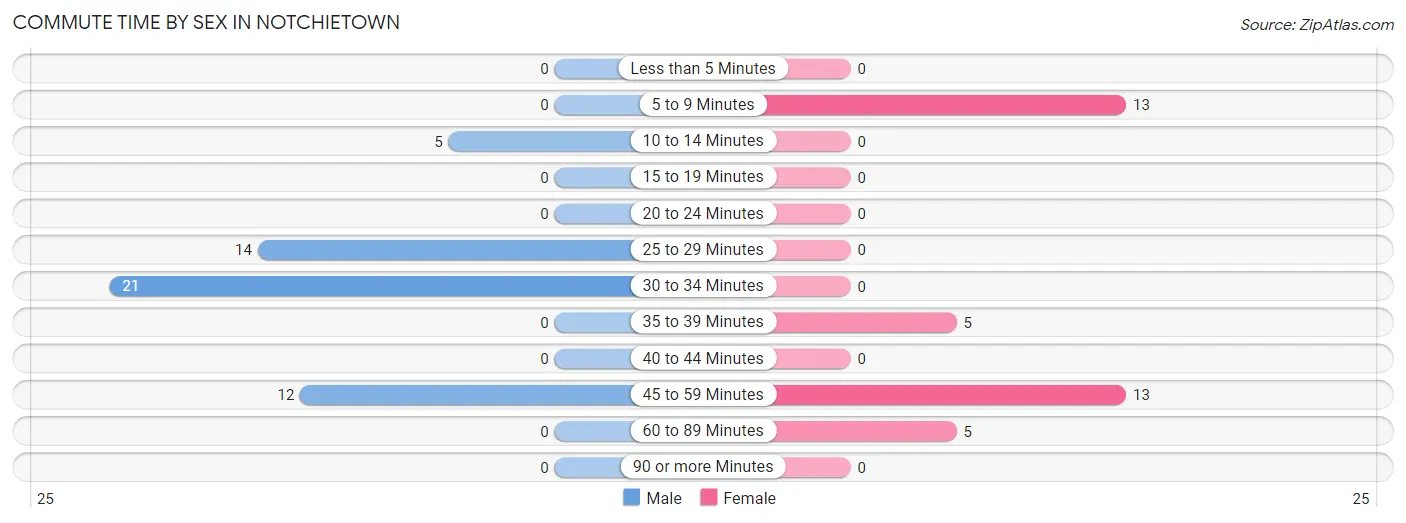
| Commute Time | Male | Female |
| Less than 5 Minutes | 0 (0.0%) | 0 (0.0%) |
| 5 to 9 Minutes | 0 (0.0%) | 13 (36.1%) |
| 10 to 14 Minutes | 5 (9.6%) | 0 (0.0%) |
| 15 to 19 Minutes | 0 (0.0%) | 0 (0.0%) |
| 20 to 24 Minutes | 0 (0.0%) | 0 (0.0%) |
| 25 to 29 Minutes | 14 (26.9%) | 0 (0.0%) |
| 30 to 34 Minutes | 21 (40.4%) | 0 (0.0%) |
| 35 to 39 Minutes | 0 (0.0%) | 5 (13.9%) |
| 40 to 44 Minutes | 0 (0.0%) | 0 (0.0%) |
| 45 to 59 Minutes | 12 (23.1%) | 13 (36.1%) |
| 60 to 89 Minutes | 0 (0.0%) | 5 (13.9%) |
| 90 or more Minutes | 0 (0.0%) | 0 (0.0%) |
Time of Departure to Work by Sex in Notchietown
The most frequent times of departure to work in Notchietown are 10:00 AM to 10:59 AM (14, 26.9%) for males and 7:00 AM to 7:29 AM (31, 86.1%) for females.
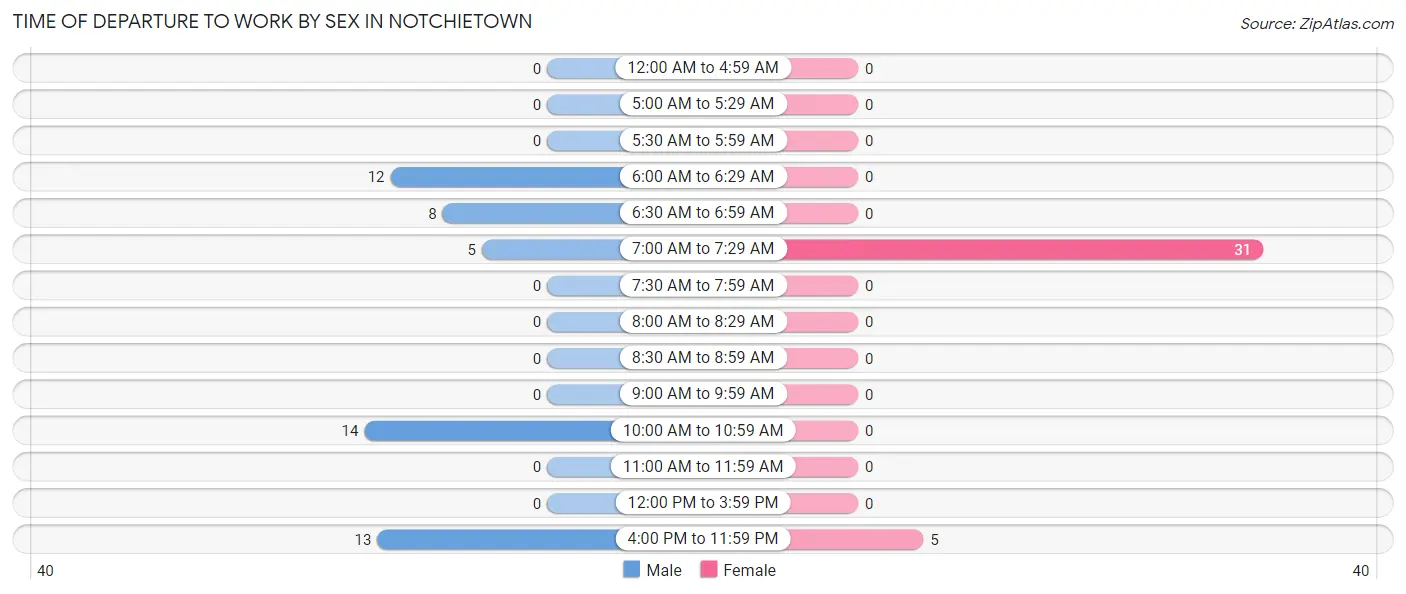
| Time of Departure | Male | Female |
| 12:00 AM to 4:59 AM | 0 (0.0%) | 0 (0.0%) |
| 5:00 AM to 5:29 AM | 0 (0.0%) | 0 (0.0%) |
| 5:30 AM to 5:59 AM | 0 (0.0%) | 0 (0.0%) |
| 6:00 AM to 6:29 AM | 12 (23.1%) | 0 (0.0%) |
| 6:30 AM to 6:59 AM | 8 (15.4%) | 0 (0.0%) |
| 7:00 AM to 7:29 AM | 5 (9.6%) | 31 (86.1%) |
| 7:30 AM to 7:59 AM | 0 (0.0%) | 0 (0.0%) |
| 8:00 AM to 8:29 AM | 0 (0.0%) | 0 (0.0%) |
| 8:30 AM to 8:59 AM | 0 (0.0%) | 0 (0.0%) |
| 9:00 AM to 9:59 AM | 0 (0.0%) | 0 (0.0%) |
| 10:00 AM to 10:59 AM | 14 (26.9%) | 0 (0.0%) |
| 11:00 AM to 11:59 AM | 0 (0.0%) | 0 (0.0%) |
| 12:00 PM to 3:59 PM | 0 (0.0%) | 0 (0.0%) |
| 4:00 PM to 11:59 PM | 13 (25.0%) | 5 (13.9%) |
| Total | 52 (100.0%) | 36 (100.0%) |
Housing Occupancy in Notchietown
Occupancy by Ownership in Notchietown
Of the total 115 dwellings in Notchietown, owner-occupied units account for 65 (56.5%), while renter-occupied units make up 50 (43.5%).
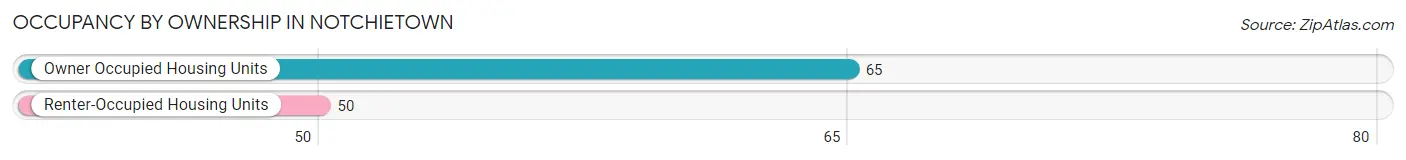
| Occupancy | # Housing Units | % Housing Units |
| Owner Occupied Housing Units | 65 | 56.5% |
| Renter-Occupied Housing Units | 50 | 43.5% |
| Total Occupied Housing Units | 115 | 100.0% |
Occupancy by Household Size in Notchietown
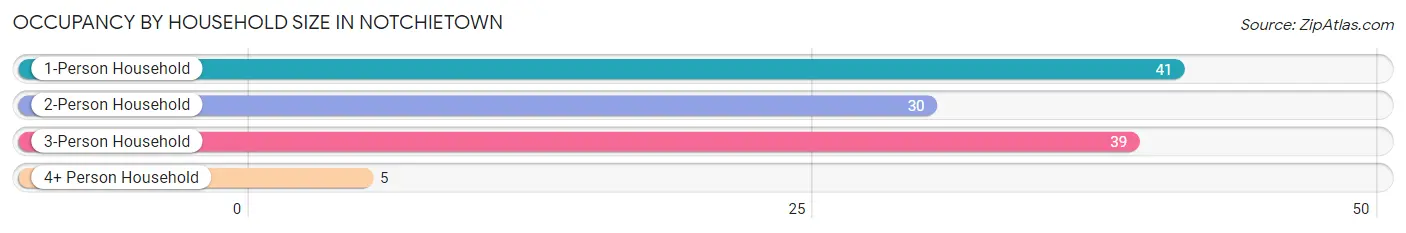
| Household Size | # Housing Units | % Housing Units |
| 1-Person Household | 41 | 35.6% |
| 2-Person Household | 30 | 26.1% |
| 3-Person Household | 39 | 33.9% |
| 4+ Person Household | 5 | 4.3% |
| Total Housing Units | 115 | 100.0% |
Occupancy by Ownership by Household Size in Notchietown
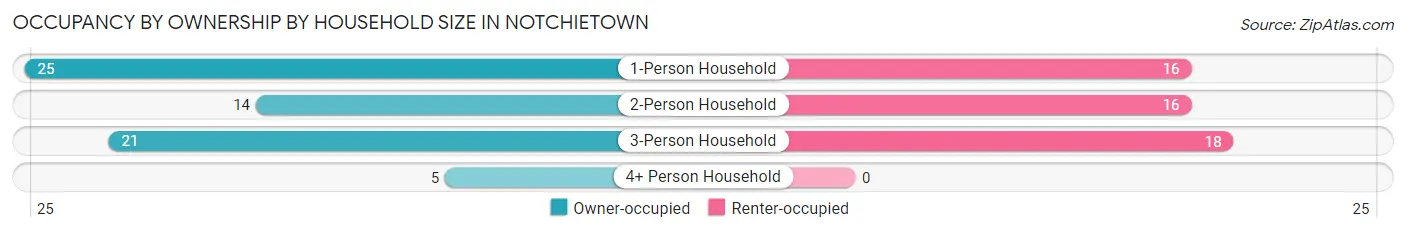
| Household Size | Owner-occupied | Renter-occupied |
| 1-Person Household | 25 (61.0%) | 16 (39.0%) |
| 2-Person Household | 14 (46.7%) | 16 (53.3%) |
| 3-Person Household | 21 (53.8%) | 18 (46.2%) |
| 4+ Person Household | 5 (100.0%) | 0 (0.0%) |
| Total Housing Units | 65 (56.5%) | 50 (43.5%) |
Occupancy by Educational Attainment in Notchietown
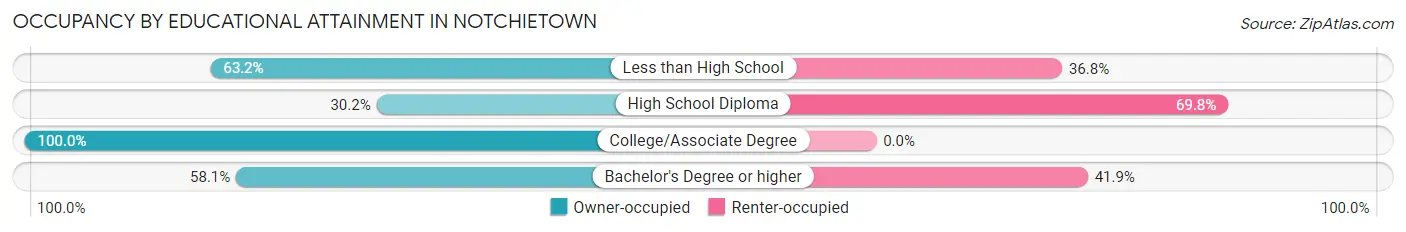
| Household Size | Owner-occupied | Renter-occupied |
| Less than High School | 12 (63.2%) | 7 (36.8%) |
| High School Diploma | 13 (30.2%) | 30 (69.8%) |
| College/Associate Degree | 22 (100.0%) | 0 (0.0%) |
| Bachelor's Degree or higher | 18 (58.1%) | 13 (41.9%) |
Occupancy by Age of Householder in Notchietown
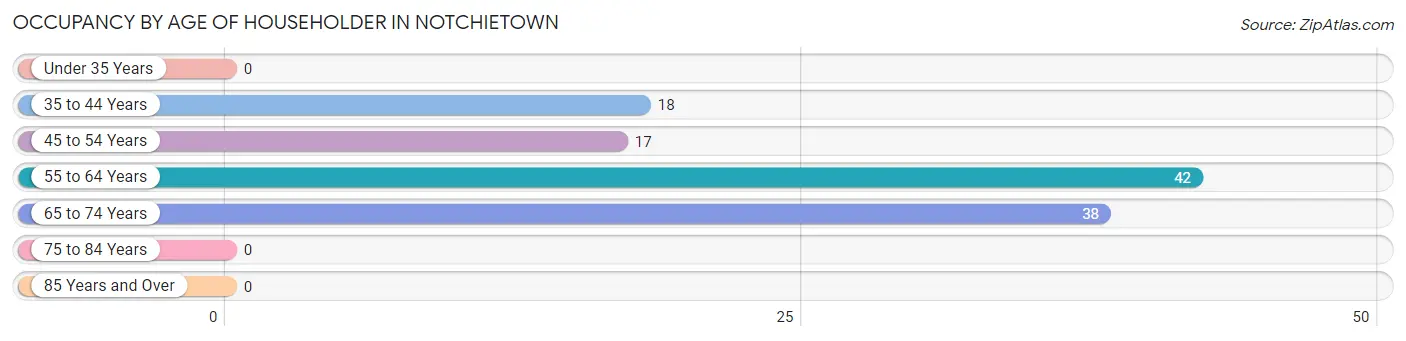
| Age Bracket | # Households | % Households |
| Under 35 Years | 0 | 0.0% |
| 35 to 44 Years | 18 | 15.7% |
| 45 to 54 Years | 17 | 14.8% |
| 55 to 64 Years | 42 | 36.5% |
| 65 to 74 Years | 38 | 33.0% |
| 75 to 84 Years | 0 | 0.0% |
| 85 Years and Over | 0 | 0.0% |
| Total | 115 | 100.0% |
Housing Finances in Notchietown
Median Income by Occupancy in Notchietown
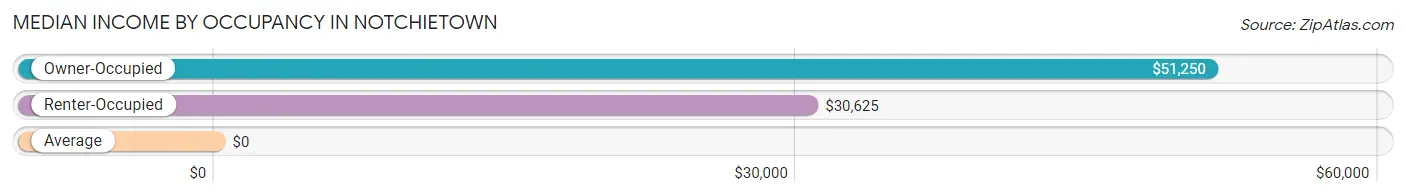
| Occupancy Type | # Households | Median Income |
| Owner-Occupied | 65 (56.5%) | $51,250 |
| Renter-Occupied | 50 (43.5%) | $30,625 |
| Average | 115 (100.0%) | $0 |
Occupancy by Householder Income Bracket in Notchietown
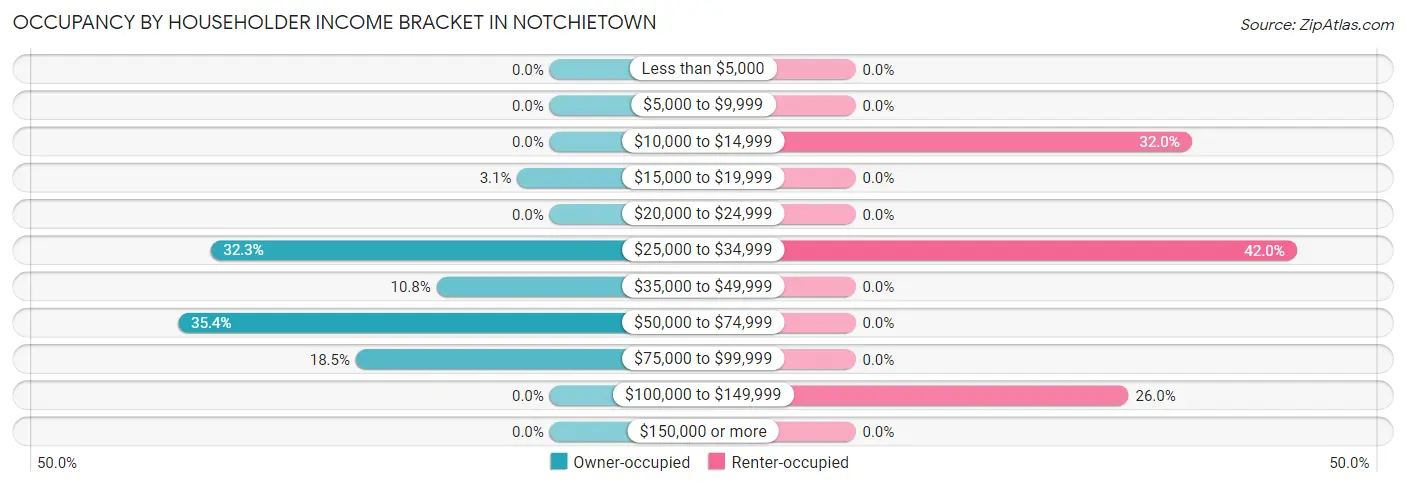
| Income Bracket | Owner-occupied | Renter-occupied |
| Less than $5,000 | 0 (0.0%) | 0 (0.0%) |
| $5,000 to $9,999 | 0 (0.0%) | 0 (0.0%) |
| $10,000 to $14,999 | 0 (0.0%) | 16 (32.0%) |
| $15,000 to $19,999 | 2 (3.1%) | 0 (0.0%) |
| $20,000 to $24,999 | 0 (0.0%) | 0 (0.0%) |
| $25,000 to $34,999 | 21 (32.3%) | 21 (42.0%) |
| $35,000 to $49,999 | 7 (10.8%) | 0 (0.0%) |
| $50,000 to $74,999 | 23 (35.4%) | 0 (0.0%) |
| $75,000 to $99,999 | 12 (18.5%) | 0 (0.0%) |
| $100,000 to $149,999 | 0 (0.0%) | 13 (26.0%) |
| $150,000 or more | 0 (0.0%) | 0 (0.0%) |
| Total | 65 (100.0%) | 50 (100.0%) |
Monthly Housing Cost Tiers in Notchietown
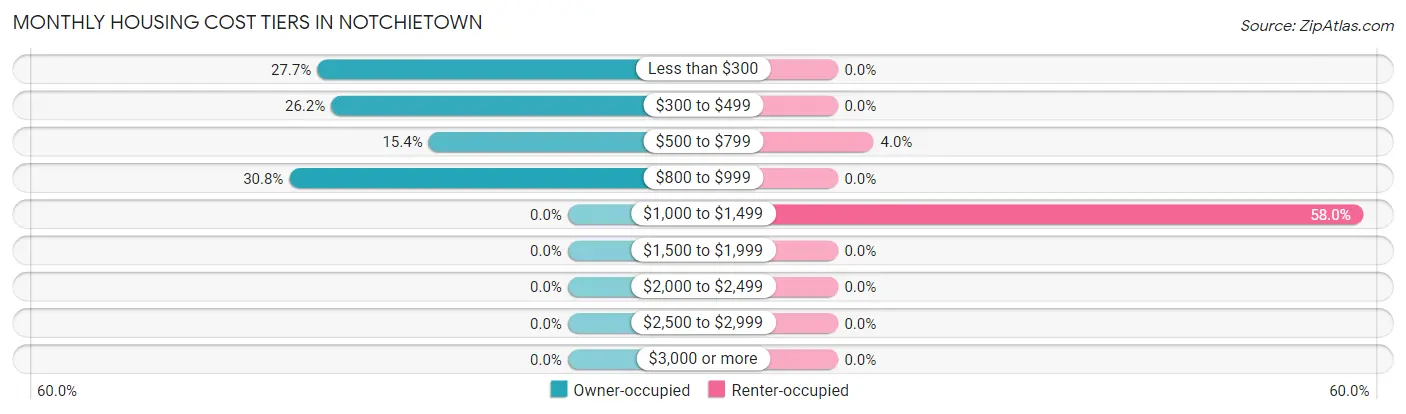
| Monthly Cost | Owner-occupied | Renter-occupied |
| Less than $300 | 18 (27.7%) | 0 (0.0%) |
| $300 to $499 | 17 (26.2%) | 0 (0.0%) |
| $500 to $799 | 10 (15.4%) | 2 (4.0%) |
| $800 to $999 | 20 (30.8%) | 0 (0.0%) |
| $1,000 to $1,499 | 0 (0.0%) | 29 (58.0%) |
| $1,500 to $1,999 | 0 (0.0%) | 0 (0.0%) |
| $2,000 to $2,499 | 0 (0.0%) | 0 (0.0%) |
| $2,500 to $2,999 | 0 (0.0%) | 0 (0.0%) |
| $3,000 or more | 0 (0.0%) | 0 (0.0%) |
| Total | 65 (100.0%) | 50 (100.0%) |
Physical Housing Characteristics in Notchietown
Housing Structures in Notchietown
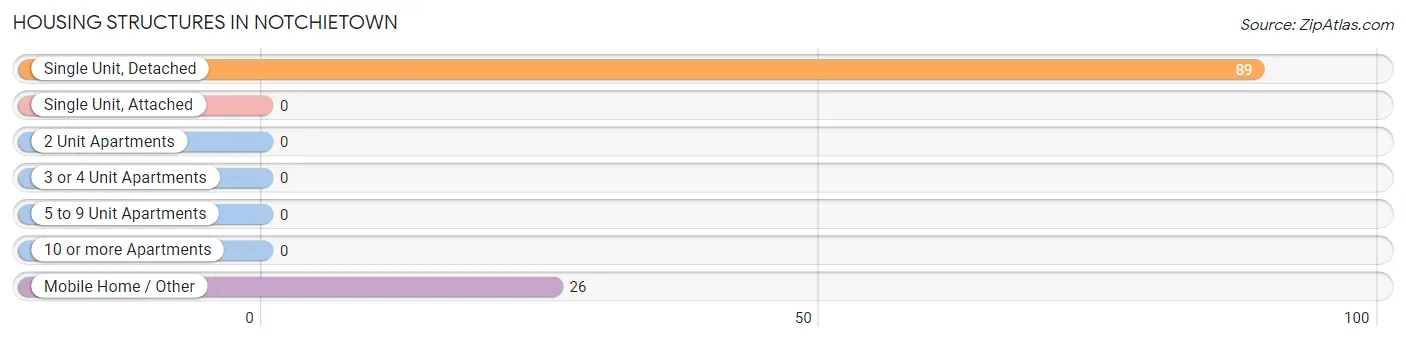
| Structure Type | # Housing Units | % Housing Units |
| Single Unit, Detached | 89 | 77.4% |
| Single Unit, Attached | 0 | 0.0% |
| 2 Unit Apartments | 0 | 0.0% |
| 3 or 4 Unit Apartments | 0 | 0.0% |
| 5 to 9 Unit Apartments | 0 | 0.0% |
| 10 or more Apartments | 0 | 0.0% |
| Mobile Home / Other | 26 | 22.6% |
| Total | 115 | 100.0% |
Housing Structures by Occupancy in Notchietown
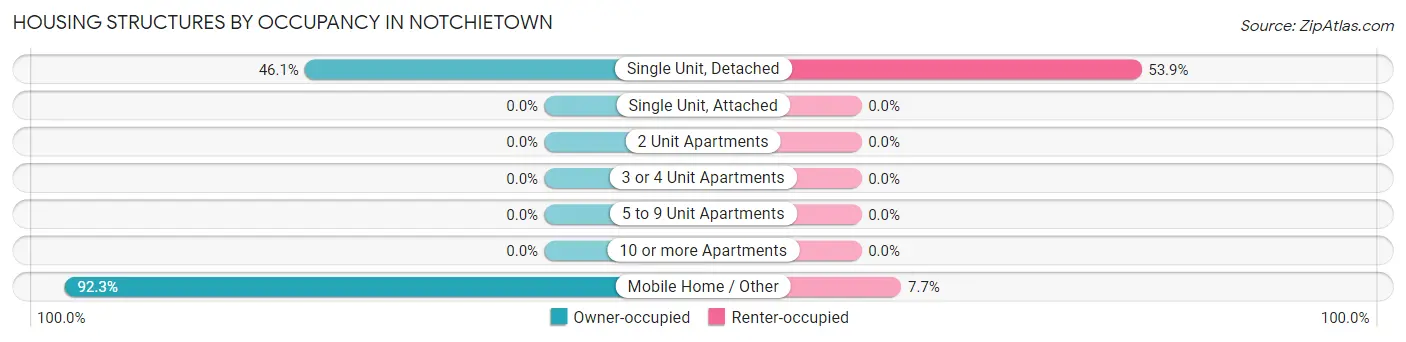
| Structure Type | Owner-occupied | Renter-occupied |
| Single Unit, Detached | 41 (46.1%) | 48 (53.9%) |
| Single Unit, Attached | 0 (0.0%) | 0 (0.0%) |
| 2 Unit Apartments | 0 (0.0%) | 0 (0.0%) |
| 3 or 4 Unit Apartments | 0 (0.0%) | 0 (0.0%) |
| 5 to 9 Unit Apartments | 0 (0.0%) | 0 (0.0%) |
| 10 or more Apartments | 0 (0.0%) | 0 (0.0%) |
| Mobile Home / Other | 24 (92.3%) | 2 (7.7%) |
| Total | 65 (56.5%) | 50 (43.5%) |
Housing Structures by Number of Rooms in Notchietown
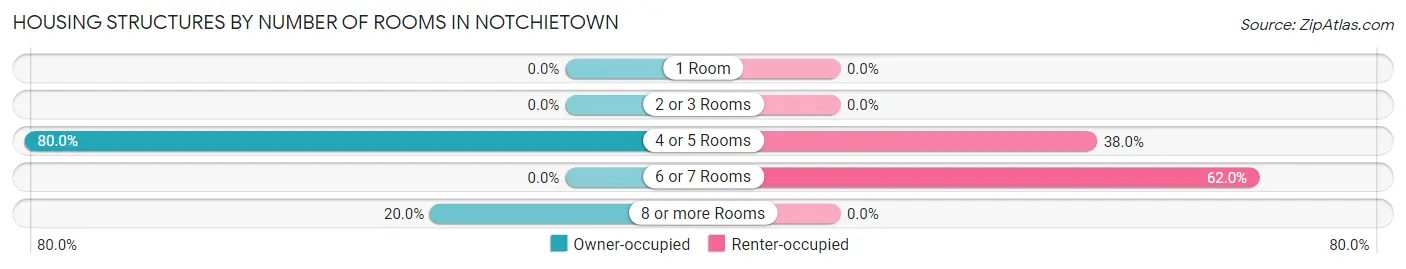
| Number of Rooms | Owner-occupied | Renter-occupied |
| 1 Room | 0 (0.0%) | 0 (0.0%) |
| 2 or 3 Rooms | 0 (0.0%) | 0 (0.0%) |
| 4 or 5 Rooms | 52 (80.0%) | 19 (38.0%) |
| 6 or 7 Rooms | 0 (0.0%) | 31 (62.0%) |
| 8 or more Rooms | 13 (20.0%) | 0 (0.0%) |
| Total | 65 (100.0%) | 50 (100.0%) |
Housing Structure by Heating Type in Notchietown
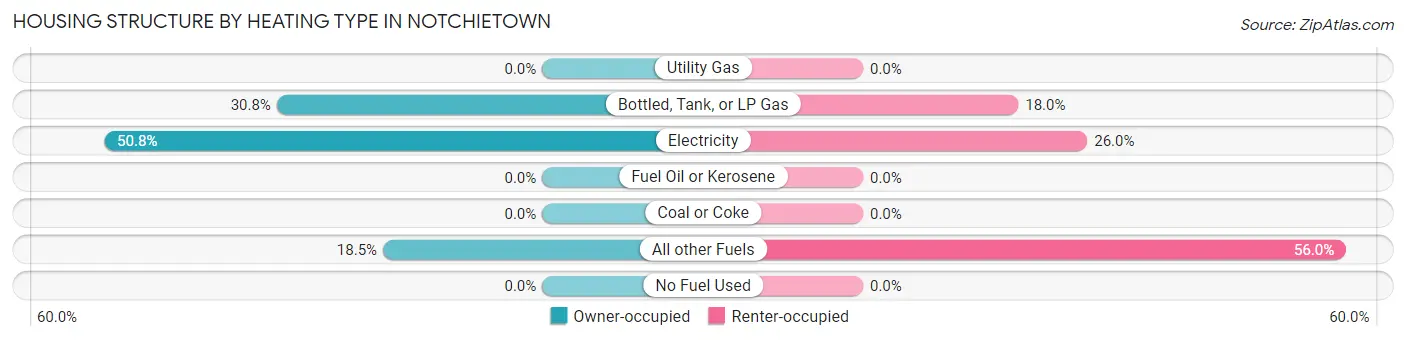
| Heating Type | Owner-occupied | Renter-occupied |
| Utility Gas | 0 (0.0%) | 0 (0.0%) |
| Bottled, Tank, or LP Gas | 20 (30.8%) | 9 (18.0%) |
| Electricity | 33 (50.8%) | 13 (26.0%) |
| Fuel Oil or Kerosene | 0 (0.0%) | 0 (0.0%) |
| Coal or Coke | 0 (0.0%) | 0 (0.0%) |
| All other Fuels | 12 (18.5%) | 28 (56.0%) |
| No Fuel Used | 0 (0.0%) | 0 (0.0%) |
| Total | 65 (100.0%) | 50 (100.0%) |
Household Vehicle Usage in Notchietown
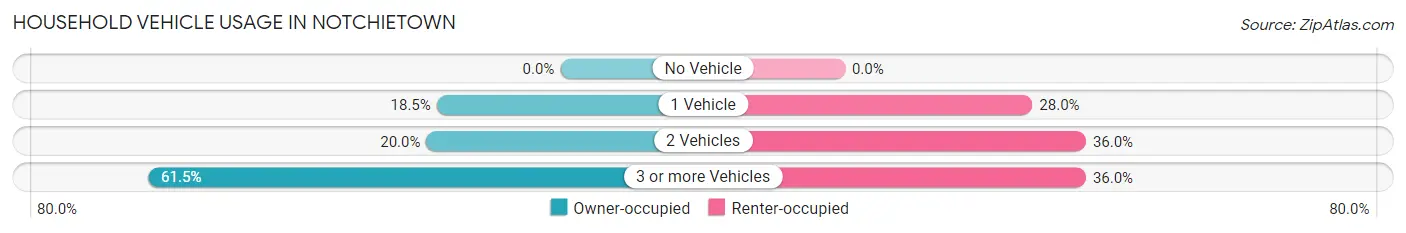
| Vehicles per Household | Owner-occupied | Renter-occupied |
| No Vehicle | 0 (0.0%) | 0 (0.0%) |
| 1 Vehicle | 12 (18.5%) | 14 (28.0%) |
| 2 Vehicles | 13 (20.0%) | 18 (36.0%) |
| 3 or more Vehicles | 40 (61.5%) | 18 (36.0%) |
| Total | 65 (100.0%) | 50 (100.0%) |
Real Estate & Mortgages in Notchietown
Real Estate and Mortgage Overview in Notchietown
| Characteristic | Without Mortgage | With Mortgage |
| Housing Units | 43 | 22 |
| Median Property Value | - | - |
| Median Household Income | $69,135 | $0 |
| Monthly Housing Costs | $365 | $0 |
| Real Estate Taxes | - | - |
Property Value by Mortgage Status in Notchietown
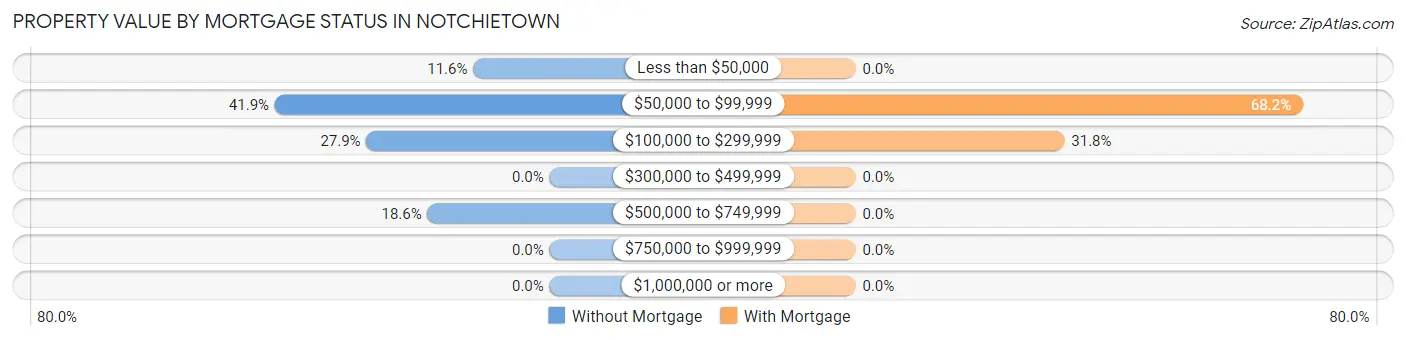
| Property Value | Without Mortgage | With Mortgage |
| Less than $50,000 | 5 (11.6%) | 0 (0.0%) |
| $50,000 to $99,999 | 18 (41.9%) | 15 (68.2%) |
| $100,000 to $299,999 | 12 (27.9%) | 7 (31.8%) |
| $300,000 to $499,999 | 0 (0.0%) | 0 (0.0%) |
| $500,000 to $749,999 | 8 (18.6%) | 0 (0.0%) |
| $750,000 to $999,999 | 0 (0.0%) | 0 (0.0%) |
| $1,000,000 or more | 0 (0.0%) | 0 (0.0%) |
| Total | 43 (100.0%) | 22 (100.0%) |
Household Income by Mortgage Status in Notchietown
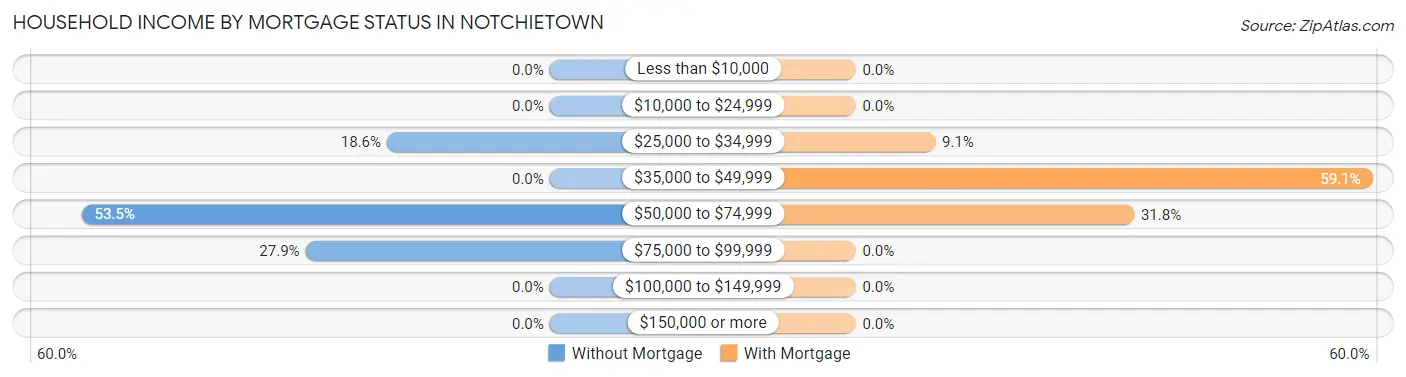
| Household Income | Without Mortgage | With Mortgage |
| Less than $10,000 | 0 (0.0%) | 0 (0.0%) |
| $10,000 to $24,999 | 0 (0.0%) | 0 (0.0%) |
| $25,000 to $34,999 | 8 (18.6%) | 2 (9.1%) |
| $35,000 to $49,999 | 0 (0.0%) | 13 (59.1%) |
| $50,000 to $74,999 | 23 (53.5%) | 7 (31.8%) |
| $75,000 to $99,999 | 12 (27.9%) | 0 (0.0%) |
| $100,000 to $149,999 | 0 (0.0%) | 0 (0.0%) |
| $150,000 or more | 0 (0.0%) | 0 (0.0%) |
| Total | 43 (100.0%) | 22 (100.0%) |
Property Value to Household Income Ratio in Notchietown
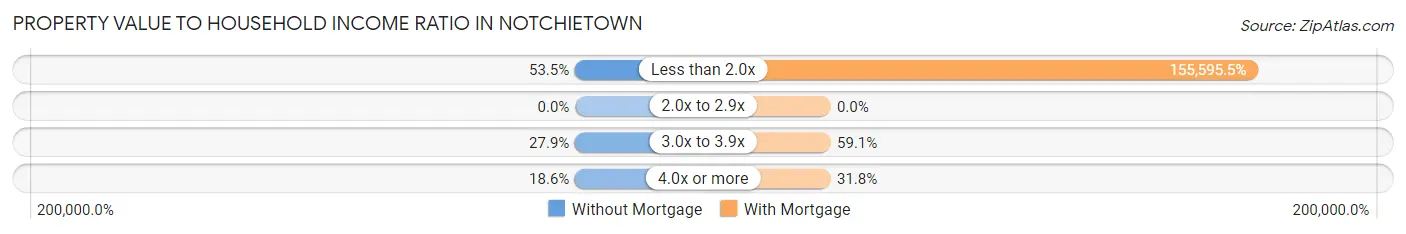
| Value-to-Income Ratio | Without Mortgage | With Mortgage |
| Less than 2.0x | 23 (53.5%) | 34,231 (155,595.5%) |
| 2.0x to 2.9x | 0 (0.0%) | 0 (0.0%) |
| 3.0x to 3.9x | 12 (27.9%) | 13 (59.1%) |
| 4.0x or more | 8 (18.6%) | 7 (31.8%) |
| Total | 43 (100.0%) | 22 (100.0%) |
Real Estate Taxes by Mortgage Status in Notchietown
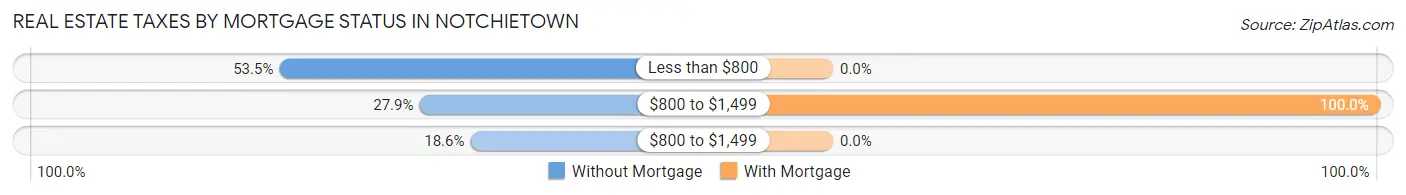
| Property Taxes | Without Mortgage | With Mortgage |
| Less than $800 | 23 (53.5%) | 0 (0.0%) |
| $800 to $1,499 | 12 (27.9%) | 22 (100.0%) |
| $800 to $1,499 | 8 (18.6%) | 0 (0.0%) |
| Total | 43 (100.0%) | 22 (100.0%) |
Health & Disability in Notchietown
Health Insurance Coverage by Age in Notchietown
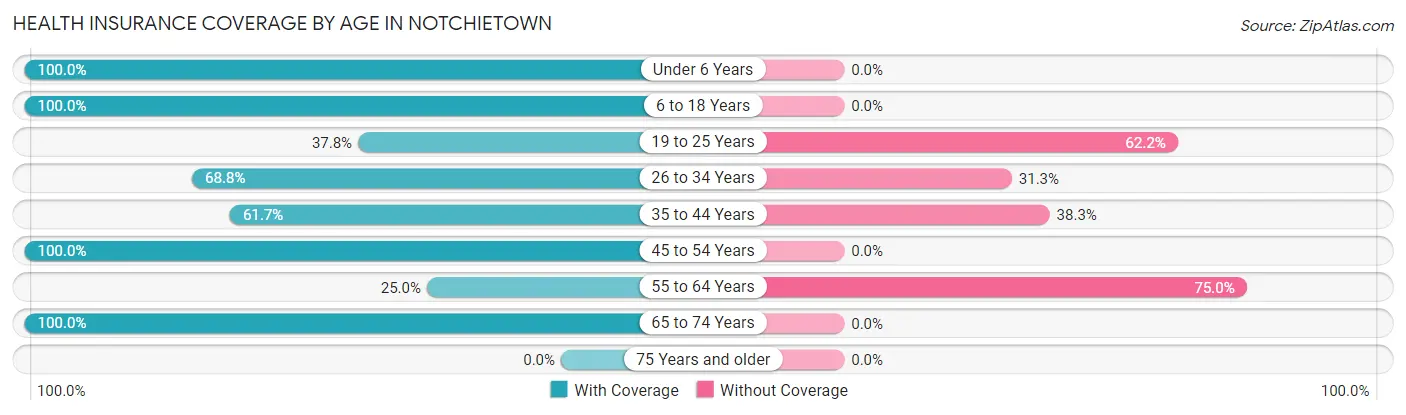
| Age Bracket | With Coverage | Without Coverage |
| Under 6 Years | 40 (100.0%) | 0 (0.0%) |
| 6 to 18 Years | 17 (100.0%) | 0 (0.0%) |
| 19 to 25 Years | 14 (37.8%) | 23 (62.2%) |
| 26 to 34 Years | 11 (68.8%) | 5 (31.2%) |
| 35 to 44 Years | 29 (61.7%) | 18 (38.3%) |
| 45 to 54 Years | 17 (100.0%) | 0 (0.0%) |
| 55 to 64 Years | 17 (25.0%) | 51 (75.0%) |
| 65 to 74 Years | 56 (100.0%) | 0 (0.0%) |
| 75 Years and older | 0 (0.0%) | 0 (0.0%) |
| Total | 201 (67.4%) | 97 (32.6%) |
Health Insurance Coverage by Citizenship Status in Notchietown
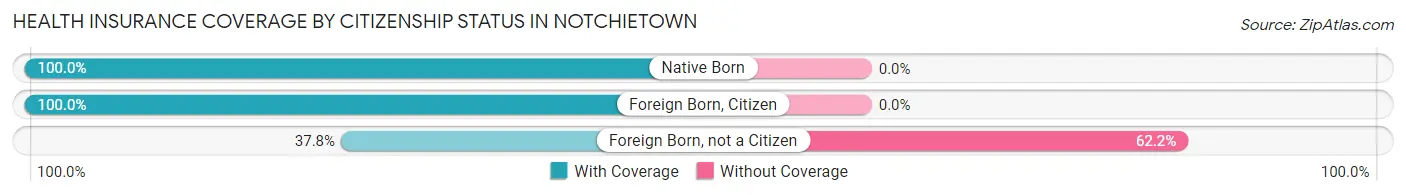
| Citizenship Status | With Coverage | Without Coverage |
| Native Born | 40 (100.0%) | 0 (0.0%) |
| Foreign Born, Citizen | 17 (100.0%) | 0 (0.0%) |
| Foreign Born, not a Citizen | 14 (37.8%) | 23 (62.2%) |
Health Insurance Coverage by Household Income in Notchietown
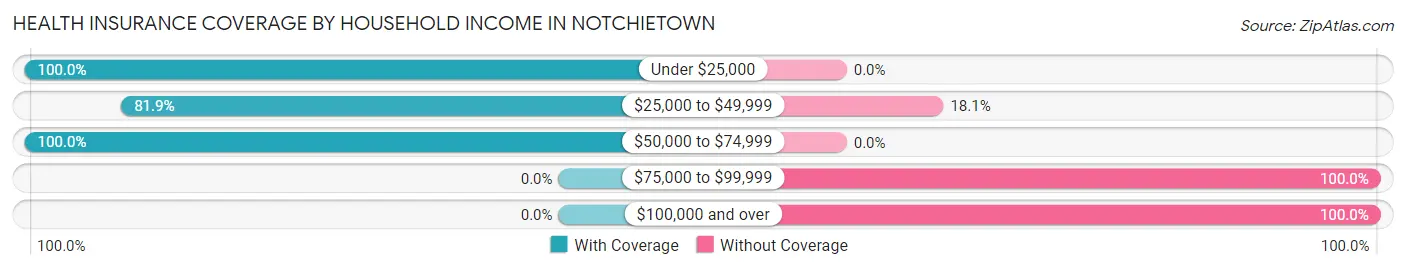
| Household Income | With Coverage | Without Coverage |
| Under $25,000 | 32 (100.0%) | 0 (0.0%) |
| $25,000 to $49,999 | 104 (81.9%) | 23 (18.1%) |
| $50,000 to $74,999 | 65 (100.0%) | 0 (0.0%) |
| $75,000 to $99,999 | 0 (0.0%) | 25 (100.0%) |
| $100,000 and over | 0 (0.0%) | 49 (100.0%) |
Public vs Private Health Insurance Coverage by Age in Notchietown
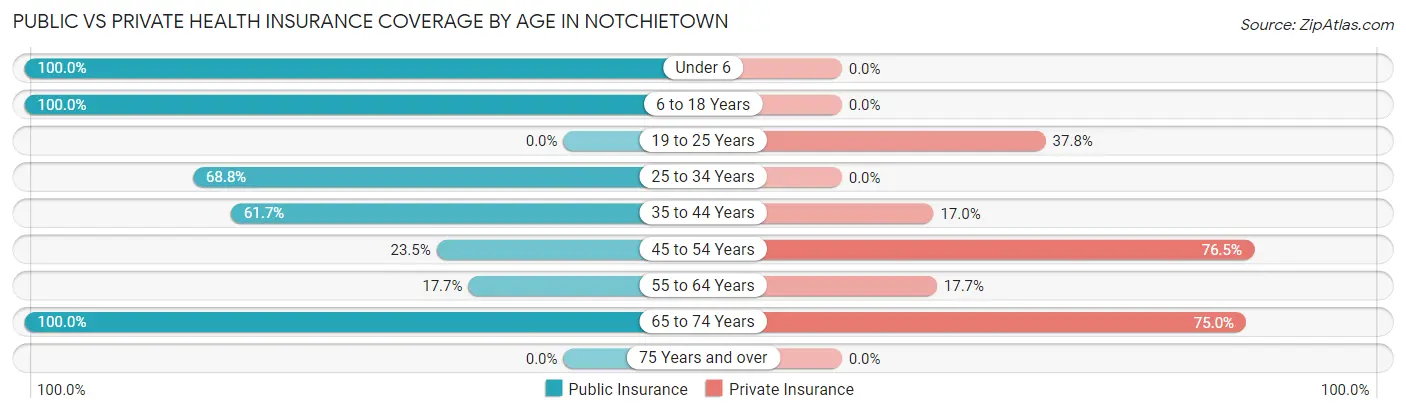
| Age Bracket | Public Insurance | Private Insurance |
| Under 6 | 40 (100.0%) | 0 (0.0%) |
| 6 to 18 Years | 17 (100.0%) | 0 (0.0%) |
| 19 to 25 Years | 0 (0.0%) | 14 (37.8%) |
| 25 to 34 Years | 11 (68.8%) | 0 (0.0%) |
| 35 to 44 Years | 29 (61.7%) | 8 (17.0%) |
| 45 to 54 Years | 4 (23.5%) | 13 (76.5%) |
| 55 to 64 Years | 12 (17.6%) | 12 (17.6%) |
| 65 to 74 Years | 56 (100.0%) | 42 (75.0%) |
| 75 Years and over | 0 (0.0%) | 0 (0.0%) |
| Total | 169 (56.7%) | 89 (29.9%) |
Disability Status by Sex by Age in Notchietown
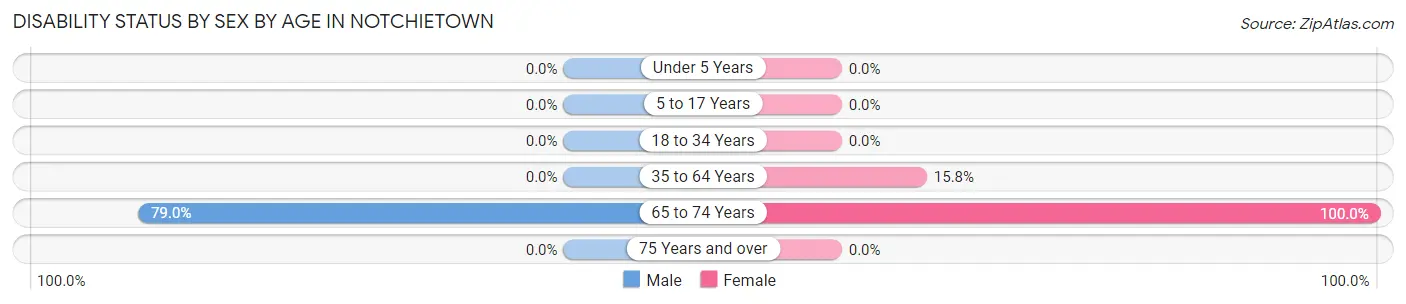
| Age Bracket | Male | Female |
| Under 5 Years | 0 (0.0%) | 0 (0.0%) |
| 5 to 17 Years | 0 (0.0%) | 0 (0.0%) |
| 18 to 34 Years | 0 (0.0%) | 0 (0.0%) |
| 35 to 64 Years | 0 (0.0%) | 12 (15.8%) |
| 65 to 74 Years | 30 (78.9%) | 18 (100.0%) |
| 75 Years and over | 0 (0.0%) | 0 (0.0%) |
Disability Class by Sex by Age in Notchietown
Disability Class: Hearing Difficulty
| Age Bracket | Male | Female |
| Under 5 Years | 0 (0.0%) | 0 (0.0%) |
| 5 to 17 Years | 0 (0.0%) | 0 (0.0%) |
| 18 to 34 Years | 0 (0.0%) | 0 (0.0%) |
| 35 to 64 Years | 0 (0.0%) | 0 (0.0%) |
| 65 to 74 Years | 0 (0.0%) | 0 (0.0%) |
| 75 Years and over | 0 (0.0%) | 0 (0.0%) |
Disability Class: Vision Difficulty
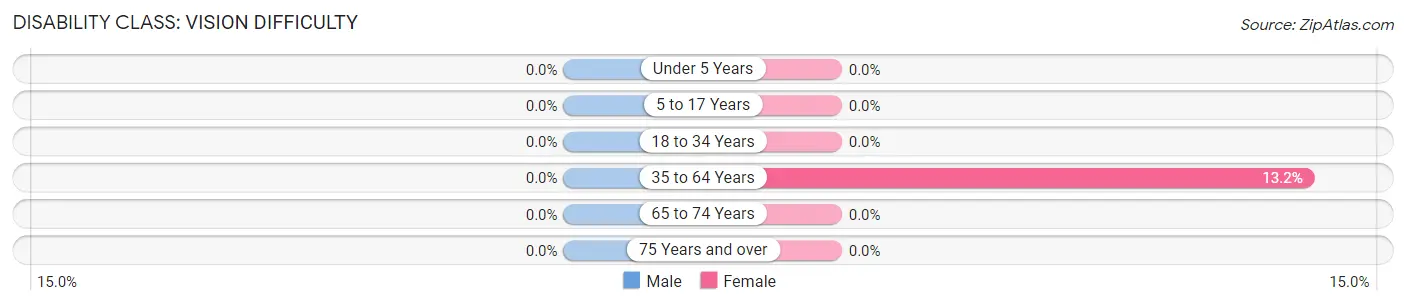
| Age Bracket | Male | Female |
| Under 5 Years | 0 (0.0%) | 0 (0.0%) |
| 5 to 17 Years | 0 (0.0%) | 0 (0.0%) |
| 18 to 34 Years | 0 (0.0%) | 0 (0.0%) |
| 35 to 64 Years | 0 (0.0%) | 10 (13.2%) |
| 65 to 74 Years | 0 (0.0%) | 0 (0.0%) |
| 75 Years and over | 0 (0.0%) | 0 (0.0%) |
Disability Class: Cognitive Difficulty
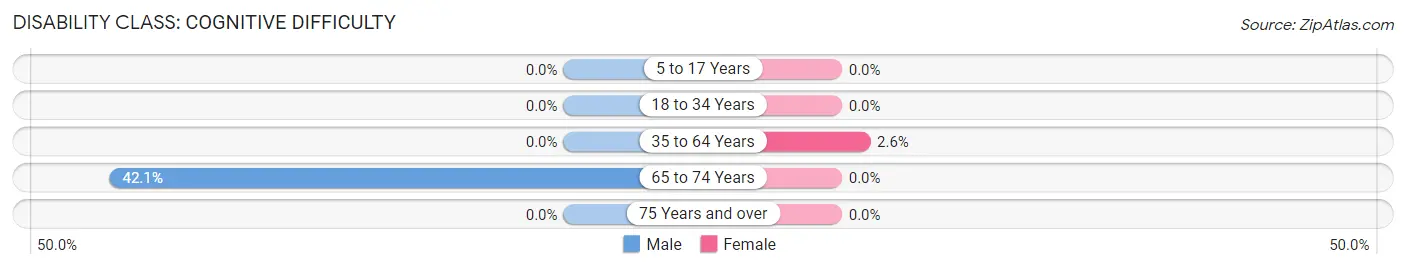
| Age Bracket | Male | Female |
| 5 to 17 Years | 0 (0.0%) | 0 (0.0%) |
| 18 to 34 Years | 0 (0.0%) | 0 (0.0%) |
| 35 to 64 Years | 0 (0.0%) | 2 (2.6%) |
| 65 to 74 Years | 16 (42.1%) | 0 (0.0%) |
| 75 Years and over | 0 (0.0%) | 0 (0.0%) |
Disability Class: Ambulatory Difficulty
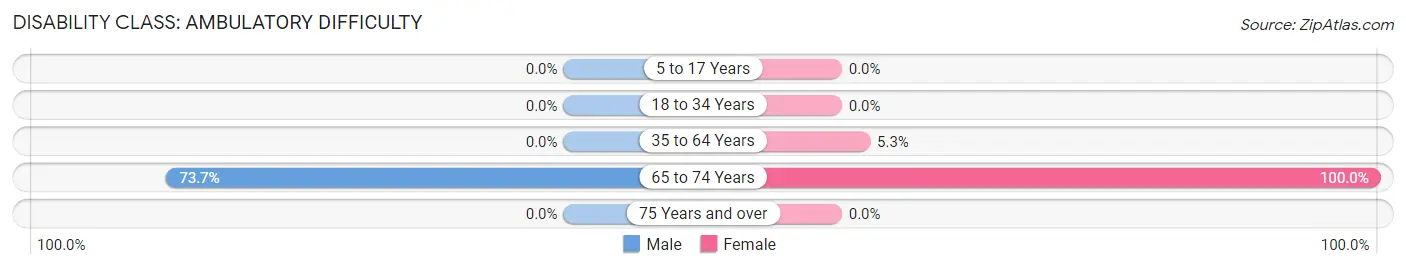
| Age Bracket | Male | Female |
| 5 to 17 Years | 0 (0.0%) | 0 (0.0%) |
| 18 to 34 Years | 0 (0.0%) | 0 (0.0%) |
| 35 to 64 Years | 0 (0.0%) | 4 (5.3%) |
| 65 to 74 Years | 28 (73.7%) | 18 (100.0%) |
| 75 Years and over | 0 (0.0%) | 0 (0.0%) |
Disability Class: Self-Care Difficulty
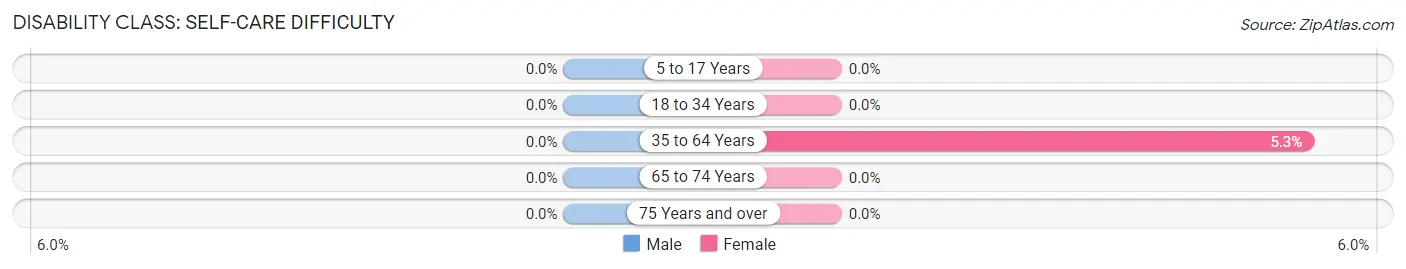
| Age Bracket | Male | Female |
| 5 to 17 Years | 0 (0.0%) | 0 (0.0%) |
| 18 to 34 Years | 0 (0.0%) | 0 (0.0%) |
| 35 to 64 Years | 0 (0.0%) | 4 (5.3%) |
| 65 to 74 Years | 0 (0.0%) | 0 (0.0%) |
| 75 Years and over | 0 (0.0%) | 0 (0.0%) |
Technology Access in Notchietown
Computing Device Access in Notchietown
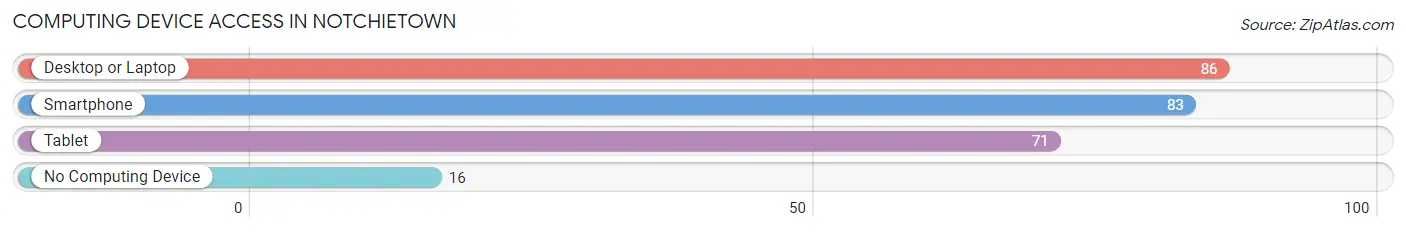
| Device Type | # Households | % Households |
| Desktop or Laptop | 86 | 74.8% |
| Smartphone | 83 | 72.2% |
| Tablet | 71 | 61.7% |
| No Computing Device | 16 | 13.9% |
| Total | 115 | 100.0% |
Internet Access in Notchietown
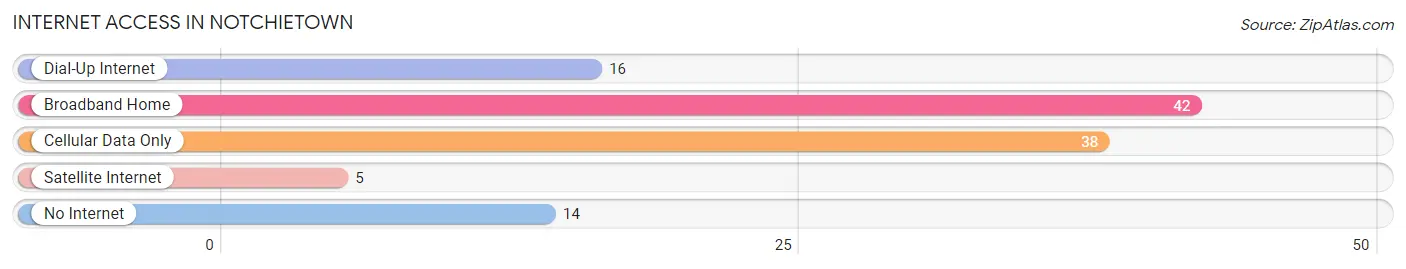
| Internet Type | # Households | % Households |
| Dial-Up Internet | 16 | 13.9% |
| Broadband Home | 42 | 36.5% |
| Cellular Data Only | 38 | 33.0% |
| Satellite Internet | 5 | 4.3% |
| No Internet | 14 | 12.2% |
| Total | 115 | 100.0% |
Notchietown Summary
Notchietown, Oklahoma is a small town located in the southeastern corner of the state. It is situated in the foothills of the Ozark Mountains and is surrounded by rolling hills and lush forests. The town is home to approximately 1,000 people and is the county seat of Adair County.
Notchietown was founded in 1891 by a group of settlers from the nearby town of Notchietown, Arkansas. The town was named after the Notchietown Creek, which runs through the area. The creek was named after a Native American chief who lived in the area.
The town was originally a farming community, but in the early 1900s, the discovery of oil and natural gas in the area led to an economic boom. The town quickly grew and became a center for oil and gas production. The town also became a hub for the timber industry, as the surrounding forests provided an abundance of lumber.
The economy of Notchietown is largely based on agriculture, oil and gas production, and timber. The town is home to several small businesses, including a grocery store, a hardware store, and a few restaurants. The town also has a small airport, which serves as a hub for private and commercial flights.
The population of Notchietown is predominantly white, with a small percentage of African Americans and Native Americans. The median household income is slightly below the state average, and the poverty rate is slightly higher than the state average.
Notchietown is served by the Adair County School District, which includes two elementary schools, one middle school, and one high school. The town also has a library, a post office, and a few churches.
Notchietown is a small, rural town with a rich history and a bright future. The town is home to a diverse population and a thriving economy. With its beautiful scenery and friendly people, Notchietown is a great place to live and work.
Common Questions
What is Per Capita Income in Notchietown?
Per Capita income in Notchietown is $21,239.
What is Inequality or Gini Index in Notchietown?
Inequality or Gini Index in Notchietown is 0.34.
What is the Total Population of Notchietown?
Total Population of Notchietown is 298.
What is the Total Male Population of Notchietown?
Total Male Population of Notchietown is 169.
What is the Total Female Population of Notchietown?
Total Female Population of Notchietown is 129.
What is the Ratio of Males per 100 Females in Notchietown?
There are 131.01 Males per 100 Females in Notchietown.
What is the Ratio of Females per 100 Males in Notchietown?
There are 76.33 Females per 100 Males in Notchietown.
What is the Median Population Age in Notchietown?
Median Population Age in Notchietown is 40.0 Years.
What is the Average Family Size in Notchietown
Average Family Size in Notchietown is 3.4 People.
What is the Average Household Size in Notchietown
Average Household Size in Notchietown is 2.6 People.
How Large is the Labor Force in Notchietown?
There are 124 People in the Labor Forcein in Notchietown.
What is the Percentage of People in the Labor Force in Notchietown?
51.5% of People are in the Labor Force in Notchietown.
What is the Unemployment Rate in Notchietown?
Unemployment Rate in Notchietown is 18.5%.