West Peavine, OK Map & Demographics
West Peavine Map
West Peavine Overview
$23,756
PER CAPITA INCOME
$49,609
AVG FAMILY INCOME
$48,203
AVG HOUSEHOLD INCOME
20.5%
WAGE / INCOME GAP [ % ]
79.5¢/ $1
WAGE / INCOME GAP [ $ ]
0.33
INEQUALITY / GINI INDEX
131
TOTAL POPULATION
65
MALE POPULATION
66
FEMALE POPULATION
98.48
MALES / 100 FEMALES
101.54
FEMALES / 100 MALES
48.8
MEDIAN AGE
1.9
AVG FAMILY SIZE
1.8
AVG HOUSEHOLD SIZE
71
LABOR FORCE [ PEOPLE ]
54.2%
PERCENT IN LABOR FORCE
Income in West Peavine
Income Overview in West Peavine
Per Capita Income in West Peavine is $23,756, while median incomes of families and households are $49,609 and $48,203 respectively.
| Characteristic | Number | Measure |
| Per Capita Income | 131 | $23,756 |
| Median Family Income | 57 | $49,609 |
| Mean Family Income | 57 | $61,535 |
| Median Household Income | 75 | $48,203 |
| Mean Household Income | 75 | $50,156 |
| Income Deficit | 57 | $0 |
| Wage / Income Gap (%) | 131 | 20.53% |
| Wage / Income Gap ($) | 131 | 79.47¢ per $1 |
| Gini / Inequality Index | 131 | 0.33 |
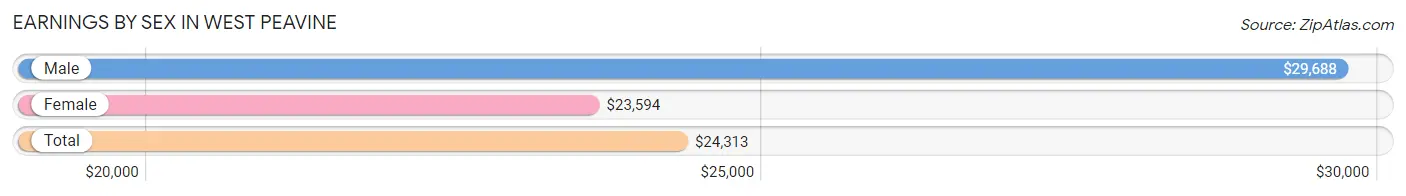
Earnings by Sex in West Peavine
Average Earnings in West Peavine are $24,313, $29,688 for men and $23,594 for women, a difference of 20.5%.
| Sex | Number | Average Earnings |
| Male | 39 (54.9%) | $29,688 |
| Female | 32 (45.1%) | $23,594 |
| Total | 71 (100.0%) | $24,313 |
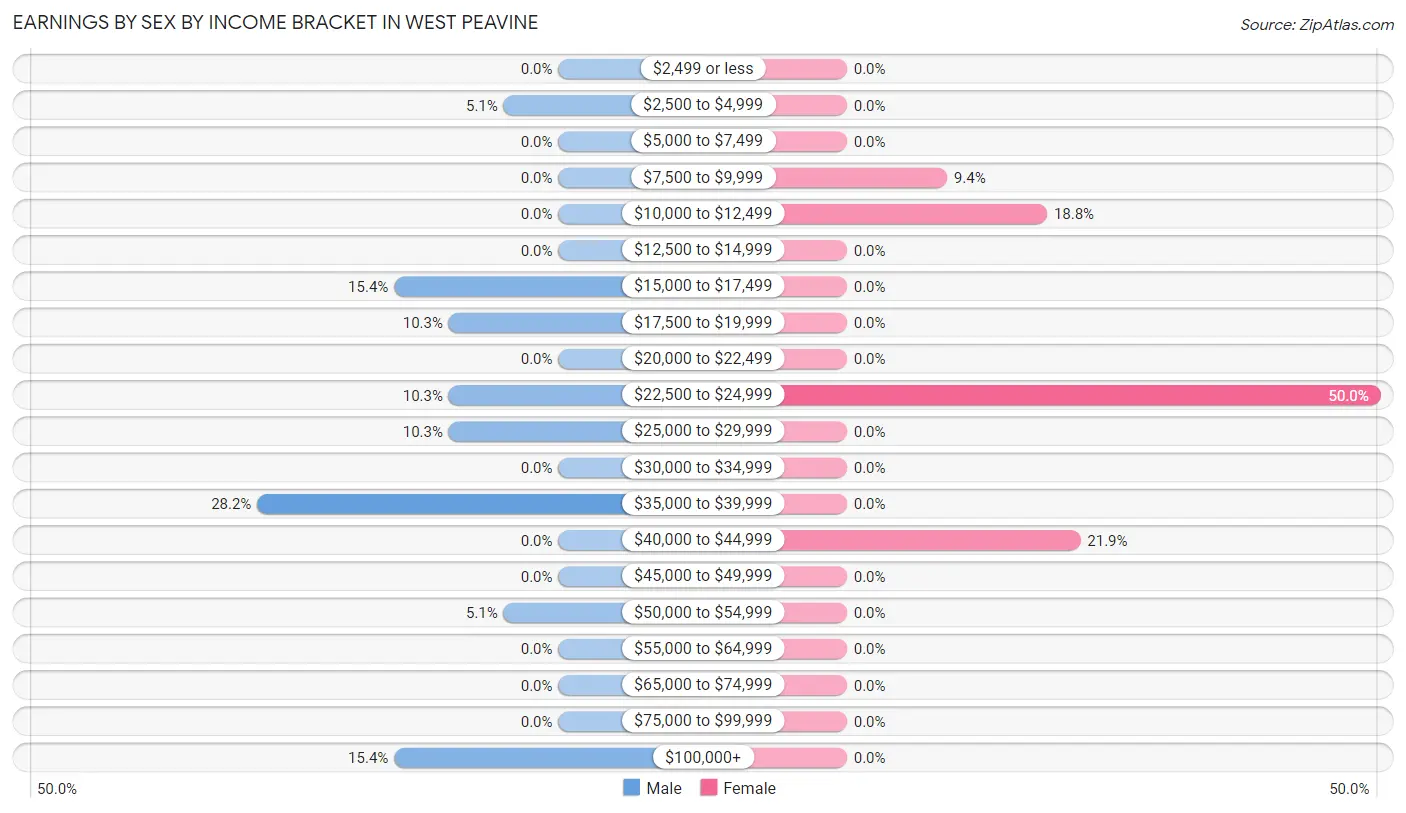
Earnings by Sex by Income Bracket in West Peavine
The most common earnings brackets in West Peavine are $35,000 to $39,999 for men (11 | 28.2%) and $22,500 to $24,999 for women (16 | 50.0%).
| Income | Male | Female |
| $2,499 or less | 0 (0.0%) | 0 (0.0%) |
| $2,500 to $4,999 | 2 (5.1%) | 0 (0.0%) |
| $5,000 to $7,499 | 0 (0.0%) | 0 (0.0%) |
| $7,500 to $9,999 | 0 (0.0%) | 3 (9.4%) |
| $10,000 to $12,499 | 0 (0.0%) | 6 (18.8%) |
| $12,500 to $14,999 | 0 (0.0%) | 0 (0.0%) |
| $15,000 to $17,499 | 6 (15.4%) | 0 (0.0%) |
| $17,500 to $19,999 | 4 (10.3%) | 0 (0.0%) |
| $20,000 to $22,499 | 0 (0.0%) | 0 (0.0%) |
| $22,500 to $24,999 | 4 (10.3%) | 16 (50.0%) |
| $25,000 to $29,999 | 4 (10.3%) | 0 (0.0%) |
| $30,000 to $34,999 | 0 (0.0%) | 0 (0.0%) |
| $35,000 to $39,999 | 11 (28.2%) | 0 (0.0%) |
| $40,000 to $44,999 | 0 (0.0%) | 7 (21.9%) |
| $45,000 to $49,999 | 0 (0.0%) | 0 (0.0%) |
| $50,000 to $54,999 | 2 (5.1%) | 0 (0.0%) |
| $55,000 to $64,999 | 0 (0.0%) | 0 (0.0%) |
| $65,000 to $74,999 | 0 (0.0%) | 0 (0.0%) |
| $75,000 to $99,999 | 0 (0.0%) | 0 (0.0%) |
| $100,000+ | 6 (15.4%) | 0 (0.0%) |
| Total | 39 (100.0%) | 32 (100.0%) |
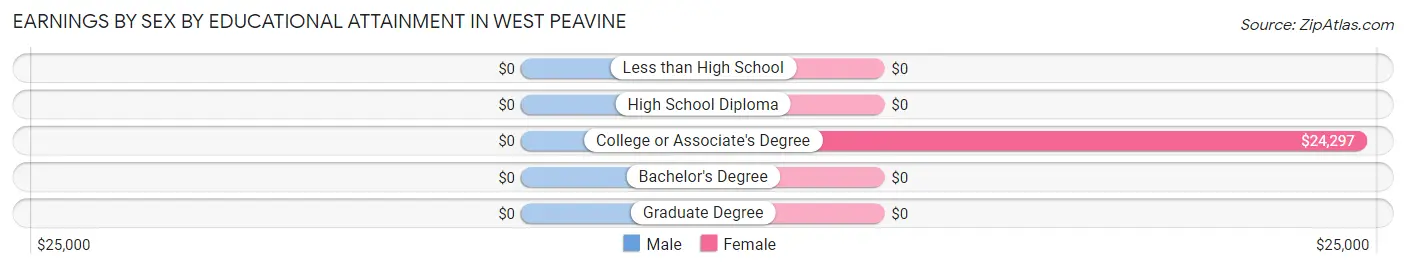
Earnings by Sex by Educational Attainment in West Peavine
| Educational Attainment | Male Income | Female Income |
| Less than High School | - | - |
| High School Diploma | - | - |
| College or Associate's Degree | - | - |
| Bachelor's Degree | - | - |
| Graduate Degree | - | - |
| Total | $35,625 | $24,063 |
Family Income in West Peavine
Family Income Brackets in West Peavine
According to the West Peavine family income data, there are 28 families falling into the $35,000 to $49,999 income range, which is the most common income bracket and makes up 49.1% of all families.
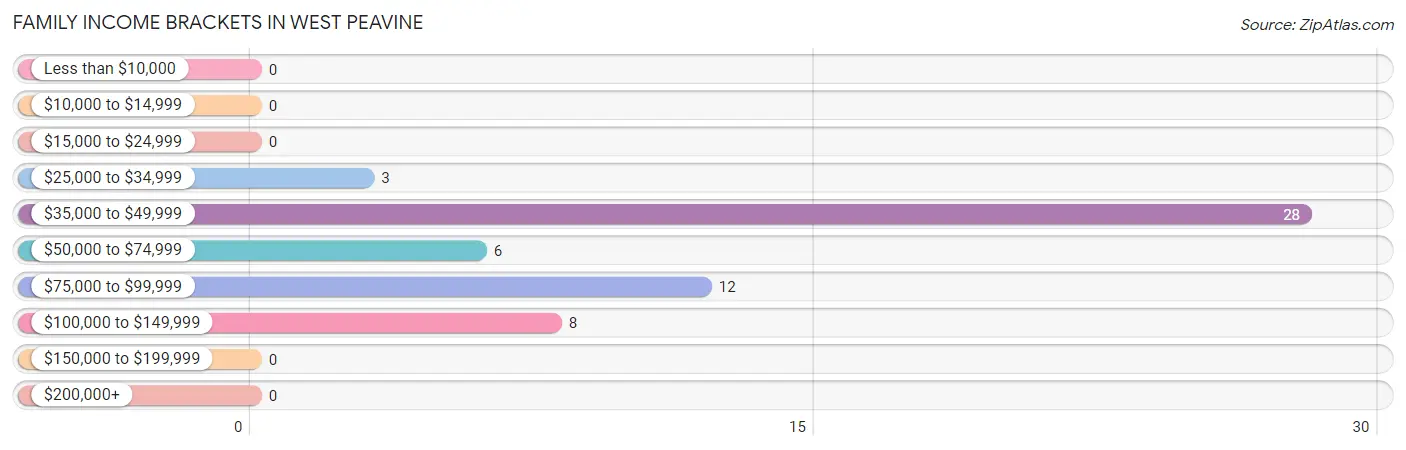
| Income Bracket | # Families | % Families |
| Less than $10,000 | 0 | 0.0% |
| $10,000 to $14,999 | 0 | 0.0% |
| $15,000 to $24,999 | 0 | 0.0% |
| $25,000 to $34,999 | 3 | 5.3% |
| $35,000 to $49,999 | 28 | 49.1% |
| $50,000 to $74,999 | 6 | 10.5% |
| $75,000 to $99,999 | 12 | 21.1% |
| $100,000 to $149,999 | 8 | 14.0% |
| $150,000 to $199,999 | 0 | 0.0% |
| $200,000+ | 0 | 0.0% |
Family Income by Famaliy Size in West Peavine
2-person families (53 | 93.0%) account for the highest median family income in West Peavine with $49,297 per family, while 2-person families (53 | 93.0%) have the highest median income of $24,648 per family member.
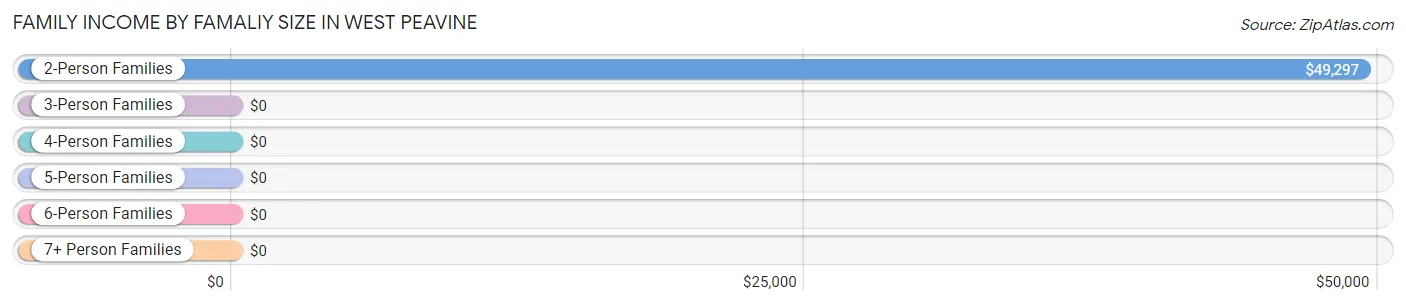
| Income Bracket | # Families | Median Income |
| 2-Person Families | 53 (93.0%) | $49,297 |
| 3-Person Families | 0 (0.0%) | $0 |
| 4-Person Families | 4 (7.0%) | $0 |
| 5-Person Families | 0 (0.0%) | $0 |
| 6-Person Families | 0 (0.0%) | $0 |
| 7+ Person Families | 0 (0.0%) | $0 |
| Total | 57 (100.0%) | $49,609 |
Family Income by Number of Earners in West Peavine
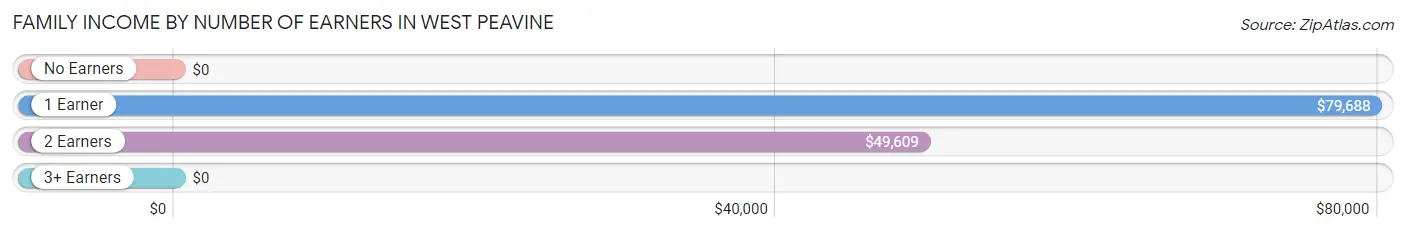
| Number of Earners | # Families | Median Income |
| No Earners | 7 (12.3%) | $0 |
| 1 Earner | 17 (29.8%) | $79,688 |
| 2 Earners | 33 (57.9%) | $49,609 |
| 3+ Earners | 0 (0.0%) | $0 |
| Total | 57 (100.0%) | $49,609 |
Household Income in West Peavine
Household Income Brackets in West Peavine
With 28 households falling in the category, the $35,000 to $49,999 income range is the most frequent in West Peavine, accounting for 37.3% of all households.
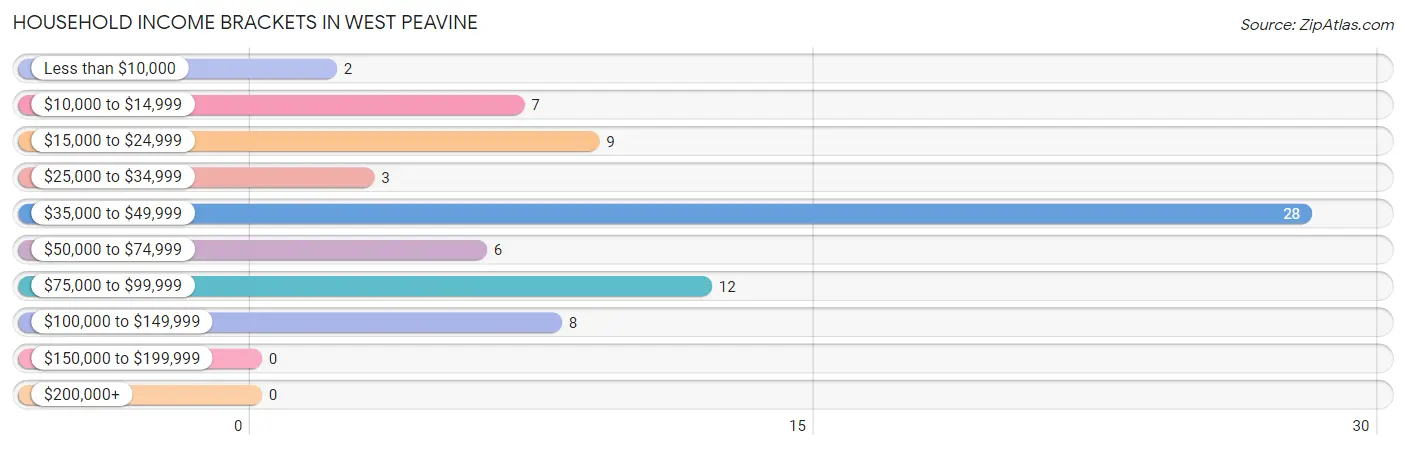
| Income Bracket | # Households | % Households |
| Less than $10,000 | 2 | 2.7% |
| $10,000 to $14,999 | 7 | 9.3% |
| $15,000 to $24,999 | 9 | 12.0% |
| $25,000 to $34,999 | 3 | 4.0% |
| $35,000 to $49,999 | 28 | 37.3% |
| $50,000 to $74,999 | 6 | 8.0% |
| $75,000 to $99,999 | 12 | 16.0% |
| $100,000 to $149,999 | 8 | 10.7% |
| $150,000 to $199,999 | 0 | 0.0% |
| $200,000+ | 0 | 0.0% |
Household Income by Householder Age in West Peavine
The median household income in West Peavine is $48,203, with the highest median household income of $76,563 found in the 45 to 64 years age bracket for the primary householder. A total of 27 households (36.0%) fall into this category. Meanwhile, the 15 to 24 years age bracket for the primary householder has the lowest median household income of $0, with 8 households (10.7%) in this group.
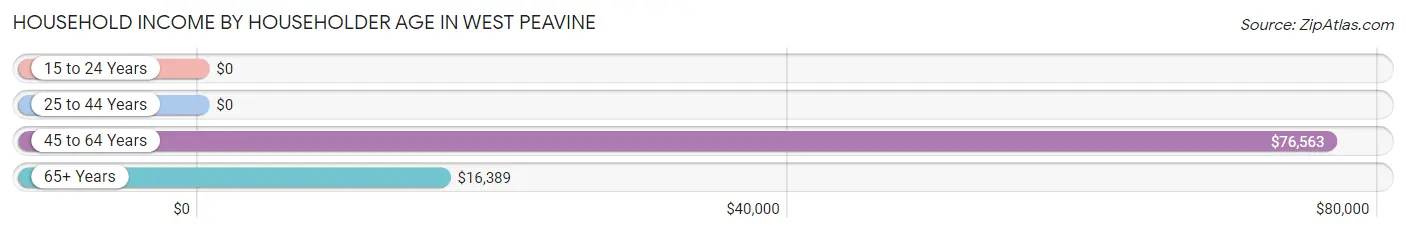
| Income Bracket | # Households | Median Income |
| 15 to 24 Years | 8 (10.7%) | $0 |
| 25 to 44 Years | 16 (21.3%) | $0 |
| 45 to 64 Years | 27 (36.0%) | $76,563 |
| 65+ Years | 24 (32.0%) | $16,389 |
| Total | 75 (100.0%) | $48,203 |
Poverty in West Peavine
Income Below Poverty by Sex and Age in West Peavine
With 10.8% poverty level for males and 10.6% for females among the residents of West Peavine, 55 to 64 year old males and 75 year old and over females are the most vulnerable to poverty, with 5 males (45.5%) and 7 females (70.0%) in their respective age groups living below the poverty level.
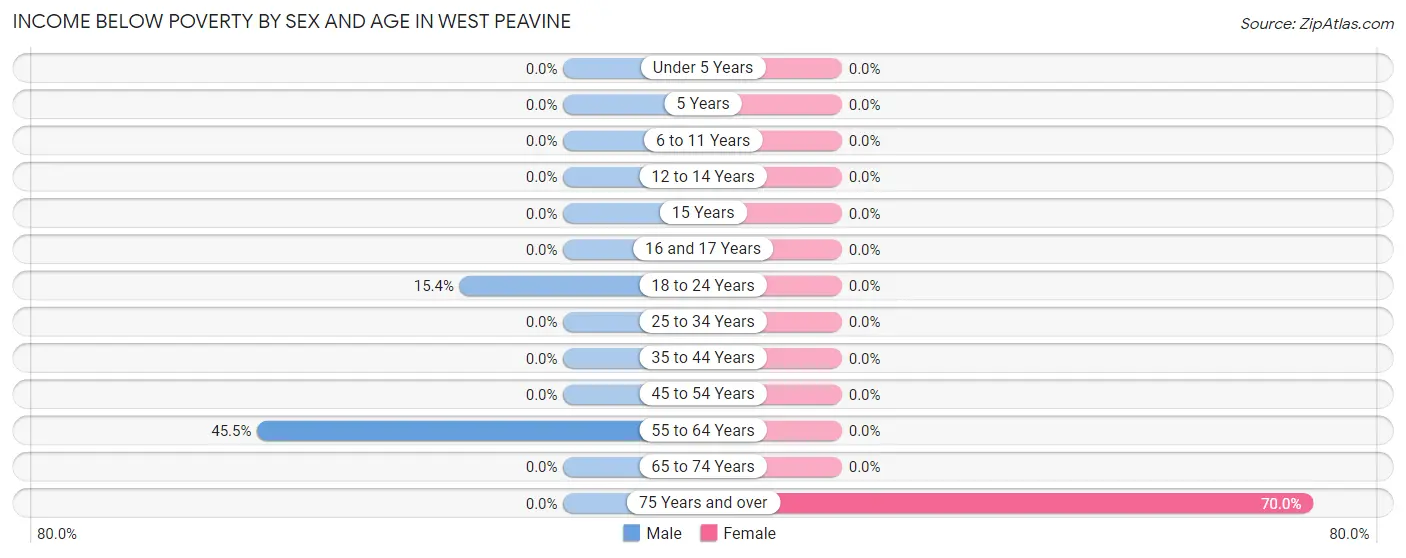
| Age Bracket | Male | Female |
| Under 5 Years | 0 (0.0%) | 0 (0.0%) |
| 5 Years | 0 (0.0%) | 0 (0.0%) |
| 6 to 11 Years | 0 (0.0%) | 0 (0.0%) |
| 12 to 14 Years | 0 (0.0%) | 0 (0.0%) |
| 15 Years | 0 (0.0%) | 0 (0.0%) |
| 16 and 17 Years | 0 (0.0%) | 0 (0.0%) |
| 18 to 24 Years | 2 (15.4%) | 0 (0.0%) |
| 25 to 34 Years | 0 (0.0%) | 0 (0.0%) |
| 35 to 44 Years | 0 (0.0%) | 0 (0.0%) |
| 45 to 54 Years | 0 (0.0%) | 0 (0.0%) |
| 55 to 64 Years | 5 (45.5%) | 0 (0.0%) |
| 65 to 74 Years | 0 (0.0%) | 0 (0.0%) |
| 75 Years and over | 0 (0.0%) | 7 (70.0%) |
| Total | 7 (10.8%) | 7 (10.6%) |
Income Above Poverty by Sex and Age in West Peavine
According to the poverty statistics in West Peavine, males aged 16 and 17 years and females aged 18 to 24 years are the age groups that are most secure financially, with 100.0% of males and 100.0% of females in these age groups living above the poverty line.
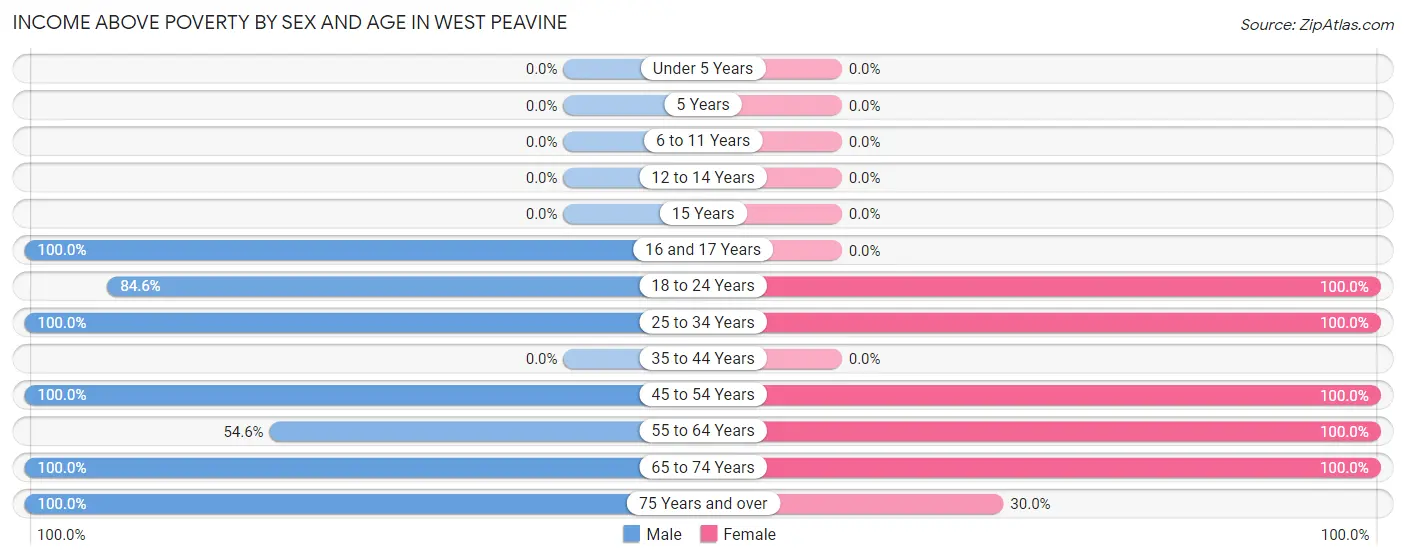
| Age Bracket | Male | Female |
| Under 5 Years | 0 (0.0%) | 0 (0.0%) |
| 5 Years | 0 (0.0%) | 0 (0.0%) |
| 6 to 11 Years | 0 (0.0%) | 0 (0.0%) |
| 12 to 14 Years | 0 (0.0%) | 0 (0.0%) |
| 15 Years | 0 (0.0%) | 0 (0.0%) |
| 16 and 17 Years | 5 (100.0%) | 0 (0.0%) |
| 18 to 24 Years | 11 (84.6%) | 6 (100.0%) |
| 25 to 34 Years | 16 (100.0%) | 16 (100.0%) |
| 35 to 44 Years | 0 (0.0%) | 0 (0.0%) |
| 45 to 54 Years | 9 (100.0%) | 6 (100.0%) |
| 55 to 64 Years | 6 (54.5%) | 16 (100.0%) |
| 65 to 74 Years | 4 (100.0%) | 12 (100.0%) |
| 75 Years and over | 7 (100.0%) | 3 (30.0%) |
| Total | 58 (89.2%) | 59 (89.4%) |
Income Below Poverty Among Married-Couple Families in West Peavine
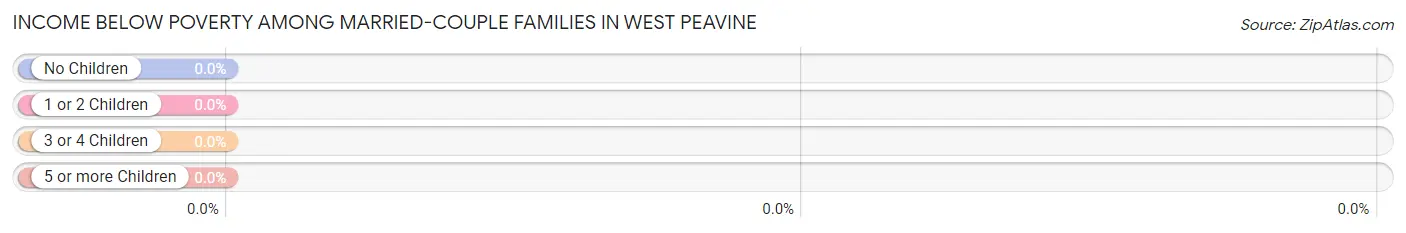
| Children | Above Poverty | Below Poverty |
| No Children | 41 (100.0%) | 0 (0.0%) |
| 1 or 2 Children | 0 (0.0%) | 0 (0.0%) |
| 3 or 4 Children | 0 (0.0%) | 0 (0.0%) |
| 5 or more Children | 0 (0.0%) | 0 (0.0%) |
| Total | 41 (100.0%) | 0 (0.0%) |
Income Below Poverty Among Single-Parent Households in West Peavine
| Children | Single Father | Single Mother |
| No Children | 0 (0.0%) | 0 (0.0%) |
| 1 or 2 Children | 0 (0.0%) | 0 (0.0%) |
| 3 or 4 Children | 0 (0.0%) | 0 (0.0%) |
| 5 or more Children | 0 (0.0%) | 0 (0.0%) |
| Total | 0 (0.0%) | 0 (0.0%) |
Income Below Poverty Among Married-Couple vs Single-Parent Households in West Peavine
| Children | Married-Couple Families | Single-Parent Households |
| No Children | 0 (0.0%) | 0 (0.0%) |
| 1 or 2 Children | 0 (0.0%) | 0 (0.0%) |
| 3 or 4 Children | 0 (0.0%) | 0 (0.0%) |
| 5 or more Children | 0 (0.0%) | 0 (0.0%) |
| Total | 0 (0.0%) | 0 (0.0%) |
Race in West Peavine
The most populous races in West Peavine are White / Caucasian (56 | 42.7%), Native / Alaskan (53 | 40.5%), and Two or more Races (22 | 16.8%).
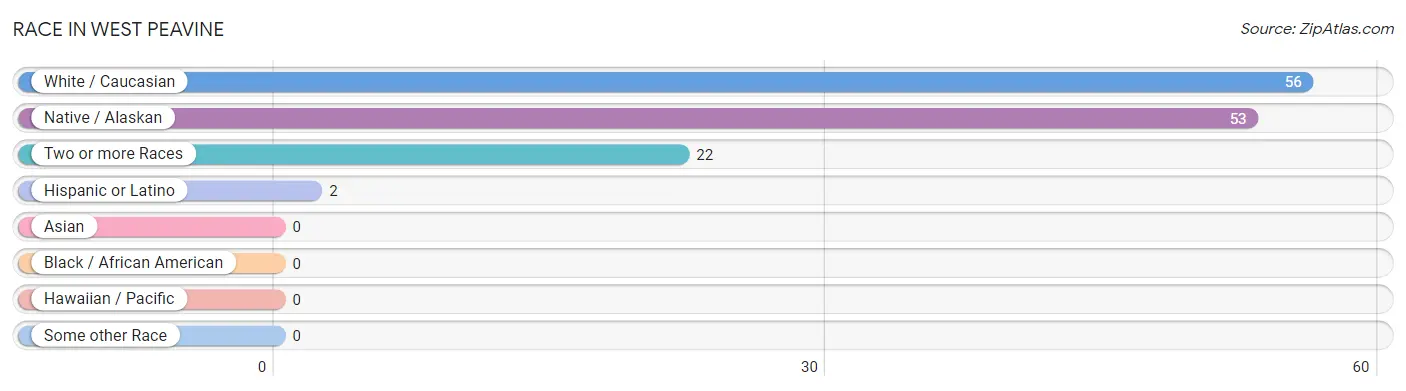
| Race | # Population | % Population |
| Asian | 0 | 0.0% |
| Black / African American | 0 | 0.0% |
| Hawaiian / Pacific | 0 | 0.0% |
| Hispanic or Latino | 2 | 1.5% |
| Native / Alaskan | 53 | 40.5% |
| White / Caucasian | 56 | 42.7% |
| Two or more Races | 22 | 16.8% |
| Some other Race | 0 | 0.0% |
| Total | 131 | 100.0% |
Ancestry in West Peavine
The most populous ancestries reported in West Peavine are Cherokee (51 | 38.9%), Irish (15 | 11.5%), French (7 | 5.3%), American (5 | 3.8%), and Choctaw (2 | 1.5%), together accounting for 61.1% of all West Peavine residents.
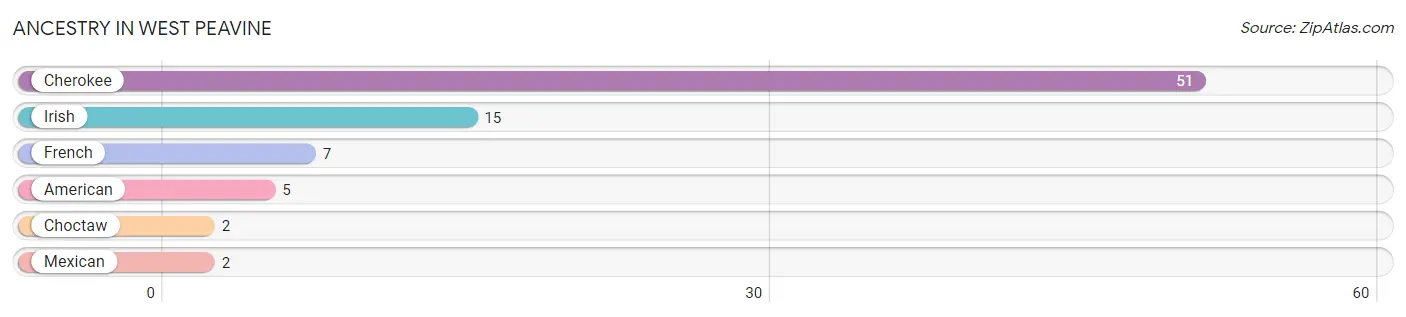
| Ancestry | # Population | % Population |
| American | 5 | 3.8% |
| Cherokee | 51 | 38.9% |
| Choctaw | 2 | 1.5% |
| French | 7 | 5.3% |
| Irish | 15 | 11.5% |
| Mexican | 2 | 1.5% | View All 6 Rows |
Immigrants in West Peavine

| Immigration Origin | # Population | % Population | View All 0 Rows |
Sex and Age in West Peavine
Sex and Age in West Peavine
The most populous age groups in West Peavine are 20 to 24 Years (11 | 16.9%) for men and 25 to 29 Years (16 | 24.2%) for women.
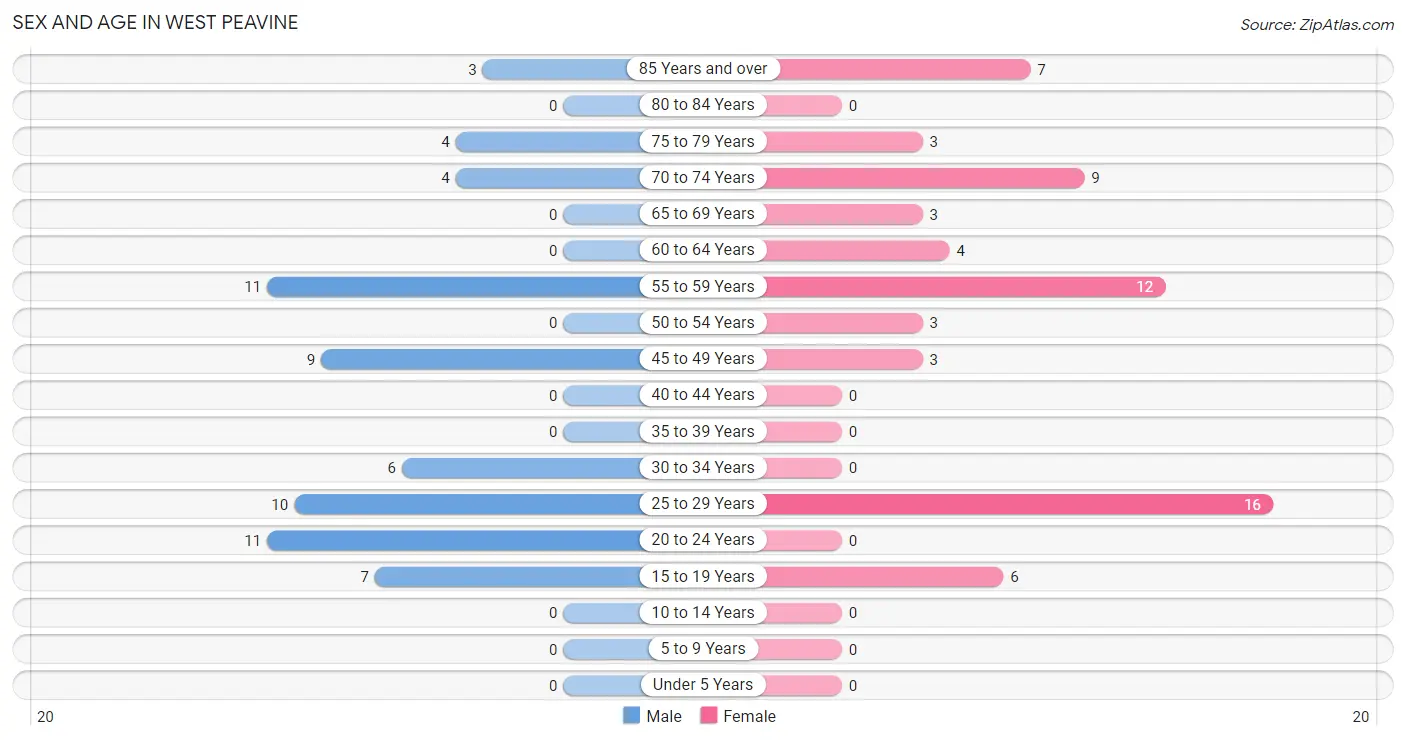
| Age Bracket | Male | Female |
| Under 5 Years | 0 (0.0%) | 0 (0.0%) |
| 5 to 9 Years | 0 (0.0%) | 0 (0.0%) |
| 10 to 14 Years | 0 (0.0%) | 0 (0.0%) |
| 15 to 19 Years | 7 (10.8%) | 6 (9.1%) |
| 20 to 24 Years | 11 (16.9%) | 0 (0.0%) |
| 25 to 29 Years | 10 (15.4%) | 16 (24.2%) |
| 30 to 34 Years | 6 (9.2%) | 0 (0.0%) |
| 35 to 39 Years | 0 (0.0%) | 0 (0.0%) |
| 40 to 44 Years | 0 (0.0%) | 0 (0.0%) |
| 45 to 49 Years | 9 (13.9%) | 3 (4.5%) |
| 50 to 54 Years | 0 (0.0%) | 3 (4.5%) |
| 55 to 59 Years | 11 (16.9%) | 12 (18.2%) |
| 60 to 64 Years | 0 (0.0%) | 4 (6.1%) |
| 65 to 69 Years | 0 (0.0%) | 3 (4.5%) |
| 70 to 74 Years | 4 (6.1%) | 9 (13.6%) |
| 75 to 79 Years | 4 (6.1%) | 3 (4.5%) |
| 80 to 84 Years | 0 (0.0%) | 0 (0.0%) |
| 85 Years and over | 3 (4.6%) | 7 (10.6%) |
| Total | 65 (100.0%) | 66 (100.0%) |
Families and Households in West Peavine
Median Family Size in West Peavine
The median family size in West Peavine is 1.89 persons per family, with single female/mother families (11 | 19.3%) accounting for the largest median family size of 3.18 persons per family. On the other hand, married-couple families (41 | 71.9%) represent the smallest median family size with 1.54 persons per family.
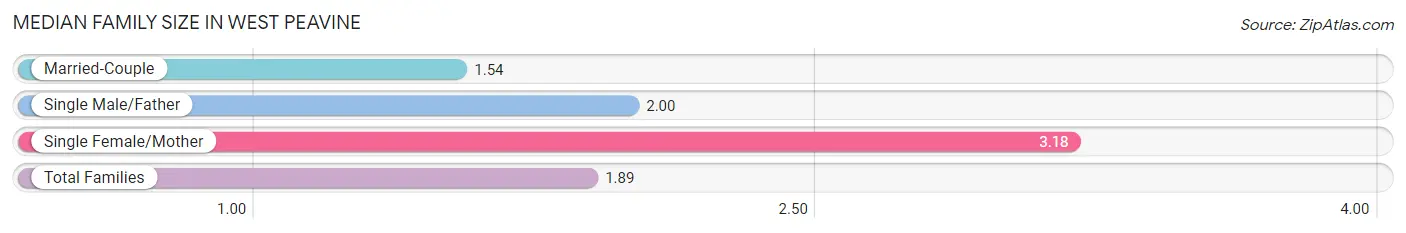
| Family Type | # Families | Family Size |
| Married-Couple | 41 (71.9%) | 1.54 |
| Single Male/Father | 5 (8.8%) | 2.00 |
| Single Female/Mother | 11 (19.3%) | 3.18 |
| Total Families | 57 (100.0%) | 1.89 |
Median Household Size in West Peavine
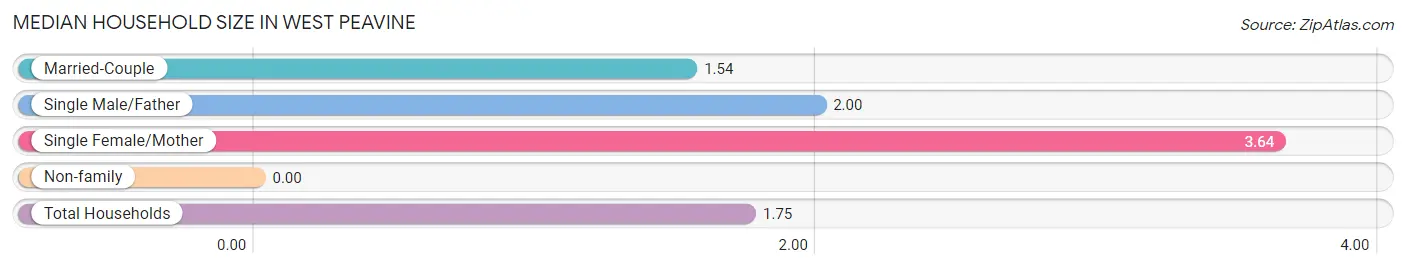
| Household Type | # Households | Household Size |
| Married-Couple | 41 (54.7%) | 1.54 |
| Single Male/Father | 5 (6.7%) | 2.00 |
| Single Female/Mother | 11 (14.7%) | 3.64 |
| Non-family | 18 (24.0%) | - |
| Total Households | 75 (100.0%) | 1.75 |
Household Size by Marriage Status in West Peavine
Out of a total of 75 households in West Peavine, 57 (76.0%) are family households, while 18 (24.0%) are nonfamily households. The most numerous type of family households are 2-person households, comprising 50, and the most common type of nonfamily households are 1-person households, comprising 18.
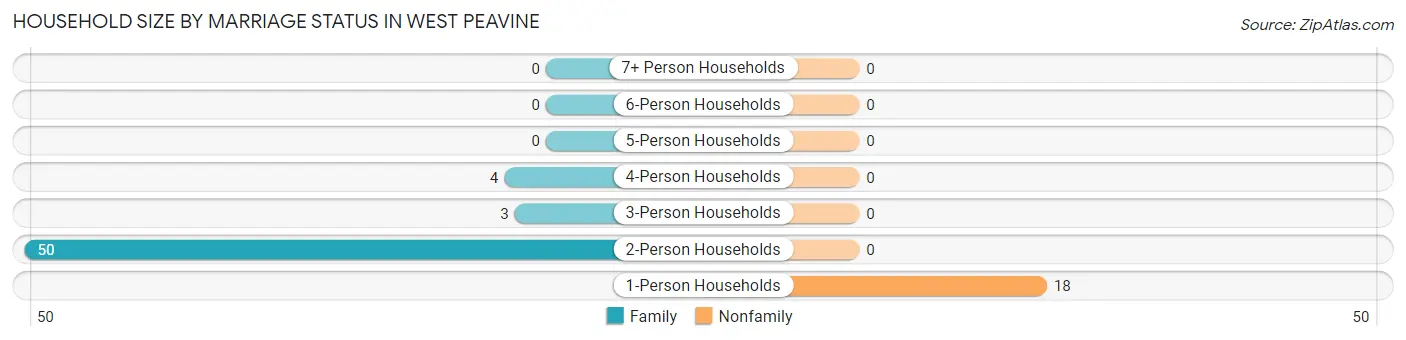
| Household Size | Family Households | Nonfamily Households |
| 1-Person Households | - | 18 (24.0%) |
| 2-Person Households | 50 (66.7%) | 0 (0.0%) |
| 3-Person Households | 3 (4.0%) | 0 (0.0%) |
| 4-Person Households | 4 (5.3%) | 0 (0.0%) |
| 5-Person Households | 0 (0.0%) | 0 (0.0%) |
| 6-Person Households | 0 (0.0%) | 0 (0.0%) |
| 7+ Person Households | 0 (0.0%) | 0 (0.0%) |
| Total | 57 (76.0%) | 18 (24.0%) |
Female Fertility in West Peavine
Fertility by Age in West Peavine
| Age Bracket | Women with Births | Births / 1,000 Women |
| 15 to 19 years | 0 (0.0%) | 0.0 |
| 20 to 34 years | 0 (0.0%) | 0.0 |
| 35 to 50 years | 0 (0.0%) | 0.0 |
| Total | 0 (0.0%) | 0.0 |
Fertility by Age by Marriage Status in West Peavine
| Age Bracket | Married | Unmarried |
| 15 to 19 years | 0 (0.0%) | 0 (0.0%) |
| 20 to 34 years | 0 (0.0%) | 0 (0.0%) |
| 35 to 50 years | 0 (0.0%) | 0 (0.0%) |
| Total | 0 (0.0%) | 0 (0.0%) |
Fertility by Education in West Peavine
| Educational Attainment | Women with Births | Births / 1,000 Women |
| Less than High School | 0 (0.0%) | 0.0 |
| High School Diploma | 0 (0.0%) | 0.0 |
| College or Associate's Degree | 0 (0.0%) | 0.0 |
| Bachelor's Degree | 0 (0.0%) | 0.0 |
| Graduate Degree | 0 (0.0%) | 0.0 |
| Total | 0 (0.0%) | 0.0 |
Fertility by Education by Marriage Status in West Peavine
| Educational Attainment | Married | Unmarried |
| Less than High School | 0 (0.0%) | 0 (0.0%) |
| High School Diploma | 0 (0.0%) | 0 (0.0%) |
| College or Associate's Degree | 0 (0.0%) | 0 (0.0%) |
| Bachelor's Degree | 0 (0.0%) | 0 (0.0%) |
| Graduate Degree | 0 (0.0%) | 0 (0.0%) |
| Total | 0 (0.0%) | 0 (0.0%) |
Employment Characteristics in West Peavine
Employment by Class of Employer in West Peavine
Among the 68 employed individuals in West Peavine, private company employees (49 | 72.1%), local government employees (11 | 16.2%), and self-employed (not incorporated) (4 | 5.9%) make up the most common classes of employment.
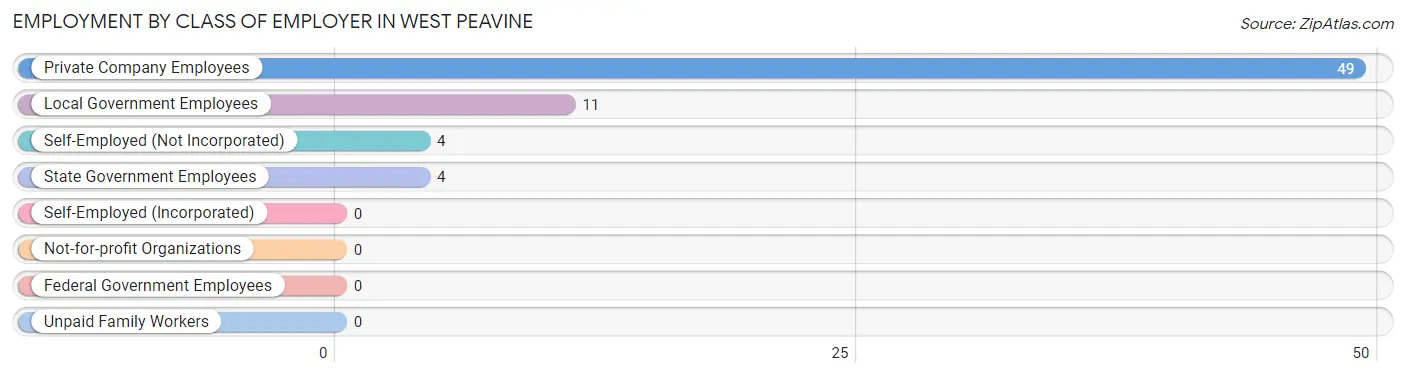
| Employer Class | # Employees | % Employees |
| Private Company Employees | 49 | 72.1% |
| Self-Employed (Incorporated) | 0 | 0.0% |
| Self-Employed (Not Incorporated) | 4 | 5.9% |
| Not-for-profit Organizations | 0 | 0.0% |
| Local Government Employees | 11 | 16.2% |
| State Government Employees | 4 | 5.9% |
| Federal Government Employees | 0 | 0.0% |
| Unpaid Family Workers | 0 | 0.0% |
| Total | 68 | 100.0% |
Employment Status by Age in West Peavine
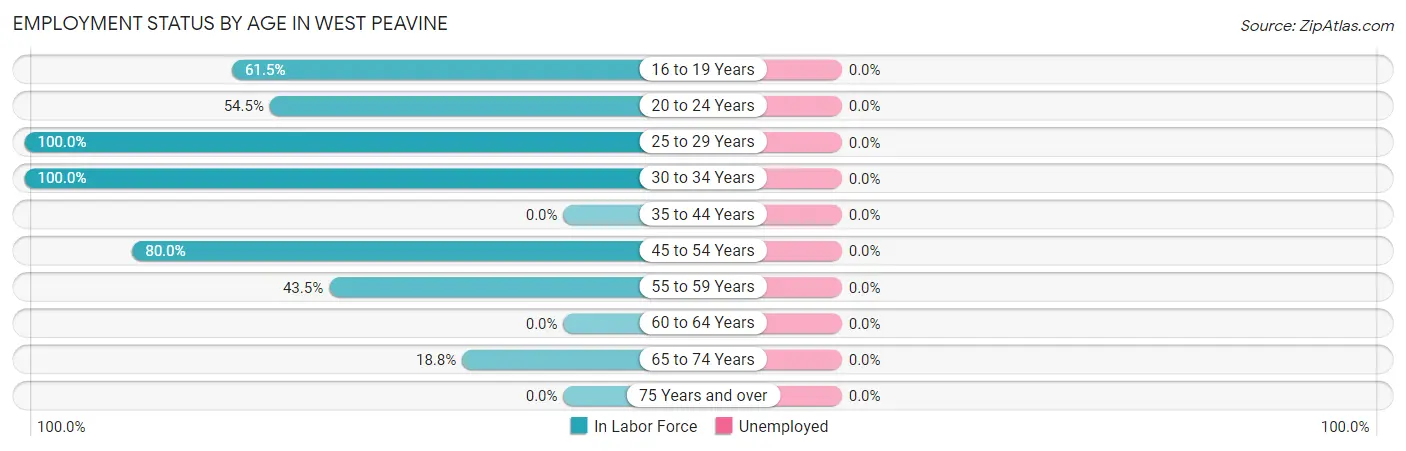
| Age Bracket | In Labor Force | Unemployed |
| 16 to 19 Years | 8 (61.5%) | 0 (0.0%) |
| 20 to 24 Years | 6 (54.5%) | 0 (0.0%) |
| 25 to 29 Years | 26 (100.0%) | 0 (0.0%) |
| 30 to 34 Years | 6 (100.0%) | 0 (0.0%) |
| 35 to 44 Years | 0 (0.0%) | 0 (0.0%) |
| 45 to 54 Years | 12 (80.0%) | 0 (0.0%) |
| 55 to 59 Years | 10 (43.5%) | 0 (0.0%) |
| 60 to 64 Years | 0 (0.0%) | 0 (0.0%) |
| 65 to 74 Years | 3 (18.8%) | 0 (0.0%) |
| 75 Years and over | 0 (0.0%) | 0 (0.0%) |
| Total | 71 (54.2%) | 0 (0.0%) |
Employment Status by Educational Attainment in West Peavine
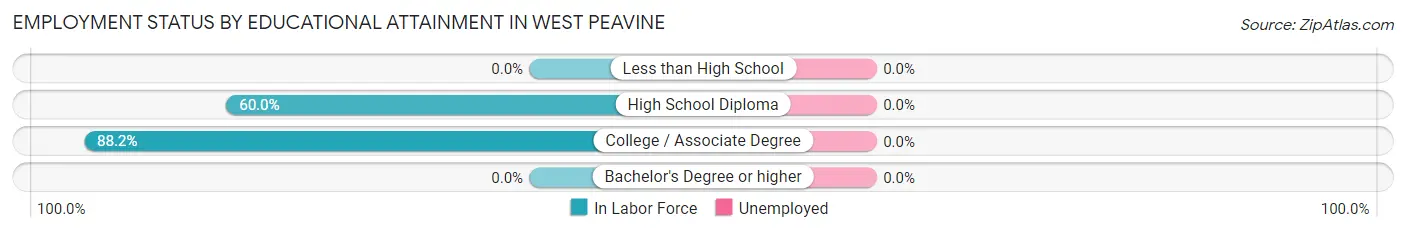
| Educational Attainment | In Labor Force | Unemployed |
| Less than High School | 0 (0.0%) | 0 (0.0%) |
| High School Diploma | 24 (60.0%) | 0 (0.0%) |
| College / Associate Degree | 30 (88.2%) | 0 (0.0%) |
| Bachelor's Degree or higher | 0 (0.0%) | 0 (0.0%) |
| Total | 54 (73.0%) | 0 (0.0%) |
Employment Occupations by Sex in West Peavine
Management, Business, Science and Arts Occupations
The most common Management, Business, Science and Arts occupations in West Peavine are Management (4 | 5.6%), Computers, Engineering & Science (4 | 5.6%), and Architecture & Engineering (4 | 5.6%).
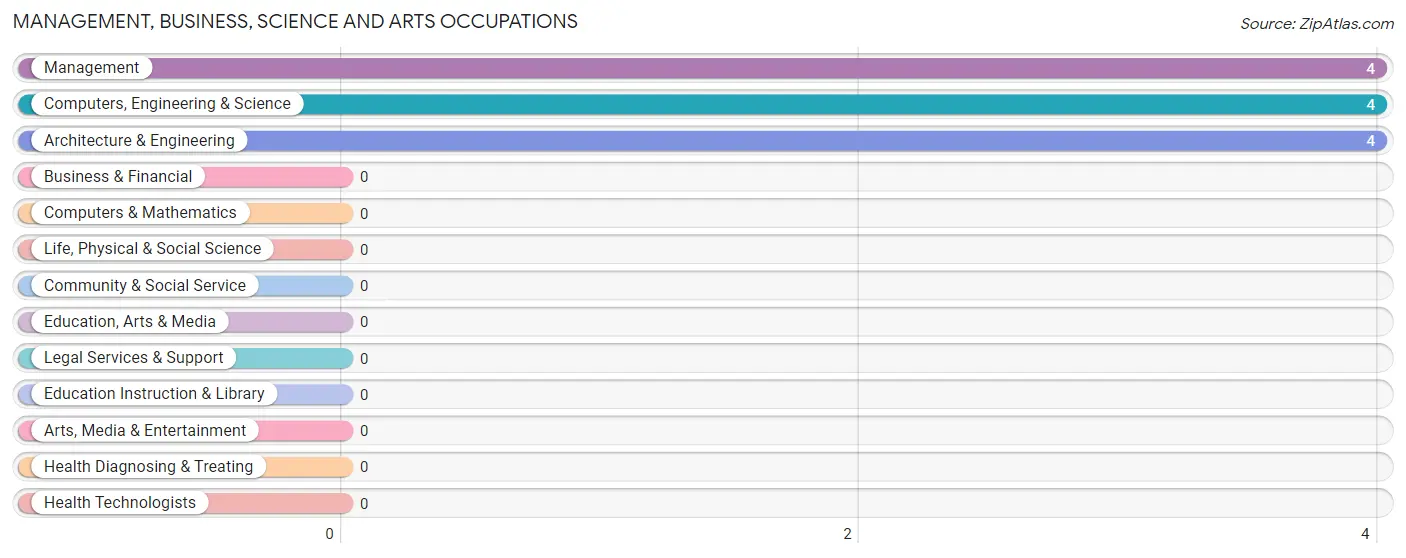
Management, Business, Science and Arts Occupations by Sex
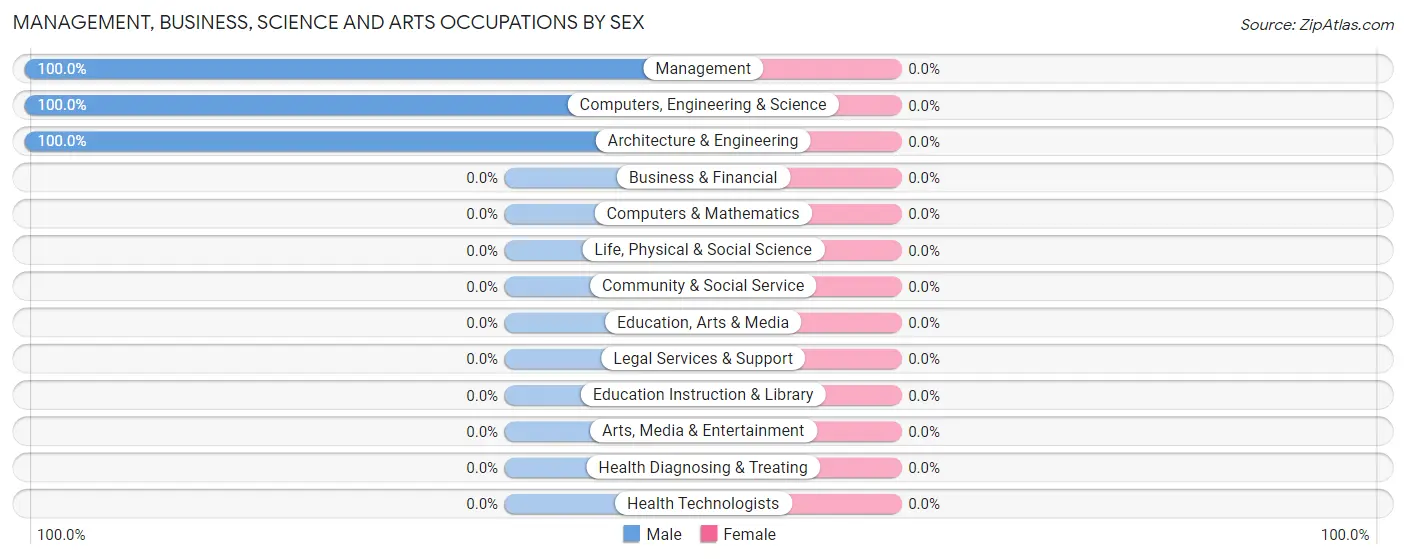
| Occupation | Male | Female |
| Management | 4 (100.0%) | 0 (0.0%) |
| Business & Financial | 0 (0.0%) | 0 (0.0%) |
| Computers, Engineering & Science | 4 (100.0%) | 0 (0.0%) |
| Computers & Mathematics | 0 (0.0%) | 0 (0.0%) |
| Architecture & Engineering | 4 (100.0%) | 0 (0.0%) |
| Life, Physical & Social Science | 0 (0.0%) | 0 (0.0%) |
| Community & Social Service | 0 (0.0%) | 0 (0.0%) |
| Education, Arts & Media | 0 (0.0%) | 0 (0.0%) |
| Legal Services & Support | 0 (0.0%) | 0 (0.0%) |
| Education Instruction & Library | 0 (0.0%) | 0 (0.0%) |
| Arts, Media & Entertainment | 0 (0.0%) | 0 (0.0%) |
| Health Diagnosing & Treating | 0 (0.0%) | 0 (0.0%) |
| Health Technologists | 0 (0.0%) | 0 (0.0%) |
| Total (Category) | 8 (100.0%) | 0 (0.0%) |
| Total (Overall) | 39 (54.9%) | 32 (45.1%) |
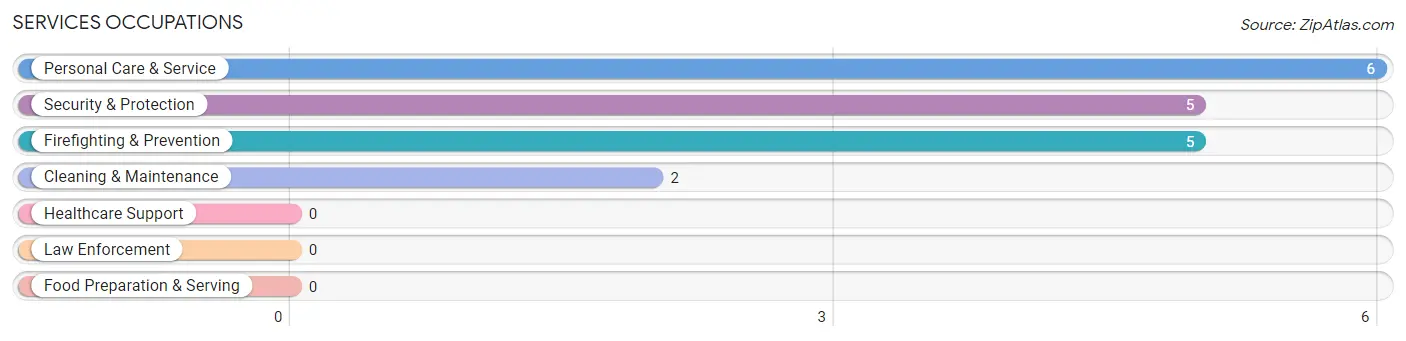
Services Occupations
The most common Services occupations in West Peavine are Personal Care & Service (6 | 8.5%), Security & Protection (5 | 7.0%), Firefighting & Prevention (5 | 7.0%), and Cleaning & Maintenance (2 | 2.8%).
Services Occupations by Sex
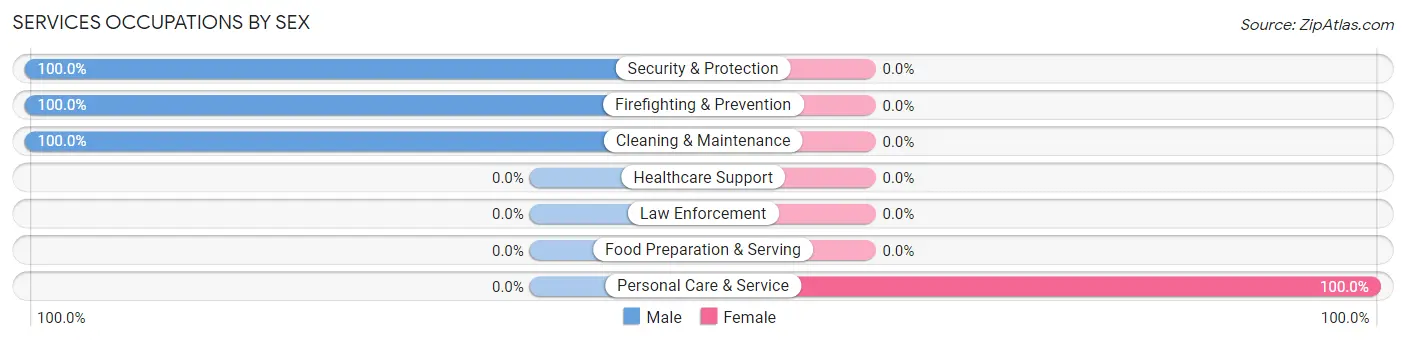
| Occupation | Male | Female |
| Healthcare Support | 0 (0.0%) | 0 (0.0%) |
| Security & Protection | 5 (100.0%) | 0 (0.0%) |
| Firefighting & Prevention | 5 (100.0%) | 0 (0.0%) |
| Law Enforcement | 0 (0.0%) | 0 (0.0%) |
| Food Preparation & Serving | 0 (0.0%) | 0 (0.0%) |
| Cleaning & Maintenance | 2 (100.0%) | 0 (0.0%) |
| Personal Care & Service | 0 (0.0%) | 6 (100.0%) |
| Total (Category) | 7 (53.8%) | 6 (46.2%) |
| Total (Overall) | 39 (54.9%) | 32 (45.1%) |
Sales and Office Occupations
The most common Sales and Office occupations in West Peavine are , and Office & Administration (7 | 9.9%).
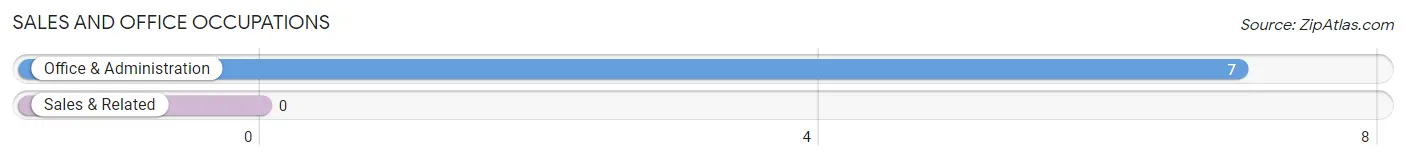
Sales and Office Occupations by Sex
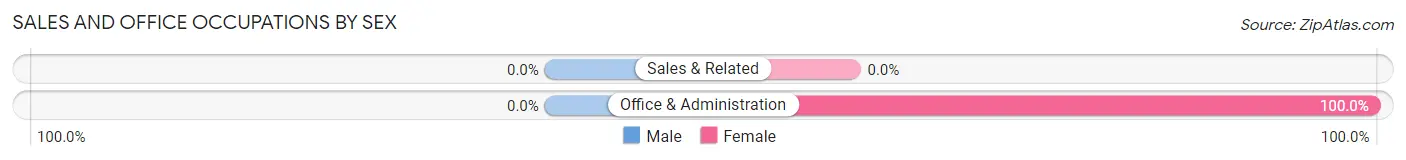
| Occupation | Male | Female |
| Sales & Related | 0 (0.0%) | 0 (0.0%) |
| Office & Administration | 0 (0.0%) | 7 (100.0%) |
| Total (Category) | 0 (0.0%) | 7 (100.0%) |
| Total (Overall) | 39 (54.9%) | 32 (45.1%) |
Natural Resources, Construction and Maintenance Occupations
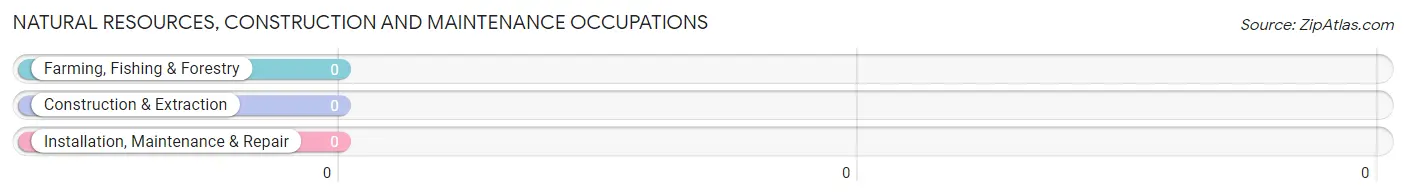
Natural Resources, Construction and Maintenance Occupations by Sex
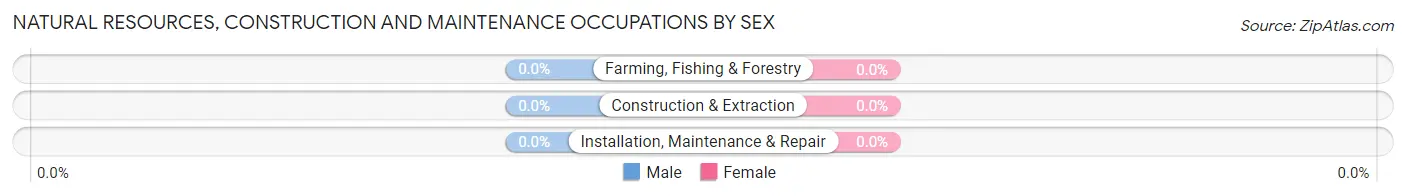
| Occupation | Male | Female |
| Farming, Fishing & Forestry | 0 (0.0%) | 0 (0.0%) |
| Construction & Extraction | 0 (0.0%) | 0 (0.0%) |
| Installation, Maintenance & Repair | 0 (0.0%) | 0 (0.0%) |
| Total (Category) | 0 (0.0%) | 0 (0.0%) |
| Total (Overall) | 39 (54.9%) | 32 (45.1%) |
Production, Transportation and Moving Occupations
The most common Production, Transportation and Moving occupations in West Peavine are Production (31 | 43.7%), Transportation (6 | 8.5%), and Material Moving (6 | 8.5%).
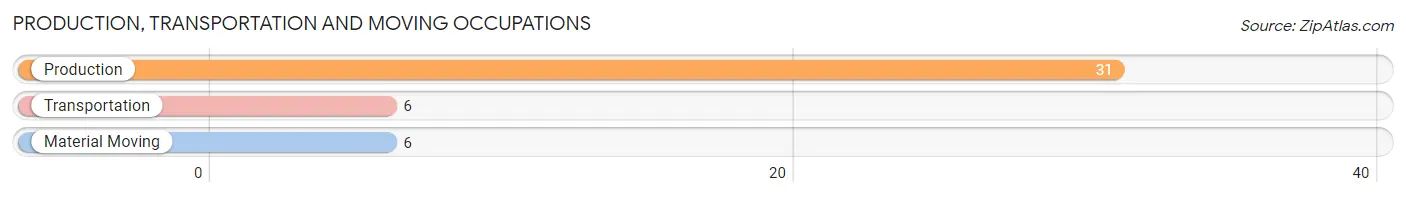
Production, Transportation and Moving Occupations by Sex
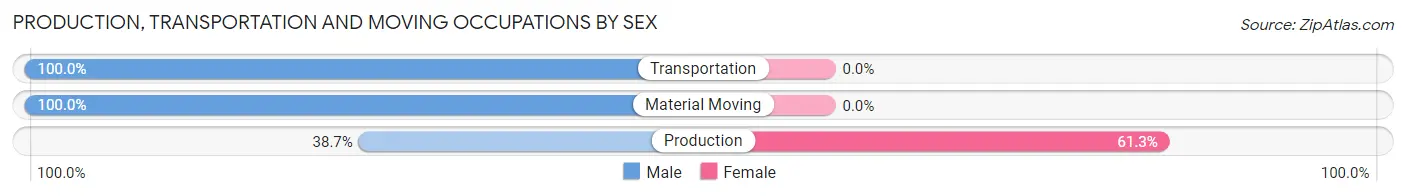
| Occupation | Male | Female |
| Production | 12 (38.7%) | 19 (61.3%) |
| Transportation | 6 (100.0%) | 0 (0.0%) |
| Material Moving | 6 (100.0%) | 0 (0.0%) |
| Total (Category) | 24 (55.8%) | 19 (44.2%) |
| Total (Overall) | 39 (54.9%) | 32 (45.1%) |
Employment Industries by Sex in West Peavine
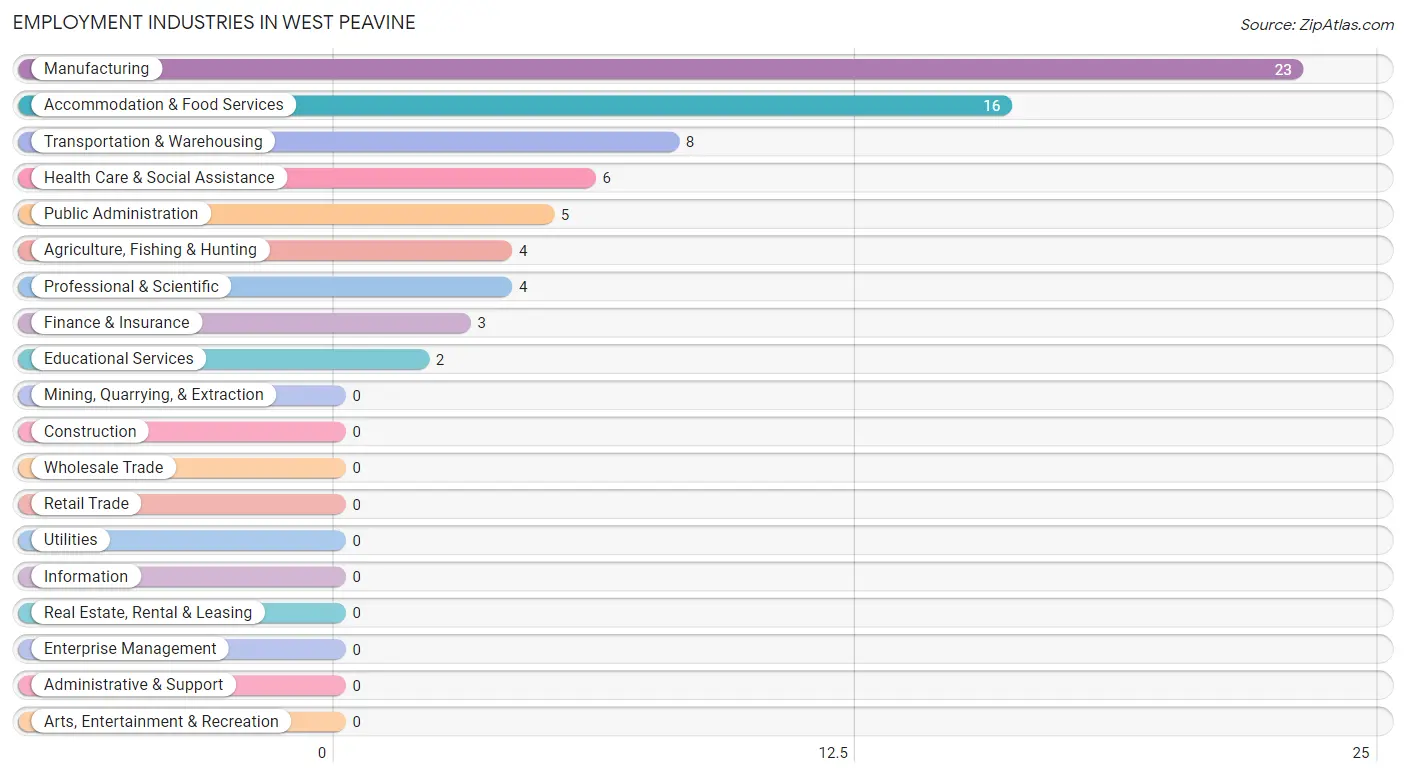
Employment Industries in West Peavine
The major employment industries in West Peavine include Manufacturing (23 | 32.4%), Accommodation & Food Services (16 | 22.5%), Transportation & Warehousing (8 | 11.3%), Health Care & Social Assistance (6 | 8.5%), and Public Administration (5 | 7.0%).
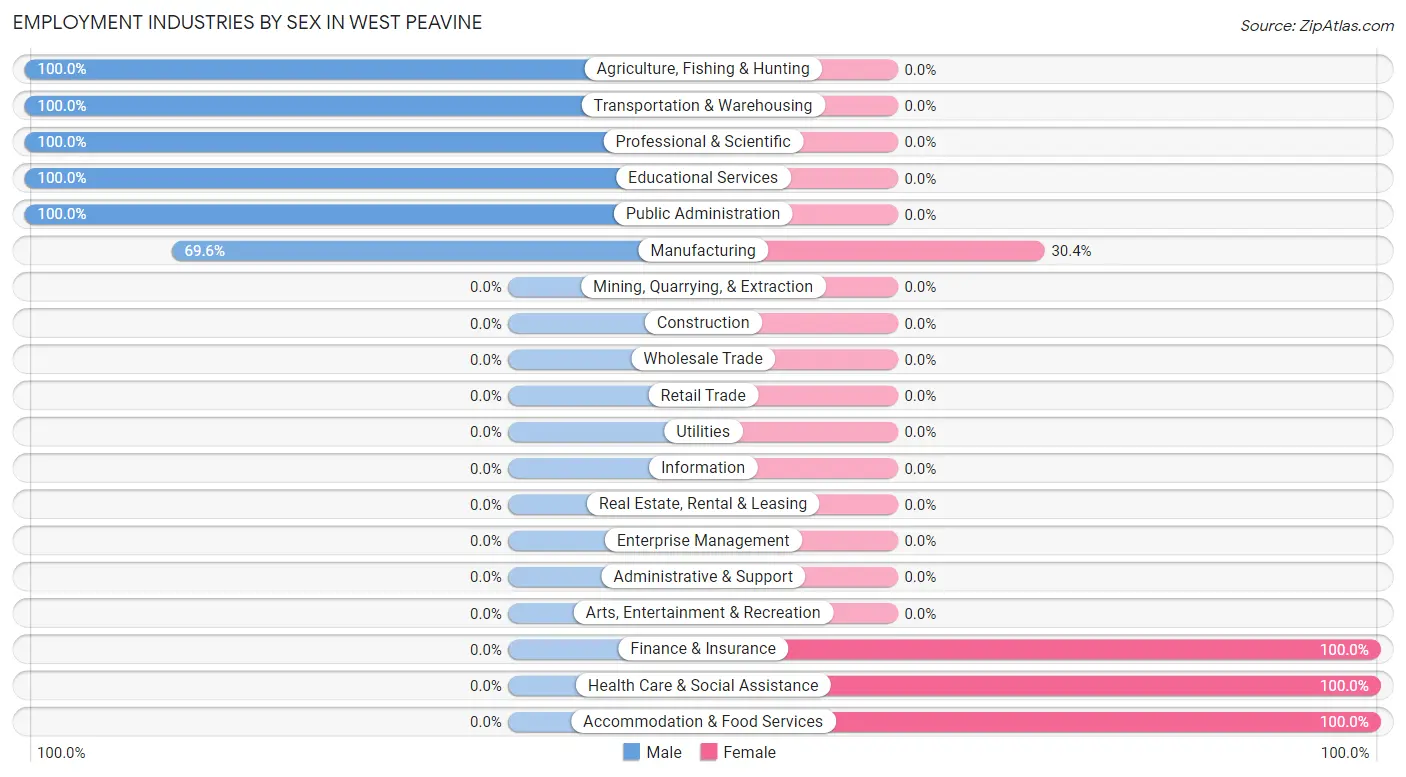
Employment Industries by Sex in West Peavine
The West Peavine industries that see more men than women are Agriculture, Fishing & Hunting (100.0%), Transportation & Warehousing (100.0%), and Professional & Scientific (100.0%), whereas the industries that tend to have a higher number of women are Finance & Insurance (100.0%), Health Care & Social Assistance (100.0%), and Accommodation & Food Services (100.0%).
| Industry | Male | Female |
| Agriculture, Fishing & Hunting | 4 (100.0%) | 0 (0.0%) |
| Mining, Quarrying, & Extraction | 0 (0.0%) | 0 (0.0%) |
| Construction | 0 (0.0%) | 0 (0.0%) |
| Manufacturing | 16 (69.6%) | 7 (30.4%) |
| Wholesale Trade | 0 (0.0%) | 0 (0.0%) |
| Retail Trade | 0 (0.0%) | 0 (0.0%) |
| Transportation & Warehousing | 8 (100.0%) | 0 (0.0%) |
| Utilities | 0 (0.0%) | 0 (0.0%) |
| Information | 0 (0.0%) | 0 (0.0%) |
| Finance & Insurance | 0 (0.0%) | 3 (100.0%) |
| Real Estate, Rental & Leasing | 0 (0.0%) | 0 (0.0%) |
| Professional & Scientific | 4 (100.0%) | 0 (0.0%) |
| Enterprise Management | 0 (0.0%) | 0 (0.0%) |
| Administrative & Support | 0 (0.0%) | 0 (0.0%) |
| Educational Services | 2 (100.0%) | 0 (0.0%) |
| Health Care & Social Assistance | 0 (0.0%) | 6 (100.0%) |
| Arts, Entertainment & Recreation | 0 (0.0%) | 0 (0.0%) |
| Accommodation & Food Services | 0 (0.0%) | 16 (100.0%) |
| Public Administration | 5 (100.0%) | 0 (0.0%) |
| Total | 39 (54.9%) | 32 (45.1%) |
Education in West Peavine
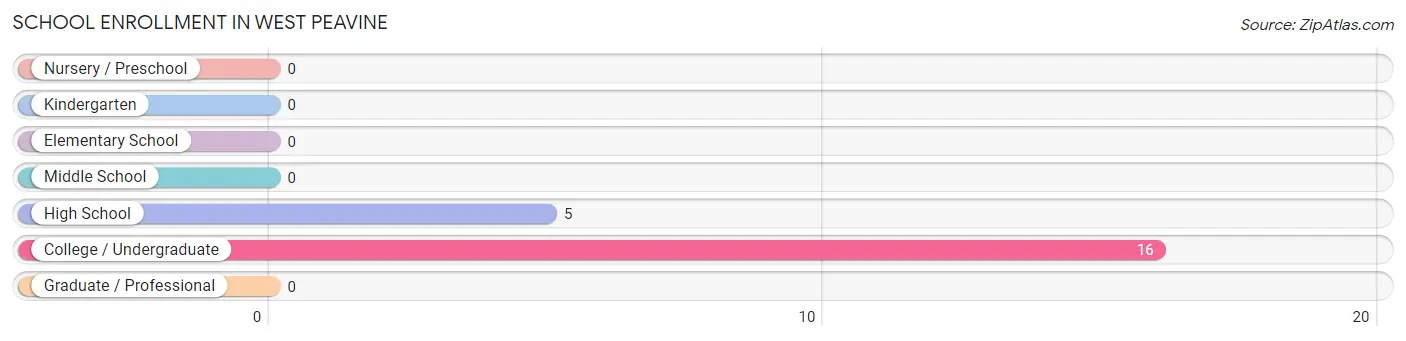
School Enrollment in West Peavine
The most common levels of schooling among the 21 students in West Peavine are college / undergraduate (16 | 76.2%), and high school (5 | 23.8%).
| School Level | # Students | % Students |
| Nursery / Preschool | 0 | 0.0% |
| Kindergarten | 0 | 0.0% |
| Elementary School | 0 | 0.0% |
| Middle School | 0 | 0.0% |
| High School | 5 | 23.8% |
| College / Undergraduate | 16 | 76.2% |
| Graduate / Professional | 0 | 0.0% |
| Total | 21 | 100.0% |
School Enrollment by Age by Funding Source in West Peavine
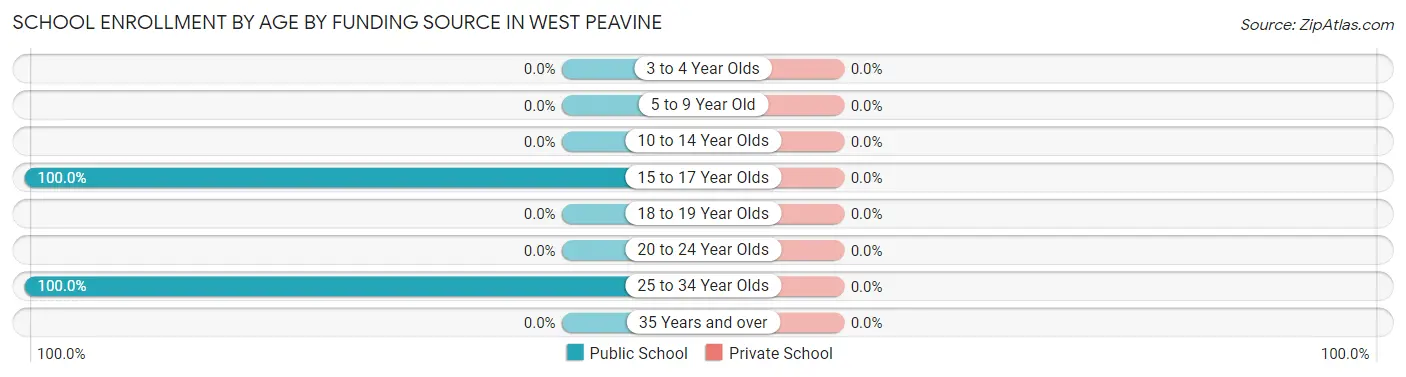
| Age Bracket | Public School | Private School |
| 3 to 4 Year Olds | 0 (0.0%) | 0 (0.0%) |
| 5 to 9 Year Old | 0 (0.0%) | 0 (0.0%) |
| 10 to 14 Year Olds | 0 (0.0%) | 0 (0.0%) |
| 15 to 17 Year Olds | 5 (100.0%) | 0 (0.0%) |
| 18 to 19 Year Olds | 0 (0.0%) | 0 (0.0%) |
| 20 to 24 Year Olds | 0 (0.0%) | 0 (0.0%) |
| 25 to 34 Year Olds | 16 (100.0%) | 0 (0.0%) |
| 35 Years and over | 0 (0.0%) | 0 (0.0%) |
| Total | 21 (100.0%) | 0 (0.0%) |
Educational Attainment by Field of Study in West Peavine
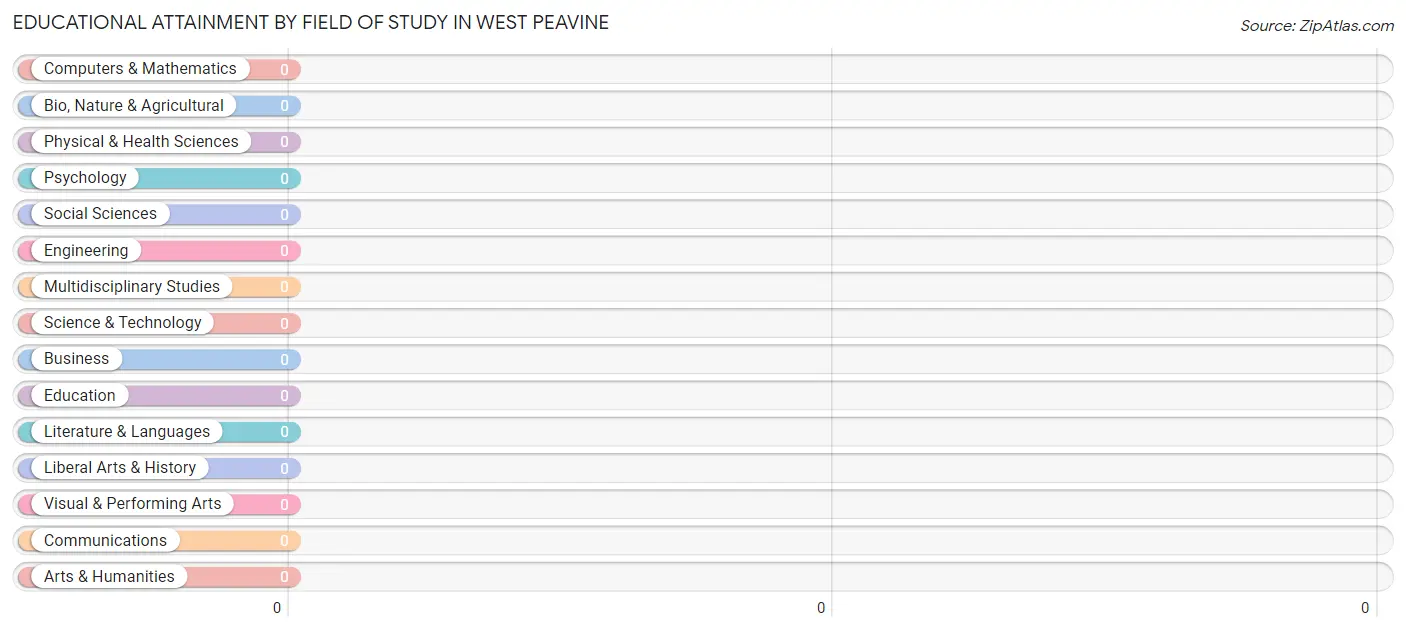
| Field of Study | # Graduates | % Graduates |
| Computers & Mathematics | 0 | 0.0% |
| Bio, Nature & Agricultural | 0 | 0.0% |
| Physical & Health Sciences | 0 | 0.0% |
| Psychology | 0 | 0.0% |
| Social Sciences | 0 | 0.0% |
| Engineering | 0 | 0.0% |
| Multidisciplinary Studies | 0 | 0.0% |
| Science & Technology | 0 | 0.0% |
| Business | 0 | 0.0% |
| Education | 0 | 0.0% |
| Literature & Languages | 0 | 0.0% |
| Liberal Arts & History | 0 | 0.0% |
| Visual & Performing Arts | 0 | 0.0% |
| Communications | 0 | 0.0% |
| Arts & Humanities | 0 | 0.0% |
| Total | 0 | 0.0% |
Transportation & Commute in West Peavine
Vehicle Availability by Sex in West Peavine
The most prevalent vehicle ownership categories in West Peavine are males with 2 vehicles (22, accounting for 56.4%) and females with 2 vehicles (26, making up 75.9%).
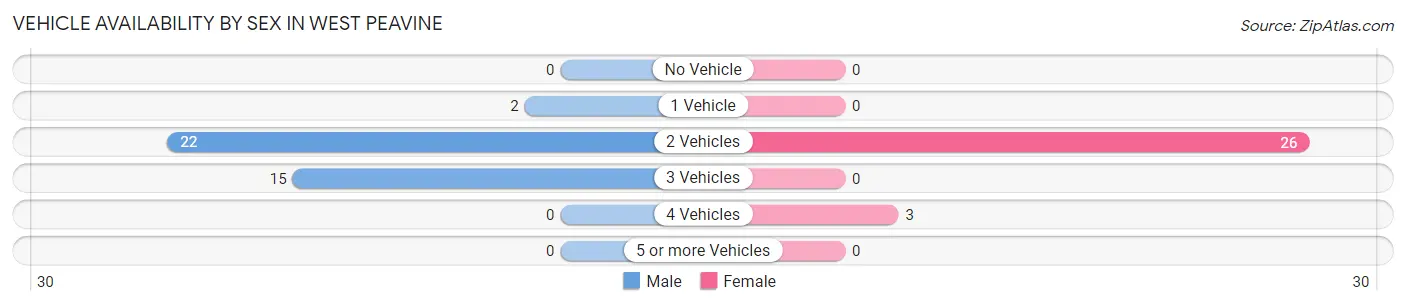
| Vehicles Available | Male | Female |
| No Vehicle | 0 (0.0%) | 0 (0.0%) |
| 1 Vehicle | 2 (5.1%) | 0 (0.0%) |
| 2 Vehicles | 22 (56.4%) | 26 (89.7%) |
| 3 Vehicles | 15 (38.5%) | 0 (0.0%) |
| 4 Vehicles | 0 (0.0%) | 3 (10.3%) |
| 5 or more Vehicles | 0 (0.0%) | 0 (0.0%) |
| Total | 39 (100.0%) | 29 (100.0%) |
Commute Time in West Peavine
The most frequently occuring commute durations in West Peavine are 15 to 19 minutes (24 commuters, 35.3%), 45 to 59 minutes (18 commuters, 26.5%), and 10 to 14 minutes (14 commuters, 20.6%).
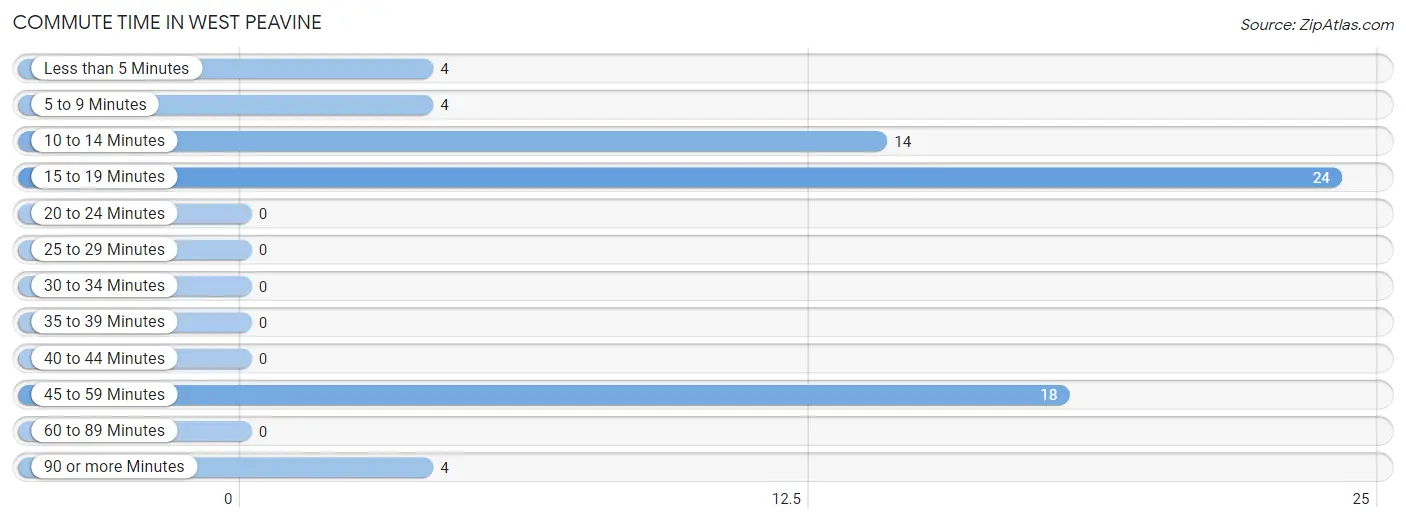
| Commute Time | # Commuters | % Commuters |
| Less than 5 Minutes | 4 | 5.9% |
| 5 to 9 Minutes | 4 | 5.9% |
| 10 to 14 Minutes | 14 | 20.6% |
| 15 to 19 Minutes | 24 | 35.3% |
| 20 to 24 Minutes | 0 | 0.0% |
| 25 to 29 Minutes | 0 | 0.0% |
| 30 to 34 Minutes | 0 | 0.0% |
| 35 to 39 Minutes | 0 | 0.0% |
| 40 to 44 Minutes | 0 | 0.0% |
| 45 to 59 Minutes | 18 | 26.5% |
| 60 to 89 Minutes | 0 | 0.0% |
| 90 or more Minutes | 4 | 5.9% |
Commute Time by Sex in West Peavine
The most common commute times in West Peavine are 15 to 19 minutes (17 commuters, 43.6%) for males and 45 to 59 minutes (16 commuters, 55.2%) for females.
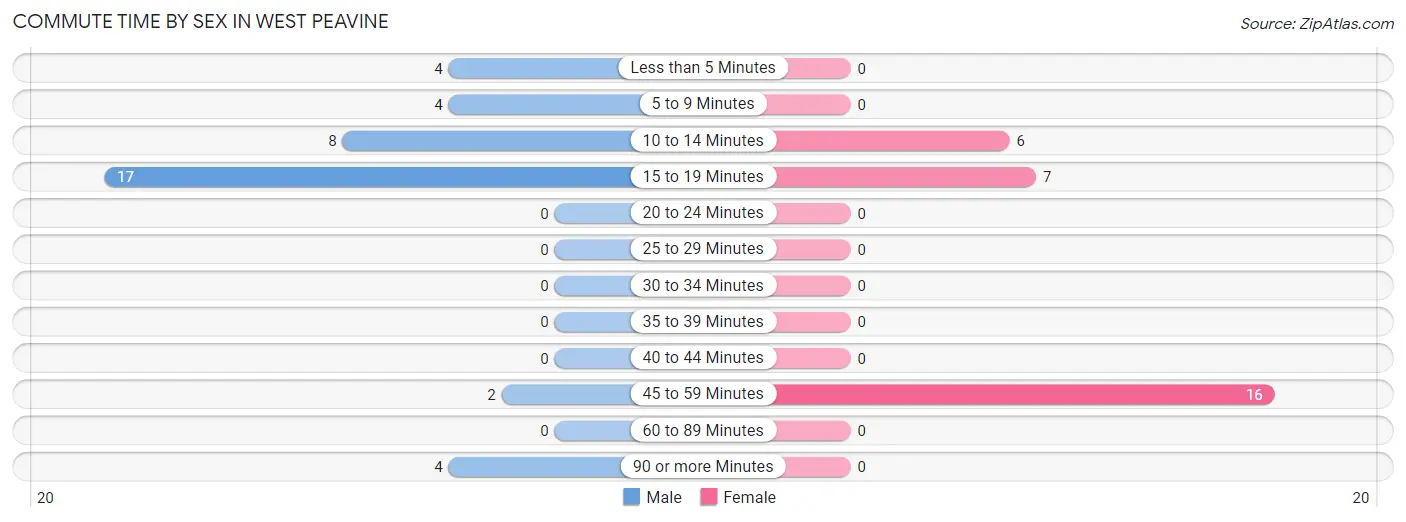
| Commute Time | Male | Female |
| Less than 5 Minutes | 4 (10.3%) | 0 (0.0%) |
| 5 to 9 Minutes | 4 (10.3%) | 0 (0.0%) |
| 10 to 14 Minutes | 8 (20.5%) | 6 (20.7%) |
| 15 to 19 Minutes | 17 (43.6%) | 7 (24.1%) |
| 20 to 24 Minutes | 0 (0.0%) | 0 (0.0%) |
| 25 to 29 Minutes | 0 (0.0%) | 0 (0.0%) |
| 30 to 34 Minutes | 0 (0.0%) | 0 (0.0%) |
| 35 to 39 Minutes | 0 (0.0%) | 0 (0.0%) |
| 40 to 44 Minutes | 0 (0.0%) | 0 (0.0%) |
| 45 to 59 Minutes | 2 (5.1%) | 16 (55.2%) |
| 60 to 89 Minutes | 0 (0.0%) | 0 (0.0%) |
| 90 or more Minutes | 4 (10.3%) | 0 (0.0%) |
Time of Departure to Work by Sex in West Peavine
The most frequent times of departure to work in West Peavine are 6:30 AM to 6:59 AM (11, 28.2%) for males and 4:00 PM to 11:59 PM (16, 55.2%) for females.
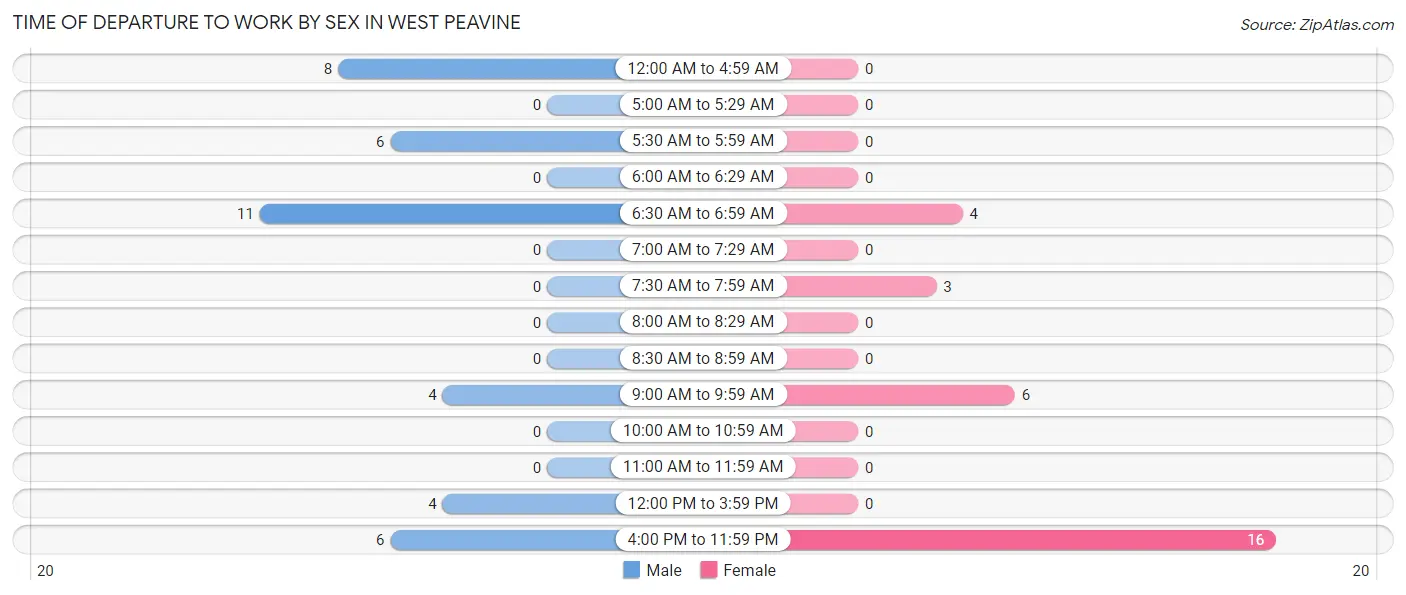
| Time of Departure | Male | Female |
| 12:00 AM to 4:59 AM | 8 (20.5%) | 0 (0.0%) |
| 5:00 AM to 5:29 AM | 0 (0.0%) | 0 (0.0%) |
| 5:30 AM to 5:59 AM | 6 (15.4%) | 0 (0.0%) |
| 6:00 AM to 6:29 AM | 0 (0.0%) | 0 (0.0%) |
| 6:30 AM to 6:59 AM | 11 (28.2%) | 4 (13.8%) |
| 7:00 AM to 7:29 AM | 0 (0.0%) | 0 (0.0%) |
| 7:30 AM to 7:59 AM | 0 (0.0%) | 3 (10.3%) |
| 8:00 AM to 8:29 AM | 0 (0.0%) | 0 (0.0%) |
| 8:30 AM to 8:59 AM | 0 (0.0%) | 0 (0.0%) |
| 9:00 AM to 9:59 AM | 4 (10.3%) | 6 (20.7%) |
| 10:00 AM to 10:59 AM | 0 (0.0%) | 0 (0.0%) |
| 11:00 AM to 11:59 AM | 0 (0.0%) | 0 (0.0%) |
| 12:00 PM to 3:59 PM | 4 (10.3%) | 0 (0.0%) |
| 4:00 PM to 11:59 PM | 6 (15.4%) | 16 (55.2%) |
| Total | 39 (100.0%) | 29 (100.0%) |
Housing Occupancy in West Peavine
Occupancy by Ownership in West Peavine
Of the total 75 dwellings in West Peavine, owner-occupied units account for 47 (62.7%), while renter-occupied units make up 28 (37.3%).
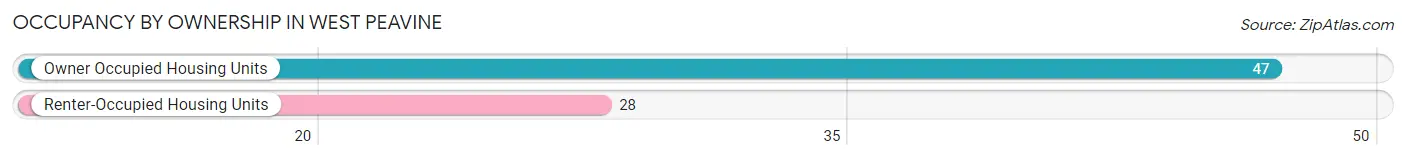
| Occupancy | # Housing Units | % Housing Units |
| Owner Occupied Housing Units | 47 | 62.7% |
| Renter-Occupied Housing Units | 28 | 37.3% |
| Total Occupied Housing Units | 75 | 100.0% |
Occupancy by Household Size in West Peavine
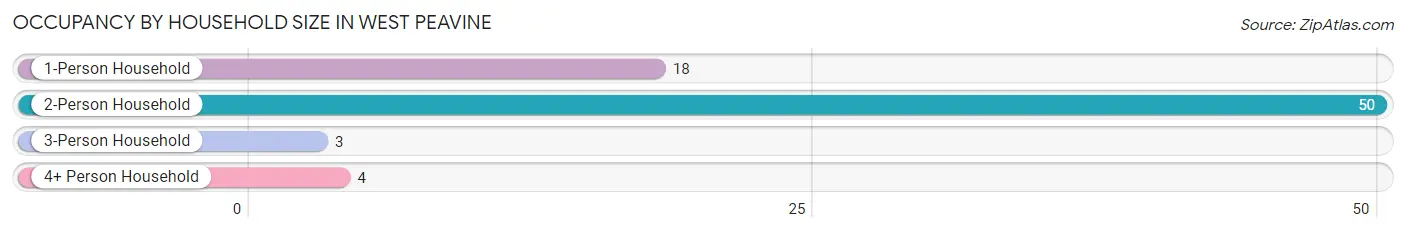
| Household Size | # Housing Units | % Housing Units |
| 1-Person Household | 18 | 24.0% |
| 2-Person Household | 50 | 66.7% |
| 3-Person Household | 3 | 4.0% |
| 4+ Person Household | 4 | 5.3% |
| Total Housing Units | 75 | 100.0% |
Occupancy by Ownership by Household Size in West Peavine
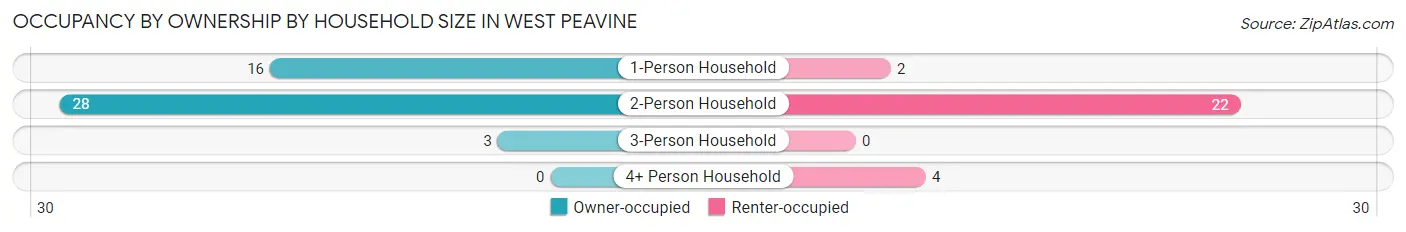
| Household Size | Owner-occupied | Renter-occupied |
| 1-Person Household | 16 (88.9%) | 2 (11.1%) |
| 2-Person Household | 28 (56.0%) | 22 (44.0%) |
| 3-Person Household | 3 (100.0%) | 0 (0.0%) |
| 4+ Person Household | 0 (0.0%) | 4 (100.0%) |
| Total Housing Units | 47 (62.7%) | 28 (37.3%) |
Occupancy by Educational Attainment in West Peavine
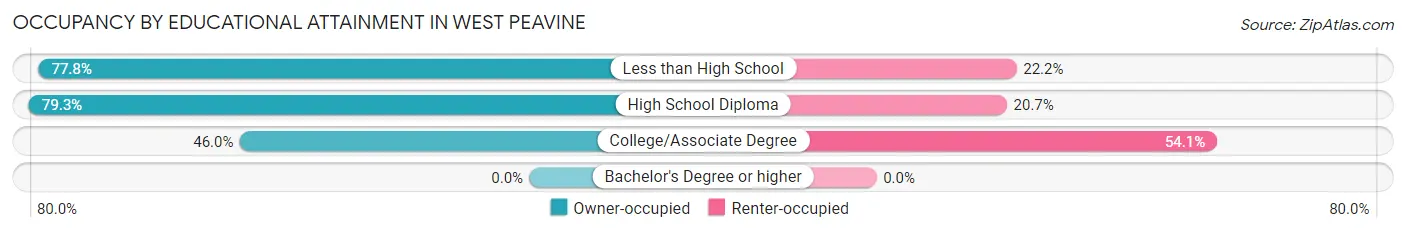
| Household Size | Owner-occupied | Renter-occupied |
| Less than High School | 7 (77.8%) | 2 (22.2%) |
| High School Diploma | 23 (79.3%) | 6 (20.7%) |
| College/Associate Degree | 17 (46.0%) | 20 (54.0%) |
| Bachelor's Degree or higher | 0 (0.0%) | 0 (0.0%) |
Occupancy by Age of Householder in West Peavine
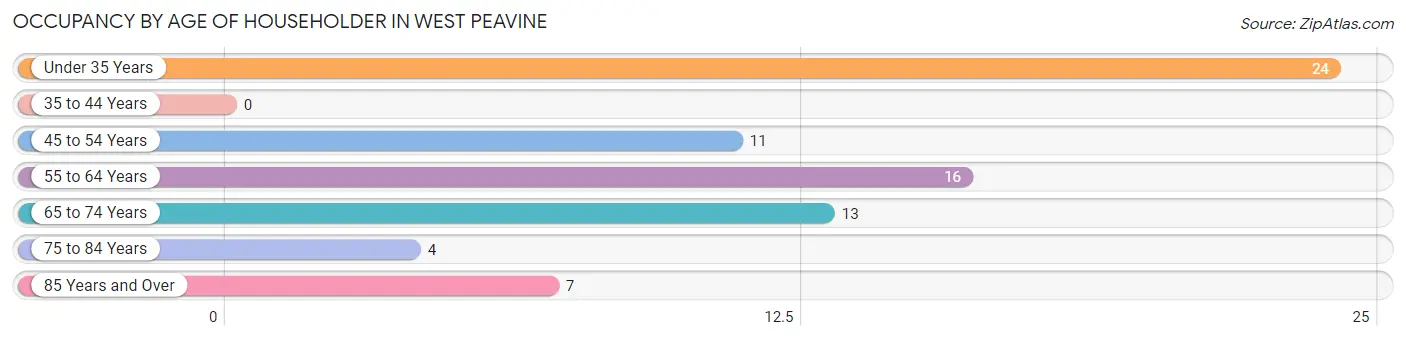
| Age Bracket | # Households | % Households |
| Under 35 Years | 24 | 32.0% |
| 35 to 44 Years | 0 | 0.0% |
| 45 to 54 Years | 11 | 14.7% |
| 55 to 64 Years | 16 | 21.3% |
| 65 to 74 Years | 13 | 17.3% |
| 75 to 84 Years | 4 | 5.3% |
| 85 Years and Over | 7 | 9.3% |
| Total | 75 | 100.0% |
Housing Finances in West Peavine
Median Income by Occupancy in West Peavine
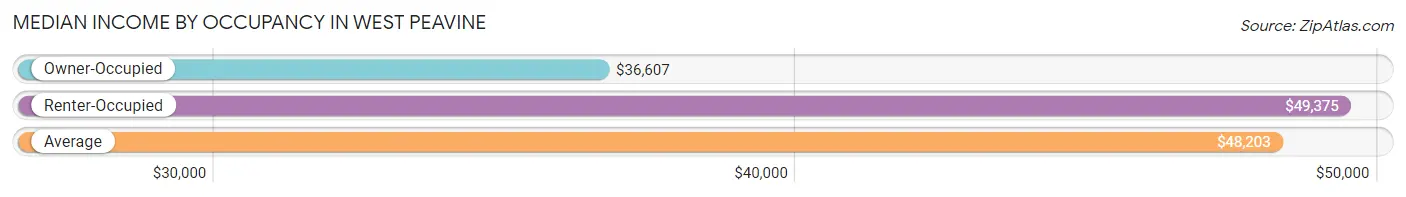
| Occupancy Type | # Households | Median Income |
| Owner-Occupied | 47 (62.7%) | $36,607 |
| Renter-Occupied | 28 (37.3%) | $49,375 |
| Average | 75 (100.0%) | $48,203 |
Occupancy by Householder Income Bracket in West Peavine
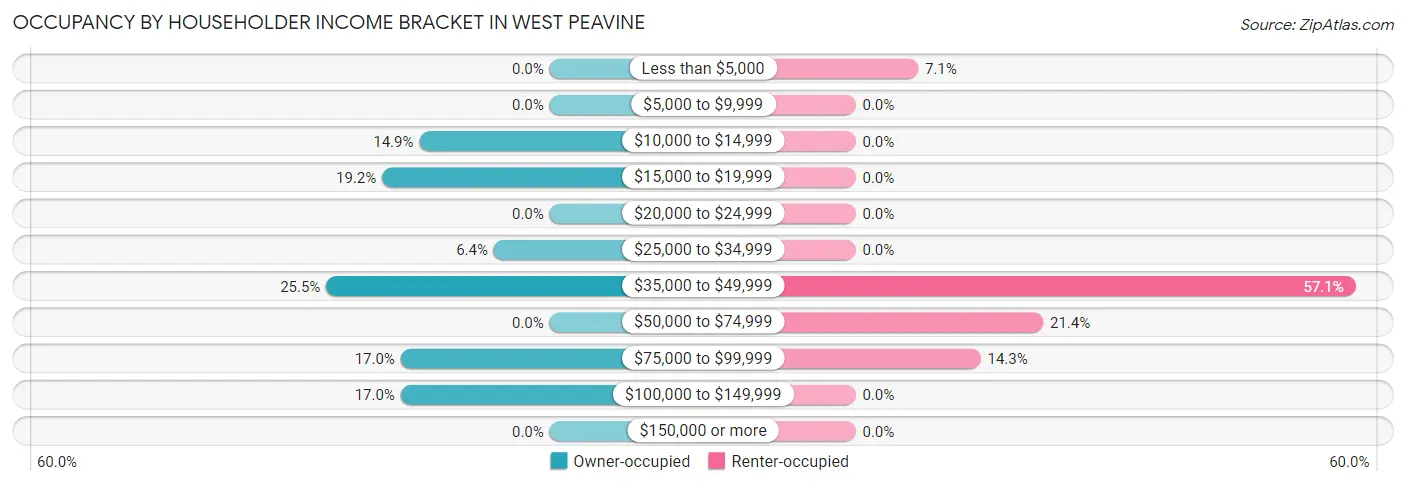
| Income Bracket | Owner-occupied | Renter-occupied |
| Less than $5,000 | 0 (0.0%) | 2 (7.1%) |
| $5,000 to $9,999 | 0 (0.0%) | 0 (0.0%) |
| $10,000 to $14,999 | 7 (14.9%) | 0 (0.0%) |
| $15,000 to $19,999 | 9 (19.2%) | 0 (0.0%) |
| $20,000 to $24,999 | 0 (0.0%) | 0 (0.0%) |
| $25,000 to $34,999 | 3 (6.4%) | 0 (0.0%) |
| $35,000 to $49,999 | 12 (25.5%) | 16 (57.1%) |
| $50,000 to $74,999 | 0 (0.0%) | 6 (21.4%) |
| $75,000 to $99,999 | 8 (17.0%) | 4 (14.3%) |
| $100,000 to $149,999 | 8 (17.0%) | 0 (0.0%) |
| $150,000 or more | 0 (0.0%) | 0 (0.0%) |
| Total | 47 (100.0%) | 28 (100.0%) |
Monthly Housing Cost Tiers in West Peavine
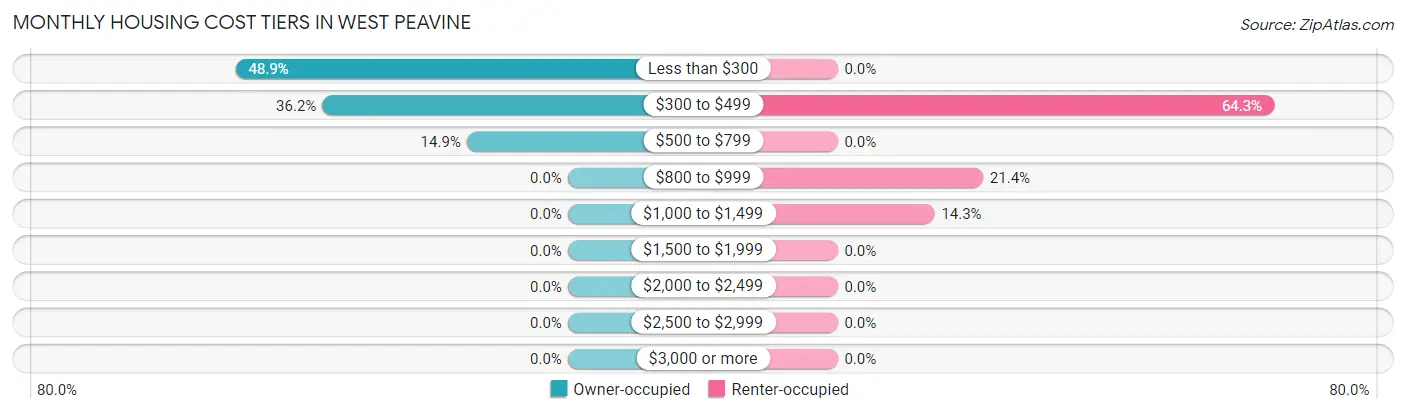
| Monthly Cost | Owner-occupied | Renter-occupied |
| Less than $300 | 23 (48.9%) | 0 (0.0%) |
| $300 to $499 | 17 (36.2%) | 18 (64.3%) |
| $500 to $799 | 7 (14.9%) | 0 (0.0%) |
| $800 to $999 | 0 (0.0%) | 6 (21.4%) |
| $1,000 to $1,499 | 0 (0.0%) | 4 (14.3%) |
| $1,500 to $1,999 | 0 (0.0%) | 0 (0.0%) |
| $2,000 to $2,499 | 0 (0.0%) | 0 (0.0%) |
| $2,500 to $2,999 | 0 (0.0%) | 0 (0.0%) |
| $3,000 or more | 0 (0.0%) | 0 (0.0%) |
| Total | 47 (100.0%) | 28 (100.0%) |
Physical Housing Characteristics in West Peavine
Housing Structures in West Peavine
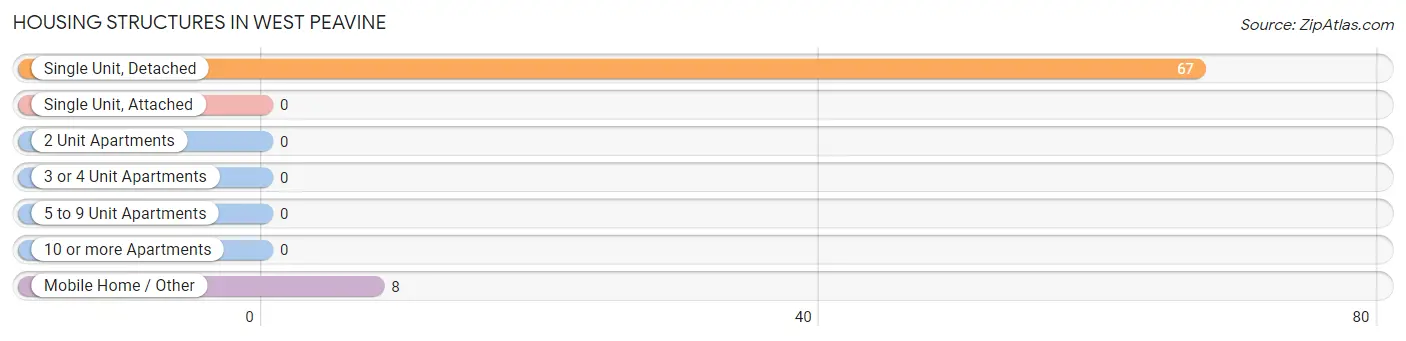
| Structure Type | # Housing Units | % Housing Units |
| Single Unit, Detached | 67 | 89.3% |
| Single Unit, Attached | 0 | 0.0% |
| 2 Unit Apartments | 0 | 0.0% |
| 3 or 4 Unit Apartments | 0 | 0.0% |
| 5 to 9 Unit Apartments | 0 | 0.0% |
| 10 or more Apartments | 0 | 0.0% |
| Mobile Home / Other | 8 | 10.7% |
| Total | 75 | 100.0% |
Housing Structures by Occupancy in West Peavine
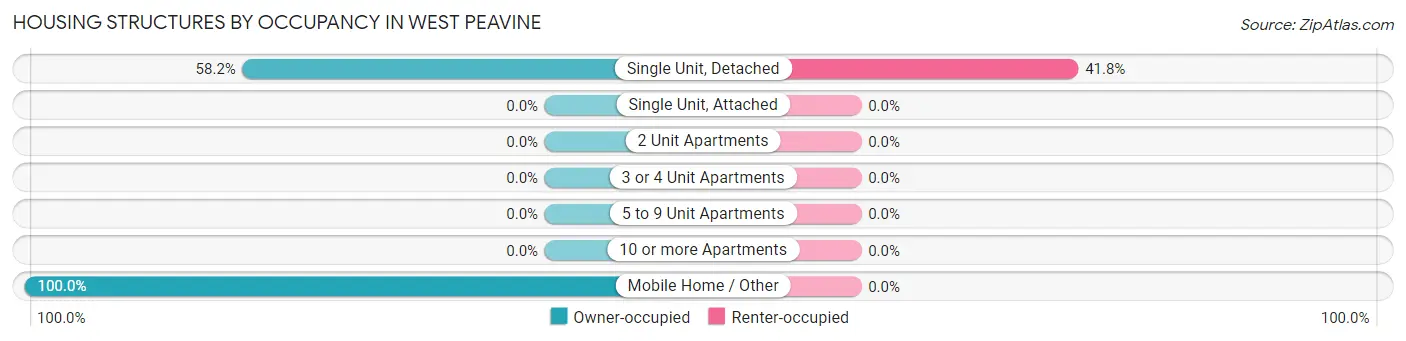
| Structure Type | Owner-occupied | Renter-occupied |
| Single Unit, Detached | 39 (58.2%) | 28 (41.8%) |
| Single Unit, Attached | 0 (0.0%) | 0 (0.0%) |
| 2 Unit Apartments | 0 (0.0%) | 0 (0.0%) |
| 3 or 4 Unit Apartments | 0 (0.0%) | 0 (0.0%) |
| 5 to 9 Unit Apartments | 0 (0.0%) | 0 (0.0%) |
| 10 or more Apartments | 0 (0.0%) | 0 (0.0%) |
| Mobile Home / Other | 8 (100.0%) | 0 (0.0%) |
| Total | 47 (62.7%) | 28 (37.3%) |
Housing Structures by Number of Rooms in West Peavine
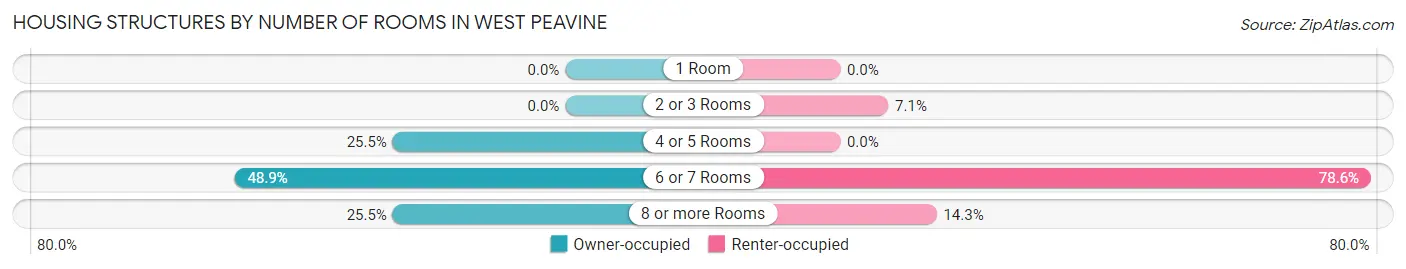
| Number of Rooms | Owner-occupied | Renter-occupied |
| 1 Room | 0 (0.0%) | 0 (0.0%) |
| 2 or 3 Rooms | 0 (0.0%) | 2 (7.1%) |
| 4 or 5 Rooms | 12 (25.5%) | 0 (0.0%) |
| 6 or 7 Rooms | 23 (48.9%) | 22 (78.6%) |
| 8 or more Rooms | 12 (25.5%) | 4 (14.3%) |
| Total | 47 (100.0%) | 28 (100.0%) |
Housing Structure by Heating Type in West Peavine
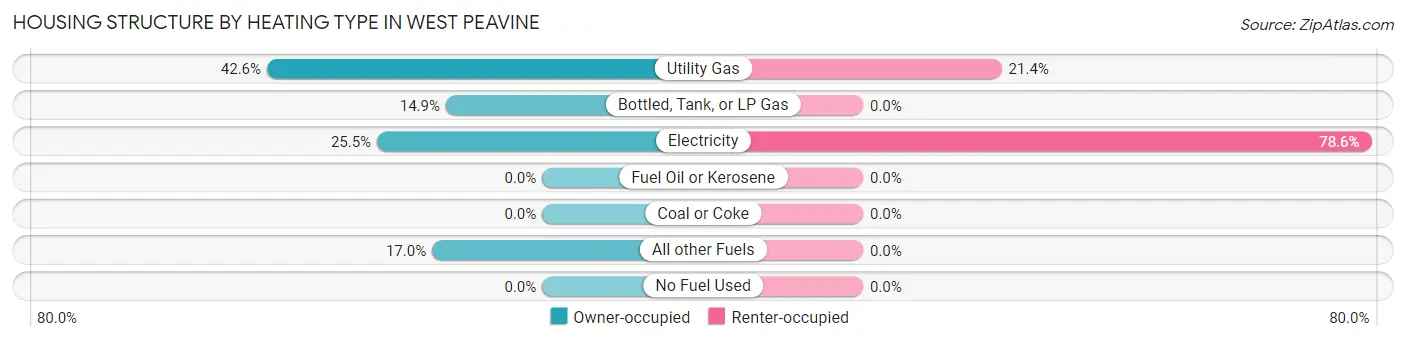
| Heating Type | Owner-occupied | Renter-occupied |
| Utility Gas | 20 (42.5%) | 6 (21.4%) |
| Bottled, Tank, or LP Gas | 7 (14.9%) | 0 (0.0%) |
| Electricity | 12 (25.5%) | 22 (78.6%) |
| Fuel Oil or Kerosene | 0 (0.0%) | 0 (0.0%) |
| Coal or Coke | 0 (0.0%) | 0 (0.0%) |
| All other Fuels | 8 (17.0%) | 0 (0.0%) |
| No Fuel Used | 0 (0.0%) | 0 (0.0%) |
| Total | 47 (100.0%) | 28 (100.0%) |
Household Vehicle Usage in West Peavine
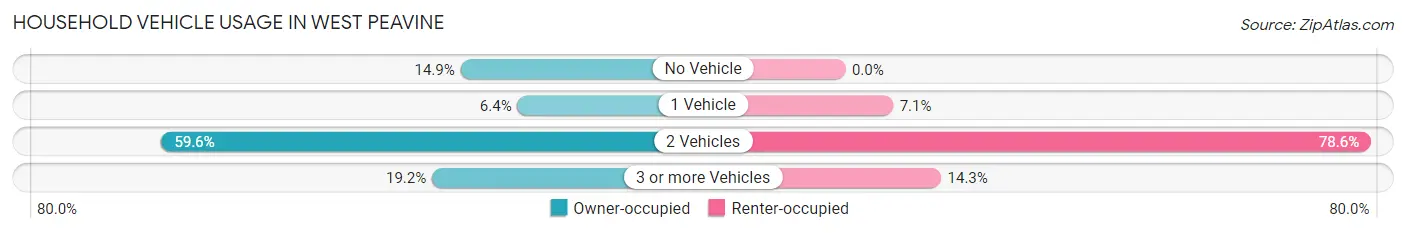
| Vehicles per Household | Owner-occupied | Renter-occupied |
| No Vehicle | 7 (14.9%) | 0 (0.0%) |
| 1 Vehicle | 3 (6.4%) | 2 (7.1%) |
| 2 Vehicles | 28 (59.6%) | 22 (78.6%) |
| 3 or more Vehicles | 9 (19.2%) | 4 (14.3%) |
| Total | 47 (100.0%) | 28 (100.0%) |
Real Estate & Mortgages in West Peavine
Real Estate and Mortgage Overview in West Peavine
| Characteristic | Without Mortgage | With Mortgage |
| Housing Units | 47 | 0 |
| Median Property Value | $129,200 | $0 |
| Median Household Income | $36,607 | $0 |
| Monthly Housing Costs | $305 | $0 |
| Real Estate Taxes | $199 | $0 |
Property Value by Mortgage Status in West Peavine
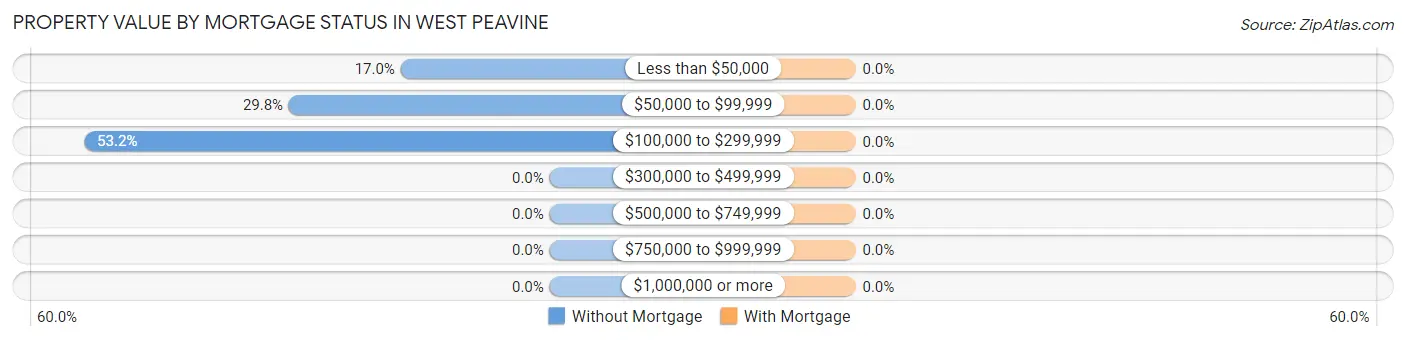
| Property Value | Without Mortgage | With Mortgage |
| Less than $50,000 | 8 (17.0%) | 0 (0.0%) |
| $50,000 to $99,999 | 14 (29.8%) | 0 (0.0%) |
| $100,000 to $299,999 | 25 (53.2%) | 0 (0.0%) |
| $300,000 to $499,999 | 0 (0.0%) | 0 (0.0%) |
| $500,000 to $749,999 | 0 (0.0%) | 0 (0.0%) |
| $750,000 to $999,999 | 0 (0.0%) | 0 (0.0%) |
| $1,000,000 or more | 0 (0.0%) | 0 (0.0%) |
| Total | 47 (100.0%) | 0 (0.0%) |
Household Income by Mortgage Status in West Peavine
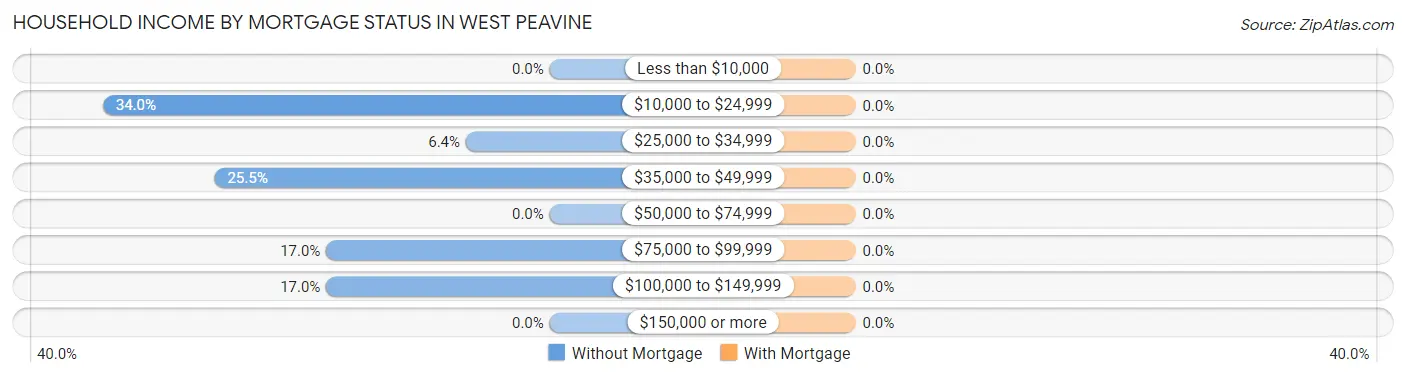
| Household Income | Without Mortgage | With Mortgage |
| Less than $10,000 | 0 (0.0%) | 0 (0.0%) |
| $10,000 to $24,999 | 16 (34.0%) | 0 (0.0%) |
| $25,000 to $34,999 | 3 (6.4%) | 0 (0.0%) |
| $35,000 to $49,999 | 12 (25.5%) | 0 (0.0%) |
| $50,000 to $74,999 | 0 (0.0%) | 0 (0.0%) |
| $75,000 to $99,999 | 8 (17.0%) | 0 (0.0%) |
| $100,000 to $149,999 | 8 (17.0%) | 0 (0.0%) |
| $150,000 or more | 0 (0.0%) | 0 (0.0%) |
| Total | 47 (100.0%) | 0 (0.0%) |
Property Value to Household Income Ratio in West Peavine
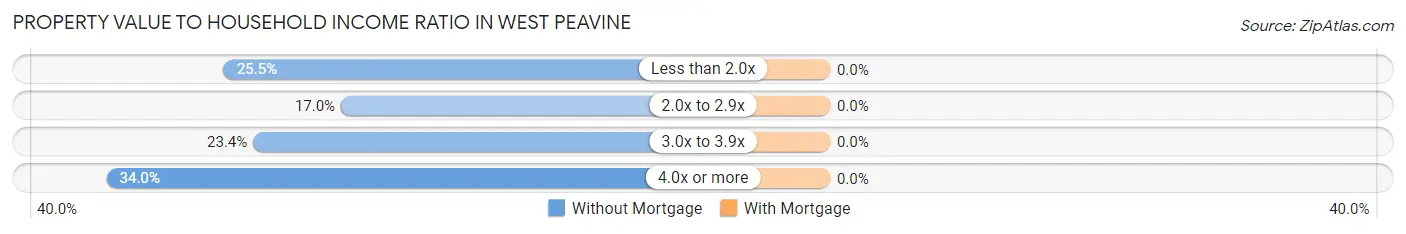
| Value-to-Income Ratio | Without Mortgage | With Mortgage |
| Less than 2.0x | 12 (25.5%) | 0 (0.0%) |
| 2.0x to 2.9x | 8 (17.0%) | 0 (0.0%) |
| 3.0x to 3.9x | 11 (23.4%) | 0 (0.0%) |
| 4.0x or more | 16 (34.0%) | 0 (0.0%) |
| Total | 47 (100.0%) | 0 (0.0%) |
Real Estate Taxes by Mortgage Status in West Peavine
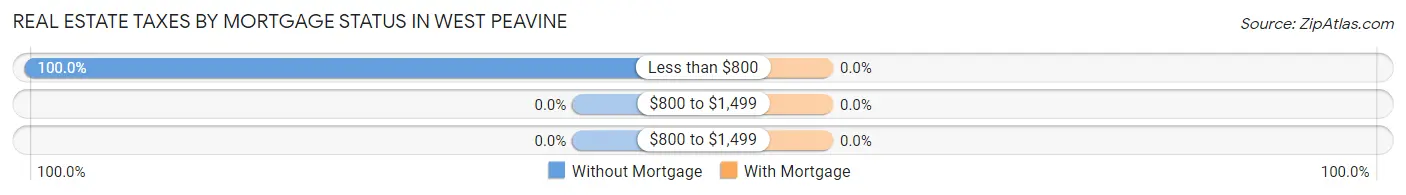
| Property Taxes | Without Mortgage | With Mortgage |
| Less than $800 | 47 (100.0%) | 0 (0.0%) |
| $800 to $1,499 | 0 (0.0%) | 0 (0.0%) |
| $800 to $1,499 | 0 (0.0%) | 0 (0.0%) |
| Total | 47 (100.0%) | 0 (0.0%) |
Health & Disability in West Peavine
Health Insurance Coverage by Age in West Peavine
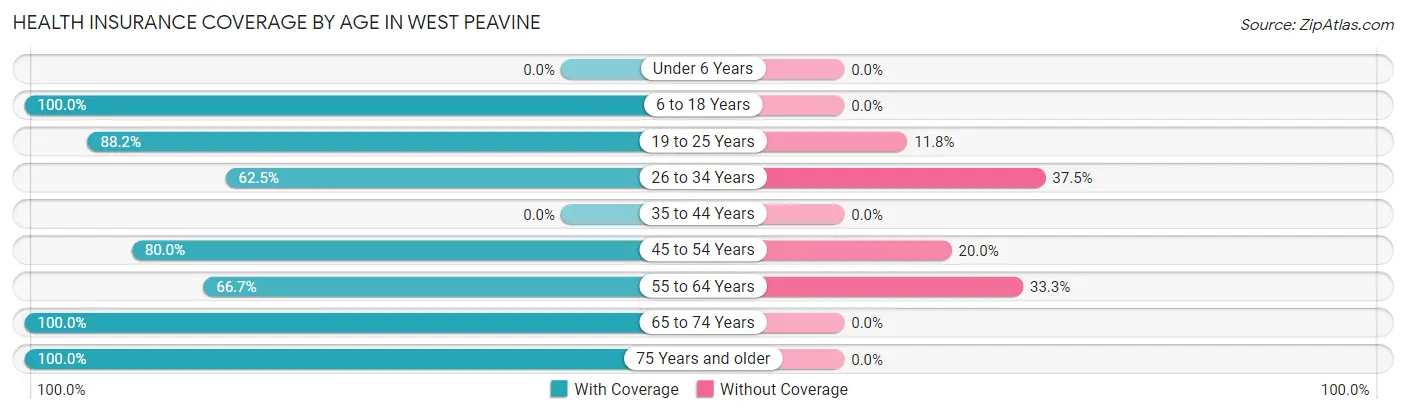
| Age Bracket | With Coverage | Without Coverage |
| Under 6 Years | 0 (0.0%) | 0 (0.0%) |
| 6 to 18 Years | 7 (100.0%) | 0 (0.0%) |
| 19 to 25 Years | 15 (88.2%) | 2 (11.8%) |
| 26 to 34 Years | 20 (62.5%) | 12 (37.5%) |
| 35 to 44 Years | 0 (0.0%) | 0 (0.0%) |
| 45 to 54 Years | 12 (80.0%) | 3 (20.0%) |
| 55 to 64 Years | 18 (66.7%) | 9 (33.3%) |
| 65 to 74 Years | 16 (100.0%) | 0 (0.0%) |
| 75 Years and older | 17 (100.0%) | 0 (0.0%) |
| Total | 105 (80.1%) | 26 (19.9%) |
Health Insurance Coverage by Citizenship Status in West Peavine
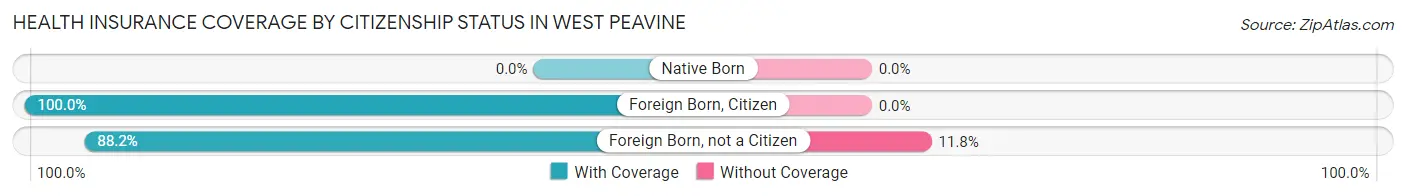
| Citizenship Status | With Coverage | Without Coverage |
| Native Born | 0 (0.0%) | 0 (0.0%) |
| Foreign Born, Citizen | 7 (100.0%) | 0 (0.0%) |
| Foreign Born, not a Citizen | 15 (88.2%) | 2 (11.8%) |
Health Insurance Coverage by Household Income in West Peavine
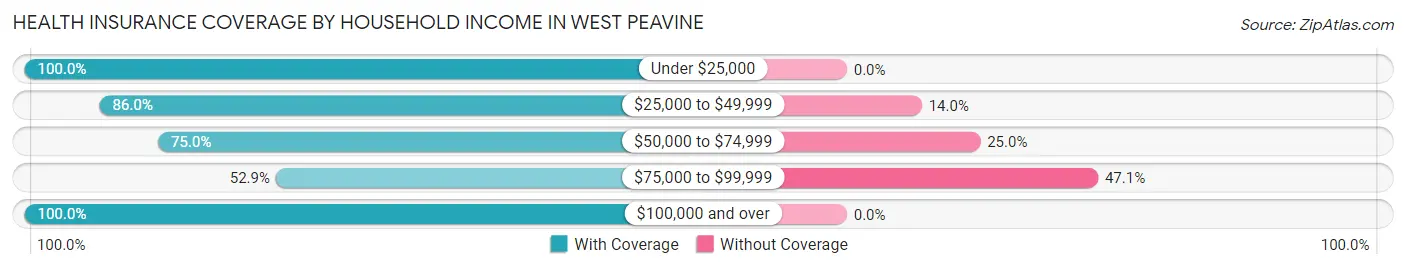
| Household Income | With Coverage | Without Coverage |
| Under $25,000 | 18 (100.0%) | 0 (0.0%) |
| $25,000 to $49,999 | 49 (86.0%) | 8 (14.0%) |
| $50,000 to $74,999 | 6 (75.0%) | 2 (25.0%) |
| $75,000 to $99,999 | 18 (52.9%) | 16 (47.1%) |
| $100,000 and over | 14 (100.0%) | 0 (0.0%) |
Public vs Private Health Insurance Coverage by Age in West Peavine
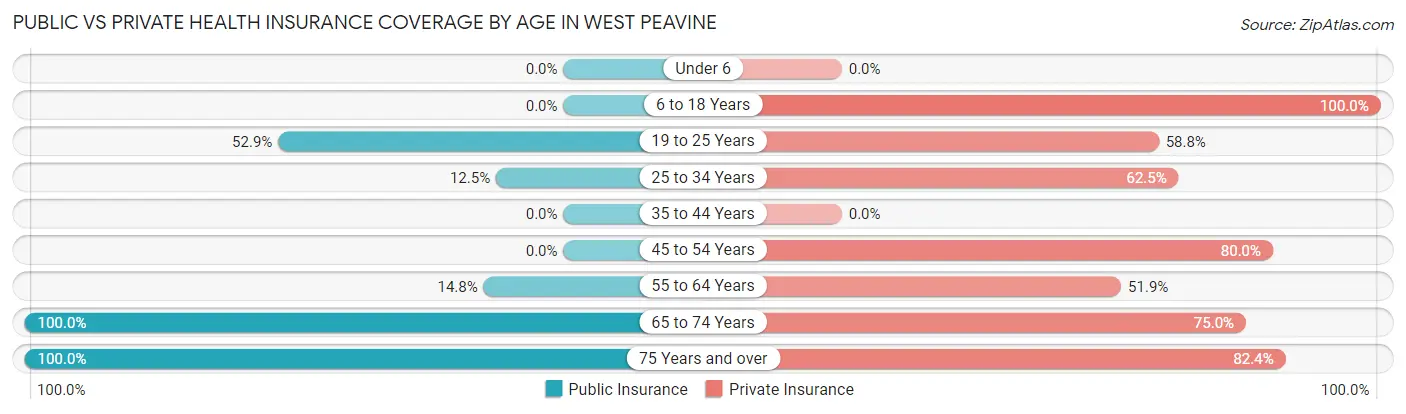
| Age Bracket | Public Insurance | Private Insurance |
| Under 6 | 0 (0.0%) | 0 (0.0%) |
| 6 to 18 Years | 0 (0.0%) | 7 (100.0%) |
| 19 to 25 Years | 9 (52.9%) | 10 (58.8%) |
| 25 to 34 Years | 4 (12.5%) | 20 (62.5%) |
| 35 to 44 Years | 0 (0.0%) | 0 (0.0%) |
| 45 to 54 Years | 0 (0.0%) | 12 (80.0%) |
| 55 to 64 Years | 4 (14.8%) | 14 (51.8%) |
| 65 to 74 Years | 16 (100.0%) | 12 (75.0%) |
| 75 Years and over | 17 (100.0%) | 14 (82.4%) |
| Total | 50 (38.2%) | 89 (67.9%) |
Disability Status by Sex by Age in West Peavine
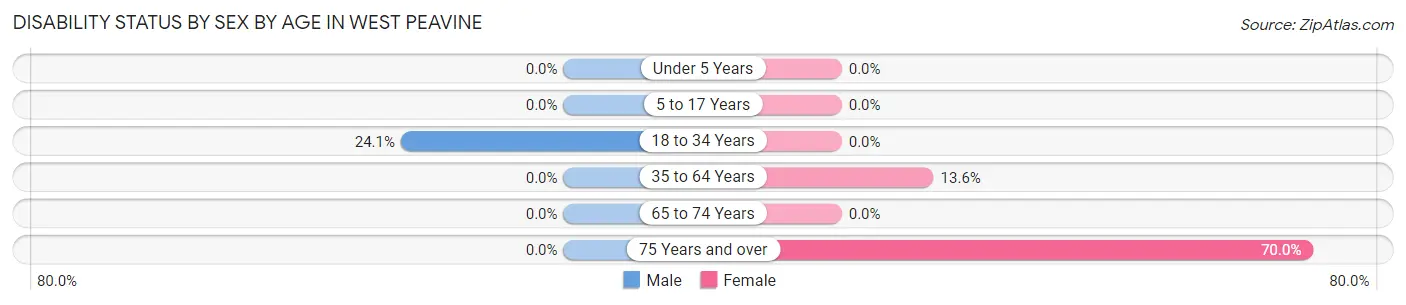
| Age Bracket | Male | Female |
| Under 5 Years | 0 (0.0%) | 0 (0.0%) |
| 5 to 17 Years | 0 (0.0%) | 0 (0.0%) |
| 18 to 34 Years | 7 (24.1%) | 0 (0.0%) |
| 35 to 64 Years | 0 (0.0%) | 3 (13.6%) |
| 65 to 74 Years | 0 (0.0%) | 0 (0.0%) |
| 75 Years and over | 0 (0.0%) | 7 (70.0%) |
Disability Class by Sex by Age in West Peavine
Disability Class: Hearing Difficulty
| Age Bracket | Male | Female |
| Under 5 Years | 0 (0.0%) | 0 (0.0%) |
| 5 to 17 Years | 0 (0.0%) | 0 (0.0%) |
| 18 to 34 Years | 0 (0.0%) | 0 (0.0%) |
| 35 to 64 Years | 0 (0.0%) | 0 (0.0%) |
| 65 to 74 Years | 0 (0.0%) | 0 (0.0%) |
| 75 Years and over | 0 (0.0%) | 0 (0.0%) |
Disability Class: Vision Difficulty
| Age Bracket | Male | Female |
| Under 5 Years | 0 (0.0%) | 0 (0.0%) |
| 5 to 17 Years | 0 (0.0%) | 0 (0.0%) |
| 18 to 34 Years | 0 (0.0%) | 0 (0.0%) |
| 35 to 64 Years | 0 (0.0%) | 0 (0.0%) |
| 65 to 74 Years | 0 (0.0%) | 0 (0.0%) |
| 75 Years and over | 0 (0.0%) | 0 (0.0%) |
Disability Class: Cognitive Difficulty
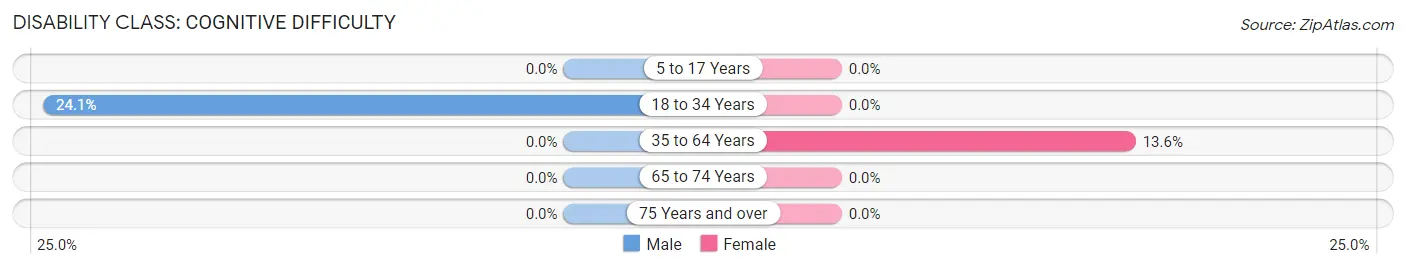
| Age Bracket | Male | Female |
| 5 to 17 Years | 0 (0.0%) | 0 (0.0%) |
| 18 to 34 Years | 7 (24.1%) | 0 (0.0%) |
| 35 to 64 Years | 0 (0.0%) | 3 (13.6%) |
| 65 to 74 Years | 0 (0.0%) | 0 (0.0%) |
| 75 Years and over | 0 (0.0%) | 0 (0.0%) |
Disability Class: Ambulatory Difficulty
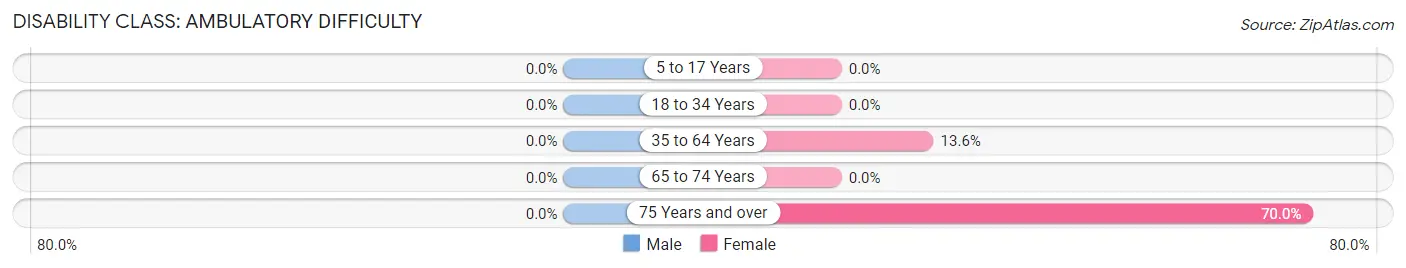
| Age Bracket | Male | Female |
| 5 to 17 Years | 0 (0.0%) | 0 (0.0%) |
| 18 to 34 Years | 0 (0.0%) | 0 (0.0%) |
| 35 to 64 Years | 0 (0.0%) | 3 (13.6%) |
| 65 to 74 Years | 0 (0.0%) | 0 (0.0%) |
| 75 Years and over | 0 (0.0%) | 7 (70.0%) |
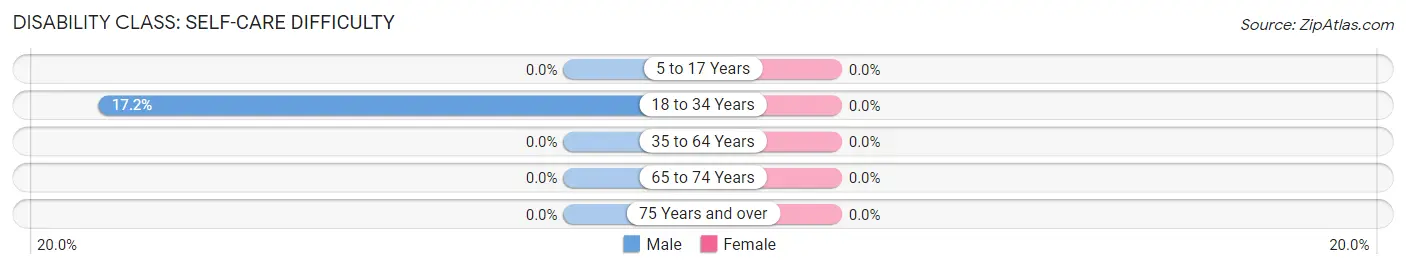
Disability Class: Self-Care Difficulty
| Age Bracket | Male | Female |
| 5 to 17 Years | 0 (0.0%) | 0 (0.0%) |
| 18 to 34 Years | 5 (17.2%) | 0 (0.0%) |
| 35 to 64 Years | 0 (0.0%) | 0 (0.0%) |
| 65 to 74 Years | 0 (0.0%) | 0 (0.0%) |
| 75 Years and over | 0 (0.0%) | 0 (0.0%) |
Technology Access in West Peavine
Computing Device Access in West Peavine
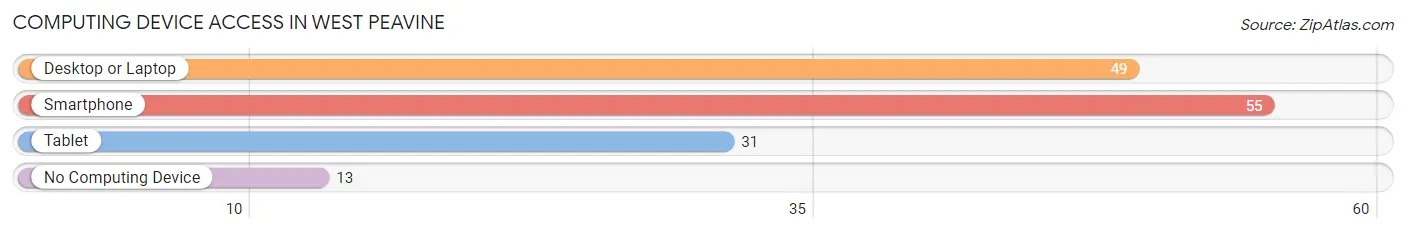
| Device Type | # Households | % Households |
| Desktop or Laptop | 49 | 65.3% |
| Smartphone | 55 | 73.3% |
| Tablet | 31 | 41.3% |
| No Computing Device | 13 | 17.3% |
| Total | 75 | 100.0% |
Internet Access in West Peavine
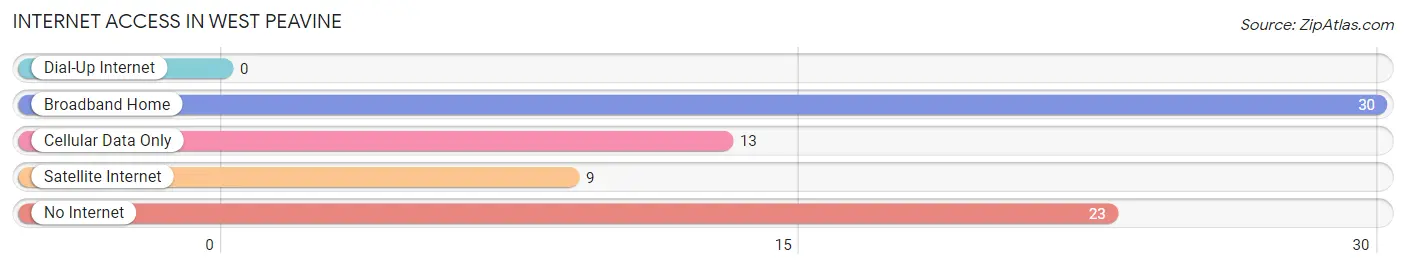
| Internet Type | # Households | % Households |
| Dial-Up Internet | 0 | 0.0% |
| Broadband Home | 30 | 40.0% |
| Cellular Data Only | 13 | 17.3% |
| Satellite Internet | 9 | 12.0% |
| No Internet | 23 | 30.7% |
| Total | 75 | 100.0% |
West Peavine Summary
West Peavine is a small unincorporated community located in the southeastern corner of Oklahoma, in the United States. It is situated in the foothills of the Ouachita Mountains, in the foothills of the Kiamichi Mountains, and is part of the Choctaw Nation. The community is located in Pushmataha County, and is approximately 10 miles south of the county seat of Antlers.
History
West Peavine was established in the late 1800s, when the Choctaw Nation was divided into two districts, the Moshulatubbee District and the Apukshunnubbee District. The area was originally part of the Apukshunnubbee District, and was known as the Peavine Community. The community was named after the Peavine Creek, which runs through the area.
In the early 1900s, the community was divided into two separate communities, East Peavine and West Peavine. The two communities were separated by a railroad line, and the West Peavine community was located on the west side of the line.
Geography
West Peavine is located in the southeastern corner of Oklahoma, in the foothills of the Ouachita Mountains and the Kiamichi Mountains. The community is situated in Pushmataha County, and is approximately 10 miles south of the county seat of Antlers.
The area is characterized by rolling hills and valleys, with the Peavine Creek running through the area. The climate is generally mild, with hot summers and cold winters.
Economy
The economy of West Peavine is largely based on agriculture and forestry. The area is home to several small farms, which produce a variety of crops, including corn, soybeans, wheat, and hay. The area is also home to several timber companies, which harvest timber from the surrounding forests.
In addition to agriculture and forestry, the area is home to several small businesses, including convenience stores, restaurants, and gas stations. The area is also home to several churches, and is served by the West Peavine School District.
Demographics
As of the 2010 census, the population of West Peavine was 1,072. The racial makeup of the community was 95.3% White, 0.9% African American, 0.7% Native American, 0.2% Asian, 0.1% Pacific Islander, and 2.8% from other races. The median household income was $30,938, and the median family income was $35,625.
Conclusion
West Peavine is a small unincorporated community located in the southeastern corner of Oklahoma, in the United States. It is situated in the foothills of the Ouachita Mountains, in the foothills of the Kiamichi Mountains, and is part of the Choctaw Nation. The economy of West Peavine is largely based on agriculture and forestry, and the area is home to several small businesses. The population of West Peavine was 1,072 as of the 2010 census, and the median household income was $30,938.
Common Questions
What is Per Capita Income in West Peavine?
Per Capita income in West Peavine is $23,756.
What is the Median Family Income in West Peavine?
Median Family Income in West Peavine is $49,609.
What is the Median Household income in West Peavine?
Median Household Income in West Peavine is $48,203.
What is Income or Wage Gap in West Peavine?
Income or Wage Gap in West Peavine is 20.5%.
Women in West Peavine earn 79.5 cents for every dollar earned by a man.
What is Inequality or Gini Index in West Peavine?
Inequality or Gini Index in West Peavine is 0.33.
What is the Total Population of West Peavine?
Total Population of West Peavine is 131.
What is the Total Male Population of West Peavine?
Total Male Population of West Peavine is 65.
What is the Total Female Population of West Peavine?
Total Female Population of West Peavine is 66.
What is the Ratio of Males per 100 Females in West Peavine?
There are 98.48 Males per 100 Females in West Peavine.
What is the Ratio of Females per 100 Males in West Peavine?
There are 101.54 Females per 100 Males in West Peavine.
What is the Median Population Age in West Peavine?
Median Population Age in West Peavine is 48.8 Years.
What is the Average Family Size in West Peavine
Average Family Size in West Peavine is 1.9 People.
What is the Average Household Size in West Peavine
Average Household Size in West Peavine is 1.8 People.
How Large is the Labor Force in West Peavine?
There are 71 People in the Labor Forcein in West Peavine.
What is the Percentage of People in the Labor Force in West Peavine?
54.2% of People are in the Labor Force in West Peavine.