Waynoka, OK Map & Demographics
Waynoka Map
Waynoka Overview
$24,663
PER CAPITA INCOME
$66,667
AVG FAMILY INCOME
$49,250
AVG HOUSEHOLD INCOME
42.0%
WAGE / INCOME GAP [ % ]
58.0¢/ $1
WAGE / INCOME GAP [ $ ]
0.42
INEQUALITY / GINI INDEX
760
TOTAL POPULATION
387
MALE POPULATION
373
FEMALE POPULATION
103.75
MALES / 100 FEMALES
96.38
FEMALES / 100 MALES
36.3
MEDIAN AGE
3.4
AVG FAMILY SIZE
2.6
AVG HOUSEHOLD SIZE
308
LABOR FORCE [ PEOPLE ]
52.3%
PERCENT IN LABOR FORCE
7.5%
UNEMPLOYMENT RATE
Waynoka Zip Codes
Waynoka Area Codes
Income in Waynoka
Income Overview in Waynoka
Per Capita Income in Waynoka is $24,663, while median incomes of families and households are $66,667 and $49,250 respectively.
| Characteristic | Number | Measure |
| Per Capita Income | 760 | $24,663 |
| Median Family Income | 170 | $66,667 |
| Mean Family Income | 170 | $78,919 |
| Median Household Income | 270 | $49,250 |
| Mean Household Income | 270 | $63,411 |
| Income Deficit | 170 | $0 |
| Wage / Income Gap (%) | 760 | 42.00% |
| Wage / Income Gap ($) | 760 | 58.00¢ per $1 |
| Gini / Inequality Index | 760 | 0.42 |
Earnings by Sex in Waynoka
Average Earnings in Waynoka are $29,861, $37,500 for men and $21,750 for women, a difference of 42.0%.
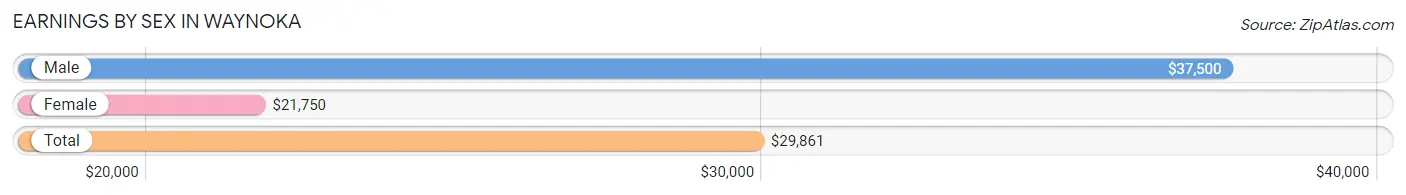
| Sex | Number | Average Earnings |
| Male | 158 (49.5%) | $37,500 |
| Female | 161 (50.5%) | $21,750 |
| Total | 319 (100.0%) | $29,861 |
Earnings by Sex by Income Bracket in Waynoka
The most common earnings brackets in Waynoka are $25,000 to $29,999 for men (33 | 20.9%) and $22,500 to $24,999 for women (21 | 13.0%).
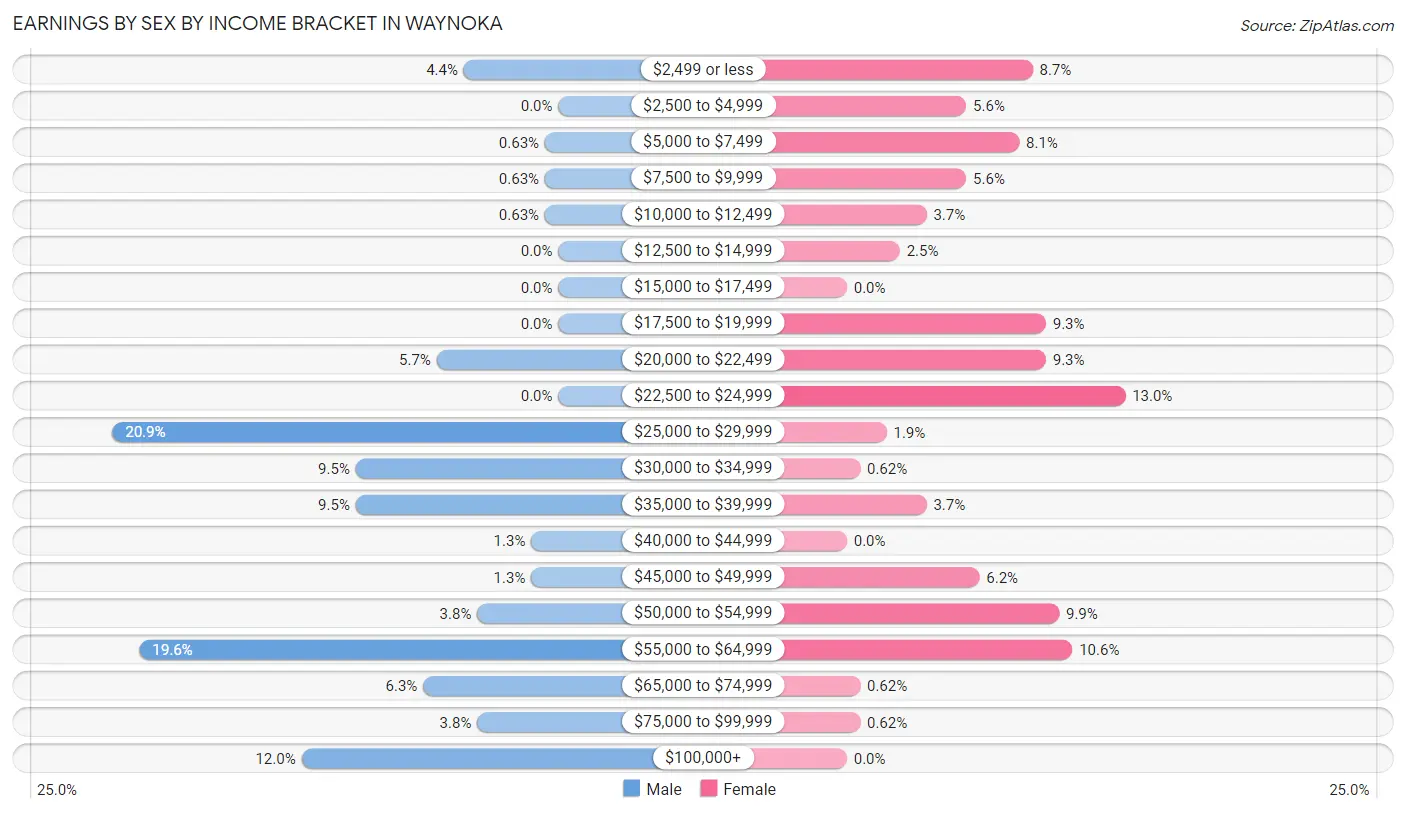
| Income | Male | Female |
| $2,499 or less | 7 (4.4%) | 14 (8.7%) |
| $2,500 to $4,999 | 0 (0.0%) | 9 (5.6%) |
| $5,000 to $7,499 | 1 (0.6%) | 13 (8.1%) |
| $7,500 to $9,999 | 1 (0.6%) | 9 (5.6%) |
| $10,000 to $12,499 | 1 (0.6%) | 6 (3.7%) |
| $12,500 to $14,999 | 0 (0.0%) | 4 (2.5%) |
| $15,000 to $17,499 | 0 (0.0%) | 0 (0.0%) |
| $17,500 to $19,999 | 0 (0.0%) | 15 (9.3%) |
| $20,000 to $22,499 | 9 (5.7%) | 15 (9.3%) |
| $22,500 to $24,999 | 0 (0.0%) | 21 (13.0%) |
| $25,000 to $29,999 | 33 (20.9%) | 3 (1.9%) |
| $30,000 to $34,999 | 15 (9.5%) | 1 (0.6%) |
| $35,000 to $39,999 | 15 (9.5%) | 6 (3.7%) |
| $40,000 to $44,999 | 2 (1.3%) | 0 (0.0%) |
| $45,000 to $49,999 | 2 (1.3%) | 10 (6.2%) |
| $50,000 to $54,999 | 6 (3.8%) | 16 (9.9%) |
| $55,000 to $64,999 | 31 (19.6%) | 17 (10.6%) |
| $65,000 to $74,999 | 10 (6.3%) | 1 (0.6%) |
| $75,000 to $99,999 | 6 (3.8%) | 1 (0.6%) |
| $100,000+ | 19 (12.0%) | 0 (0.0%) |
| Total | 158 (100.0%) | 161 (100.0%) |
Earnings by Sex by Educational Attainment in Waynoka
Average earnings in Waynoka are $45,000 for men and $24,167 for women, a difference of 46.3%. Men with an educational attainment of bachelor's degree enjoy the highest average annual earnings of $60,682, while those with less than high school education earn the least with $32,708. Women with an educational attainment of bachelor's degree earn the most with the average annual earnings of $54,375, while those with college or associate's degree education have the smallest earnings of $20,000.
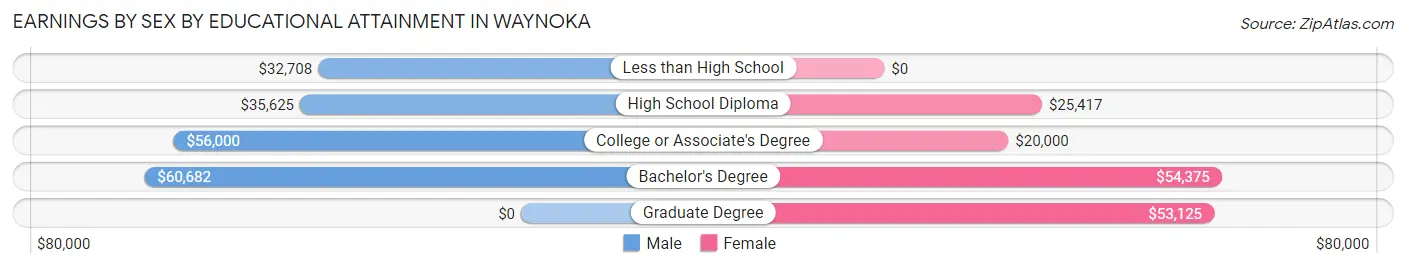
| Educational Attainment | Male Income | Female Income |
| Less than High School | $32,708 | $0 |
| High School Diploma | $35,625 | $25,417 |
| College or Associate's Degree | $56,000 | $20,000 |
| Bachelor's Degree | $60,682 | $54,375 |
| Graduate Degree | - | - |
| Total | $45,000 | $24,167 |
Family Income in Waynoka
Family Income Brackets in Waynoka
According to the Waynoka family income data, there are 39 families falling into the $100,000 to $149,999 income range, which is the most common income bracket and makes up 22.9% of all families. Conversely, the $10,000 to $14,999 income bracket is the least frequent group with only 1 families (0.6%) belonging to this category.
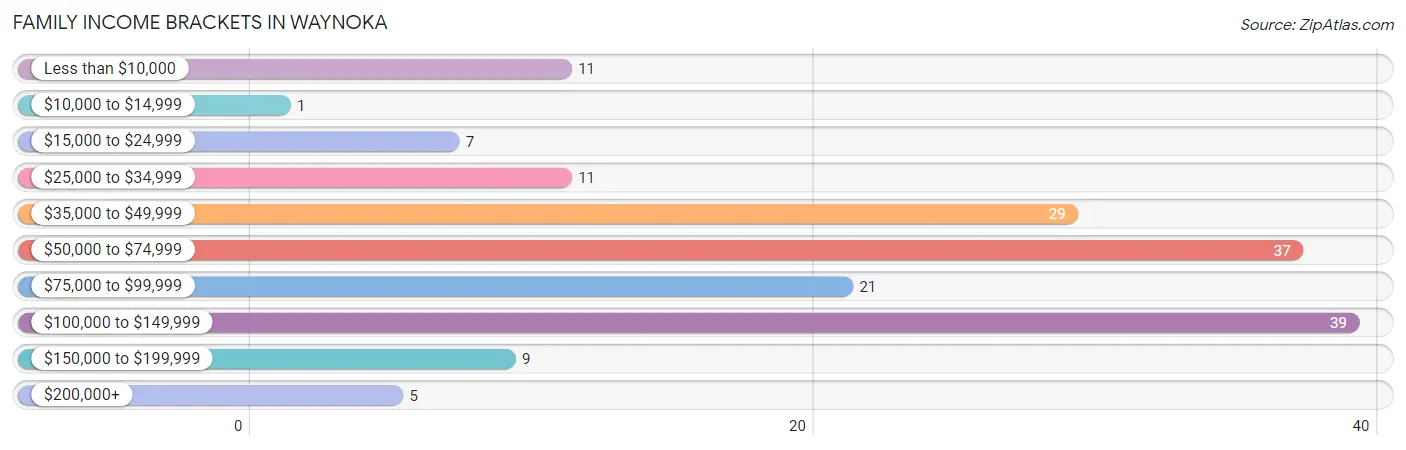
| Income Bracket | # Families | % Families |
| Less than $10,000 | 11 | 6.5% |
| $10,000 to $14,999 | 1 | 0.6% |
| $15,000 to $24,999 | 7 | 4.1% |
| $25,000 to $34,999 | 11 | 6.5% |
| $35,000 to $49,999 | 29 | 17.1% |
| $50,000 to $74,999 | 37 | 21.8% |
| $75,000 to $99,999 | 21 | 12.4% |
| $100,000 to $149,999 | 39 | 22.9% |
| $150,000 to $199,999 | 9 | 5.3% |
| $200,000+ | 5 | 2.9% |
Family Income by Famaliy Size in Waynoka
4-person families (15 | 8.8%) account for the highest median family income in Waynoka with $128,750 per family, while 2-person families (106 | 62.4%) have the highest median income of $33,875 per family member.
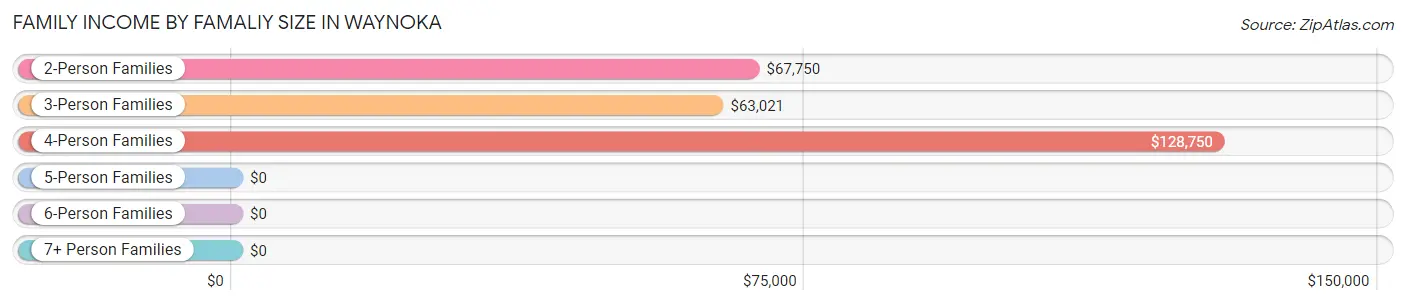
| Income Bracket | # Families | Median Income |
| 2-Person Families | 106 (62.4%) | $67,750 |
| 3-Person Families | 33 (19.4%) | $63,021 |
| 4-Person Families | 15 (8.8%) | $128,750 |
| 5-Person Families | 8 (4.7%) | $0 |
| 6-Person Families | 8 (4.7%) | $0 |
| 7+ Person Families | 0 (0.0%) | $0 |
| Total | 170 (100.0%) | $66,667 |
Family Income by Number of Earners in Waynoka
The median family income in Waynoka is $66,667, with families comprising 3+ earners (11) having the highest median family income of $128,906, while families with no earners (25) have the lowest median family income of $48,438, accounting for 6.5% and 14.7% of families, respectively.
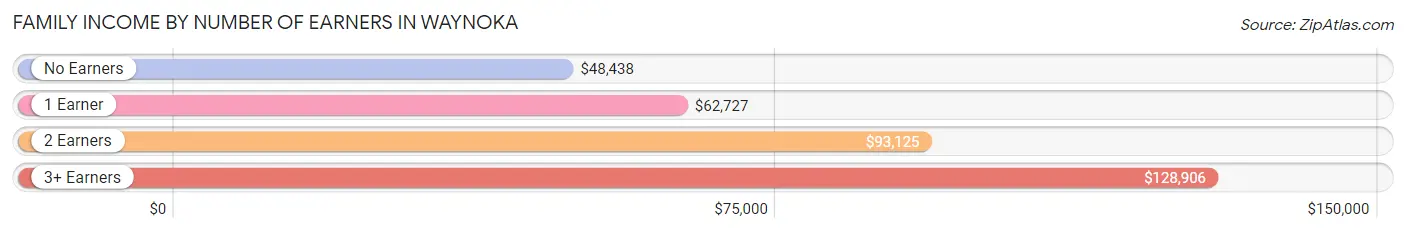
| Number of Earners | # Families | Median Income |
| No Earners | 25 (14.7%) | $48,438 |
| 1 Earner | 88 (51.8%) | $62,727 |
| 2 Earners | 46 (27.1%) | $93,125 |
| 3+ Earners | 11 (6.5%) | $128,906 |
| Total | 170 (100.0%) | $66,667 |
Household Income in Waynoka
Household Income Brackets in Waynoka
With 48 households falling in the category, the $50,000 to $74,999 income range is the most frequent in Waynoka, accounting for 17.8% of all households. In contrast, only 4 households (1.5%) fall into the $10,000 to $14,999 income bracket, making it the least populous group.
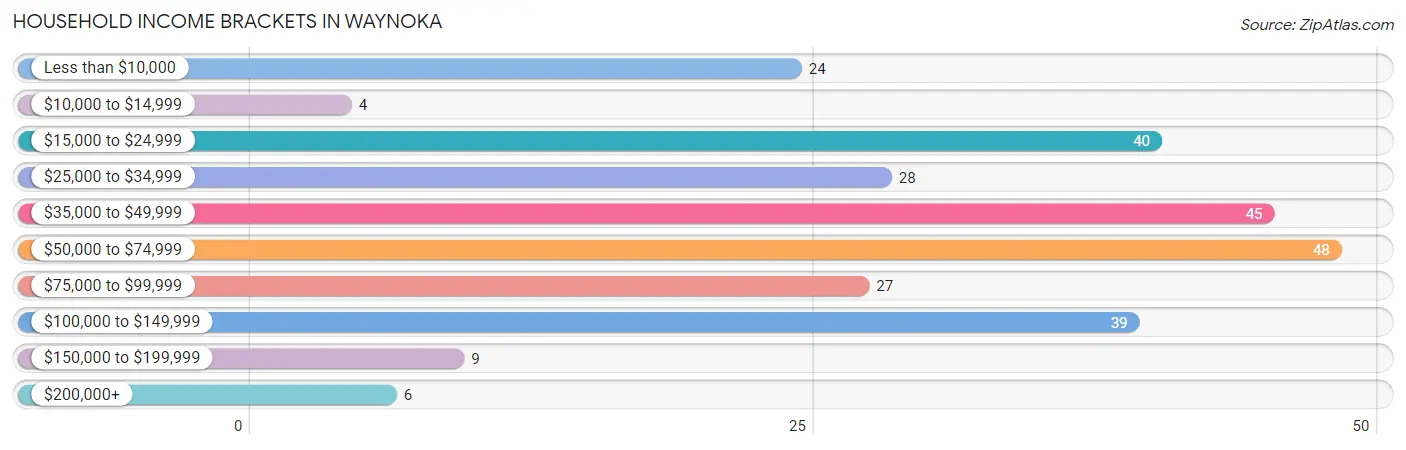
| Income Bracket | # Households | % Households |
| Less than $10,000 | 24 | 8.9% |
| $10,000 to $14,999 | 4 | 1.5% |
| $15,000 to $24,999 | 40 | 14.8% |
| $25,000 to $34,999 | 28 | 10.4% |
| $35,000 to $49,999 | 45 | 16.7% |
| $50,000 to $74,999 | 48 | 17.8% |
| $75,000 to $99,999 | 27 | 10.0% |
| $100,000 to $149,999 | 39 | 14.4% |
| $150,000 to $199,999 | 9 | 3.3% |
| $200,000+ | 6 | 2.2% |
Household Income by Householder Age in Waynoka
The median household income in Waynoka is $49,250, with the highest median household income of $62,841 found in the 25 to 44 years age bracket for the primary householder. A total of 87 households (32.2%) fall into this category. Meanwhile, the 15 to 24 years age bracket for the primary householder has the lowest median household income of $0, with 20 households (7.4%) in this group.
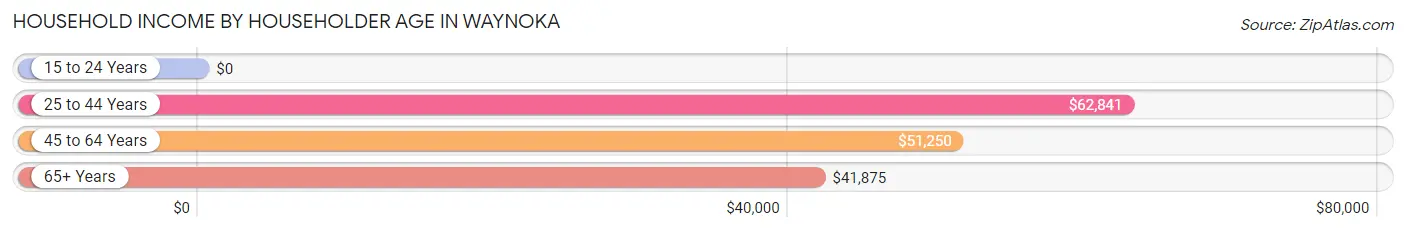
| Income Bracket | # Households | Median Income |
| 15 to 24 Years | 20 (7.4%) | $0 |
| 25 to 44 Years | 87 (32.2%) | $62,841 |
| 45 to 64 Years | 72 (26.7%) | $51,250 |
| 65+ Years | 91 (33.7%) | $41,875 |
| Total | 270 (100.0%) | $49,250 |
Poverty in Waynoka
Income Below Poverty by Sex and Age in Waynoka
With 30.5% poverty level for males and 24.3% for females among the residents of Waynoka, 16 and 17 year old males and under 5 year old females are the most vulnerable to poverty, with 58 males (96.7%) and 13 females (61.9%) in their respective age groups living below the poverty level.
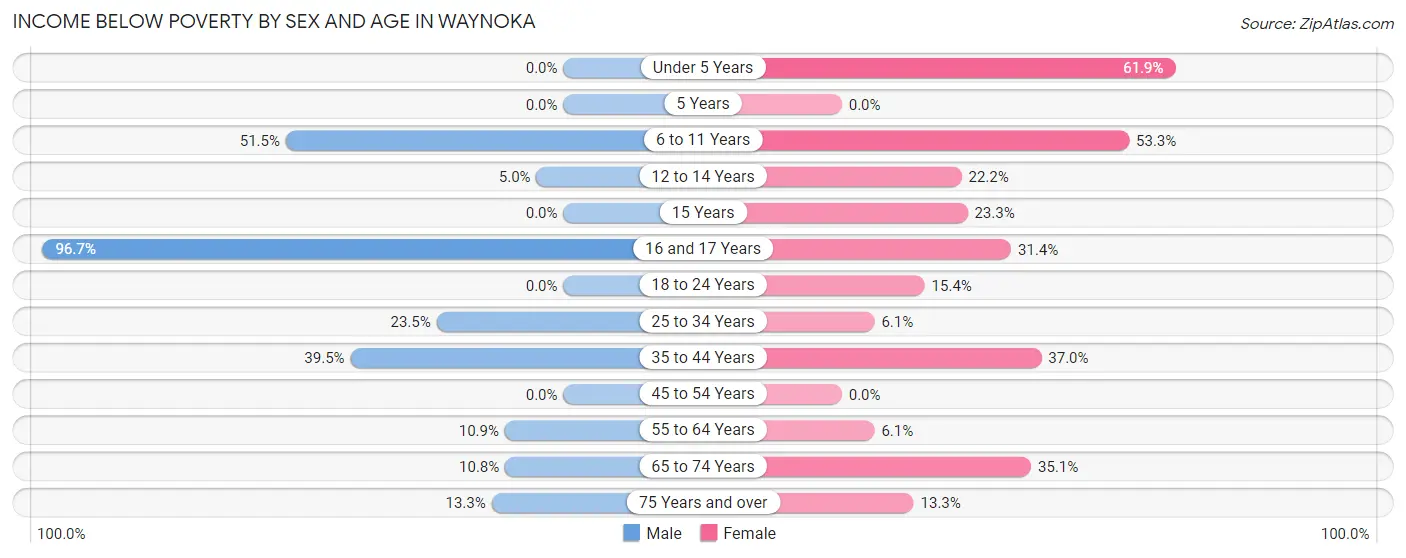
| Age Bracket | Male | Female |
| Under 5 Years | 0 (0.0%) | 13 (61.9%) |
| 5 Years | 0 (0.0%) | 0 (0.0%) |
| 6 to 11 Years | 17 (51.5%) | 8 (53.3%) |
| 12 to 14 Years | 1 (5.0%) | 4 (22.2%) |
| 15 Years | 0 (0.0%) | 7 (23.3%) |
| 16 and 17 Years | 58 (96.7%) | 11 (31.4%) |
| 18 to 24 Years | 0 (0.0%) | 2 (15.4%) |
| 25 to 34 Years | 12 (23.5%) | 2 (6.1%) |
| 35 to 44 Years | 17 (39.5%) | 20 (37.0%) |
| 45 to 54 Years | 0 (0.0%) | 0 (0.0%) |
| 55 to 64 Years | 5 (10.9%) | 2 (6.1%) |
| 65 to 74 Years | 4 (10.8%) | 13 (35.1%) |
| 75 Years and over | 4 (13.3%) | 4 (13.3%) |
| Total | 118 (30.5%) | 86 (24.3%) |
Income Above Poverty by Sex and Age in Waynoka
According to the poverty statistics in Waynoka, males aged under 5 years and females aged 45 to 54 years are the age groups that are most secure financially, with 100.0% of males and 100.0% of females in these age groups living above the poverty line.
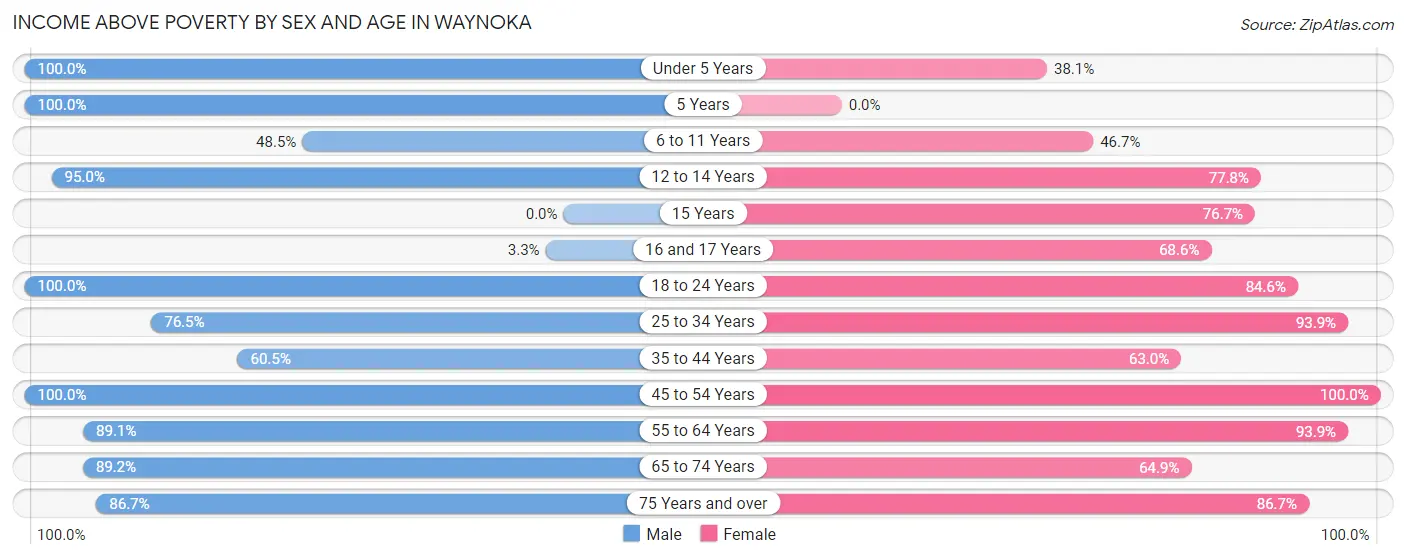
| Age Bracket | Male | Female |
| Under 5 Years | 28 (100.0%) | 8 (38.1%) |
| 5 Years | 6 (100.0%) | 0 (0.0%) |
| 6 to 11 Years | 16 (48.5%) | 7 (46.7%) |
| 12 to 14 Years | 19 (95.0%) | 14 (77.8%) |
| 15 Years | 0 (0.0%) | 23 (76.7%) |
| 16 and 17 Years | 2 (3.3%) | 24 (68.6%) |
| 18 to 24 Years | 11 (100.0%) | 11 (84.6%) |
| 25 to 34 Years | 39 (76.5%) | 31 (93.9%) |
| 35 to 44 Years | 26 (60.5%) | 34 (63.0%) |
| 45 to 54 Years | 22 (100.0%) | 35 (100.0%) |
| 55 to 64 Years | 41 (89.1%) | 31 (93.9%) |
| 65 to 74 Years | 33 (89.2%) | 24 (64.9%) |
| 75 Years and over | 26 (86.7%) | 26 (86.7%) |
| Total | 269 (69.5%) | 268 (75.7%) |
Income Below Poverty Among Married-Couple Families in Waynoka
The poverty statistics for married-couple families in Waynoka show that 7.1% or 8 of the total 112 families live below the poverty line. Families with 3 or 4 children have the highest poverty rate of 46.7%, comprising of 7 families. On the other hand, families with no children have the lowest poverty rate of 0.0%, which includes 0 families.
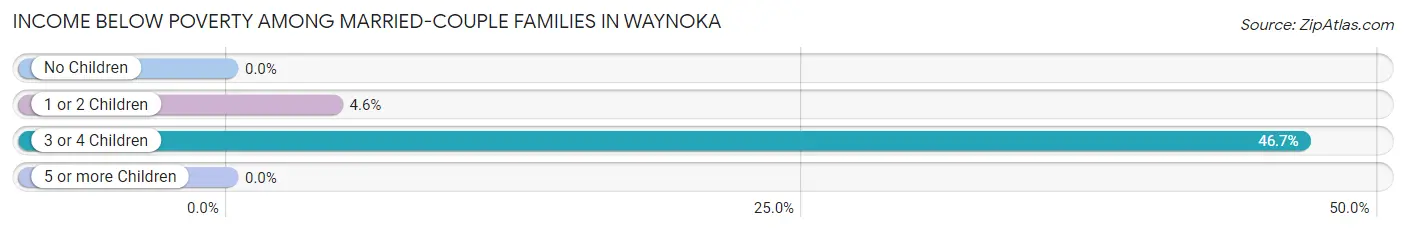
| Children | Above Poverty | Below Poverty |
| No Children | 75 (100.0%) | 0 (0.0%) |
| 1 or 2 Children | 21 (95.5%) | 1 (4.5%) |
| 3 or 4 Children | 8 (53.3%) | 7 (46.7%) |
| 5 or more Children | 0 (0.0%) | 0 (0.0%) |
| Total | 104 (92.9%) | 8 (7.1%) |
Income Below Poverty Among Single-Parent Households in Waynoka
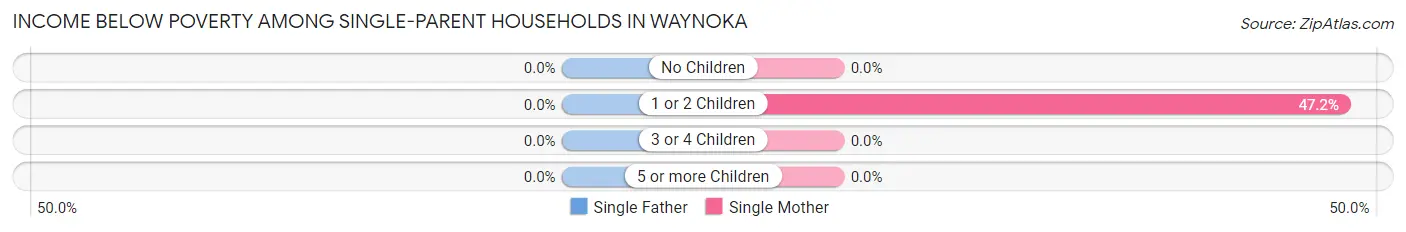
| Children | Single Father | Single Mother |
| No Children | 0 (0.0%) | 0 (0.0%) |
| 1 or 2 Children | 0 (0.0%) | 17 (47.2%) |
| 3 or 4 Children | 0 (0.0%) | 0 (0.0%) |
| 5 or more Children | 0 (0.0%) | 0 (0.0%) |
| Total | 0 (0.0%) | 17 (43.6%) |
Income Below Poverty Among Married-Couple vs Single-Parent Households in Waynoka
The poverty data for Waynoka shows that 8 of the married-couple family households (7.1%) and 17 of the single-parent households (29.3%) are living below the poverty level. Within the married-couple family households, those with 3 or 4 children have the highest poverty rate, with 7 households (46.7%) falling below the poverty line. Among the single-parent households, those with 1 or 2 children have the highest poverty rate, with 17 household (32.7%) living below poverty.
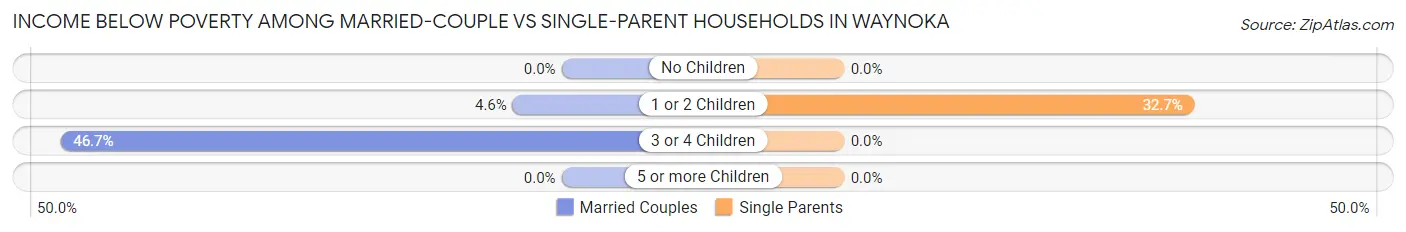
| Children | Married-Couple Families | Single-Parent Households |
| No Children | 0 (0.0%) | 0 (0.0%) |
| 1 or 2 Children | 1 (4.5%) | 17 (32.7%) |
| 3 or 4 Children | 7 (46.7%) | 0 (0.0%) |
| 5 or more Children | 0 (0.0%) | 0 (0.0%) |
| Total | 8 (7.1%) | 17 (29.3%) |
Race in Waynoka
The most populous races in Waynoka are White / Caucasian (697 | 91.7%), Two or more Races (46 | 6.0%), and Hispanic or Latino (35 | 4.6%).
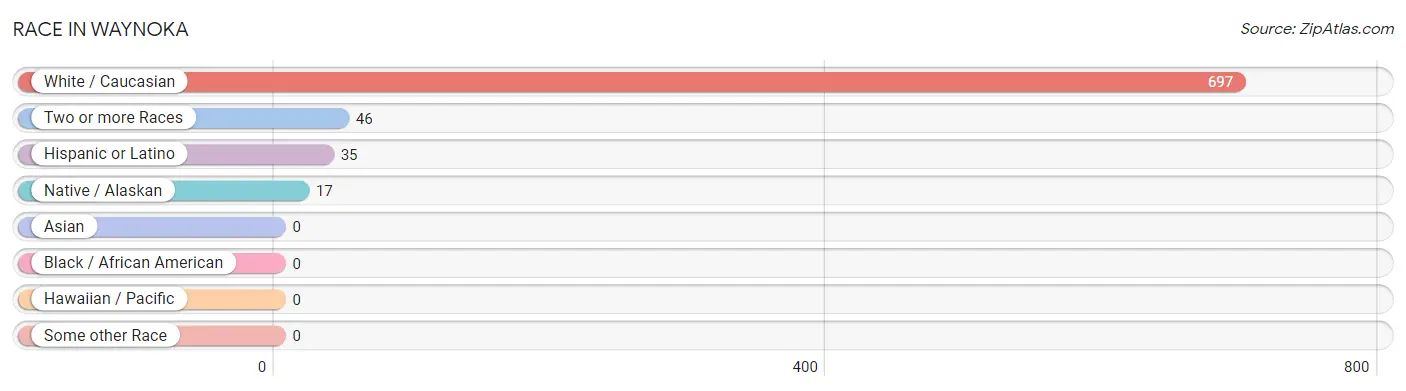
| Race | # Population | % Population |
| Asian | 0 | 0.0% |
| Black / African American | 0 | 0.0% |
| Hawaiian / Pacific | 0 | 0.0% |
| Hispanic or Latino | 35 | 4.6% |
| Native / Alaskan | 17 | 2.2% |
| White / Caucasian | 697 | 91.7% |
| Two or more Races | 46 | 6.0% |
| Some other Race | 0 | 0.0% |
| Total | 760 | 100.0% |
Ancestry in Waynoka
The most populous ancestries reported in Waynoka are German (156 | 20.5%), English (73 | 9.6%), Irish (70 | 9.2%), American (67 | 8.8%), and Scottish (40 | 5.3%), together accounting for 53.4% of all Waynoka residents.
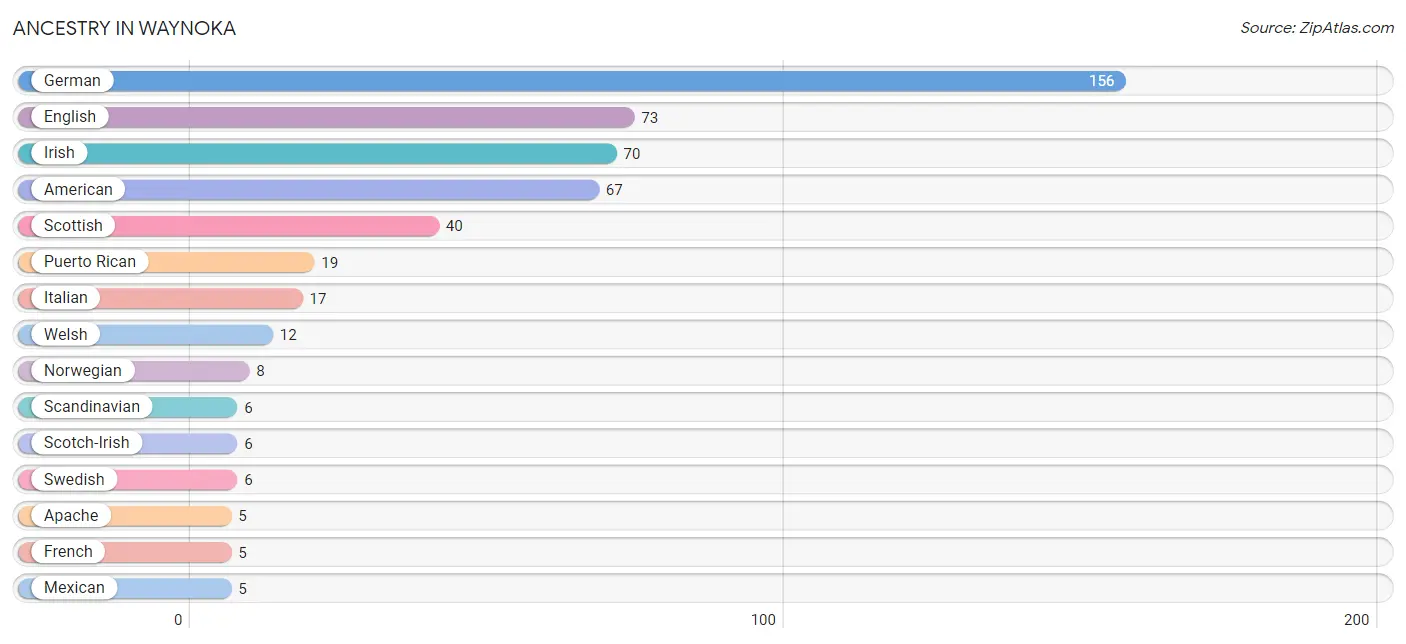
| Ancestry | # Population | % Population |
| American | 67 | 8.8% |
| Apache | 5 | 0.7% |
| British | 4 | 0.5% |
| Cherokee | 1 | 0.1% |
| Chippewa | 4 | 0.5% |
| Choctaw | 1 | 0.1% |
| Czech | 1 | 0.1% |
| Danish | 2 | 0.3% |
| Dutch | 3 | 0.4% |
| English | 73 | 9.6% |
| European | 2 | 0.3% |
| French | 5 | 0.7% |
| French Canadian | 1 | 0.1% |
| German | 156 | 20.5% |
| Irish | 70 | 9.2% |
| Italian | 17 | 2.2% |
| Mexican | 5 | 0.7% |
| Norwegian | 8 | 1.1% |
| Portuguese | 3 | 0.4% |
| Puerto Rican | 19 | 2.5% |
| Scandinavian | 6 | 0.8% |
| Scotch-Irish | 6 | 0.8% |
| Scottish | 40 | 5.3% |
| Swedish | 6 | 0.8% |
| Welsh | 12 | 1.6% | View All 25 Rows |
Immigrants in Waynoka
The most numerous immigrant groups reported in Waynoka came from Europe (12 | 1.6%), Germany (12 | 1.6%), and Western Europe (12 | 1.6%), together accounting for 4.7% of all Waynoka residents.
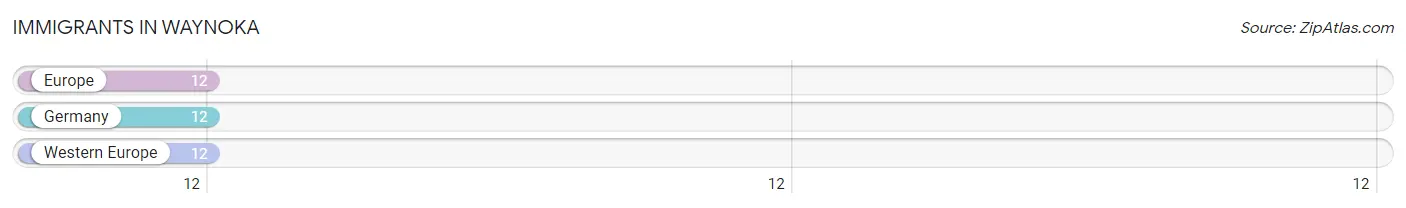
| Immigration Origin | # Population | % Population |
| Europe | 12 | 1.6% |
| Germany | 12 | 1.6% |
| Western Europe | 12 | 1.6% | View All 3 Rows |
Sex and Age in Waynoka
Sex and Age in Waynoka
The most populous age groups in Waynoka are 15 to 19 Years (61 | 15.8%) for men and 15 to 19 Years (65 | 17.4%) for women.
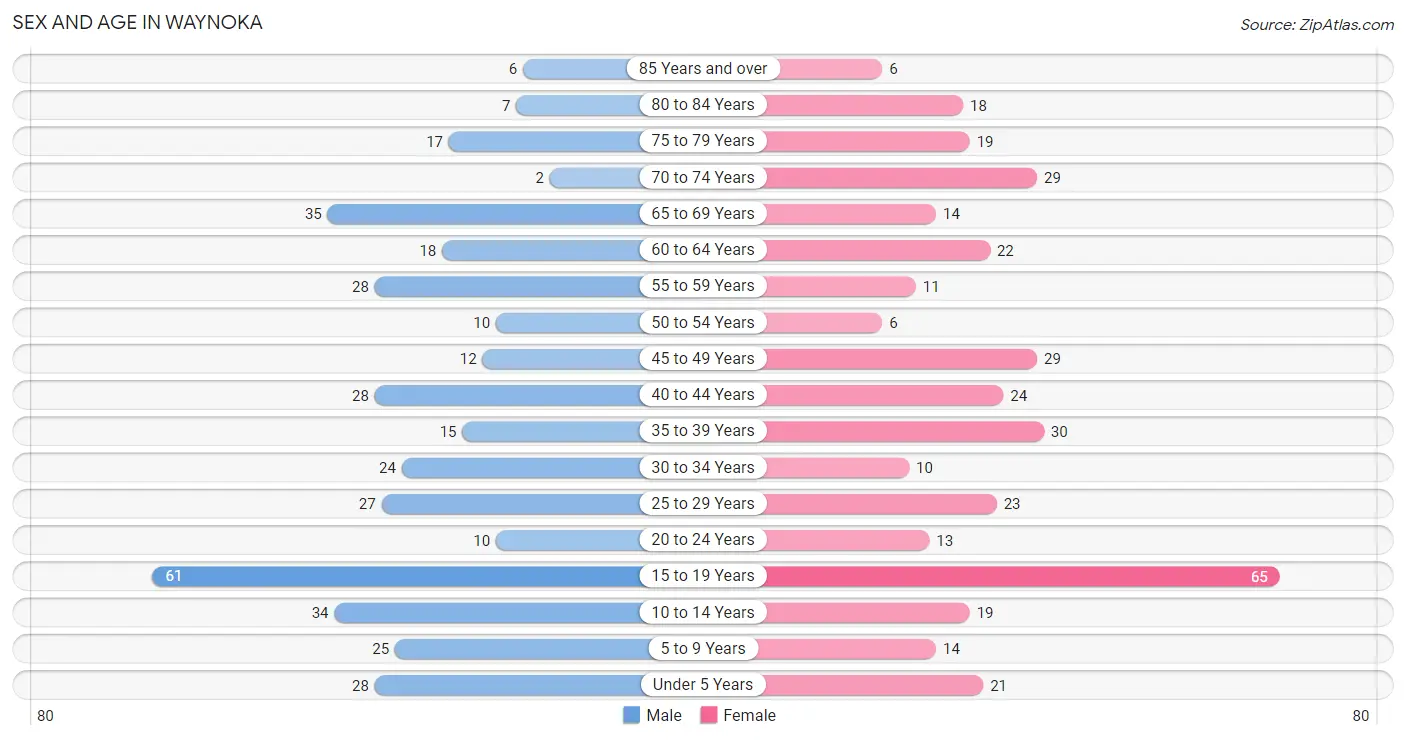
| Age Bracket | Male | Female |
| Under 5 Years | 28 (7.2%) | 21 (5.6%) |
| 5 to 9 Years | 25 (6.5%) | 14 (3.7%) |
| 10 to 14 Years | 34 (8.8%) | 19 (5.1%) |
| 15 to 19 Years | 61 (15.8%) | 65 (17.4%) |
| 20 to 24 Years | 10 (2.6%) | 13 (3.5%) |
| 25 to 29 Years | 27 (7.0%) | 23 (6.2%) |
| 30 to 34 Years | 24 (6.2%) | 10 (2.7%) |
| 35 to 39 Years | 15 (3.9%) | 30 (8.0%) |
| 40 to 44 Years | 28 (7.2%) | 24 (6.4%) |
| 45 to 49 Years | 12 (3.1%) | 29 (7.8%) |
| 50 to 54 Years | 10 (2.6%) | 6 (1.6%) |
| 55 to 59 Years | 28 (7.2%) | 11 (2.9%) |
| 60 to 64 Years | 18 (4.6%) | 22 (5.9%) |
| 65 to 69 Years | 35 (9.0%) | 14 (3.7%) |
| 70 to 74 Years | 2 (0.5%) | 29 (7.8%) |
| 75 to 79 Years | 17 (4.4%) | 19 (5.1%) |
| 80 to 84 Years | 7 (1.8%) | 18 (4.8%) |
| 85 Years and over | 6 (1.5%) | 6 (1.6%) |
| Total | 387 (100.0%) | 373 (100.0%) |
Families and Households in Waynoka
Median Family Size in Waynoka
The median family size in Waynoka is 3.41 persons per family, with married-couple families (112 | 65.9%) accounting for the largest median family size of 3.61 persons per family. On the other hand, single male/father families (19 | 11.2%) represent the smallest median family size with 2.26 persons per family.
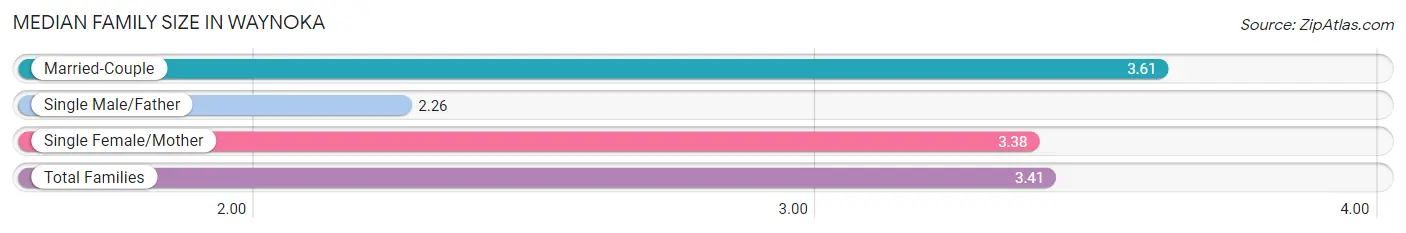
| Family Type | # Families | Family Size |
| Married-Couple | 112 (65.9%) | 3.61 |
| Single Male/Father | 19 (11.2%) | 2.26 |
| Single Female/Mother | 39 (22.9%) | 3.38 |
| Total Families | 170 (100.0%) | 3.41 |
Median Household Size in Waynoka
The median household size in Waynoka is 2.65 persons per household, with married-couple households (112 | 41.5%) accounting for the largest median household size of 3.61 persons per household. non-family households (100 | 37.0%) represent the smallest median household size with 1.30 persons per household.
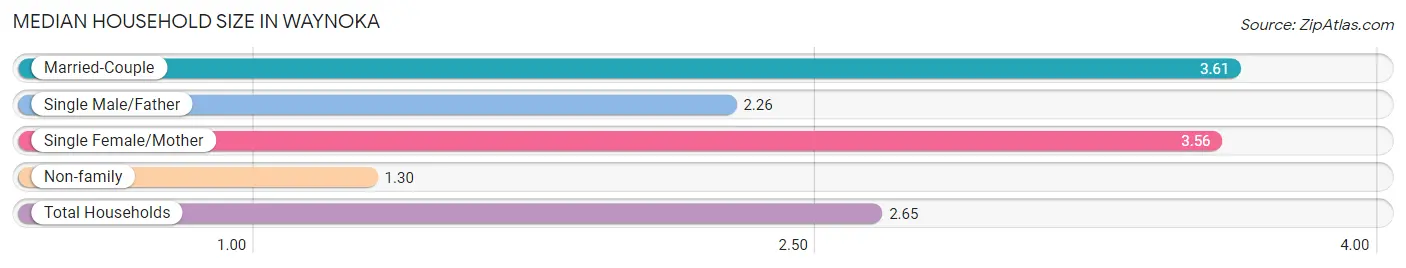
| Household Type | # Households | Household Size |
| Married-Couple | 112 (41.5%) | 3.61 |
| Single Male/Father | 19 (7.0%) | 2.26 |
| Single Female/Mother | 39 (14.4%) | 3.56 |
| Non-family | 100 (37.0%) | 1.30 |
| Total Households | 270 (100.0%) | 2.65 |
Household Size by Marriage Status in Waynoka
Out of a total of 270 households in Waynoka, 170 (63.0%) are family households, while 100 (37.0%) are nonfamily households. The most numerous type of family households are 2-person households, comprising 106, and the most common type of nonfamily households are 1-person households, comprising 82.
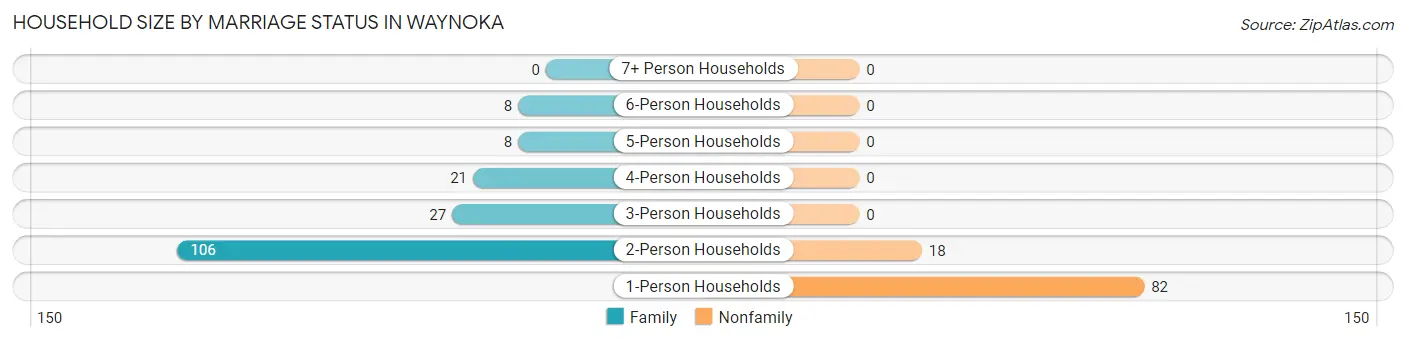
| Household Size | Family Households | Nonfamily Households |
| 1-Person Households | - | 82 (30.4%) |
| 2-Person Households | 106 (39.3%) | 18 (6.7%) |
| 3-Person Households | 27 (10.0%) | 0 (0.0%) |
| 4-Person Households | 21 (7.8%) | 0 (0.0%) |
| 5-Person Households | 8 (3.0%) | 0 (0.0%) |
| 6-Person Households | 8 (3.0%) | 0 (0.0%) |
| 7+ Person Households | 0 (0.0%) | 0 (0.0%) |
| Total | 170 (63.0%) | 100 (37.0%) |
Female Fertility in Waynoka
Fertility by Age in Waynoka
Average fertility rate in Waynoka is 21.0 births per 1,000 women. Women in the age bracket of 20 to 34 years have the highest fertility rate with 87.0 births per 1,000 women. Women in the age bracket of 20 to 34 years acount for 100.0% of all women with births.
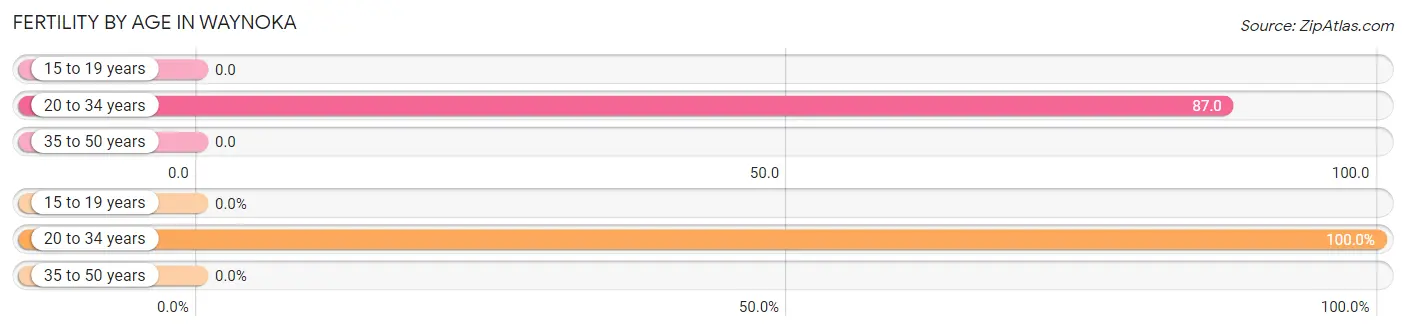
| Age Bracket | Women with Births | Births / 1,000 Women |
| 15 to 19 years | 0 (0.0%) | 0.0 |
| 20 to 34 years | 4 (100.0%) | 87.0 |
| 35 to 50 years | 0 (0.0%) | 0.0 |
| Total | 4 (100.0%) | 21.0 |
Fertility by Age by Marriage Status in Waynoka
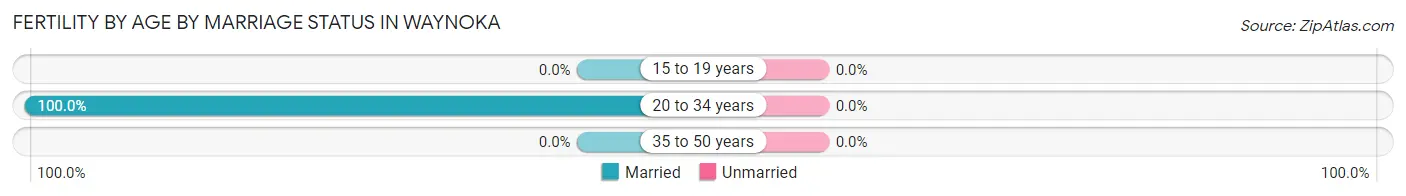
| Age Bracket | Married | Unmarried |
| 15 to 19 years | 0 (0.0%) | 0 (0.0%) |
| 20 to 34 years | 4 (100.0%) | 0 (0.0%) |
| 35 to 50 years | 0 (0.0%) | 0 (0.0%) |
| Total | 4 (100.0%) | 0 (0.0%) |
Fertility by Education in Waynoka
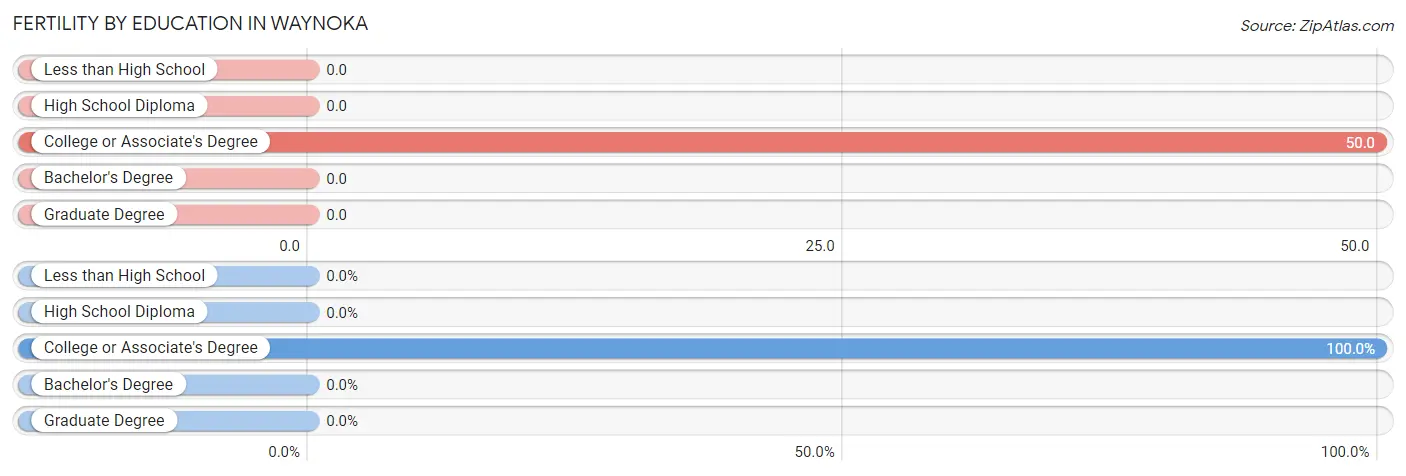
| Educational Attainment | Women with Births | Births / 1,000 Women |
| Less than High School | 0 (0.0%) | 0.0 |
| High School Diploma | 0 (0.0%) | 0.0 |
| College or Associate's Degree | 4 (100.0%) | 50.0 |
| Bachelor's Degree | 0 (0.0%) | 0.0 |
| Graduate Degree | 0 (0.0%) | 0.0 |
| Total | 4 (100.0%) | 21.0 |
Fertility by Education by Marriage Status in Waynoka
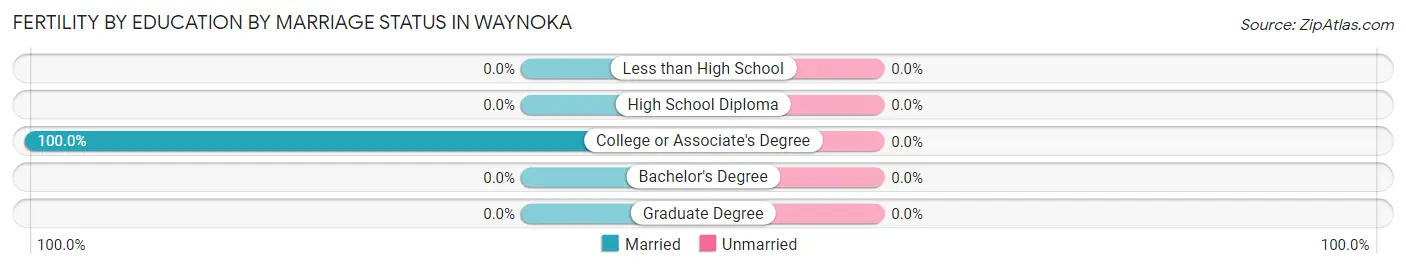
| Educational Attainment | Married | Unmarried |
| Less than High School | 0 (0.0%) | 0 (0.0%) |
| High School Diploma | 0 (0.0%) | 0 (0.0%) |
| College or Associate's Degree | 4 (100.0%) | 0 (0.0%) |
| Bachelor's Degree | 0 (0.0%) | 0 (0.0%) |
| Graduate Degree | 0 (0.0%) | 0 (0.0%) |
| Total | 4 (100.0%) | 0 (0.0%) |
Employment Characteristics in Waynoka
Employment by Class of Employer in Waynoka
Among the 284 employed individuals in Waynoka, private company employees (179 | 63.0%), local government employees (39 | 13.7%), and not-for-profit organizations (24 | 8.5%) make up the most common classes of employment.
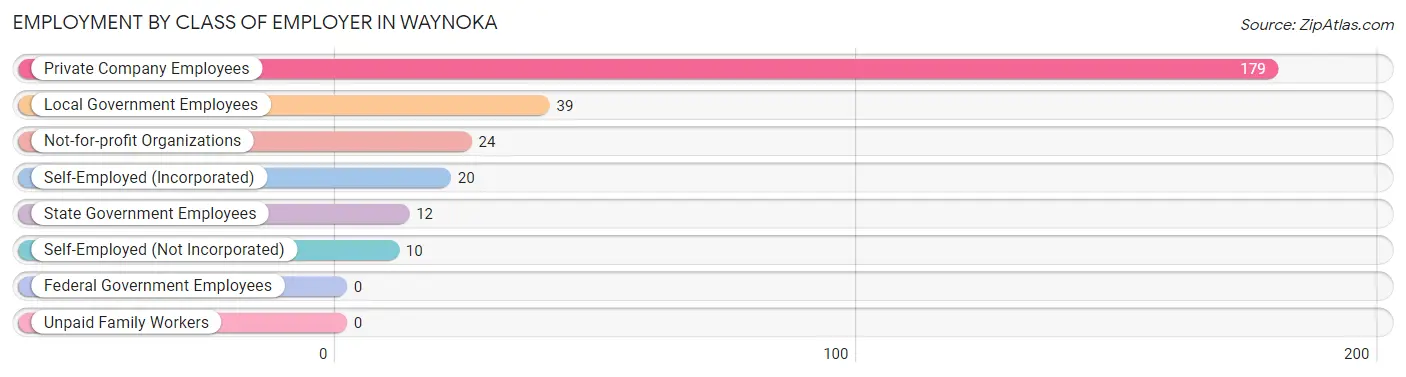
| Employer Class | # Employees | % Employees |
| Private Company Employees | 179 | 63.0% |
| Self-Employed (Incorporated) | 20 | 7.0% |
| Self-Employed (Not Incorporated) | 10 | 3.5% |
| Not-for-profit Organizations | 24 | 8.5% |
| Local Government Employees | 39 | 13.7% |
| State Government Employees | 12 | 4.2% |
| Federal Government Employees | 0 | 0.0% |
| Unpaid Family Workers | 0 | 0.0% |
| Total | 284 | 100.0% |
Employment Status by Age in Waynoka
According to the labor force statistics for Waynoka, out of the total population over 16 years of age (589), 52.3% or 308 individuals are in the labor force, with 7.5% or 23 of them unemployed. The age group with the highest labor force participation rate is 20 to 24 years, with 100.0% or 23 individuals in the labor force. Within the labor force, the 55 to 59 years age range has the highest percentage of unemployed individuals, with 20.8% or 5 of them being unemployed.
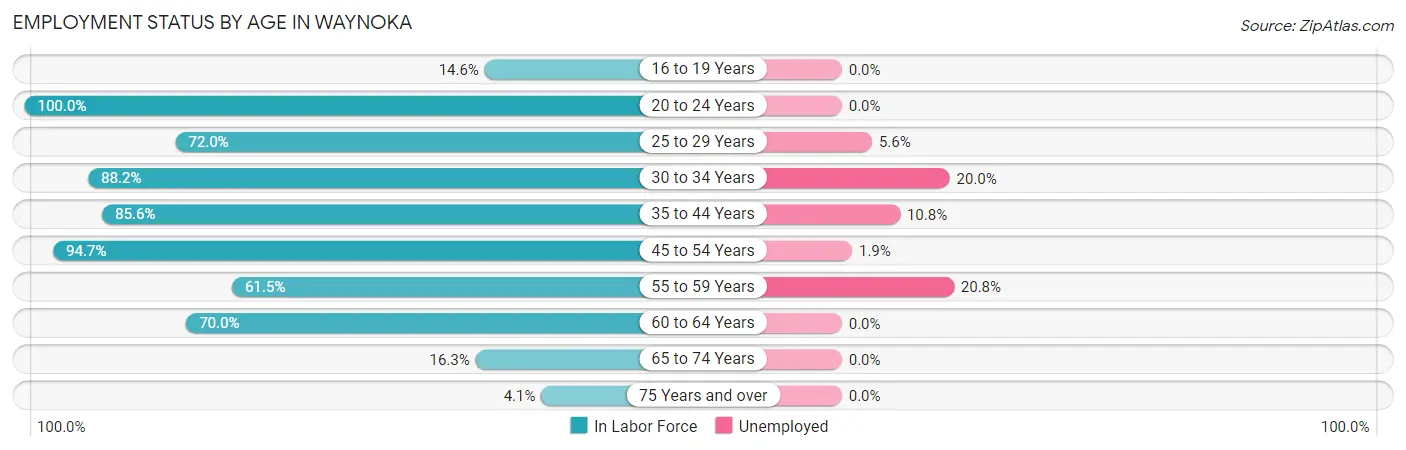
| Age Bracket | In Labor Force | Unemployed |
| 16 to 19 Years | 14 (14.6%) | 0 (0.0%) |
| 20 to 24 Years | 23 (100.0%) | 0 (0.0%) |
| 25 to 29 Years | 36 (72.0%) | 2 (5.6%) |
| 30 to 34 Years | 30 (88.2%) | 6 (20.0%) |
| 35 to 44 Years | 83 (85.6%) | 9 (10.8%) |
| 45 to 54 Years | 54 (94.7%) | 1 (1.9%) |
| 55 to 59 Years | 24 (61.5%) | 5 (20.8%) |
| 60 to 64 Years | 28 (70.0%) | 0 (0.0%) |
| 65 to 74 Years | 13 (16.3%) | 0 (0.0%) |
| 75 Years and over | 3 (4.1%) | 0 (0.0%) |
| Total | 308 (52.3%) | 23 (7.5%) |
Employment Status by Educational Attainment in Waynoka
According to labor force statistics for Waynoka, 80.4% of individuals (255) out of the total population between 25 and 64 years of age (317) are in the labor force, with 9.0% or 23 of them being unemployed. The group with the highest labor force participation rate are those with the educational attainment of bachelor's degree or higher, with 97.0% or 65 individuals in the labor force. Within the labor force, individuals with less than high school education have the highest percentage of unemployment, with 33.3% or 6 of them being unemployed.
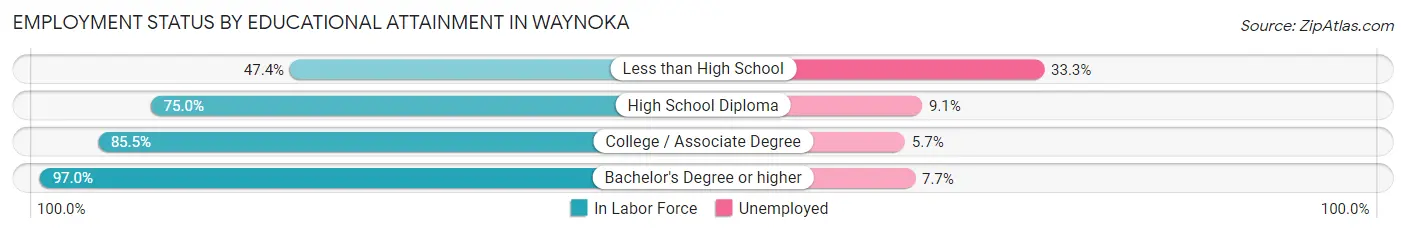
| Educational Attainment | In Labor Force | Unemployed |
| Less than High School | 18 (47.4%) | 13 (33.3%) |
| High School Diploma | 66 (75.0%) | 8 (9.1%) |
| College / Associate Degree | 106 (85.5%) | 7 (5.7%) |
| Bachelor's Degree or higher | 65 (97.0%) | 5 (7.7%) |
| Total | 255 (80.4%) | 29 (9.0%) |
Employment Occupations by Sex in Waynoka
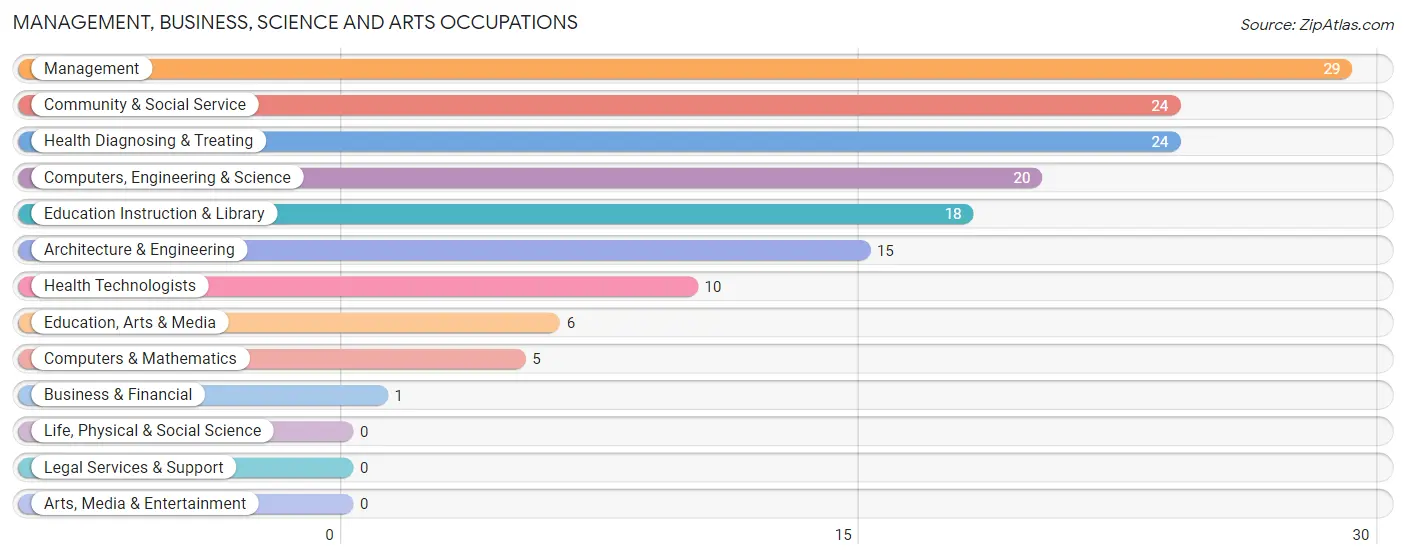
Management, Business, Science and Arts Occupations
The most common Management, Business, Science and Arts occupations in Waynoka are Management (29 | 10.2%), Community & Social Service (24 | 8.4%), Health Diagnosing & Treating (24 | 8.4%), Computers, Engineering & Science (20 | 7.0%), and Education Instruction & Library (18 | 6.3%).
Management, Business, Science and Arts Occupations by Sex
Within the Management, Business, Science and Arts occupations in Waynoka, the most male-oriented occupations are Computers & Mathematics (100.0%), Education, Arts & Media (83.3%), and Management (75.9%), while the most female-oriented occupations are Business & Financial (100.0%), Health Diagnosing & Treating (100.0%), and Health Technologists (100.0%).
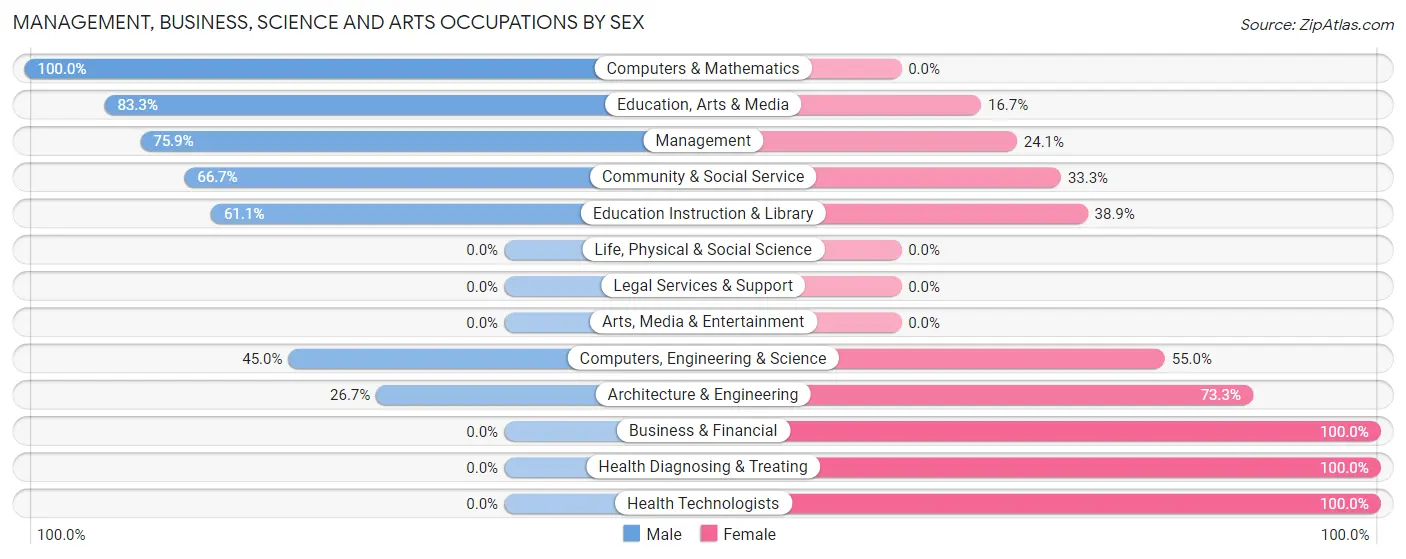
| Occupation | Male | Female |
| Management | 22 (75.9%) | 7 (24.1%) |
| Business & Financial | 0 (0.0%) | 1 (100.0%) |
| Computers, Engineering & Science | 9 (45.0%) | 11 (55.0%) |
| Computers & Mathematics | 5 (100.0%) | 0 (0.0%) |
| Architecture & Engineering | 4 (26.7%) | 11 (73.3%) |
| Life, Physical & Social Science | 0 (0.0%) | 0 (0.0%) |
| Community & Social Service | 16 (66.7%) | 8 (33.3%) |
| Education, Arts & Media | 5 (83.3%) | 1 (16.7%) |
| Legal Services & Support | 0 (0.0%) | 0 (0.0%) |
| Education Instruction & Library | 11 (61.1%) | 7 (38.9%) |
| Arts, Media & Entertainment | 0 (0.0%) | 0 (0.0%) |
| Health Diagnosing & Treating | 0 (0.0%) | 24 (100.0%) |
| Health Technologists | 0 (0.0%) | 10 (100.0%) |
| Total (Category) | 47 (48.0%) | 51 (52.0%) |
| Total (Overall) | 145 (50.9%) | 140 (49.1%) |
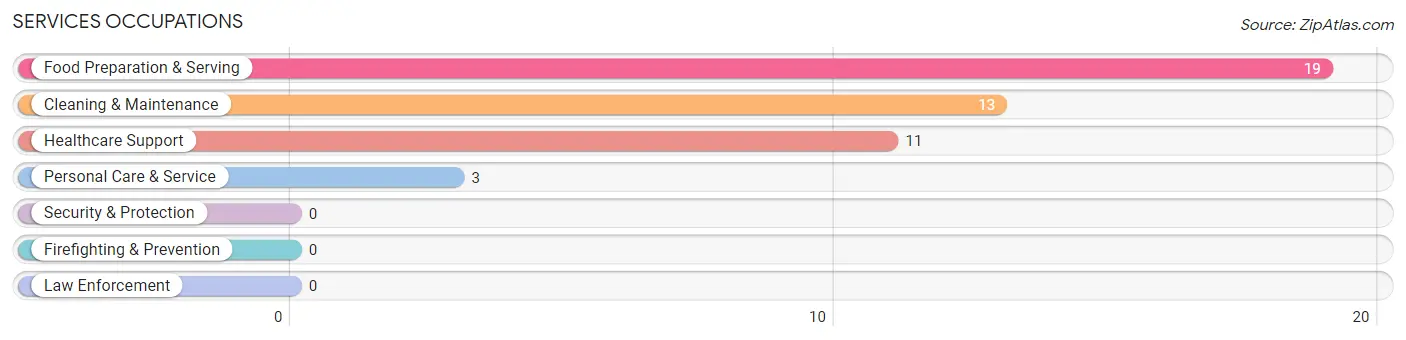
Services Occupations
The most common Services occupations in Waynoka are Food Preparation & Serving (19 | 6.7%), Cleaning & Maintenance (13 | 4.6%), Healthcare Support (11 | 3.9%), and Personal Care & Service (3 | 1.1%).
Services Occupations by Sex
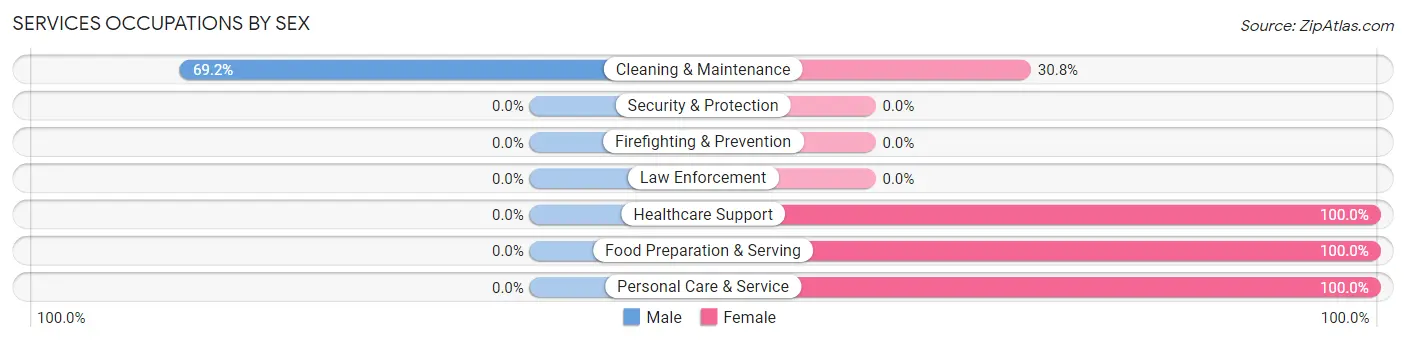
| Occupation | Male | Female |
| Healthcare Support | 0 (0.0%) | 11 (100.0%) |
| Security & Protection | 0 (0.0%) | 0 (0.0%) |
| Firefighting & Prevention | 0 (0.0%) | 0 (0.0%) |
| Law Enforcement | 0 (0.0%) | 0 (0.0%) |
| Food Preparation & Serving | 0 (0.0%) | 19 (100.0%) |
| Cleaning & Maintenance | 9 (69.2%) | 4 (30.8%) |
| Personal Care & Service | 0 (0.0%) | 3 (100.0%) |
| Total (Category) | 9 (19.6%) | 37 (80.4%) |
| Total (Overall) | 145 (50.9%) | 140 (49.1%) |
Sales and Office Occupations
The most common Sales and Office occupations in Waynoka are Office & Administration (20 | 7.0%), and Sales & Related (18 | 6.3%).
Sales and Office Occupations by Sex
| Occupation | Male | Female |
| Sales & Related | 0 (0.0%) | 18 (100.0%) |
| Office & Administration | 4 (20.0%) | 16 (80.0%) |
| Total (Category) | 4 (10.5%) | 34 (89.5%) |
| Total (Overall) | 145 (50.9%) | 140 (49.1%) |
Natural Resources, Construction and Maintenance Occupations
The most common Natural Resources, Construction and Maintenance occupations in Waynoka are Construction & Extraction (28 | 9.8%), and Installation, Maintenance & Repair (27 | 9.5%).
Natural Resources, Construction and Maintenance Occupations by Sex
| Occupation | Male | Female |
| Farming, Fishing & Forestry | 0 (0.0%) | 0 (0.0%) |
| Construction & Extraction | 28 (100.0%) | 0 (0.0%) |
| Installation, Maintenance & Repair | 17 (63.0%) | 10 (37.0%) |
| Total (Category) | 45 (81.8%) | 10 (18.2%) |
| Total (Overall) | 145 (50.9%) | 140 (49.1%) |
Production, Transportation and Moving Occupations
The most common Production, Transportation and Moving occupations in Waynoka are Transportation (31 | 10.9%), Production (13 | 4.6%), and Material Moving (4 | 1.4%).
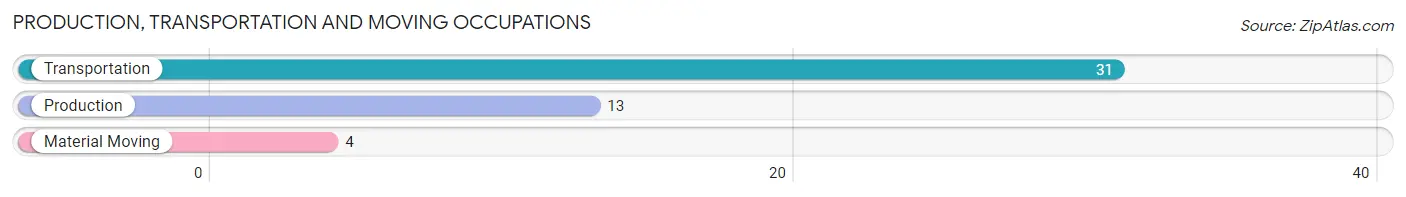
Production, Transportation and Moving Occupations by Sex
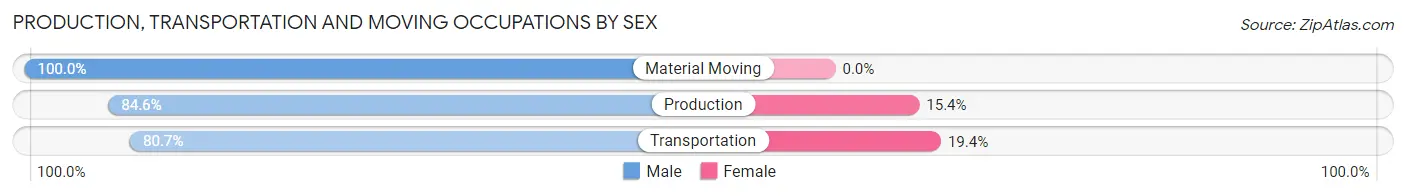
| Occupation | Male | Female |
| Production | 11 (84.6%) | 2 (15.4%) |
| Transportation | 25 (80.6%) | 6 (19.4%) |
| Material Moving | 4 (100.0%) | 0 (0.0%) |
| Total (Category) | 40 (83.3%) | 8 (16.7%) |
| Total (Overall) | 145 (50.9%) | 140 (49.1%) |
Employment Industries by Sex in Waynoka
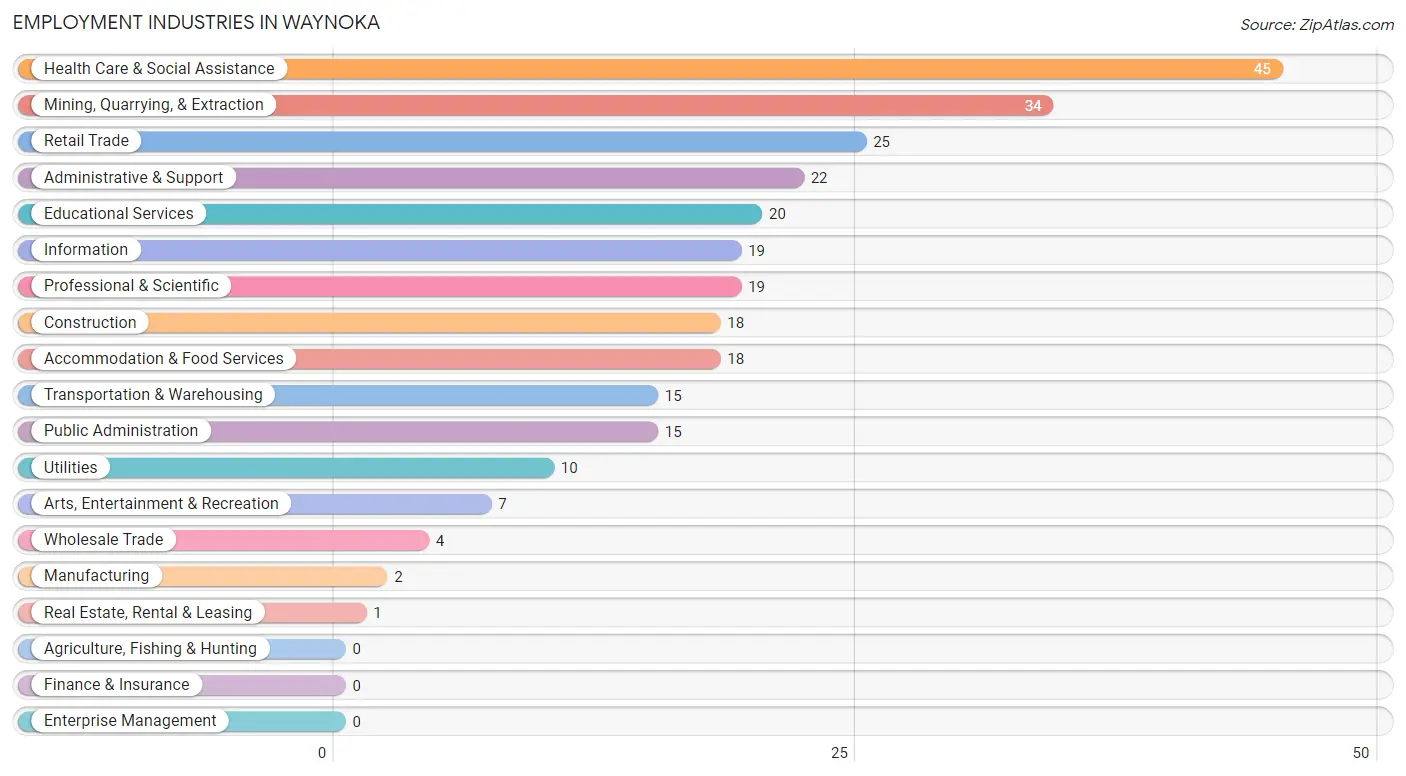
Employment Industries in Waynoka
The major employment industries in Waynoka include Health Care & Social Assistance (45 | 15.8%), Mining, Quarrying, & Extraction (34 | 11.9%), Retail Trade (25 | 8.8%), Administrative & Support (22 | 7.7%), and Educational Services (20 | 7.0%).
Employment Industries by Sex in Waynoka
The Waynoka industries that see more men than women are Mining, Quarrying, & Extraction (100.0%), Manufacturing (100.0%), and Wholesale Trade (100.0%), whereas the industries that tend to have a higher number of women are Real Estate, Rental & Leasing (100.0%), Accommodation & Food Services (88.9%), and Public Administration (86.7%).
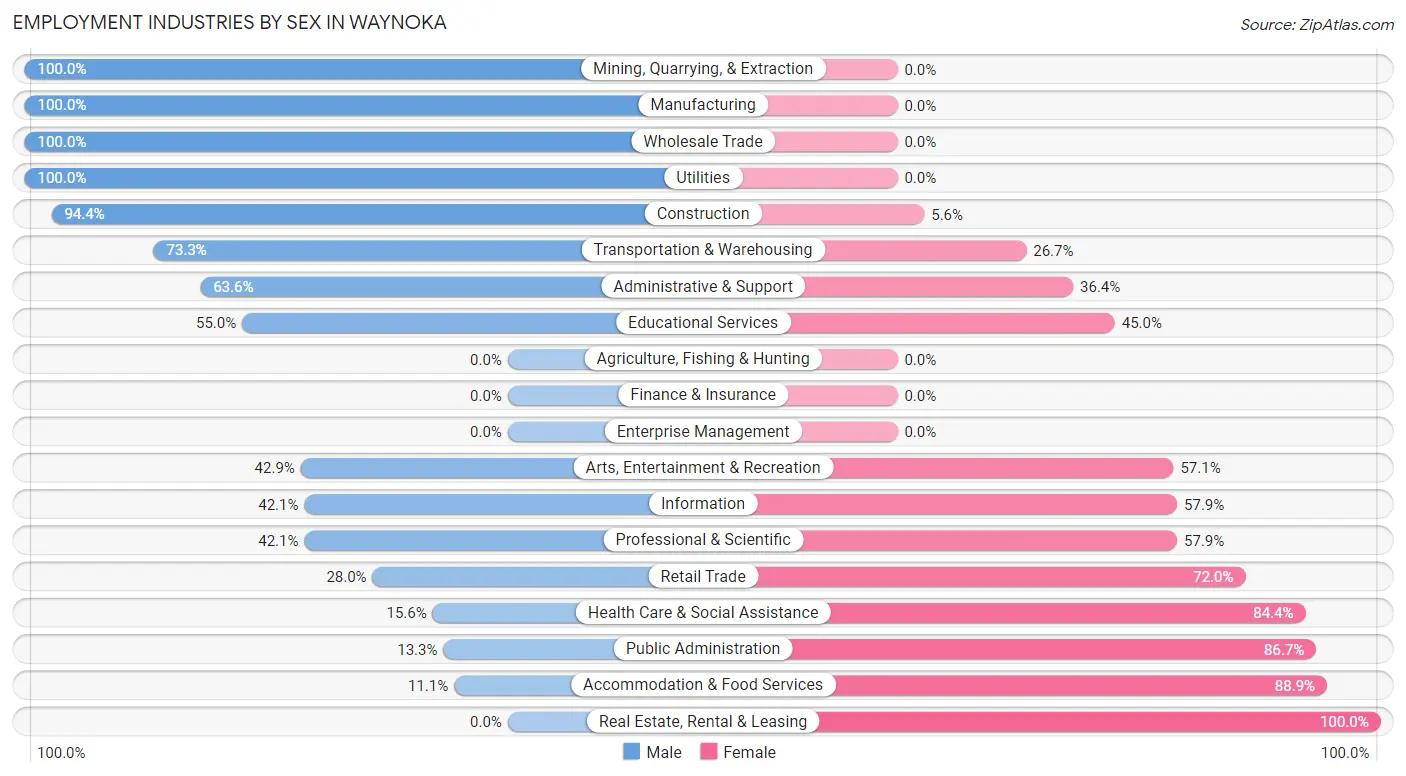
| Industry | Male | Female |
| Agriculture, Fishing & Hunting | 0 (0.0%) | 0 (0.0%) |
| Mining, Quarrying, & Extraction | 34 (100.0%) | 0 (0.0%) |
| Construction | 17 (94.4%) | 1 (5.6%) |
| Manufacturing | 2 (100.0%) | 0 (0.0%) |
| Wholesale Trade | 4 (100.0%) | 0 (0.0%) |
| Retail Trade | 7 (28.0%) | 18 (72.0%) |
| Transportation & Warehousing | 11 (73.3%) | 4 (26.7%) |
| Utilities | 10 (100.0%) | 0 (0.0%) |
| Information | 8 (42.1%) | 11 (57.9%) |
| Finance & Insurance | 0 (0.0%) | 0 (0.0%) |
| Real Estate, Rental & Leasing | 0 (0.0%) | 1 (100.0%) |
| Professional & Scientific | 8 (42.1%) | 11 (57.9%) |
| Enterprise Management | 0 (0.0%) | 0 (0.0%) |
| Administrative & Support | 14 (63.6%) | 8 (36.4%) |
| Educational Services | 11 (55.0%) | 9 (45.0%) |
| Health Care & Social Assistance | 7 (15.6%) | 38 (84.4%) |
| Arts, Entertainment & Recreation | 3 (42.9%) | 4 (57.1%) |
| Accommodation & Food Services | 2 (11.1%) | 16 (88.9%) |
| Public Administration | 2 (13.3%) | 13 (86.7%) |
| Total | 145 (50.9%) | 140 (49.1%) |
Education in Waynoka
School Enrollment in Waynoka
The most common levels of schooling among the 242 students in Waynoka are high school (108 | 44.6%), middle school (51 | 21.1%), and elementary school (35 | 14.5%).
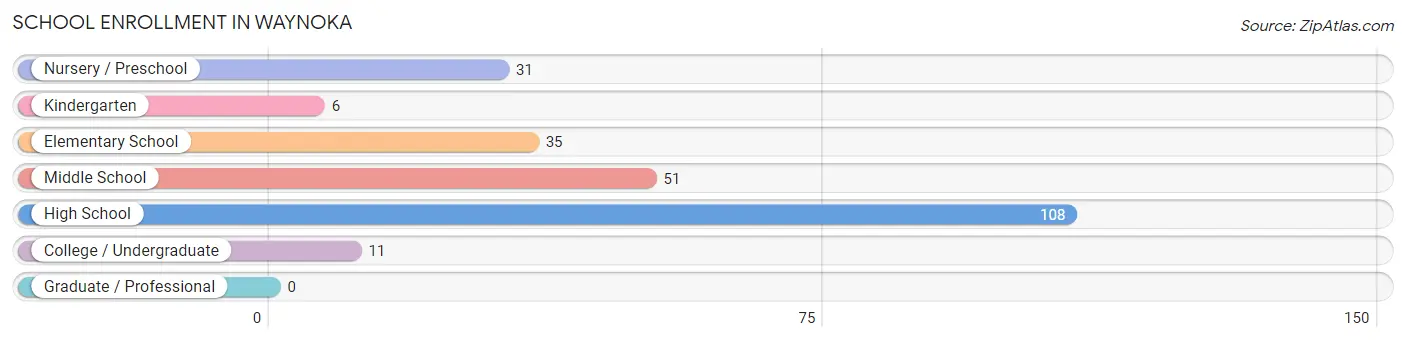
| School Level | # Students | % Students |
| Nursery / Preschool | 31 | 12.8% |
| Kindergarten | 6 | 2.5% |
| Elementary School | 35 | 14.5% |
| Middle School | 51 | 21.1% |
| High School | 108 | 44.6% |
| College / Undergraduate | 11 | 4.5% |
| Graduate / Professional | 0 | 0.0% |
| Total | 242 | 100.0% |
School Enrollment by Age by Funding Source in Waynoka
Out of a total of 242 students who are enrolled in schools in Waynoka, 12 (5.0%) attend a private institution, while the remaining 230 (95.0%) are enrolled in public schools. The age group of 15 to 17 year olds has the highest likelihood of being enrolled in private schools, with 9 (7.5% in the age bracket) enrolled. Conversely, the age group of 3 to 4 year olds has the lowest likelihood of being enrolled in a private school, with 25 (100.0% in the age bracket) attending a public institution.
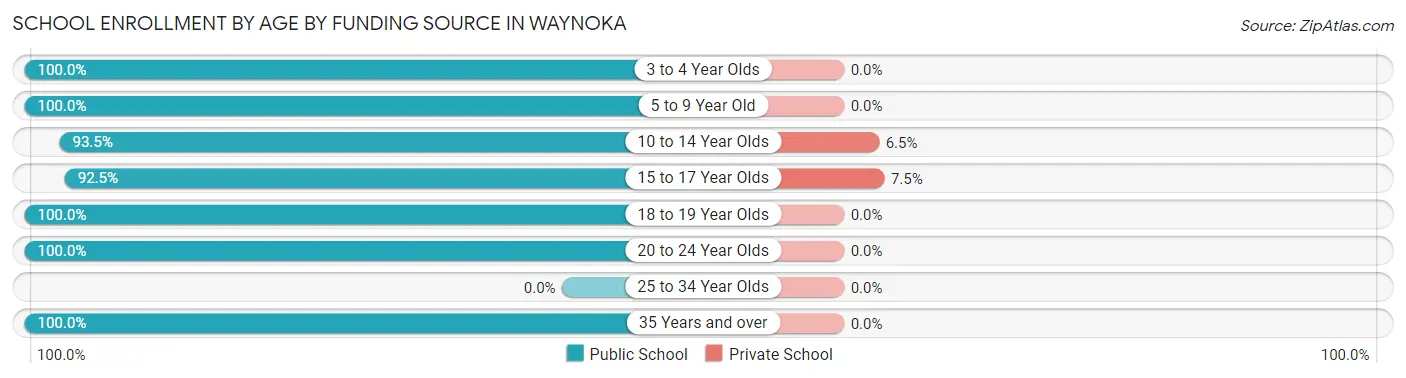
| Age Bracket | Public School | Private School |
| 3 to 4 Year Olds | 25 (100.0%) | 0 (0.0%) |
| 5 to 9 Year Old | 39 (100.0%) | 0 (0.0%) |
| 10 to 14 Year Olds | 43 (93.5%) | 3 (6.5%) |
| 15 to 17 Year Olds | 111 (92.5%) | 9 (7.5%) |
| 18 to 19 Year Olds | 1 (100.0%) | 0 (0.0%) |
| 20 to 24 Year Olds | 7 (100.0%) | 0 (0.0%) |
| 25 to 34 Year Olds | 0 (0.0%) | 0 (0.0%) |
| 35 Years and over | 4 (100.0%) | 0 (0.0%) |
| Total | 230 (95.0%) | 12 (5.0%) |
Educational Attainment by Field of Study in Waynoka
Education (41 | 39.8%), science & technology (29 | 28.2%), communications (9 | 8.7%), business (5 | 4.9%), and arts & humanities (5 | 4.9%) are the most common fields of study among 103 individuals in Waynoka who have obtained a bachelor's degree or higher.
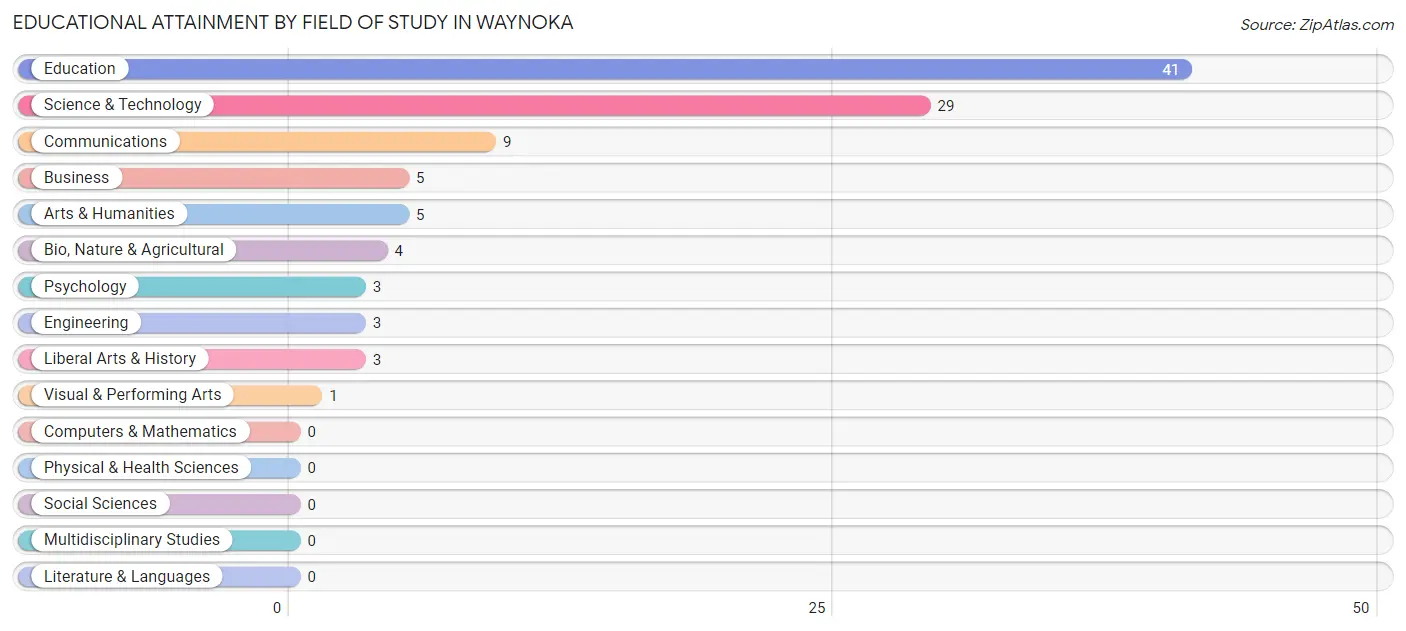
| Field of Study | # Graduates | % Graduates |
| Computers & Mathematics | 0 | 0.0% |
| Bio, Nature & Agricultural | 4 | 3.9% |
| Physical & Health Sciences | 0 | 0.0% |
| Psychology | 3 | 2.9% |
| Social Sciences | 0 | 0.0% |
| Engineering | 3 | 2.9% |
| Multidisciplinary Studies | 0 | 0.0% |
| Science & Technology | 29 | 28.2% |
| Business | 5 | 4.9% |
| Education | 41 | 39.8% |
| Literature & Languages | 0 | 0.0% |
| Liberal Arts & History | 3 | 2.9% |
| Visual & Performing Arts | 1 | 1.0% |
| Communications | 9 | 8.7% |
| Arts & Humanities | 5 | 4.9% |
| Total | 103 | 100.0% |
Transportation & Commute in Waynoka
Vehicle Availability by Sex in Waynoka
The most prevalent vehicle ownership categories in Waynoka are males with 2 vehicles (62, accounting for 42.8%) and females with 2 vehicles (54, making up 44.6%).
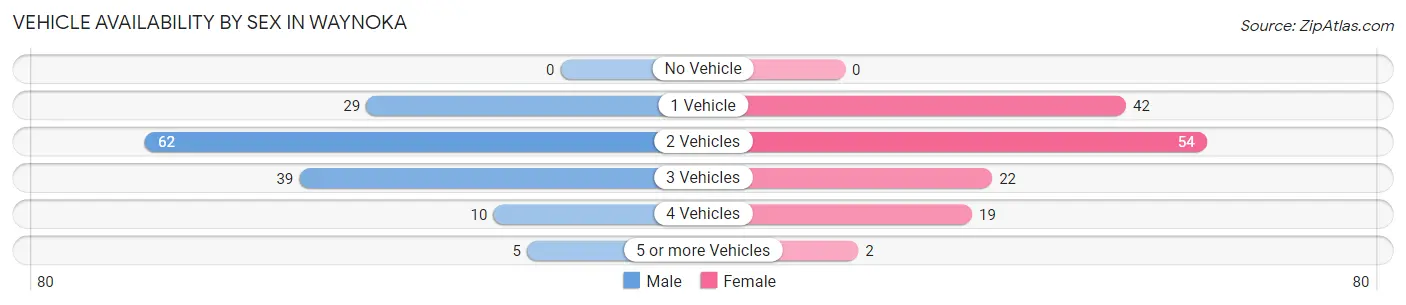
| Vehicles Available | Male | Female |
| No Vehicle | 0 (0.0%) | 0 (0.0%) |
| 1 Vehicle | 29 (20.0%) | 42 (30.2%) |
| 2 Vehicles | 62 (42.8%) | 54 (38.9%) |
| 3 Vehicles | 39 (26.9%) | 22 (15.8%) |
| 4 Vehicles | 10 (6.9%) | 19 (13.7%) |
| 5 or more Vehicles | 5 (3.5%) | 2 (1.4%) |
| Total | 145 (100.0%) | 139 (100.0%) |
Commute Time in Waynoka
The most frequently occuring commute durations in Waynoka are 30 to 34 minutes (66 commuters, 24.1%), 5 to 9 minutes (59 commuters, 21.5%), and less than 5 minutes (46 commuters, 16.8%).
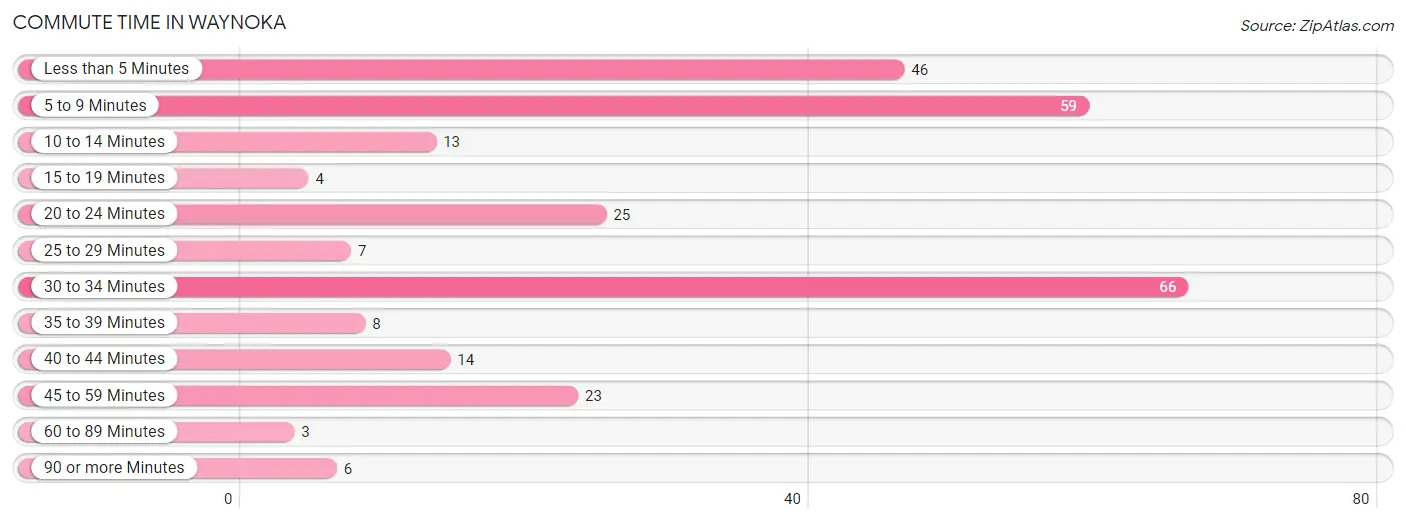
| Commute Time | # Commuters | % Commuters |
| Less than 5 Minutes | 46 | 16.8% |
| 5 to 9 Minutes | 59 | 21.5% |
| 10 to 14 Minutes | 13 | 4.7% |
| 15 to 19 Minutes | 4 | 1.5% |
| 20 to 24 Minutes | 25 | 9.1% |
| 25 to 29 Minutes | 7 | 2.5% |
| 30 to 34 Minutes | 66 | 24.1% |
| 35 to 39 Minutes | 8 | 2.9% |
| 40 to 44 Minutes | 14 | 5.1% |
| 45 to 59 Minutes | 23 | 8.4% |
| 60 to 89 Minutes | 3 | 1.1% |
| 90 or more Minutes | 6 | 2.2% |
Commute Time by Sex in Waynoka
The most common commute times in Waynoka are 30 to 34 minutes (37 commuters, 26.8%) for males and 5 to 9 minutes (29 commuters, 21.3%) for females.
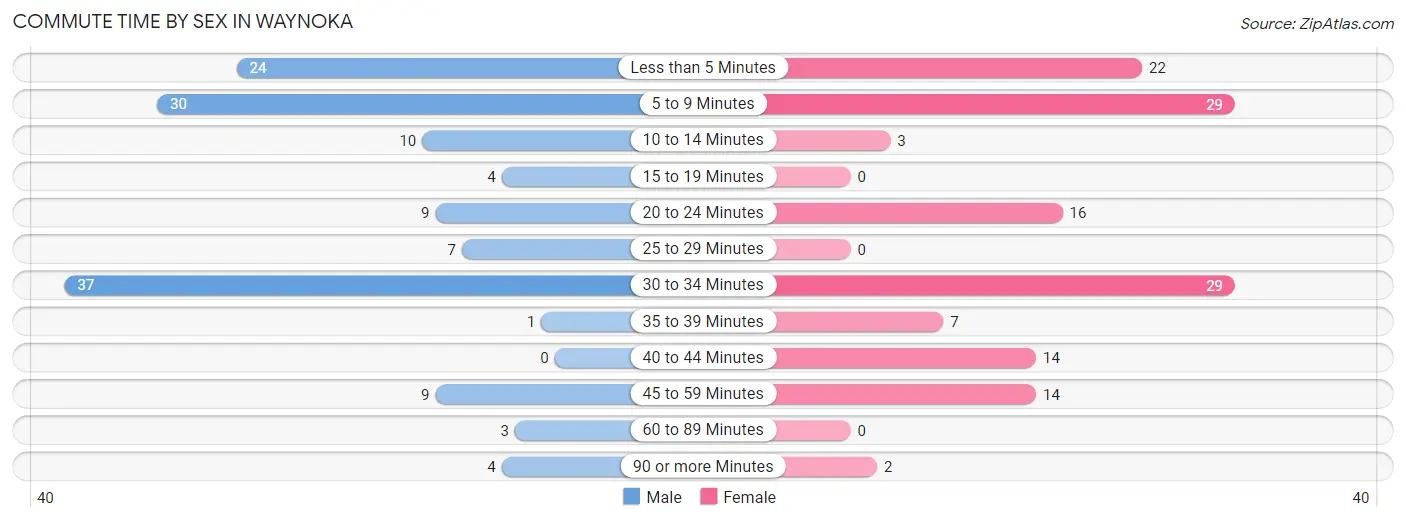
| Commute Time | Male | Female |
| Less than 5 Minutes | 24 (17.4%) | 22 (16.2%) |
| 5 to 9 Minutes | 30 (21.7%) | 29 (21.3%) |
| 10 to 14 Minutes | 10 (7.2%) | 3 (2.2%) |
| 15 to 19 Minutes | 4 (2.9%) | 0 (0.0%) |
| 20 to 24 Minutes | 9 (6.5%) | 16 (11.8%) |
| 25 to 29 Minutes | 7 (5.1%) | 0 (0.0%) |
| 30 to 34 Minutes | 37 (26.8%) | 29 (21.3%) |
| 35 to 39 Minutes | 1 (0.7%) | 7 (5.1%) |
| 40 to 44 Minutes | 0 (0.0%) | 14 (10.3%) |
| 45 to 59 Minutes | 9 (6.5%) | 14 (10.3%) |
| 60 to 89 Minutes | 3 (2.2%) | 0 (0.0%) |
| 90 or more Minutes | 4 (2.9%) | 2 (1.5%) |
Time of Departure to Work by Sex in Waynoka
The most frequent times of departure to work in Waynoka are 7:00 AM to 7:29 AM (47, 34.1%) for males and 4:00 PM to 11:59 PM (45, 33.1%) for females.
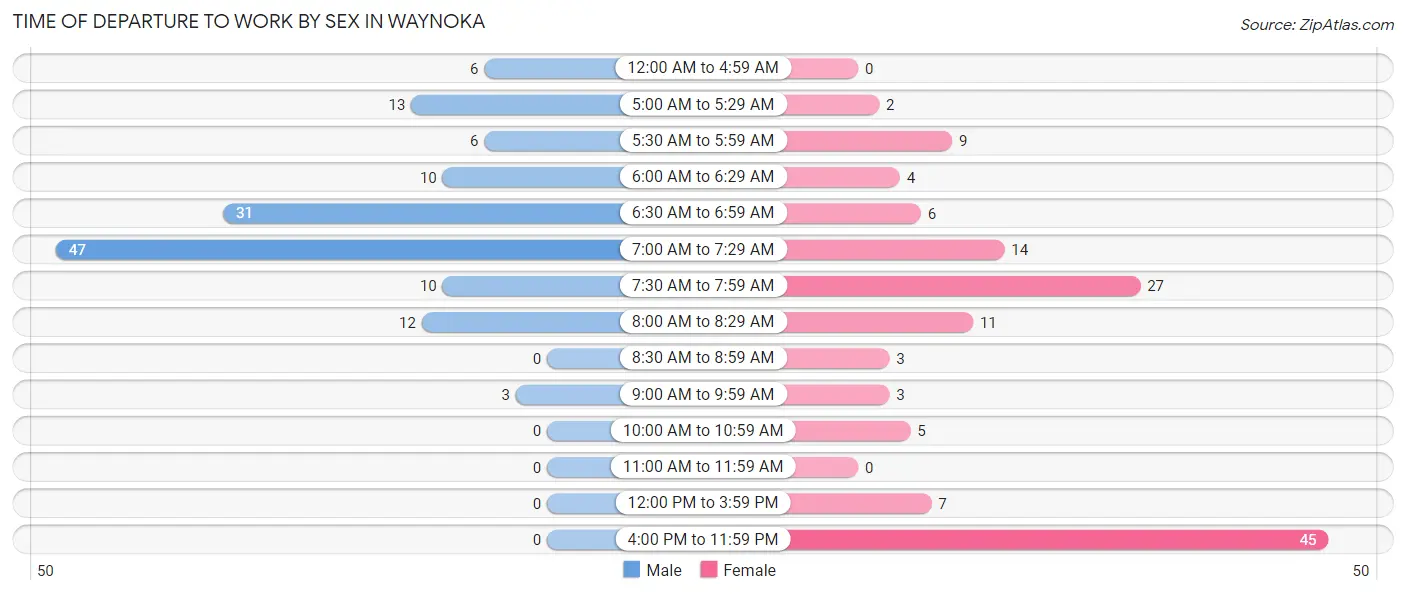
| Time of Departure | Male | Female |
| 12:00 AM to 4:59 AM | 6 (4.3%) | 0 (0.0%) |
| 5:00 AM to 5:29 AM | 13 (9.4%) | 2 (1.5%) |
| 5:30 AM to 5:59 AM | 6 (4.3%) | 9 (6.6%) |
| 6:00 AM to 6:29 AM | 10 (7.2%) | 4 (2.9%) |
| 6:30 AM to 6:59 AM | 31 (22.5%) | 6 (4.4%) |
| 7:00 AM to 7:29 AM | 47 (34.1%) | 14 (10.3%) |
| 7:30 AM to 7:59 AM | 10 (7.2%) | 27 (19.9%) |
| 8:00 AM to 8:29 AM | 12 (8.7%) | 11 (8.1%) |
| 8:30 AM to 8:59 AM | 0 (0.0%) | 3 (2.2%) |
| 9:00 AM to 9:59 AM | 3 (2.2%) | 3 (2.2%) |
| 10:00 AM to 10:59 AM | 0 (0.0%) | 5 (3.7%) |
| 11:00 AM to 11:59 AM | 0 (0.0%) | 0 (0.0%) |
| 12:00 PM to 3:59 PM | 0 (0.0%) | 7 (5.1%) |
| 4:00 PM to 11:59 PM | 0 (0.0%) | 45 (33.1%) |
| Total | 138 (100.0%) | 136 (100.0%) |
Housing Occupancy in Waynoka
Occupancy by Ownership in Waynoka
Of the total 270 dwellings in Waynoka, owner-occupied units account for 201 (74.4%), while renter-occupied units make up 69 (25.6%).
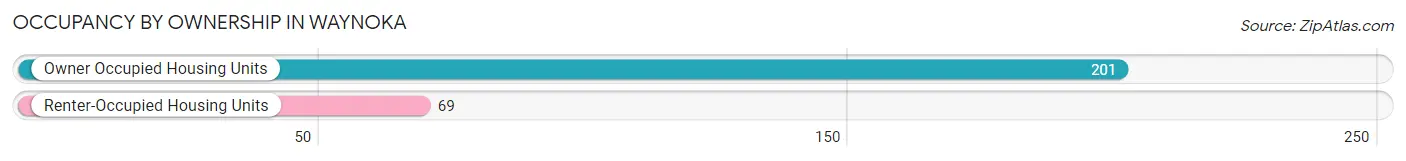
| Occupancy | # Housing Units | % Housing Units |
| Owner Occupied Housing Units | 201 | 74.4% |
| Renter-Occupied Housing Units | 69 | 25.6% |
| Total Occupied Housing Units | 270 | 100.0% |
Occupancy by Household Size in Waynoka
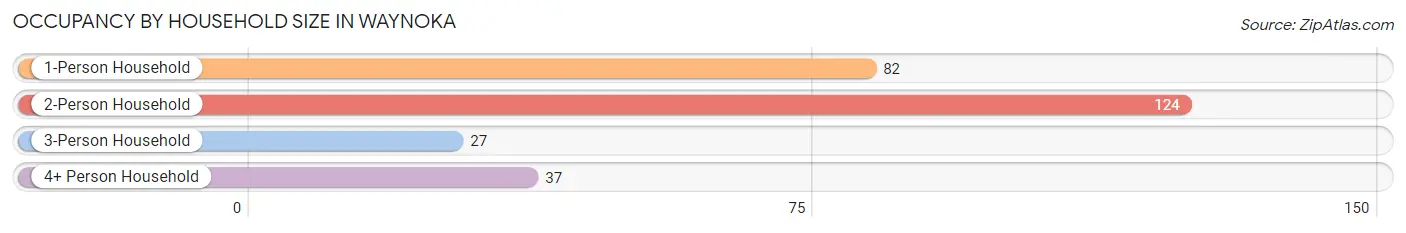
| Household Size | # Housing Units | % Housing Units |
| 1-Person Household | 82 | 30.4% |
| 2-Person Household | 124 | 45.9% |
| 3-Person Household | 27 | 10.0% |
| 4+ Person Household | 37 | 13.7% |
| Total Housing Units | 270 | 100.0% |
Occupancy by Ownership by Household Size in Waynoka
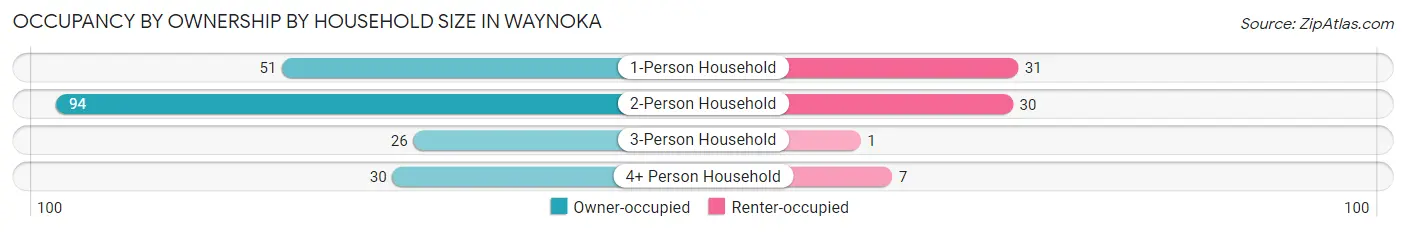
| Household Size | Owner-occupied | Renter-occupied |
| 1-Person Household | 51 (62.2%) | 31 (37.8%) |
| 2-Person Household | 94 (75.8%) | 30 (24.2%) |
| 3-Person Household | 26 (96.3%) | 1 (3.7%) |
| 4+ Person Household | 30 (81.1%) | 7 (18.9%) |
| Total Housing Units | 201 (74.4%) | 69 (25.6%) |
Occupancy by Educational Attainment in Waynoka
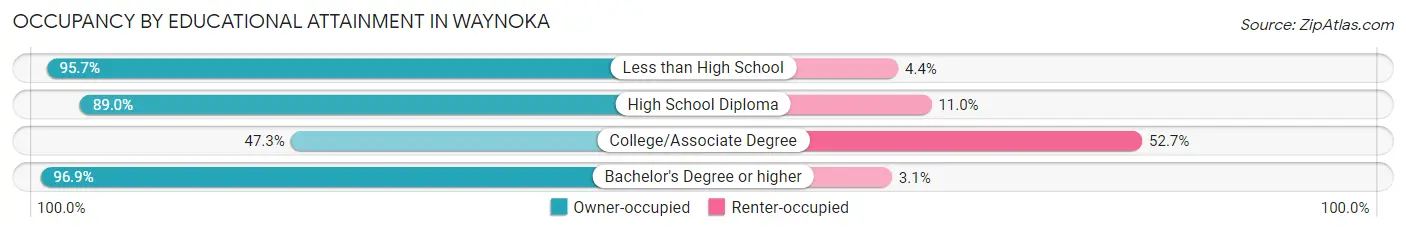
| Household Size | Owner-occupied | Renter-occupied |
| Less than High School | 22 (95.7%) | 1 (4.3%) |
| High School Diploma | 65 (89.0%) | 8 (11.0%) |
| College/Associate Degree | 52 (47.3%) | 58 (52.7%) |
| Bachelor's Degree or higher | 62 (96.9%) | 2 (3.1%) |
Occupancy by Age of Householder in Waynoka
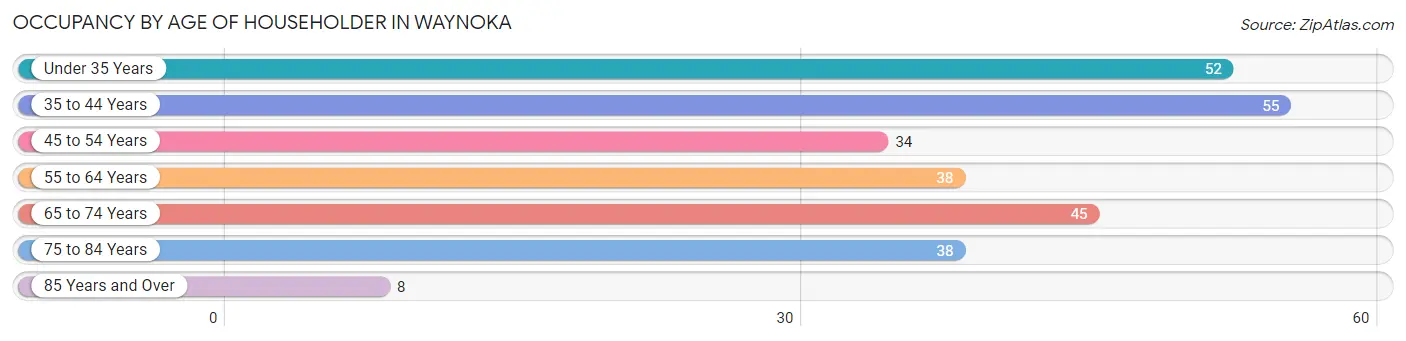
| Age Bracket | # Households | % Households |
| Under 35 Years | 52 | 19.3% |
| 35 to 44 Years | 55 | 20.4% |
| 45 to 54 Years | 34 | 12.6% |
| 55 to 64 Years | 38 | 14.1% |
| 65 to 74 Years | 45 | 16.7% |
| 75 to 84 Years | 38 | 14.1% |
| 85 Years and Over | 8 | 3.0% |
| Total | 270 | 100.0% |
Housing Finances in Waynoka
Median Income by Occupancy in Waynoka
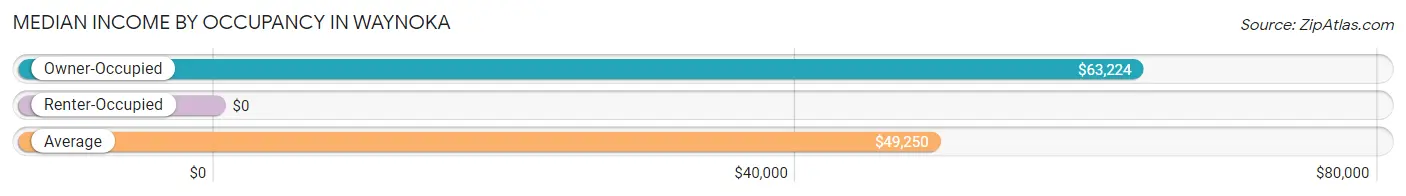
| Occupancy Type | # Households | Median Income |
| Owner-Occupied | 201 (74.4%) | $63,224 |
| Renter-Occupied | 69 (25.6%) | $0 |
| Average | 270 (100.0%) | $49,250 |
Occupancy by Householder Income Bracket in Waynoka
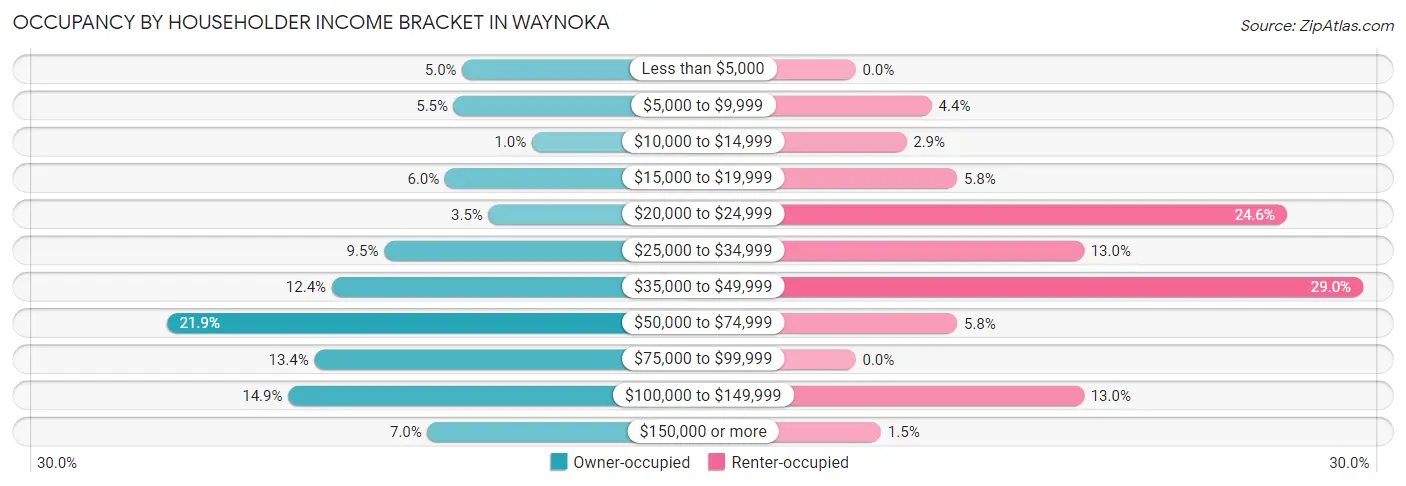
| Income Bracket | Owner-occupied | Renter-occupied |
| Less than $5,000 | 10 (5.0%) | 0 (0.0%) |
| $5,000 to $9,999 | 11 (5.5%) | 3 (4.3%) |
| $10,000 to $14,999 | 2 (1.0%) | 2 (2.9%) |
| $15,000 to $19,999 | 12 (6.0%) | 4 (5.8%) |
| $20,000 to $24,999 | 7 (3.5%) | 17 (24.6%) |
| $25,000 to $34,999 | 19 (9.5%) | 9 (13.0%) |
| $35,000 to $49,999 | 25 (12.4%) | 20 (29.0%) |
| $50,000 to $74,999 | 44 (21.9%) | 4 (5.8%) |
| $75,000 to $99,999 | 27 (13.4%) | 0 (0.0%) |
| $100,000 to $149,999 | 30 (14.9%) | 9 (13.0%) |
| $150,000 or more | 14 (7.0%) | 1 (1.5%) |
| Total | 201 (100.0%) | 69 (100.0%) |
Monthly Housing Cost Tiers in Waynoka
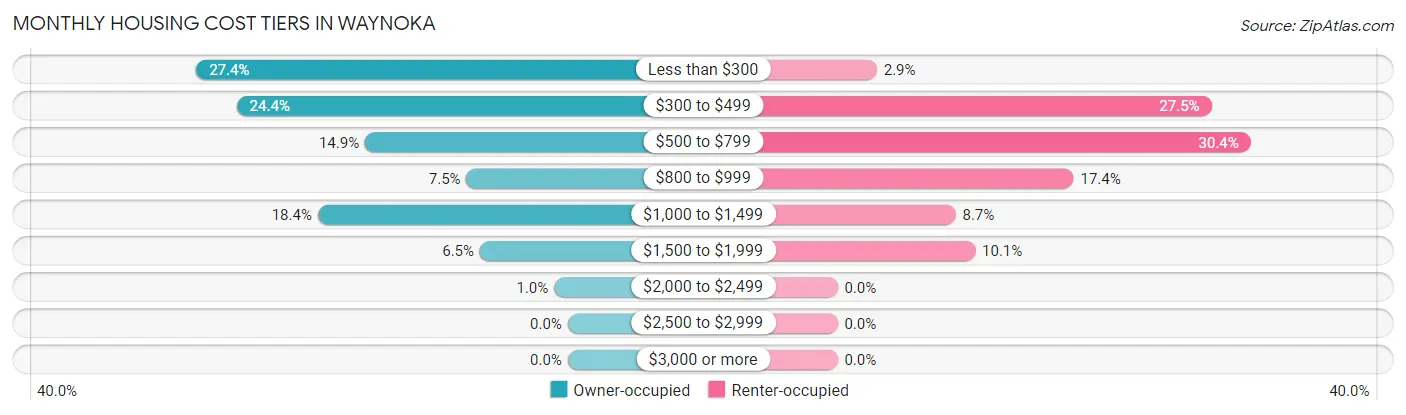
| Monthly Cost | Owner-occupied | Renter-occupied |
| Less than $300 | 55 (27.4%) | 2 (2.9%) |
| $300 to $499 | 49 (24.4%) | 19 (27.5%) |
| $500 to $799 | 30 (14.9%) | 21 (30.4%) |
| $800 to $999 | 15 (7.5%) | 12 (17.4%) |
| $1,000 to $1,499 | 37 (18.4%) | 6 (8.7%) |
| $1,500 to $1,999 | 13 (6.5%) | 7 (10.1%) |
| $2,000 to $2,499 | 2 (1.0%) | 0 (0.0%) |
| $2,500 to $2,999 | 0 (0.0%) | 0 (0.0%) |
| $3,000 or more | 0 (0.0%) | 0 (0.0%) |
| Total | 201 (100.0%) | 69 (100.0%) |
Physical Housing Characteristics in Waynoka
Housing Structures in Waynoka
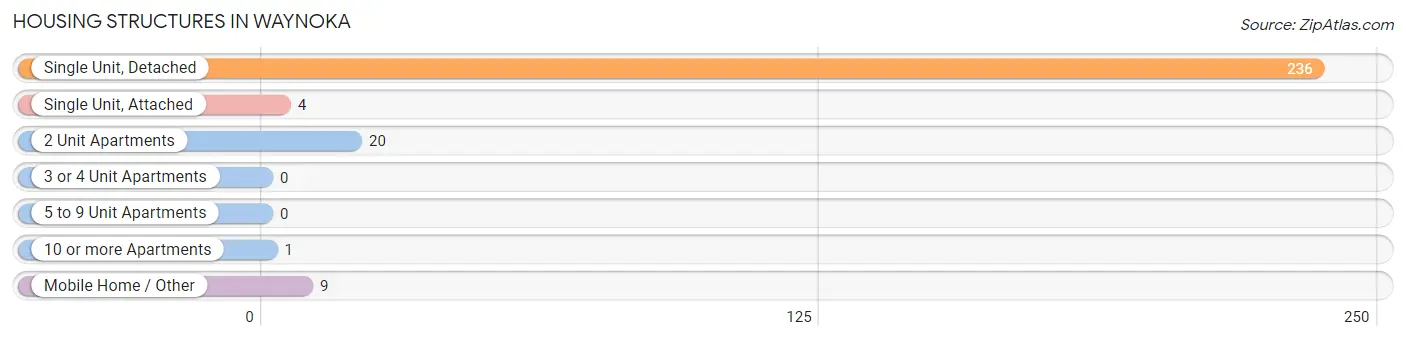
| Structure Type | # Housing Units | % Housing Units |
| Single Unit, Detached | 236 | 87.4% |
| Single Unit, Attached | 4 | 1.5% |
| 2 Unit Apartments | 20 | 7.4% |
| 3 or 4 Unit Apartments | 0 | 0.0% |
| 5 to 9 Unit Apartments | 0 | 0.0% |
| 10 or more Apartments | 1 | 0.4% |
| Mobile Home / Other | 9 | 3.3% |
| Total | 270 | 100.0% |
Housing Structures by Occupancy in Waynoka
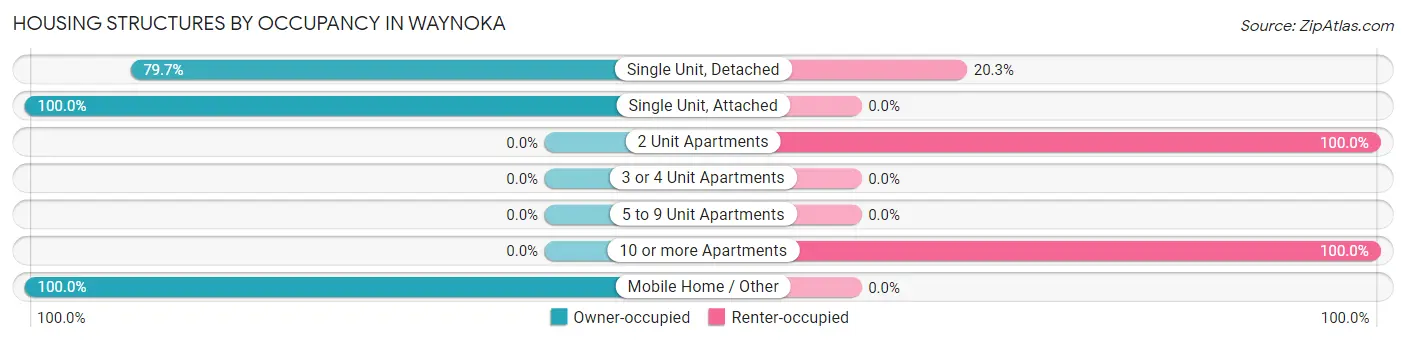
| Structure Type | Owner-occupied | Renter-occupied |
| Single Unit, Detached | 188 (79.7%) | 48 (20.3%) |
| Single Unit, Attached | 4 (100.0%) | 0 (0.0%) |
| 2 Unit Apartments | 0 (0.0%) | 20 (100.0%) |
| 3 or 4 Unit Apartments | 0 (0.0%) | 0 (0.0%) |
| 5 to 9 Unit Apartments | 0 (0.0%) | 0 (0.0%) |
| 10 or more Apartments | 0 (0.0%) | 1 (100.0%) |
| Mobile Home / Other | 9 (100.0%) | 0 (0.0%) |
| Total | 201 (74.4%) | 69 (25.6%) |
Housing Structures by Number of Rooms in Waynoka
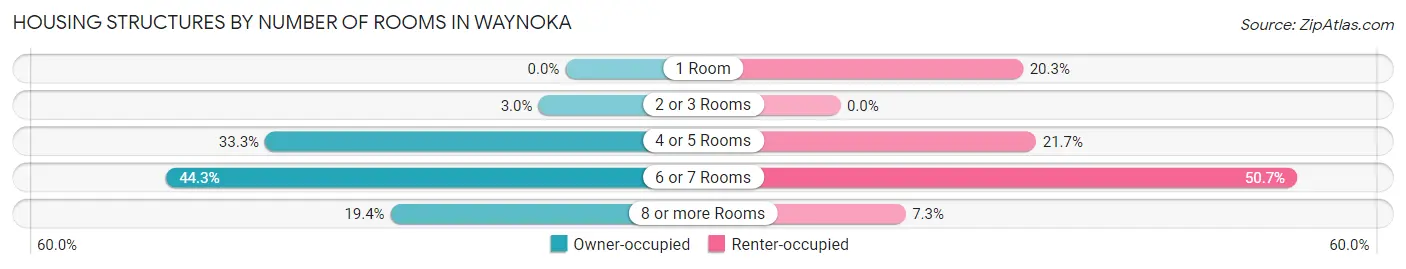
| Number of Rooms | Owner-occupied | Renter-occupied |
| 1 Room | 0 (0.0%) | 14 (20.3%) |
| 2 or 3 Rooms | 6 (3.0%) | 0 (0.0%) |
| 4 or 5 Rooms | 67 (33.3%) | 15 (21.7%) |
| 6 or 7 Rooms | 89 (44.3%) | 35 (50.7%) |
| 8 or more Rooms | 39 (19.4%) | 5 (7.2%) |
| Total | 201 (100.0%) | 69 (100.0%) |
Housing Structure by Heating Type in Waynoka
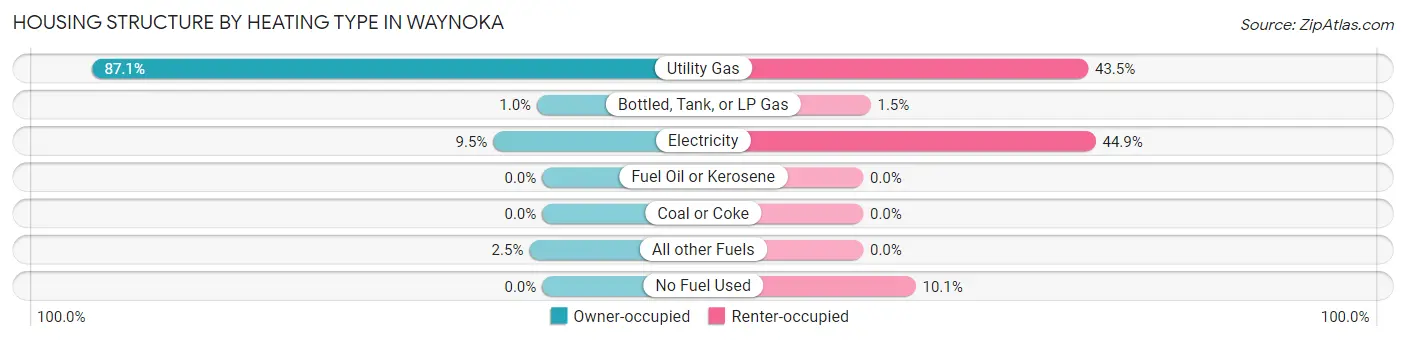
| Heating Type | Owner-occupied | Renter-occupied |
| Utility Gas | 175 (87.1%) | 30 (43.5%) |
| Bottled, Tank, or LP Gas | 2 (1.0%) | 1 (1.5%) |
| Electricity | 19 (9.5%) | 31 (44.9%) |
| Fuel Oil or Kerosene | 0 (0.0%) | 0 (0.0%) |
| Coal or Coke | 0 (0.0%) | 0 (0.0%) |
| All other Fuels | 5 (2.5%) | 0 (0.0%) |
| No Fuel Used | 0 (0.0%) | 7 (10.1%) |
| Total | 201 (100.0%) | 69 (100.0%) |
Household Vehicle Usage in Waynoka
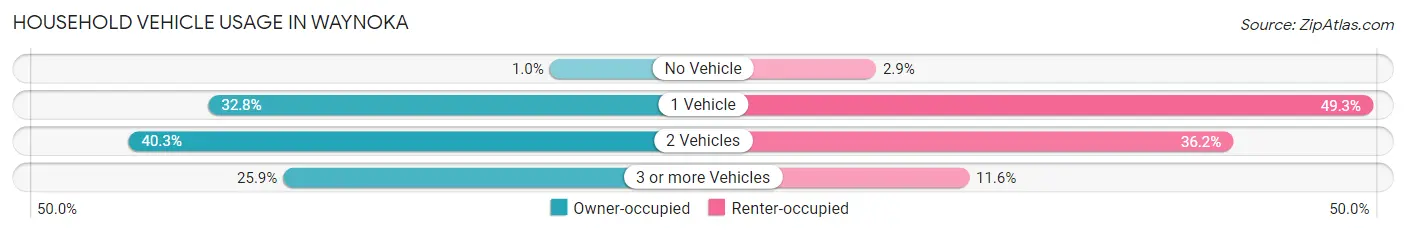
| Vehicles per Household | Owner-occupied | Renter-occupied |
| No Vehicle | 2 (1.0%) | 2 (2.9%) |
| 1 Vehicle | 66 (32.8%) | 34 (49.3%) |
| 2 Vehicles | 81 (40.3%) | 25 (36.2%) |
| 3 or more Vehicles | 52 (25.9%) | 8 (11.6%) |
| Total | 201 (100.0%) | 69 (100.0%) |
Real Estate & Mortgages in Waynoka
Real Estate and Mortgage Overview in Waynoka
| Characteristic | Without Mortgage | With Mortgage |
| Housing Units | 130 | 71 |
| Median Property Value | $68,300 | $133,600 |
| Median Household Income | $46,250 | $7 |
| Monthly Housing Costs | $322 | $0 |
| Real Estate Taxes | $371 | $0 |
Property Value by Mortgage Status in Waynoka
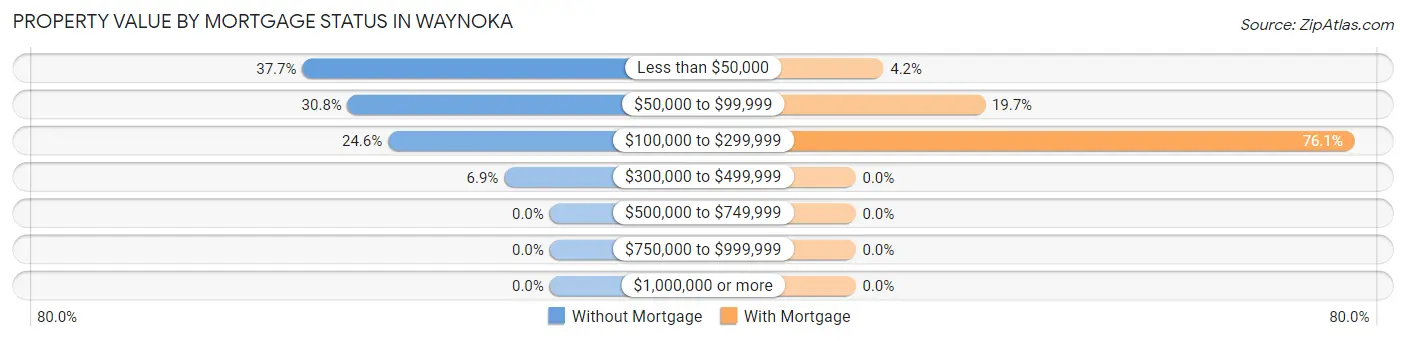
| Property Value | Without Mortgage | With Mortgage |
| Less than $50,000 | 49 (37.7%) | 3 (4.2%) |
| $50,000 to $99,999 | 40 (30.8%) | 14 (19.7%) |
| $100,000 to $299,999 | 32 (24.6%) | 54 (76.1%) |
| $300,000 to $499,999 | 9 (6.9%) | 0 (0.0%) |
| $500,000 to $749,999 | 0 (0.0%) | 0 (0.0%) |
| $750,000 to $999,999 | 0 (0.0%) | 0 (0.0%) |
| $1,000,000 or more | 0 (0.0%) | 0 (0.0%) |
| Total | 130 (100.0%) | 71 (100.0%) |
Household Income by Mortgage Status in Waynoka
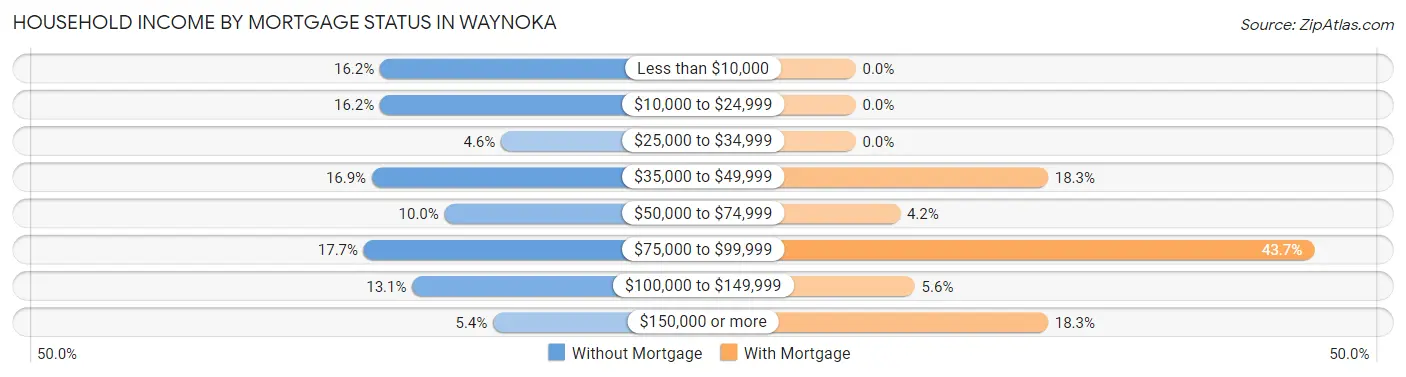
| Household Income | Without Mortgage | With Mortgage |
| Less than $10,000 | 21 (16.2%) | 0 (0.0%) |
| $10,000 to $24,999 | 21 (16.2%) | 0 (0.0%) |
| $25,000 to $34,999 | 6 (4.6%) | 0 (0.0%) |
| $35,000 to $49,999 | 22 (16.9%) | 13 (18.3%) |
| $50,000 to $74,999 | 13 (10.0%) | 3 (4.2%) |
| $75,000 to $99,999 | 23 (17.7%) | 31 (43.7%) |
| $100,000 to $149,999 | 17 (13.1%) | 4 (5.6%) |
| $150,000 or more | 7 (5.4%) | 13 (18.3%) |
| Total | 130 (100.0%) | 71 (100.0%) |
Property Value to Household Income Ratio in Waynoka
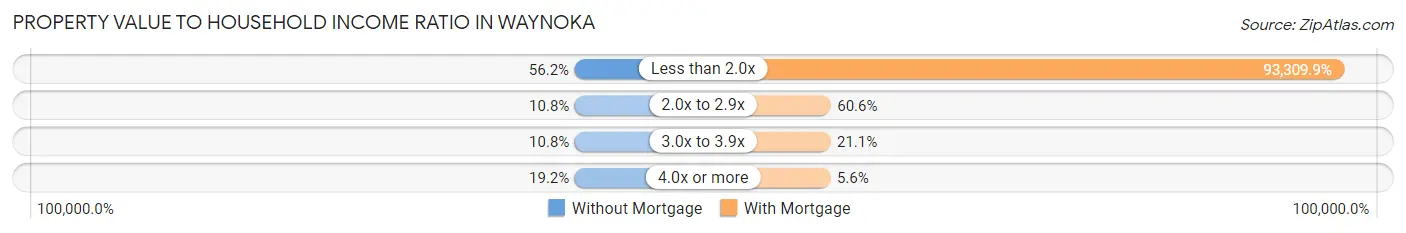
| Value-to-Income Ratio | Without Mortgage | With Mortgage |
| Less than 2.0x | 73 (56.1%) | 66,250 (93,309.9%) |
| 2.0x to 2.9x | 14 (10.8%) | 43 (60.6%) |
| 3.0x to 3.9x | 14 (10.8%) | 15 (21.1%) |
| 4.0x or more | 25 (19.2%) | 4 (5.6%) |
| Total | 130 (100.0%) | 71 (100.0%) |
Real Estate Taxes by Mortgage Status in Waynoka
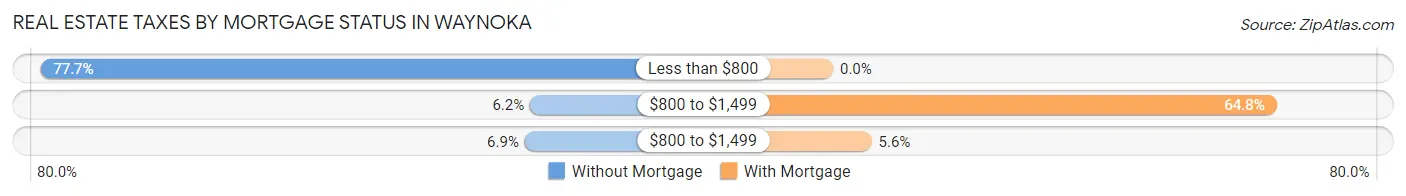
| Property Taxes | Without Mortgage | With Mortgage |
| Less than $800 | 101 (77.7%) | 0 (0.0%) |
| $800 to $1,499 | 8 (6.1%) | 46 (64.8%) |
| $800 to $1,499 | 9 (6.9%) | 4 (5.6%) |
| Total | 130 (100.0%) | 71 (100.0%) |
Health & Disability in Waynoka
Health Insurance Coverage by Age in Waynoka
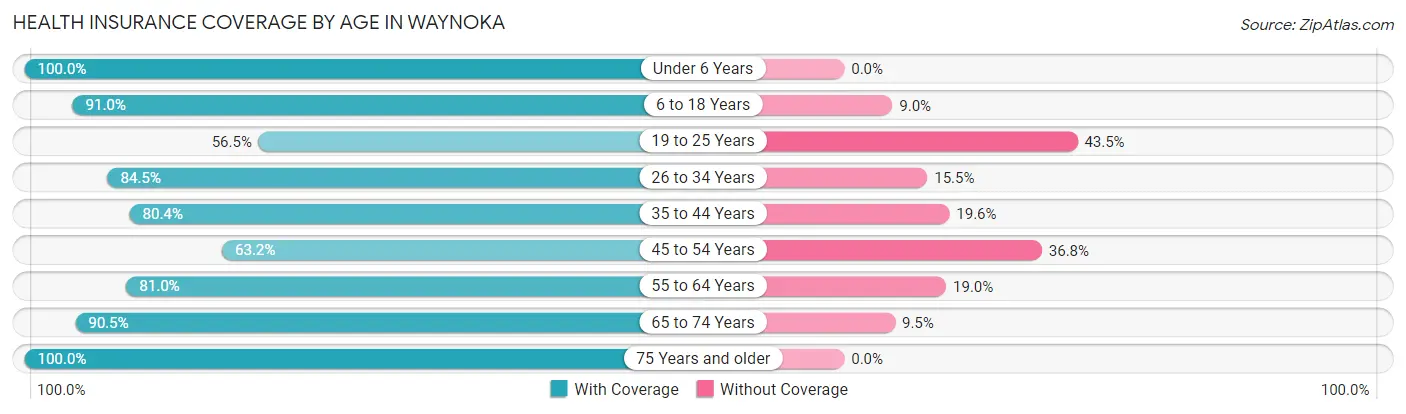
| Age Bracket | With Coverage | Without Coverage |
| Under 6 Years | 55 (100.0%) | 0 (0.0%) |
| 6 to 18 Years | 193 (91.0%) | 19 (9.0%) |
| 19 to 25 Years | 13 (56.5%) | 10 (43.5%) |
| 26 to 34 Years | 71 (84.5%) | 13 (15.5%) |
| 35 to 44 Years | 78 (80.4%) | 19 (19.6%) |
| 45 to 54 Years | 36 (63.2%) | 21 (36.8%) |
| 55 to 64 Years | 64 (81.0%) | 15 (19.0%) |
| 65 to 74 Years | 67 (90.5%) | 7 (9.5%) |
| 75 Years and older | 60 (100.0%) | 0 (0.0%) |
| Total | 637 (86.0%) | 104 (14.0%) |
Health Insurance Coverage by Citizenship Status in Waynoka
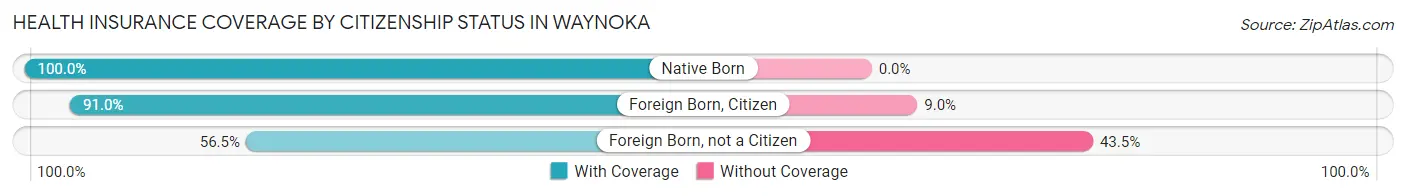
| Citizenship Status | With Coverage | Without Coverage |
| Native Born | 55 (100.0%) | 0 (0.0%) |
| Foreign Born, Citizen | 193 (91.0%) | 19 (9.0%) |
| Foreign Born, not a Citizen | 13 (56.5%) | 10 (43.5%) |
Health Insurance Coverage by Household Income in Waynoka
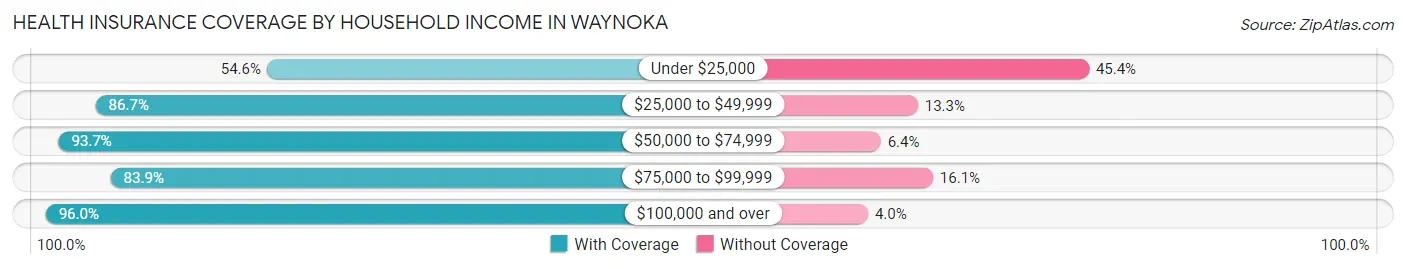
| Household Income | With Coverage | Without Coverage |
| Under $25,000 | 59 (54.6%) | 49 (45.4%) |
| $25,000 to $49,999 | 189 (86.7%) | 29 (13.3%) |
| $50,000 to $74,999 | 118 (93.6%) | 8 (6.4%) |
| $75,000 to $99,999 | 52 (83.9%) | 10 (16.1%) |
| $100,000 and over | 194 (96.0%) | 8 (4.0%) |
Public vs Private Health Insurance Coverage by Age in Waynoka
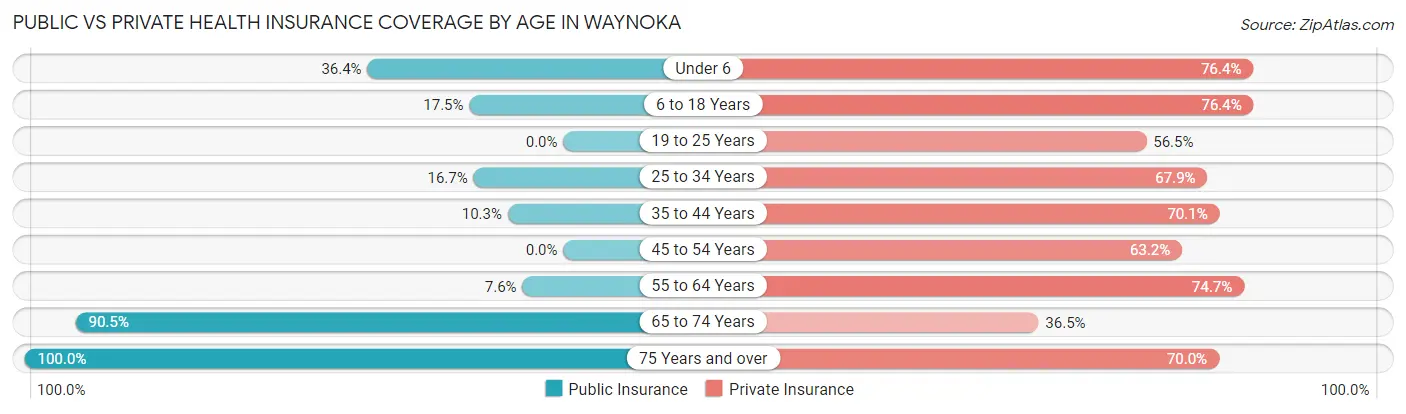
| Age Bracket | Public Insurance | Private Insurance |
| Under 6 | 20 (36.4%) | 42 (76.4%) |
| 6 to 18 Years | 37 (17.4%) | 162 (76.4%) |
| 19 to 25 Years | 0 (0.0%) | 13 (56.5%) |
| 25 to 34 Years | 14 (16.7%) | 57 (67.9%) |
| 35 to 44 Years | 10 (10.3%) | 68 (70.1%) |
| 45 to 54 Years | 0 (0.0%) | 36 (63.2%) |
| 55 to 64 Years | 6 (7.6%) | 59 (74.7%) |
| 65 to 74 Years | 67 (90.5%) | 27 (36.5%) |
| 75 Years and over | 60 (100.0%) | 42 (70.0%) |
| Total | 214 (28.9%) | 506 (68.3%) |
Disability Status by Sex by Age in Waynoka
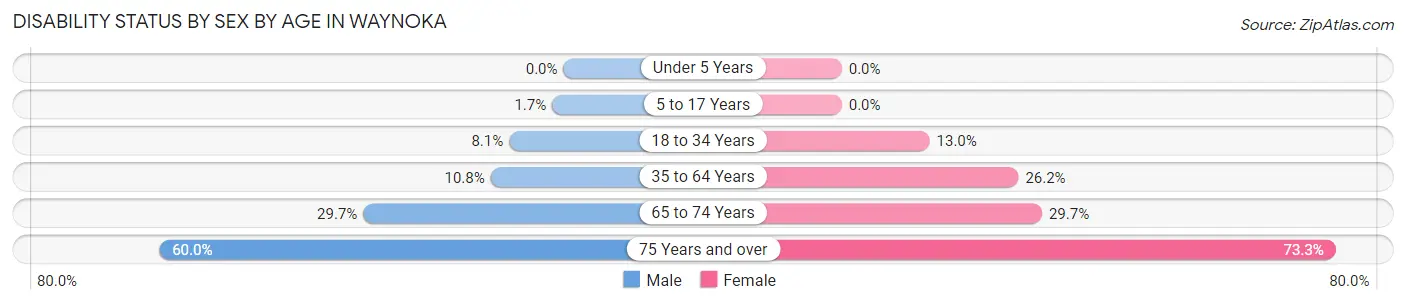
| Age Bracket | Male | Female |
| Under 5 Years | 0 (0.0%) | 0 (0.0%) |
| 5 to 17 Years | 2 (1.7%) | 0 (0.0%) |
| 18 to 34 Years | 5 (8.1%) | 6 (13.0%) |
| 35 to 64 Years | 12 (10.8%) | 32 (26.2%) |
| 65 to 74 Years | 11 (29.7%) | 11 (29.7%) |
| 75 Years and over | 18 (60.0%) | 22 (73.3%) |
Disability Class by Sex by Age in Waynoka
Disability Class: Hearing Difficulty
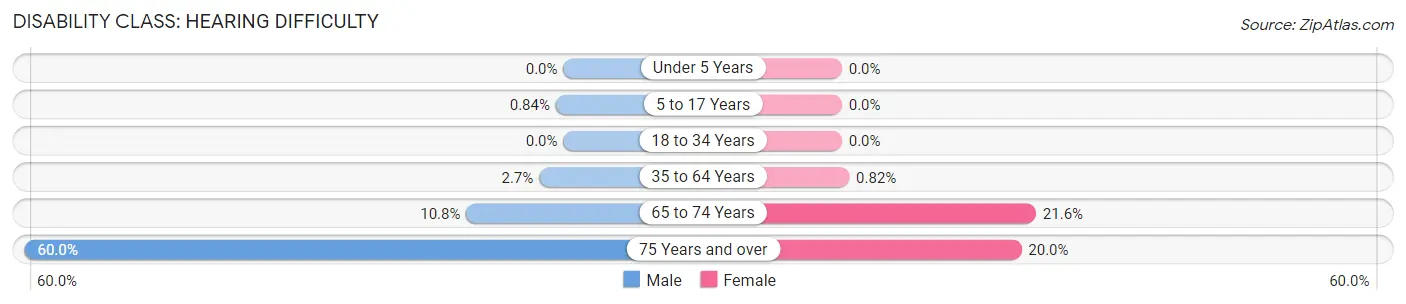
| Age Bracket | Male | Female |
| Under 5 Years | 0 (0.0%) | 0 (0.0%) |
| 5 to 17 Years | 1 (0.8%) | 0 (0.0%) |
| 18 to 34 Years | 0 (0.0%) | 0 (0.0%) |
| 35 to 64 Years | 3 (2.7%) | 1 (0.8%) |
| 65 to 74 Years | 4 (10.8%) | 8 (21.6%) |
| 75 Years and over | 18 (60.0%) | 6 (20.0%) |
Disability Class: Vision Difficulty
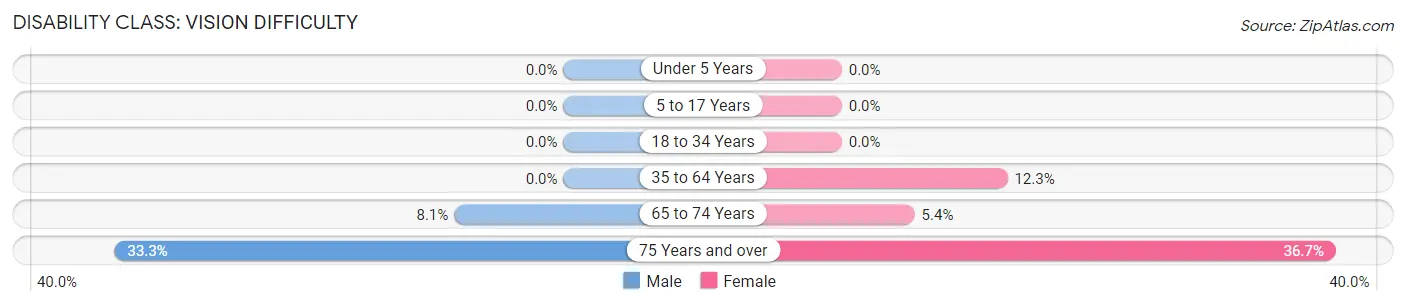
| Age Bracket | Male | Female |
| Under 5 Years | 0 (0.0%) | 0 (0.0%) |
| 5 to 17 Years | 0 (0.0%) | 0 (0.0%) |
| 18 to 34 Years | 0 (0.0%) | 0 (0.0%) |
| 35 to 64 Years | 0 (0.0%) | 15 (12.3%) |
| 65 to 74 Years | 3 (8.1%) | 2 (5.4%) |
| 75 Years and over | 10 (33.3%) | 11 (36.7%) |
Disability Class: Cognitive Difficulty
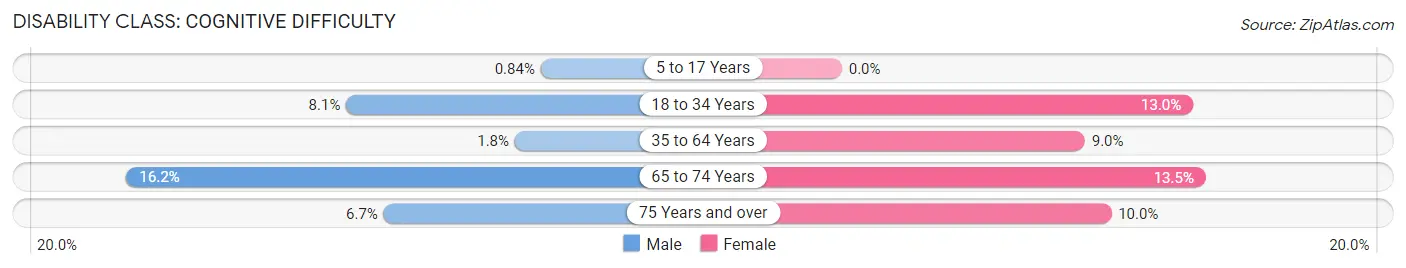
| Age Bracket | Male | Female |
| 5 to 17 Years | 1 (0.8%) | 0 (0.0%) |
| 18 to 34 Years | 5 (8.1%) | 6 (13.0%) |
| 35 to 64 Years | 2 (1.8%) | 11 (9.0%) |
| 65 to 74 Years | 6 (16.2%) | 5 (13.5%) |
| 75 Years and over | 2 (6.7%) | 3 (10.0%) |
Disability Class: Ambulatory Difficulty
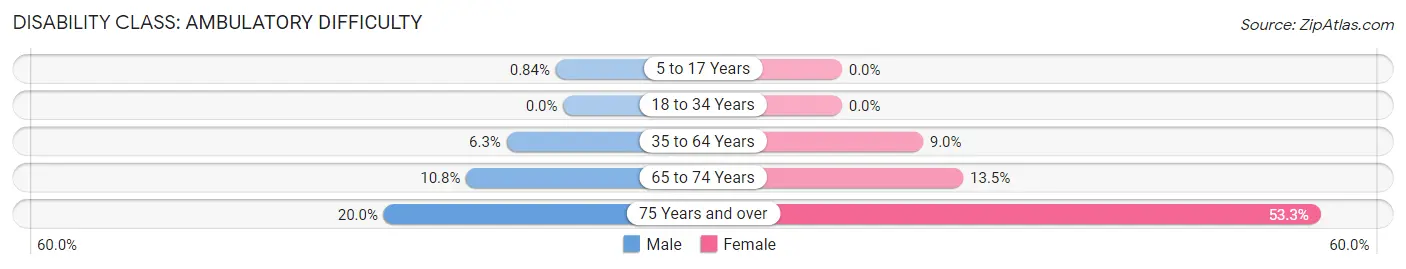
| Age Bracket | Male | Female |
| 5 to 17 Years | 1 (0.8%) | 0 (0.0%) |
| 18 to 34 Years | 0 (0.0%) | 0 (0.0%) |
| 35 to 64 Years | 7 (6.3%) | 11 (9.0%) |
| 65 to 74 Years | 4 (10.8%) | 5 (13.5%) |
| 75 Years and over | 6 (20.0%) | 16 (53.3%) |
Disability Class: Self-Care Difficulty
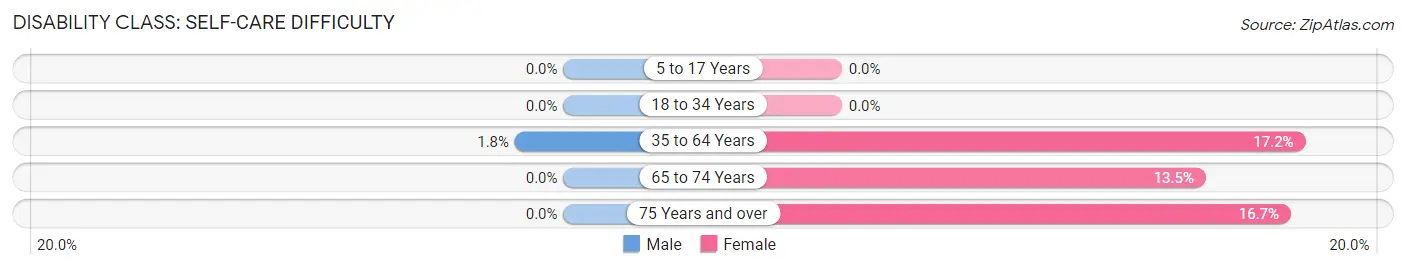
| Age Bracket | Male | Female |
| 5 to 17 Years | 0 (0.0%) | 0 (0.0%) |
| 18 to 34 Years | 0 (0.0%) | 0 (0.0%) |
| 35 to 64 Years | 2 (1.8%) | 21 (17.2%) |
| 65 to 74 Years | 0 (0.0%) | 5 (13.5%) |
| 75 Years and over | 0 (0.0%) | 5 (16.7%) |
Technology Access in Waynoka
Computing Device Access in Waynoka
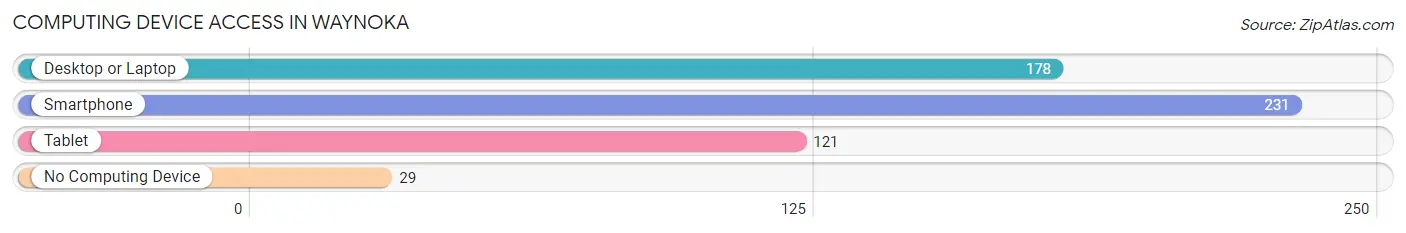
| Device Type | # Households | % Households |
| Desktop or Laptop | 178 | 65.9% |
| Smartphone | 231 | 85.6% |
| Tablet | 121 | 44.8% |
| No Computing Device | 29 | 10.7% |
| Total | 270 | 100.0% |
Internet Access in Waynoka
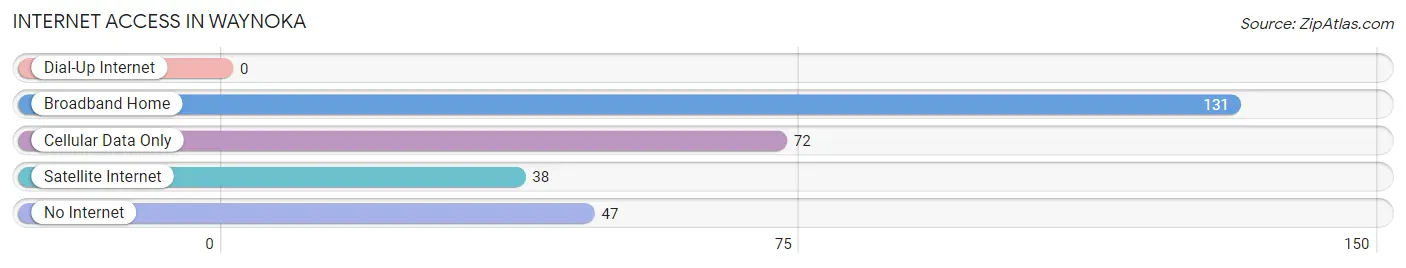
| Internet Type | # Households | % Households |
| Dial-Up Internet | 0 | 0.0% |
| Broadband Home | 131 | 48.5% |
| Cellular Data Only | 72 | 26.7% |
| Satellite Internet | 38 | 14.1% |
| No Internet | 47 | 17.4% |
| Total | 270 | 100.0% |
Waynoka Summary
Waynoka is a small town located in Woods County, Oklahoma. It is situated in the northwest corner of the state, approximately 90 miles northwest of Oklahoma City. The town was founded in 1901 and was named after the nearby Waynoka Creek. As of the 2010 census, the population of Waynoka was 1,521.
Geography
Waynoka is located at the intersection of U.S. Highway 281 and State Highway 45. It is situated in the northwest corner of Woods County, approximately 90 miles northwest of Oklahoma City. The town is located in the Red Bed Plains region of Oklahoma, which is characterized by flat terrain and sandy soils. The area is also known for its rolling hills and grasslands. The nearest major cities are Woodward, Oklahoma, approximately 30 miles to the north, and Enid, Oklahoma, approximately 40 miles to the south.
Climate
Waynoka has a humid subtropical climate, with hot summers and cold winters. The average annual temperature is 61°F, with an average high of 79°F in July and an average low of 43°F in January. The average annual precipitation is 33.5 inches, with an average of 4.5 inches of snowfall per year.
Economy
Waynoka’s economy is largely based on agriculture and oil production. The town is home to several grain elevators, as well as a number of oil and gas wells. The town is also home to a number of small businesses, including a grocery store, a hardware store, and a restaurant.
Demographics
As of the 2010 census, the population of Waynoka was 1,521. The racial makeup of the town was 95.2% White, 0.7% African American, 0.7% Native American, 0.2% Asian, 0.1% Pacific Islander, and 2.3% from other races. The median household income was $35,938, and the median family income was $41,250. The per capita income was $17,845.
Conclusion
Waynoka is a small town located in Woods County, Oklahoma. It is situated in the northwest corner of the state, approximately 90 miles northwest of Oklahoma City. The town was founded in 1901 and was named after the nearby Waynoka Creek. As of the 2010 census, the population of Waynoka was 1,521. The town’s economy is largely based on agriculture and oil production, and the town is home to several grain elevators, as well as a number of oil and gas wells. The racial makeup of the town was 95.2% White, 0.7% African American, 0.7% Native American, 0.2% Asian, 0.1% Pacific Islander, and 2.3% from other races. The median household income was $35,938, and the median family income was $41,250. The per capita income was $17,845.
Common Questions
What is Per Capita Income in Waynoka?
Per Capita income in Waynoka is $24,663.
What is the Median Family Income in Waynoka?
Median Family Income in Waynoka is $66,667.
What is the Median Household income in Waynoka?
Median Household Income in Waynoka is $49,250.
What is Income or Wage Gap in Waynoka?
Income or Wage Gap in Waynoka is 42.0%.
Women in Waynoka earn 58.0 cents for every dollar earned by a man.
What is Inequality or Gini Index in Waynoka?
Inequality or Gini Index in Waynoka is 0.42.
What is the Total Population of Waynoka?
Total Population of Waynoka is 760.
What is the Total Male Population of Waynoka?
Total Male Population of Waynoka is 387.
What is the Total Female Population of Waynoka?
Total Female Population of Waynoka is 373.
What is the Ratio of Males per 100 Females in Waynoka?
There are 103.75 Males per 100 Females in Waynoka.
What is the Ratio of Females per 100 Males in Waynoka?
There are 96.38 Females per 100 Males in Waynoka.
What is the Median Population Age in Waynoka?
Median Population Age in Waynoka is 36.3 Years.
What is the Average Family Size in Waynoka
Average Family Size in Waynoka is 3.4 People.
What is the Average Household Size in Waynoka
Average Household Size in Waynoka is 2.6 People.
How Large is the Labor Force in Waynoka?
There are 308 People in the Labor Forcein in Waynoka.
What is the Percentage of People in the Labor Force in Waynoka?
52.3% of People are in the Labor Force in Waynoka.
What is the Unemployment Rate in Waynoka?
Unemployment Rate in Waynoka is 7.5%.