Long, OK Map & Demographics
Long Map
Long Overview
$21,980
PER CAPITA INCOME
$46,500
AVG FAMILY INCOME
$46,667
AVG HOUSEHOLD INCOME
0.34
INEQUALITY / GINI INDEX
390
TOTAL POPULATION
216
MALE POPULATION
174
FEMALE POPULATION
124.14
MALES / 100 FEMALES
80.56
FEMALES / 100 MALES
28.8
MEDIAN AGE
3.5
AVG FAMILY SIZE
2.8
AVG HOUSEHOLD SIZE
156
LABOR FORCE [ PEOPLE ]
61.4%
PERCENT IN LABOR FORCE
Income in Long
Income Overview in Long
Per Capita Income in Long is $21,980, while median incomes of families and households are $46,500 and $46,667 respectively.
| Characteristic | Number | Measure |
| Per Capita Income | 390 | $21,980 |
| Median Family Income | 102 | $46,500 |
| Mean Family Income | 102 | $69,451 |
| Median Household Income | 140 | $46,667 |
| Mean Household Income | 140 | $65,289 |
| Income Deficit | 102 | $0 |
| Wage / Income Gap (%) | 390 | 0.00% |
| Wage / Income Gap ($) | 390 | 100.00¢ per $1 |
| Gini / Inequality Index | 390 | 0.34 |
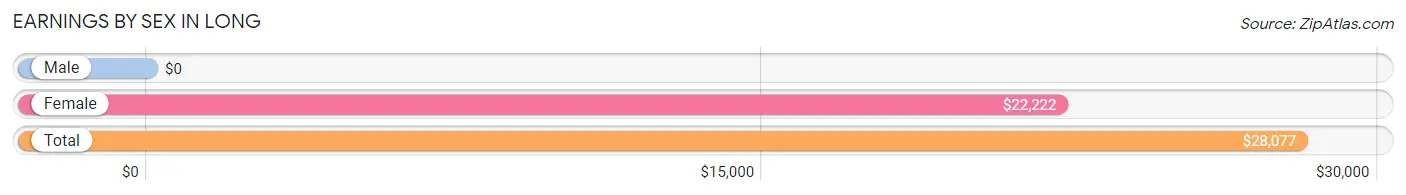
Earnings by Sex in Long
| Sex | Number | Average Earnings |
| Male | 86 (50.6%) | $0 |
| Female | 84 (49.4%) | $22,222 |
| Total | 170 (100.0%) | $28,077 |
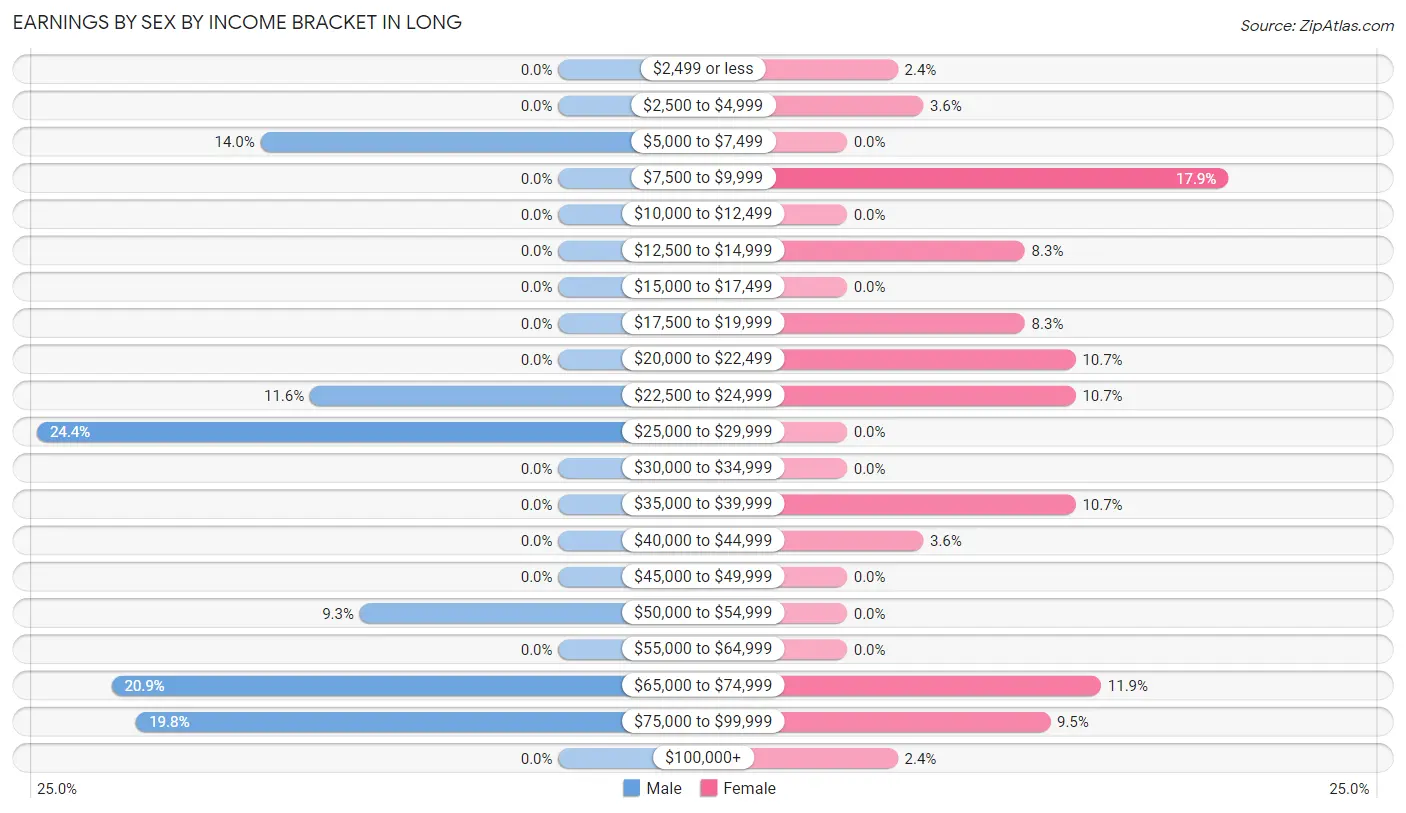
Earnings by Sex by Income Bracket in Long
The most common earnings brackets in Long are $25,000 to $29,999 for men (21 | 24.4%) and $7,500 to $9,999 for women (15 | 17.9%).
| Income | Male | Female |
| $2,499 or less | 0 (0.0%) | 2 (2.4%) |
| $2,500 to $4,999 | 0 (0.0%) | 3 (3.6%) |
| $5,000 to $7,499 | 12 (14.0%) | 0 (0.0%) |
| $7,500 to $9,999 | 0 (0.0%) | 15 (17.9%) |
| $10,000 to $12,499 | 0 (0.0%) | 0 (0.0%) |
| $12,500 to $14,999 | 0 (0.0%) | 7 (8.3%) |
| $15,000 to $17,499 | 0 (0.0%) | 0 (0.0%) |
| $17,500 to $19,999 | 0 (0.0%) | 7 (8.3%) |
| $20,000 to $22,499 | 0 (0.0%) | 9 (10.7%) |
| $22,500 to $24,999 | 10 (11.6%) | 9 (10.7%) |
| $25,000 to $29,999 | 21 (24.4%) | 0 (0.0%) |
| $30,000 to $34,999 | 0 (0.0%) | 0 (0.0%) |
| $35,000 to $39,999 | 0 (0.0%) | 9 (10.7%) |
| $40,000 to $44,999 | 0 (0.0%) | 3 (3.6%) |
| $45,000 to $49,999 | 0 (0.0%) | 0 (0.0%) |
| $50,000 to $54,999 | 8 (9.3%) | 0 (0.0%) |
| $55,000 to $64,999 | 0 (0.0%) | 0 (0.0%) |
| $65,000 to $74,999 | 18 (20.9%) | 10 (11.9%) |
| $75,000 to $99,999 | 17 (19.8%) | 8 (9.5%) |
| $100,000+ | 0 (0.0%) | 2 (2.4%) |
| Total | 86 (100.0%) | 84 (100.0%) |
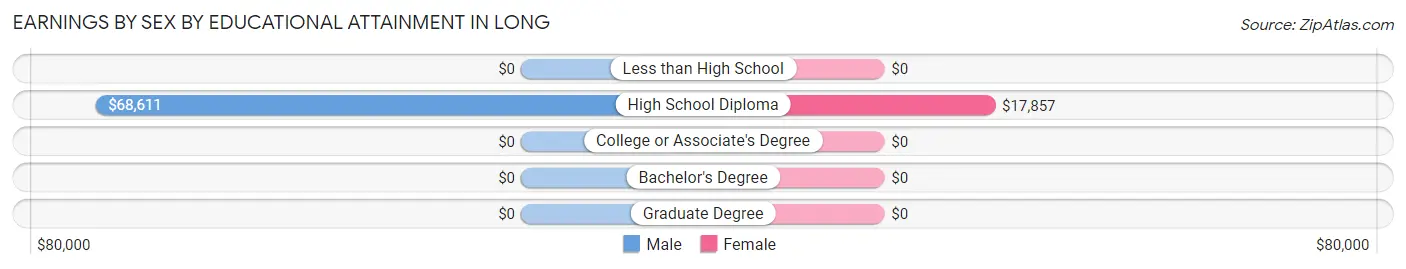
Earnings by Sex by Educational Attainment in Long
Average earnings in Long are $67,778 for men and $22,917 for women, a difference of 66.2%. Men with an educational attainment of high school diploma enjoy the highest average annual earnings of $68,611, while those with high school diploma education earn the least with $68,611. Women with an educational attainment of high school diploma earn the most with the average annual earnings of $17,857, while those with high school diploma education have the smallest earnings of $17,857.
| Educational Attainment | Male Income | Female Income |
| Less than High School | - | - |
| High School Diploma | $68,611 | $17,857 |
| College or Associate's Degree | - | - |
| Bachelor's Degree | - | - |
| Graduate Degree | - | - |
| Total | $67,778 | $22,917 |
Family Income in Long
Family Income Brackets in Long
According to the Long family income data, there are 43 families falling into the $35,000 to $49,999 income range, which is the most common income bracket and makes up 42.2% of all families.
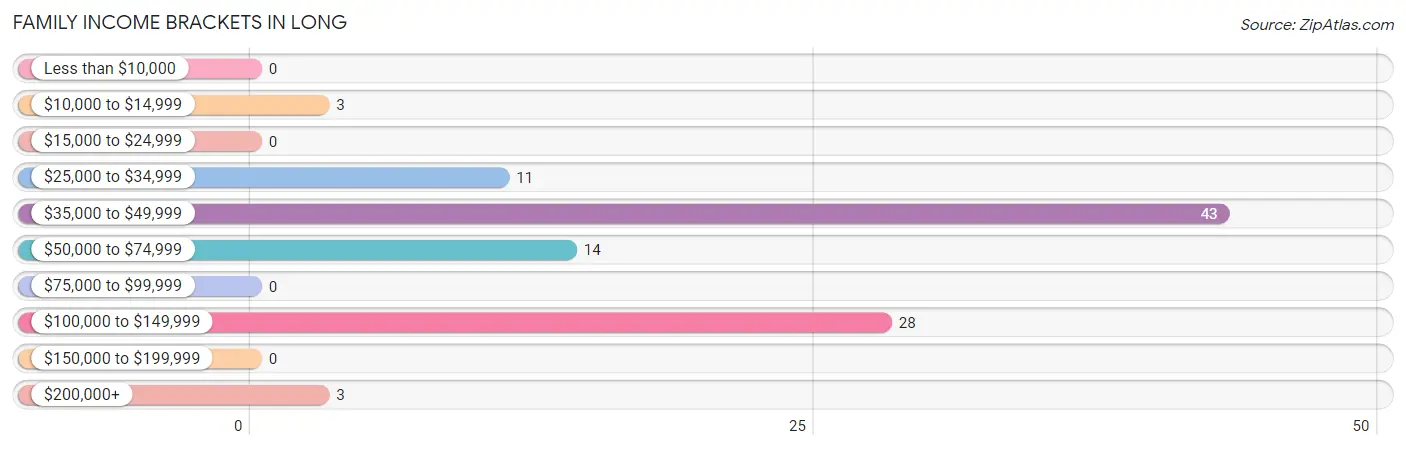
| Income Bracket | # Families | % Families |
| Less than $10,000 | 0 | 0.0% |
| $10,000 to $14,999 | 3 | 2.9% |
| $15,000 to $24,999 | 0 | 0.0% |
| $25,000 to $34,999 | 11 | 10.8% |
| $35,000 to $49,999 | 43 | 42.2% |
| $50,000 to $74,999 | 14 | 13.7% |
| $75,000 to $99,999 | 0 | 0.0% |
| $100,000 to $149,999 | 28 | 27.5% |
| $150,000 to $199,999 | 0 | 0.0% |
| $200,000+ | 3 | 2.9% |
Family Income by Famaliy Size in Long
2-person families (54 | 52.9%) account for the highest median family income in Long with $46,333 per family, while 2-person families (54 | 52.9%) have the highest median income of $23,166 per family member.
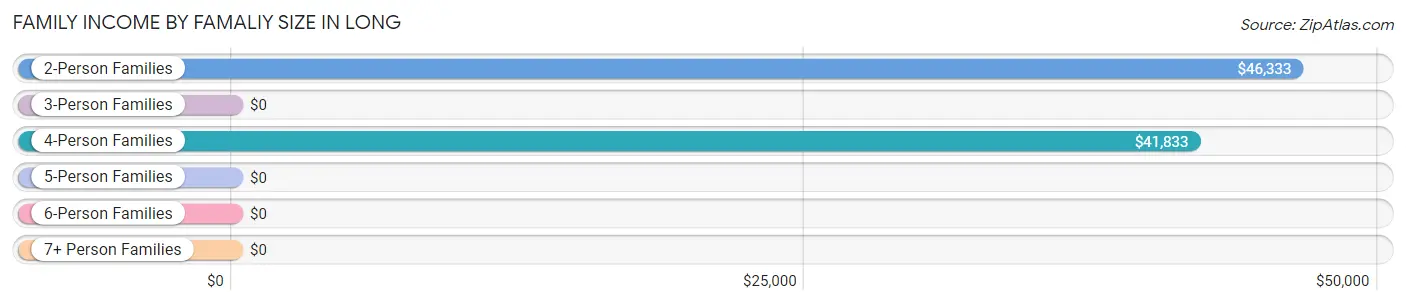
| Income Bracket | # Families | Median Income |
| 2-Person Families | 54 (52.9%) | $46,333 |
| 3-Person Families | 6 (5.9%) | $0 |
| 4-Person Families | 22 (21.6%) | $41,833 |
| 5-Person Families | 18 (17.6%) | $0 |
| 6-Person Families | 2 (2.0%) | $0 |
| 7+ Person Families | 0 (0.0%) | $0 |
| Total | 102 (100.0%) | $46,500 |
Family Income by Number of Earners in Long
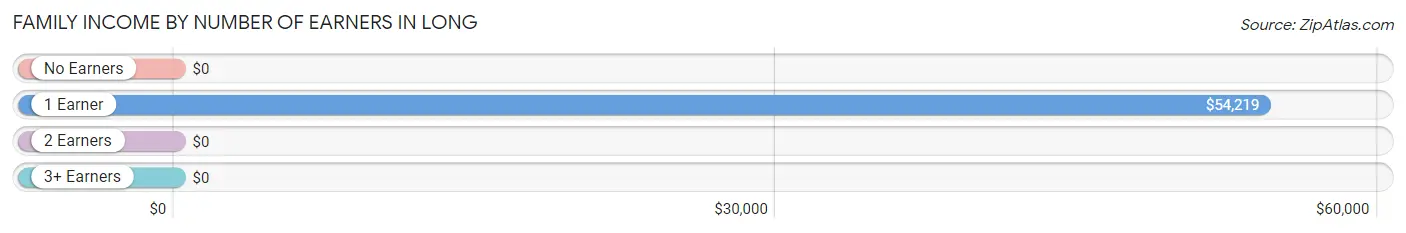
| Number of Earners | # Families | Median Income |
| No Earners | 23 (22.6%) | $0 |
| 1 Earner | 17 (16.7%) | $54,219 |
| 2 Earners | 47 (46.1%) | $0 |
| 3+ Earners | 15 (14.7%) | $0 |
| Total | 102 (100.0%) | $46,500 |
Household Income in Long
Household Income Brackets in Long
With 43 households falling in the category, the $35,000 to $49,999 income range is the most frequent in Long, accounting for 30.7% of all households.
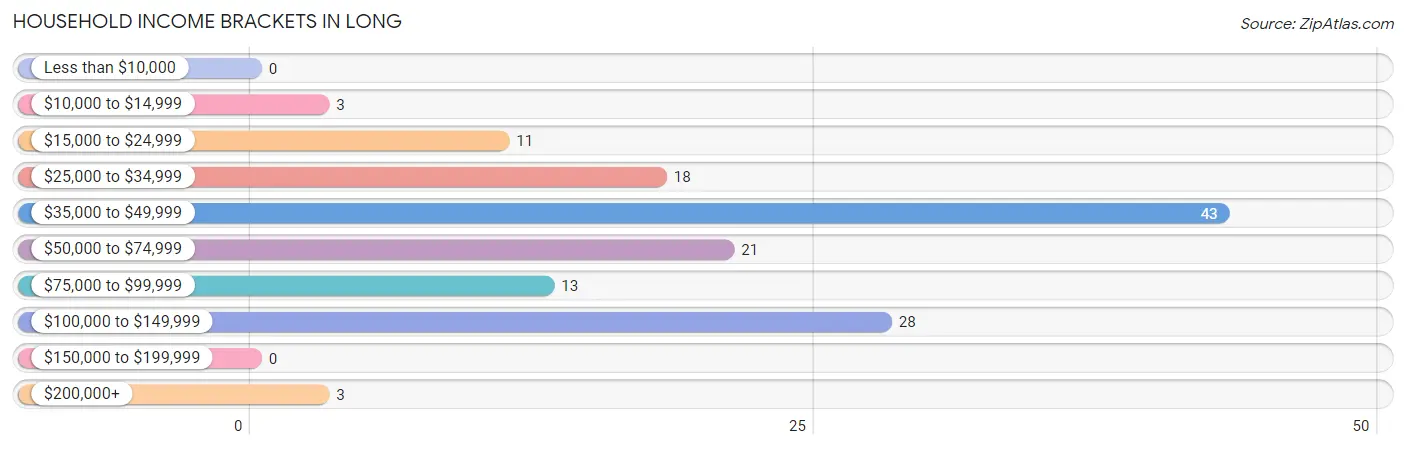
| Income Bracket | # Households | % Households |
| Less than $10,000 | 0 | 0.0% |
| $10,000 to $14,999 | 3 | 2.1% |
| $15,000 to $24,999 | 11 | 7.9% |
| $25,000 to $34,999 | 18 | 12.9% |
| $35,000 to $49,999 | 43 | 30.7% |
| $50,000 to $74,999 | 21 | 15.0% |
| $75,000 to $99,999 | 13 | 9.3% |
| $100,000 to $149,999 | 28 | 20.0% |
| $150,000 to $199,999 | 0 | 0.0% |
| $200,000+ | 3 | 2.1% |
Household Income by Householder Age in Long
The median household income in Long is $46,667, with the highest median household income of $45,208 found in the 45 to 64 years age bracket for the primary householder. A total of 61 households (43.6%) fall into this category. Meanwhile, the 15 to 24 years age bracket for the primary householder has the lowest median household income of $0, with 6 households (4.3%) in this group.
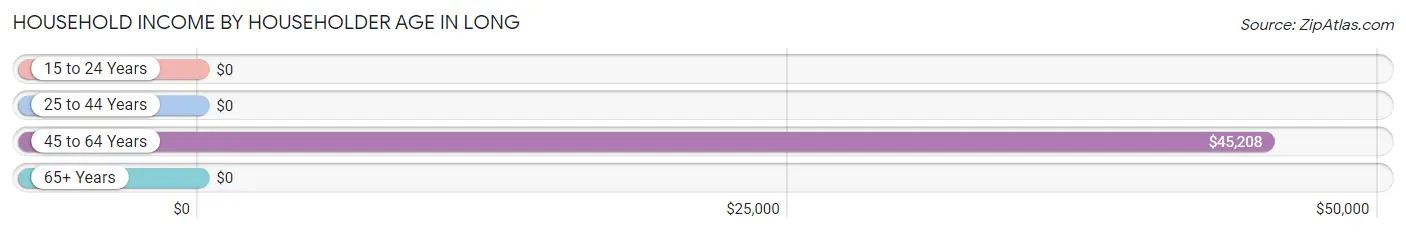
| Income Bracket | # Households | Median Income |
| 15 to 24 Years | 6 (4.3%) | $0 |
| 25 to 44 Years | 47 (33.6%) | $0 |
| 45 to 64 Years | 61 (43.6%) | $45,208 |
| 65+ Years | 26 (18.6%) | $0 |
| Total | 140 (100.0%) | $46,667 |
Poverty in Long
Income Below Poverty by Sex and Age in Long
With 5.6% poverty level for males and 9.2% for females among the residents of Long, 12 to 14 year old males and under 5 year old females are the most vulnerable to poverty, with 2 males (100.0%) and 3 females (100.0%) in their respective age groups living below the poverty level.
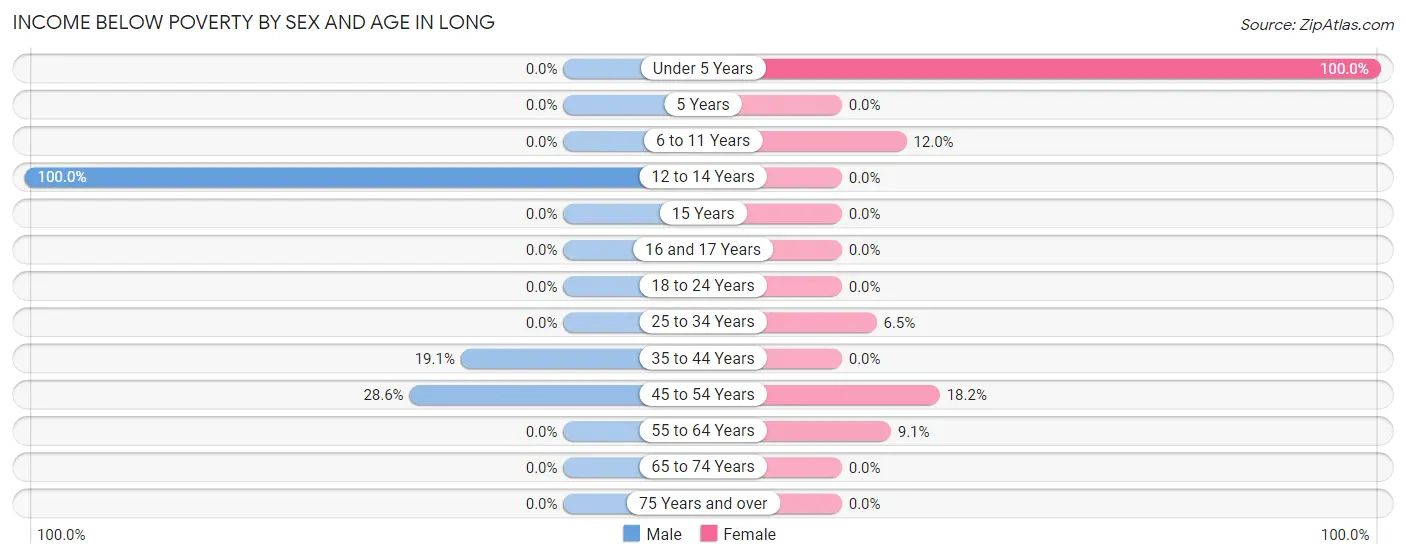
| Age Bracket | Male | Female |
| Under 5 Years | 0 (0.0%) | 3 (100.0%) |
| 5 Years | 0 (0.0%) | 0 (0.0%) |
| 6 to 11 Years | 0 (0.0%) | 6 (12.0%) |
| 12 to 14 Years | 2 (100.0%) | 0 (0.0%) |
| 15 Years | 0 (0.0%) | 0 (0.0%) |
| 16 and 17 Years | 0 (0.0%) | 0 (0.0%) |
| 18 to 24 Years | 0 (0.0%) | 0 (0.0%) |
| 25 to 34 Years | 0 (0.0%) | 2 (6.5%) |
| 35 to 44 Years | 4 (19.1%) | 0 (0.0%) |
| 45 to 54 Years | 6 (28.6%) | 2 (18.2%) |
| 55 to 64 Years | 0 (0.0%) | 3 (9.1%) |
| 65 to 74 Years | 0 (0.0%) | 0 (0.0%) |
| 75 Years and over | 0 (0.0%) | 0 (0.0%) |
| Total | 12 (5.6%) | 16 (9.2%) |
Income Above Poverty by Sex and Age in Long
According to the poverty statistics in Long, males aged under 5 years and females aged 18 to 24 years are the age groups that are most secure financially, with 100.0% of males and 100.0% of females in these age groups living above the poverty line.
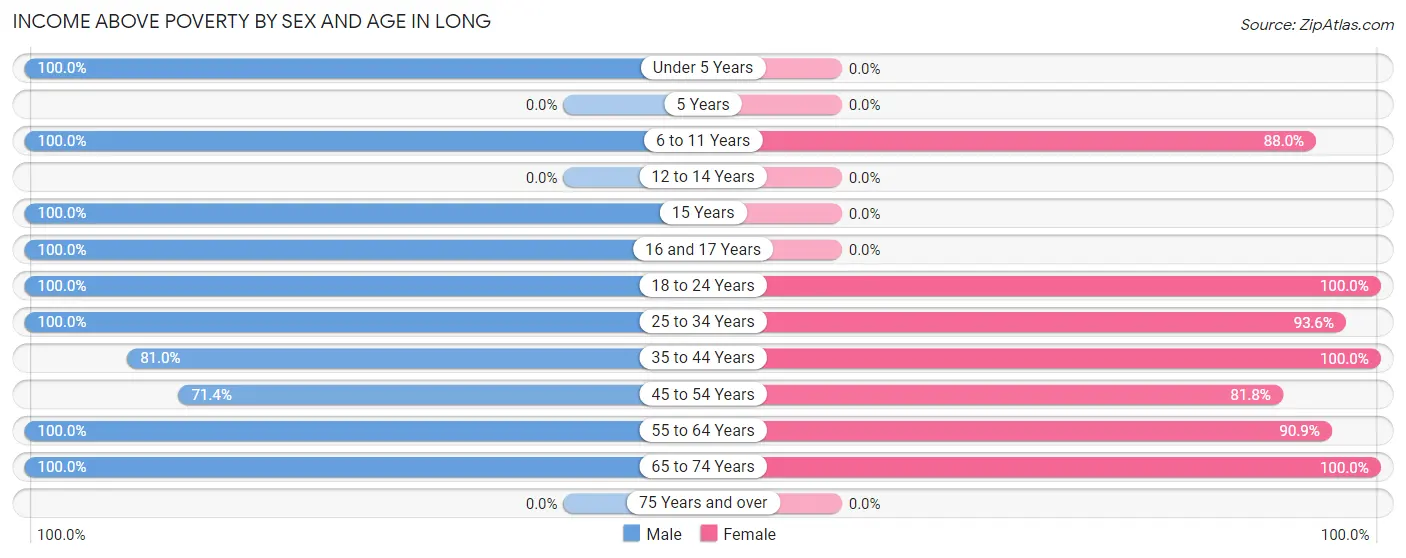
| Age Bracket | Male | Female |
| Under 5 Years | 33 (100.0%) | 0 (0.0%) |
| 5 Years | 0 (0.0%) | 0 (0.0%) |
| 6 to 11 Years | 42 (100.0%) | 44 (88.0%) |
| 12 to 14 Years | 0 (0.0%) | 0 (0.0%) |
| 15 Years | 6 (100.0%) | 0 (0.0%) |
| 16 and 17 Years | 8 (100.0%) | 0 (0.0%) |
| 18 to 24 Years | 18 (100.0%) | 5 (100.0%) |
| 25 to 34 Years | 25 (100.0%) | 29 (93.5%) |
| 35 to 44 Years | 17 (80.9%) | 15 (100.0%) |
| 45 to 54 Years | 15 (71.4%) | 9 (81.8%) |
| 55 to 64 Years | 25 (100.0%) | 30 (90.9%) |
| 65 to 74 Years | 15 (100.0%) | 26 (100.0%) |
| 75 Years and over | 0 (0.0%) | 0 (0.0%) |
| Total | 204 (94.4%) | 158 (90.8%) |
Income Below Poverty Among Married-Couple Families in Long
The poverty statistics for married-couple families in Long show that 2.3% or 2 of the total 86 families live below the poverty line. Families with 3 or 4 children have the highest poverty rate of 10.0%, comprising of 2 families. On the other hand, families with no children have the lowest poverty rate of 0.0%, which includes 0 families.
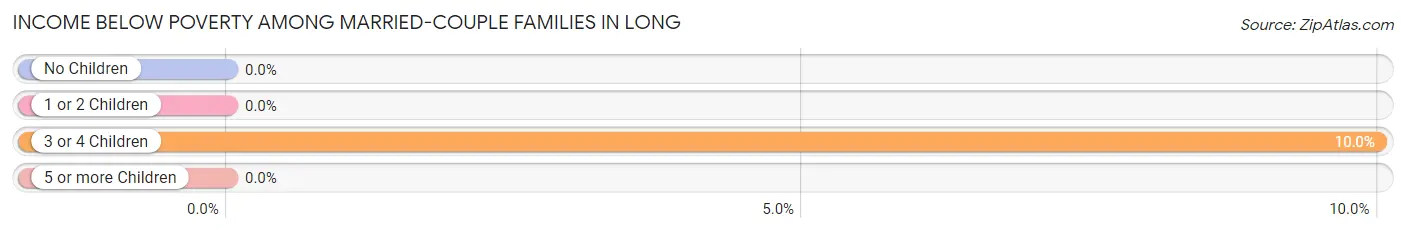
| Children | Above Poverty | Below Poverty |
| No Children | 38 (100.0%) | 0 (0.0%) |
| 1 or 2 Children | 28 (100.0%) | 0 (0.0%) |
| 3 or 4 Children | 18 (90.0%) | 2 (10.0%) |
| 5 or more Children | 0 (0.0%) | 0 (0.0%) |
| Total | 84 (97.7%) | 2 (2.3%) |
Income Below Poverty Among Single-Parent Households in Long
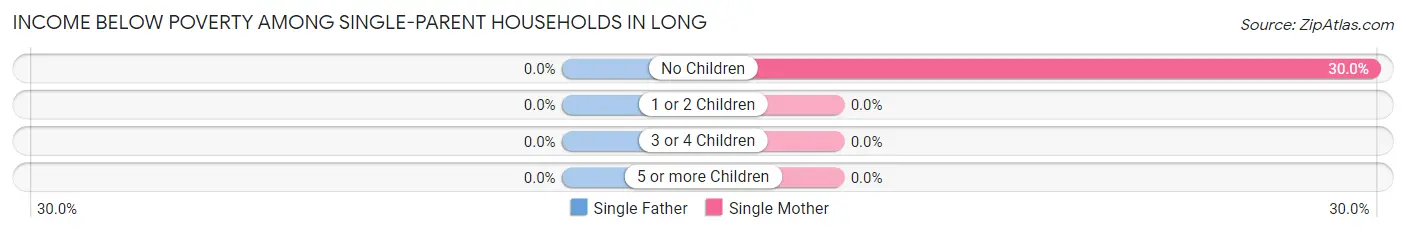
| Children | Single Father | Single Mother |
| No Children | 0 (0.0%) | 3 (30.0%) |
| 1 or 2 Children | 0 (0.0%) | 0 (0.0%) |
| 3 or 4 Children | 0 (0.0%) | 0 (0.0%) |
| 5 or more Children | 0 (0.0%) | 0 (0.0%) |
| Total | 0 (0.0%) | 3 (18.8%) |
Income Below Poverty Among Married-Couple vs Single-Parent Households in Long
The poverty data for Long shows that 2 of the married-couple family households (2.3%) and 3 of the single-parent households (18.8%) are living below the poverty level. Within the married-couple family households, those with 3 or 4 children have the highest poverty rate, with 2 households (10.0%) falling below the poverty line. Among the single-parent households, those with no children have the highest poverty rate, with 3 household (30.0%) living below poverty.
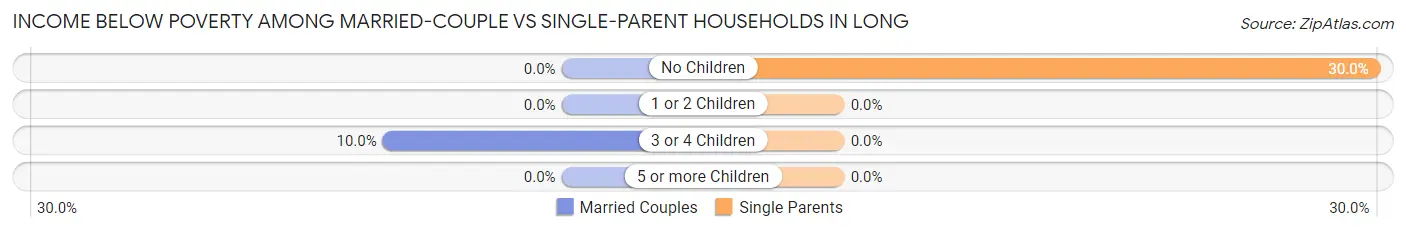
| Children | Married-Couple Families | Single-Parent Households |
| No Children | 0 (0.0%) | 3 (30.0%) |
| 1 or 2 Children | 0 (0.0%) | 0 (0.0%) |
| 3 or 4 Children | 2 (10.0%) | 0 (0.0%) |
| 5 or more Children | 0 (0.0%) | 0 (0.0%) |
| Total | 2 (2.3%) | 3 (18.8%) |
Race in Long
The most populous races in Long are White / Caucasian (289 | 74.1%), Native / Alaskan (70 | 17.9%), and Two or more Races (31 | 8.0%).
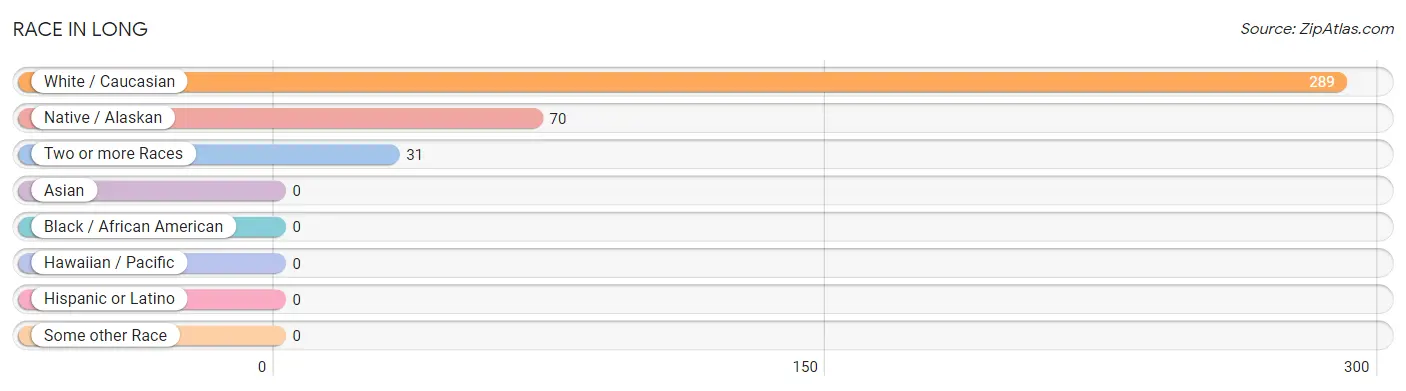
| Race | # Population | % Population |
| Asian | 0 | 0.0% |
| Black / African American | 0 | 0.0% |
| Hawaiian / Pacific | 0 | 0.0% |
| Hispanic or Latino | 0 | 0.0% |
| Native / Alaskan | 70 | 17.9% |
| White / Caucasian | 289 | 74.1% |
| Two or more Races | 31 | 8.0% |
| Some other Race | 0 | 0.0% |
| Total | 390 | 100.0% |
Ancestry in Long
The most populous ancestries reported in Long are Cherokee (101 | 25.9%), American (33 | 8.5%), Irish (30 | 7.7%), French (25 | 6.4%), and English (20 | 5.1%), together accounting for 53.6% of all Long residents.
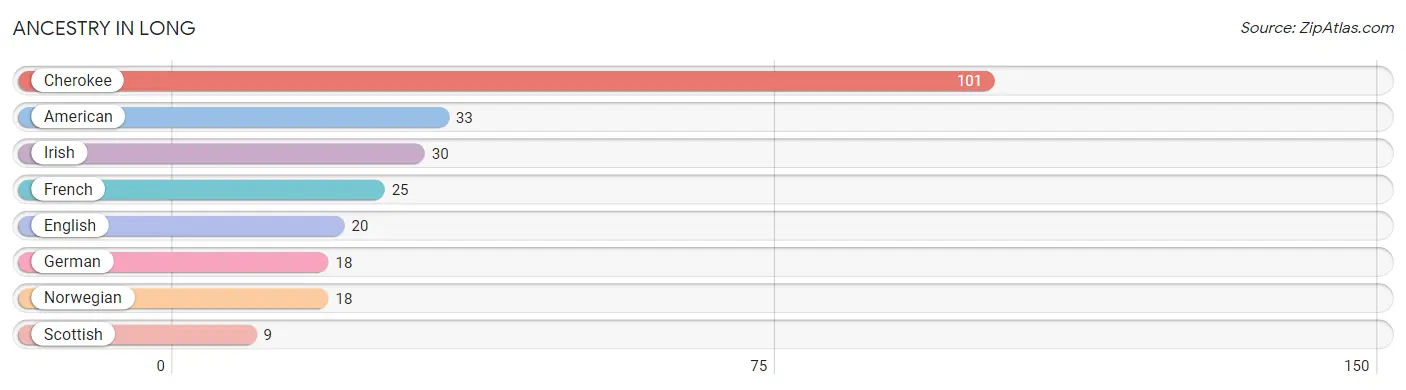
| Ancestry | # Population | % Population |
| American | 33 | 8.5% |
| Cherokee | 101 | 25.9% |
| English | 20 | 5.1% |
| French | 25 | 6.4% |
| German | 18 | 4.6% |
| Irish | 30 | 7.7% |
| Norwegian | 18 | 4.6% |
| Scottish | 9 | 2.3% | View All 8 Rows |
Immigrants in Long

| Immigration Origin | # Population | % Population | View All 0 Rows |
Sex and Age in Long
Sex and Age in Long
The most populous age groups in Long are Under 5 Years (33 | 15.3%) for men and 5 to 9 Years (50 | 28.7%) for women.
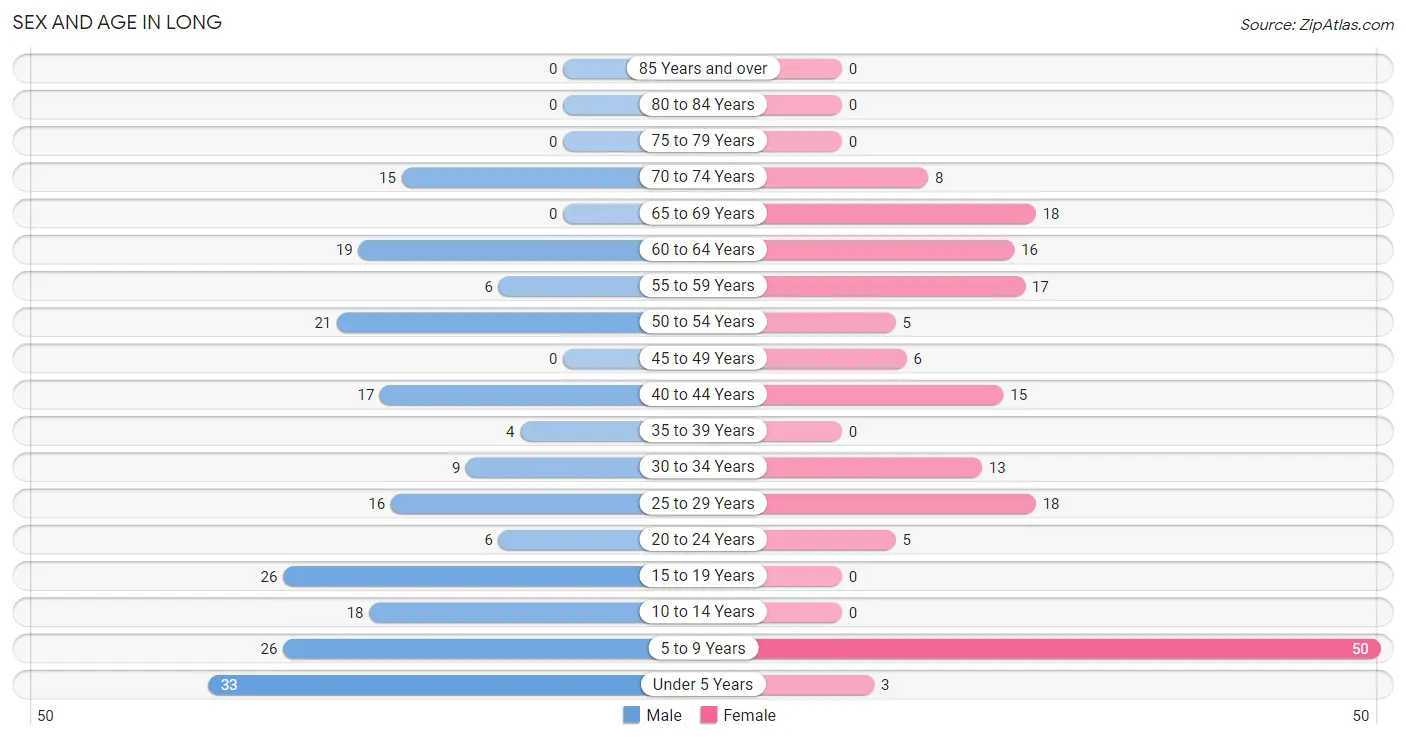
| Age Bracket | Male | Female |
| Under 5 Years | 33 (15.3%) | 3 (1.7%) |
| 5 to 9 Years | 26 (12.0%) | 50 (28.7%) |
| 10 to 14 Years | 18 (8.3%) | 0 (0.0%) |
| 15 to 19 Years | 26 (12.0%) | 0 (0.0%) |
| 20 to 24 Years | 6 (2.8%) | 5 (2.9%) |
| 25 to 29 Years | 16 (7.4%) | 18 (10.3%) |
| 30 to 34 Years | 9 (4.2%) | 13 (7.5%) |
| 35 to 39 Years | 4 (1.8%) | 0 (0.0%) |
| 40 to 44 Years | 17 (7.9%) | 15 (8.6%) |
| 45 to 49 Years | 0 (0.0%) | 6 (3.5%) |
| 50 to 54 Years | 21 (9.7%) | 5 (2.9%) |
| 55 to 59 Years | 6 (2.8%) | 17 (9.8%) |
| 60 to 64 Years | 19 (8.8%) | 16 (9.2%) |
| 65 to 69 Years | 0 (0.0%) | 18 (10.3%) |
| 70 to 74 Years | 15 (6.9%) | 8 (4.6%) |
| 75 to 79 Years | 0 (0.0%) | 0 (0.0%) |
| 80 to 84 Years | 0 (0.0%) | 0 (0.0%) |
| 85 Years and over | 0 (0.0%) | 0 (0.0%) |
| Total | 216 (100.0%) | 174 (100.0%) |
Families and Households in Long
Median Family Size in Long
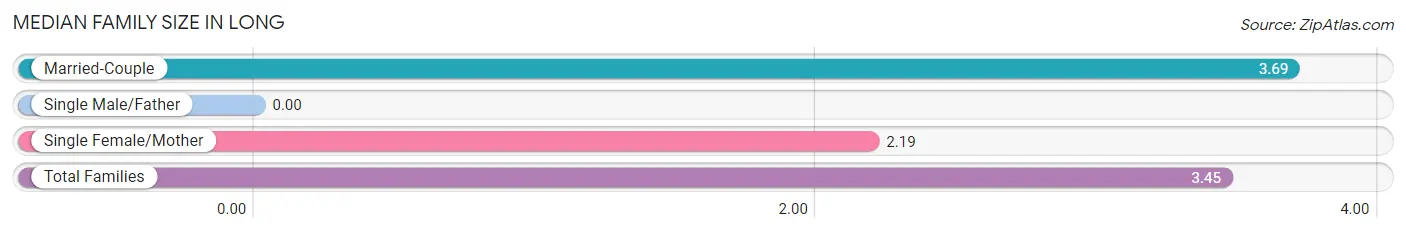
| Family Type | # Families | Family Size |
| Married-Couple | 86 (84.3%) | 3.69 |
| Single Male/Father | 0 (0.0%) | - |
| Single Female/Mother | 16 (15.7%) | 2.19 |
| Total Families | 102 (100.0%) | 3.45 |
Median Household Size in Long
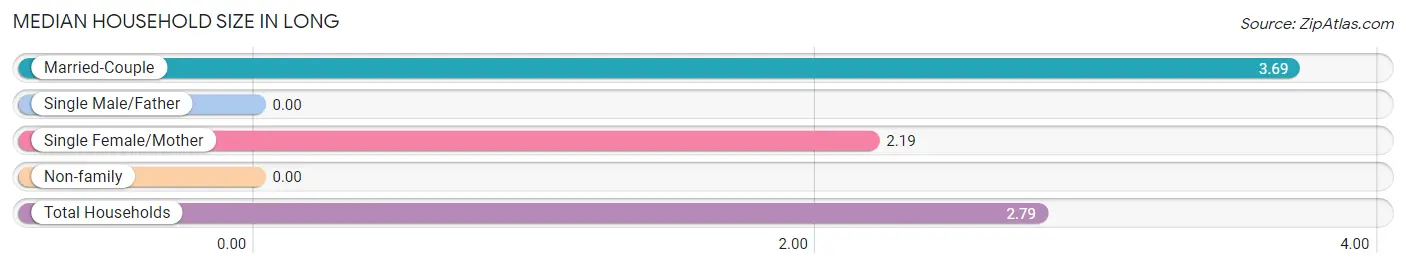
| Household Type | # Households | Household Size |
| Married-Couple | 86 (61.4%) | 3.69 |
| Single Male/Father | 0 (0.0%) | - |
| Single Female/Mother | 16 (11.4%) | 2.19 |
| Non-family | 38 (27.1%) | - |
| Total Households | 140 (100.0%) | 2.79 |
Household Size by Marriage Status in Long
Out of a total of 140 households in Long, 102 (72.9%) are family households, while 38 (27.1%) are nonfamily households. The most numerous type of family households are 2-person households, comprising 54, and the most common type of nonfamily households are 1-person households, comprising 38.
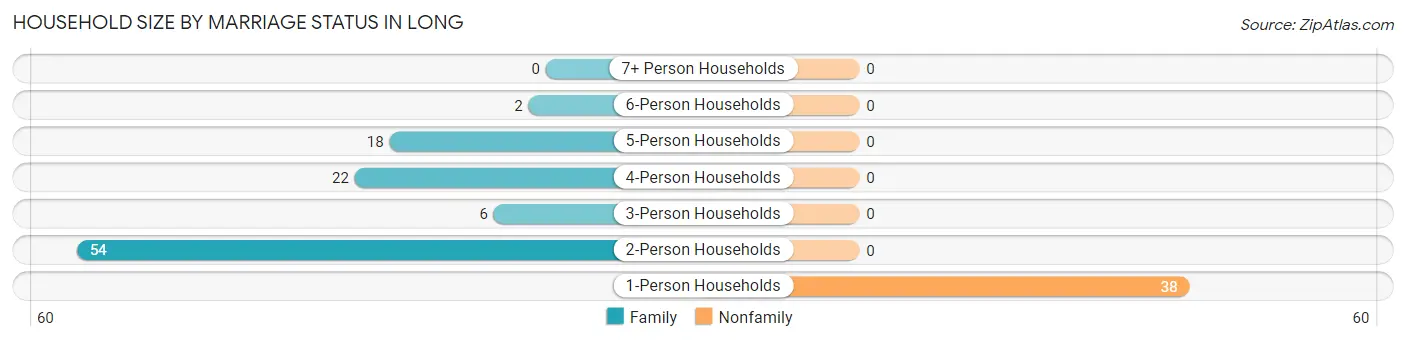
| Household Size | Family Households | Nonfamily Households |
| 1-Person Households | - | 38 (27.1%) |
| 2-Person Households | 54 (38.6%) | 0 (0.0%) |
| 3-Person Households | 6 (4.3%) | 0 (0.0%) |
| 4-Person Households | 22 (15.7%) | 0 (0.0%) |
| 5-Person Households | 18 (12.9%) | 0 (0.0%) |
| 6-Person Households | 2 (1.4%) | 0 (0.0%) |
| 7+ Person Households | 0 (0.0%) | 0 (0.0%) |
| Total | 102 (72.9%) | 38 (27.1%) |
Female Fertility in Long
Fertility by Age in Long
Average fertility rate in Long is 175.0 births per 1,000 women. Women in the age bracket of 20 to 34 years have the highest fertility rate with 278.0 births per 1,000 women. Women in the age bracket of 20 to 34 years acount for 100.0% of all women with births.
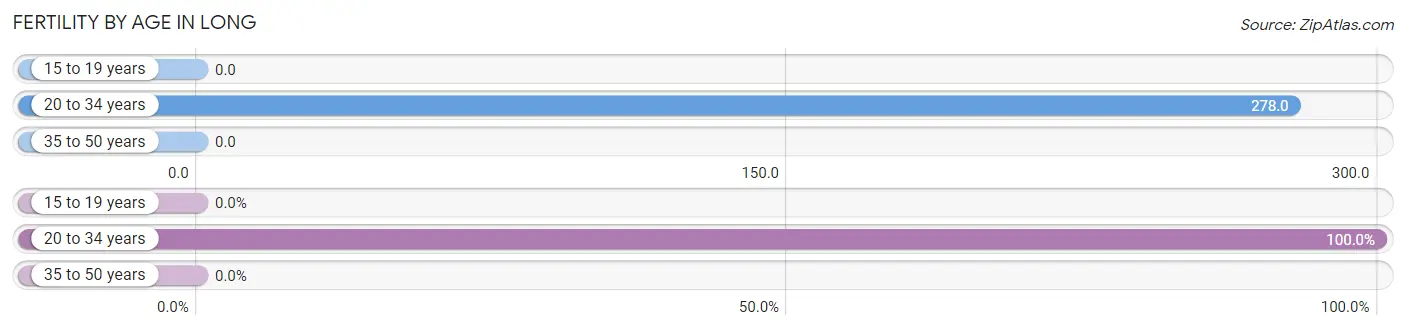
| Age Bracket | Women with Births | Births / 1,000 Women |
| 15 to 19 years | 0 (0.0%) | 0.0 |
| 20 to 34 years | 10 (100.0%) | 278.0 |
| 35 to 50 years | 0 (0.0%) | 0.0 |
| Total | 10 (100.0%) | 175.0 |
Fertility by Age by Marriage Status in Long
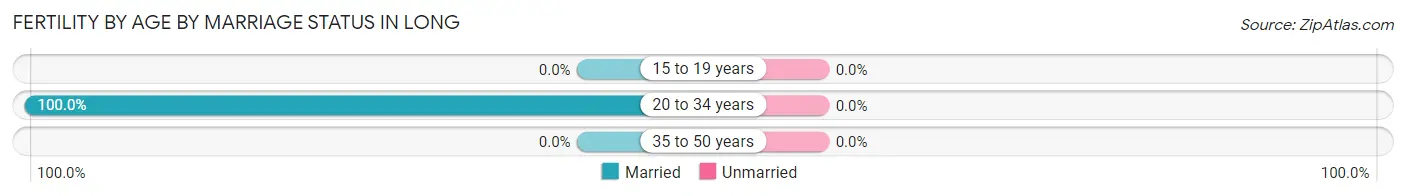
| Age Bracket | Married | Unmarried |
| 15 to 19 years | 0 (0.0%) | 0 (0.0%) |
| 20 to 34 years | 10 (100.0%) | 0 (0.0%) |
| 35 to 50 years | 0 (0.0%) | 0 (0.0%) |
| Total | 10 (100.0%) | 0 (0.0%) |
Fertility by Education in Long
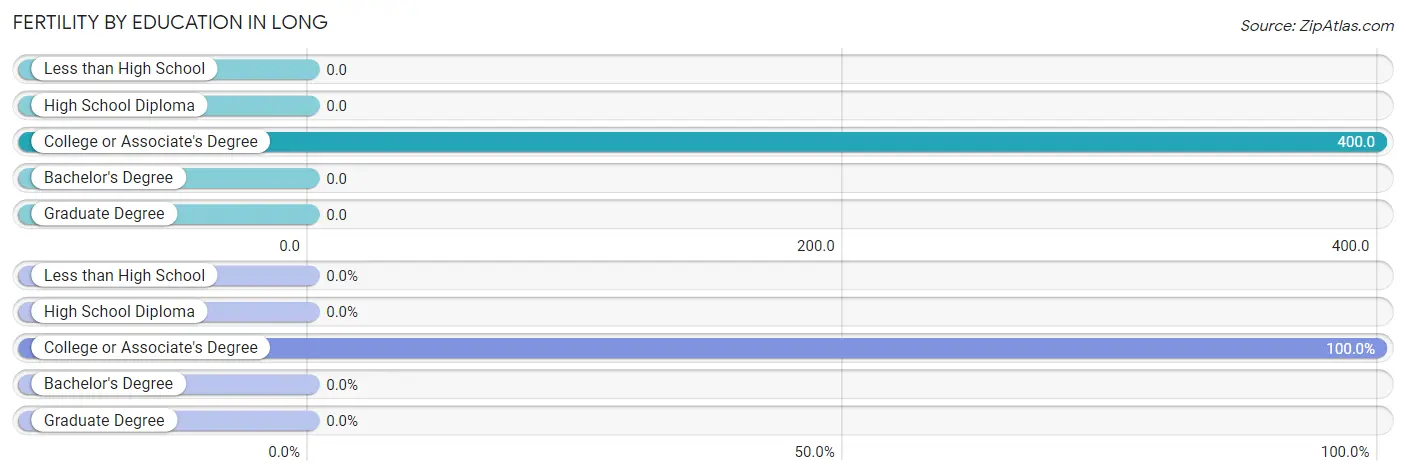
| Educational Attainment | Women with Births | Births / 1,000 Women |
| Less than High School | 0 (0.0%) | 0.0 |
| High School Diploma | 0 (0.0%) | 0.0 |
| College or Associate's Degree | 10 (100.0%) | 400.0 |
| Bachelor's Degree | 0 (0.0%) | 0.0 |
| Graduate Degree | 0 (0.0%) | 0.0 |
| Total | 10 (100.0%) | 175.0 |
Fertility by Education by Marriage Status in Long
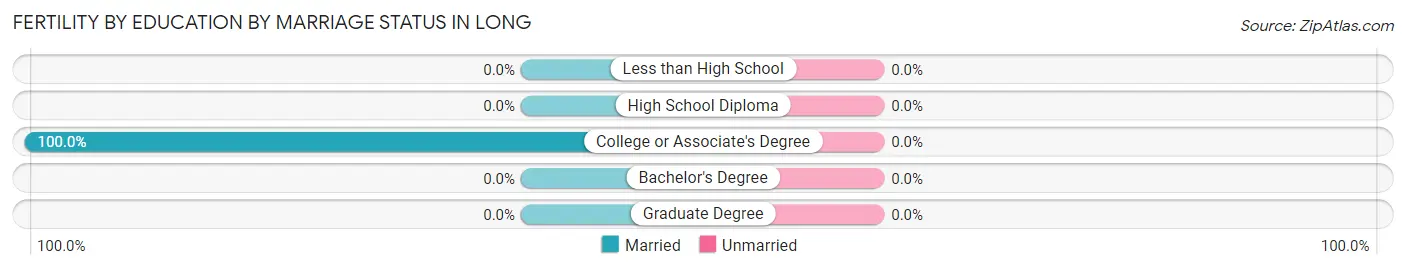
| Educational Attainment | Married | Unmarried |
| Less than High School | 0 (0.0%) | 0 (0.0%) |
| High School Diploma | 0 (0.0%) | 0 (0.0%) |
| College or Associate's Degree | 10 (100.0%) | 0 (0.0%) |
| Bachelor's Degree | 0 (0.0%) | 0 (0.0%) |
| Graduate Degree | 0 (0.0%) | 0 (0.0%) |
| Total | 10 (100.0%) | 0 (0.0%) |
Employment Characteristics in Long
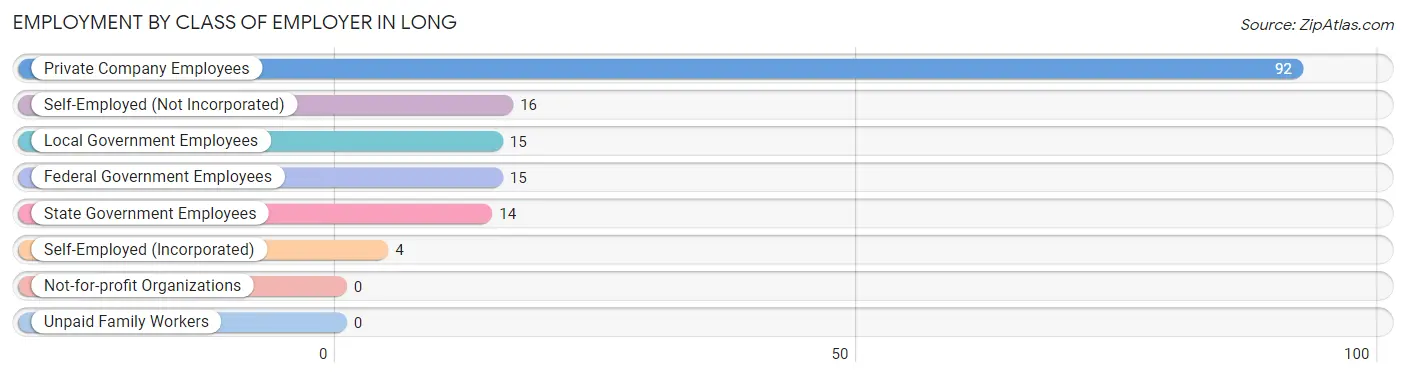
Employment by Class of Employer in Long
Among the 156 employed individuals in Long, private company employees (92 | 59.0%), self-employed (not incorporated) (16 | 10.3%), and local government employees (15 | 9.6%) make up the most common classes of employment.
| Employer Class | # Employees | % Employees |
| Private Company Employees | 92 | 59.0% |
| Self-Employed (Incorporated) | 4 | 2.6% |
| Self-Employed (Not Incorporated) | 16 | 10.3% |
| Not-for-profit Organizations | 0 | 0.0% |
| Local Government Employees | 15 | 9.6% |
| State Government Employees | 14 | 9.0% |
| Federal Government Employees | 15 | 9.6% |
| Unpaid Family Workers | 0 | 0.0% |
| Total | 156 | 100.0% |
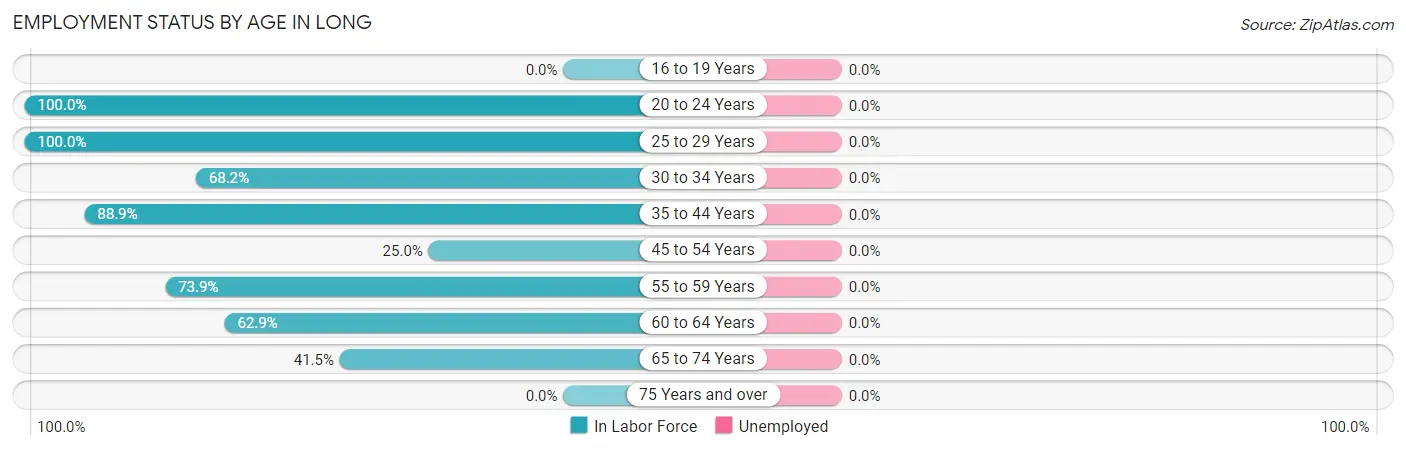
Employment Status by Age in Long
| Age Bracket | In Labor Force | Unemployed |
| 16 to 19 Years | 0 (0.0%) | 0 (0.0%) |
| 20 to 24 Years | 11 (100.0%) | 0 (0.0%) |
| 25 to 29 Years | 34 (100.0%) | 0 (0.0%) |
| 30 to 34 Years | 15 (68.2%) | 0 (0.0%) |
| 35 to 44 Years | 32 (88.9%) | 0 (0.0%) |
| 45 to 54 Years | 8 (25.0%) | 0 (0.0%) |
| 55 to 59 Years | 17 (73.9%) | 0 (0.0%) |
| 60 to 64 Years | 22 (62.9%) | 0 (0.0%) |
| 65 to 74 Years | 17 (41.5%) | 0 (0.0%) |
| 75 Years and over | 0 (0.0%) | 0 (0.0%) |
| Total | 156 (61.4%) | 0 (0.0%) |
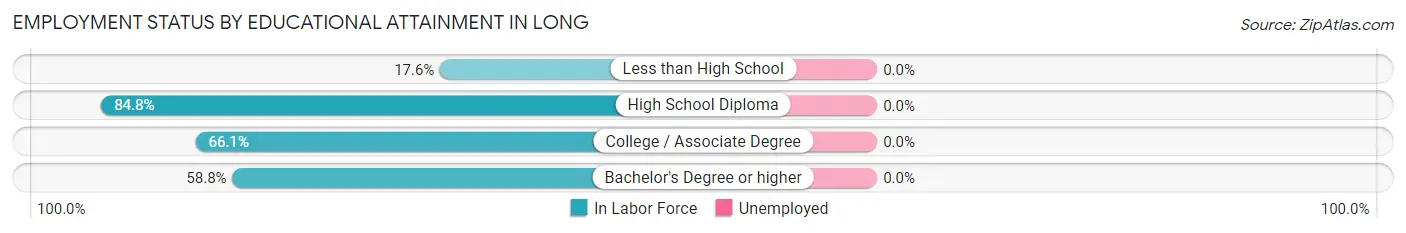
Employment Status by Educational Attainment in Long
| Educational Attainment | In Labor Force | Unemployed |
| Less than High School | 3 (17.6%) | 0 (0.0%) |
| High School Diploma | 78 (84.8%) | 0 (0.0%) |
| College / Associate Degree | 37 (66.1%) | 0 (0.0%) |
| Bachelor's Degree or higher | 10 (58.8%) | 0 (0.0%) |
| Total | 128 (70.3%) | 0 (0.0%) |
Employment Occupations by Sex in Long
Management, Business, Science and Arts Occupations
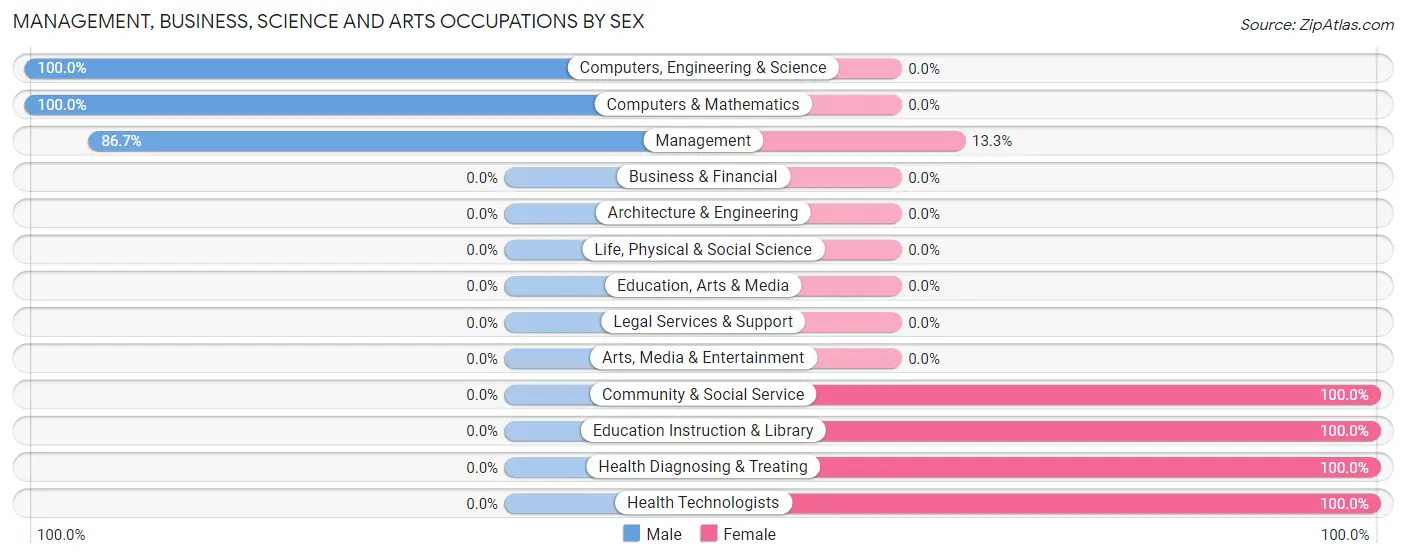
The most common Management, Business, Science and Arts occupations in Long are Management (15 | 9.6%), Community & Social Service (15 | 9.6%), Education Instruction & Library (15 | 9.6%), Health Diagnosing & Treating (12 | 7.7%), and Health Technologists (12 | 7.7%).
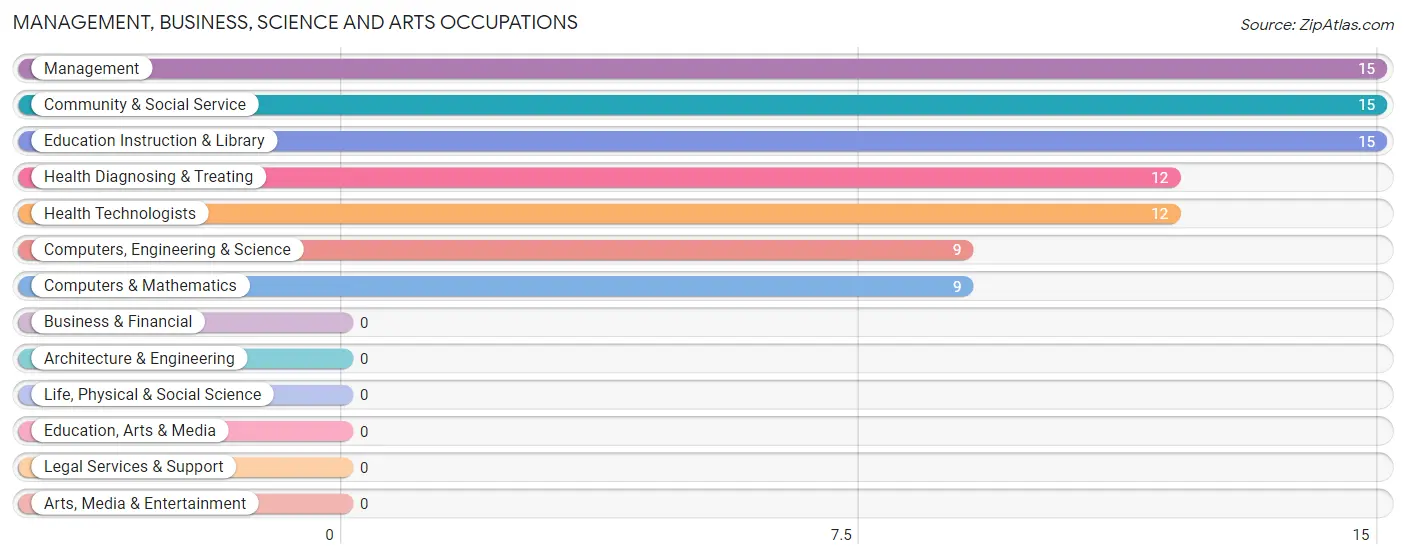
Management, Business, Science and Arts Occupations by Sex
Within the Management, Business, Science and Arts occupations in Long, the most male-oriented occupations are Computers, Engineering & Science (100.0%), Computers & Mathematics (100.0%), and Management (86.7%), while the most female-oriented occupations are Community & Social Service (100.0%), Education Instruction & Library (100.0%), and Health Diagnosing & Treating (100.0%).
| Occupation | Male | Female |
| Management | 13 (86.7%) | 2 (13.3%) |
| Business & Financial | 0 (0.0%) | 0 (0.0%) |
| Computers, Engineering & Science | 9 (100.0%) | 0 (0.0%) |
| Computers & Mathematics | 9 (100.0%) | 0 (0.0%) |
| Architecture & Engineering | 0 (0.0%) | 0 (0.0%) |
| Life, Physical & Social Science | 0 (0.0%) | 0 (0.0%) |
| Community & Social Service | 0 (0.0%) | 15 (100.0%) |
| Education, Arts & Media | 0 (0.0%) | 0 (0.0%) |
| Legal Services & Support | 0 (0.0%) | 0 (0.0%) |
| Education Instruction & Library | 0 (0.0%) | 15 (100.0%) |
| Arts, Media & Entertainment | 0 (0.0%) | 0 (0.0%) |
| Health Diagnosing & Treating | 0 (0.0%) | 12 (100.0%) |
| Health Technologists | 0 (0.0%) | 12 (100.0%) |
| Total (Category) | 22 (43.1%) | 29 (56.9%) |
| Total (Overall) | 74 (47.4%) | 82 (52.6%) |
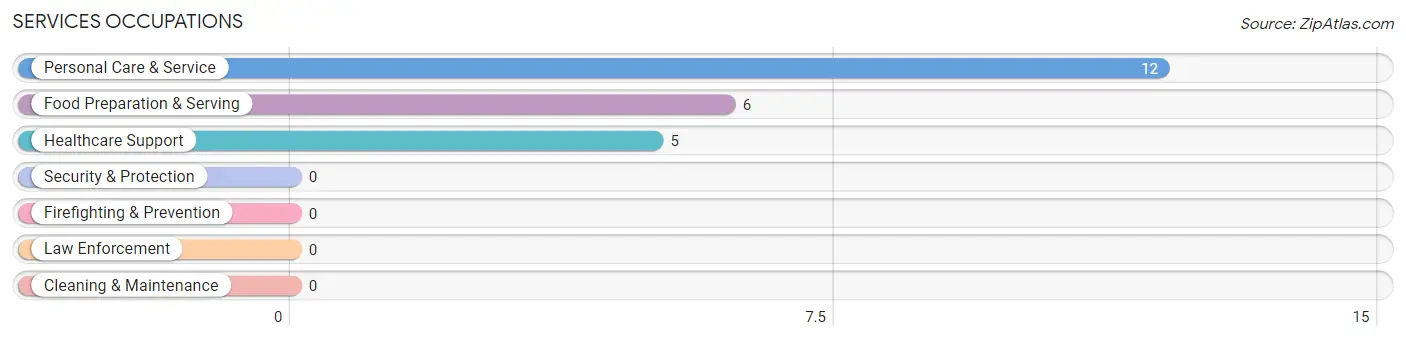
Services Occupations
The most common Services occupations in Long are Personal Care & Service (12 | 7.7%), Food Preparation & Serving (6 | 3.8%), and Healthcare Support (5 | 3.2%).
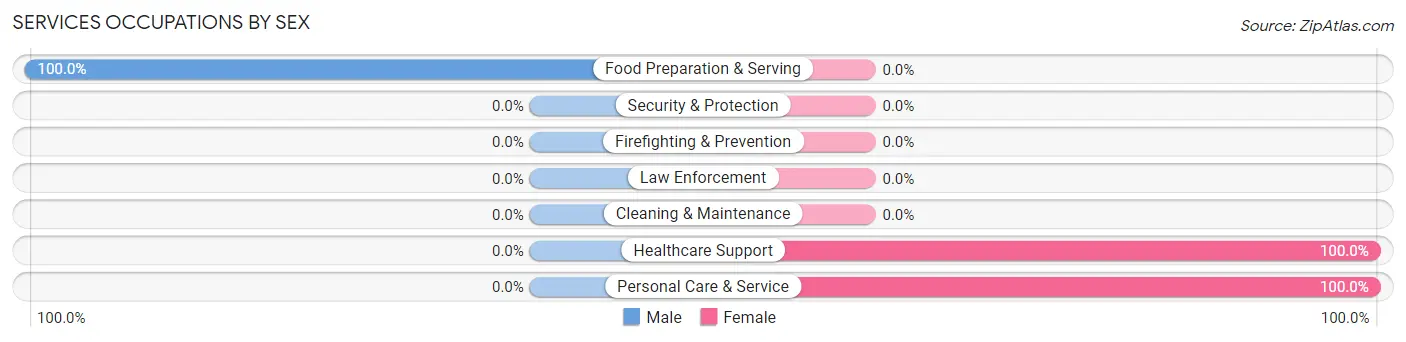
Services Occupations by Sex
| Occupation | Male | Female |
| Healthcare Support | 0 (0.0%) | 5 (100.0%) |
| Security & Protection | 0 (0.0%) | 0 (0.0%) |
| Firefighting & Prevention | 0 (0.0%) | 0 (0.0%) |
| Law Enforcement | 0 (0.0%) | 0 (0.0%) |
| Food Preparation & Serving | 6 (100.0%) | 0 (0.0%) |
| Cleaning & Maintenance | 0 (0.0%) | 0 (0.0%) |
| Personal Care & Service | 0 (0.0%) | 12 (100.0%) |
| Total (Category) | 6 (26.1%) | 17 (73.9%) |
| Total (Overall) | 74 (47.4%) | 82 (52.6%) |
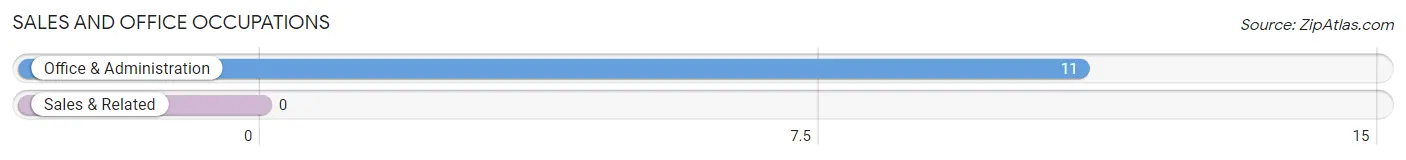
Sales and Office Occupations
The most common Sales and Office occupations in Long are , and Office & Administration (11 | 7.0%).
Sales and Office Occupations by Sex
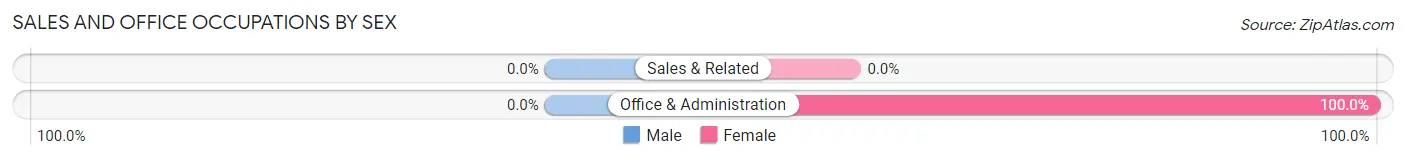
| Occupation | Male | Female |
| Sales & Related | 0 (0.0%) | 0 (0.0%) |
| Office & Administration | 0 (0.0%) | 11 (100.0%) |
| Total (Category) | 0 (0.0%) | 11 (100.0%) |
| Total (Overall) | 74 (47.4%) | 82 (52.6%) |
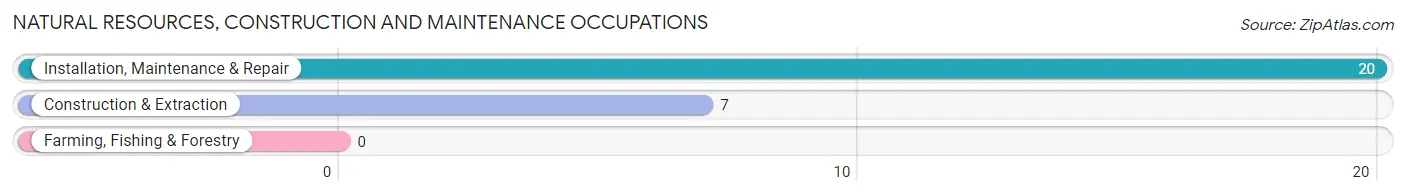
Natural Resources, Construction and Maintenance Occupations
The most common Natural Resources, Construction and Maintenance occupations in Long are Installation, Maintenance & Repair (20 | 12.8%), and Construction & Extraction (7 | 4.5%).
Natural Resources, Construction and Maintenance Occupations by Sex
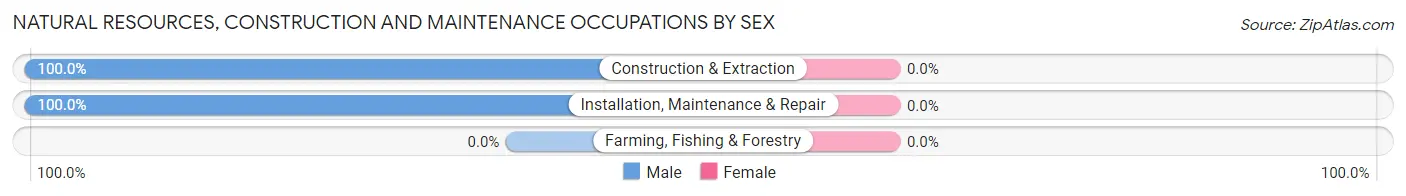
| Occupation | Male | Female |
| Farming, Fishing & Forestry | 0 (0.0%) | 0 (0.0%) |
| Construction & Extraction | 7 (100.0%) | 0 (0.0%) |
| Installation, Maintenance & Repair | 20 (100.0%) | 0 (0.0%) |
| Total (Category) | 27 (100.0%) | 0 (0.0%) |
| Total (Overall) | 74 (47.4%) | 82 (52.6%) |
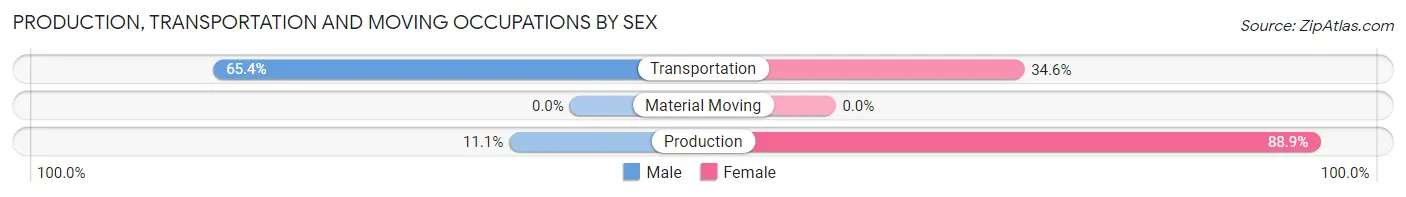
Production, Transportation and Moving Occupations
The most common Production, Transportation and Moving occupations in Long are Transportation (26 | 16.7%), and Production (18 | 11.5%).
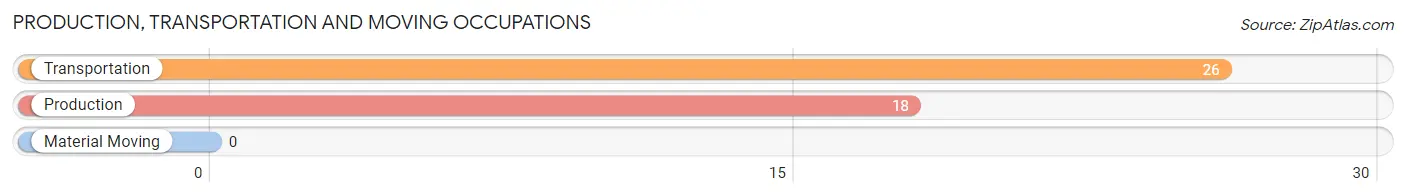
Production, Transportation and Moving Occupations by Sex
| Occupation | Male | Female |
| Production | 2 (11.1%) | 16 (88.9%) |
| Transportation | 17 (65.4%) | 9 (34.6%) |
| Material Moving | 0 (0.0%) | 0 (0.0%) |
| Total (Category) | 19 (43.2%) | 25 (56.8%) |
| Total (Overall) | 74 (47.4%) | 82 (52.6%) |
Employment Industries by Sex in Long
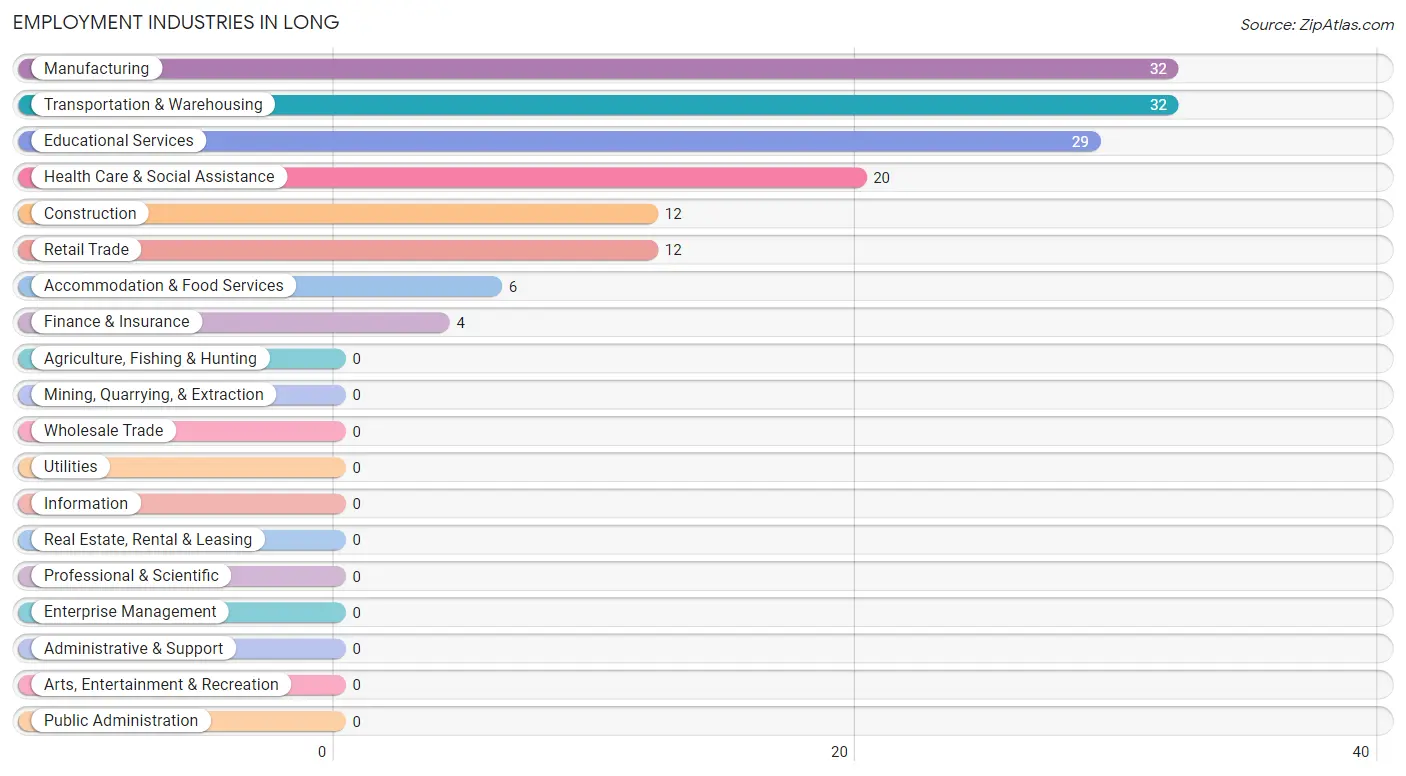
Employment Industries in Long
The major employment industries in Long include Manufacturing (32 | 20.5%), Transportation & Warehousing (32 | 20.5%), Educational Services (29 | 18.6%), Health Care & Social Assistance (20 | 12.8%), and Construction (12 | 7.7%).
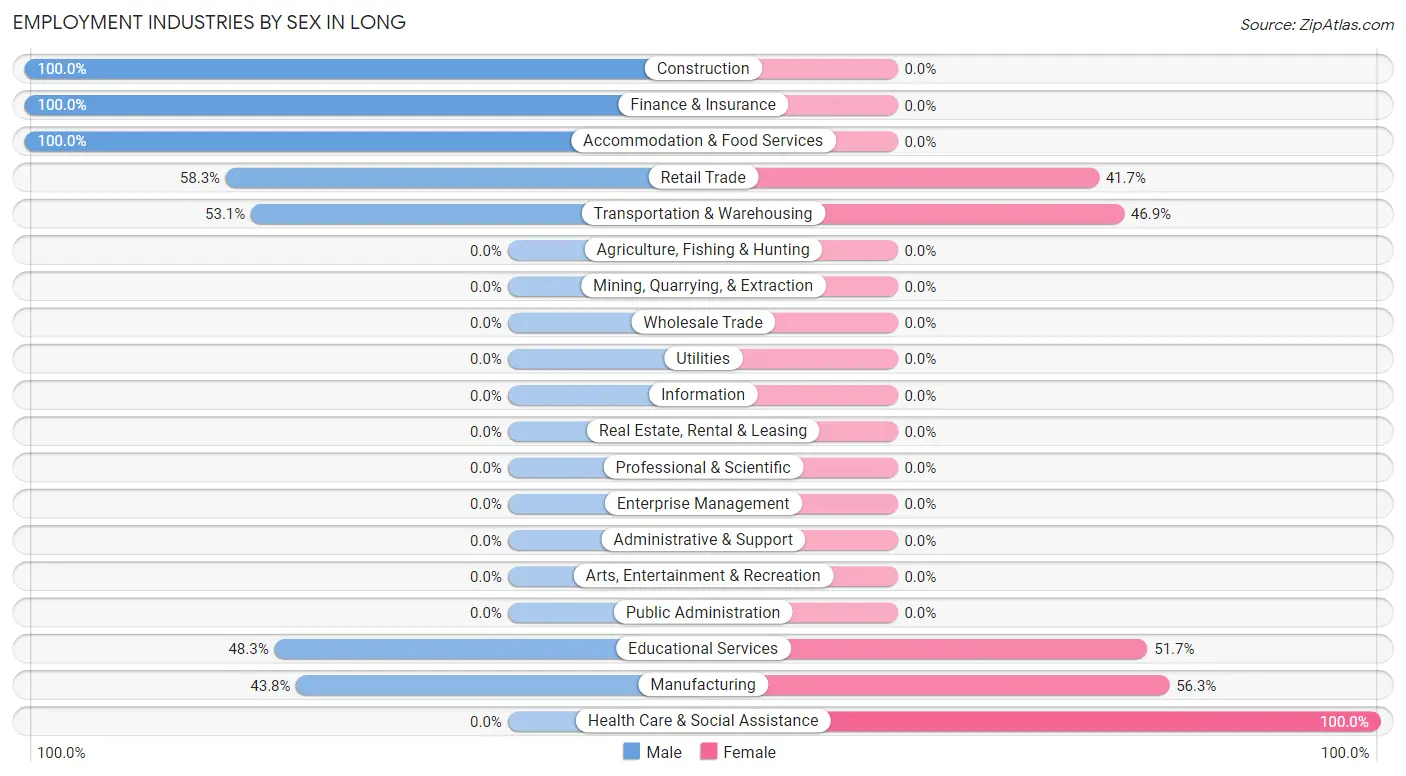
Employment Industries by Sex in Long
The Long industries that see more men than women are Construction (100.0%), Finance & Insurance (100.0%), and Accommodation & Food Services (100.0%), whereas the industries that tend to have a higher number of women are Health Care & Social Assistance (100.0%), Manufacturing (56.2%), and Educational Services (51.7%).
| Industry | Male | Female |
| Agriculture, Fishing & Hunting | 0 (0.0%) | 0 (0.0%) |
| Mining, Quarrying, & Extraction | 0 (0.0%) | 0 (0.0%) |
| Construction | 12 (100.0%) | 0 (0.0%) |
| Manufacturing | 14 (43.8%) | 18 (56.2%) |
| Wholesale Trade | 0 (0.0%) | 0 (0.0%) |
| Retail Trade | 7 (58.3%) | 5 (41.7%) |
| Transportation & Warehousing | 17 (53.1%) | 15 (46.9%) |
| Utilities | 0 (0.0%) | 0 (0.0%) |
| Information | 0 (0.0%) | 0 (0.0%) |
| Finance & Insurance | 4 (100.0%) | 0 (0.0%) |
| Real Estate, Rental & Leasing | 0 (0.0%) | 0 (0.0%) |
| Professional & Scientific | 0 (0.0%) | 0 (0.0%) |
| Enterprise Management | 0 (0.0%) | 0 (0.0%) |
| Administrative & Support | 0 (0.0%) | 0 (0.0%) |
| Educational Services | 14 (48.3%) | 15 (51.7%) |
| Health Care & Social Assistance | 0 (0.0%) | 20 (100.0%) |
| Arts, Entertainment & Recreation | 0 (0.0%) | 0 (0.0%) |
| Accommodation & Food Services | 6 (100.0%) | 0 (0.0%) |
| Public Administration | 0 (0.0%) | 0 (0.0%) |
| Total | 74 (47.4%) | 82 (52.6%) |
Education in Long
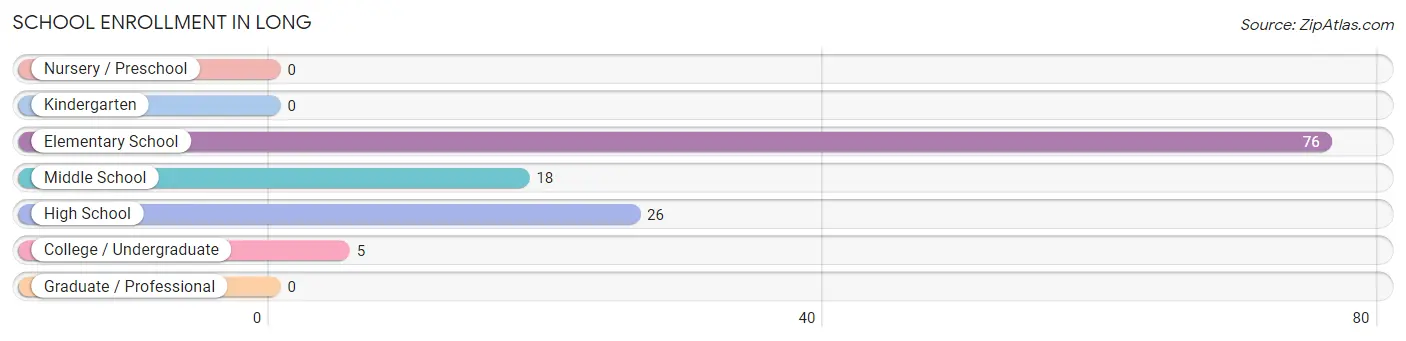
School Enrollment in Long
The most common levels of schooling among the 125 students in Long are elementary school (76 | 60.8%), high school (26 | 20.8%), and middle school (18 | 14.4%).
| School Level | # Students | % Students |
| Nursery / Preschool | 0 | 0.0% |
| Kindergarten | 0 | 0.0% |
| Elementary School | 76 | 60.8% |
| Middle School | 18 | 14.4% |
| High School | 26 | 20.8% |
| College / Undergraduate | 5 | 4.0% |
| Graduate / Professional | 0 | 0.0% |
| Total | 125 | 100.0% |
School Enrollment by Age by Funding Source in Long
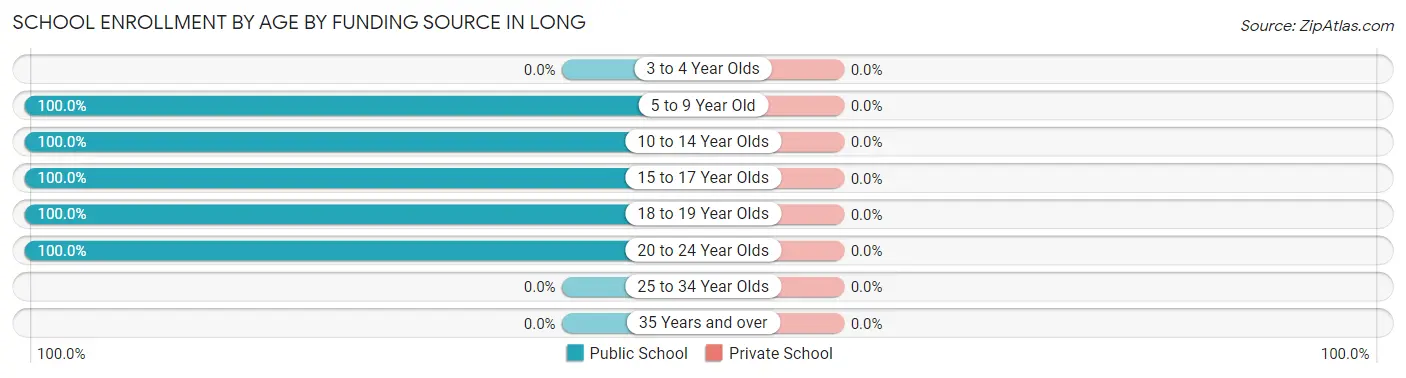
| Age Bracket | Public School | Private School |
| 3 to 4 Year Olds | 0 (0.0%) | 0 (0.0%) |
| 5 to 9 Year Old | 76 (100.0%) | 0 (0.0%) |
| 10 to 14 Year Olds | 18 (100.0%) | 0 (0.0%) |
| 15 to 17 Year Olds | 14 (100.0%) | 0 (0.0%) |
| 18 to 19 Year Olds | 12 (100.0%) | 0 (0.0%) |
| 20 to 24 Year Olds | 5 (100.0%) | 0 (0.0%) |
| 25 to 34 Year Olds | 0 (0.0%) | 0 (0.0%) |
| 35 Years and over | 0 (0.0%) | 0 (0.0%) |
| Total | 125 (100.0%) | 0 (0.0%) |
Educational Attainment by Field of Study in Long
Education (7 | 41.2%), business (4 | 23.5%), liberal arts & history (4 | 23.5%), and bio, nature & agricultural (2 | 11.8%) are the most common fields of study among 17 individuals in Long who have obtained a bachelor's degree or higher.
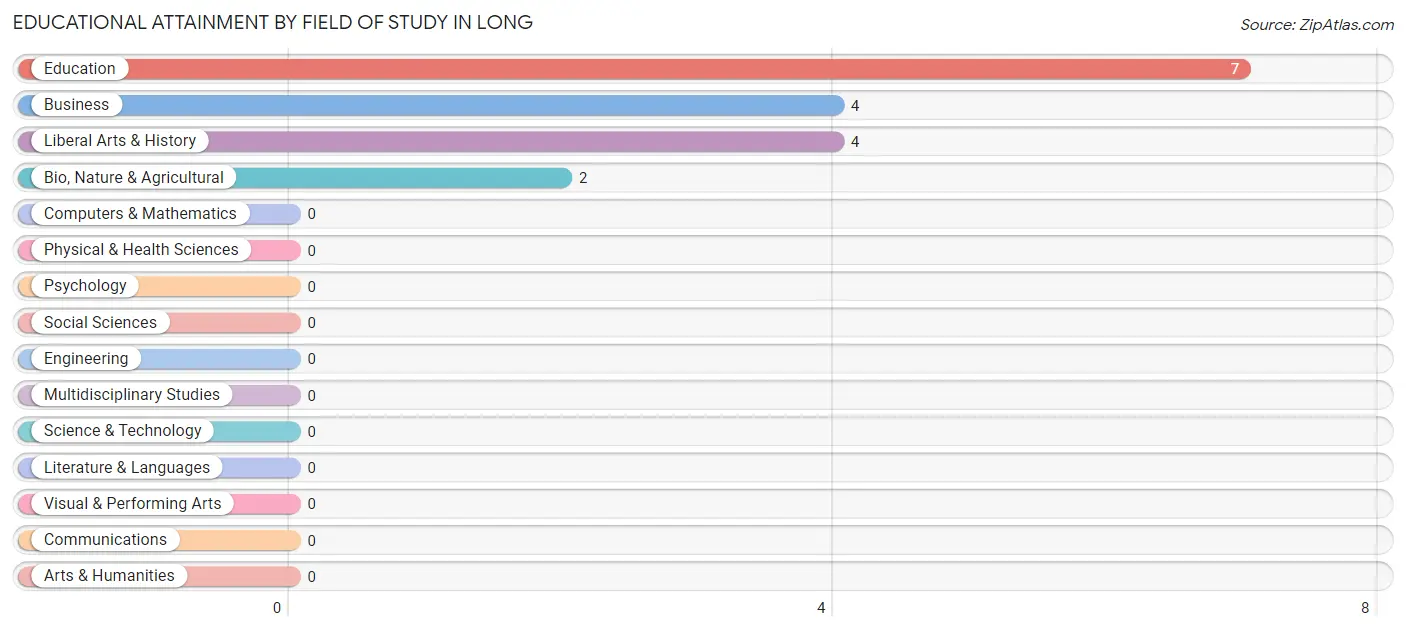
| Field of Study | # Graduates | % Graduates |
| Computers & Mathematics | 0 | 0.0% |
| Bio, Nature & Agricultural | 2 | 11.8% |
| Physical & Health Sciences | 0 | 0.0% |
| Psychology | 0 | 0.0% |
| Social Sciences | 0 | 0.0% |
| Engineering | 0 | 0.0% |
| Multidisciplinary Studies | 0 | 0.0% |
| Science & Technology | 0 | 0.0% |
| Business | 4 | 23.5% |
| Education | 7 | 41.2% |
| Literature & Languages | 0 | 0.0% |
| Liberal Arts & History | 4 | 23.5% |
| Visual & Performing Arts | 0 | 0.0% |
| Communications | 0 | 0.0% |
| Arts & Humanities | 0 | 0.0% |
| Total | 17 | 100.0% |
Transportation & Commute in Long
Vehicle Availability by Sex in Long
The most prevalent vehicle ownership categories in Long are males with 2 vehicles (40, accounting for 54.0%) and females with 2 vehicles (37, making up 48.8%).
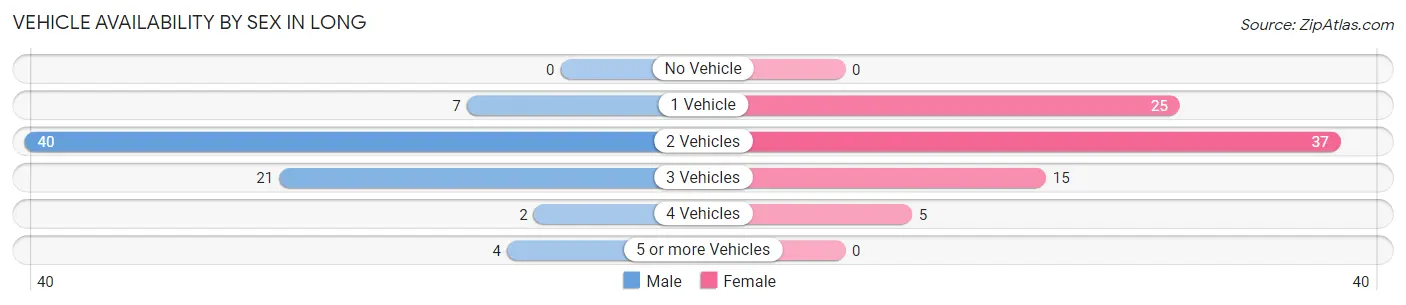
| Vehicles Available | Male | Female |
| No Vehicle | 0 (0.0%) | 0 (0.0%) |
| 1 Vehicle | 7 (9.5%) | 25 (30.5%) |
| 2 Vehicles | 40 (54.0%) | 37 (45.1%) |
| 3 Vehicles | 21 (28.4%) | 15 (18.3%) |
| 4 Vehicles | 2 (2.7%) | 5 (6.1%) |
| 5 or more Vehicles | 4 (5.4%) | 0 (0.0%) |
| Total | 74 (100.0%) | 82 (100.0%) |
Commute Time in Long
The most frequently occuring commute durations in Long are 15 to 19 minutes (43 commuters, 29.2%), 5 to 9 minutes (25 commuters, 17.0%), and 20 to 24 minutes (25 commuters, 17.0%).
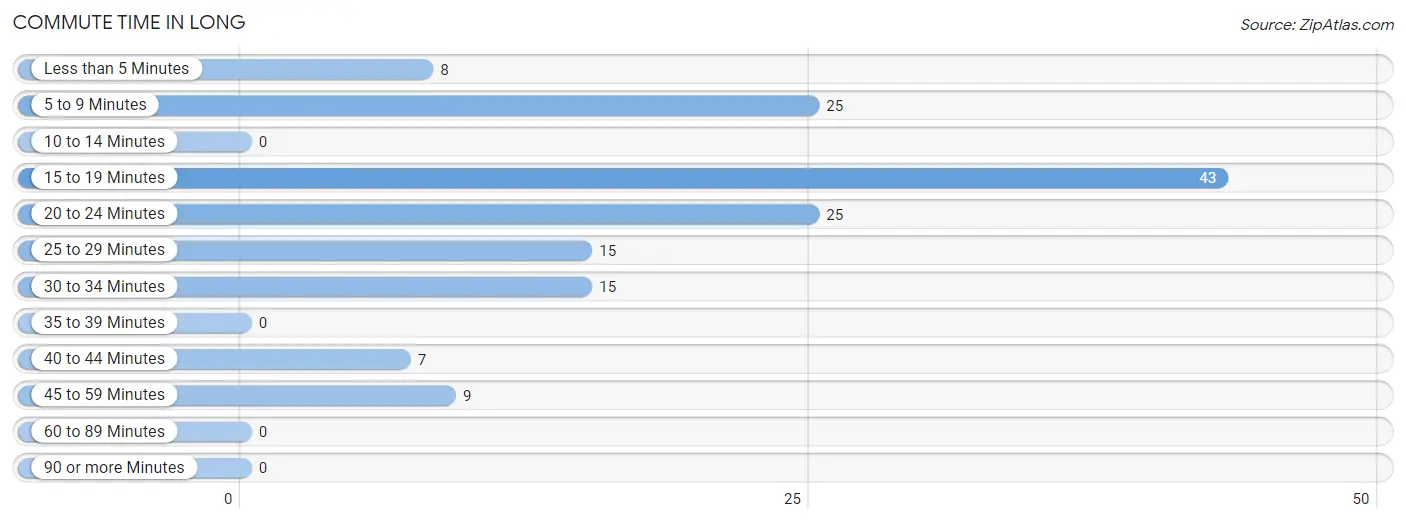
| Commute Time | # Commuters | % Commuters |
| Less than 5 Minutes | 8 | 5.4% |
| 5 to 9 Minutes | 25 | 17.0% |
| 10 to 14 Minutes | 0 | 0.0% |
| 15 to 19 Minutes | 43 | 29.2% |
| 20 to 24 Minutes | 25 | 17.0% |
| 25 to 29 Minutes | 15 | 10.2% |
| 30 to 34 Minutes | 15 | 10.2% |
| 35 to 39 Minutes | 0 | 0.0% |
| 40 to 44 Minutes | 7 | 4.8% |
| 45 to 59 Minutes | 9 | 6.1% |
| 60 to 89 Minutes | 0 | 0.0% |
| 90 or more Minutes | 0 | 0.0% |
Commute Time by Sex in Long
The most common commute times in Long are 15 to 19 minutes (28 commuters, 43.1%) for males and 20 to 24 minutes (17 commuters, 20.7%) for females.
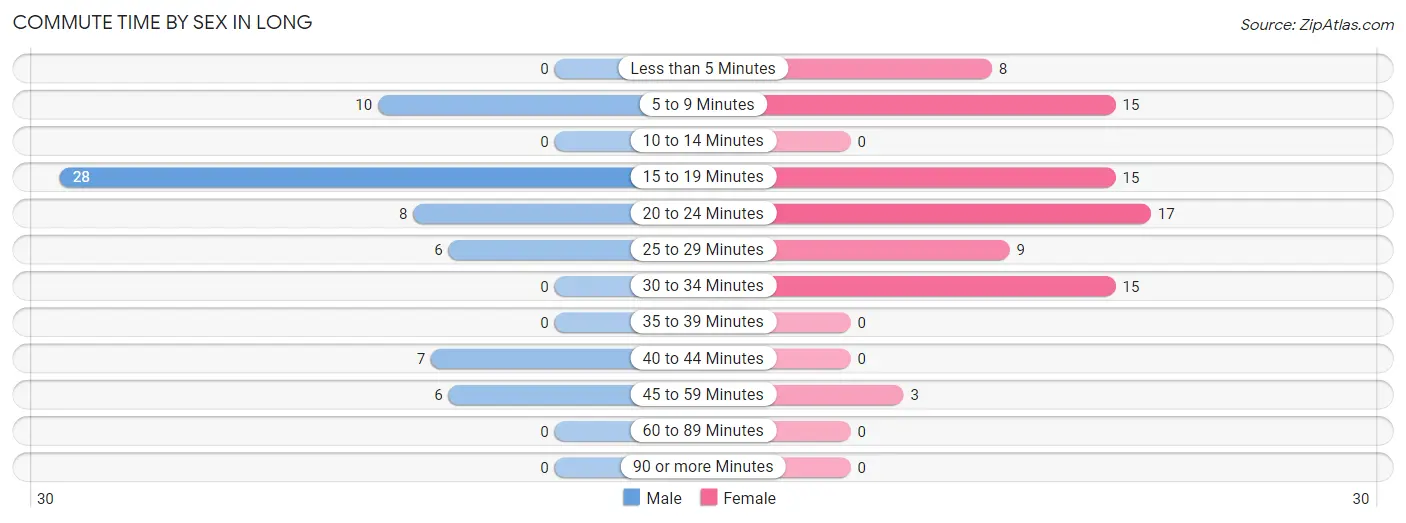
| Commute Time | Male | Female |
| Less than 5 Minutes | 0 (0.0%) | 8 (9.8%) |
| 5 to 9 Minutes | 10 (15.4%) | 15 (18.3%) |
| 10 to 14 Minutes | 0 (0.0%) | 0 (0.0%) |
| 15 to 19 Minutes | 28 (43.1%) | 15 (18.3%) |
| 20 to 24 Minutes | 8 (12.3%) | 17 (20.7%) |
| 25 to 29 Minutes | 6 (9.2%) | 9 (11.0%) |
| 30 to 34 Minutes | 0 (0.0%) | 15 (18.3%) |
| 35 to 39 Minutes | 0 (0.0%) | 0 (0.0%) |
| 40 to 44 Minutes | 7 (10.8%) | 0 (0.0%) |
| 45 to 59 Minutes | 6 (9.2%) | 3 (3.7%) |
| 60 to 89 Minutes | 0 (0.0%) | 0 (0.0%) |
| 90 or more Minutes | 0 (0.0%) | 0 (0.0%) |
Time of Departure to Work by Sex in Long
The most frequent times of departure to work in Long are 7:30 AM to 7:59 AM (30, 46.2%) for males and 5:30 AM to 5:59 AM (24, 29.3%) for females.
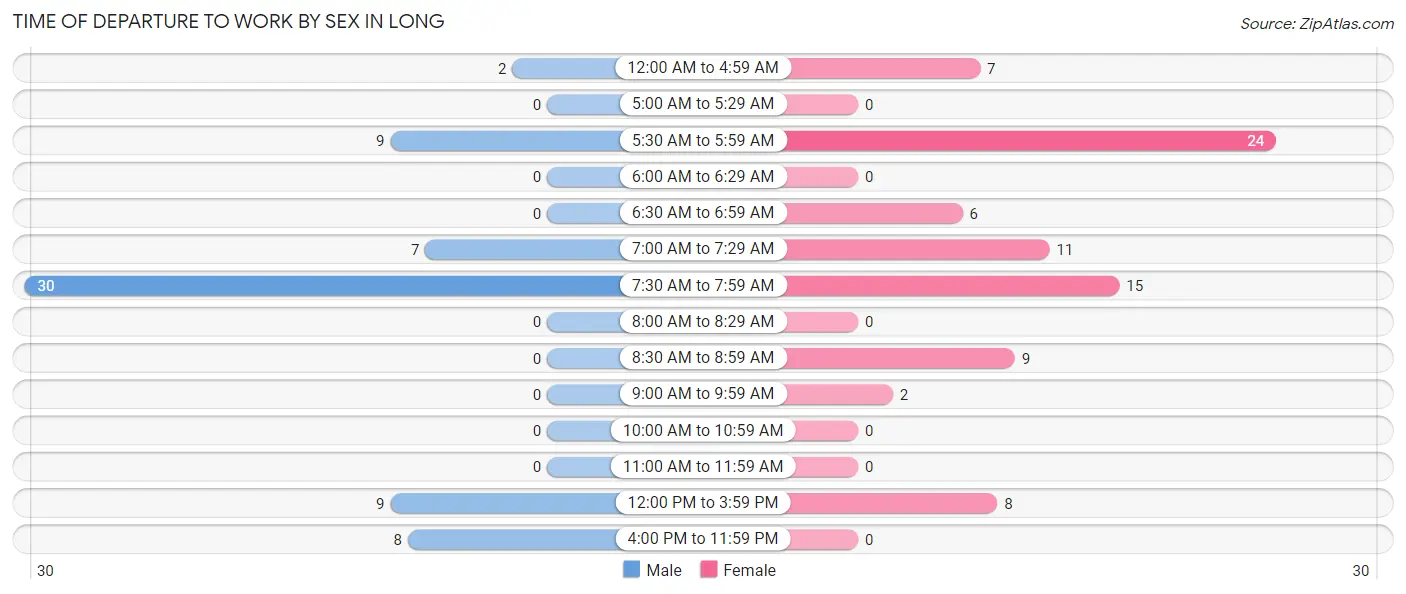
| Time of Departure | Male | Female |
| 12:00 AM to 4:59 AM | 2 (3.1%) | 7 (8.5%) |
| 5:00 AM to 5:29 AM | 0 (0.0%) | 0 (0.0%) |
| 5:30 AM to 5:59 AM | 9 (13.9%) | 24 (29.3%) |
| 6:00 AM to 6:29 AM | 0 (0.0%) | 0 (0.0%) |
| 6:30 AM to 6:59 AM | 0 (0.0%) | 6 (7.3%) |
| 7:00 AM to 7:29 AM | 7 (10.8%) | 11 (13.4%) |
| 7:30 AM to 7:59 AM | 30 (46.2%) | 15 (18.3%) |
| 8:00 AM to 8:29 AM | 0 (0.0%) | 0 (0.0%) |
| 8:30 AM to 8:59 AM | 0 (0.0%) | 9 (11.0%) |
| 9:00 AM to 9:59 AM | 0 (0.0%) | 2 (2.4%) |
| 10:00 AM to 10:59 AM | 0 (0.0%) | 0 (0.0%) |
| 11:00 AM to 11:59 AM | 0 (0.0%) | 0 (0.0%) |
| 12:00 PM to 3:59 PM | 9 (13.9%) | 8 (9.8%) |
| 4:00 PM to 11:59 PM | 8 (12.3%) | 0 (0.0%) |
| Total | 65 (100.0%) | 82 (100.0%) |
Housing Occupancy in Long
Occupancy by Ownership in Long
Of the total 140 dwellings in Long, owner-occupied units account for 104 (74.3%), while renter-occupied units make up 36 (25.7%).
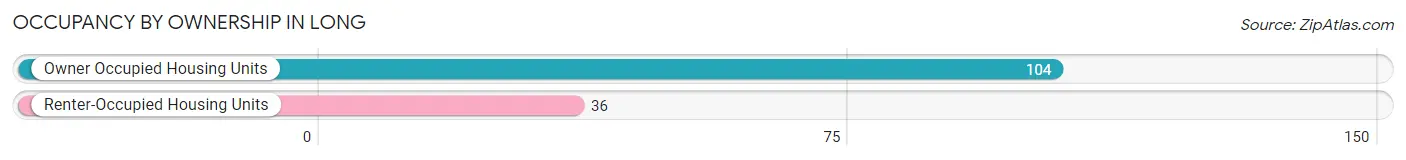
| Occupancy | # Housing Units | % Housing Units |
| Owner Occupied Housing Units | 104 | 74.3% |
| Renter-Occupied Housing Units | 36 | 25.7% |
| Total Occupied Housing Units | 140 | 100.0% |
Occupancy by Household Size in Long
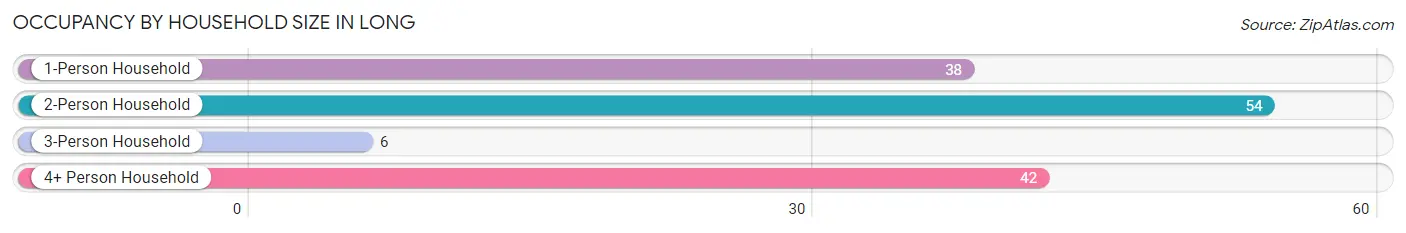
| Household Size | # Housing Units | % Housing Units |
| 1-Person Household | 38 | 27.1% |
| 2-Person Household | 54 | 38.6% |
| 3-Person Household | 6 | 4.3% |
| 4+ Person Household | 42 | 30.0% |
| Total Housing Units | 140 | 100.0% |
Occupancy by Ownership by Household Size in Long
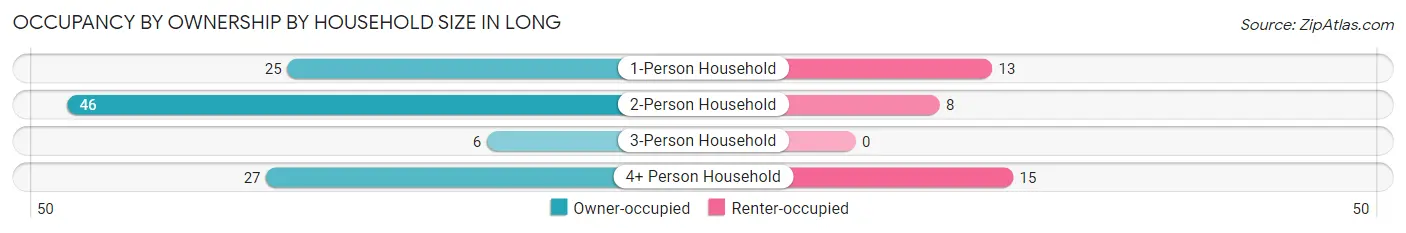
| Household Size | Owner-occupied | Renter-occupied |
| 1-Person Household | 25 (65.8%) | 13 (34.2%) |
| 2-Person Household | 46 (85.2%) | 8 (14.8%) |
| 3-Person Household | 6 (100.0%) | 0 (0.0%) |
| 4+ Person Household | 27 (64.3%) | 15 (35.7%) |
| Total Housing Units | 104 (74.3%) | 36 (25.7%) |
Occupancy by Educational Attainment in Long
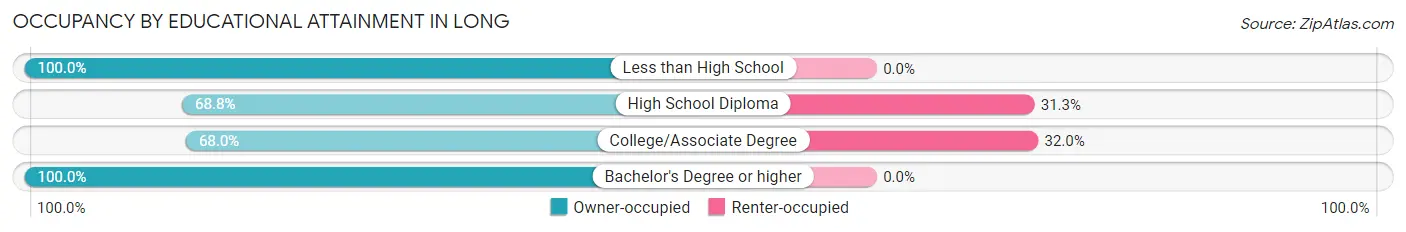
| Household Size | Owner-occupied | Renter-occupied |
| Less than High School | 18 (100.0%) | 0 (0.0%) |
| High School Diploma | 44 (68.8%) | 20 (31.2%) |
| College/Associate Degree | 34 (68.0%) | 16 (32.0%) |
| Bachelor's Degree or higher | 8 (100.0%) | 0 (0.0%) |
Occupancy by Age of Householder in Long
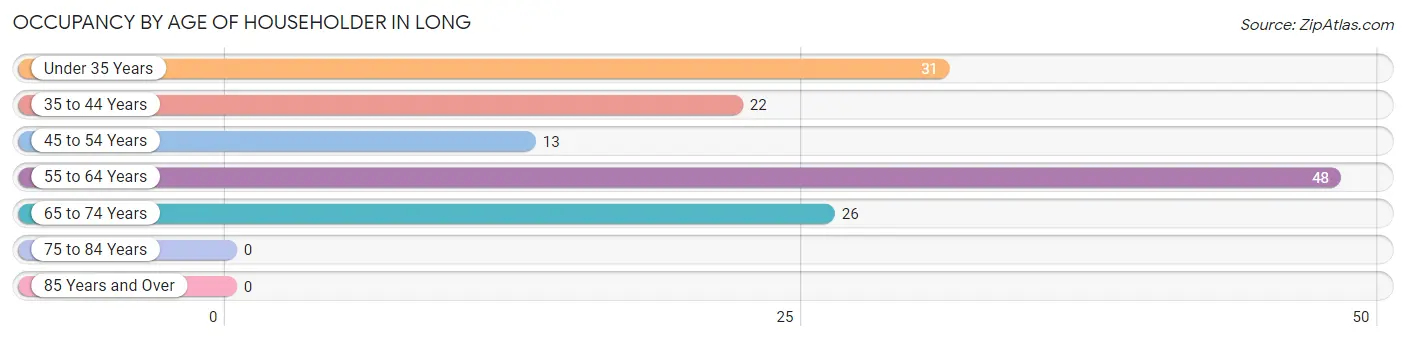
| Age Bracket | # Households | % Households |
| Under 35 Years | 31 | 22.1% |
| 35 to 44 Years | 22 | 15.7% |
| 45 to 54 Years | 13 | 9.3% |
| 55 to 64 Years | 48 | 34.3% |
| 65 to 74 Years | 26 | 18.6% |
| 75 to 84 Years | 0 | 0.0% |
| 85 Years and Over | 0 | 0.0% |
| Total | 140 | 100.0% |
Housing Finances in Long
Median Income by Occupancy in Long
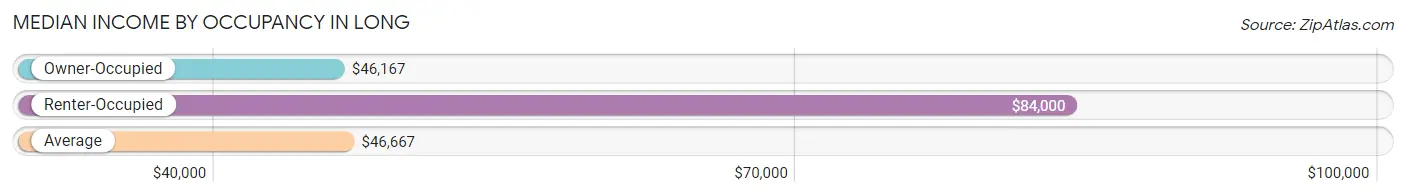
| Occupancy Type | # Households | Median Income |
| Owner-Occupied | 104 (74.3%) | $46,167 |
| Renter-Occupied | 36 (25.7%) | $84,000 |
| Average | 140 (100.0%) | $46,667 |
Occupancy by Householder Income Bracket in Long
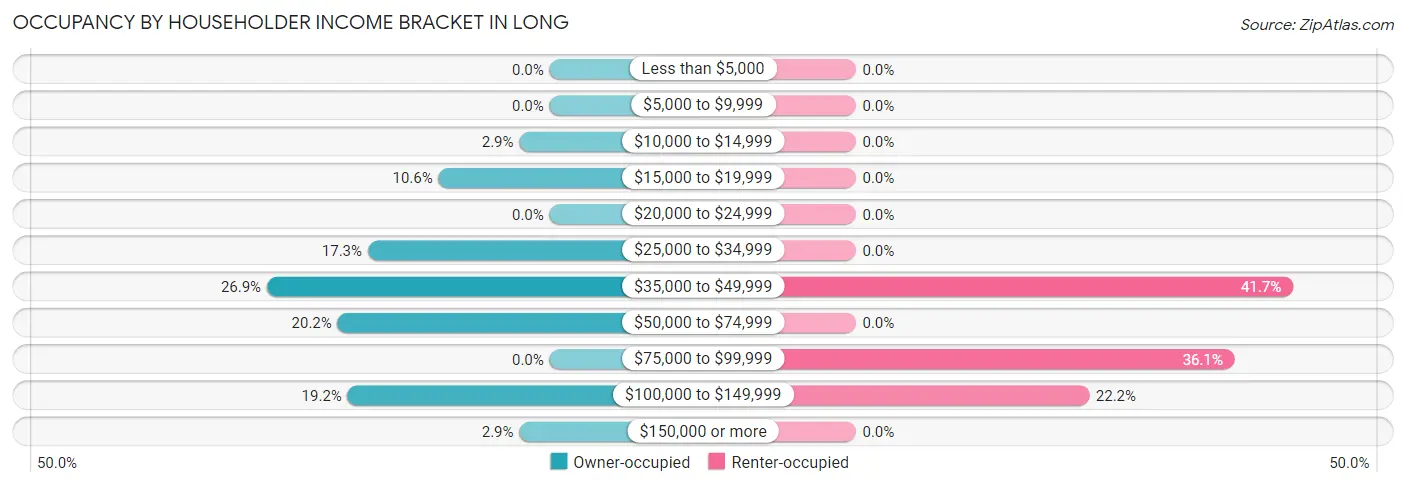
| Income Bracket | Owner-occupied | Renter-occupied |
| Less than $5,000 | 0 (0.0%) | 0 (0.0%) |
| $5,000 to $9,999 | 0 (0.0%) | 0 (0.0%) |
| $10,000 to $14,999 | 3 (2.9%) | 0 (0.0%) |
| $15,000 to $19,999 | 11 (10.6%) | 0 (0.0%) |
| $20,000 to $24,999 | 0 (0.0%) | 0 (0.0%) |
| $25,000 to $34,999 | 18 (17.3%) | 0 (0.0%) |
| $35,000 to $49,999 | 28 (26.9%) | 15 (41.7%) |
| $50,000 to $74,999 | 21 (20.2%) | 0 (0.0%) |
| $75,000 to $99,999 | 0 (0.0%) | 13 (36.1%) |
| $100,000 to $149,999 | 20 (19.2%) | 8 (22.2%) |
| $150,000 or more | 3 (2.9%) | 0 (0.0%) |
| Total | 104 (100.0%) | 36 (100.0%) |
Monthly Housing Cost Tiers in Long
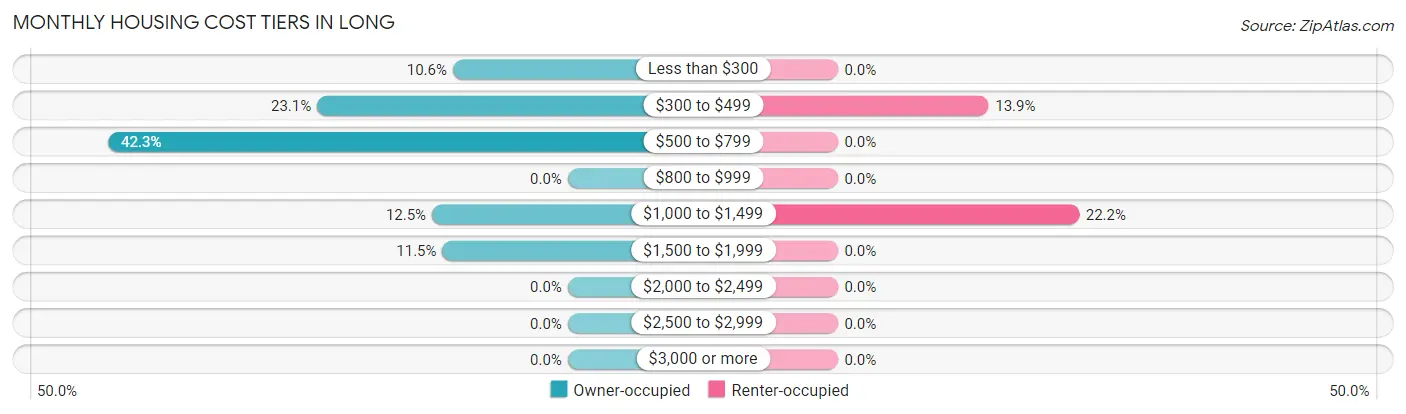
| Monthly Cost | Owner-occupied | Renter-occupied |
| Less than $300 | 11 (10.6%) | 0 (0.0%) |
| $300 to $499 | 24 (23.1%) | 5 (13.9%) |
| $500 to $799 | 44 (42.3%) | 0 (0.0%) |
| $800 to $999 | 0 (0.0%) | 0 (0.0%) |
| $1,000 to $1,499 | 13 (12.5%) | 8 (22.2%) |
| $1,500 to $1,999 | 12 (11.5%) | 0 (0.0%) |
| $2,000 to $2,499 | 0 (0.0%) | 0 (0.0%) |
| $2,500 to $2,999 | 0 (0.0%) | 0 (0.0%) |
| $3,000 or more | 0 (0.0%) | 0 (0.0%) |
| Total | 104 (100.0%) | 36 (100.0%) |
Physical Housing Characteristics in Long
Housing Structures in Long
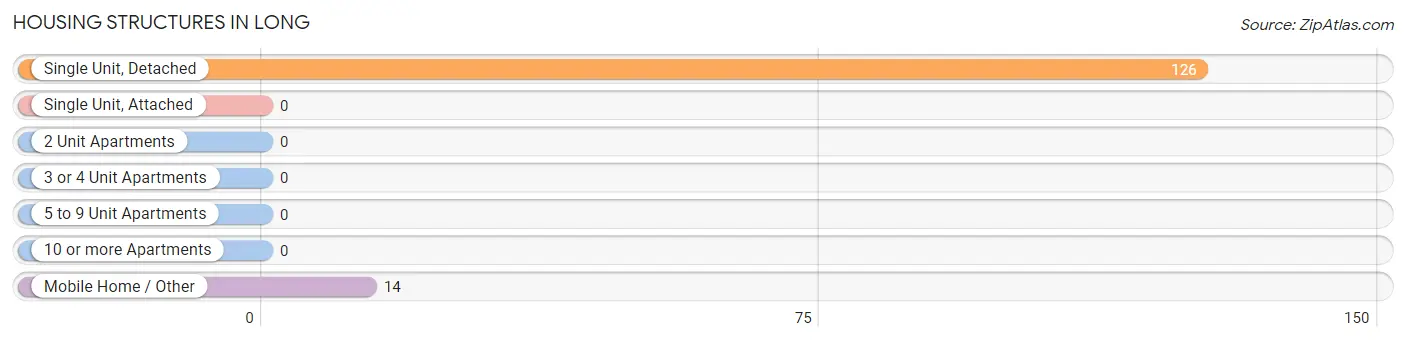
| Structure Type | # Housing Units | % Housing Units |
| Single Unit, Detached | 126 | 90.0% |
| Single Unit, Attached | 0 | 0.0% |
| 2 Unit Apartments | 0 | 0.0% |
| 3 or 4 Unit Apartments | 0 | 0.0% |
| 5 to 9 Unit Apartments | 0 | 0.0% |
| 10 or more Apartments | 0 | 0.0% |
| Mobile Home / Other | 14 | 10.0% |
| Total | 140 | 100.0% |
Housing Structures by Occupancy in Long
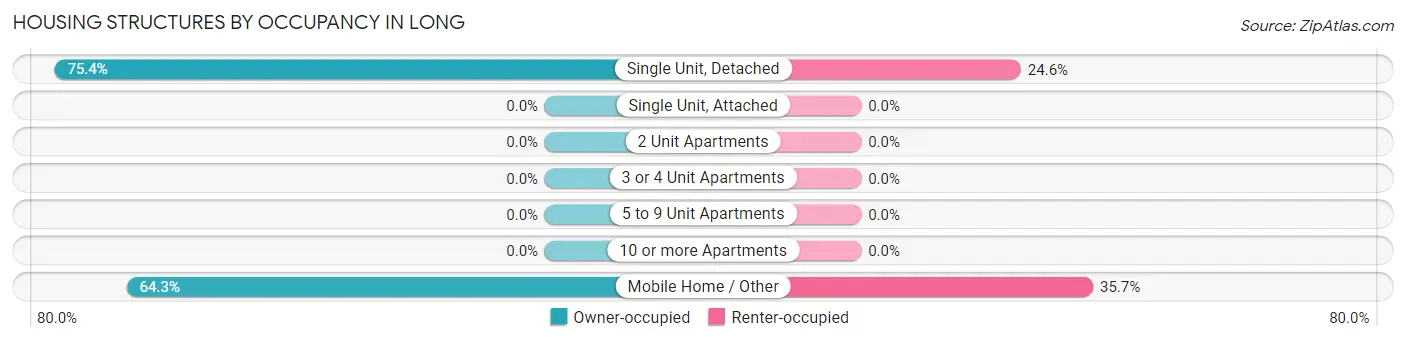
| Structure Type | Owner-occupied | Renter-occupied |
| Single Unit, Detached | 95 (75.4%) | 31 (24.6%) |
| Single Unit, Attached | 0 (0.0%) | 0 (0.0%) |
| 2 Unit Apartments | 0 (0.0%) | 0 (0.0%) |
| 3 or 4 Unit Apartments | 0 (0.0%) | 0 (0.0%) |
| 5 to 9 Unit Apartments | 0 (0.0%) | 0 (0.0%) |
| 10 or more Apartments | 0 (0.0%) | 0 (0.0%) |
| Mobile Home / Other | 9 (64.3%) | 5 (35.7%) |
| Total | 104 (74.3%) | 36 (25.7%) |
Housing Structures by Number of Rooms in Long
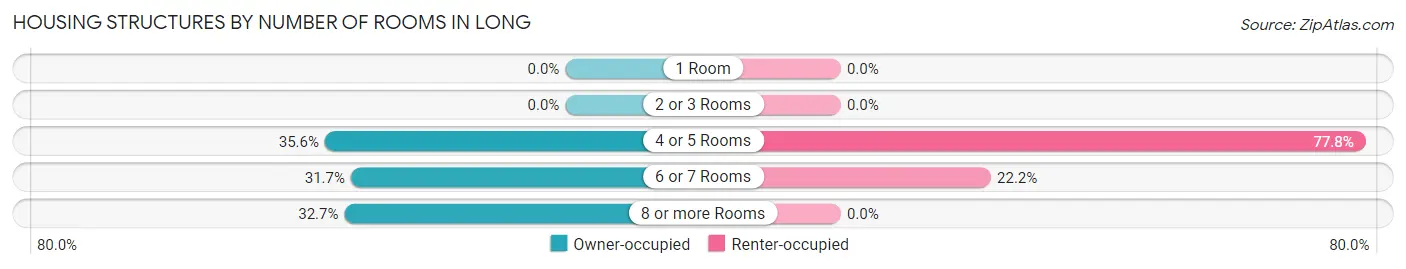
| Number of Rooms | Owner-occupied | Renter-occupied |
| 1 Room | 0 (0.0%) | 0 (0.0%) |
| 2 or 3 Rooms | 0 (0.0%) | 0 (0.0%) |
| 4 or 5 Rooms | 37 (35.6%) | 28 (77.8%) |
| 6 or 7 Rooms | 33 (31.7%) | 8 (22.2%) |
| 8 or more Rooms | 34 (32.7%) | 0 (0.0%) |
| Total | 104 (100.0%) | 36 (100.0%) |
Housing Structure by Heating Type in Long
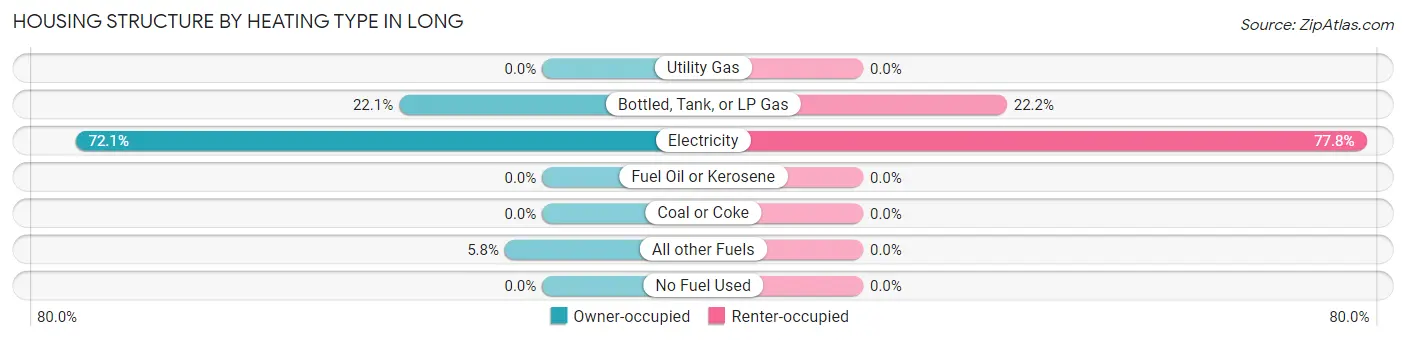
| Heating Type | Owner-occupied | Renter-occupied |
| Utility Gas | 0 (0.0%) | 0 (0.0%) |
| Bottled, Tank, or LP Gas | 23 (22.1%) | 8 (22.2%) |
| Electricity | 75 (72.1%) | 28 (77.8%) |
| Fuel Oil or Kerosene | 0 (0.0%) | 0 (0.0%) |
| Coal or Coke | 0 (0.0%) | 0 (0.0%) |
| All other Fuels | 6 (5.8%) | 0 (0.0%) |
| No Fuel Used | 0 (0.0%) | 0 (0.0%) |
| Total | 104 (100.0%) | 36 (100.0%) |
Household Vehicle Usage in Long
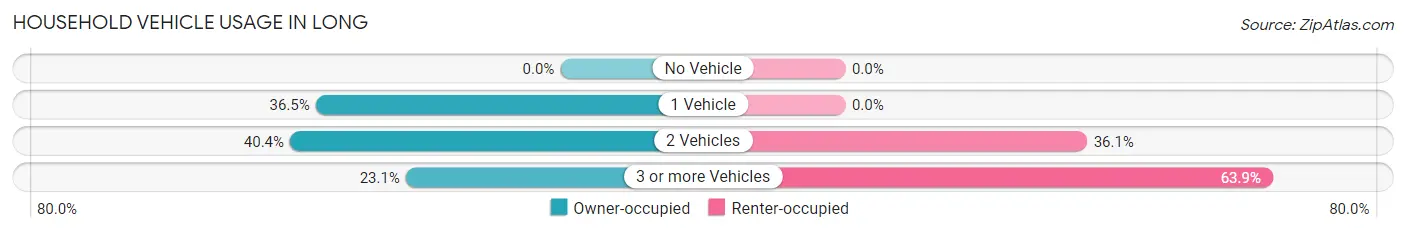
| Vehicles per Household | Owner-occupied | Renter-occupied |
| No Vehicle | 0 (0.0%) | 0 (0.0%) |
| 1 Vehicle | 38 (36.5%) | 0 (0.0%) |
| 2 Vehicles | 42 (40.4%) | 13 (36.1%) |
| 3 or more Vehicles | 24 (23.1%) | 23 (63.9%) |
| Total | 104 (100.0%) | 36 (100.0%) |
Real Estate & Mortgages in Long
Real Estate and Mortgage Overview in Long
| Characteristic | Without Mortgage | With Mortgage |
| Housing Units | 52 | 52 |
| Median Property Value | - | - |
| Median Household Income | $40,417 | $3 |
| Monthly Housing Costs | $350 | $0 |
| Real Estate Taxes | - | - |
Property Value by Mortgage Status in Long
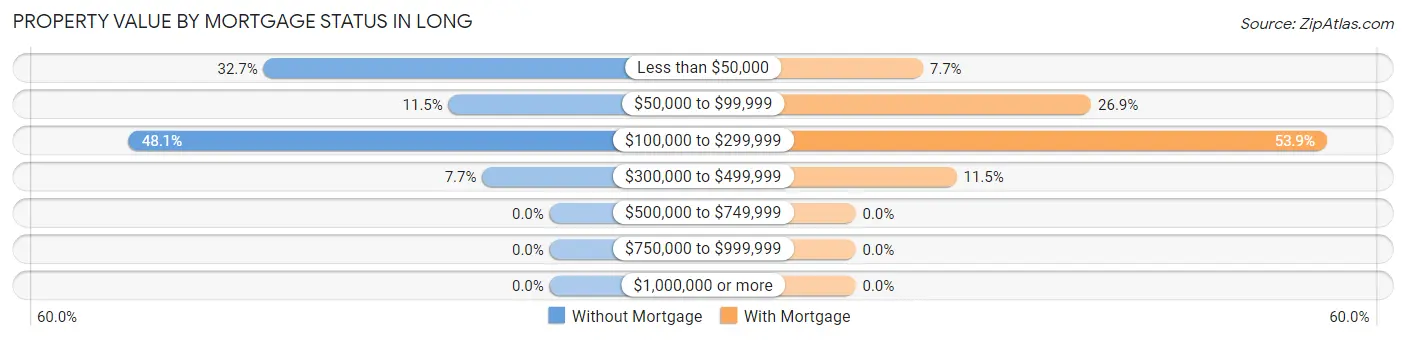
| Property Value | Without Mortgage | With Mortgage |
| Less than $50,000 | 17 (32.7%) | 4 (7.7%) |
| $50,000 to $99,999 | 6 (11.5%) | 14 (26.9%) |
| $100,000 to $299,999 | 25 (48.1%) | 28 (53.8%) |
| $300,000 to $499,999 | 4 (7.7%) | 6 (11.5%) |
| $500,000 to $749,999 | 0 (0.0%) | 0 (0.0%) |
| $750,000 to $999,999 | 0 (0.0%) | 0 (0.0%) |
| $1,000,000 or more | 0 (0.0%) | 0 (0.0%) |
| Total | 52 (100.0%) | 52 (100.0%) |
Household Income by Mortgage Status in Long
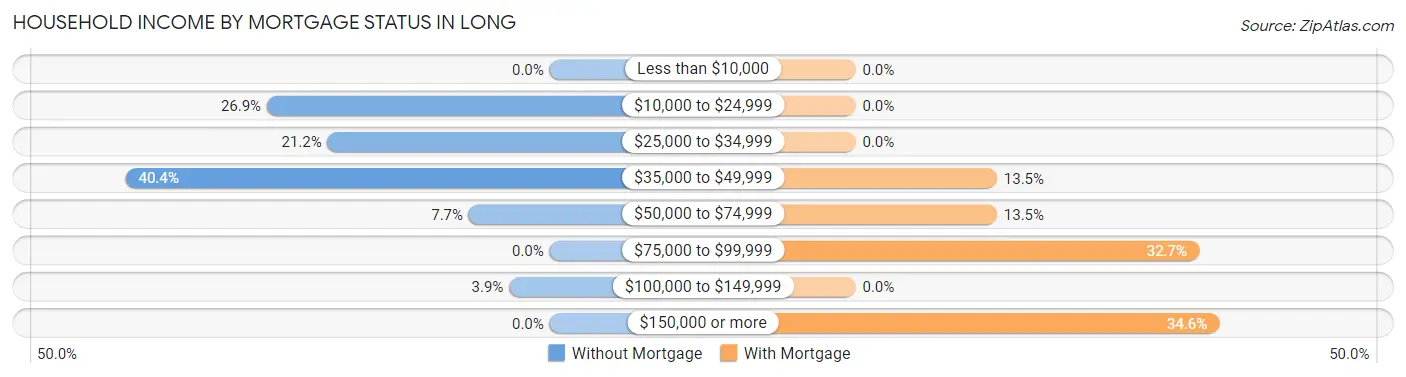
| Household Income | Without Mortgage | With Mortgage |
| Less than $10,000 | 0 (0.0%) | 0 (0.0%) |
| $10,000 to $24,999 | 14 (26.9%) | 0 (0.0%) |
| $25,000 to $34,999 | 11 (21.1%) | 0 (0.0%) |
| $35,000 to $49,999 | 21 (40.4%) | 7 (13.5%) |
| $50,000 to $74,999 | 4 (7.7%) | 7 (13.5%) |
| $75,000 to $99,999 | 0 (0.0%) | 17 (32.7%) |
| $100,000 to $149,999 | 2 (3.8%) | 0 (0.0%) |
| $150,000 or more | 0 (0.0%) | 18 (34.6%) |
| Total | 52 (100.0%) | 52 (100.0%) |
Property Value to Household Income Ratio in Long
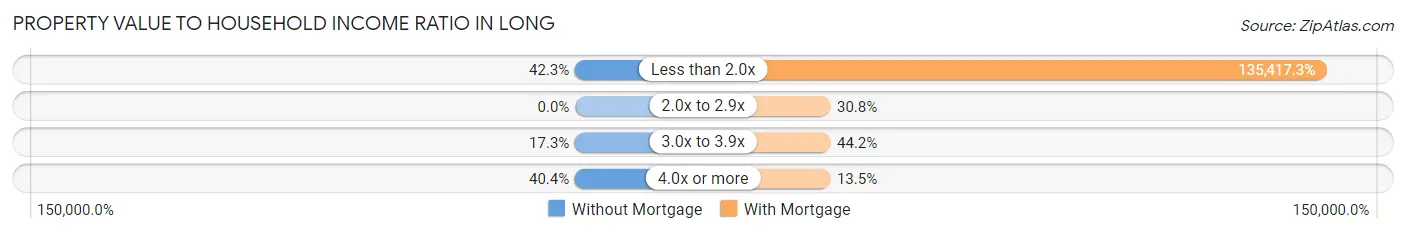
| Value-to-Income Ratio | Without Mortgage | With Mortgage |
| Less than 2.0x | 22 (42.3%) | 70,417 (135,417.3%) |
| 2.0x to 2.9x | 0 (0.0%) | 16 (30.8%) |
| 3.0x to 3.9x | 9 (17.3%) | 23 (44.2%) |
| 4.0x or more | 21 (40.4%) | 7 (13.5%) |
| Total | 52 (100.0%) | 52 (100.0%) |
Real Estate Taxes by Mortgage Status in Long
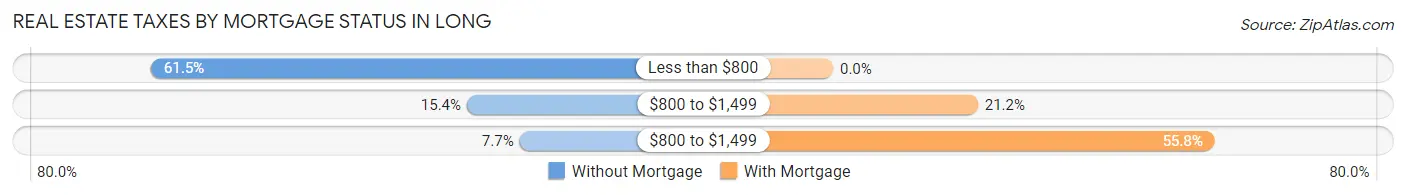
| Property Taxes | Without Mortgage | With Mortgage |
| Less than $800 | 32 (61.5%) | 0 (0.0%) |
| $800 to $1,499 | 8 (15.4%) | 11 (21.1%) |
| $800 to $1,499 | 4 (7.7%) | 29 (55.8%) |
| Total | 52 (100.0%) | 52 (100.0%) |
Health & Disability in Long
Health Insurance Coverage by Age in Long
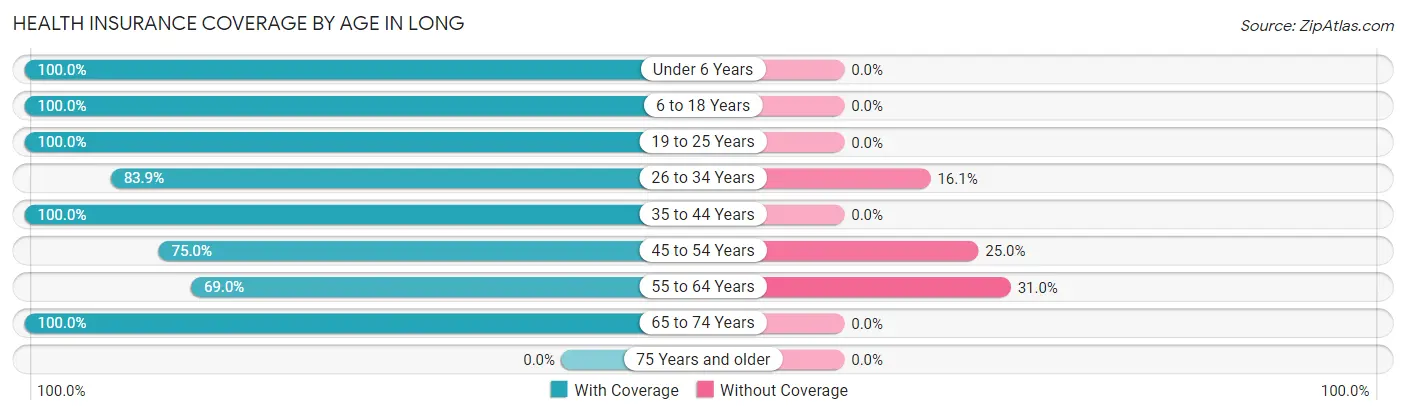
| Age Bracket | With Coverage | Without Coverage |
| Under 6 Years | 36 (100.0%) | 0 (0.0%) |
| 6 to 18 Years | 120 (100.0%) | 0 (0.0%) |
| 19 to 25 Years | 11 (100.0%) | 0 (0.0%) |
| 26 to 34 Years | 47 (83.9%) | 9 (16.1%) |
| 35 to 44 Years | 36 (100.0%) | 0 (0.0%) |
| 45 to 54 Years | 24 (75.0%) | 8 (25.0%) |
| 55 to 64 Years | 40 (69.0%) | 18 (31.0%) |
| 65 to 74 Years | 41 (100.0%) | 0 (0.0%) |
| 75 Years and older | 0 (0.0%) | 0 (0.0%) |
| Total | 355 (91.0%) | 35 (9.0%) |
Health Insurance Coverage by Citizenship Status in Long
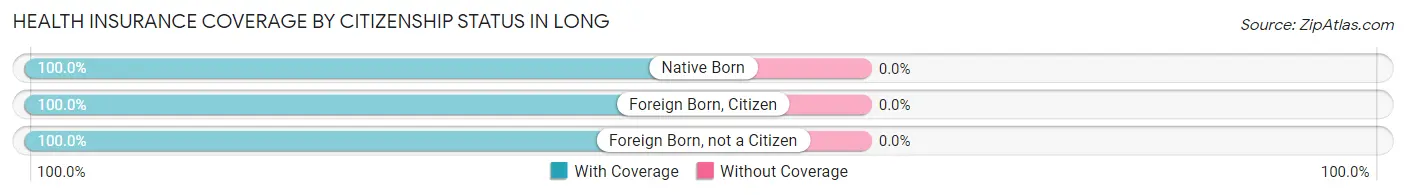
| Citizenship Status | With Coverage | Without Coverage |
| Native Born | 36 (100.0%) | 0 (0.0%) |
| Foreign Born, Citizen | 120 (100.0%) | 0 (0.0%) |
| Foreign Born, not a Citizen | 11 (100.0%) | 0 (0.0%) |
Health Insurance Coverage by Household Income in Long
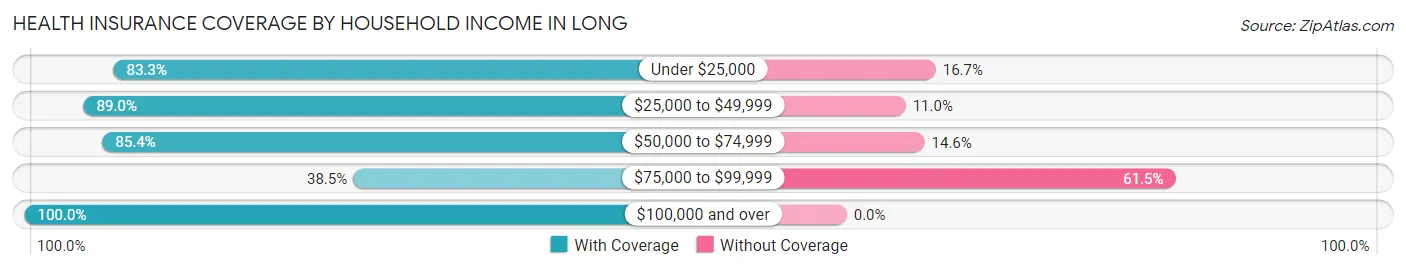
| Household Income | With Coverage | Without Coverage |
| Under $25,000 | 15 (83.3%) | 3 (16.7%) |
| $25,000 to $49,999 | 137 (89.0%) | 17 (11.0%) |
| $50,000 to $74,999 | 41 (85.4%) | 7 (14.6%) |
| $75,000 to $99,999 | 5 (38.5%) | 8 (61.5%) |
| $100,000 and over | 157 (100.0%) | 0 (0.0%) |
Public vs Private Health Insurance Coverage by Age in Long
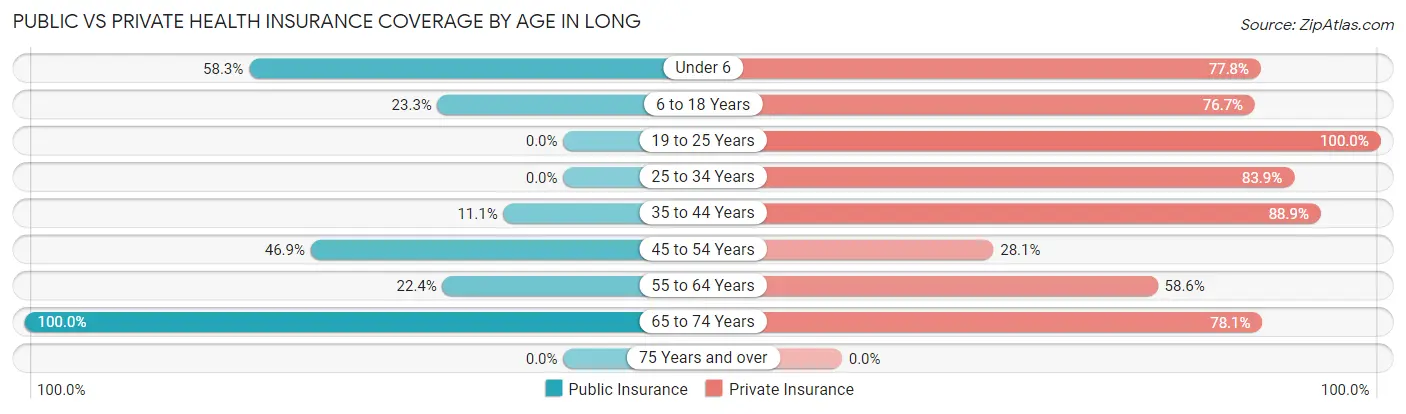
| Age Bracket | Public Insurance | Private Insurance |
| Under 6 | 21 (58.3%) | 28 (77.8%) |
| 6 to 18 Years | 28 (23.3%) | 92 (76.7%) |
| 19 to 25 Years | 0 (0.0%) | 11 (100.0%) |
| 25 to 34 Years | 0 (0.0%) | 47 (83.9%) |
| 35 to 44 Years | 4 (11.1%) | 32 (88.9%) |
| 45 to 54 Years | 15 (46.9%) | 9 (28.1%) |
| 55 to 64 Years | 13 (22.4%) | 34 (58.6%) |
| 65 to 74 Years | 41 (100.0%) | 32 (78.0%) |
| 75 Years and over | 0 (0.0%) | 0 (0.0%) |
| Total | 122 (31.3%) | 285 (73.1%) |
Disability Status by Sex by Age in Long
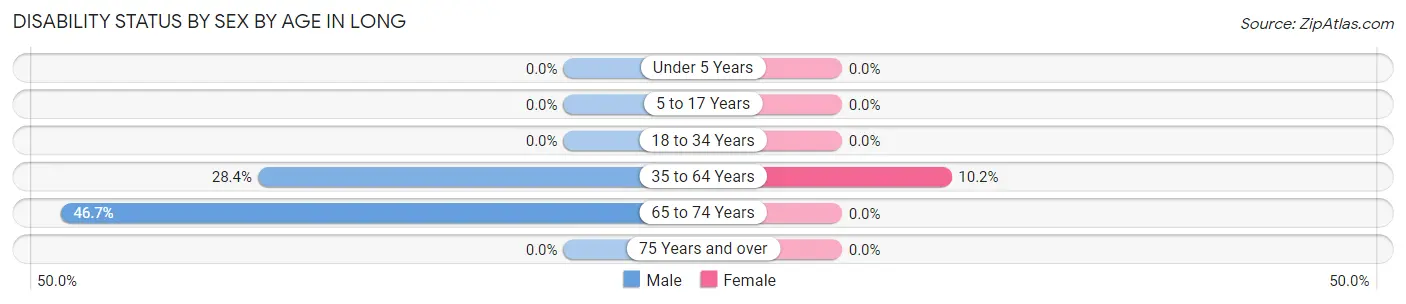
| Age Bracket | Male | Female |
| Under 5 Years | 0 (0.0%) | 0 (0.0%) |
| 5 to 17 Years | 0 (0.0%) | 0 (0.0%) |
| 18 to 34 Years | 0 (0.0%) | 0 (0.0%) |
| 35 to 64 Years | 19 (28.4%) | 6 (10.2%) |
| 65 to 74 Years | 7 (46.7%) | 0 (0.0%) |
| 75 Years and over | 0 (0.0%) | 0 (0.0%) |
Disability Class by Sex by Age in Long
Disability Class: Hearing Difficulty
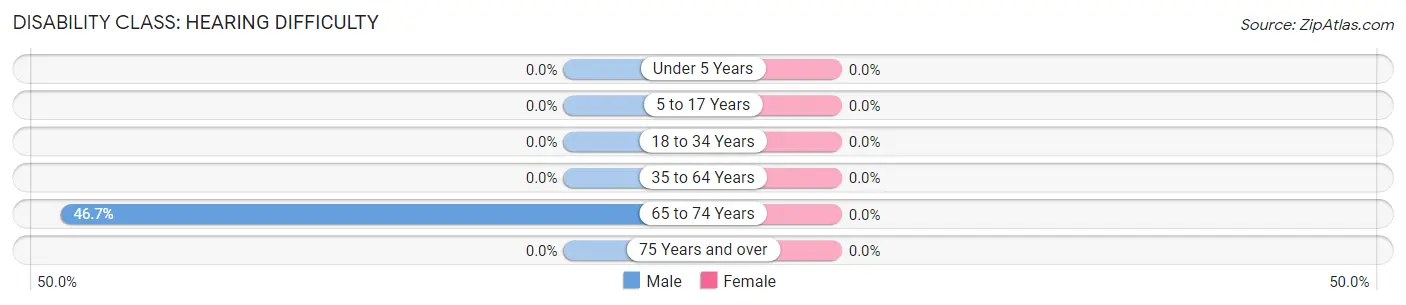
| Age Bracket | Male | Female |
| Under 5 Years | 0 (0.0%) | 0 (0.0%) |
| 5 to 17 Years | 0 (0.0%) | 0 (0.0%) |
| 18 to 34 Years | 0 (0.0%) | 0 (0.0%) |
| 35 to 64 Years | 0 (0.0%) | 0 (0.0%) |
| 65 to 74 Years | 7 (46.7%) | 0 (0.0%) |
| 75 Years and over | 0 (0.0%) | 0 (0.0%) |
Disability Class: Vision Difficulty
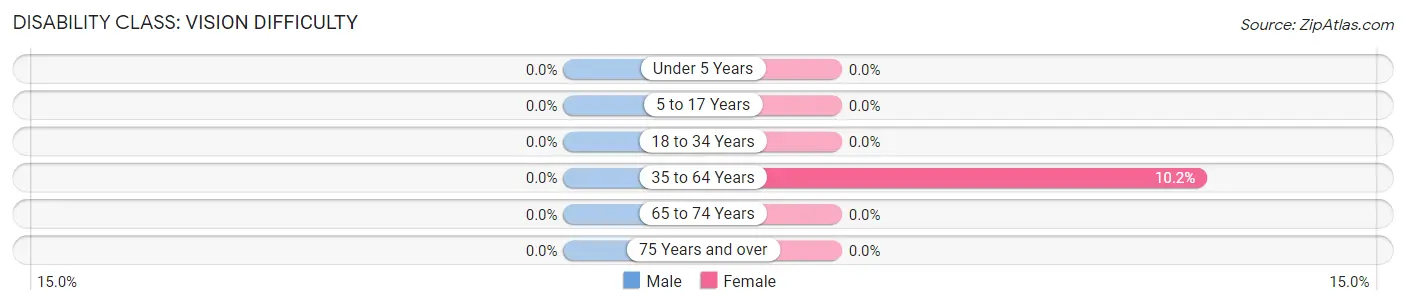
| Age Bracket | Male | Female |
| Under 5 Years | 0 (0.0%) | 0 (0.0%) |
| 5 to 17 Years | 0 (0.0%) | 0 (0.0%) |
| 18 to 34 Years | 0 (0.0%) | 0 (0.0%) |
| 35 to 64 Years | 0 (0.0%) | 6 (10.2%) |
| 65 to 74 Years | 0 (0.0%) | 0 (0.0%) |
| 75 Years and over | 0 (0.0%) | 0 (0.0%) |
Disability Class: Cognitive Difficulty
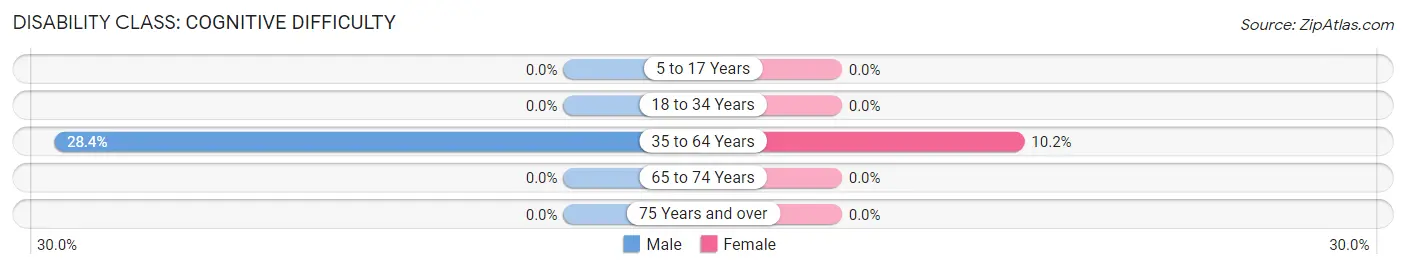
| Age Bracket | Male | Female |
| 5 to 17 Years | 0 (0.0%) | 0 (0.0%) |
| 18 to 34 Years | 0 (0.0%) | 0 (0.0%) |
| 35 to 64 Years | 19 (28.4%) | 6 (10.2%) |
| 65 to 74 Years | 0 (0.0%) | 0 (0.0%) |
| 75 Years and over | 0 (0.0%) | 0 (0.0%) |
Disability Class: Ambulatory Difficulty
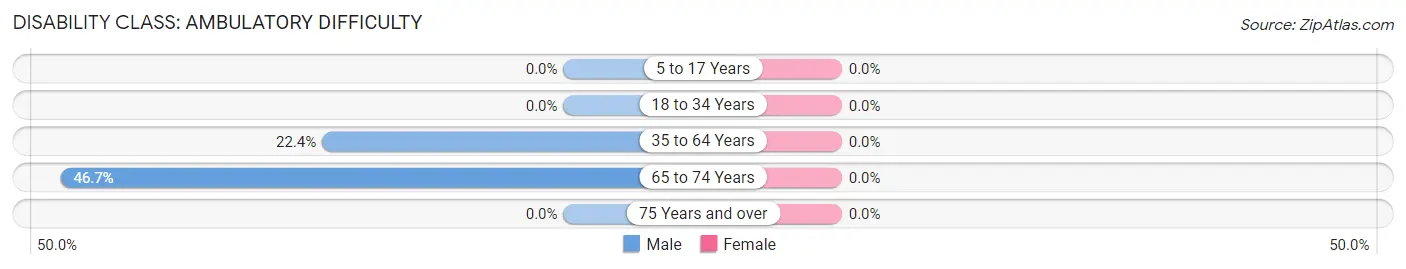
| Age Bracket | Male | Female |
| 5 to 17 Years | 0 (0.0%) | 0 (0.0%) |
| 18 to 34 Years | 0 (0.0%) | 0 (0.0%) |
| 35 to 64 Years | 15 (22.4%) | 0 (0.0%) |
| 65 to 74 Years | 7 (46.7%) | 0 (0.0%) |
| 75 Years and over | 0 (0.0%) | 0 (0.0%) |
Disability Class: Self-Care Difficulty
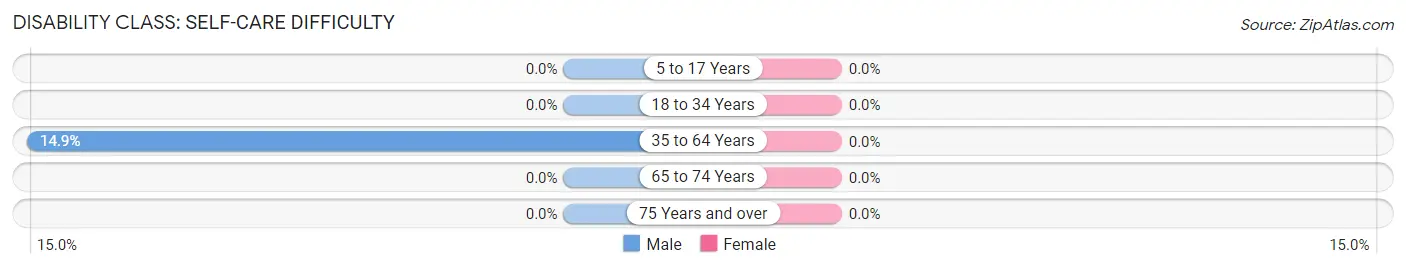
| Age Bracket | Male | Female |
| 5 to 17 Years | 0 (0.0%) | 0 (0.0%) |
| 18 to 34 Years | 0 (0.0%) | 0 (0.0%) |
| 35 to 64 Years | 10 (14.9%) | 0 (0.0%) |
| 65 to 74 Years | 0 (0.0%) | 0 (0.0%) |
| 75 Years and over | 0 (0.0%) | 0 (0.0%) |
Technology Access in Long
Computing Device Access in Long
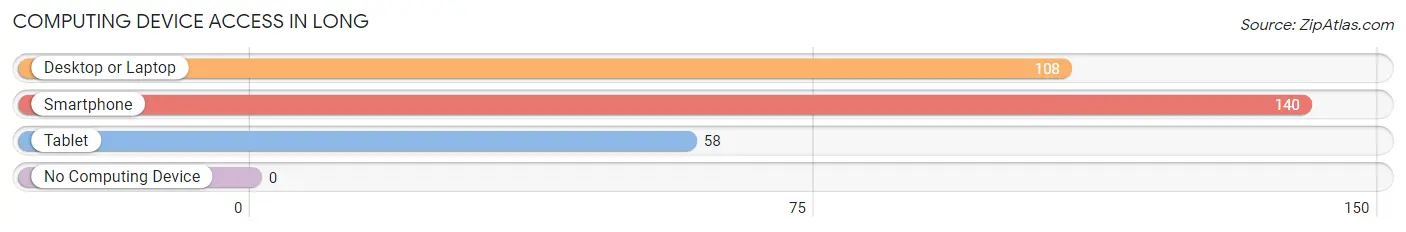
| Device Type | # Households | % Households |
| Desktop or Laptop | 108 | 77.1% |
| Smartphone | 140 | 100.0% |
| Tablet | 58 | 41.4% |
| No Computing Device | 0 | 0.0% |
| Total | 140 | 100.0% |
Internet Access in Long
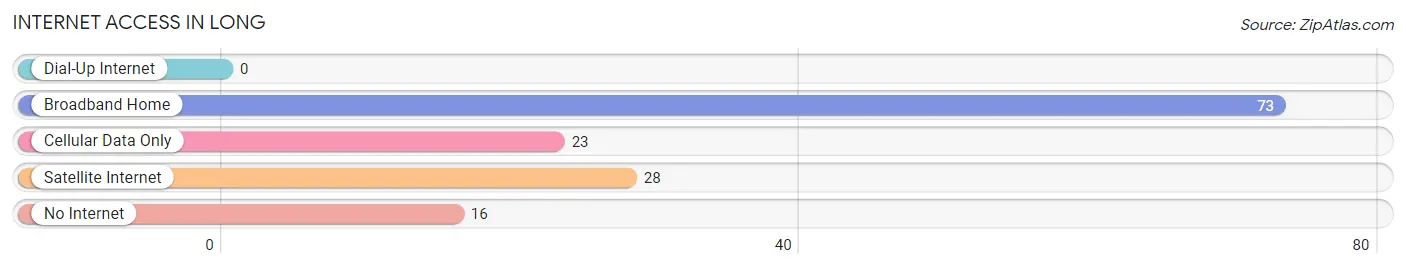
| Internet Type | # Households | % Households |
| Dial-Up Internet | 0 | 0.0% |
| Broadband Home | 73 | 52.1% |
| Cellular Data Only | 23 | 16.4% |
| Satellite Internet | 28 | 20.0% |
| No Internet | 16 | 11.4% |
| Total | 140 | 100.0% |
Long Summary
Oklahoma is a state located in the South Central region of the United States. It is bordered by Texas to the south, Arkansas to the east, Kansas to the north, and New Mexico to the west. Oklahoma is the 20th most extensive and the 28th most populous of the 50 United States. The state's name is derived from the Choctaw words okla and humma, meaning "red people". It is also known informally by its nickname, The Sooner State, in reference to the non-Native settlers who staked their claims on the choicest pieces of land before the official opening date of lands in the western Oklahoma Territory or before the Indian Appropriations Act of 1889, which increased European-American settlement in the eastern Indian Territory.
History
The area now known as Oklahoma was first settled by Native Americans, including the Caddo, Comanche, Osage, and Quapaw. The first European to visit the region was Spanish explorer Francisco Vásquez de Coronado in 1541. In the early 1800s, the United States government began to negotiate treaties with the Native American tribes in the area, culminating in the 1803 Louisiana Purchase. The area was part of the Indian Territory until the Oklahoma Organic Act of 1890, which created the Oklahoma Territory. The Oklahoma Territory was admitted to the Union as the 46th state in 1907.
Geography
Oklahoma covers an area of 69,899 square miles, making it the 20th largest state in the United States. It is located in the South Central region of the country and is bordered by Texas to the south, Arkansas to the east, Kansas to the north, and New Mexico to the west. Oklahoma is divided into 77 counties and contains five major physiographic regions: the Ozark Plateau, the Ouachita Mountains, the Arbuckle Mountains, the Wichita Mountains, and the Great Plains. The state's highest point is Black Mesa, at 4,973 feet, and its lowest point is Little River, at 289 feet.
Economy
Oklahoma's economy is largely based on the energy industry, with oil and natural gas production being the largest contributors. Other major industries include agriculture, manufacturing, and tourism. The state is also home to several major military installations, including Tinker Air Force Base, Fort Sill, and Altus Air Force Base.
Demographics
As of 2019, Oklahoma had an estimated population of 3.9 million people. The state is home to a diverse population, with the largest ethnic groups being White (68.3%), American Indian and Alaska Native (9.2%), Black or African American (7.7%), and Hispanic or Latino (7.6%). The median household income in Oklahoma is $50,051, and the poverty rate is 16.2%. The state's largest cities are Oklahoma City, Tulsa, Norman, Broken Arrow, and Lawton.
Common Questions
What is Per Capita Income in Long?
Per Capita income in Long is $21,980.
What is the Median Family Income in Long?
Median Family Income in Long is $46,500.
What is the Median Household income in Long?
Median Household Income in Long is $46,667.
What is Inequality or Gini Index in Long?
Inequality or Gini Index in Long is 0.34.
What is the Total Population of Long?
Total Population of Long is 390.
What is the Total Male Population of Long?
Total Male Population of Long is 216.
What is the Total Female Population of Long?
Total Female Population of Long is 174.
What is the Ratio of Males per 100 Females in Long?
There are 124.14 Males per 100 Females in Long.
What is the Ratio of Females per 100 Males in Long?
There are 80.56 Females per 100 Males in Long.
What is the Median Population Age in Long?
Median Population Age in Long is 28.8 Years.
What is the Average Family Size in Long
Average Family Size in Long is 3.5 People.
What is the Average Household Size in Long
Average Household Size in Long is 2.8 People.
How Large is the Labor Force in Long?
There are 156 People in the Labor Forcein in Long.
What is the Percentage of People in the Labor Force in Long?
61.4% of People are in the Labor Force in Long.