Bixby, OK Map & Demographics
Bixby Map
Bixby Overview
$45,275
PER CAPITA INCOME
$110,750
AVG FAMILY INCOME
$93,765
AVG HOUSEHOLD INCOME
43.2%
WAGE / INCOME GAP [ % ]
56.8¢/ $1
WAGE / INCOME GAP [ $ ]
$7,300
FAMILY INCOME DEFICIT
0.46
INEQUALITY / GINI INDEX
28,731
TOTAL POPULATION
13,850
MALE POPULATION
14,881
FEMALE POPULATION
93.07
MALES / 100 FEMALES
107.44
FEMALES / 100 MALES
36.8
MEDIAN AGE
3.3
AVG FAMILY SIZE
2.8
AVG HOUSEHOLD SIZE
14,289
LABOR FORCE [ PEOPLE ]
67.0%
PERCENT IN LABOR FORCE
3.6%
UNEMPLOYMENT RATE
Bixby Zip Codes
Bixby Area Codes
Income in Bixby
Income Overview in Bixby
Per Capita Income in Bixby is $45,275, while median incomes of families and households are $110,750 and $93,765 respectively.
| Characteristic | Number | Measure |
| Per Capita Income | 28,731 | $45,275 |
| Median Family Income | 7,531 | $110,750 |
| Mean Family Income | 7,531 | $148,395 |
| Median Household Income | 10,196 | $93,765 |
| Mean Household Income | 10,196 | $126,096 |
| Income Deficit | 7,531 | $7,300 |
| Wage / Income Gap (%) | 28,731 | 43.19% |
| Wage / Income Gap ($) | 28,731 | 56.81¢ per $1 |
| Gini / Inequality Index | 28,731 | 0.46 |
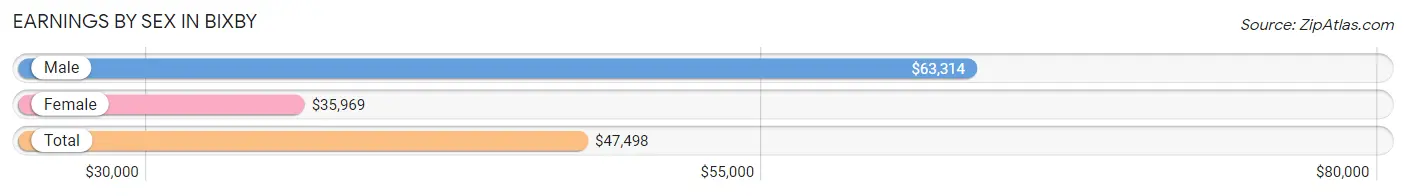
Earnings by Sex in Bixby
Average Earnings in Bixby are $47,498, $63,314 for men and $35,969 for women, a difference of 43.2%.
| Sex | Number | Average Earnings |
| Male | 8,012 (53.1%) | $63,314 |
| Female | 7,087 (46.9%) | $35,969 |
| Total | 15,099 (100.0%) | $47,498 |
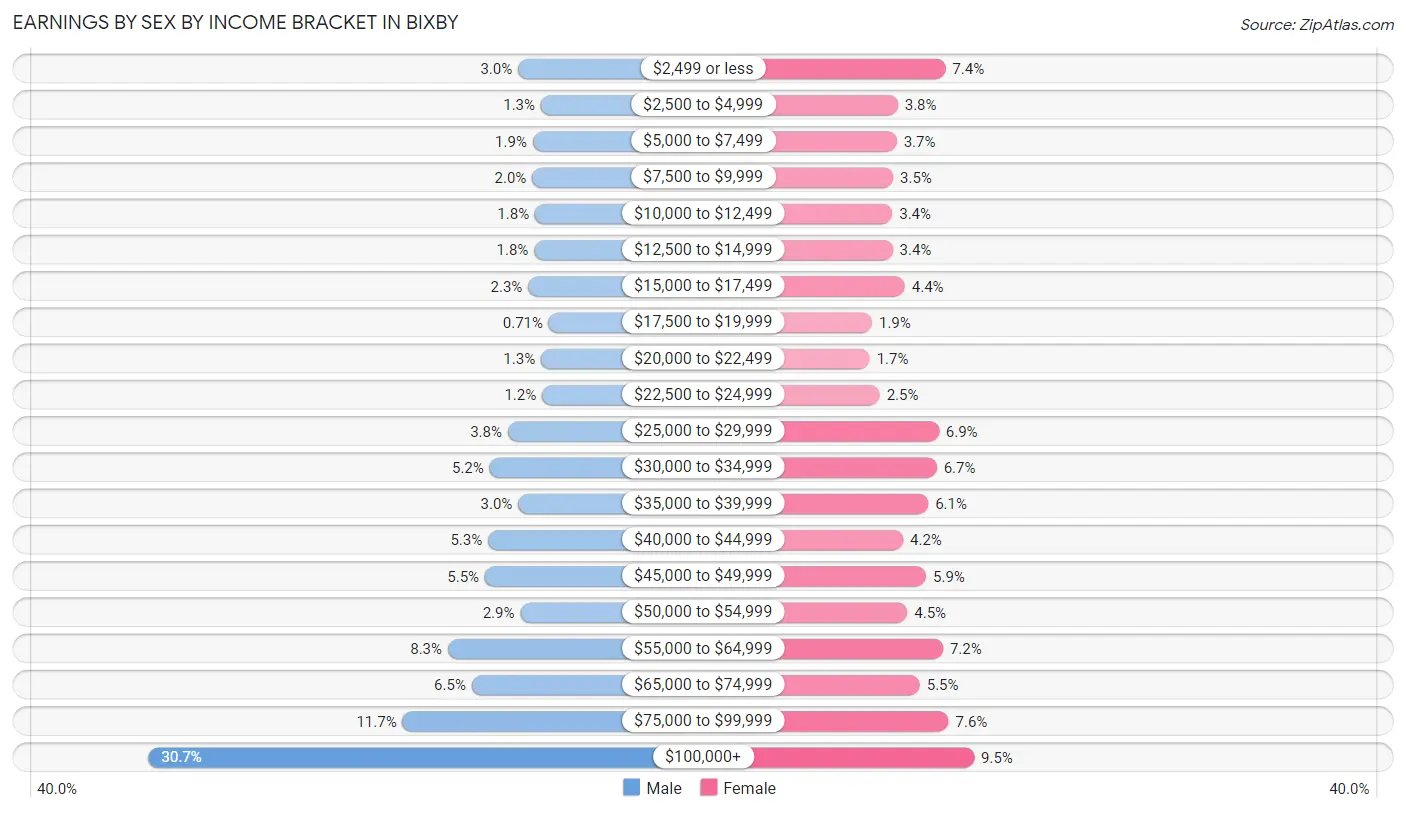
Earnings by Sex by Income Bracket in Bixby
The most common earnings brackets in Bixby are $100,000+ for men (2,461 | 30.7%) and $100,000+ for women (676 | 9.5%).
| Income | Male | Female |
| $2,499 or less | 242 (3.0%) | 524 (7.4%) |
| $2,500 to $4,999 | 105 (1.3%) | 271 (3.8%) |
| $5,000 to $7,499 | 154 (1.9%) | 265 (3.7%) |
| $7,500 to $9,999 | 157 (2.0%) | 246 (3.5%) |
| $10,000 to $12,499 | 140 (1.8%) | 242 (3.4%) |
| $12,500 to $14,999 | 145 (1.8%) | 243 (3.4%) |
| $15,000 to $17,499 | 181 (2.3%) | 308 (4.3%) |
| $17,500 to $19,999 | 57 (0.7%) | 134 (1.9%) |
| $20,000 to $22,499 | 104 (1.3%) | 122 (1.7%) |
| $22,500 to $24,999 | 98 (1.2%) | 175 (2.5%) |
| $25,000 to $29,999 | 304 (3.8%) | 489 (6.9%) |
| $30,000 to $34,999 | 413 (5.1%) | 478 (6.7%) |
| $35,000 to $39,999 | 241 (3.0%) | 432 (6.1%) |
| $40,000 to $44,999 | 422 (5.3%) | 299 (4.2%) |
| $45,000 to $49,999 | 441 (5.5%) | 421 (5.9%) |
| $50,000 to $54,999 | 228 (2.9%) | 322 (4.5%) |
| $55,000 to $64,999 | 663 (8.3%) | 511 (7.2%) |
| $65,000 to $74,999 | 520 (6.5%) | 388 (5.5%) |
| $75,000 to $99,999 | 936 (11.7%) | 541 (7.6%) |
| $100,000+ | 2,461 (30.7%) | 676 (9.5%) |
| Total | 8,012 (100.0%) | 7,087 (100.0%) |
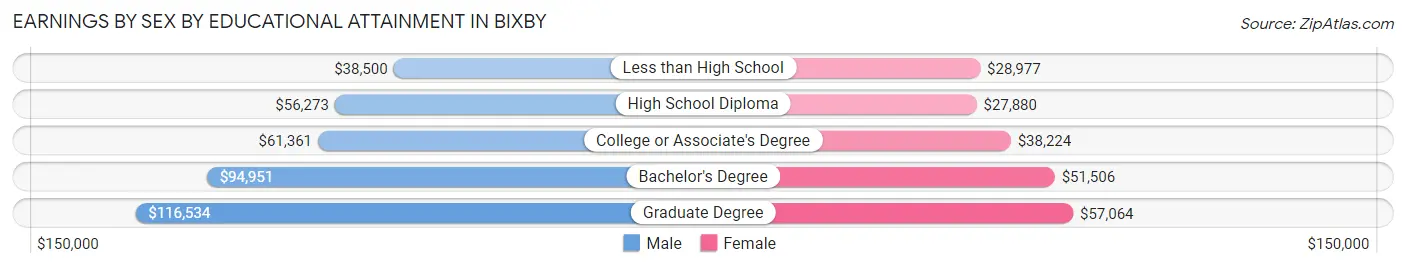
Earnings by Sex by Educational Attainment in Bixby
Average earnings in Bixby are $71,677 for men and $41,681 for women, a difference of 41.8%. Men with an educational attainment of graduate degree enjoy the highest average annual earnings of $116,534, while those with less than high school education earn the least with $38,500. Women with an educational attainment of graduate degree earn the most with the average annual earnings of $57,064, while those with high school diploma education have the smallest earnings of $27,880.
| Educational Attainment | Male Income | Female Income |
| Less than High School | $38,500 | $28,977 |
| High School Diploma | $56,273 | $27,880 |
| College or Associate's Degree | $61,361 | $38,224 |
| Bachelor's Degree | $94,951 | $51,506 |
| Graduate Degree | $116,534 | $57,064 |
| Total | $71,677 | $41,681 |
Family Income in Bixby
Family Income Brackets in Bixby
According to the Bixby family income data, there are 1,845 families falling into the $100,000 to $149,999 income range, which is the most common income bracket and makes up 24.5% of all families. Conversely, the less than $10,000 income bracket is the least frequent group with only 98 families (1.3%) belonging to this category.
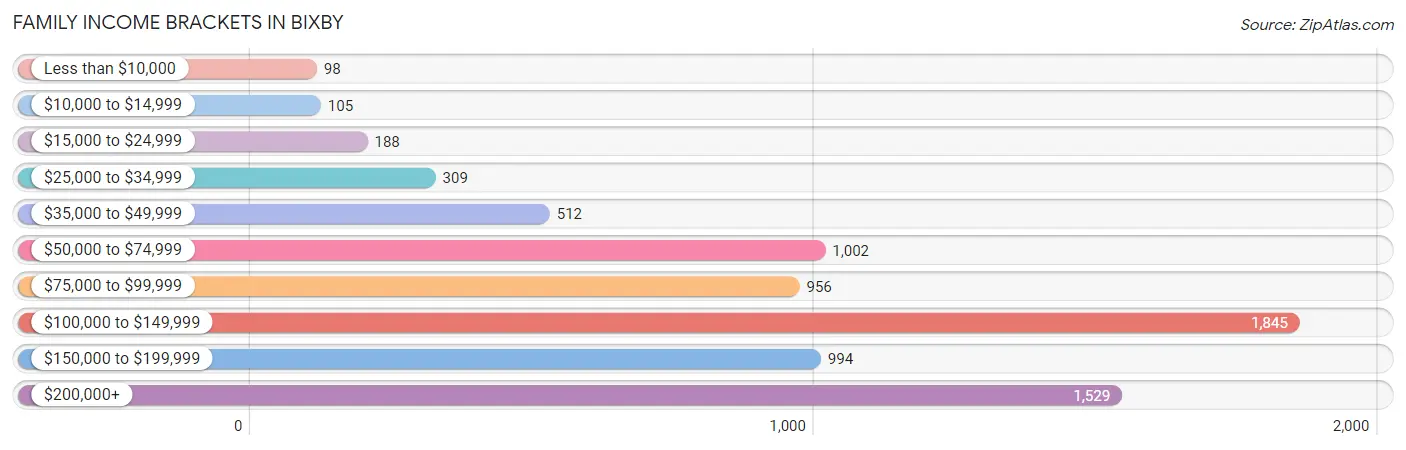
| Income Bracket | # Families | % Families |
| Less than $10,000 | 98 | 1.3% |
| $10,000 to $14,999 | 105 | 1.4% |
| $15,000 to $24,999 | 188 | 2.5% |
| $25,000 to $34,999 | 309 | 4.1% |
| $35,000 to $49,999 | 512 | 6.8% |
| $50,000 to $74,999 | 1,002 | 13.3% |
| $75,000 to $99,999 | 956 | 12.7% |
| $100,000 to $149,999 | 1,845 | 24.5% |
| $150,000 to $199,999 | 994 | 13.2% |
| $200,000+ | 1,529 | 20.3% |
Family Income by Famaliy Size in Bixby
6-person families (355 | 4.7%) account for the highest median family income in Bixby with $168,264 per family, while 2-person families (3,053 | 40.5%) have the highest median income of $47,108 per family member.
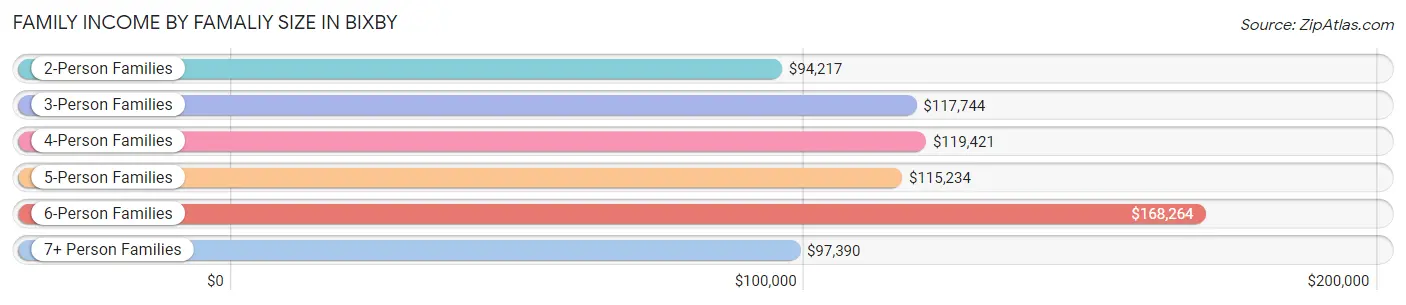
| Income Bracket | # Families | Median Income |
| 2-Person Families | 3,053 (40.5%) | $94,217 |
| 3-Person Families | 1,612 (21.4%) | $117,744 |
| 4-Person Families | 1,685 (22.4%) | $119,421 |
| 5-Person Families | 693 (9.2%) | $115,234 |
| 6-Person Families | 355 (4.7%) | $168,264 |
| 7+ Person Families | 133 (1.8%) | $97,390 |
| Total | 7,531 (100.0%) | $110,750 |
Family Income by Number of Earners in Bixby
The median family income in Bixby is $110,750, with families comprising 3+ earners (976) having the highest median family income of $173,500, while families with no earners (615) have the lowest median family income of $61,088, accounting for 13.0% and 8.2% of families, respectively.
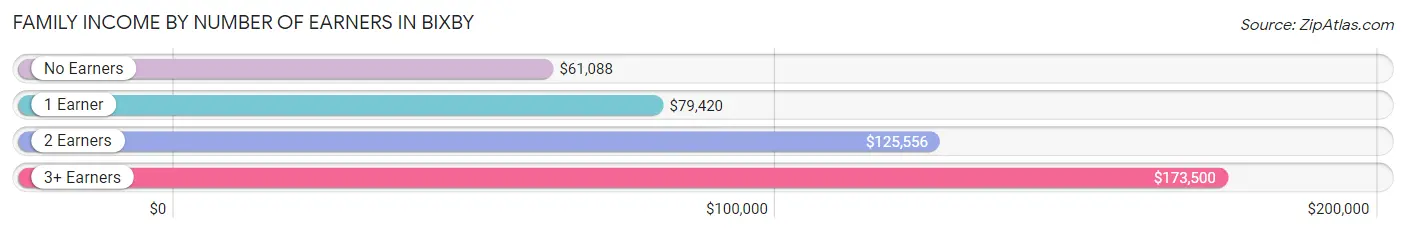
| Number of Earners | # Families | Median Income |
| No Earners | 615 (8.2%) | $61,088 |
| 1 Earner | 2,378 (31.6%) | $79,420 |
| 2 Earners | 3,562 (47.3%) | $125,556 |
| 3+ Earners | 976 (13.0%) | $173,500 |
| Total | 7,531 (100.0%) | $110,750 |
Household Income in Bixby
Household Income Brackets in Bixby
With 2,131 households falling in the category, the $100,000 to $149,999 income range is the most frequent in Bixby, accounting for 20.9% of all households. In contrast, only 275 households (2.7%) fall into the $10,000 to $14,999 income bracket, making it the least populous group.
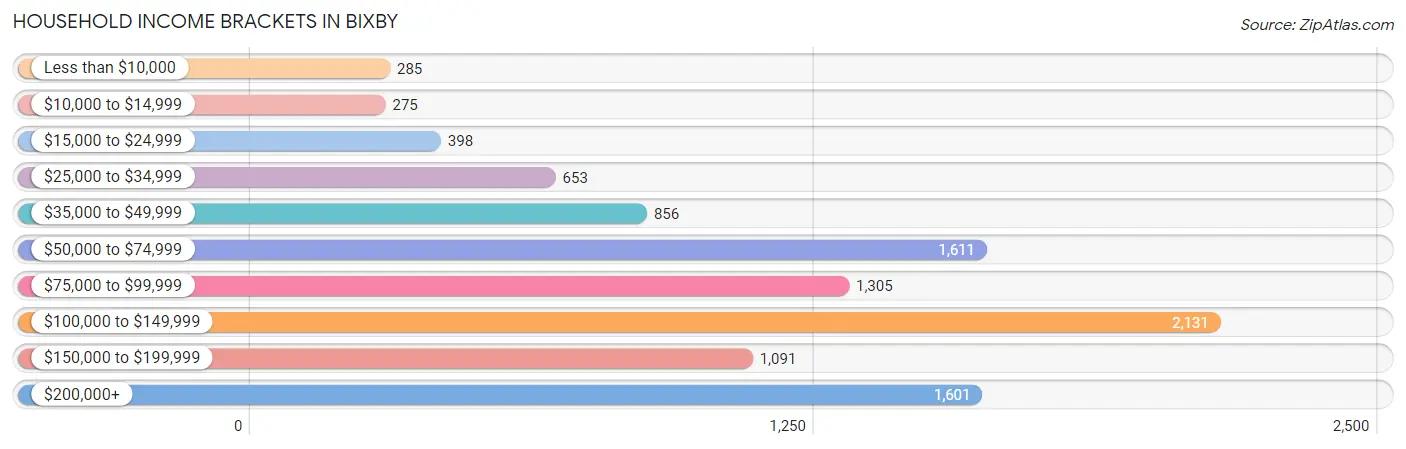
| Income Bracket | # Households | % Households |
| Less than $10,000 | 285 | 2.8% |
| $10,000 to $14,999 | 275 | 2.7% |
| $15,000 to $24,999 | 398 | 3.9% |
| $25,000 to $34,999 | 653 | 6.4% |
| $35,000 to $49,999 | 856 | 8.4% |
| $50,000 to $74,999 | 1,611 | 15.8% |
| $75,000 to $99,999 | 1,305 | 12.8% |
| $100,000 to $149,999 | 2,131 | 20.9% |
| $150,000 to $199,999 | 1,091 | 10.7% |
| $200,000+ | 1,601 | 15.7% |
Household Income by Householder Age in Bixby
The median household income in Bixby is $93,765, with the highest median household income of $109,579 found in the 45 to 64 years age bracket for the primary householder. A total of 3,943 households (38.7%) fall into this category. Meanwhile, the 15 to 24 years age bracket for the primary householder has the lowest median household income of $42,765, with 259 households (2.5%) in this group.
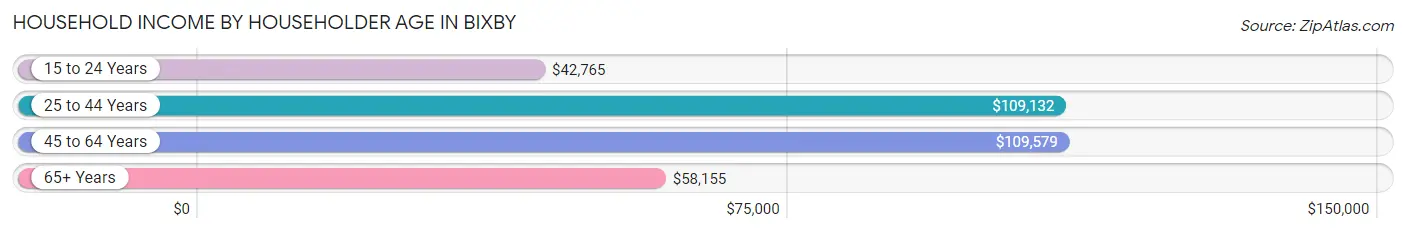
| Income Bracket | # Households | Median Income |
| 15 to 24 Years | 259 (2.5%) | $42,765 |
| 25 to 44 Years | 3,435 (33.7%) | $109,132 |
| 45 to 64 Years | 3,943 (38.7%) | $109,579 |
| 65+ Years | 2,559 (25.1%) | $58,155 |
| Total | 10,196 (100.0%) | $93,765 |
Poverty in Bixby
Income Below Poverty by Sex and Age in Bixby
With 4.9% poverty level for males and 7.2% for females among the residents of Bixby, 6 to 11 year old males and 75 year old and over females are the most vulnerable to poverty, with 159 males (11.3%) and 115 females (13.5%) in their respective age groups living below the poverty level.
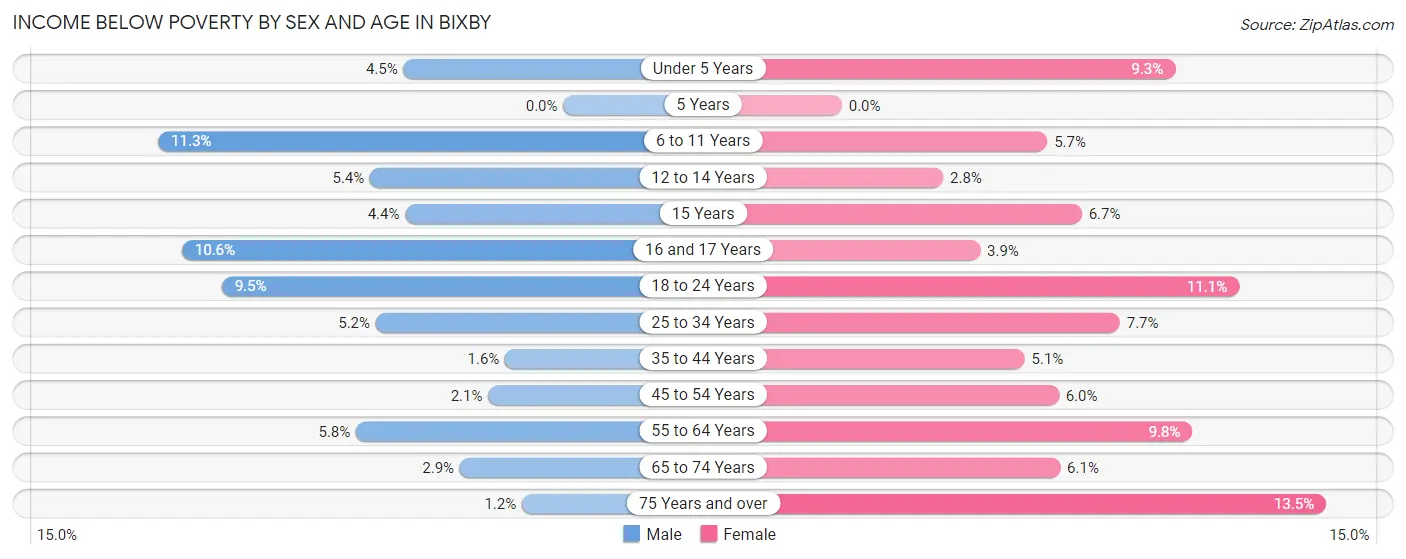
| Age Bracket | Male | Female |
| Under 5 Years | 46 (4.4%) | 82 (9.3%) |
| 5 Years | 0 (0.0%) | 0 (0.0%) |
| 6 to 11 Years | 159 (11.3%) | 77 (5.7%) |
| 12 to 14 Years | 43 (5.4%) | 20 (2.8%) |
| 15 Years | 15 (4.4%) | 25 (6.7%) |
| 16 and 17 Years | 50 (10.6%) | 19 (3.8%) |
| 18 to 24 Years | 83 (9.5%) | 124 (11.1%) |
| 25 to 34 Years | 81 (5.2%) | 144 (7.7%) |
| 35 to 44 Years | 31 (1.6%) | 110 (5.1%) |
| 45 to 54 Years | 37 (2.1%) | 104 (6.0%) |
| 55 to 64 Years | 97 (5.8%) | 165 (9.8%) |
| 65 to 74 Years | 32 (2.9%) | 85 (6.1%) |
| 75 Years and over | 7 (1.1%) | 115 (13.5%) |
| Total | 681 (4.9%) | 1,070 (7.2%) |
Income Above Poverty by Sex and Age in Bixby
According to the poverty statistics in Bixby, males aged 5 years and females aged 5 years are the age groups that are most secure financially, with 100.0% of males and 100.0% of females in these age groups living above the poverty line.
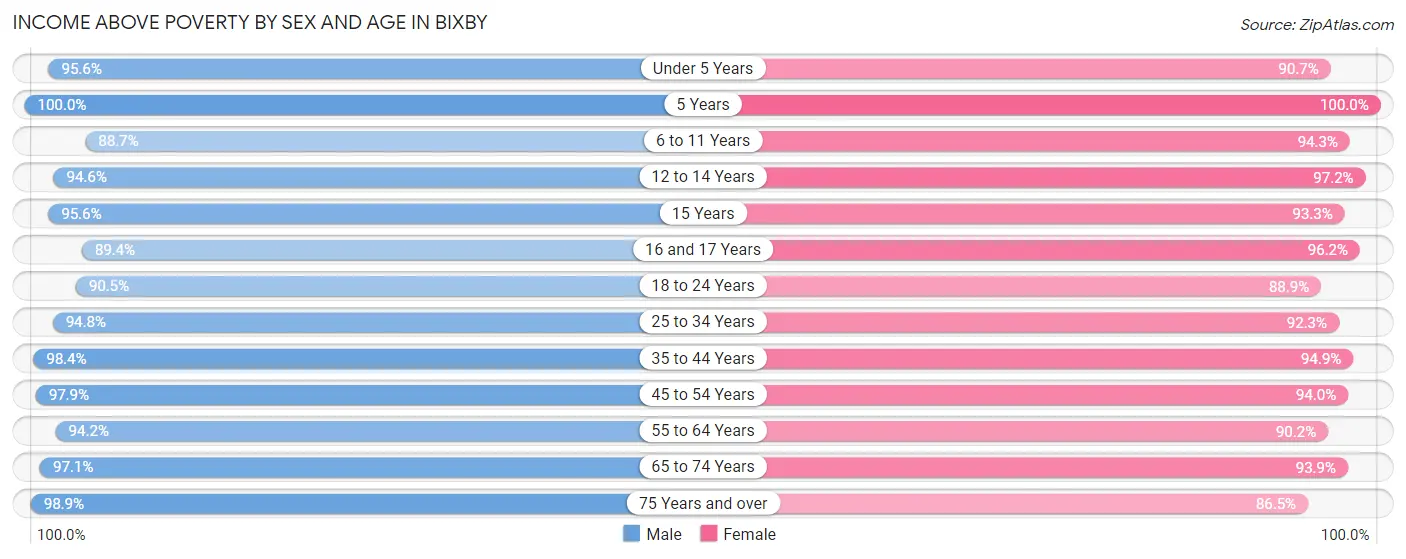
| Age Bracket | Male | Female |
| Under 5 Years | 988 (95.6%) | 802 (90.7%) |
| 5 Years | 215 (100.0%) | 199 (100.0%) |
| 6 to 11 Years | 1,251 (88.7%) | 1,269 (94.3%) |
| 12 to 14 Years | 757 (94.6%) | 690 (97.2%) |
| 15 Years | 326 (95.6%) | 349 (93.3%) |
| 16 and 17 Years | 421 (89.4%) | 475 (96.2%) |
| 18 to 24 Years | 790 (90.5%) | 997 (88.9%) |
| 25 to 34 Years | 1,470 (94.8%) | 1,716 (92.3%) |
| 35 to 44 Years | 1,878 (98.4%) | 2,051 (94.9%) |
| 45 to 54 Years | 1,733 (97.9%) | 1,618 (94.0%) |
| 55 to 64 Years | 1,584 (94.2%) | 1,526 (90.2%) |
| 65 to 74 Years | 1,078 (97.1%) | 1,314 (93.9%) |
| 75 Years and over | 602 (98.9%) | 738 (86.5%) |
| Total | 13,093 (95.1%) | 13,744 (92.8%) |
Income Below Poverty Among Married-Couple Families in Bixby
The poverty statistics for married-couple families in Bixby show that 2.9% or 184 of the total 6,235 families live below the poverty line. Families with 3 or 4 children have the highest poverty rate of 6.4%, comprising of 42 families. On the other hand, families with 5 or more children have the lowest poverty rate of 0.0%, which includes 0 families.

| Children | Above Poverty | Below Poverty |
| No Children | 2,946 (97.0%) | 91 (3.0%) |
| 1 or 2 Children | 2,422 (97.9%) | 51 (2.1%) |
| 3 or 4 Children | 610 (93.6%) | 42 (6.4%) |
| 5 or more Children | 73 (100.0%) | 0 (0.0%) |
| Total | 6,051 (97.1%) | 184 (2.9%) |
Income Below Poverty Among Single-Parent Households in Bixby
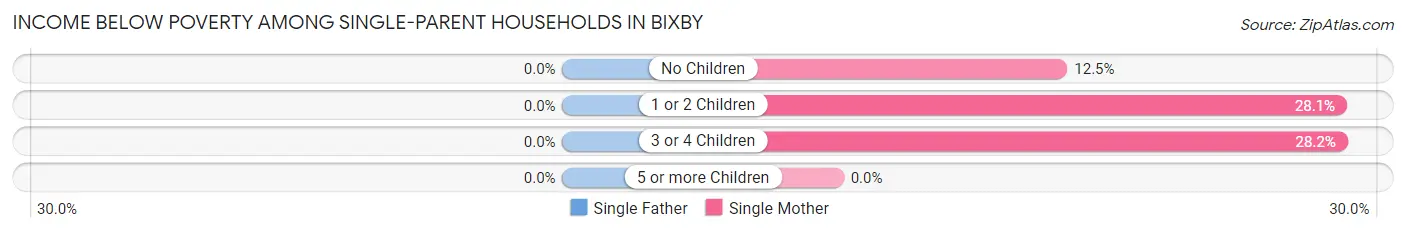
| Children | Single Father | Single Mother |
| No Children | 0 (0.0%) | 34 (12.5%) |
| 1 or 2 Children | 0 (0.0%) | 115 (28.1%) |
| 3 or 4 Children | 0 (0.0%) | 29 (28.2%) |
| 5 or more Children | 0 (0.0%) | 0 (0.0%) |
| Total | 0 (0.0%) | 178 (21.9%) |
Income Below Poverty Among Married-Couple vs Single-Parent Households in Bixby
The poverty data for Bixby shows that 184 of the married-couple family households (2.9%) and 178 of the single-parent households (13.7%) are living below the poverty level. Within the married-couple family households, those with 3 or 4 children have the highest poverty rate, with 42 households (6.4%) falling below the poverty line. Among the single-parent households, those with 3 or 4 children have the highest poverty rate, with 29 household (21.3%) living below poverty.
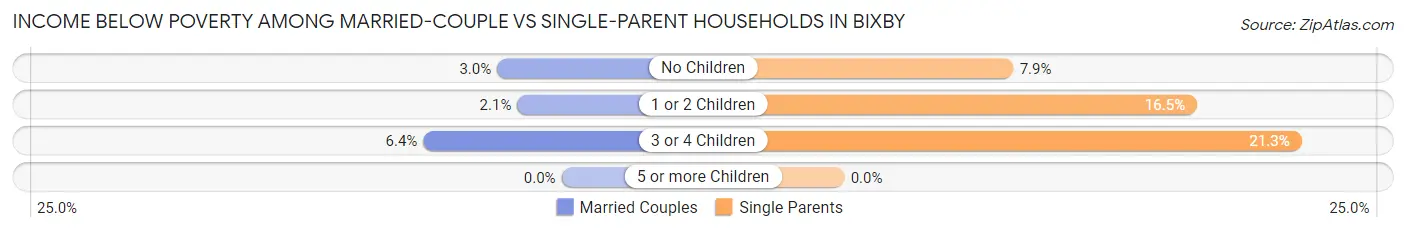
| Children | Married-Couple Families | Single-Parent Households |
| No Children | 91 (3.0%) | 34 (7.9%) |
| 1 or 2 Children | 51 (2.1%) | 115 (16.5%) |
| 3 or 4 Children | 42 (6.4%) | 29 (21.3%) |
| 5 or more Children | 0 (0.0%) | 0 (0.0%) |
| Total | 184 (2.9%) | 178 (13.7%) |
Race in Bixby
The most populous races in Bixby are White / Caucasian (21,933 | 76.3%), Two or more Races (3,380 | 11.8%), and Hispanic or Latino (2,154 | 7.5%).
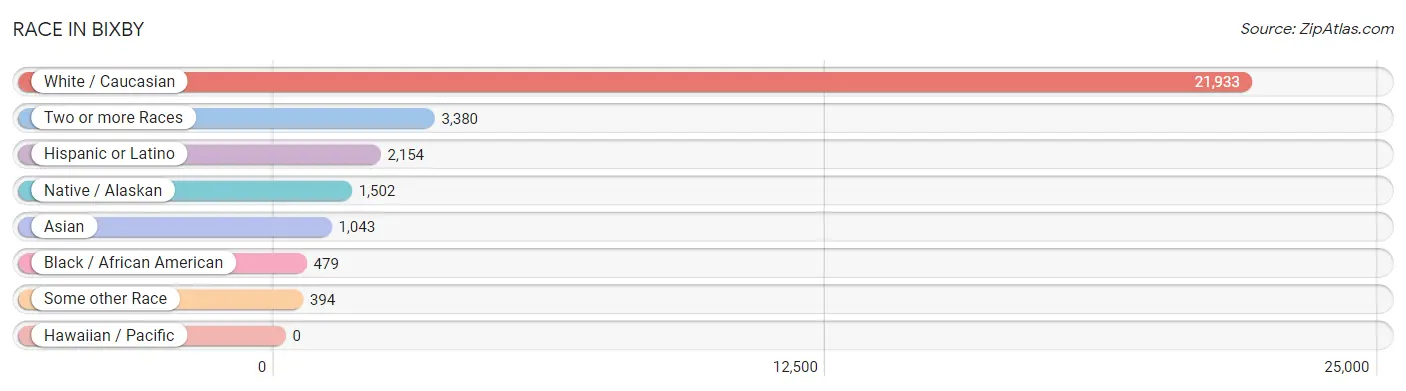
| Race | # Population | % Population |
| Asian | 1,043 | 3.6% |
| Black / African American | 479 | 1.7% |
| Hawaiian / Pacific | 0 | 0.0% |
| Hispanic or Latino | 2,154 | 7.5% |
| Native / Alaskan | 1,502 | 5.2% |
| White / Caucasian | 21,933 | 76.3% |
| Two or more Races | 3,380 | 11.8% |
| Some other Race | 394 | 1.4% |
| Total | 28,731 | 100.0% |
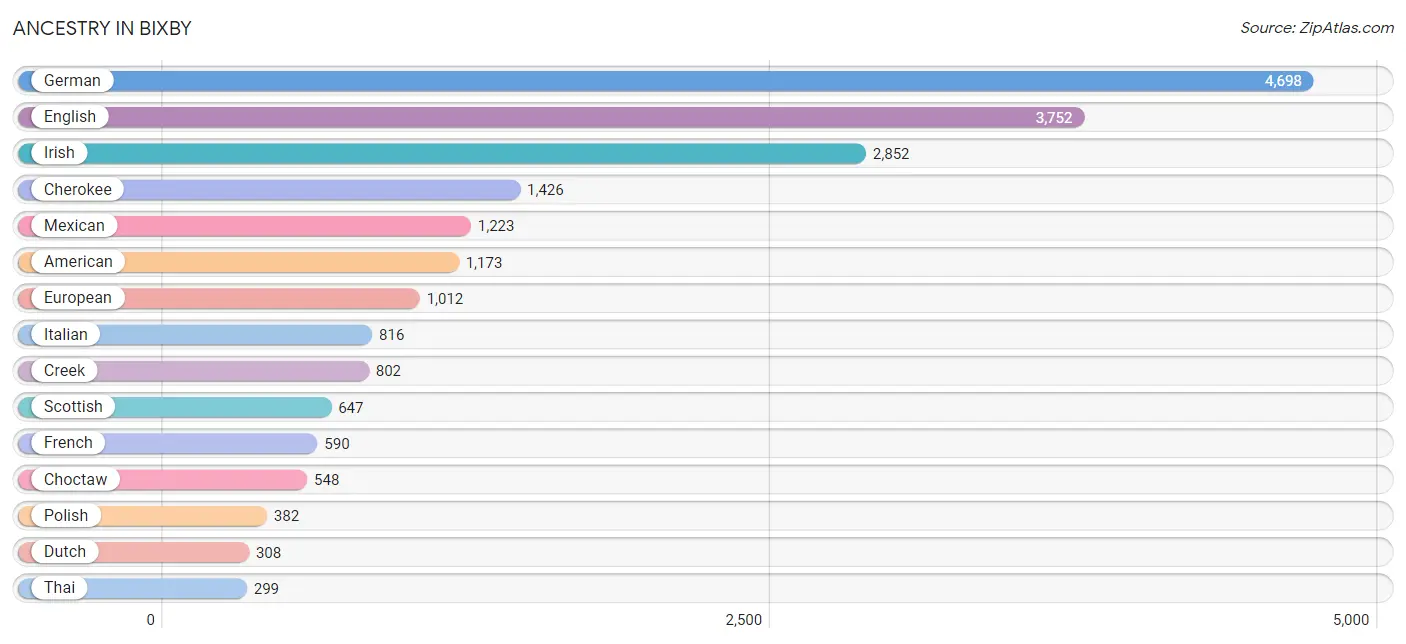
Ancestry in Bixby
The most populous ancestries reported in Bixby are German (4,698 | 16.4%), English (3,752 | 13.1%), Irish (2,852 | 9.9%), Cherokee (1,426 | 5.0%), and Mexican (1,223 | 4.3%), together accounting for 48.6% of all Bixby residents.
| Ancestry | # Population | % Population |
| African | 9 | 0.0% |
| American | 1,173 | 4.1% |
| Apache | 36 | 0.1% |
| Arab | 92 | 0.3% |
| Armenian | 15 | 0.1% |
| Australian | 11 | 0.0% |
| Austrian | 141 | 0.5% |
| Bangladeshi | 8 | 0.0% |
| Belgian | 11 | 0.0% |
| Bhutanese | 73 | 0.3% |
| Blackfeet | 17 | 0.1% |
| Bolivian | 8 | 0.0% |
| Brazilian | 21 | 0.1% |
| British | 143 | 0.5% |
| Burmese | 80 | 0.3% |
| Central American | 198 | 0.7% |
| Central American Indian | 120 | 0.4% |
| Cherokee | 1,426 | 5.0% |
| Cheyenne | 13 | 0.1% |
| Chickasaw | 23 | 0.1% |
| Choctaw | 548 | 1.9% |
| Colombian | 104 | 0.4% |
| Comanche | 18 | 0.1% |
| Creek | 802 | 2.8% |
| Cuban | 12 | 0.0% |
| Czech | 194 | 0.7% |
| Danish | 230 | 0.8% |
| Dominican | 185 | 0.6% |
| Dutch | 308 | 1.1% |
| Dutch West Indian | 64 | 0.2% |
| Eastern European | 98 | 0.3% |
| English | 3,752 | 13.1% |
| European | 1,012 | 3.5% |
| Finnish | 14 | 0.1% |
| French | 590 | 2.1% |
| German | 4,698 | 16.4% |
| Greek | 105 | 0.4% |
| Guatemalan | 17 | 0.1% |
| Hungarian | 60 | 0.2% |
| Indian (Asian) | 223 | 0.8% |
| Indonesian | 69 | 0.2% |
| Iranian | 77 | 0.3% |
| Irish | 2,852 | 9.9% |
| Iroquois | 31 | 0.1% |
| Israeli | 21 | 0.1% |
| Italian | 816 | 2.8% |
| Jamaican | 20 | 0.1% |
| Kenyan | 16 | 0.1% |
| Kiowa | 63 | 0.2% |
| Korean | 94 | 0.3% |
| Laotian | 15 | 0.1% |
| Lebanese | 44 | 0.2% |
| Mexican | 1,223 | 4.3% |
| Moroccan | 48 | 0.2% |
| Nicaraguan | 13 | 0.1% |
| Northern European | 118 | 0.4% |
| Norwegian | 293 | 1.0% |
| Osage | 85 | 0.3% |
| Ottawa | 25 | 0.1% |
| Pakistani | 10 | 0.0% |
| Panamanian | 128 | 0.4% |
| Peruvian | 27 | 0.1% |
| Polish | 382 | 1.3% |
| Puerto Rican | 82 | 0.3% |
| Romanian | 61 | 0.2% |
| Russian | 62 | 0.2% |
| Salvadoran | 40 | 0.1% |
| Scandinavian | 193 | 0.7% |
| Scotch-Irish | 292 | 1.0% |
| Scottish | 647 | 2.2% |
| Seminole | 71 | 0.3% |
| Sioux | 12 | 0.0% |
| Slovak | 34 | 0.1% |
| South American | 275 | 1.0% |
| Spaniard | 12 | 0.0% |
| Spanish | 75 | 0.3% |
| Sri Lankan | 293 | 1.0% |
| Subsaharan African | 25 | 0.1% |
| Swedish | 279 | 1.0% |
| Swiss | 45 | 0.2% |
| Thai | 299 | 1.0% |
| Ukrainian | 33 | 0.1% |
| Venezuelan | 136 | 0.5% |
| Welsh | 195 | 0.7% | View All 84 Rows |
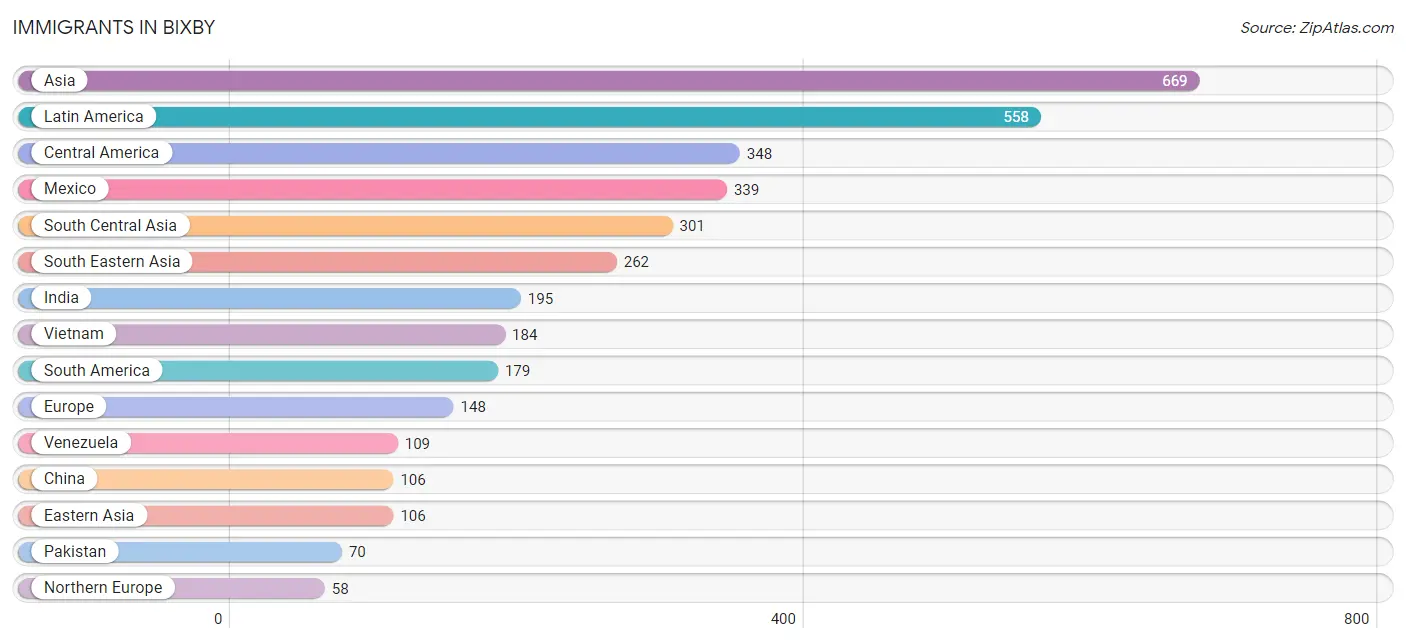
Immigrants in Bixby
The most numerous immigrant groups reported in Bixby came from Asia (669 | 2.3%), Latin America (558 | 1.9%), Central America (348 | 1.2%), Mexico (339 | 1.2%), and South Central Asia (301 | 1.1%), together accounting for 7.7% of all Bixby residents.
| Immigration Origin | # Population | % Population |
| Africa | 34 | 0.1% |
| Asia | 669 | 2.3% |
| Australia | 11 | 0.0% |
| Bolivia | 8 | 0.0% |
| Brazil | 21 | 0.1% |
| Canada | 45 | 0.2% |
| Caribbean | 31 | 0.1% |
| Central America | 348 | 1.2% |
| China | 106 | 0.4% |
| Colombia | 17 | 0.1% |
| Dominican Republic | 31 | 0.1% |
| Eastern Africa | 16 | 0.1% |
| Eastern Asia | 106 | 0.4% |
| Eastern Europe | 51 | 0.2% |
| Ecuador | 6 | 0.0% |
| England | 20 | 0.1% |
| Europe | 148 | 0.5% |
| Germany | 39 | 0.1% |
| Guatemala | 9 | 0.0% |
| India | 195 | 0.7% |
| Iran | 36 | 0.1% |
| Kenya | 16 | 0.1% |
| Laos | 8 | 0.0% |
| Latin America | 558 | 1.9% |
| Mexico | 339 | 1.2% |
| Morocco | 18 | 0.1% |
| Northern Africa | 18 | 0.1% |
| Northern Europe | 58 | 0.2% |
| Oceania | 11 | 0.0% |
| Pakistan | 70 | 0.2% |
| Peru | 18 | 0.1% |
| Philippines | 13 | 0.1% |
| Russia | 18 | 0.1% |
| South America | 179 | 0.6% |
| South Central Asia | 301 | 1.1% |
| South Eastern Asia | 262 | 0.9% |
| Taiwan | 14 | 0.1% |
| Thailand | 10 | 0.0% |
| Ukraine | 33 | 0.1% |
| Venezuela | 109 | 0.4% |
| Vietnam | 184 | 0.6% |
| Western Europe | 39 | 0.1% | View All 42 Rows |
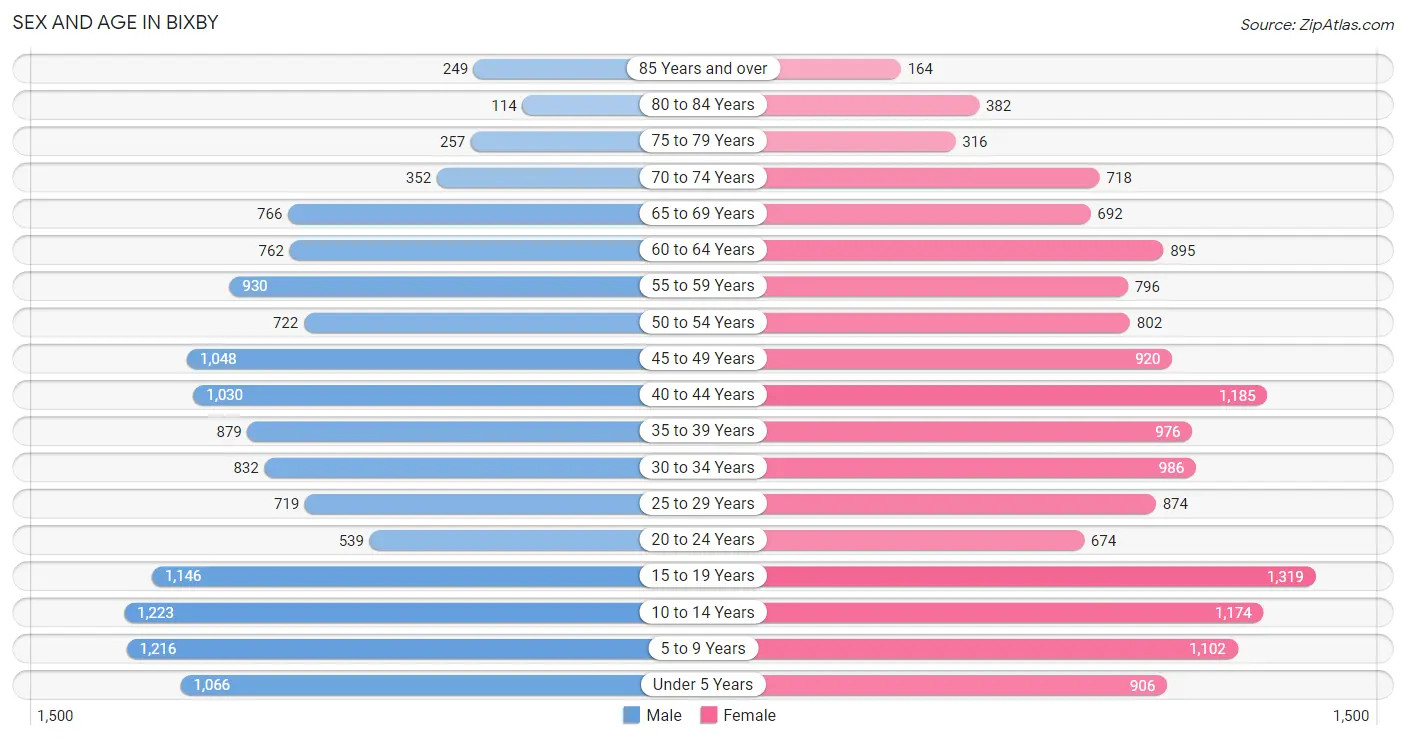
Sex and Age in Bixby
Sex and Age in Bixby
The most populous age groups in Bixby are 10 to 14 Years (1,223 | 8.8%) for men and 15 to 19 Years (1,319 | 8.9%) for women.
| Age Bracket | Male | Female |
| Under 5 Years | 1,066 (7.7%) | 906 (6.1%) |
| 5 to 9 Years | 1,216 (8.8%) | 1,102 (7.4%) |
| 10 to 14 Years | 1,223 (8.8%) | 1,174 (7.9%) |
| 15 to 19 Years | 1,146 (8.3%) | 1,319 (8.9%) |
| 20 to 24 Years | 539 (3.9%) | 674 (4.5%) |
| 25 to 29 Years | 719 (5.2%) | 874 (5.9%) |
| 30 to 34 Years | 832 (6.0%) | 986 (6.6%) |
| 35 to 39 Years | 879 (6.4%) | 976 (6.6%) |
| 40 to 44 Years | 1,030 (7.4%) | 1,185 (8.0%) |
| 45 to 49 Years | 1,048 (7.6%) | 920 (6.2%) |
| 50 to 54 Years | 722 (5.2%) | 802 (5.4%) |
| 55 to 59 Years | 930 (6.7%) | 796 (5.3%) |
| 60 to 64 Years | 762 (5.5%) | 895 (6.0%) |
| 65 to 69 Years | 766 (5.5%) | 692 (4.6%) |
| 70 to 74 Years | 352 (2.5%) | 718 (4.8%) |
| 75 to 79 Years | 257 (1.9%) | 316 (2.1%) |
| 80 to 84 Years | 114 (0.8%) | 382 (2.6%) |
| 85 Years and over | 249 (1.8%) | 164 (1.1%) |
| Total | 13,850 (100.0%) | 14,881 (100.0%) |
Families and Households in Bixby
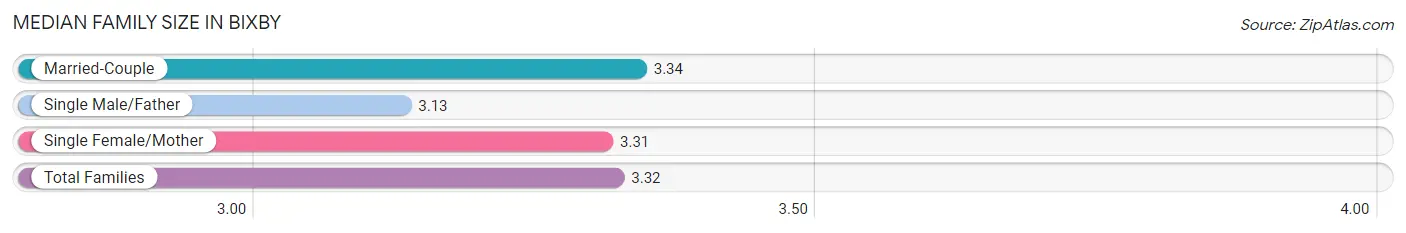
Median Family Size in Bixby
The median family size in Bixby is 3.32 persons per family, with married-couple families (6,235 | 82.8%) accounting for the largest median family size of 3.34 persons per family. On the other hand, single male/father families (483 | 6.4%) represent the smallest median family size with 3.13 persons per family.
| Family Type | # Families | Family Size |
| Married-Couple | 6,235 (82.8%) | 3.34 |
| Single Male/Father | 483 (6.4%) | 3.13 |
| Single Female/Mother | 813 (10.8%) | 3.31 |
| Total Families | 7,531 (100.0%) | 3.32 |
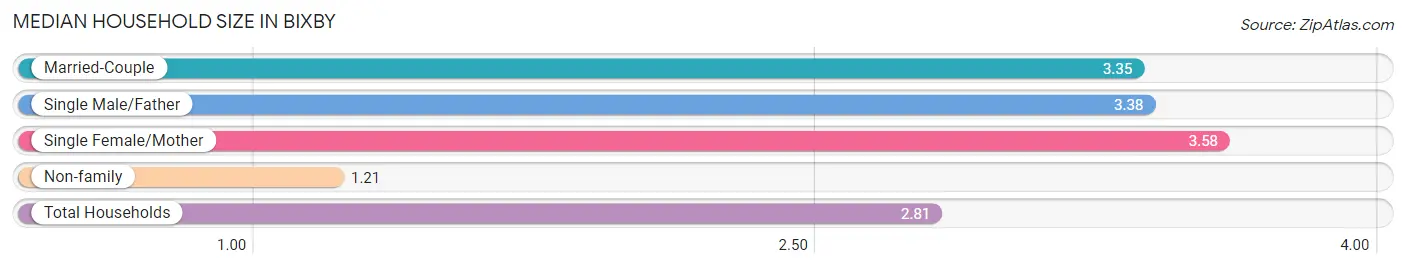
Median Household Size in Bixby
The median household size in Bixby is 2.81 persons per household, with single female/mother households (813 | 8.0%) accounting for the largest median household size of 3.58 persons per household. non-family households (2,665 | 26.1%) represent the smallest median household size with 1.21 persons per household.
| Household Type | # Households | Household Size |
| Married-Couple | 6,235 (61.2%) | 3.35 |
| Single Male/Father | 483 (4.7%) | 3.38 |
| Single Female/Mother | 813 (8.0%) | 3.58 |
| Non-family | 2,665 (26.1%) | 1.21 |
| Total Households | 10,196 (100.0%) | 2.81 |
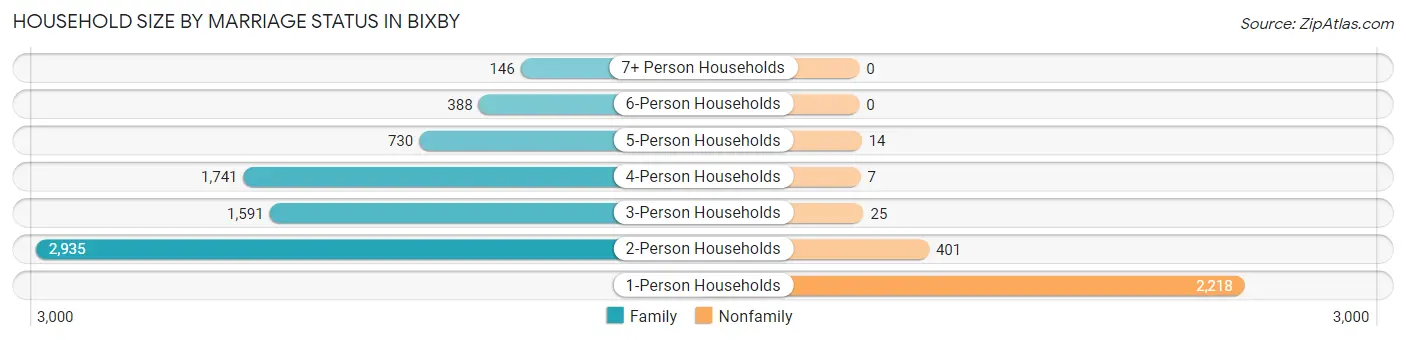
Household Size by Marriage Status in Bixby
Out of a total of 10,196 households in Bixby, 7,531 (73.9%) are family households, while 2,665 (26.1%) are nonfamily households. The most numerous type of family households are 2-person households, comprising 2,935, and the most common type of nonfamily households are 1-person households, comprising 2,218.
| Household Size | Family Households | Nonfamily Households |
| 1-Person Households | - | 2,218 (21.7%) |
| 2-Person Households | 2,935 (28.8%) | 401 (3.9%) |
| 3-Person Households | 1,591 (15.6%) | 25 (0.3%) |
| 4-Person Households | 1,741 (17.1%) | 7 (0.1%) |
| 5-Person Households | 730 (7.2%) | 14 (0.1%) |
| 6-Person Households | 388 (3.8%) | 0 (0.0%) |
| 7+ Person Households | 146 (1.4%) | 0 (0.0%) |
| Total | 7,531 (73.9%) | 2,665 (26.1%) |
Female Fertility in Bixby
Fertility by Age in Bixby
Average fertility rate in Bixby is 44.0 births per 1,000 women. Women in the age bracket of 20 to 34 years have the highest fertility rate with 106.0 births per 1,000 women. Women in the age bracket of 20 to 34 years acount for 87.6% of all women with births.
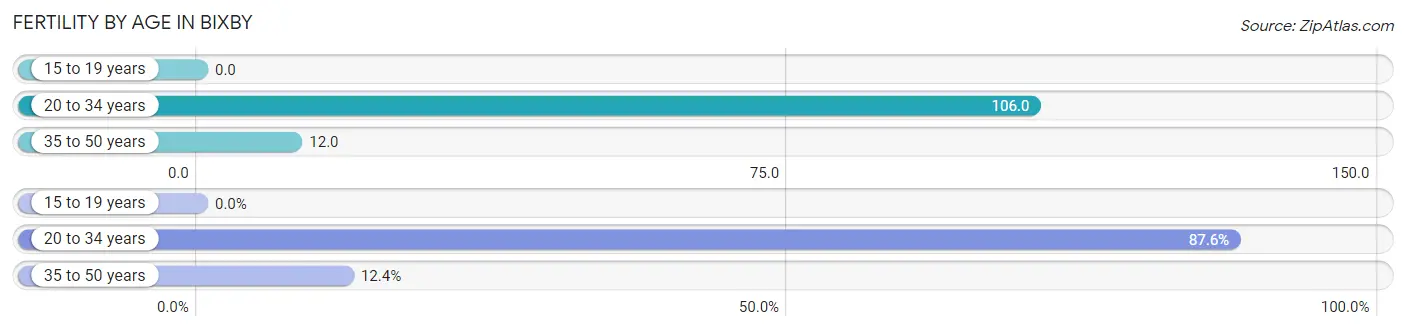
| Age Bracket | Women with Births | Births / 1,000 Women |
| 15 to 19 years | 0 (0.0%) | 0.0 |
| 20 to 34 years | 269 (87.6%) | 106.0 |
| 35 to 50 years | 38 (12.4%) | 12.0 |
| Total | 307 (100.0%) | 44.0 |
Fertility by Age by Marriage Status in Bixby
86.0% of women with births (307) in Bixby are married. The highest percentage of unmarried women with births falls into 35 to 50 years age bracket with 23.7% of them unmarried at the time of birth, while the lowest percentage of unmarried women with births belong to 20 to 34 years age bracket with 12.6% of them unmarried.
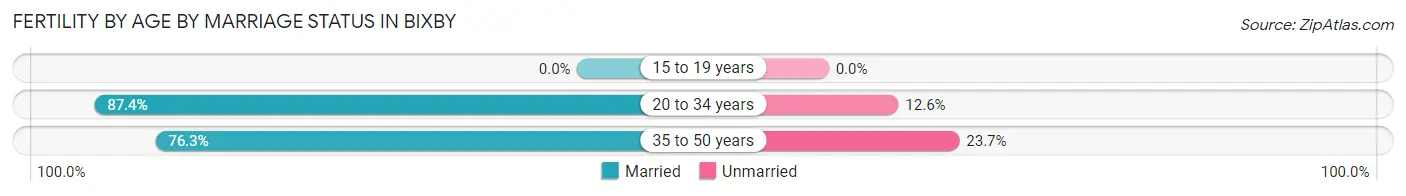
| Age Bracket | Married | Unmarried |
| 15 to 19 years | 0 (0.0%) | 0 (0.0%) |
| 20 to 34 years | 235 (87.4%) | 34 (12.6%) |
| 35 to 50 years | 29 (76.3%) | 9 (23.7%) |
| Total | 264 (86.0%) | 43 (14.0%) |
Fertility by Education in Bixby
Average fertility rate in Bixby is 44.0 births per 1,000 women. Women with the education attainment of bachelor's degree have the highest fertility rate of 64.0 births per 1,000 women, while women with the education attainment of less than high school have the lowest fertility at 17.0 births per 1,000 women. Women with the education attainment of bachelor's degree represent 38.8% of all women with births.
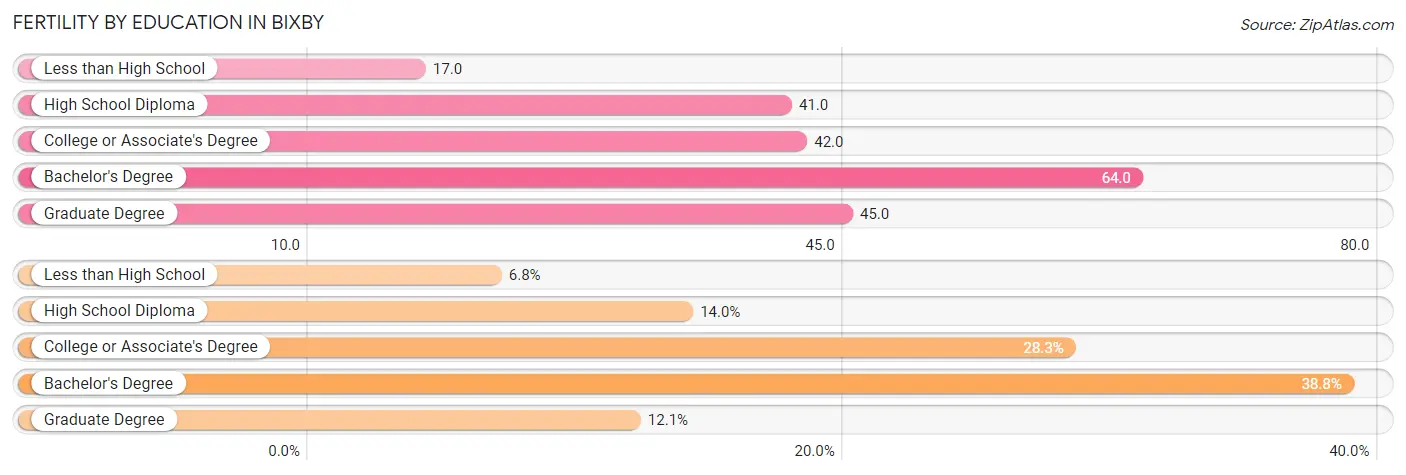
| Educational Attainment | Women with Births | Births / 1,000 Women |
| Less than High School | 21 (6.8%) | 17.0 |
| High School Diploma | 43 (14.0%) | 41.0 |
| College or Associate's Degree | 87 (28.3%) | 42.0 |
| Bachelor's Degree | 119 (38.8%) | 64.0 |
| Graduate Degree | 37 (12.0%) | 45.0 |
| Total | 307 (100.0%) | 44.0 |
Fertility by Education by Marriage Status in Bixby
14.0% of women with births in Bixby are unmarried. Women with the educational attainment of less than high school are most likely to be married with 100.0% of them married at childbirth, while women with the educational attainment of high school diploma are least likely to be married with 44.2% of them unmarried at childbirth.

| Educational Attainment | Married | Unmarried |
| Less than High School | 21 (100.0%) | 0 (0.0%) |
| High School Diploma | 24 (55.8%) | 19 (44.2%) |
| College or Associate's Degree | 80 (91.9%) | 7 (8.1%) |
| Bachelor's Degree | 102 (85.7%) | 17 (14.3%) |
| Graduate Degree | 37 (100.0%) | 0 (0.0%) |
| Total | 264 (86.0%) | 43 (14.0%) |
Employment Characteristics in Bixby
Employment by Class of Employer in Bixby
Among the 13,536 employed individuals in Bixby, private company employees (9,263 | 68.4%), self-employed (not incorporated) (1,224 | 9.0%), and not-for-profit organizations (1,070 | 7.9%) make up the most common classes of employment.
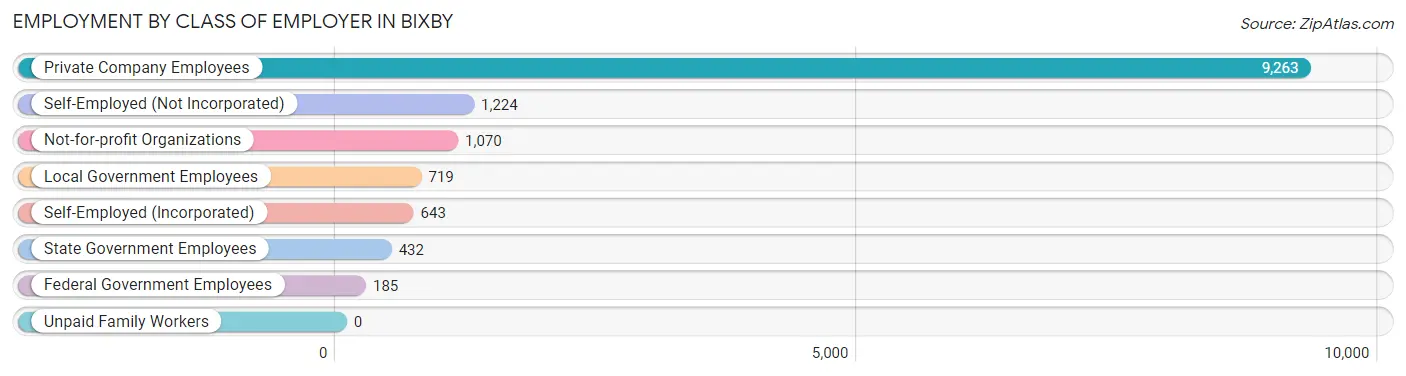
| Employer Class | # Employees | % Employees |
| Private Company Employees | 9,263 | 68.4% |
| Self-Employed (Incorporated) | 643 | 4.8% |
| Self-Employed (Not Incorporated) | 1,224 | 9.0% |
| Not-for-profit Organizations | 1,070 | 7.9% |
| Local Government Employees | 719 | 5.3% |
| State Government Employees | 432 | 3.2% |
| Federal Government Employees | 185 | 1.4% |
| Unpaid Family Workers | 0 | 0.0% |
| Total | 13,536 | 100.0% |
Employment Status by Age in Bixby
According to the labor force statistics for Bixby, out of the total population over 16 years of age (21,327), 67.0% or 14,289 individuals are in the labor force, with 3.6% or 514 of them unemployed. The age group with the highest labor force participation rate is 35 to 44 years, with 88.2% or 3,590 individuals in the labor force. Within the labor force, the 16 to 19 years age range has the highest percentage of unemployed individuals, with 17.0% or 104 of them being unemployed.
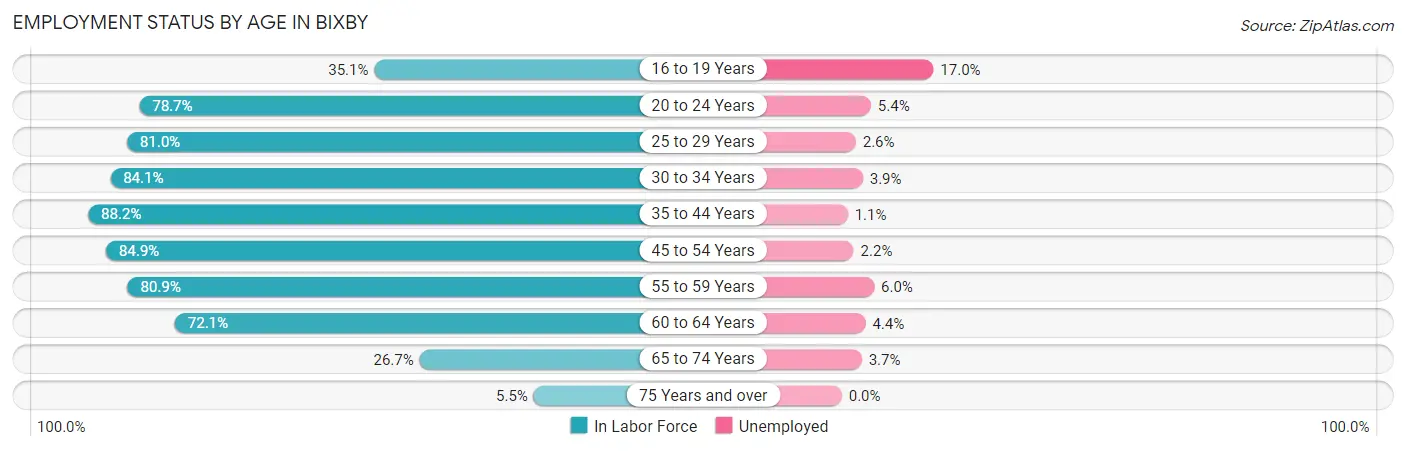
| Age Bracket | In Labor Force | Unemployed |
| 16 to 19 Years | 614 (35.1%) | 104 (17.0%) |
| 20 to 24 Years | 955 (78.7%) | 52 (5.4%) |
| 25 to 29 Years | 1,290 (81.0%) | 34 (2.6%) |
| 30 to 34 Years | 1,529 (84.1%) | 60 (3.9%) |
| 35 to 44 Years | 3,590 (88.2%) | 39 (1.1%) |
| 45 to 54 Years | 2,965 (84.9%) | 65 (2.2%) |
| 55 to 59 Years | 1,396 (80.9%) | 84 (6.0%) |
| 60 to 64 Years | 1,195 (72.1%) | 53 (4.4%) |
| 65 to 74 Years | 675 (26.7%) | 25 (3.7%) |
| 75 Years and over | 82 (5.5%) | 0 (0.0%) |
| Total | 14,289 (67.0%) | 514 (3.6%) |
Employment Status by Educational Attainment in Bixby
According to labor force statistics for Bixby, 83.3% of individuals (11,959) out of the total population between 25 and 64 years of age (14,356) are in the labor force, with 2.8% or 335 of them being unemployed. The group with the highest labor force participation rate are those with the educational attainment of bachelor's degree or higher, with 86.4% or 5,723 individuals in the labor force. Within the labor force, individuals with college / associate degree education have the highest percentage of unemployment, with 3.5% or 128 of them being unemployed.
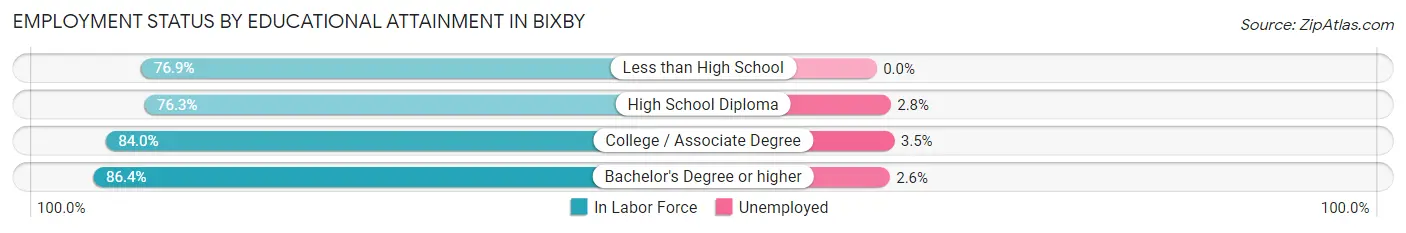
| Educational Attainment | In Labor Force | Unemployed |
| Less than High School | 573 (76.9%) | 0 (0.0%) |
| High School Diploma | 2,018 (76.3%) | 74 (2.8%) |
| College / Associate Degree | 3,647 (84.0%) | 152 (3.5%) |
| Bachelor's Degree or higher | 5,723 (86.4%) | 172 (2.6%) |
| Total | 11,959 (83.3%) | 402 (2.8%) |
Employment Occupations by Sex in Bixby
Management, Business, Science and Arts Occupations
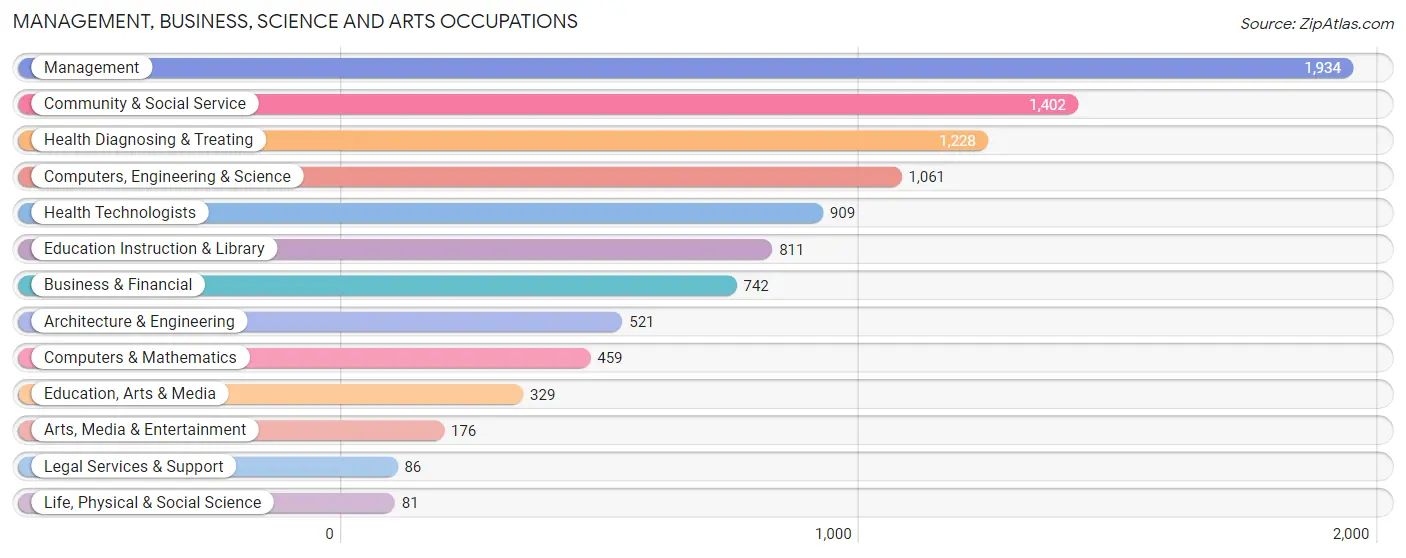
The most common Management, Business, Science and Arts occupations in Bixby are Management (1,934 | 14.1%), Community & Social Service (1,402 | 10.2%), Health Diagnosing & Treating (1,228 | 8.9%), Computers, Engineering & Science (1,061 | 7.7%), and Health Technologists (909 | 6.6%).
Management, Business, Science and Arts Occupations by Sex
Within the Management, Business, Science and Arts occupations in Bixby, the most male-oriented occupations are Architecture & Engineering (90.2%), Computers, Engineering & Science (81.7%), and Computers & Mathematics (77.3%), while the most female-oriented occupations are Education Instruction & Library (74.9%), Community & Social Service (68.0%), and Legal Services & Support (67.4%).
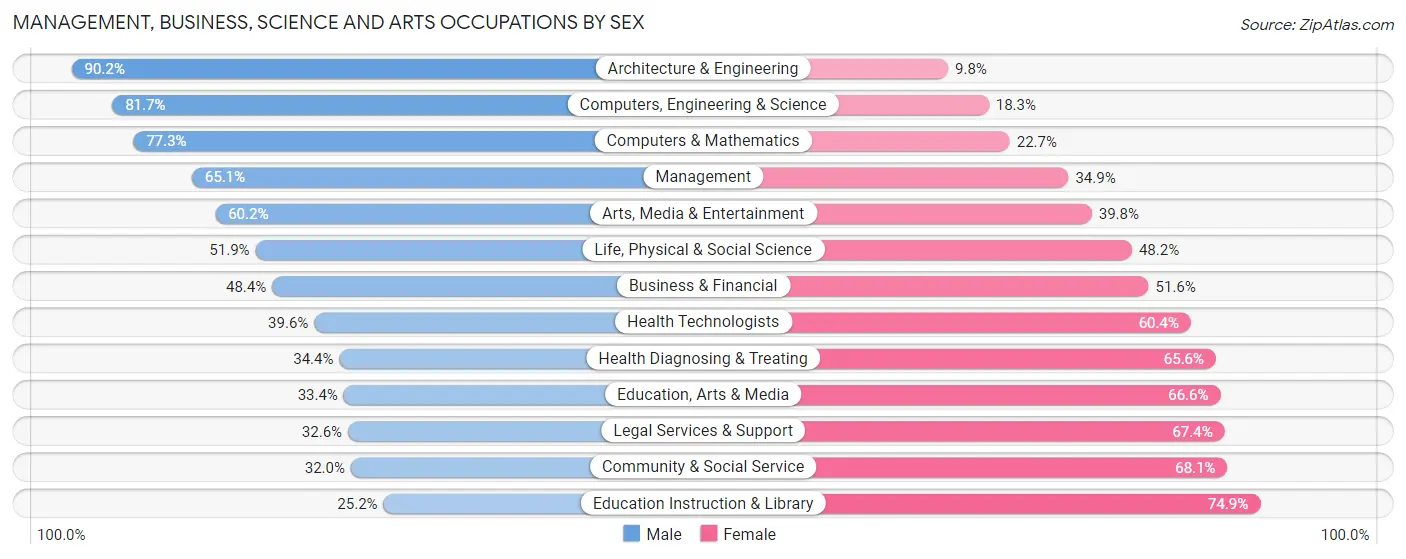
| Occupation | Male | Female |
| Management | 1,259 (65.1%) | 675 (34.9%) |
| Business & Financial | 359 (48.4%) | 383 (51.6%) |
| Computers, Engineering & Science | 867 (81.7%) | 194 (18.3%) |
| Computers & Mathematics | 355 (77.3%) | 104 (22.7%) |
| Architecture & Engineering | 470 (90.2%) | 51 (9.8%) |
| Life, Physical & Social Science | 42 (51.8%) | 39 (48.1%) |
| Community & Social Service | 448 (32.0%) | 954 (68.0%) |
| Education, Arts & Media | 110 (33.4%) | 219 (66.6%) |
| Legal Services & Support | 28 (32.6%) | 58 (67.4%) |
| Education Instruction & Library | 204 (25.2%) | 607 (74.9%) |
| Arts, Media & Entertainment | 106 (60.2%) | 70 (39.8%) |
| Health Diagnosing & Treating | 422 (34.4%) | 806 (65.6%) |
| Health Technologists | 360 (39.6%) | 549 (60.4%) |
| Total (Category) | 3,355 (52.7%) | 3,012 (47.3%) |
| Total (Overall) | 7,489 (54.4%) | 6,276 (45.6%) |
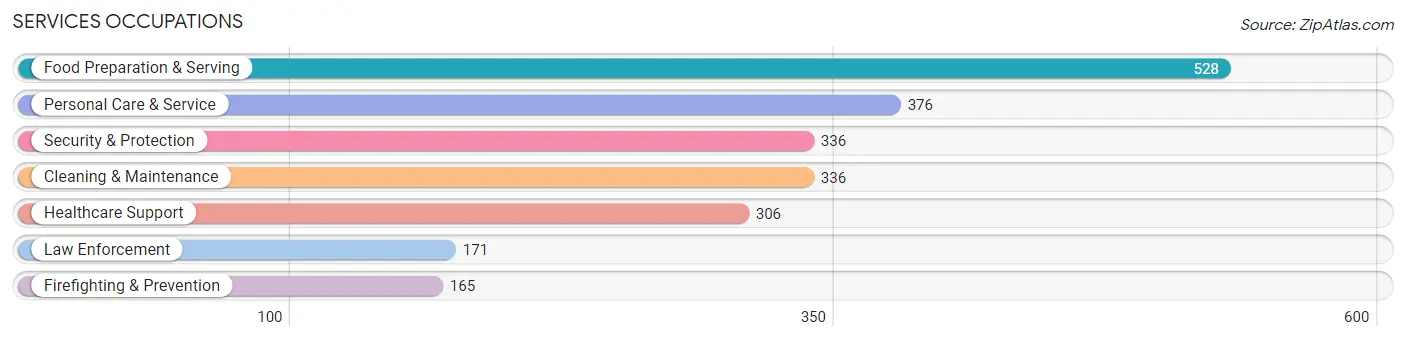
Services Occupations
The most common Services occupations in Bixby are Food Preparation & Serving (528 | 3.8%), Personal Care & Service (376 | 2.7%), Security & Protection (336 | 2.4%), Cleaning & Maintenance (336 | 2.4%), and Healthcare Support (306 | 2.2%).
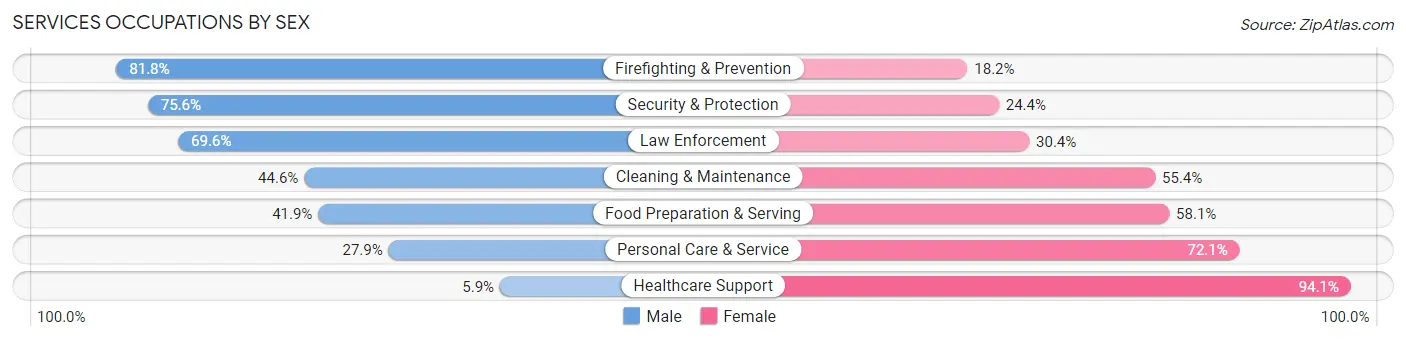
Services Occupations by Sex
Within the Services occupations in Bixby, the most male-oriented occupations are Firefighting & Prevention (81.8%), Security & Protection (75.6%), and Law Enforcement (69.6%), while the most female-oriented occupations are Healthcare Support (94.1%), Personal Care & Service (72.1%), and Food Preparation & Serving (58.1%).
| Occupation | Male | Female |
| Healthcare Support | 18 (5.9%) | 288 (94.1%) |
| Security & Protection | 254 (75.6%) | 82 (24.4%) |
| Firefighting & Prevention | 135 (81.8%) | 30 (18.2%) |
| Law Enforcement | 119 (69.6%) | 52 (30.4%) |
| Food Preparation & Serving | 221 (41.9%) | 307 (58.1%) |
| Cleaning & Maintenance | 150 (44.6%) | 186 (55.4%) |
| Personal Care & Service | 105 (27.9%) | 271 (72.1%) |
| Total (Category) | 748 (39.7%) | 1,134 (60.3%) |
| Total (Overall) | 7,489 (54.4%) | 6,276 (45.6%) |
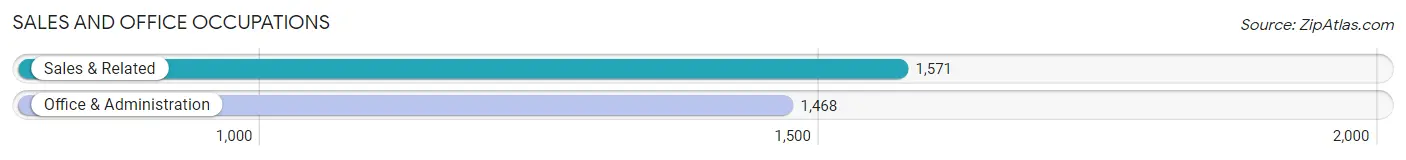
Sales and Office Occupations
The most common Sales and Office occupations in Bixby are Sales & Related (1,571 | 11.4%), and Office & Administration (1,468 | 10.7%).
Sales and Office Occupations by Sex
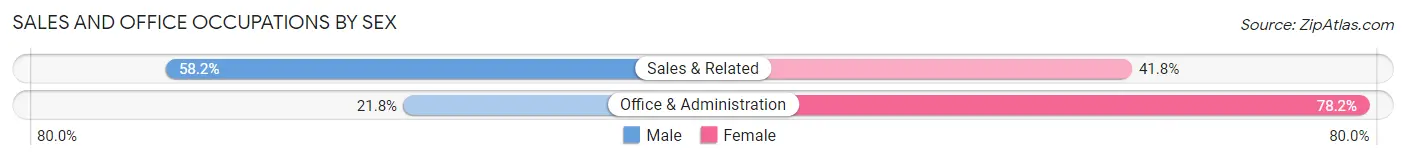
| Occupation | Male | Female |
| Sales & Related | 915 (58.2%) | 656 (41.8%) |
| Office & Administration | 320 (21.8%) | 1,148 (78.2%) |
| Total (Category) | 1,235 (40.6%) | 1,804 (59.4%) |
| Total (Overall) | 7,489 (54.4%) | 6,276 (45.6%) |
Natural Resources, Construction and Maintenance Occupations
The most common Natural Resources, Construction and Maintenance occupations in Bixby are Installation, Maintenance & Repair (575 | 4.2%), Construction & Extraction (561 | 4.1%), and Farming, Fishing & Forestry (51 | 0.4%).
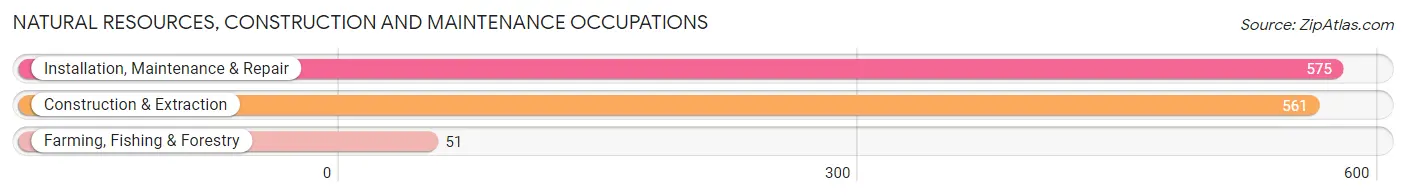
Natural Resources, Construction and Maintenance Occupations by Sex
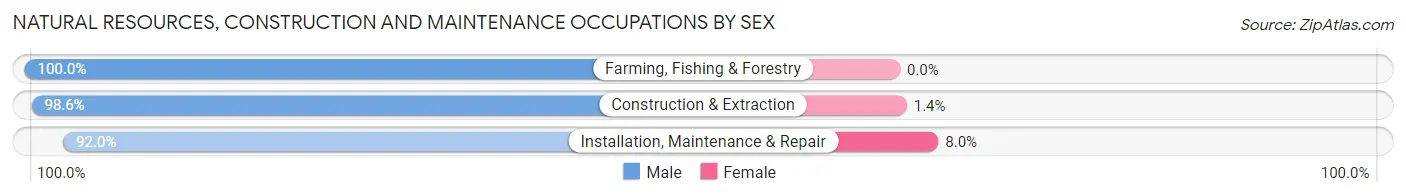
| Occupation | Male | Female |
| Farming, Fishing & Forestry | 51 (100.0%) | 0 (0.0%) |
| Construction & Extraction | 553 (98.6%) | 8 (1.4%) |
| Installation, Maintenance & Repair | 529 (92.0%) | 46 (8.0%) |
| Total (Category) | 1,133 (95.5%) | 54 (4.5%) |
| Total (Overall) | 7,489 (54.4%) | 6,276 (45.6%) |
Production, Transportation and Moving Occupations
The most common Production, Transportation and Moving occupations in Bixby are Production (592 | 4.3%), Material Moving (409 | 3.0%), and Transportation (289 | 2.1%).
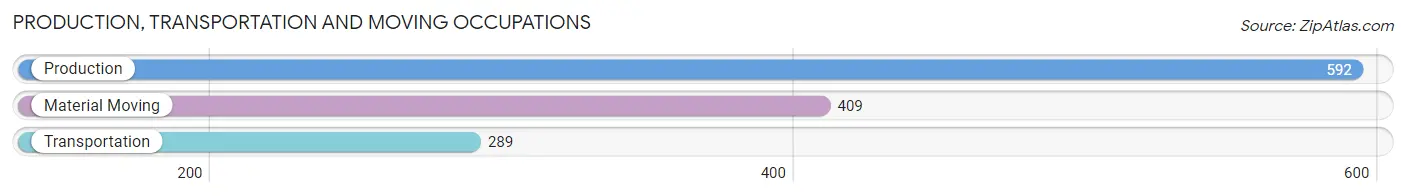
Production, Transportation and Moving Occupations by Sex
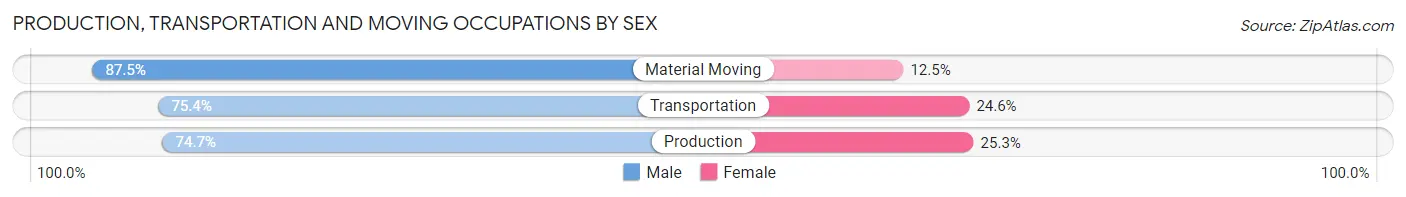
| Occupation | Male | Female |
| Production | 442 (74.7%) | 150 (25.3%) |
| Transportation | 218 (75.4%) | 71 (24.6%) |
| Material Moving | 358 (87.5%) | 51 (12.5%) |
| Total (Category) | 1,018 (78.9%) | 272 (21.1%) |
| Total (Overall) | 7,489 (54.4%) | 6,276 (45.6%) |
Employment Industries by Sex in Bixby
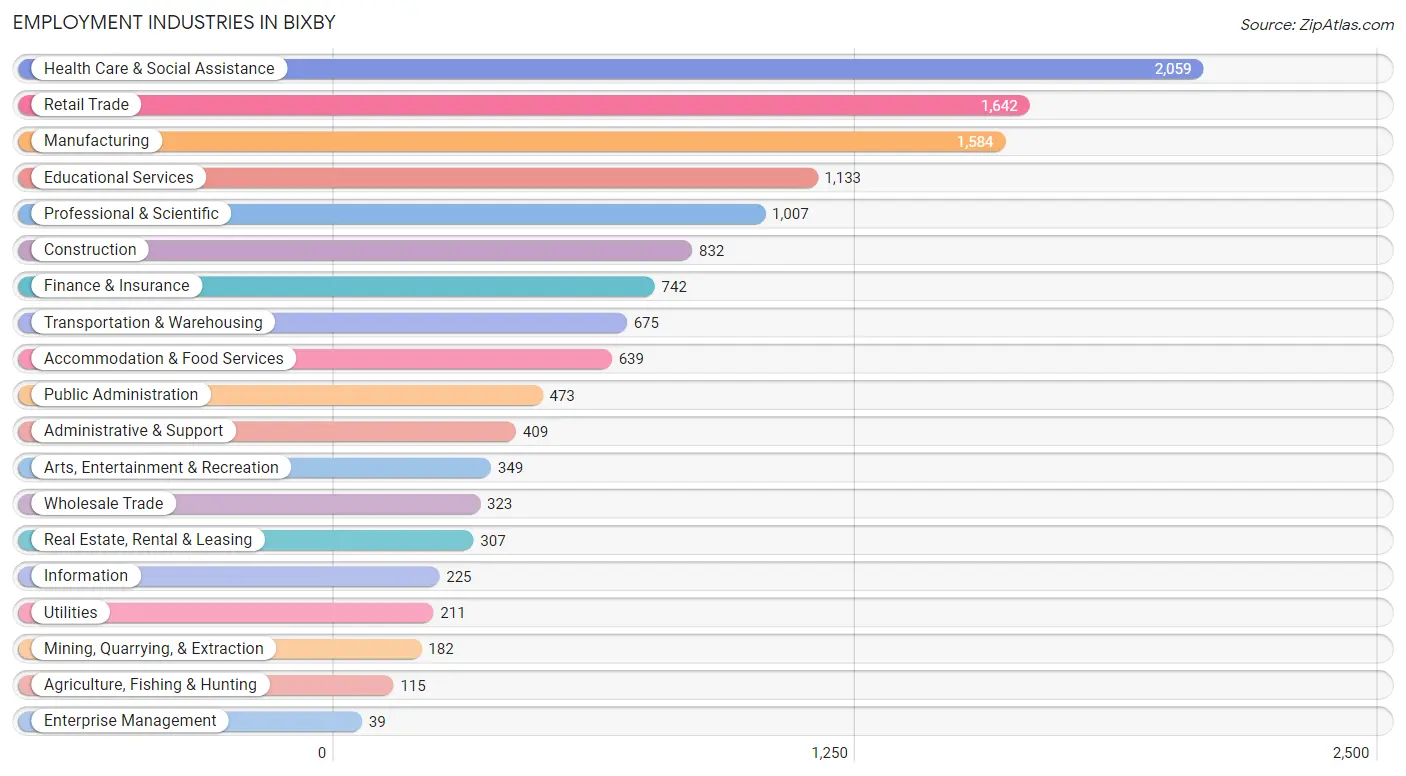
Employment Industries in Bixby
The major employment industries in Bixby include Health Care & Social Assistance (2,059 | 15.0%), Retail Trade (1,642 | 11.9%), Manufacturing (1,584 | 11.5%), Educational Services (1,133 | 8.2%), and Professional & Scientific (1,007 | 7.3%).
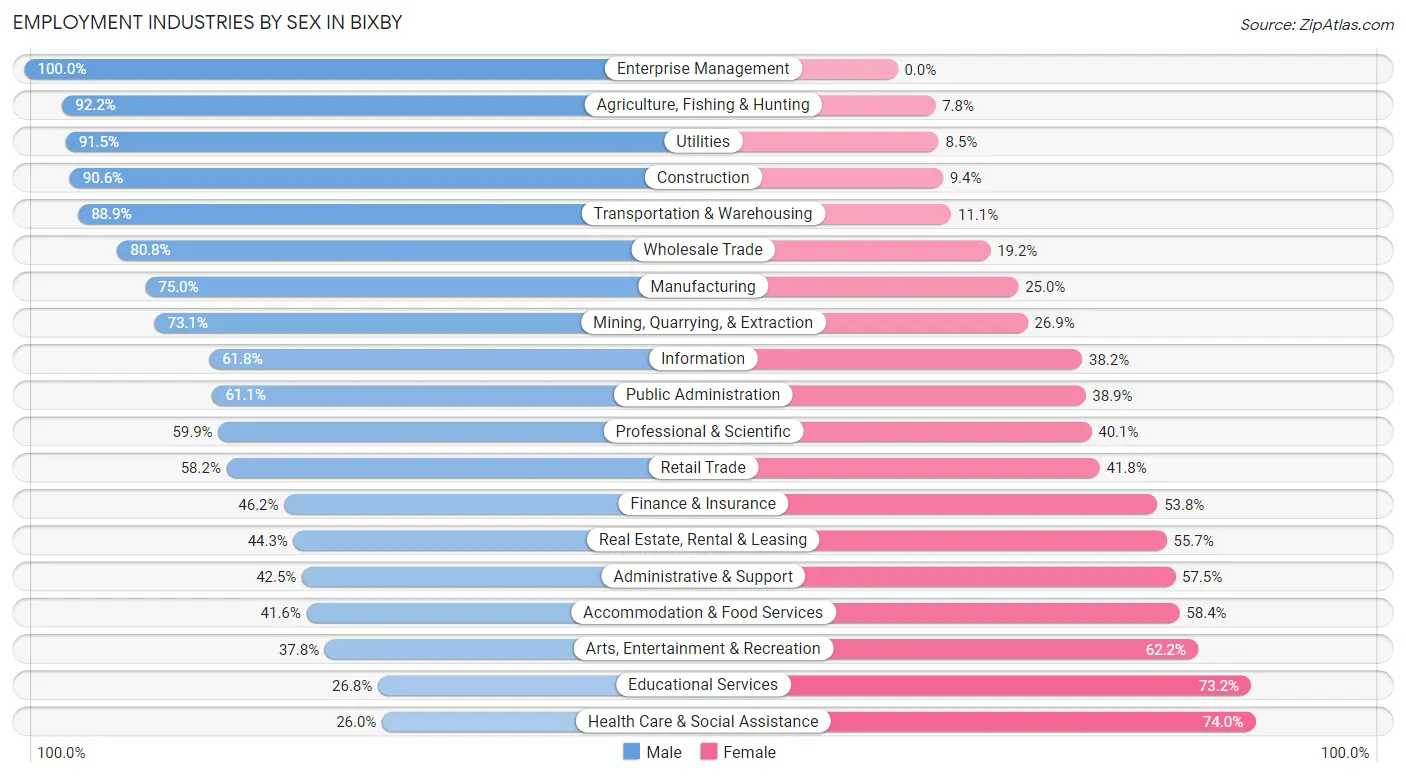
Employment Industries by Sex in Bixby
The Bixby industries that see more men than women are Enterprise Management (100.0%), Agriculture, Fishing & Hunting (92.2%), and Utilities (91.5%), whereas the industries that tend to have a higher number of women are Health Care & Social Assistance (74.0%), Educational Services (73.2%), and Arts, Entertainment & Recreation (62.2%).
| Industry | Male | Female |
| Agriculture, Fishing & Hunting | 106 (92.2%) | 9 (7.8%) |
| Mining, Quarrying, & Extraction | 133 (73.1%) | 49 (26.9%) |
| Construction | 754 (90.6%) | 78 (9.4%) |
| Manufacturing | 1,188 (75.0%) | 396 (25.0%) |
| Wholesale Trade | 261 (80.8%) | 62 (19.2%) |
| Retail Trade | 955 (58.2%) | 687 (41.8%) |
| Transportation & Warehousing | 600 (88.9%) | 75 (11.1%) |
| Utilities | 193 (91.5%) | 18 (8.5%) |
| Information | 139 (61.8%) | 86 (38.2%) |
| Finance & Insurance | 343 (46.2%) | 399 (53.8%) |
| Real Estate, Rental & Leasing | 136 (44.3%) | 171 (55.7%) |
| Professional & Scientific | 603 (59.9%) | 404 (40.1%) |
| Enterprise Management | 39 (100.0%) | 0 (0.0%) |
| Administrative & Support | 174 (42.5%) | 235 (57.5%) |
| Educational Services | 304 (26.8%) | 829 (73.2%) |
| Health Care & Social Assistance | 535 (26.0%) | 1,524 (74.0%) |
| Arts, Entertainment & Recreation | 132 (37.8%) | 217 (62.2%) |
| Accommodation & Food Services | 266 (41.6%) | 373 (58.4%) |
| Public Administration | 289 (61.1%) | 184 (38.9%) |
| Total | 7,489 (54.4%) | 6,276 (45.6%) |
Education in Bixby
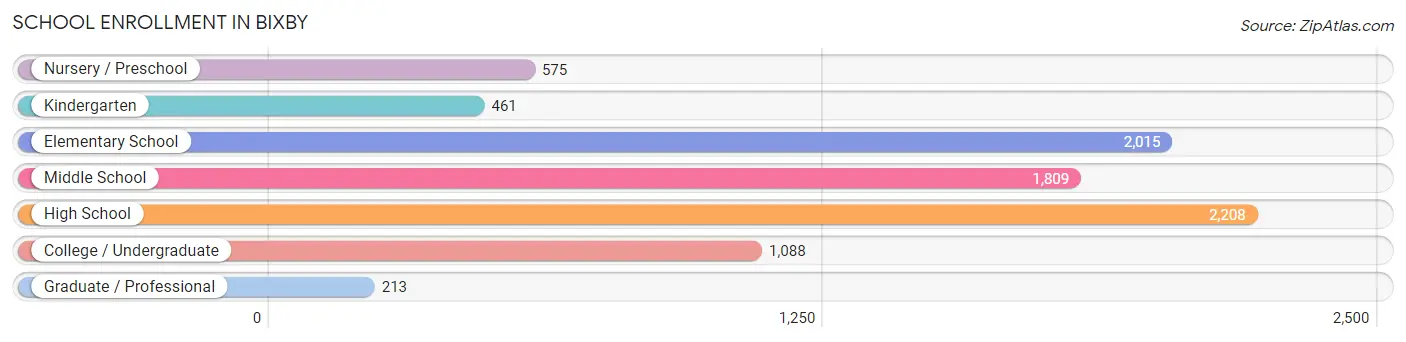
School Enrollment in Bixby
The most common levels of schooling among the 8,369 students in Bixby are high school (2,208 | 26.4%), elementary school (2,015 | 24.1%), and middle school (1,809 | 21.6%).
| School Level | # Students | % Students |
| Nursery / Preschool | 575 | 6.9% |
| Kindergarten | 461 | 5.5% |
| Elementary School | 2,015 | 24.1% |
| Middle School | 1,809 | 21.6% |
| High School | 2,208 | 26.4% |
| College / Undergraduate | 1,088 | 13.0% |
| Graduate / Professional | 213 | 2.5% |
| Total | 8,369 | 100.0% |
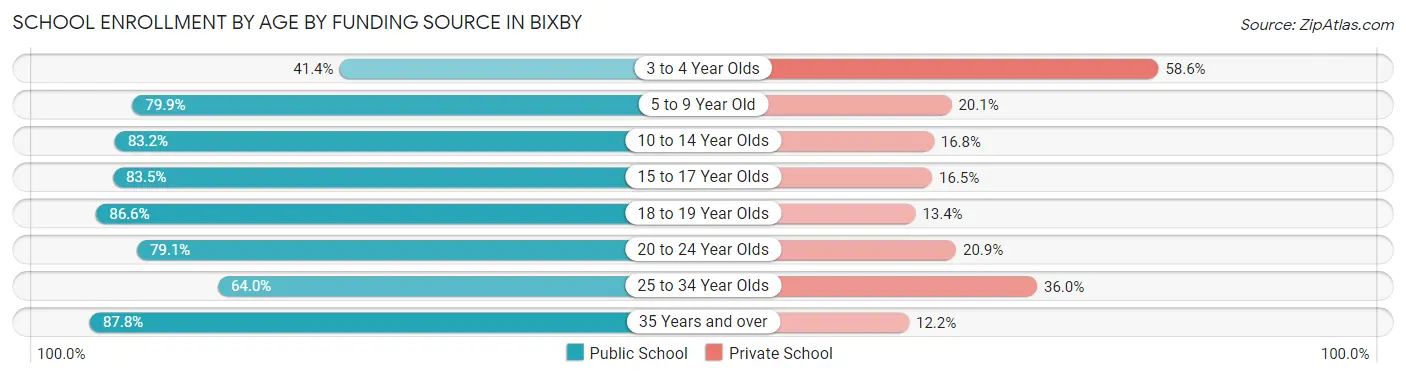
School Enrollment by Age by Funding Source in Bixby
Out of a total of 8,369 students who are enrolled in schools in Bixby, 1,682 (20.1%) attend a private institution, while the remaining 6,687 (79.9%) are enrolled in public schools. The age group of 3 to 4 year olds has the highest likelihood of being enrolled in private schools, with 248 (58.6% in the age bracket) enrolled. Conversely, the age group of 35 years and over has the lowest likelihood of being enrolled in a private school, with 296 (87.8% in the age bracket) attending a public institution.
| Age Bracket | Public School | Private School |
| 3 to 4 Year Olds | 175 (41.4%) | 248 (58.6%) |
| 5 to 9 Year Old | 1,835 (79.9%) | 461 (20.1%) |
| 10 to 14 Year Olds | 1,962 (83.2%) | 396 (16.8%) |
| 15 to 17 Year Olds | 1,354 (83.5%) | 267 (16.5%) |
| 18 to 19 Year Olds | 525 (86.6%) | 81 (13.4%) |
| 20 to 24 Year Olds | 389 (79.1%) | 103 (20.9%) |
| 25 to 34 Year Olds | 151 (64.0%) | 85 (36.0%) |
| 35 Years and over | 296 (87.8%) | 41 (12.2%) |
| Total | 6,687 (79.9%) | 1,682 (20.1%) |
Educational Attainment by Field of Study in Bixby
Business (1,891 | 21.3%), education (1,198 | 13.5%), science & technology (1,020 | 11.5%), engineering (765 | 8.6%), and arts & humanities (662 | 7.4%) are the most common fields of study among 8,882 individuals in Bixby who have obtained a bachelor's degree or higher.
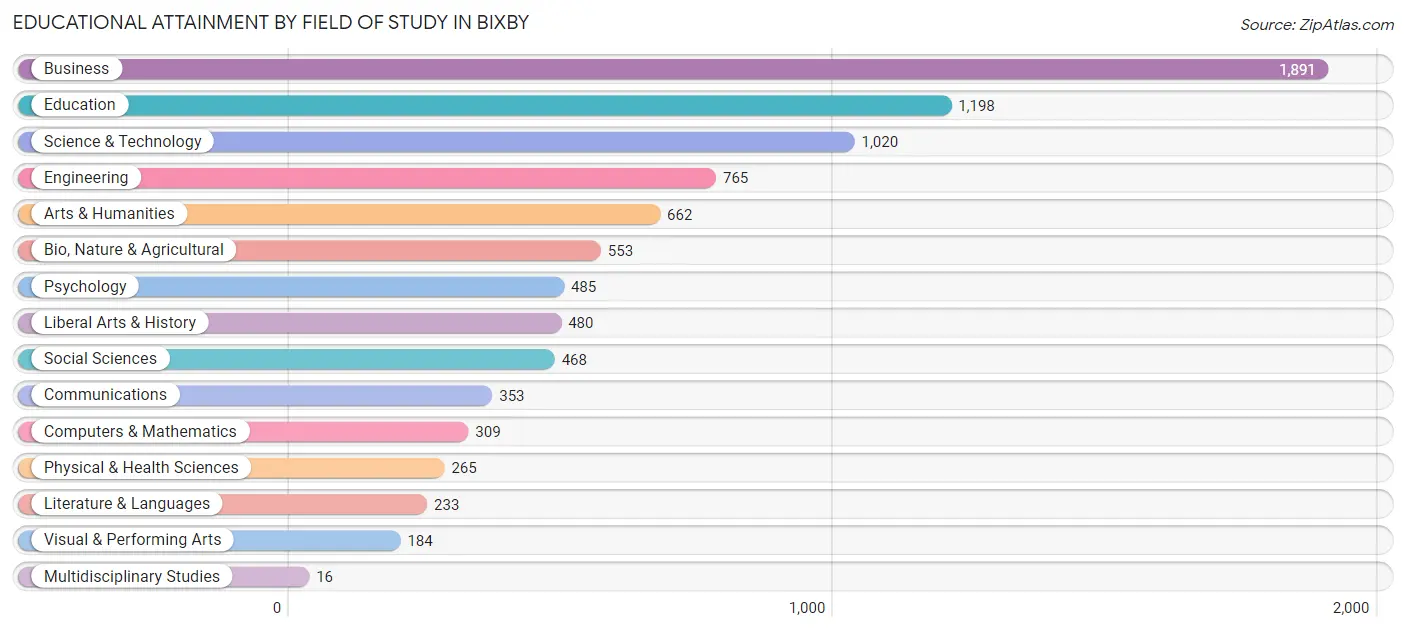
| Field of Study | # Graduates | % Graduates |
| Computers & Mathematics | 309 | 3.5% |
| Bio, Nature & Agricultural | 553 | 6.2% |
| Physical & Health Sciences | 265 | 3.0% |
| Psychology | 485 | 5.5% |
| Social Sciences | 468 | 5.3% |
| Engineering | 765 | 8.6% |
| Multidisciplinary Studies | 16 | 0.2% |
| Science & Technology | 1,020 | 11.5% |
| Business | 1,891 | 21.3% |
| Education | 1,198 | 13.5% |
| Literature & Languages | 233 | 2.6% |
| Liberal Arts & History | 480 | 5.4% |
| Visual & Performing Arts | 184 | 2.1% |
| Communications | 353 | 4.0% |
| Arts & Humanities | 662 | 7.4% |
| Total | 8,882 | 100.0% |
Transportation & Commute in Bixby
Vehicle Availability by Sex in Bixby
The most prevalent vehicle ownership categories in Bixby are males with 2 vehicles (3,357, accounting for 45.5%) and females with 2 vehicles (2,379, making up 54.5%).
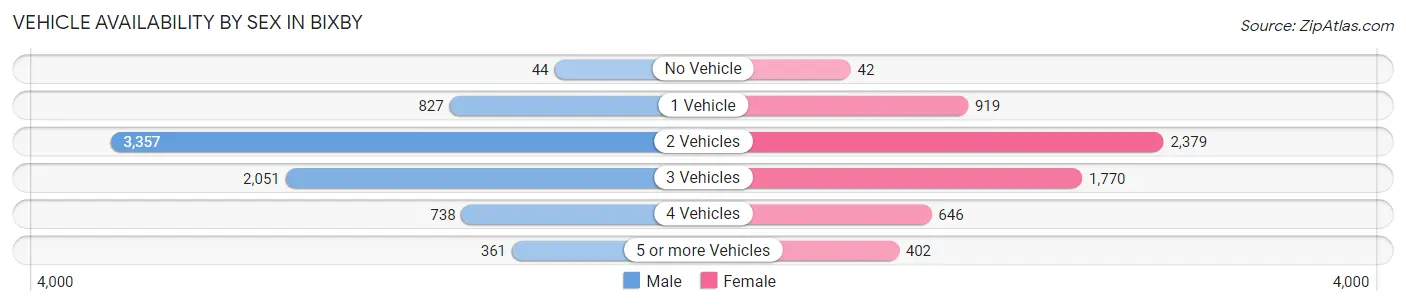
| Vehicles Available | Male | Female |
| No Vehicle | 44 (0.6%) | 42 (0.7%) |
| 1 Vehicle | 827 (11.2%) | 919 (14.9%) |
| 2 Vehicles | 3,357 (45.5%) | 2,379 (38.6%) |
| 3 Vehicles | 2,051 (27.8%) | 1,770 (28.7%) |
| 4 Vehicles | 738 (10.0%) | 646 (10.5%) |
| 5 or more Vehicles | 361 (4.9%) | 402 (6.5%) |
| Total | 7,378 (100.0%) | 6,158 (100.0%) |
Commute Time in Bixby
The most frequently occuring commute durations in Bixby are 20 to 24 minutes (2,556 commuters, 21.0%), 30 to 34 minutes (2,295 commuters, 18.9%), and 15 to 19 minutes (1,713 commuters, 14.1%).
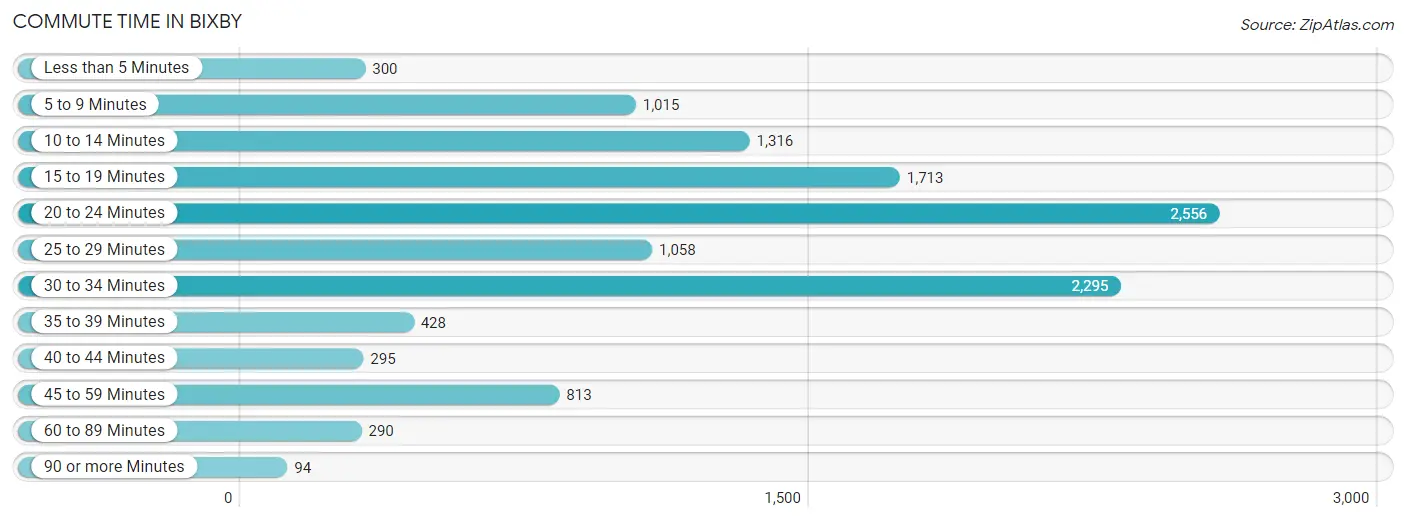
| Commute Time | # Commuters | % Commuters |
| Less than 5 Minutes | 300 | 2.5% |
| 5 to 9 Minutes | 1,015 | 8.3% |
| 10 to 14 Minutes | 1,316 | 10.8% |
| 15 to 19 Minutes | 1,713 | 14.1% |
| 20 to 24 Minutes | 2,556 | 21.0% |
| 25 to 29 Minutes | 1,058 | 8.7% |
| 30 to 34 Minutes | 2,295 | 18.9% |
| 35 to 39 Minutes | 428 | 3.5% |
| 40 to 44 Minutes | 295 | 2.4% |
| 45 to 59 Minutes | 813 | 6.7% |
| 60 to 89 Minutes | 290 | 2.4% |
| 90 or more Minutes | 94 | 0.8% |
Commute Time by Sex in Bixby
The most common commute times in Bixby are 20 to 24 minutes (1,355 commuters, 20.3%) for males and 20 to 24 minutes (1,201 commuters, 21.9%) for females.
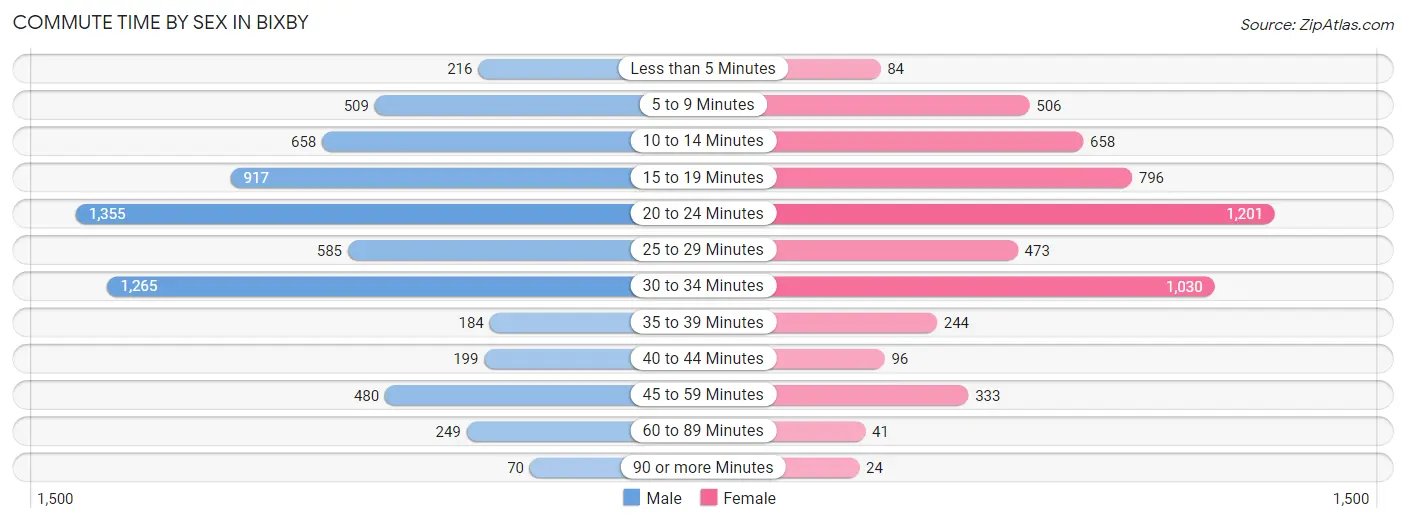
| Commute Time | Male | Female |
| Less than 5 Minutes | 216 (3.2%) | 84 (1.5%) |
| 5 to 9 Minutes | 509 (7.6%) | 506 (9.2%) |
| 10 to 14 Minutes | 658 (9.8%) | 658 (12.0%) |
| 15 to 19 Minutes | 917 (13.7%) | 796 (14.5%) |
| 20 to 24 Minutes | 1,355 (20.3%) | 1,201 (21.9%) |
| 25 to 29 Minutes | 585 (8.7%) | 473 (8.6%) |
| 30 to 34 Minutes | 1,265 (18.9%) | 1,030 (18.8%) |
| 35 to 39 Minutes | 184 (2.8%) | 244 (4.4%) |
| 40 to 44 Minutes | 199 (3.0%) | 96 (1.8%) |
| 45 to 59 Minutes | 480 (7.2%) | 333 (6.1%) |
| 60 to 89 Minutes | 249 (3.7%) | 41 (0.7%) |
| 90 or more Minutes | 70 (1.1%) | 24 (0.4%) |
Time of Departure to Work by Sex in Bixby
The most frequent times of departure to work in Bixby are 7:00 AM to 7:29 AM (1,228, 18.4%) for males and 8:00 AM to 8:29 AM (1,124, 20.5%) for females.
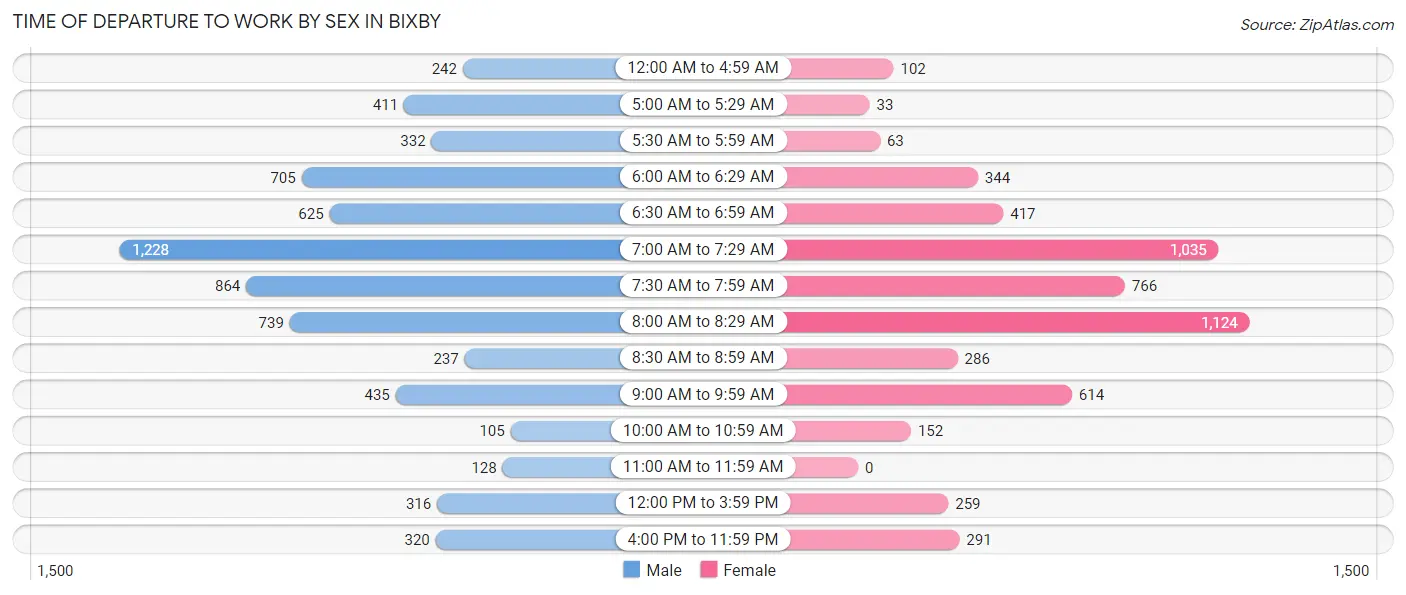
| Time of Departure | Male | Female |
| 12:00 AM to 4:59 AM | 242 (3.6%) | 102 (1.9%) |
| 5:00 AM to 5:29 AM | 411 (6.1%) | 33 (0.6%) |
| 5:30 AM to 5:59 AM | 332 (5.0%) | 63 (1.1%) |
| 6:00 AM to 6:29 AM | 705 (10.5%) | 344 (6.3%) |
| 6:30 AM to 6:59 AM | 625 (9.3%) | 417 (7.6%) |
| 7:00 AM to 7:29 AM | 1,228 (18.4%) | 1,035 (18.9%) |
| 7:30 AM to 7:59 AM | 864 (12.9%) | 766 (14.0%) |
| 8:00 AM to 8:29 AM | 739 (11.1%) | 1,124 (20.5%) |
| 8:30 AM to 8:59 AM | 237 (3.5%) | 286 (5.2%) |
| 9:00 AM to 9:59 AM | 435 (6.5%) | 614 (11.2%) |
| 10:00 AM to 10:59 AM | 105 (1.6%) | 152 (2.8%) |
| 11:00 AM to 11:59 AM | 128 (1.9%) | 0 (0.0%) |
| 12:00 PM to 3:59 PM | 316 (4.7%) | 259 (4.7%) |
| 4:00 PM to 11:59 PM | 320 (4.8%) | 291 (5.3%) |
| Total | 6,687 (100.0%) | 5,486 (100.0%) |
Housing Occupancy in Bixby
Occupancy by Ownership in Bixby
Of the total 10,196 dwellings in Bixby, owner-occupied units account for 7,747 (76.0%), while renter-occupied units make up 2,449 (24.0%).
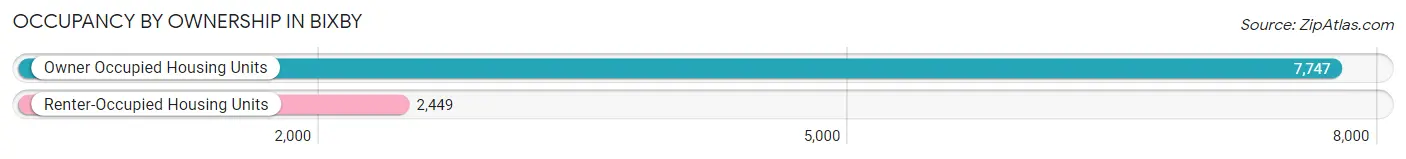
| Occupancy | # Housing Units | % Housing Units |
| Owner Occupied Housing Units | 7,747 | 76.0% |
| Renter-Occupied Housing Units | 2,449 | 24.0% |
| Total Occupied Housing Units | 10,196 | 100.0% |
Occupancy by Household Size in Bixby
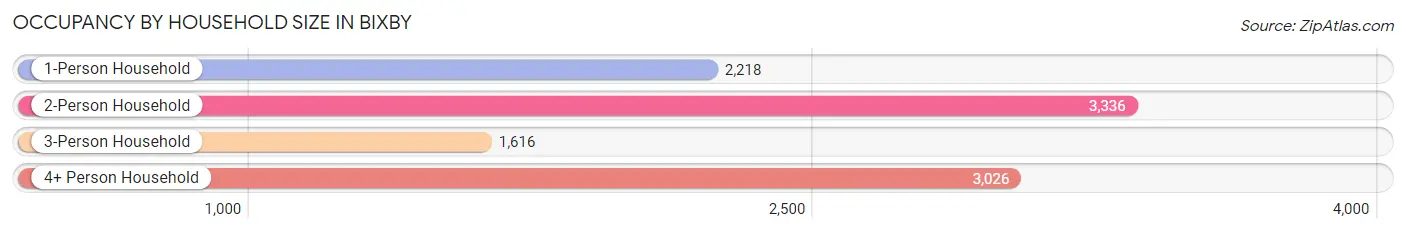
| Household Size | # Housing Units | % Housing Units |
| 1-Person Household | 2,218 | 21.7% |
| 2-Person Household | 3,336 | 32.7% |
| 3-Person Household | 1,616 | 15.9% |
| 4+ Person Household | 3,026 | 29.7% |
| Total Housing Units | 10,196 | 100.0% |
Occupancy by Ownership by Household Size in Bixby
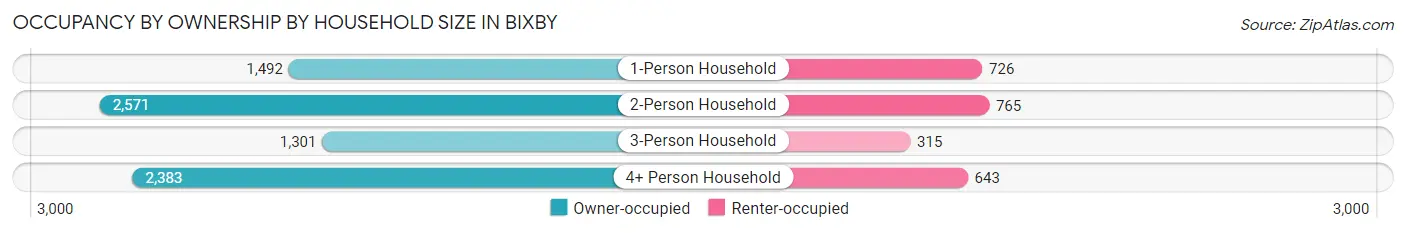
| Household Size | Owner-occupied | Renter-occupied |
| 1-Person Household | 1,492 (67.3%) | 726 (32.7%) |
| 2-Person Household | 2,571 (77.1%) | 765 (22.9%) |
| 3-Person Household | 1,301 (80.5%) | 315 (19.5%) |
| 4+ Person Household | 2,383 (78.7%) | 643 (21.2%) |
| Total Housing Units | 7,747 (76.0%) | 2,449 (24.0%) |
Occupancy by Educational Attainment in Bixby
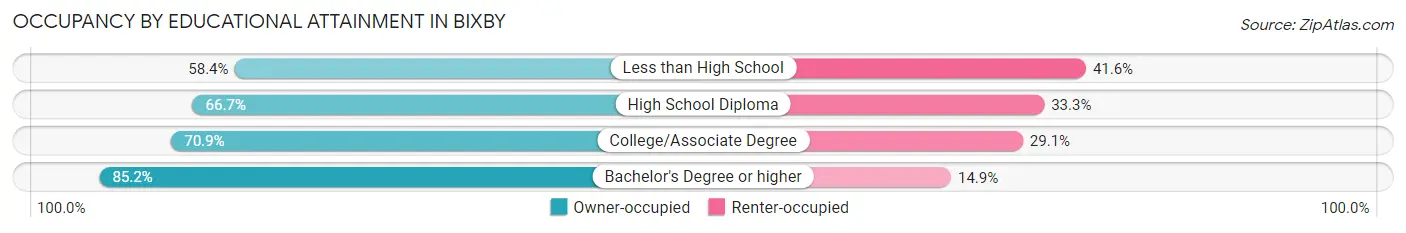
| Household Size | Owner-occupied | Renter-occupied |
| Less than High School | 302 (58.4%) | 215 (41.6%) |
| High School Diploma | 1,245 (66.7%) | 622 (33.3%) |
| College/Associate Degree | 2,250 (70.9%) | 923 (29.1%) |
| Bachelor's Degree or higher | 3,950 (85.2%) | 689 (14.8%) |
Occupancy by Age of Householder in Bixby
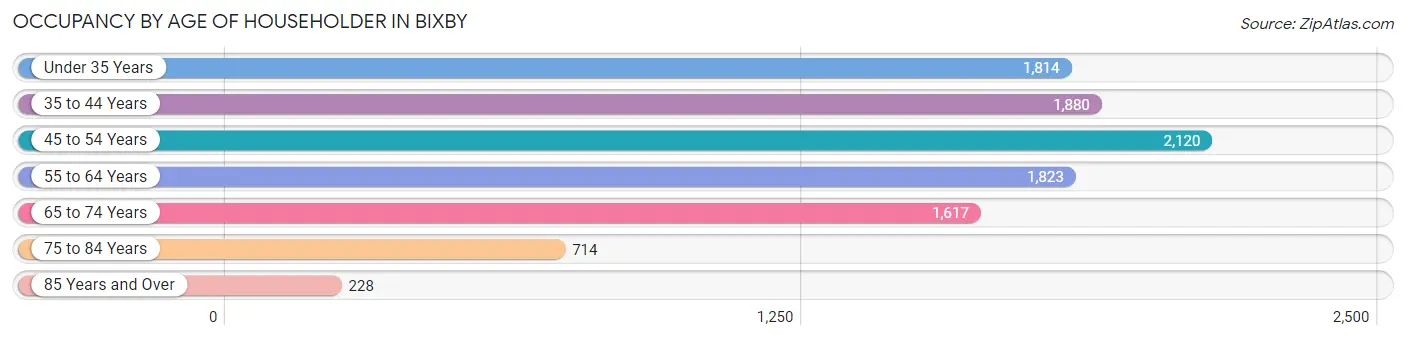
| Age Bracket | # Households | % Households |
| Under 35 Years | 1,814 | 17.8% |
| 35 to 44 Years | 1,880 | 18.4% |
| 45 to 54 Years | 2,120 | 20.8% |
| 55 to 64 Years | 1,823 | 17.9% |
| 65 to 74 Years | 1,617 | 15.9% |
| 75 to 84 Years | 714 | 7.0% |
| 85 Years and Over | 228 | 2.2% |
| Total | 10,196 | 100.0% |
Housing Finances in Bixby
Median Income by Occupancy in Bixby
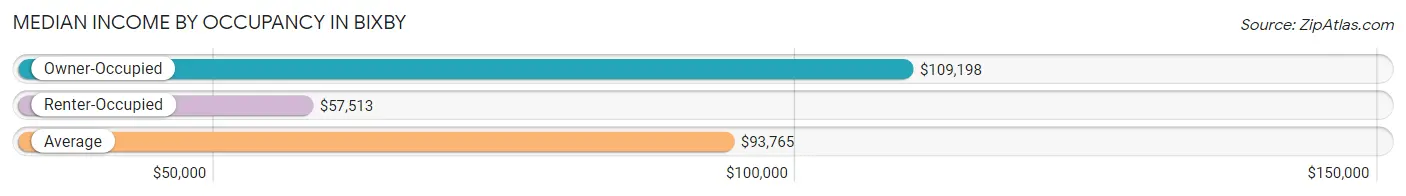
| Occupancy Type | # Households | Median Income |
| Owner-Occupied | 7,747 (76.0%) | $109,198 |
| Renter-Occupied | 2,449 (24.0%) | $57,513 |
| Average | 10,196 (100.0%) | $93,765 |
Occupancy by Householder Income Bracket in Bixby
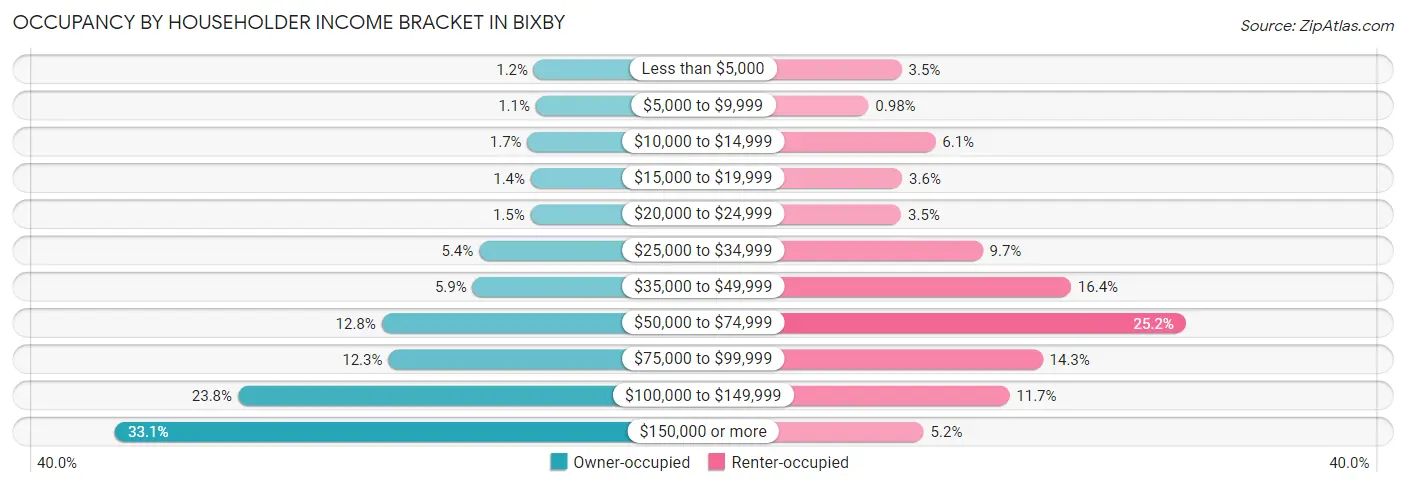
| Income Bracket | Owner-occupied | Renter-occupied |
| Less than $5,000 | 93 (1.2%) | 86 (3.5%) |
| $5,000 to $9,999 | 81 (1.1%) | 24 (1.0%) |
| $10,000 to $14,999 | 131 (1.7%) | 149 (6.1%) |
| $15,000 to $19,999 | 111 (1.4%) | 87 (3.5%) |
| $20,000 to $24,999 | 112 (1.5%) | 85 (3.5%) |
| $25,000 to $34,999 | 416 (5.4%) | 237 (9.7%) |
| $35,000 to $49,999 | 455 (5.9%) | 402 (16.4%) |
| $50,000 to $74,999 | 992 (12.8%) | 616 (25.2%) |
| $75,000 to $99,999 | 952 (12.3%) | 349 (14.2%) |
| $100,000 to $149,999 | 1,840 (23.7%) | 287 (11.7%) |
| $150,000 or more | 2,564 (33.1%) | 127 (5.2%) |
| Total | 7,747 (100.0%) | 2,449 (100.0%) |
Monthly Housing Cost Tiers in Bixby
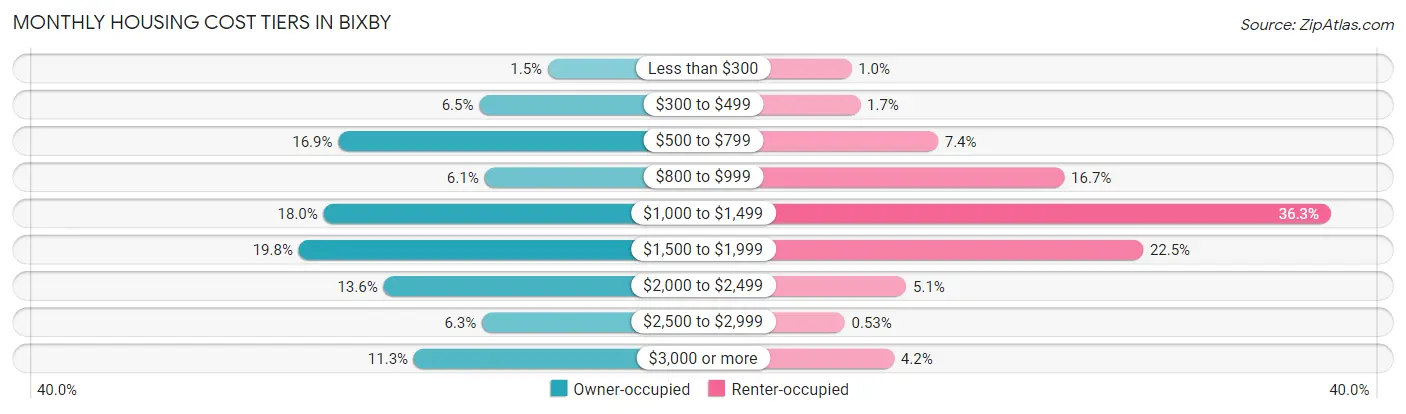
| Monthly Cost | Owner-occupied | Renter-occupied |
| Less than $300 | 113 (1.5%) | 25 (1.0%) |
| $300 to $499 | 504 (6.5%) | 41 (1.7%) |
| $500 to $799 | 1,309 (16.9%) | 181 (7.4%) |
| $800 to $999 | 475 (6.1%) | 409 (16.7%) |
| $1,000 to $1,499 | 1,393 (18.0%) | 890 (36.3%) |
| $1,500 to $1,999 | 1,535 (19.8%) | 551 (22.5%) |
| $2,000 to $2,499 | 1,051 (13.6%) | 124 (5.1%) |
| $2,500 to $2,999 | 489 (6.3%) | 13 (0.5%) |
| $3,000 or more | 878 (11.3%) | 102 (4.2%) |
| Total | 7,747 (100.0%) | 2,449 (100.0%) |
Physical Housing Characteristics in Bixby
Housing Structures in Bixby
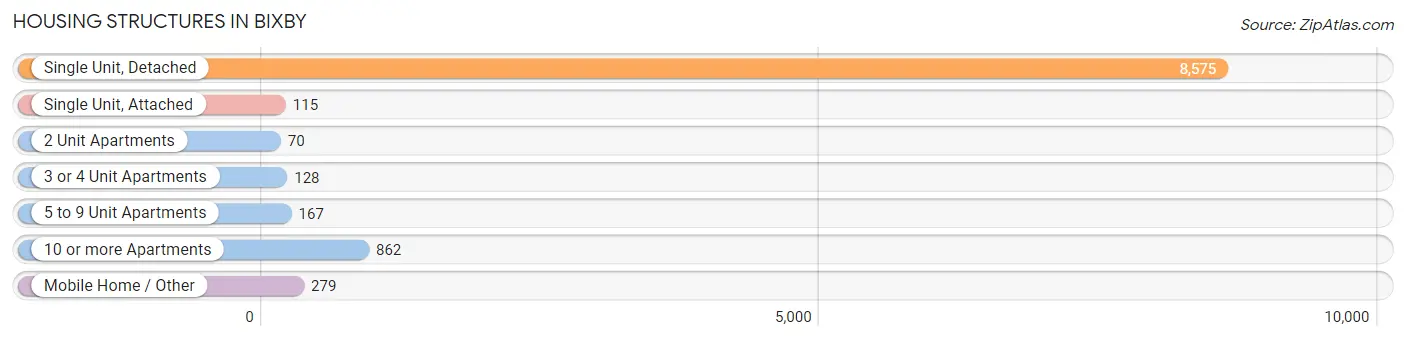
| Structure Type | # Housing Units | % Housing Units |
| Single Unit, Detached | 8,575 | 84.1% |
| Single Unit, Attached | 115 | 1.1% |
| 2 Unit Apartments | 70 | 0.7% |
| 3 or 4 Unit Apartments | 128 | 1.3% |
| 5 to 9 Unit Apartments | 167 | 1.6% |
| 10 or more Apartments | 862 | 8.5% |
| Mobile Home / Other | 279 | 2.7% |
| Total | 10,196 | 100.0% |
Housing Structures by Occupancy in Bixby
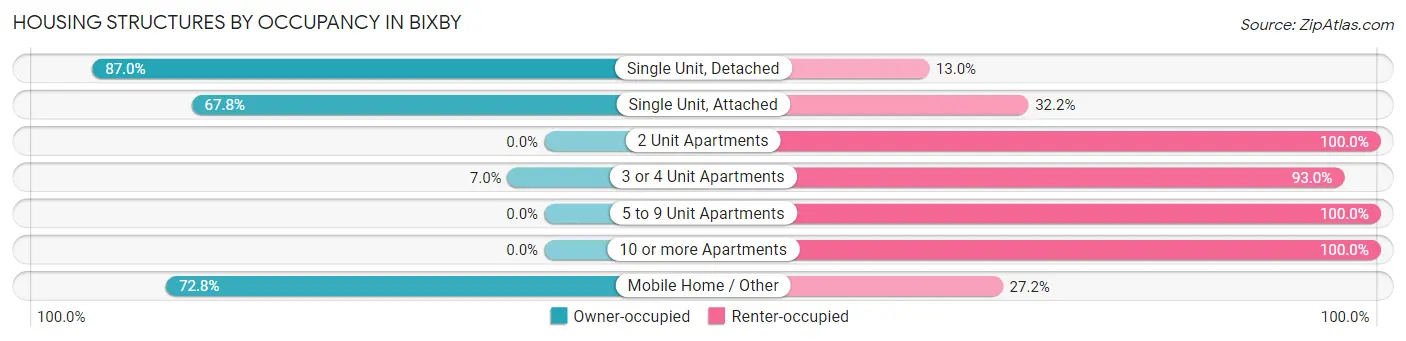
| Structure Type | Owner-occupied | Renter-occupied |
| Single Unit, Detached | 7,457 (87.0%) | 1,118 (13.0%) |
| Single Unit, Attached | 78 (67.8%) | 37 (32.2%) |
| 2 Unit Apartments | 0 (0.0%) | 70 (100.0%) |
| 3 or 4 Unit Apartments | 9 (7.0%) | 119 (93.0%) |
| 5 to 9 Unit Apartments | 0 (0.0%) | 167 (100.0%) |
| 10 or more Apartments | 0 (0.0%) | 862 (100.0%) |
| Mobile Home / Other | 203 (72.8%) | 76 (27.2%) |
| Total | 7,747 (76.0%) | 2,449 (24.0%) |
Housing Structures by Number of Rooms in Bixby
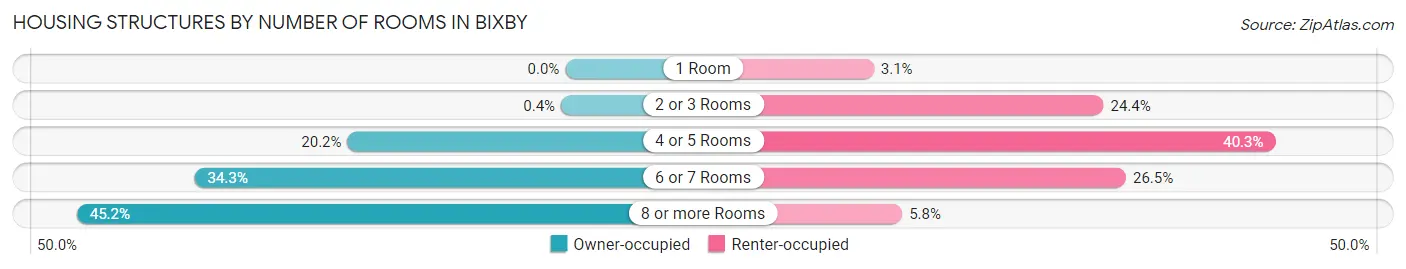
| Number of Rooms | Owner-occupied | Renter-occupied |
| 1 Room | 0 (0.0%) | 77 (3.1%) |
| 2 or 3 Rooms | 31 (0.4%) | 597 (24.4%) |
| 4 or 5 Rooms | 1,561 (20.2%) | 986 (40.3%) |
| 6 or 7 Rooms | 2,656 (34.3%) | 648 (26.5%) |
| 8 or more Rooms | 3,499 (45.2%) | 141 (5.8%) |
| Total | 7,747 (100.0%) | 2,449 (100.0%) |
Housing Structure by Heating Type in Bixby
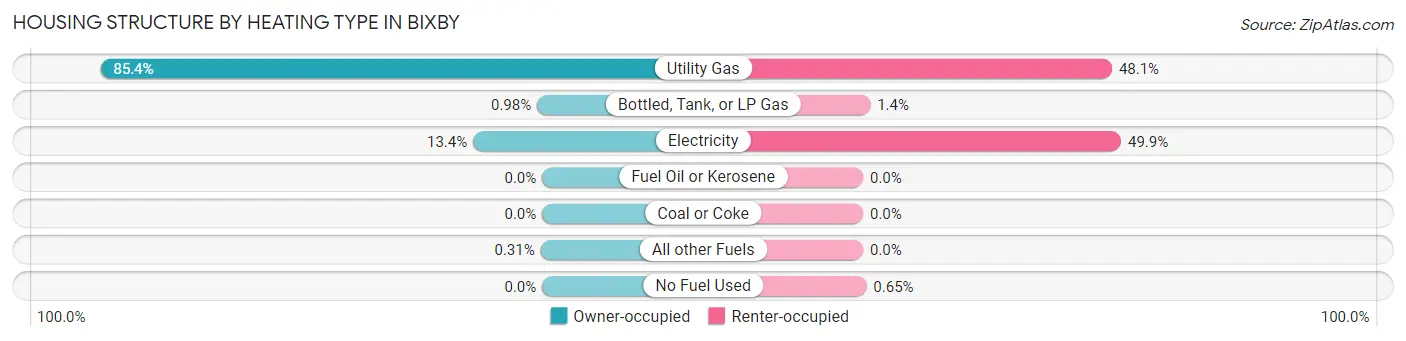
| Heating Type | Owner-occupied | Renter-occupied |
| Utility Gas | 6,613 (85.4%) | 1,178 (48.1%) |
| Bottled, Tank, or LP Gas | 76 (1.0%) | 34 (1.4%) |
| Electricity | 1,034 (13.4%) | 1,221 (49.9%) |
| Fuel Oil or Kerosene | 0 (0.0%) | 0 (0.0%) |
| Coal or Coke | 0 (0.0%) | 0 (0.0%) |
| All other Fuels | 24 (0.3%) | 0 (0.0%) |
| No Fuel Used | 0 (0.0%) | 16 (0.6%) |
| Total | 7,747 (100.0%) | 2,449 (100.0%) |
Household Vehicle Usage in Bixby
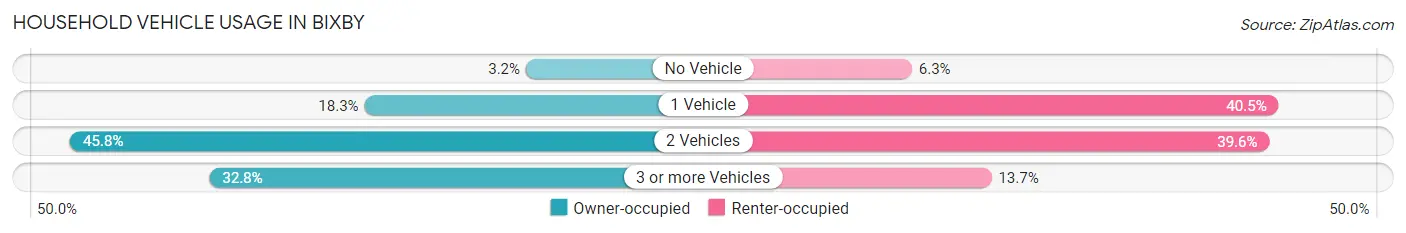
| Vehicles per Household | Owner-occupied | Renter-occupied |
| No Vehicle | 249 (3.2%) | 153 (6.2%) |
| 1 Vehicle | 1,416 (18.3%) | 991 (40.5%) |
| 2 Vehicles | 3,545 (45.8%) | 970 (39.6%) |
| 3 or more Vehicles | 2,537 (32.8%) | 335 (13.7%) |
| Total | 7,747 (100.0%) | 2,449 (100.0%) |
Real Estate & Mortgages in Bixby
Real Estate and Mortgage Overview in Bixby
| Characteristic | Without Mortgage | With Mortgage |
| Housing Units | 2,575 | 5,172 |
| Median Property Value | $267,400 | $284,800 |
| Median Household Income | $64,346 | $1,996 |
| Monthly Housing Costs | $685 | $854 |
| Real Estate Taxes | $2,818 | $73 |
Property Value by Mortgage Status in Bixby
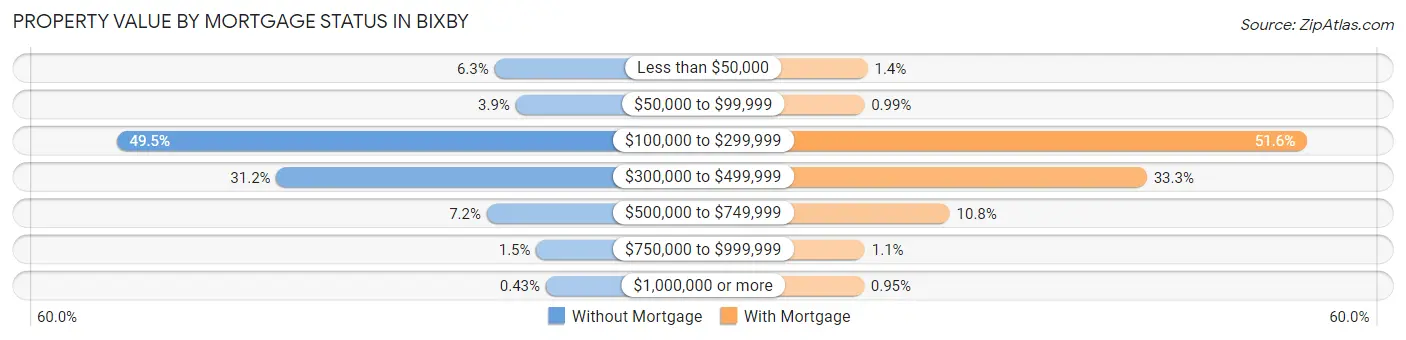
| Property Value | Without Mortgage | With Mortgage |
| Less than $50,000 | 162 (6.3%) | 71 (1.4%) |
| $50,000 to $99,999 | 100 (3.9%) | 51 (1.0%) |
| $100,000 to $299,999 | 1,274 (49.5%) | 2,669 (51.6%) |
| $300,000 to $499,999 | 804 (31.2%) | 1,721 (33.3%) |
| $500,000 to $749,999 | 185 (7.2%) | 556 (10.7%) |
| $750,000 to $999,999 | 39 (1.5%) | 55 (1.1%) |
| $1,000,000 or more | 11 (0.4%) | 49 (0.9%) |
| Total | 2,575 (100.0%) | 5,172 (100.0%) |
Household Income by Mortgage Status in Bixby
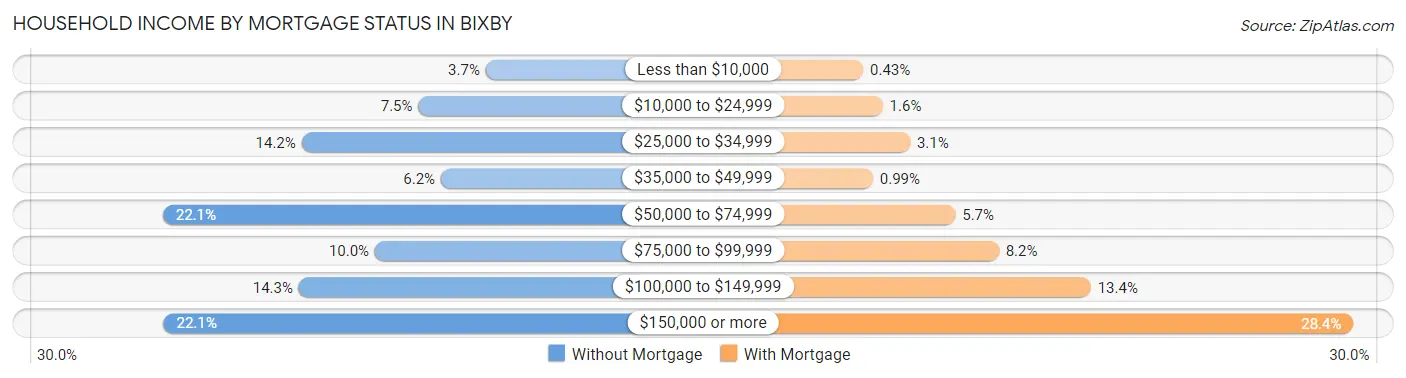
| Household Income | Without Mortgage | With Mortgage |
| Less than $10,000 | 94 (3.6%) | 22 (0.4%) |
| $10,000 to $24,999 | 193 (7.5%) | 80 (1.5%) |
| $25,000 to $34,999 | 365 (14.2%) | 161 (3.1%) |
| $35,000 to $49,999 | 160 (6.2%) | 51 (1.0%) |
| $50,000 to $74,999 | 569 (22.1%) | 295 (5.7%) |
| $75,000 to $99,999 | 257 (10.0%) | 423 (8.2%) |
| $100,000 to $149,999 | 369 (14.3%) | 695 (13.4%) |
| $150,000 or more | 568 (22.1%) | 1,471 (28.4%) |
| Total | 2,575 (100.0%) | 5,172 (100.0%) |
Property Value to Household Income Ratio in Bixby
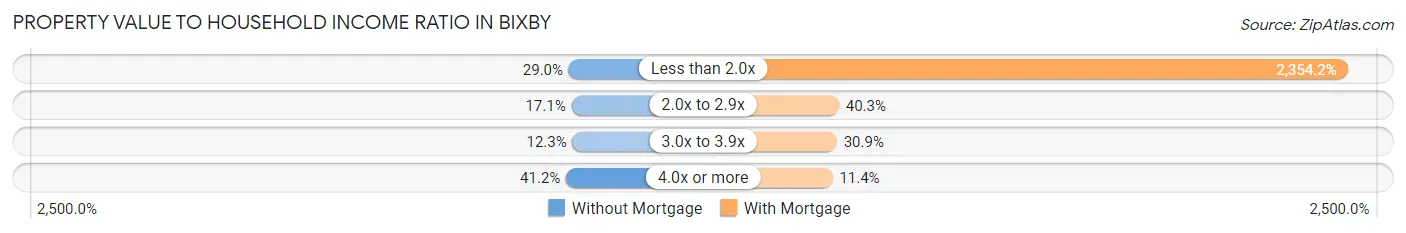
| Value-to-Income Ratio | Without Mortgage | With Mortgage |
| Less than 2.0x | 746 (29.0%) | 121,757 (2,354.2%) |
| 2.0x to 2.9x | 440 (17.1%) | 2,086 (40.3%) |
| 3.0x to 3.9x | 316 (12.3%) | 1,597 (30.9%) |
| 4.0x or more | 1,060 (41.2%) | 591 (11.4%) |
| Total | 2,575 (100.0%) | 5,172 (100.0%) |
Real Estate Taxes by Mortgage Status in Bixby
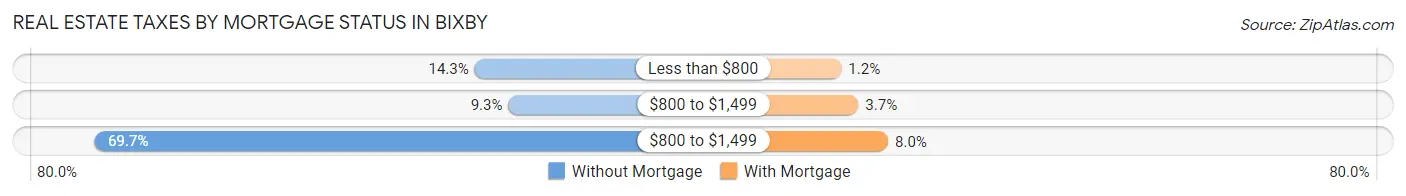
| Property Taxes | Without Mortgage | With Mortgage |
| Less than $800 | 367 (14.2%) | 63 (1.2%) |
| $800 to $1,499 | 240 (9.3%) | 192 (3.7%) |
| $800 to $1,499 | 1,795 (69.7%) | 416 (8.0%) |
| Total | 2,575 (100.0%) | 5,172 (100.0%) |
Health & Disability in Bixby
Health Insurance Coverage by Age in Bixby
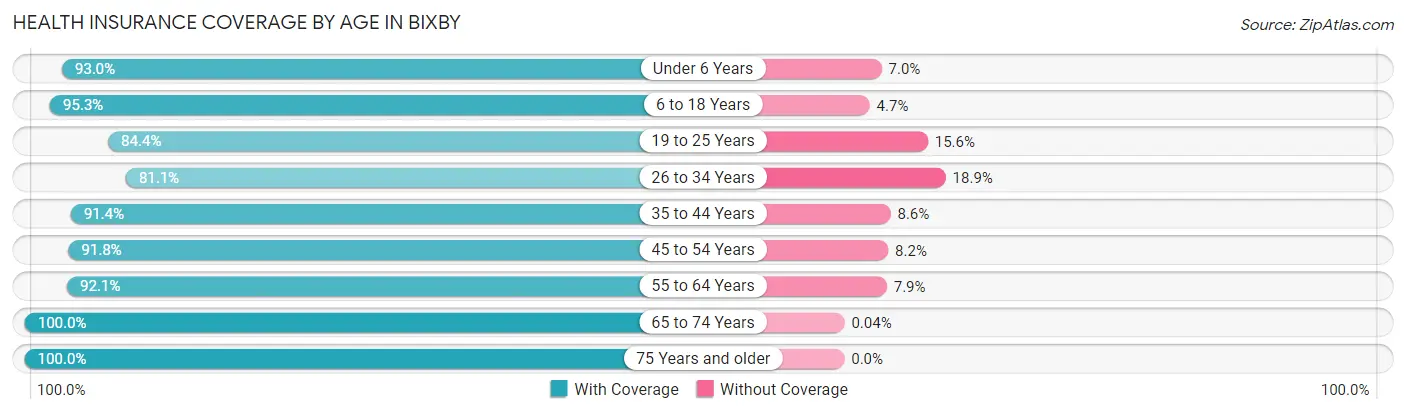
| Age Bracket | With Coverage | Without Coverage |
| Under 6 Years | 2,220 (93.0%) | 166 (7.0%) |
| 6 to 18 Years | 6,117 (95.3%) | 304 (4.7%) |
| 19 to 25 Years | 1,573 (84.4%) | 290 (15.6%) |
| 26 to 34 Years | 2,514 (81.1%) | 586 (18.9%) |
| 35 to 44 Years | 3,719 (91.4%) | 351 (8.6%) |
| 45 to 54 Years | 3,197 (91.8%) | 285 (8.2%) |
| 55 to 64 Years | 3,105 (92.1%) | 267 (7.9%) |
| 65 to 74 Years | 2,508 (100.0%) | 1 (0.0%) |
| 75 Years and older | 1,462 (100.0%) | 0 (0.0%) |
| Total | 26,415 (92.1%) | 2,250 (7.9%) |
Health Insurance Coverage by Citizenship Status in Bixby
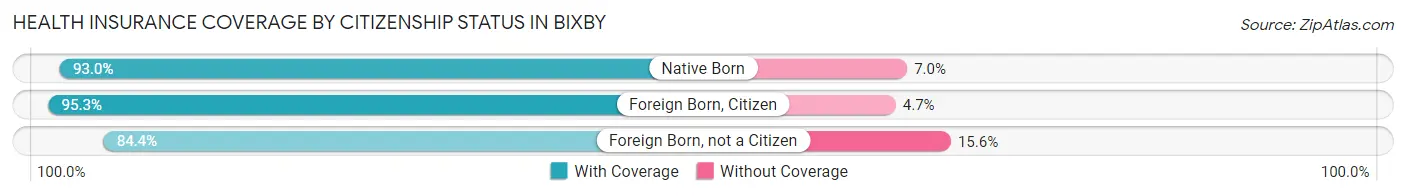
| Citizenship Status | With Coverage | Without Coverage |
| Native Born | 2,220 (93.0%) | 166 (7.0%) |
| Foreign Born, Citizen | 6,117 (95.3%) | 304 (4.7%) |
| Foreign Born, not a Citizen | 1,573 (84.4%) | 290 (15.6%) |
Health Insurance Coverage by Household Income in Bixby
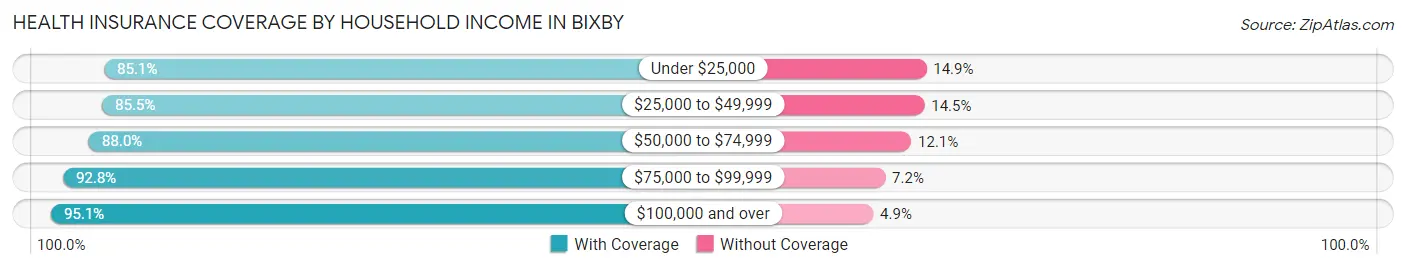
| Household Income | With Coverage | Without Coverage |
| Under $25,000 | 1,268 (85.1%) | 222 (14.9%) |
| $25,000 to $49,999 | 2,650 (85.5%) | 450 (14.5%) |
| $50,000 to $74,999 | 3,750 (87.9%) | 514 (12.0%) |
| $75,000 to $99,999 | 3,500 (92.8%) | 271 (7.2%) |
| $100,000 and over | 15,247 (95.1%) | 793 (4.9%) |
Public vs Private Health Insurance Coverage by Age in Bixby
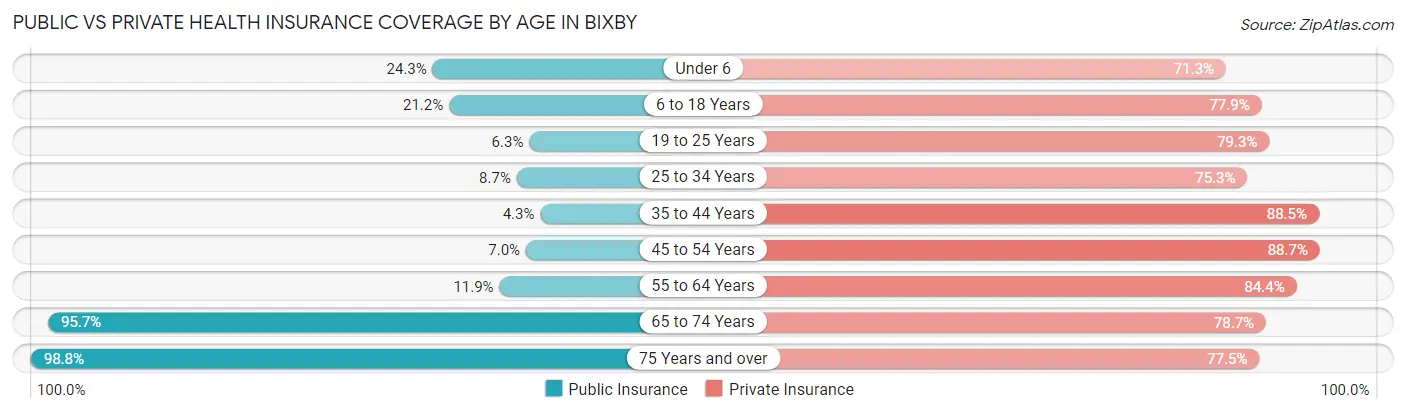
| Age Bracket | Public Insurance | Private Insurance |
| Under 6 | 579 (24.3%) | 1,701 (71.3%) |
| 6 to 18 Years | 1,362 (21.2%) | 5,001 (77.9%) |
| 19 to 25 Years | 118 (6.3%) | 1,478 (79.3%) |
| 25 to 34 Years | 268 (8.6%) | 2,333 (75.3%) |
| 35 to 44 Years | 174 (4.3%) | 3,603 (88.5%) |
| 45 to 54 Years | 242 (7.0%) | 3,089 (88.7%) |
| 55 to 64 Years | 400 (11.9%) | 2,846 (84.4%) |
| 65 to 74 Years | 2,400 (95.7%) | 1,975 (78.7%) |
| 75 Years and over | 1,445 (98.8%) | 1,133 (77.5%) |
| Total | 6,988 (24.4%) | 23,159 (80.8%) |
Disability Status by Sex by Age in Bixby
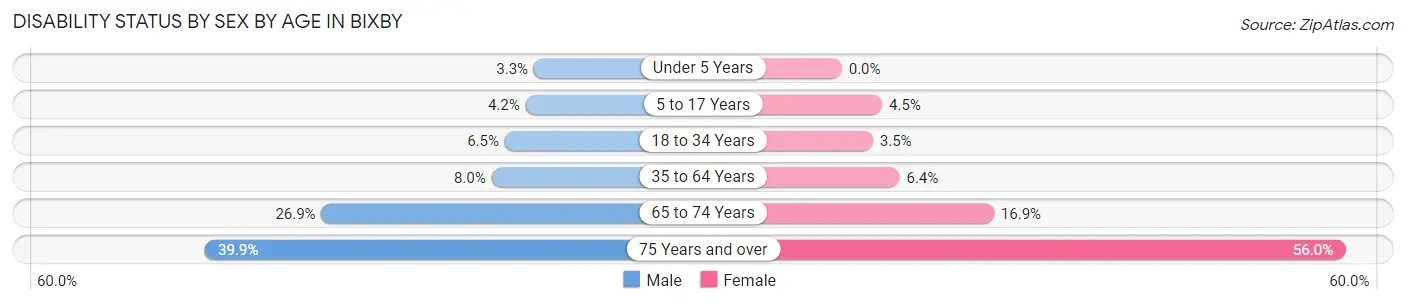
| Age Bracket | Male | Female |
| Under 5 Years | 35 (3.3%) | 0 (0.0%) |
| 5 to 17 Years | 137 (4.2%) | 141 (4.5%) |
| 18 to 34 Years | 158 (6.5%) | 103 (3.5%) |
| 35 to 64 Years | 429 (8.0%) | 358 (6.4%) |
| 65 to 74 Years | 299 (26.9%) | 237 (16.9%) |
| 75 Years and over | 243 (39.9%) | 478 (56.0%) |
Disability Class by Sex by Age in Bixby
Disability Class: Hearing Difficulty
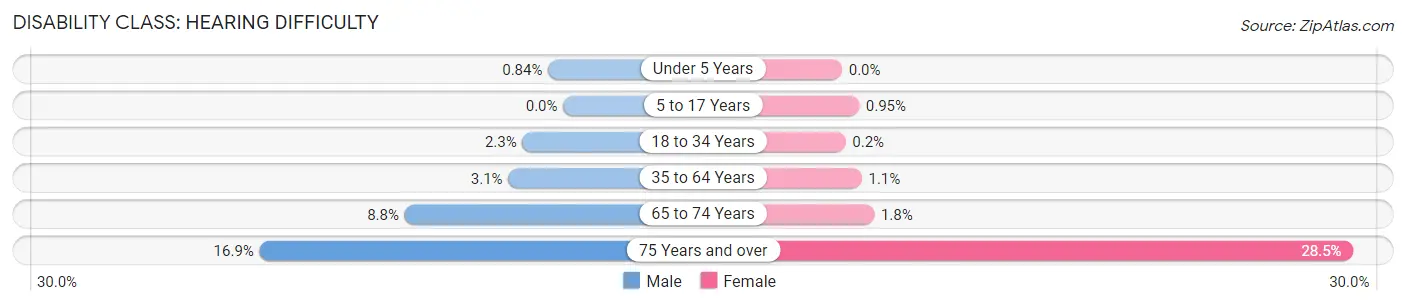
| Age Bracket | Male | Female |
| Under 5 Years | 9 (0.8%) | 0 (0.0%) |
| 5 to 17 Years | 0 (0.0%) | 30 (0.9%) |
| 18 to 34 Years | 55 (2.3%) | 6 (0.2%) |
| 35 to 64 Years | 164 (3.1%) | 61 (1.1%) |
| 65 to 74 Years | 98 (8.8%) | 25 (1.8%) |
| 75 Years and over | 103 (16.9%) | 243 (28.5%) |
Disability Class: Vision Difficulty
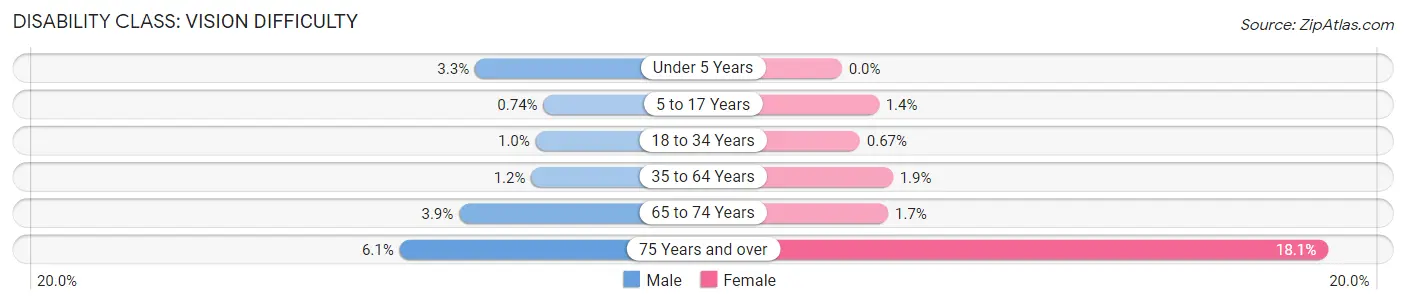
| Age Bracket | Male | Female |
| Under 5 Years | 35 (3.3%) | 0 (0.0%) |
| 5 to 17 Years | 24 (0.7%) | 43 (1.4%) |
| 18 to 34 Years | 25 (1.0%) | 20 (0.7%) |
| 35 to 64 Years | 64 (1.2%) | 105 (1.9%) |
| 65 to 74 Years | 43 (3.9%) | 24 (1.7%) |
| 75 Years and over | 37 (6.1%) | 154 (18.0%) |
Disability Class: Cognitive Difficulty
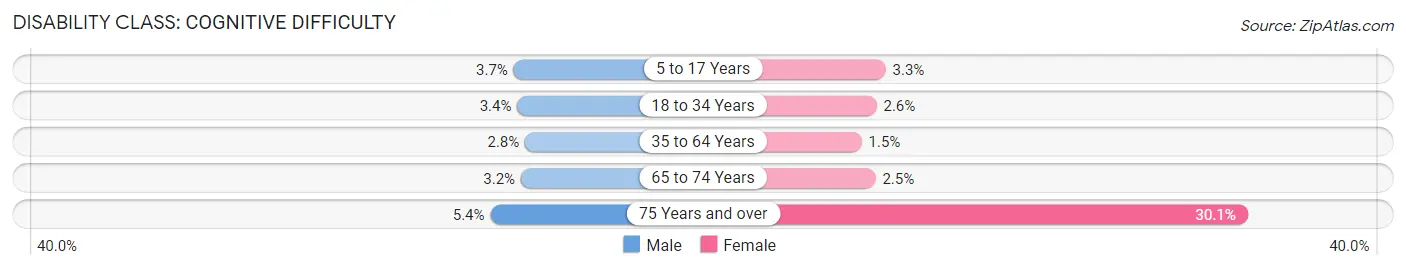
| Age Bracket | Male | Female |
| 5 to 17 Years | 120 (3.7%) | 102 (3.3%) |
| 18 to 34 Years | 83 (3.4%) | 77 (2.6%) |
| 35 to 64 Years | 152 (2.8%) | 82 (1.5%) |
| 65 to 74 Years | 35 (3.2%) | 35 (2.5%) |
| 75 Years and over | 33 (5.4%) | 257 (30.1%) |
Disability Class: Ambulatory Difficulty
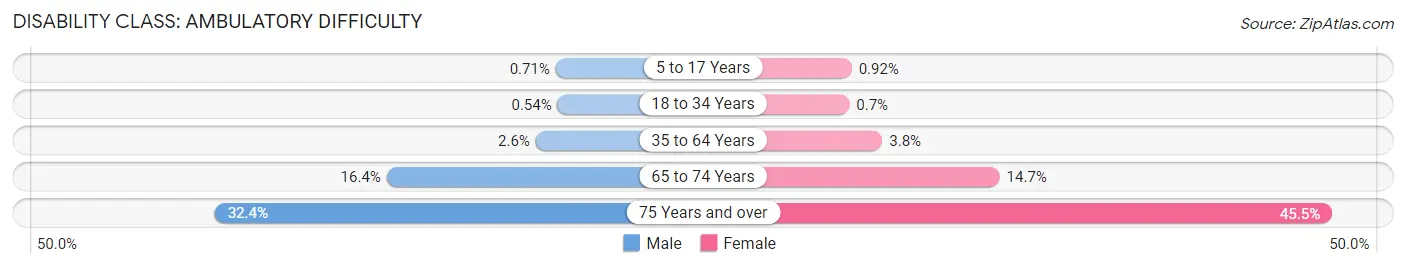
| Age Bracket | Male | Female |
| 5 to 17 Years | 23 (0.7%) | 29 (0.9%) |
| 18 to 34 Years | 13 (0.5%) | 21 (0.7%) |
| 35 to 64 Years | 138 (2.6%) | 209 (3.8%) |
| 65 to 74 Years | 182 (16.4%) | 205 (14.6%) |
| 75 Years and over | 197 (32.4%) | 388 (45.5%) |
Disability Class: Self-Care Difficulty
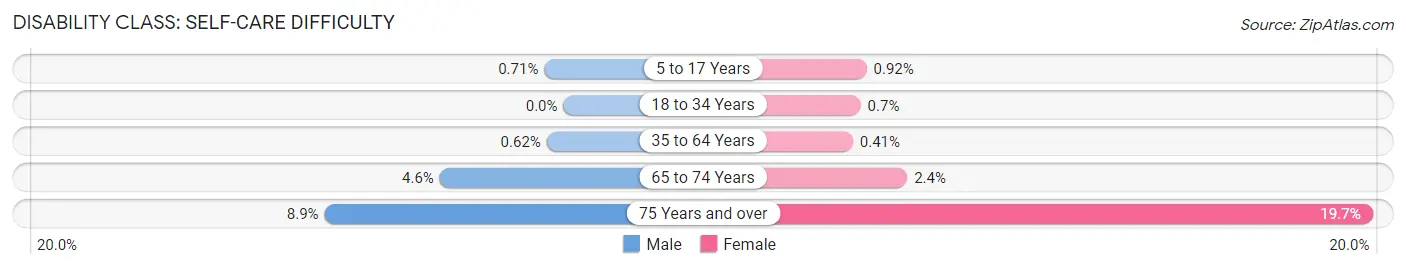
| Age Bracket | Male | Female |
| 5 to 17 Years | 23 (0.7%) | 29 (0.9%) |
| 18 to 34 Years | 0 (0.0%) | 21 (0.7%) |
| 35 to 64 Years | 33 (0.6%) | 23 (0.4%) |
| 65 to 74 Years | 51 (4.6%) | 34 (2.4%) |
| 75 Years and over | 54 (8.9%) | 168 (19.7%) |
Technology Access in Bixby
Computing Device Access in Bixby
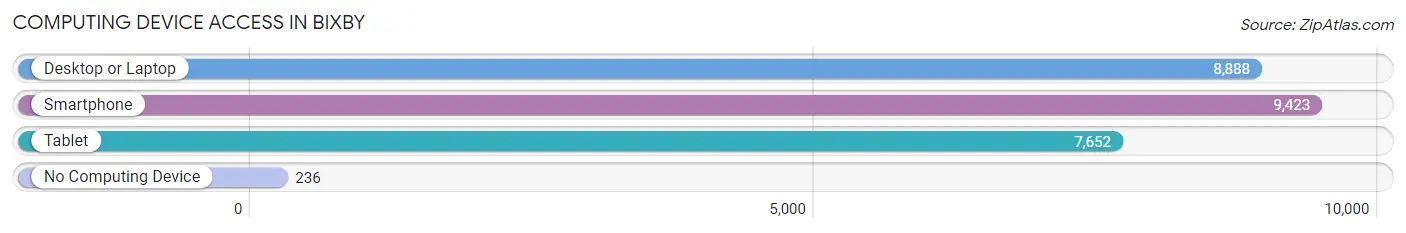
| Device Type | # Households | % Households |
| Desktop or Laptop | 8,888 | 87.2% |
| Smartphone | 9,423 | 92.4% |
| Tablet | 7,652 | 75.0% |
| No Computing Device | 236 | 2.3% |
| Total | 10,196 | 100.0% |
Internet Access in Bixby
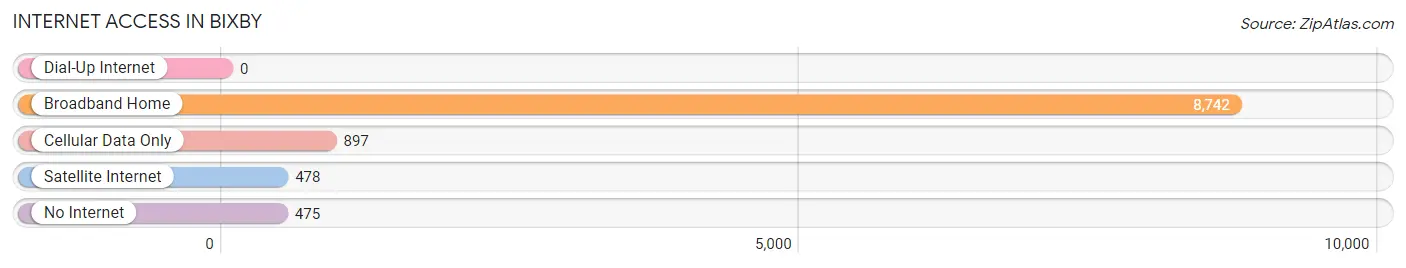
| Internet Type | # Households | % Households |
| Dial-Up Internet | 0 | 0.0% |
| Broadband Home | 8,742 | 85.7% |
| Cellular Data Only | 897 | 8.8% |
| Satellite Internet | 478 | 4.7% |
| No Internet | 475 | 4.7% |
| Total | 10,196 | 100.0% |
Bixby Summary
Bixby is a city located in Tulsa County, Oklahoma, United States. It is part of the Tulsa Metropolitan Statistical Area. The population was 13,336 at the 2010 census, an increase of 81.1 percent from 7,335 at the 2000 census.
History
The area that is now Bixby was originally part of the Creek Nation, Indian Territory. The first settlers arrived in the area in the late 1800s. The town was named after James Bixby, a rancher who owned a large portion of the land in the area.
In the early 1900s, the town began to grow as a farming community. The first post office was established in 1906. The town was incorporated in 1910.
In the 1920s, the town began to experience a population boom as oil was discovered in the area. The population grew from 1,000 in 1920 to 4,000 in 1930.
In the 1950s, the town began to experience a decline in population as the oil industry began to decline. The population dropped to 2,000 in 1960.
In the 1970s, the town began to experience a resurgence in population as the Tulsa metropolitan area began to expand. The population grew to 7,335 in 2000.
Geography
Bixby is located in Tulsa County, Oklahoma, at (35.945, -95.890). It is situated on the Arkansas River, just south of Tulsa.
According to the United States Census Bureau, the city has a total area of 11.2 square miles (29.0 km2), of which 11.1 square miles (28.7 km2) is land and 0.1 square miles (0.3 km2) (0.72%) is water.
Economy
Bixby's economy is largely based on the oil and gas industry. The city is home to several oil and gas companies, including Apache Corporation, Devon Energy, and Williams Companies.
The city is also home to several manufacturing companies, including Bixby Manufacturing, which produces industrial equipment, and Bixby Plastics, which produces plastic products.
The city is also home to several retail stores including Walmart Target and Lowe s
Demographics
As of the 2010 census, there were 13,336 people, 4,845 households, and 3,717 families residing in the city. The population density was 1,196.2 people per square mile (461.7/km2). There were 5,093 housing units at an average density of 459.2 per square mile (177.4/km2). The racial makeup of the city was 81.2% White, 4.2% African American, 8.2% Native American, 0.7% Asian, 0.1% Pacific Islander, 2.2% from other races, and 3.5% from two or more races. Hispanic or Latino of any race were 6.3% of the population.
There were 4,845 households, out of which 37.2% had children under the age of 18 living with them, 58.2% were married couples living together, 11.7% had a female householder with no husband present, and 25.3% were non-families. 21.2% of all households were made up of individuals, and 7.2% had someone living alone who was 65 years of age or older. The average household size was 2.72 and the average family size was 3.17.
In the city, the population was spread out, with 28.7% under the age of 18, 8.2% from 18 to 24, 30.2% from 25 to 44, 22.7% from 45 to 64, and 10.2% who were 65 years of age or older. The median age was 34 years. For every 100 females, there were 94.2 males. For every 100 females age 18 and over, there were 90.3 males.
The median income for a household in the city was $50,945, and the median income for a family was $58,945. Males had a median income of $41,945 versus $30,945 for females. The per capita income for the city was $22,945. About 5.2% of families and 7.2% of the population were below the poverty line, including 9.2% of those under age 18 and 6.2% of those age 65 or over.
Common Questions
What is Per Capita Income in Bixby?
Per Capita income in Bixby is $45,275.
What is the Median Family Income in Bixby?
Median Family Income in Bixby is $110,750.
What is the Median Household income in Bixby?
Median Household Income in Bixby is $93,765.
What is Income or Wage Gap in Bixby?
Income or Wage Gap in Bixby is 43.2%.
Women in Bixby earn 56.8 cents for every dollar earned by a man.
What is Family Income Deficit in Bixby?
Family Income Deficit in Bixby is $7,300.
Families that are below poverty line in Bixby earn $7,300 less on average than the poverty threshold level.
What is Inequality or Gini Index in Bixby?
Inequality or Gini Index in Bixby is 0.46.
What is the Total Population of Bixby?
Total Population of Bixby is 28,731.
What is the Total Male Population of Bixby?
Total Male Population of Bixby is 13,850.
What is the Total Female Population of Bixby?
Total Female Population of Bixby is 14,881.
What is the Ratio of Males per 100 Females in Bixby?
There are 93.07 Males per 100 Females in Bixby.
What is the Ratio of Females per 100 Males in Bixby?
There are 107.44 Females per 100 Males in Bixby.
What is the Median Population Age in Bixby?
Median Population Age in Bixby is 36.8 Years.
What is the Average Family Size in Bixby
Average Family Size in Bixby is 3.3 People.
What is the Average Household Size in Bixby
Average Household Size in Bixby is 2.8 People.
How Large is the Labor Force in Bixby?
There are 14,289 People in the Labor Forcein in Bixby.
What is the Percentage of People in the Labor Force in Bixby?
67.0% of People are in the Labor Force in Bixby.
What is the Unemployment Rate in Bixby?
Unemployment Rate in Bixby is 3.6%.