Rentiesville, OK Map & Demographics
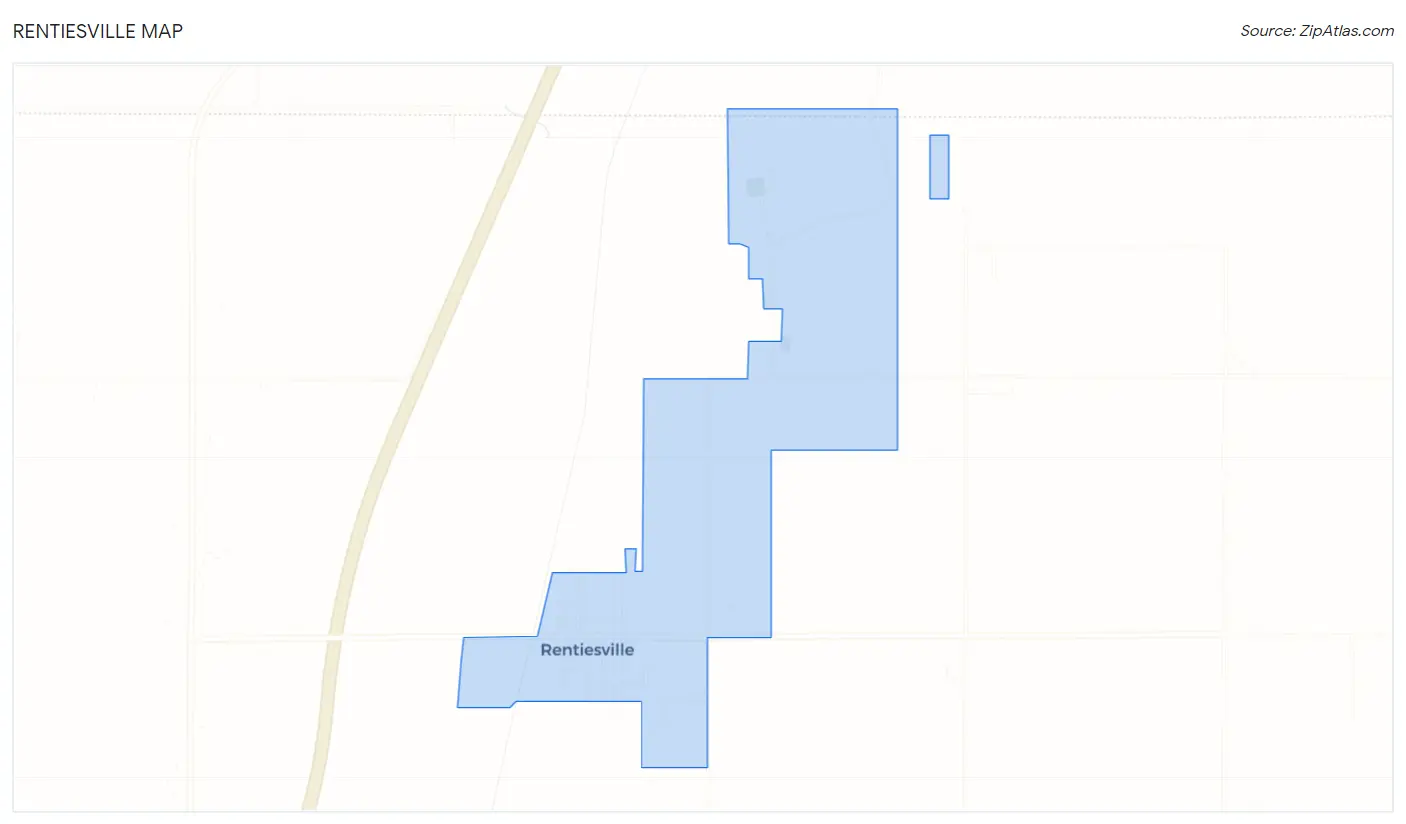
Rentiesville Map
Rentiesville Overview
$27,958
PER CAPITA INCOME
$97,500
AVG FAMILY INCOME
$63,750
AVG HOUSEHOLD INCOME
0.39
INEQUALITY / GINI INDEX
108
TOTAL POPULATION
64
MALE POPULATION
44
FEMALE POPULATION
145.45
MALES / 100 FEMALES
68.75
FEMALES / 100 MALES
40.0
MEDIAN AGE
3.5
AVG FAMILY SIZE
2.3
AVG HOUSEHOLD SIZE
53
LABOR FORCE [ PEOPLE ]
60.2%
PERCENT IN LABOR FORCE
3.8%
UNEMPLOYMENT RATE
Rentiesville Zip Codes
Rentiesville Area Codes
Income in Rentiesville
Income Overview in Rentiesville
Per Capita Income in Rentiesville is $27,958, while median incomes of families and households are $97,500 and $63,750 respectively.
| Characteristic | Number | Measure |
| Per Capita Income | 108 | $27,958 |
| Median Family Income | 24 | $97,500 |
| Mean Family Income | 24 | $95,417 |
| Median Household Income | 47 | $63,750 |
| Mean Household Income | 47 | $63,896 |
| Income Deficit | 24 | $0 |
| Wage / Income Gap (%) | 108 | 0.00% |
| Wage / Income Gap ($) | 108 | 100.00¢ per $1 |
| Gini / Inequality Index | 108 | 0.39 |
Earnings by Sex in Rentiesville
| Sex | Number | Average Earnings |
| Male | 36 (67.9%) | $0 |
| Female | 17 (32.1%) | $0 |
| Total | 53 (100.0%) | $0 |
Earnings by Sex by Income Bracket in Rentiesville
The most common earnings brackets in Rentiesville are $10,000 to $12,499 for men (19 | 52.8%) and $30,000 to $34,999 for women (3 | 17.6%).
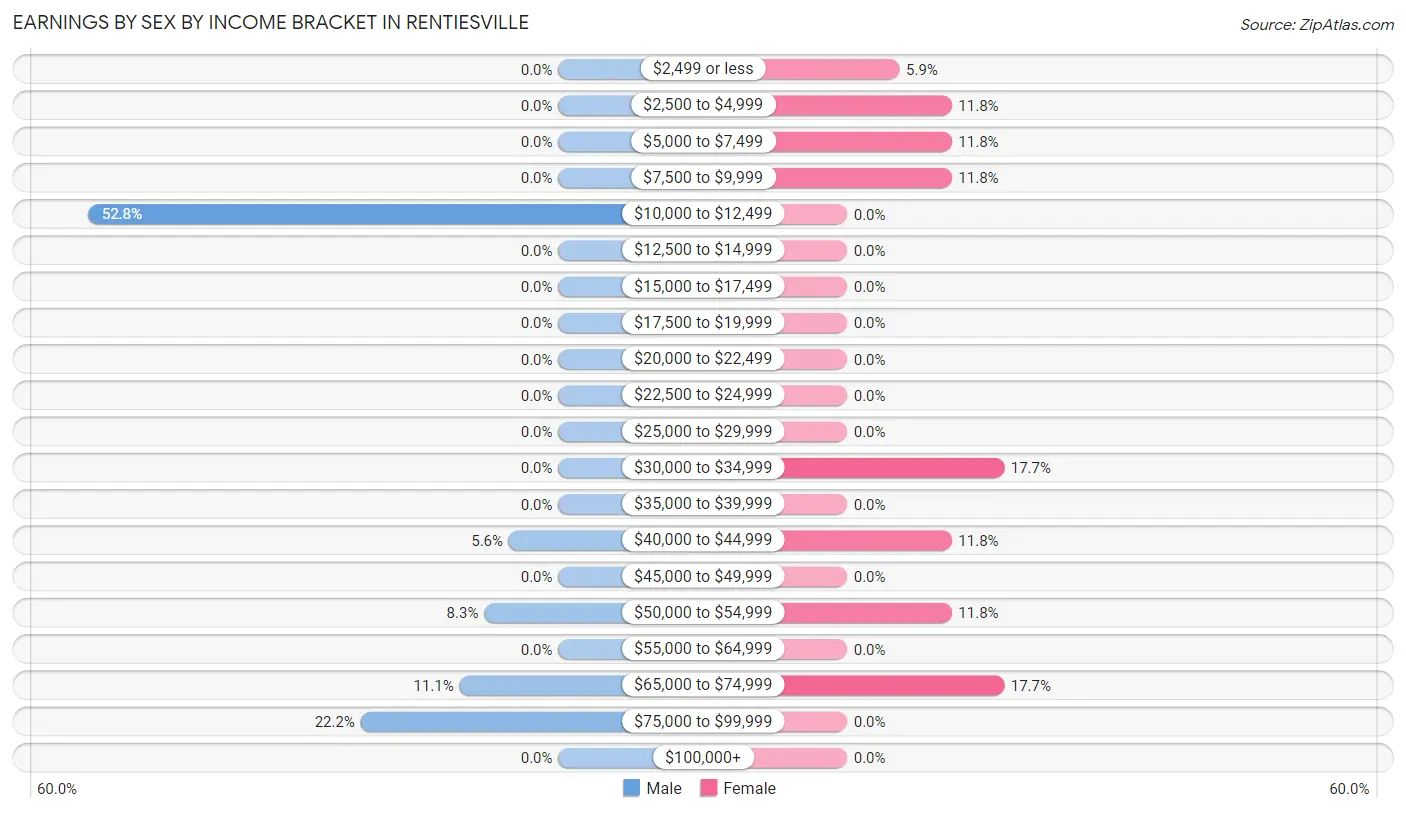
| Income | Male | Female |
| $2,499 or less | 0 (0.0%) | 1 (5.9%) |
| $2,500 to $4,999 | 0 (0.0%) | 2 (11.8%) |
| $5,000 to $7,499 | 0 (0.0%) | 2 (11.8%) |
| $7,500 to $9,999 | 0 (0.0%) | 2 (11.8%) |
| $10,000 to $12,499 | 19 (52.8%) | 0 (0.0%) |
| $12,500 to $14,999 | 0 (0.0%) | 0 (0.0%) |
| $15,000 to $17,499 | 0 (0.0%) | 0 (0.0%) |
| $17,500 to $19,999 | 0 (0.0%) | 0 (0.0%) |
| $20,000 to $22,499 | 0 (0.0%) | 0 (0.0%) |
| $22,500 to $24,999 | 0 (0.0%) | 0 (0.0%) |
| $25,000 to $29,999 | 0 (0.0%) | 0 (0.0%) |
| $30,000 to $34,999 | 0 (0.0%) | 3 (17.6%) |
| $35,000 to $39,999 | 0 (0.0%) | 0 (0.0%) |
| $40,000 to $44,999 | 2 (5.6%) | 2 (11.8%) |
| $45,000 to $49,999 | 0 (0.0%) | 0 (0.0%) |
| $50,000 to $54,999 | 3 (8.3%) | 2 (11.8%) |
| $55,000 to $64,999 | 0 (0.0%) | 0 (0.0%) |
| $65,000 to $74,999 | 4 (11.1%) | 3 (17.6%) |
| $75,000 to $99,999 | 8 (22.2%) | 0 (0.0%) |
| $100,000+ | 0 (0.0%) | 0 (0.0%) |
| Total | 36 (100.0%) | 17 (100.0%) |
Earnings by Sex by Educational Attainment in Rentiesville
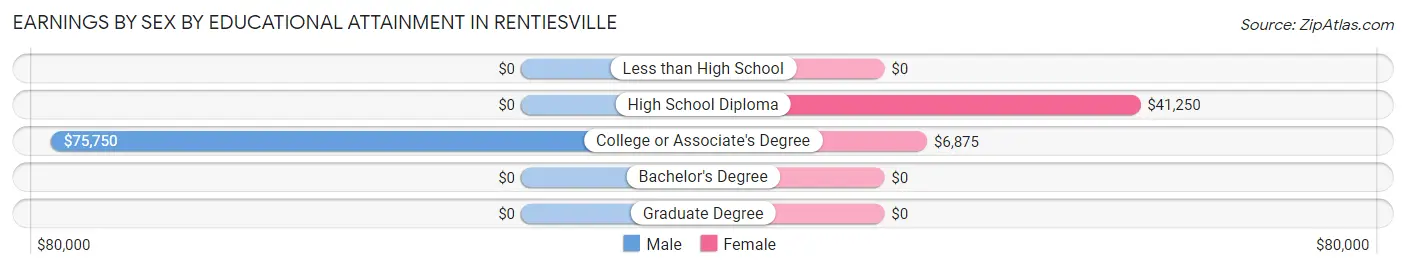
| Educational Attainment | Male Income | Female Income |
| Less than High School | - | - |
| High School Diploma | - | - |
| College or Associate's Degree | $75,750 | $6,875 |
| Bachelor's Degree | - | - |
| Graduate Degree | - | - |
| Total | - | - |
Family Income in Rentiesville
Family Income Brackets in Rentiesville
According to the Rentiesville family income data, there are 10 families falling into the $100,000 to $149,999 income range, which is the most common income bracket and makes up 41.7% of all families.
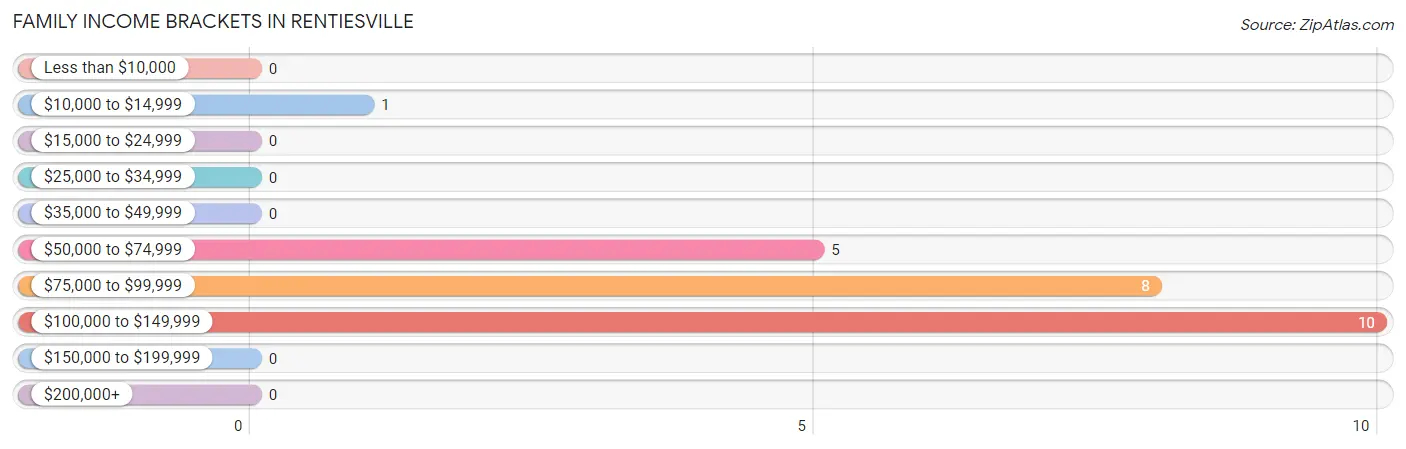
| Income Bracket | # Families | % Families |
| Less than $10,000 | 0 | 0.0% |
| $10,000 to $14,999 | 1 | 4.2% |
| $15,000 to $24,999 | 0 | 0.0% |
| $25,000 to $34,999 | 0 | 0.0% |
| $35,000 to $49,999 | 0 | 0.0% |
| $50,000 to $74,999 | 5 | 20.8% |
| $75,000 to $99,999 | 8 | 33.3% |
| $100,000 to $149,999 | 10 | 41.7% |
| $150,000 to $199,999 | 0 | 0.0% |
| $200,000+ | 0 | 0.0% |
Family Income by Famaliy Size in Rentiesville
4-person families (6 | 25.0%) account for the highest median family income in Rentiesville with $116,250 per family, while 2-person families (13 | 54.2%) have the highest median income of $52,812 per family member.
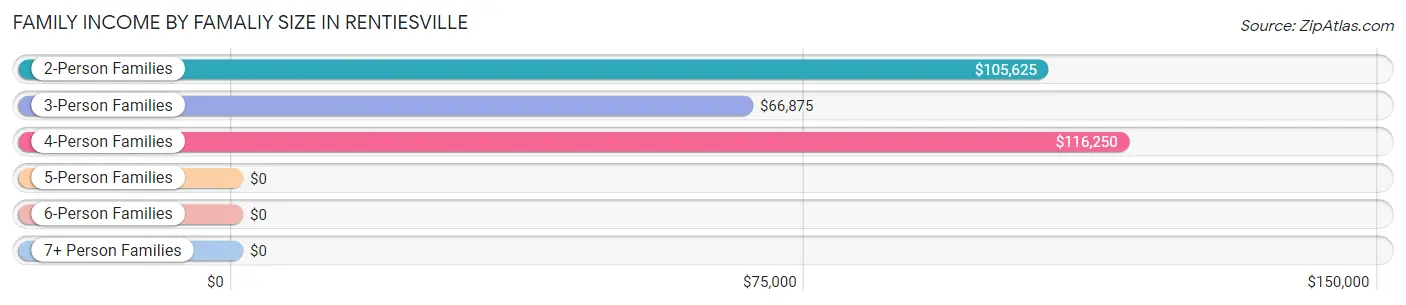
| Income Bracket | # Families | Median Income |
| 2-Person Families | 13 (54.2%) | $105,625 |
| 3-Person Families | 5 (20.8%) | $66,875 |
| 4-Person Families | 6 (25.0%) | $116,250 |
| 5-Person Families | 0 (0.0%) | $0 |
| 6-Person Families | 0 (0.0%) | $0 |
| 7+ Person Families | 0 (0.0%) | $0 |
| Total | 24 (100.0%) | $97,500 |
Family Income by Number of Earners in Rentiesville
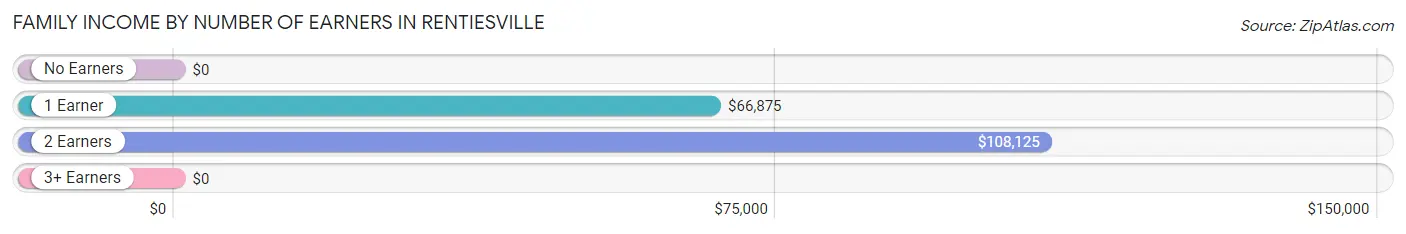
| Number of Earners | # Families | Median Income |
| No Earners | 4 (16.7%) | $0 |
| 1 Earner | 5 (20.8%) | $66,875 |
| 2 Earners | 15 (62.5%) | $108,125 |
| 3+ Earners | 0 (0.0%) | $0 |
| Total | 24 (100.0%) | $97,500 |
Household Income in Rentiesville
Household Income Brackets in Rentiesville
With 10 households falling in the category, the $25,000 to $34,999 income range is the most frequent in Rentiesville, accounting for 21.3% of all households.
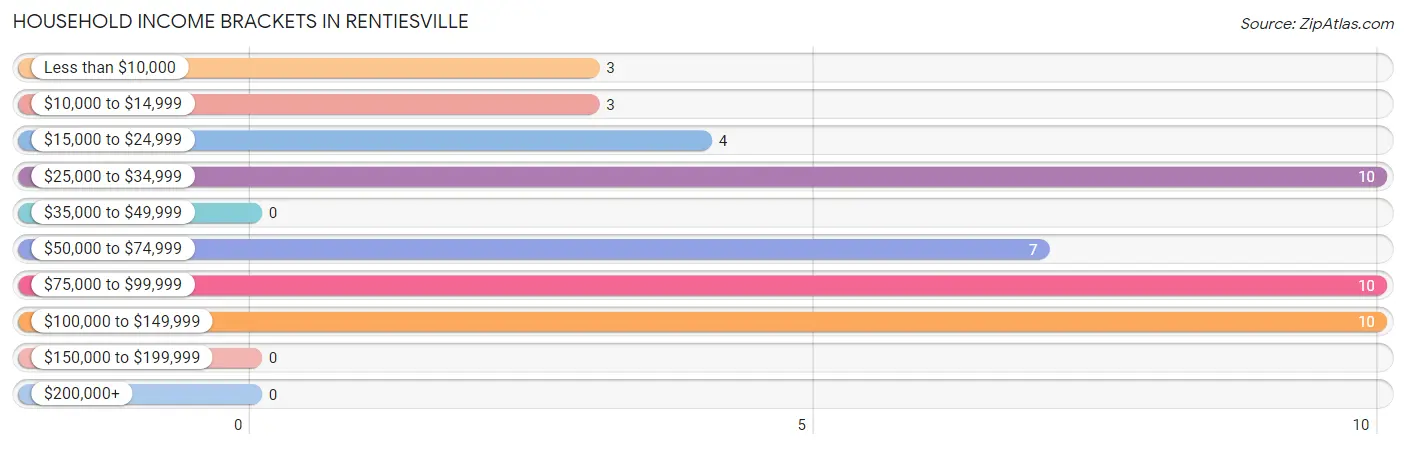
| Income Bracket | # Households | % Households |
| Less than $10,000 | 3 | 6.4% |
| $10,000 to $14,999 | 3 | 6.4% |
| $15,000 to $24,999 | 4 | 8.5% |
| $25,000 to $34,999 | 10 | 21.3% |
| $35,000 to $49,999 | 0 | 0.0% |
| $50,000 to $74,999 | 7 | 14.9% |
| $75,000 to $99,999 | 10 | 21.3% |
| $100,000 to $149,999 | 10 | 21.3% |
| $150,000 to $199,999 | 0 | 0.0% |
| $200,000+ | 0 | 0.0% |
Household Income by Householder Age in Rentiesville
The median household income in Rentiesville is $63,750, with the highest median household income of $83,750 found in the 25 to 44 years age bracket for the primary householder. A total of 9 households (19.2%) fall into this category.
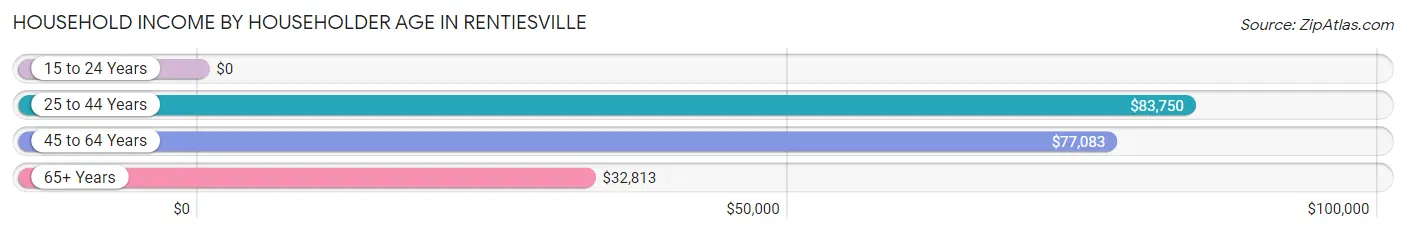
| Income Bracket | # Households | Median Income |
| 15 to 24 Years | 0 (0.0%) | $0 |
| 25 to 44 Years | 9 (19.2%) | $83,750 |
| 45 to 64 Years | 19 (40.4%) | $77,083 |
| 65+ Years | 19 (40.4%) | $32,813 |
| Total | 47 (100.0%) | $63,750 |
Poverty in Rentiesville
Income Below Poverty by Sex and Age in Rentiesville
With 7.8% poverty level for males and 9.1% for females among the residents of Rentiesville, 75 year old and over males and 75 year old and over females are the most vulnerable to poverty, with 3 males (33.3%) and 1 females (100.0%) in their respective age groups living below the poverty level.
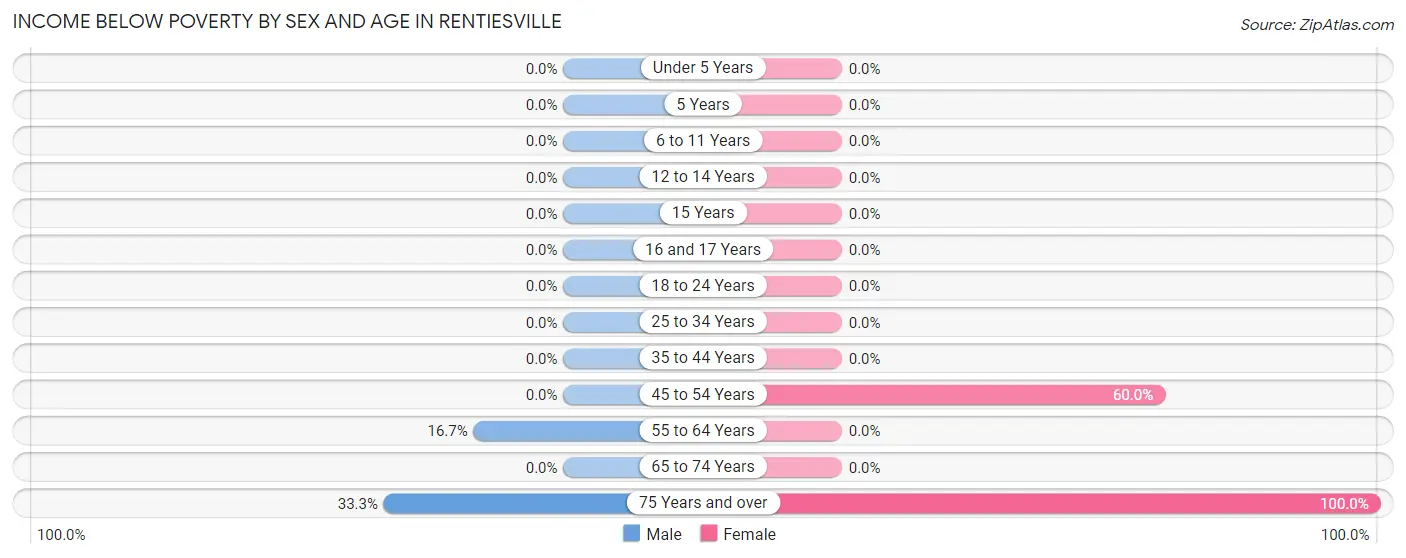
| Age Bracket | Male | Female |
| Under 5 Years | 0 (0.0%) | 0 (0.0%) |
| 5 Years | 0 (0.0%) | 0 (0.0%) |
| 6 to 11 Years | 0 (0.0%) | 0 (0.0%) |
| 12 to 14 Years | 0 (0.0%) | 0 (0.0%) |
| 15 Years | 0 (0.0%) | 0 (0.0%) |
| 16 and 17 Years | 0 (0.0%) | 0 (0.0%) |
| 18 to 24 Years | 0 (0.0%) | 0 (0.0%) |
| 25 to 34 Years | 0 (0.0%) | 0 (0.0%) |
| 35 to 44 Years | 0 (0.0%) | 0 (0.0%) |
| 45 to 54 Years | 0 (0.0%) | 3 (60.0%) |
| 55 to 64 Years | 2 (16.7%) | 0 (0.0%) |
| 65 to 74 Years | 0 (0.0%) | 0 (0.0%) |
| 75 Years and over | 3 (33.3%) | 1 (100.0%) |
| Total | 5 (7.8%) | 4 (9.1%) |
Income Above Poverty by Sex and Age in Rentiesville
According to the poverty statistics in Rentiesville, males aged under 5 years and females aged under 5 years are the age groups that are most secure financially, with 100.0% of males and 100.0% of females in these age groups living above the poverty line.
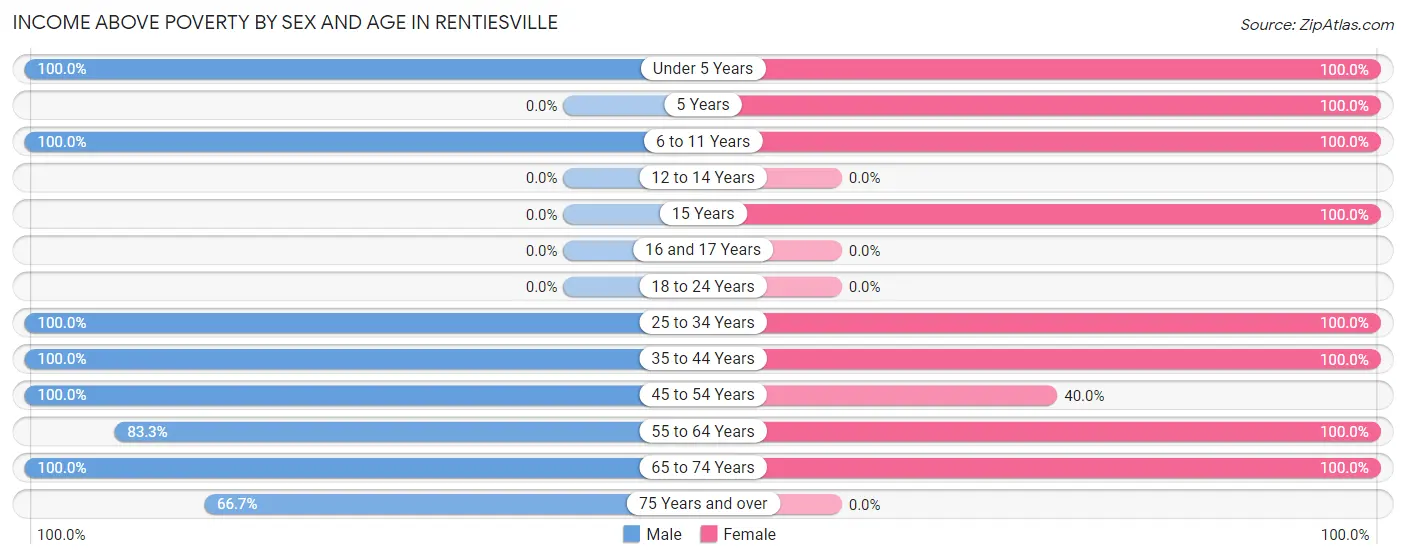
| Age Bracket | Male | Female |
| Under 5 Years | 4 (100.0%) | 8 (100.0%) |
| 5 Years | 0 (0.0%) | 3 (100.0%) |
| 6 to 11 Years | 1 (100.0%) | 3 (100.0%) |
| 12 to 14 Years | 0 (0.0%) | 0 (0.0%) |
| 15 Years | 0 (0.0%) | 1 (100.0%) |
| 16 and 17 Years | 0 (0.0%) | 0 (0.0%) |
| 18 to 24 Years | 0 (0.0%) | 0 (0.0%) |
| 25 to 34 Years | 24 (100.0%) | 4 (100.0%) |
| 35 to 44 Years | 5 (100.0%) | 4 (100.0%) |
| 45 to 54 Years | 2 (100.0%) | 2 (40.0%) |
| 55 to 64 Years | 10 (83.3%) | 10 (100.0%) |
| 65 to 74 Years | 7 (100.0%) | 5 (100.0%) |
| 75 Years and over | 6 (66.7%) | 0 (0.0%) |
| Total | 59 (92.2%) | 40 (90.9%) |
Income Below Poverty Among Married-Couple Families in Rentiesville
The poverty statistics for married-couple families in Rentiesville show that 4.8% or 1 of the total 21 families live below the poverty line. Families with no children have the highest poverty rate of 6.7%, comprising of 1 families. On the other hand, families with 1 or 2 children have the lowest poverty rate of 0.0%, which includes 0 families.
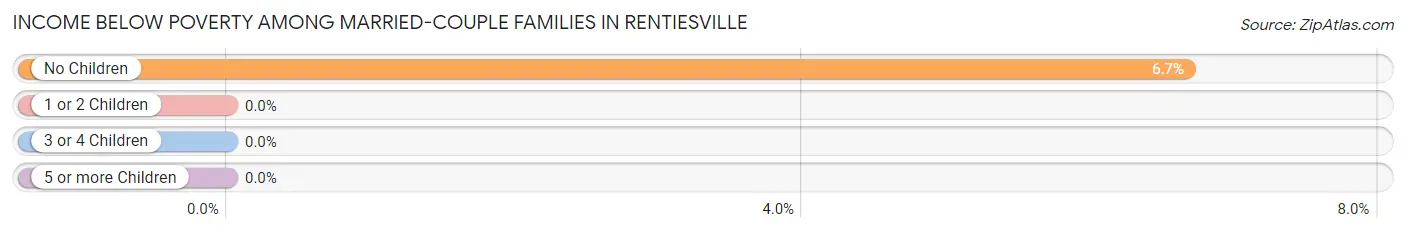
| Children | Above Poverty | Below Poverty |
| No Children | 14 (93.3%) | 1 (6.7%) |
| 1 or 2 Children | 6 (100.0%) | 0 (0.0%) |
| 3 or 4 Children | 0 (0.0%) | 0 (0.0%) |
| 5 or more Children | 0 (0.0%) | 0 (0.0%) |
| Total | 20 (95.2%) | 1 (4.8%) |
Income Below Poverty Among Single-Parent Households in Rentiesville
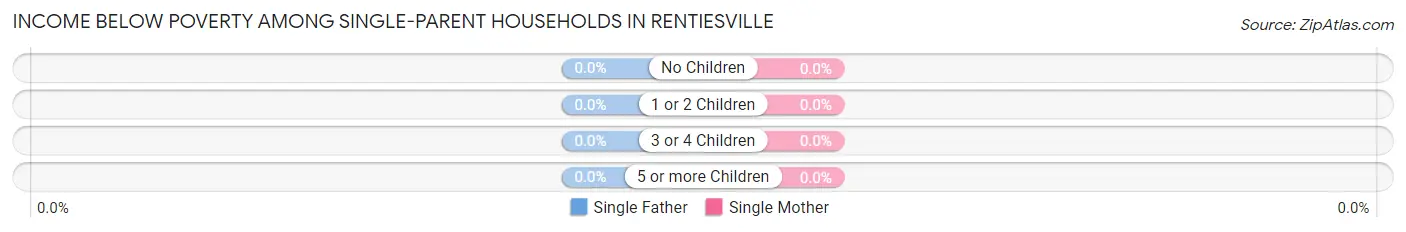
| Children | Single Father | Single Mother |
| No Children | 0 (0.0%) | 0 (0.0%) |
| 1 or 2 Children | 0 (0.0%) | 0 (0.0%) |
| 3 or 4 Children | 0 (0.0%) | 0 (0.0%) |
| 5 or more Children | 0 (0.0%) | 0 (0.0%) |
| Total | 0 (0.0%) | 0 (0.0%) |
Income Below Poverty Among Married-Couple vs Single-Parent Households in Rentiesville
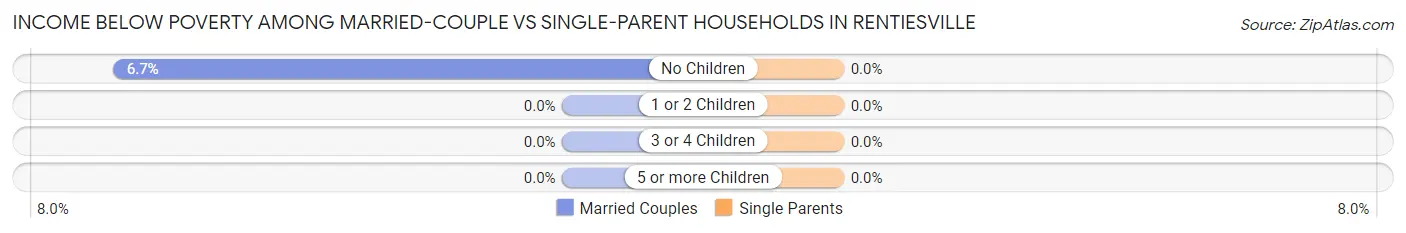
| Children | Married-Couple Families | Single-Parent Households |
| No Children | 1 (6.7%) | 0 (0.0%) |
| 1 or 2 Children | 0 (0.0%) | 0 (0.0%) |
| 3 or 4 Children | 0 (0.0%) | 0 (0.0%) |
| 5 or more Children | 0 (0.0%) | 0 (0.0%) |
| Total | 1 (4.8%) | 0 (0.0%) |
Race in Rentiesville
The most populous races in Rentiesville are Black / African American (58 | 53.7%), Two or more Races (24 | 22.2%), and White / Caucasian (23 | 21.3%).
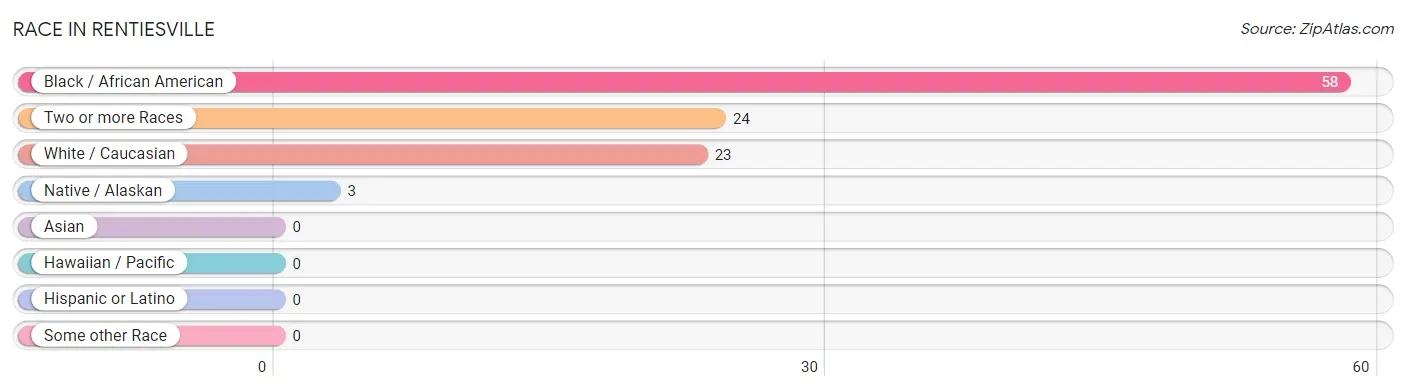
| Race | # Population | % Population |
| Asian | 0 | 0.0% |
| Black / African American | 58 | 53.7% |
| Hawaiian / Pacific | 0 | 0.0% |
| Hispanic or Latino | 0 | 0.0% |
| Native / Alaskan | 3 | 2.8% |
| White / Caucasian | 23 | 21.3% |
| Two or more Races | 24 | 22.2% |
| Some other Race | 0 | 0.0% |
| Total | 108 | 100.0% |
Ancestry in Rentiesville
The most populous ancestries reported in Rentiesville are Cherokee (14 | 13.0%), Creek (8 | 7.4%), German (5 | 4.6%), Choctaw (4 | 3.7%), and English (4 | 3.7%), together accounting for 32.4% of all Rentiesville residents.
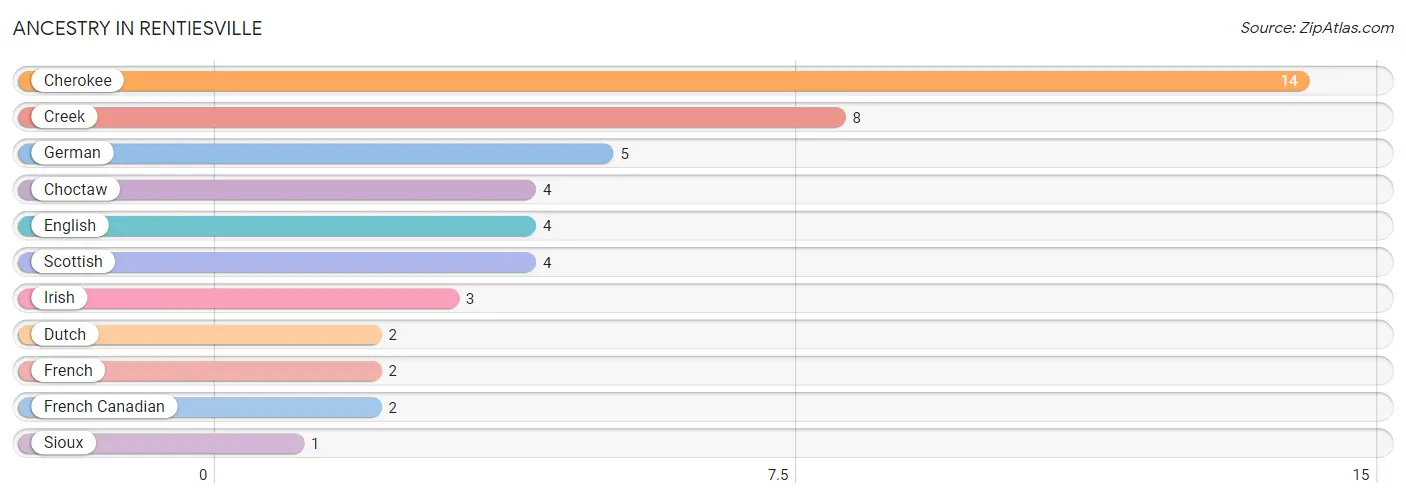
| Ancestry | # Population | % Population |
| Cherokee | 14 | 13.0% |
| Choctaw | 4 | 3.7% |
| Creek | 8 | 7.4% |
| Dutch | 2 | 1.8% |
| English | 4 | 3.7% |
| French | 2 | 1.8% |
| French Canadian | 2 | 1.8% |
| German | 5 | 4.6% |
| Irish | 3 | 2.8% |
| Scottish | 4 | 3.7% |
| Sioux | 1 | 0.9% | View All 11 Rows |
Immigrants in Rentiesville

| Immigration Origin | # Population | % Population | View All 0 Rows |
Sex and Age in Rentiesville
Sex and Age in Rentiesville
The most populous age groups in Rentiesville are 25 to 29 Years (21 | 32.8%) for men and Under 5 Years (8 | 18.2%) for women.
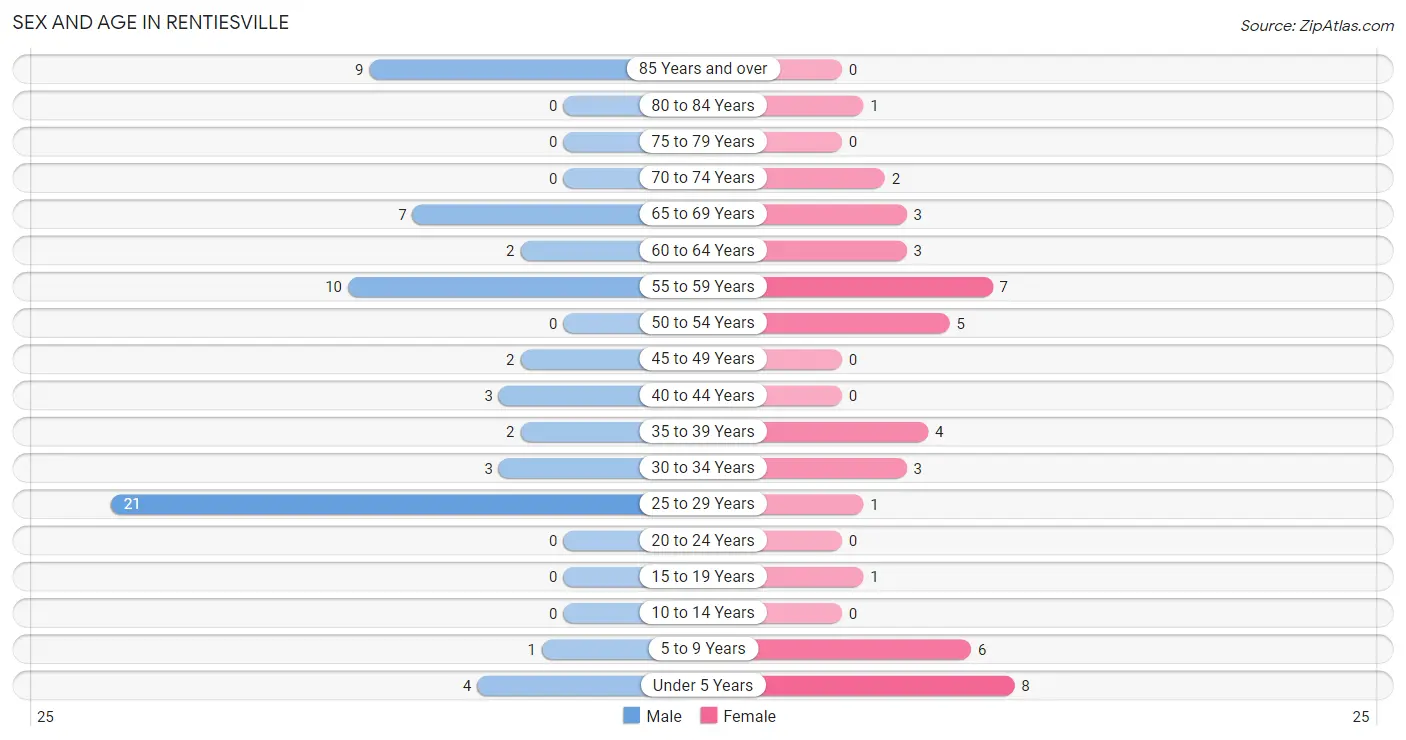
| Age Bracket | Male | Female |
| Under 5 Years | 4 (6.2%) | 8 (18.2%) |
| 5 to 9 Years | 1 (1.6%) | 6 (13.6%) |
| 10 to 14 Years | 0 (0.0%) | 0 (0.0%) |
| 15 to 19 Years | 0 (0.0%) | 1 (2.3%) |
| 20 to 24 Years | 0 (0.0%) | 0 (0.0%) |
| 25 to 29 Years | 21 (32.8%) | 1 (2.3%) |
| 30 to 34 Years | 3 (4.7%) | 3 (6.8%) |
| 35 to 39 Years | 2 (3.1%) | 4 (9.1%) |
| 40 to 44 Years | 3 (4.7%) | 0 (0.0%) |
| 45 to 49 Years | 2 (3.1%) | 0 (0.0%) |
| 50 to 54 Years | 0 (0.0%) | 5 (11.4%) |
| 55 to 59 Years | 10 (15.6%) | 7 (15.9%) |
| 60 to 64 Years | 2 (3.1%) | 3 (6.8%) |
| 65 to 69 Years | 7 (10.9%) | 3 (6.8%) |
| 70 to 74 Years | 0 (0.0%) | 2 (4.5%) |
| 75 to 79 Years | 0 (0.0%) | 0 (0.0%) |
| 80 to 84 Years | 0 (0.0%) | 1 (2.3%) |
| 85 Years and over | 9 (14.1%) | 0 (0.0%) |
| Total | 64 (100.0%) | 44 (100.0%) |
Families and Households in Rentiesville
Median Family Size in Rentiesville
The median family size in Rentiesville is 3.50 persons per family, with married-couple families (21 | 87.5%) accounting for the largest median family size of 3.57 persons per family. On the other hand, single male/father families (1 | 4.2%) represent the smallest median family size with 3.00 persons per family.
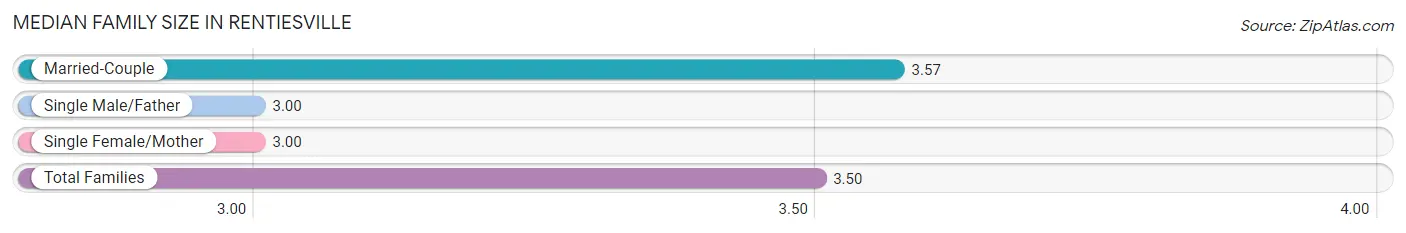
| Family Type | # Families | Family Size |
| Married-Couple | 21 (87.5%) | 3.57 |
| Single Male/Father | 1 (4.2%) | 3.00 |
| Single Female/Mother | 2 (8.3%) | 3.00 |
| Total Families | 24 (100.0%) | 3.50 |
Median Household Size in Rentiesville
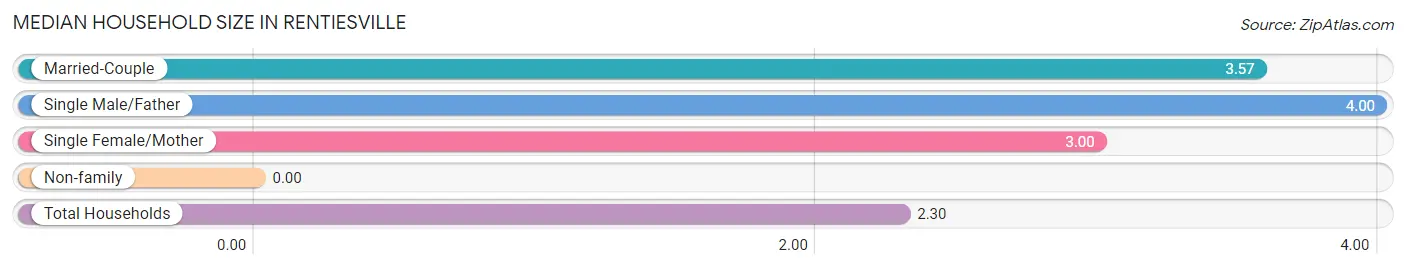
| Household Type | # Households | Household Size |
| Married-Couple | 21 (44.7%) | 3.57 |
| Single Male/Father | 1 (2.1%) | 4.00 |
| Single Female/Mother | 2 (4.3%) | 3.00 |
| Non-family | 23 (48.9%) | - |
| Total Households | 47 (100.0%) | 2.30 |
Household Size by Marriage Status in Rentiesville
Out of a total of 47 households in Rentiesville, 24 (51.1%) are family households, while 23 (48.9%) are nonfamily households. The most numerous type of family households are 2-person households, comprising 13, and the most common type of nonfamily households are 1-person households, comprising 23.
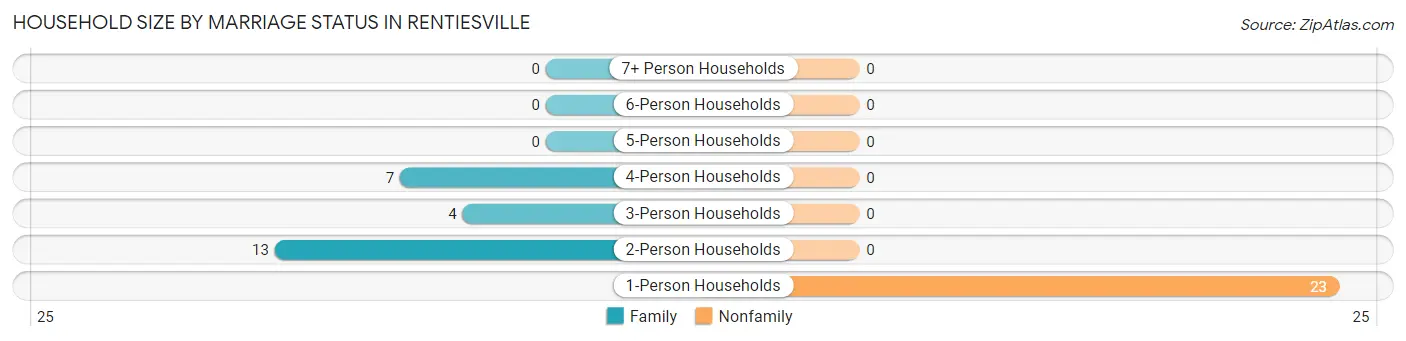
| Household Size | Family Households | Nonfamily Households |
| 1-Person Households | - | 23 (48.9%) |
| 2-Person Households | 13 (27.7%) | 0 (0.0%) |
| 3-Person Households | 4 (8.5%) | 0 (0.0%) |
| 4-Person Households | 7 (14.9%) | 0 (0.0%) |
| 5-Person Households | 0 (0.0%) | 0 (0.0%) |
| 6-Person Households | 0 (0.0%) | 0 (0.0%) |
| 7+ Person Households | 0 (0.0%) | 0 (0.0%) |
| Total | 24 (51.1%) | 23 (48.9%) |
Female Fertility in Rentiesville
Fertility by Age in Rentiesville
Average fertility rate in Rentiesville is 214.0 births per 1,000 women. Women in the age bracket of 20 to 34 years have the highest fertility rate with 250.0 births per 1,000 women. Women in the age bracket of 35 to 50 years acount for 66.7% of all women with births.
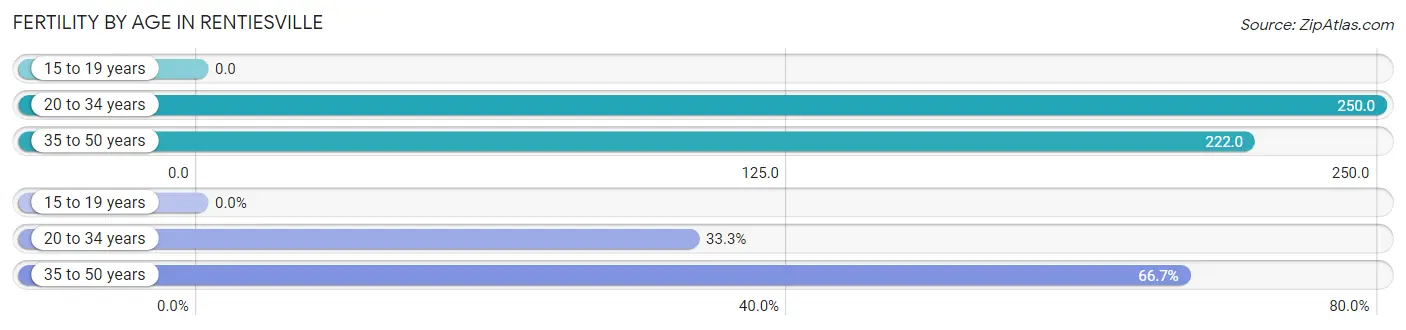
| Age Bracket | Women with Births | Births / 1,000 Women |
| 15 to 19 years | 0 (0.0%) | 0.0 |
| 20 to 34 years | 1 (33.3%) | 250.0 |
| 35 to 50 years | 2 (66.7%) | 222.0 |
| Total | 3 (100.0%) | 214.0 |
Fertility by Age by Marriage Status in Rentiesville
66.7% of women with births (3) in Rentiesville are married. The highest percentage of unmarried women with births falls into 20 to 34 years age bracket with 100.0% of them unmarried at the time of birth, while the lowest percentage of unmarried women with births belong to 35 to 50 years age bracket with 0.0% of them unmarried.
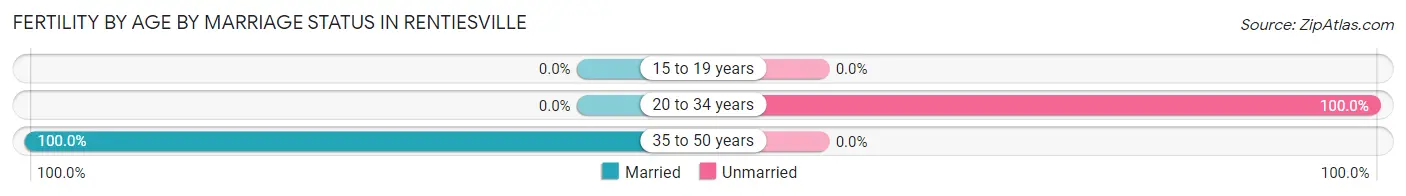
| Age Bracket | Married | Unmarried |
| 15 to 19 years | 0 (0.0%) | 0 (0.0%) |
| 20 to 34 years | 0 (0.0%) | 1 (100.0%) |
| 35 to 50 years | 2 (100.0%) | 0 (0.0%) |
| Total | 2 (66.7%) | 1 (33.3%) |
Fertility by Education in Rentiesville
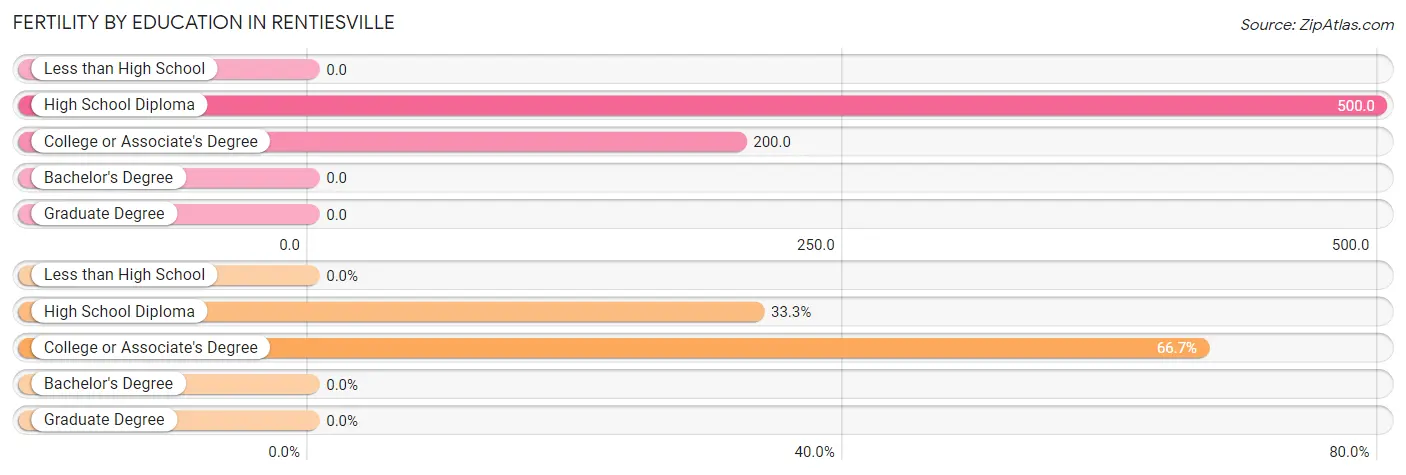
| Educational Attainment | Women with Births | Births / 1,000 Women |
| Less than High School | 0 (0.0%) | 0.0 |
| High School Diploma | 1 (33.3%) | 500.0 |
| College or Associate's Degree | 2 (66.7%) | 200.0 |
| Bachelor's Degree | 0 (0.0%) | 0.0 |
| Graduate Degree | 0 (0.0%) | 0.0 |
| Total | 3 (100.0%) | 214.0 |
Fertility by Education by Marriage Status in Rentiesville
33.3% of women with births in Rentiesville are unmarried. Women with the educational attainment of college or associate's degree are most likely to be married with 100.0% of them married at childbirth, while women with the educational attainment of high school diploma are least likely to be married with 100.0% of them unmarried at childbirth.
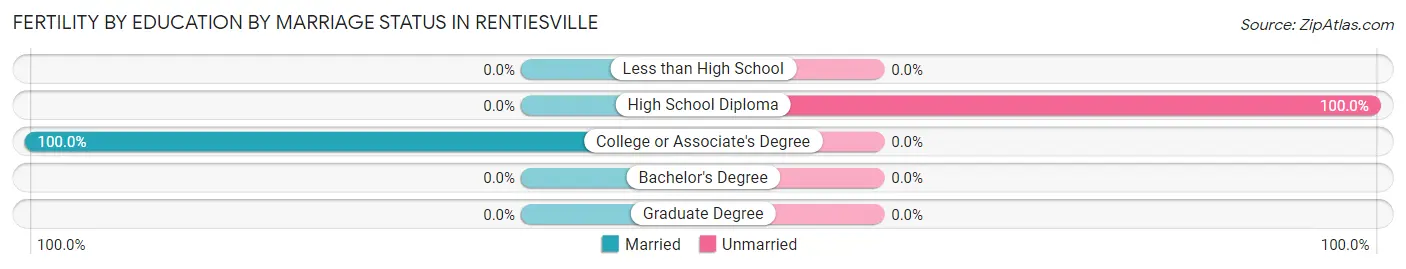
| Educational Attainment | Married | Unmarried |
| Less than High School | 0 (0.0%) | 0 (0.0%) |
| High School Diploma | 0 (0.0%) | 1 (100.0%) |
| College or Associate's Degree | 2 (100.0%) | 0 (0.0%) |
| Bachelor's Degree | 0 (0.0%) | 0 (0.0%) |
| Graduate Degree | 0 (0.0%) | 0 (0.0%) |
| Total | 2 (66.7%) | 1 (33.3%) |
Employment Characteristics in Rentiesville
Employment by Class of Employer in Rentiesville
Among the 32 employed individuals in Rentiesville, private company employees (24 | 75.0%), state government employees (3 | 9.4%), and self-employed (not incorporated) (2 | 6.2%) make up the most common classes of employment.
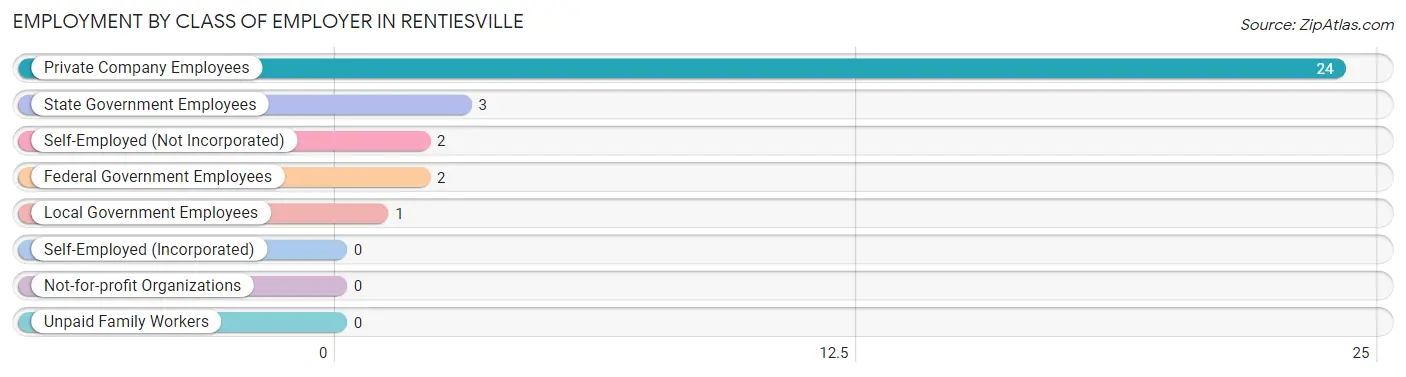
| Employer Class | # Employees | % Employees |
| Private Company Employees | 24 | 75.0% |
| Self-Employed (Incorporated) | 0 | 0.0% |
| Self-Employed (Not Incorporated) | 2 | 6.2% |
| Not-for-profit Organizations | 0 | 0.0% |
| Local Government Employees | 1 | 3.1% |
| State Government Employees | 3 | 9.4% |
| Federal Government Employees | 2 | 6.2% |
| Unpaid Family Workers | 0 | 0.0% |
| Total | 32 | 100.0% |
Employment Status by Age in Rentiesville
According to the labor force statistics for Rentiesville, out of the total population over 16 years of age (88), 60.2% or 53 individuals are in the labor force, with 3.8% or 2 of them unemployed. The age group with the highest labor force participation rate is 25 to 29 years, with 100.0% or 22 individuals in the labor force. Within the labor force, the 65 to 74 years age range has the highest percentage of unemployed individuals, with 33.3% or 2 of them being unemployed.
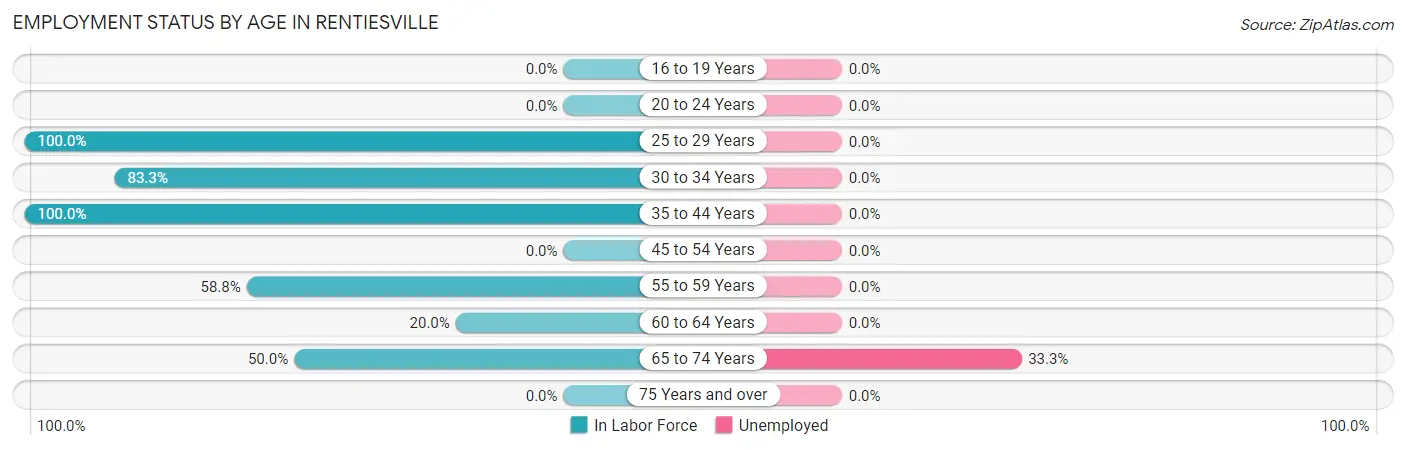
| Age Bracket | In Labor Force | Unemployed |
| 16 to 19 Years | 0 (0.0%) | 0 (0.0%) |
| 20 to 24 Years | 0 (0.0%) | 0 (0.0%) |
| 25 to 29 Years | 22 (100.0%) | 0 (0.0%) |
| 30 to 34 Years | 5 (83.3%) | 0 (0.0%) |
| 35 to 44 Years | 9 (100.0%) | 0 (0.0%) |
| 45 to 54 Years | 0 (0.0%) | 0 (0.0%) |
| 55 to 59 Years | 10 (58.8%) | 0 (0.0%) |
| 60 to 64 Years | 1 (20.0%) | 0 (0.0%) |
| 65 to 74 Years | 6 (50.0%) | 2 (33.3%) |
| 75 Years and over | 0 (0.0%) | 0 (0.0%) |
| Total | 53 (60.2%) | 2 (3.8%) |
Employment Status by Educational Attainment in Rentiesville
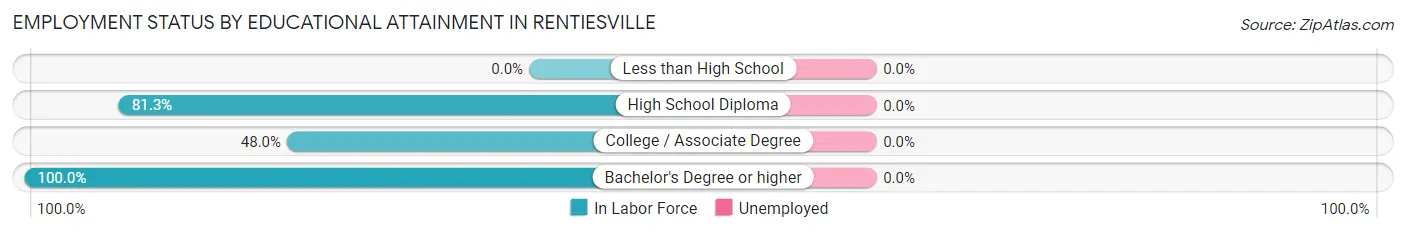
| Educational Attainment | In Labor Force | Unemployed |
| Less than High School | 0 (0.0%) | 0 (0.0%) |
| High School Diploma | 26 (81.3%) | 0 (0.0%) |
| College / Associate Degree | 12 (48.0%) | 0 (0.0%) |
| Bachelor's Degree or higher | 9 (100.0%) | 0 (0.0%) |
| Total | 47 (71.2%) | 0 (0.0%) |
Employment Occupations by Sex in Rentiesville
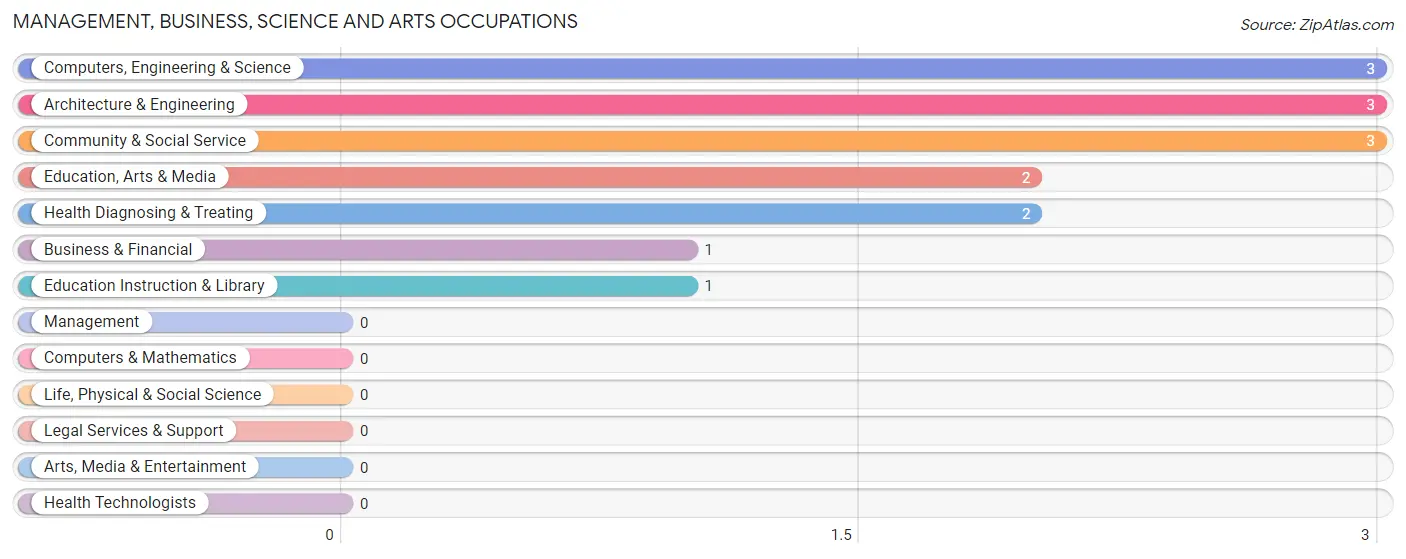
Management, Business, Science and Arts Occupations
The most common Management, Business, Science and Arts occupations in Rentiesville are Computers, Engineering & Science (3 | 5.9%), Architecture & Engineering (3 | 5.9%), Community & Social Service (3 | 5.9%), Education, Arts & Media (2 | 3.9%), and Health Diagnosing & Treating (2 | 3.9%).
Management, Business, Science and Arts Occupations by Sex
Within the Management, Business, Science and Arts occupations in Rentiesville, the most male-oriented occupations are Computers, Engineering & Science (100.0%), Architecture & Engineering (100.0%), and Education, Arts & Media (100.0%), while the most female-oriented occupations are Business & Financial (100.0%), Education Instruction & Library (100.0%), and Health Diagnosing & Treating (100.0%).
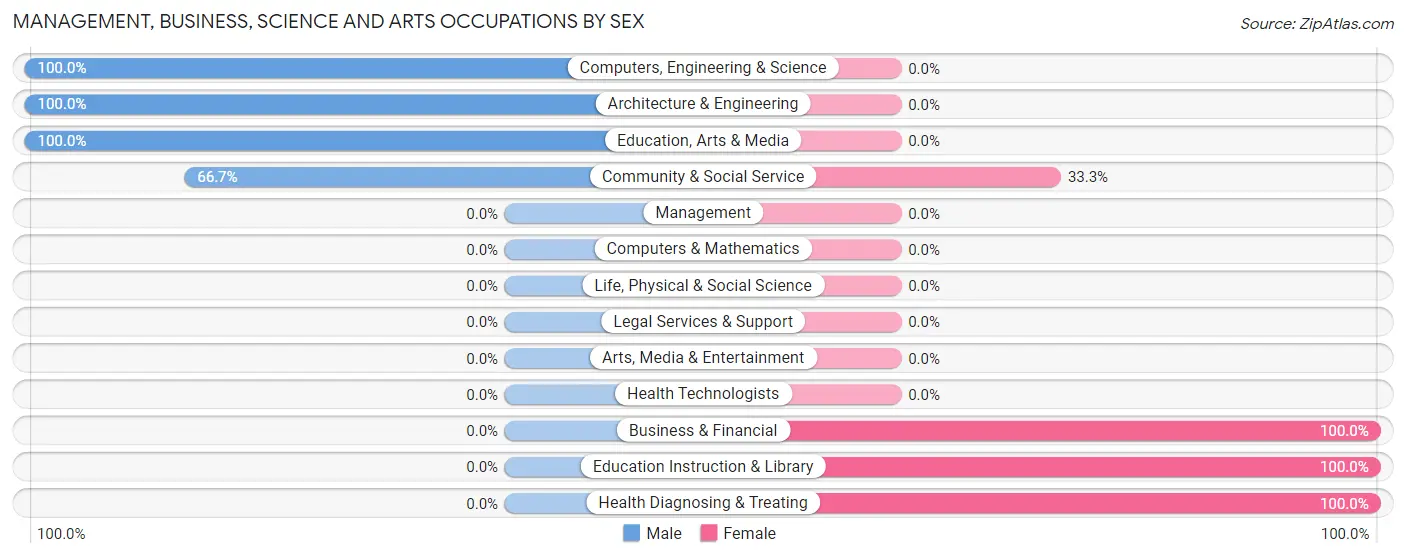
| Occupation | Male | Female |
| Management | 0 (0.0%) | 0 (0.0%) |
| Business & Financial | 0 (0.0%) | 1 (100.0%) |
| Computers, Engineering & Science | 3 (100.0%) | 0 (0.0%) |
| Computers & Mathematics | 0 (0.0%) | 0 (0.0%) |
| Architecture & Engineering | 3 (100.0%) | 0 (0.0%) |
| Life, Physical & Social Science | 0 (0.0%) | 0 (0.0%) |
| Community & Social Service | 2 (66.7%) | 1 (33.3%) |
| Education, Arts & Media | 2 (100.0%) | 0 (0.0%) |
| Legal Services & Support | 0 (0.0%) | 0 (0.0%) |
| Education Instruction & Library | 0 (0.0%) | 1 (100.0%) |
| Arts, Media & Entertainment | 0 (0.0%) | 0 (0.0%) |
| Health Diagnosing & Treating | 0 (0.0%) | 2 (100.0%) |
| Health Technologists | 0 (0.0%) | 0 (0.0%) |
| Total (Category) | 5 (55.6%) | 4 (44.4%) |
| Total (Overall) | 36 (70.6%) | 15 (29.4%) |
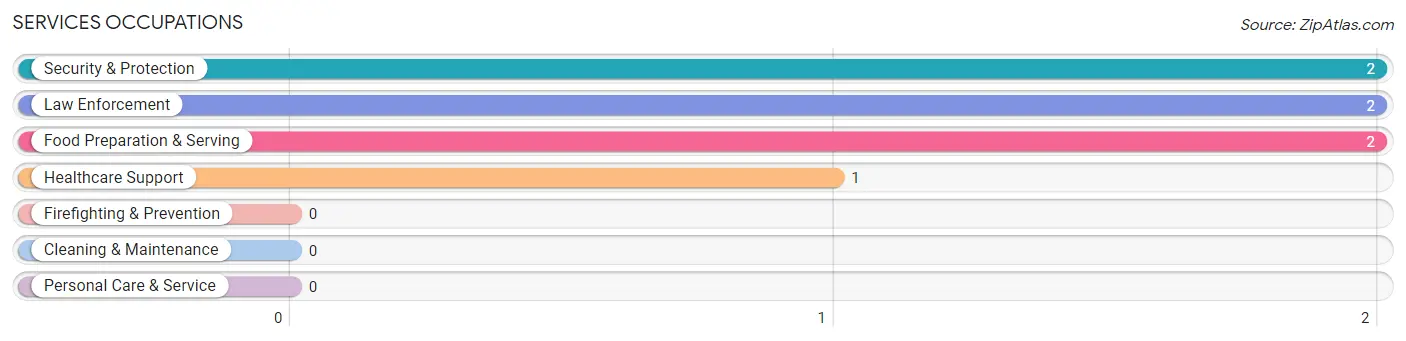
Services Occupations
The most common Services occupations in Rentiesville are Security & Protection (2 | 3.9%), Law Enforcement (2 | 3.9%), Food Preparation & Serving (2 | 3.9%), and Healthcare Support (1 | 2.0%).
Services Occupations by Sex
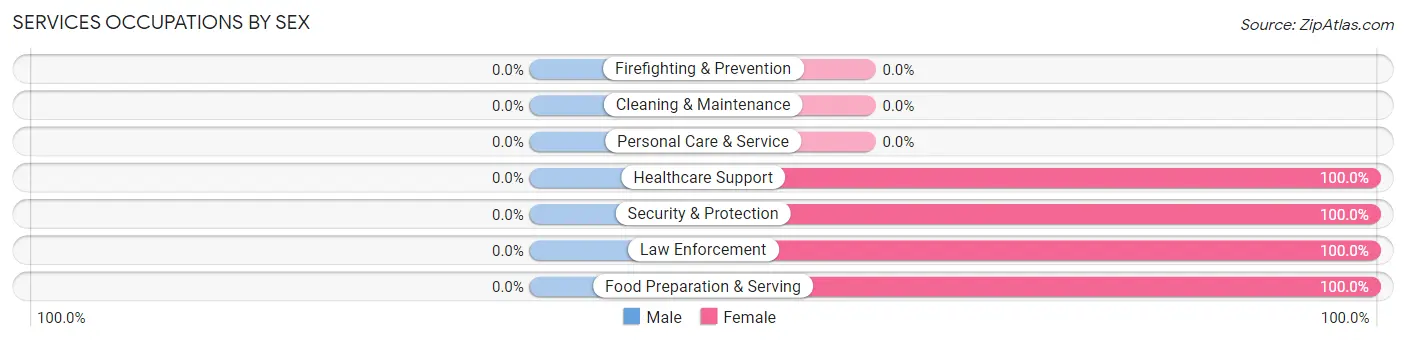
| Occupation | Male | Female |
| Healthcare Support | 0 (0.0%) | 1 (100.0%) |
| Security & Protection | 0 (0.0%) | 2 (100.0%) |
| Firefighting & Prevention | 0 (0.0%) | 0 (0.0%) |
| Law Enforcement | 0 (0.0%) | 2 (100.0%) |
| Food Preparation & Serving | 0 (0.0%) | 2 (100.0%) |
| Cleaning & Maintenance | 0 (0.0%) | 0 (0.0%) |
| Personal Care & Service | 0 (0.0%) | 0 (0.0%) |
| Total (Category) | 0 (0.0%) | 5 (100.0%) |
| Total (Overall) | 36 (70.6%) | 15 (29.4%) |
Sales and Office Occupations
The most common Sales and Office occupations in Rentiesville are Sales & Related (5 | 9.8%), and Office & Administration (2 | 3.9%).
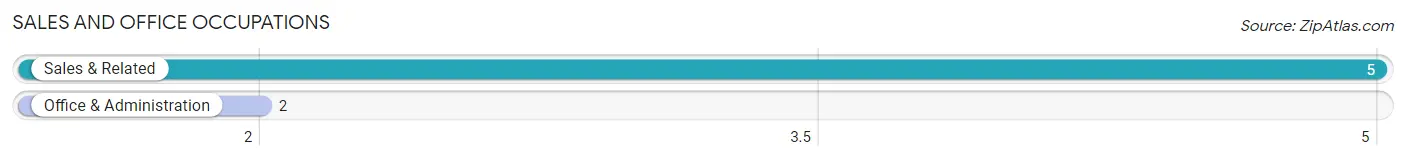
Sales and Office Occupations by Sex
| Occupation | Male | Female |
| Sales & Related | 3 (60.0%) | 2 (40.0%) |
| Office & Administration | 0 (0.0%) | 2 (100.0%) |
| Total (Category) | 3 (42.9%) | 4 (57.1%) |
| Total (Overall) | 36 (70.6%) | 15 (29.4%) |
Natural Resources, Construction and Maintenance Occupations
The most common Natural Resources, Construction and Maintenance occupations in Rentiesville are Construction & Extraction (19 | 37.2%), and Installation, Maintenance & Repair (1 | 2.0%).
Natural Resources, Construction and Maintenance Occupations by Sex
| Occupation | Male | Female |
| Farming, Fishing & Forestry | 0 (0.0%) | 0 (0.0%) |
| Construction & Extraction | 19 (100.0%) | 0 (0.0%) |
| Installation, Maintenance & Repair | 1 (100.0%) | 0 (0.0%) |
| Total (Category) | 20 (100.0%) | 0 (0.0%) |
| Total (Overall) | 36 (70.6%) | 15 (29.4%) |
Production, Transportation and Moving Occupations
The most common Production, Transportation and Moving occupations in Rentiesville are Production (6 | 11.8%), and Material Moving (4 | 7.8%).
Production, Transportation and Moving Occupations by Sex
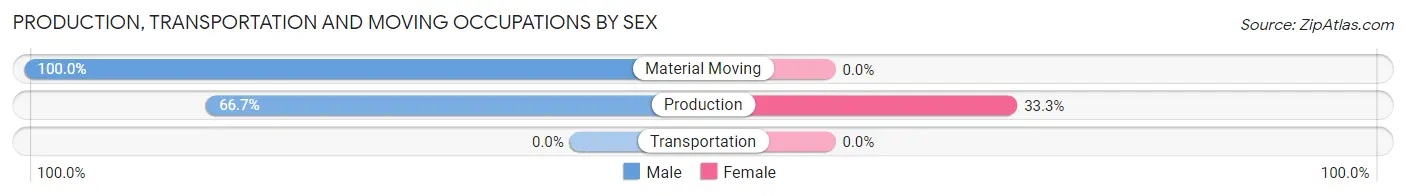
| Occupation | Male | Female |
| Production | 4 (66.7%) | 2 (33.3%) |
| Transportation | 0 (0.0%) | 0 (0.0%) |
| Material Moving | 4 (100.0%) | 0 (0.0%) |
| Total (Category) | 8 (80.0%) | 2 (20.0%) |
| Total (Overall) | 36 (70.6%) | 15 (29.4%) |
Employment Industries by Sex in Rentiesville
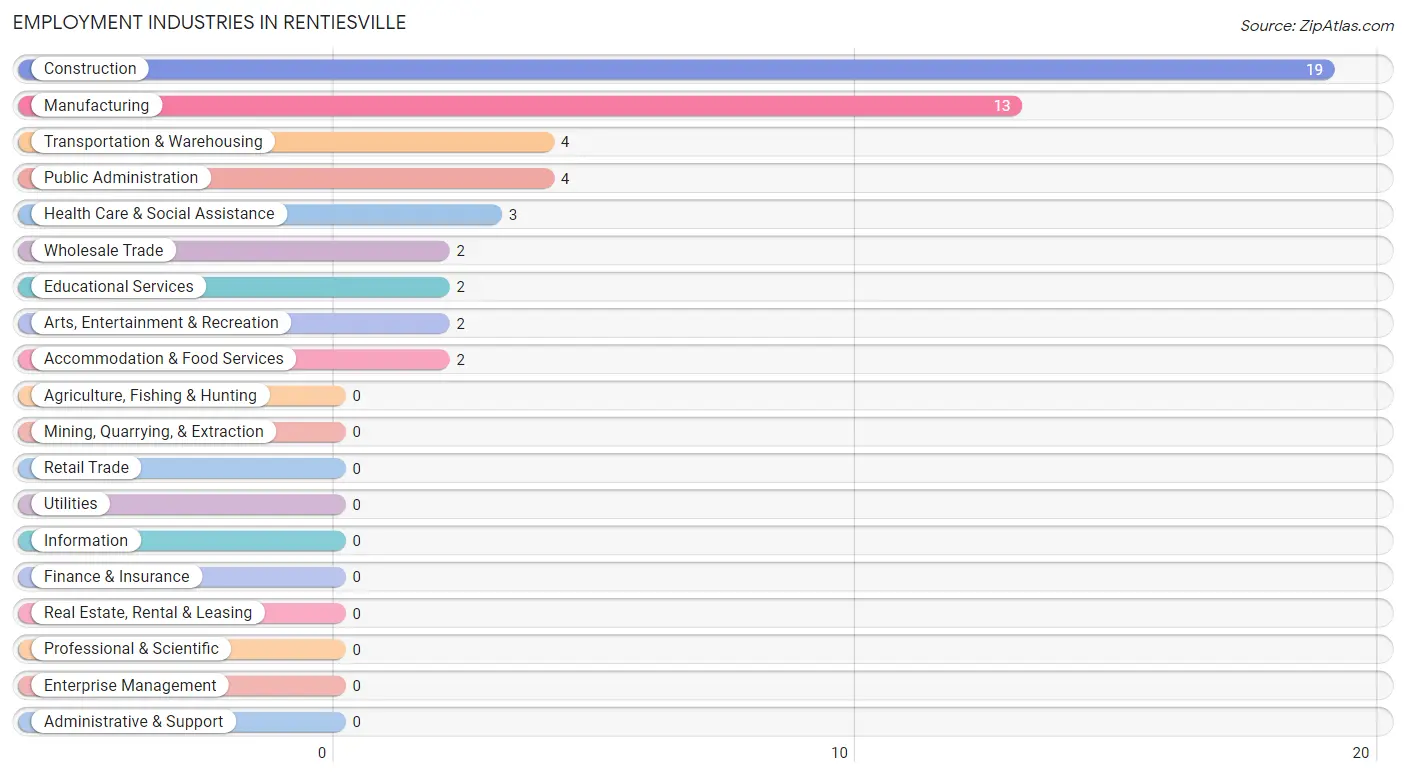
Employment Industries in Rentiesville
The major employment industries in Rentiesville include Construction (19 | 37.2%), Manufacturing (13 | 25.5%), Transportation & Warehousing (4 | 7.8%), Public Administration (4 | 7.8%), and Health Care & Social Assistance (3 | 5.9%).
Employment Industries by Sex in Rentiesville
The Rentiesville industries that see more men than women are Construction (100.0%), Transportation & Warehousing (100.0%), and Manufacturing (84.6%), whereas the industries that tend to have a higher number of women are Wholesale Trade (100.0%), Educational Services (100.0%), and Health Care & Social Assistance (100.0%).
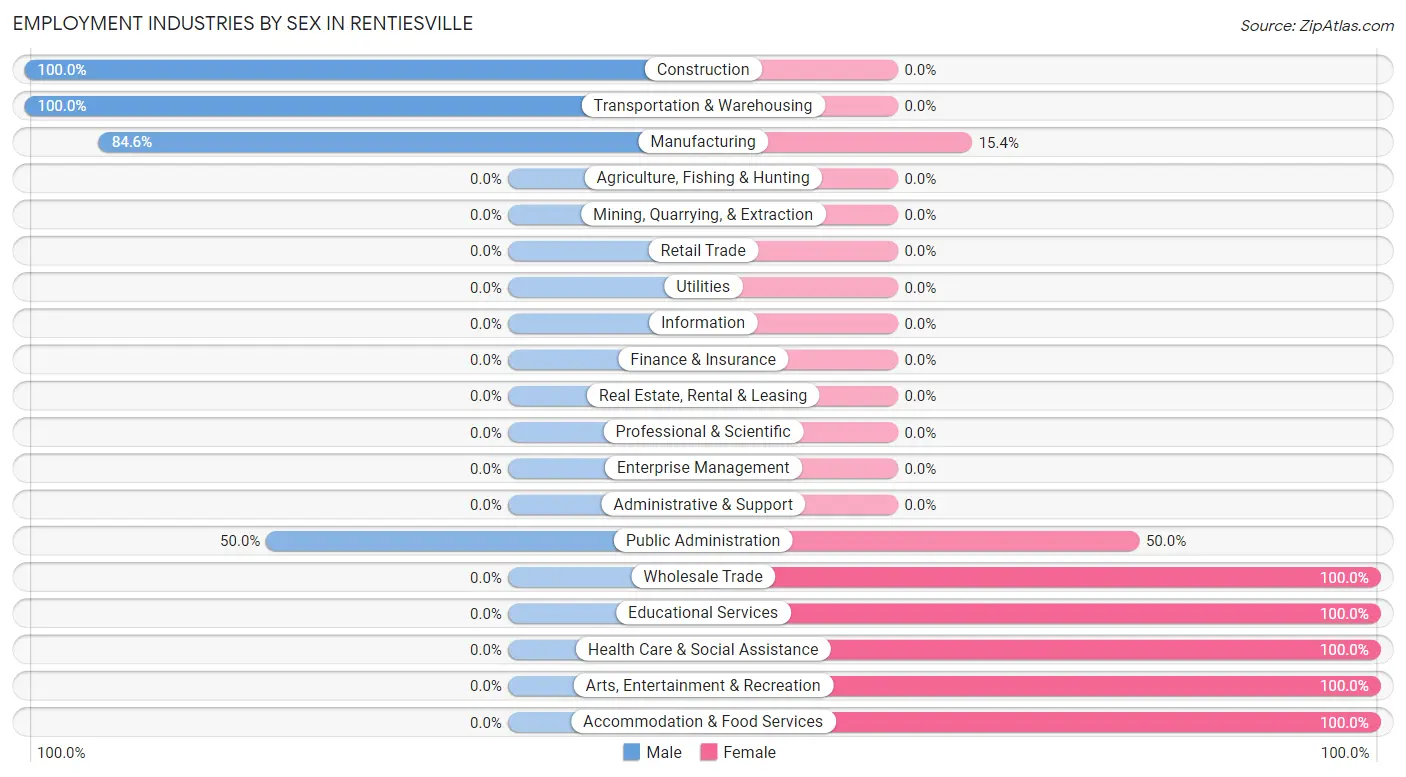
| Industry | Male | Female |
| Agriculture, Fishing & Hunting | 0 (0.0%) | 0 (0.0%) |
| Mining, Quarrying, & Extraction | 0 (0.0%) | 0 (0.0%) |
| Construction | 19 (100.0%) | 0 (0.0%) |
| Manufacturing | 11 (84.6%) | 2 (15.4%) |
| Wholesale Trade | 0 (0.0%) | 2 (100.0%) |
| Retail Trade | 0 (0.0%) | 0 (0.0%) |
| Transportation & Warehousing | 4 (100.0%) | 0 (0.0%) |
| Utilities | 0 (0.0%) | 0 (0.0%) |
| Information | 0 (0.0%) | 0 (0.0%) |
| Finance & Insurance | 0 (0.0%) | 0 (0.0%) |
| Real Estate, Rental & Leasing | 0 (0.0%) | 0 (0.0%) |
| Professional & Scientific | 0 (0.0%) | 0 (0.0%) |
| Enterprise Management | 0 (0.0%) | 0 (0.0%) |
| Administrative & Support | 0 (0.0%) | 0 (0.0%) |
| Educational Services | 0 (0.0%) | 2 (100.0%) |
| Health Care & Social Assistance | 0 (0.0%) | 3 (100.0%) |
| Arts, Entertainment & Recreation | 0 (0.0%) | 2 (100.0%) |
| Accommodation & Food Services | 0 (0.0%) | 2 (100.0%) |
| Public Administration | 2 (50.0%) | 2 (50.0%) |
| Total | 36 (70.6%) | 15 (29.4%) |
Education in Rentiesville
School Enrollment in Rentiesville
The most common levels of schooling among the 17 students in Rentiesville are high school (5 | 29.4%), college / undergraduate (5 | 29.4%), and elementary school (4 | 23.5%).
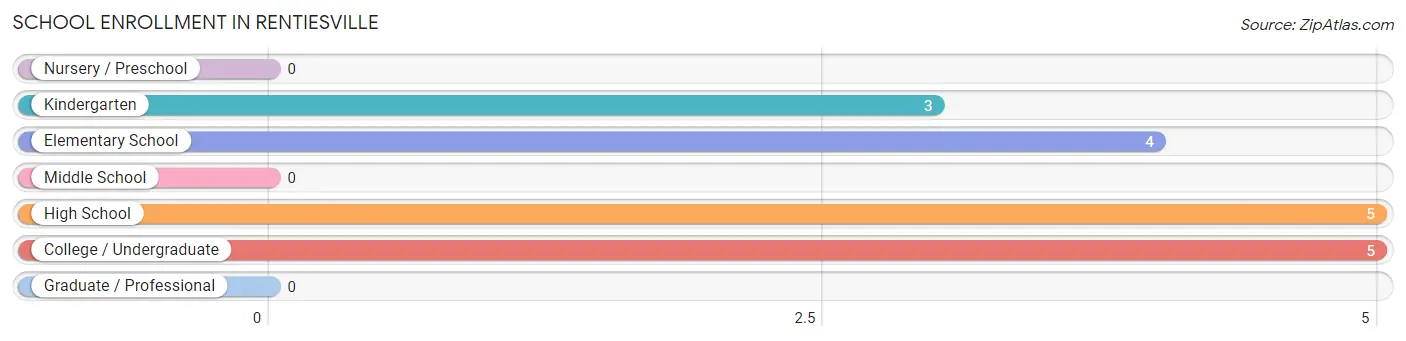
| School Level | # Students | % Students |
| Nursery / Preschool | 0 | 0.0% |
| Kindergarten | 3 | 17.6% |
| Elementary School | 4 | 23.5% |
| Middle School | 0 | 0.0% |
| High School | 5 | 29.4% |
| College / Undergraduate | 5 | 29.4% |
| Graduate / Professional | 0 | 0.0% |
| Total | 17 | 100.0% |
School Enrollment by Age by Funding Source in Rentiesville
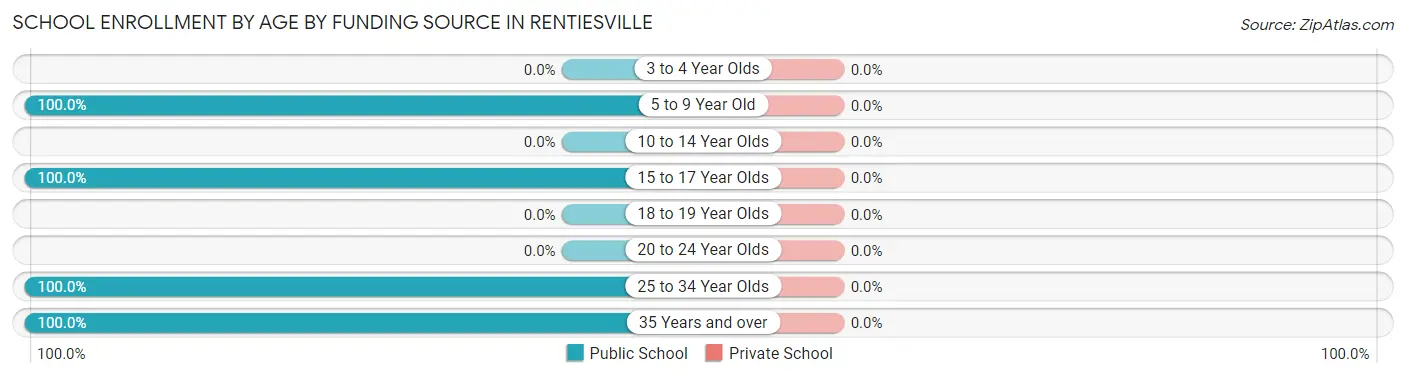
| Age Bracket | Public School | Private School |
| 3 to 4 Year Olds | 0 (0.0%) | 0 (0.0%) |
| 5 to 9 Year Old | 7 (100.0%) | 0 (0.0%) |
| 10 to 14 Year Olds | 0 (0.0%) | 0 (0.0%) |
| 15 to 17 Year Olds | 1 (100.0%) | 0 (0.0%) |
| 18 to 19 Year Olds | 0 (0.0%) | 0 (0.0%) |
| 20 to 24 Year Olds | 0 (0.0%) | 0 (0.0%) |
| 25 to 34 Year Olds | 3 (100.0%) | 0 (0.0%) |
| 35 Years and over | 6 (100.0%) | 0 (0.0%) |
| Total | 17 (100.0%) | 0 (0.0%) |
Educational Attainment by Field of Study in Rentiesville
Education (4 | 30.8%), bio, nature & agricultural (3 | 23.1%), business (3 | 23.1%), psychology (2 | 15.4%), and physical & health sciences (1 | 7.7%) are the most common fields of study among 13 individuals in Rentiesville who have obtained a bachelor's degree or higher.
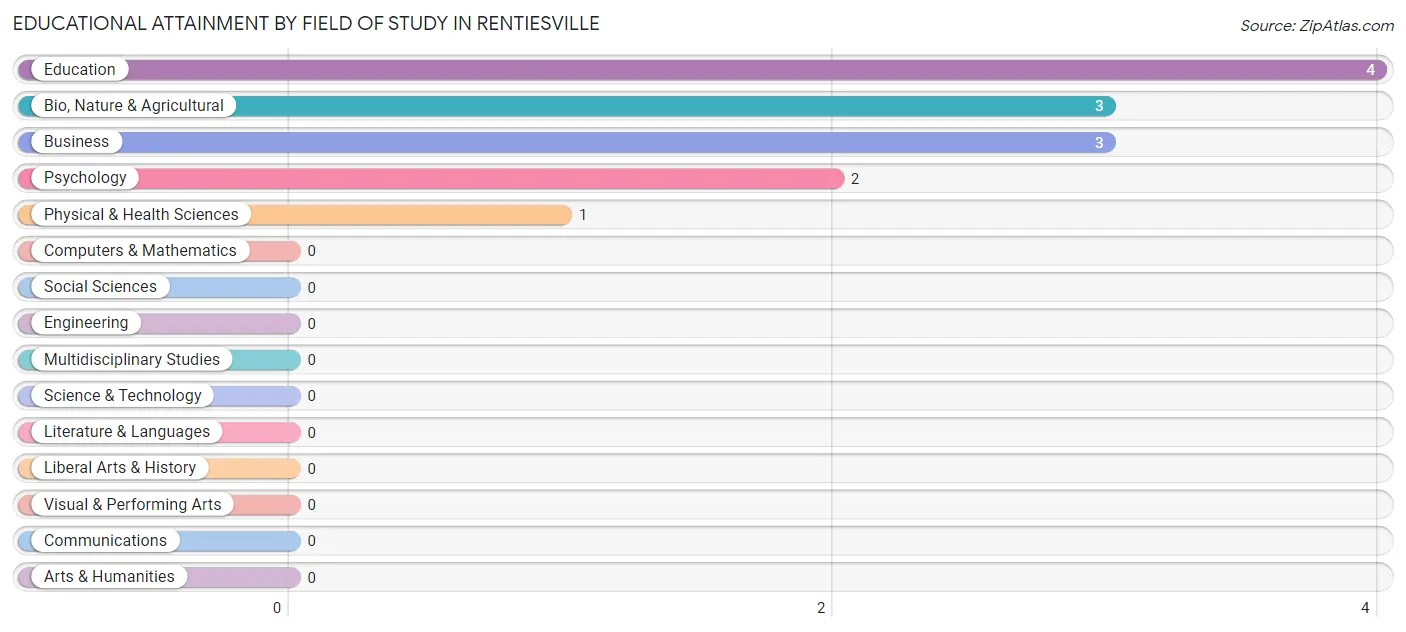
| Field of Study | # Graduates | % Graduates |
| Computers & Mathematics | 0 | 0.0% |
| Bio, Nature & Agricultural | 3 | 23.1% |
| Physical & Health Sciences | 1 | 7.7% |
| Psychology | 2 | 15.4% |
| Social Sciences | 0 | 0.0% |
| Engineering | 0 | 0.0% |
| Multidisciplinary Studies | 0 | 0.0% |
| Science & Technology | 0 | 0.0% |
| Business | 3 | 23.1% |
| Education | 4 | 30.8% |
| Literature & Languages | 0 | 0.0% |
| Liberal Arts & History | 0 | 0.0% |
| Visual & Performing Arts | 0 | 0.0% |
| Communications | 0 | 0.0% |
| Arts & Humanities | 0 | 0.0% |
| Total | 13 | 100.0% |
Transportation & Commute in Rentiesville
Vehicle Availability by Sex in Rentiesville
The most prevalent vehicle ownership categories in Rentiesville are males with 3 vehicles (8, accounting for 47.1%) and females with 3 vehicles (6, making up 53.3%).
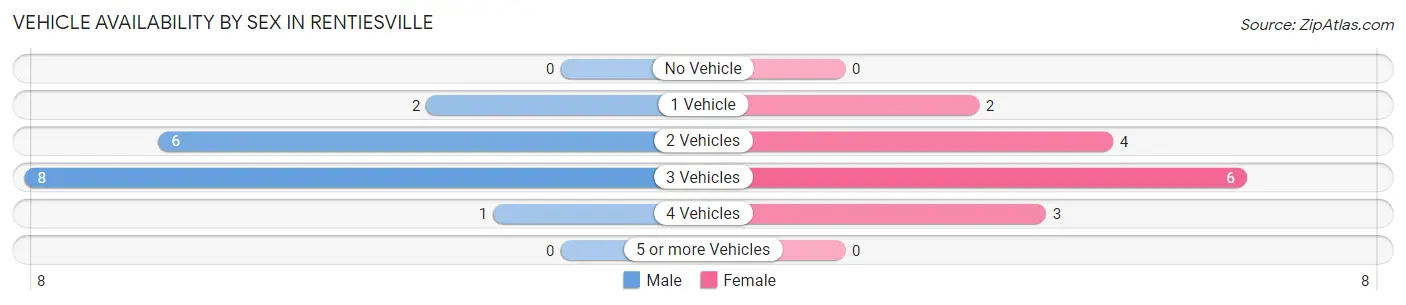
| Vehicles Available | Male | Female |
| No Vehicle | 0 (0.0%) | 0 (0.0%) |
| 1 Vehicle | 2 (11.8%) | 2 (13.3%) |
| 2 Vehicles | 6 (35.3%) | 4 (26.7%) |
| 3 Vehicles | 8 (47.1%) | 6 (40.0%) |
| 4 Vehicles | 1 (5.9%) | 3 (20.0%) |
| 5 or more Vehicles | 0 (0.0%) | 0 (0.0%) |
| Total | 17 (100.0%) | 15 (100.0%) |
Commute Time in Rentiesville
The most frequently occuring commute durations in Rentiesville are 30 to 34 minutes (7 commuters, 23.3%), 25 to 29 minutes (6 commuters, 20.0%), and 45 to 59 minutes (6 commuters, 20.0%).
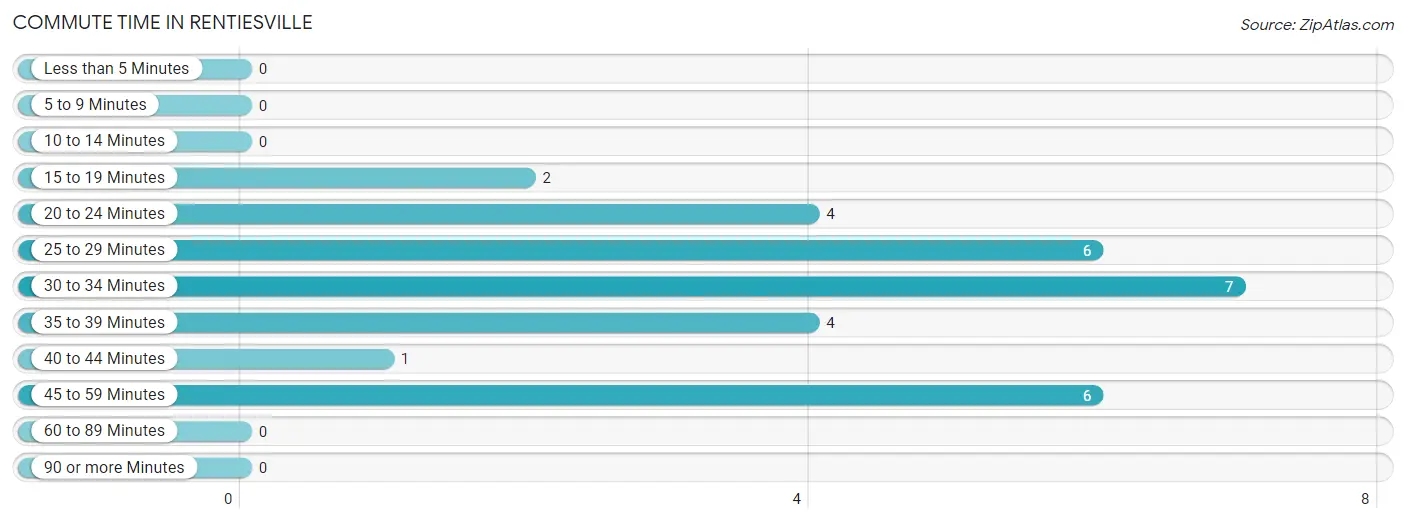
| Commute Time | # Commuters | % Commuters |
| Less than 5 Minutes | 0 | 0.0% |
| 5 to 9 Minutes | 0 | 0.0% |
| 10 to 14 Minutes | 0 | 0.0% |
| 15 to 19 Minutes | 2 | 6.7% |
| 20 to 24 Minutes | 4 | 13.3% |
| 25 to 29 Minutes | 6 | 20.0% |
| 30 to 34 Minutes | 7 | 23.3% |
| 35 to 39 Minutes | 4 | 13.3% |
| 40 to 44 Minutes | 1 | 3.3% |
| 45 to 59 Minutes | 6 | 20.0% |
| 60 to 89 Minutes | 0 | 0.0% |
| 90 or more Minutes | 0 | 0.0% |
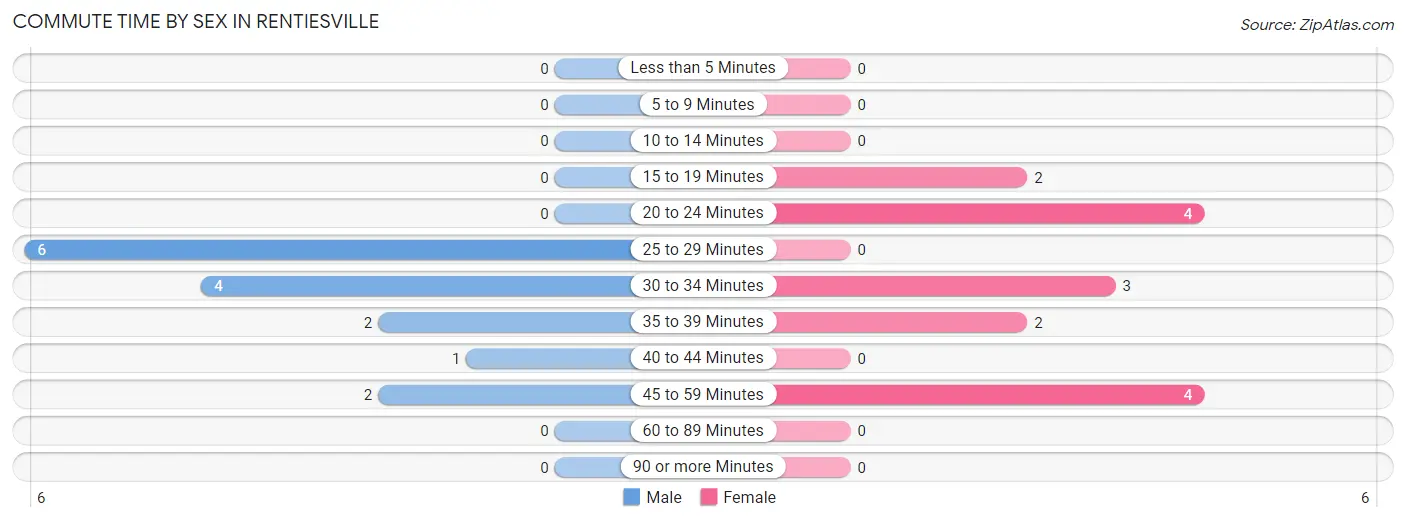
Commute Time by Sex in Rentiesville
The most common commute times in Rentiesville are 25 to 29 minutes (6 commuters, 40.0%) for males and 20 to 24 minutes (4 commuters, 26.7%) for females.
| Commute Time | Male | Female |
| Less than 5 Minutes | 0 (0.0%) | 0 (0.0%) |
| 5 to 9 Minutes | 0 (0.0%) | 0 (0.0%) |
| 10 to 14 Minutes | 0 (0.0%) | 0 (0.0%) |
| 15 to 19 Minutes | 0 (0.0%) | 2 (13.3%) |
| 20 to 24 Minutes | 0 (0.0%) | 4 (26.7%) |
| 25 to 29 Minutes | 6 (40.0%) | 0 (0.0%) |
| 30 to 34 Minutes | 4 (26.7%) | 3 (20.0%) |
| 35 to 39 Minutes | 2 (13.3%) | 2 (13.3%) |
| 40 to 44 Minutes | 1 (6.7%) | 0 (0.0%) |
| 45 to 59 Minutes | 2 (13.3%) | 4 (26.7%) |
| 60 to 89 Minutes | 0 (0.0%) | 0 (0.0%) |
| 90 or more Minutes | 0 (0.0%) | 0 (0.0%) |
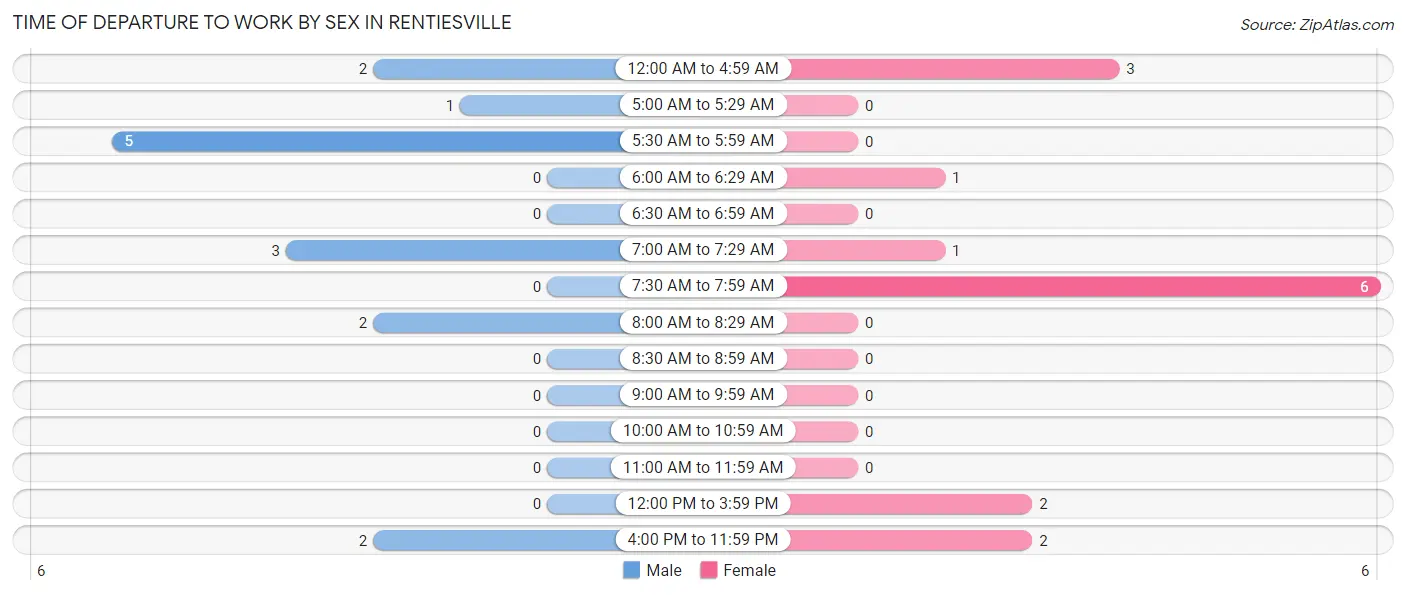
Time of Departure to Work by Sex in Rentiesville
The most frequent times of departure to work in Rentiesville are 5:30 AM to 5:59 AM (5, 33.3%) for males and 7:30 AM to 7:59 AM (6, 40.0%) for females.
| Time of Departure | Male | Female |
| 12:00 AM to 4:59 AM | 2 (13.3%) | 3 (20.0%) |
| 5:00 AM to 5:29 AM | 1 (6.7%) | 0 (0.0%) |
| 5:30 AM to 5:59 AM | 5 (33.3%) | 0 (0.0%) |
| 6:00 AM to 6:29 AM | 0 (0.0%) | 1 (6.7%) |
| 6:30 AM to 6:59 AM | 0 (0.0%) | 0 (0.0%) |
| 7:00 AM to 7:29 AM | 3 (20.0%) | 1 (6.7%) |
| 7:30 AM to 7:59 AM | 0 (0.0%) | 6 (40.0%) |
| 8:00 AM to 8:29 AM | 2 (13.3%) | 0 (0.0%) |
| 8:30 AM to 8:59 AM | 0 (0.0%) | 0 (0.0%) |
| 9:00 AM to 9:59 AM | 0 (0.0%) | 0 (0.0%) |
| 10:00 AM to 10:59 AM | 0 (0.0%) | 0 (0.0%) |
| 11:00 AM to 11:59 AM | 0 (0.0%) | 0 (0.0%) |
| 12:00 PM to 3:59 PM | 0 (0.0%) | 2 (13.3%) |
| 4:00 PM to 11:59 PM | 2 (13.3%) | 2 (13.3%) |
| Total | 15 (100.0%) | 15 (100.0%) |
Housing Occupancy in Rentiesville
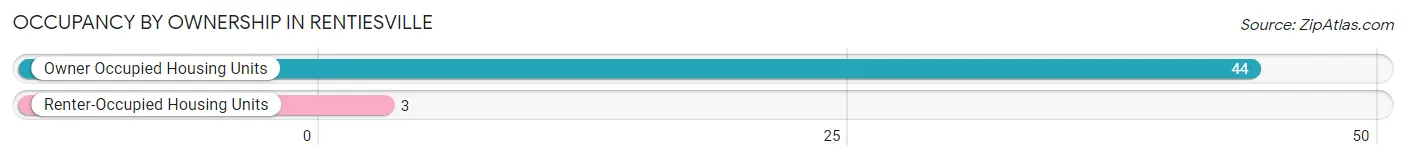
Occupancy by Ownership in Rentiesville
Of the total 47 dwellings in Rentiesville, owner-occupied units account for 44 (93.6%), while renter-occupied units make up 3 (6.4%).
| Occupancy | # Housing Units | % Housing Units |
| Owner Occupied Housing Units | 44 | 93.6% |
| Renter-Occupied Housing Units | 3 | 6.4% |
| Total Occupied Housing Units | 47 | 100.0% |
Occupancy by Household Size in Rentiesville
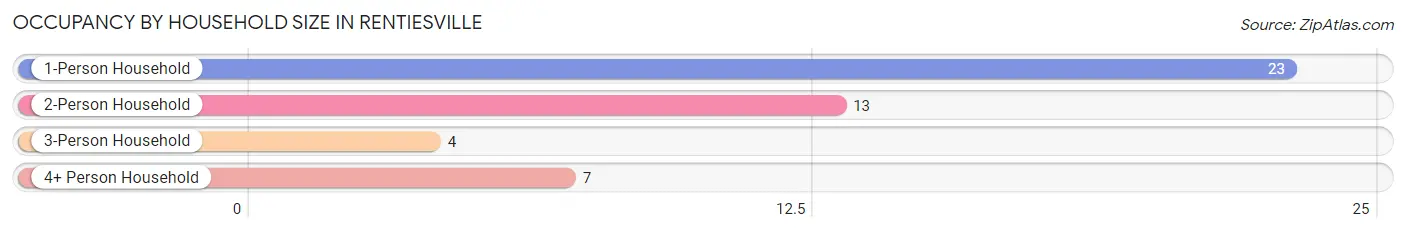
| Household Size | # Housing Units | % Housing Units |
| 1-Person Household | 23 | 48.9% |
| 2-Person Household | 13 | 27.7% |
| 3-Person Household | 4 | 8.5% |
| 4+ Person Household | 7 | 14.9% |
| Total Housing Units | 47 | 100.0% |
Occupancy by Ownership by Household Size in Rentiesville
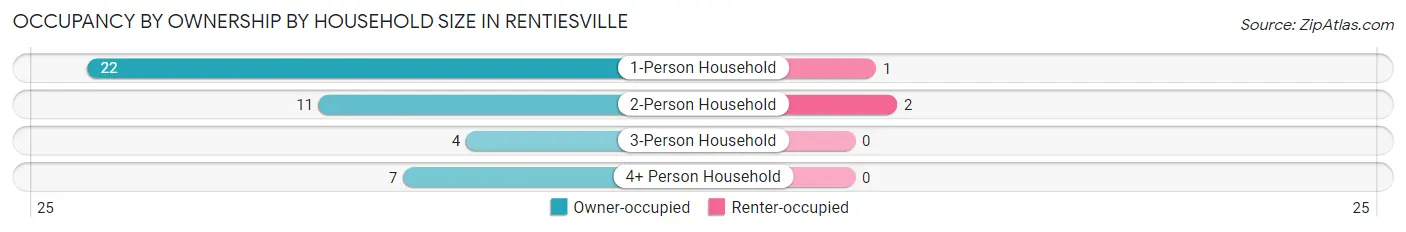
| Household Size | Owner-occupied | Renter-occupied |
| 1-Person Household | 22 (95.7%) | 1 (4.3%) |
| 2-Person Household | 11 (84.6%) | 2 (15.4%) |
| 3-Person Household | 4 (100.0%) | 0 (0.0%) |
| 4+ Person Household | 7 (100.0%) | 0 (0.0%) |
| Total Housing Units | 44 (93.6%) | 3 (6.4%) |
Occupancy by Educational Attainment in Rentiesville
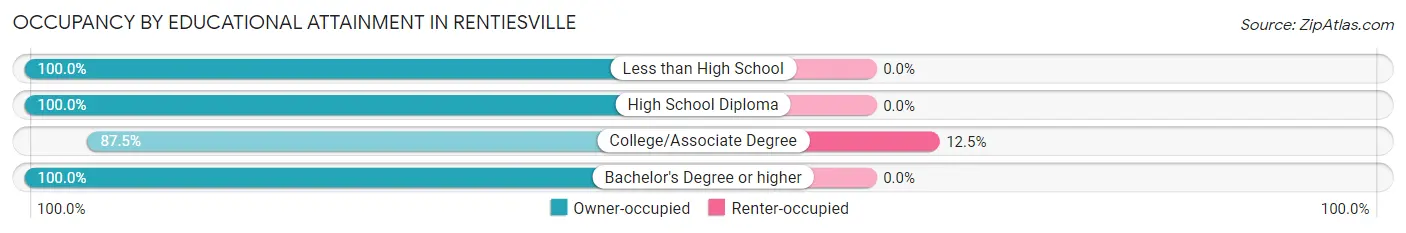
| Household Size | Owner-occupied | Renter-occupied |
| Less than High School | 10 (100.0%) | 0 (0.0%) |
| High School Diploma | 6 (100.0%) | 0 (0.0%) |
| College/Associate Degree | 21 (87.5%) | 3 (12.5%) |
| Bachelor's Degree or higher | 7 (100.0%) | 0 (0.0%) |
Occupancy by Age of Householder in Rentiesville
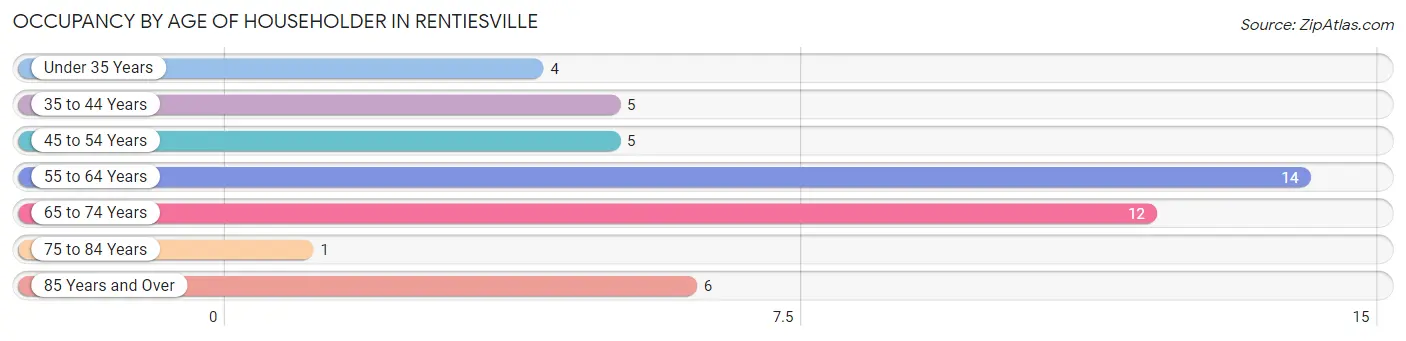
| Age Bracket | # Households | % Households |
| Under 35 Years | 4 | 8.5% |
| 35 to 44 Years | 5 | 10.6% |
| 45 to 54 Years | 5 | 10.6% |
| 55 to 64 Years | 14 | 29.8% |
| 65 to 74 Years | 12 | 25.5% |
| 75 to 84 Years | 1 | 2.1% |
| 85 Years and Over | 6 | 12.8% |
| Total | 47 | 100.0% |
Housing Finances in Rentiesville
Median Income by Occupancy in Rentiesville
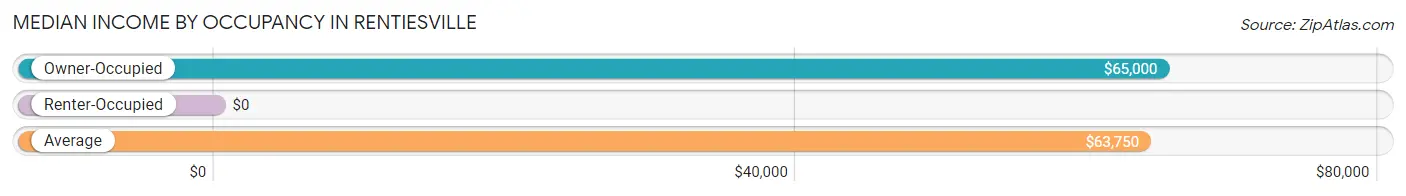
| Occupancy Type | # Households | Median Income |
| Owner-Occupied | 44 (93.6%) | $65,000 |
| Renter-Occupied | 3 (6.4%) | $0 |
| Average | 47 (100.0%) | $63,750 |
Occupancy by Householder Income Bracket in Rentiesville
| Income Bracket | Owner-occupied | Renter-occupied |
| Less than $5,000 | 3 (6.8%) | 0 (0.0%) |
| $5,000 to $9,999 | 0 (0.0%) | 0 (0.0%) |
| $10,000 to $14,999 | 3 (6.8%) | 0 (0.0%) |
| $15,000 to $19,999 | 3 (6.8%) | 0 (0.0%) |
| $20,000 to $24,999 | 0 (0.0%) | 1 (33.3%) |
| $25,000 to $34,999 | 10 (22.7%) | 0 (0.0%) |
| $35,000 to $49,999 | 0 (0.0%) | 0 (0.0%) |
| $50,000 to $74,999 | 5 (11.4%) | 2 (66.7%) |
| $75,000 to $99,999 | 10 (22.7%) | 0 (0.0%) |
| $100,000 to $149,999 | 10 (22.7%) | 0 (0.0%) |
| $150,000 or more | 0 (0.0%) | 0 (0.0%) |
| Total | 44 (100.0%) | 3 (100.0%) |
Monthly Housing Cost Tiers in Rentiesville
| Monthly Cost | Owner-occupied | Renter-occupied |
| Less than $300 | 11 (25.0%) | 0 (0.0%) |
| $300 to $499 | 11 (25.0%) | 0 (0.0%) |
| $500 to $799 | 7 (15.9%) | 3 (100.0%) |
| $800 to $999 | 10 (22.7%) | 0 (0.0%) |
| $1,000 to $1,499 | 3 (6.8%) | 0 (0.0%) |
| $1,500 to $1,999 | 2 (4.5%) | 0 (0.0%) |
| $2,000 to $2,499 | 0 (0.0%) | 0 (0.0%) |
| $2,500 to $2,999 | 0 (0.0%) | 0 (0.0%) |
| $3,000 or more | 0 (0.0%) | 0 (0.0%) |
| Total | 44 (100.0%) | 3 (100.0%) |
Physical Housing Characteristics in Rentiesville
Housing Structures in Rentiesville
| Structure Type | # Housing Units | % Housing Units |
| Single Unit, Detached | 38 | 80.8% |
| Single Unit, Attached | 0 | 0.0% |
| 2 Unit Apartments | 0 | 0.0% |
| 3 or 4 Unit Apartments | 0 | 0.0% |
| 5 to 9 Unit Apartments | 0 | 0.0% |
| 10 or more Apartments | 0 | 0.0% |
| Mobile Home / Other | 9 | 19.2% |
| Total | 47 | 100.0% |
Housing Structures by Occupancy in Rentiesville
| Structure Type | Owner-occupied | Renter-occupied |
| Single Unit, Detached | 37 (97.4%) | 1 (2.6%) |
| Single Unit, Attached | 0 (0.0%) | 0 (0.0%) |
| 2 Unit Apartments | 0 (0.0%) | 0 (0.0%) |
| 3 or 4 Unit Apartments | 0 (0.0%) | 0 (0.0%) |
| 5 to 9 Unit Apartments | 0 (0.0%) | 0 (0.0%) |
| 10 or more Apartments | 0 (0.0%) | 0 (0.0%) |
| Mobile Home / Other | 7 (77.8%) | 2 (22.2%) |
| Total | 44 (93.6%) | 3 (6.4%) |
Housing Structures by Number of Rooms in Rentiesville
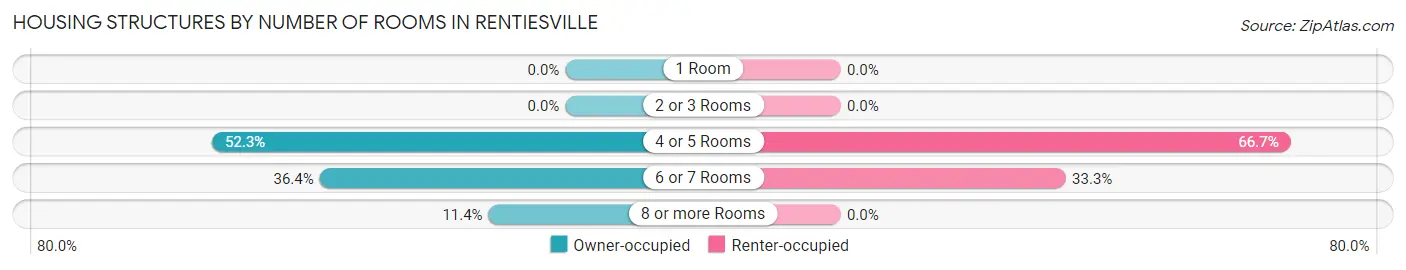
| Number of Rooms | Owner-occupied | Renter-occupied |
| 1 Room | 0 (0.0%) | 0 (0.0%) |
| 2 or 3 Rooms | 0 (0.0%) | 0 (0.0%) |
| 4 or 5 Rooms | 23 (52.3%) | 2 (66.7%) |
| 6 or 7 Rooms | 16 (36.4%) | 1 (33.3%) |
| 8 or more Rooms | 5 (11.4%) | 0 (0.0%) |
| Total | 44 (100.0%) | 3 (100.0%) |
Housing Structure by Heating Type in Rentiesville
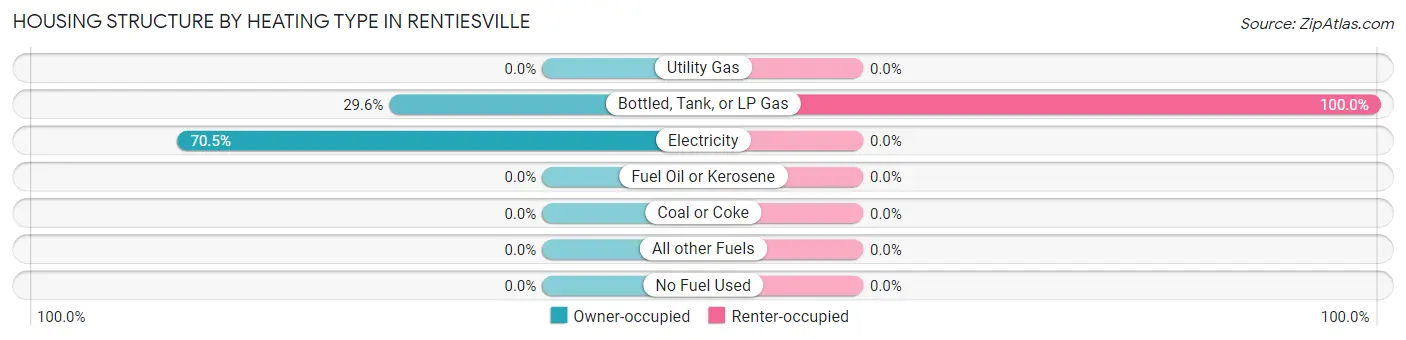
| Heating Type | Owner-occupied | Renter-occupied |
| Utility Gas | 0 (0.0%) | 0 (0.0%) |
| Bottled, Tank, or LP Gas | 13 (29.5%) | 3 (100.0%) |
| Electricity | 31 (70.5%) | 0 (0.0%) |
| Fuel Oil or Kerosene | 0 (0.0%) | 0 (0.0%) |
| Coal or Coke | 0 (0.0%) | 0 (0.0%) |
| All other Fuels | 0 (0.0%) | 0 (0.0%) |
| No Fuel Used | 0 (0.0%) | 0 (0.0%) |
| Total | 44 (100.0%) | 3 (100.0%) |
Household Vehicle Usage in Rentiesville
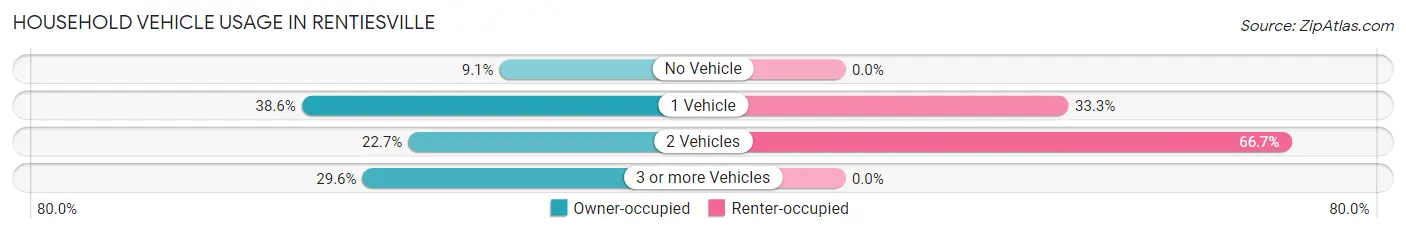
| Vehicles per Household | Owner-occupied | Renter-occupied |
| No Vehicle | 4 (9.1%) | 0 (0.0%) |
| 1 Vehicle | 17 (38.6%) | 1 (33.3%) |
| 2 Vehicles | 10 (22.7%) | 2 (66.7%) |
| 3 or more Vehicles | 13 (29.5%) | 0 (0.0%) |
| Total | 44 (100.0%) | 3 (100.0%) |
Real Estate & Mortgages in Rentiesville
Real Estate and Mortgage Overview in Rentiesville
| Characteristic | Without Mortgage | With Mortgage |
| Housing Units | 22 | 22 |
| Median Property Value | $68,000 | $102,800 |
| Median Household Income | $33,125 | $0 |
| Monthly Housing Costs | $300 | $0 |
| Real Estate Taxes | - | - |
Property Value by Mortgage Status in Rentiesville
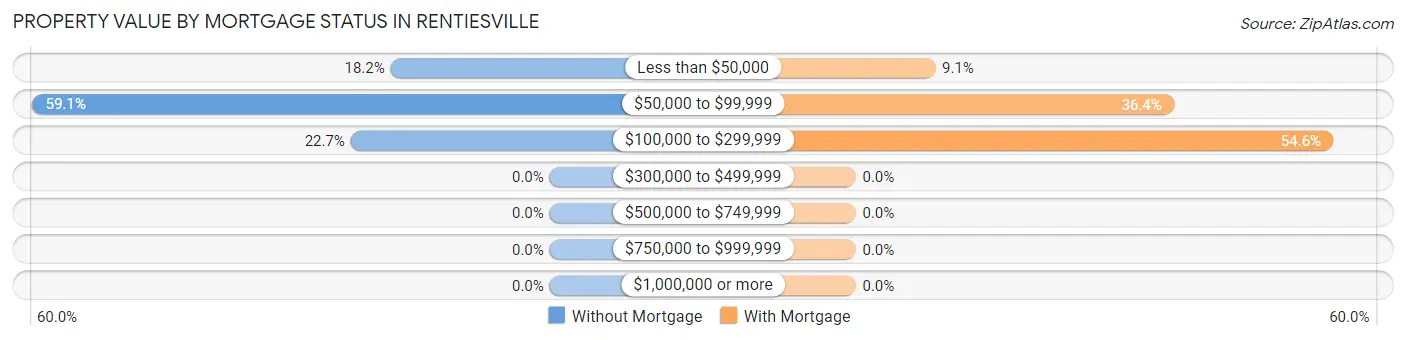
| Property Value | Without Mortgage | With Mortgage |
| Less than $50,000 | 4 (18.2%) | 2 (9.1%) |
| $50,000 to $99,999 | 13 (59.1%) | 8 (36.4%) |
| $100,000 to $299,999 | 5 (22.7%) | 12 (54.5%) |
| $300,000 to $499,999 | 0 (0.0%) | 0 (0.0%) |
| $500,000 to $749,999 | 0 (0.0%) | 0 (0.0%) |
| $750,000 to $999,999 | 0 (0.0%) | 0 (0.0%) |
| $1,000,000 or more | 0 (0.0%) | 0 (0.0%) |
| Total | 22 (100.0%) | 22 (100.0%) |
Household Income by Mortgage Status in Rentiesville
| Household Income | Without Mortgage | With Mortgage |
| Less than $10,000 | 0 (0.0%) | 0 (0.0%) |
| $10,000 to $24,999 | 6 (27.3%) | 3 (13.6%) |
| $25,000 to $34,999 | 8 (36.4%) | 0 (0.0%) |
| $35,000 to $49,999 | 0 (0.0%) | 2 (9.1%) |
| $50,000 to $74,999 | 0 (0.0%) | 0 (0.0%) |
| $75,000 to $99,999 | 6 (27.3%) | 5 (22.7%) |
| $100,000 to $149,999 | 2 (9.1%) | 4 (18.2%) |
| $150,000 or more | 0 (0.0%) | 8 (36.4%) |
| Total | 22 (100.0%) | 22 (100.0%) |
Property Value to Household Income Ratio in Rentiesville
| Value-to-Income Ratio | Without Mortgage | With Mortgage |
| Less than 2.0x | 12 (54.5%) | 90,000 (409,090.9%) |
| 2.0x to 2.9x | 2 (9.1%) | 14 (63.6%) |
| 3.0x to 3.9x | 3 (13.6%) | 3 (13.6%) |
| 4.0x or more | 5 (22.7%) | 2 (9.1%) |
| Total | 22 (100.0%) | 22 (100.0%) |
Real Estate Taxes by Mortgage Status in Rentiesville
| Property Taxes | Without Mortgage | With Mortgage |
| Less than $800 | 22 (100.0%) | 0 (0.0%) |
| $800 to $1,499 | 0 (0.0%) | 15 (68.2%) |
| $800 to $1,499 | 0 (0.0%) | 7 (31.8%) |
| Total | 22 (100.0%) | 22 (100.0%) |
Health & Disability in Rentiesville
Health Insurance Coverage by Age in Rentiesville
| Age Bracket | With Coverage | Without Coverage |
| Under 6 Years | 15 (100.0%) | 0 (0.0%) |
| 6 to 18 Years | 5 (100.0%) | 0 (0.0%) |
| 19 to 25 Years | 1 (100.0%) | 0 (0.0%) |
| 26 to 34 Years | 26 (96.3%) | 1 (3.7%) |
| 35 to 44 Years | 5 (55.6%) | 4 (44.4%) |
| 45 to 54 Years | 7 (100.0%) | 0 (0.0%) |
| 55 to 64 Years | 20 (90.9%) | 2 (9.1%) |
| 65 to 74 Years | 12 (100.0%) | 0 (0.0%) |
| 75 Years and older | 10 (100.0%) | 0 (0.0%) |
| Total | 101 (93.5%) | 7 (6.5%) |
Health Insurance Coverage by Citizenship Status in Rentiesville
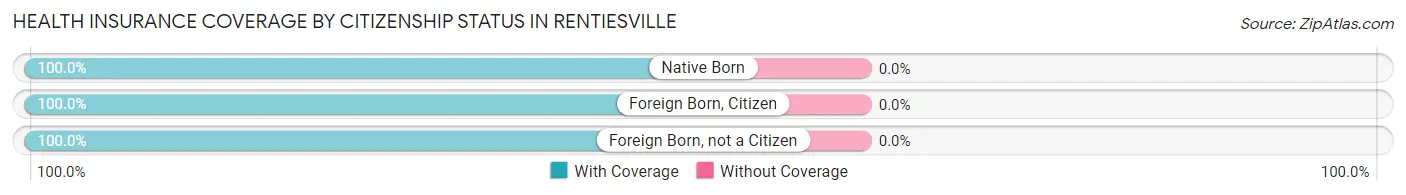
| Citizenship Status | With Coverage | Without Coverage |
| Native Born | 15 (100.0%) | 0 (0.0%) |
| Foreign Born, Citizen | 5 (100.0%) | 0 (0.0%) |
| Foreign Born, not a Citizen | 1 (100.0%) | 0 (0.0%) |
Health Insurance Coverage by Household Income in Rentiesville
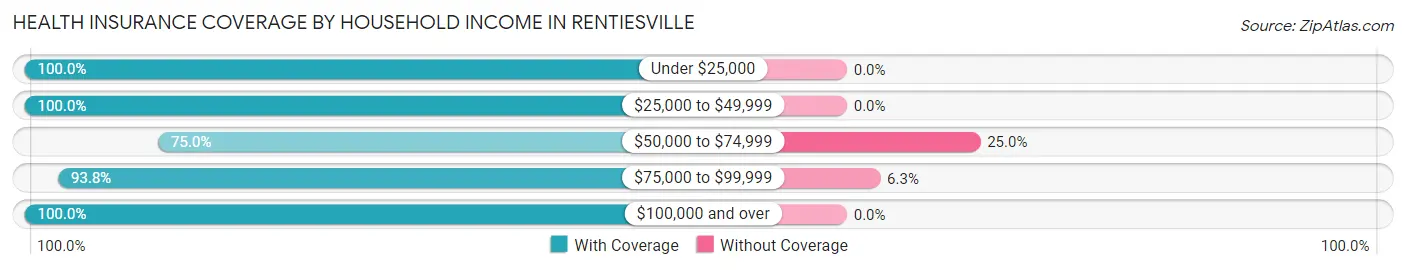
| Household Income | With Coverage | Without Coverage |
| Under $25,000 | 13 (100.0%) | 0 (0.0%) |
| $25,000 to $49,999 | 10 (100.0%) | 0 (0.0%) |
| $50,000 to $74,999 | 12 (75.0%) | 4 (25.0%) |
| $75,000 to $99,999 | 45 (93.8%) | 3 (6.2%) |
| $100,000 and over | 21 (100.0%) | 0 (0.0%) |
Public vs Private Health Insurance Coverage by Age in Rentiesville
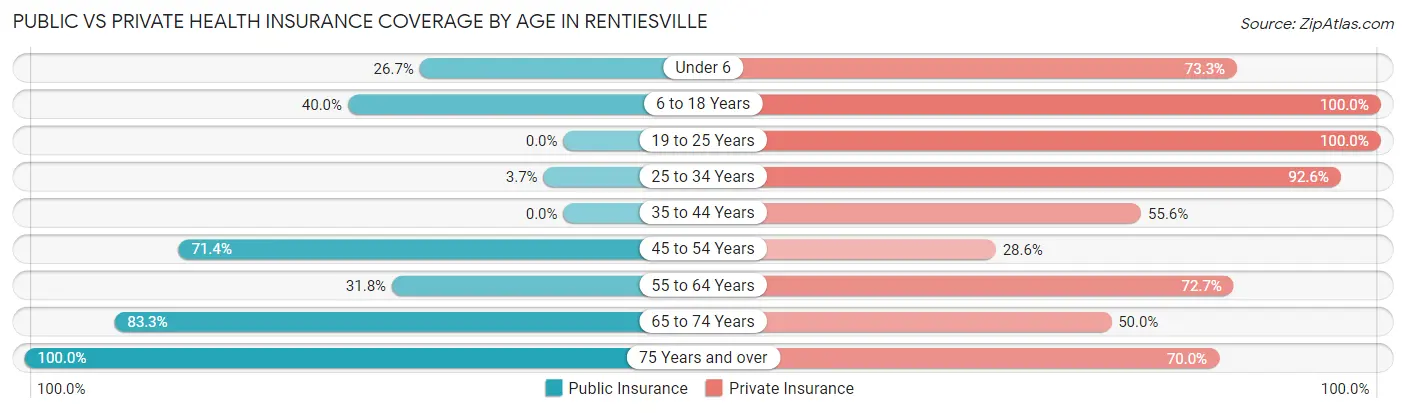
| Age Bracket | Public Insurance | Private Insurance |
| Under 6 | 4 (26.7%) | 11 (73.3%) |
| 6 to 18 Years | 2 (40.0%) | 5 (100.0%) |
| 19 to 25 Years | 0 (0.0%) | 1 (100.0%) |
| 25 to 34 Years | 1 (3.7%) | 25 (92.6%) |
| 35 to 44 Years | 0 (0.0%) | 5 (55.6%) |
| 45 to 54 Years | 5 (71.4%) | 2 (28.6%) |
| 55 to 64 Years | 7 (31.8%) | 16 (72.7%) |
| 65 to 74 Years | 10 (83.3%) | 6 (50.0%) |
| 75 Years and over | 10 (100.0%) | 7 (70.0%) |
| Total | 39 (36.1%) | 78 (72.2%) |
Disability Status by Sex by Age in Rentiesville
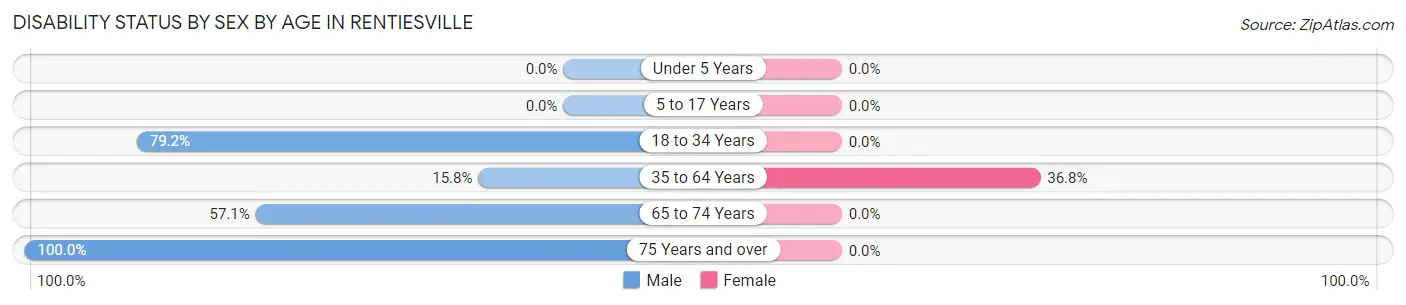
| Age Bracket | Male | Female |
| Under 5 Years | 0 (0.0%) | 0 (0.0%) |
| 5 to 17 Years | 0 (0.0%) | 0 (0.0%) |
| 18 to 34 Years | 19 (79.2%) | 0 (0.0%) |
| 35 to 64 Years | 3 (15.8%) | 7 (36.8%) |
| 65 to 74 Years | 4 (57.1%) | 0 (0.0%) |
| 75 Years and over | 9 (100.0%) | 0 (0.0%) |
Disability Class by Sex by Age in Rentiesville
Disability Class: Hearing Difficulty
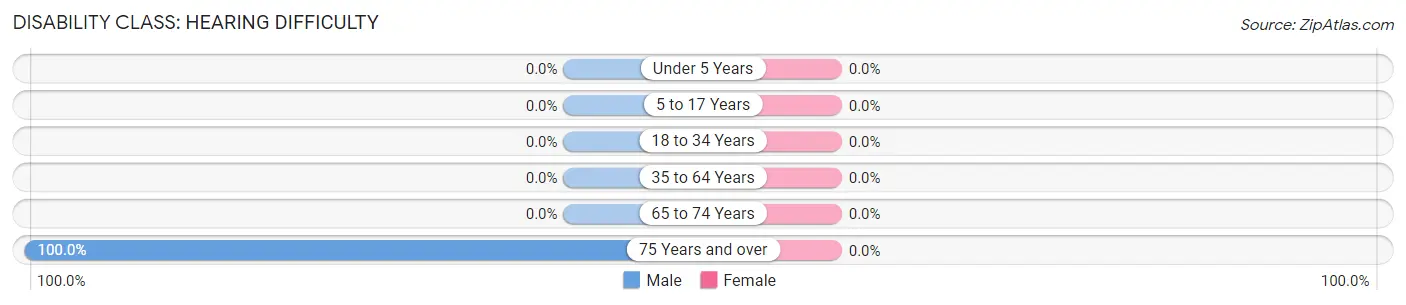
| Age Bracket | Male | Female |
| Under 5 Years | 0 (0.0%) | 0 (0.0%) |
| 5 to 17 Years | 0 (0.0%) | 0 (0.0%) |
| 18 to 34 Years | 0 (0.0%) | 0 (0.0%) |
| 35 to 64 Years | 0 (0.0%) | 0 (0.0%) |
| 65 to 74 Years | 0 (0.0%) | 0 (0.0%) |
| 75 Years and over | 9 (100.0%) | 0 (0.0%) |
Disability Class: Vision Difficulty
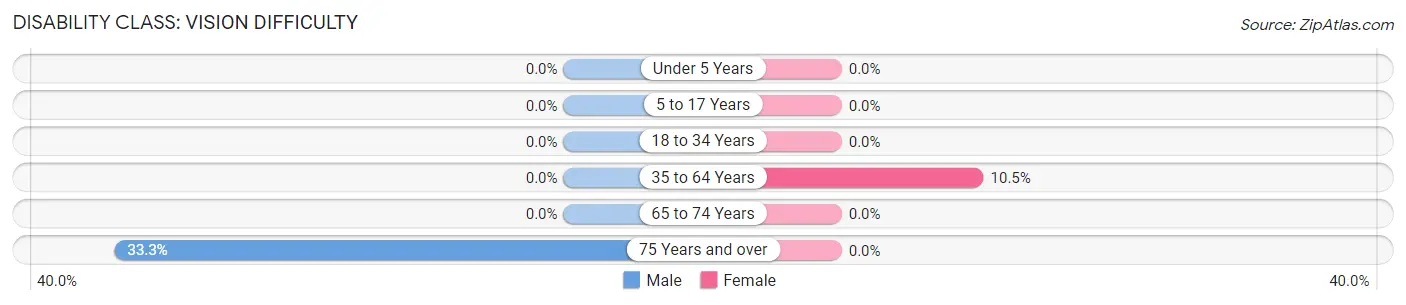
| Age Bracket | Male | Female |
| Under 5 Years | 0 (0.0%) | 0 (0.0%) |
| 5 to 17 Years | 0 (0.0%) | 0 (0.0%) |
| 18 to 34 Years | 0 (0.0%) | 0 (0.0%) |
| 35 to 64 Years | 0 (0.0%) | 2 (10.5%) |
| 65 to 74 Years | 0 (0.0%) | 0 (0.0%) |
| 75 Years and over | 3 (33.3%) | 0 (0.0%) |
Disability Class: Cognitive Difficulty
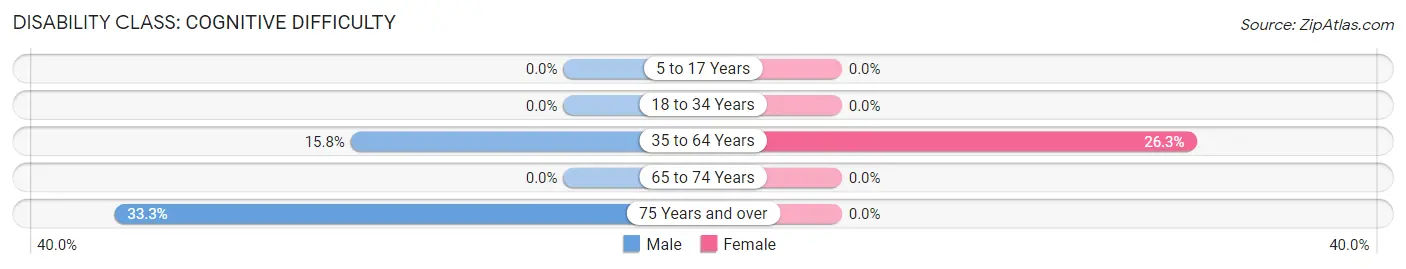
| Age Bracket | Male | Female |
| 5 to 17 Years | 0 (0.0%) | 0 (0.0%) |
| 18 to 34 Years | 0 (0.0%) | 0 (0.0%) |
| 35 to 64 Years | 3 (15.8%) | 5 (26.3%) |
| 65 to 74 Years | 0 (0.0%) | 0 (0.0%) |
| 75 Years and over | 3 (33.3%) | 0 (0.0%) |
Disability Class: Ambulatory Difficulty
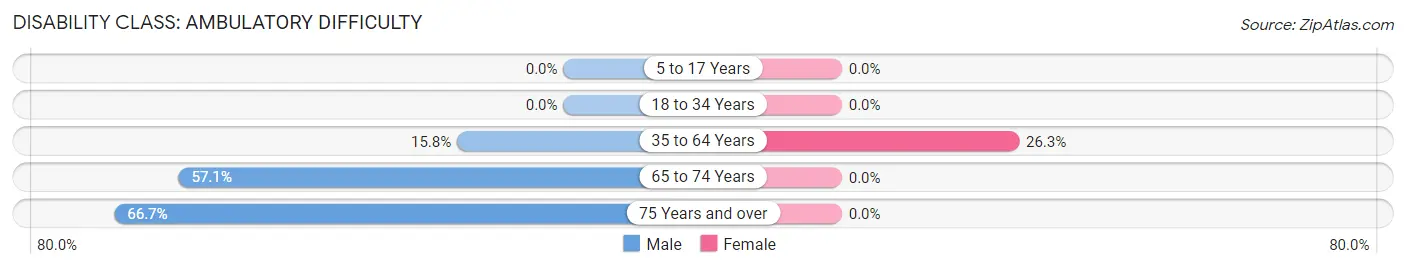
| Age Bracket | Male | Female |
| 5 to 17 Years | 0 (0.0%) | 0 (0.0%) |
| 18 to 34 Years | 0 (0.0%) | 0 (0.0%) |
| 35 to 64 Years | 3 (15.8%) | 5 (26.3%) |
| 65 to 74 Years | 4 (57.1%) | 0 (0.0%) |
| 75 Years and over | 6 (66.7%) | 0 (0.0%) |
Disability Class: Self-Care Difficulty
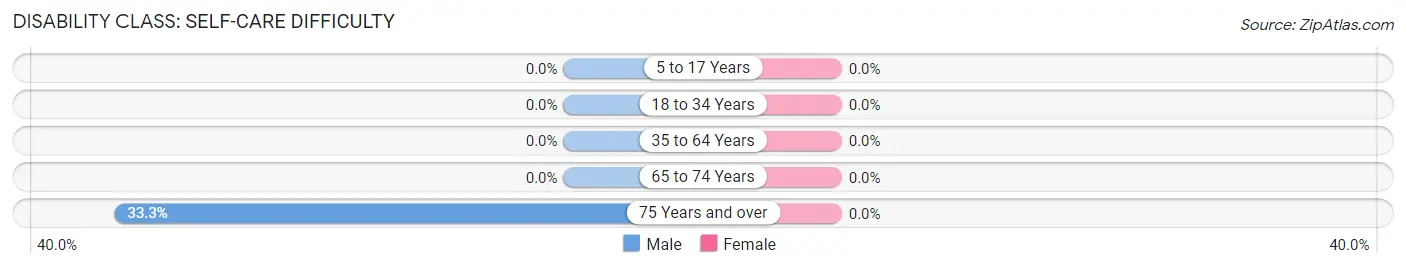
| Age Bracket | Male | Female |
| 5 to 17 Years | 0 (0.0%) | 0 (0.0%) |
| 18 to 34 Years | 0 (0.0%) | 0 (0.0%) |
| 35 to 64 Years | 0 (0.0%) | 0 (0.0%) |
| 65 to 74 Years | 0 (0.0%) | 0 (0.0%) |
| 75 Years and over | 3 (33.3%) | 0 (0.0%) |
Technology Access in Rentiesville
Computing Device Access in Rentiesville
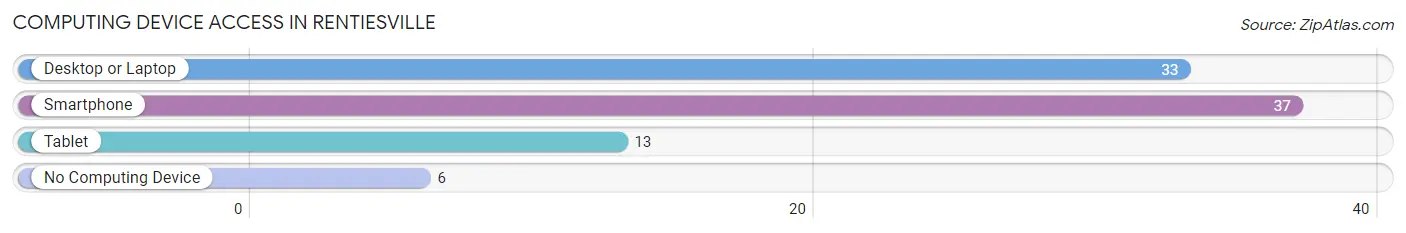
| Device Type | # Households | % Households |
| Desktop or Laptop | 33 | 70.2% |
| Smartphone | 37 | 78.7% |
| Tablet | 13 | 27.7% |
| No Computing Device | 6 | 12.8% |
| Total | 47 | 100.0% |
Internet Access in Rentiesville
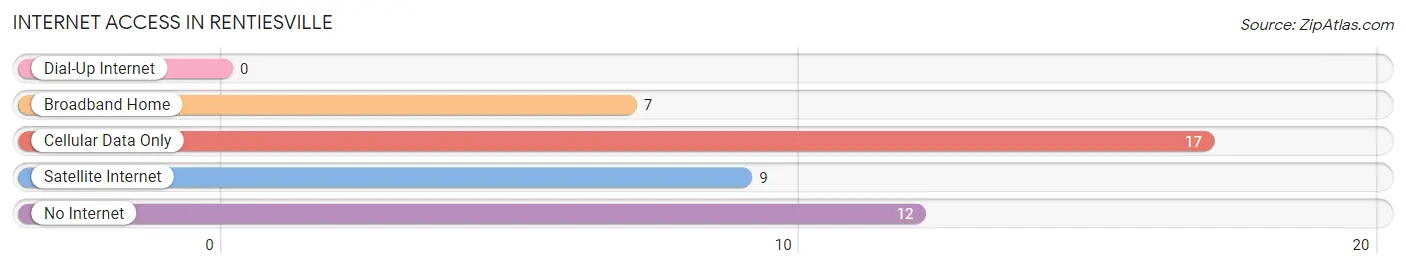
| Internet Type | # Households | % Households |
| Dial-Up Internet | 0 | 0.0% |
| Broadband Home | 7 | 14.9% |
| Cellular Data Only | 17 | 36.2% |
| Satellite Internet | 9 | 19.2% |
| No Internet | 12 | 25.5% |
| Total | 47 | 100.0% |
Rentiesville Summary
Rentiesville is a small unincorporated community located in Muskogee County, Oklahoma. It is situated in the foothills of the Ozark Mountains, approximately 20 miles south of Muskogee. The town was founded in the late 1800s by a group of freed slaves who had been relocated from the Deep South. The town was named after the first postmaster, William Rentie.
History
Rentiesville was founded in the late 1800s by a group of freed slaves who had been relocated from the Deep South. The town was named after the first postmaster, William Rentie. The town was originally a farming community, but it soon became a center for blues music. In the early 1900s, blues musicians from all over the region began to gather in Rentiesville to play and perform. The town became known as the “Crossroads of the Blues” and was home to some of the most influential blues musicians of the time, including Robert Johnson, Charley Patton, and Son House.
In the 1930s, the town was home to a thriving juke joint scene. The juke joints were popular gathering places for locals and travelers alike, and they provided a place for people to come together and enjoy music, dancing, and socializing. The juke joints were also a place for musicians to hone their craft and develop their own unique styles.
In the 1950s, the town began to decline as the blues scene moved to larger cities. The juke joints closed and the population dwindled. In the 1970s, the town was revitalized by the efforts of local blues musician and historian, David “Honeyboy” Edwards. Edwards opened the Honeyboy Edwards Blues Club, which became a popular destination for blues fans from all over the world.
Geography
Rentiesville is located in Muskogee County, Oklahoma. It is situated in the foothills of the Ozark Mountains, approximately 20 miles south of Muskogee. The town is located on the banks of the Arkansas River, which provides a scenic backdrop for the town. The town is surrounded by rolling hills and lush forests, making it a popular destination for outdoor enthusiasts.
Economy
Rentiesville’s economy is largely based on tourism. The town is home to the Honeyboy Edwards Blues Club, which attracts blues fans from all over the world. The town is also home to several small businesses, including a general store, a gas station, and a few restaurants. The town is also home to a number of small farms, which provide fresh produce to the local community.
Demographics
As of the 2010 census, the population of Rentiesville was 545. The racial makeup of the town was 95.3% White, 0.7% African American, 0.2% Native American, 0.2% Asian, 0.2% from other races, and 3.4% from two or more races. The median household income was $30,000, and the median family income was $35,000. The per capita income was $14,000. The town is served by the Muskogee County School District.
Common Questions
What is Per Capita Income in Rentiesville?
Per Capita income in Rentiesville is $27,958.
What is the Median Family Income in Rentiesville?
Median Family Income in Rentiesville is $97,500.
What is the Median Household income in Rentiesville?
Median Household Income in Rentiesville is $63,750.
What is Inequality or Gini Index in Rentiesville?
Inequality or Gini Index in Rentiesville is 0.39.
What is the Total Population of Rentiesville?
Total Population of Rentiesville is 108.
What is the Total Male Population of Rentiesville?
Total Male Population of Rentiesville is 64.
What is the Total Female Population of Rentiesville?
Total Female Population of Rentiesville is 44.
What is the Ratio of Males per 100 Females in Rentiesville?
There are 145.45 Males per 100 Females in Rentiesville.
What is the Ratio of Females per 100 Males in Rentiesville?
There are 68.75 Females per 100 Males in Rentiesville.
What is the Median Population Age in Rentiesville?
Median Population Age in Rentiesville is 40.0 Years.
What is the Average Family Size in Rentiesville
Average Family Size in Rentiesville is 3.5 People.
What is the Average Household Size in Rentiesville
Average Household Size in Rentiesville is 2.3 People.
How Large is the Labor Force in Rentiesville?
There are 53 People in the Labor Forcein in Rentiesville.
What is the Percentage of People in the Labor Force in Rentiesville?
60.2% of People are in the Labor Force in Rentiesville.
What is the Unemployment Rate in Rentiesville?
Unemployment Rate in Rentiesville is 3.8%.