Fort Cobb, OK Map & Demographics
Fort Cobb Map
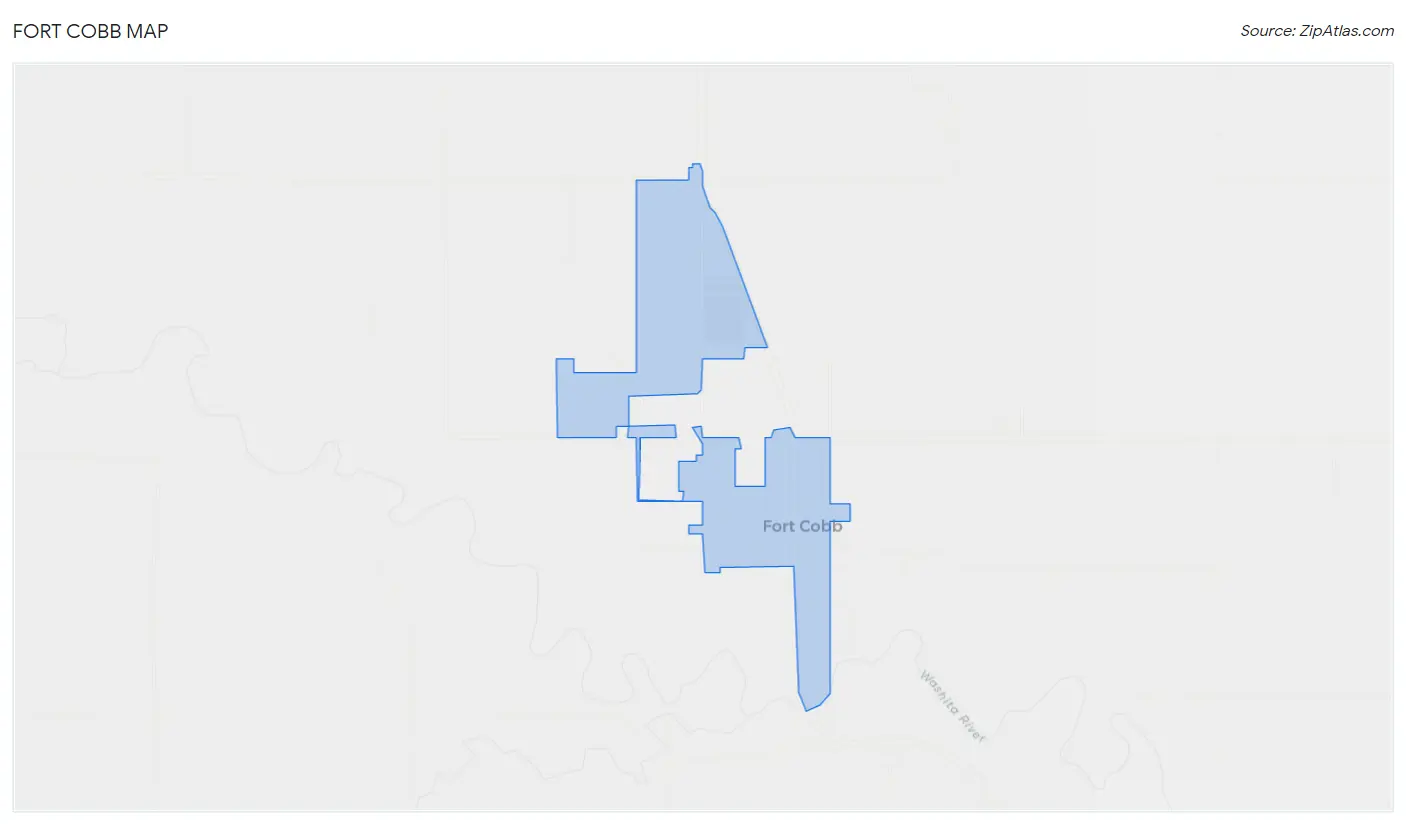
Fort Cobb Overview
$23,614
PER CAPITA INCOME
$62,083
AVG FAMILY INCOME
$52,700
AVG HOUSEHOLD INCOME
1.7%
WAGE / INCOME GAP [ % ]
98.3¢/ $1
WAGE / INCOME GAP [ $ ]
0.38
INEQUALITY / GINI INDEX
499
TOTAL POPULATION
277
MALE POPULATION
222
FEMALE POPULATION
124.77
MALES / 100 FEMALES
80.14
FEMALES / 100 MALES
40.3
MEDIAN AGE
3.2
AVG FAMILY SIZE
2.5
AVG HOUSEHOLD SIZE
216
LABOR FORCE [ PEOPLE ]
56.1%
PERCENT IN LABOR FORCE
0.9%
UNEMPLOYMENT RATE
Fort Cobb Zip Codes
Fort Cobb Area Codes
Income in Fort Cobb
Income Overview in Fort Cobb
Per Capita Income in Fort Cobb is $23,614, while median incomes of families and households are $62,083 and $52,700 respectively.
| Characteristic | Number | Measure |
| Per Capita Income | 499 | $23,614 |
| Median Family Income | 123 | $62,083 |
| Mean Family Income | 123 | $63,696 |
| Median Household Income | 202 | $52,700 |
| Mean Household Income | 202 | $53,083 |
| Income Deficit | 123 | $0 |
| Wage / Income Gap (%) | 499 | 1.73% |
| Wage / Income Gap ($) | 499 | 98.27¢ per $1 |
| Gini / Inequality Index | 499 | 0.38 |
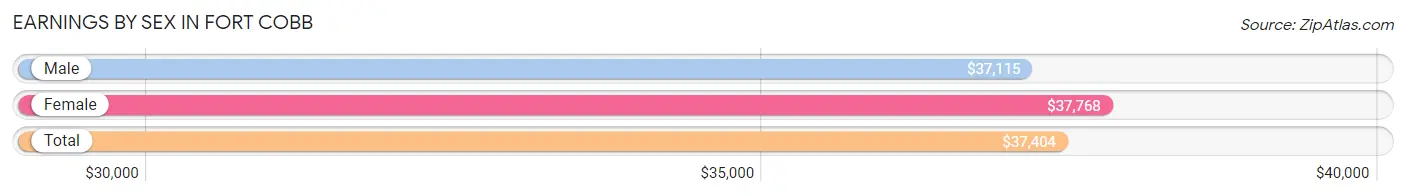
Earnings by Sex in Fort Cobb
Average Earnings in Fort Cobb are $37,404, $37,115 for men and $37,768 for women, a difference of 1.7%.
| Sex | Number | Average Earnings |
| Male | 138 (58.2%) | $37,115 |
| Female | 99 (41.8%) | $37,768 |
| Total | 237 (100.0%) | $37,404 |
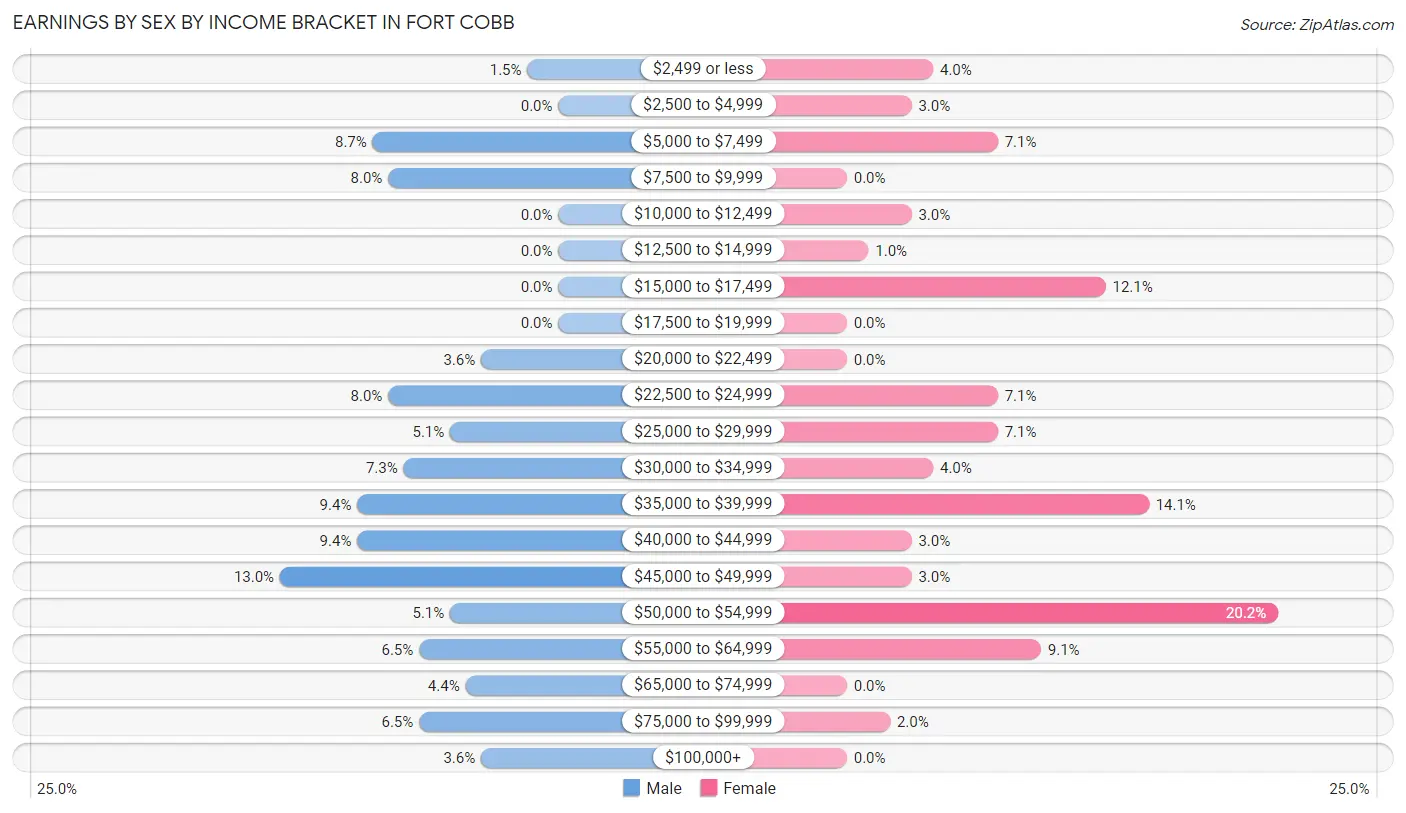
Earnings by Sex by Income Bracket in Fort Cobb
The most common earnings brackets in Fort Cobb are $45,000 to $49,999 for men (18 | 13.0%) and $50,000 to $54,999 for women (20 | 20.2%).
| Income | Male | Female |
| $2,499 or less | 2 (1.5%) | 4 (4.0%) |
| $2,500 to $4,999 | 0 (0.0%) | 3 (3.0%) |
| $5,000 to $7,499 | 12 (8.7%) | 7 (7.1%) |
| $7,500 to $9,999 | 11 (8.0%) | 0 (0.0%) |
| $10,000 to $12,499 | 0 (0.0%) | 3 (3.0%) |
| $12,500 to $14,999 | 0 (0.0%) | 1 (1.0%) |
| $15,000 to $17,499 | 0 (0.0%) | 12 (12.1%) |
| $17,500 to $19,999 | 0 (0.0%) | 0 (0.0%) |
| $20,000 to $22,499 | 5 (3.6%) | 0 (0.0%) |
| $22,500 to $24,999 | 11 (8.0%) | 7 (7.1%) |
| $25,000 to $29,999 | 7 (5.1%) | 7 (7.1%) |
| $30,000 to $34,999 | 10 (7.2%) | 4 (4.0%) |
| $35,000 to $39,999 | 13 (9.4%) | 14 (14.1%) |
| $40,000 to $44,999 | 13 (9.4%) | 3 (3.0%) |
| $45,000 to $49,999 | 18 (13.0%) | 3 (3.0%) |
| $50,000 to $54,999 | 7 (5.1%) | 20 (20.2%) |
| $55,000 to $64,999 | 9 (6.5%) | 9 (9.1%) |
| $65,000 to $74,999 | 6 (4.3%) | 0 (0.0%) |
| $75,000 to $99,999 | 9 (6.5%) | 2 (2.0%) |
| $100,000+ | 5 (3.6%) | 0 (0.0%) |
| Total | 138 (100.0%) | 99 (100.0%) |
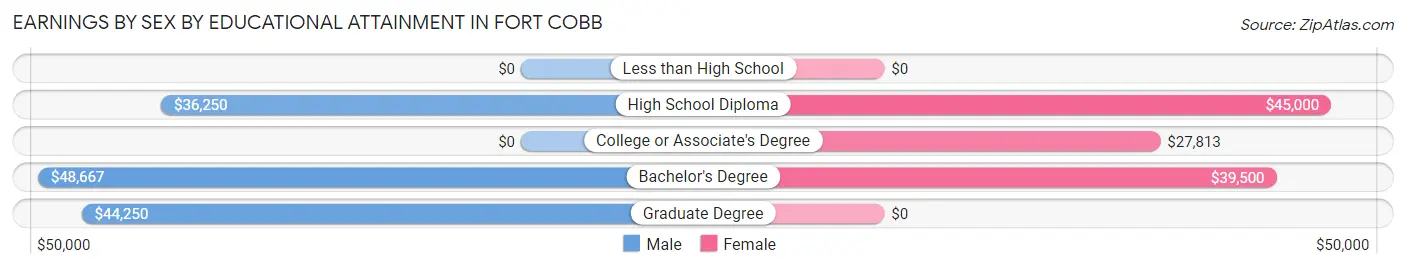
Earnings by Sex by Educational Attainment in Fort Cobb
Average earnings in Fort Cobb are $44,531 for men and $38,214 for women, a difference of 14.2%. Men with an educational attainment of bachelor's degree enjoy the highest average annual earnings of $48,667, while those with high school diploma education earn the least with $36,250. Women with an educational attainment of high school diploma earn the most with the average annual earnings of $45,000, while those with college or associate's degree education have the smallest earnings of $27,813.
| Educational Attainment | Male Income | Female Income |
| Less than High School | - | - |
| High School Diploma | $36,250 | $45,000 |
| College or Associate's Degree | - | - |
| Bachelor's Degree | $48,667 | $39,500 |
| Graduate Degree | $44,250 | $0 |
| Total | $44,531 | $38,214 |
Family Income in Fort Cobb
Family Income Brackets in Fort Cobb
According to the Fort Cobb family income data, there are 32 families falling into the $75,000 to $99,999 income range, which is the most common income bracket and makes up 26.0% of all families.
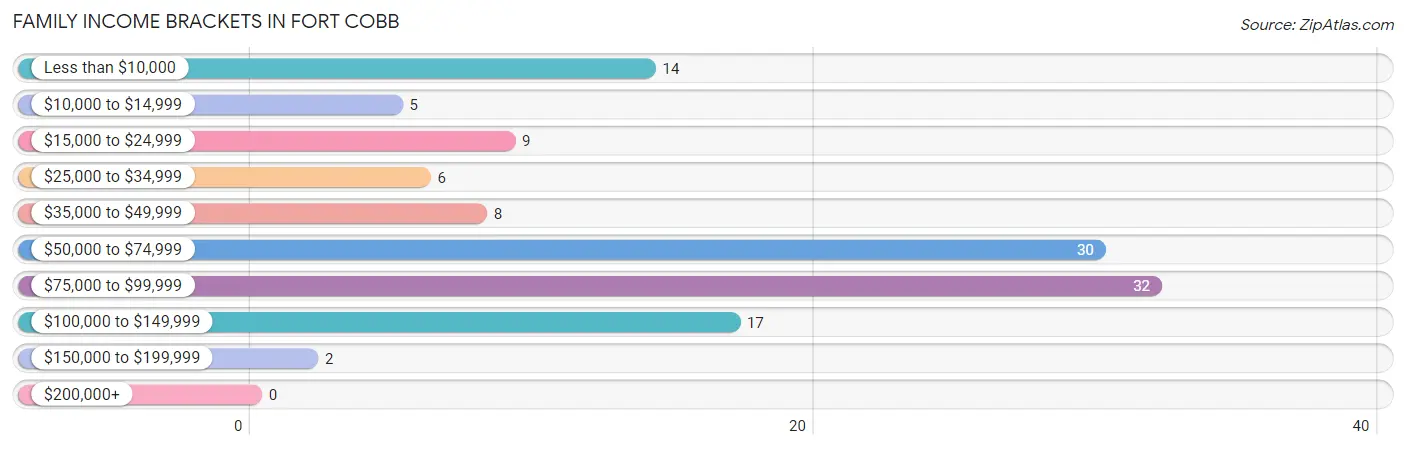
| Income Bracket | # Families | % Families |
| Less than $10,000 | 14 | 11.4% |
| $10,000 to $14,999 | 5 | 4.1% |
| $15,000 to $24,999 | 9 | 7.3% |
| $25,000 to $34,999 | 6 | 4.9% |
| $35,000 to $49,999 | 8 | 6.5% |
| $50,000 to $74,999 | 30 | 24.4% |
| $75,000 to $99,999 | 32 | 26.0% |
| $100,000 to $149,999 | 17 | 13.8% |
| $150,000 to $199,999 | 2 | 1.6% |
| $200,000+ | 0 | 0.0% |
Family Income by Famaliy Size in Fort Cobb
6-person families (4 | 3.3%) account for the highest median family income in Fort Cobb with $83,750 per family, while 2-person families (64 | 52.0%) have the highest median income of $36,875 per family member.
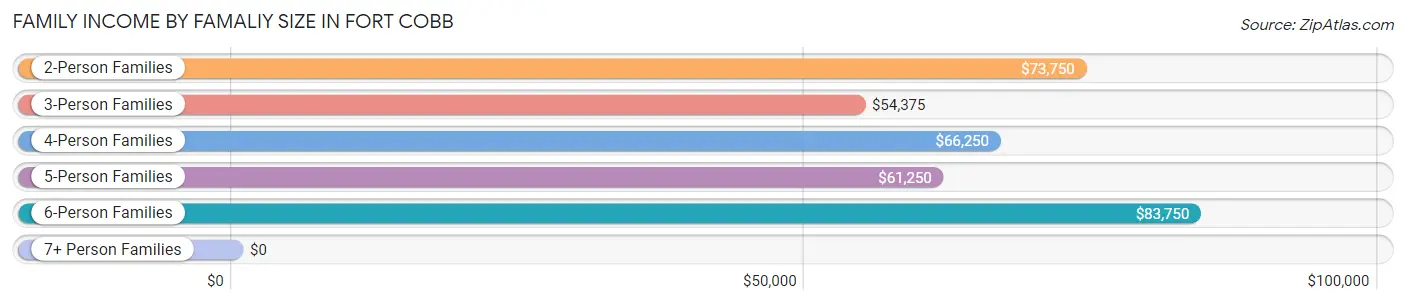
| Income Bracket | # Families | Median Income |
| 2-Person Families | 64 (52.0%) | $73,750 |
| 3-Person Families | 29 (23.6%) | $54,375 |
| 4-Person Families | 13 (10.6%) | $66,250 |
| 5-Person Families | 12 (9.8%) | $61,250 |
| 6-Person Families | 4 (3.3%) | $83,750 |
| 7+ Person Families | 1 (0.8%) | $0 |
| Total | 123 (100.0%) | $62,083 |
Family Income by Number of Earners in Fort Cobb
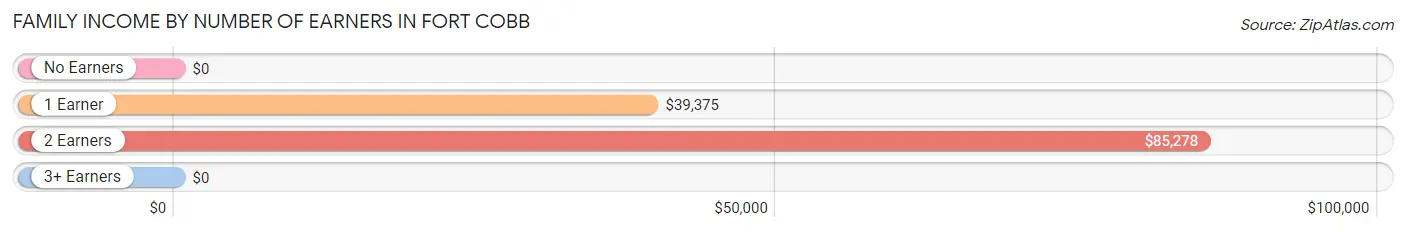
| Number of Earners | # Families | Median Income |
| No Earners | 29 (23.6%) | $0 |
| 1 Earner | 31 (25.2%) | $39,375 |
| 2 Earners | 62 (50.4%) | $85,278 |
| 3+ Earners | 1 (0.8%) | $0 |
| Total | 123 (100.0%) | $62,083 |
Household Income in Fort Cobb
Household Income Brackets in Fort Cobb
With 49 households falling in the category, the $50,000 to $74,999 income range is the most frequent in Fort Cobb, accounting for 24.3% of all households.
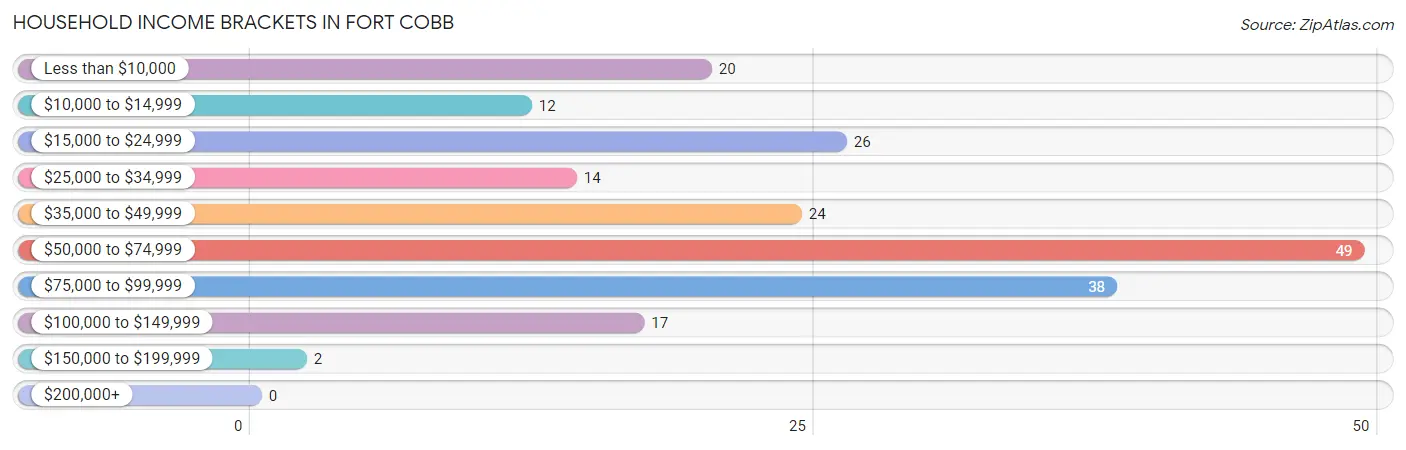
| Income Bracket | # Households | % Households |
| Less than $10,000 | 20 | 9.9% |
| $10,000 to $14,999 | 12 | 5.9% |
| $15,000 to $24,999 | 26 | 12.9% |
| $25,000 to $34,999 | 14 | 6.9% |
| $35,000 to $49,999 | 24 | 11.9% |
| $50,000 to $74,999 | 49 | 24.3% |
| $75,000 to $99,999 | 38 | 18.8% |
| $100,000 to $149,999 | 17 | 8.4% |
| $150,000 to $199,999 | 2 | 1.0% |
| $200,000+ | 0 | 0.0% |
Household Income by Householder Age in Fort Cobb
The median household income in Fort Cobb is $52,700, with the highest median household income of $61,667 found in the 25 to 44 years age bracket for the primary householder. A total of 54 households (26.7%) fall into this category. Meanwhile, the 15 to 24 years age bracket for the primary householder has the lowest median household income of $0, with 6 households (3.0%) in this group.
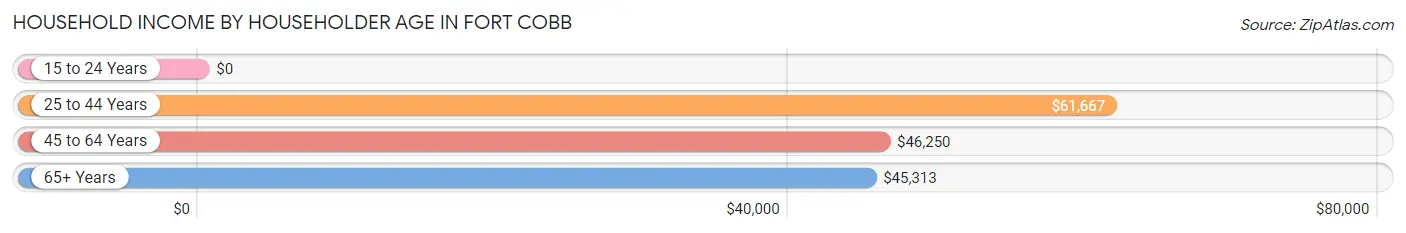
| Income Bracket | # Households | Median Income |
| 15 to 24 Years | 6 (3.0%) | $0 |
| 25 to 44 Years | 54 (26.7%) | $61,667 |
| 45 to 64 Years | 73 (36.1%) | $46,250 |
| 65+ Years | 69 (34.2%) | $45,313 |
| Total | 202 (100.0%) | $52,700 |
Poverty in Fort Cobb
Income Below Poverty by Sex and Age in Fort Cobb
With 21.3% poverty level for males and 28.4% for females among the residents of Fort Cobb, 55 to 64 year old males and 15 year old females are the most vulnerable to poverty, with 15 males (44.1%) and 4 females (100.0%) in their respective age groups living below the poverty level.
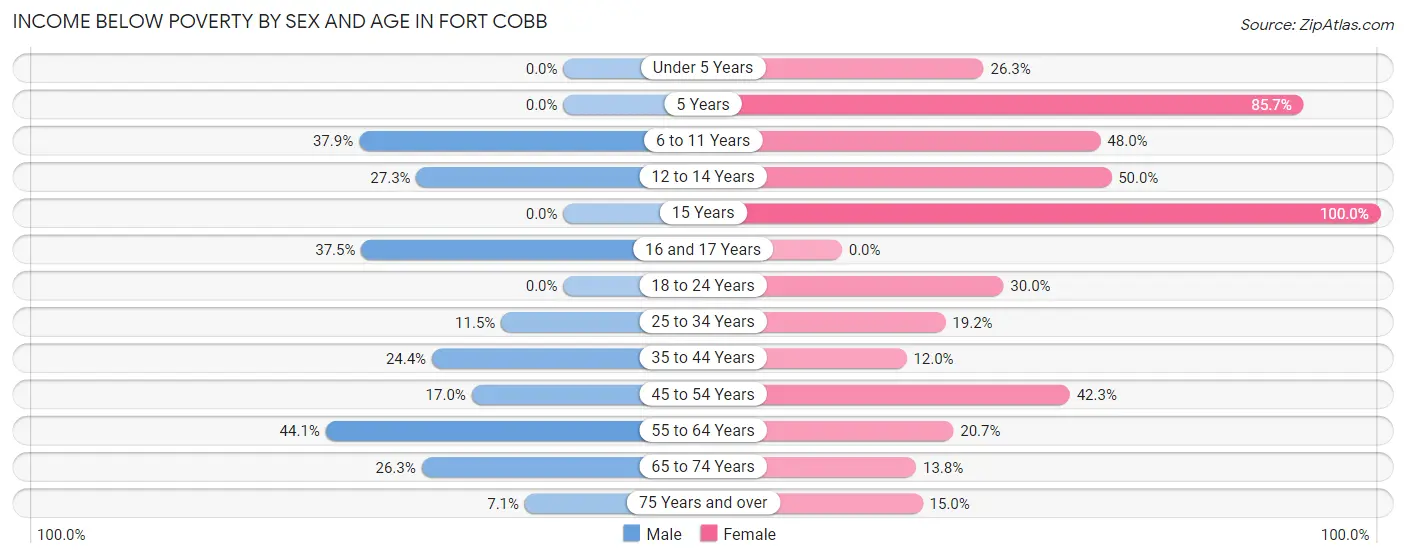
| Age Bracket | Male | Female |
| Under 5 Years | 0 (0.0%) | 5 (26.3%) |
| 5 Years | 0 (0.0%) | 6 (85.7%) |
| 6 to 11 Years | 11 (37.9%) | 12 (48.0%) |
| 12 to 14 Years | 3 (27.3%) | 1 (50.0%) |
| 15 Years | 0 (0.0%) | 4 (100.0%) |
| 16 and 17 Years | 3 (37.5%) | 0 (0.0%) |
| 18 to 24 Years | 0 (0.0%) | 3 (30.0%) |
| 25 to 34 Years | 3 (11.5%) | 5 (19.2%) |
| 35 to 44 Years | 10 (24.4%) | 3 (12.0%) |
| 45 to 54 Years | 8 (17.0%) | 11 (42.3%) |
| 55 to 64 Years | 15 (44.1%) | 6 (20.7%) |
| 65 to 74 Years | 5 (26.3%) | 4 (13.8%) |
| 75 Years and over | 1 (7.1%) | 3 (15.0%) |
| Total | 59 (21.3%) | 63 (28.4%) |
Income Above Poverty by Sex and Age in Fort Cobb
According to the poverty statistics in Fort Cobb, males aged under 5 years and females aged 35 to 44 years are the age groups that are most secure financially, with 100.0% of males and 88.0% of females in these age groups living above the poverty line.
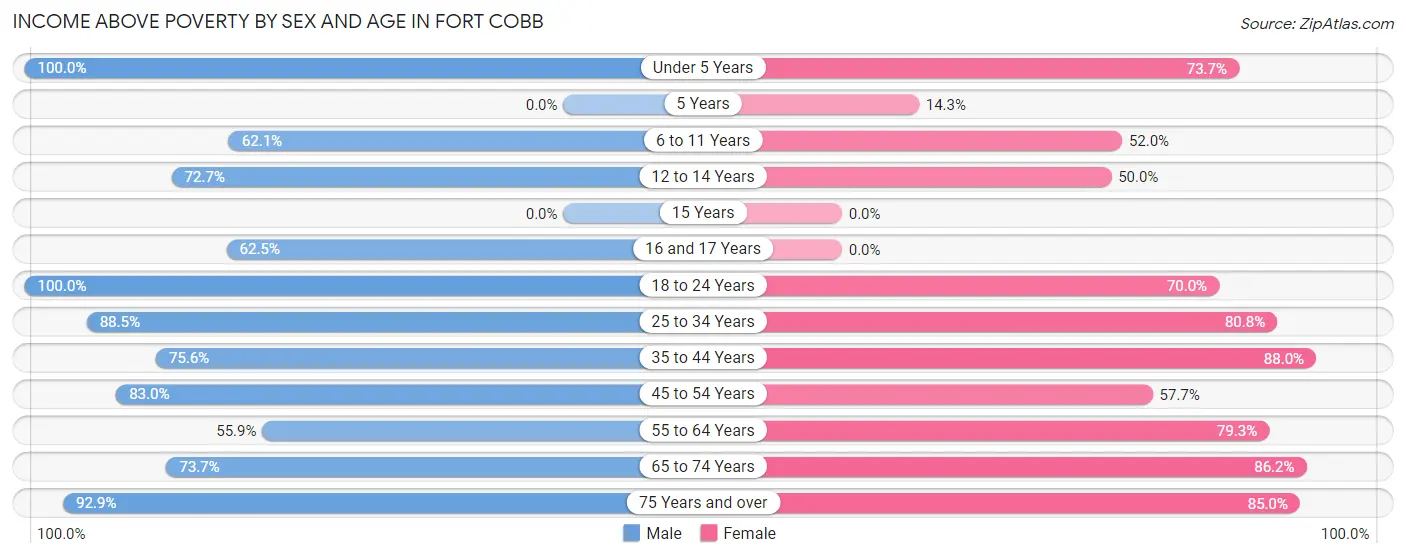
| Age Bracket | Male | Female |
| Under 5 Years | 17 (100.0%) | 14 (73.7%) |
| 5 Years | 0 (0.0%) | 1 (14.3%) |
| 6 to 11 Years | 18 (62.1%) | 13 (52.0%) |
| 12 to 14 Years | 8 (72.7%) | 1 (50.0%) |
| 15 Years | 0 (0.0%) | 0 (0.0%) |
| 16 and 17 Years | 5 (62.5%) | 0 (0.0%) |
| 18 to 24 Years | 31 (100.0%) | 7 (70.0%) |
| 25 to 34 Years | 23 (88.5%) | 21 (80.8%) |
| 35 to 44 Years | 31 (75.6%) | 22 (88.0%) |
| 45 to 54 Years | 39 (83.0%) | 15 (57.7%) |
| 55 to 64 Years | 19 (55.9%) | 23 (79.3%) |
| 65 to 74 Years | 14 (73.7%) | 25 (86.2%) |
| 75 Years and over | 13 (92.9%) | 17 (85.0%) |
| Total | 218 (78.7%) | 159 (71.6%) |
Income Below Poverty Among Married-Couple Families in Fort Cobb
The poverty statistics for married-couple families in Fort Cobb show that 7.9% or 7 of the total 89 families live below the poverty line. Families with 5 or more children have the highest poverty rate of 100.0%, comprising of 1 families. On the other hand, families with 3 or 4 children have the lowest poverty rate of 0.0%, which includes 0 families.
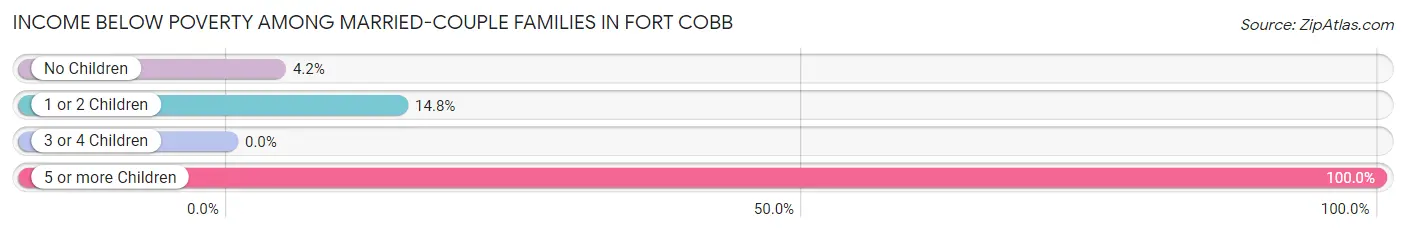
| Children | Above Poverty | Below Poverty |
| No Children | 46 (95.8%) | 2 (4.2%) |
| 1 or 2 Children | 23 (85.2%) | 4 (14.8%) |
| 3 or 4 Children | 13 (100.0%) | 0 (0.0%) |
| 5 or more Children | 0 (0.0%) | 1 (100.0%) |
| Total | 82 (92.1%) | 7 (7.9%) |
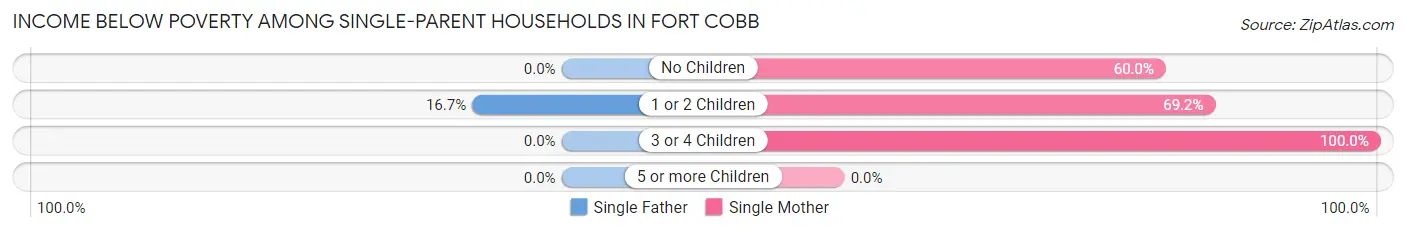
Income Below Poverty Among Single-Parent Households in Fort Cobb
According to the poverty data in Fort Cobb, 12.5% or 1 single-father households and 69.2% or 18 single-mother households are living below the poverty line. Among single-father households, those with 1 or 2 children have the highest poverty rate, with 1 households (16.7%) experiencing poverty. Likewise, among single-mother households, those with 3 or 4 children have the highest poverty rate, with 3 households (100.0%) falling below the poverty line.
| Children | Single Father | Single Mother |
| No Children | 0 (0.0%) | 6 (60.0%) |
| 1 or 2 Children | 1 (16.7%) | 9 (69.2%) |
| 3 or 4 Children | 0 (0.0%) | 3 (100.0%) |
| 5 or more Children | 0 (0.0%) | 0 (0.0%) |
| Total | 1 (12.5%) | 18 (69.2%) |
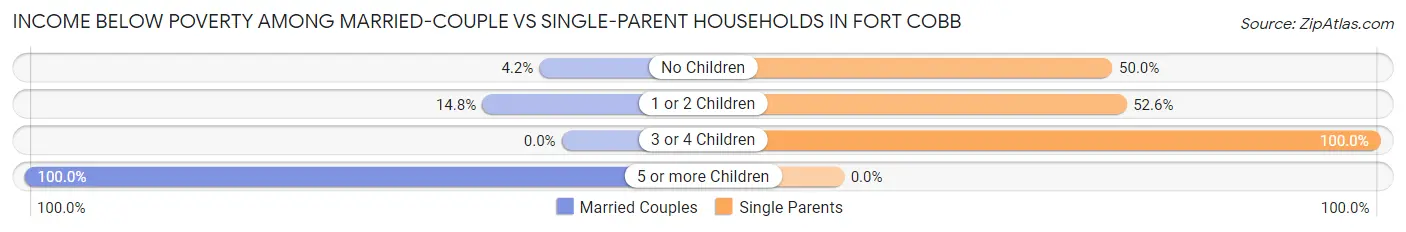
Income Below Poverty Among Married-Couple vs Single-Parent Households in Fort Cobb
The poverty data for Fort Cobb shows that 7 of the married-couple family households (7.9%) and 19 of the single-parent households (55.9%) are living below the poverty level. Within the married-couple family households, those with 5 or more children have the highest poverty rate, with 1 households (100.0%) falling below the poverty line. Among the single-parent households, those with 3 or 4 children have the highest poverty rate, with 3 household (100.0%) living below poverty.
| Children | Married-Couple Families | Single-Parent Households |
| No Children | 2 (4.2%) | 6 (50.0%) |
| 1 or 2 Children | 4 (14.8%) | 10 (52.6%) |
| 3 or 4 Children | 0 (0.0%) | 3 (100.0%) |
| 5 or more Children | 1 (100.0%) | 0 (0.0%) |
| Total | 7 (7.9%) | 19 (55.9%) |
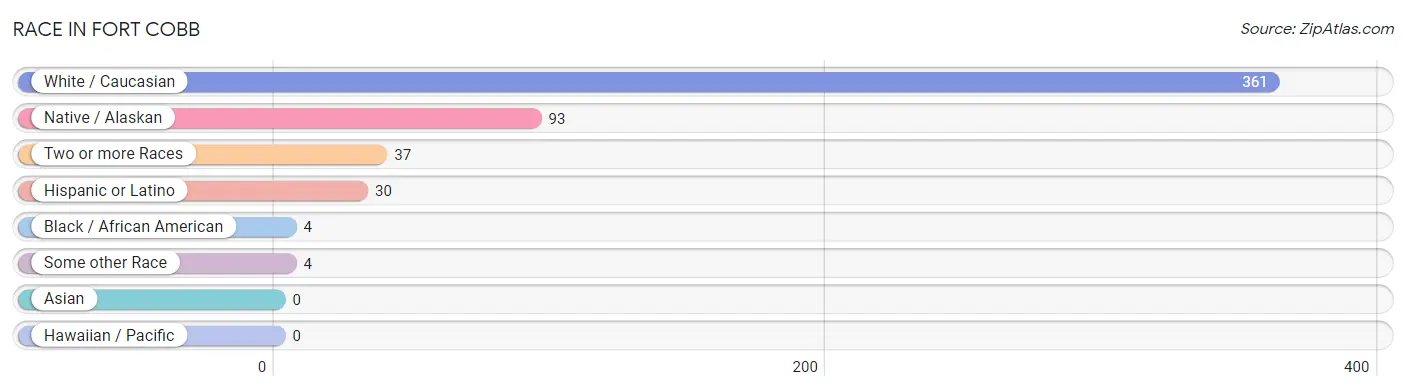
Race in Fort Cobb
The most populous races in Fort Cobb are White / Caucasian (361 | 72.3%), Native / Alaskan (93 | 18.6%), and Two or more Races (37 | 7.4%).
| Race | # Population | % Population |
| Asian | 0 | 0.0% |
| Black / African American | 4 | 0.8% |
| Hawaiian / Pacific | 0 | 0.0% |
| Hispanic or Latino | 30 | 6.0% |
| Native / Alaskan | 93 | 18.6% |
| White / Caucasian | 361 | 72.3% |
| Two or more Races | 37 | 7.4% |
| Some other Race | 4 | 0.8% |
| Total | 499 | 100.0% |
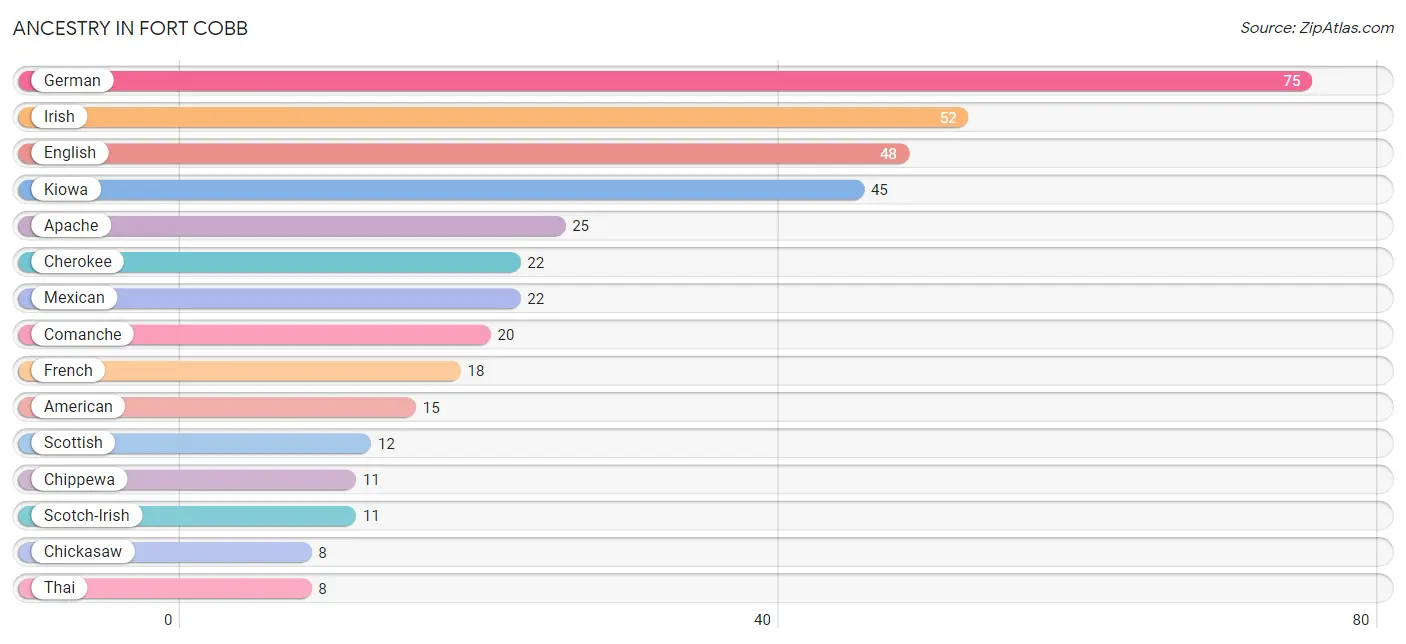
Ancestry in Fort Cobb
The most populous ancestries reported in Fort Cobb are German (75 | 15.0%), Irish (52 | 10.4%), English (48 | 9.6%), Kiowa (45 | 9.0%), and Apache (25 | 5.0%), together accounting for 49.1% of all Fort Cobb residents.
| Ancestry | # Population | % Population |
| American | 15 | 3.0% |
| Apache | 25 | 5.0% |
| Cherokee | 22 | 4.4% |
| Chickasaw | 8 | 1.6% |
| Chippewa | 11 | 2.2% |
| Choctaw | 3 | 0.6% |
| Comanche | 20 | 4.0% |
| Dutch | 2 | 0.4% |
| Dutch West Indian | 4 | 0.8% |
| Eastern European | 2 | 0.4% |
| English | 48 | 9.6% |
| European | 5 | 1.0% |
| French | 18 | 3.6% |
| German | 75 | 15.0% |
| Irish | 52 | 10.4% |
| Italian | 7 | 1.4% |
| Kiowa | 45 | 9.0% |
| Mexican | 22 | 4.4% |
| Native Hawaiian | 3 | 0.6% |
| Puerto Rican | 7 | 1.4% |
| Russian | 2 | 0.4% |
| Scandinavian | 3 | 0.6% |
| Scotch-Irish | 11 | 2.2% |
| Scottish | 12 | 2.4% |
| Swedish | 2 | 0.4% |
| Thai | 8 | 1.6% | View All 26 Rows |
Immigrants in Fort Cobb

| Immigration Origin | # Population | % Population | View All 0 Rows |
Sex and Age in Fort Cobb
Sex and Age in Fort Cobb
The most populous age groups in Fort Cobb are 50 to 54 Years (32 | 11.6%) for men and 5 to 9 Years (23 | 10.4%) for women.
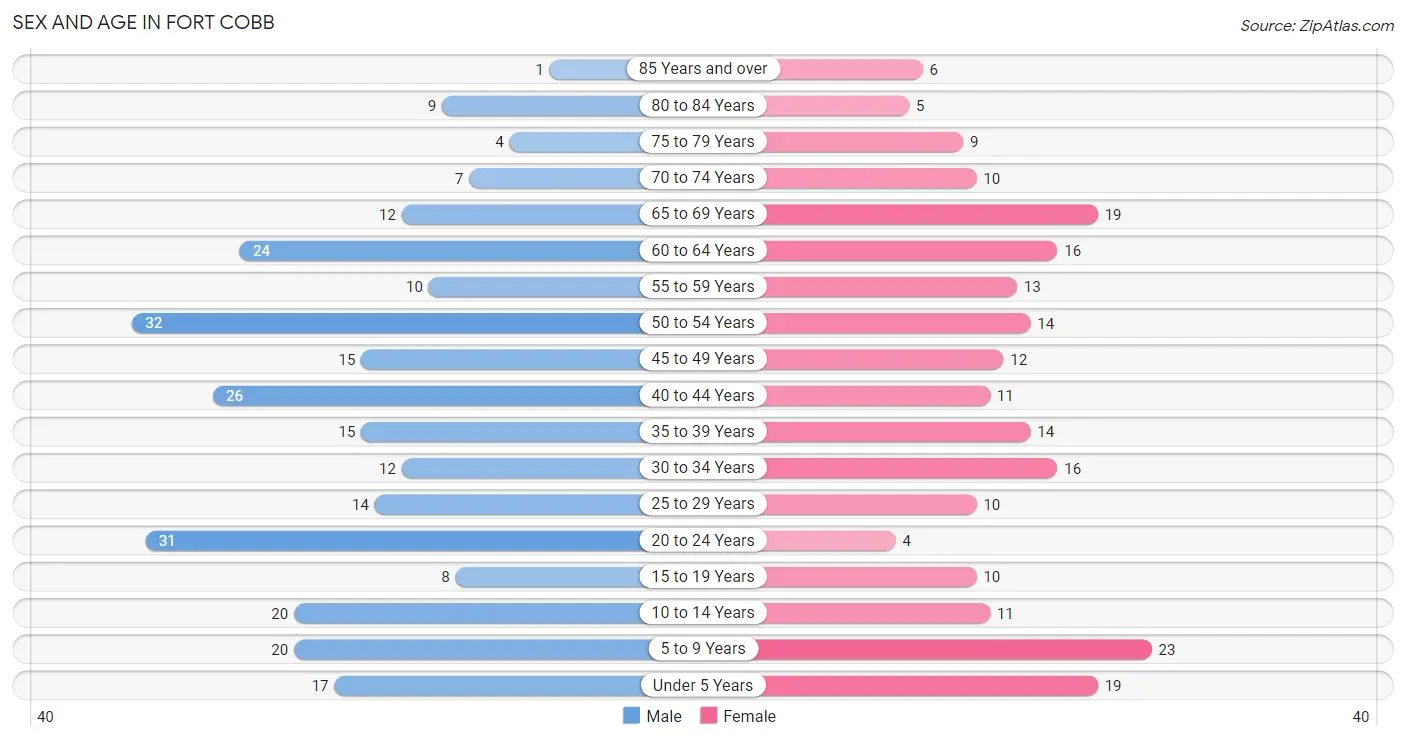
| Age Bracket | Male | Female |
| Under 5 Years | 17 (6.1%) | 19 (8.6%) |
| 5 to 9 Years | 20 (7.2%) | 23 (10.4%) |
| 10 to 14 Years | 20 (7.2%) | 11 (5.0%) |
| 15 to 19 Years | 8 (2.9%) | 10 (4.5%) |
| 20 to 24 Years | 31 (11.2%) | 4 (1.8%) |
| 25 to 29 Years | 14 (5.1%) | 10 (4.5%) |
| 30 to 34 Years | 12 (4.3%) | 16 (7.2%) |
| 35 to 39 Years | 15 (5.4%) | 14 (6.3%) |
| 40 to 44 Years | 26 (9.4%) | 11 (5.0%) |
| 45 to 49 Years | 15 (5.4%) | 12 (5.4%) |
| 50 to 54 Years | 32 (11.6%) | 14 (6.3%) |
| 55 to 59 Years | 10 (3.6%) | 13 (5.9%) |
| 60 to 64 Years | 24 (8.7%) | 16 (7.2%) |
| 65 to 69 Years | 12 (4.3%) | 19 (8.6%) |
| 70 to 74 Years | 7 (2.5%) | 10 (4.5%) |
| 75 to 79 Years | 4 (1.4%) | 9 (4.1%) |
| 80 to 84 Years | 9 (3.3%) | 5 (2.2%) |
| 85 Years and over | 1 (0.4%) | 6 (2.7%) |
| Total | 277 (100.0%) | 222 (100.0%) |
Families and Households in Fort Cobb
Median Family Size in Fort Cobb
The median family size in Fort Cobb is 3.20 persons per family, with single male/father families (8 | 6.5%) accounting for the largest median family size of 3.38 persons per family. On the other hand, married-couple families (89 | 72.4%) represent the smallest median family size with 3.15 persons per family.
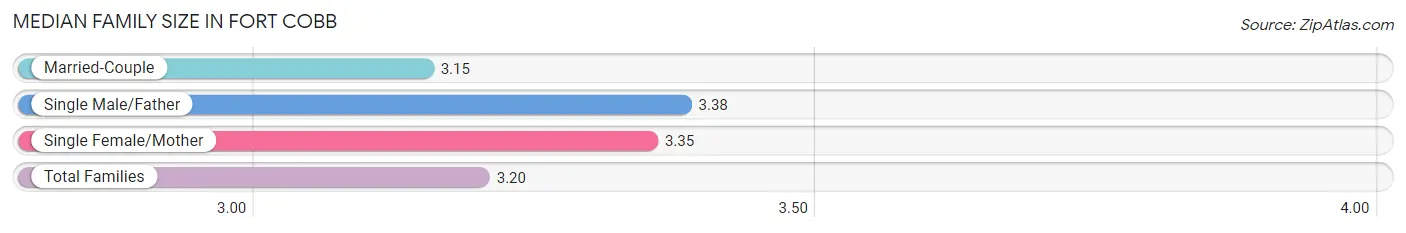
| Family Type | # Families | Family Size |
| Married-Couple | 89 (72.4%) | 3.15 |
| Single Male/Father | 8 (6.5%) | 3.38 |
| Single Female/Mother | 26 (21.1%) | 3.35 |
| Total Families | 123 (100.0%) | 3.20 |
Median Household Size in Fort Cobb
The median household size in Fort Cobb is 2.47 persons per household, with single male/father households (8 | 4.0%) accounting for the largest median household size of 4 persons per household. non-family households (79 | 39.1%) represent the smallest median household size with 1.24 persons per household.
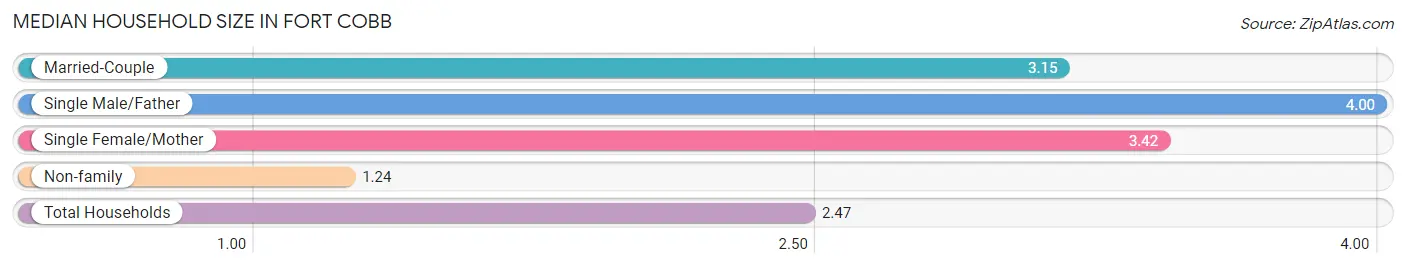
| Household Type | # Households | Household Size |
| Married-Couple | 89 (44.1%) | 3.15 |
| Single Male/Father | 8 (4.0%) | 4.00 |
| Single Female/Mother | 26 (12.9%) | 3.42 |
| Non-family | 79 (39.1%) | 1.24 |
| Total Households | 202 (100.0%) | 2.47 |
Household Size by Marriage Status in Fort Cobb
Out of a total of 202 households in Fort Cobb, 123 (60.9%) are family households, while 79 (39.1%) are nonfamily households. The most numerous type of family households are 2-person households, comprising 61, and the most common type of nonfamily households are 1-person households, comprising 65.
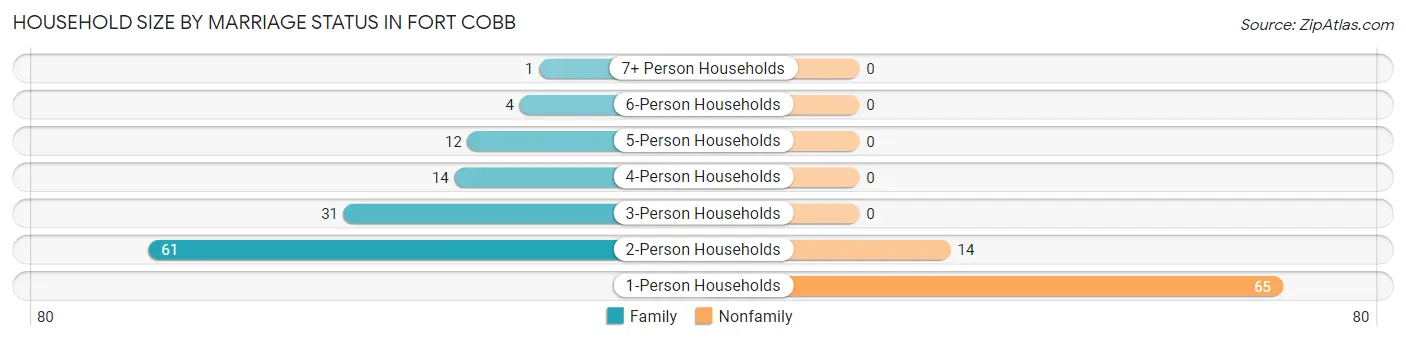
| Household Size | Family Households | Nonfamily Households |
| 1-Person Households | - | 65 (32.2%) |
| 2-Person Households | 61 (30.2%) | 14 (6.9%) |
| 3-Person Households | 31 (15.3%) | 0 (0.0%) |
| 4-Person Households | 14 (6.9%) | 0 (0.0%) |
| 5-Person Households | 12 (5.9%) | 0 (0.0%) |
| 6-Person Households | 4 (2.0%) | 0 (0.0%) |
| 7+ Person Households | 1 (0.5%) | 0 (0.0%) |
| Total | 123 (60.9%) | 79 (39.1%) |
Female Fertility in Fort Cobb
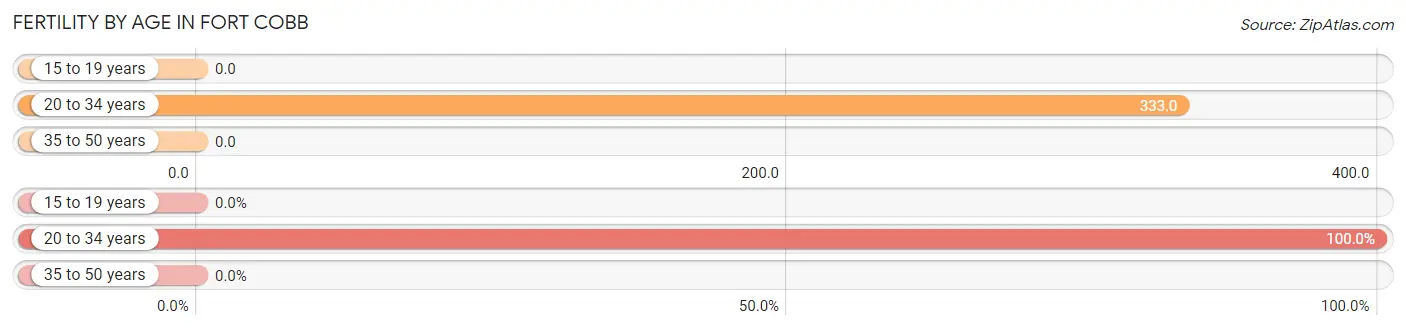
Fertility by Age in Fort Cobb
Average fertility rate in Fort Cobb is 127.0 births per 1,000 women. Women in the age bracket of 20 to 34 years have the highest fertility rate with 333.0 births per 1,000 women. Women in the age bracket of 20 to 34 years acount for 100.0% of all women with births.
| Age Bracket | Women with Births | Births / 1,000 Women |
| 15 to 19 years | 0 (0.0%) | 0.0 |
| 20 to 34 years | 10 (100.0%) | 333.0 |
| 35 to 50 years | 0 (0.0%) | 0.0 |
| Total | 10 (100.0%) | 127.0 |
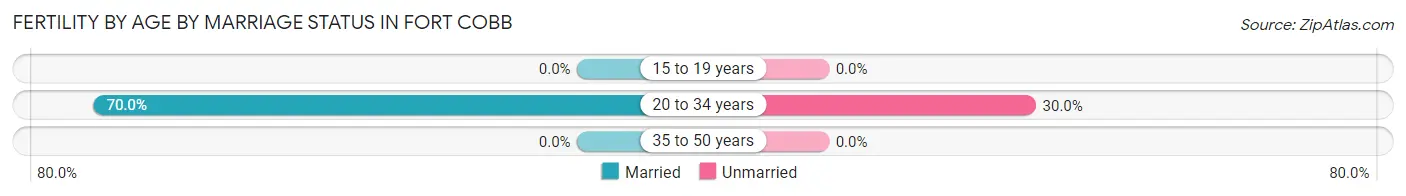
Fertility by Age by Marriage Status in Fort Cobb
70.0% of women with births (10) in Fort Cobb are married. The highest percentage of unmarried women with births falls into 20 to 34 years age bracket with 30.0% of them unmarried at the time of birth, while the lowest percentage of unmarried women with births belong to 20 to 34 years age bracket with 30.0% of them unmarried.
| Age Bracket | Married | Unmarried |
| 15 to 19 years | 0 (0.0%) | 0 (0.0%) |
| 20 to 34 years | 7 (70.0%) | 3 (30.0%) |
| 35 to 50 years | 0 (0.0%) | 0 (0.0%) |
| Total | 7 (70.0%) | 3 (30.0%) |
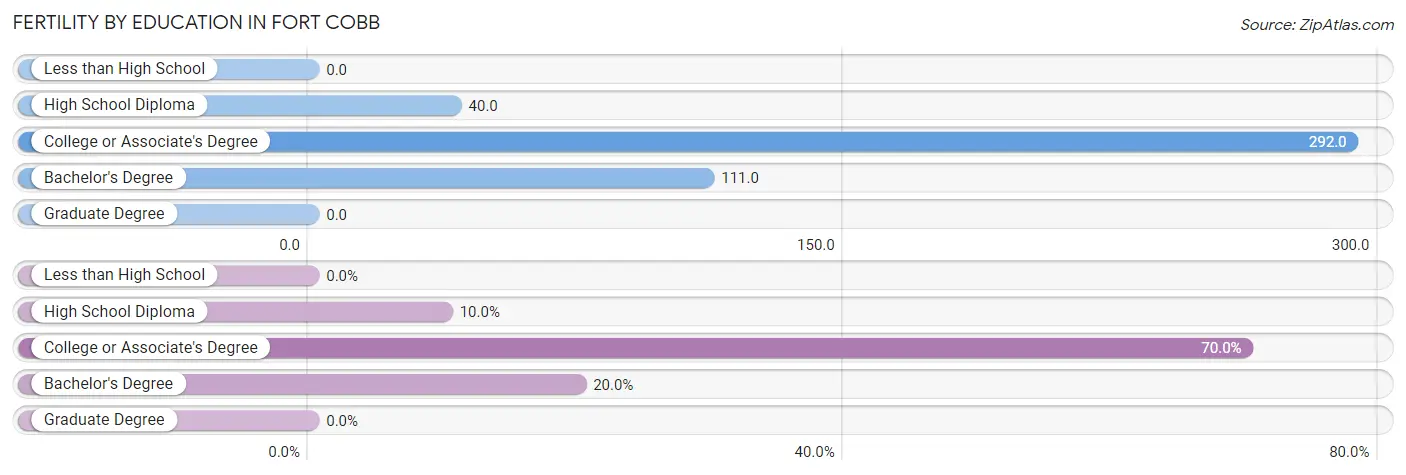
Fertility by Education in Fort Cobb
| Educational Attainment | Women with Births | Births / 1,000 Women |
| Less than High School | 0 (0.0%) | 0.0 |
| High School Diploma | 1 (10.0%) | 40.0 |
| College or Associate's Degree | 7 (70.0%) | 292.0 |
| Bachelor's Degree | 2 (20.0%) | 111.0 |
| Graduate Degree | 0 (0.0%) | 0.0 |
| Total | 10 (100.0%) | 127.0 |
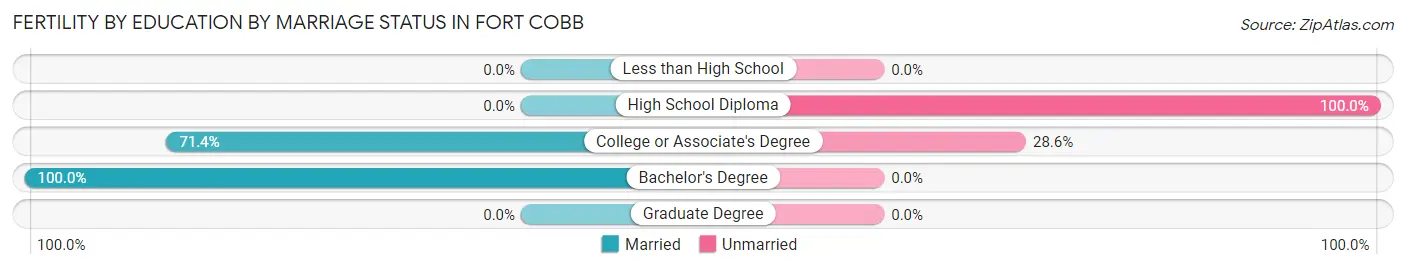
Fertility by Education by Marriage Status in Fort Cobb
30.0% of women with births in Fort Cobb are unmarried. Women with the educational attainment of bachelor's degree are most likely to be married with 100.0% of them married at childbirth, while women with the educational attainment of high school diploma are least likely to be married with 100.0% of them unmarried at childbirth.
| Educational Attainment | Married | Unmarried |
| Less than High School | 0 (0.0%) | 0 (0.0%) |
| High School Diploma | 0 (0.0%) | 1 (100.0%) |
| College or Associate's Degree | 5 (71.4%) | 2 (28.6%) |
| Bachelor's Degree | 2 (100.0%) | 0 (0.0%) |
| Graduate Degree | 0 (0.0%) | 0 (0.0%) |
| Total | 7 (70.0%) | 3 (30.0%) |
Employment Characteristics in Fort Cobb
Employment by Class of Employer in Fort Cobb
Among the 195 employed individuals in Fort Cobb, private company employees (97 | 49.7%), state government employees (26 | 13.3%), and federal government employees (22 | 11.3%) make up the most common classes of employment.
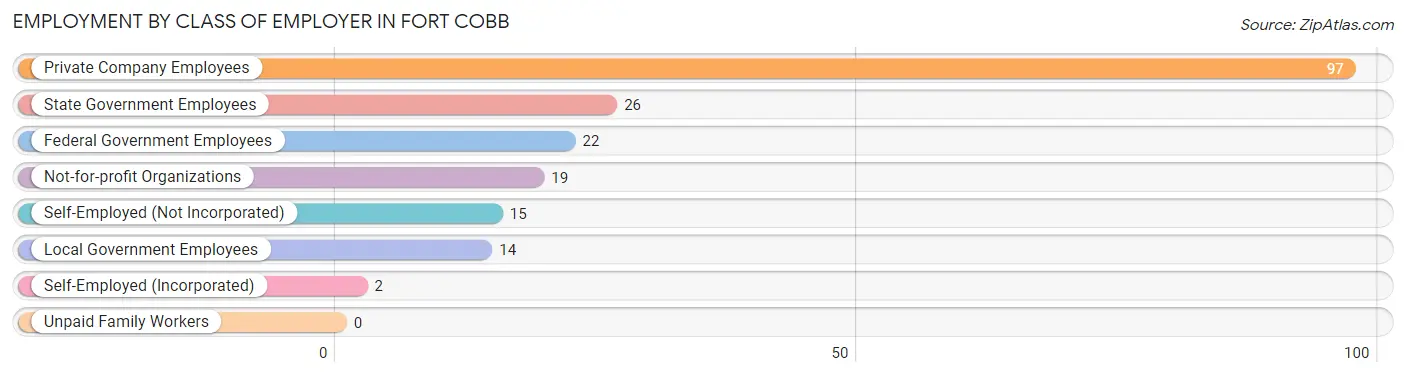
| Employer Class | # Employees | % Employees |
| Private Company Employees | 97 | 49.7% |
| Self-Employed (Incorporated) | 2 | 1.0% |
| Self-Employed (Not Incorporated) | 15 | 7.7% |
| Not-for-profit Organizations | 19 | 9.7% |
| Local Government Employees | 14 | 7.2% |
| State Government Employees | 26 | 13.3% |
| Federal Government Employees | 22 | 11.3% |
| Unpaid Family Workers | 0 | 0.0% |
| Total | 195 | 100.0% |
Employment Status by Age in Fort Cobb
According to the labor force statistics for Fort Cobb, out of the total population over 16 years of age (385), 56.1% or 216 individuals are in the labor force, with 0.9% or 2 of them unemployed. The age group with the highest labor force participation rate is 25 to 29 years, with 87.5% or 21 individuals in the labor force. Within the labor force, the 55 to 59 years age range has the highest percentage of unemployed individuals, with 5.9% or 1 of them being unemployed.
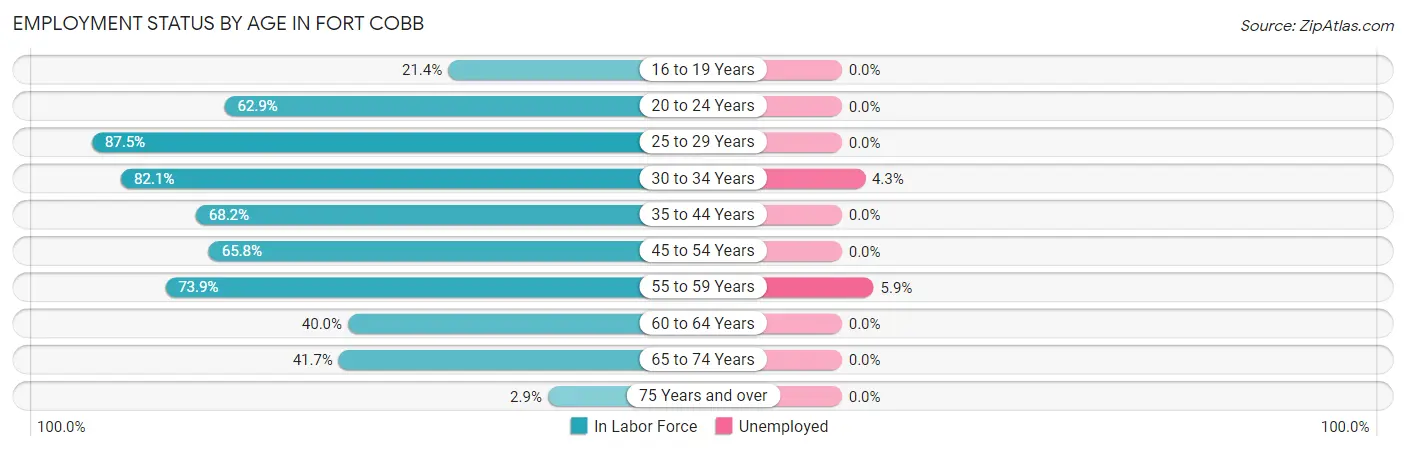
| Age Bracket | In Labor Force | Unemployed |
| 16 to 19 Years | 3 (21.4%) | 0 (0.0%) |
| 20 to 24 Years | 22 (62.9%) | 0 (0.0%) |
| 25 to 29 Years | 21 (87.5%) | 0 (0.0%) |
| 30 to 34 Years | 23 (82.1%) | 1 (4.3%) |
| 35 to 44 Years | 45 (68.2%) | 0 (0.0%) |
| 45 to 54 Years | 48 (65.8%) | 0 (0.0%) |
| 55 to 59 Years | 17 (73.9%) | 1 (5.9%) |
| 60 to 64 Years | 16 (40.0%) | 0 (0.0%) |
| 65 to 74 Years | 20 (41.7%) | 0 (0.0%) |
| 75 Years and over | 1 (2.9%) | 0 (0.0%) |
| Total | 216 (56.1%) | 2 (0.9%) |
Employment Status by Educational Attainment in Fort Cobb
According to labor force statistics for Fort Cobb, 66.9% of individuals (170) out of the total population between 25 and 64 years of age (254) are in the labor force, with 1.2% or 2 of them being unemployed. The group with the highest labor force participation rate are those with the educational attainment of bachelor's degree or higher, with 94.1% or 64 individuals in the labor force. Within the labor force, individuals with college / associate degree education have the highest percentage of unemployment, with 5.0% or 2 of them being unemployed.
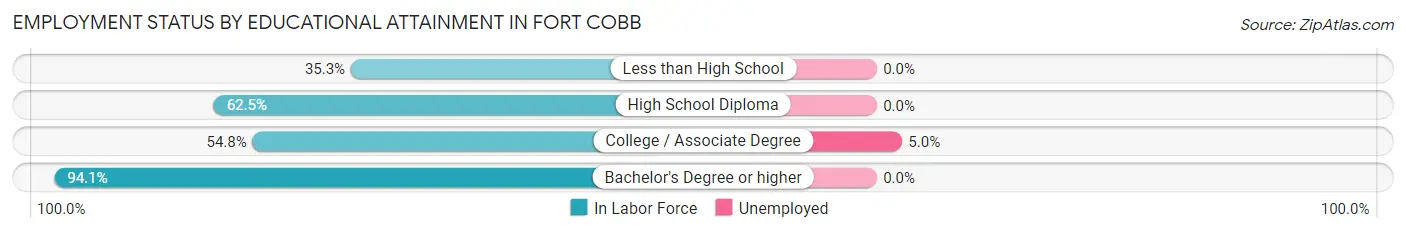
| Educational Attainment | In Labor Force | Unemployed |
| Less than High School | 6 (35.3%) | 0 (0.0%) |
| High School Diploma | 60 (62.5%) | 0 (0.0%) |
| College / Associate Degree | 40 (54.8%) | 4 (5.0%) |
| Bachelor's Degree or higher | 64 (94.1%) | 0 (0.0%) |
| Total | 170 (66.9%) | 3 (1.2%) |
Employment Occupations by Sex in Fort Cobb
Management, Business, Science and Arts Occupations
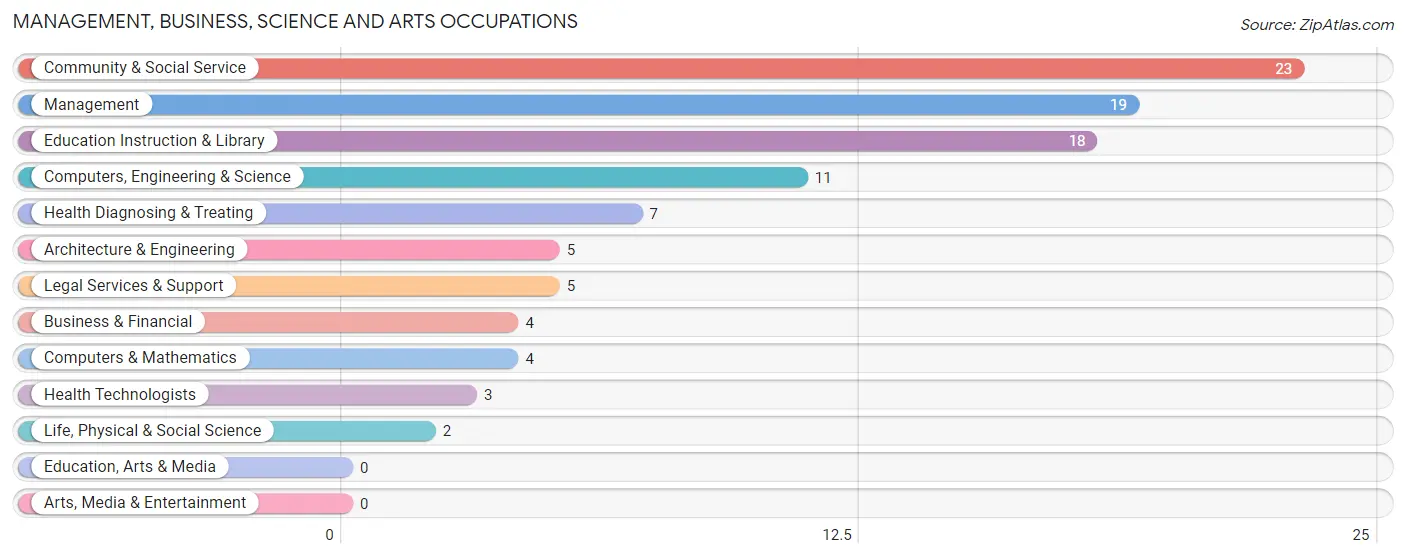
The most common Management, Business, Science and Arts occupations in Fort Cobb are Community & Social Service (23 | 10.7%), Management (19 | 8.9%), Education Instruction & Library (18 | 8.4%), Computers, Engineering & Science (11 | 5.1%), and Health Diagnosing & Treating (7 | 3.3%).
Management, Business, Science and Arts Occupations by Sex
Within the Management, Business, Science and Arts occupations in Fort Cobb, the most male-oriented occupations are Management (100.0%), Computers, Engineering & Science (100.0%), and Computers & Mathematics (100.0%), while the most female-oriented occupations are Business & Financial (100.0%), Health Technologists (100.0%), and Health Diagnosing & Treating (71.4%).
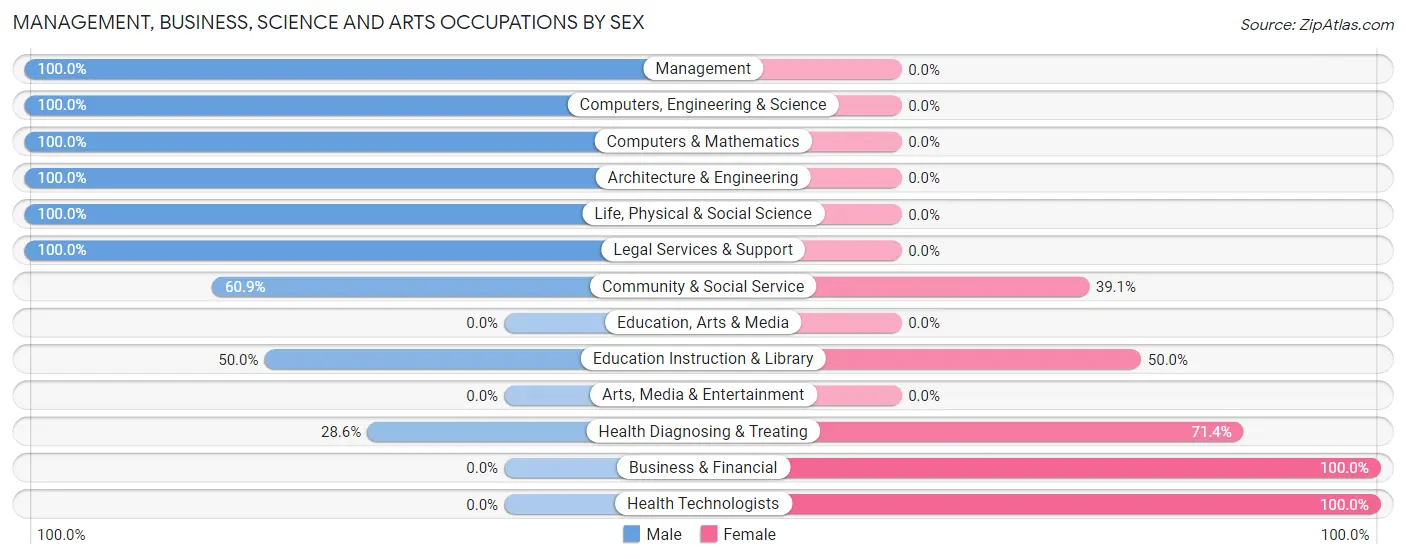
| Occupation | Male | Female |
| Management | 19 (100.0%) | 0 (0.0%) |
| Business & Financial | 0 (0.0%) | 4 (100.0%) |
| Computers, Engineering & Science | 11 (100.0%) | 0 (0.0%) |
| Computers & Mathematics | 4 (100.0%) | 0 (0.0%) |
| Architecture & Engineering | 5 (100.0%) | 0 (0.0%) |
| Life, Physical & Social Science | 2 (100.0%) | 0 (0.0%) |
| Community & Social Service | 14 (60.9%) | 9 (39.1%) |
| Education, Arts & Media | 0 (0.0%) | 0 (0.0%) |
| Legal Services & Support | 5 (100.0%) | 0 (0.0%) |
| Education Instruction & Library | 9 (50.0%) | 9 (50.0%) |
| Arts, Media & Entertainment | 0 (0.0%) | 0 (0.0%) |
| Health Diagnosing & Treating | 2 (28.6%) | 5 (71.4%) |
| Health Technologists | 0 (0.0%) | 3 (100.0%) |
| Total (Category) | 46 (71.9%) | 18 (28.1%) |
| Total (Overall) | 129 (60.3%) | 85 (39.7%) |
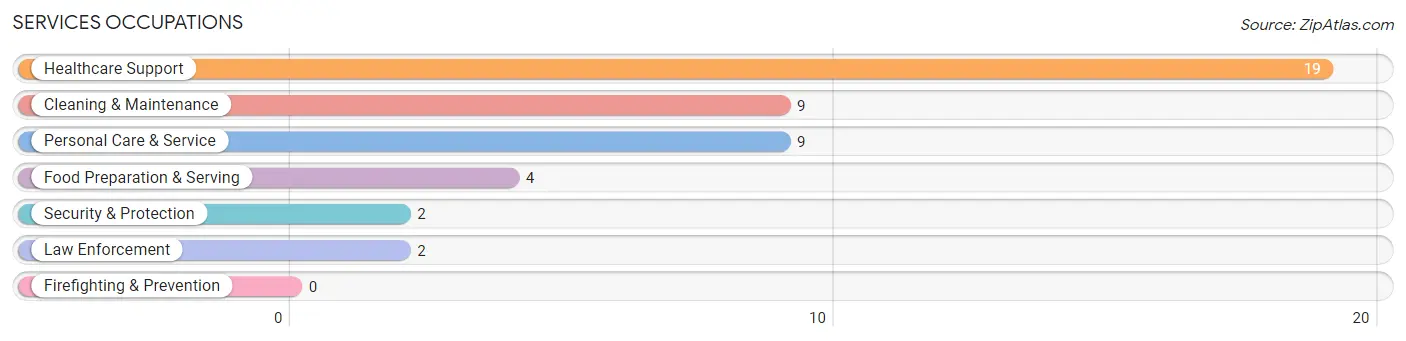
Services Occupations
The most common Services occupations in Fort Cobb are Healthcare Support (19 | 8.9%), Cleaning & Maintenance (9 | 4.2%), Personal Care & Service (9 | 4.2%), Food Preparation & Serving (4 | 1.9%), and Security & Protection (2 | 0.9%).
Services Occupations by Sex
Within the Services occupations in Fort Cobb, the most male-oriented occupations are Security & Protection (100.0%), Law Enforcement (100.0%), and Cleaning & Maintenance (100.0%), while the most female-oriented occupations are Personal Care & Service (77.8%), Food Preparation & Serving (75.0%), and Healthcare Support (36.8%).
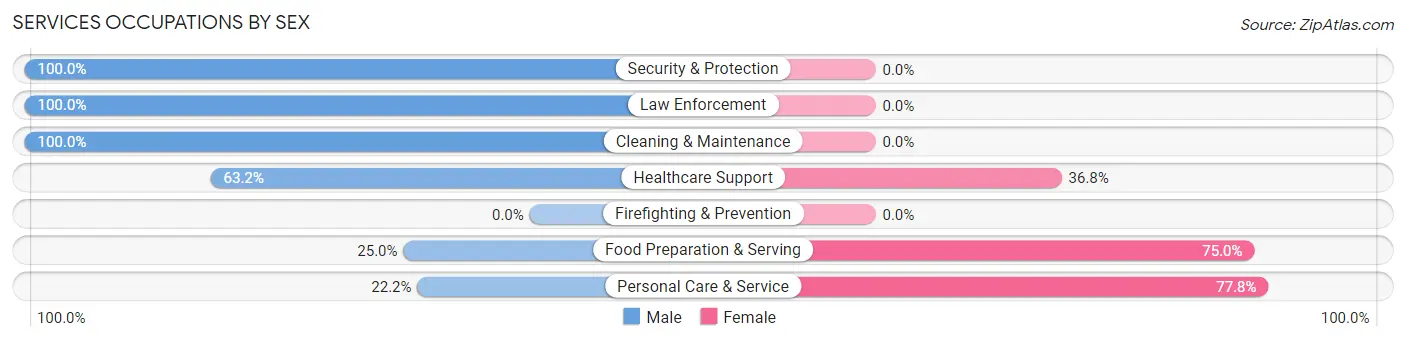
| Occupation | Male | Female |
| Healthcare Support | 12 (63.2%) | 7 (36.8%) |
| Security & Protection | 2 (100.0%) | 0 (0.0%) |
| Firefighting & Prevention | 0 (0.0%) | 0 (0.0%) |
| Law Enforcement | 2 (100.0%) | 0 (0.0%) |
| Food Preparation & Serving | 1 (25.0%) | 3 (75.0%) |
| Cleaning & Maintenance | 9 (100.0%) | 0 (0.0%) |
| Personal Care & Service | 2 (22.2%) | 7 (77.8%) |
| Total (Category) | 26 (60.5%) | 17 (39.5%) |
| Total (Overall) | 129 (60.3%) | 85 (39.7%) |
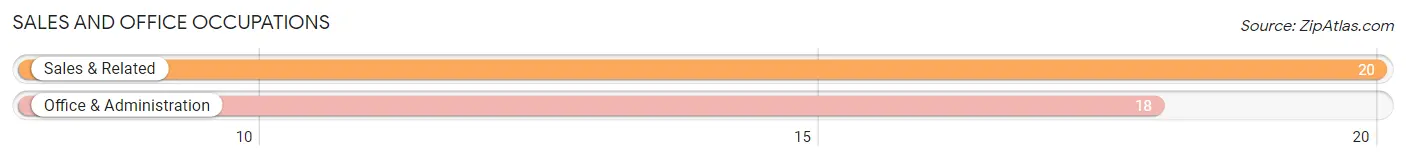
Sales and Office Occupations
The most common Sales and Office occupations in Fort Cobb are Sales & Related (20 | 9.3%), and Office & Administration (18 | 8.4%).
Sales and Office Occupations by Sex
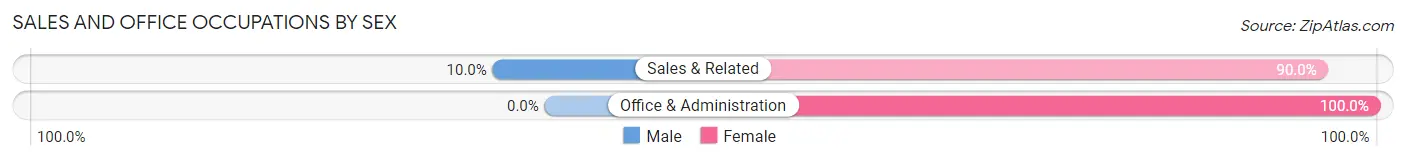
| Occupation | Male | Female |
| Sales & Related | 2 (10.0%) | 18 (90.0%) |
| Office & Administration | 0 (0.0%) | 18 (100.0%) |
| Total (Category) | 2 (5.3%) | 36 (94.7%) |
| Total (Overall) | 129 (60.3%) | 85 (39.7%) |
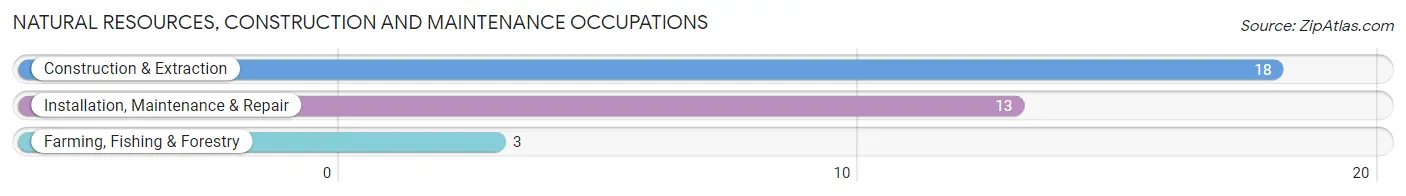
Natural Resources, Construction and Maintenance Occupations
The most common Natural Resources, Construction and Maintenance occupations in Fort Cobb are Construction & Extraction (18 | 8.4%), Installation, Maintenance & Repair (13 | 6.1%), and Farming, Fishing & Forestry (3 | 1.4%).
Natural Resources, Construction and Maintenance Occupations by Sex
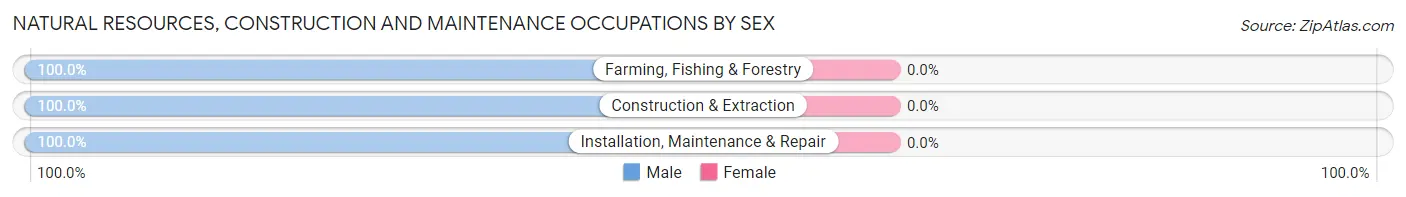
| Occupation | Male | Female |
| Farming, Fishing & Forestry | 3 (100.0%) | 0 (0.0%) |
| Construction & Extraction | 18 (100.0%) | 0 (0.0%) |
| Installation, Maintenance & Repair | 13 (100.0%) | 0 (0.0%) |
| Total (Category) | 34 (100.0%) | 0 (0.0%) |
| Total (Overall) | 129 (60.3%) | 85 (39.7%) |
Production, Transportation and Moving Occupations
The most common Production, Transportation and Moving occupations in Fort Cobb are Production (26 | 12.1%), and Transportation (9 | 4.2%).
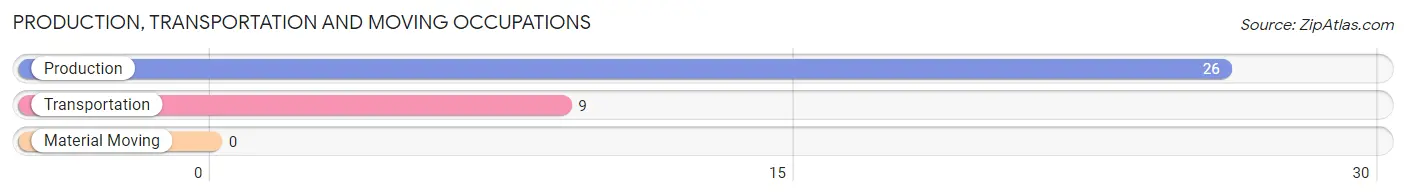
Production, Transportation and Moving Occupations by Sex
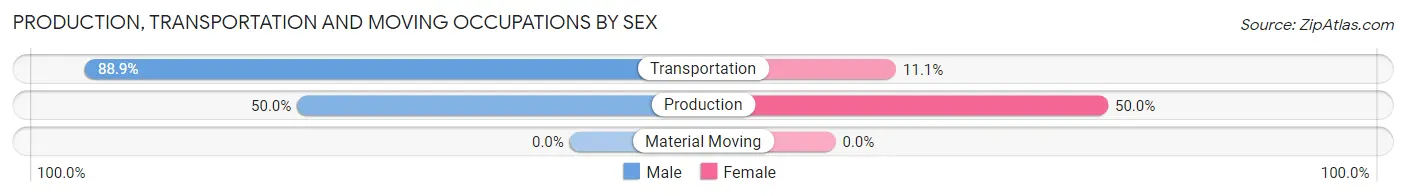
| Occupation | Male | Female |
| Production | 13 (50.0%) | 13 (50.0%) |
| Transportation | 8 (88.9%) | 1 (11.1%) |
| Material Moving | 0 (0.0%) | 0 (0.0%) |
| Total (Category) | 21 (60.0%) | 14 (40.0%) |
| Total (Overall) | 129 (60.3%) | 85 (39.7%) |
Employment Industries by Sex in Fort Cobb
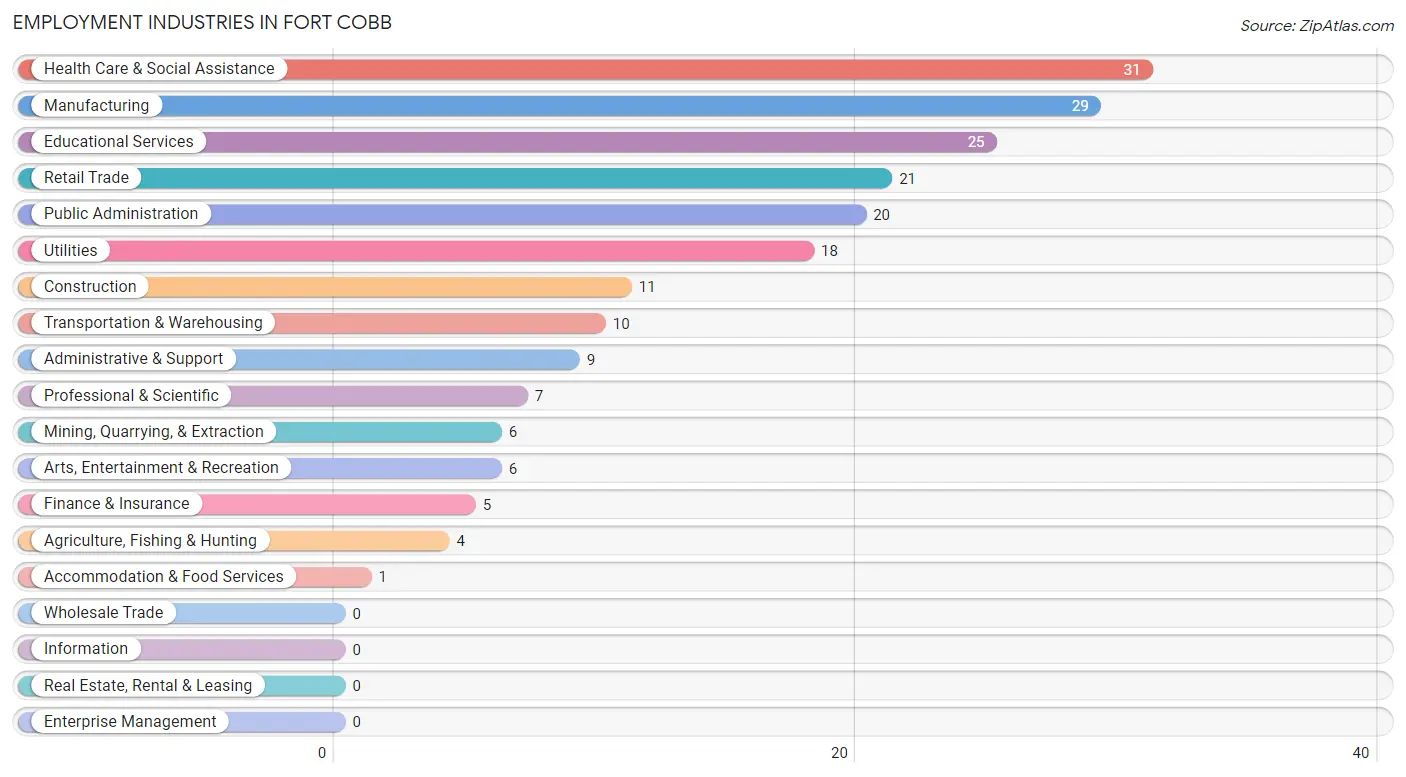
Employment Industries in Fort Cobb
The major employment industries in Fort Cobb include Health Care & Social Assistance (31 | 14.5%), Manufacturing (29 | 13.6%), Educational Services (25 | 11.7%), Retail Trade (21 | 9.8%), and Public Administration (20 | 9.3%).
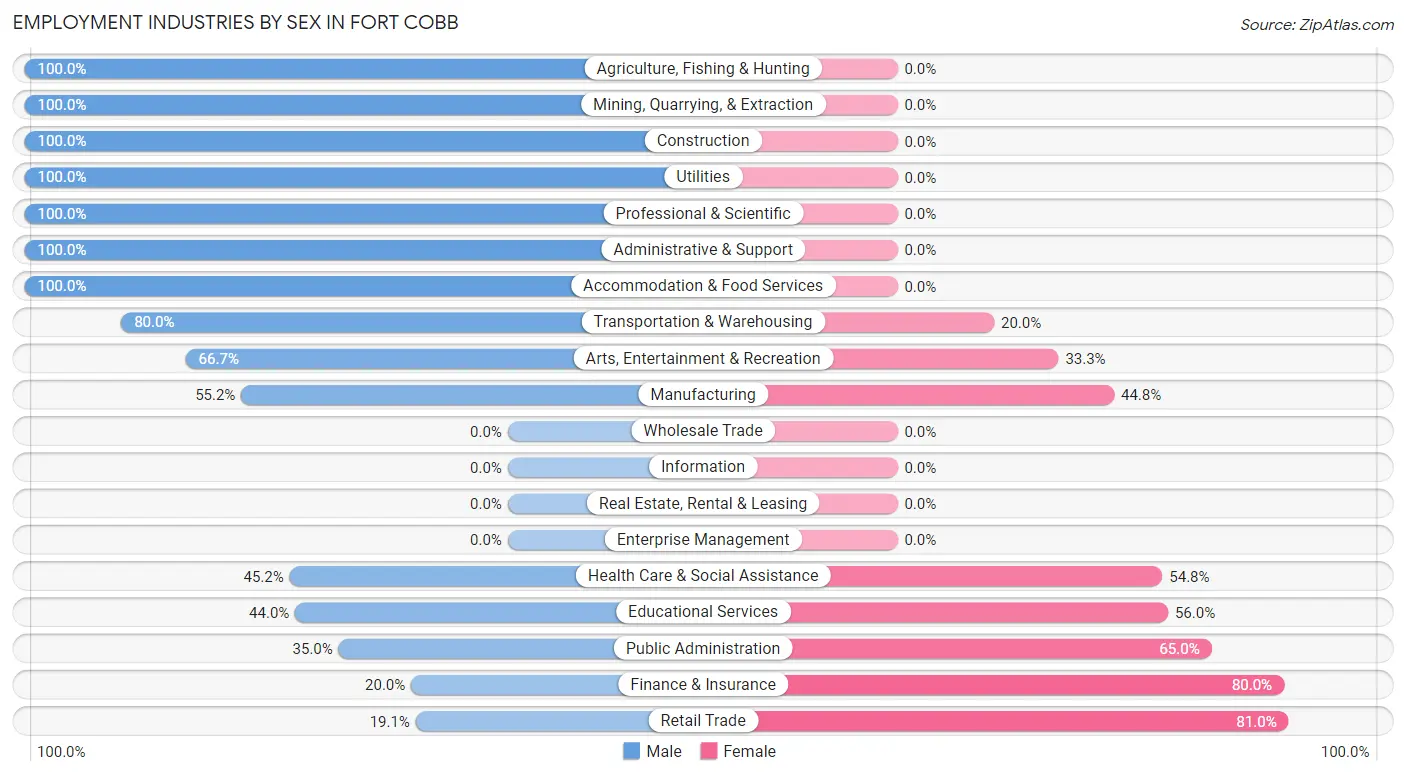
Employment Industries by Sex in Fort Cobb
The Fort Cobb industries that see more men than women are Agriculture, Fishing & Hunting (100.0%), Mining, Quarrying, & Extraction (100.0%), and Construction (100.0%), whereas the industries that tend to have a higher number of women are Retail Trade (80.9%), Finance & Insurance (80.0%), and Public Administration (65.0%).
| Industry | Male | Female |
| Agriculture, Fishing & Hunting | 4 (100.0%) | 0 (0.0%) |
| Mining, Quarrying, & Extraction | 6 (100.0%) | 0 (0.0%) |
| Construction | 11 (100.0%) | 0 (0.0%) |
| Manufacturing | 16 (55.2%) | 13 (44.8%) |
| Wholesale Trade | 0 (0.0%) | 0 (0.0%) |
| Retail Trade | 4 (19.1%) | 17 (80.9%) |
| Transportation & Warehousing | 8 (80.0%) | 2 (20.0%) |
| Utilities | 18 (100.0%) | 0 (0.0%) |
| Information | 0 (0.0%) | 0 (0.0%) |
| Finance & Insurance | 1 (20.0%) | 4 (80.0%) |
| Real Estate, Rental & Leasing | 0 (0.0%) | 0 (0.0%) |
| Professional & Scientific | 7 (100.0%) | 0 (0.0%) |
| Enterprise Management | 0 (0.0%) | 0 (0.0%) |
| Administrative & Support | 9 (100.0%) | 0 (0.0%) |
| Educational Services | 11 (44.0%) | 14 (56.0%) |
| Health Care & Social Assistance | 14 (45.2%) | 17 (54.8%) |
| Arts, Entertainment & Recreation | 4 (66.7%) | 2 (33.3%) |
| Accommodation & Food Services | 1 (100.0%) | 0 (0.0%) |
| Public Administration | 7 (35.0%) | 13 (65.0%) |
| Total | 129 (60.3%) | 85 (39.7%) |
Education in Fort Cobb
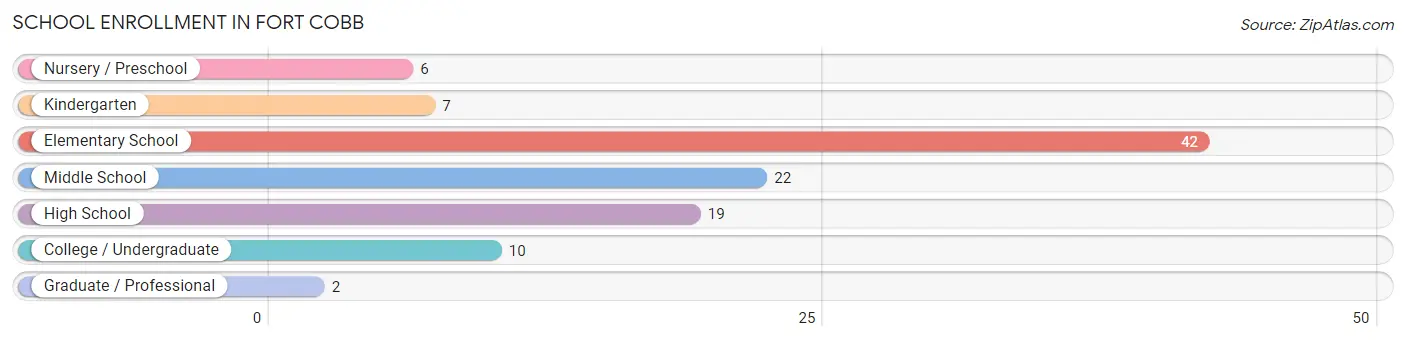
School Enrollment in Fort Cobb
The most common levels of schooling among the 108 students in Fort Cobb are elementary school (42 | 38.9%), middle school (22 | 20.4%), and high school (19 | 17.6%).
| School Level | # Students | % Students |
| Nursery / Preschool | 6 | 5.6% |
| Kindergarten | 7 | 6.5% |
| Elementary School | 42 | 38.9% |
| Middle School | 22 | 20.4% |
| High School | 19 | 17.6% |
| College / Undergraduate | 10 | 9.3% |
| Graduate / Professional | 2 | 1.8% |
| Total | 108 | 100.0% |
School Enrollment by Age by Funding Source in Fort Cobb
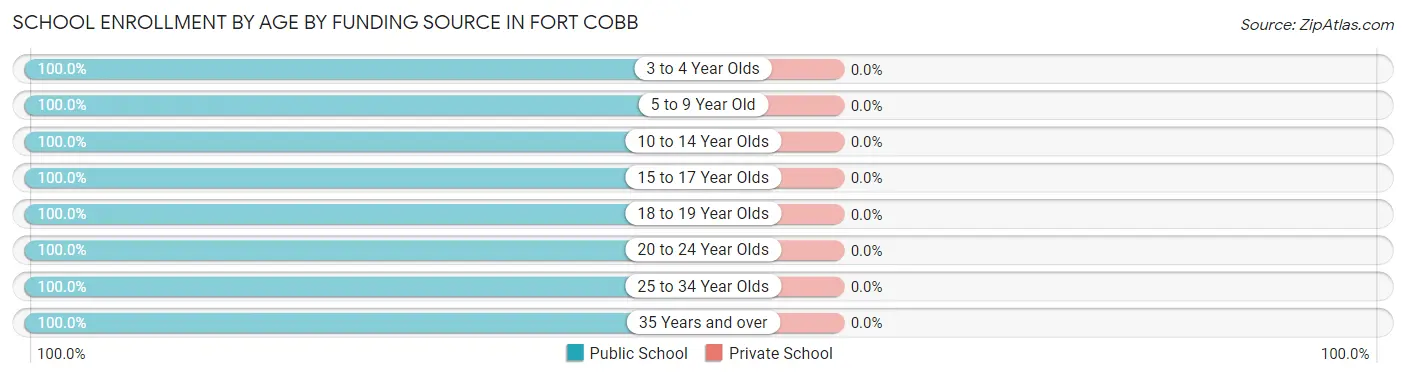
| Age Bracket | Public School | Private School |
| 3 to 4 Year Olds | 6 (100.0%) | 0 (0.0%) |
| 5 to 9 Year Old | 43 (100.0%) | 0 (0.0%) |
| 10 to 14 Year Olds | 29 (100.0%) | 0 (0.0%) |
| 15 to 17 Year Olds | 12 (100.0%) | 0 (0.0%) |
| 18 to 19 Year Olds | 6 (100.0%) | 0 (0.0%) |
| 20 to 24 Year Olds | 7 (100.0%) | 0 (0.0%) |
| 25 to 34 Year Olds | 3 (100.0%) | 0 (0.0%) |
| 35 Years and over | 2 (100.0%) | 0 (0.0%) |
| Total | 108 (100.0%) | 0 (0.0%) |
Educational Attainment by Field of Study in Fort Cobb
Education (24 | 25.3%), bio, nature & agricultural (23 | 24.2%), business (18 | 19.0%), arts & humanities (12 | 12.6%), and physical & health sciences (9 | 9.5%) are the most common fields of study among 95 individuals in Fort Cobb who have obtained a bachelor's degree or higher.
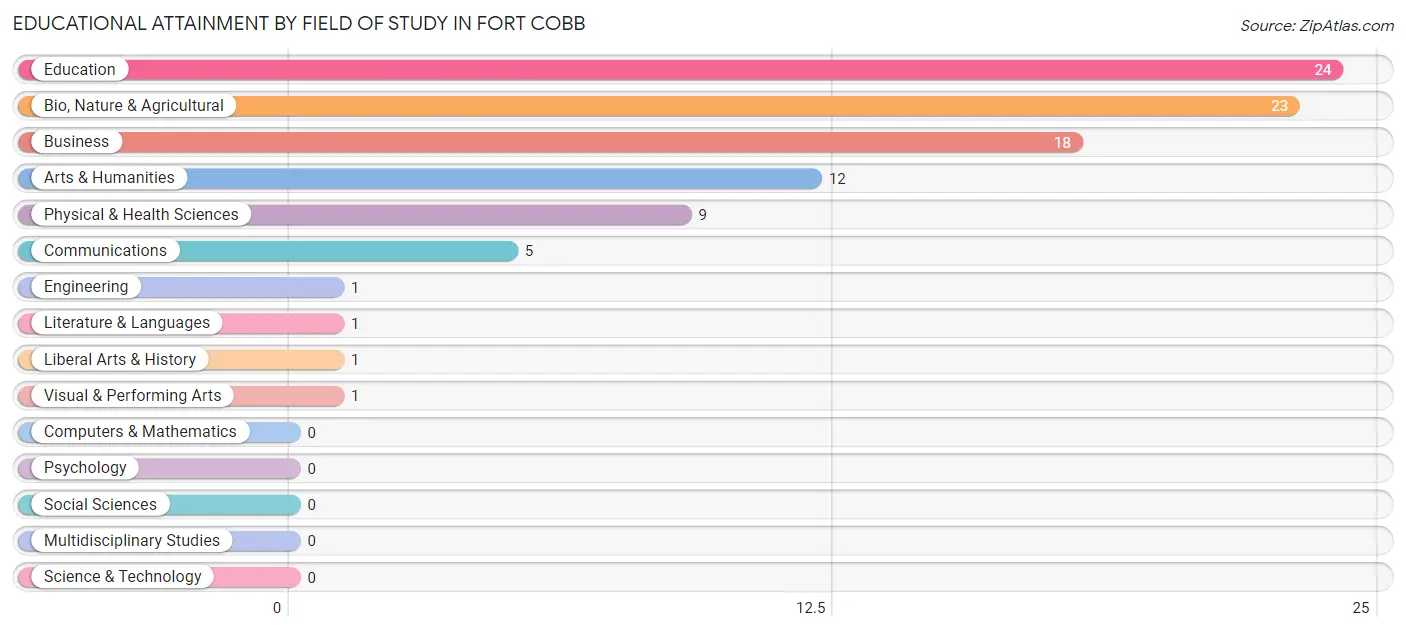
| Field of Study | # Graduates | % Graduates |
| Computers & Mathematics | 0 | 0.0% |
| Bio, Nature & Agricultural | 23 | 24.2% |
| Physical & Health Sciences | 9 | 9.5% |
| Psychology | 0 | 0.0% |
| Social Sciences | 0 | 0.0% |
| Engineering | 1 | 1.1% |
| Multidisciplinary Studies | 0 | 0.0% |
| Science & Technology | 0 | 0.0% |
| Business | 18 | 19.0% |
| Education | 24 | 25.3% |
| Literature & Languages | 1 | 1.1% |
| Liberal Arts & History | 1 | 1.1% |
| Visual & Performing Arts | 1 | 1.1% |
| Communications | 5 | 5.3% |
| Arts & Humanities | 12 | 12.6% |
| Total | 95 | 100.0% |
Transportation & Commute in Fort Cobb
Vehicle Availability by Sex in Fort Cobb
The most prevalent vehicle ownership categories in Fort Cobb are males with 3 vehicles (46, accounting for 37.1%) and females with 3 vehicles (25, making up 64.8%).
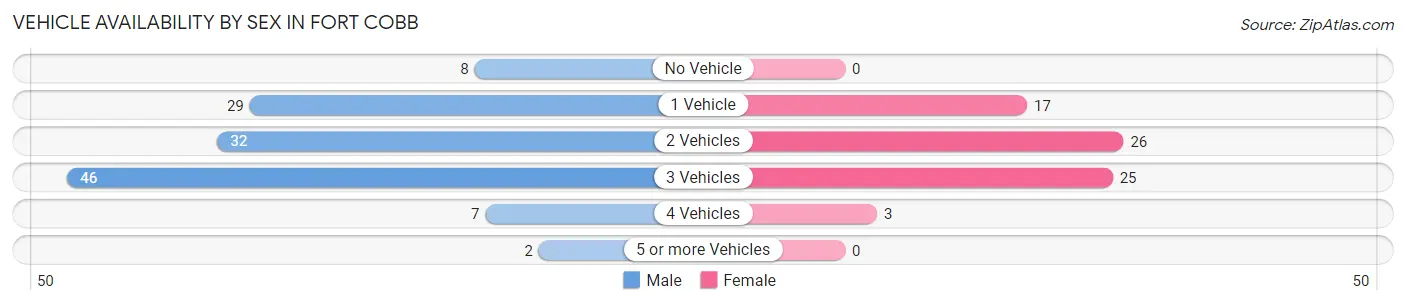
| Vehicles Available | Male | Female |
| No Vehicle | 8 (6.5%) | 0 (0.0%) |
| 1 Vehicle | 29 (23.4%) | 17 (23.9%) |
| 2 Vehicles | 32 (25.8%) | 26 (36.6%) |
| 3 Vehicles | 46 (37.1%) | 25 (35.2%) |
| 4 Vehicles | 7 (5.7%) | 3 (4.2%) |
| 5 or more Vehicles | 2 (1.6%) | 0 (0.0%) |
| Total | 124 (100.0%) | 71 (100.0%) |
Commute Time in Fort Cobb
The most frequently occuring commute durations in Fort Cobb are 5 to 9 minutes (29 commuters, 15.2%), 20 to 24 minutes (28 commuters, 14.7%), and less than 5 minutes (24 commuters, 12.6%).
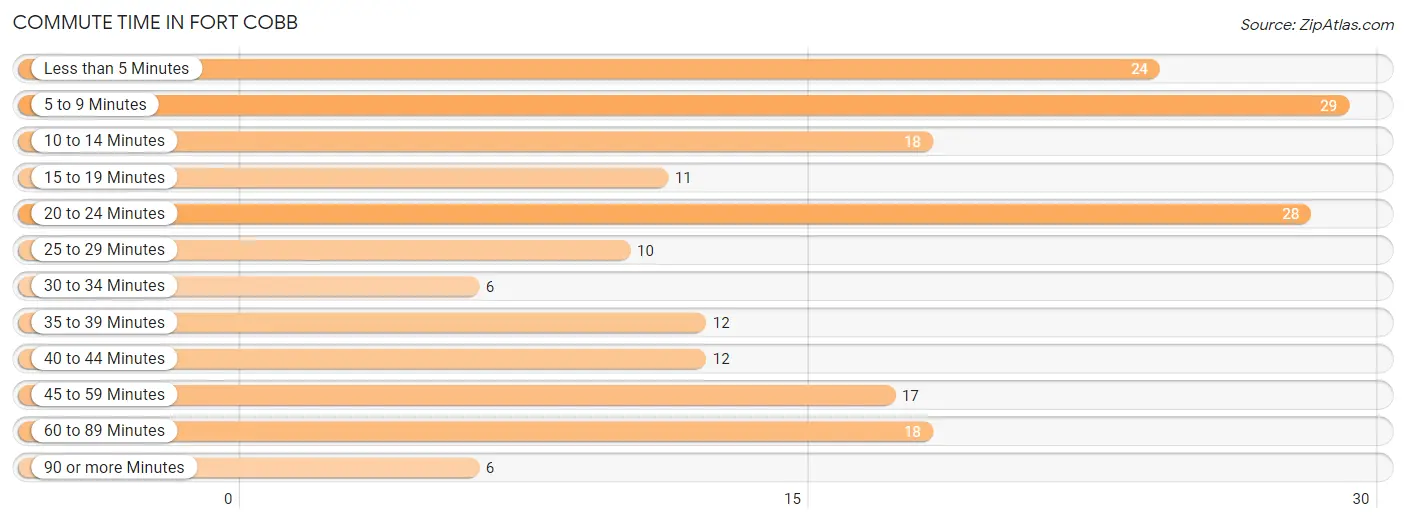
| Commute Time | # Commuters | % Commuters |
| Less than 5 Minutes | 24 | 12.6% |
| 5 to 9 Minutes | 29 | 15.2% |
| 10 to 14 Minutes | 18 | 9.4% |
| 15 to 19 Minutes | 11 | 5.8% |
| 20 to 24 Minutes | 28 | 14.7% |
| 25 to 29 Minutes | 10 | 5.2% |
| 30 to 34 Minutes | 6 | 3.1% |
| 35 to 39 Minutes | 12 | 6.3% |
| 40 to 44 Minutes | 12 | 6.3% |
| 45 to 59 Minutes | 17 | 8.9% |
| 60 to 89 Minutes | 18 | 9.4% |
| 90 or more Minutes | 6 | 3.1% |
Commute Time by Sex in Fort Cobb
The most common commute times in Fort Cobb are 5 to 9 minutes (23 commuters, 18.5%) for males and 20 to 24 minutes (22 commuters, 32.8%) for females.
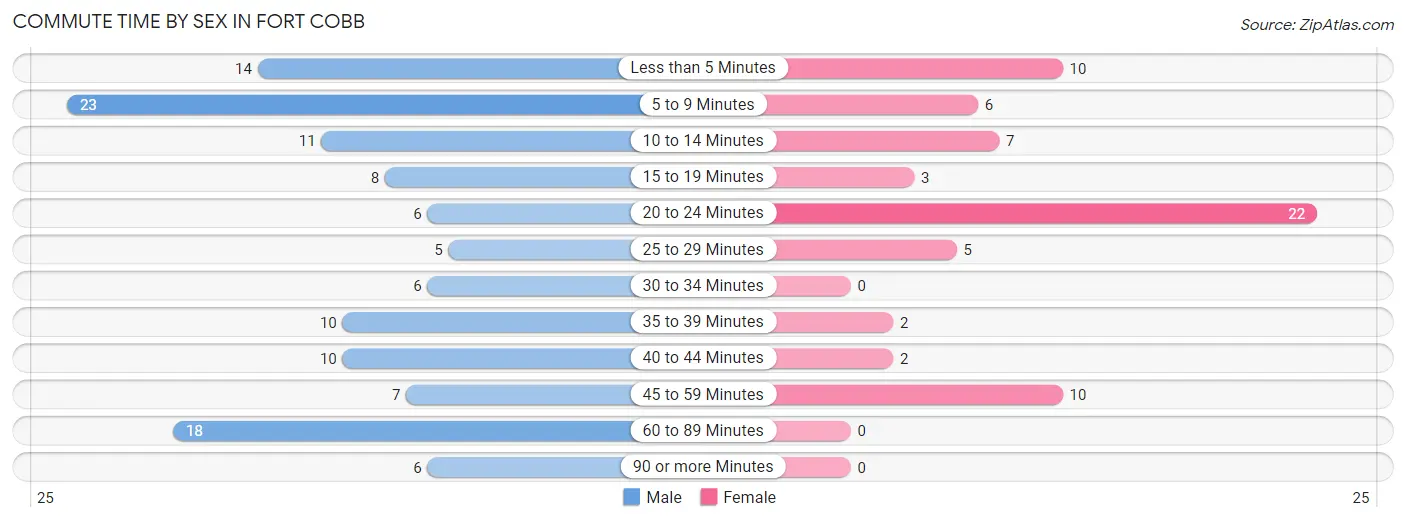
| Commute Time | Male | Female |
| Less than 5 Minutes | 14 (11.3%) | 10 (14.9%) |
| 5 to 9 Minutes | 23 (18.5%) | 6 (9.0%) |
| 10 to 14 Minutes | 11 (8.9%) | 7 (10.4%) |
| 15 to 19 Minutes | 8 (6.5%) | 3 (4.5%) |
| 20 to 24 Minutes | 6 (4.8%) | 22 (32.8%) |
| 25 to 29 Minutes | 5 (4.0%) | 5 (7.5%) |
| 30 to 34 Minutes | 6 (4.8%) | 0 (0.0%) |
| 35 to 39 Minutes | 10 (8.1%) | 2 (3.0%) |
| 40 to 44 Minutes | 10 (8.1%) | 2 (3.0%) |
| 45 to 59 Minutes | 7 (5.7%) | 10 (14.9%) |
| 60 to 89 Minutes | 18 (14.5%) | 0 (0.0%) |
| 90 or more Minutes | 6 (4.8%) | 0 (0.0%) |
Time of Departure to Work by Sex in Fort Cobb
The most frequent times of departure to work in Fort Cobb are 7:00 AM to 7:29 AM (27, 21.8%) for males and 7:00 AM to 7:29 AM (17, 25.4%) for females.
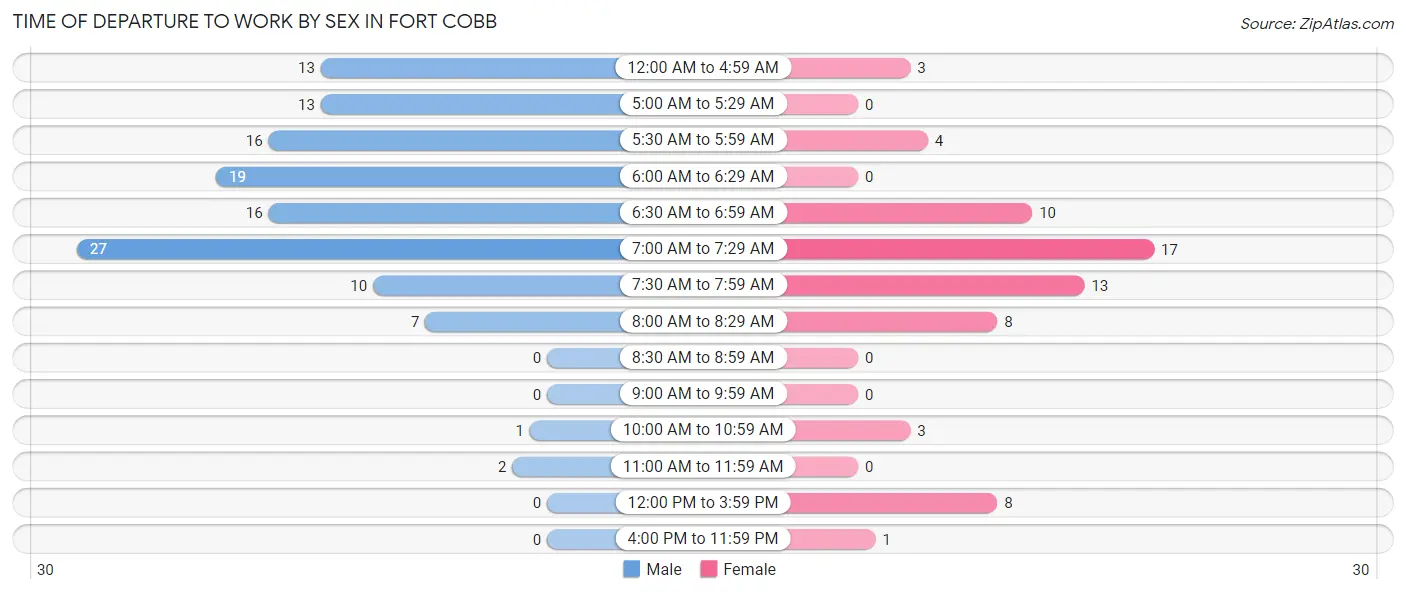
| Time of Departure | Male | Female |
| 12:00 AM to 4:59 AM | 13 (10.5%) | 3 (4.5%) |
| 5:00 AM to 5:29 AM | 13 (10.5%) | 0 (0.0%) |
| 5:30 AM to 5:59 AM | 16 (12.9%) | 4 (6.0%) |
| 6:00 AM to 6:29 AM | 19 (15.3%) | 0 (0.0%) |
| 6:30 AM to 6:59 AM | 16 (12.9%) | 10 (14.9%) |
| 7:00 AM to 7:29 AM | 27 (21.8%) | 17 (25.4%) |
| 7:30 AM to 7:59 AM | 10 (8.1%) | 13 (19.4%) |
| 8:00 AM to 8:29 AM | 7 (5.7%) | 8 (11.9%) |
| 8:30 AM to 8:59 AM | 0 (0.0%) | 0 (0.0%) |
| 9:00 AM to 9:59 AM | 0 (0.0%) | 0 (0.0%) |
| 10:00 AM to 10:59 AM | 1 (0.8%) | 3 (4.5%) |
| 11:00 AM to 11:59 AM | 2 (1.6%) | 0 (0.0%) |
| 12:00 PM to 3:59 PM | 0 (0.0%) | 8 (11.9%) |
| 4:00 PM to 11:59 PM | 0 (0.0%) | 1 (1.5%) |
| Total | 124 (100.0%) | 67 (100.0%) |
Housing Occupancy in Fort Cobb
Occupancy by Ownership in Fort Cobb
Of the total 202 dwellings in Fort Cobb, owner-occupied units account for 145 (71.8%), while renter-occupied units make up 57 (28.2%).
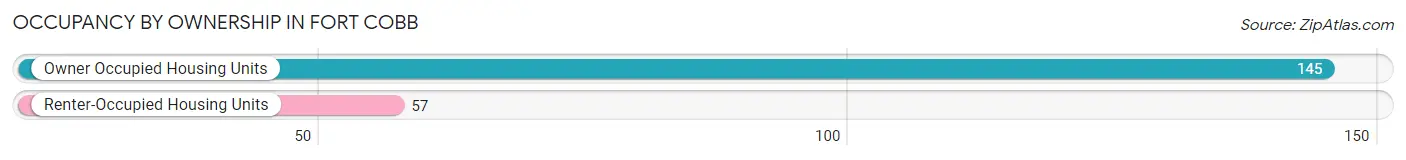
| Occupancy | # Housing Units | % Housing Units |
| Owner Occupied Housing Units | 145 | 71.8% |
| Renter-Occupied Housing Units | 57 | 28.2% |
| Total Occupied Housing Units | 202 | 100.0% |
Occupancy by Household Size in Fort Cobb
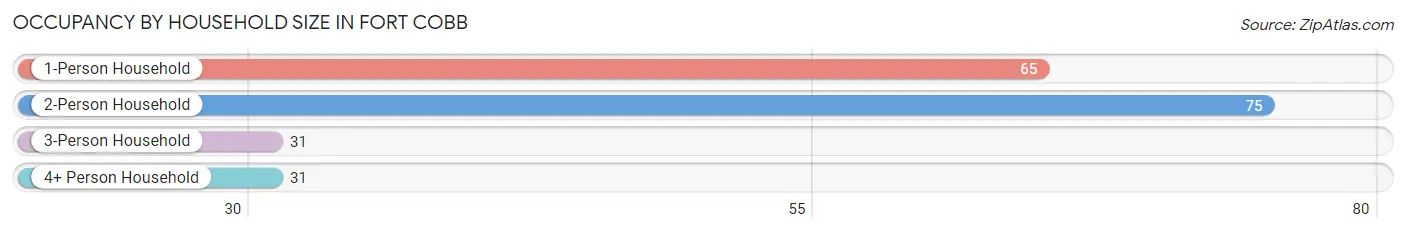
| Household Size | # Housing Units | % Housing Units |
| 1-Person Household | 65 | 32.2% |
| 2-Person Household | 75 | 37.1% |
| 3-Person Household | 31 | 15.3% |
| 4+ Person Household | 31 | 15.3% |
| Total Housing Units | 202 | 100.0% |
Occupancy by Ownership by Household Size in Fort Cobb
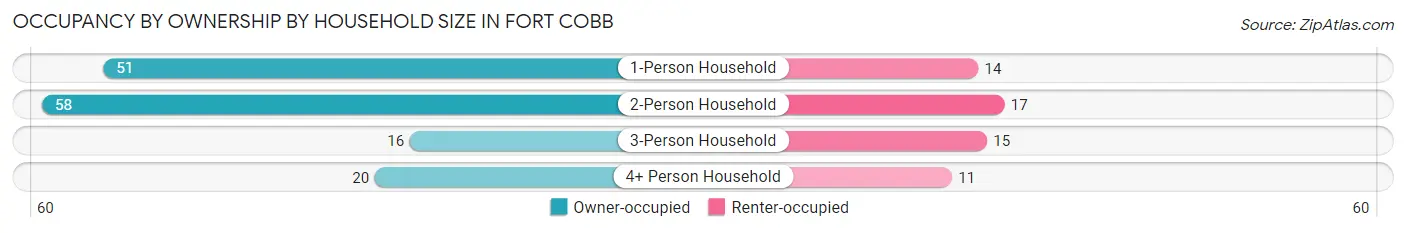
| Household Size | Owner-occupied | Renter-occupied |
| 1-Person Household | 51 (78.5%) | 14 (21.5%) |
| 2-Person Household | 58 (77.3%) | 17 (22.7%) |
| 3-Person Household | 16 (51.6%) | 15 (48.4%) |
| 4+ Person Household | 20 (64.5%) | 11 (35.5%) |
| Total Housing Units | 145 (71.8%) | 57 (28.2%) |
Occupancy by Educational Attainment in Fort Cobb
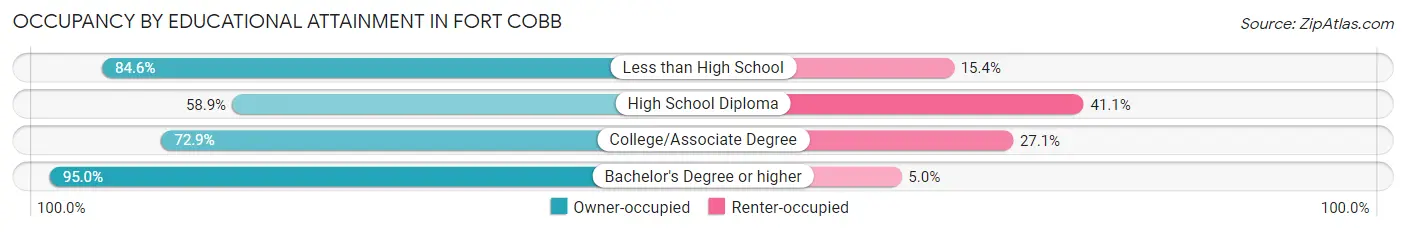
| Household Size | Owner-occupied | Renter-occupied |
| Less than High School | 11 (84.6%) | 2 (15.4%) |
| High School Diploma | 53 (58.9%) | 37 (41.1%) |
| College/Associate Degree | 43 (72.9%) | 16 (27.1%) |
| Bachelor's Degree or higher | 38 (95.0%) | 2 (5.0%) |
Occupancy by Age of Householder in Fort Cobb
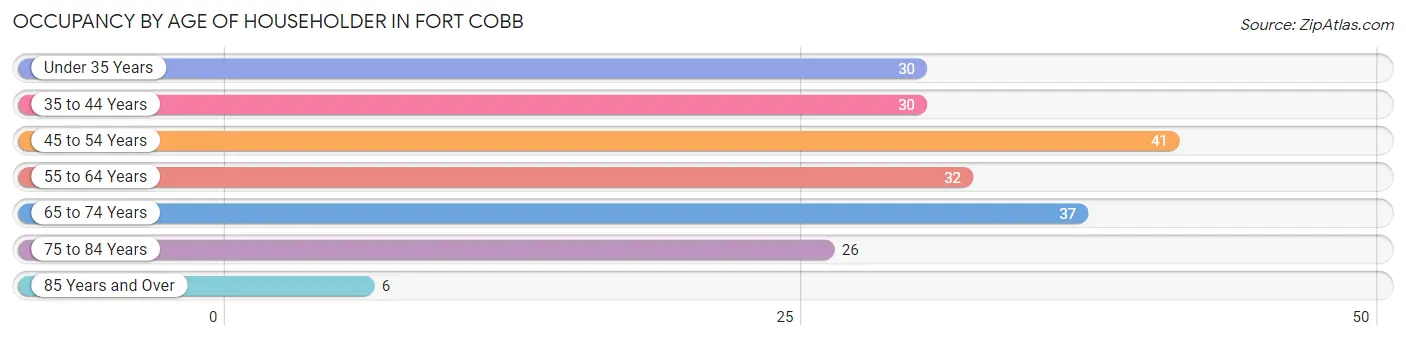
| Age Bracket | # Households | % Households |
| Under 35 Years | 30 | 14.8% |
| 35 to 44 Years | 30 | 14.8% |
| 45 to 54 Years | 41 | 20.3% |
| 55 to 64 Years | 32 | 15.8% |
| 65 to 74 Years | 37 | 18.3% |
| 75 to 84 Years | 26 | 12.9% |
| 85 Years and Over | 6 | 3.0% |
| Total | 202 | 100.0% |
Housing Finances in Fort Cobb
Median Income by Occupancy in Fort Cobb
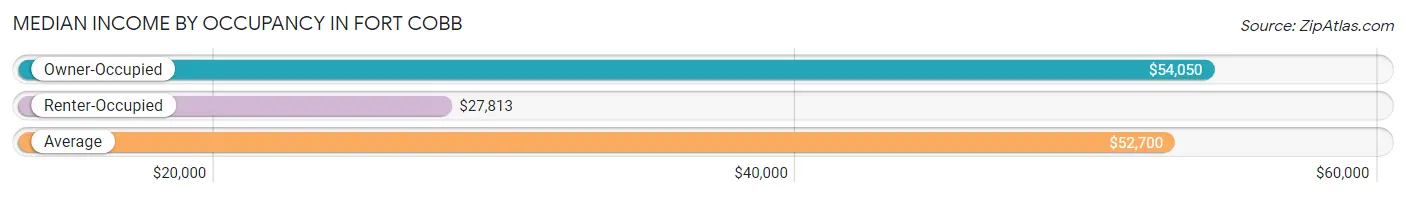
| Occupancy Type | # Households | Median Income |
| Owner-Occupied | 145 (71.8%) | $54,050 |
| Renter-Occupied | 57 (28.2%) | $27,813 |
| Average | 202 (100.0%) | $52,700 |
Occupancy by Householder Income Bracket in Fort Cobb
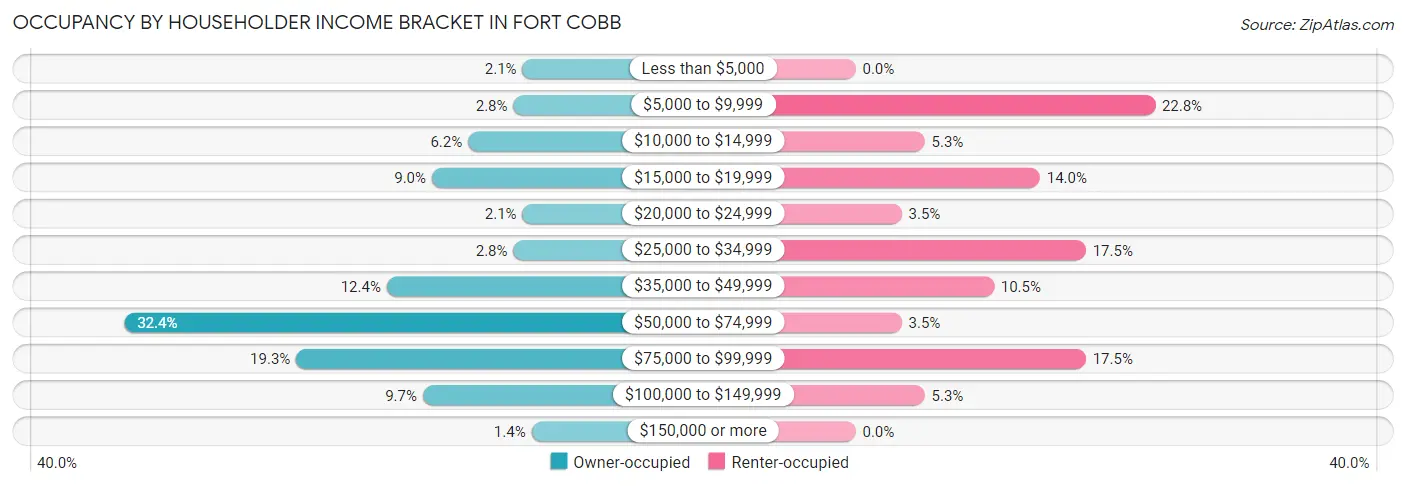
| Income Bracket | Owner-occupied | Renter-occupied |
| Less than $5,000 | 3 (2.1%) | 0 (0.0%) |
| $5,000 to $9,999 | 4 (2.8%) | 13 (22.8%) |
| $10,000 to $14,999 | 9 (6.2%) | 3 (5.3%) |
| $15,000 to $19,999 | 13 (9.0%) | 8 (14.0%) |
| $20,000 to $24,999 | 3 (2.1%) | 2 (3.5%) |
| $25,000 to $34,999 | 4 (2.8%) | 10 (17.5%) |
| $35,000 to $49,999 | 18 (12.4%) | 6 (10.5%) |
| $50,000 to $74,999 | 47 (32.4%) | 2 (3.5%) |
| $75,000 to $99,999 | 28 (19.3%) | 10 (17.5%) |
| $100,000 to $149,999 | 14 (9.7%) | 3 (5.3%) |
| $150,000 or more | 2 (1.4%) | 0 (0.0%) |
| Total | 145 (100.0%) | 57 (100.0%) |
Monthly Housing Cost Tiers in Fort Cobb
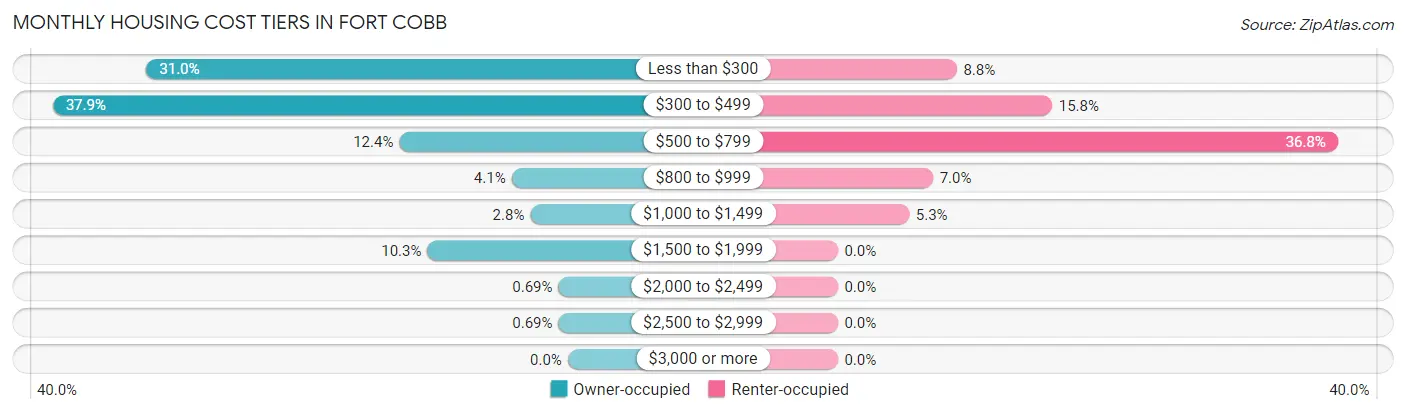
| Monthly Cost | Owner-occupied | Renter-occupied |
| Less than $300 | 45 (31.0%) | 5 (8.8%) |
| $300 to $499 | 55 (37.9%) | 9 (15.8%) |
| $500 to $799 | 18 (12.4%) | 21 (36.8%) |
| $800 to $999 | 6 (4.1%) | 4 (7.0%) |
| $1,000 to $1,499 | 4 (2.8%) | 3 (5.3%) |
| $1,500 to $1,999 | 15 (10.3%) | 0 (0.0%) |
| $2,000 to $2,499 | 1 (0.7%) | 0 (0.0%) |
| $2,500 to $2,999 | 1 (0.7%) | 0 (0.0%) |
| $3,000 or more | 0 (0.0%) | 0 (0.0%) |
| Total | 145 (100.0%) | 57 (100.0%) |
Physical Housing Characteristics in Fort Cobb
Housing Structures in Fort Cobb
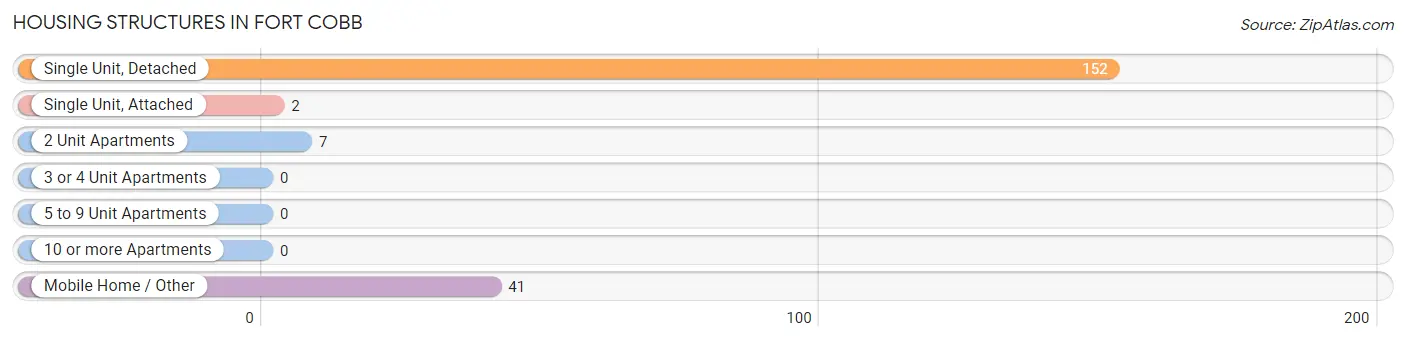
| Structure Type | # Housing Units | % Housing Units |
| Single Unit, Detached | 152 | 75.2% |
| Single Unit, Attached | 2 | 1.0% |
| 2 Unit Apartments | 7 | 3.5% |
| 3 or 4 Unit Apartments | 0 | 0.0% |
| 5 to 9 Unit Apartments | 0 | 0.0% |
| 10 or more Apartments | 0 | 0.0% |
| Mobile Home / Other | 41 | 20.3% |
| Total | 202 | 100.0% |
Housing Structures by Occupancy in Fort Cobb
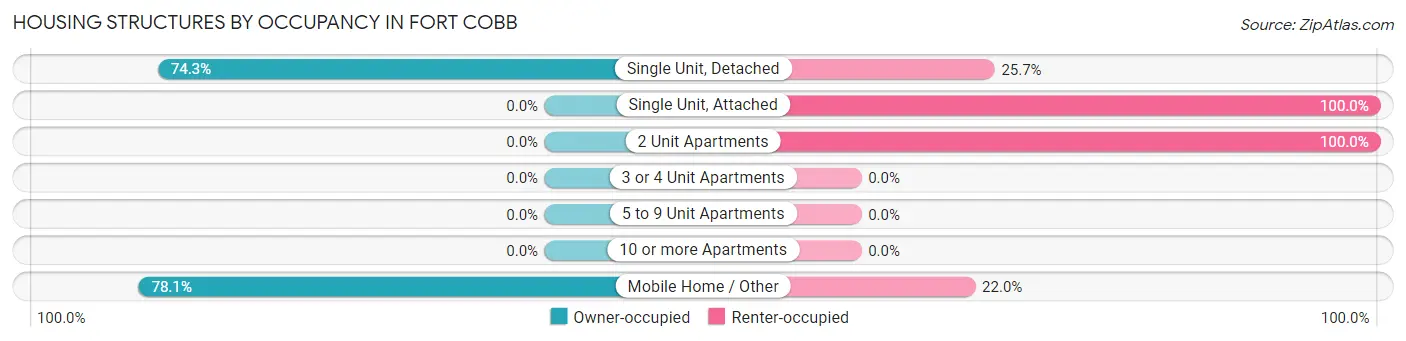
| Structure Type | Owner-occupied | Renter-occupied |
| Single Unit, Detached | 113 (74.3%) | 39 (25.7%) |
| Single Unit, Attached | 0 (0.0%) | 2 (100.0%) |
| 2 Unit Apartments | 0 (0.0%) | 7 (100.0%) |
| 3 or 4 Unit Apartments | 0 (0.0%) | 0 (0.0%) |
| 5 to 9 Unit Apartments | 0 (0.0%) | 0 (0.0%) |
| 10 or more Apartments | 0 (0.0%) | 0 (0.0%) |
| Mobile Home / Other | 32 (78.0%) | 9 (22.0%) |
| Total | 145 (71.8%) | 57 (28.2%) |
Housing Structures by Number of Rooms in Fort Cobb
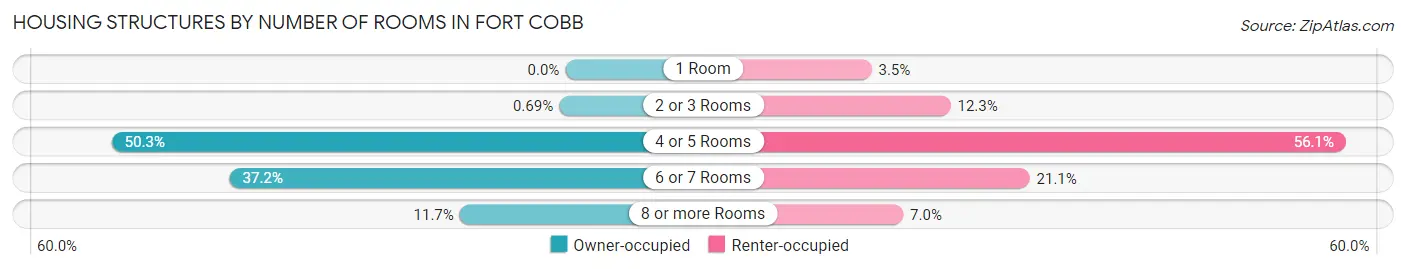
| Number of Rooms | Owner-occupied | Renter-occupied |
| 1 Room | 0 (0.0%) | 2 (3.5%) |
| 2 or 3 Rooms | 1 (0.7%) | 7 (12.3%) |
| 4 or 5 Rooms | 73 (50.3%) | 32 (56.1%) |
| 6 or 7 Rooms | 54 (37.2%) | 12 (21.0%) |
| 8 or more Rooms | 17 (11.7%) | 4 (7.0%) |
| Total | 145 (100.0%) | 57 (100.0%) |
Housing Structure by Heating Type in Fort Cobb
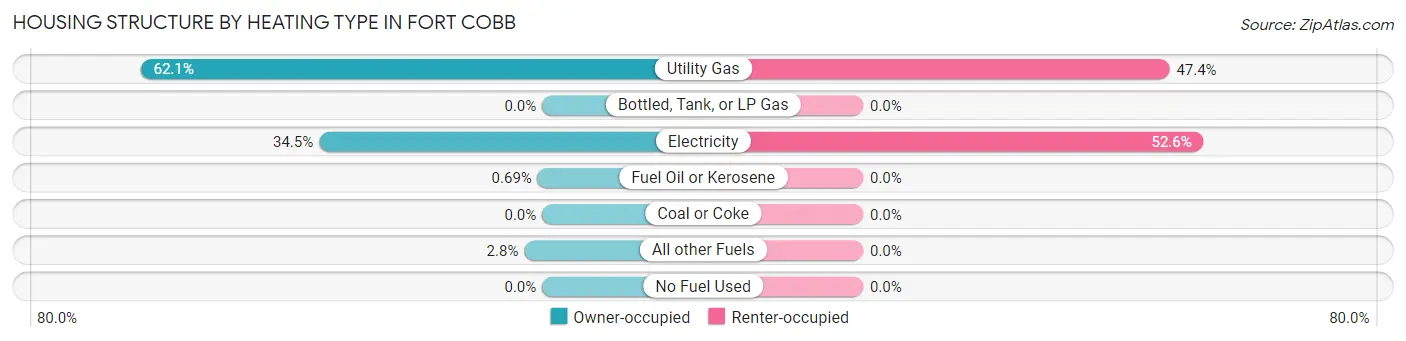
| Heating Type | Owner-occupied | Renter-occupied |
| Utility Gas | 90 (62.1%) | 27 (47.4%) |
| Bottled, Tank, or LP Gas | 0 (0.0%) | 0 (0.0%) |
| Electricity | 50 (34.5%) | 30 (52.6%) |
| Fuel Oil or Kerosene | 1 (0.7%) | 0 (0.0%) |
| Coal or Coke | 0 (0.0%) | 0 (0.0%) |
| All other Fuels | 4 (2.8%) | 0 (0.0%) |
| No Fuel Used | 0 (0.0%) | 0 (0.0%) |
| Total | 145 (100.0%) | 57 (100.0%) |
Household Vehicle Usage in Fort Cobb
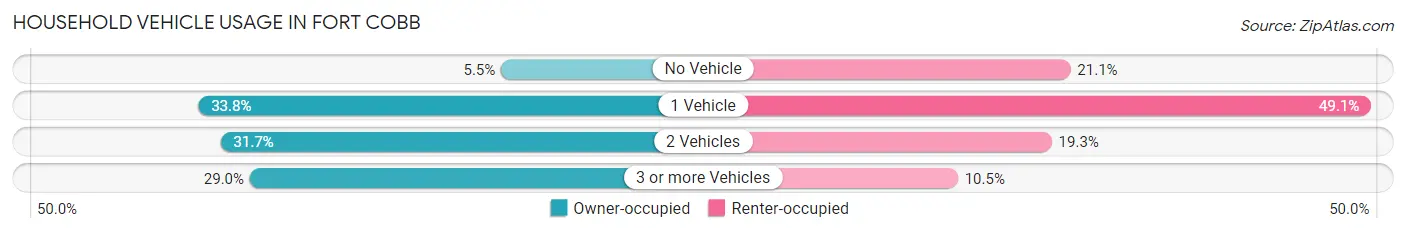
| Vehicles per Household | Owner-occupied | Renter-occupied |
| No Vehicle | 8 (5.5%) | 12 (21.0%) |
| 1 Vehicle | 49 (33.8%) | 28 (49.1%) |
| 2 Vehicles | 46 (31.7%) | 11 (19.3%) |
| 3 or more Vehicles | 42 (29.0%) | 6 (10.5%) |
| Total | 145 (100.0%) | 57 (100.0%) |
Real Estate & Mortgages in Fort Cobb
Real Estate and Mortgage Overview in Fort Cobb
| Characteristic | Without Mortgage | With Mortgage |
| Housing Units | 107 | 38 |
| Median Property Value | $65,800 | $0 |
| Median Household Income | $53,472 | $2 |
| Monthly Housing Costs | $324 | $0 |
| Real Estate Taxes | $350 | $0 |
Property Value by Mortgage Status in Fort Cobb
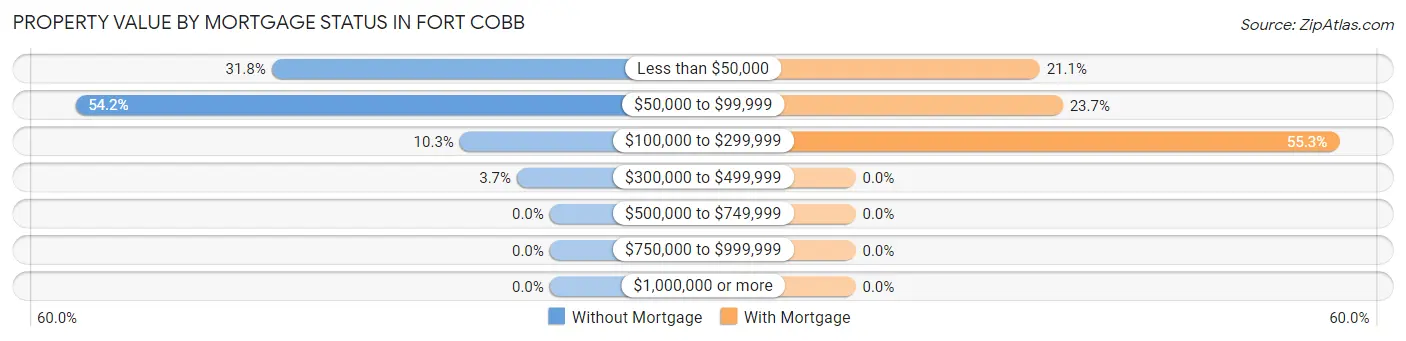
| Property Value | Without Mortgage | With Mortgage |
| Less than $50,000 | 34 (31.8%) | 8 (21.0%) |
| $50,000 to $99,999 | 58 (54.2%) | 9 (23.7%) |
| $100,000 to $299,999 | 11 (10.3%) | 21 (55.3%) |
| $300,000 to $499,999 | 4 (3.7%) | 0 (0.0%) |
| $500,000 to $749,999 | 0 (0.0%) | 0 (0.0%) |
| $750,000 to $999,999 | 0 (0.0%) | 0 (0.0%) |
| $1,000,000 or more | 0 (0.0%) | 0 (0.0%) |
| Total | 107 (100.0%) | 38 (100.0%) |
Household Income by Mortgage Status in Fort Cobb
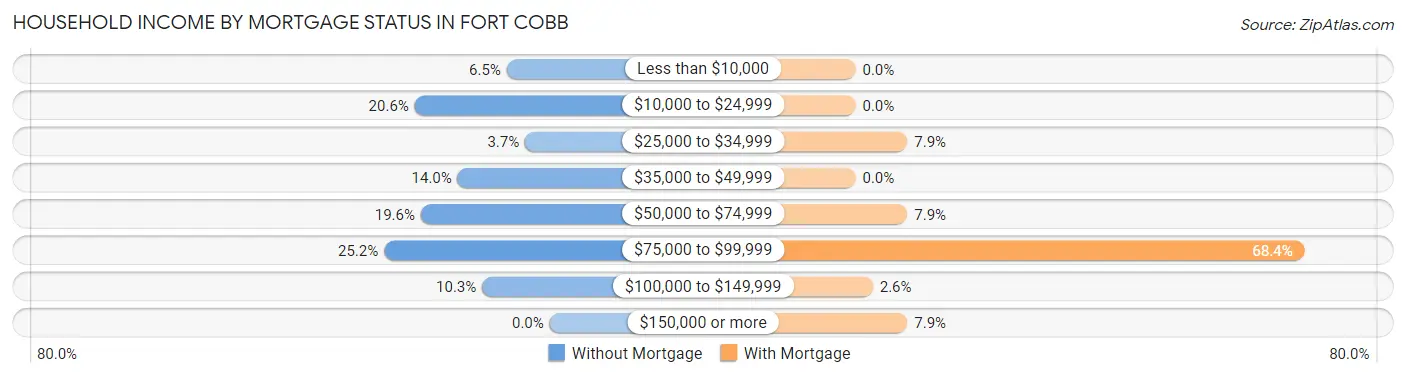
| Household Income | Without Mortgage | With Mortgage |
| Less than $10,000 | 7 (6.5%) | 0 (0.0%) |
| $10,000 to $24,999 | 22 (20.6%) | 0 (0.0%) |
| $25,000 to $34,999 | 4 (3.7%) | 3 (7.9%) |
| $35,000 to $49,999 | 15 (14.0%) | 0 (0.0%) |
| $50,000 to $74,999 | 21 (19.6%) | 3 (7.9%) |
| $75,000 to $99,999 | 27 (25.2%) | 26 (68.4%) |
| $100,000 to $149,999 | 11 (10.3%) | 1 (2.6%) |
| $150,000 or more | 0 (0.0%) | 3 (7.9%) |
| Total | 107 (100.0%) | 38 (100.0%) |
Property Value to Household Income Ratio in Fort Cobb
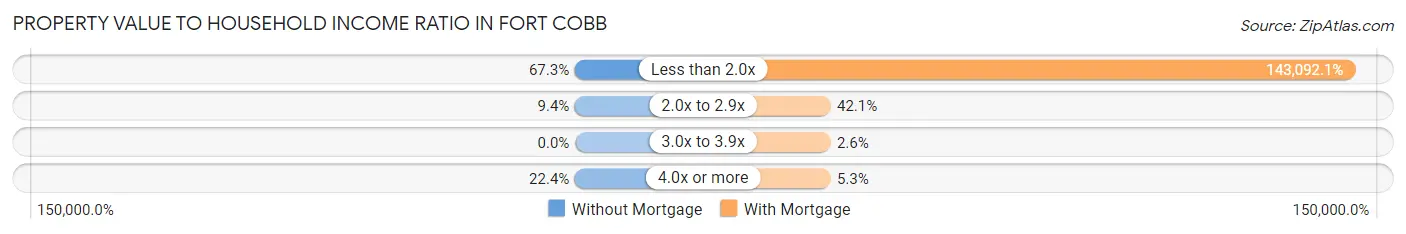
| Value-to-Income Ratio | Without Mortgage | With Mortgage |
| Less than 2.0x | 72 (67.3%) | 54,375 (143,092.1%) |
| 2.0x to 2.9x | 10 (9.3%) | 16 (42.1%) |
| 3.0x to 3.9x | 0 (0.0%) | 1 (2.6%) |
| 4.0x or more | 24 (22.4%) | 2 (5.3%) |
| Total | 107 (100.0%) | 38 (100.0%) |
Real Estate Taxes by Mortgage Status in Fort Cobb
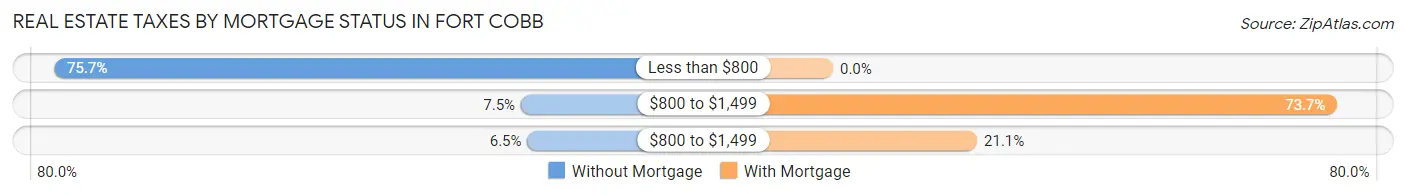
| Property Taxes | Without Mortgage | With Mortgage |
| Less than $800 | 81 (75.7%) | 0 (0.0%) |
| $800 to $1,499 | 8 (7.5%) | 28 (73.7%) |
| $800 to $1,499 | 7 (6.5%) | 8 (21.0%) |
| Total | 107 (100.0%) | 38 (100.0%) |
Health & Disability in Fort Cobb
Health Insurance Coverage by Age in Fort Cobb
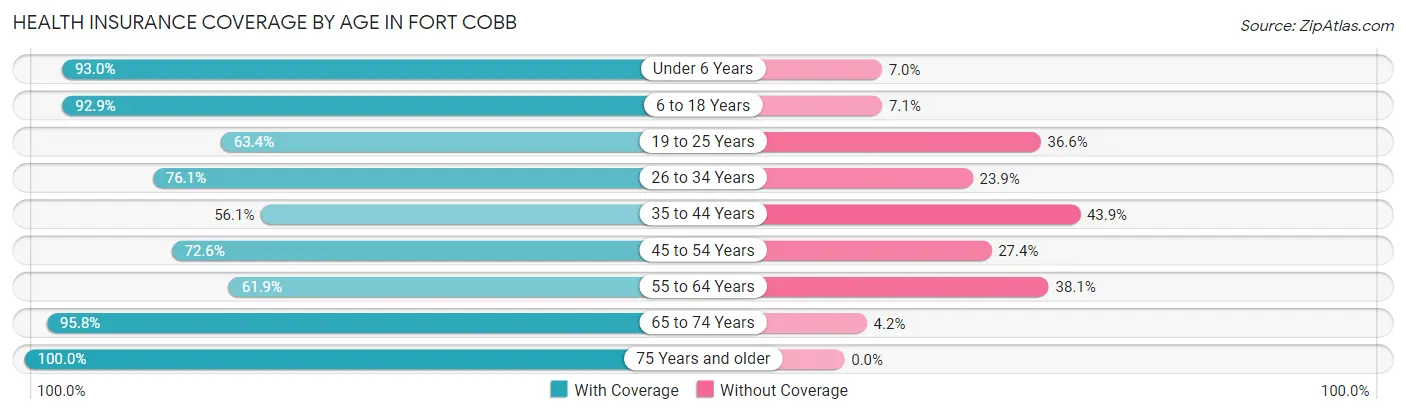
| Age Bracket | With Coverage | Without Coverage |
| Under 6 Years | 40 (93.0%) | 3 (7.0%) |
| 6 to 18 Years | 79 (92.9%) | 6 (7.1%) |
| 19 to 25 Years | 26 (63.4%) | 15 (36.6%) |
| 26 to 34 Years | 35 (76.1%) | 11 (23.9%) |
| 35 to 44 Years | 37 (56.1%) | 29 (43.9%) |
| 45 to 54 Years | 53 (72.6%) | 20 (27.4%) |
| 55 to 64 Years | 39 (61.9%) | 24 (38.1%) |
| 65 to 74 Years | 46 (95.8%) | 2 (4.2%) |
| 75 Years and older | 34 (100.0%) | 0 (0.0%) |
| Total | 389 (78.0%) | 110 (22.0%) |
Health Insurance Coverage by Citizenship Status in Fort Cobb
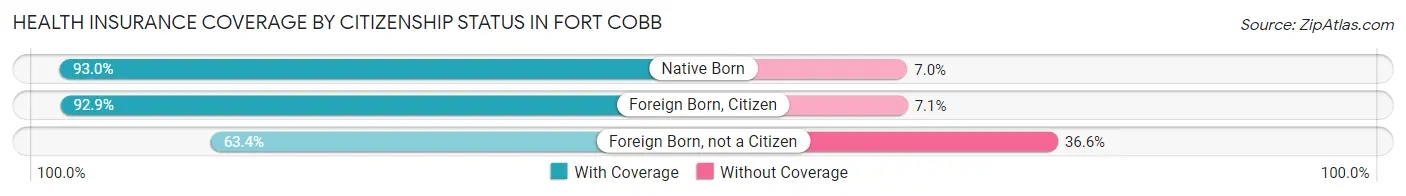
| Citizenship Status | With Coverage | Without Coverage |
| Native Born | 40 (93.0%) | 3 (7.0%) |
| Foreign Born, Citizen | 79 (92.9%) | 6 (7.1%) |
| Foreign Born, not a Citizen | 26 (63.4%) | 15 (36.6%) |
Health Insurance Coverage by Household Income in Fort Cobb
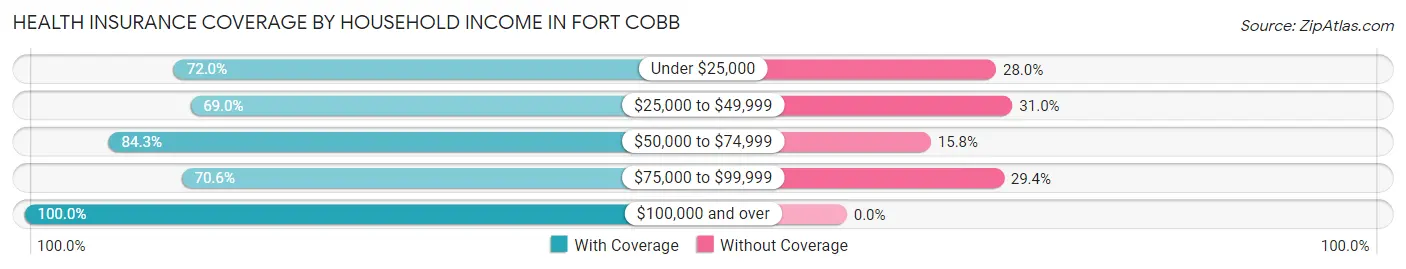
| Household Income | With Coverage | Without Coverage |
| Under $25,000 | 85 (72.0%) | 33 (28.0%) |
| $25,000 to $49,999 | 60 (69.0%) | 27 (31.0%) |
| $50,000 to $74,999 | 107 (84.3%) | 20 (15.8%) |
| $75,000 to $99,999 | 72 (70.6%) | 30 (29.4%) |
| $100,000 and over | 65 (100.0%) | 0 (0.0%) |
Public vs Private Health Insurance Coverage by Age in Fort Cobb
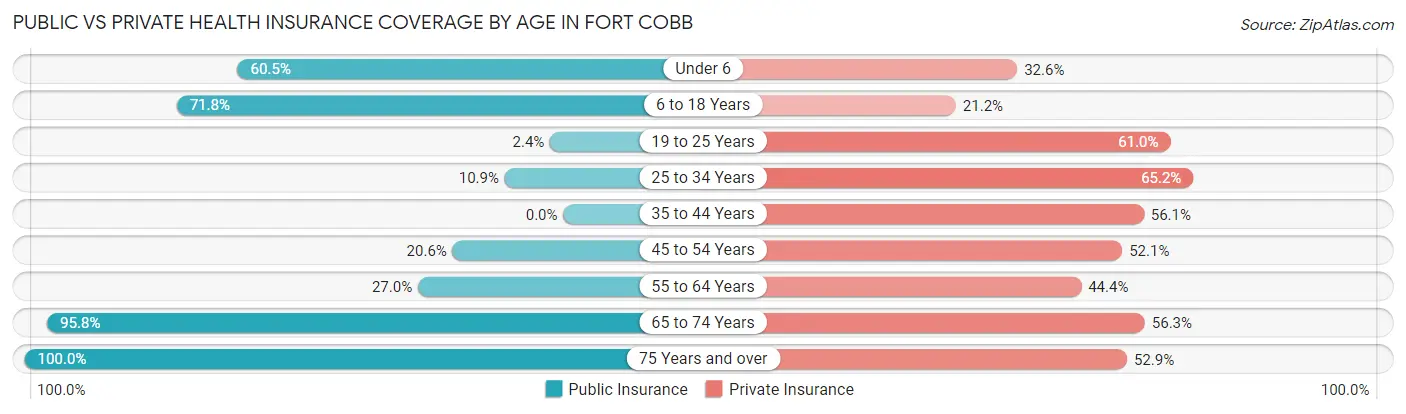
| Age Bracket | Public Insurance | Private Insurance |
| Under 6 | 26 (60.5%) | 14 (32.6%) |
| 6 to 18 Years | 61 (71.8%) | 18 (21.2%) |
| 19 to 25 Years | 1 (2.4%) | 25 (61.0%) |
| 25 to 34 Years | 5 (10.9%) | 30 (65.2%) |
| 35 to 44 Years | 0 (0.0%) | 37 (56.1%) |
| 45 to 54 Years | 15 (20.5%) | 38 (52.0%) |
| 55 to 64 Years | 17 (27.0%) | 28 (44.4%) |
| 65 to 74 Years | 46 (95.8%) | 27 (56.2%) |
| 75 Years and over | 34 (100.0%) | 18 (52.9%) |
| Total | 205 (41.1%) | 235 (47.1%) |
Disability Status by Sex by Age in Fort Cobb
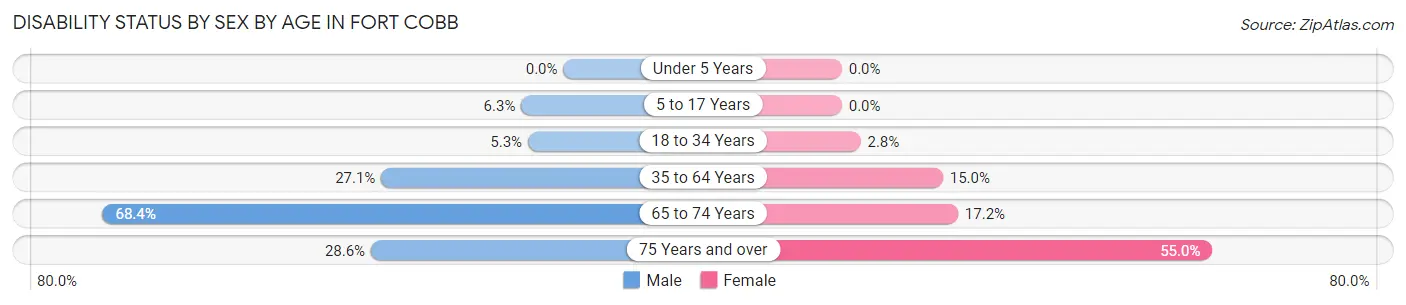
| Age Bracket | Male | Female |
| Under 5 Years | 0 (0.0%) | 0 (0.0%) |
| 5 to 17 Years | 3 (6.2%) | 0 (0.0%) |
| 18 to 34 Years | 3 (5.3%) | 1 (2.8%) |
| 35 to 64 Years | 33 (27.1%) | 12 (15.0%) |
| 65 to 74 Years | 13 (68.4%) | 5 (17.2%) |
| 75 Years and over | 4 (28.6%) | 11 (55.0%) |
Disability Class by Sex by Age in Fort Cobb
Disability Class: Hearing Difficulty
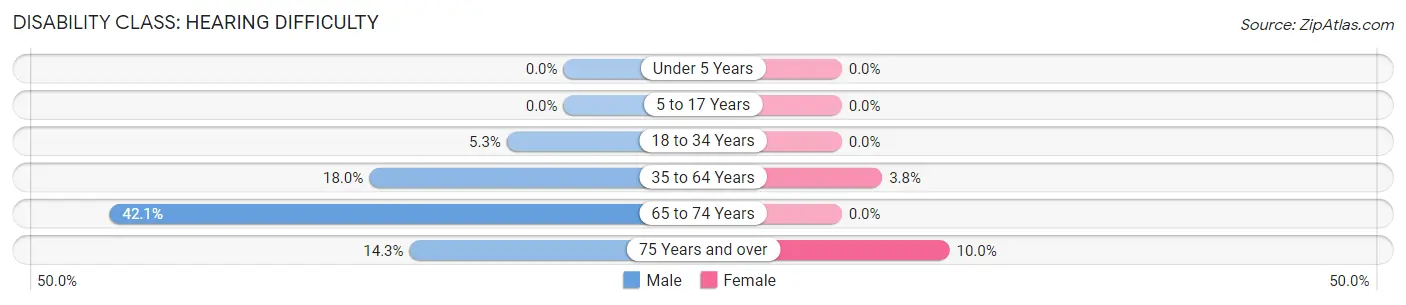
| Age Bracket | Male | Female |
| Under 5 Years | 0 (0.0%) | 0 (0.0%) |
| 5 to 17 Years | 0 (0.0%) | 0 (0.0%) |
| 18 to 34 Years | 3 (5.3%) | 0 (0.0%) |
| 35 to 64 Years | 22 (18.0%) | 3 (3.7%) |
| 65 to 74 Years | 8 (42.1%) | 0 (0.0%) |
| 75 Years and over | 2 (14.3%) | 2 (10.0%) |
Disability Class: Vision Difficulty
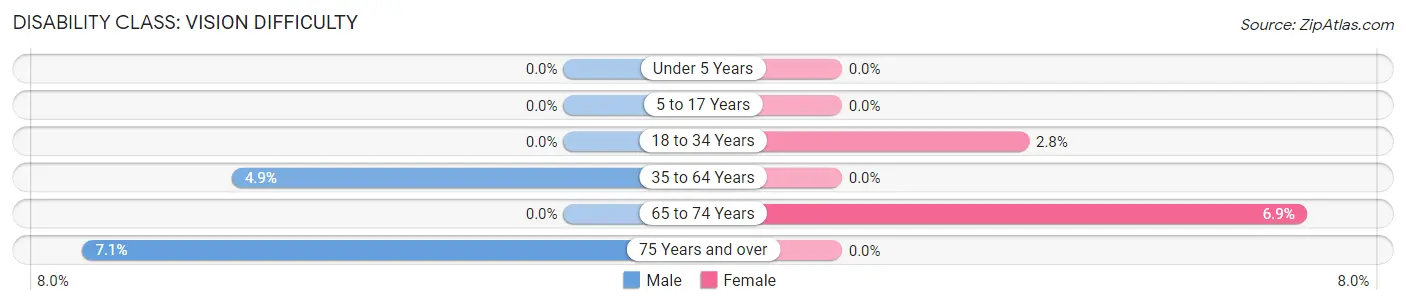
| Age Bracket | Male | Female |
| Under 5 Years | 0 (0.0%) | 0 (0.0%) |
| 5 to 17 Years | 0 (0.0%) | 0 (0.0%) |
| 18 to 34 Years | 0 (0.0%) | 1 (2.8%) |
| 35 to 64 Years | 6 (4.9%) | 0 (0.0%) |
| 65 to 74 Years | 0 (0.0%) | 2 (6.9%) |
| 75 Years and over | 1 (7.1%) | 0 (0.0%) |
Disability Class: Cognitive Difficulty
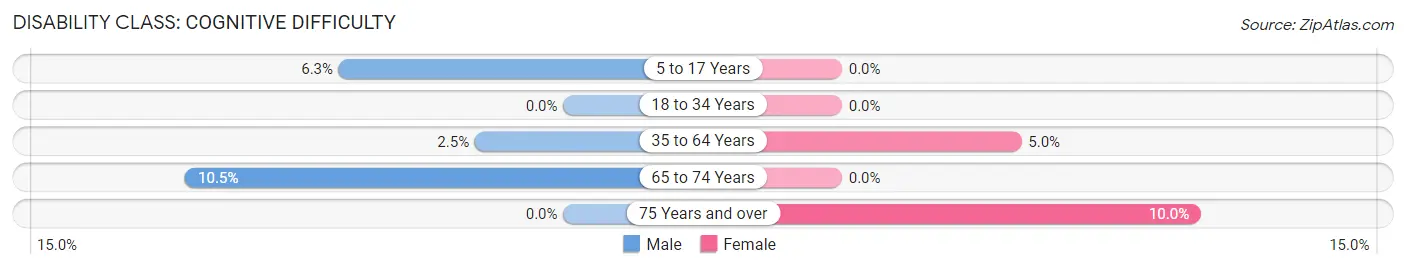
| Age Bracket | Male | Female |
| 5 to 17 Years | 3 (6.2%) | 0 (0.0%) |
| 18 to 34 Years | 0 (0.0%) | 0 (0.0%) |
| 35 to 64 Years | 3 (2.5%) | 4 (5.0%) |
| 65 to 74 Years | 2 (10.5%) | 0 (0.0%) |
| 75 Years and over | 0 (0.0%) | 2 (10.0%) |
Disability Class: Ambulatory Difficulty
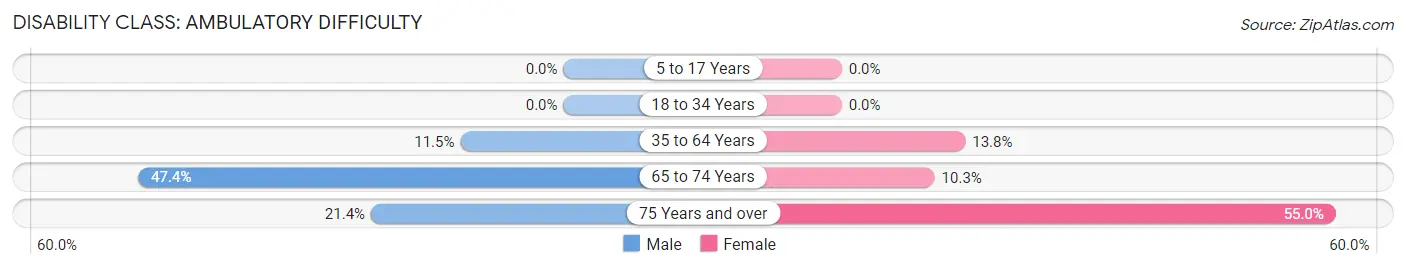
| Age Bracket | Male | Female |
| 5 to 17 Years | 0 (0.0%) | 0 (0.0%) |
| 18 to 34 Years | 0 (0.0%) | 0 (0.0%) |
| 35 to 64 Years | 14 (11.5%) | 11 (13.8%) |
| 65 to 74 Years | 9 (47.4%) | 3 (10.3%) |
| 75 Years and over | 3 (21.4%) | 11 (55.0%) |
Disability Class: Self-Care Difficulty
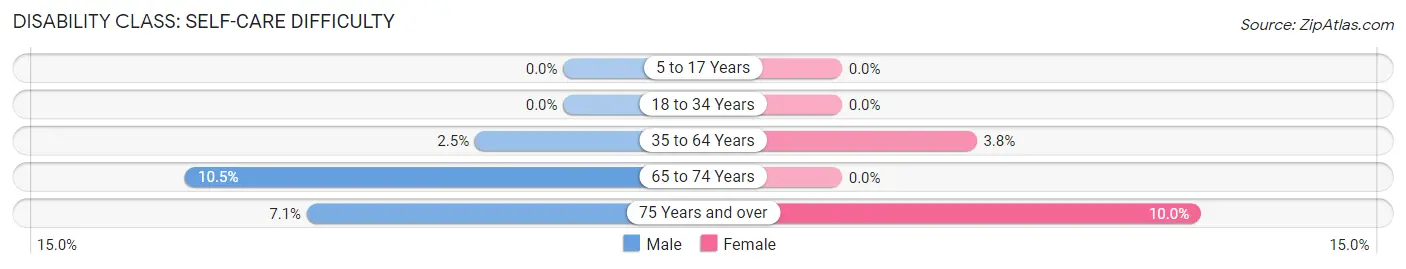
| Age Bracket | Male | Female |
| 5 to 17 Years | 0 (0.0%) | 0 (0.0%) |
| 18 to 34 Years | 0 (0.0%) | 0 (0.0%) |
| 35 to 64 Years | 3 (2.5%) | 3 (3.7%) |
| 65 to 74 Years | 2 (10.5%) | 0 (0.0%) |
| 75 Years and over | 1 (7.1%) | 2 (10.0%) |
Technology Access in Fort Cobb
Computing Device Access in Fort Cobb
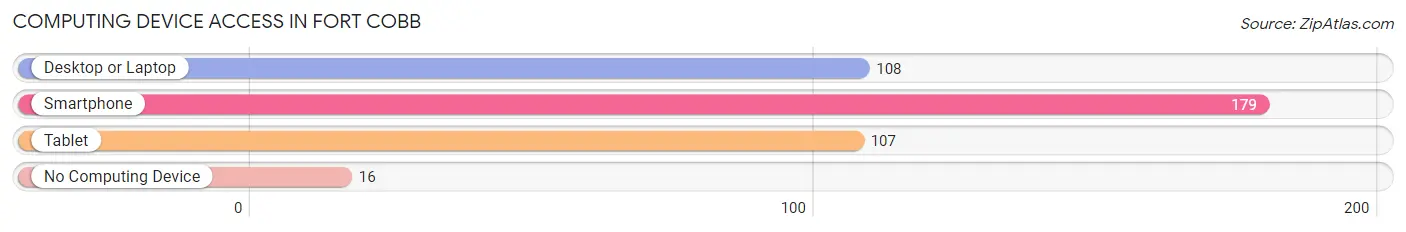
| Device Type | # Households | % Households |
| Desktop or Laptop | 108 | 53.5% |
| Smartphone | 179 | 88.6% |
| Tablet | 107 | 53.0% |
| No Computing Device | 16 | 7.9% |
| Total | 202 | 100.0% |
Internet Access in Fort Cobb
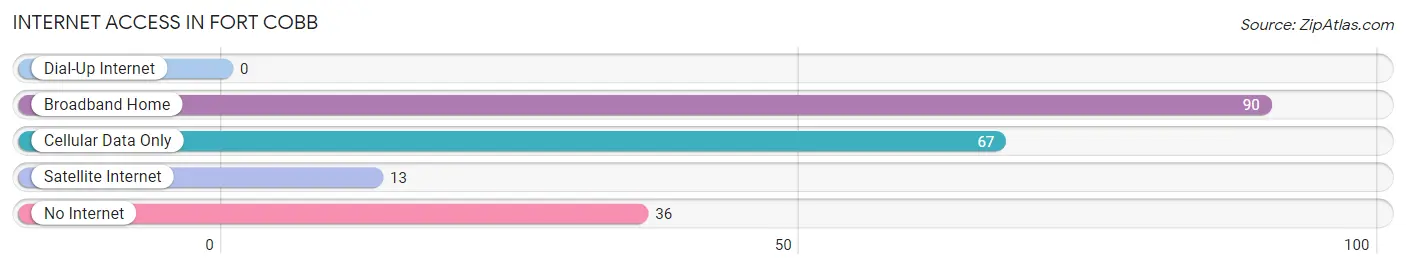
| Internet Type | # Households | % Households |
| Dial-Up Internet | 0 | 0.0% |
| Broadband Home | 90 | 44.6% |
| Cellular Data Only | 67 | 33.2% |
| Satellite Internet | 13 | 6.4% |
| No Internet | 36 | 17.8% |
| Total | 202 | 100.0% |
Fort Cobb Summary
Cobb, Oklahoma is a small town located in Caddo County, Oklahoma. It is situated on the banks of the Washita River, approximately 30 miles south of Anadarko. The town was founded in 1872 and named after the nearby Fort Cobb, which was established in 1859. The town was originally a trading post for the Kiowa and Comanche tribes, and later became a stop on the Chisholm Trail.
History
Fort Cobb was established in 1859 by the United States Army to protect the Kiowa and Comanche tribes from the encroaching settlers. The fort was located on the banks of the Washita River, approximately 30 miles south of Anadarko. The fort was abandoned in 1861 due to the Civil War, but the town of Cobb was established in 1872. The town was named after the nearby fort and was originally a trading post for the Kiowa and Comanche tribes.
In 1874, Cobb became a stop on the Chisholm Trail, which was used by cattle drivers to transport their herds from Texas to Kansas. The town quickly grew and by 1876, it had a population of over 500. The town was also home to a number of saloons, gambling halls, and brothels.
In 1892, Cobb was incorporated as a town and in 1895, it was designated as the county seat of Caddo County. The town continued to grow and by 1900, it had a population of over 1,000.
Geography
Cobb is located in Caddo County, Oklahoma. It is situated on the banks of the Washita River, approximately 30 miles south of Anadarko. The town is located in the Red Bed Plains region of Oklahoma, which is characterized by flat terrain and red-colored soil. The town is located at an elevation of 1,068 feet above sea level.
The climate in Cobb is classified as humid subtropical, with hot summers and mild winters. The average annual temperature is 64°F, with an average high of 90°F in the summer and an average low of 37°F in the winter. The average annual precipitation is 33 inches.
Economy
Cobb’s economy is largely based on agriculture. The town is home to a number of farms and ranches, which produce a variety of crops, including wheat, corn, soybeans, and cotton. The town is also home to a number of businesses, including a grocery store, a hardware store, and a few restaurants.
Demographics
As of the 2010 census, Cobb had a population of 1,093. The racial makeup of the town was 79.2% White, 0.7% African American, 15.2% Native American, 0.2% Asian, 0.1% Pacific Islander, and 4.7% from other races. The median household income was $30,938 and the median family income was $35,625.
Cobb is a small town with a rich history and a diverse population. The town is home to a number of farms and businesses, and is a popular destination for tourists looking to explore the area’s history and culture.
Common Questions
What is Per Capita Income in Fort Cobb?
Per Capita income in Fort Cobb is $23,614.
What is the Median Family Income in Fort Cobb?
Median Family Income in Fort Cobb is $62,083.
What is the Median Household income in Fort Cobb?
Median Household Income in Fort Cobb is $52,700.
What is Income or Wage Gap in Fort Cobb?
Income or Wage Gap in Fort Cobb is 1.7%.
Women in Fort Cobb earn 98.3 cents for every dollar earned by a man.
What is Inequality or Gini Index in Fort Cobb?
Inequality or Gini Index in Fort Cobb is 0.38.
What is the Total Population of Fort Cobb?
Total Population of Fort Cobb is 499.
What is the Total Male Population of Fort Cobb?
Total Male Population of Fort Cobb is 277.
What is the Total Female Population of Fort Cobb?
Total Female Population of Fort Cobb is 222.
What is the Ratio of Males per 100 Females in Fort Cobb?
There are 124.77 Males per 100 Females in Fort Cobb.
What is the Ratio of Females per 100 Males in Fort Cobb?
There are 80.14 Females per 100 Males in Fort Cobb.
What is the Median Population Age in Fort Cobb?
Median Population Age in Fort Cobb is 40.3 Years.
What is the Average Family Size in Fort Cobb
Average Family Size in Fort Cobb is 3.2 People.
What is the Average Household Size in Fort Cobb
Average Household Size in Fort Cobb is 2.5 People.
How Large is the Labor Force in Fort Cobb?
There are 216 People in the Labor Forcein in Fort Cobb.
What is the Percentage of People in the Labor Force in Fort Cobb?
56.1% of People are in the Labor Force in Fort Cobb.
What is the Unemployment Rate in Fort Cobb?
Unemployment Rate in Fort Cobb is 0.9%.