Milburn, OK Map & Demographics
Milburn Map
Milburn Overview
$18,429
PER CAPITA INCOME
$50,000
AVG FAMILY INCOME
$40,000
AVG HOUSEHOLD INCOME
52.8%
WAGE / INCOME GAP [ % ]
47.2¢/ $1
WAGE / INCOME GAP [ $ ]
0.41
INEQUALITY / GINI INDEX
268
TOTAL POPULATION
123
MALE POPULATION
145
FEMALE POPULATION
84.83
MALES / 100 FEMALES
117.89
FEMALES / 100 MALES
32.9
MEDIAN AGE
4.2
AVG FAMILY SIZE
3.1
AVG HOUSEHOLD SIZE
111
LABOR FORCE [ PEOPLE ]
52.1%
PERCENT IN LABOR FORCE
5.4%
UNEMPLOYMENT RATE
Milburn Zip Codes
Milburn Area Codes
Income in Milburn
Income Overview in Milburn
Per Capita Income in Milburn is $18,429, while median incomes of families and households are $50,000 and $40,000 respectively.
| Characteristic | Number | Measure |
| Per Capita Income | 268 | $18,429 |
| Median Family Income | 54 | $50,000 |
| Mean Family Income | 54 | $54,993 |
| Median Household Income | 86 | $40,000 |
| Mean Household Income | 86 | $49,181 |
| Income Deficit | 54 | $0 |
| Wage / Income Gap (%) | 268 | 52.82% |
| Wage / Income Gap ($) | 268 | 47.18¢ per $1 |
| Gini / Inequality Index | 268 | 0.41 |
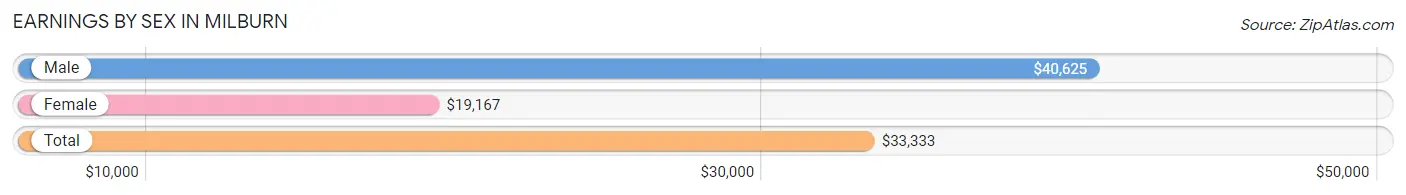
Earnings by Sex in Milburn
Average Earnings in Milburn are $33,333, $40,625 for men and $19,167 for women, a difference of 52.8%.
| Sex | Number | Average Earnings |
| Male | 66 (58.9%) | $40,625 |
| Female | 46 (41.1%) | $19,167 |
| Total | 112 (100.0%) | $33,333 |
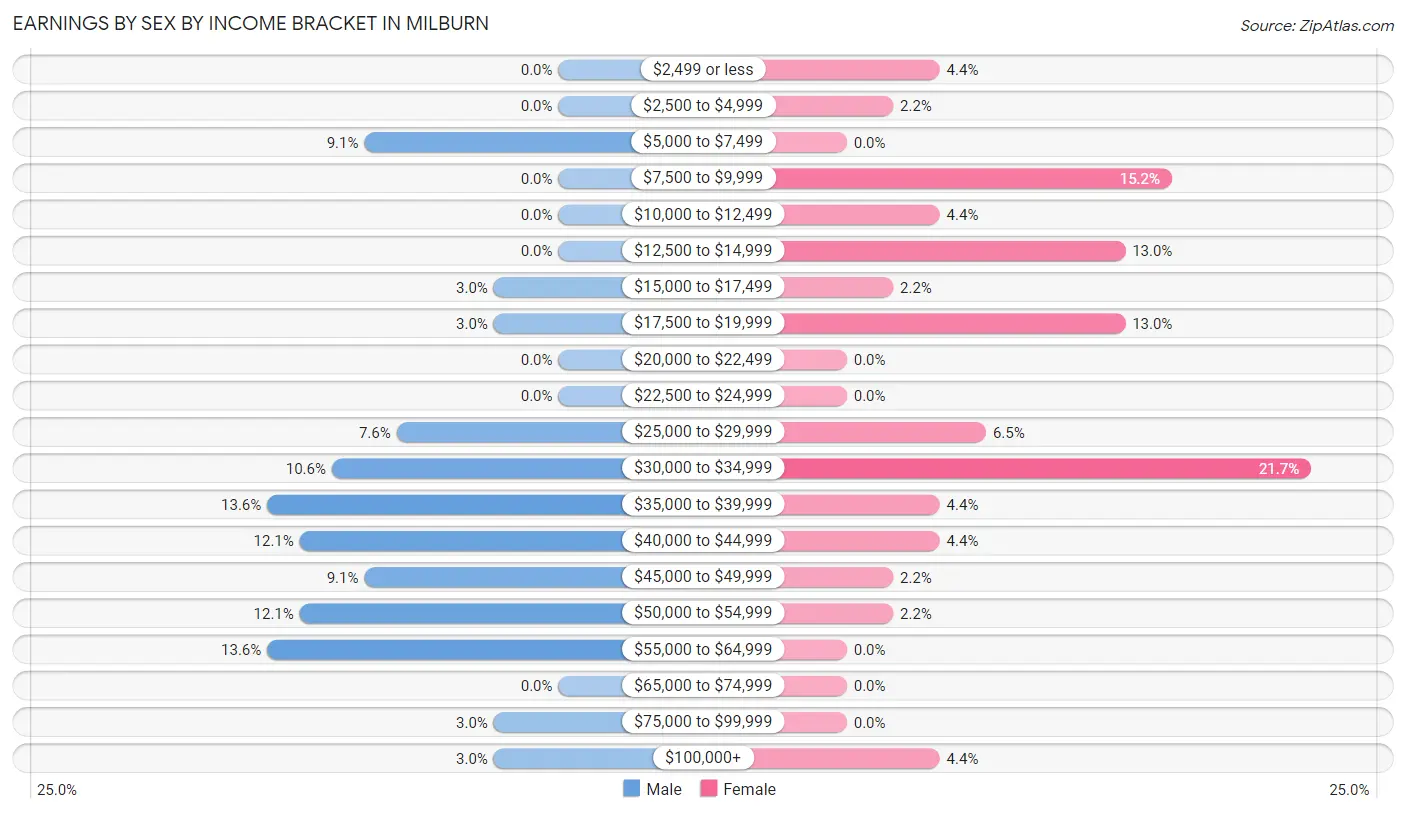
Earnings by Sex by Income Bracket in Milburn
The most common earnings brackets in Milburn are $35,000 to $39,999 for men (9 | 13.6%) and $30,000 to $34,999 for women (10 | 21.7%).
| Income | Male | Female |
| $2,499 or less | 0 (0.0%) | 2 (4.3%) |
| $2,500 to $4,999 | 0 (0.0%) | 1 (2.2%) |
| $5,000 to $7,499 | 6 (9.1%) | 0 (0.0%) |
| $7,500 to $9,999 | 0 (0.0%) | 7 (15.2%) |
| $10,000 to $12,499 | 0 (0.0%) | 2 (4.3%) |
| $12,500 to $14,999 | 0 (0.0%) | 6 (13.0%) |
| $15,000 to $17,499 | 2 (3.0%) | 1 (2.2%) |
| $17,500 to $19,999 | 2 (3.0%) | 6 (13.0%) |
| $20,000 to $22,499 | 0 (0.0%) | 0 (0.0%) |
| $22,500 to $24,999 | 0 (0.0%) | 0 (0.0%) |
| $25,000 to $29,999 | 5 (7.6%) | 3 (6.5%) |
| $30,000 to $34,999 | 7 (10.6%) | 10 (21.7%) |
| $35,000 to $39,999 | 9 (13.6%) | 2 (4.3%) |
| $40,000 to $44,999 | 8 (12.1%) | 2 (4.3%) |
| $45,000 to $49,999 | 6 (9.1%) | 1 (2.2%) |
| $50,000 to $54,999 | 8 (12.1%) | 1 (2.2%) |
| $55,000 to $64,999 | 9 (13.6%) | 0 (0.0%) |
| $65,000 to $74,999 | 0 (0.0%) | 0 (0.0%) |
| $75,000 to $99,999 | 2 (3.0%) | 0 (0.0%) |
| $100,000+ | 2 (3.0%) | 2 (4.3%) |
| Total | 66 (100.0%) | 46 (100.0%) |
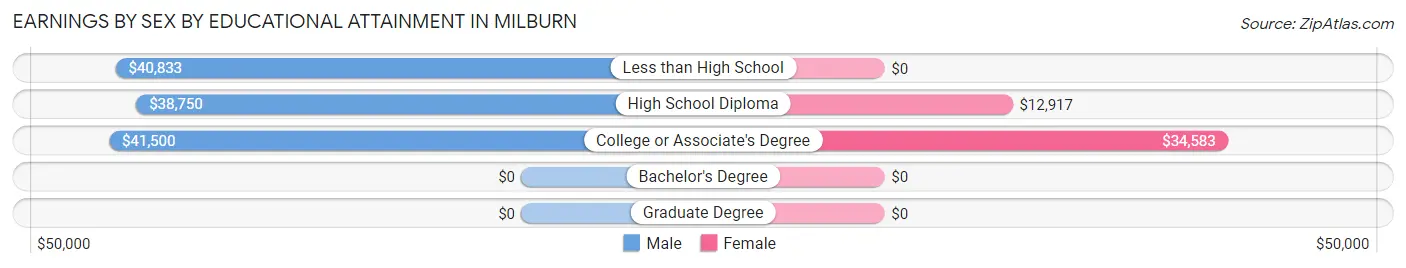
Earnings by Sex by Educational Attainment in Milburn
Average earnings in Milburn are $41,563 for men and $17,813 for women, a difference of 57.1%. Men with an educational attainment of college or associate's degree enjoy the highest average annual earnings of $41,500, while those with high school diploma education earn the least with $38,750. Women with an educational attainment of college or associate's degree earn the most with the average annual earnings of $34,583, while those with high school diploma education have the smallest earnings of $12,917.
| Educational Attainment | Male Income | Female Income |
| Less than High School | $40,833 | $0 |
| High School Diploma | $38,750 | $12,917 |
| College or Associate's Degree | $41,500 | $34,583 |
| Bachelor's Degree | - | - |
| Graduate Degree | - | - |
| Total | $41,563 | $17,813 |
Family Income in Milburn
Family Income Brackets in Milburn
According to the Milburn family income data, there are 15 families falling into the $50,000 to $74,999 income range, which is the most common income bracket and makes up 27.8% of all families.
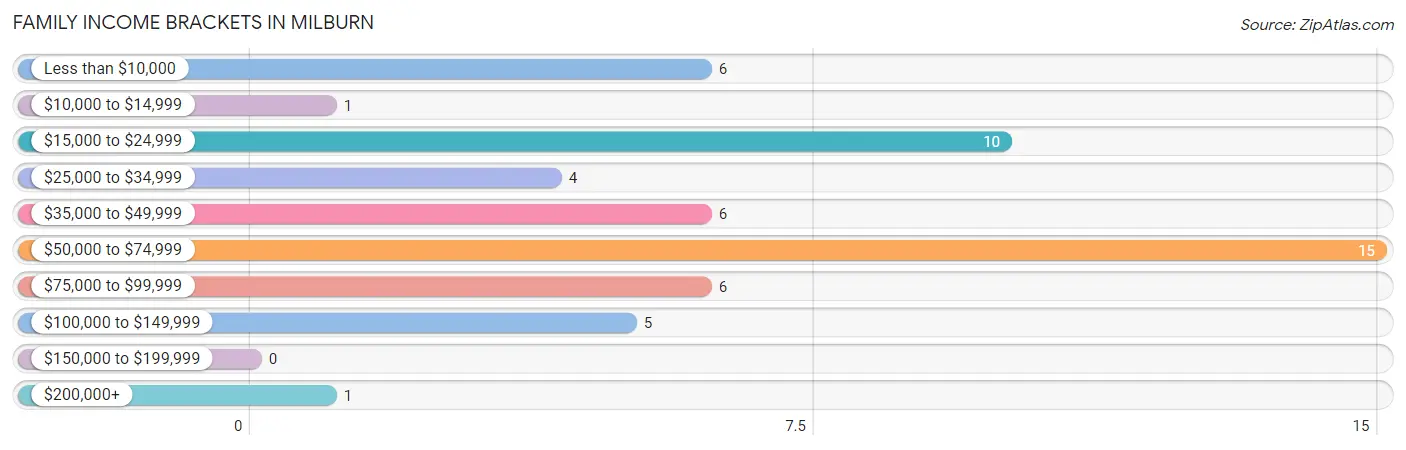
| Income Bracket | # Families | % Families |
| Less than $10,000 | 6 | 11.1% |
| $10,000 to $14,999 | 1 | 1.9% |
| $15,000 to $24,999 | 10 | 18.5% |
| $25,000 to $34,999 | 4 | 7.4% |
| $35,000 to $49,999 | 6 | 11.1% |
| $50,000 to $74,999 | 15 | 27.8% |
| $75,000 to $99,999 | 6 | 11.1% |
| $100,000 to $149,999 | 5 | 9.3% |
| $150,000 to $199,999 | 0 | 0.0% |
| $200,000+ | 1 | 1.9% |
Family Income by Famaliy Size in Milburn
4-person families (15 | 27.8%) account for the highest median family income in Milburn with $65,417 per family, while 3-person families (16 | 29.6%) have the highest median income of $17,917 per family member.
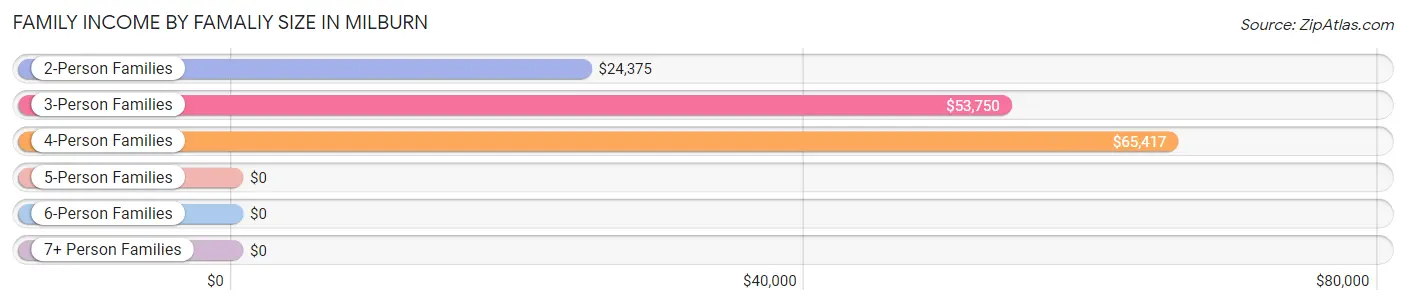
| Income Bracket | # Families | Median Income |
| 2-Person Families | 14 (25.9%) | $24,375 |
| 3-Person Families | 16 (29.6%) | $53,750 |
| 4-Person Families | 15 (27.8%) | $65,417 |
| 5-Person Families | 6 (11.1%) | $0 |
| 6-Person Families | 2 (3.7%) | $0 |
| 7+ Person Families | 1 (1.8%) | $0 |
| Total | 54 (100.0%) | $50,000 |
Family Income by Number of Earners in Milburn
The median family income in Milburn is $50,000, with families comprising 3+ earners (9) having the highest median family income of $104,375, while families with no earners (17) have the lowest median family income of $16,875, accounting for 16.7% and 31.5% of families, respectively.
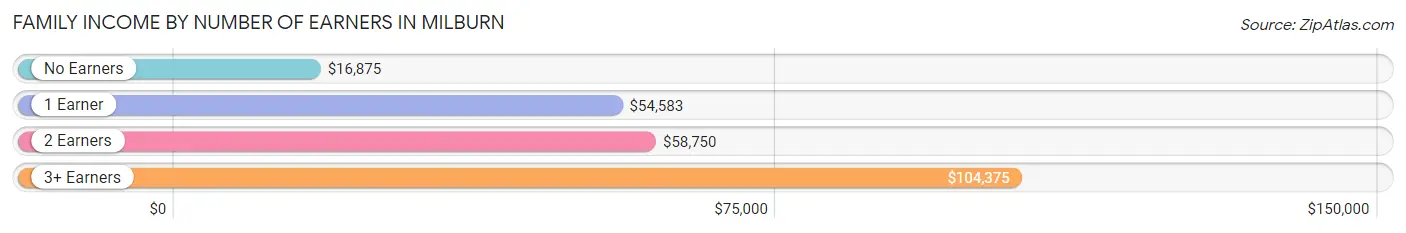
| Number of Earners | # Families | Median Income |
| No Earners | 17 (31.5%) | $16,875 |
| 1 Earner | 15 (27.8%) | $54,583 |
| 2 Earners | 13 (24.1%) | $58,750 |
| 3+ Earners | 9 (16.7%) | $104,375 |
| Total | 54 (100.0%) | $50,000 |
Household Income in Milburn
Household Income Brackets in Milburn
With 22 households falling in the category, the $50,000 to $74,999 income range is the most frequent in Milburn, accounting for 25.6% of all households.
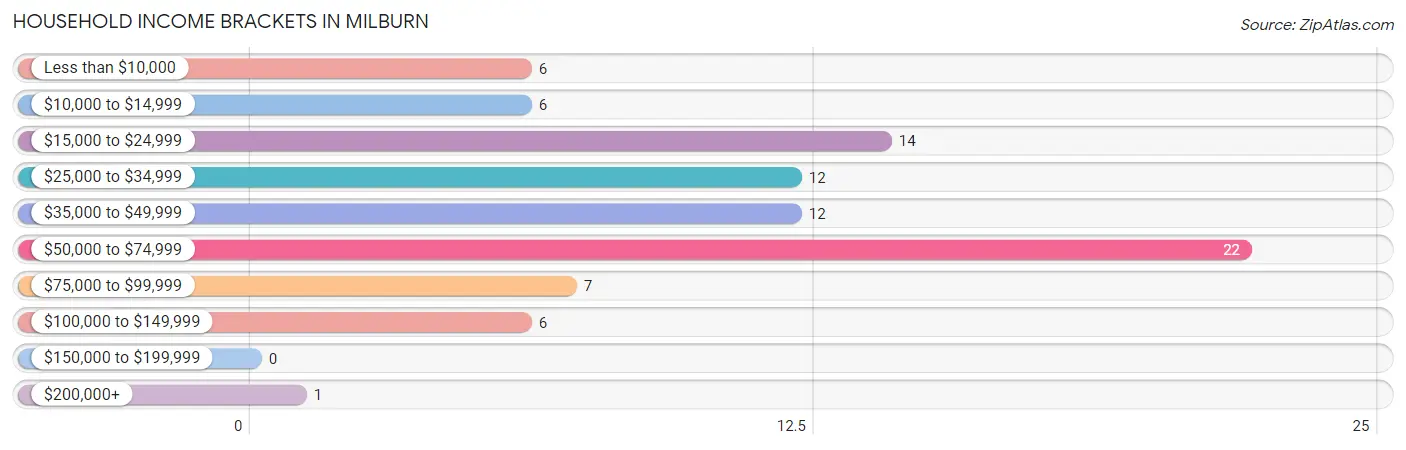
| Income Bracket | # Households | % Households |
| Less than $10,000 | 6 | 7.0% |
| $10,000 to $14,999 | 6 | 7.0% |
| $15,000 to $24,999 | 14 | 16.3% |
| $25,000 to $34,999 | 12 | 14.0% |
| $35,000 to $49,999 | 12 | 14.0% |
| $50,000 to $74,999 | 22 | 25.6% |
| $75,000 to $99,999 | 7 | 8.1% |
| $100,000 to $149,999 | 6 | 7.0% |
| $150,000 to $199,999 | 0 | 0.0% |
| $200,000+ | 1 | 1.2% |
Household Income by Householder Age in Milburn
The median household income in Milburn is $40,000, with the highest median household income of $51,250 found in the 45 to 64 years age bracket for the primary householder. A total of 31 households (36.0%) fall into this category. Meanwhile, the 15 to 24 years age bracket for the primary householder has the lowest median household income of $0, with 4 households (4.6%) in this group.
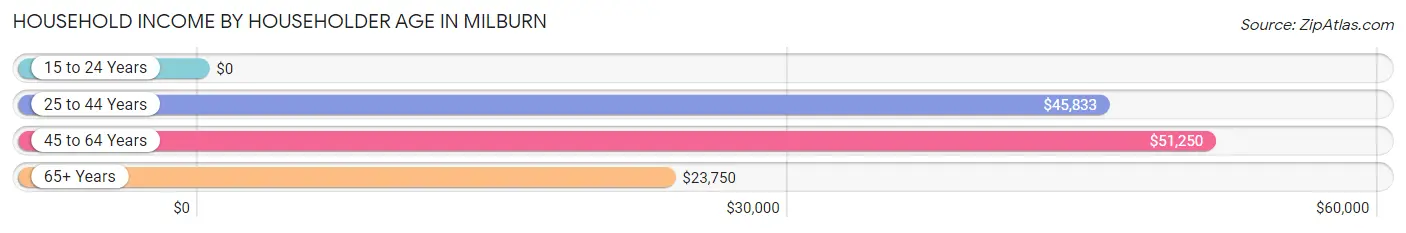
| Income Bracket | # Households | Median Income |
| 15 to 24 Years | 4 (4.6%) | $0 |
| 25 to 44 Years | 32 (37.2%) | $45,833 |
| 45 to 64 Years | 31 (36.0%) | $51,250 |
| 65+ Years | 19 (22.1%) | $23,750 |
| Total | 86 (100.0%) | $40,000 |
Poverty in Milburn
Income Below Poverty by Sex and Age in Milburn
With 25.6% poverty level for males and 33.8% for females among the residents of Milburn, 16 and 17 year old males and 16 and 17 year old females are the most vulnerable to poverty, with 3 males (75.0%) and 5 females (100.0%) in their respective age groups living below the poverty level.
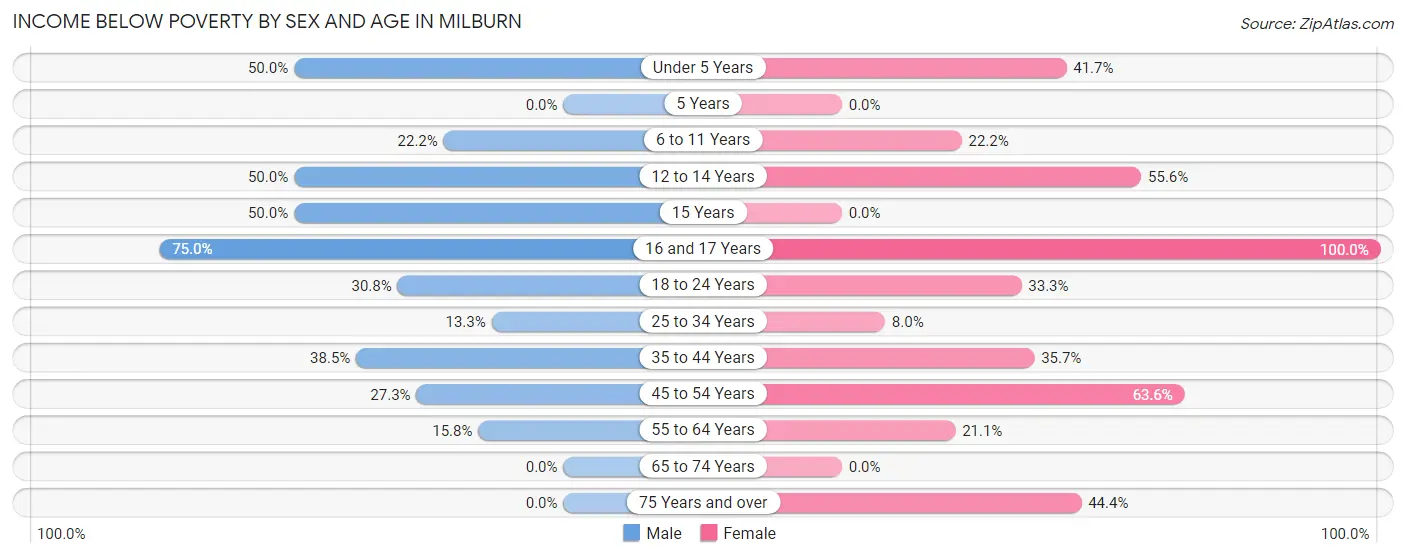
| Age Bracket | Male | Female |
| Under 5 Years | 4 (50.0%) | 5 (41.7%) |
| 5 Years | 0 (0.0%) | 0 (0.0%) |
| 6 to 11 Years | 2 (22.2%) | 2 (22.2%) |
| 12 to 14 Years | 2 (50.0%) | 5 (55.6%) |
| 15 Years | 1 (50.0%) | 0 (0.0%) |
| 16 and 17 Years | 3 (75.0%) | 5 (100.0%) |
| 18 to 24 Years | 4 (30.8%) | 5 (33.3%) |
| 25 to 34 Years | 4 (13.3%) | 2 (8.0%) |
| 35 to 44 Years | 5 (38.5%) | 10 (35.7%) |
| 45 to 54 Years | 3 (27.3%) | 7 (63.6%) |
| 55 to 64 Years | 3 (15.8%) | 4 (21.0%) |
| 65 to 74 Years | 0 (0.0%) | 0 (0.0%) |
| 75 Years and over | 0 (0.0%) | 4 (44.4%) |
| Total | 31 (25.6%) | 49 (33.8%) |
Income Above Poverty by Sex and Age in Milburn
According to the poverty statistics in Milburn, males aged 65 to 74 years and females aged 65 to 74 years are the age groups that are most secure financially, with 100.0% of males and 100.0% of females in these age groups living above the poverty line.
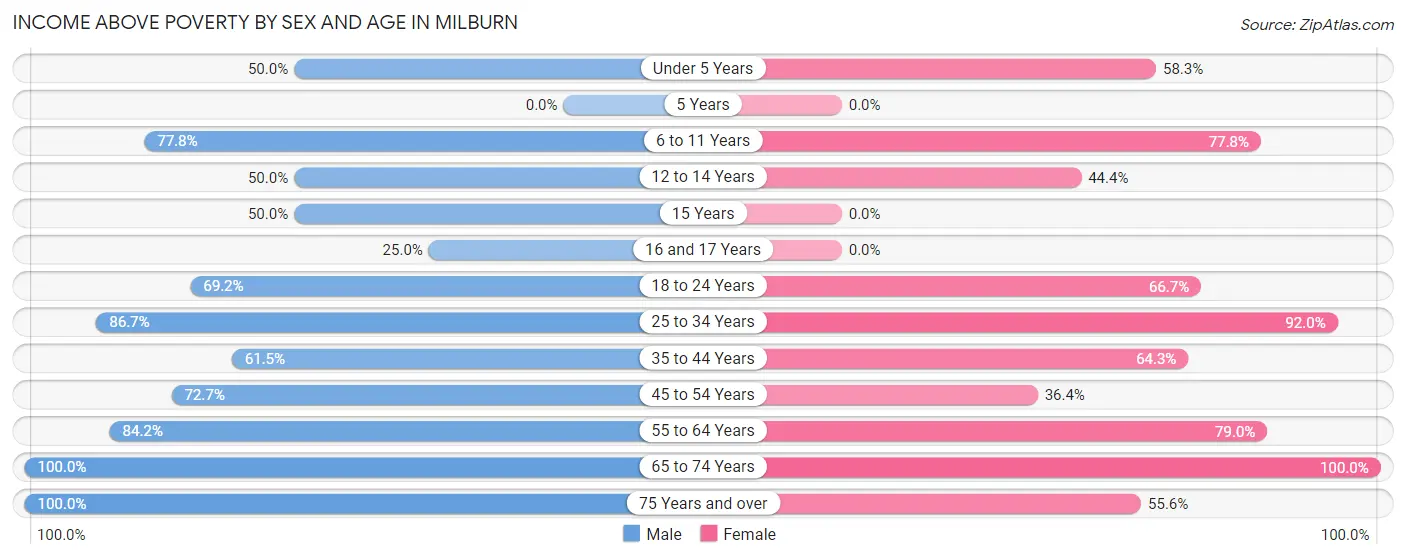
| Age Bracket | Male | Female |
| Under 5 Years | 4 (50.0%) | 7 (58.3%) |
| 5 Years | 0 (0.0%) | 0 (0.0%) |
| 6 to 11 Years | 7 (77.8%) | 7 (77.8%) |
| 12 to 14 Years | 2 (50.0%) | 4 (44.4%) |
| 15 Years | 1 (50.0%) | 0 (0.0%) |
| 16 and 17 Years | 1 (25.0%) | 0 (0.0%) |
| 18 to 24 Years | 9 (69.2%) | 10 (66.7%) |
| 25 to 34 Years | 26 (86.7%) | 23 (92.0%) |
| 35 to 44 Years | 8 (61.5%) | 18 (64.3%) |
| 45 to 54 Years | 8 (72.7%) | 4 (36.4%) |
| 55 to 64 Years | 16 (84.2%) | 15 (78.9%) |
| 65 to 74 Years | 7 (100.0%) | 3 (100.0%) |
| 75 Years and over | 1 (100.0%) | 5 (55.6%) |
| Total | 90 (74.4%) | 96 (66.2%) |
Income Below Poverty Among Married-Couple Families in Milburn
The poverty statistics for married-couple families in Milburn show that 14.6% or 6 of the total 41 families live below the poverty line. Families with 3 or 4 children have the highest poverty rate of 40.0%, comprising of 2 families. On the other hand, families with no children have the lowest poverty rate of 6.2%, which includes 1 families.
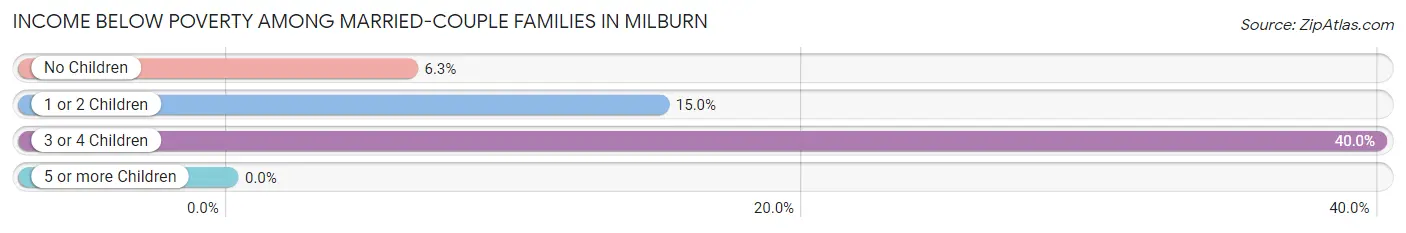
| Children | Above Poverty | Below Poverty |
| No Children | 15 (93.8%) | 1 (6.2%) |
| 1 or 2 Children | 17 (85.0%) | 3 (15.0%) |
| 3 or 4 Children | 3 (60.0%) | 2 (40.0%) |
| 5 or more Children | 0 (0.0%) | 0 (0.0%) |
| Total | 35 (85.4%) | 6 (14.6%) |
Income Below Poverty Among Single-Parent Households in Milburn
According to the poverty data in Milburn, 50.0% or 2 single-father households and 66.7% or 6 single-mother households are living below the poverty line. Among single-father households, those with 3 or 4 children have the highest poverty rate, with 2 households (100.0%) experiencing poverty. Likewise, among single-mother households, those with 3 or 4 children have the highest poverty rate, with 2 households (100.0%) falling below the poverty line.
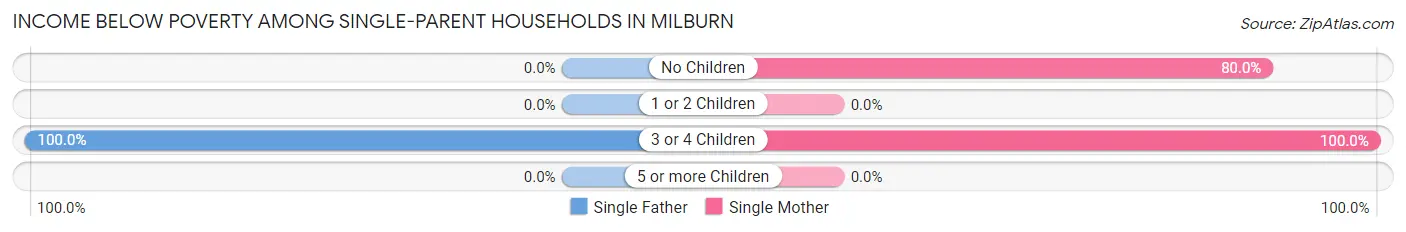
| Children | Single Father | Single Mother |
| No Children | 0 (0.0%) | 4 (80.0%) |
| 1 or 2 Children | 0 (0.0%) | 0 (0.0%) |
| 3 or 4 Children | 2 (100.0%) | 2 (100.0%) |
| 5 or more Children | 0 (0.0%) | 0 (0.0%) |
| Total | 2 (50.0%) | 6 (66.7%) |
Income Below Poverty Among Married-Couple vs Single-Parent Households in Milburn
The poverty data for Milburn shows that 6 of the married-couple family households (14.6%) and 8 of the single-parent households (61.5%) are living below the poverty level. Within the married-couple family households, those with 3 or 4 children have the highest poverty rate, with 2 households (40.0%) falling below the poverty line. Among the single-parent households, those with 3 or 4 children have the highest poverty rate, with 4 household (100.0%) living below poverty.
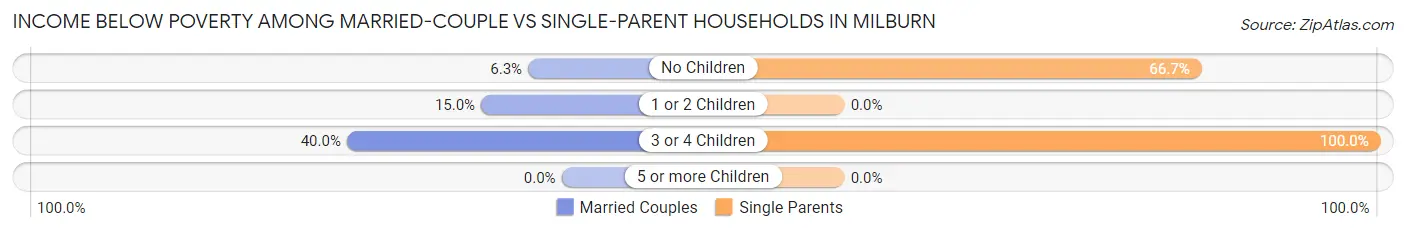
| Children | Married-Couple Families | Single-Parent Households |
| No Children | 1 (6.2%) | 4 (66.7%) |
| 1 or 2 Children | 3 (15.0%) | 0 (0.0%) |
| 3 or 4 Children | 2 (40.0%) | 4 (100.0%) |
| 5 or more Children | 0 (0.0%) | 0 (0.0%) |
| Total | 6 (14.6%) | 8 (61.5%) |
Race in Milburn
The most populous races in Milburn are White / Caucasian (211 | 78.7%), Two or more Races (33 | 12.3%), and Native / Alaskan (24 | 9.0%).
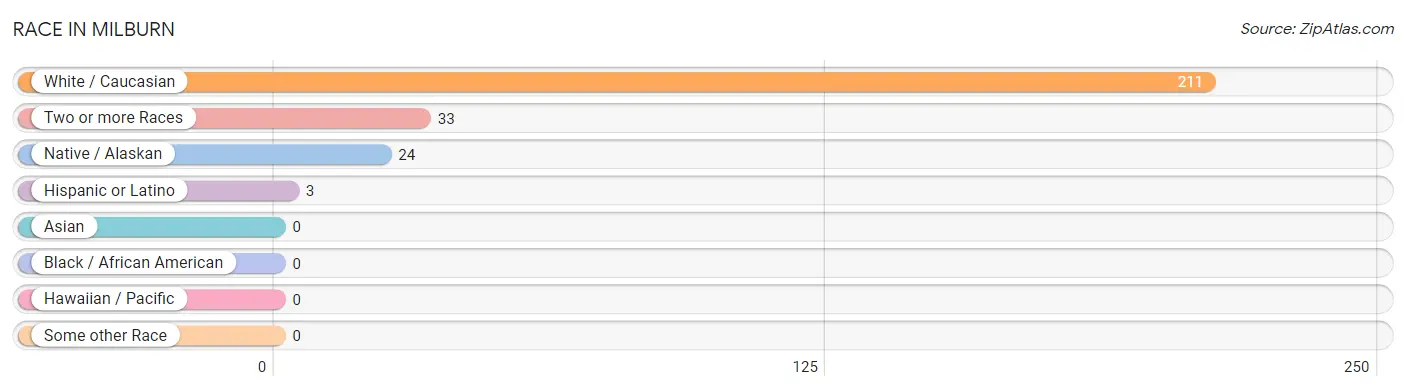
| Race | # Population | % Population |
| Asian | 0 | 0.0% |
| Black / African American | 0 | 0.0% |
| Hawaiian / Pacific | 0 | 0.0% |
| Hispanic or Latino | 3 | 1.1% |
| Native / Alaskan | 24 | 9.0% |
| White / Caucasian | 211 | 78.7% |
| Two or more Races | 33 | 12.3% |
| Some other Race | 0 | 0.0% |
| Total | 268 | 100.0% |
Ancestry in Milburn
The most populous ancestries reported in Milburn are American (48 | 17.9%), Irish (35 | 13.1%), Chickasaw (26 | 9.7%), German (19 | 7.1%), and Cherokee (14 | 5.2%), together accounting for 53.0% of all Milburn residents.
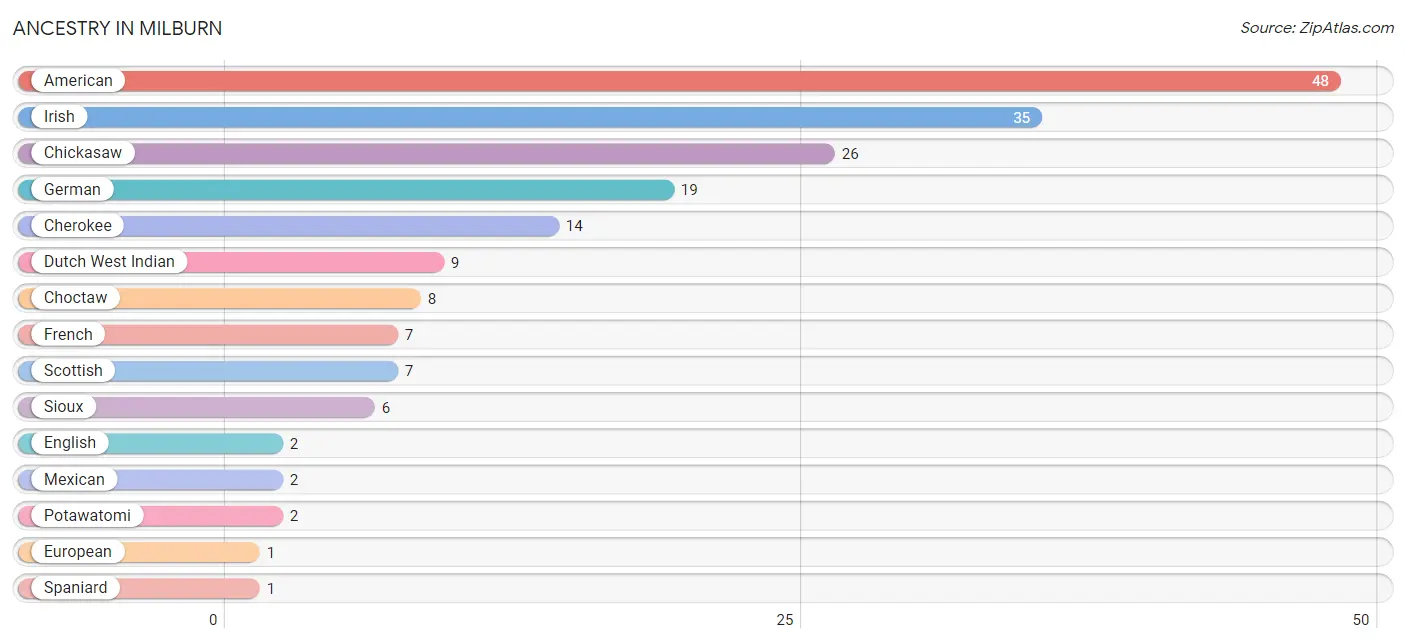
| Ancestry | # Population | % Population |
| American | 48 | 17.9% |
| Cherokee | 14 | 5.2% |
| Chickasaw | 26 | 9.7% |
| Choctaw | 8 | 3.0% |
| Dutch West Indian | 9 | 3.4% |
| English | 2 | 0.7% |
| European | 1 | 0.4% |
| French | 7 | 2.6% |
| German | 19 | 7.1% |
| Irish | 35 | 13.1% |
| Mexican | 2 | 0.7% |
| Potawatomi | 2 | 0.7% |
| Scottish | 7 | 2.6% |
| Sioux | 6 | 2.2% |
| Spaniard | 1 | 0.4% | View All 15 Rows |
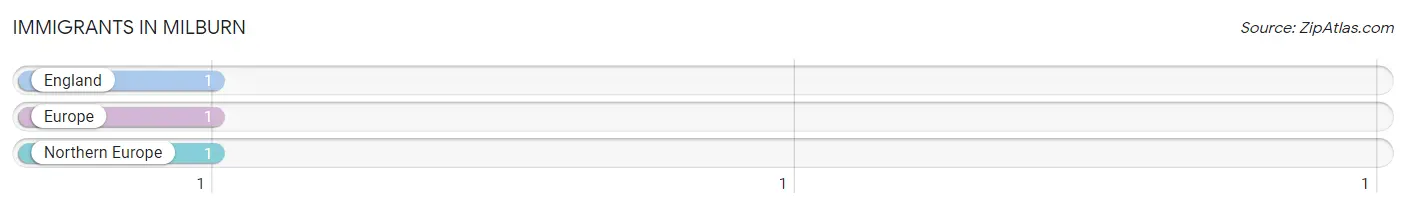
Immigrants in Milburn
The most numerous immigrant groups reported in Milburn came from England (1 | 0.4%), Europe (1 | 0.4%), and Northern Europe (1 | 0.4%), together accounting for 1.1% of all Milburn residents.
| Immigration Origin | # Population | % Population |
| England | 1 | 0.4% |
| Europe | 1 | 0.4% |
| Northern Europe | 1 | 0.4% | View All 3 Rows |
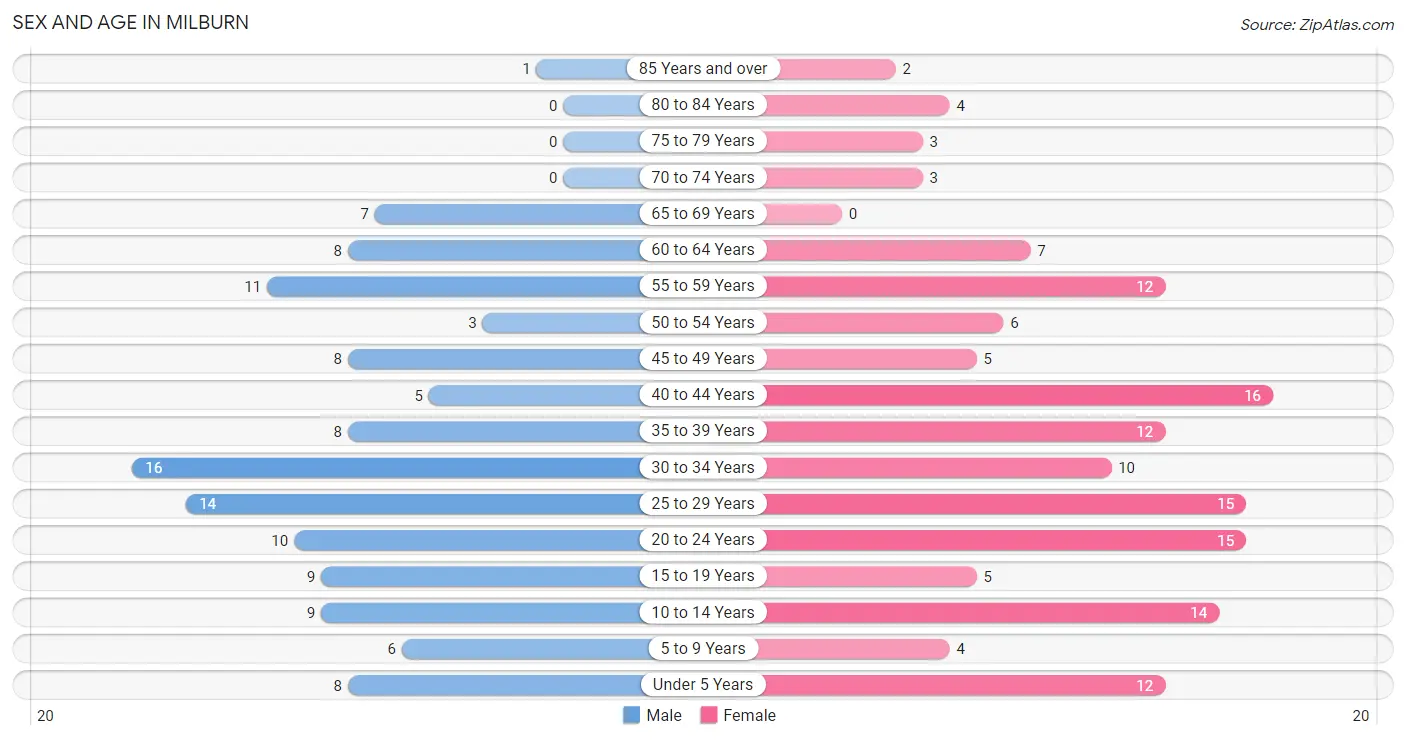
Sex and Age in Milburn
Sex and Age in Milburn
The most populous age groups in Milburn are 30 to 34 Years (16 | 13.0%) for men and 40 to 44 Years (16 | 11.0%) for women.
| Age Bracket | Male | Female |
| Under 5 Years | 8 (6.5%) | 12 (8.3%) |
| 5 to 9 Years | 6 (4.9%) | 4 (2.8%) |
| 10 to 14 Years | 9 (7.3%) | 14 (9.7%) |
| 15 to 19 Years | 9 (7.3%) | 5 (3.5%) |
| 20 to 24 Years | 10 (8.1%) | 15 (10.3%) |
| 25 to 29 Years | 14 (11.4%) | 15 (10.3%) |
| 30 to 34 Years | 16 (13.0%) | 10 (6.9%) |
| 35 to 39 Years | 8 (6.5%) | 12 (8.3%) |
| 40 to 44 Years | 5 (4.1%) | 16 (11.0%) |
| 45 to 49 Years | 8 (6.5%) | 5 (3.5%) |
| 50 to 54 Years | 3 (2.4%) | 6 (4.1%) |
| 55 to 59 Years | 11 (8.9%) | 12 (8.3%) |
| 60 to 64 Years | 8 (6.5%) | 7 (4.8%) |
| 65 to 69 Years | 7 (5.7%) | 0 (0.0%) |
| 70 to 74 Years | 0 (0.0%) | 3 (2.1%) |
| 75 to 79 Years | 0 (0.0%) | 3 (2.1%) |
| 80 to 84 Years | 0 (0.0%) | 4 (2.8%) |
| 85 Years and over | 1 (0.8%) | 2 (1.4%) |
| Total | 123 (100.0%) | 145 (100.0%) |
Families and Households in Milburn
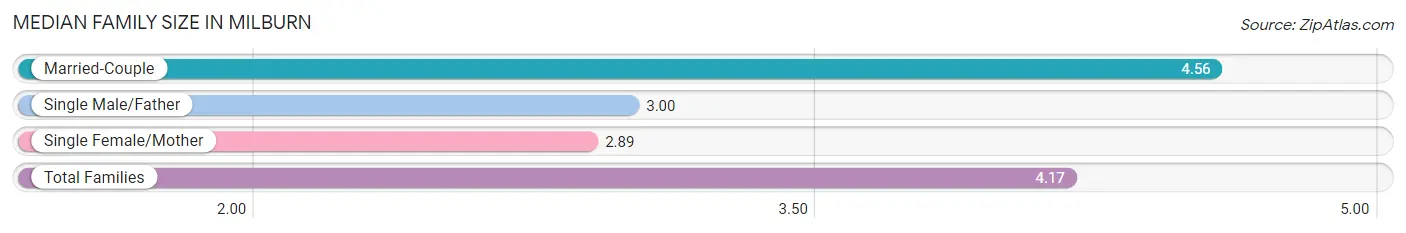
Median Family Size in Milburn
The median family size in Milburn is 4.17 persons per family, with married-couple families (41 | 75.9%) accounting for the largest median family size of 4.56 persons per family. On the other hand, single female/mother families (9 | 16.7%) represent the smallest median family size with 2.89 persons per family.
| Family Type | # Families | Family Size |
| Married-Couple | 41 (75.9%) | 4.56 |
| Single Male/Father | 4 (7.4%) | 3.00 |
| Single Female/Mother | 9 (16.7%) | 2.89 |
| Total Families | 54 (100.0%) | 4.17 |
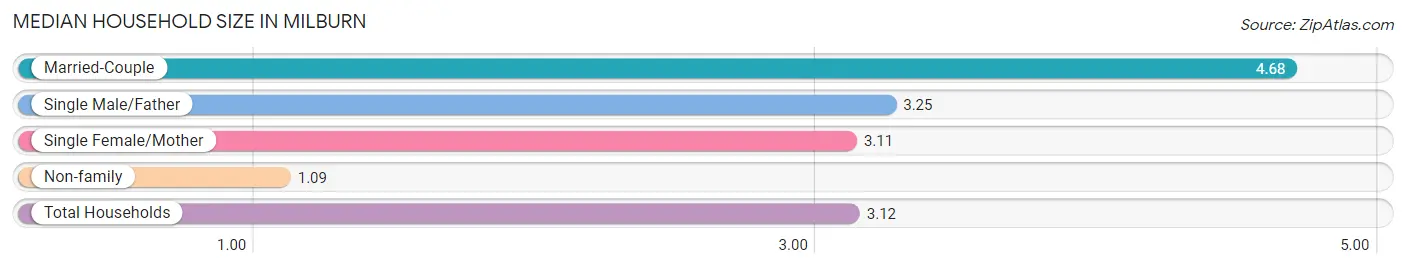
Median Household Size in Milburn
The median household size in Milburn is 3.12 persons per household, with married-couple households (41 | 47.7%) accounting for the largest median household size of 4.68 persons per household. non-family households (32 | 37.2%) represent the smallest median household size with 1.09 persons per household.
| Household Type | # Households | Household Size |
| Married-Couple | 41 (47.7%) | 4.68 |
| Single Male/Father | 4 (4.6%) | 3.25 |
| Single Female/Mother | 9 (10.5%) | 3.11 |
| Non-family | 32 (37.2%) | 1.09 |
| Total Households | 86 (100.0%) | 3.12 |
Household Size by Marriage Status in Milburn
Out of a total of 86 households in Milburn, 54 (62.8%) are family households, while 32 (37.2%) are nonfamily households. The most numerous type of family households are 3-person households, comprising 16, and the most common type of nonfamily households are 1-person households, comprising 27.
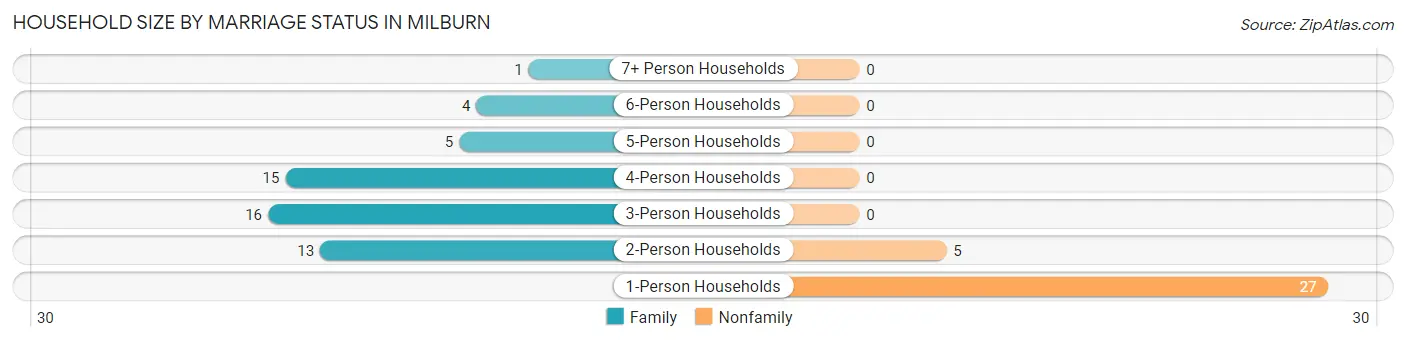
| Household Size | Family Households | Nonfamily Households |
| 1-Person Households | - | 27 (31.4%) |
| 2-Person Households | 13 (15.1%) | 5 (5.8%) |
| 3-Person Households | 16 (18.6%) | 0 (0.0%) |
| 4-Person Households | 15 (17.4%) | 0 (0.0%) |
| 5-Person Households | 5 (5.8%) | 0 (0.0%) |
| 6-Person Households | 4 (4.6%) | 0 (0.0%) |
| 7+ Person Households | 1 (1.2%) | 0 (0.0%) |
| Total | 54 (62.8%) | 32 (37.2%) |
Female Fertility in Milburn
Fertility by Age in Milburn
Average fertility rate in Milburn is 113.0 births per 1,000 women. Women in the age bracket of 20 to 34 years have the highest fertility rate with 225.0 births per 1,000 women. Women in the age bracket of 20 to 34 years acount for 100.0% of all women with births.
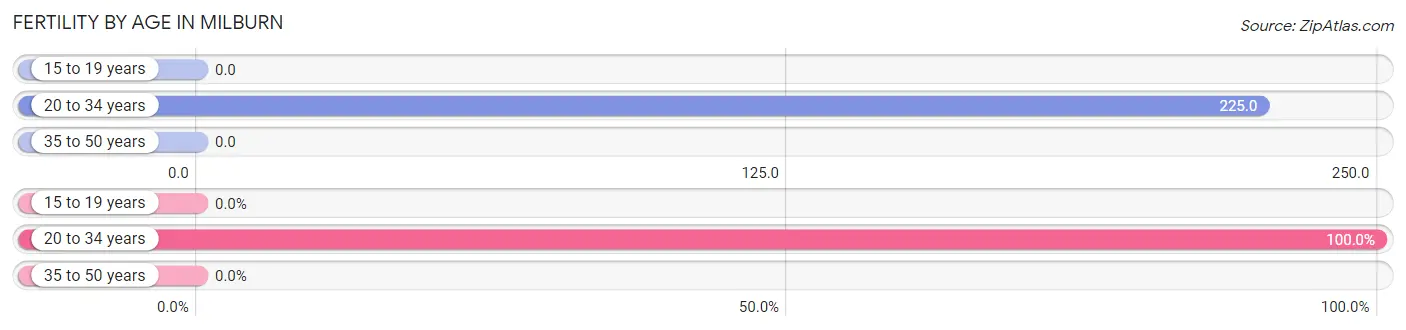
| Age Bracket | Women with Births | Births / 1,000 Women |
| 15 to 19 years | 0 (0.0%) | 0.0 |
| 20 to 34 years | 9 (100.0%) | 225.0 |
| 35 to 50 years | 0 (0.0%) | 0.0 |
| Total | 9 (100.0%) | 113.0 |
Fertility by Age by Marriage Status in Milburn
22.2% of women with births (9) in Milburn are married. The highest percentage of unmarried women with births falls into 20 to 34 years age bracket with 77.8% of them unmarried at the time of birth, while the lowest percentage of unmarried women with births belong to 20 to 34 years age bracket with 77.8% of them unmarried.
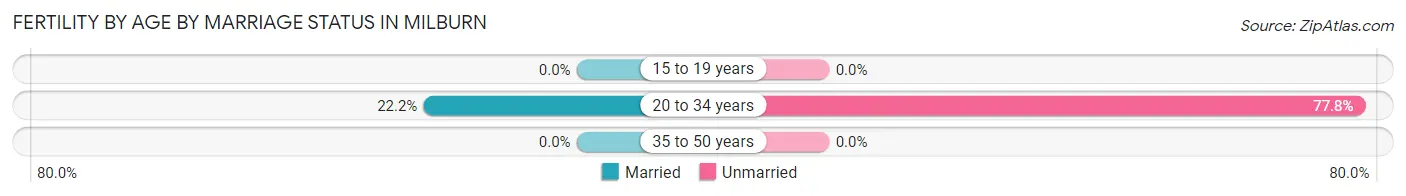
| Age Bracket | Married | Unmarried |
| 15 to 19 years | 0 (0.0%) | 0 (0.0%) |
| 20 to 34 years | 2 (22.2%) | 7 (77.8%) |
| 35 to 50 years | 0 (0.0%) | 0 (0.0%) |
| Total | 2 (22.2%) | 7 (77.8%) |
Fertility by Education in Milburn
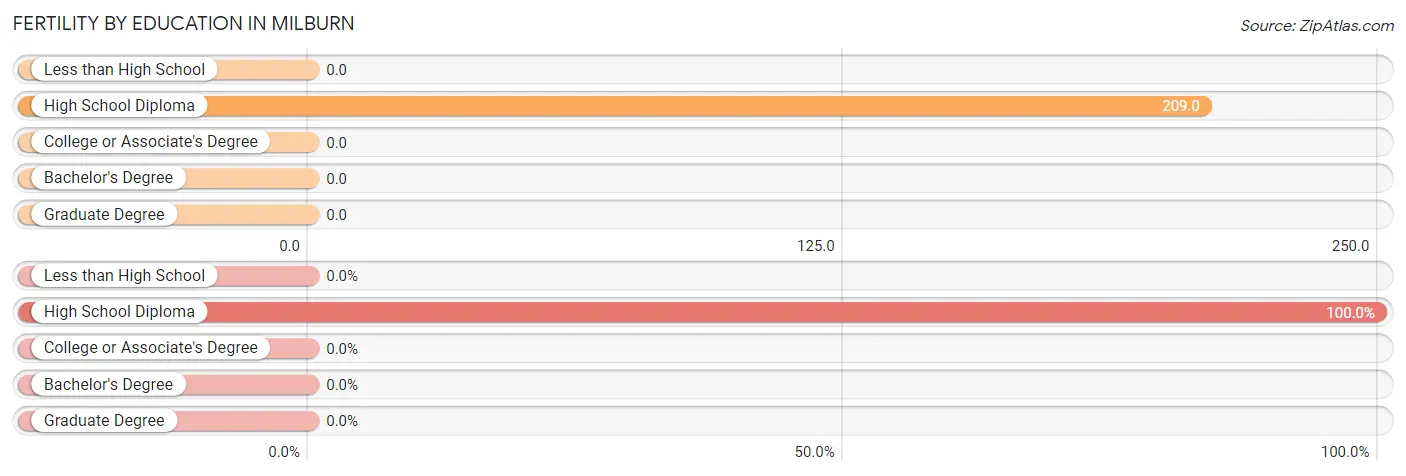
| Educational Attainment | Women with Births | Births / 1,000 Women |
| Less than High School | 0 (0.0%) | 0.0 |
| High School Diploma | 9 (100.0%) | 209.0 |
| College or Associate's Degree | 0 (0.0%) | 0.0 |
| Bachelor's Degree | 0 (0.0%) | 0.0 |
| Graduate Degree | 0 (0.0%) | 0.0 |
| Total | 9 (100.0%) | 113.0 |
Fertility by Education by Marriage Status in Milburn
77.8% of women with births in Milburn are unmarried. Women with the educational attainment of high school diploma are most likely to be married with 22.2% of them married at childbirth, while women with the educational attainment of high school diploma are least likely to be married with 77.8% of them unmarried at childbirth.
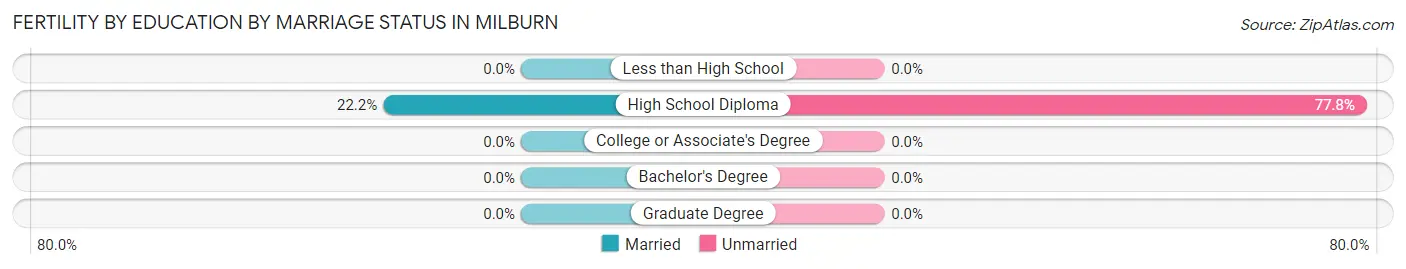
| Educational Attainment | Married | Unmarried |
| Less than High School | 0 (0.0%) | 0 (0.0%) |
| High School Diploma | 2 (22.2%) | 7 (77.8%) |
| College or Associate's Degree | 0 (0.0%) | 0 (0.0%) |
| Bachelor's Degree | 0 (0.0%) | 0 (0.0%) |
| Graduate Degree | 0 (0.0%) | 0 (0.0%) |
| Total | 2 (22.2%) | 7 (77.8%) |
Employment Characteristics in Milburn
Employment by Class of Employer in Milburn
Among the 105 employed individuals in Milburn, private company employees (82 | 78.1%), federal government employees (10 | 9.5%), and state government employees (6 | 5.7%) make up the most common classes of employment.
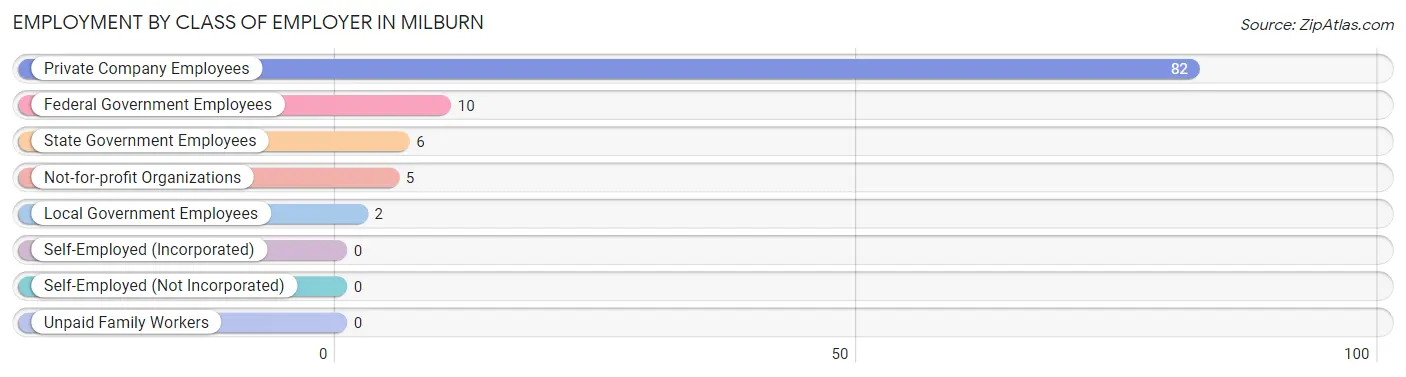
| Employer Class | # Employees | % Employees |
| Private Company Employees | 82 | 78.1% |
| Self-Employed (Incorporated) | 0 | 0.0% |
| Self-Employed (Not Incorporated) | 0 | 0.0% |
| Not-for-profit Organizations | 5 | 4.8% |
| Local Government Employees | 2 | 1.9% |
| State Government Employees | 6 | 5.7% |
| Federal Government Employees | 10 | 9.5% |
| Unpaid Family Workers | 0 | 0.0% |
| Total | 105 | 100.0% |
Employment Status by Age in Milburn
According to the labor force statistics for Milburn, out of the total population over 16 years of age (213), 52.1% or 111 individuals are in the labor force, with 5.4% or 6 of them unemployed. The age group with the highest labor force participation rate is 30 to 34 years, with 84.6% or 22 individuals in the labor force. Within the labor force, the 30 to 34 years age range has the highest percentage of unemployed individuals, with 18.2% or 4 of them being unemployed.
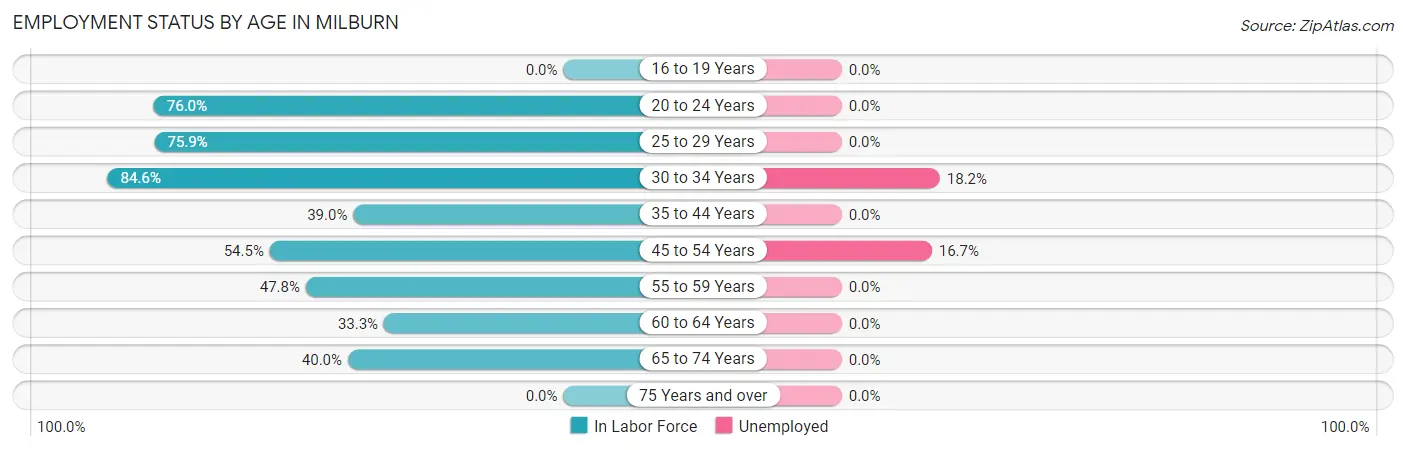
| Age Bracket | In Labor Force | Unemployed |
| 16 to 19 Years | 0 (0.0%) | 0 (0.0%) |
| 20 to 24 Years | 19 (76.0%) | 0 (0.0%) |
| 25 to 29 Years | 22 (75.9%) | 0 (0.0%) |
| 30 to 34 Years | 22 (84.6%) | 4 (18.2%) |
| 35 to 44 Years | 16 (39.0%) | 0 (0.0%) |
| 45 to 54 Years | 12 (54.5%) | 2 (16.7%) |
| 55 to 59 Years | 11 (47.8%) | 0 (0.0%) |
| 60 to 64 Years | 5 (33.3%) | 0 (0.0%) |
| 65 to 74 Years | 4 (40.0%) | 0 (0.0%) |
| 75 Years and over | 0 (0.0%) | 0 (0.0%) |
| Total | 111 (52.1%) | 6 (5.4%) |
Employment Status by Educational Attainment in Milburn
According to labor force statistics for Milburn, 56.4% of individuals (88) out of the total population between 25 and 64 years of age (156) are in the labor force, with 6.8% or 6 of them being unemployed. The group with the highest labor force participation rate are those with the educational attainment of bachelor's degree or higher, with 100.0% or 7 individuals in the labor force. Within the labor force, individuals with less than high school education have the highest percentage of unemployment, with 12.5% or 2 of them being unemployed.
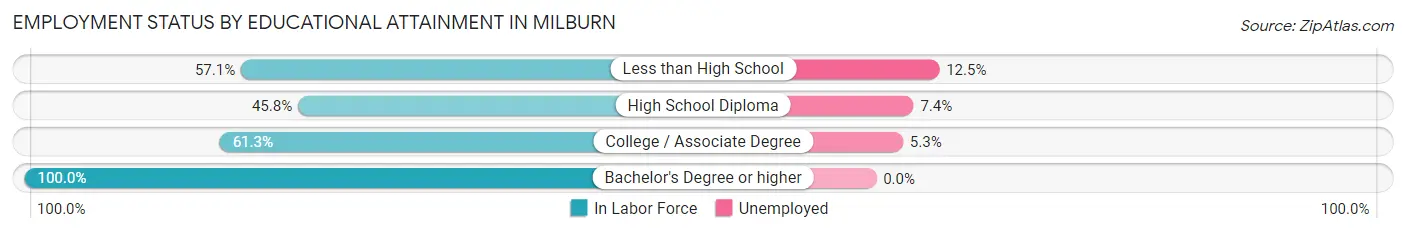
| Educational Attainment | In Labor Force | Unemployed |
| Less than High School | 16 (57.1%) | 4 (12.5%) |
| High School Diploma | 27 (45.8%) | 4 (7.4%) |
| College / Associate Degree | 38 (61.3%) | 3 (5.3%) |
| Bachelor's Degree or higher | 7 (100.0%) | 0 (0.0%) |
| Total | 88 (56.4%) | 11 (6.8%) |
Employment Occupations by Sex in Milburn
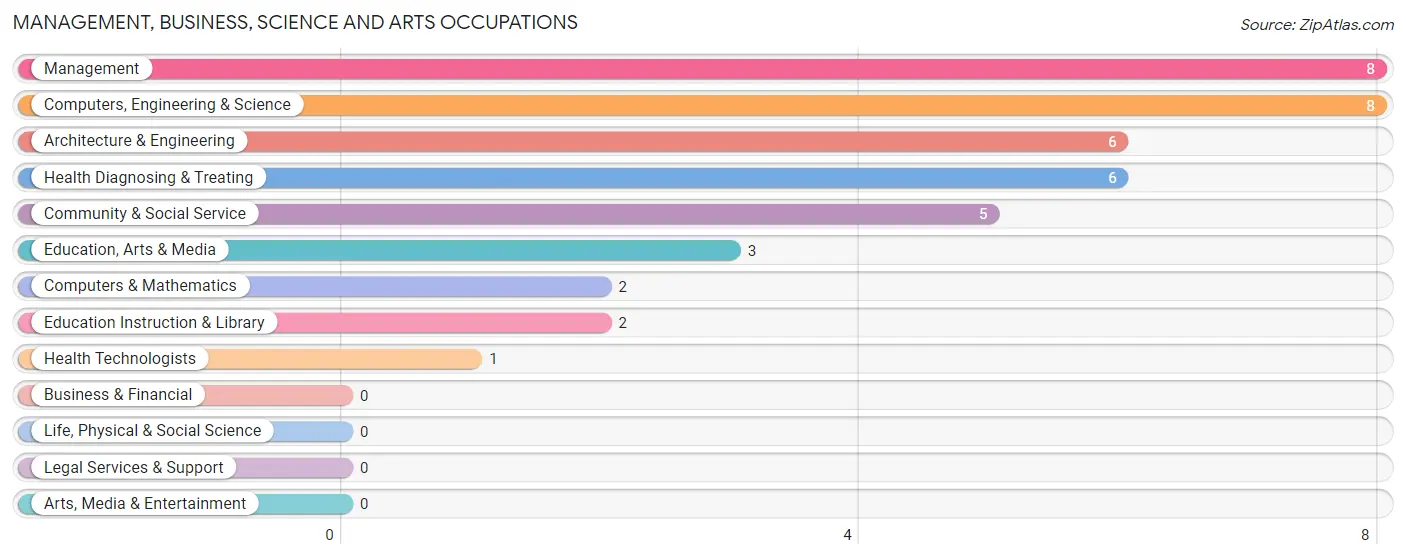
Management, Business, Science and Arts Occupations
The most common Management, Business, Science and Arts occupations in Milburn are Management (8 | 7.6%), Computers, Engineering & Science (8 | 7.6%), Architecture & Engineering (6 | 5.7%), Health Diagnosing & Treating (6 | 5.7%), and Community & Social Service (5 | 4.8%).
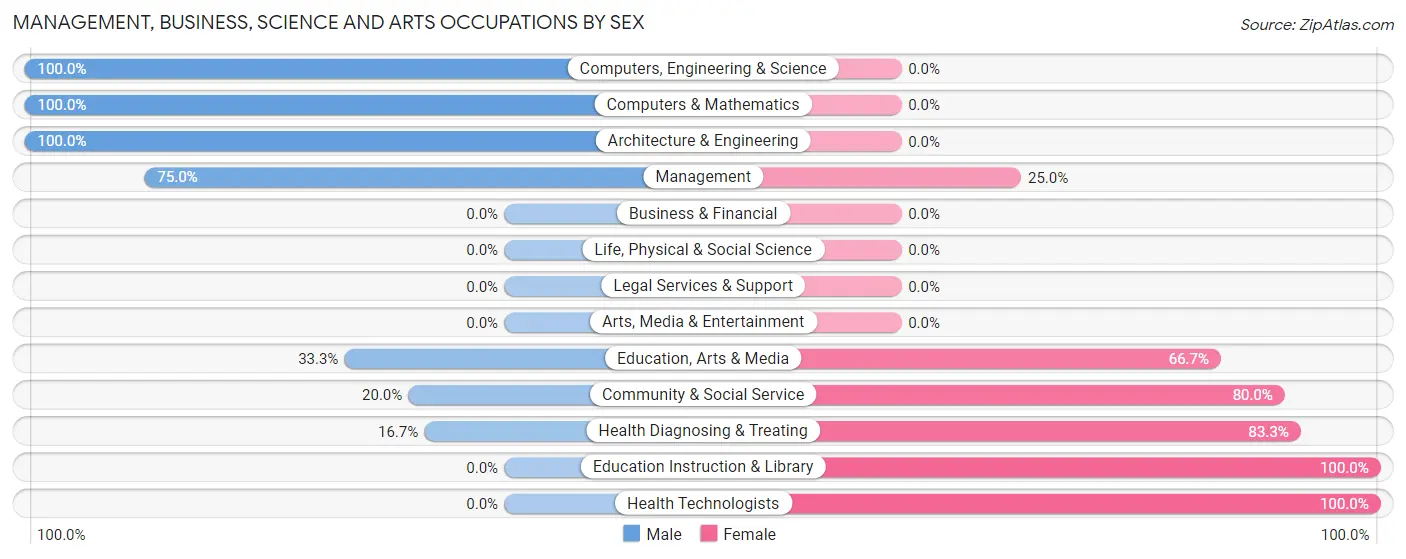
Management, Business, Science and Arts Occupations by Sex
Within the Management, Business, Science and Arts occupations in Milburn, the most male-oriented occupations are Computers, Engineering & Science (100.0%), Computers & Mathematics (100.0%), and Architecture & Engineering (100.0%), while the most female-oriented occupations are Education Instruction & Library (100.0%), Health Technologists (100.0%), and Health Diagnosing & Treating (83.3%).
| Occupation | Male | Female |
| Management | 6 (75.0%) | 2 (25.0%) |
| Business & Financial | 0 (0.0%) | 0 (0.0%) |
| Computers, Engineering & Science | 8 (100.0%) | 0 (0.0%) |
| Computers & Mathematics | 2 (100.0%) | 0 (0.0%) |
| Architecture & Engineering | 6 (100.0%) | 0 (0.0%) |
| Life, Physical & Social Science | 0 (0.0%) | 0 (0.0%) |
| Community & Social Service | 1 (20.0%) | 4 (80.0%) |
| Education, Arts & Media | 1 (33.3%) | 2 (66.7%) |
| Legal Services & Support | 0 (0.0%) | 0 (0.0%) |
| Education Instruction & Library | 0 (0.0%) | 2 (100.0%) |
| Arts, Media & Entertainment | 0 (0.0%) | 0 (0.0%) |
| Health Diagnosing & Treating | 1 (16.7%) | 5 (83.3%) |
| Health Technologists | 0 (0.0%) | 1 (100.0%) |
| Total (Category) | 16 (59.3%) | 11 (40.7%) |
| Total (Overall) | 62 (59.1%) | 43 (40.9%) |
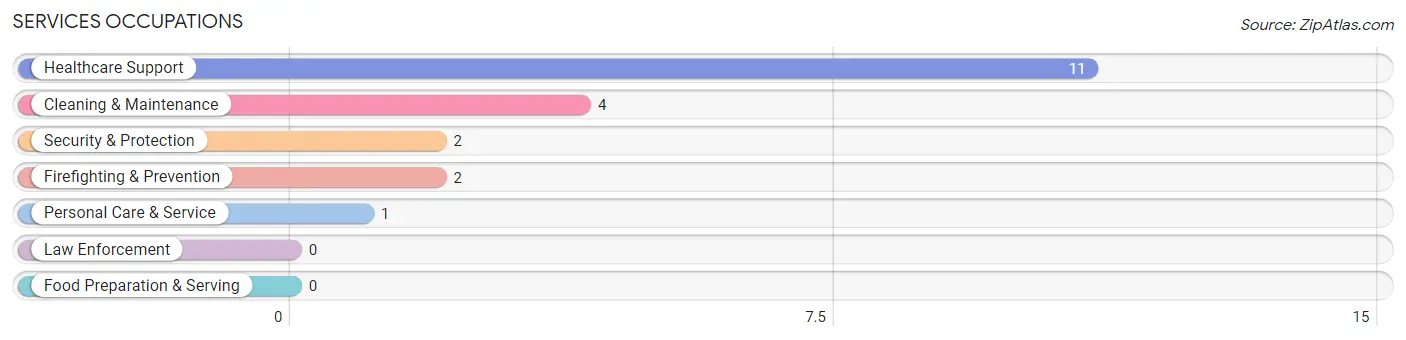
Services Occupations
The most common Services occupations in Milburn are Healthcare Support (11 | 10.5%), Cleaning & Maintenance (4 | 3.8%), Security & Protection (2 | 1.9%), Firefighting & Prevention (2 | 1.9%), and Personal Care & Service (1 | 0.9%).
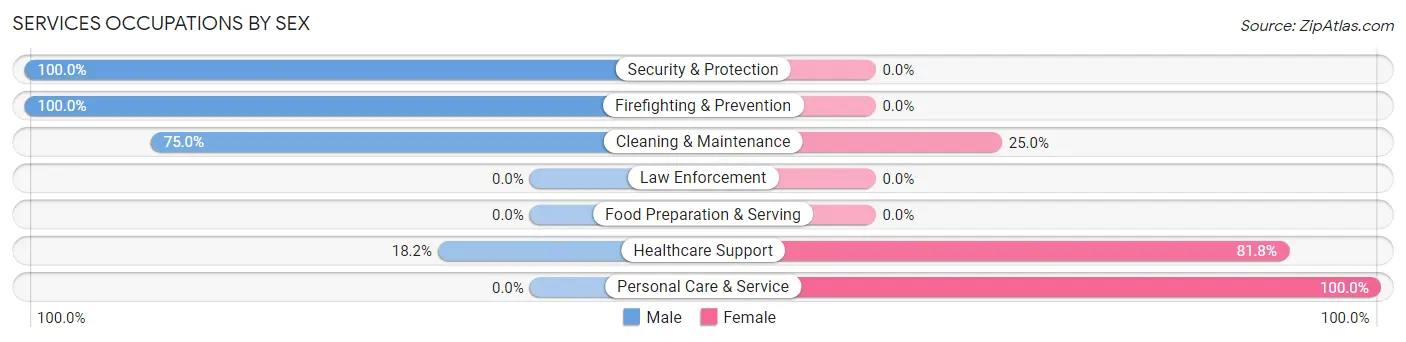
Services Occupations by Sex
Within the Services occupations in Milburn, the most male-oriented occupations are Security & Protection (100.0%), Firefighting & Prevention (100.0%), and Cleaning & Maintenance (75.0%), while the most female-oriented occupations are Personal Care & Service (100.0%), Healthcare Support (81.8%), and Cleaning & Maintenance (25.0%).
| Occupation | Male | Female |
| Healthcare Support | 2 (18.2%) | 9 (81.8%) |
| Security & Protection | 2 (100.0%) | 0 (0.0%) |
| Firefighting & Prevention | 2 (100.0%) | 0 (0.0%) |
| Law Enforcement | 0 (0.0%) | 0 (0.0%) |
| Food Preparation & Serving | 0 (0.0%) | 0 (0.0%) |
| Cleaning & Maintenance | 3 (75.0%) | 1 (25.0%) |
| Personal Care & Service | 0 (0.0%) | 1 (100.0%) |
| Total (Category) | 7 (38.9%) | 11 (61.1%) |
| Total (Overall) | 62 (59.1%) | 43 (40.9%) |
Sales and Office Occupations
The most common Sales and Office occupations in Milburn are Sales & Related (9 | 8.6%), and Office & Administration (8 | 7.6%).
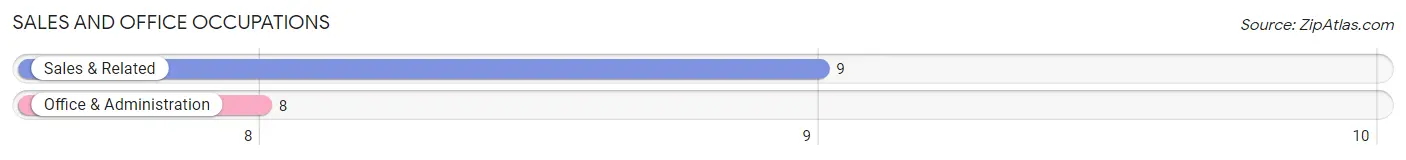
Sales and Office Occupations by Sex
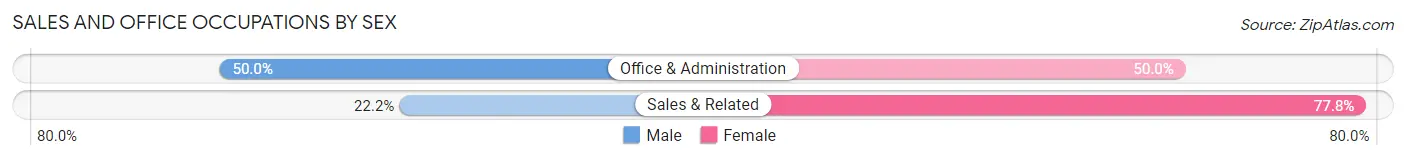
| Occupation | Male | Female |
| Sales & Related | 2 (22.2%) | 7 (77.8%) |
| Office & Administration | 4 (50.0%) | 4 (50.0%) |
| Total (Category) | 6 (35.3%) | 11 (64.7%) |
| Total (Overall) | 62 (59.1%) | 43 (40.9%) |
Natural Resources, Construction and Maintenance Occupations
The most common Natural Resources, Construction and Maintenance occupations in Milburn are , and Construction & Extraction (7 | 6.7%).
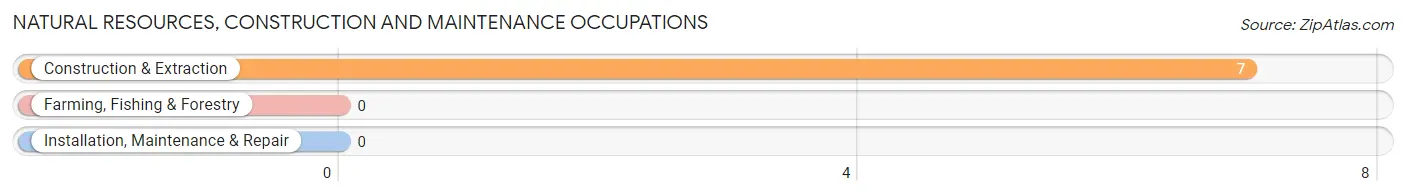
Natural Resources, Construction and Maintenance Occupations by Sex
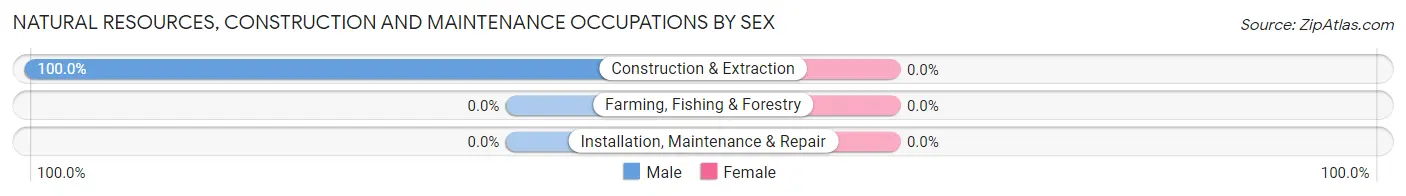
| Occupation | Male | Female |
| Farming, Fishing & Forestry | 0 (0.0%) | 0 (0.0%) |
| Construction & Extraction | 7 (100.0%) | 0 (0.0%) |
| Installation, Maintenance & Repair | 0 (0.0%) | 0 (0.0%) |
| Total (Category) | 7 (100.0%) | 0 (0.0%) |
| Total (Overall) | 62 (59.1%) | 43 (40.9%) |
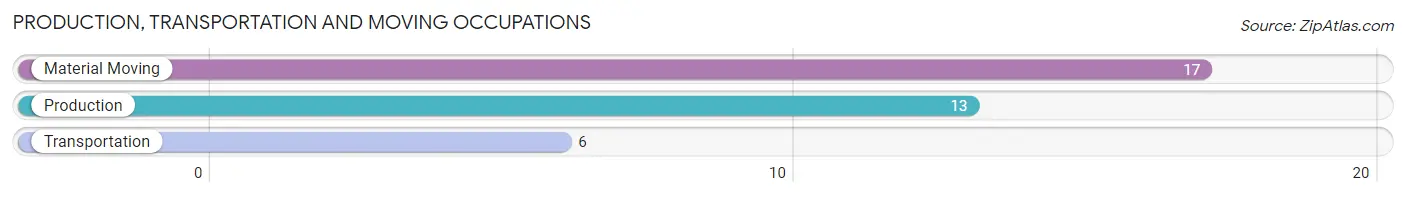
Production, Transportation and Moving Occupations
The most common Production, Transportation and Moving occupations in Milburn are Material Moving (17 | 16.2%), Production (13 | 12.4%), and Transportation (6 | 5.7%).
Production, Transportation and Moving Occupations by Sex
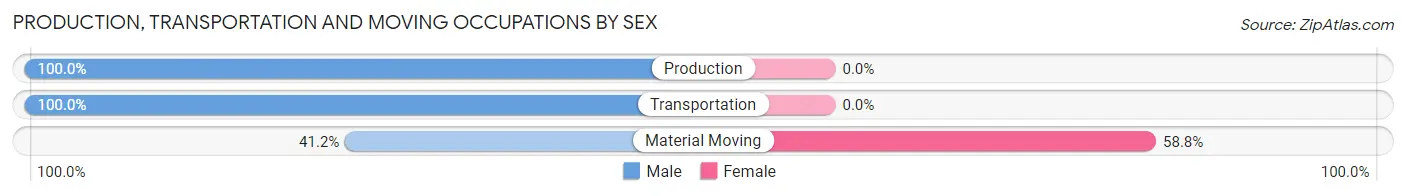
| Occupation | Male | Female |
| Production | 13 (100.0%) | 0 (0.0%) |
| Transportation | 6 (100.0%) | 0 (0.0%) |
| Material Moving | 7 (41.2%) | 10 (58.8%) |
| Total (Category) | 26 (72.2%) | 10 (27.8%) |
| Total (Overall) | 62 (59.1%) | 43 (40.9%) |
Employment Industries by Sex in Milburn
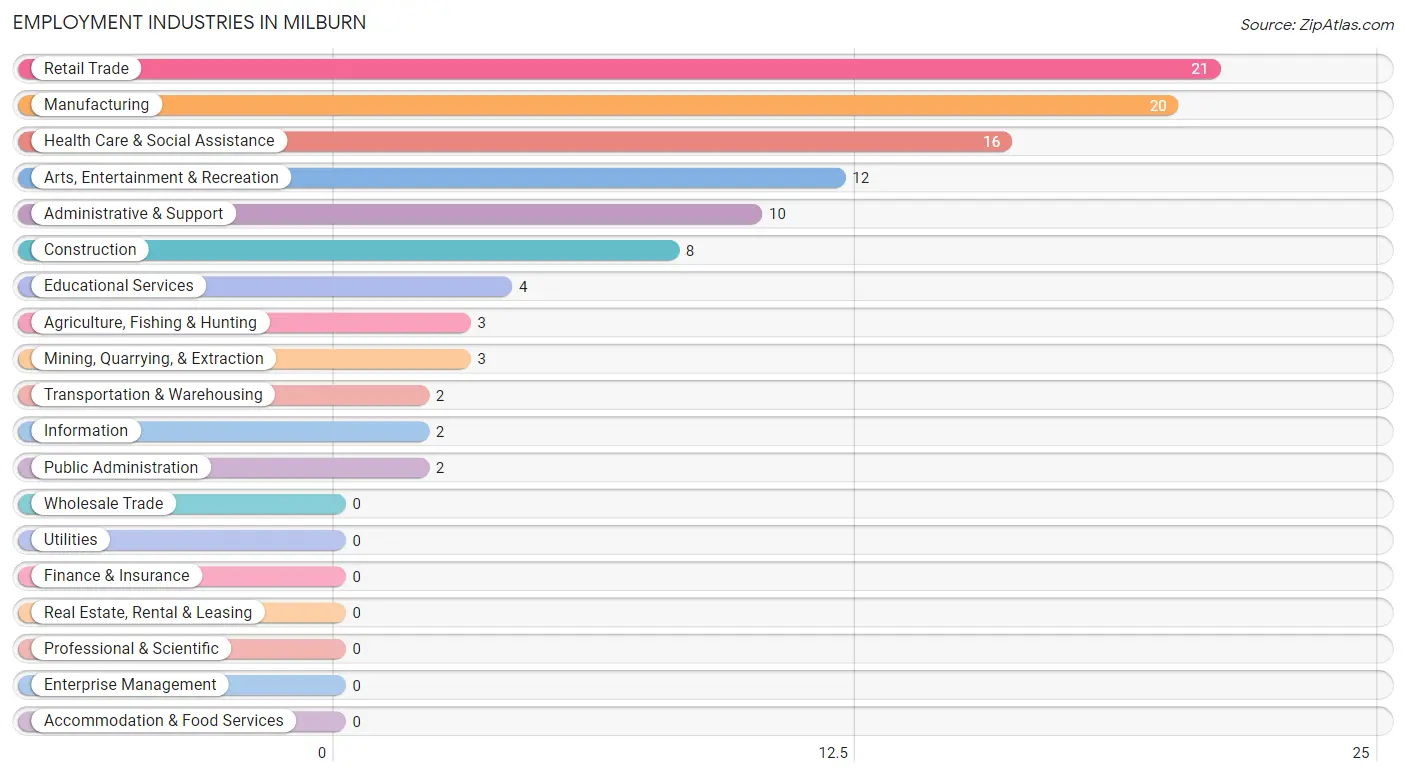
Employment Industries in Milburn
The major employment industries in Milburn include Retail Trade (21 | 20.0%), Manufacturing (20 | 19.1%), Health Care & Social Assistance (16 | 15.2%), Arts, Entertainment & Recreation (12 | 11.4%), and Administrative & Support (10 | 9.5%).
Employment Industries by Sex in Milburn
The Milburn industries that see more men than women are Agriculture, Fishing & Hunting (100.0%), Mining, Quarrying, & Extraction (100.0%), and Construction (100.0%), whereas the industries that tend to have a higher number of women are Educational Services (100.0%), Public Administration (100.0%), and Health Care & Social Assistance (81.2%).
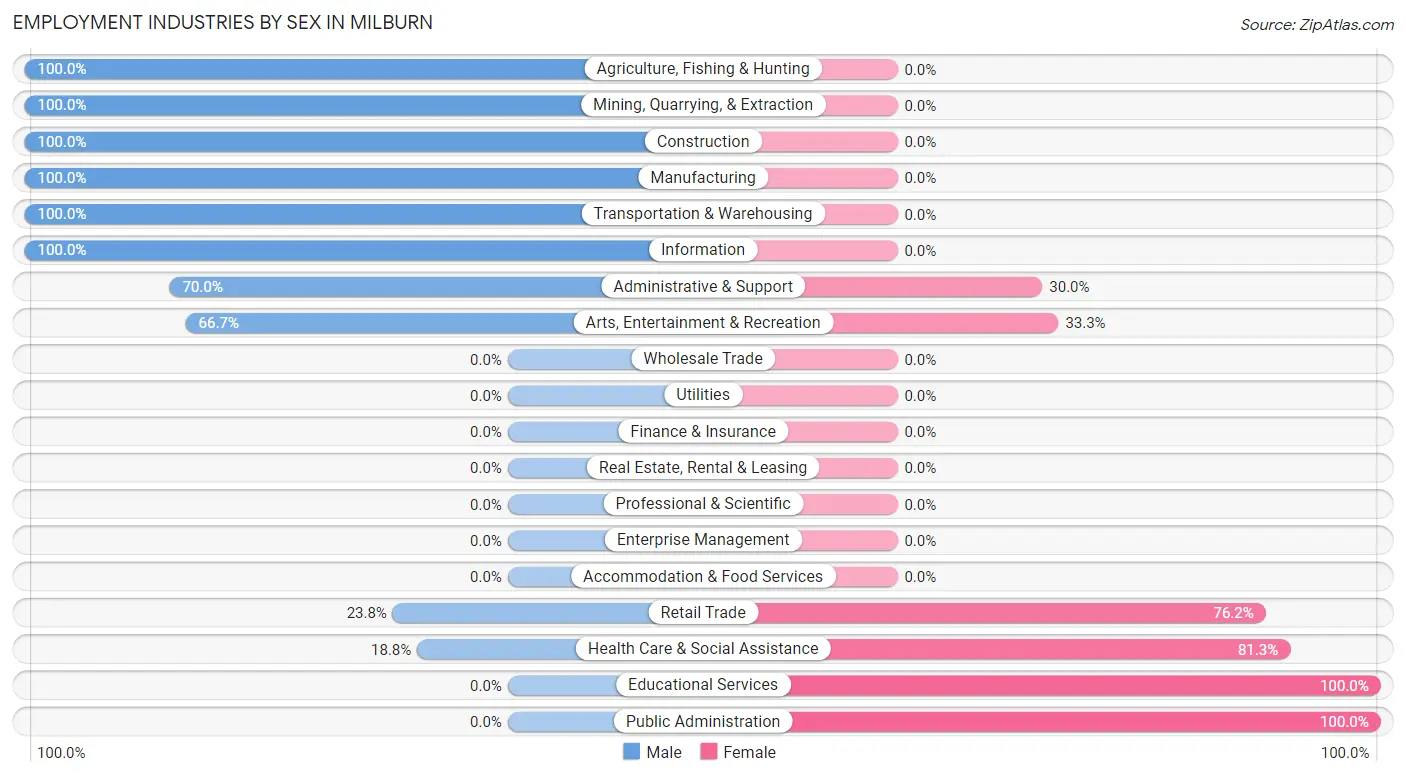
| Industry | Male | Female |
| Agriculture, Fishing & Hunting | 3 (100.0%) | 0 (0.0%) |
| Mining, Quarrying, & Extraction | 3 (100.0%) | 0 (0.0%) |
| Construction | 8 (100.0%) | 0 (0.0%) |
| Manufacturing | 20 (100.0%) | 0 (0.0%) |
| Wholesale Trade | 0 (0.0%) | 0 (0.0%) |
| Retail Trade | 5 (23.8%) | 16 (76.2%) |
| Transportation & Warehousing | 2 (100.0%) | 0 (0.0%) |
| Utilities | 0 (0.0%) | 0 (0.0%) |
| Information | 2 (100.0%) | 0 (0.0%) |
| Finance & Insurance | 0 (0.0%) | 0 (0.0%) |
| Real Estate, Rental & Leasing | 0 (0.0%) | 0 (0.0%) |
| Professional & Scientific | 0 (0.0%) | 0 (0.0%) |
| Enterprise Management | 0 (0.0%) | 0 (0.0%) |
| Administrative & Support | 7 (70.0%) | 3 (30.0%) |
| Educational Services | 0 (0.0%) | 4 (100.0%) |
| Health Care & Social Assistance | 3 (18.8%) | 13 (81.2%) |
| Arts, Entertainment & Recreation | 8 (66.7%) | 4 (33.3%) |
| Accommodation & Food Services | 0 (0.0%) | 0 (0.0%) |
| Public Administration | 0 (0.0%) | 2 (100.0%) |
| Total | 62 (59.1%) | 43 (40.9%) |
Education in Milburn
School Enrollment in Milburn
The most common levels of schooling among the 54 students in Milburn are middle school (15 | 27.8%), high school (14 | 25.9%), and elementary school (11 | 20.4%).
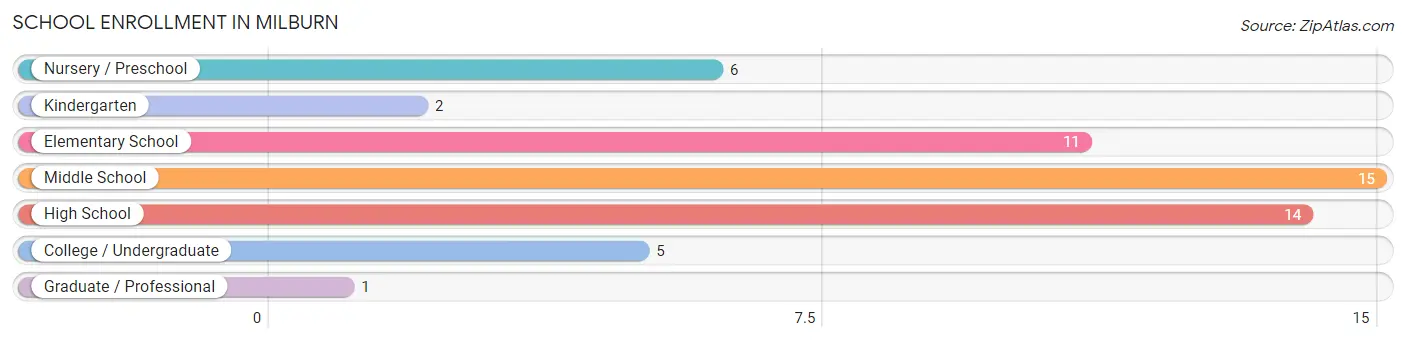
| School Level | # Students | % Students |
| Nursery / Preschool | 6 | 11.1% |
| Kindergarten | 2 | 3.7% |
| Elementary School | 11 | 20.4% |
| Middle School | 15 | 27.8% |
| High School | 14 | 25.9% |
| College / Undergraduate | 5 | 9.3% |
| Graduate / Professional | 1 | 1.8% |
| Total | 54 | 100.0% |
School Enrollment by Age by Funding Source in Milburn
Out of a total of 54 students who are enrolled in schools in Milburn, 3 (5.6%) attend a private institution, while the remaining 51 (94.4%) are enrolled in public schools. The age group of 25 to 34 year olds has the highest likelihood of being enrolled in private schools, with 1 (33.3% in the age bracket) enrolled. Conversely, the age group of 3 to 4 year olds has the lowest likelihood of being enrolled in a private school, with 6 (100.0% in the age bracket) attending a public institution.
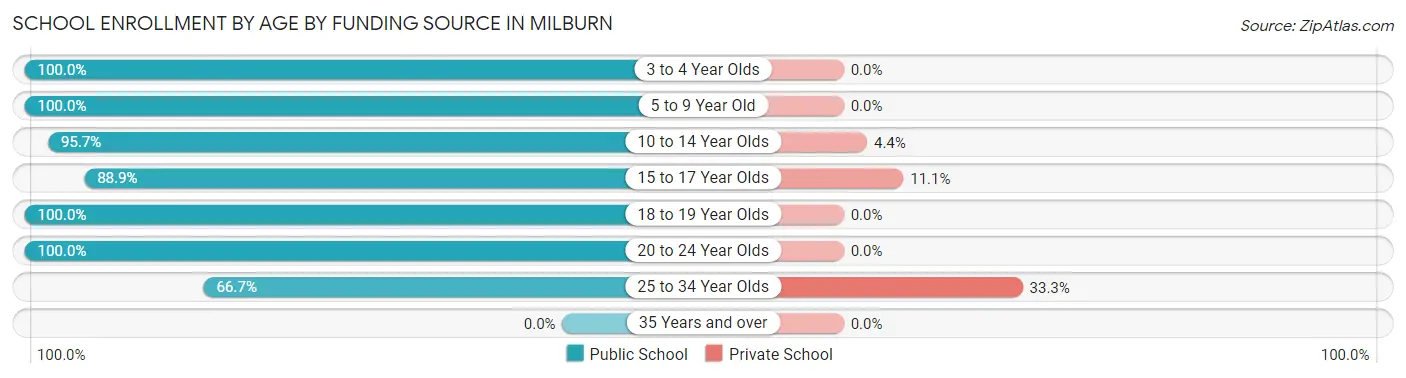
| Age Bracket | Public School | Private School |
| 3 to 4 Year Olds | 6 (100.0%) | 0 (0.0%) |
| 5 to 9 Year Old | 10 (100.0%) | 0 (0.0%) |
| 10 to 14 Year Olds | 22 (95.7%) | 1 (4.3%) |
| 15 to 17 Year Olds | 8 (88.9%) | 1 (11.1%) |
| 18 to 19 Year Olds | 2 (100.0%) | 0 (0.0%) |
| 20 to 24 Year Olds | 1 (100.0%) | 0 (0.0%) |
| 25 to 34 Year Olds | 2 (66.7%) | 1 (33.3%) |
| 35 Years and over | 0 (0.0%) | 0 (0.0%) |
| Total | 51 (94.4%) | 3 (5.6%) |
Educational Attainment by Field of Study in Milburn
Computers & mathematics (3 | 37.5%), engineering (2 | 25.0%), psychology (1 | 12.5%), social sciences (1 | 12.5%), and business (1 | 12.5%) are the most common fields of study among 8 individuals in Milburn who have obtained a bachelor's degree or higher.
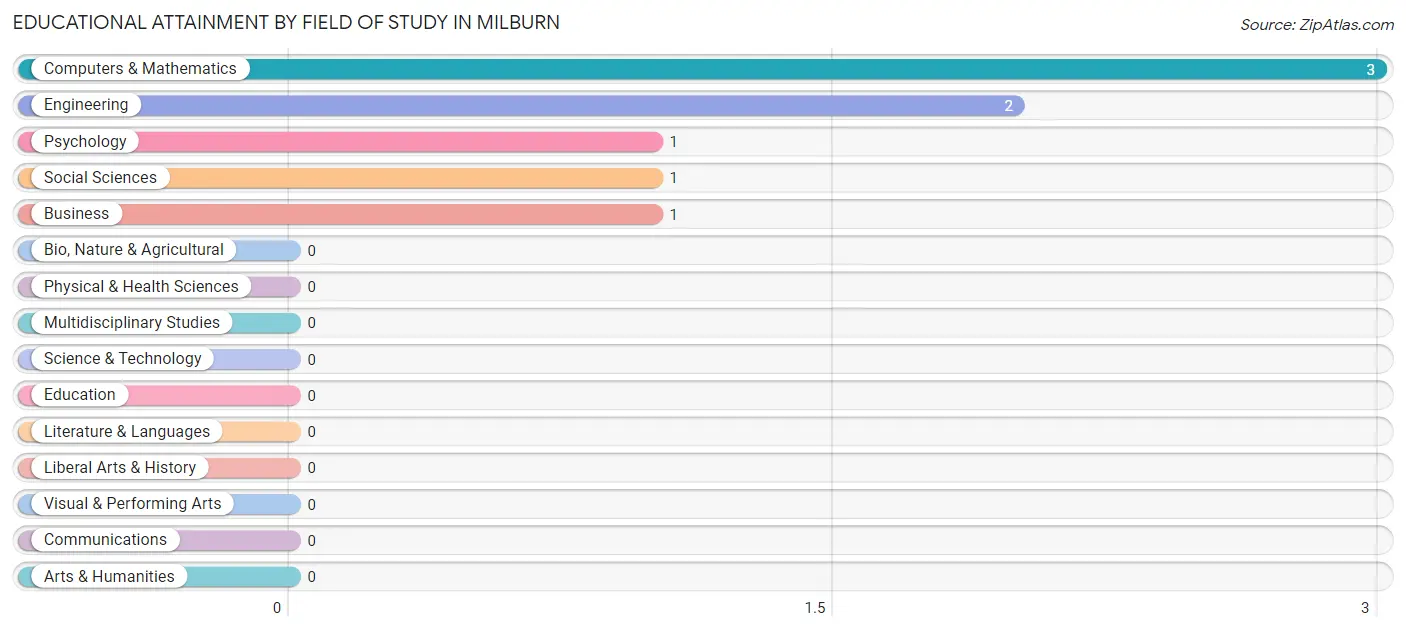
| Field of Study | # Graduates | % Graduates |
| Computers & Mathematics | 3 | 37.5% |
| Bio, Nature & Agricultural | 0 | 0.0% |
| Physical & Health Sciences | 0 | 0.0% |
| Psychology | 1 | 12.5% |
| Social Sciences | 1 | 12.5% |
| Engineering | 2 | 25.0% |
| Multidisciplinary Studies | 0 | 0.0% |
| Science & Technology | 0 | 0.0% |
| Business | 1 | 12.5% |
| Education | 0 | 0.0% |
| Literature & Languages | 0 | 0.0% |
| Liberal Arts & History | 0 | 0.0% |
| Visual & Performing Arts | 0 | 0.0% |
| Communications | 0 | 0.0% |
| Arts & Humanities | 0 | 0.0% |
| Total | 8 | 100.0% |
Transportation & Commute in Milburn
Vehicle Availability by Sex in Milburn
The most prevalent vehicle ownership categories in Milburn are males with 2 vehicles (20, accounting for 32.3%) and females with 2 vehicles (10, making up 46.5%).
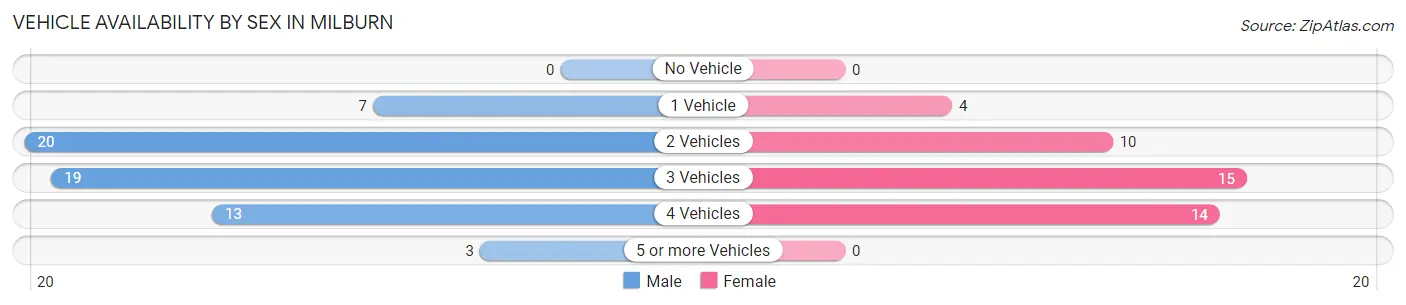
| Vehicles Available | Male | Female |
| No Vehicle | 0 (0.0%) | 0 (0.0%) |
| 1 Vehicle | 7 (11.3%) | 4 (9.3%) |
| 2 Vehicles | 20 (32.3%) | 10 (23.3%) |
| 3 Vehicles | 19 (30.6%) | 15 (34.9%) |
| 4 Vehicles | 13 (21.0%) | 14 (32.6%) |
| 5 or more Vehicles | 3 (4.8%) | 0 (0.0%) |
| Total | 62 (100.0%) | 43 (100.0%) |
Commute Time in Milburn
The most frequently occuring commute durations in Milburn are 45 to 59 minutes (22 commuters, 20.9%), 30 to 34 minutes (21 commuters, 20.0%), and 15 to 19 minutes (16 commuters, 15.2%).
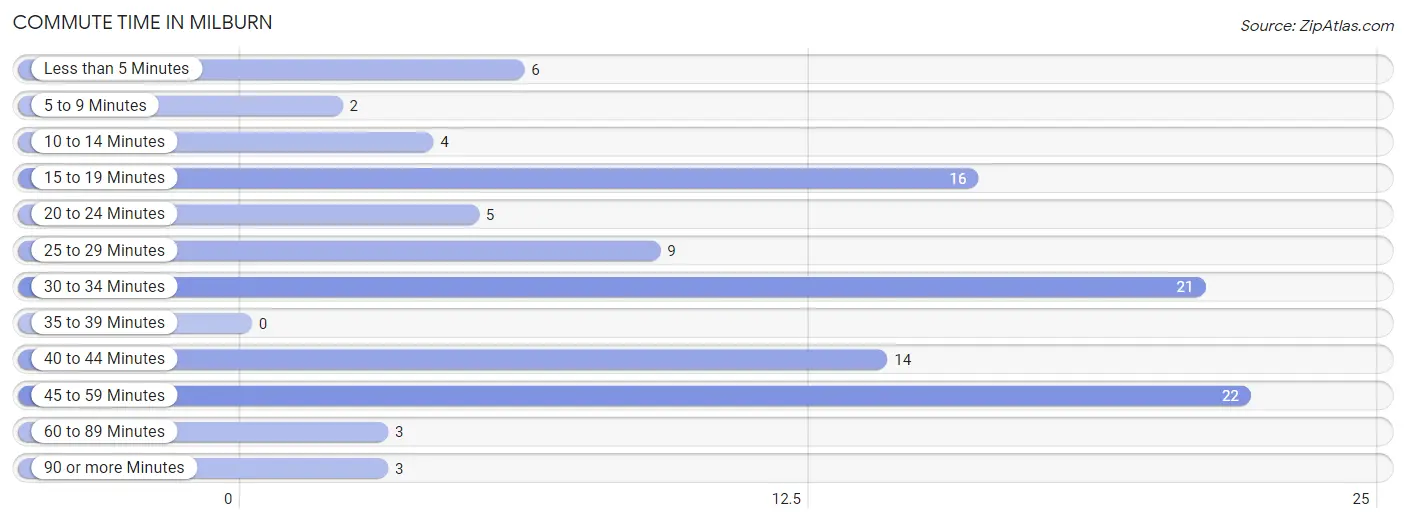
| Commute Time | # Commuters | % Commuters |
| Less than 5 Minutes | 6 | 5.7% |
| 5 to 9 Minutes | 2 | 1.9% |
| 10 to 14 Minutes | 4 | 3.8% |
| 15 to 19 Minutes | 16 | 15.2% |
| 20 to 24 Minutes | 5 | 4.8% |
| 25 to 29 Minutes | 9 | 8.6% |
| 30 to 34 Minutes | 21 | 20.0% |
| 35 to 39 Minutes | 0 | 0.0% |
| 40 to 44 Minutes | 14 | 13.3% |
| 45 to 59 Minutes | 22 | 20.9% |
| 60 to 89 Minutes | 3 | 2.9% |
| 90 or more Minutes | 3 | 2.9% |
Commute Time by Sex in Milburn
The most common commute times in Milburn are 30 to 34 minutes (18 commuters, 29.0%) for males and 45 to 59 minutes (13 commuters, 30.2%) for females.
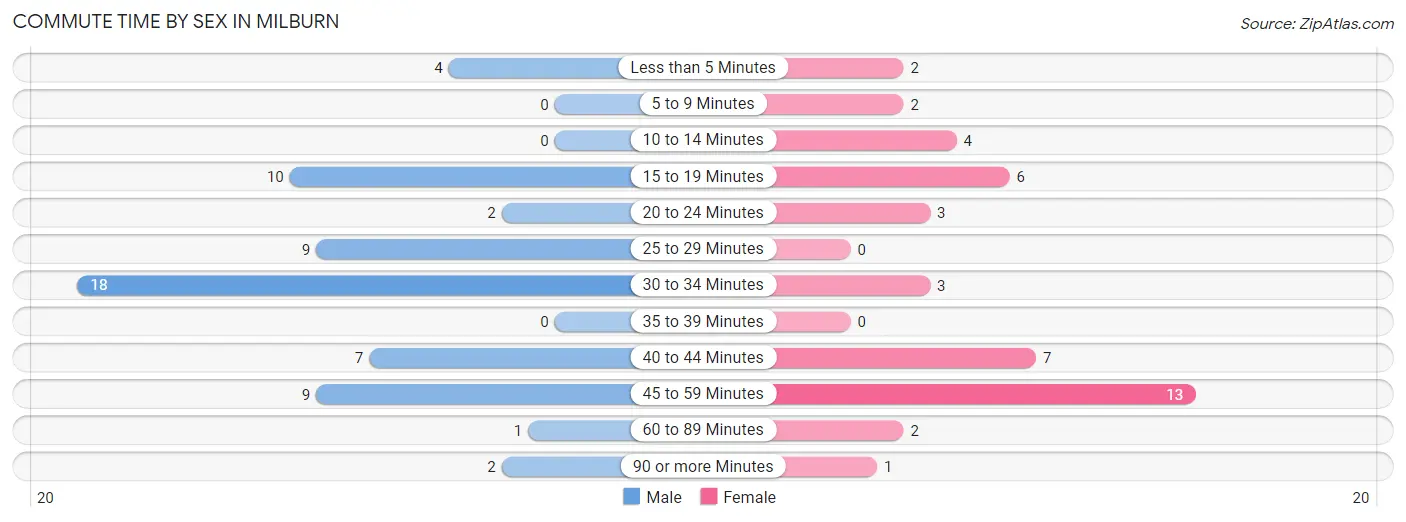
| Commute Time | Male | Female |
| Less than 5 Minutes | 4 (6.5%) | 2 (4.6%) |
| 5 to 9 Minutes | 0 (0.0%) | 2 (4.6%) |
| 10 to 14 Minutes | 0 (0.0%) | 4 (9.3%) |
| 15 to 19 Minutes | 10 (16.1%) | 6 (14.0%) |
| 20 to 24 Minutes | 2 (3.2%) | 3 (7.0%) |
| 25 to 29 Minutes | 9 (14.5%) | 0 (0.0%) |
| 30 to 34 Minutes | 18 (29.0%) | 3 (7.0%) |
| 35 to 39 Minutes | 0 (0.0%) | 0 (0.0%) |
| 40 to 44 Minutes | 7 (11.3%) | 7 (16.3%) |
| 45 to 59 Minutes | 9 (14.5%) | 13 (30.2%) |
| 60 to 89 Minutes | 1 (1.6%) | 2 (4.6%) |
| 90 or more Minutes | 2 (3.2%) | 1 (2.3%) |
Time of Departure to Work by Sex in Milburn
The most frequent times of departure to work in Milburn are 12:00 AM to 4:59 AM (9, 14.5%) for males and 7:00 AM to 7:29 AM (9, 20.9%) for females.
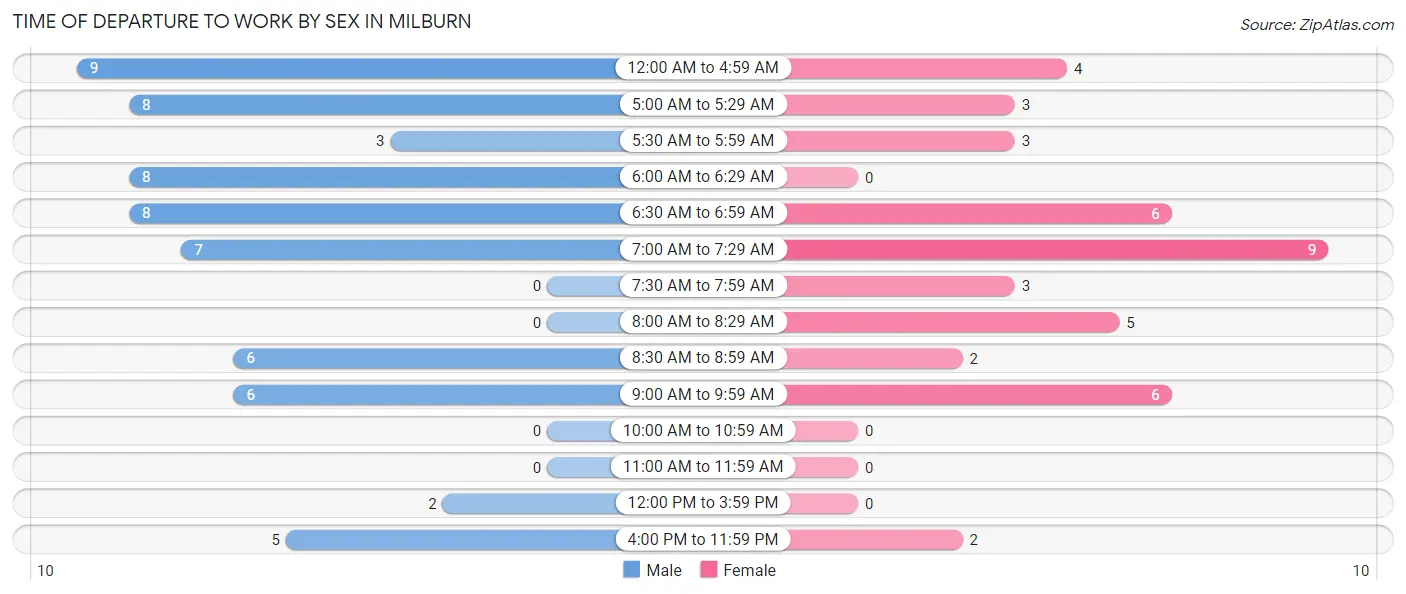
| Time of Departure | Male | Female |
| 12:00 AM to 4:59 AM | 9 (14.5%) | 4 (9.3%) |
| 5:00 AM to 5:29 AM | 8 (12.9%) | 3 (7.0%) |
| 5:30 AM to 5:59 AM | 3 (4.8%) | 3 (7.0%) |
| 6:00 AM to 6:29 AM | 8 (12.9%) | 0 (0.0%) |
| 6:30 AM to 6:59 AM | 8 (12.9%) | 6 (14.0%) |
| 7:00 AM to 7:29 AM | 7 (11.3%) | 9 (20.9%) |
| 7:30 AM to 7:59 AM | 0 (0.0%) | 3 (7.0%) |
| 8:00 AM to 8:29 AM | 0 (0.0%) | 5 (11.6%) |
| 8:30 AM to 8:59 AM | 6 (9.7%) | 2 (4.6%) |
| 9:00 AM to 9:59 AM | 6 (9.7%) | 6 (14.0%) |
| 10:00 AM to 10:59 AM | 0 (0.0%) | 0 (0.0%) |
| 11:00 AM to 11:59 AM | 0 (0.0%) | 0 (0.0%) |
| 12:00 PM to 3:59 PM | 2 (3.2%) | 0 (0.0%) |
| 4:00 PM to 11:59 PM | 5 (8.1%) | 2 (4.6%) |
| Total | 62 (100.0%) | 43 (100.0%) |
Housing Occupancy in Milburn
Occupancy by Ownership in Milburn
Of the total 86 dwellings in Milburn, owner-occupied units account for 49 (57.0%), while renter-occupied units make up 37 (43.0%).
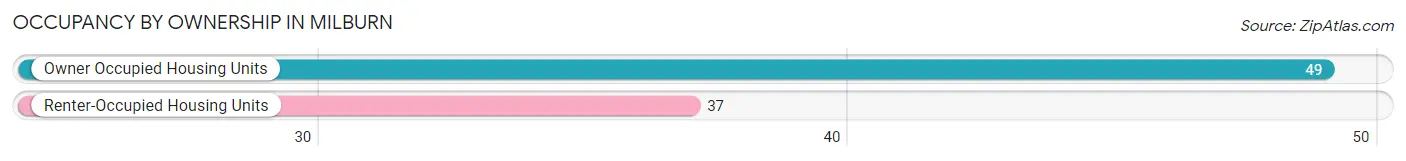
| Occupancy | # Housing Units | % Housing Units |
| Owner Occupied Housing Units | 49 | 57.0% |
| Renter-Occupied Housing Units | 37 | 43.0% |
| Total Occupied Housing Units | 86 | 100.0% |
Occupancy by Household Size in Milburn
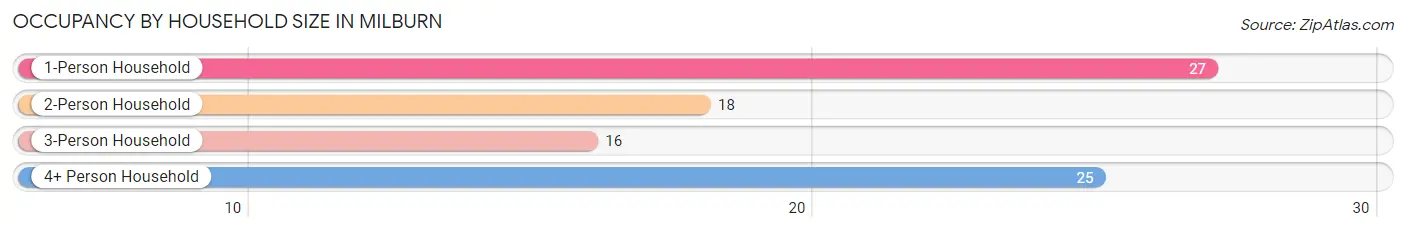
| Household Size | # Housing Units | % Housing Units |
| 1-Person Household | 27 | 31.4% |
| 2-Person Household | 18 | 20.9% |
| 3-Person Household | 16 | 18.6% |
| 4+ Person Household | 25 | 29.1% |
| Total Housing Units | 86 | 100.0% |
Occupancy by Ownership by Household Size in Milburn
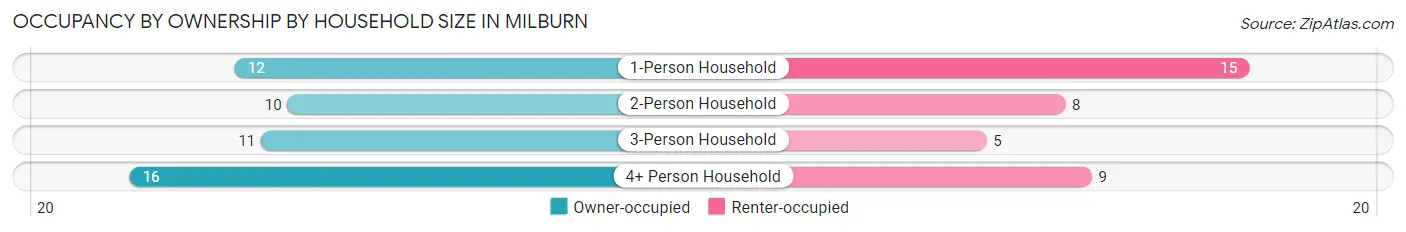
| Household Size | Owner-occupied | Renter-occupied |
| 1-Person Household | 12 (44.4%) | 15 (55.6%) |
| 2-Person Household | 10 (55.6%) | 8 (44.4%) |
| 3-Person Household | 11 (68.8%) | 5 (31.2%) |
| 4+ Person Household | 16 (64.0%) | 9 (36.0%) |
| Total Housing Units | 49 (57.0%) | 37 (43.0%) |
Occupancy by Educational Attainment in Milburn
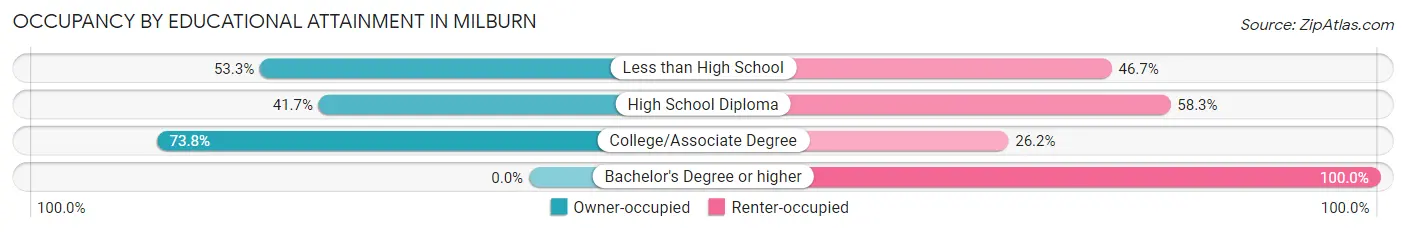
| Household Size | Owner-occupied | Renter-occupied |
| Less than High School | 8 (53.3%) | 7 (46.7%) |
| High School Diploma | 10 (41.7%) | 14 (58.3%) |
| College/Associate Degree | 31 (73.8%) | 11 (26.2%) |
| Bachelor's Degree or higher | 0 (0.0%) | 5 (100.0%) |
Occupancy by Age of Householder in Milburn
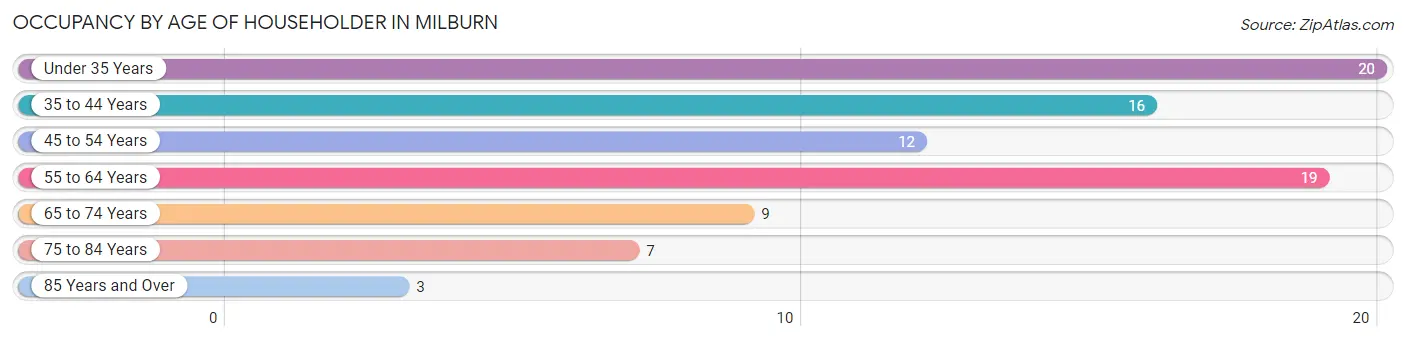
| Age Bracket | # Households | % Households |
| Under 35 Years | 20 | 23.3% |
| 35 to 44 Years | 16 | 18.6% |
| 45 to 54 Years | 12 | 14.0% |
| 55 to 64 Years | 19 | 22.1% |
| 65 to 74 Years | 9 | 10.5% |
| 75 to 84 Years | 7 | 8.1% |
| 85 Years and Over | 3 | 3.5% |
| Total | 86 | 100.0% |
Housing Finances in Milburn
Median Income by Occupancy in Milburn
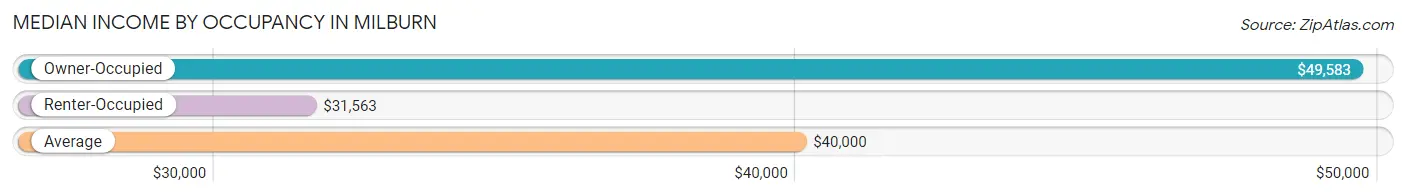
| Occupancy Type | # Households | Median Income |
| Owner-Occupied | 49 (57.0%) | $49,583 |
| Renter-Occupied | 37 (43.0%) | $31,563 |
| Average | 86 (100.0%) | $40,000 |
Occupancy by Householder Income Bracket in Milburn
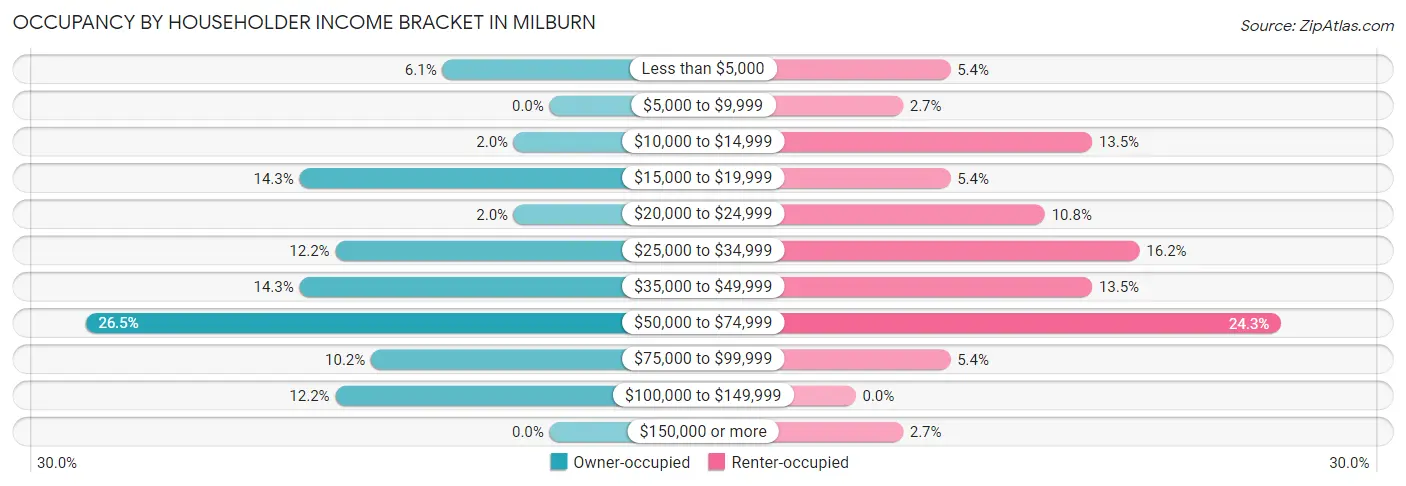
| Income Bracket | Owner-occupied | Renter-occupied |
| Less than $5,000 | 3 (6.1%) | 2 (5.4%) |
| $5,000 to $9,999 | 0 (0.0%) | 1 (2.7%) |
| $10,000 to $14,999 | 1 (2.0%) | 5 (13.5%) |
| $15,000 to $19,999 | 7 (14.3%) | 2 (5.4%) |
| $20,000 to $24,999 | 1 (2.0%) | 4 (10.8%) |
| $25,000 to $34,999 | 6 (12.2%) | 6 (16.2%) |
| $35,000 to $49,999 | 7 (14.3%) | 5 (13.5%) |
| $50,000 to $74,999 | 13 (26.5%) | 9 (24.3%) |
| $75,000 to $99,999 | 5 (10.2%) | 2 (5.4%) |
| $100,000 to $149,999 | 6 (12.2%) | 0 (0.0%) |
| $150,000 or more | 0 (0.0%) | 1 (2.7%) |
| Total | 49 (100.0%) | 37 (100.0%) |
Monthly Housing Cost Tiers in Milburn
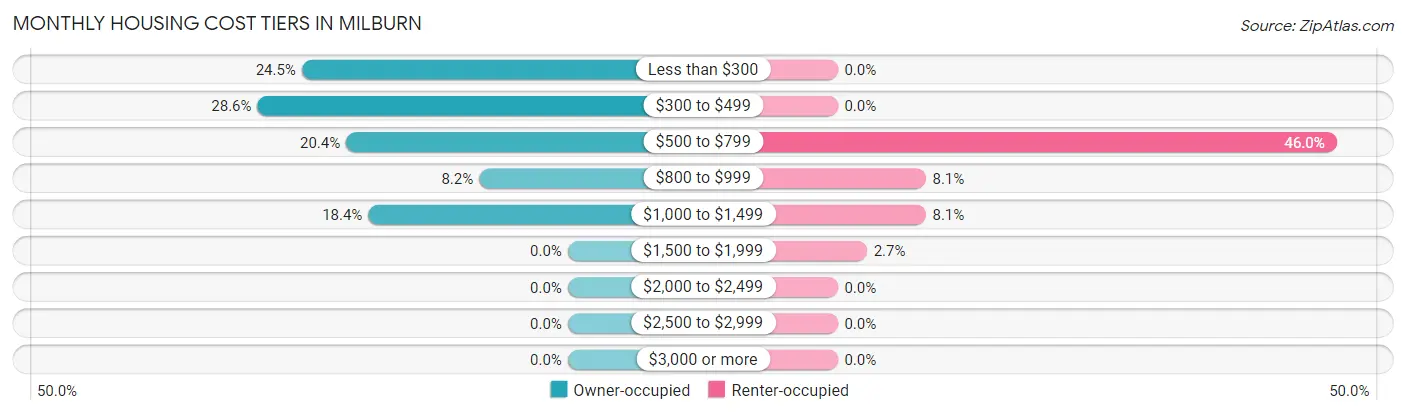
| Monthly Cost | Owner-occupied | Renter-occupied |
| Less than $300 | 12 (24.5%) | 0 (0.0%) |
| $300 to $499 | 14 (28.6%) | 0 (0.0%) |
| $500 to $799 | 10 (20.4%) | 17 (46.0%) |
| $800 to $999 | 4 (8.2%) | 3 (8.1%) |
| $1,000 to $1,499 | 9 (18.4%) | 3 (8.1%) |
| $1,500 to $1,999 | 0 (0.0%) | 1 (2.7%) |
| $2,000 to $2,499 | 0 (0.0%) | 0 (0.0%) |
| $2,500 to $2,999 | 0 (0.0%) | 0 (0.0%) |
| $3,000 or more | 0 (0.0%) | 0 (0.0%) |
| Total | 49 (100.0%) | 37 (100.0%) |
Physical Housing Characteristics in Milburn
Housing Structures in Milburn
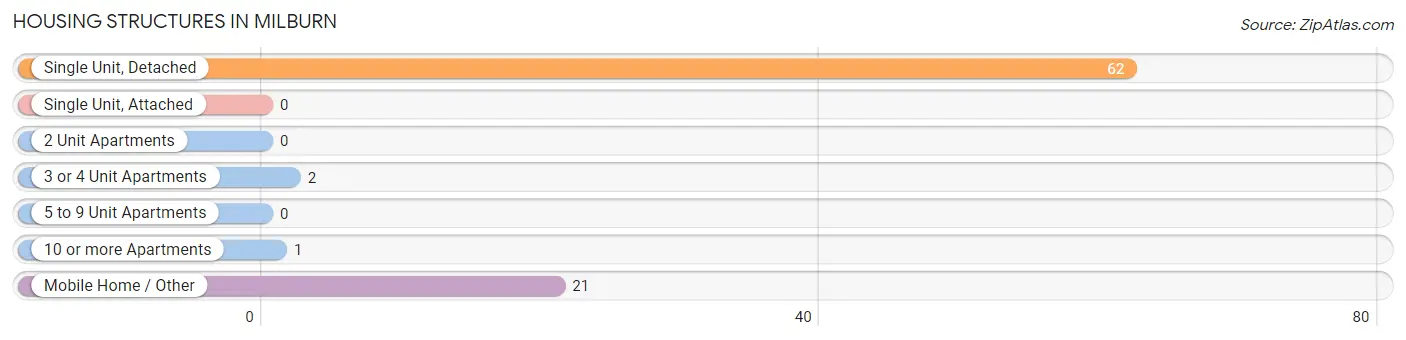
| Structure Type | # Housing Units | % Housing Units |
| Single Unit, Detached | 62 | 72.1% |
| Single Unit, Attached | 0 | 0.0% |
| 2 Unit Apartments | 0 | 0.0% |
| 3 or 4 Unit Apartments | 2 | 2.3% |
| 5 to 9 Unit Apartments | 0 | 0.0% |
| 10 or more Apartments | 1 | 1.2% |
| Mobile Home / Other | 21 | 24.4% |
| Total | 86 | 100.0% |
Housing Structures by Occupancy in Milburn
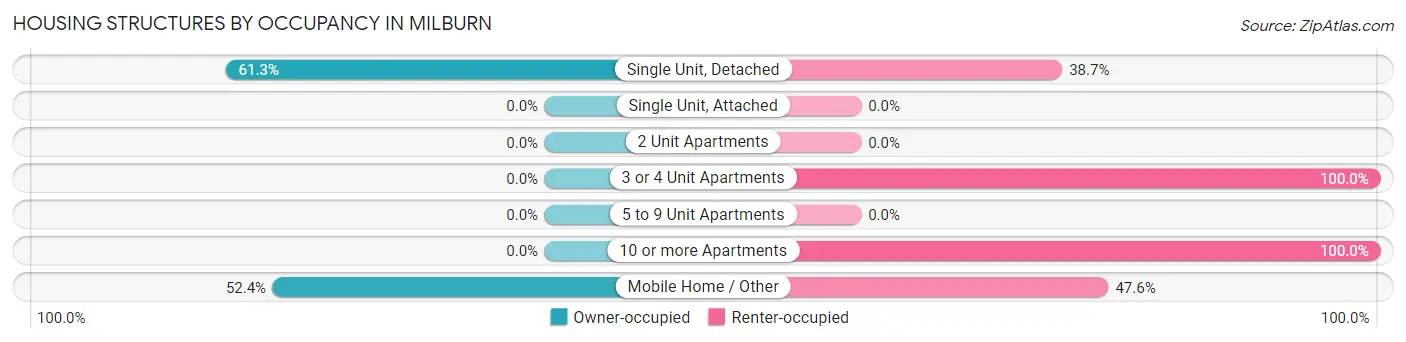
| Structure Type | Owner-occupied | Renter-occupied |
| Single Unit, Detached | 38 (61.3%) | 24 (38.7%) |
| Single Unit, Attached | 0 (0.0%) | 0 (0.0%) |
| 2 Unit Apartments | 0 (0.0%) | 0 (0.0%) |
| 3 or 4 Unit Apartments | 0 (0.0%) | 2 (100.0%) |
| 5 to 9 Unit Apartments | 0 (0.0%) | 0 (0.0%) |
| 10 or more Apartments | 0 (0.0%) | 1 (100.0%) |
| Mobile Home / Other | 11 (52.4%) | 10 (47.6%) |
| Total | 49 (57.0%) | 37 (43.0%) |
Housing Structures by Number of Rooms in Milburn
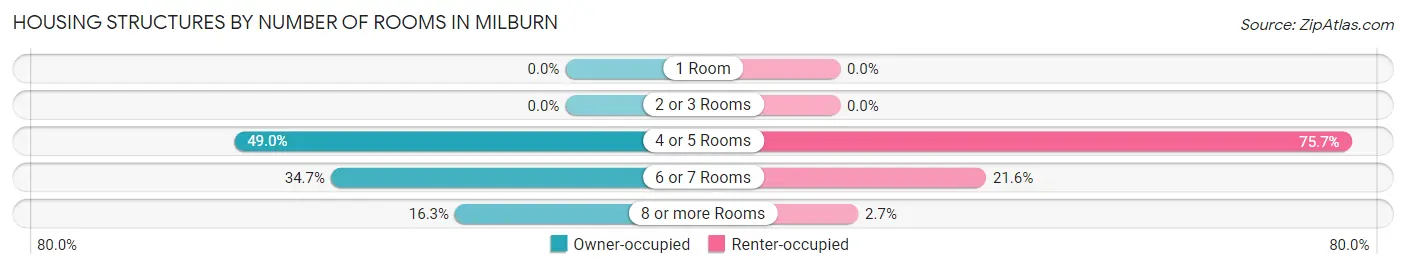
| Number of Rooms | Owner-occupied | Renter-occupied |
| 1 Room | 0 (0.0%) | 0 (0.0%) |
| 2 or 3 Rooms | 0 (0.0%) | 0 (0.0%) |
| 4 or 5 Rooms | 24 (49.0%) | 28 (75.7%) |
| 6 or 7 Rooms | 17 (34.7%) | 8 (21.6%) |
| 8 or more Rooms | 8 (16.3%) | 1 (2.7%) |
| Total | 49 (100.0%) | 37 (100.0%) |
Housing Structure by Heating Type in Milburn
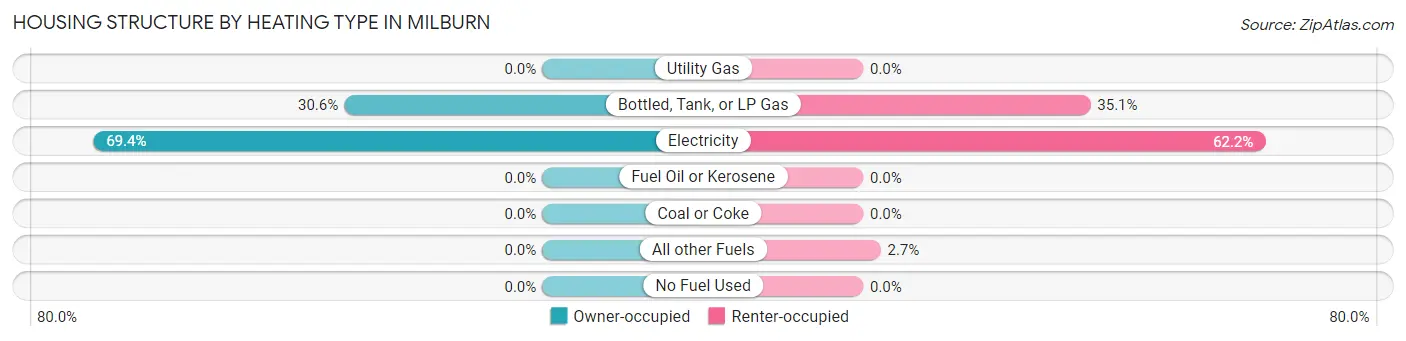
| Heating Type | Owner-occupied | Renter-occupied |
| Utility Gas | 0 (0.0%) | 0 (0.0%) |
| Bottled, Tank, or LP Gas | 15 (30.6%) | 13 (35.1%) |
| Electricity | 34 (69.4%) | 23 (62.2%) |
| Fuel Oil or Kerosene | 0 (0.0%) | 0 (0.0%) |
| Coal or Coke | 0 (0.0%) | 0 (0.0%) |
| All other Fuels | 0 (0.0%) | 1 (2.7%) |
| No Fuel Used | 0 (0.0%) | 0 (0.0%) |
| Total | 49 (100.0%) | 37 (100.0%) |
Household Vehicle Usage in Milburn
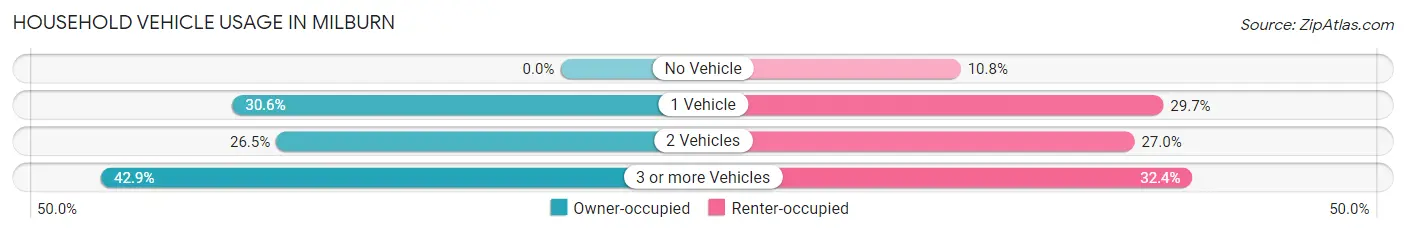
| Vehicles per Household | Owner-occupied | Renter-occupied |
| No Vehicle | 0 (0.0%) | 4 (10.8%) |
| 1 Vehicle | 15 (30.6%) | 11 (29.7%) |
| 2 Vehicles | 13 (26.5%) | 10 (27.0%) |
| 3 or more Vehicles | 21 (42.9%) | 12 (32.4%) |
| Total | 49 (100.0%) | 37 (100.0%) |
Real Estate & Mortgages in Milburn
Real Estate and Mortgage Overview in Milburn
| Characteristic | Without Mortgage | With Mortgage |
| Housing Units | 27 | 22 |
| Median Property Value | $53,600 | $82,000 |
| Median Household Income | $47,917 | $0 |
| Monthly Housing Costs | $315 | $0 |
| Real Estate Taxes | $342 | $2 |
Property Value by Mortgage Status in Milburn
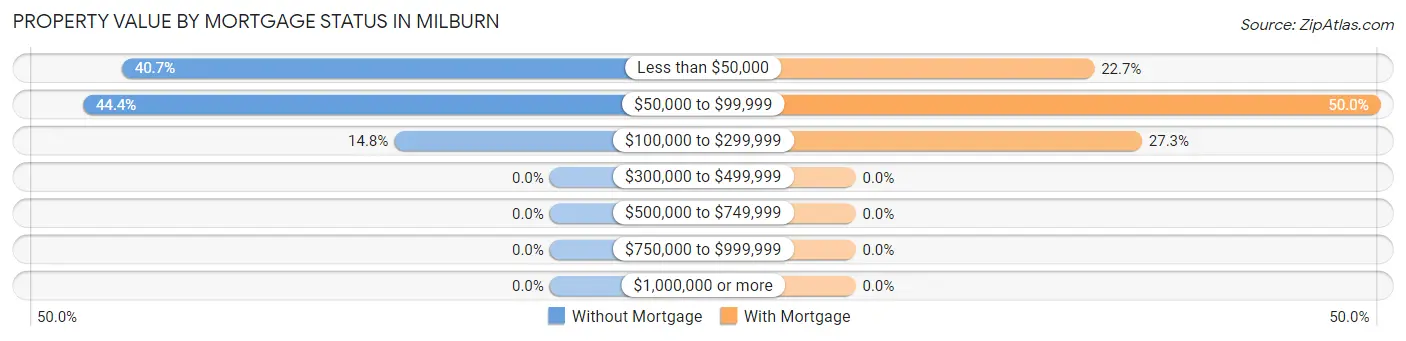
| Property Value | Without Mortgage | With Mortgage |
| Less than $50,000 | 11 (40.7%) | 5 (22.7%) |
| $50,000 to $99,999 | 12 (44.4%) | 11 (50.0%) |
| $100,000 to $299,999 | 4 (14.8%) | 6 (27.3%) |
| $300,000 to $499,999 | 0 (0.0%) | 0 (0.0%) |
| $500,000 to $749,999 | 0 (0.0%) | 0 (0.0%) |
| $750,000 to $999,999 | 0 (0.0%) | 0 (0.0%) |
| $1,000,000 or more | 0 (0.0%) | 0 (0.0%) |
| Total | 27 (100.0%) | 22 (100.0%) |
Household Income by Mortgage Status in Milburn
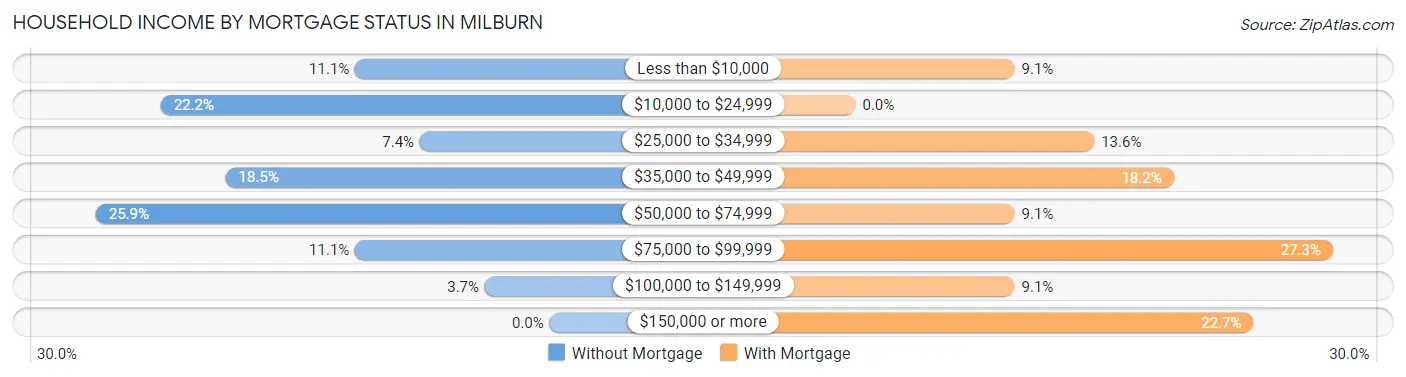
| Household Income | Without Mortgage | With Mortgage |
| Less than $10,000 | 3 (11.1%) | 2 (9.1%) |
| $10,000 to $24,999 | 6 (22.2%) | 0 (0.0%) |
| $25,000 to $34,999 | 2 (7.4%) | 3 (13.6%) |
| $35,000 to $49,999 | 5 (18.5%) | 4 (18.2%) |
| $50,000 to $74,999 | 7 (25.9%) | 2 (9.1%) |
| $75,000 to $99,999 | 3 (11.1%) | 6 (27.3%) |
| $100,000 to $149,999 | 1 (3.7%) | 2 (9.1%) |
| $150,000 or more | 0 (0.0%) | 5 (22.7%) |
| Total | 27 (100.0%) | 22 (100.0%) |
Property Value to Household Income Ratio in Milburn
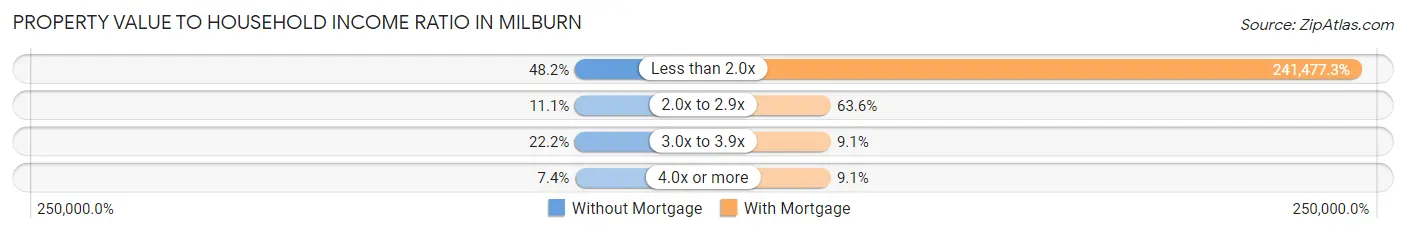
| Value-to-Income Ratio | Without Mortgage | With Mortgage |
| Less than 2.0x | 13 (48.1%) | 53,125 (241,477.3%) |
| 2.0x to 2.9x | 3 (11.1%) | 14 (63.6%) |
| 3.0x to 3.9x | 6 (22.2%) | 2 (9.1%) |
| 4.0x or more | 2 (7.4%) | 2 (9.1%) |
| Total | 27 (100.0%) | 22 (100.0%) |
Real Estate Taxes by Mortgage Status in Milburn
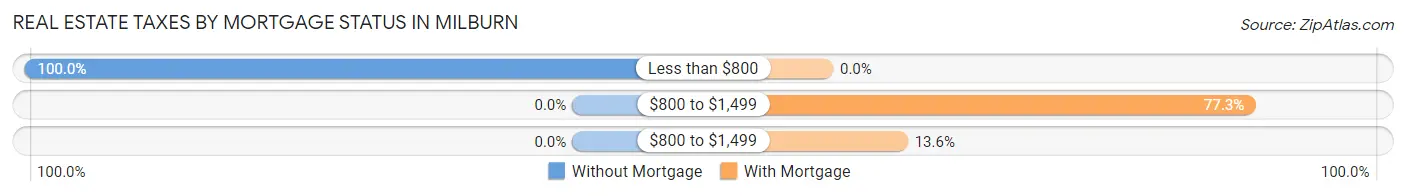
| Property Taxes | Without Mortgage | With Mortgage |
| Less than $800 | 27 (100.0%) | 0 (0.0%) |
| $800 to $1,499 | 0 (0.0%) | 17 (77.3%) |
| $800 to $1,499 | 0 (0.0%) | 3 (13.6%) |
| Total | 27 (100.0%) | 22 (100.0%) |
Health & Disability in Milburn
Health Insurance Coverage by Age in Milburn
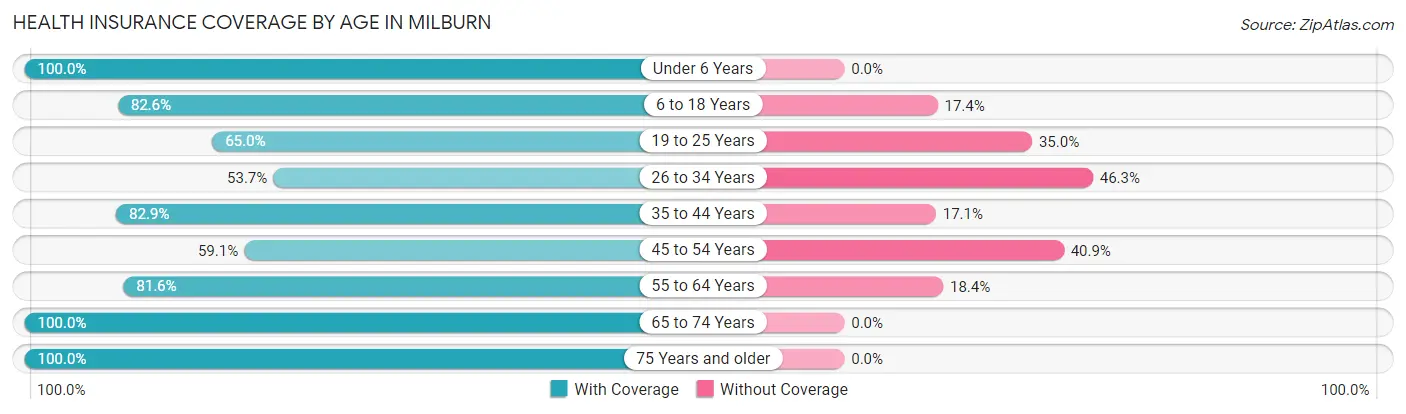
| Age Bracket | With Coverage | Without Coverage |
| Under 6 Years | 20 (100.0%) | 0 (0.0%) |
| 6 to 18 Years | 38 (82.6%) | 8 (17.4%) |
| 19 to 25 Years | 26 (65.0%) | 14 (35.0%) |
| 26 to 34 Years | 22 (53.7%) | 19 (46.3%) |
| 35 to 44 Years | 34 (82.9%) | 7 (17.1%) |
| 45 to 54 Years | 13 (59.1%) | 9 (40.9%) |
| 55 to 64 Years | 31 (81.6%) | 7 (18.4%) |
| 65 to 74 Years | 10 (100.0%) | 0 (0.0%) |
| 75 Years and older | 10 (100.0%) | 0 (0.0%) |
| Total | 204 (76.1%) | 64 (23.9%) |
Health Insurance Coverage by Citizenship Status in Milburn
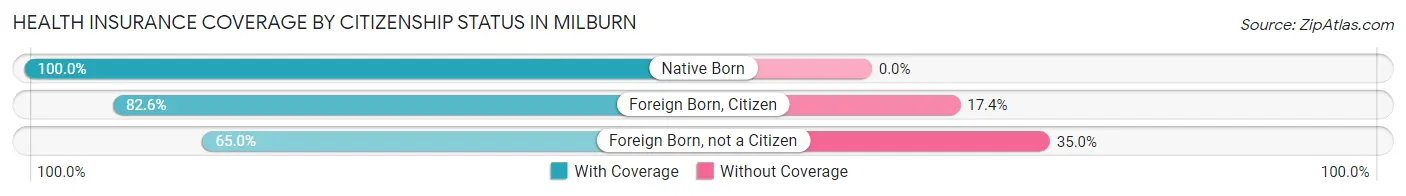
| Citizenship Status | With Coverage | Without Coverage |
| Native Born | 20 (100.0%) | 0 (0.0%) |
| Foreign Born, Citizen | 38 (82.6%) | 8 (17.4%) |
| Foreign Born, not a Citizen | 26 (65.0%) | 14 (35.0%) |
Health Insurance Coverage by Household Income in Milburn
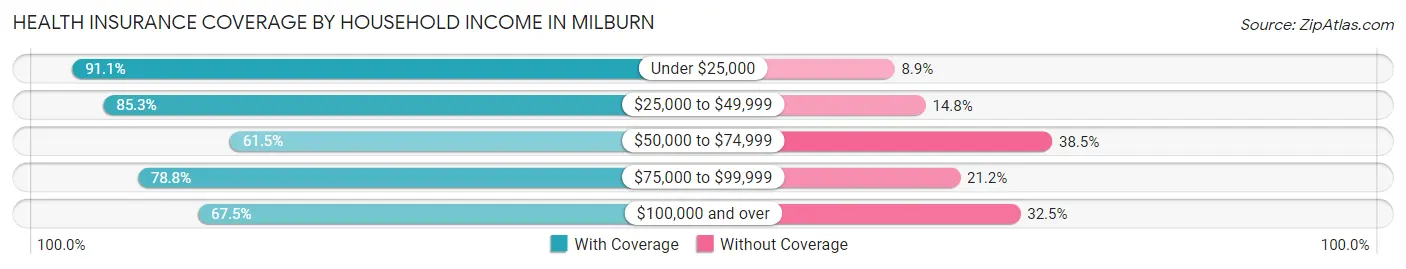
| Household Income | With Coverage | Without Coverage |
| Under $25,000 | 51 (91.1%) | 5 (8.9%) |
| $25,000 to $49,999 | 52 (85.3%) | 9 (14.7%) |
| $50,000 to $74,999 | 48 (61.5%) | 30 (38.5%) |
| $75,000 to $99,999 | 26 (78.8%) | 7 (21.2%) |
| $100,000 and over | 27 (67.5%) | 13 (32.5%) |
Public vs Private Health Insurance Coverage by Age in Milburn
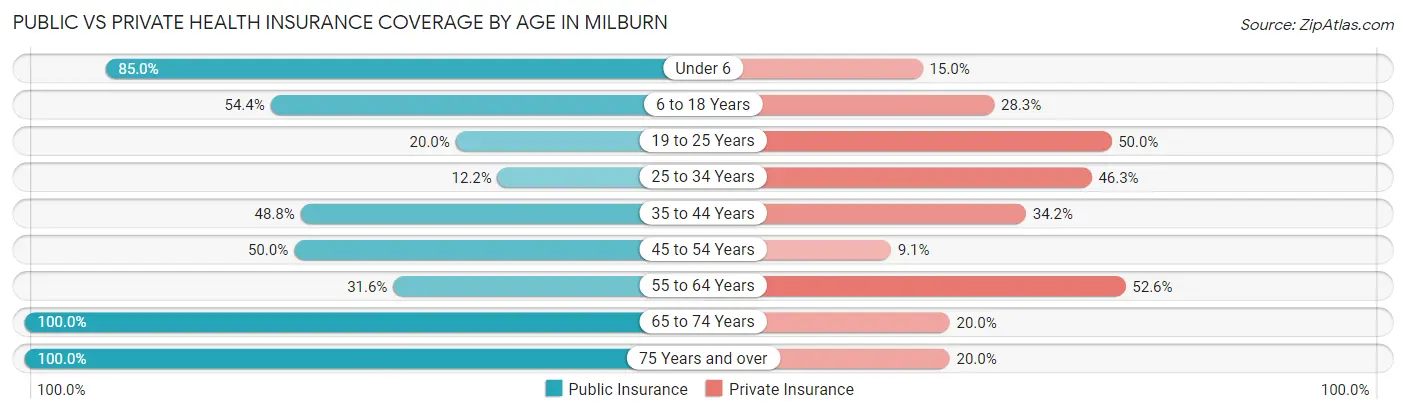
| Age Bracket | Public Insurance | Private Insurance |
| Under 6 | 17 (85.0%) | 3 (15.0%) |
| 6 to 18 Years | 25 (54.3%) | 13 (28.3%) |
| 19 to 25 Years | 8 (20.0%) | 20 (50.0%) |
| 25 to 34 Years | 5 (12.2%) | 19 (46.3%) |
| 35 to 44 Years | 20 (48.8%) | 14 (34.2%) |
| 45 to 54 Years | 11 (50.0%) | 2 (9.1%) |
| 55 to 64 Years | 12 (31.6%) | 20 (52.6%) |
| 65 to 74 Years | 10 (100.0%) | 2 (20.0%) |
| 75 Years and over | 10 (100.0%) | 2 (20.0%) |
| Total | 118 (44.0%) | 95 (35.4%) |
Disability Status by Sex by Age in Milburn
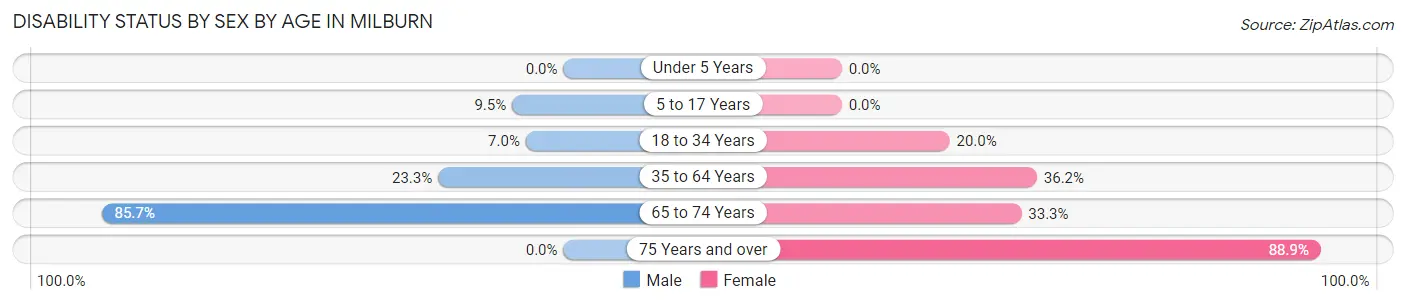
| Age Bracket | Male | Female |
| Under 5 Years | 0 (0.0%) | 0 (0.0%) |
| 5 to 17 Years | 2 (9.5%) | 0 (0.0%) |
| 18 to 34 Years | 3 (7.0%) | 8 (20.0%) |
| 35 to 64 Years | 10 (23.3%) | 21 (36.2%) |
| 65 to 74 Years | 6 (85.7%) | 1 (33.3%) |
| 75 Years and over | 0 (0.0%) | 8 (88.9%) |
Disability Class by Sex by Age in Milburn
Disability Class: Hearing Difficulty
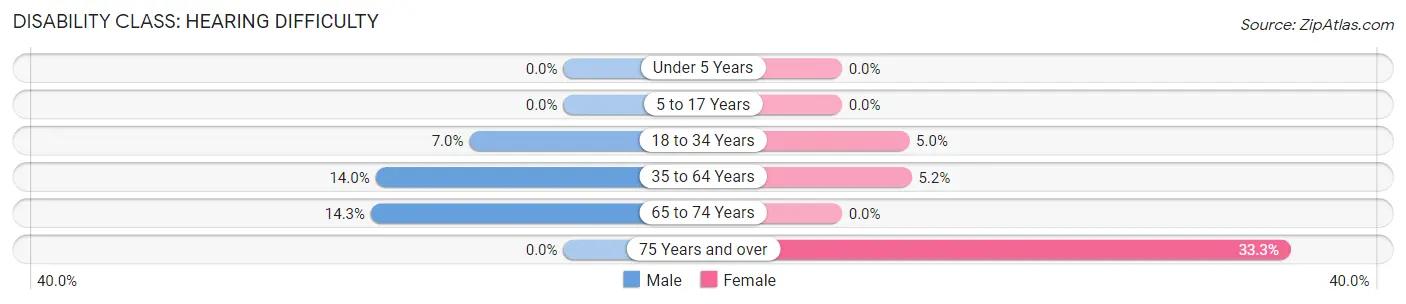
| Age Bracket | Male | Female |
| Under 5 Years | 0 (0.0%) | 0 (0.0%) |
| 5 to 17 Years | 0 (0.0%) | 0 (0.0%) |
| 18 to 34 Years | 3 (7.0%) | 2 (5.0%) |
| 35 to 64 Years | 6 (14.0%) | 3 (5.2%) |
| 65 to 74 Years | 1 (14.3%) | 0 (0.0%) |
| 75 Years and over | 0 (0.0%) | 3 (33.3%) |
Disability Class: Vision Difficulty
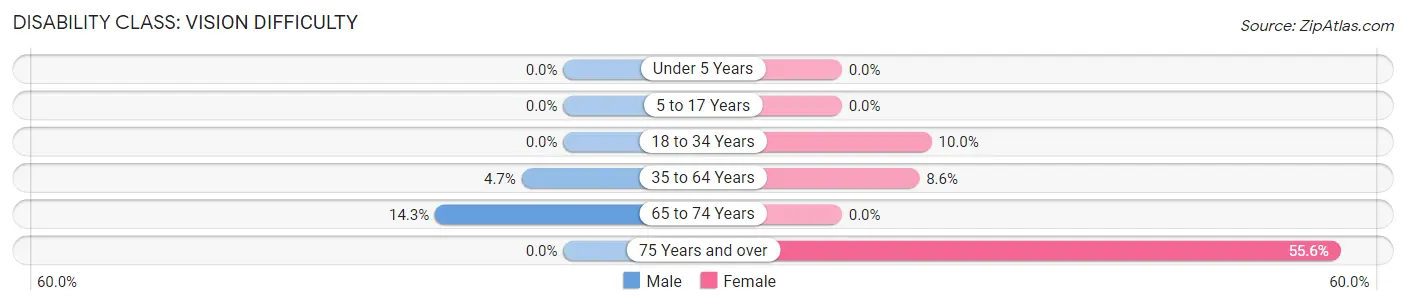
| Age Bracket | Male | Female |
| Under 5 Years | 0 (0.0%) | 0 (0.0%) |
| 5 to 17 Years | 0 (0.0%) | 0 (0.0%) |
| 18 to 34 Years | 0 (0.0%) | 4 (10.0%) |
| 35 to 64 Years | 2 (4.6%) | 5 (8.6%) |
| 65 to 74 Years | 1 (14.3%) | 0 (0.0%) |
| 75 Years and over | 0 (0.0%) | 5 (55.6%) |
Disability Class: Cognitive Difficulty
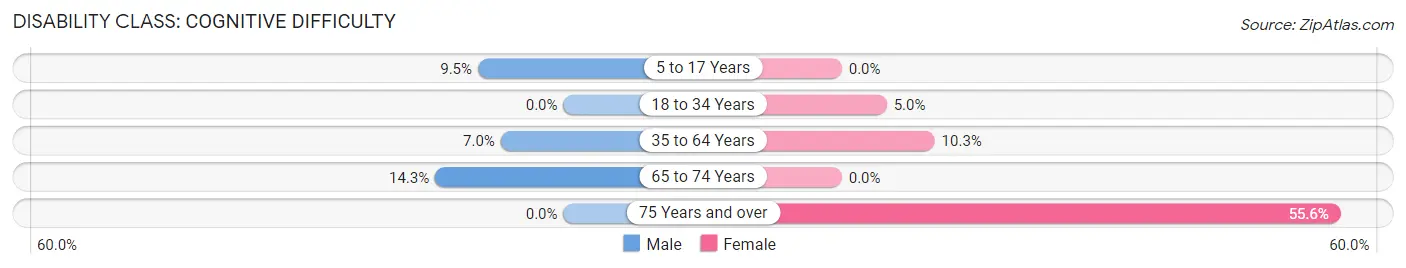
| Age Bracket | Male | Female |
| 5 to 17 Years | 2 (9.5%) | 0 (0.0%) |
| 18 to 34 Years | 0 (0.0%) | 2 (5.0%) |
| 35 to 64 Years | 3 (7.0%) | 6 (10.3%) |
| 65 to 74 Years | 1 (14.3%) | 0 (0.0%) |
| 75 Years and over | 0 (0.0%) | 5 (55.6%) |
Disability Class: Ambulatory Difficulty
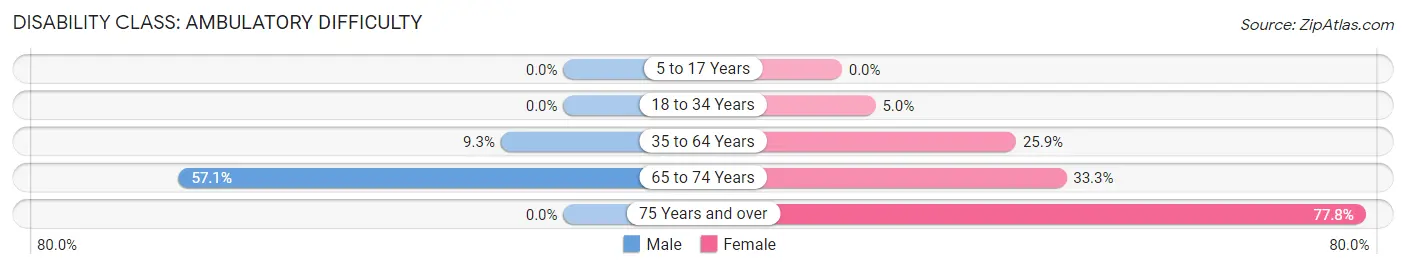
| Age Bracket | Male | Female |
| 5 to 17 Years | 0 (0.0%) | 0 (0.0%) |
| 18 to 34 Years | 0 (0.0%) | 2 (5.0%) |
| 35 to 64 Years | 4 (9.3%) | 15 (25.9%) |
| 65 to 74 Years | 4 (57.1%) | 1 (33.3%) |
| 75 Years and over | 0 (0.0%) | 7 (77.8%) |
Disability Class: Self-Care Difficulty
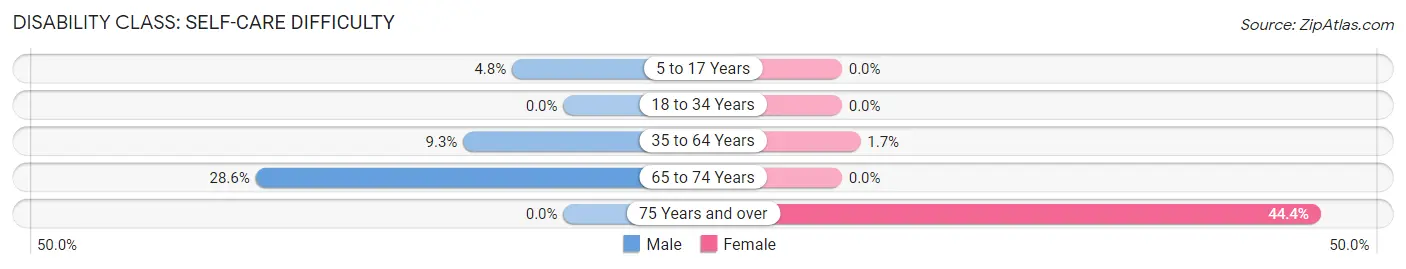
| Age Bracket | Male | Female |
| 5 to 17 Years | 1 (4.8%) | 0 (0.0%) |
| 18 to 34 Years | 0 (0.0%) | 0 (0.0%) |
| 35 to 64 Years | 4 (9.3%) | 1 (1.7%) |
| 65 to 74 Years | 2 (28.6%) | 0 (0.0%) |
| 75 Years and over | 0 (0.0%) | 4 (44.4%) |
Technology Access in Milburn
Computing Device Access in Milburn
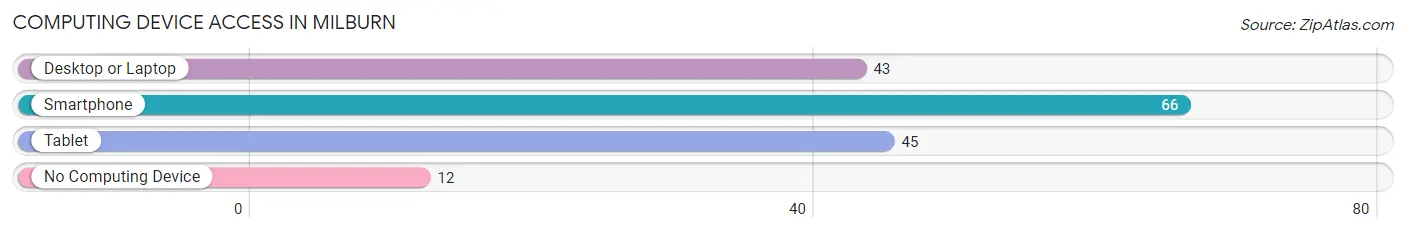
| Device Type | # Households | % Households |
| Desktop or Laptop | 43 | 50.0% |
| Smartphone | 66 | 76.7% |
| Tablet | 45 | 52.3% |
| No Computing Device | 12 | 14.0% |
| Total | 86 | 100.0% |
Internet Access in Milburn
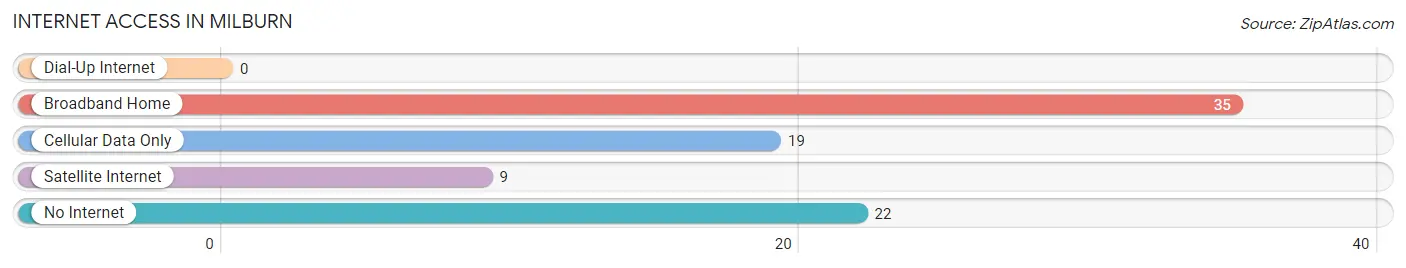
| Internet Type | # Households | % Households |
| Dial-Up Internet | 0 | 0.0% |
| Broadband Home | 35 | 40.7% |
| Cellular Data Only | 19 | 22.1% |
| Satellite Internet | 9 | 10.5% |
| No Internet | 22 | 25.6% |
| Total | 86 | 100.0% |
Milburn Summary
History
The town of Milburn, Oklahoma is located in Johnston County, in the south-central part of the state. It is situated on the banks of the Red River, near the Texas border. The town was founded in 1891 by a group of settlers from Texas, led by William Milburn. The settlers were looking for a place to settle and start a new life, and they found it in the fertile land of the Red River Valley.
The town was originally called Milburnville, but the name was changed to Milburn in 1895. The town grew quickly, and by 1900 it had a population of over 500 people. The town was incorporated in 1901, and the first mayor was William Milburn.
The town was a thriving agricultural center, with cotton, corn, and wheat being the main crops. The town also had a number of businesses, including a bank, a hotel, a general store, and a blacksmith shop.
In the early 1900s, the town was a popular stop on the Texas and Pacific Railway. The railroad brought in new people and businesses, and the town continued to grow. By 1910, the population had grown to over 1,000 people.
In the 1920s, the town was hit hard by the Great Depression. Many of the businesses closed, and the population declined. However, the town was able to survive, and by 1940 the population had grown to over 1,200 people.
The town continued to grow throughout the 1940s and 1950s, and by 1960 the population had grown to over 1,500 people. The town was also home to a number of businesses, including a cotton gin, a feed mill, and a lumber yard.
In the 1970s, the town began to decline. Many of the businesses closed, and the population began to decline. By 1980, the population had dropped to just over 1,000 people.
The town has seen a resurgence in recent years, and the population has grown to over 1,400 people. The town is still a thriving agricultural center, and it is home to a number of businesses, including a grocery store, a hardware store, and a restaurant.
Geography
Milburn is located in the south-central part of Oklahoma, in Johnston County. It is situated on the banks of the Red River, near the Texas border. The town is located about 30 miles south of Durant, Oklahoma, and about 50 miles north of Paris, Texas.
The town is located in a flat, open area, with rolling hills to the east and west. The climate is mild, with hot summers and mild winters. The average annual temperature is around 70 degrees Fahrenheit.
Economy
The economy of Milburn is largely based on agriculture. The town is home to a number of farms, and the main crops are cotton, corn, and wheat. The town also has a number of businesses, including a grocery store, a hardware store, and a restaurant.
The town is also home to a number of manufacturing businesses, including a cotton gin, a feed mill, and a lumber yard. The town is also home to a number of oil and gas companies, which provide jobs for many of the town’s residents.
Demographics
As of the 2010 census, the population of Milburn was 1,427 people. The racial makeup of the town was 94.3% White, 0.7% African American, 0.2% Native American, 0.2% Asian, 0.1% Pacific Islander, 0.1% from other races, and 4.4% from two or more races. Hispanic or Latino of any race were 1.7% of the population.
The median income for a household in the town was $35,625, and the median income for a family was $41,250. The per capita income for the town was $17,845. About 15.2% of the population was below the poverty line.
Common Questions
What is Per Capita Income in Milburn?
Per Capita income in Milburn is $18,429.
What is the Median Family Income in Milburn?
Median Family Income in Milburn is $50,000.
What is the Median Household income in Milburn?
Median Household Income in Milburn is $40,000.
What is Income or Wage Gap in Milburn?
Income or Wage Gap in Milburn is 52.8%.
Women in Milburn earn 47.2 cents for every dollar earned by a man.
What is Inequality or Gini Index in Milburn?
Inequality or Gini Index in Milburn is 0.41.
What is the Total Population of Milburn?
Total Population of Milburn is 268.
What is the Total Male Population of Milburn?
Total Male Population of Milburn is 123.
What is the Total Female Population of Milburn?
Total Female Population of Milburn is 145.
What is the Ratio of Males per 100 Females in Milburn?
There are 84.83 Males per 100 Females in Milburn.
What is the Ratio of Females per 100 Males in Milburn?
There are 117.89 Females per 100 Males in Milburn.
What is the Median Population Age in Milburn?
Median Population Age in Milburn is 32.9 Years.
What is the Average Family Size in Milburn
Average Family Size in Milburn is 4.2 People.
What is the Average Household Size in Milburn
Average Household Size in Milburn is 3.1 People.
How Large is the Labor Force in Milburn?
There are 111 People in the Labor Forcein in Milburn.
What is the Percentage of People in the Labor Force in Milburn?
52.1% of People are in the Labor Force in Milburn.
What is the Unemployment Rate in Milburn?
Unemployment Rate in Milburn is 5.4%.