Ulen, MN Map & Demographics
Ulen Map
Ulen Overview
$26,347
PER CAPITA INCOME
$76,042
AVG FAMILY INCOME
$36,979
AVG HOUSEHOLD INCOME
0.48
INEQUALITY / GINI INDEX
428
TOTAL POPULATION
211
MALE POPULATION
217
FEMALE POPULATION
97.24
MALES / 100 FEMALES
102.84
FEMALES / 100 MALES
52.4
MEDIAN AGE
2.6
AVG FAMILY SIZE
1.9
AVG HOUSEHOLD SIZE
133
LABOR FORCE [ PEOPLE ]
38.1%
PERCENT IN LABOR FORCE
1.5%
UNEMPLOYMENT RATE
Ulen Zip Codes
Ulen Area Codes
Income in Ulen
Income Overview in Ulen
Per Capita Income in Ulen is $26,347, while median incomes of families and households are $76,042 and $36,979 respectively.
| Characteristic | Number | Measure |
| Per Capita Income | 428 | $26,347 |
| Median Family Income | 109 | $76,042 |
| Mean Family Income | 109 | $69,040 |
| Median Household Income | 213 | $36,979 |
| Mean Household Income | 213 | $50,609 |
| Income Deficit | 109 | $0 |
| Wage / Income Gap (%) | 428 | 0.00% |
| Wage / Income Gap ($) | 428 | 100.00¢ per $1 |
| Gini / Inequality Index | 428 | 0.48 |
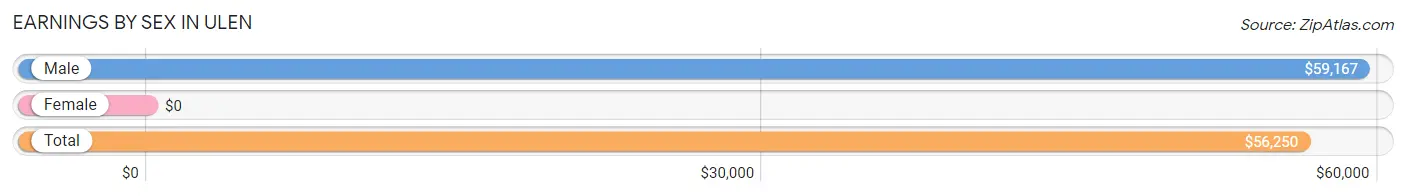
Earnings by Sex in Ulen
| Sex | Number | Average Earnings |
| Male | 72 (49.3%) | $59,167 |
| Female | 74 (50.7%) | $0 |
| Total | 146 (100.0%) | $56,250 |
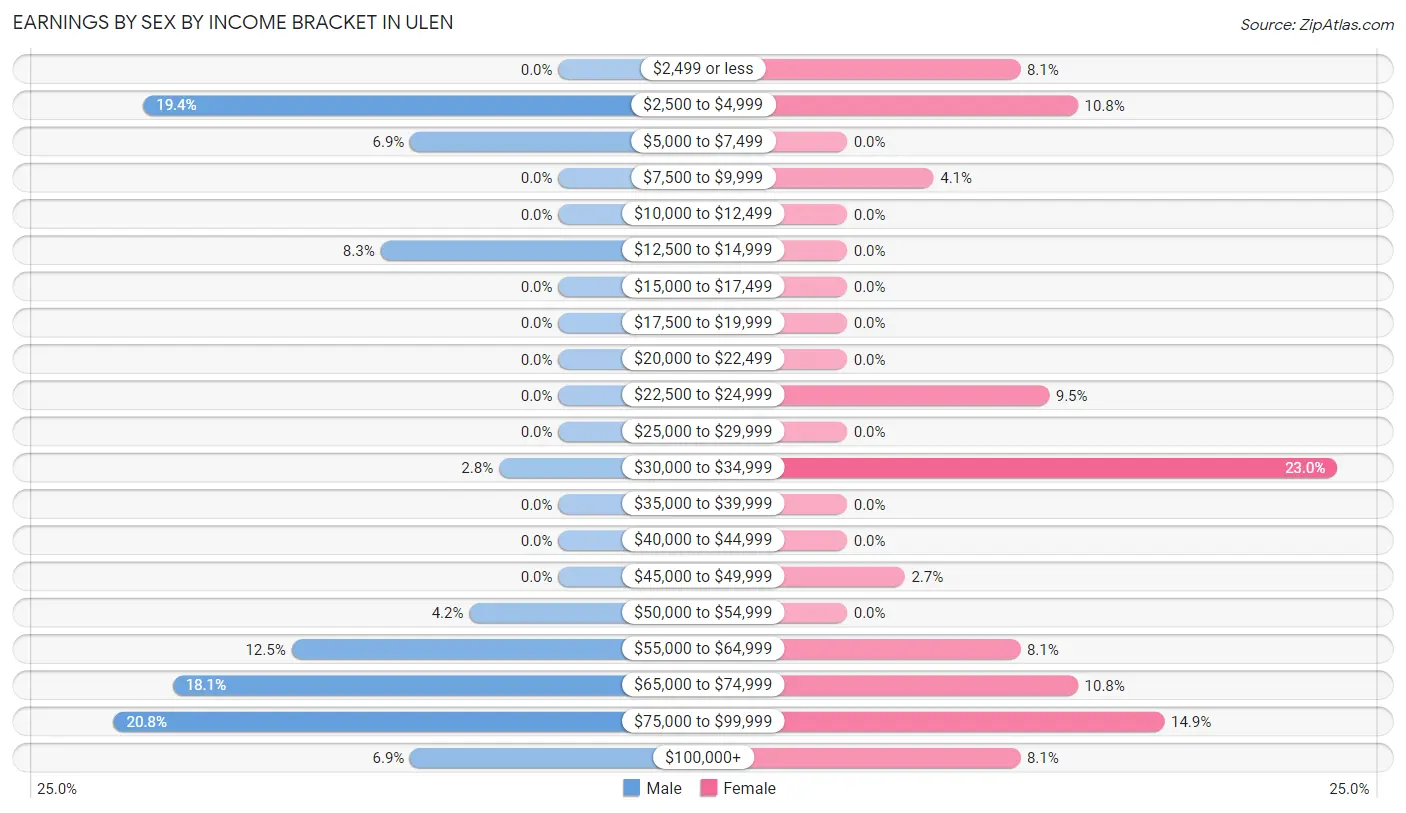
Earnings by Sex by Income Bracket in Ulen
The most common earnings brackets in Ulen are $75,000 to $99,999 for men (15 | 20.8%) and $30,000 to $34,999 for women (17 | 23.0%).
| Income | Male | Female |
| $2,499 or less | 0 (0.0%) | 6 (8.1%) |
| $2,500 to $4,999 | 14 (19.4%) | 8 (10.8%) |
| $5,000 to $7,499 | 5 (6.9%) | 0 (0.0%) |
| $7,500 to $9,999 | 0 (0.0%) | 3 (4.1%) |
| $10,000 to $12,499 | 0 (0.0%) | 0 (0.0%) |
| $12,500 to $14,999 | 6 (8.3%) | 0 (0.0%) |
| $15,000 to $17,499 | 0 (0.0%) | 0 (0.0%) |
| $17,500 to $19,999 | 0 (0.0%) | 0 (0.0%) |
| $20,000 to $22,499 | 0 (0.0%) | 0 (0.0%) |
| $22,500 to $24,999 | 0 (0.0%) | 7 (9.5%) |
| $25,000 to $29,999 | 0 (0.0%) | 0 (0.0%) |
| $30,000 to $34,999 | 2 (2.8%) | 17 (23.0%) |
| $35,000 to $39,999 | 0 (0.0%) | 0 (0.0%) |
| $40,000 to $44,999 | 0 (0.0%) | 0 (0.0%) |
| $45,000 to $49,999 | 0 (0.0%) | 2 (2.7%) |
| $50,000 to $54,999 | 3 (4.2%) | 0 (0.0%) |
| $55,000 to $64,999 | 9 (12.5%) | 6 (8.1%) |
| $65,000 to $74,999 | 13 (18.1%) | 8 (10.8%) |
| $75,000 to $99,999 | 15 (20.8%) | 11 (14.9%) |
| $100,000+ | 5 (6.9%) | 6 (8.1%) |
| Total | 72 (100.0%) | 74 (100.0%) |
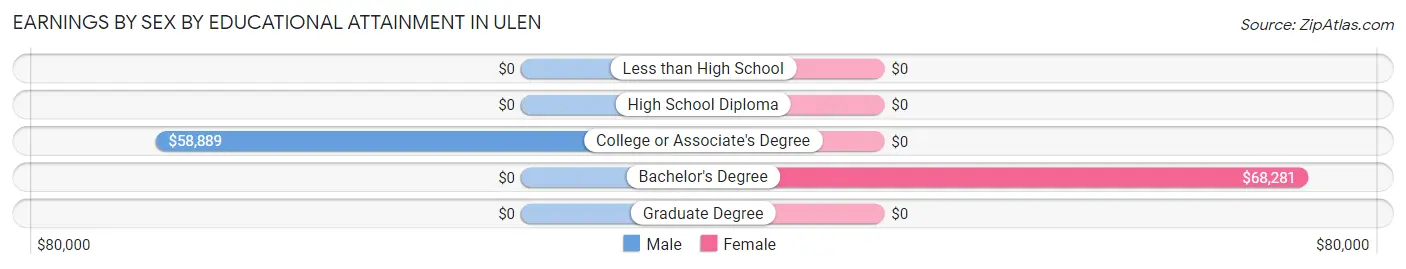
Earnings by Sex by Educational Attainment in Ulen
| Educational Attainment | Male Income | Female Income |
| Less than High School | - | - |
| High School Diploma | - | - |
| College or Associate's Degree | $58,889 | $0 |
| Bachelor's Degree | - | - |
| Graduate Degree | - | - |
| Total | $70,288 | $0 |
Family Income in Ulen
Family Income Brackets in Ulen
According to the Ulen family income data, there are 34 families falling into the $75,000 to $99,999 income range, which is the most common income bracket and makes up 31.2% of all families.
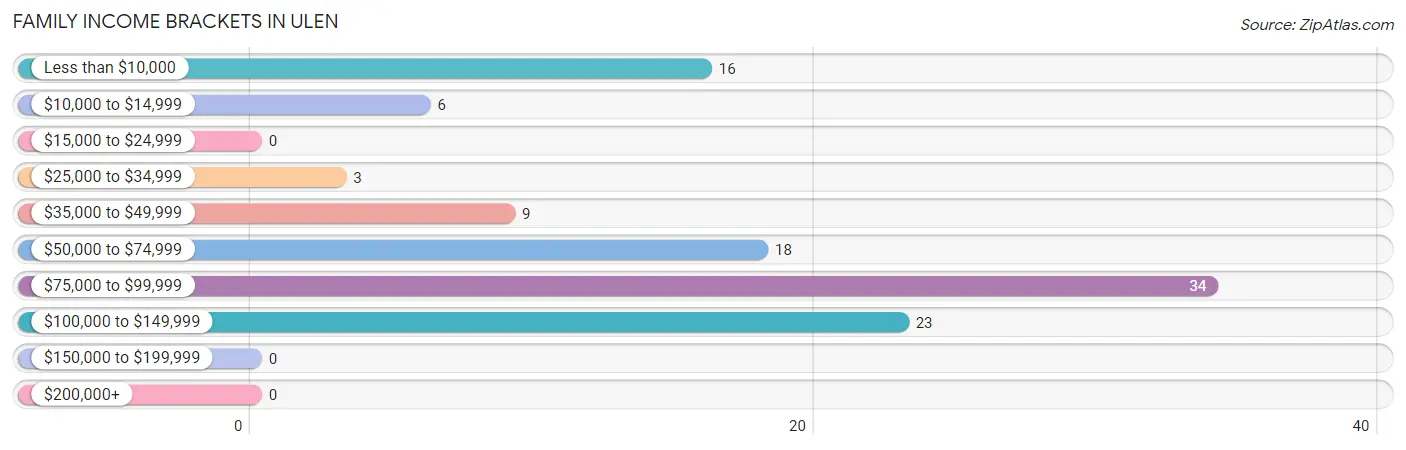
| Income Bracket | # Families | % Families |
| Less than $10,000 | 16 | 14.7% |
| $10,000 to $14,999 | 6 | 5.5% |
| $15,000 to $24,999 | 0 | 0.0% |
| $25,000 to $34,999 | 3 | 2.8% |
| $35,000 to $49,999 | 9 | 8.3% |
| $50,000 to $74,999 | 18 | 16.5% |
| $75,000 to $99,999 | 34 | 31.2% |
| $100,000 to $149,999 | 23 | 21.1% |
| $150,000 to $199,999 | 0 | 0.0% |
| $200,000+ | 0 | 0.0% |
Family Income by Famaliy Size in Ulen
3-person families (16 | 14.7%) account for the highest median family income in Ulen with $137,500 per family, while 3-person families (16 | 14.7%) have the highest median income of $45,833 per family member.
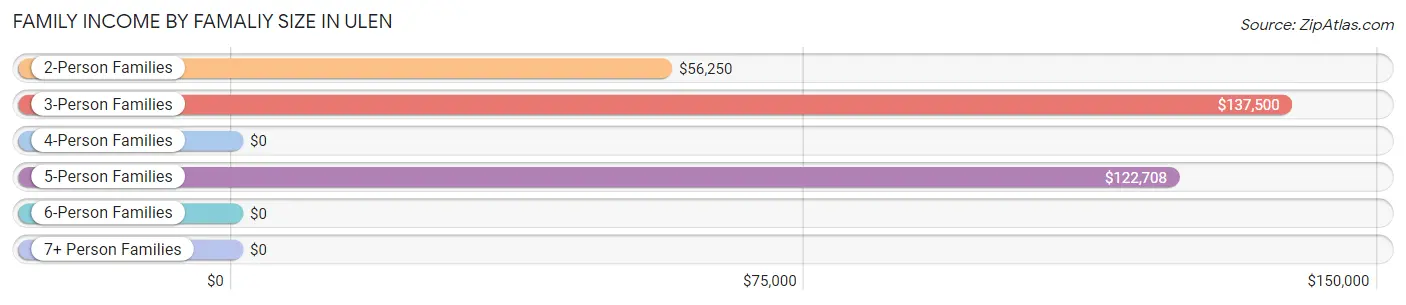
| Income Bracket | # Families | Median Income |
| 2-Person Families | 70 (64.2%) | $56,250 |
| 3-Person Families | 16 (14.7%) | $137,500 |
| 4-Person Families | 6 (5.5%) | $0 |
| 5-Person Families | 17 (15.6%) | $122,708 |
| 6-Person Families | 0 (0.0%) | $0 |
| 7+ Person Families | 0 (0.0%) | $0 |
| Total | 109 (100.0%) | $76,042 |
Family Income by Number of Earners in Ulen
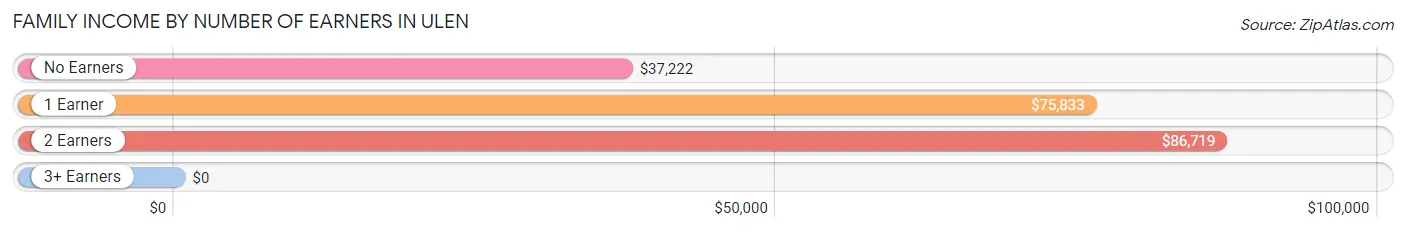
| Number of Earners | # Families | Median Income |
| No Earners | 34 (31.2%) | $37,222 |
| 1 Earner | 26 (23.8%) | $75,833 |
| 2 Earners | 43 (39.5%) | $86,719 |
| 3+ Earners | 6 (5.5%) | $0 |
| Total | 109 (100.0%) | $76,042 |
Household Income in Ulen
Household Income Brackets in Ulen
With 48 households falling in the category, the less than $10,000 income range is the most frequent in Ulen, accounting for 22.5% of all households.
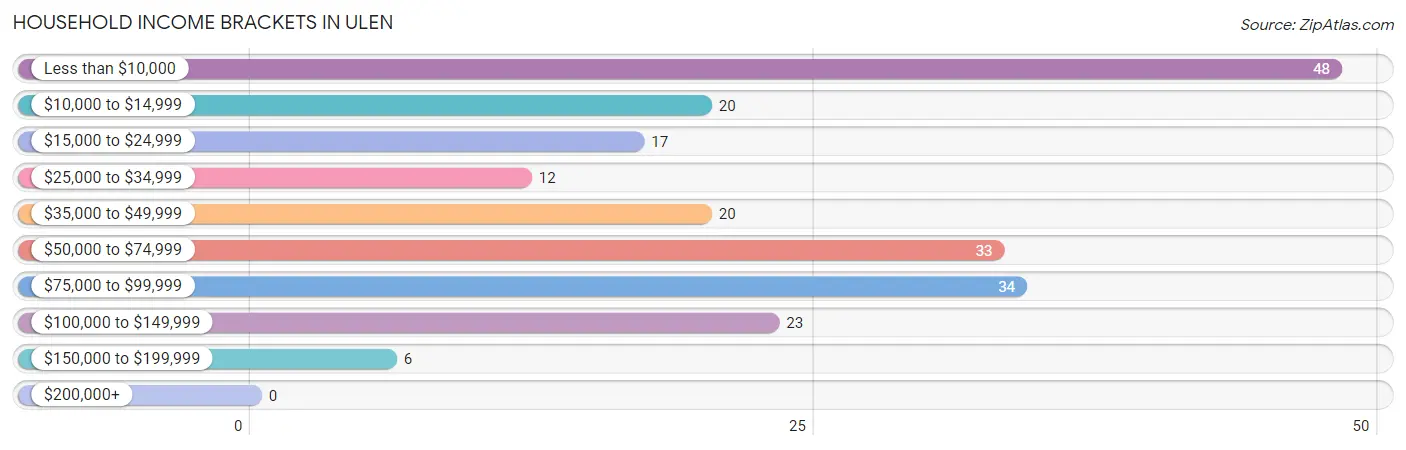
| Income Bracket | # Households | % Households |
| Less than $10,000 | 48 | 22.5% |
| $10,000 to $14,999 | 20 | 9.4% |
| $15,000 to $24,999 | 17 | 8.0% |
| $25,000 to $34,999 | 12 | 5.6% |
| $35,000 to $49,999 | 20 | 9.4% |
| $50,000 to $74,999 | 33 | 15.5% |
| $75,000 to $99,999 | 34 | 16.0% |
| $100,000 to $149,999 | 23 | 10.8% |
| $150,000 to $199,999 | 6 | 2.8% |
| $200,000+ | 0 | 0.0% |
Household Income by Householder Age in Ulen
The median household income in Ulen is $36,979, with the highest median household income of $86,094 found in the 25 to 44 years age bracket for the primary householder. A total of 31 households (14.5%) fall into this category.
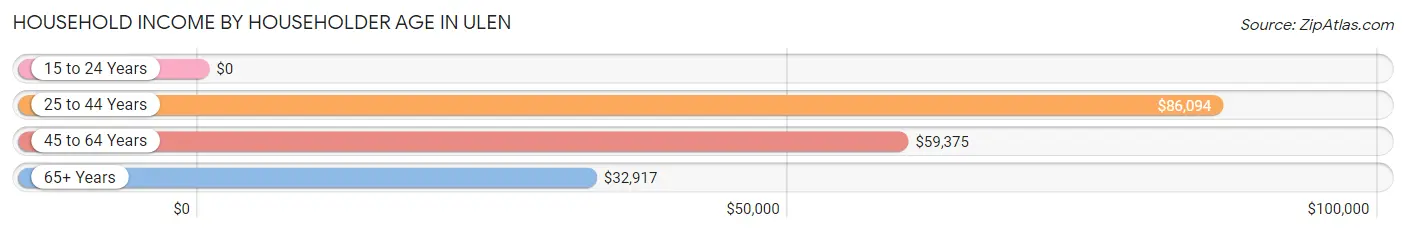
| Income Bracket | # Households | Median Income |
| 15 to 24 Years | 0 (0.0%) | $0 |
| 25 to 44 Years | 31 (14.5%) | $86,094 |
| 45 to 64 Years | 79 (37.1%) | $59,375 |
| 65+ Years | 103 (48.4%) | $32,917 |
| Total | 213 (100.0%) | $36,979 |
Poverty in Ulen
Income Below Poverty by Sex and Age in Ulen
With 29.4% poverty level for males and 21.4% for females among the residents of Ulen, 18 to 24 year old males and 25 to 34 year old females are the most vulnerable to poverty, with 5 males (100.0%) and 12 females (100.0%) in their respective age groups living below the poverty level.
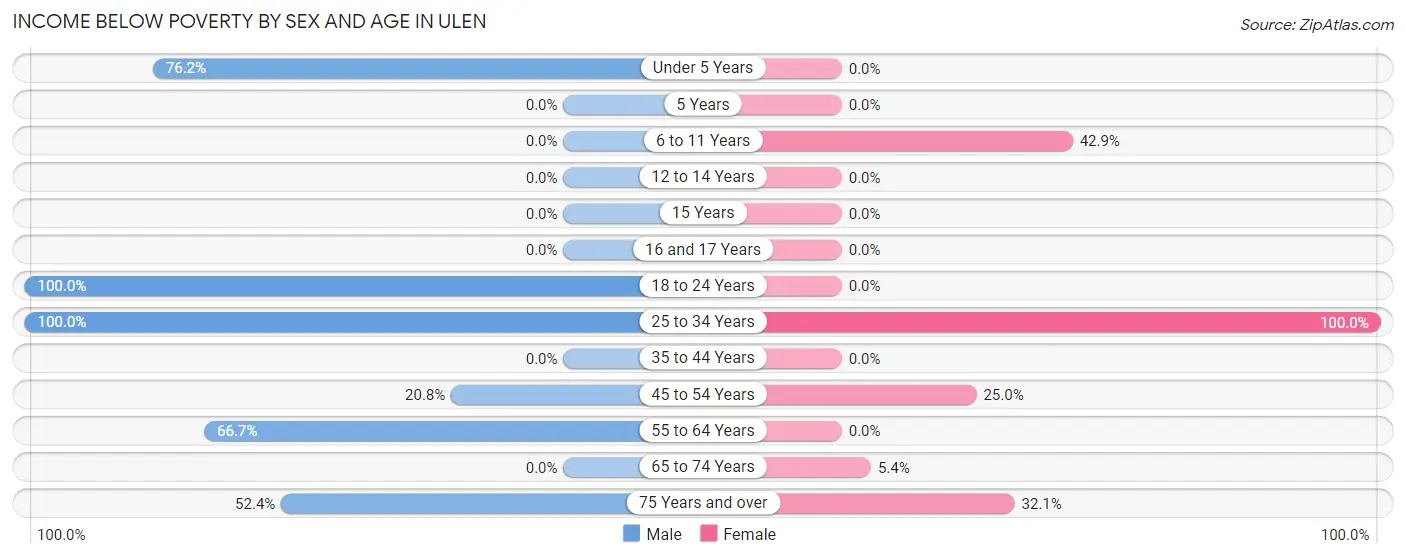
| Age Bracket | Male | Female |
| Under 5 Years | 16 (76.2%) | 0 (0.0%) |
| 5 Years | 0 (0.0%) | 0 (0.0%) |
| 6 to 11 Years | 0 (0.0%) | 6 (42.9%) |
| 12 to 14 Years | 0 (0.0%) | 0 (0.0%) |
| 15 Years | 0 (0.0%) | 0 (0.0%) |
| 16 and 17 Years | 0 (0.0%) | 0 (0.0%) |
| 18 to 24 Years | 5 (100.0%) | 0 (0.0%) |
| 25 to 34 Years | 6 (100.0%) | 12 (100.0%) |
| 35 to 44 Years | 0 (0.0%) | 0 (0.0%) |
| 45 to 54 Years | 10 (20.8%) | 2 (25.0%) |
| 55 to 64 Years | 14 (66.7%) | 0 (0.0%) |
| 65 to 74 Years | 0 (0.0%) | 2 (5.4%) |
| 75 Years and over | 11 (52.4%) | 17 (32.1%) |
| Total | 62 (29.4%) | 39 (21.4%) |
Income Above Poverty by Sex and Age in Ulen
According to the poverty statistics in Ulen, males aged 6 to 11 years and females aged 12 to 14 years are the age groups that are most secure financially, with 100.0% of males and 100.0% of females in these age groups living above the poverty line.
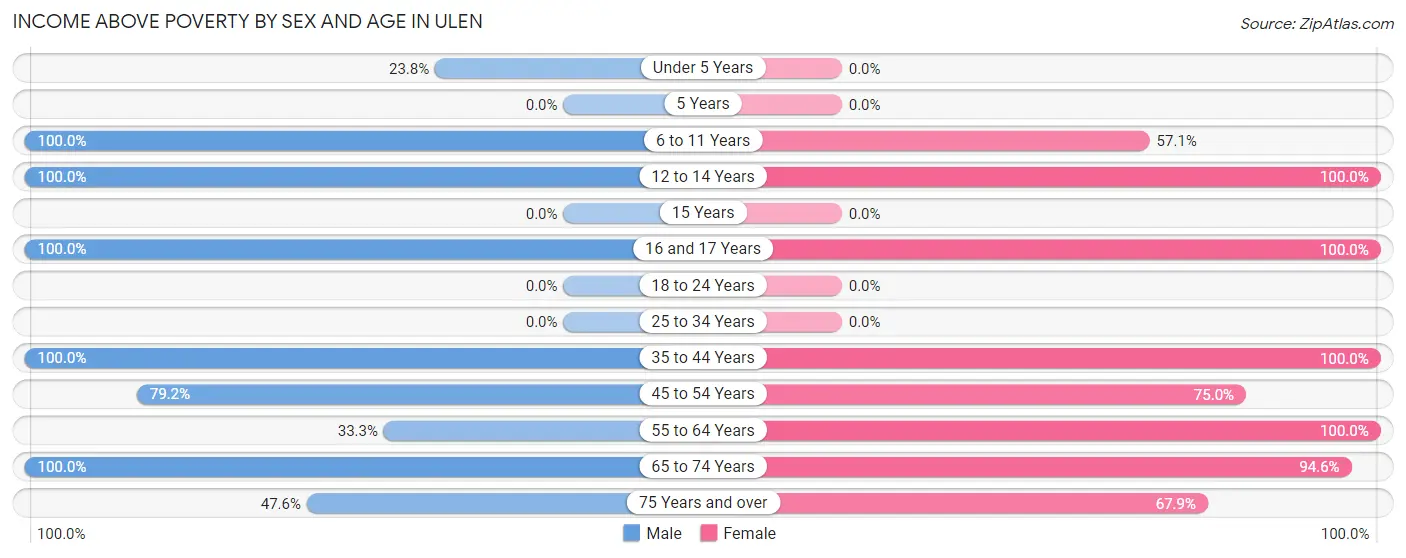
| Age Bracket | Male | Female |
| Under 5 Years | 5 (23.8%) | 0 (0.0%) |
| 5 Years | 0 (0.0%) | 0 (0.0%) |
| 6 to 11 Years | 16 (100.0%) | 8 (57.1%) |
| 12 to 14 Years | 23 (100.0%) | 5 (100.0%) |
| 15 Years | 0 (0.0%) | 0 (0.0%) |
| 16 and 17 Years | 10 (100.0%) | 8 (100.0%) |
| 18 to 24 Years | 0 (0.0%) | 0 (0.0%) |
| 25 to 34 Years | 0 (0.0%) | 0 (0.0%) |
| 35 to 44 Years | 11 (100.0%) | 31 (100.0%) |
| 45 to 54 Years | 38 (79.2%) | 6 (75.0%) |
| 55 to 64 Years | 7 (33.3%) | 14 (100.0%) |
| 65 to 74 Years | 29 (100.0%) | 35 (94.6%) |
| 75 Years and over | 10 (47.6%) | 36 (67.9%) |
| Total | 149 (70.6%) | 143 (78.6%) |
Income Below Poverty Among Married-Couple Families in Ulen
The poverty statistics for married-couple families in Ulen show that 8.8% or 6 of the total 68 families live below the poverty line. Families with 1 or 2 children have the highest poverty rate of 42.9%, comprising of 6 families. On the other hand, families with no children have the lowest poverty rate of 0.0%, which includes 0 families.
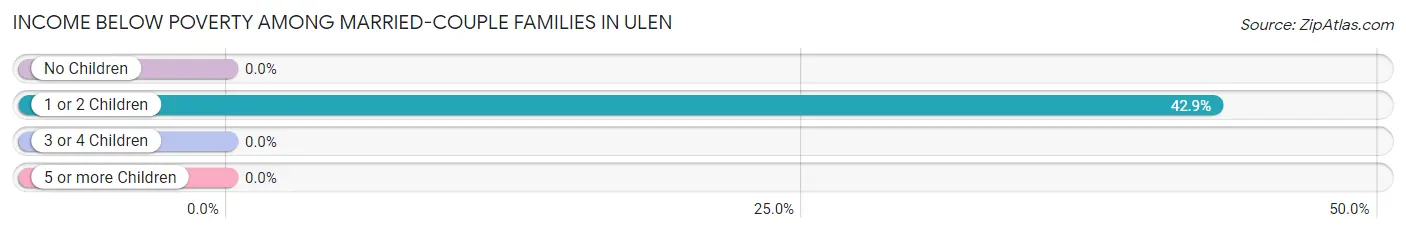
| Children | Above Poverty | Below Poverty |
| No Children | 45 (100.0%) | 0 (0.0%) |
| 1 or 2 Children | 8 (57.1%) | 6 (42.9%) |
| 3 or 4 Children | 9 (100.0%) | 0 (0.0%) |
| 5 or more Children | 0 (0.0%) | 0 (0.0%) |
| Total | 62 (91.2%) | 6 (8.8%) |
Income Below Poverty Among Single-Parent Households in Ulen
According to the poverty data in Ulen, 52.6% or 10 single-father households and 27.3% or 6 single-mother households are living below the poverty line. Among single-father households, those with no children have the highest poverty rate, with 10 households (100.0%) experiencing poverty. Likewise, among single-mother households, those with 1 or 2 children have the highest poverty rate, with 6 households (42.9%) falling below the poverty line.
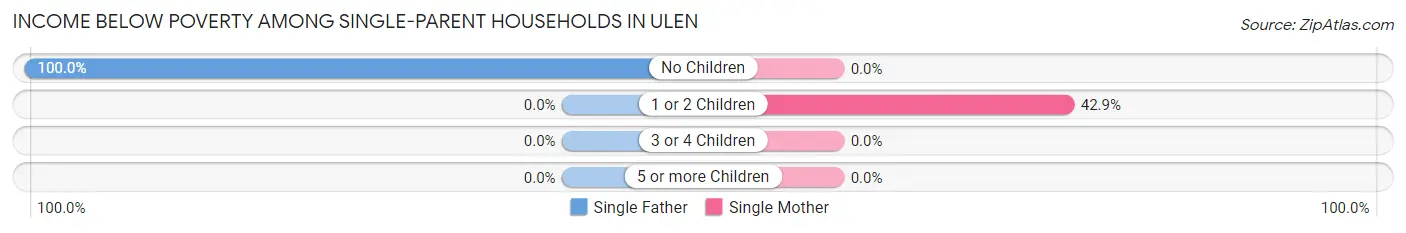
| Children | Single Father | Single Mother |
| No Children | 10 (100.0%) | 0 (0.0%) |
| 1 or 2 Children | 0 (0.0%) | 6 (42.9%) |
| 3 or 4 Children | 0 (0.0%) | 0 (0.0%) |
| 5 or more Children | 0 (0.0%) | 0 (0.0%) |
| Total | 10 (52.6%) | 6 (27.3%) |
Income Below Poverty Among Married-Couple vs Single-Parent Households in Ulen
The poverty data for Ulen shows that 6 of the married-couple family households (8.8%) and 16 of the single-parent households (39.0%) are living below the poverty level. Within the married-couple family households, those with 1 or 2 children have the highest poverty rate, with 6 households (42.9%) falling below the poverty line. Among the single-parent households, those with no children have the highest poverty rate, with 10 household (100.0%) living below poverty.
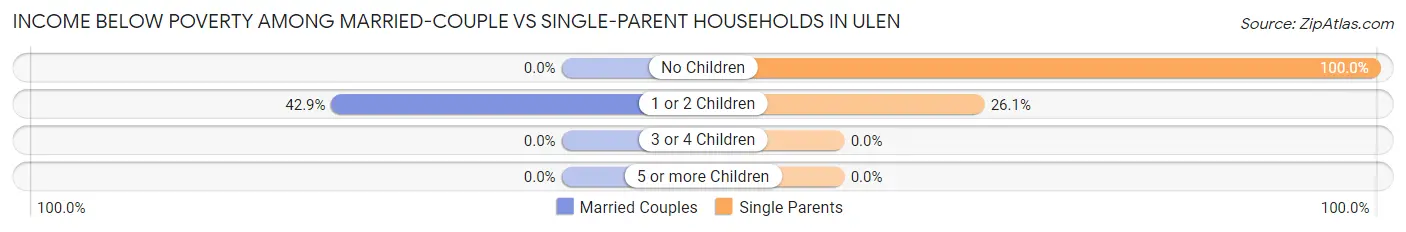
| Children | Married-Couple Families | Single-Parent Households |
| No Children | 0 (0.0%) | 10 (100.0%) |
| 1 or 2 Children | 6 (42.9%) | 6 (26.1%) |
| 3 or 4 Children | 0 (0.0%) | 0 (0.0%) |
| 5 or more Children | 0 (0.0%) | 0 (0.0%) |
| Total | 6 (8.8%) | 16 (39.0%) |
Race in Ulen
The most populous races in Ulen are White / Caucasian (419 | 97.9%), Hispanic or Latino (9 | 2.1%), and Two or more Races (9 | 2.1%).
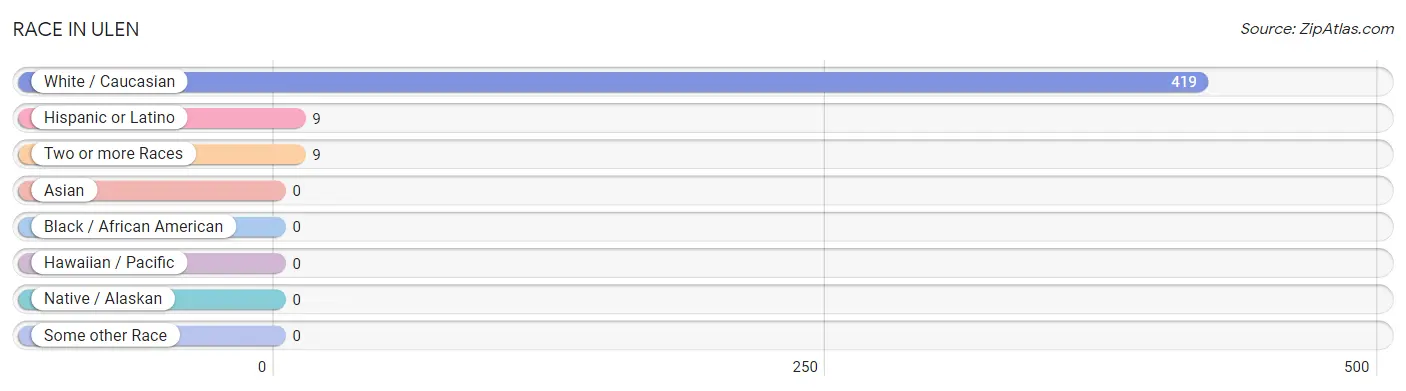
| Race | # Population | % Population |
| Asian | 0 | 0.0% |
| Black / African American | 0 | 0.0% |
| Hawaiian / Pacific | 0 | 0.0% |
| Hispanic or Latino | 9 | 2.1% |
| Native / Alaskan | 0 | 0.0% |
| White / Caucasian | 419 | 97.9% |
| Two or more Races | 9 | 2.1% |
| Some other Race | 0 | 0.0% |
| Total | 428 | 100.0% |
Ancestry in Ulen
The most populous ancestries reported in Ulen are German (160 | 37.4%), Norwegian (142 | 33.2%), Swedish (45 | 10.5%), Scandinavian (30 | 7.0%), and Czech (26 | 6.1%), together accounting for 94.2% of all Ulen residents.
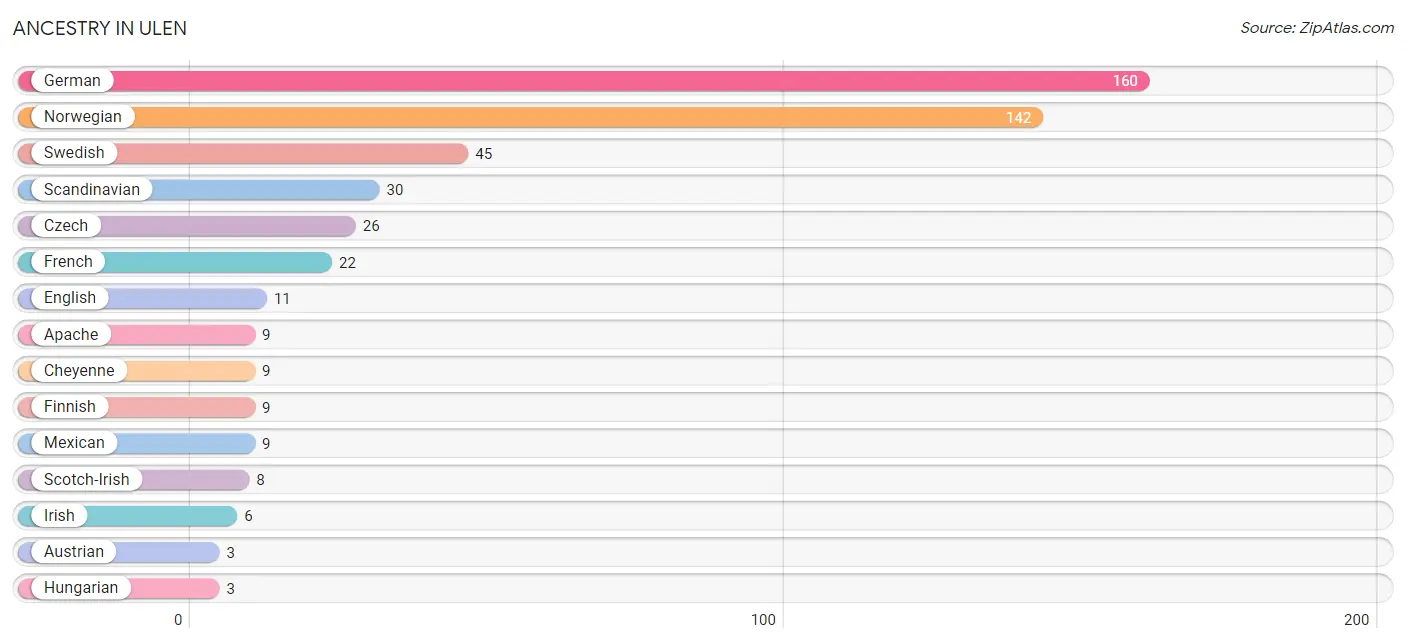
| Ancestry | # Population | % Population |
| Apache | 9 | 2.1% |
| Austrian | 3 | 0.7% |
| Cheyenne | 9 | 2.1% |
| Czech | 26 | 6.1% |
| English | 11 | 2.6% |
| Finnish | 9 | 2.1% |
| French | 22 | 5.1% |
| German | 160 | 37.4% |
| Hungarian | 3 | 0.7% |
| Irish | 6 | 1.4% |
| Mexican | 9 | 2.1% |
| Norwegian | 142 | 33.2% |
| Scandinavian | 30 | 7.0% |
| Scotch-Irish | 8 | 1.9% |
| Scottish | 3 | 0.7% |
| Swedish | 45 | 10.5% | View All 16 Rows |
Immigrants in Ulen

| Immigration Origin | # Population | % Population | View All 0 Rows |
Sex and Age in Ulen
Sex and Age in Ulen
The most populous age groups in Ulen are 45 to 49 Years (37 | 17.5%) for men and 85 Years and over (58 | 26.7%) for women.
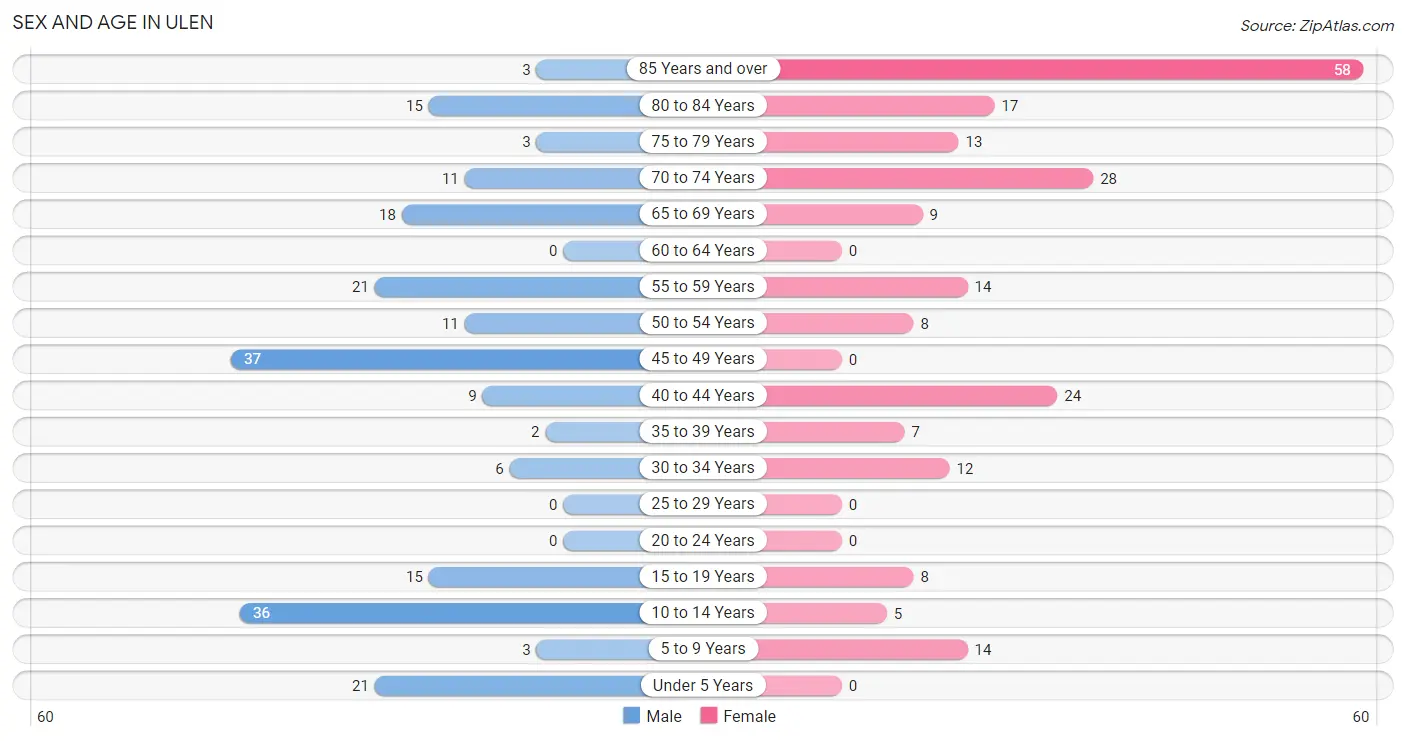
| Age Bracket | Male | Female |
| Under 5 Years | 21 (10.0%) | 0 (0.0%) |
| 5 to 9 Years | 3 (1.4%) | 14 (6.5%) |
| 10 to 14 Years | 36 (17.1%) | 5 (2.3%) |
| 15 to 19 Years | 15 (7.1%) | 8 (3.7%) |
| 20 to 24 Years | 0 (0.0%) | 0 (0.0%) |
| 25 to 29 Years | 0 (0.0%) | 0 (0.0%) |
| 30 to 34 Years | 6 (2.8%) | 12 (5.5%) |
| 35 to 39 Years | 2 (0.9%) | 7 (3.2%) |
| 40 to 44 Years | 9 (4.3%) | 24 (11.1%) |
| 45 to 49 Years | 37 (17.5%) | 0 (0.0%) |
| 50 to 54 Years | 11 (5.2%) | 8 (3.7%) |
| 55 to 59 Years | 21 (10.0%) | 14 (6.5%) |
| 60 to 64 Years | 0 (0.0%) | 0 (0.0%) |
| 65 to 69 Years | 18 (8.5%) | 9 (4.2%) |
| 70 to 74 Years | 11 (5.2%) | 28 (12.9%) |
| 75 to 79 Years | 3 (1.4%) | 13 (6.0%) |
| 80 to 84 Years | 15 (7.1%) | 17 (7.8%) |
| 85 Years and over | 3 (1.4%) | 58 (26.7%) |
| Total | 211 (100.0%) | 217 (100.0%) |
Families and Households in Ulen
Median Family Size in Ulen
The median family size in Ulen is 2.65 persons per family, with single female/mother families (22 | 20.2%) accounting for the largest median family size of 3.36 persons per family. On the other hand, single male/father families (19 | 17.4%) represent the smallest median family size with 1.68 persons per family.
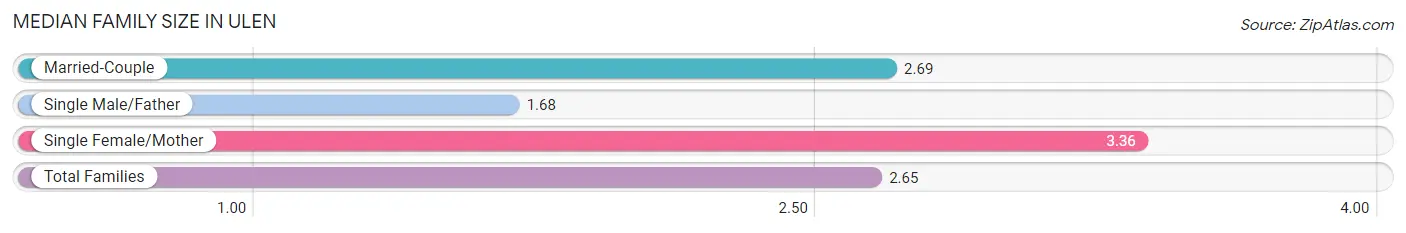
| Family Type | # Families | Family Size |
| Married-Couple | 68 (62.4%) | 2.69 |
| Single Male/Father | 19 (17.4%) | 1.68 |
| Single Female/Mother | 22 (20.2%) | 3.36 |
| Total Families | 109 (100.0%) | 2.65 |
Median Household Size in Ulen
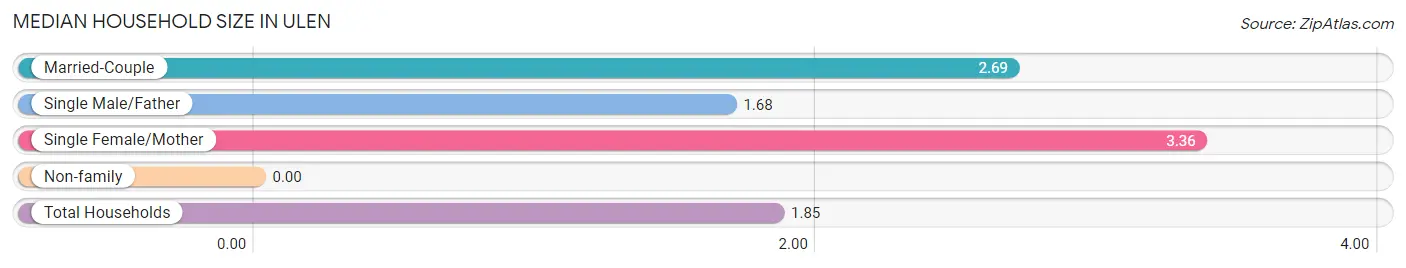
| Household Type | # Households | Household Size |
| Married-Couple | 68 (31.9%) | 2.69 |
| Single Male/Father | 19 (8.9%) | 1.68 |
| Single Female/Mother | 22 (10.3%) | 3.36 |
| Non-family | 104 (48.8%) | - |
| Total Households | 213 (100.0%) | 1.85 |
Household Size by Marriage Status in Ulen
Out of a total of 213 households in Ulen, 109 (51.2%) are family households, while 104 (48.8%) are nonfamily households. The most numerous type of family households are 2-person households, comprising 70, and the most common type of nonfamily households are 1-person households, comprising 104.
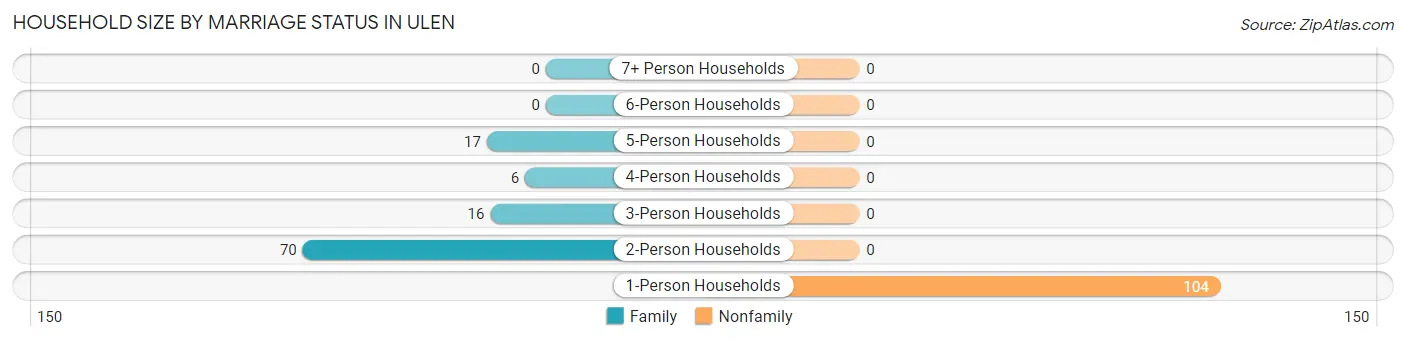
| Household Size | Family Households | Nonfamily Households |
| 1-Person Households | - | 104 (48.8%) |
| 2-Person Households | 70 (32.9%) | 0 (0.0%) |
| 3-Person Households | 16 (7.5%) | 0 (0.0%) |
| 4-Person Households | 6 (2.8%) | 0 (0.0%) |
| 5-Person Households | 17 (8.0%) | 0 (0.0%) |
| 6-Person Households | 0 (0.0%) | 0 (0.0%) |
| 7+ Person Households | 0 (0.0%) | 0 (0.0%) |
| Total | 109 (51.2%) | 104 (48.8%) |
Female Fertility in Ulen
Fertility by Age in Ulen
Average fertility rate in Ulen is 118.0 births per 1,000 women. Women in the age bracket of 20 to 34 years have the highest fertility rate with 500.0 births per 1,000 women. Women in the age bracket of 20 to 34 years acount for 100.0% of all women with births.
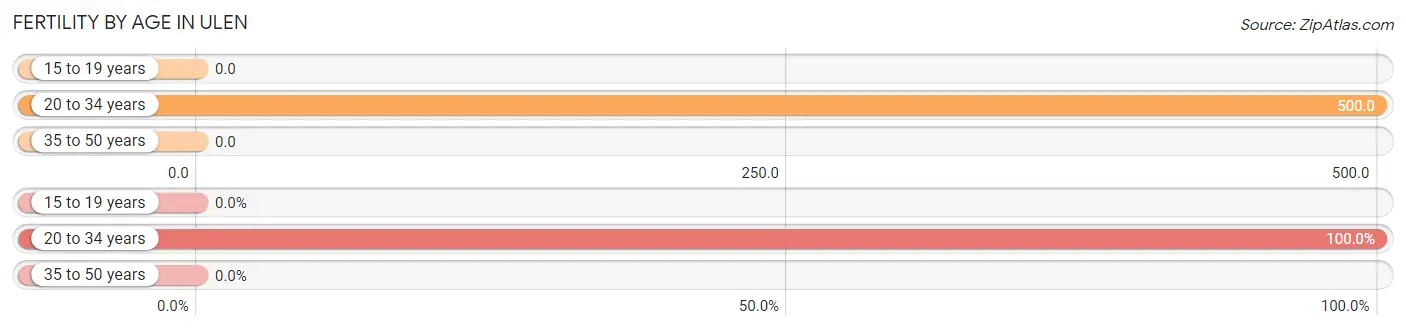
| Age Bracket | Women with Births | Births / 1,000 Women |
| 15 to 19 years | 0 (0.0%) | 0.0 |
| 20 to 34 years | 6 (100.0%) | 500.0 |
| 35 to 50 years | 0 (0.0%) | 0.0 |
| Total | 6 (100.0%) | 118.0 |
Fertility by Age by Marriage Status in Ulen
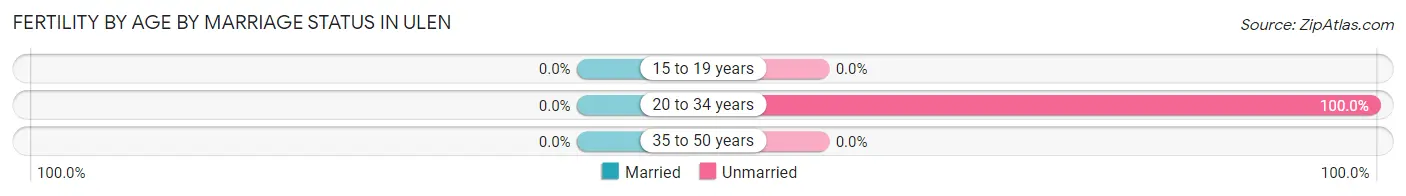
| Age Bracket | Married | Unmarried |
| 15 to 19 years | 0 (0.0%) | 0 (0.0%) |
| 20 to 34 years | 0 (0.0%) | 6 (100.0%) |
| 35 to 50 years | 0 (0.0%) | 0 (0.0%) |
| Total | 0 (0.0%) | 6 (100.0%) |
Fertility by Education in Ulen
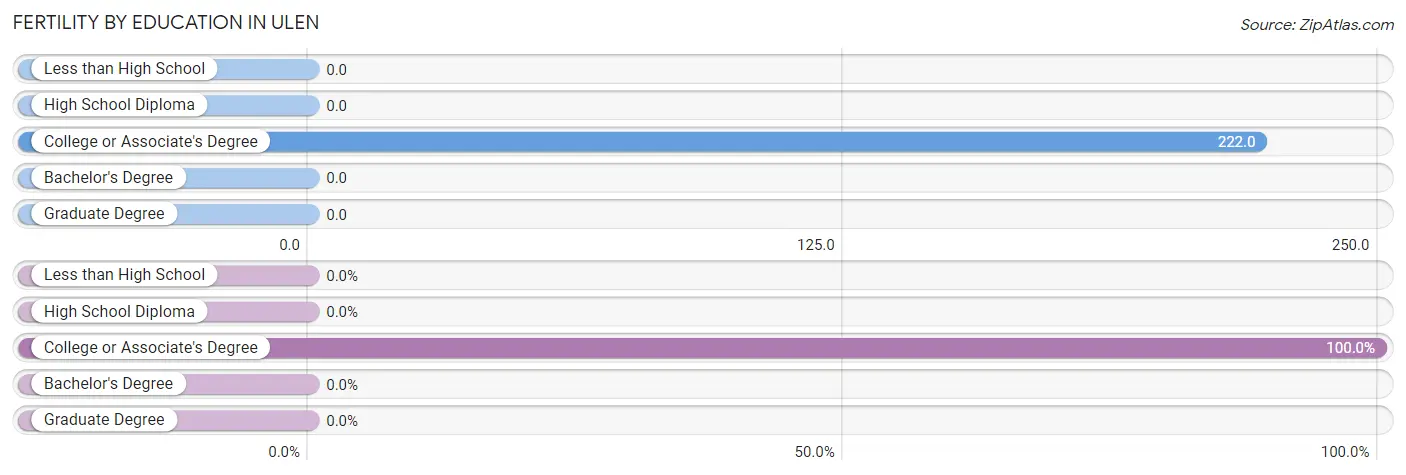
| Educational Attainment | Women with Births | Births / 1,000 Women |
| Less than High School | 0 (0.0%) | 0.0 |
| High School Diploma | 0 (0.0%) | 0.0 |
| College or Associate's Degree | 6 (100.0%) | 222.0 |
| Bachelor's Degree | 0 (0.0%) | 0.0 |
| Graduate Degree | 0 (0.0%) | 0.0 |
| Total | 6 (100.0%) | 118.0 |
Fertility by Education by Marriage Status in Ulen
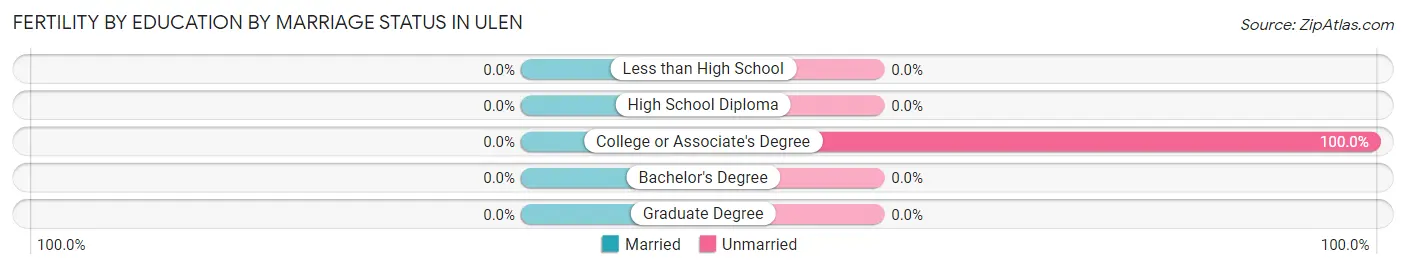
| Educational Attainment | Married | Unmarried |
| Less than High School | 0 (0.0%) | 0 (0.0%) |
| High School Diploma | 0 (0.0%) | 0 (0.0%) |
| College or Associate's Degree | 0 (0.0%) | 6 (100.0%) |
| Bachelor's Degree | 0 (0.0%) | 0 (0.0%) |
| Graduate Degree | 0 (0.0%) | 0 (0.0%) |
| Total | 0 (0.0%) | 6 (100.0%) |
Employment Characteristics in Ulen
Employment by Class of Employer in Ulen
Among the 114 employed individuals in Ulen, private company employees (63 | 55.3%), local government employees (43 | 37.7%), and state government employees (6 | 5.3%) make up the most common classes of employment.
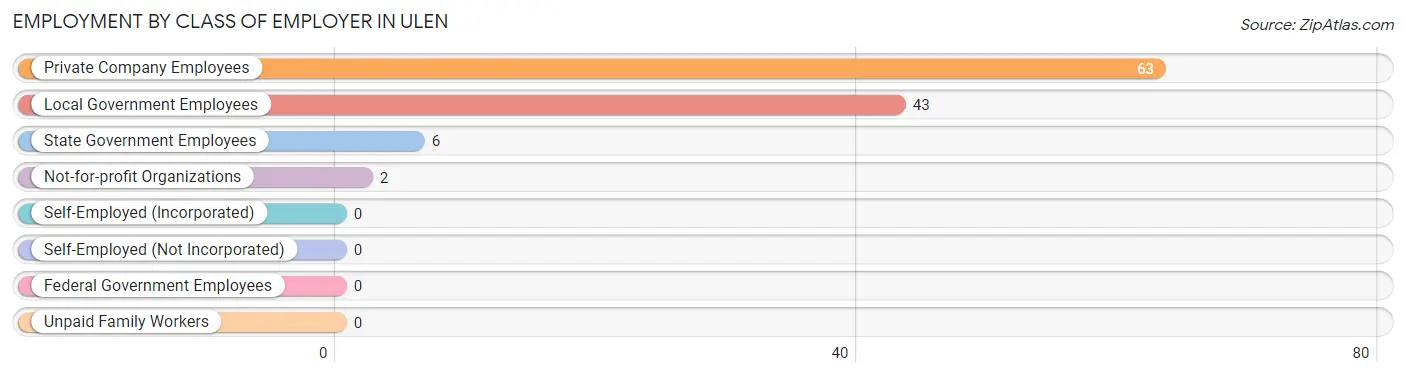
| Employer Class | # Employees | % Employees |
| Private Company Employees | 63 | 55.3% |
| Self-Employed (Incorporated) | 0 | 0.0% |
| Self-Employed (Not Incorporated) | 0 | 0.0% |
| Not-for-profit Organizations | 2 | 1.8% |
| Local Government Employees | 43 | 37.7% |
| State Government Employees | 6 | 5.3% |
| Federal Government Employees | 0 | 0.0% |
| Unpaid Family Workers | 0 | 0.0% |
| Total | 114 | 100.0% |
Employment Status by Age in Ulen
According to the labor force statistics for Ulen, out of the total population over 16 years of age (349), 38.1% or 133 individuals are in the labor force, with 1.5% or 2 of them unemployed. The age group with the highest labor force participation rate is 35 to 44 years, with 92.9% or 39 individuals in the labor force. Within the labor force, the 35 to 44 years age range has the highest percentage of unemployed individuals, with 5.1% or 2 of them being unemployed.
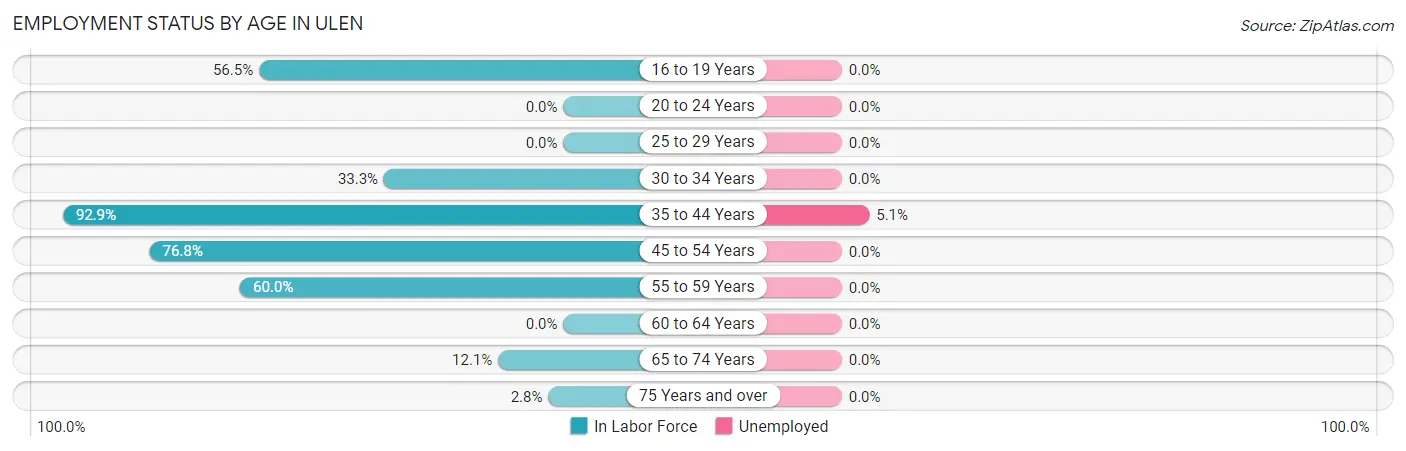
| Age Bracket | In Labor Force | Unemployed |
| 16 to 19 Years | 13 (56.5%) | 0 (0.0%) |
| 20 to 24 Years | 0 (0.0%) | 0 (0.0%) |
| 25 to 29 Years | 0 (0.0%) | 0 (0.0%) |
| 30 to 34 Years | 6 (33.3%) | 0 (0.0%) |
| 35 to 44 Years | 39 (92.9%) | 2 (5.1%) |
| 45 to 54 Years | 43 (76.8%) | 0 (0.0%) |
| 55 to 59 Years | 21 (60.0%) | 0 (0.0%) |
| 60 to 64 Years | 0 (0.0%) | 0 (0.0%) |
| 65 to 74 Years | 8 (12.1%) | 0 (0.0%) |
| 75 Years and over | 3 (2.8%) | 0 (0.0%) |
| Total | 133 (38.1%) | 2 (1.5%) |
Employment Status by Educational Attainment in Ulen
According to labor force statistics for Ulen, 72.2% of individuals (109) out of the total population between 25 and 64 years of age (151) are in the labor force, with 1.8% or 2 of them being unemployed. The group with the highest labor force participation rate are those with the educational attainment of college / associate degree, with 91.5% or 65 individuals in the labor force. Within the labor force, individuals with college / associate degree education have the highest percentage of unemployment, with 3.1% or 2 of them being unemployed.
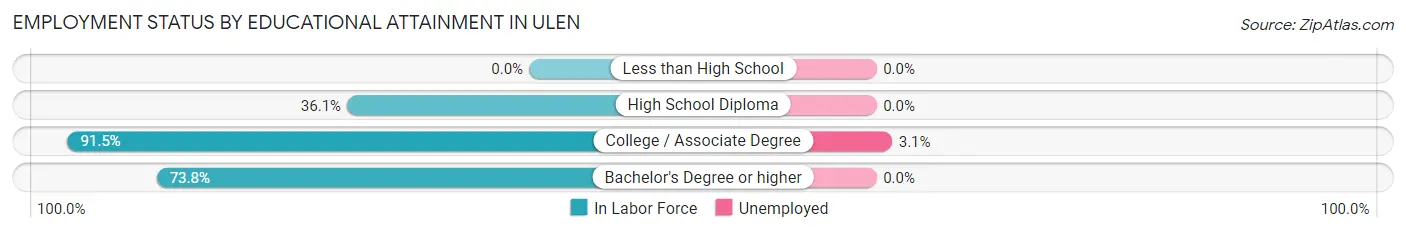
| Educational Attainment | In Labor Force | Unemployed |
| Less than High School | 0 (0.0%) | 0 (0.0%) |
| High School Diploma | 13 (36.1%) | 0 (0.0%) |
| College / Associate Degree | 65 (91.5%) | 2 (3.1%) |
| Bachelor's Degree or higher | 31 (73.8%) | 0 (0.0%) |
| Total | 109 (72.2%) | 3 (1.8%) |
Employment Occupations by Sex in Ulen
Management, Business, Science and Arts Occupations
The most common Management, Business, Science and Arts occupations in Ulen are Management (32 | 24.4%), Community & Social Service (30 | 22.9%), Education Instruction & Library (30 | 22.9%), Computers, Engineering & Science (6 | 4.6%), and Computers & Mathematics (6 | 4.6%).
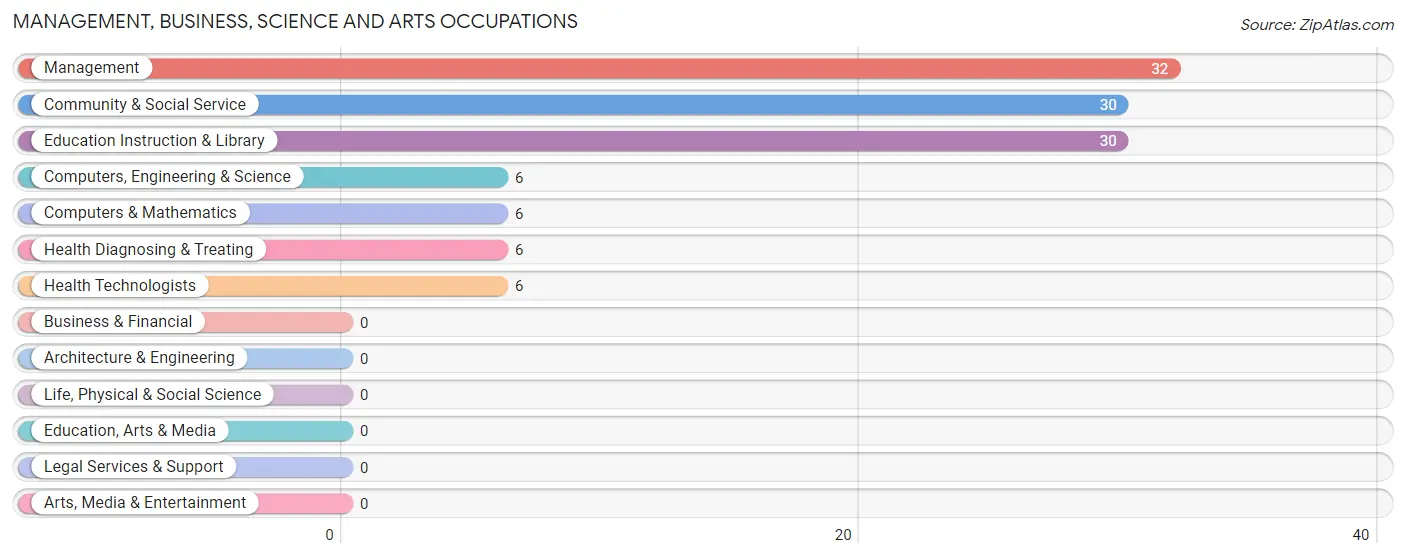
Management, Business, Science and Arts Occupations by Sex
Within the Management, Business, Science and Arts occupations in Ulen, the most male-oriented occupations are Health Diagnosing & Treating (100.0%), Health Technologists (100.0%), and Management (56.2%), while the most female-oriented occupations are Computers, Engineering & Science (100.0%), Computers & Mathematics (100.0%), and Community & Social Service (70.0%).
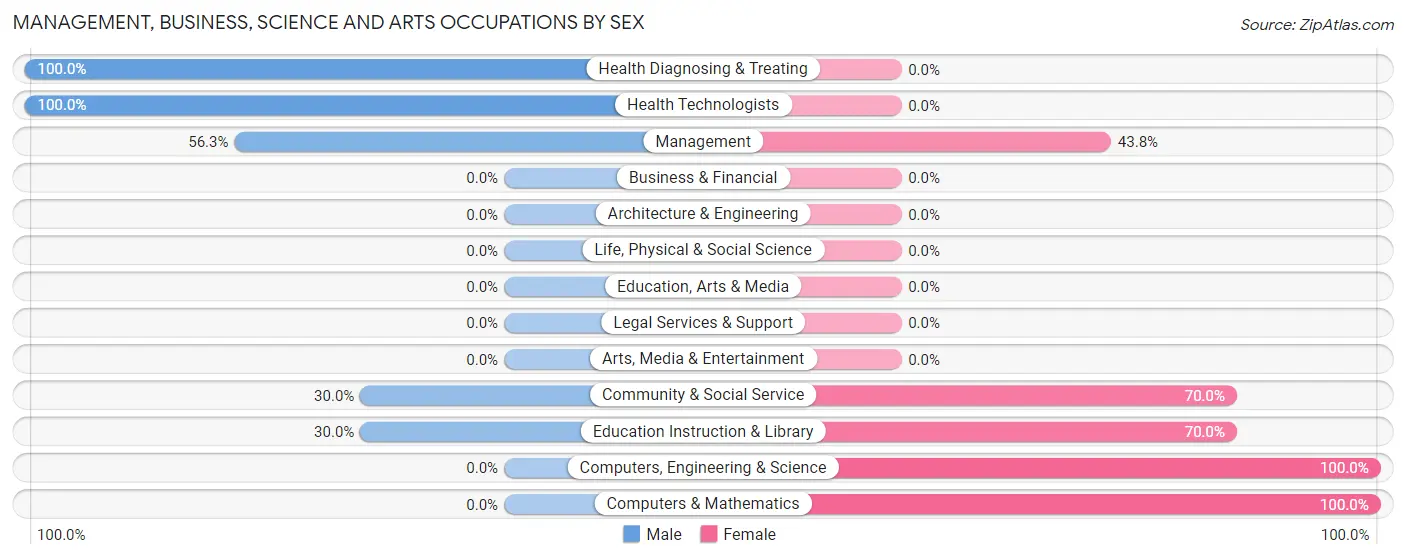
| Occupation | Male | Female |
| Management | 18 (56.2%) | 14 (43.8%) |
| Business & Financial | 0 (0.0%) | 0 (0.0%) |
| Computers, Engineering & Science | 0 (0.0%) | 6 (100.0%) |
| Computers & Mathematics | 0 (0.0%) | 6 (100.0%) |
| Architecture & Engineering | 0 (0.0%) | 0 (0.0%) |
| Life, Physical & Social Science | 0 (0.0%) | 0 (0.0%) |
| Community & Social Service | 9 (30.0%) | 21 (70.0%) |
| Education, Arts & Media | 0 (0.0%) | 0 (0.0%) |
| Legal Services & Support | 0 (0.0%) | 0 (0.0%) |
| Education Instruction & Library | 9 (30.0%) | 21 (70.0%) |
| Arts, Media & Entertainment | 0 (0.0%) | 0 (0.0%) |
| Health Diagnosing & Treating | 6 (100.0%) | 0 (0.0%) |
| Health Technologists | 6 (100.0%) | 0 (0.0%) |
| Total (Category) | 33 (44.6%) | 41 (55.4%) |
| Total (Overall) | 63 (48.1%) | 68 (51.9%) |
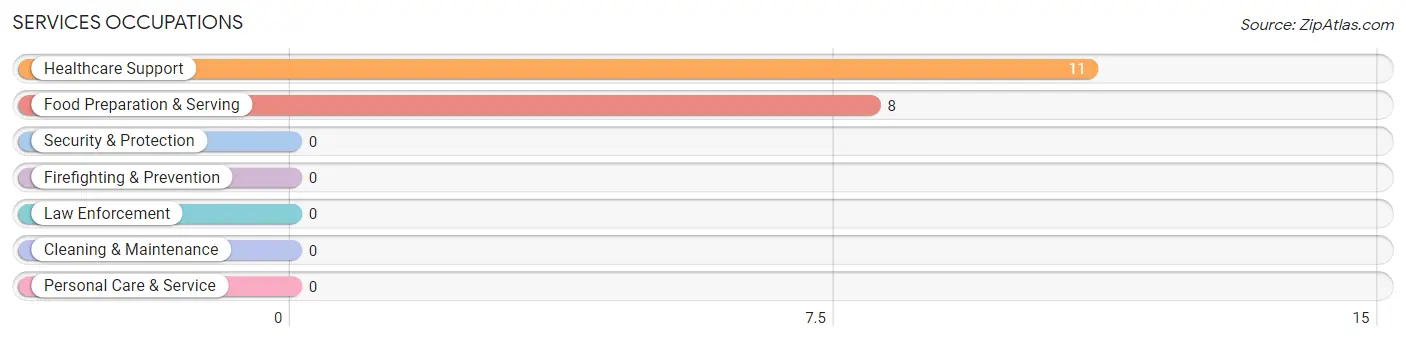
Services Occupations
The most common Services occupations in Ulen are Healthcare Support (11 | 8.4%), and Food Preparation & Serving (8 | 6.1%).
Services Occupations by Sex
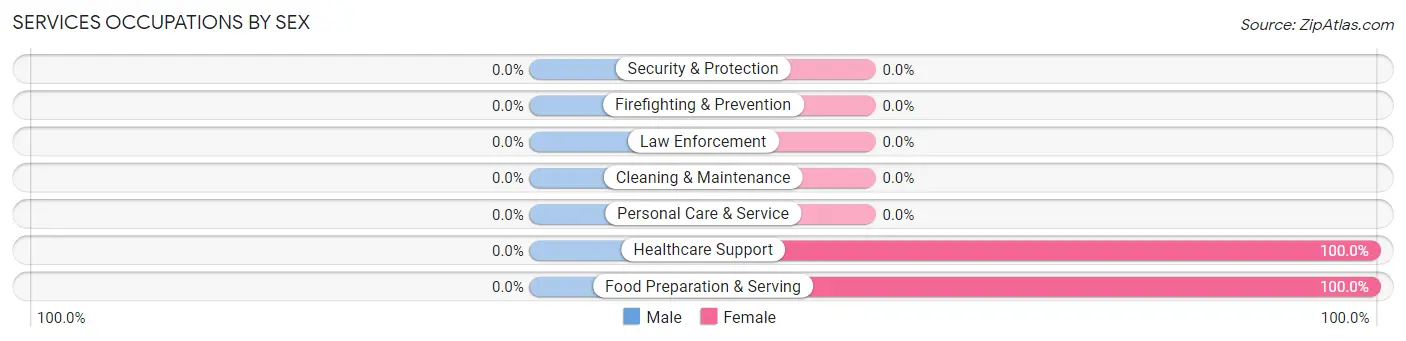
| Occupation | Male | Female |
| Healthcare Support | 0 (0.0%) | 11 (100.0%) |
| Security & Protection | 0 (0.0%) | 0 (0.0%) |
| Firefighting & Prevention | 0 (0.0%) | 0 (0.0%) |
| Law Enforcement | 0 (0.0%) | 0 (0.0%) |
| Food Preparation & Serving | 0 (0.0%) | 8 (100.0%) |
| Cleaning & Maintenance | 0 (0.0%) | 0 (0.0%) |
| Personal Care & Service | 0 (0.0%) | 0 (0.0%) |
| Total (Category) | 0 (0.0%) | 19 (100.0%) |
| Total (Overall) | 63 (48.1%) | 68 (51.9%) |
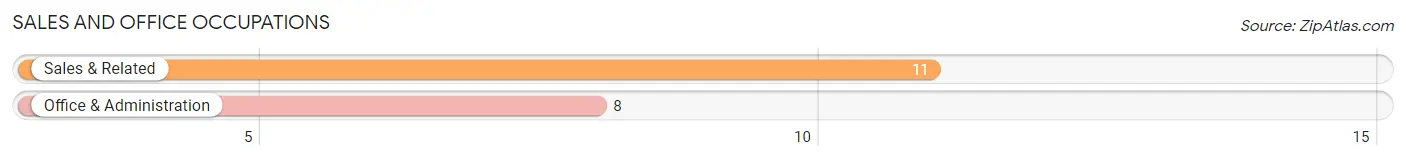
Sales and Office Occupations
The most common Sales and Office occupations in Ulen are Sales & Related (11 | 8.4%), and Office & Administration (8 | 6.1%).
Sales and Office Occupations by Sex

| Occupation | Male | Female |
| Sales & Related | 11 (100.0%) | 0 (0.0%) |
| Office & Administration | 0 (0.0%) | 8 (100.0%) |
| Total (Category) | 11 (57.9%) | 8 (42.1%) |
| Total (Overall) | 63 (48.1%) | 68 (51.9%) |
Natural Resources, Construction and Maintenance Occupations
The most common Natural Resources, Construction and Maintenance occupations in Ulen are , and Construction & Extraction (7 | 5.3%).
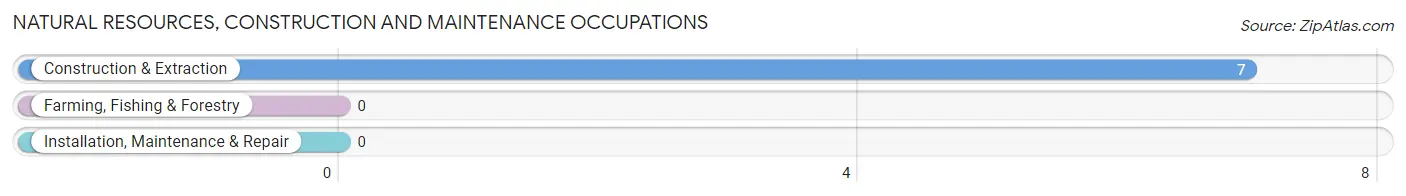
Natural Resources, Construction and Maintenance Occupations by Sex

| Occupation | Male | Female |
| Farming, Fishing & Forestry | 0 (0.0%) | 0 (0.0%) |
| Construction & Extraction | 7 (100.0%) | 0 (0.0%) |
| Installation, Maintenance & Repair | 0 (0.0%) | 0 (0.0%) |
| Total (Category) | 7 (100.0%) | 0 (0.0%) |
| Total (Overall) | 63 (48.1%) | 68 (51.9%) |
Production, Transportation and Moving Occupations
The most common Production, Transportation and Moving occupations in Ulen are Production (10 | 7.6%), and Transportation (2 | 1.5%).
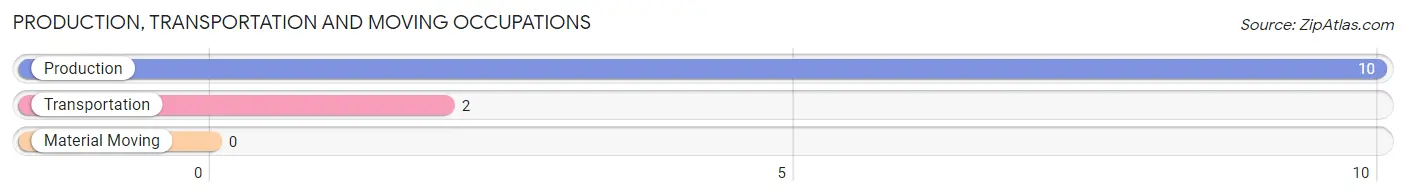
Production, Transportation and Moving Occupations by Sex
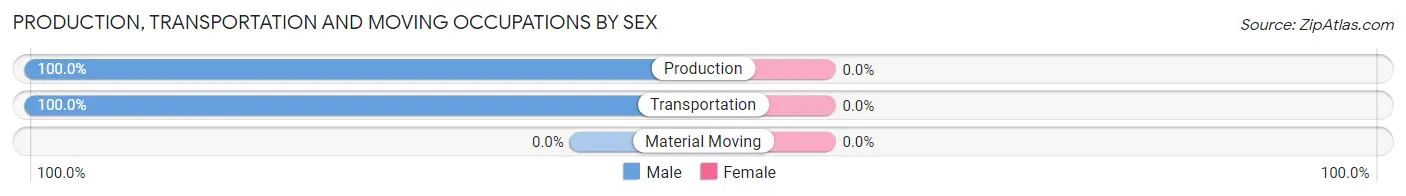
| Occupation | Male | Female |
| Production | 10 (100.0%) | 0 (0.0%) |
| Transportation | 2 (100.0%) | 0 (0.0%) |
| Material Moving | 0 (0.0%) | 0 (0.0%) |
| Total (Category) | 12 (100.0%) | 0 (0.0%) |
| Total (Overall) | 63 (48.1%) | 68 (51.9%) |
Employment Industries by Sex in Ulen
Employment Industries in Ulen
The major employment industries in Ulen include Educational Services (36 | 27.5%), Health Care & Social Assistance (23 | 17.6%), Finance & Insurance (15 | 11.5%), Construction (13 | 9.9%), and Retail Trade (11 | 8.4%).
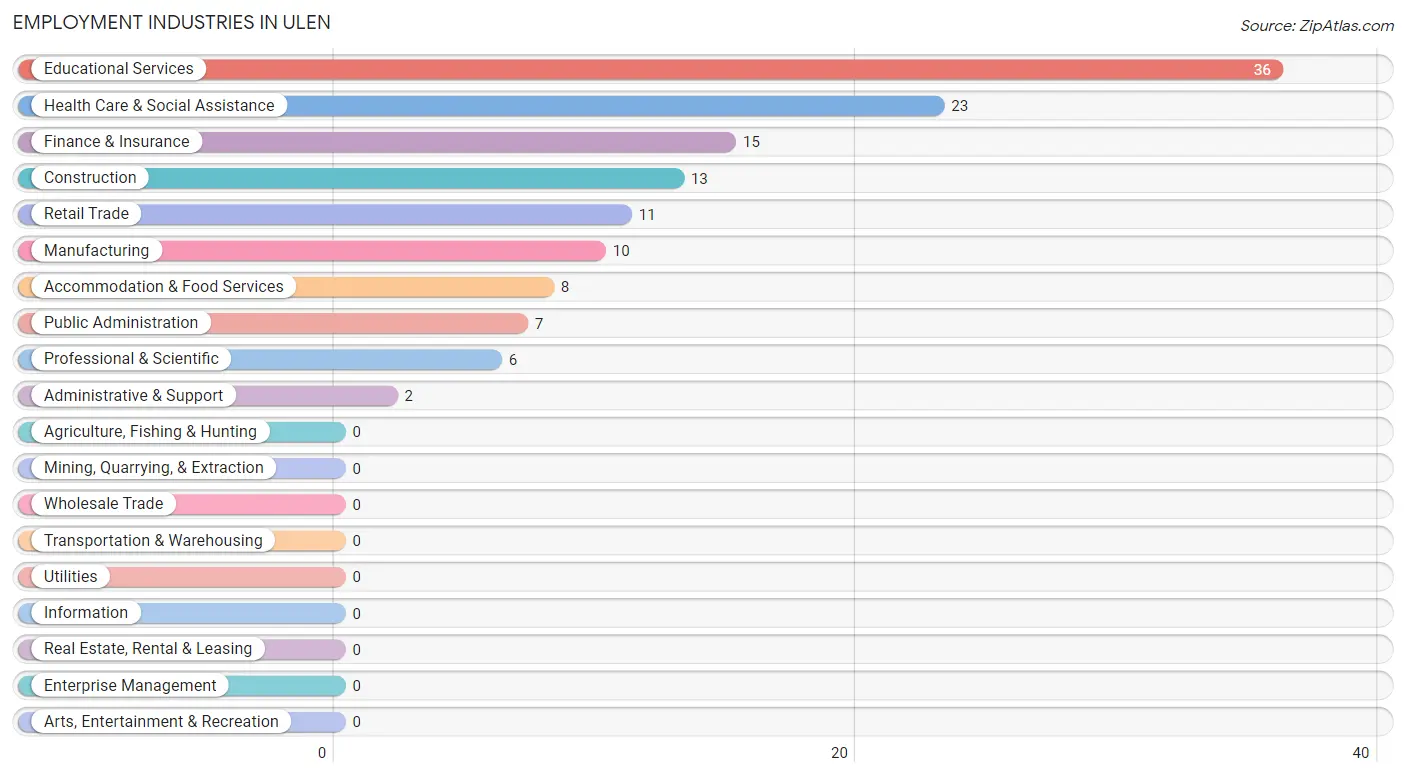
Employment Industries by Sex in Ulen
The Ulen industries that see more men than women are Construction (100.0%), Manufacturing (100.0%), and Retail Trade (100.0%), whereas the industries that tend to have a higher number of women are Professional & Scientific (100.0%), Accommodation & Food Services (100.0%), and Educational Services (75.0%).
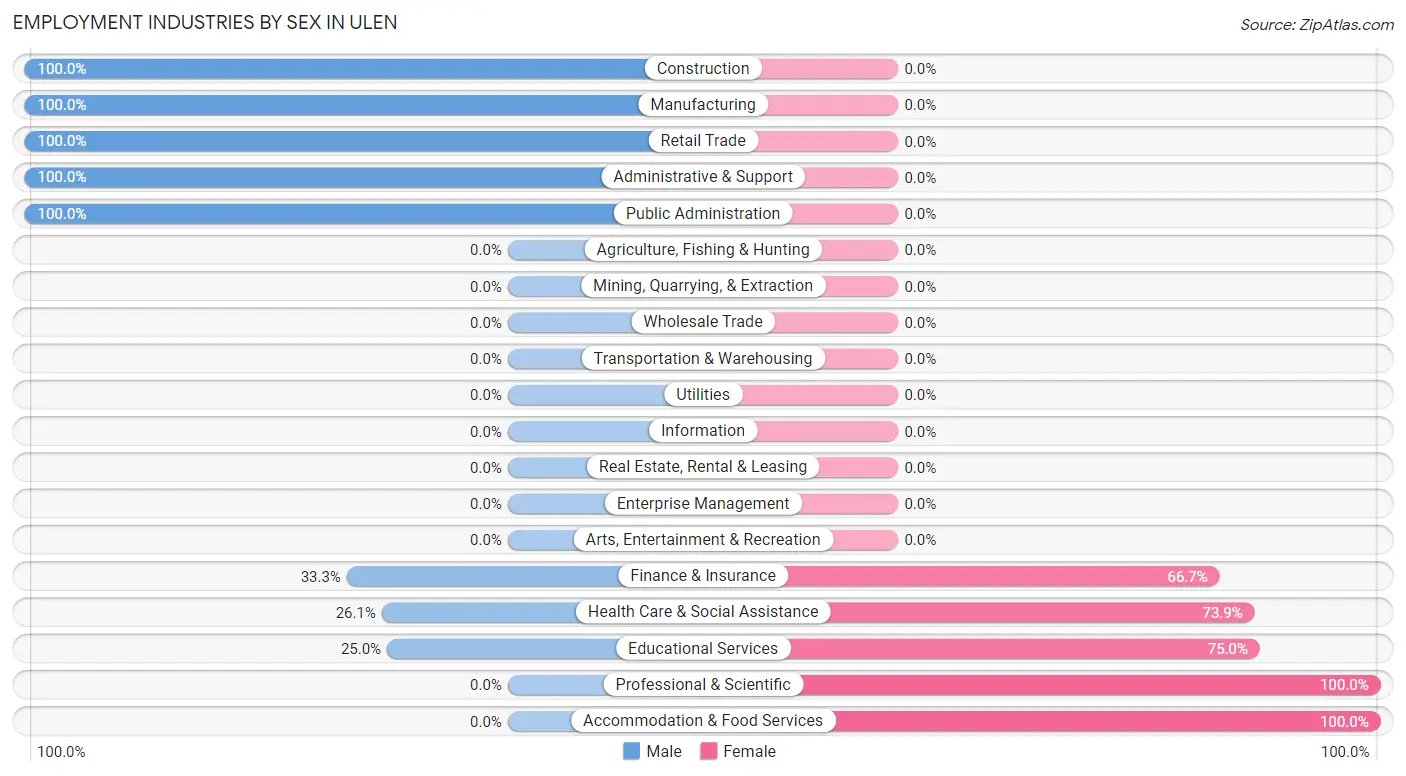
| Industry | Male | Female |
| Agriculture, Fishing & Hunting | 0 (0.0%) | 0 (0.0%) |
| Mining, Quarrying, & Extraction | 0 (0.0%) | 0 (0.0%) |
| Construction | 13 (100.0%) | 0 (0.0%) |
| Manufacturing | 10 (100.0%) | 0 (0.0%) |
| Wholesale Trade | 0 (0.0%) | 0 (0.0%) |
| Retail Trade | 11 (100.0%) | 0 (0.0%) |
| Transportation & Warehousing | 0 (0.0%) | 0 (0.0%) |
| Utilities | 0 (0.0%) | 0 (0.0%) |
| Information | 0 (0.0%) | 0 (0.0%) |
| Finance & Insurance | 5 (33.3%) | 10 (66.7%) |
| Real Estate, Rental & Leasing | 0 (0.0%) | 0 (0.0%) |
| Professional & Scientific | 0 (0.0%) | 6 (100.0%) |
| Enterprise Management | 0 (0.0%) | 0 (0.0%) |
| Administrative & Support | 2 (100.0%) | 0 (0.0%) |
| Educational Services | 9 (25.0%) | 27 (75.0%) |
| Health Care & Social Assistance | 6 (26.1%) | 17 (73.9%) |
| Arts, Entertainment & Recreation | 0 (0.0%) | 0 (0.0%) |
| Accommodation & Food Services | 0 (0.0%) | 8 (100.0%) |
| Public Administration | 7 (100.0%) | 0 (0.0%) |
| Total | 63 (48.1%) | 68 (51.9%) |
Education in Ulen
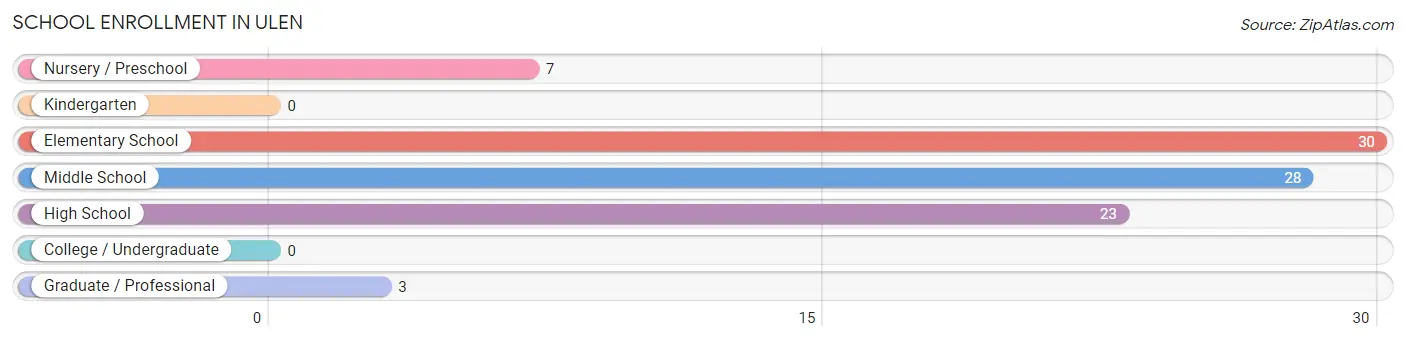
School Enrollment in Ulen
The most common levels of schooling among the 91 students in Ulen are elementary school (30 | 33.0%), middle school (28 | 30.8%), and high school (23 | 25.3%).
| School Level | # Students | % Students |
| Nursery / Preschool | 7 | 7.7% |
| Kindergarten | 0 | 0.0% |
| Elementary School | 30 | 33.0% |
| Middle School | 28 | 30.8% |
| High School | 23 | 25.3% |
| College / Undergraduate | 0 | 0.0% |
| Graduate / Professional | 3 | 3.3% |
| Total | 91 | 100.0% |
School Enrollment by Age by Funding Source in Ulen
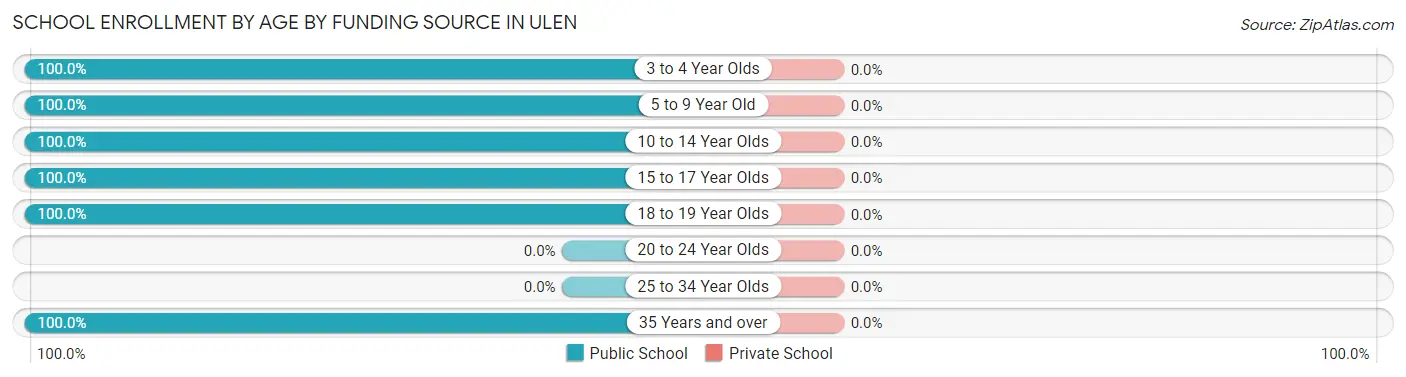
| Age Bracket | Public School | Private School |
| 3 to 4 Year Olds | 7 (100.0%) | 0 (0.0%) |
| 5 to 9 Year Old | 17 (100.0%) | 0 (0.0%) |
| 10 to 14 Year Olds | 41 (100.0%) | 0 (0.0%) |
| 15 to 17 Year Olds | 18 (100.0%) | 0 (0.0%) |
| 18 to 19 Year Olds | 5 (100.0%) | 0 (0.0%) |
| 20 to 24 Year Olds | 0 (0.0%) | 0 (0.0%) |
| 25 to 34 Year Olds | 0 (0.0%) | 0 (0.0%) |
| 35 Years and over | 3 (100.0%) | 0 (0.0%) |
| Total | 91 (100.0%) | 0 (0.0%) |
Educational Attainment by Field of Study in Ulen
Education (28 | 48.3%), business (11 | 19.0%), liberal arts & history (11 | 19.0%), and engineering (8 | 13.8%) are the most common fields of study among 58 individuals in Ulen who have obtained a bachelor's degree or higher.
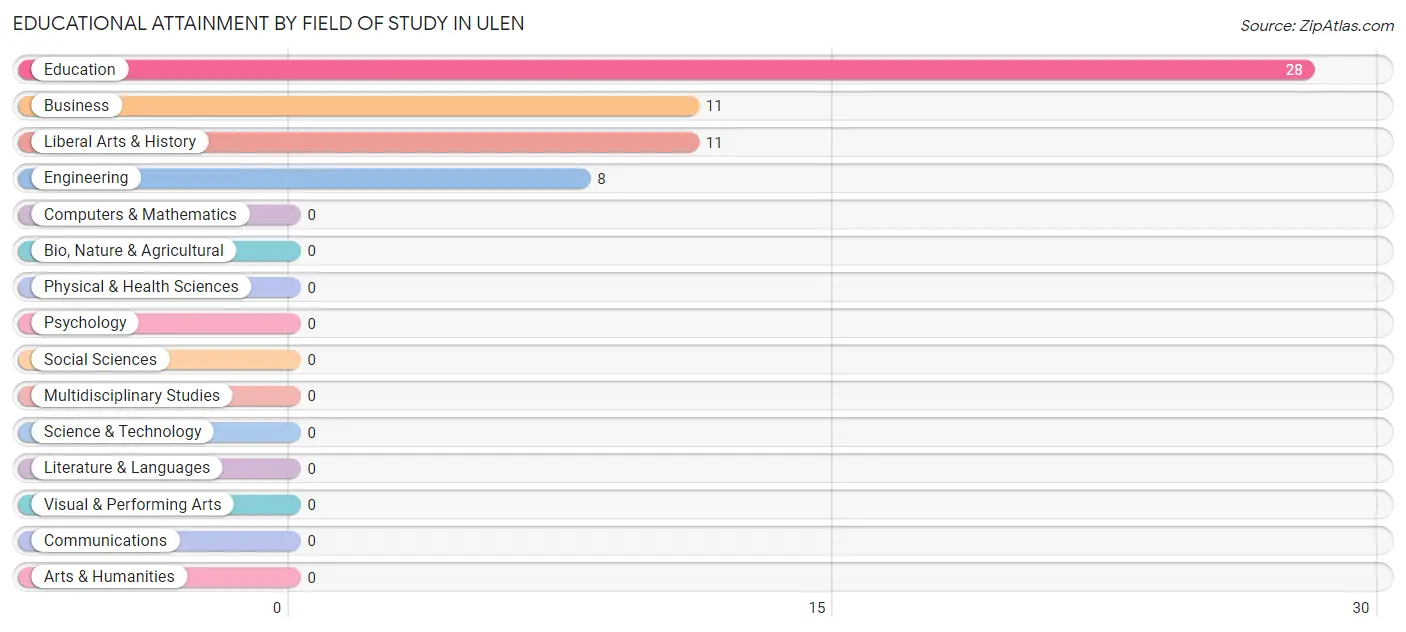
| Field of Study | # Graduates | % Graduates |
| Computers & Mathematics | 0 | 0.0% |
| Bio, Nature & Agricultural | 0 | 0.0% |
| Physical & Health Sciences | 0 | 0.0% |
| Psychology | 0 | 0.0% |
| Social Sciences | 0 | 0.0% |
| Engineering | 8 | 13.8% |
| Multidisciplinary Studies | 0 | 0.0% |
| Science & Technology | 0 | 0.0% |
| Business | 11 | 19.0% |
| Education | 28 | 48.3% |
| Literature & Languages | 0 | 0.0% |
| Liberal Arts & History | 11 | 19.0% |
| Visual & Performing Arts | 0 | 0.0% |
| Communications | 0 | 0.0% |
| Arts & Humanities | 0 | 0.0% |
| Total | 58 | 100.0% |
Transportation & Commute in Ulen
Vehicle Availability by Sex in Ulen
The most prevalent vehicle ownership categories in Ulen are males with 2 vehicles (39, accounting for 61.9%) and females with 2 vehicles (18, making up 76.5%).
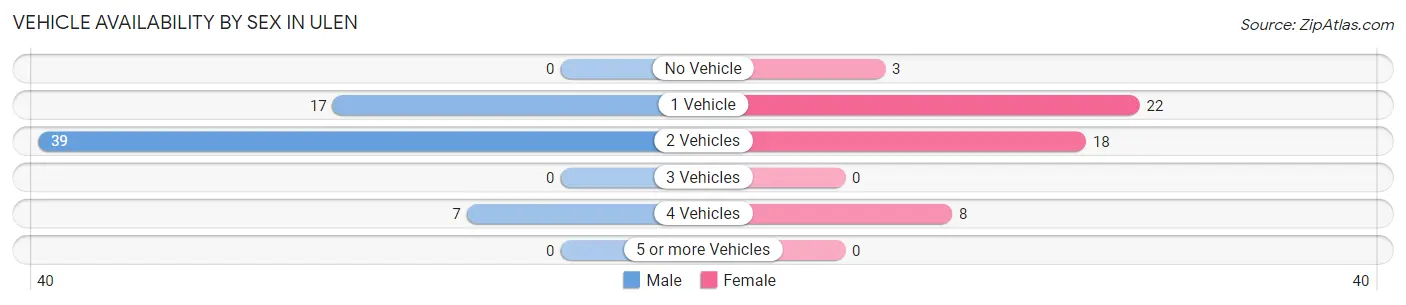
| Vehicles Available | Male | Female |
| No Vehicle | 0 (0.0%) | 3 (5.9%) |
| 1 Vehicle | 17 (27.0%) | 22 (43.1%) |
| 2 Vehicles | 39 (61.9%) | 18 (35.3%) |
| 3 Vehicles | 0 (0.0%) | 0 (0.0%) |
| 4 Vehicles | 7 (11.1%) | 8 (15.7%) |
| 5 or more Vehicles | 0 (0.0%) | 0 (0.0%) |
| Total | 63 (100.0%) | 51 (100.0%) |
Commute Time in Ulen
The most frequently occuring commute durations in Ulen are less than 5 minutes (40 commuters, 35.1%), 5 to 9 minutes (22 commuters, 19.3%), and 45 to 59 minutes (16 commuters, 14.0%).
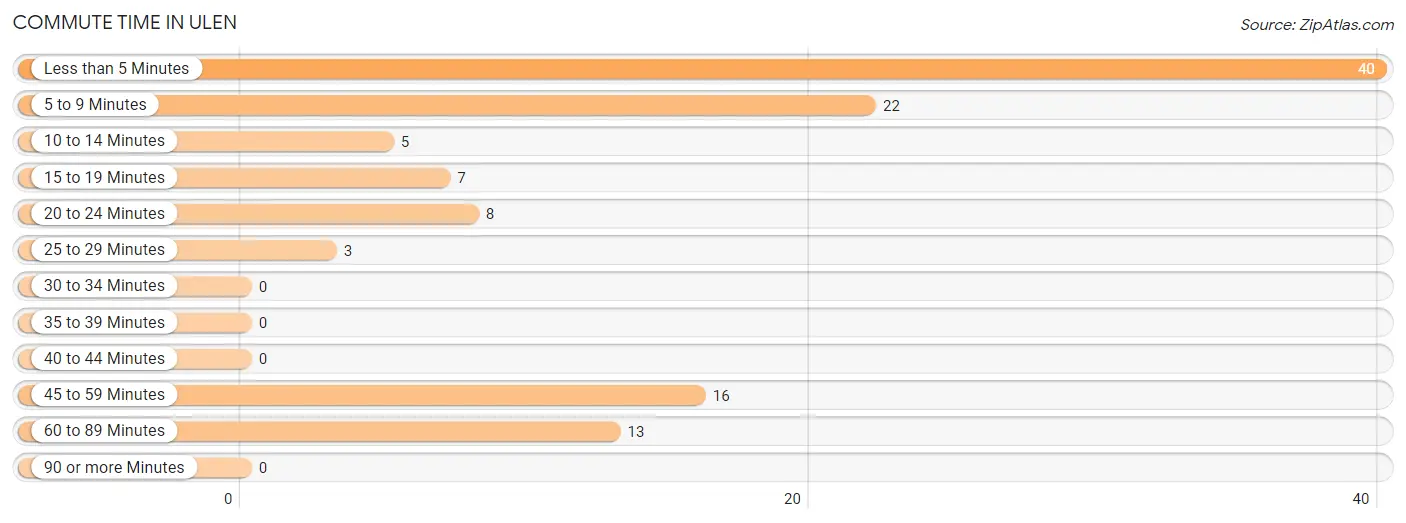
| Commute Time | # Commuters | % Commuters |
| Less than 5 Minutes | 40 | 35.1% |
| 5 to 9 Minutes | 22 | 19.3% |
| 10 to 14 Minutes | 5 | 4.4% |
| 15 to 19 Minutes | 7 | 6.1% |
| 20 to 24 Minutes | 8 | 7.0% |
| 25 to 29 Minutes | 3 | 2.6% |
| 30 to 34 Minutes | 0 | 0.0% |
| 35 to 39 Minutes | 0 | 0.0% |
| 40 to 44 Minutes | 0 | 0.0% |
| 45 to 59 Minutes | 16 | 14.0% |
| 60 to 89 Minutes | 13 | 11.4% |
| 90 or more Minutes | 0 | 0.0% |
Commute Time by Sex in Ulen
The most common commute times in Ulen are 45 to 59 minutes (16 commuters, 25.4%) for males and less than 5 minutes (27 commuters, 52.9%) for females.
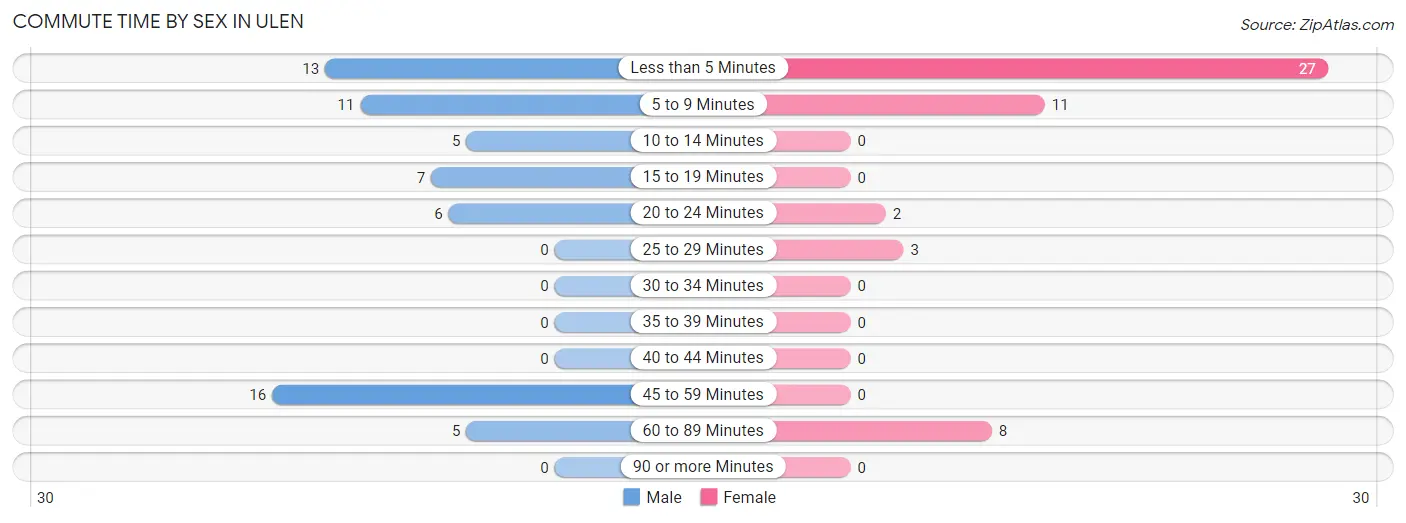
| Commute Time | Male | Female |
| Less than 5 Minutes | 13 (20.6%) | 27 (52.9%) |
| 5 to 9 Minutes | 11 (17.5%) | 11 (21.6%) |
| 10 to 14 Minutes | 5 (7.9%) | 0 (0.0%) |
| 15 to 19 Minutes | 7 (11.1%) | 0 (0.0%) |
| 20 to 24 Minutes | 6 (9.5%) | 2 (3.9%) |
| 25 to 29 Minutes | 0 (0.0%) | 3 (5.9%) |
| 30 to 34 Minutes | 0 (0.0%) | 0 (0.0%) |
| 35 to 39 Minutes | 0 (0.0%) | 0 (0.0%) |
| 40 to 44 Minutes | 0 (0.0%) | 0 (0.0%) |
| 45 to 59 Minutes | 16 (25.4%) | 0 (0.0%) |
| 60 to 89 Minutes | 5 (7.9%) | 8 (15.7%) |
| 90 or more Minutes | 0 (0.0%) | 0 (0.0%) |
Time of Departure to Work by Sex in Ulen
The most frequent times of departure to work in Ulen are 6:30 AM to 6:59 AM (22, 34.9%) for males and 7:30 AM to 7:59 AM (29, 56.9%) for females.
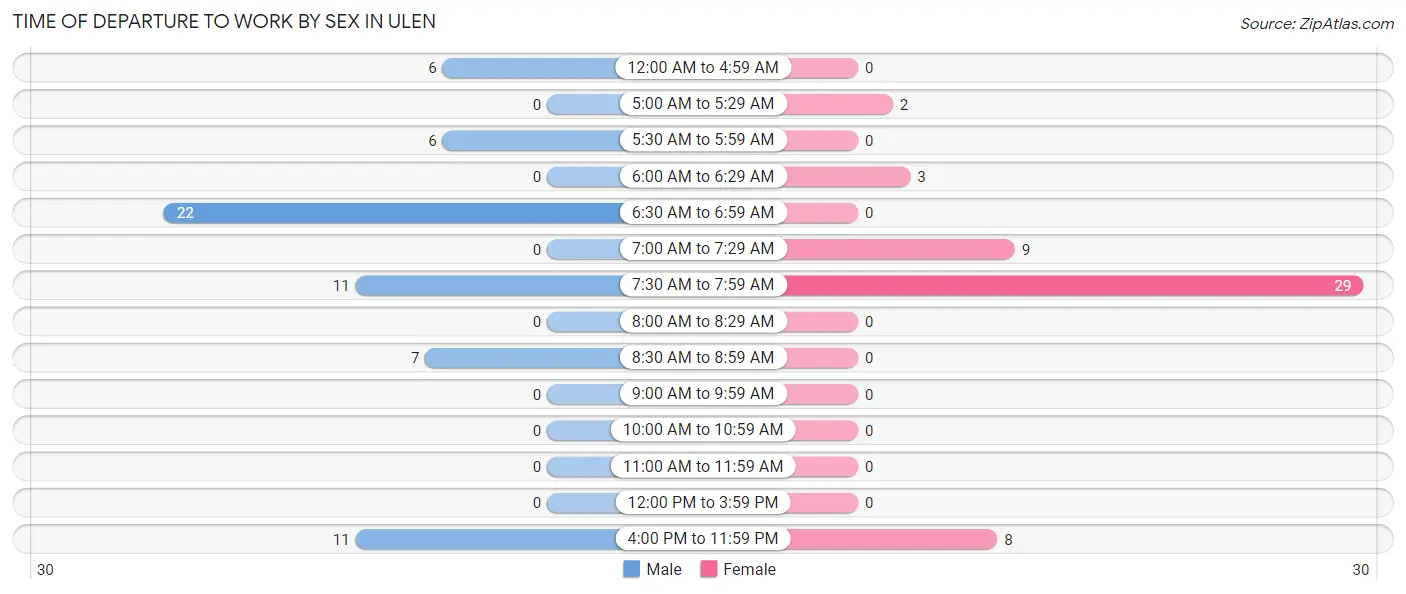
| Time of Departure | Male | Female |
| 12:00 AM to 4:59 AM | 6 (9.5%) | 0 (0.0%) |
| 5:00 AM to 5:29 AM | 0 (0.0%) | 2 (3.9%) |
| 5:30 AM to 5:59 AM | 6 (9.5%) | 0 (0.0%) |
| 6:00 AM to 6:29 AM | 0 (0.0%) | 3 (5.9%) |
| 6:30 AM to 6:59 AM | 22 (34.9%) | 0 (0.0%) |
| 7:00 AM to 7:29 AM | 0 (0.0%) | 9 (17.6%) |
| 7:30 AM to 7:59 AM | 11 (17.5%) | 29 (56.9%) |
| 8:00 AM to 8:29 AM | 0 (0.0%) | 0 (0.0%) |
| 8:30 AM to 8:59 AM | 7 (11.1%) | 0 (0.0%) |
| 9:00 AM to 9:59 AM | 0 (0.0%) | 0 (0.0%) |
| 10:00 AM to 10:59 AM | 0 (0.0%) | 0 (0.0%) |
| 11:00 AM to 11:59 AM | 0 (0.0%) | 0 (0.0%) |
| 12:00 PM to 3:59 PM | 0 (0.0%) | 0 (0.0%) |
| 4:00 PM to 11:59 PM | 11 (17.5%) | 8 (15.7%) |
| Total | 63 (100.0%) | 51 (100.0%) |
Housing Occupancy in Ulen
Occupancy by Ownership in Ulen
Of the total 213 dwellings in Ulen, owner-occupied units account for 141 (66.2%), while renter-occupied units make up 72 (33.8%).
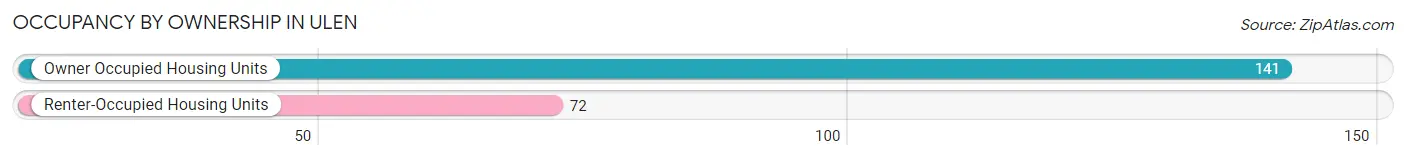
| Occupancy | # Housing Units | % Housing Units |
| Owner Occupied Housing Units | 141 | 66.2% |
| Renter-Occupied Housing Units | 72 | 33.8% |
| Total Occupied Housing Units | 213 | 100.0% |
Occupancy by Household Size in Ulen
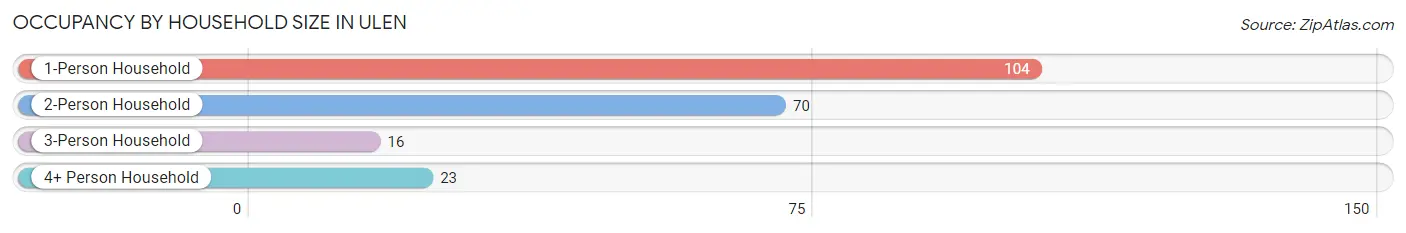
| Household Size | # Housing Units | % Housing Units |
| 1-Person Household | 104 | 48.8% |
| 2-Person Household | 70 | 32.9% |
| 3-Person Household | 16 | 7.5% |
| 4+ Person Household | 23 | 10.8% |
| Total Housing Units | 213 | 100.0% |
Occupancy by Ownership by Household Size in Ulen
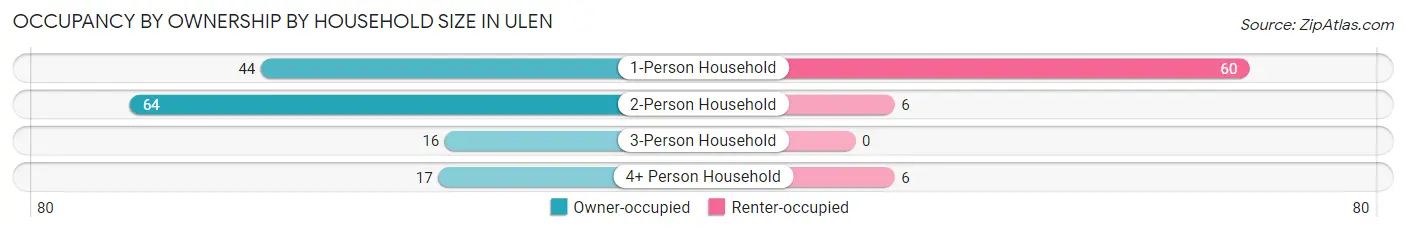
| Household Size | Owner-occupied | Renter-occupied |
| 1-Person Household | 44 (42.3%) | 60 (57.7%) |
| 2-Person Household | 64 (91.4%) | 6 (8.6%) |
| 3-Person Household | 16 (100.0%) | 0 (0.0%) |
| 4+ Person Household | 17 (73.9%) | 6 (26.1%) |
| Total Housing Units | 141 (66.2%) | 72 (33.8%) |
Occupancy by Educational Attainment in Ulen
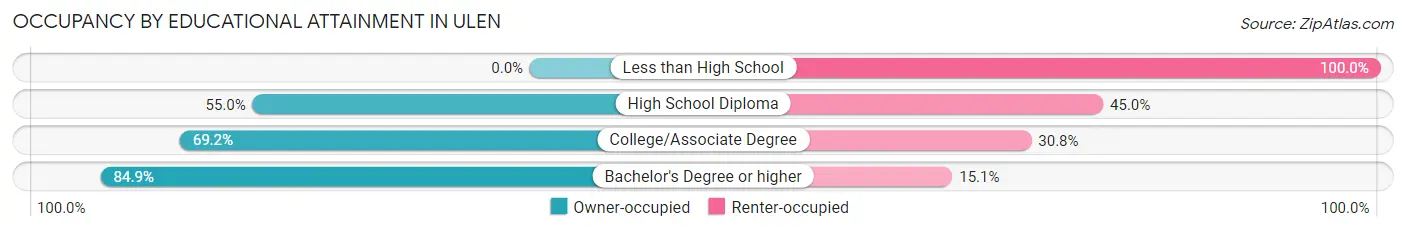
| Household Size | Owner-occupied | Renter-occupied |
| Less than High School | 0 (0.0%) | 9 (100.0%) |
| High School Diploma | 33 (55.0%) | 27 (45.0%) |
| College/Associate Degree | 63 (69.2%) | 28 (30.8%) |
| Bachelor's Degree or higher | 45 (84.9%) | 8 (15.1%) |
Occupancy by Age of Householder in Ulen
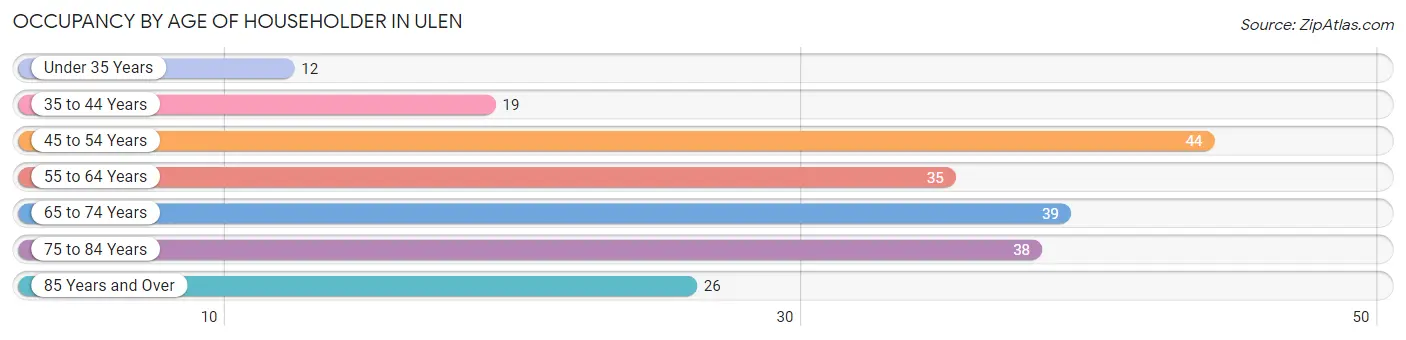
| Age Bracket | # Households | % Households |
| Under 35 Years | 12 | 5.6% |
| 35 to 44 Years | 19 | 8.9% |
| 45 to 54 Years | 44 | 20.7% |
| 55 to 64 Years | 35 | 16.4% |
| 65 to 74 Years | 39 | 18.3% |
| 75 to 84 Years | 38 | 17.8% |
| 85 Years and Over | 26 | 12.2% |
| Total | 213 | 100.0% |
Housing Finances in Ulen
Median Income by Occupancy in Ulen
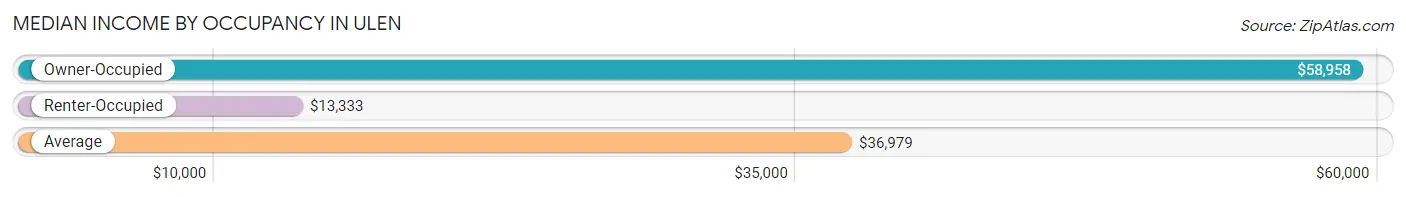
| Occupancy Type | # Households | Median Income |
| Owner-Occupied | 141 (66.2%) | $58,958 |
| Renter-Occupied | 72 (33.8%) | $13,333 |
| Average | 213 (100.0%) | $36,979 |
Occupancy by Householder Income Bracket in Ulen
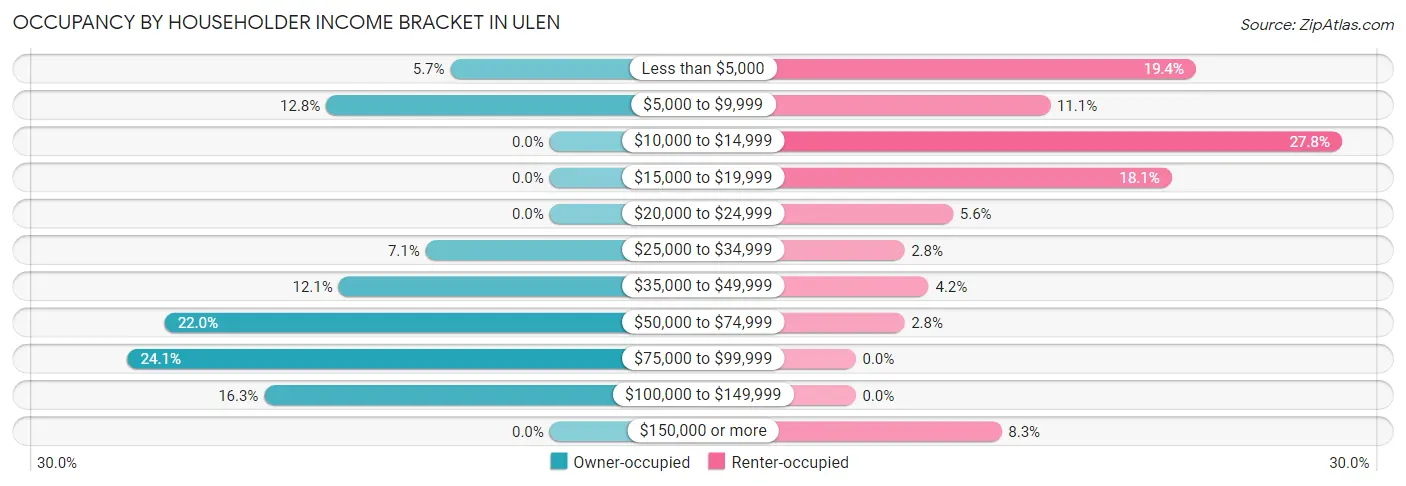
| Income Bracket | Owner-occupied | Renter-occupied |
| Less than $5,000 | 8 (5.7%) | 14 (19.4%) |
| $5,000 to $9,999 | 18 (12.8%) | 8 (11.1%) |
| $10,000 to $14,999 | 0 (0.0%) | 20 (27.8%) |
| $15,000 to $19,999 | 0 (0.0%) | 13 (18.1%) |
| $20,000 to $24,999 | 0 (0.0%) | 4 (5.6%) |
| $25,000 to $34,999 | 10 (7.1%) | 2 (2.8%) |
| $35,000 to $49,999 | 17 (12.1%) | 3 (4.2%) |
| $50,000 to $74,999 | 31 (22.0%) | 2 (2.8%) |
| $75,000 to $99,999 | 34 (24.1%) | 0 (0.0%) |
| $100,000 to $149,999 | 23 (16.3%) | 0 (0.0%) |
| $150,000 or more | 0 (0.0%) | 6 (8.3%) |
| Total | 141 (100.0%) | 72 (100.0%) |
Monthly Housing Cost Tiers in Ulen
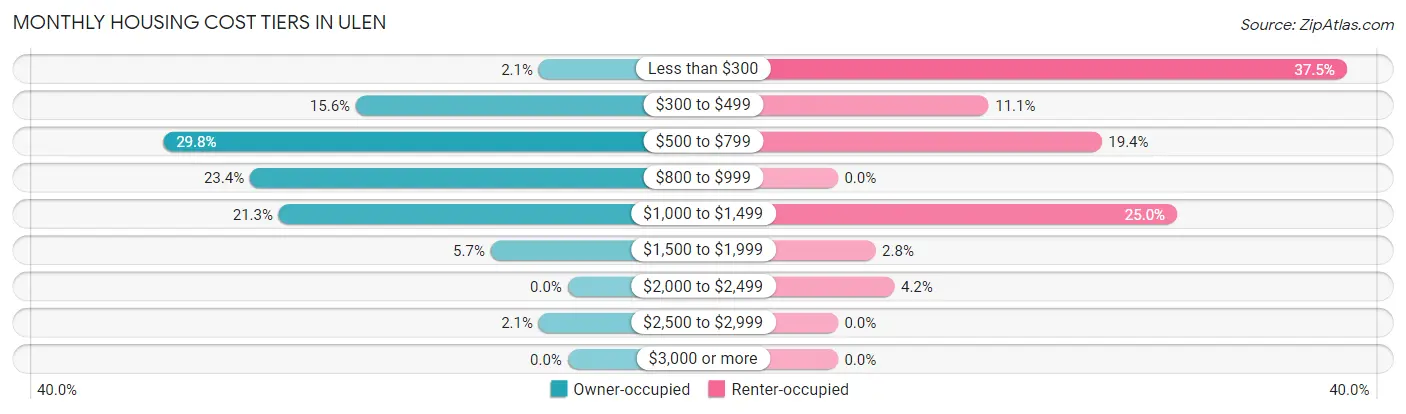
| Monthly Cost | Owner-occupied | Renter-occupied |
| Less than $300 | 3 (2.1%) | 27 (37.5%) |
| $300 to $499 | 22 (15.6%) | 8 (11.1%) |
| $500 to $799 | 42 (29.8%) | 14 (19.4%) |
| $800 to $999 | 33 (23.4%) | 0 (0.0%) |
| $1,000 to $1,499 | 30 (21.3%) | 18 (25.0%) |
| $1,500 to $1,999 | 8 (5.7%) | 2 (2.8%) |
| $2,000 to $2,499 | 0 (0.0%) | 3 (4.2%) |
| $2,500 to $2,999 | 3 (2.1%) | 0 (0.0%) |
| $3,000 or more | 0 (0.0%) | 0 (0.0%) |
| Total | 141 (100.0%) | 72 (100.0%) |
Physical Housing Characteristics in Ulen
Housing Structures in Ulen
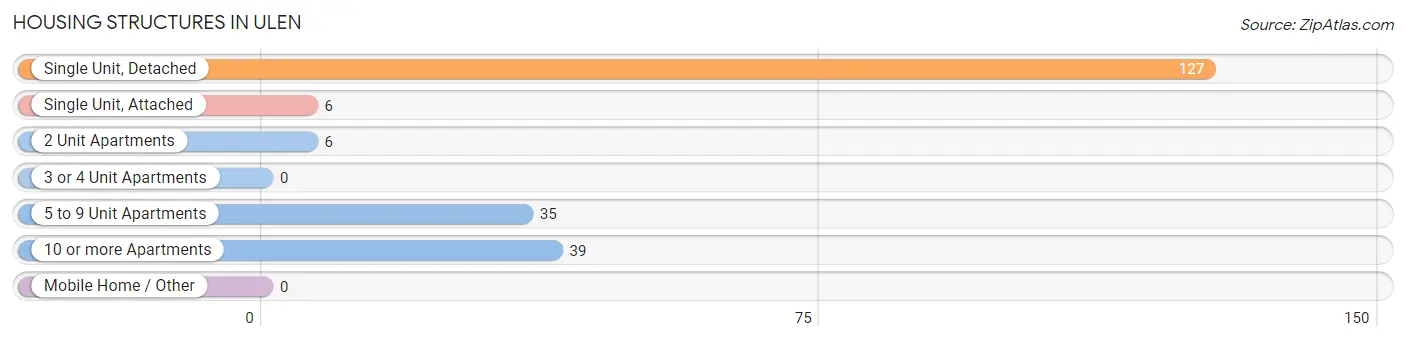
| Structure Type | # Housing Units | % Housing Units |
| Single Unit, Detached | 127 | 59.6% |
| Single Unit, Attached | 6 | 2.8% |
| 2 Unit Apartments | 6 | 2.8% |
| 3 or 4 Unit Apartments | 0 | 0.0% |
| 5 to 9 Unit Apartments | 35 | 16.4% |
| 10 or more Apartments | 39 | 18.3% |
| Mobile Home / Other | 0 | 0.0% |
| Total | 213 | 100.0% |
Housing Structures by Occupancy in Ulen
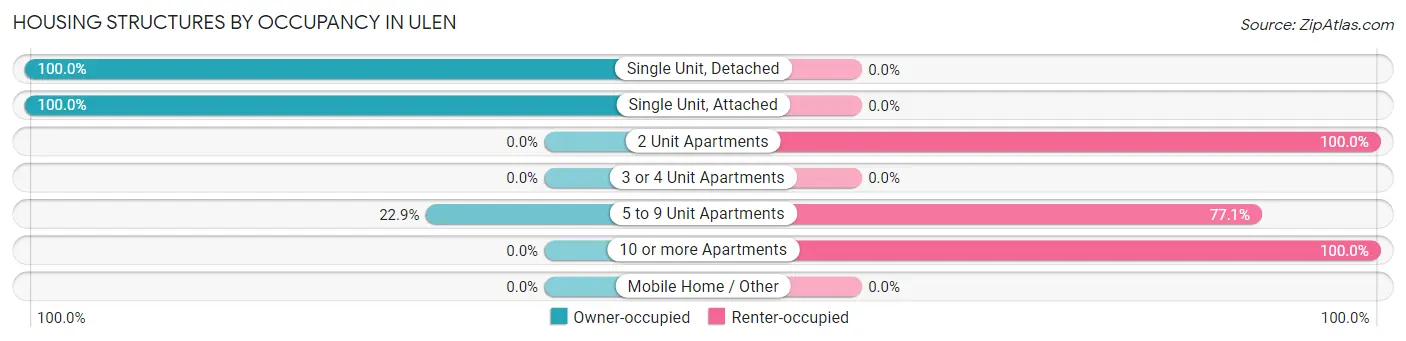
| Structure Type | Owner-occupied | Renter-occupied |
| Single Unit, Detached | 127 (100.0%) | 0 (0.0%) |
| Single Unit, Attached | 6 (100.0%) | 0 (0.0%) |
| 2 Unit Apartments | 0 (0.0%) | 6 (100.0%) |
| 3 or 4 Unit Apartments | 0 (0.0%) | 0 (0.0%) |
| 5 to 9 Unit Apartments | 8 (22.9%) | 27 (77.1%) |
| 10 or more Apartments | 0 (0.0%) | 39 (100.0%) |
| Mobile Home / Other | 0 (0.0%) | 0 (0.0%) |
| Total | 141 (66.2%) | 72 (33.8%) |
Housing Structures by Number of Rooms in Ulen
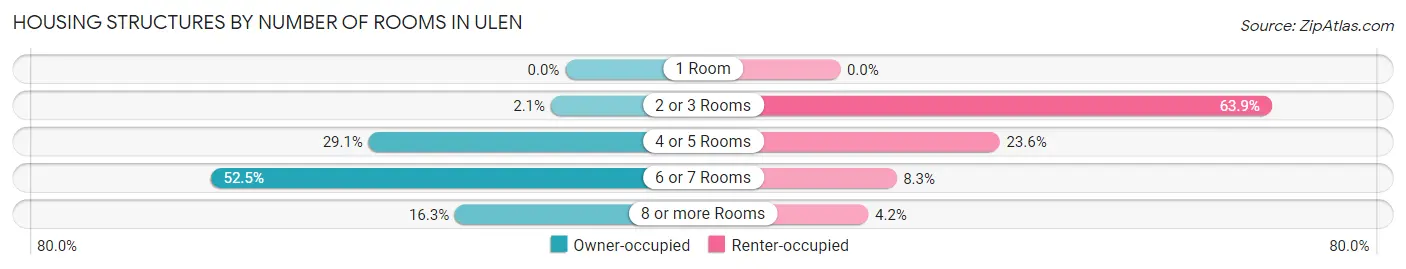
| Number of Rooms | Owner-occupied | Renter-occupied |
| 1 Room | 0 (0.0%) | 0 (0.0%) |
| 2 or 3 Rooms | 3 (2.1%) | 46 (63.9%) |
| 4 or 5 Rooms | 41 (29.1%) | 17 (23.6%) |
| 6 or 7 Rooms | 74 (52.5%) | 6 (8.3%) |
| 8 or more Rooms | 23 (16.3%) | 3 (4.2%) |
| Total | 141 (100.0%) | 72 (100.0%) |
Housing Structure by Heating Type in Ulen
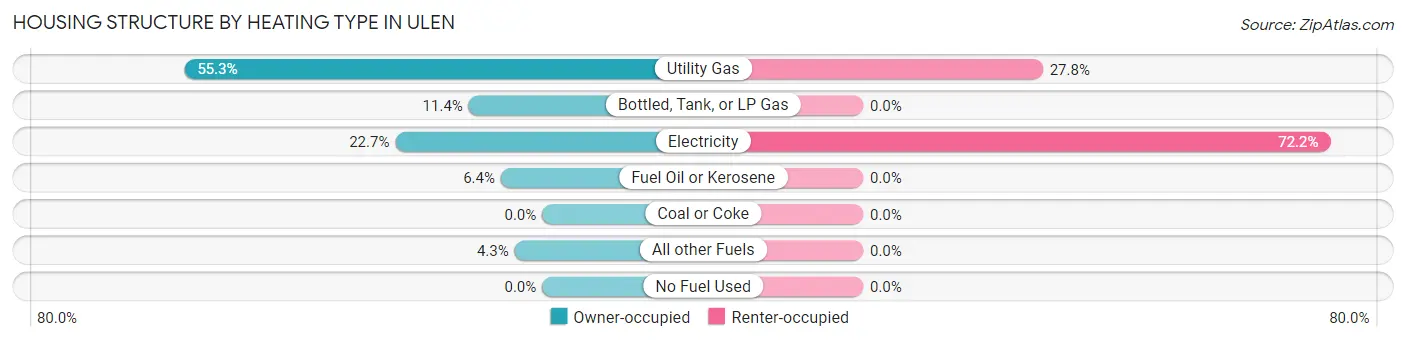
| Heating Type | Owner-occupied | Renter-occupied |
| Utility Gas | 78 (55.3%) | 20 (27.8%) |
| Bottled, Tank, or LP Gas | 16 (11.4%) | 0 (0.0%) |
| Electricity | 32 (22.7%) | 52 (72.2%) |
| Fuel Oil or Kerosene | 9 (6.4%) | 0 (0.0%) |
| Coal or Coke | 0 (0.0%) | 0 (0.0%) |
| All other Fuels | 6 (4.3%) | 0 (0.0%) |
| No Fuel Used | 0 (0.0%) | 0 (0.0%) |
| Total | 141 (100.0%) | 72 (100.0%) |
Household Vehicle Usage in Ulen
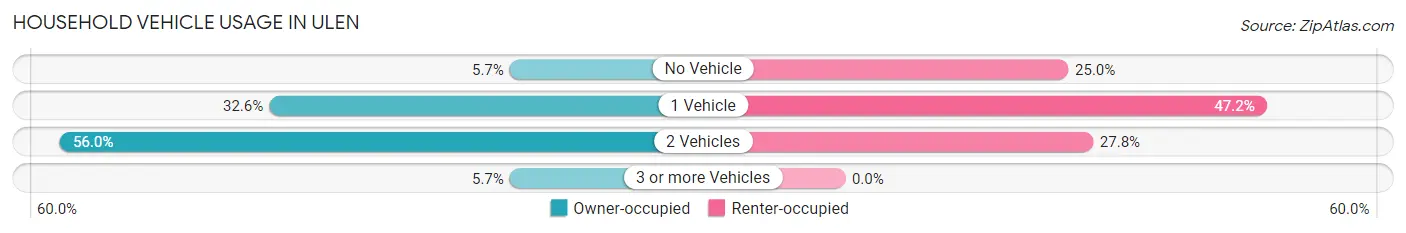
| Vehicles per Household | Owner-occupied | Renter-occupied |
| No Vehicle | 8 (5.7%) | 18 (25.0%) |
| 1 Vehicle | 46 (32.6%) | 34 (47.2%) |
| 2 Vehicles | 79 (56.0%) | 20 (27.8%) |
| 3 or more Vehicles | 8 (5.7%) | 0 (0.0%) |
| Total | 141 (100.0%) | 72 (100.0%) |
Real Estate & Mortgages in Ulen
Real Estate and Mortgage Overview in Ulen
| Characteristic | Without Mortgage | With Mortgage |
| Housing Units | 64 | 77 |
| Median Property Value | $97,100 | $154,700 |
| Median Household Income | $36,667 | $0 |
| Monthly Housing Costs | $528 | $0 |
| Real Estate Taxes | $1,435 | $11 |
Property Value by Mortgage Status in Ulen
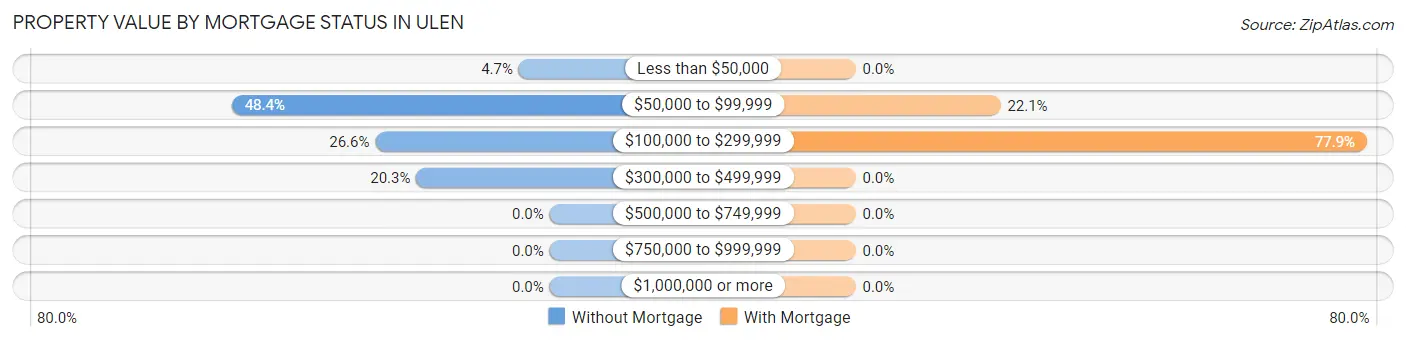
| Property Value | Without Mortgage | With Mortgage |
| Less than $50,000 | 3 (4.7%) | 0 (0.0%) |
| $50,000 to $99,999 | 31 (48.4%) | 17 (22.1%) |
| $100,000 to $299,999 | 17 (26.6%) | 60 (77.9%) |
| $300,000 to $499,999 | 13 (20.3%) | 0 (0.0%) |
| $500,000 to $749,999 | 0 (0.0%) | 0 (0.0%) |
| $750,000 to $999,999 | 0 (0.0%) | 0 (0.0%) |
| $1,000,000 or more | 0 (0.0%) | 0 (0.0%) |
| Total | 64 (100.0%) | 77 (100.0%) |
Household Income by Mortgage Status in Ulen
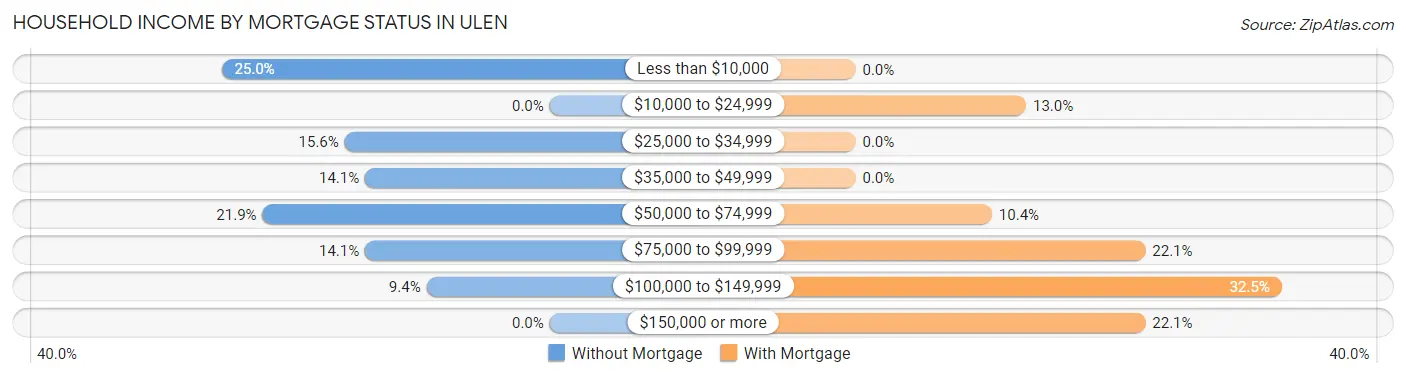
| Household Income | Without Mortgage | With Mortgage |
| Less than $10,000 | 16 (25.0%) | 0 (0.0%) |
| $10,000 to $24,999 | 0 (0.0%) | 10 (13.0%) |
| $25,000 to $34,999 | 10 (15.6%) | 0 (0.0%) |
| $35,000 to $49,999 | 9 (14.1%) | 0 (0.0%) |
| $50,000 to $74,999 | 14 (21.9%) | 8 (10.4%) |
| $75,000 to $99,999 | 9 (14.1%) | 17 (22.1%) |
| $100,000 to $149,999 | 6 (9.4%) | 25 (32.5%) |
| $150,000 or more | 0 (0.0%) | 17 (22.1%) |
| Total | 64 (100.0%) | 77 (100.0%) |
Property Value to Household Income Ratio in Ulen
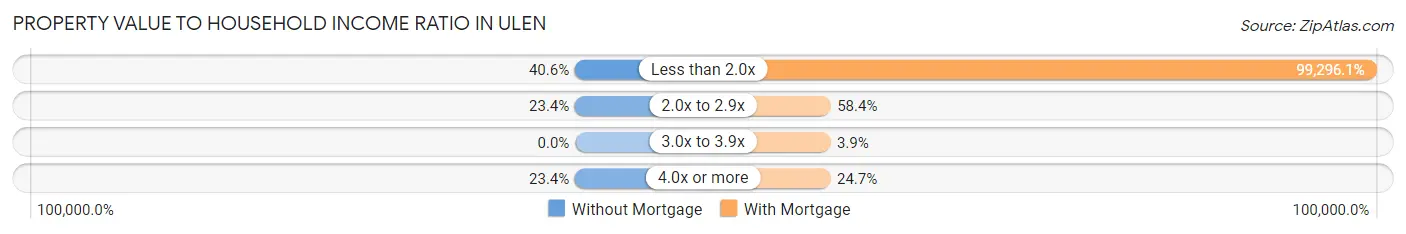
| Value-to-Income Ratio | Without Mortgage | With Mortgage |
| Less than 2.0x | 26 (40.6%) | 76,458 (99,296.1%) |
| 2.0x to 2.9x | 15 (23.4%) | 45 (58.4%) |
| 3.0x to 3.9x | 0 (0.0%) | 3 (3.9%) |
| 4.0x or more | 15 (23.4%) | 19 (24.7%) |
| Total | 64 (100.0%) | 77 (100.0%) |
Real Estate Taxes by Mortgage Status in Ulen
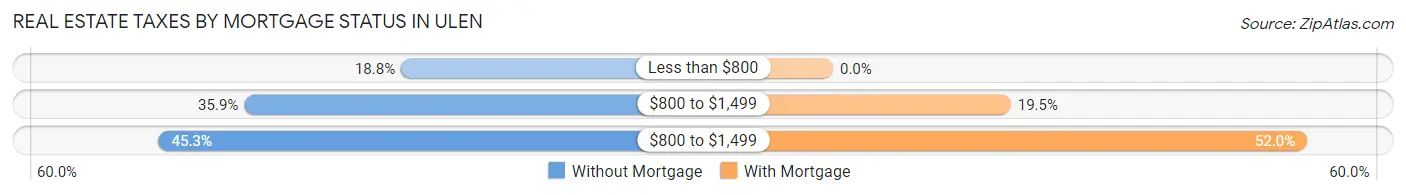
| Property Taxes | Without Mortgage | With Mortgage |
| Less than $800 | 12 (18.8%) | 0 (0.0%) |
| $800 to $1,499 | 23 (35.9%) | 15 (19.5%) |
| $800 to $1,499 | 29 (45.3%) | 40 (51.9%) |
| Total | 64 (100.0%) | 77 (100.0%) |
Health & Disability in Ulen
Health Insurance Coverage by Age in Ulen
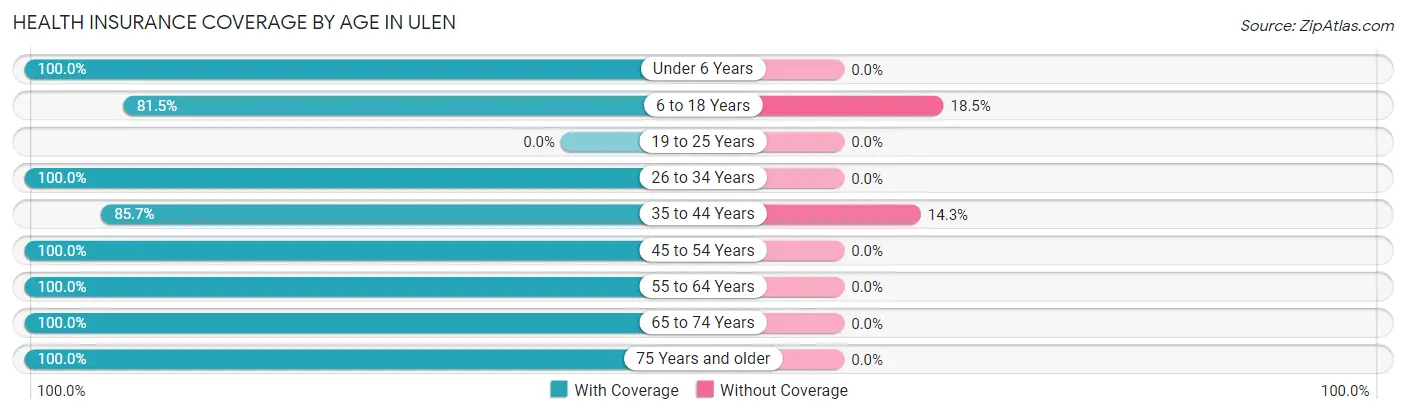
| Age Bracket | With Coverage | Without Coverage |
| Under 6 Years | 21 (100.0%) | 0 (0.0%) |
| 6 to 18 Years | 66 (81.5%) | 15 (18.5%) |
| 19 to 25 Years | 0 (0.0%) | 0 (0.0%) |
| 26 to 34 Years | 18 (100.0%) | 0 (0.0%) |
| 35 to 44 Years | 36 (85.7%) | 6 (14.3%) |
| 45 to 54 Years | 56 (100.0%) | 0 (0.0%) |
| 55 to 64 Years | 35 (100.0%) | 0 (0.0%) |
| 65 to 74 Years | 66 (100.0%) | 0 (0.0%) |
| 75 Years and older | 74 (100.0%) | 0 (0.0%) |
| Total | 372 (94.7%) | 21 (5.3%) |
Health Insurance Coverage by Citizenship Status in Ulen
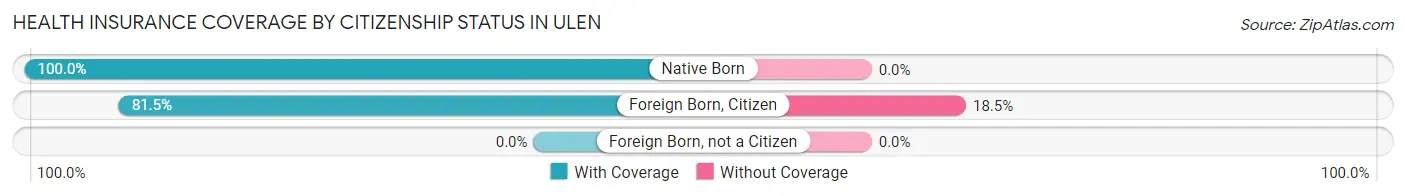
| Citizenship Status | With Coverage | Without Coverage |
| Native Born | 21 (100.0%) | 0 (0.0%) |
| Foreign Born, Citizen | 66 (81.5%) | 15 (18.5%) |
| Foreign Born, not a Citizen | 0 (0.0%) | 0 (0.0%) |
Health Insurance Coverage by Household Income in Ulen
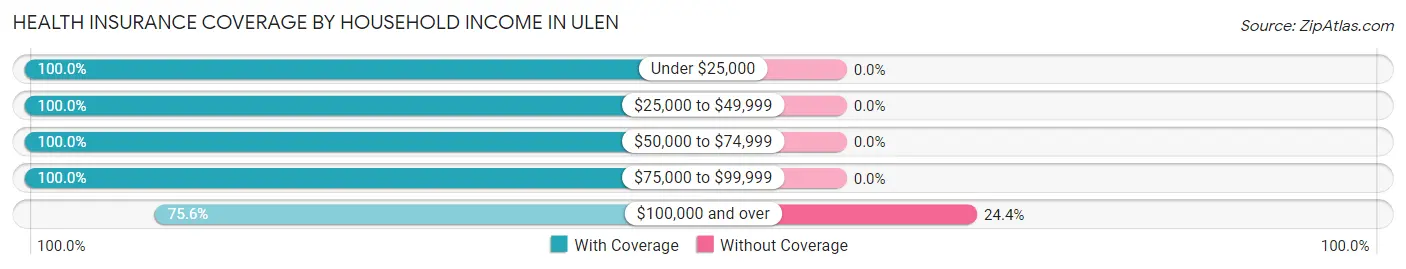
| Household Income | With Coverage | Without Coverage |
| Under $25,000 | 118 (100.0%) | 0 (0.0%) |
| $25,000 to $49,999 | 44 (100.0%) | 0 (0.0%) |
| $50,000 to $74,999 | 51 (100.0%) | 0 (0.0%) |
| $75,000 to $99,999 | 94 (100.0%) | 0 (0.0%) |
| $100,000 and over | 65 (75.6%) | 21 (24.4%) |
Public vs Private Health Insurance Coverage by Age in Ulen
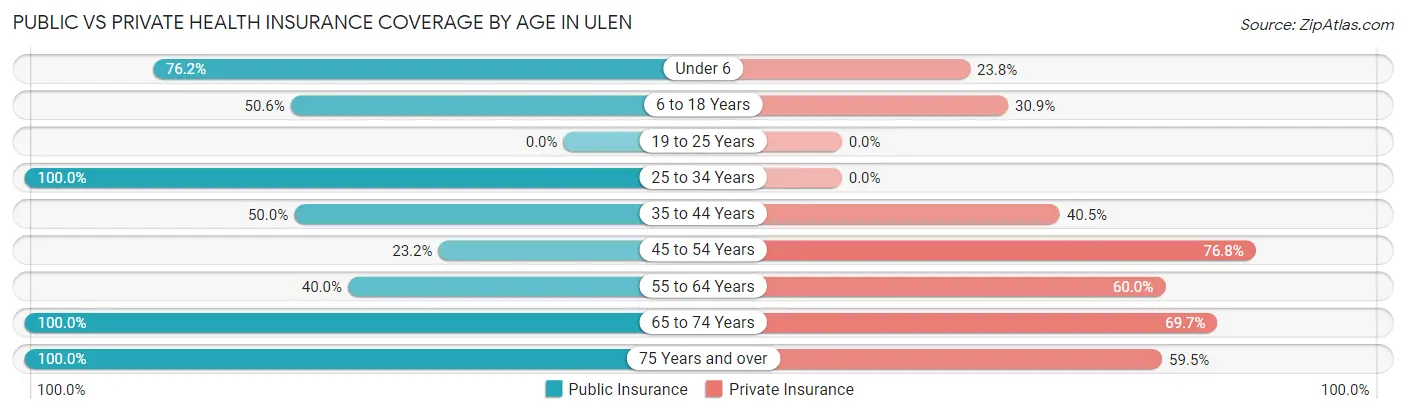
| Age Bracket | Public Insurance | Private Insurance |
| Under 6 | 16 (76.2%) | 5 (23.8%) |
| 6 to 18 Years | 41 (50.6%) | 25 (30.9%) |
| 19 to 25 Years | 0 (0.0%) | 0 (0.0%) |
| 25 to 34 Years | 18 (100.0%) | 0 (0.0%) |
| 35 to 44 Years | 21 (50.0%) | 17 (40.5%) |
| 45 to 54 Years | 13 (23.2%) | 43 (76.8%) |
| 55 to 64 Years | 14 (40.0%) | 21 (60.0%) |
| 65 to 74 Years | 66 (100.0%) | 46 (69.7%) |
| 75 Years and over | 74 (100.0%) | 44 (59.5%) |
| Total | 263 (66.9%) | 201 (51.1%) |
Disability Status by Sex by Age in Ulen
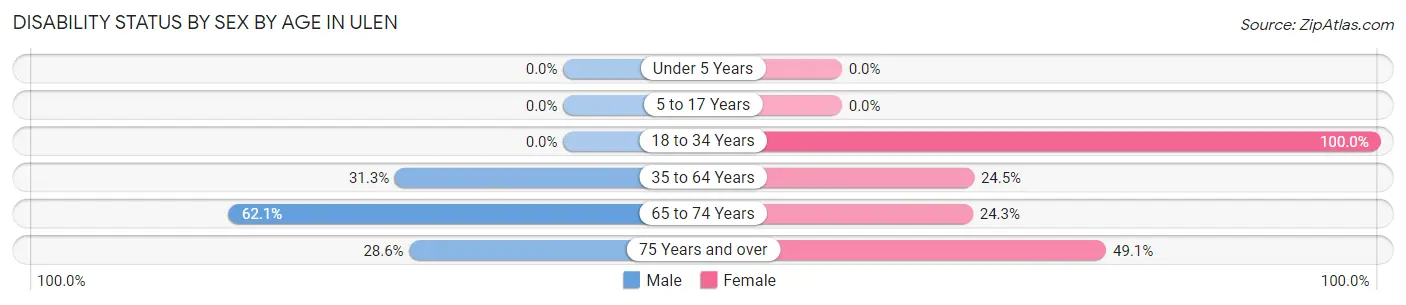
| Age Bracket | Male | Female |
| Under 5 Years | 0 (0.0%) | 0 (0.0%) |
| 5 to 17 Years | 0 (0.0%) | 0 (0.0%) |
| 18 to 34 Years | 0 (0.0%) | 12 (100.0%) |
| 35 to 64 Years | 25 (31.2%) | 13 (24.5%) |
| 65 to 74 Years | 18 (62.1%) | 9 (24.3%) |
| 75 Years and over | 6 (28.6%) | 26 (49.1%) |
Disability Class by Sex by Age in Ulen
Disability Class: Hearing Difficulty
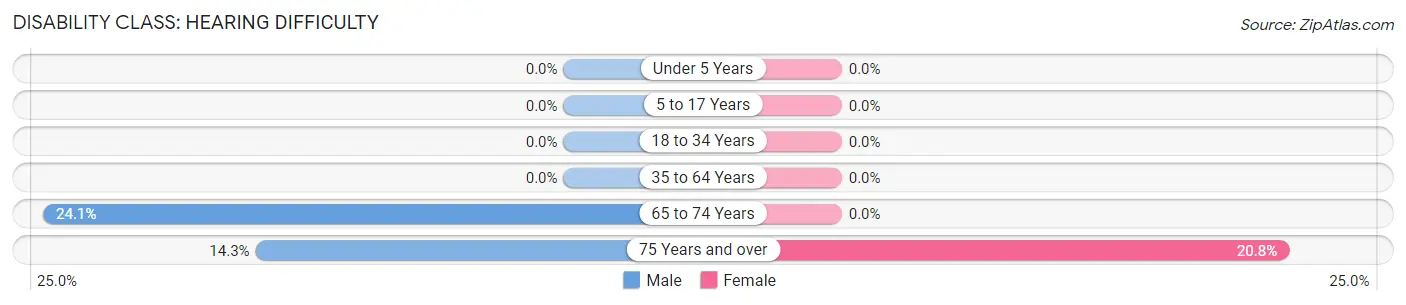
| Age Bracket | Male | Female |
| Under 5 Years | 0 (0.0%) | 0 (0.0%) |
| 5 to 17 Years | 0 (0.0%) | 0 (0.0%) |
| 18 to 34 Years | 0 (0.0%) | 0 (0.0%) |
| 35 to 64 Years | 0 (0.0%) | 0 (0.0%) |
| 65 to 74 Years | 7 (24.1%) | 0 (0.0%) |
| 75 Years and over | 3 (14.3%) | 11 (20.7%) |
Disability Class: Vision Difficulty
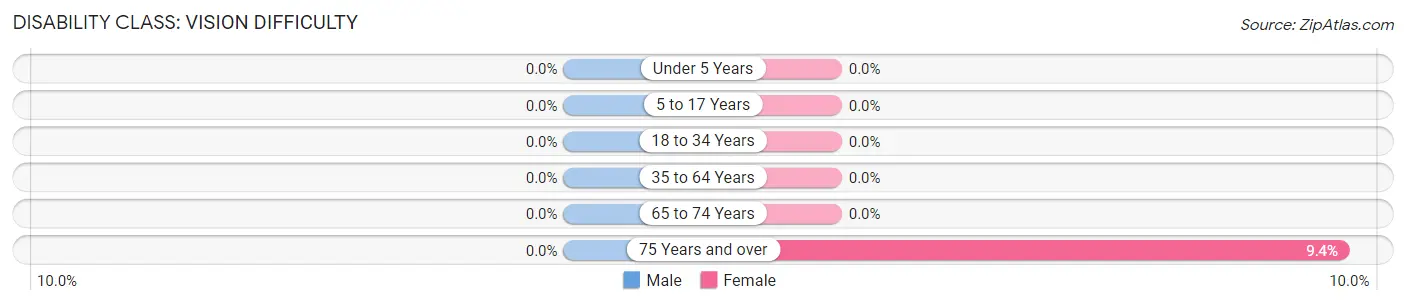
| Age Bracket | Male | Female |
| Under 5 Years | 0 (0.0%) | 0 (0.0%) |
| 5 to 17 Years | 0 (0.0%) | 0 (0.0%) |
| 18 to 34 Years | 0 (0.0%) | 0 (0.0%) |
| 35 to 64 Years | 0 (0.0%) | 0 (0.0%) |
| 65 to 74 Years | 0 (0.0%) | 0 (0.0%) |
| 75 Years and over | 0 (0.0%) | 5 (9.4%) |
Disability Class: Cognitive Difficulty
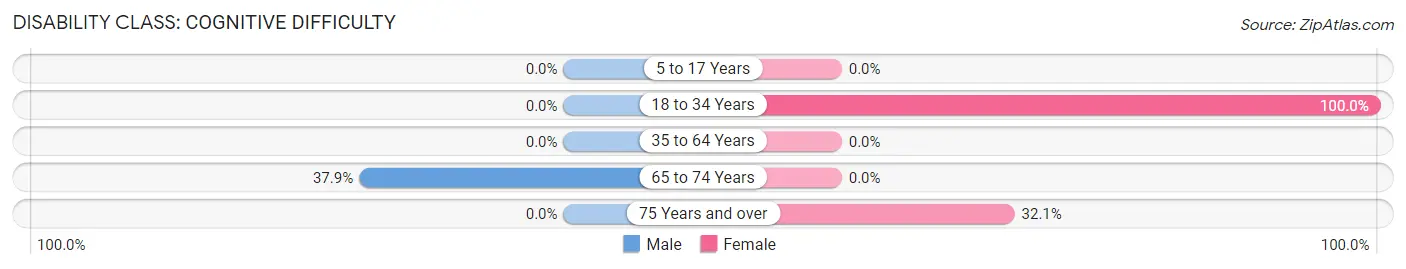
| Age Bracket | Male | Female |
| 5 to 17 Years | 0 (0.0%) | 0 (0.0%) |
| 18 to 34 Years | 0 (0.0%) | 12 (100.0%) |
| 35 to 64 Years | 0 (0.0%) | 0 (0.0%) |
| 65 to 74 Years | 11 (37.9%) | 0 (0.0%) |
| 75 Years and over | 0 (0.0%) | 17 (32.1%) |
Disability Class: Ambulatory Difficulty
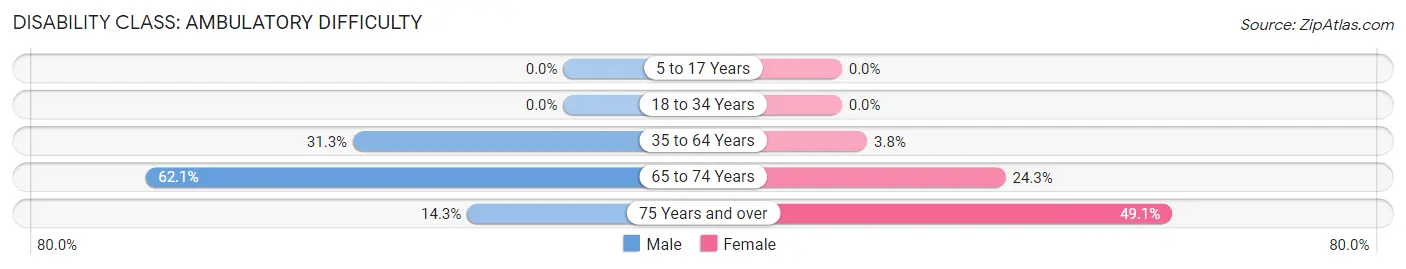
| Age Bracket | Male | Female |
| 5 to 17 Years | 0 (0.0%) | 0 (0.0%) |
| 18 to 34 Years | 0 (0.0%) | 0 (0.0%) |
| 35 to 64 Years | 25 (31.2%) | 2 (3.8%) |
| 65 to 74 Years | 18 (62.1%) | 9 (24.3%) |
| 75 Years and over | 3 (14.3%) | 26 (49.1%) |
Disability Class: Self-Care Difficulty
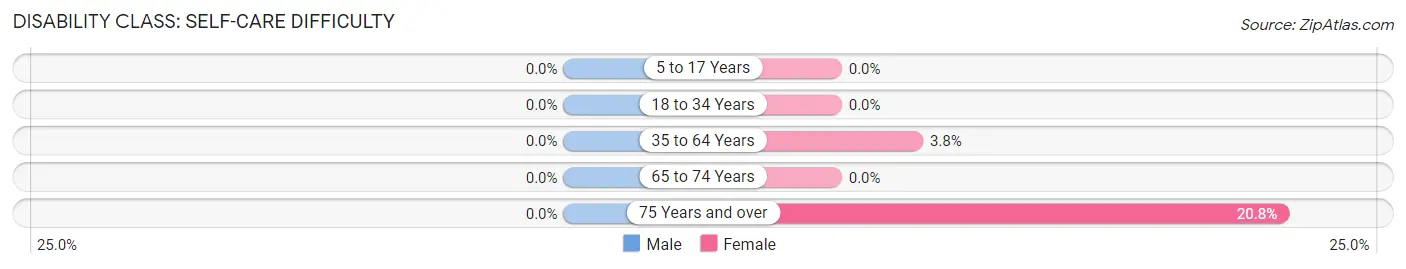
| Age Bracket | Male | Female |
| 5 to 17 Years | 0 (0.0%) | 0 (0.0%) |
| 18 to 34 Years | 0 (0.0%) | 0 (0.0%) |
| 35 to 64 Years | 0 (0.0%) | 2 (3.8%) |
| 65 to 74 Years | 0 (0.0%) | 0 (0.0%) |
| 75 Years and over | 0 (0.0%) | 11 (20.7%) |
Technology Access in Ulen
Computing Device Access in Ulen
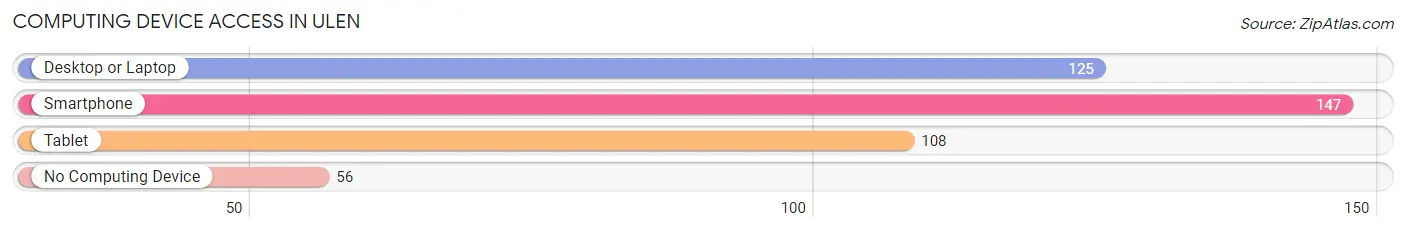
| Device Type | # Households | % Households |
| Desktop or Laptop | 125 | 58.7% |
| Smartphone | 147 | 69.0% |
| Tablet | 108 | 50.7% |
| No Computing Device | 56 | 26.3% |
| Total | 213 | 100.0% |
Internet Access in Ulen
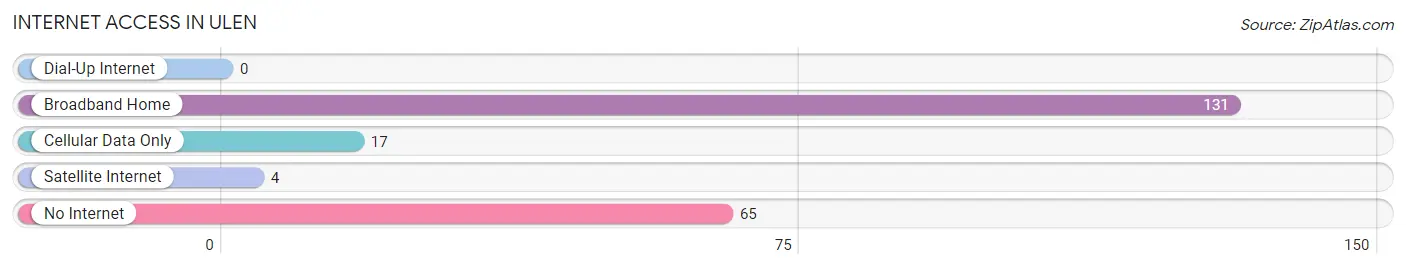
| Internet Type | # Households | % Households |
| Dial-Up Internet | 0 | 0.0% |
| Broadband Home | 131 | 61.5% |
| Cellular Data Only | 17 | 8.0% |
| Satellite Internet | 4 | 1.9% |
| No Internet | 65 | 30.5% |
| Total | 213 | 100.0% |
Ulen Summary
Ulen is a small city located in Clay County, Minnesota, United States. The population was 845 at the 2010 census. It is part of the Fargo-Moorhead metropolitan area.
Geography
Ulen is located at the intersection of Minnesota State Highways 32 and 75. It is situated on the western edge of Clay County, approximately 10 miles south of the county seat of Moorhead. The city is located on the banks of the Wild Rice River, which flows through the city and is a tributary of the Red River of the North.
Ulen is surrounded by rolling hills and farmland. The city is located in the Red River Valley, a flat, fertile region of the state. The nearest major city is Fargo, North Dakota, located approximately 25 miles to the north.
History
Ulen was founded in 1881 by Norwegian immigrants. The city was named after Ulen, Norway, the hometown of many of the settlers. The city was incorporated in 1883 and quickly became a center of commerce and industry in the region.
The city was home to a number of businesses, including a flour mill, a creamery, a lumber yard, and a brickyard. The city also had a number of churches, including a Lutheran church, a Methodist church, and a Catholic church.
In the early 20th century, Ulen was a thriving community. The city had a population of over 1,000 and was home to a number of businesses, including a bank, a hotel, a movie theater, and a variety of stores.
Economy
Today, Ulen is a small, rural community. The city is home to a number of small businesses, including a grocery store, a hardware store, and a variety of restaurants. The city is also home to a number of manufacturing companies, including a furniture manufacturer and a plastics manufacturer.
The city is also home to a number of agricultural businesses, including a dairy farm, a hog farm, and a grain elevator. The city is also home to a number of small businesses, including a gas station, a barber shop, and a variety of other services.
Demographics
As of the 2010 census, Ulen had a population of 845. The racial makeup of the city was 97.3% White, 0.6% African American, 0.2% Native American, 0.2% Asian, 0.2% from other races, and 1.7% from two or more races. Hispanic or Latino of any race were 1.2% of the population.
The median income for a household in Ulen was $41,250, and the median income for a family was $50,000. The per capita income for the city was $19,945. About 8.3% of families and 10.2% of the population were below the poverty line, including 11.3% of those under age 18 and 8.3% of those age 65 or over.
Ulen is a small, rural community with a strong sense of community and a rich history. The city is home to a number of businesses and industries, and is a popular destination for outdoor recreation. The city is also home to a number of churches, schools, and other community organizations.
Common Questions
What is Per Capita Income in Ulen?
Per Capita income in Ulen is $26,347.
What is the Median Family Income in Ulen?
Median Family Income in Ulen is $76,042.
What is the Median Household income in Ulen?
Median Household Income in Ulen is $36,979.
What is Inequality or Gini Index in Ulen?
Inequality or Gini Index in Ulen is 0.48.
What is the Total Population of Ulen?
Total Population of Ulen is 428.
What is the Total Male Population of Ulen?
Total Male Population of Ulen is 211.
What is the Total Female Population of Ulen?
Total Female Population of Ulen is 217.
What is the Ratio of Males per 100 Females in Ulen?
There are 97.24 Males per 100 Females in Ulen.
What is the Ratio of Females per 100 Males in Ulen?
There are 102.84 Females per 100 Males in Ulen.
What is the Median Population Age in Ulen?
Median Population Age in Ulen is 52.4 Years.
What is the Average Family Size in Ulen
Average Family Size in Ulen is 2.6 People.
What is the Average Household Size in Ulen
Average Household Size in Ulen is 1.9 People.
How Large is the Labor Force in Ulen?
There are 133 People in the Labor Forcein in Ulen.
What is the Percentage of People in the Labor Force in Ulen?
38.1% of People are in the Labor Force in Ulen.
What is the Unemployment Rate in Ulen?
Unemployment Rate in Ulen is 1.5%.