Baker, MN Map & Demographics
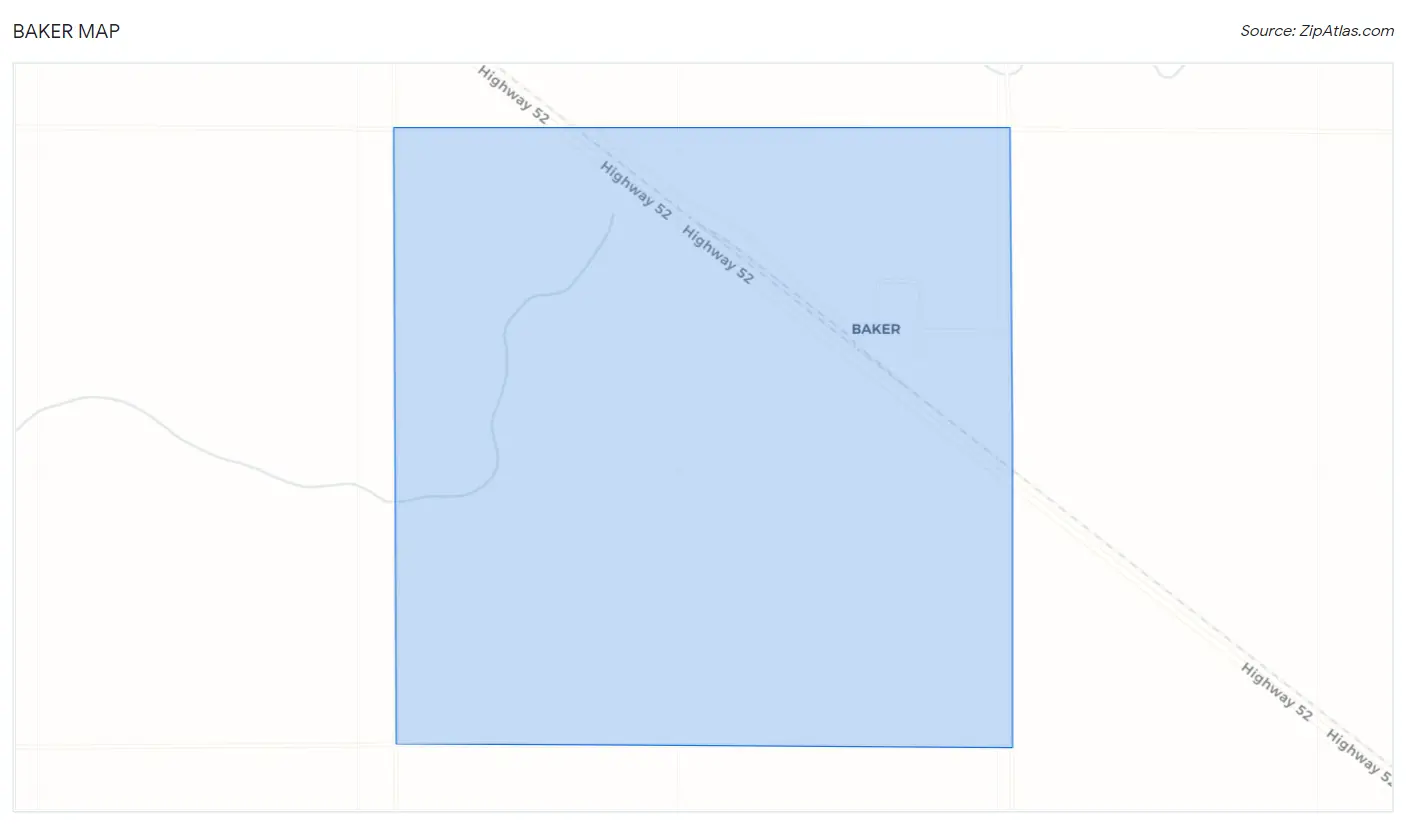
Baker Map
Baker Overview
$33,326
PER CAPITA INCOME
$57,321
AVG HOUSEHOLD INCOME
21.3%
WAGE / INCOME GAP [ % ]
78.7¢/ $1
WAGE / INCOME GAP [ $ ]
0.29
INEQUALITY / GINI INDEX
47
TOTAL POPULATION
29
MALE POPULATION
18
FEMALE POPULATION
161.11
MALES / 100 FEMALES
62.07
FEMALES / 100 MALES
37.7
MEDIAN AGE
2.6
AVG FAMILY SIZE
2.2
AVG HOUSEHOLD SIZE
28
LABOR FORCE [ PEOPLE ]
84.8%
PERCENT IN LABOR FORCE
Baker Area Codes
Income in Baker
Income Overview in Baker
| Characteristic | Number | Measure |
| Per Capita Income | 47 | $33,326 |
| Median Family Income | 14 | $0 |
| Mean Family Income | 14 | $77,607 |
| Median Household Income | 21 | $57,321 |
| Mean Household Income | 21 | $73,281 |
| Income Deficit | 14 | $0 |
| Wage / Income Gap (%) | 47 | 21.35% |
| Wage / Income Gap ($) | 47 | 78.65¢ per $1 |
| Gini / Inequality Index | 47 | 0.29 |
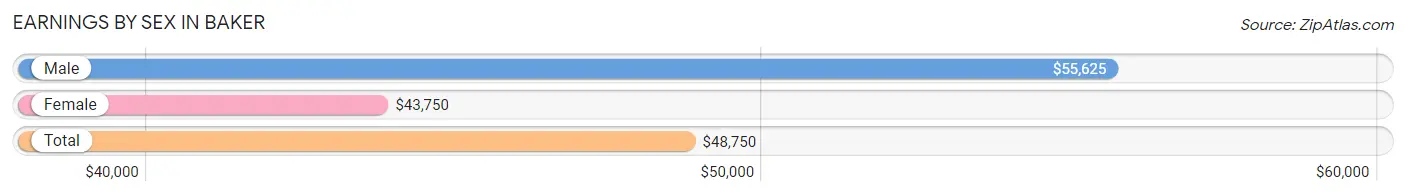
Earnings by Sex in Baker
Average Earnings in Baker are $48,750, $55,625 for men and $43,750 for women, a difference of 21.3%.
| Sex | Number | Average Earnings |
| Male | 15 (51.7%) | $55,625 |
| Female | 14 (48.3%) | $43,750 |
| Total | 29 (100.0%) | $48,750 |
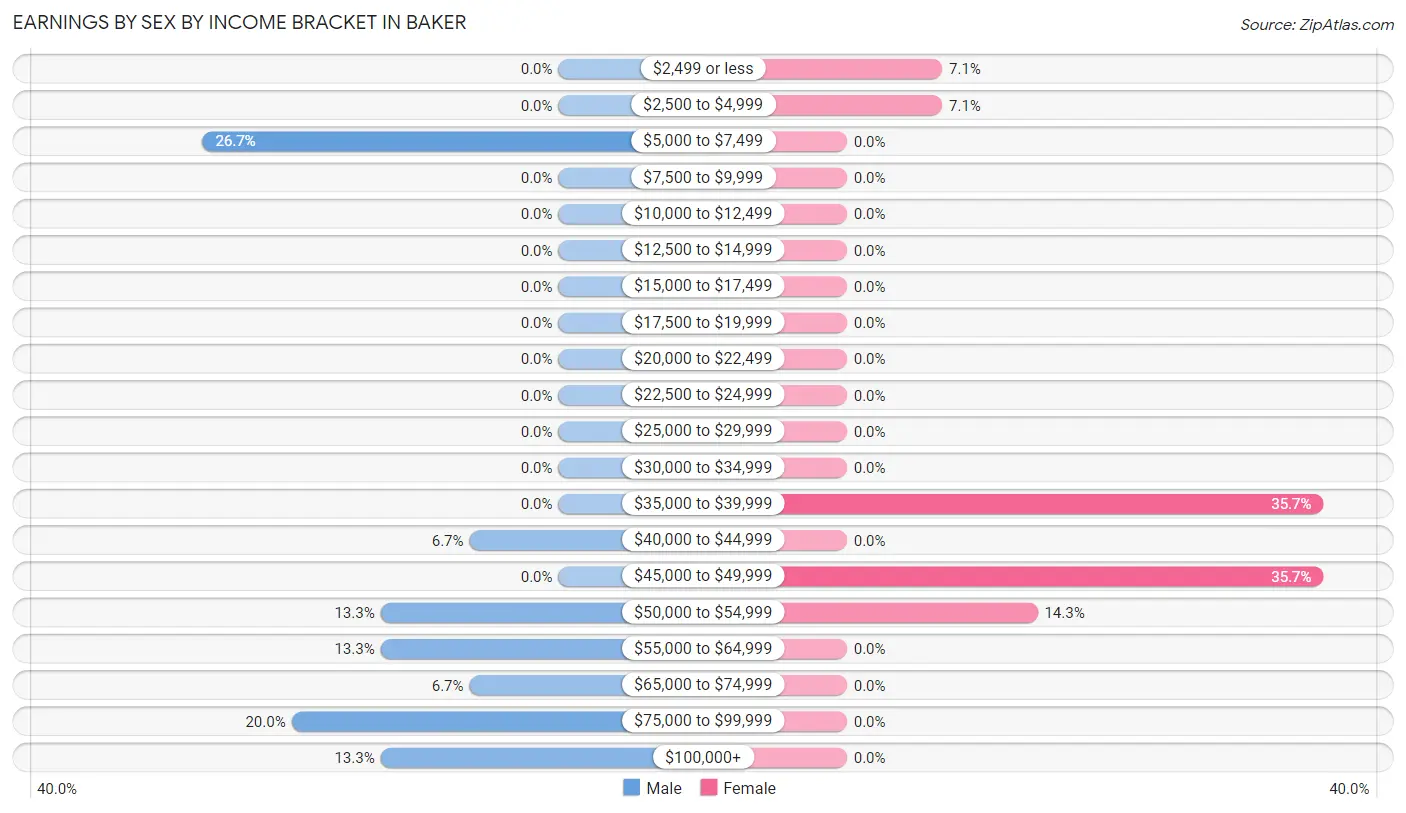
Earnings by Sex by Income Bracket in Baker
The most common earnings brackets in Baker are $5,000 to $7,499 for men (4 | 26.7%) and $35,000 to $39,999 for women (5 | 35.7%).
| Income | Male | Female |
| $2,499 or less | 0 (0.0%) | 1 (7.1%) |
| $2,500 to $4,999 | 0 (0.0%) | 1 (7.1%) |
| $5,000 to $7,499 | 4 (26.7%) | 0 (0.0%) |
| $7,500 to $9,999 | 0 (0.0%) | 0 (0.0%) |
| $10,000 to $12,499 | 0 (0.0%) | 0 (0.0%) |
| $12,500 to $14,999 | 0 (0.0%) | 0 (0.0%) |
| $15,000 to $17,499 | 0 (0.0%) | 0 (0.0%) |
| $17,500 to $19,999 | 0 (0.0%) | 0 (0.0%) |
| $20,000 to $22,499 | 0 (0.0%) | 0 (0.0%) |
| $22,500 to $24,999 | 0 (0.0%) | 0 (0.0%) |
| $25,000 to $29,999 | 0 (0.0%) | 0 (0.0%) |
| $30,000 to $34,999 | 0 (0.0%) | 0 (0.0%) |
| $35,000 to $39,999 | 0 (0.0%) | 5 (35.7%) |
| $40,000 to $44,999 | 1 (6.7%) | 0 (0.0%) |
| $45,000 to $49,999 | 0 (0.0%) | 5 (35.7%) |
| $50,000 to $54,999 | 2 (13.3%) | 2 (14.3%) |
| $55,000 to $64,999 | 2 (13.3%) | 0 (0.0%) |
| $65,000 to $74,999 | 1 (6.7%) | 0 (0.0%) |
| $75,000 to $99,999 | 3 (20.0%) | 0 (0.0%) |
| $100,000+ | 2 (13.3%) | 0 (0.0%) |
| Total | 15 (100.0%) | 14 (100.0%) |
Earnings by Sex by Educational Attainment in Baker
Average earnings in Baker are $55,625 for men and $48,000 for women, a difference of 13.7%. Men with an educational attainment of high school diploma enjoy the highest average annual earnings of $61,250, while those with college or associate's degree education earn the least with $56,250. Women with an educational attainment of college or associate's degree earn the most with the average annual earnings of $48,250, while those with college or associate's degree education have the smallest earnings of $48,250.
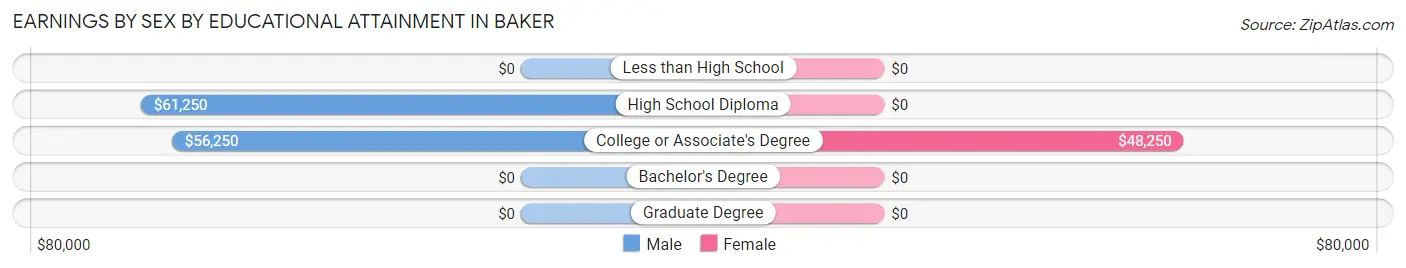
| Educational Attainment | Male Income | Female Income |
| Less than High School | - | - |
| High School Diploma | $61,250 | $0 |
| College or Associate's Degree | $56,250 | $48,250 |
| Bachelor's Degree | - | - |
| Graduate Degree | - | - |
| Total | $55,625 | $48,000 |
Family Income in Baker
Family Income Brackets in Baker
According to the Baker family income data, there are 6 families falling into the $50,000 to $74,999 income range, which is the most common income bracket and makes up 42.9% of all families.
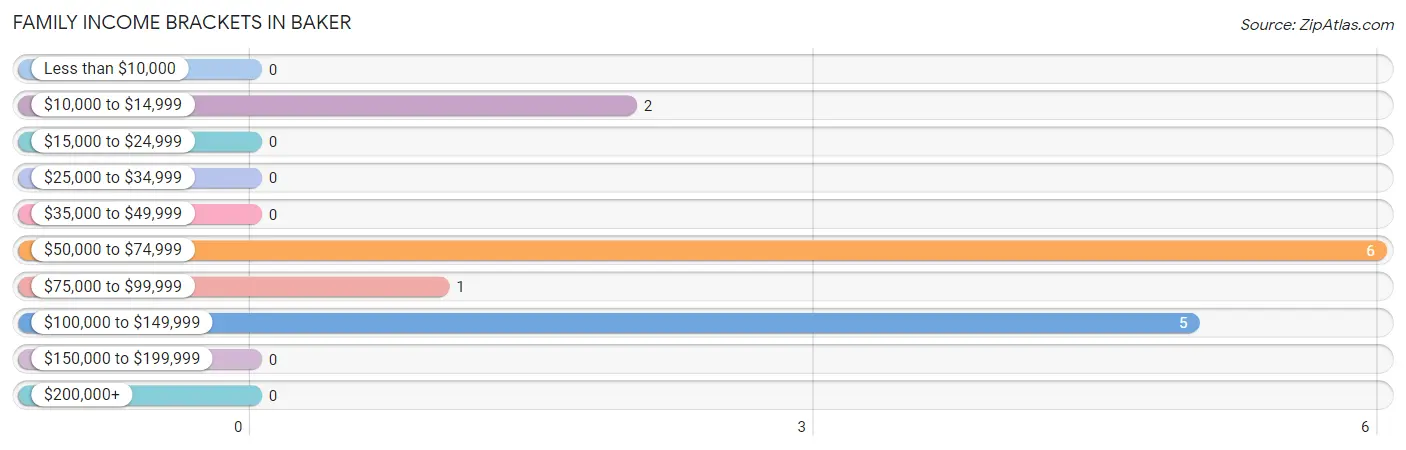
| Income Bracket | # Families | % Families |
| Less than $10,000 | 0 | 0.0% |
| $10,000 to $14,999 | 2 | 14.3% |
| $15,000 to $24,999 | 0 | 0.0% |
| $25,000 to $34,999 | 0 | 0.0% |
| $35,000 to $49,999 | 0 | 0.0% |
| $50,000 to $74,999 | 6 | 42.9% |
| $75,000 to $99,999 | 1 | 7.1% |
| $100,000 to $149,999 | 5 | 35.7% |
| $150,000 to $199,999 | 0 | 0.0% |
| $200,000+ | 0 | 0.0% |
Family Income by Famaliy Size in Baker
| Income Bracket | # Families | Median Income |
| 2-Person Families | 6 (42.9%) | $0 |
| 3-Person Families | 6 (42.9%) | $0 |
| 4-Person Families | 0 (0.0%) | $0 |
| 5-Person Families | 2 (14.3%) | $0 |
| 6-Person Families | 0 (0.0%) | $0 |
| 7+ Person Families | 0 (0.0%) | $0 |
| Total | 14 (100.0%) | $0 |
Family Income by Number of Earners in Baker
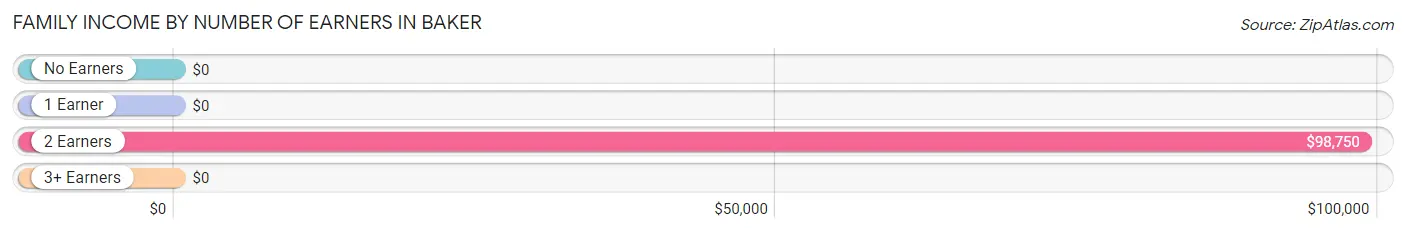
| Number of Earners | # Families | Median Income |
| No Earners | 0 (0.0%) | $0 |
| 1 Earner | 6 (42.9%) | $0 |
| 2 Earners | 6 (42.9%) | $98,750 |
| 3+ Earners | 2 (14.3%) | $0 |
| Total | 14 (100.0%) | $0 |
Household Income in Baker
Household Income Brackets in Baker
With 8 households falling in the category, the $50,000 to $74,999 income range is the most frequent in Baker, accounting for 38.1% of all households.
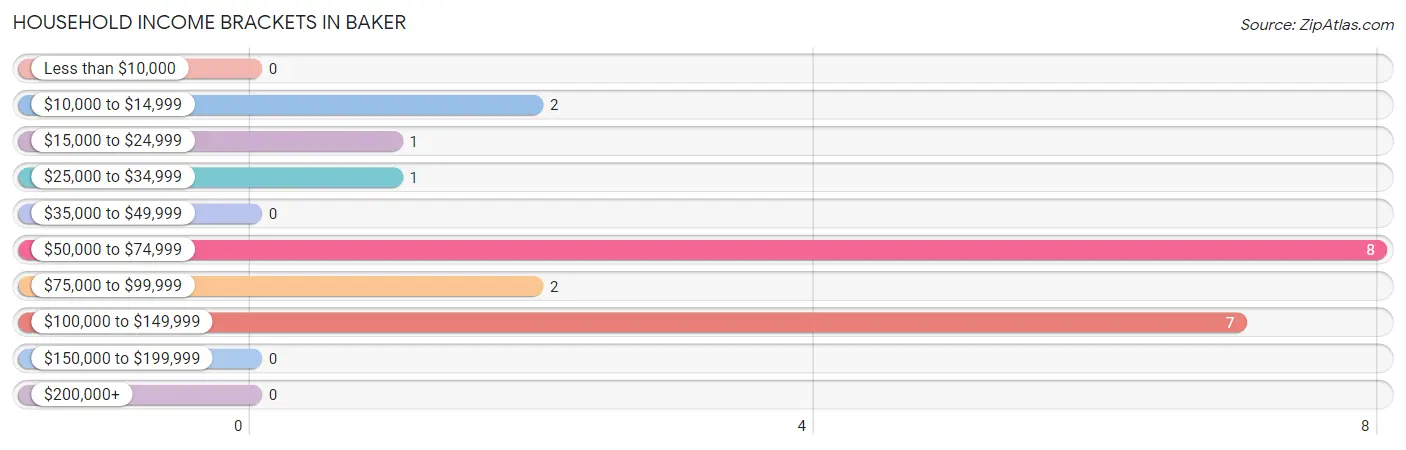
| Income Bracket | # Households | % Households |
| Less than $10,000 | 0 | 0.0% |
| $10,000 to $14,999 | 2 | 9.5% |
| $15,000 to $24,999 | 1 | 4.8% |
| $25,000 to $34,999 | 1 | 4.8% |
| $35,000 to $49,999 | 0 | 0.0% |
| $50,000 to $74,999 | 8 | 38.1% |
| $75,000 to $99,999 | 2 | 9.5% |
| $100,000 to $149,999 | 7 | 33.3% |
| $150,000 to $199,999 | 0 | 0.0% |
| $200,000+ | 0 | 0.0% |
Household Income by Householder Age in Baker
The median household income in Baker is $57,321, with the highest median household income of $129,375 found in the 45 to 64 years age bracket for the primary householder. A total of 5 households (23.8%) fall into this category.
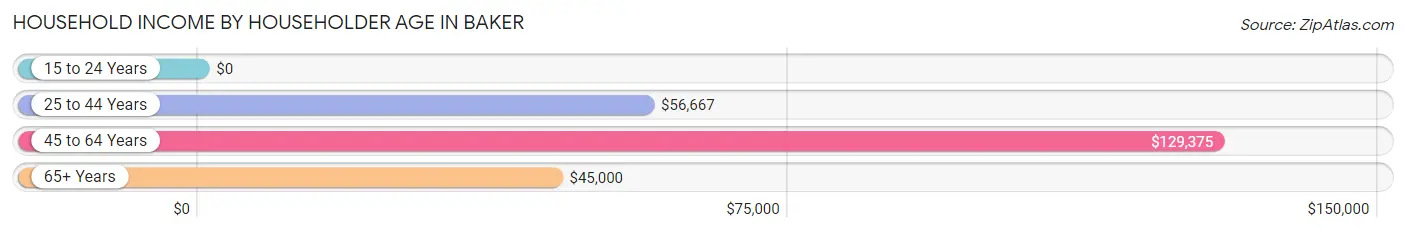
| Income Bracket | # Households | Median Income |
| 15 to 24 Years | 0 (0.0%) | $0 |
| 25 to 44 Years | 12 (57.1%) | $56,667 |
| 45 to 64 Years | 5 (23.8%) | $129,375 |
| 65+ Years | 4 (19.1%) | $45,000 |
| Total | 21 (100.0%) | $57,321 |
Poverty in Baker
Income Below Poverty by Sex and Age in Baker
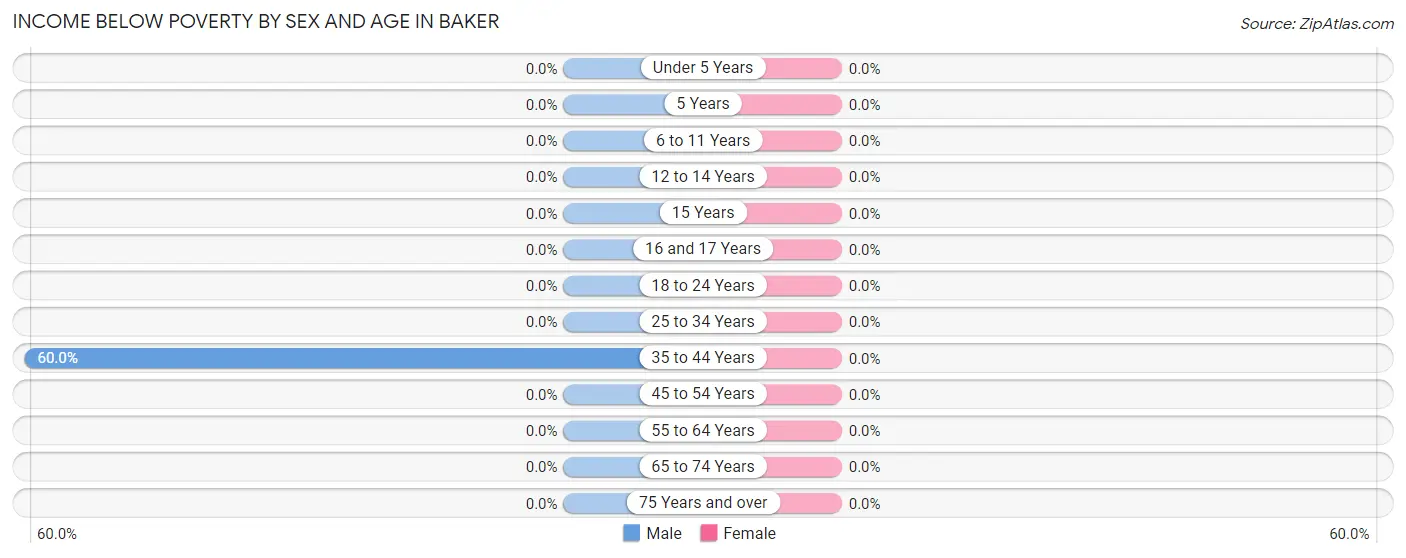
| Age Bracket | Male | Female |
| Under 5 Years | 0 (0.0%) | 0 (0.0%) |
| 5 Years | 0 (0.0%) | 0 (0.0%) |
| 6 to 11 Years | 0 (0.0%) | 0 (0.0%) |
| 12 to 14 Years | 0 (0.0%) | 0 (0.0%) |
| 15 Years | 0 (0.0%) | 0 (0.0%) |
| 16 and 17 Years | 0 (0.0%) | 0 (0.0%) |
| 18 to 24 Years | 0 (0.0%) | 0 (0.0%) |
| 25 to 34 Years | 0 (0.0%) | 0 (0.0%) |
| 35 to 44 Years | 3 (60.0%) | 0 (0.0%) |
| 45 to 54 Years | 0 (0.0%) | 0 (0.0%) |
| 55 to 64 Years | 0 (0.0%) | 0 (0.0%) |
| 65 to 74 Years | 0 (0.0%) | 0 (0.0%) |
| 75 Years and over | 0 (0.0%) | 0 (0.0%) |
| Total | 3 (10.3%) | 0 (0.0%) |
Income Above Poverty by Sex and Age in Baker
According to the poverty statistics in Baker, males aged under 5 years and females aged 15 years are the age groups that are most secure financially, with 100.0% of males and 100.0% of females in these age groups living above the poverty line.
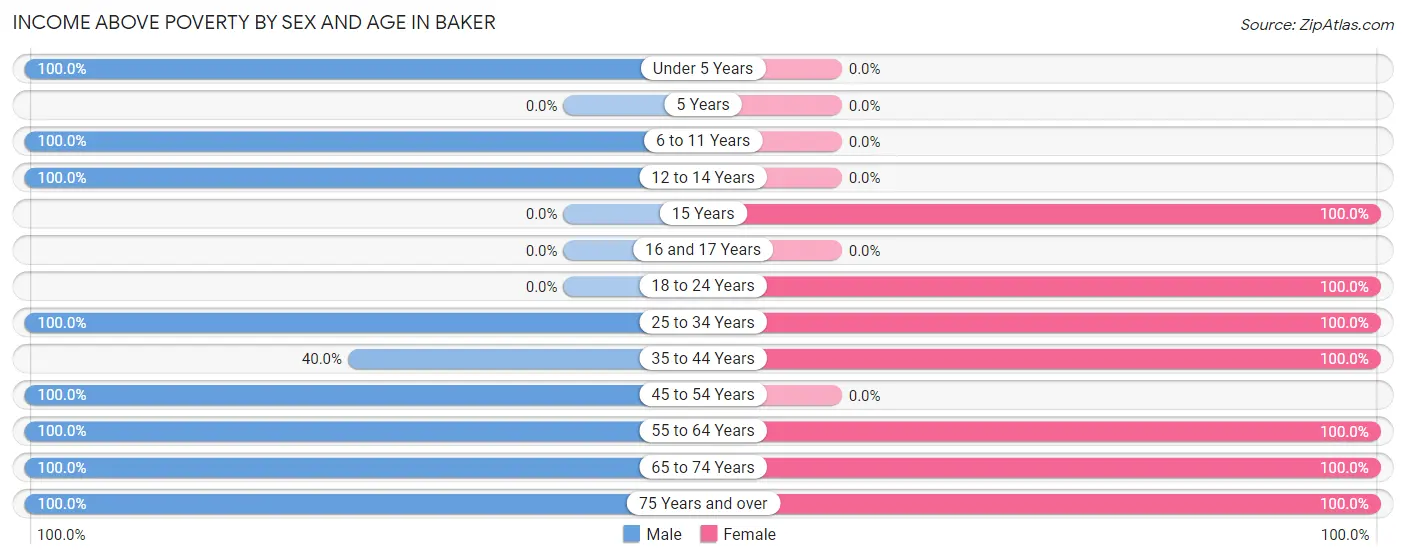
| Age Bracket | Male | Female |
| Under 5 Years | 2 (100.0%) | 0 (0.0%) |
| 5 Years | 0 (0.0%) | 0 (0.0%) |
| 6 to 11 Years | 9 (100.0%) | 0 (0.0%) |
| 12 to 14 Years | 2 (100.0%) | 0 (0.0%) |
| 15 Years | 0 (0.0%) | 1 (100.0%) |
| 16 and 17 Years | 0 (0.0%) | 0 (0.0%) |
| 18 to 24 Years | 0 (0.0%) | 2 (100.0%) |
| 25 to 34 Years | 3 (100.0%) | 1 (100.0%) |
| 35 to 44 Years | 2 (40.0%) | 8 (100.0%) |
| 45 to 54 Years | 3 (100.0%) | 0 (0.0%) |
| 55 to 64 Years | 3 (100.0%) | 3 (100.0%) |
| 65 to 74 Years | 1 (100.0%) | 2 (100.0%) |
| 75 Years and over | 1 (100.0%) | 1 (100.0%) |
| Total | 26 (89.7%) | 18 (100.0%) |
Income Below Poverty Among Married-Couple Families in Baker
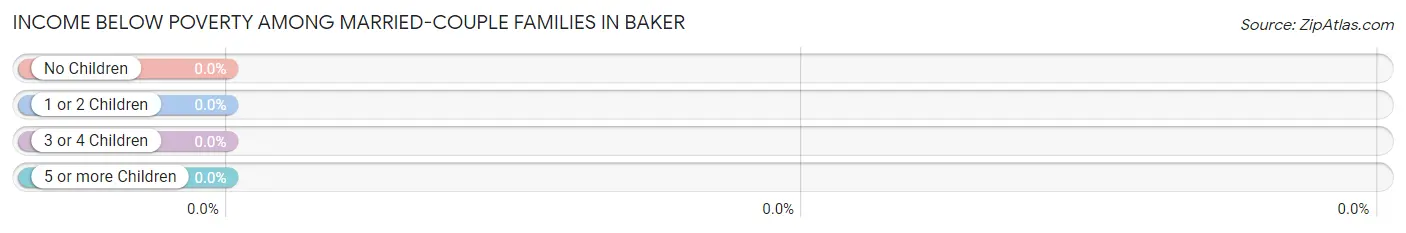
| Children | Above Poverty | Below Poverty |
| No Children | 4 (100.0%) | 0 (0.0%) |
| 1 or 2 Children | 3 (100.0%) | 0 (0.0%) |
| 3 or 4 Children | 0 (0.0%) | 0 (0.0%) |
| 5 or more Children | 0 (0.0%) | 0 (0.0%) |
| Total | 7 (100.0%) | 0 (0.0%) |
Income Below Poverty Among Single-Parent Households in Baker
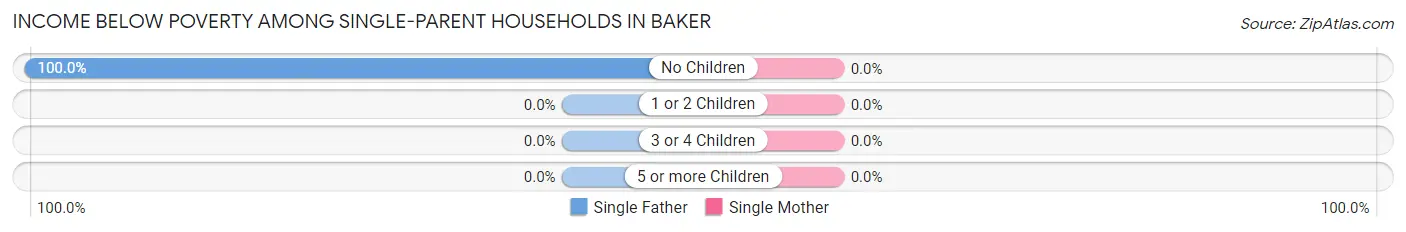
| Children | Single Father | Single Mother |
| No Children | 2 (100.0%) | 0 (0.0%) |
| 1 or 2 Children | 0 (0.0%) | 0 (0.0%) |
| 3 or 4 Children | 0 (0.0%) | 0 (0.0%) |
| 5 or more Children | 0 (0.0%) | 0 (0.0%) |
| Total | 2 (100.0%) | 0 (0.0%) |
Income Below Poverty Among Married-Couple vs Single-Parent Households in Baker
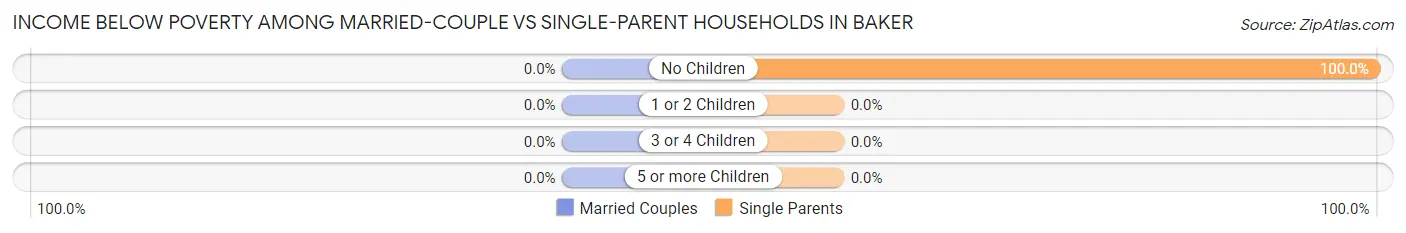
| Children | Married-Couple Families | Single-Parent Households |
| No Children | 0 (0.0%) | 2 (100.0%) |
| 1 or 2 Children | 0 (0.0%) | 0 (0.0%) |
| 3 or 4 Children | 0 (0.0%) | 0 (0.0%) |
| 5 or more Children | 0 (0.0%) | 0 (0.0%) |
| Total | 0 (0.0%) | 2 (28.6%) |
Race in Baker
The most populous races in Baker are White / Caucasian (45 | 95.7%), and Two or more Races (2 | 4.3%).
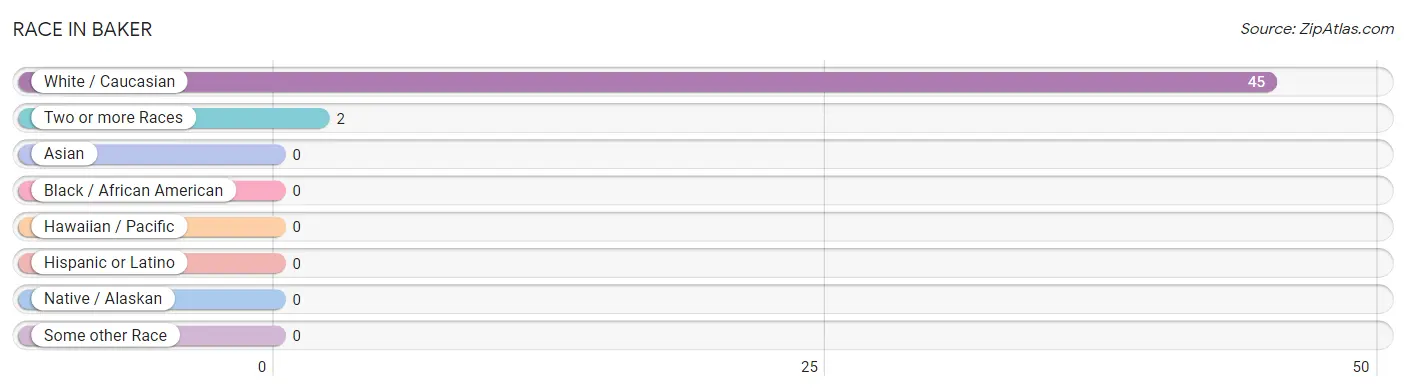
| Race | # Population | % Population |
| Asian | 0 | 0.0% |
| Black / African American | 0 | 0.0% |
| Hawaiian / Pacific | 0 | 0.0% |
| Hispanic or Latino | 0 | 0.0% |
| Native / Alaskan | 0 | 0.0% |
| White / Caucasian | 45 | 95.7% |
| Two or more Races | 2 | 4.3% |
| Some other Race | 0 | 0.0% |
| Total | 47 | 100.0% |
Ancestry in Baker
The most populous ancestries reported in Baker are German (26 | 55.3%), Norwegian (15 | 31.9%), Irish (9 | 19.2%), English (3 | 6.4%), and Polish (3 | 6.4%), together accounting for 119.1% of all Baker residents.
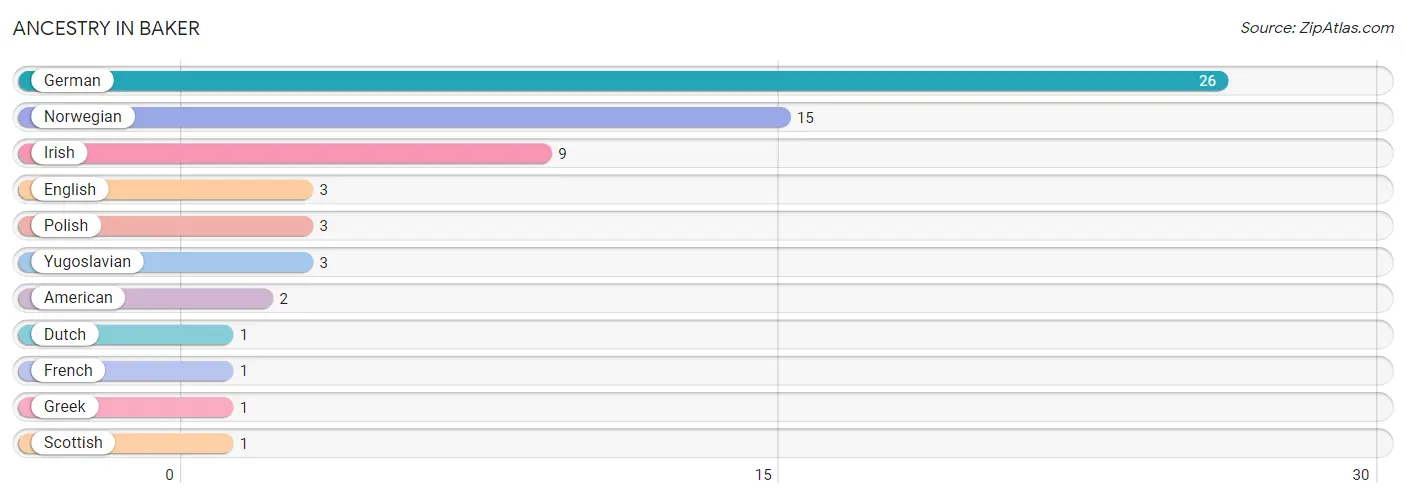
| Ancestry | # Population | % Population |
| American | 2 | 4.3% |
| Dutch | 1 | 2.1% |
| English | 3 | 6.4% |
| French | 1 | 2.1% |
| German | 26 | 55.3% |
| Greek | 1 | 2.1% |
| Irish | 9 | 19.2% |
| Norwegian | 15 | 31.9% |
| Polish | 3 | 6.4% |
| Scottish | 1 | 2.1% |
| Yugoslavian | 3 | 6.4% | View All 11 Rows |
Immigrants in Baker
The most numerous immigrant groups reported in Baker came from Bosnia and Herzegovina (3 | 6.4%), Eastern Europe (3 | 6.4%), Europe (3 | 6.4%), and Canada (1 | 2.1%), together accounting for 21.3% of all Baker residents.
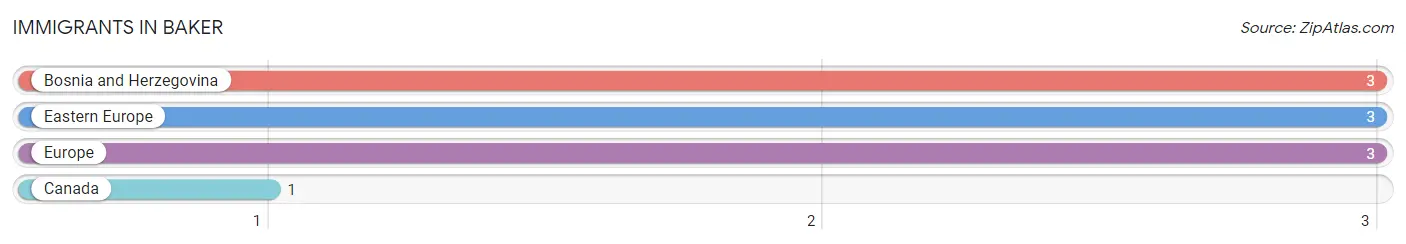
| Immigration Origin | # Population | % Population |
| Bosnia and Herzegovina | 3 | 6.4% |
| Canada | 1 | 2.1% |
| Eastern Europe | 3 | 6.4% |
| Europe | 3 | 6.4% | View All 4 Rows |
Sex and Age in Baker
Sex and Age in Baker
The most populous age groups in Baker are 10 to 14 Years (11 | 37.9%) for men and 35 to 39 Years (5 | 27.8%) for women.
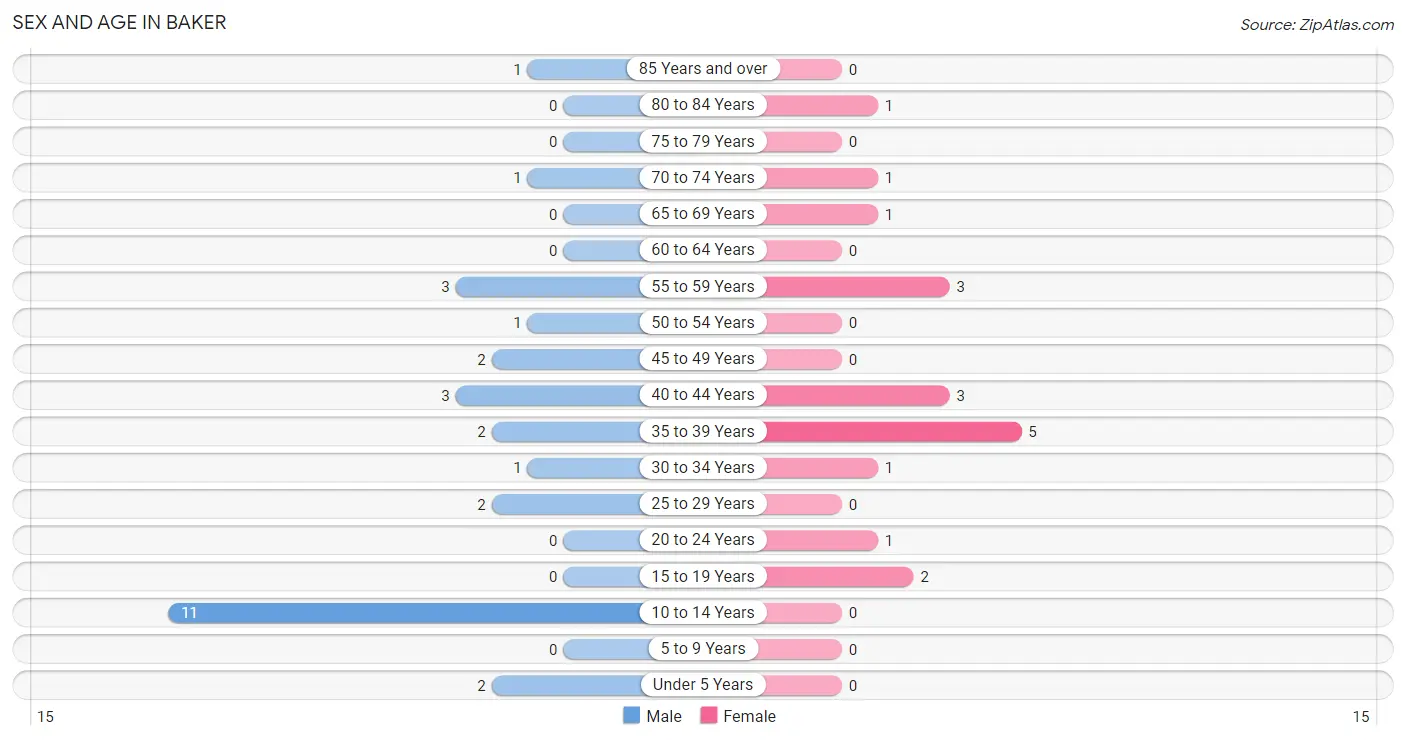
| Age Bracket | Male | Female |
| Under 5 Years | 2 (6.9%) | 0 (0.0%) |
| 5 to 9 Years | 0 (0.0%) | 0 (0.0%) |
| 10 to 14 Years | 11 (37.9%) | 0 (0.0%) |
| 15 to 19 Years | 0 (0.0%) | 2 (11.1%) |
| 20 to 24 Years | 0 (0.0%) | 1 (5.6%) |
| 25 to 29 Years | 2 (6.9%) | 0 (0.0%) |
| 30 to 34 Years | 1 (3.5%) | 1 (5.6%) |
| 35 to 39 Years | 2 (6.9%) | 5 (27.8%) |
| 40 to 44 Years | 3 (10.3%) | 3 (16.7%) |
| 45 to 49 Years | 2 (6.9%) | 0 (0.0%) |
| 50 to 54 Years | 1 (3.5%) | 0 (0.0%) |
| 55 to 59 Years | 3 (10.3%) | 3 (16.7%) |
| 60 to 64 Years | 0 (0.0%) | 0 (0.0%) |
| 65 to 69 Years | 0 (0.0%) | 1 (5.6%) |
| 70 to 74 Years | 1 (3.5%) | 1 (5.6%) |
| 75 to 79 Years | 0 (0.0%) | 0 (0.0%) |
| 80 to 84 Years | 0 (0.0%) | 1 (5.6%) |
| 85 Years and over | 1 (3.5%) | 0 (0.0%) |
| Total | 29 (100.0%) | 18 (100.0%) |
Families and Households in Baker
Median Family Size in Baker
The median family size in Baker is 2.64 persons per family, with married-couple families (7 | 50.0%) accounting for the largest median family size of 2.86 persons per family. On the other hand, single male/father families (2 | 14.3%) represent the smallest median family size with 1.50 persons per family.
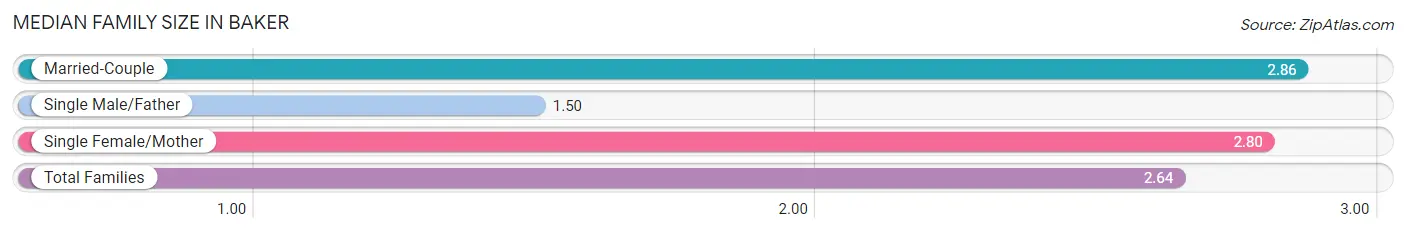
| Family Type | # Families | Family Size |
| Married-Couple | 7 (50.0%) | 2.86 |
| Single Male/Father | 2 (14.3%) | 1.50 |
| Single Female/Mother | 5 (35.7%) | 2.80 |
| Total Families | 14 (100.0%) | 2.64 |
Median Household Size in Baker
The median household size in Baker is 2.24 persons per household, with married-couple households (7 | 33.3%) accounting for the largest median household size of 2.86 persons per household. non-family households (7 | 33.3%) represent the smallest median household size with 1.43 persons per household.
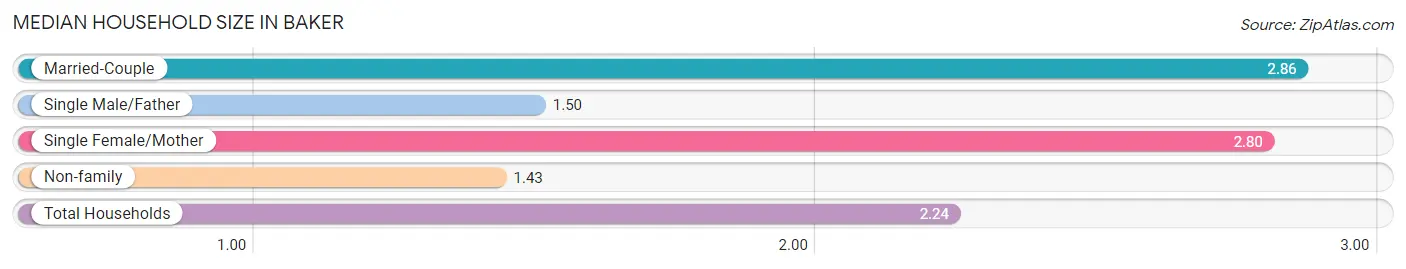
| Household Type | # Households | Household Size |
| Married-Couple | 7 (33.3%) | 2.86 |
| Single Male/Father | 2 (9.5%) | 1.50 |
| Single Female/Mother | 5 (23.8%) | 2.80 |
| Non-family | 7 (33.3%) | 1.43 |
| Total Households | 21 (100.0%) | 2.24 |
Household Size by Marriage Status in Baker
Out of a total of 21 households in Baker, 14 (66.7%) are family households, while 7 (33.3%) are nonfamily households. The most numerous type of family households are 2-person households, comprising 6, and the most common type of nonfamily households are 1-person households, comprising 4.
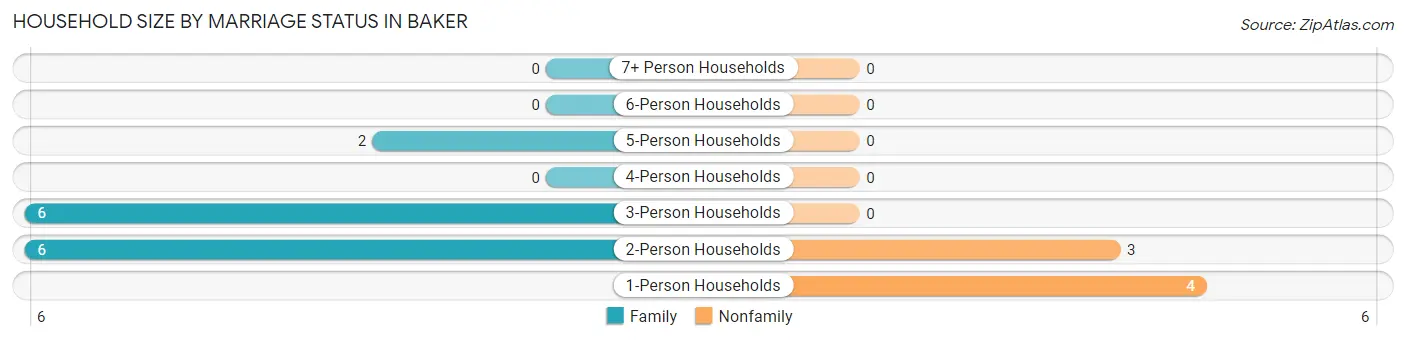
| Household Size | Family Households | Nonfamily Households |
| 1-Person Households | - | 4 (19.1%) |
| 2-Person Households | 6 (28.6%) | 3 (14.3%) |
| 3-Person Households | 6 (28.6%) | 0 (0.0%) |
| 4-Person Households | 0 (0.0%) | 0 (0.0%) |
| 5-Person Households | 2 (9.5%) | 0 (0.0%) |
| 6-Person Households | 0 (0.0%) | 0 (0.0%) |
| 7+ Person Households | 0 (0.0%) | 0 (0.0%) |
| Total | 14 (66.7%) | 7 (33.3%) |
Female Fertility in Baker
Fertility by Age in Baker
| Age Bracket | Women with Births | Births / 1,000 Women |
| 15 to 19 years | 0 (0.0%) | 0.0 |
| 20 to 34 years | 0 (0.0%) | 0.0 |
| 35 to 50 years | 0 (0.0%) | 0.0 |
| Total | 0 (0.0%) | 0.0 |
Fertility by Age by Marriage Status in Baker
| Age Bracket | Married | Unmarried |
| 15 to 19 years | 0 (0.0%) | 0 (0.0%) |
| 20 to 34 years | 0 (0.0%) | 0 (0.0%) |
| 35 to 50 years | 0 (0.0%) | 0 (0.0%) |
| Total | 0 (0.0%) | 0 (0.0%) |
Fertility by Education in Baker
| Educational Attainment | Women with Births | Births / 1,000 Women |
| Less than High School | 0 (0.0%) | 0.0 |
| High School Diploma | 0 (0.0%) | 0.0 |
| College or Associate's Degree | 0 (0.0%) | 0.0 |
| Bachelor's Degree | 0 (0.0%) | 0.0 |
| Graduate Degree | 0 (0.0%) | 0.0 |
| Total | 0 (0.0%) | 0.0 |
Fertility by Education by Marriage Status in Baker
| Educational Attainment | Married | Unmarried |
| Less than High School | 0 (0.0%) | 0 (0.0%) |
| High School Diploma | 0 (0.0%) | 0 (0.0%) |
| College or Associate's Degree | 0 (0.0%) | 0 (0.0%) |
| Bachelor's Degree | 0 (0.0%) | 0 (0.0%) |
| Graduate Degree | 0 (0.0%) | 0 (0.0%) |
| Total | 0 (0.0%) | 0 (0.0%) |
Employment Characteristics in Baker
Employment by Class of Employer in Baker
Among the 28 employed individuals in Baker, private company employees (23 | 82.1%), and self-employed (not incorporated) (5 | 17.9%) make up the most common classes of employment.
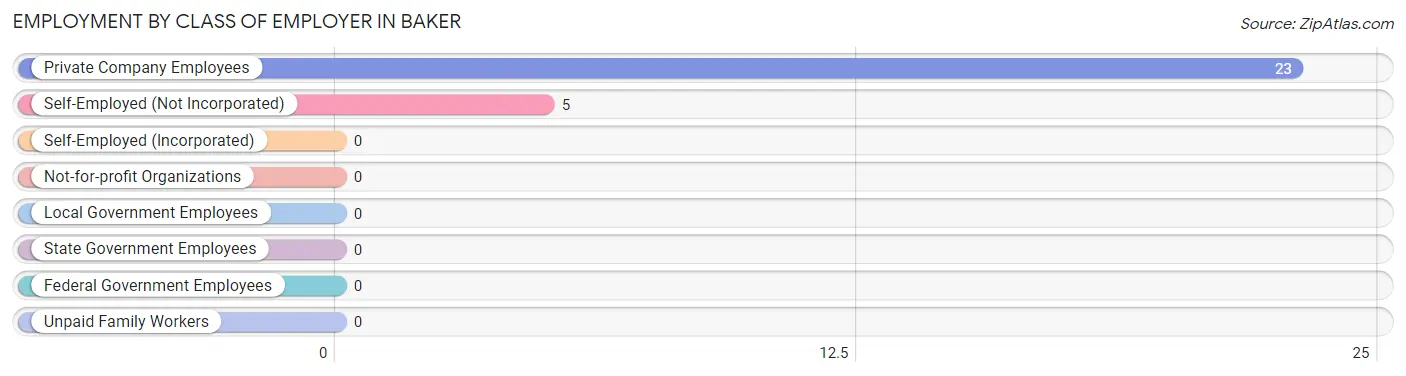
| Employer Class | # Employees | % Employees |
| Private Company Employees | 23 | 82.1% |
| Self-Employed (Incorporated) | 0 | 0.0% |
| Self-Employed (Not Incorporated) | 5 | 17.9% |
| Not-for-profit Organizations | 0 | 0.0% |
| Local Government Employees | 0 | 0.0% |
| State Government Employees | 0 | 0.0% |
| Federal Government Employees | 0 | 0.0% |
| Unpaid Family Workers | 0 | 0.0% |
| Total | 28 | 100.0% |
Employment Status by Age in Baker
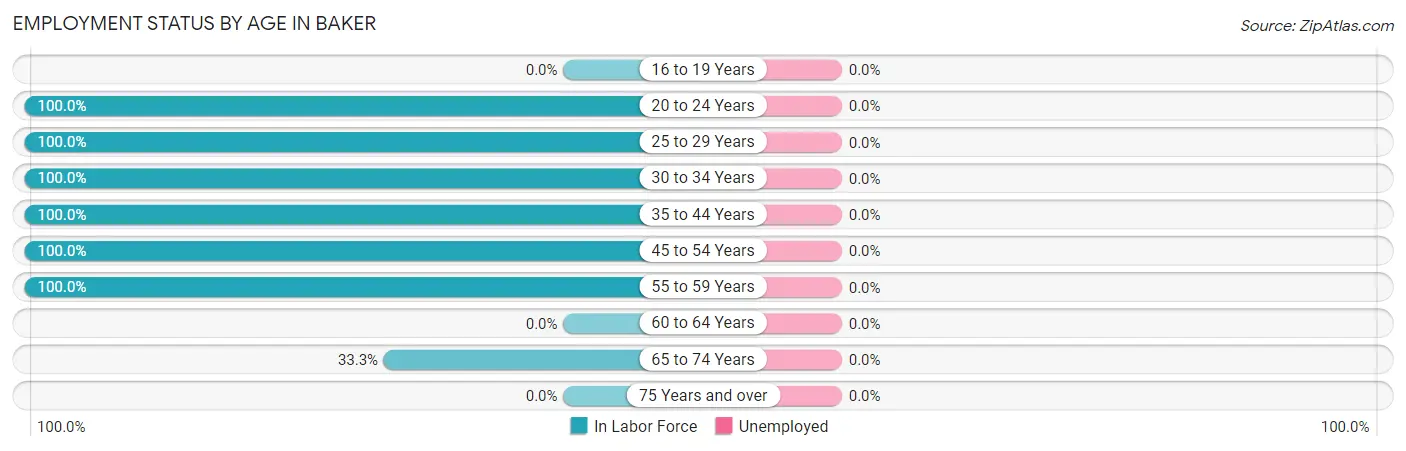
| Age Bracket | In Labor Force | Unemployed |
| 16 to 19 Years | 0 (0.0%) | 0 (0.0%) |
| 20 to 24 Years | 1 (100.0%) | 0 (0.0%) |
| 25 to 29 Years | 2 (100.0%) | 0 (0.0%) |
| 30 to 34 Years | 2 (100.0%) | 0 (0.0%) |
| 35 to 44 Years | 13 (100.0%) | 0 (0.0%) |
| 45 to 54 Years | 3 (100.0%) | 0 (0.0%) |
| 55 to 59 Years | 6 (100.0%) | 0 (0.0%) |
| 60 to 64 Years | 0 (0.0%) | 0 (0.0%) |
| 65 to 74 Years | 1 (33.3%) | 0 (0.0%) |
| 75 Years and over | 0 (0.0%) | 0 (0.0%) |
| Total | 28 (84.8%) | 0 (0.0%) |
Employment Status by Educational Attainment in Baker
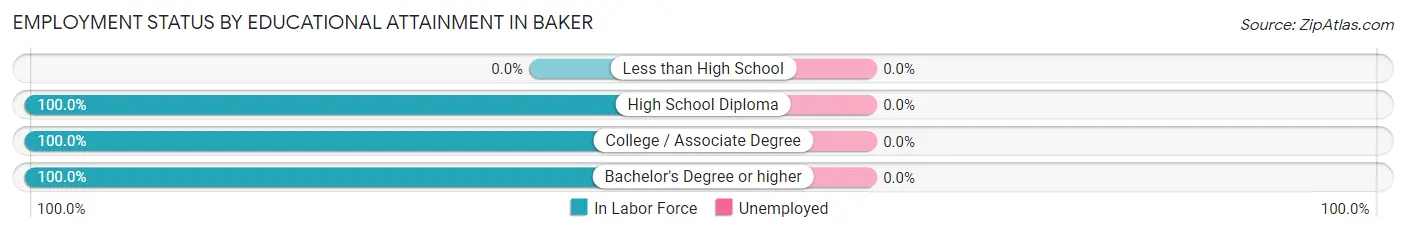
| Educational Attainment | In Labor Force | Unemployed |
| Less than High School | 0 (0.0%) | 0 (0.0%) |
| High School Diploma | 4 (100.0%) | 0 (0.0%) |
| College / Associate Degree | 16 (100.0%) | 0 (0.0%) |
| Bachelor's Degree or higher | 6 (100.0%) | 0 (0.0%) |
| Total | 26 (100.0%) | 0 (0.0%) |
Employment Occupations by Sex in Baker
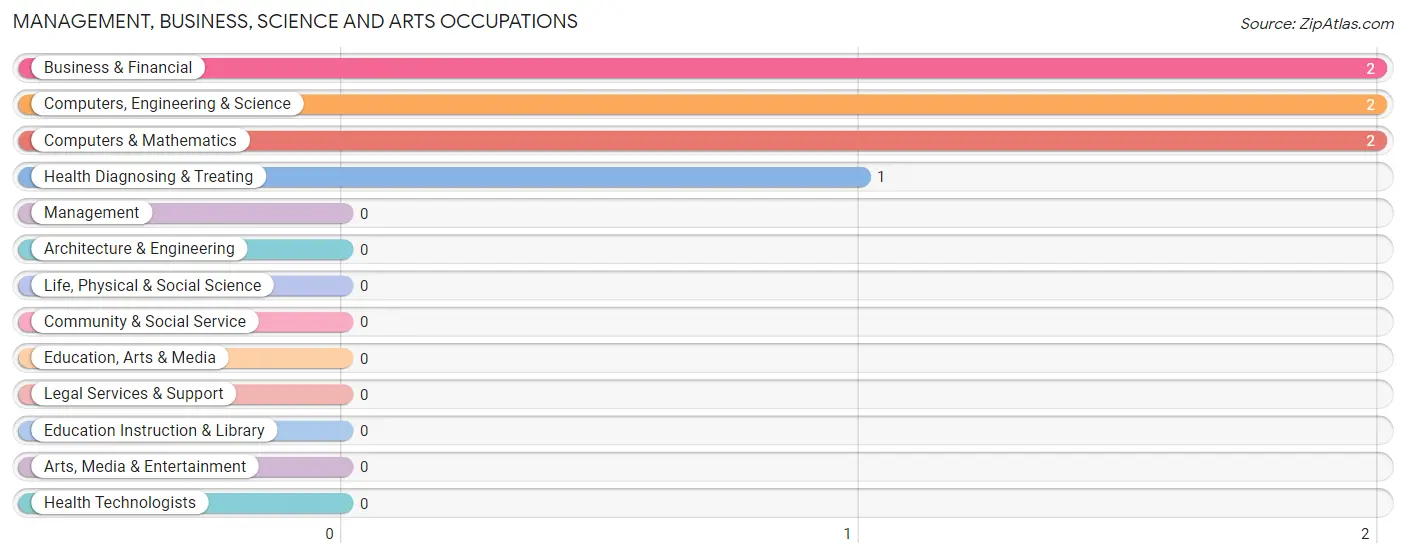
Management, Business, Science and Arts Occupations
The most common Management, Business, Science and Arts occupations in Baker are Business & Financial (2 | 7.1%), Computers, Engineering & Science (2 | 7.1%), Computers & Mathematics (2 | 7.1%), and Health Diagnosing & Treating (1 | 3.6%).
Management, Business, Science and Arts Occupations by Sex
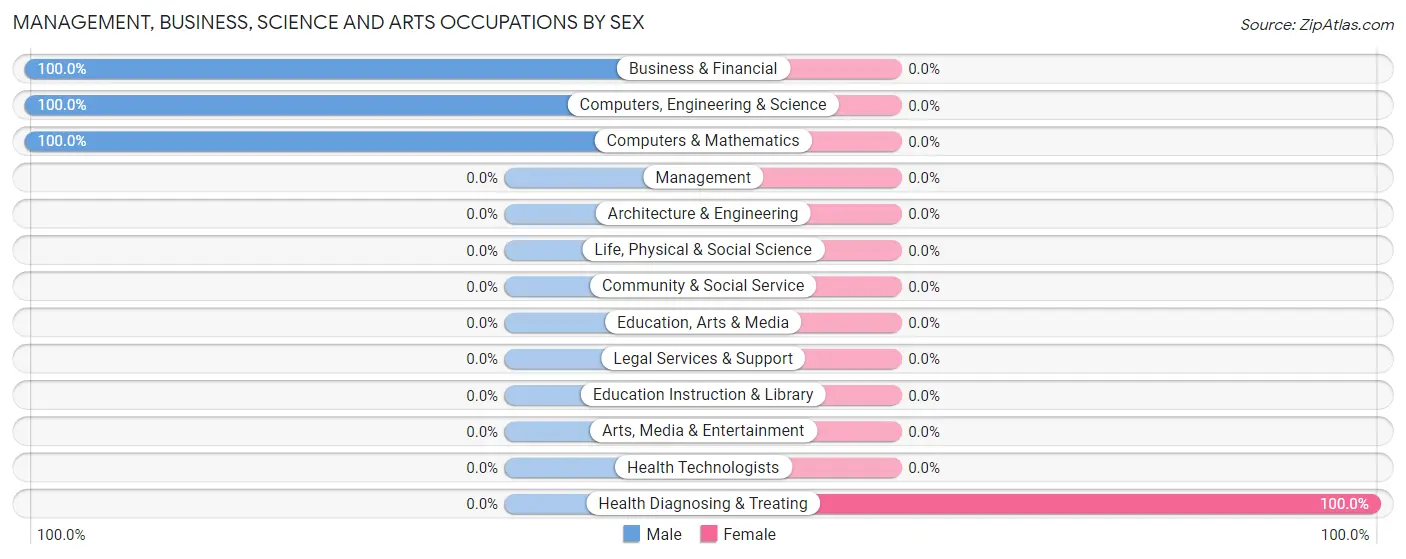
| Occupation | Male | Female |
| Management | 0 (0.0%) | 0 (0.0%) |
| Business & Financial | 2 (100.0%) | 0 (0.0%) |
| Computers, Engineering & Science | 2 (100.0%) | 0 (0.0%) |
| Computers & Mathematics | 2 (100.0%) | 0 (0.0%) |
| Architecture & Engineering | 0 (0.0%) | 0 (0.0%) |
| Life, Physical & Social Science | 0 (0.0%) | 0 (0.0%) |
| Community & Social Service | 0 (0.0%) | 0 (0.0%) |
| Education, Arts & Media | 0 (0.0%) | 0 (0.0%) |
| Legal Services & Support | 0 (0.0%) | 0 (0.0%) |
| Education Instruction & Library | 0 (0.0%) | 0 (0.0%) |
| Arts, Media & Entertainment | 0 (0.0%) | 0 (0.0%) |
| Health Diagnosing & Treating | 0 (0.0%) | 1 (100.0%) |
| Health Technologists | 0 (0.0%) | 0 (0.0%) |
| Total (Category) | 4 (80.0%) | 1 (20.0%) |
| Total (Overall) | 15 (53.6%) | 13 (46.4%) |
Services Occupations
The most common Services occupations in Baker are Security & Protection (1 | 3.6%), and Firefighting & Prevention (1 | 3.6%).
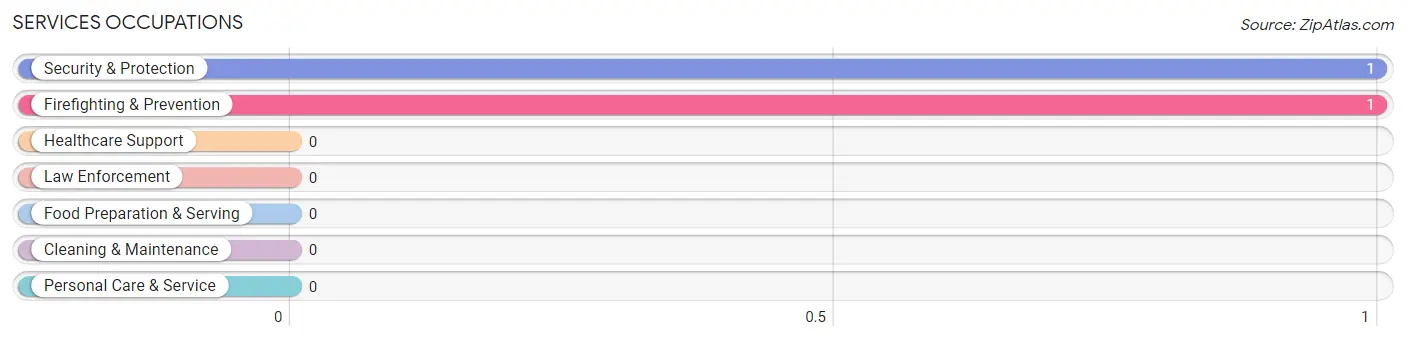
Services Occupations by Sex
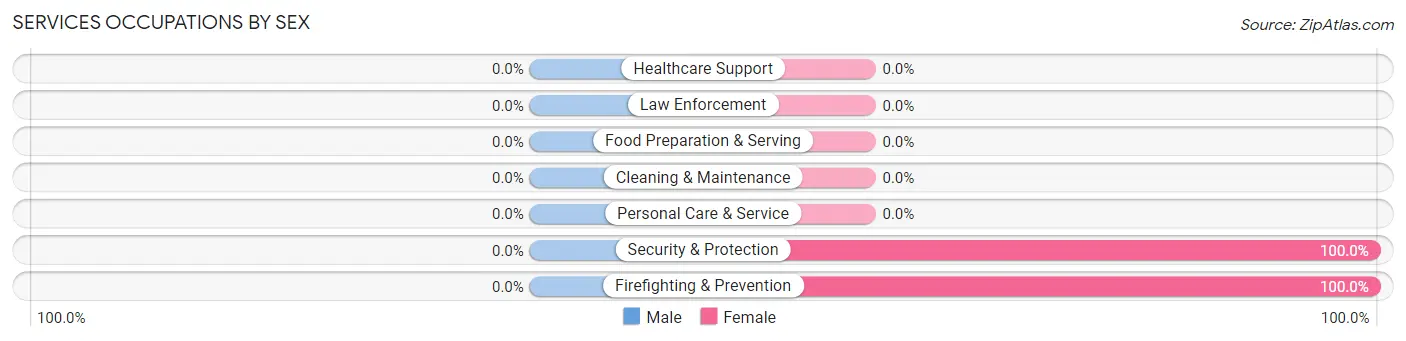
| Occupation | Male | Female |
| Healthcare Support | 0 (0.0%) | 0 (0.0%) |
| Security & Protection | 0 (0.0%) | 1 (100.0%) |
| Firefighting & Prevention | 0 (0.0%) | 1 (100.0%) |
| Law Enforcement | 0 (0.0%) | 0 (0.0%) |
| Food Preparation & Serving | 0 (0.0%) | 0 (0.0%) |
| Cleaning & Maintenance | 0 (0.0%) | 0 (0.0%) |
| Personal Care & Service | 0 (0.0%) | 0 (0.0%) |
| Total (Category) | 0 (0.0%) | 1 (100.0%) |
| Total (Overall) | 15 (53.6%) | 13 (46.4%) |
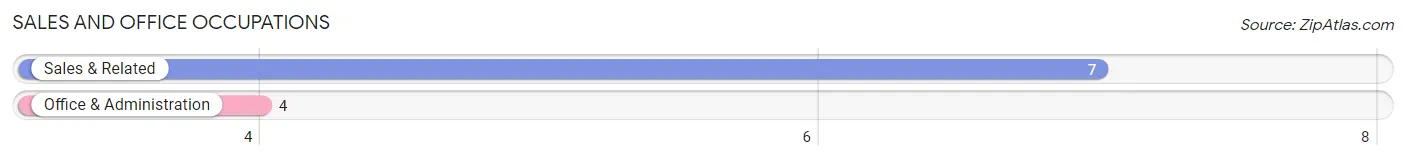
Sales and Office Occupations
The most common Sales and Office occupations in Baker are Sales & Related (7 | 25.0%), and Office & Administration (4 | 14.3%).
Sales and Office Occupations by Sex
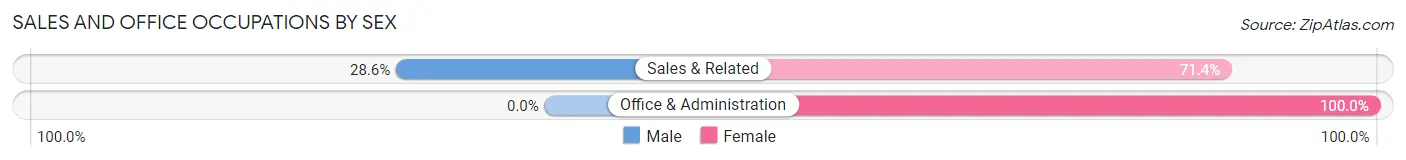
| Occupation | Male | Female |
| Sales & Related | 2 (28.6%) | 5 (71.4%) |
| Office & Administration | 0 (0.0%) | 4 (100.0%) |
| Total (Category) | 2 (18.2%) | 9 (81.8%) |
| Total (Overall) | 15 (53.6%) | 13 (46.4%) |
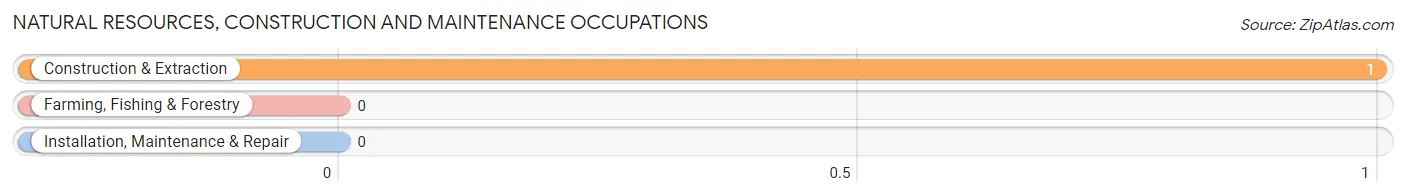
Natural Resources, Construction and Maintenance Occupations
The most common Natural Resources, Construction and Maintenance occupations in Baker are , and Construction & Extraction (1 | 3.6%).
Natural Resources, Construction and Maintenance Occupations by Sex
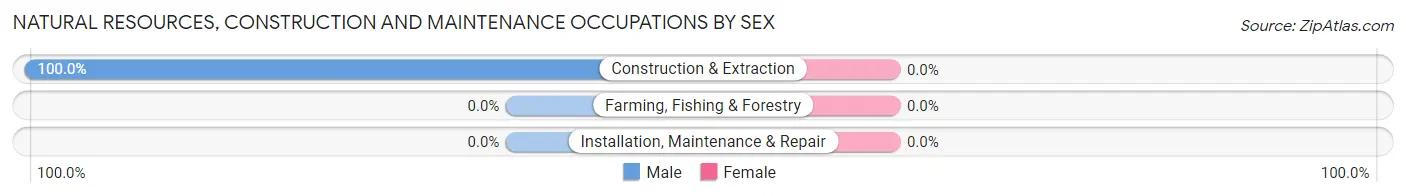
| Occupation | Male | Female |
| Farming, Fishing & Forestry | 0 (0.0%) | 0 (0.0%) |
| Construction & Extraction | 1 (100.0%) | 0 (0.0%) |
| Installation, Maintenance & Repair | 0 (0.0%) | 0 (0.0%) |
| Total (Category) | 1 (100.0%) | 0 (0.0%) |
| Total (Overall) | 15 (53.6%) | 13 (46.4%) |
Production, Transportation and Moving Occupations
The most common Production, Transportation and Moving occupations in Baker are Transportation (6 | 21.4%), Material Moving (3 | 10.7%), and Production (1 | 3.6%).
Production, Transportation and Moving Occupations by Sex
| Occupation | Male | Female |
| Production | 1 (100.0%) | 0 (0.0%) |
| Transportation | 6 (100.0%) | 0 (0.0%) |
| Material Moving | 1 (33.3%) | 2 (66.7%) |
| Total (Category) | 8 (80.0%) | 2 (20.0%) |
| Total (Overall) | 15 (53.6%) | 13 (46.4%) |
Employment Industries by Sex in Baker
Employment Industries in Baker
The major employment industries in Baker include Manufacturing (8 | 28.6%), Real Estate, Rental & Leasing (8 | 28.6%), Health Care & Social Assistance (4 | 14.3%), Transportation & Warehousing (3 | 10.7%), and Wholesale Trade (2 | 7.1%).
Employment Industries by Sex in Baker
The Baker industries that see more men than women are Construction (100.0%), Wholesale Trade (100.0%), and Transportation & Warehousing (100.0%), whereas the industries that tend to have a higher number of women are Finance & Insurance (100.0%), Professional & Scientific (100.0%), and Health Care & Social Assistance (100.0%).
| Industry | Male | Female |
| Agriculture, Fishing & Hunting | 0 (0.0%) | 0 (0.0%) |
| Mining, Quarrying, & Extraction | 0 (0.0%) | 0 (0.0%) |
| Construction | 1 (100.0%) | 0 (0.0%) |
| Manufacturing | 6 (75.0%) | 2 (25.0%) |
| Wholesale Trade | 2 (100.0%) | 0 (0.0%) |
| Retail Trade | 0 (0.0%) | 0 (0.0%) |
| Transportation & Warehousing | 3 (100.0%) | 0 (0.0%) |
| Utilities | 0 (0.0%) | 0 (0.0%) |
| Information | 0 (0.0%) | 0 (0.0%) |
| Finance & Insurance | 0 (0.0%) | 1 (100.0%) |
| Real Estate, Rental & Leasing | 3 (37.5%) | 5 (62.5%) |
| Professional & Scientific | 0 (0.0%) | 1 (100.0%) |
| Enterprise Management | 0 (0.0%) | 0 (0.0%) |
| Administrative & Support | 0 (0.0%) | 0 (0.0%) |
| Educational Services | 0 (0.0%) | 0 (0.0%) |
| Health Care & Social Assistance | 0 (0.0%) | 4 (100.0%) |
| Arts, Entertainment & Recreation | 0 (0.0%) | 0 (0.0%) |
| Accommodation & Food Services | 0 (0.0%) | 0 (0.0%) |
| Public Administration | 0 (0.0%) | 0 (0.0%) |
| Total | 15 (53.6%) | 13 (46.4%) |
Education in Baker
School Enrollment in Baker
The most common levels of schooling among the 13 students in Baker are middle school (6 | 46.2%), elementary school (5 | 38.5%), and high school (2 | 15.4%).
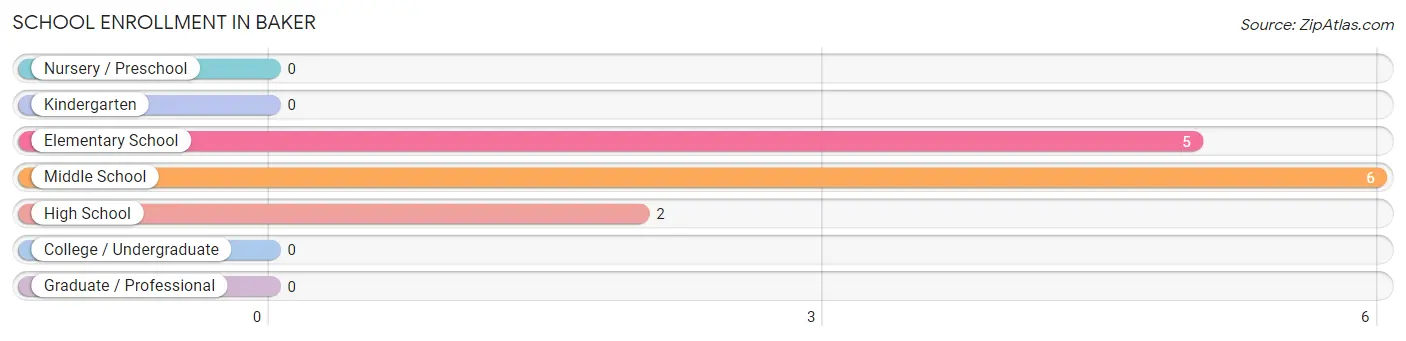
| School Level | # Students | % Students |
| Nursery / Preschool | 0 | 0.0% |
| Kindergarten | 0 | 0.0% |
| Elementary School | 5 | 38.5% |
| Middle School | 6 | 46.2% |
| High School | 2 | 15.4% |
| College / Undergraduate | 0 | 0.0% |
| Graduate / Professional | 0 | 0.0% |
| Total | 13 | 100.0% |
School Enrollment by Age by Funding Source in Baker
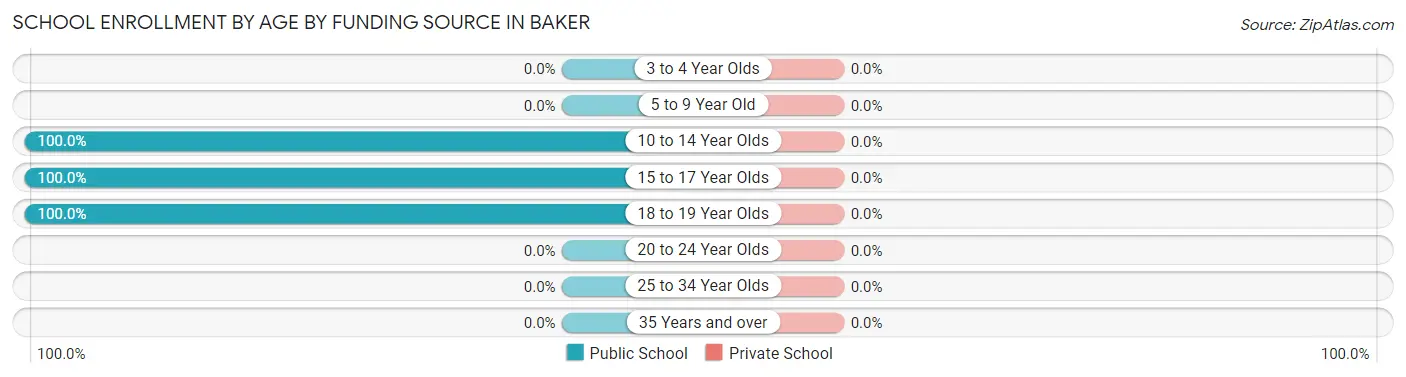
| Age Bracket | Public School | Private School |
| 3 to 4 Year Olds | 0 (0.0%) | 0 (0.0%) |
| 5 to 9 Year Old | 0 (0.0%) | 0 (0.0%) |
| 10 to 14 Year Olds | 11 (100.0%) | 0 (0.0%) |
| 15 to 17 Year Olds | 1 (100.0%) | 0 (0.0%) |
| 18 to 19 Year Olds | 1 (100.0%) | 0 (0.0%) |
| 20 to 24 Year Olds | 0 (0.0%) | 0 (0.0%) |
| 25 to 34 Year Olds | 0 (0.0%) | 0 (0.0%) |
| 35 Years and over | 0 (0.0%) | 0 (0.0%) |
| Total | 13 (100.0%) | 0 (0.0%) |
Educational Attainment by Field of Study in Baker
Computers & mathematics (2 | 28.6%), liberal arts & history (2 | 28.6%), education (1 | 14.3%), visual & performing arts (1 | 14.3%), and arts & humanities (1 | 14.3%) are the most common fields of study among 7 individuals in Baker who have obtained a bachelor's degree or higher.
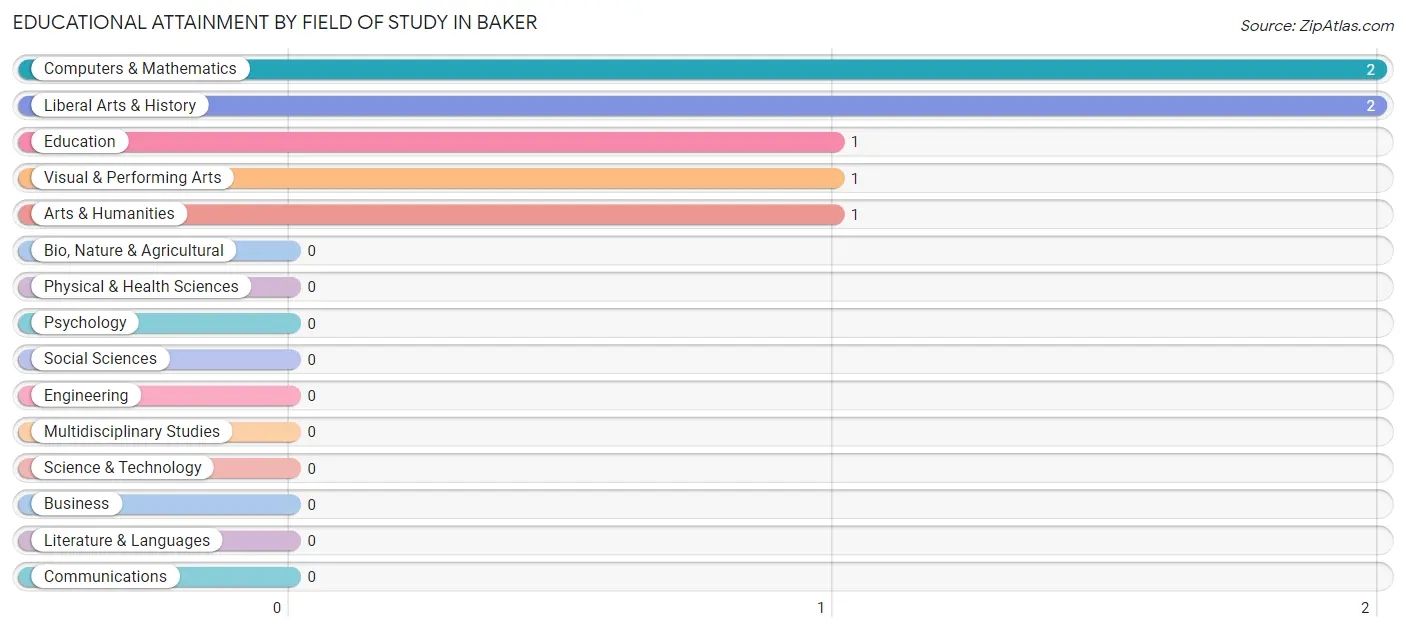
| Field of Study | # Graduates | % Graduates |
| Computers & Mathematics | 2 | 28.6% |
| Bio, Nature & Agricultural | 0 | 0.0% |
| Physical & Health Sciences | 0 | 0.0% |
| Psychology | 0 | 0.0% |
| Social Sciences | 0 | 0.0% |
| Engineering | 0 | 0.0% |
| Multidisciplinary Studies | 0 | 0.0% |
| Science & Technology | 0 | 0.0% |
| Business | 0 | 0.0% |
| Education | 1 | 14.3% |
| Literature & Languages | 0 | 0.0% |
| Liberal Arts & History | 2 | 28.6% |
| Visual & Performing Arts | 1 | 14.3% |
| Communications | 0 | 0.0% |
| Arts & Humanities | 1 | 14.3% |
| Total | 7 | 100.0% |
Transportation & Commute in Baker
Vehicle Availability by Sex in Baker
The most prevalent vehicle ownership categories in Baker are males with 2 vehicles (4, accounting for 26.7%) and females with 2 vehicles (0, making up 30.8%).
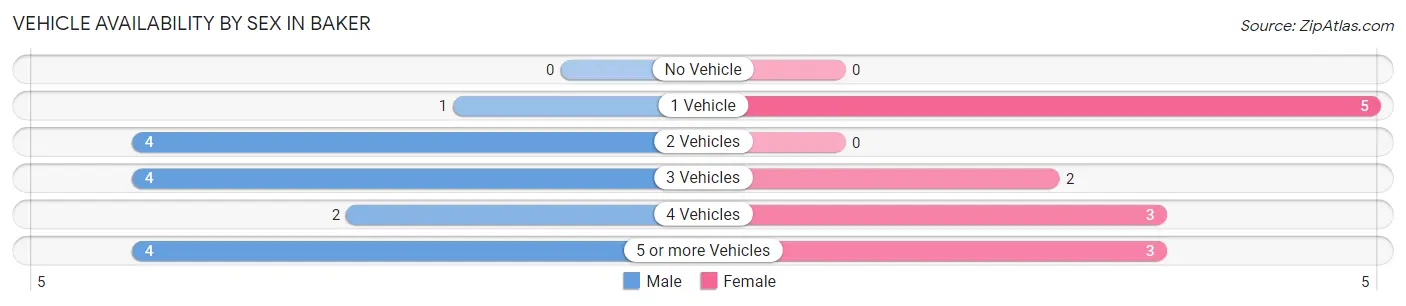
| Vehicles Available | Male | Female |
| No Vehicle | 0 (0.0%) | 0 (0.0%) |
| 1 Vehicle | 1 (6.7%) | 5 (38.5%) |
| 2 Vehicles | 4 (26.7%) | 0 (0.0%) |
| 3 Vehicles | 4 (26.7%) | 2 (15.4%) |
| 4 Vehicles | 2 (13.3%) | 3 (23.1%) |
| 5 or more Vehicles | 4 (26.7%) | 3 (23.1%) |
| Total | 15 (100.0%) | 13 (100.0%) |
Commute Time in Baker
The most frequently occuring commute durations in Baker are 25 to 29 minutes (10 commuters, 37.0%), 30 to 34 minutes (7 commuters, 25.9%), and 35 to 39 minutes (5 commuters, 18.5%).
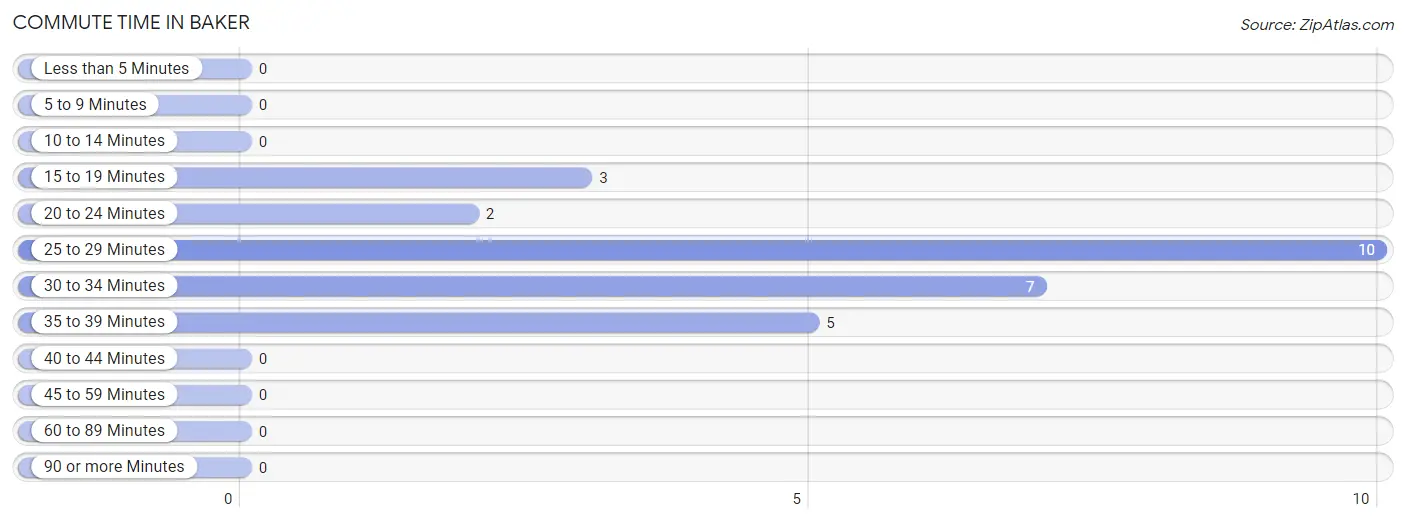
| Commute Time | # Commuters | % Commuters |
| Less than 5 Minutes | 0 | 0.0% |
| 5 to 9 Minutes | 0 | 0.0% |
| 10 to 14 Minutes | 0 | 0.0% |
| 15 to 19 Minutes | 3 | 11.1% |
| 20 to 24 Minutes | 2 | 7.4% |
| 25 to 29 Minutes | 10 | 37.0% |
| 30 to 34 Minutes | 7 | 25.9% |
| 35 to 39 Minutes | 5 | 18.5% |
| 40 to 44 Minutes | 0 | 0.0% |
| 45 to 59 Minutes | 0 | 0.0% |
| 60 to 89 Minutes | 0 | 0.0% |
| 90 or more Minutes | 0 | 0.0% |
Commute Time by Sex in Baker
The most common commute times in Baker are 25 to 29 minutes (5 commuters, 33.3%) for males and 25 to 29 minutes (5 commuters, 41.7%) for females.
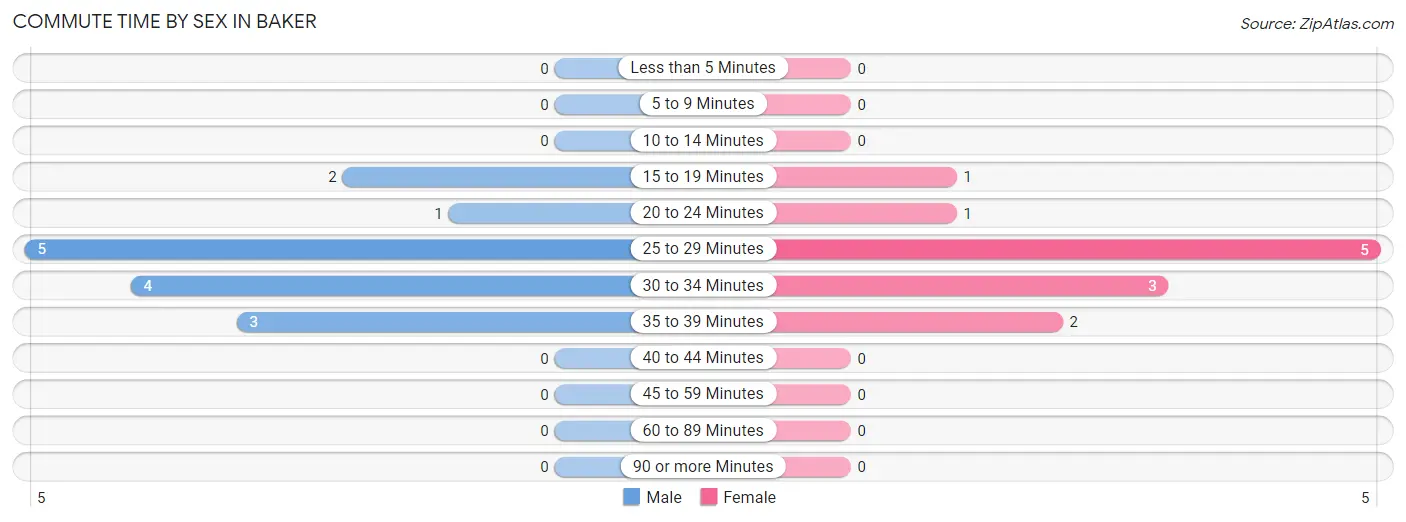
| Commute Time | Male | Female |
| Less than 5 Minutes | 0 (0.0%) | 0 (0.0%) |
| 5 to 9 Minutes | 0 (0.0%) | 0 (0.0%) |
| 10 to 14 Minutes | 0 (0.0%) | 0 (0.0%) |
| 15 to 19 Minutes | 2 (13.3%) | 1 (8.3%) |
| 20 to 24 Minutes | 1 (6.7%) | 1 (8.3%) |
| 25 to 29 Minutes | 5 (33.3%) | 5 (41.7%) |
| 30 to 34 Minutes | 4 (26.7%) | 3 (25.0%) |
| 35 to 39 Minutes | 3 (20.0%) | 2 (16.7%) |
| 40 to 44 Minutes | 0 (0.0%) | 0 (0.0%) |
| 45 to 59 Minutes | 0 (0.0%) | 0 (0.0%) |
| 60 to 89 Minutes | 0 (0.0%) | 0 (0.0%) |
| 90 or more Minutes | 0 (0.0%) | 0 (0.0%) |
Time of Departure to Work by Sex in Baker
The most frequent times of departure to work in Baker are 12:00 AM to 4:59 AM (6, 40.0%) for males and 6:00 AM to 6:29 AM (5, 41.7%) for females.
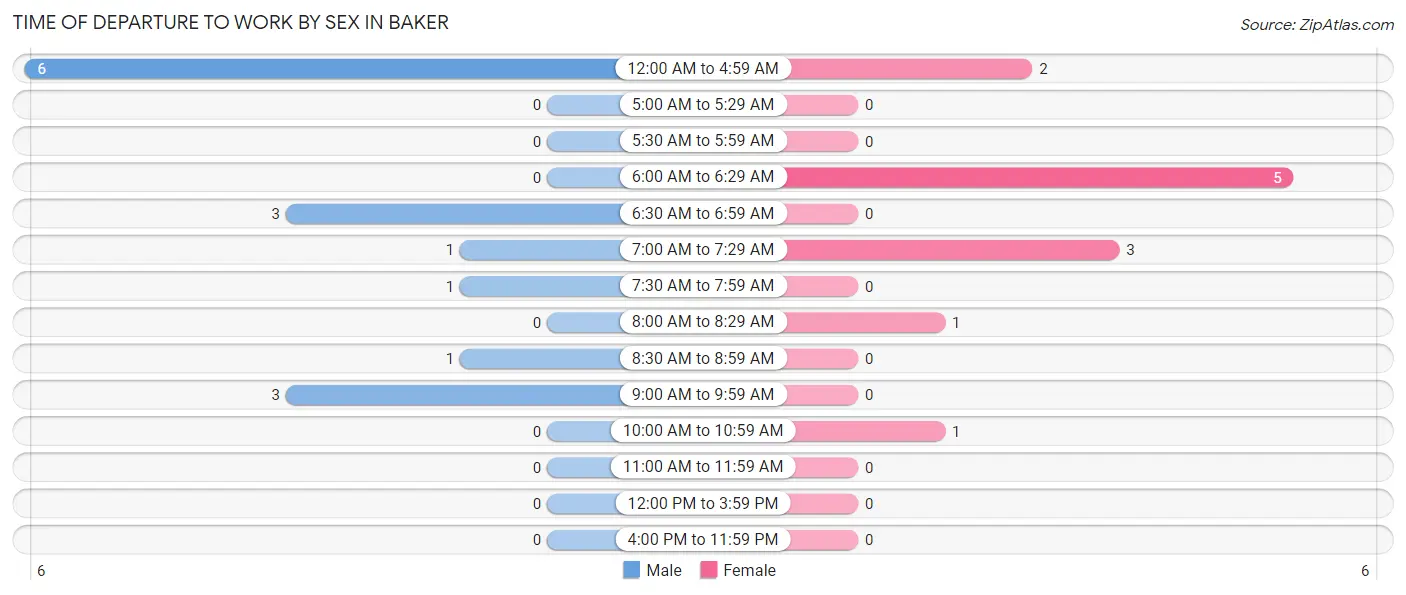
| Time of Departure | Male | Female |
| 12:00 AM to 4:59 AM | 6 (40.0%) | 2 (16.7%) |
| 5:00 AM to 5:29 AM | 0 (0.0%) | 0 (0.0%) |
| 5:30 AM to 5:59 AM | 0 (0.0%) | 0 (0.0%) |
| 6:00 AM to 6:29 AM | 0 (0.0%) | 5 (41.7%) |
| 6:30 AM to 6:59 AM | 3 (20.0%) | 0 (0.0%) |
| 7:00 AM to 7:29 AM | 1 (6.7%) | 3 (25.0%) |
| 7:30 AM to 7:59 AM | 1 (6.7%) | 0 (0.0%) |
| 8:00 AM to 8:29 AM | 0 (0.0%) | 1 (8.3%) |
| 8:30 AM to 8:59 AM | 1 (6.7%) | 0 (0.0%) |
| 9:00 AM to 9:59 AM | 3 (20.0%) | 0 (0.0%) |
| 10:00 AM to 10:59 AM | 0 (0.0%) | 1 (8.3%) |
| 11:00 AM to 11:59 AM | 0 (0.0%) | 0 (0.0%) |
| 12:00 PM to 3:59 PM | 0 (0.0%) | 0 (0.0%) |
| 4:00 PM to 11:59 PM | 0 (0.0%) | 0 (0.0%) |
| Total | 15 (100.0%) | 12 (100.0%) |
Housing Occupancy in Baker
Occupancy by Ownership in Baker
Of the total 21 dwellings in Baker, owner-occupied units account for 16 (76.2%), while renter-occupied units make up 5 (23.8%).
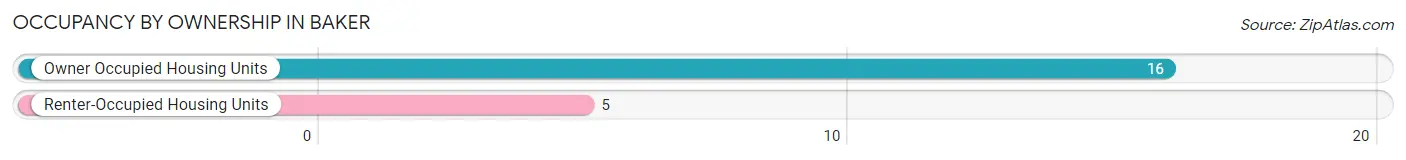
| Occupancy | # Housing Units | % Housing Units |
| Owner Occupied Housing Units | 16 | 76.2% |
| Renter-Occupied Housing Units | 5 | 23.8% |
| Total Occupied Housing Units | 21 | 100.0% |
Occupancy by Household Size in Baker
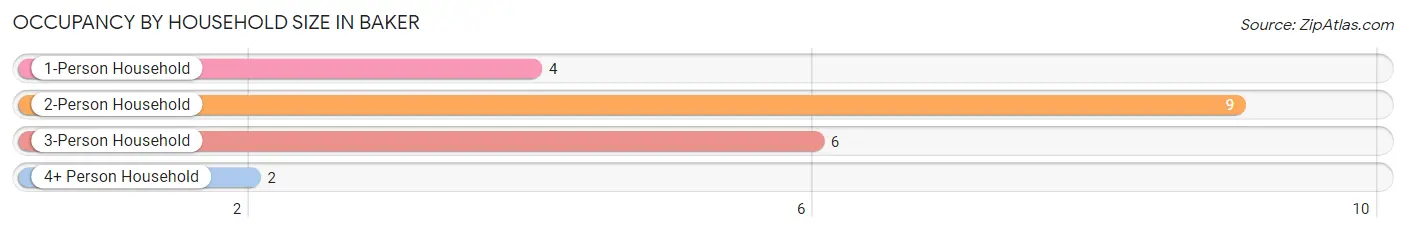
| Household Size | # Housing Units | % Housing Units |
| 1-Person Household | 4 | 19.1% |
| 2-Person Household | 9 | 42.9% |
| 3-Person Household | 6 | 28.6% |
| 4+ Person Household | 2 | 9.5% |
| Total Housing Units | 21 | 100.0% |
Occupancy by Ownership by Household Size in Baker
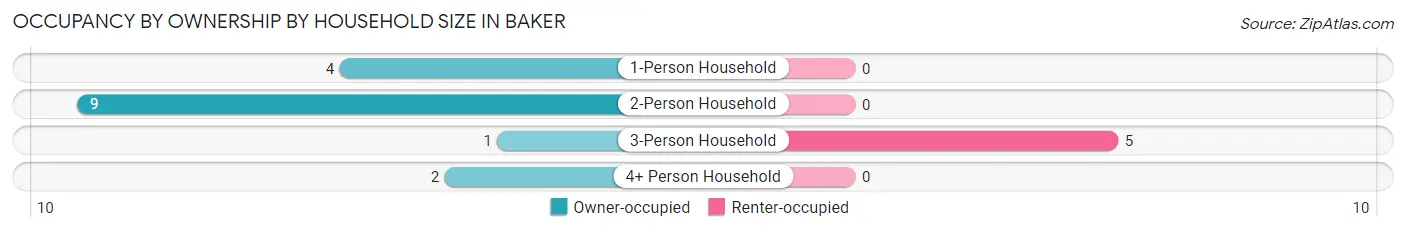
| Household Size | Owner-occupied | Renter-occupied |
| 1-Person Household | 4 (100.0%) | 0 (0.0%) |
| 2-Person Household | 9 (100.0%) | 0 (0.0%) |
| 3-Person Household | 1 (16.7%) | 5 (83.3%) |
| 4+ Person Household | 2 (100.0%) | 0 (0.0%) |
| Total Housing Units | 16 (76.2%) | 5 (23.8%) |
Occupancy by Educational Attainment in Baker
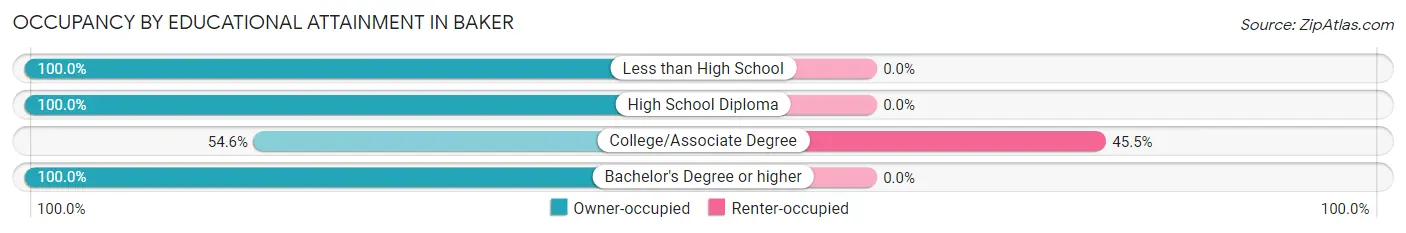
| Household Size | Owner-occupied | Renter-occupied |
| Less than High School | 1 (100.0%) | 0 (0.0%) |
| High School Diploma | 3 (100.0%) | 0 (0.0%) |
| College/Associate Degree | 6 (54.5%) | 5 (45.5%) |
| Bachelor's Degree or higher | 6 (100.0%) | 0 (0.0%) |
Occupancy by Age of Householder in Baker
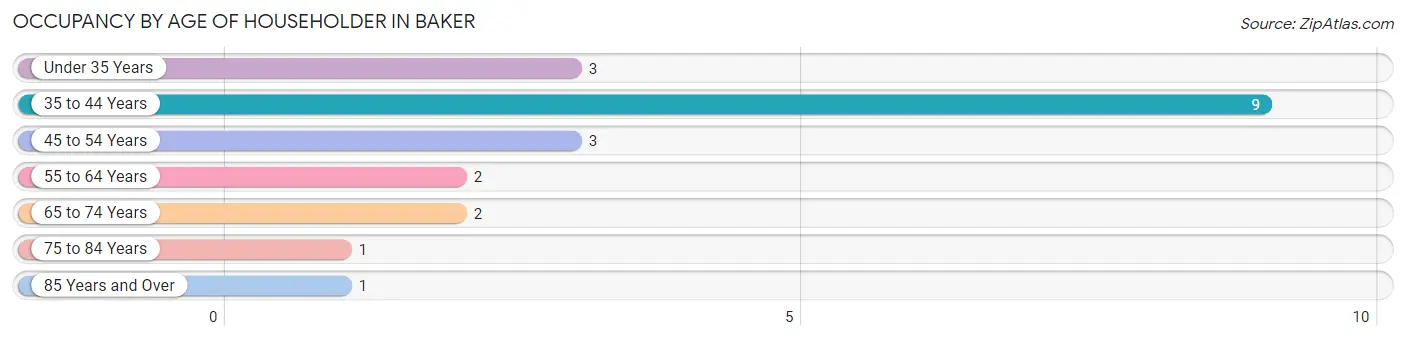
| Age Bracket | # Households | % Households |
| Under 35 Years | 3 | 14.3% |
| 35 to 44 Years | 9 | 42.9% |
| 45 to 54 Years | 3 | 14.3% |
| 55 to 64 Years | 2 | 9.5% |
| 65 to 74 Years | 2 | 9.5% |
| 75 to 84 Years | 1 | 4.8% |
| 85 Years and Over | 1 | 4.8% |
| Total | 21 | 100.0% |
Housing Finances in Baker
Median Income by Occupancy in Baker
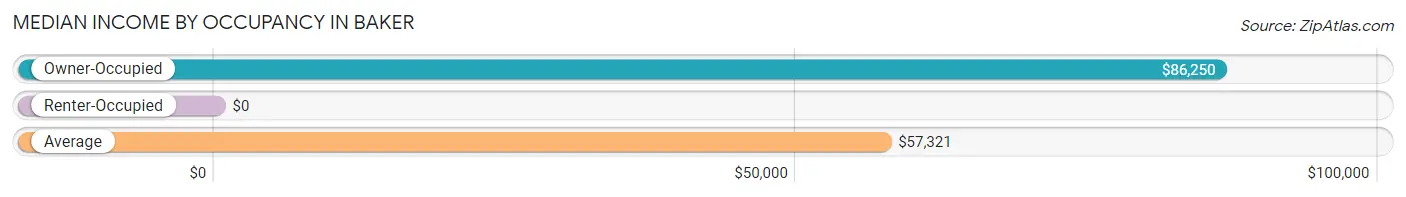
| Occupancy Type | # Households | Median Income |
| Owner-Occupied | 16 (76.2%) | $86,250 |
| Renter-Occupied | 5 (23.8%) | $0 |
| Average | 21 (100.0%) | $57,321 |
Occupancy by Householder Income Bracket in Baker
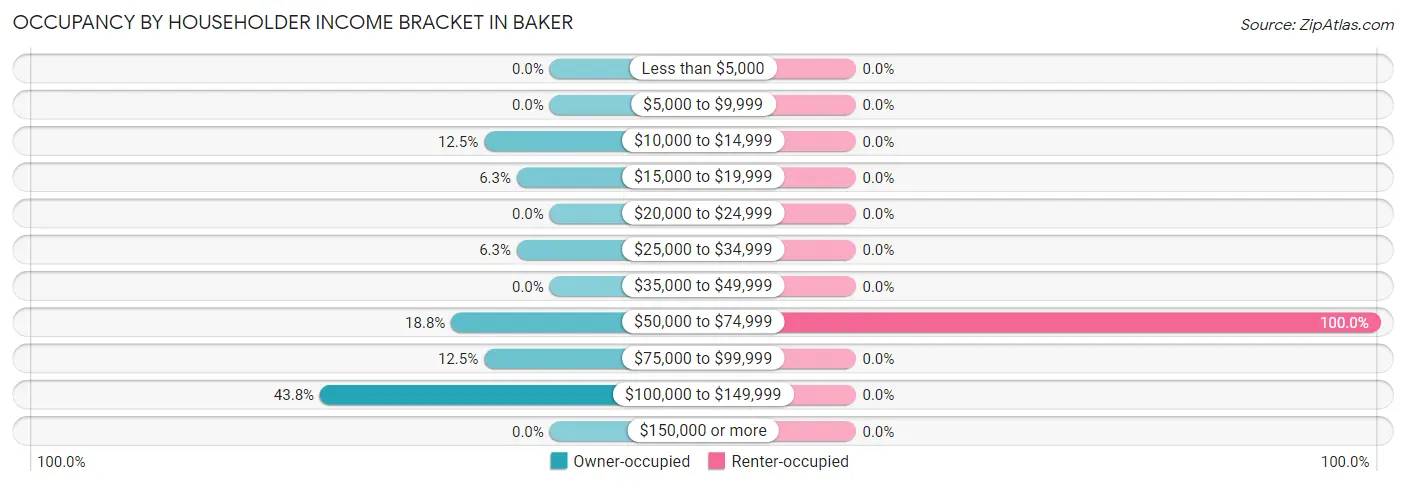
| Income Bracket | Owner-occupied | Renter-occupied |
| Less than $5,000 | 0 (0.0%) | 0 (0.0%) |
| $5,000 to $9,999 | 0 (0.0%) | 0 (0.0%) |
| $10,000 to $14,999 | 2 (12.5%) | 0 (0.0%) |
| $15,000 to $19,999 | 1 (6.2%) | 0 (0.0%) |
| $20,000 to $24,999 | 0 (0.0%) | 0 (0.0%) |
| $25,000 to $34,999 | 1 (6.2%) | 0 (0.0%) |
| $35,000 to $49,999 | 0 (0.0%) | 0 (0.0%) |
| $50,000 to $74,999 | 3 (18.8%) | 5 (100.0%) |
| $75,000 to $99,999 | 2 (12.5%) | 0 (0.0%) |
| $100,000 to $149,999 | 7 (43.8%) | 0 (0.0%) |
| $150,000 or more | 0 (0.0%) | 0 (0.0%) |
| Total | 16 (100.0%) | 5 (100.0%) |
Monthly Housing Cost Tiers in Baker
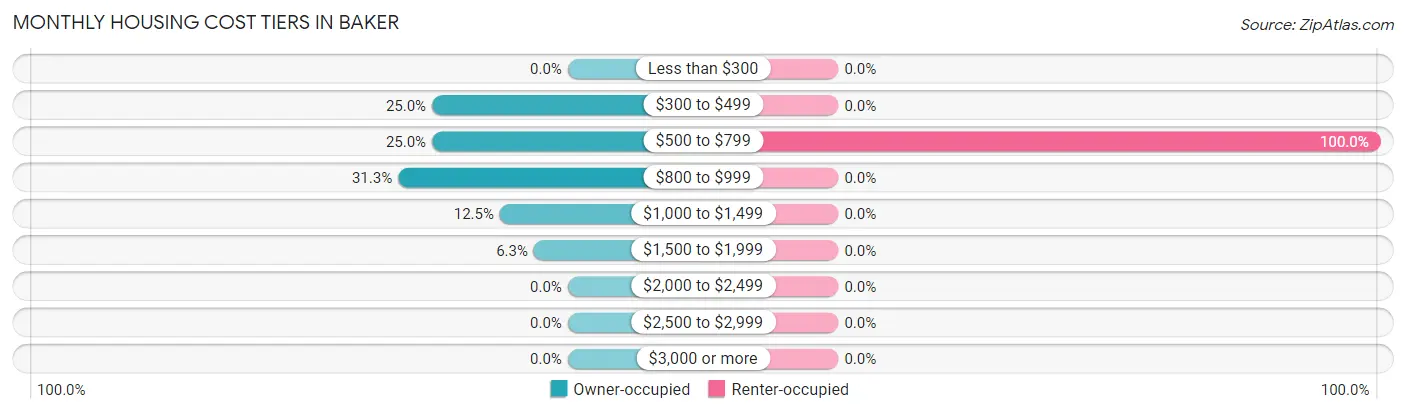
| Monthly Cost | Owner-occupied | Renter-occupied |
| Less than $300 | 0 (0.0%) | 0 (0.0%) |
| $300 to $499 | 4 (25.0%) | 0 (0.0%) |
| $500 to $799 | 4 (25.0%) | 5 (100.0%) |
| $800 to $999 | 5 (31.2%) | 0 (0.0%) |
| $1,000 to $1,499 | 2 (12.5%) | 0 (0.0%) |
| $1,500 to $1,999 | 1 (6.2%) | 0 (0.0%) |
| $2,000 to $2,499 | 0 (0.0%) | 0 (0.0%) |
| $2,500 to $2,999 | 0 (0.0%) | 0 (0.0%) |
| $3,000 or more | 0 (0.0%) | 0 (0.0%) |
| Total | 16 (100.0%) | 5 (100.0%) |
Physical Housing Characteristics in Baker
Housing Structures in Baker
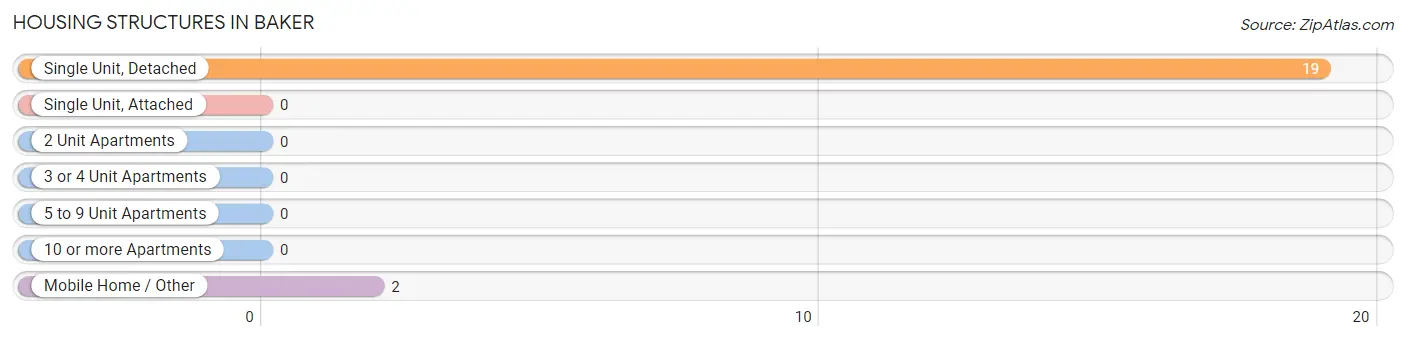
| Structure Type | # Housing Units | % Housing Units |
| Single Unit, Detached | 19 | 90.5% |
| Single Unit, Attached | 0 | 0.0% |
| 2 Unit Apartments | 0 | 0.0% |
| 3 or 4 Unit Apartments | 0 | 0.0% |
| 5 to 9 Unit Apartments | 0 | 0.0% |
| 10 or more Apartments | 0 | 0.0% |
| Mobile Home / Other | 2 | 9.5% |
| Total | 21 | 100.0% |
Housing Structures by Occupancy in Baker
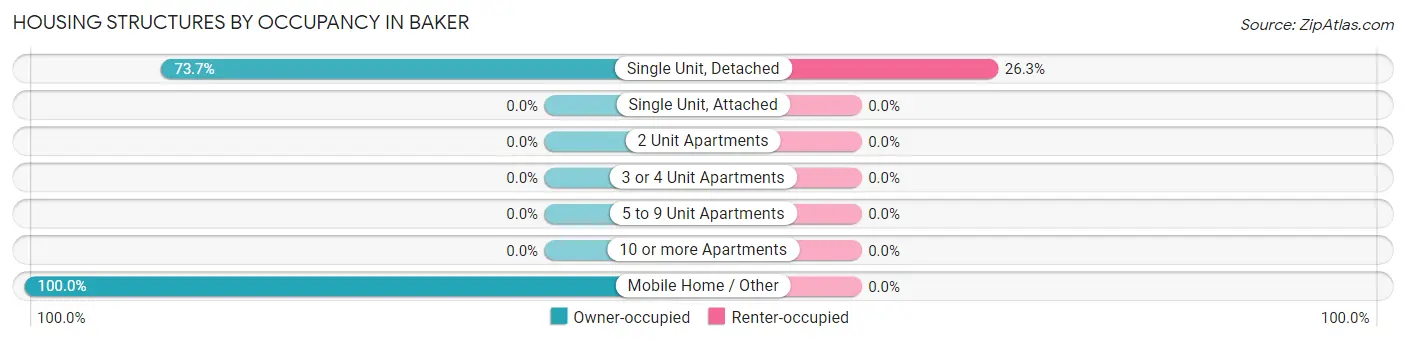
| Structure Type | Owner-occupied | Renter-occupied |
| Single Unit, Detached | 14 (73.7%) | 5 (26.3%) |
| Single Unit, Attached | 0 (0.0%) | 0 (0.0%) |
| 2 Unit Apartments | 0 (0.0%) | 0 (0.0%) |
| 3 or 4 Unit Apartments | 0 (0.0%) | 0 (0.0%) |
| 5 to 9 Unit Apartments | 0 (0.0%) | 0 (0.0%) |
| 10 or more Apartments | 0 (0.0%) | 0 (0.0%) |
| Mobile Home / Other | 2 (100.0%) | 0 (0.0%) |
| Total | 16 (76.2%) | 5 (23.8%) |
Housing Structures by Number of Rooms in Baker
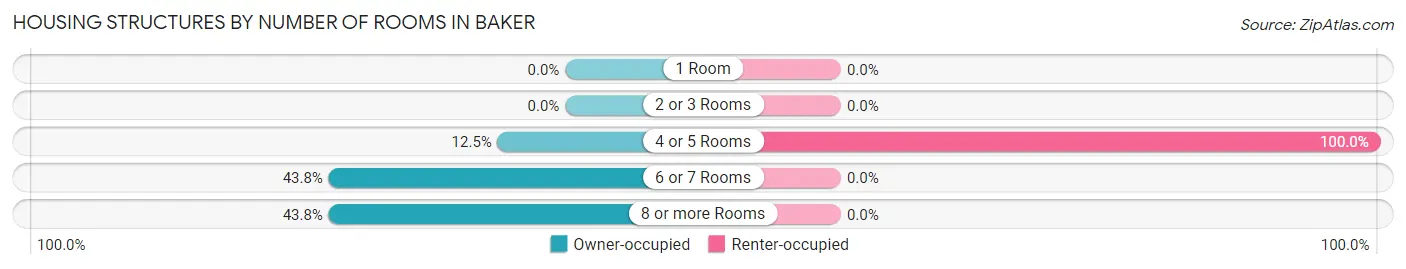
| Number of Rooms | Owner-occupied | Renter-occupied |
| 1 Room | 0 (0.0%) | 0 (0.0%) |
| 2 or 3 Rooms | 0 (0.0%) | 0 (0.0%) |
| 4 or 5 Rooms | 2 (12.5%) | 5 (100.0%) |
| 6 or 7 Rooms | 7 (43.8%) | 0 (0.0%) |
| 8 or more Rooms | 7 (43.8%) | 0 (0.0%) |
| Total | 16 (100.0%) | 5 (100.0%) |
Housing Structure by Heating Type in Baker
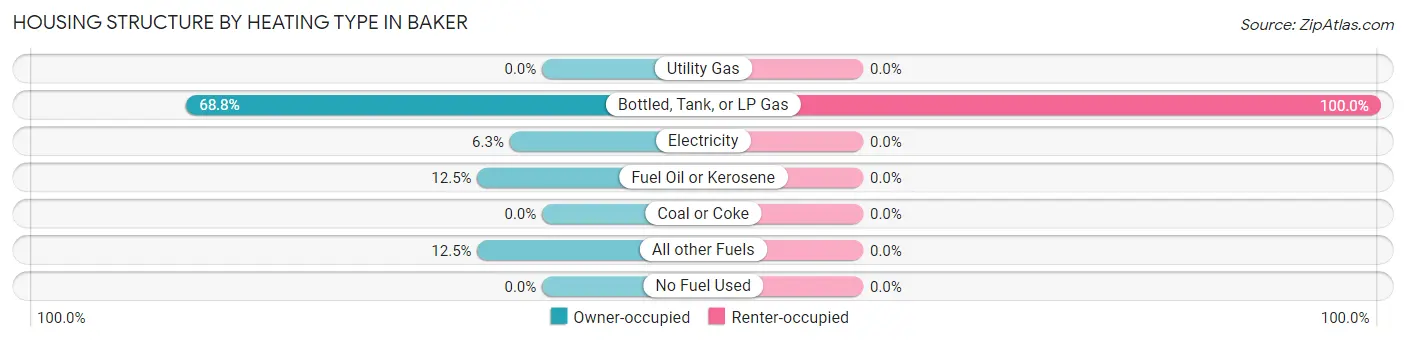
| Heating Type | Owner-occupied | Renter-occupied |
| Utility Gas | 0 (0.0%) | 0 (0.0%) |
| Bottled, Tank, or LP Gas | 11 (68.8%) | 5 (100.0%) |
| Electricity | 1 (6.2%) | 0 (0.0%) |
| Fuel Oil or Kerosene | 2 (12.5%) | 0 (0.0%) |
| Coal or Coke | 0 (0.0%) | 0 (0.0%) |
| All other Fuels | 2 (12.5%) | 0 (0.0%) |
| No Fuel Used | 0 (0.0%) | 0 (0.0%) |
| Total | 16 (100.0%) | 5 (100.0%) |
Household Vehicle Usage in Baker
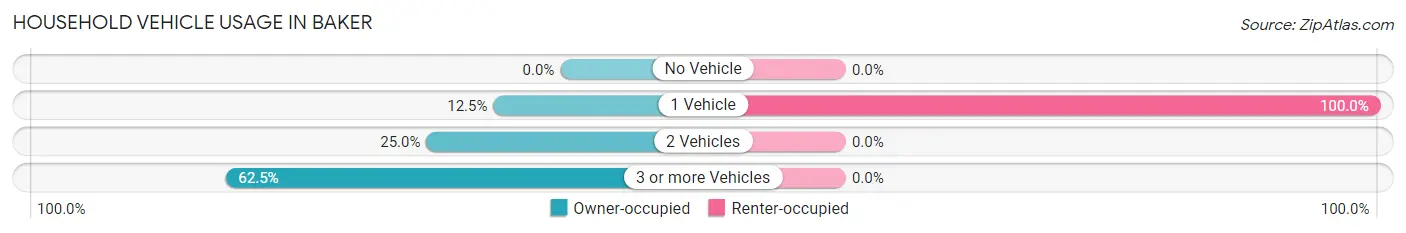
| Vehicles per Household | Owner-occupied | Renter-occupied |
| No Vehicle | 0 (0.0%) | 0 (0.0%) |
| 1 Vehicle | 2 (12.5%) | 5 (100.0%) |
| 2 Vehicles | 4 (25.0%) | 0 (0.0%) |
| 3 or more Vehicles | 10 (62.5%) | 0 (0.0%) |
| Total | 16 (100.0%) | 5 (100.0%) |
Real Estate & Mortgages in Baker
Real Estate and Mortgage Overview in Baker
| Characteristic | Without Mortgage | With Mortgage |
| Housing Units | 7 | 9 |
| Median Property Value | $168,800 | $143,800 |
| Median Household Income | - | - |
| Monthly Housing Costs | $475 | $0 |
| Real Estate Taxes | - | - |
Property Value by Mortgage Status in Baker
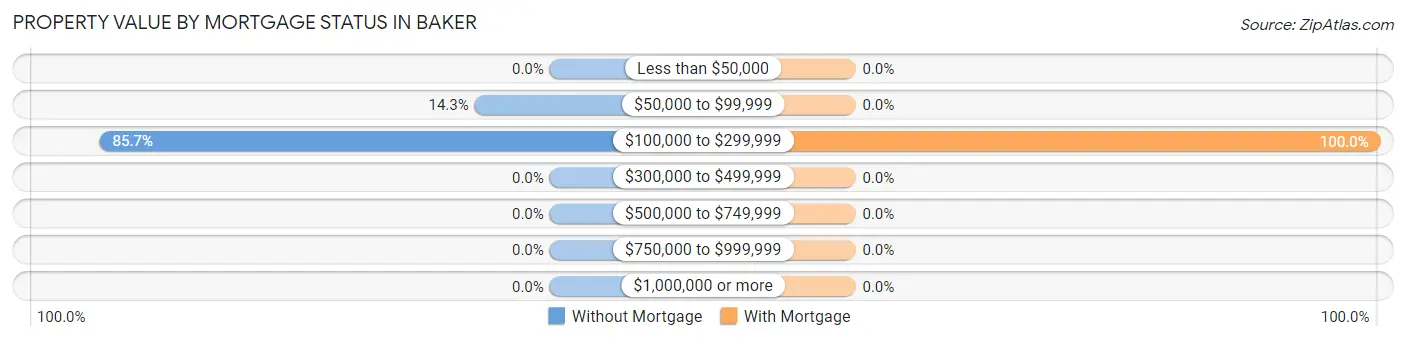
| Property Value | Without Mortgage | With Mortgage |
| Less than $50,000 | 0 (0.0%) | 0 (0.0%) |
| $50,000 to $99,999 | 1 (14.3%) | 0 (0.0%) |
| $100,000 to $299,999 | 6 (85.7%) | 9 (100.0%) |
| $300,000 to $499,999 | 0 (0.0%) | 0 (0.0%) |
| $500,000 to $749,999 | 0 (0.0%) | 0 (0.0%) |
| $750,000 to $999,999 | 0 (0.0%) | 0 (0.0%) |
| $1,000,000 or more | 0 (0.0%) | 0 (0.0%) |
| Total | 7 (100.0%) | 9 (100.0%) |
Household Income by Mortgage Status in Baker
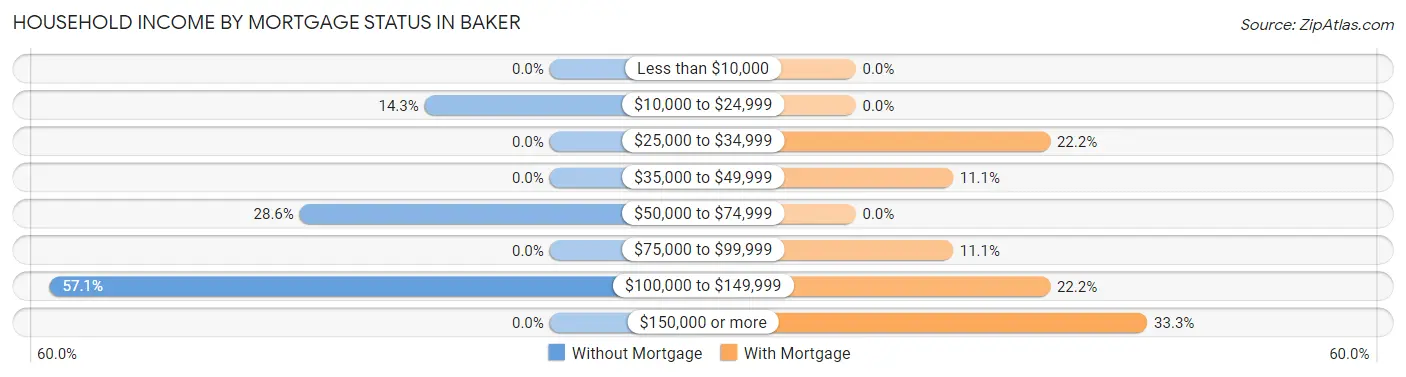
| Household Income | Without Mortgage | With Mortgage |
| Less than $10,000 | 0 (0.0%) | 0 (0.0%) |
| $10,000 to $24,999 | 1 (14.3%) | 0 (0.0%) |
| $25,000 to $34,999 | 0 (0.0%) | 2 (22.2%) |
| $35,000 to $49,999 | 0 (0.0%) | 1 (11.1%) |
| $50,000 to $74,999 | 2 (28.6%) | 0 (0.0%) |
| $75,000 to $99,999 | 0 (0.0%) | 1 (11.1%) |
| $100,000 to $149,999 | 4 (57.1%) | 2 (22.2%) |
| $150,000 or more | 0 (0.0%) | 3 (33.3%) |
| Total | 7 (100.0%) | 9 (100.0%) |
Property Value to Household Income Ratio in Baker
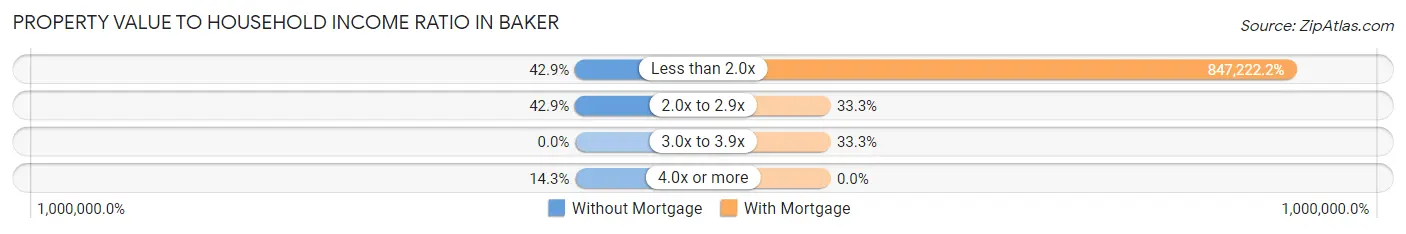
| Value-to-Income Ratio | Without Mortgage | With Mortgage |
| Less than 2.0x | 3 (42.9%) | 76,250 (847,222.2%) |
| 2.0x to 2.9x | 3 (42.9%) | 3 (33.3%) |
| 3.0x to 3.9x | 0 (0.0%) | 3 (33.3%) |
| 4.0x or more | 1 (14.3%) | 0 (0.0%) |
| Total | 7 (100.0%) | 9 (100.0%) |
Real Estate Taxes by Mortgage Status in Baker
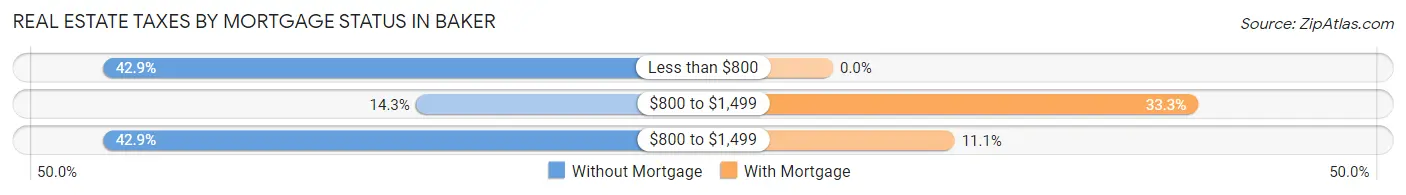
| Property Taxes | Without Mortgage | With Mortgage |
| Less than $800 | 3 (42.9%) | 0 (0.0%) |
| $800 to $1,499 | 1 (14.3%) | 3 (33.3%) |
| $800 to $1,499 | 3 (42.9%) | 1 (11.1%) |
| Total | 7 (100.0%) | 9 (100.0%) |
Health & Disability in Baker
Health Insurance Coverage by Age in Baker
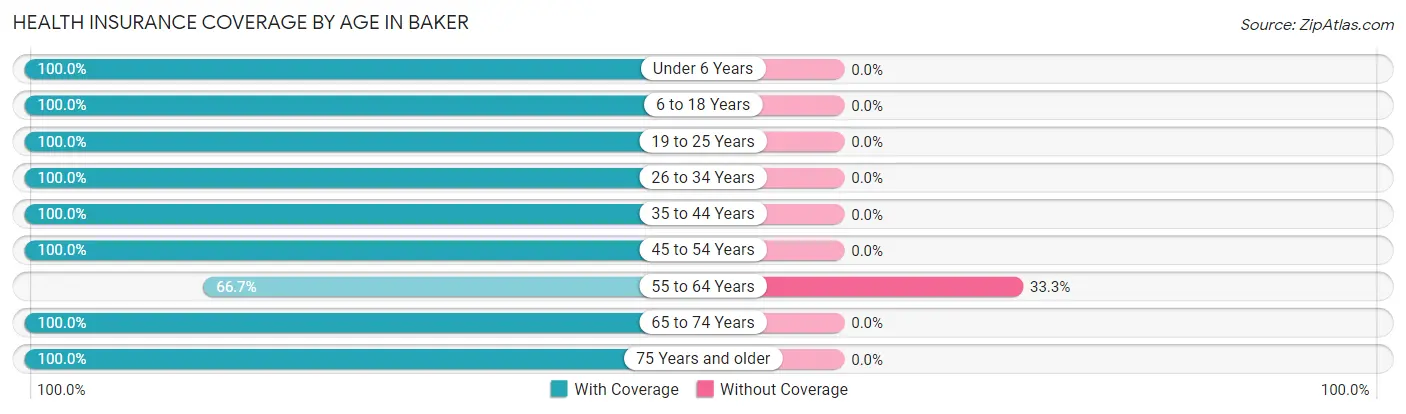
| Age Bracket | With Coverage | Without Coverage |
| Under 6 Years | 2 (100.0%) | 0 (0.0%) |
| 6 to 18 Years | 13 (100.0%) | 0 (0.0%) |
| 19 to 25 Years | 2 (100.0%) | 0 (0.0%) |
| 26 to 34 Years | 3 (100.0%) | 0 (0.0%) |
| 35 to 44 Years | 13 (100.0%) | 0 (0.0%) |
| 45 to 54 Years | 3 (100.0%) | 0 (0.0%) |
| 55 to 64 Years | 4 (66.7%) | 2 (33.3%) |
| 65 to 74 Years | 3 (100.0%) | 0 (0.0%) |
| 75 Years and older | 2 (100.0%) | 0 (0.0%) |
| Total | 45 (95.7%) | 2 (4.3%) |
Health Insurance Coverage by Citizenship Status in Baker
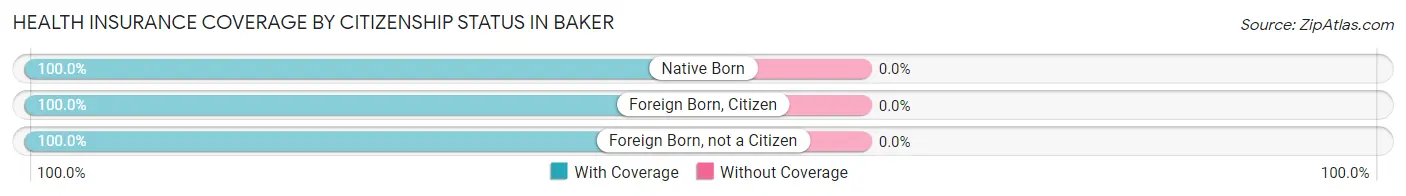
| Citizenship Status | With Coverage | Without Coverage |
| Native Born | 2 (100.0%) | 0 (0.0%) |
| Foreign Born, Citizen | 13 (100.0%) | 0 (0.0%) |
| Foreign Born, not a Citizen | 2 (100.0%) | 0 (0.0%) |
Health Insurance Coverage by Household Income in Baker
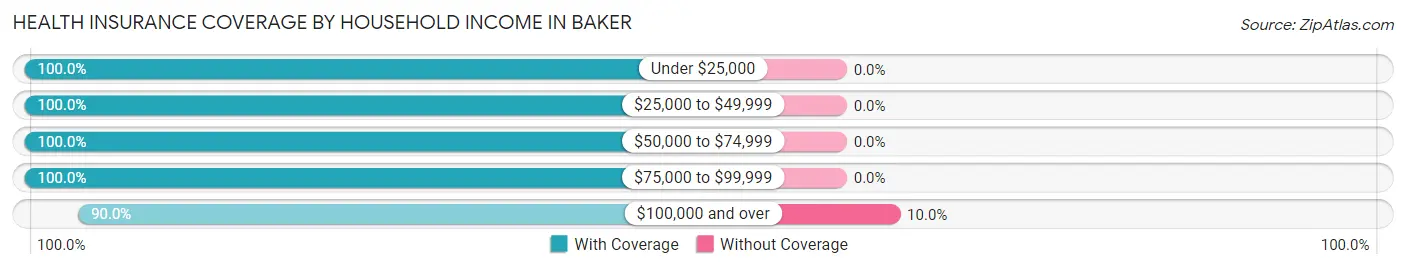
| Household Income | With Coverage | Without Coverage |
| Under $25,000 | 4 (100.0%) | 0 (0.0%) |
| $25,000 to $49,999 | 1 (100.0%) | 0 (0.0%) |
| $50,000 to $74,999 | 19 (100.0%) | 0 (0.0%) |
| $75,000 to $99,999 | 3 (100.0%) | 0 (0.0%) |
| $100,000 and over | 18 (90.0%) | 2 (10.0%) |
Public vs Private Health Insurance Coverage by Age in Baker
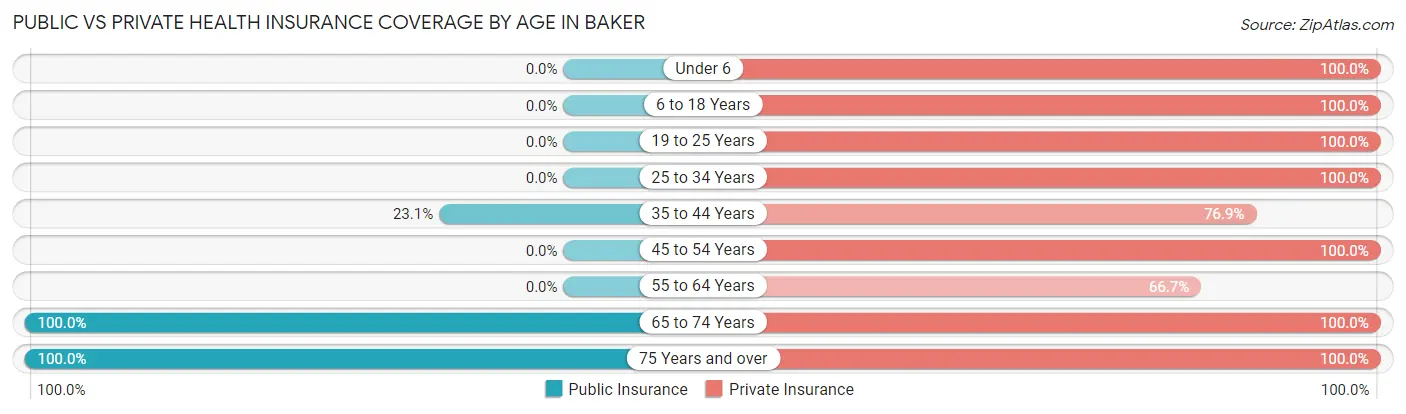
| Age Bracket | Public Insurance | Private Insurance |
| Under 6 | 0 (0.0%) | 2 (100.0%) |
| 6 to 18 Years | 0 (0.0%) | 13 (100.0%) |
| 19 to 25 Years | 0 (0.0%) | 2 (100.0%) |
| 25 to 34 Years | 0 (0.0%) | 3 (100.0%) |
| 35 to 44 Years | 3 (23.1%) | 10 (76.9%) |
| 45 to 54 Years | 0 (0.0%) | 3 (100.0%) |
| 55 to 64 Years | 0 (0.0%) | 4 (66.7%) |
| 65 to 74 Years | 3 (100.0%) | 3 (100.0%) |
| 75 Years and over | 2 (100.0%) | 2 (100.0%) |
| Total | 8 (17.0%) | 42 (89.4%) |
Disability Status by Sex by Age in Baker
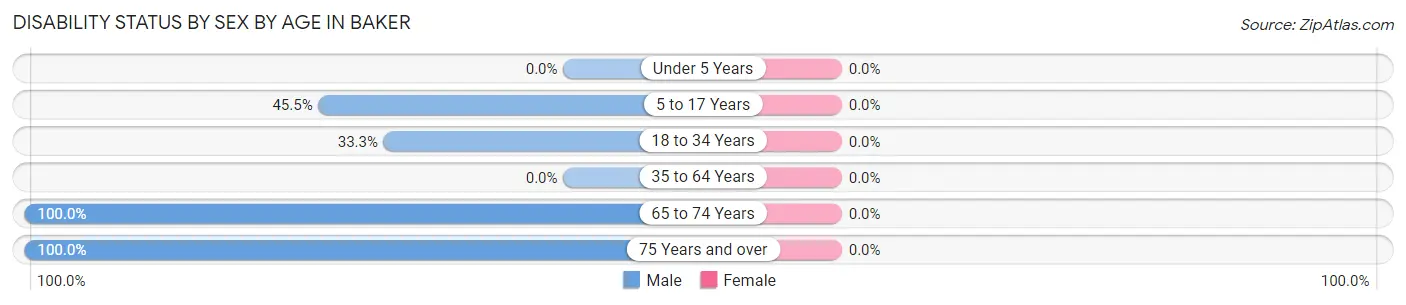
| Age Bracket | Male | Female |
| Under 5 Years | 0 (0.0%) | 0 (0.0%) |
| 5 to 17 Years | 5 (45.5%) | 0 (0.0%) |
| 18 to 34 Years | 1 (33.3%) | 0 (0.0%) |
| 35 to 64 Years | 0 (0.0%) | 0 (0.0%) |
| 65 to 74 Years | 1 (100.0%) | 0 (0.0%) |
| 75 Years and over | 1 (100.0%) | 0 (0.0%) |
Disability Class by Sex by Age in Baker
Disability Class: Hearing Difficulty
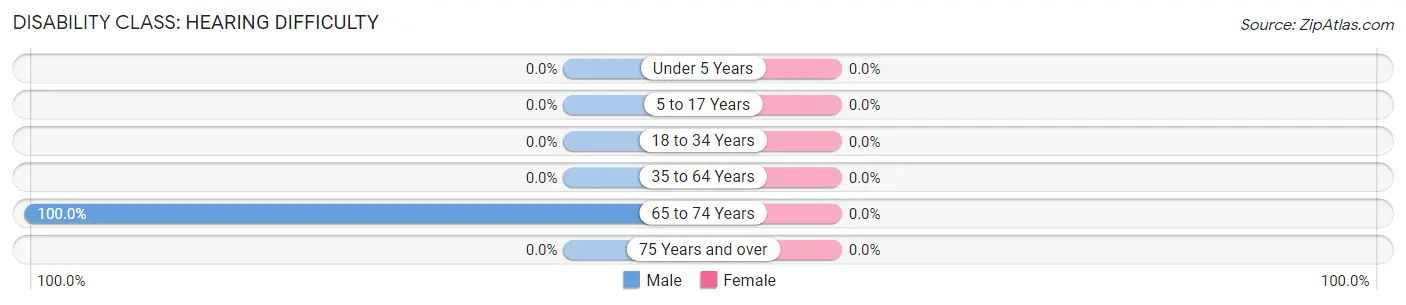
| Age Bracket | Male | Female |
| Under 5 Years | 0 (0.0%) | 0 (0.0%) |
| 5 to 17 Years | 0 (0.0%) | 0 (0.0%) |
| 18 to 34 Years | 0 (0.0%) | 0 (0.0%) |
| 35 to 64 Years | 0 (0.0%) | 0 (0.0%) |
| 65 to 74 Years | 1 (100.0%) | 0 (0.0%) |
| 75 Years and over | 0 (0.0%) | 0 (0.0%) |
Disability Class: Vision Difficulty
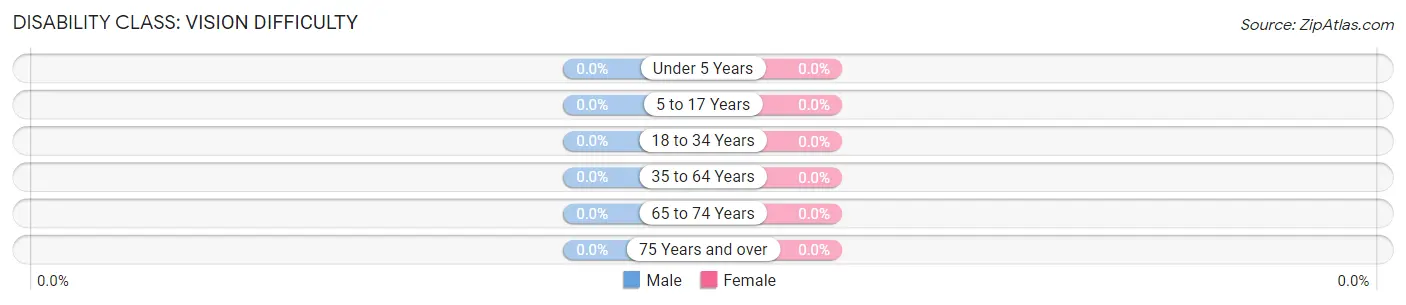
| Age Bracket | Male | Female |
| Under 5 Years | 0 (0.0%) | 0 (0.0%) |
| 5 to 17 Years | 0 (0.0%) | 0 (0.0%) |
| 18 to 34 Years | 0 (0.0%) | 0 (0.0%) |
| 35 to 64 Years | 0 (0.0%) | 0 (0.0%) |
| 65 to 74 Years | 0 (0.0%) | 0 (0.0%) |
| 75 Years and over | 0 (0.0%) | 0 (0.0%) |
Disability Class: Cognitive Difficulty
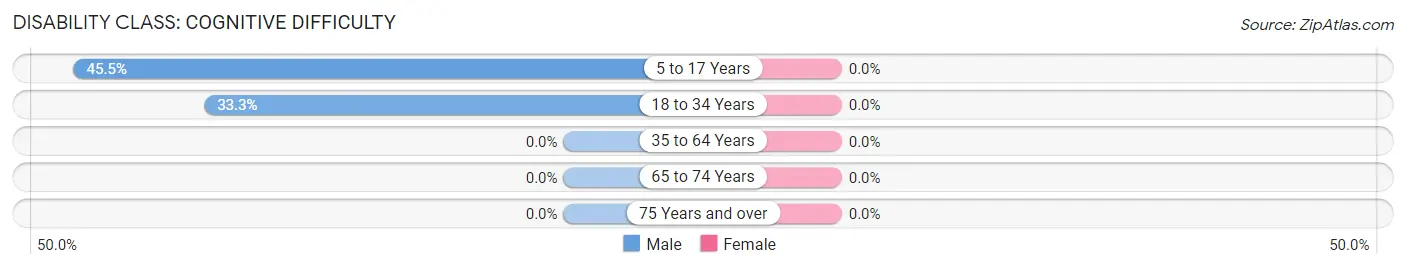
| Age Bracket | Male | Female |
| 5 to 17 Years | 5 (45.5%) | 0 (0.0%) |
| 18 to 34 Years | 1 (33.3%) | 0 (0.0%) |
| 35 to 64 Years | 0 (0.0%) | 0 (0.0%) |
| 65 to 74 Years | 0 (0.0%) | 0 (0.0%) |
| 75 Years and over | 0 (0.0%) | 0 (0.0%) |
Disability Class: Ambulatory Difficulty
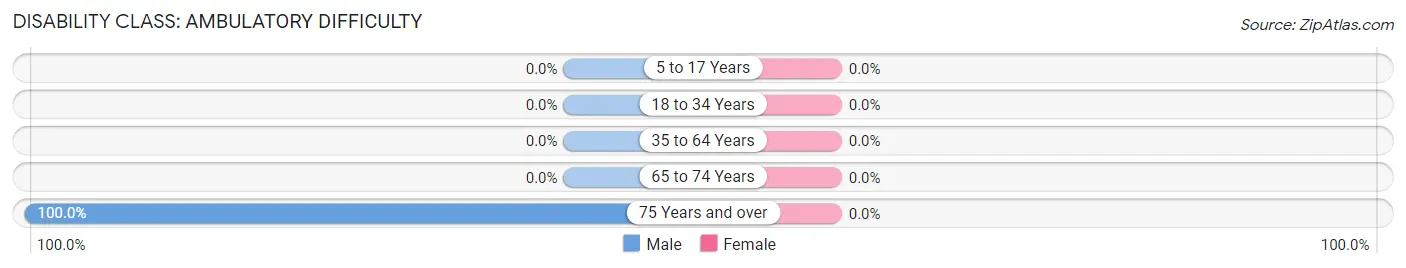
| Age Bracket | Male | Female |
| 5 to 17 Years | 0 (0.0%) | 0 (0.0%) |
| 18 to 34 Years | 0 (0.0%) | 0 (0.0%) |
| 35 to 64 Years | 0 (0.0%) | 0 (0.0%) |
| 65 to 74 Years | 0 (0.0%) | 0 (0.0%) |
| 75 Years and over | 1 (100.0%) | 0 (0.0%) |
Disability Class: Self-Care Difficulty
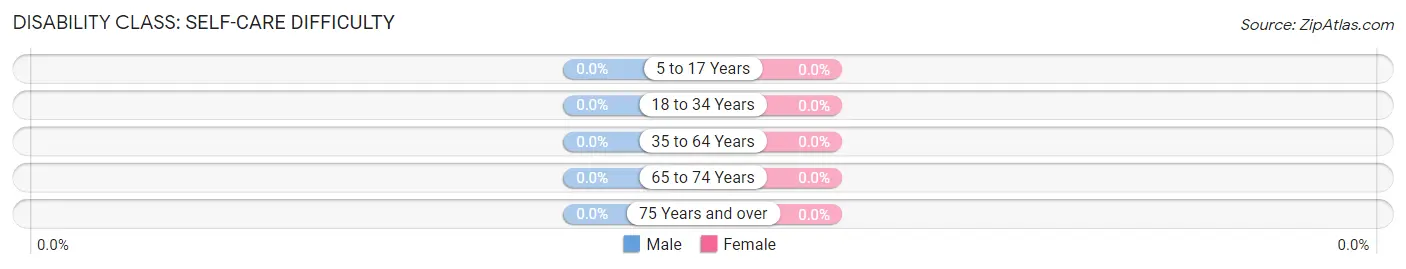
| Age Bracket | Male | Female |
| 5 to 17 Years | 0 (0.0%) | 0 (0.0%) |
| 18 to 34 Years | 0 (0.0%) | 0 (0.0%) |
| 35 to 64 Years | 0 (0.0%) | 0 (0.0%) |
| 65 to 74 Years | 0 (0.0%) | 0 (0.0%) |
| 75 Years and over | 0 (0.0%) | 0 (0.0%) |
Technology Access in Baker
Computing Device Access in Baker
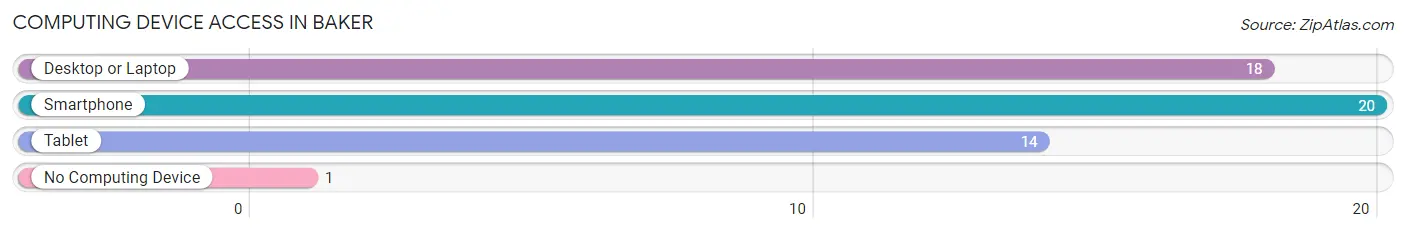
| Device Type | # Households | % Households |
| Desktop or Laptop | 18 | 85.7% |
| Smartphone | 20 | 95.2% |
| Tablet | 14 | 66.7% |
| No Computing Device | 1 | 4.8% |
| Total | 21 | 100.0% |
Internet Access in Baker
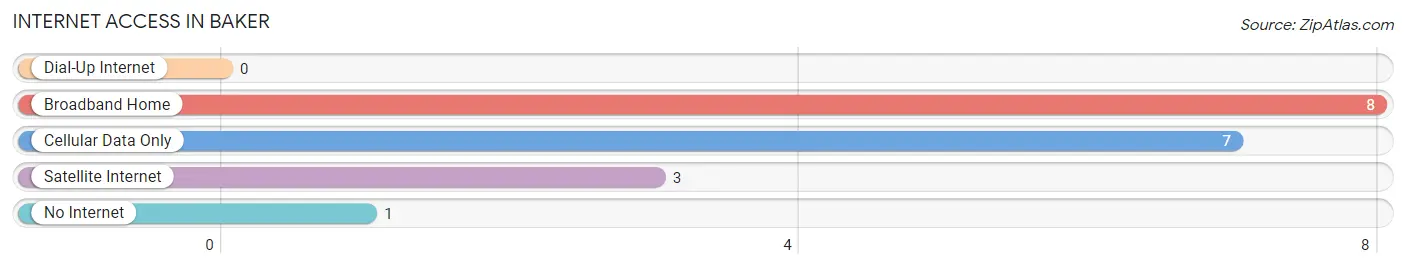
| Internet Type | # Households | % Households |
| Dial-Up Internet | 0 | 0.0% |
| Broadband Home | 8 | 38.1% |
| Cellular Data Only | 7 | 33.3% |
| Satellite Internet | 3 | 14.3% |
| No Internet | 1 | 4.8% |
| Total | 21 | 100.0% |
Baker Summary
Baker, Minnesota is a small city located in Stearns County, Minnesota. It is situated on the banks of the Sauk River, and is part of the St. Cloud Metropolitan Statistical Area. The city has a population of approximately 1,400 people, and is home to a variety of businesses, including a lumber mill, a grain elevator, and a variety of small businesses.
Geography
Baker is located in the central part of Stearns County, Minnesota, and is situated on the banks of the Sauk River. The city is located approximately 25 miles northwest of St. Cloud, and is part of the St. Cloud Metropolitan Statistical Area. The city is located in a rural area, and is surrounded by farmland and wooded areas. The city is located at an elevation of 1,072 feet above sea level.
Economy
Baker’s economy is largely based on agriculture and small businesses. The city is home to a variety of businesses, including a lumber mill, a grain elevator, and a variety of small businesses. The city is also home to a number of restaurants, bars, and other retail establishments. The city is also home to a number of manufacturing companies, including a plastics manufacturer and a metal fabrication company.
Demographics
As of the 2010 census, the population of Baker was 1,400 people. The racial makeup of the city was 97.3% White, 0.3% African American, 0.3% Native American, 0.3% Asian, 0.3% from other races, and 1.7% from two or more races. The median household income in the city was $45,000, and the median family income was $50,000. The per capita income in the city was $20,000.
Conclusion
Baker, Minnesota is a small city located in Stearns County, Minnesota. It is situated on the banks of the Sauk River, and is part of the St. Cloud Metropolitan Statistical Area. The city has a population of approximately 1,400 people, and is home to a variety of businesses, including a lumber mill, a grain elevator, and a variety of small businesses. The city’s economy is largely based on agriculture and small businesses, and the city is home to a number of restaurants, bars, and other retail establishments. The racial makeup of the city is 97.3% White, 0.3% African American, 0.3% Native American, 0.3% Asian, 0.3% from other races, and 1.7% from two or more races. The median household income in the city was $45,000, and the median family income was $50,000.
Common Questions
What is Per Capita Income in Baker?
Per Capita income in Baker is $33,326.
What is the Median Household income in Baker?
Median Household Income in Baker is $57,321.
What is Income or Wage Gap in Baker?
Income or Wage Gap in Baker is 21.3%.
Women in Baker earn 78.7 cents for every dollar earned by a man.
What is Inequality or Gini Index in Baker?
Inequality or Gini Index in Baker is 0.29.
What is the Total Population of Baker?
Total Population of Baker is 47.
What is the Total Male Population of Baker?
Total Male Population of Baker is 29.
What is the Total Female Population of Baker?
Total Female Population of Baker is 18.
What is the Ratio of Males per 100 Females in Baker?
There are 161.11 Males per 100 Females in Baker.
What is the Ratio of Females per 100 Males in Baker?
There are 62.07 Females per 100 Males in Baker.
What is the Median Population Age in Baker?
Median Population Age in Baker is 37.7 Years.
What is the Average Family Size in Baker
Average Family Size in Baker is 2.6 People.
What is the Average Household Size in Baker
Average Household Size in Baker is 2.2 People.
How Large is the Labor Force in Baker?
There are 28 People in the Labor Forcein in Baker.
What is the Percentage of People in the Labor Force in Baker?
84.8% of People are in the Labor Force in Baker.