Homer, MN Map & Demographics
Homer Map
Homer Overview
$37,544
PER CAPITA INCOME
$59,688
AVG FAMILY INCOME
$58,839
AVG HOUSEHOLD INCOME
0.35
INEQUALITY / GINI INDEX
131
TOTAL POPULATION
74
MALE POPULATION
57
FEMALE POPULATION
129.82
MALES / 100 FEMALES
77.03
FEMALES / 100 MALES
59.8
MEDIAN AGE
2.5
AVG FAMILY SIZE
2.2
AVG HOUSEHOLD SIZE
63
LABOR FORCE [ PEOPLE ]
51.6%
PERCENT IN LABOR FORCE
Homer Area Codes
Income in Homer
Income Overview in Homer
Per Capita Income in Homer is $37,544, while median incomes of families and households are $59,688 and $58,839 respectively.
| Characteristic | Number | Measure |
| Per Capita Income | 131 | $37,544 |
| Median Family Income | 49 | $59,688 |
| Mean Family Income | 49 | $95,349 |
| Median Household Income | 59 | $58,839 |
| Mean Household Income | 59 | $85,792 |
| Income Deficit | 49 | $0 |
| Wage / Income Gap (%) | 131 | 0.00% |
| Wage / Income Gap ($) | 131 | 100.00¢ per $1 |
| Gini / Inequality Index | 131 | 0.35 |
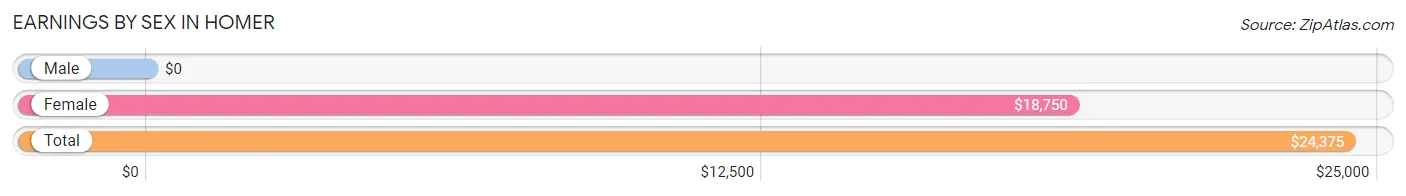
Earnings by Sex in Homer
| Sex | Number | Average Earnings |
| Male | 40 (59.7%) | $0 |
| Female | 27 (40.3%) | $18,750 |
| Total | 67 (100.0%) | $24,375 |
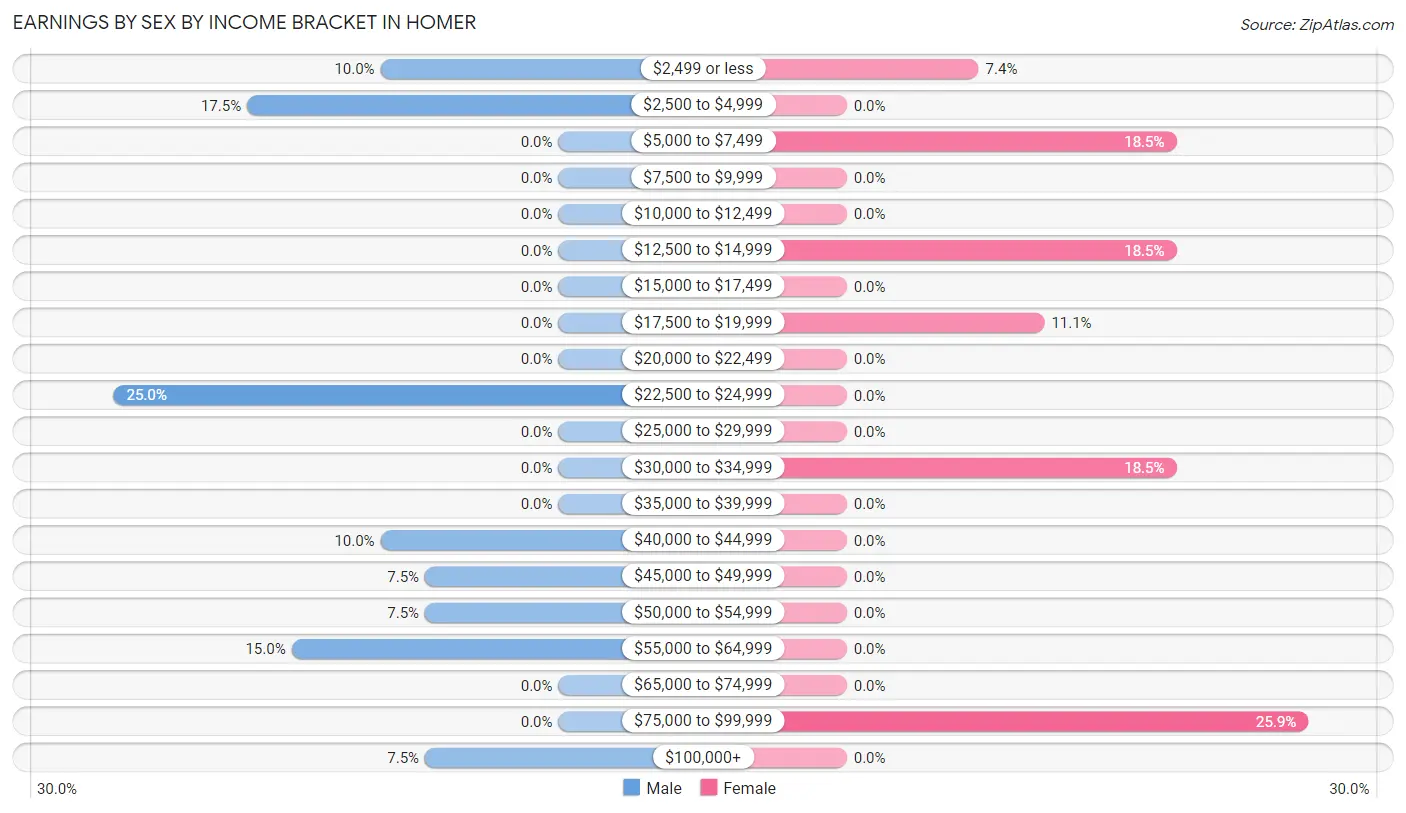
Earnings by Sex by Income Bracket in Homer
The most common earnings brackets in Homer are $22,500 to $24,999 for men (10 | 25.0%) and $75,000 to $99,999 for women (7 | 25.9%).
| Income | Male | Female |
| $2,499 or less | 4 (10.0%) | 2 (7.4%) |
| $2,500 to $4,999 | 7 (17.5%) | 0 (0.0%) |
| $5,000 to $7,499 | 0 (0.0%) | 5 (18.5%) |
| $7,500 to $9,999 | 0 (0.0%) | 0 (0.0%) |
| $10,000 to $12,499 | 0 (0.0%) | 0 (0.0%) |
| $12,500 to $14,999 | 0 (0.0%) | 5 (18.5%) |
| $15,000 to $17,499 | 0 (0.0%) | 0 (0.0%) |
| $17,500 to $19,999 | 0 (0.0%) | 3 (11.1%) |
| $20,000 to $22,499 | 0 (0.0%) | 0 (0.0%) |
| $22,500 to $24,999 | 10 (25.0%) | 0 (0.0%) |
| $25,000 to $29,999 | 0 (0.0%) | 0 (0.0%) |
| $30,000 to $34,999 | 0 (0.0%) | 5 (18.5%) |
| $35,000 to $39,999 | 0 (0.0%) | 0 (0.0%) |
| $40,000 to $44,999 | 4 (10.0%) | 0 (0.0%) |
| $45,000 to $49,999 | 3 (7.5%) | 0 (0.0%) |
| $50,000 to $54,999 | 3 (7.5%) | 0 (0.0%) |
| $55,000 to $64,999 | 6 (15.0%) | 0 (0.0%) |
| $65,000 to $74,999 | 0 (0.0%) | 0 (0.0%) |
| $75,000 to $99,999 | 0 (0.0%) | 7 (25.9%) |
| $100,000+ | 3 (7.5%) | 0 (0.0%) |
| Total | 40 (100.0%) | 27 (100.0%) |
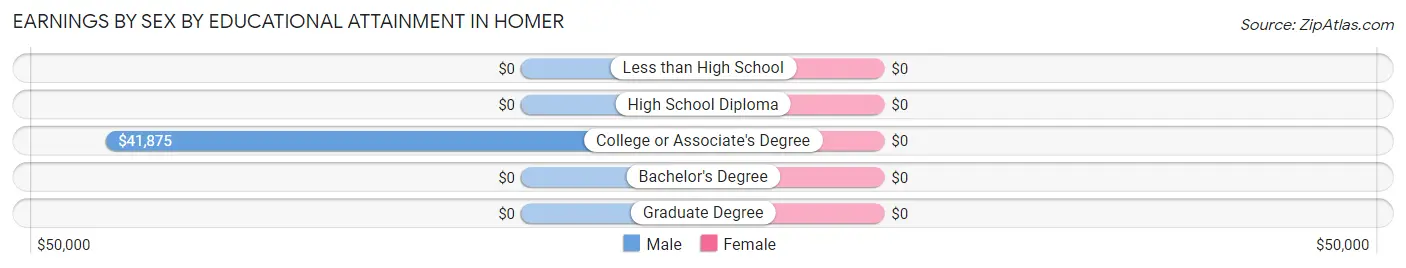
Earnings by Sex by Educational Attainment in Homer
| Educational Attainment | Male Income | Female Income |
| Less than High School | - | - |
| High School Diploma | - | - |
| College or Associate's Degree | $41,875 | $0 |
| Bachelor's Degree | - | - |
| Graduate Degree | - | - |
| Total | $46,250 | $0 |
Family Income in Homer
Family Income Brackets in Homer
According to the Homer family income data, there are 28 families falling into the $50,000 to $74,999 income range, which is the most common income bracket and makes up 57.1% of all families.
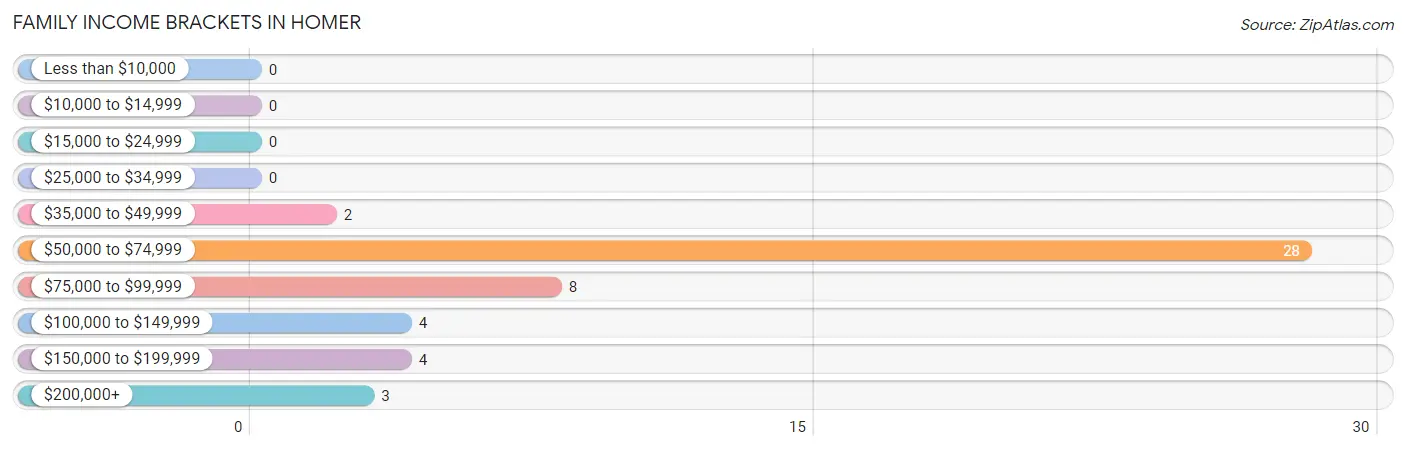
| Income Bracket | # Families | % Families |
| Less than $10,000 | 0 | 0.0% |
| $10,000 to $14,999 | 0 | 0.0% |
| $15,000 to $24,999 | 0 | 0.0% |
| $25,000 to $34,999 | 0 | 0.0% |
| $35,000 to $49,999 | 2 | 4.1% |
| $50,000 to $74,999 | 28 | 57.1% |
| $75,000 to $99,999 | 8 | 16.3% |
| $100,000 to $149,999 | 4 | 8.2% |
| $150,000 to $199,999 | 4 | 8.2% |
| $200,000+ | 3 | 6.1% |
Family Income by Famaliy Size in Homer
2-person families (38 | 77.5%) account for the highest median family income in Homer with $65,000 per family, while 2-person families (38 | 77.5%) have the highest median income of $32,500 per family member.
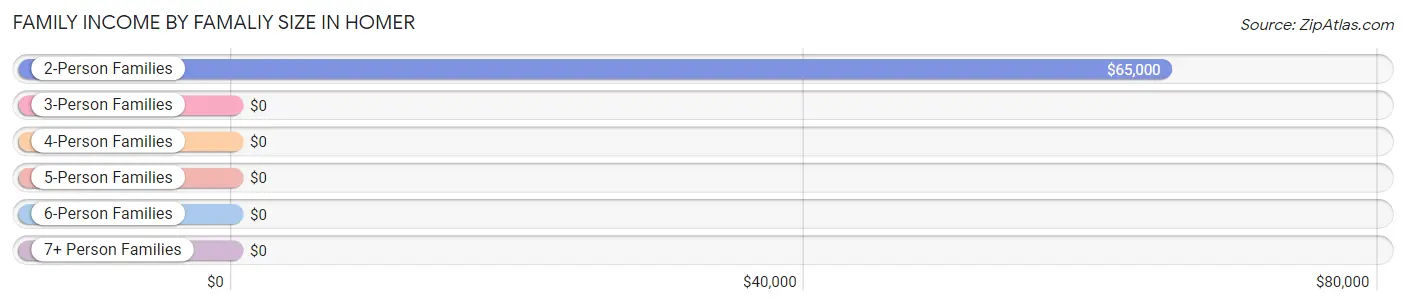
| Income Bracket | # Families | Median Income |
| 2-Person Families | 38 (77.5%) | $65,000 |
| 3-Person Families | 4 (8.2%) | $0 |
| 4-Person Families | 4 (8.2%) | $0 |
| 5-Person Families | 0 (0.0%) | $0 |
| 6-Person Families | 3 (6.1%) | $0 |
| 7+ Person Families | 0 (0.0%) | $0 |
| Total | 49 (100.0%) | $59,688 |
Family Income by Number of Earners in Homer
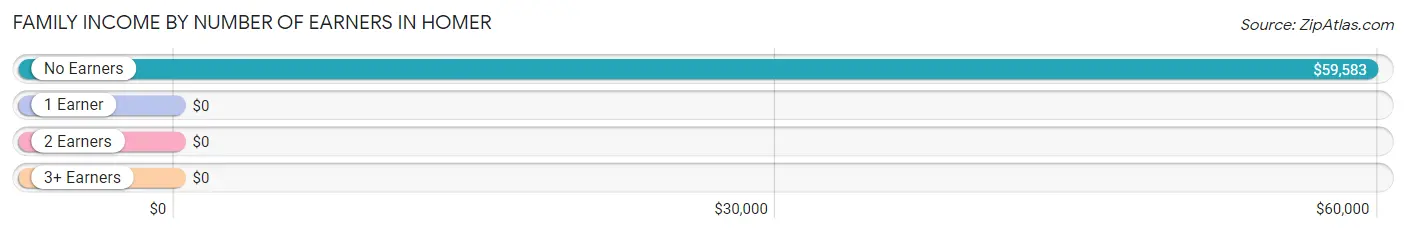
| Number of Earners | # Families | Median Income |
| No Earners | 20 (40.8%) | $59,583 |
| 1 Earner | 6 (12.2%) | $0 |
| 2 Earners | 15 (30.6%) | $0 |
| 3+ Earners | 8 (16.3%) | $0 |
| Total | 49 (100.0%) | $59,688 |
Household Income in Homer
Household Income Brackets in Homer
With 30 households falling in the category, the $50,000 to $74,999 income range is the most frequent in Homer, accounting for 50.8% of all households.
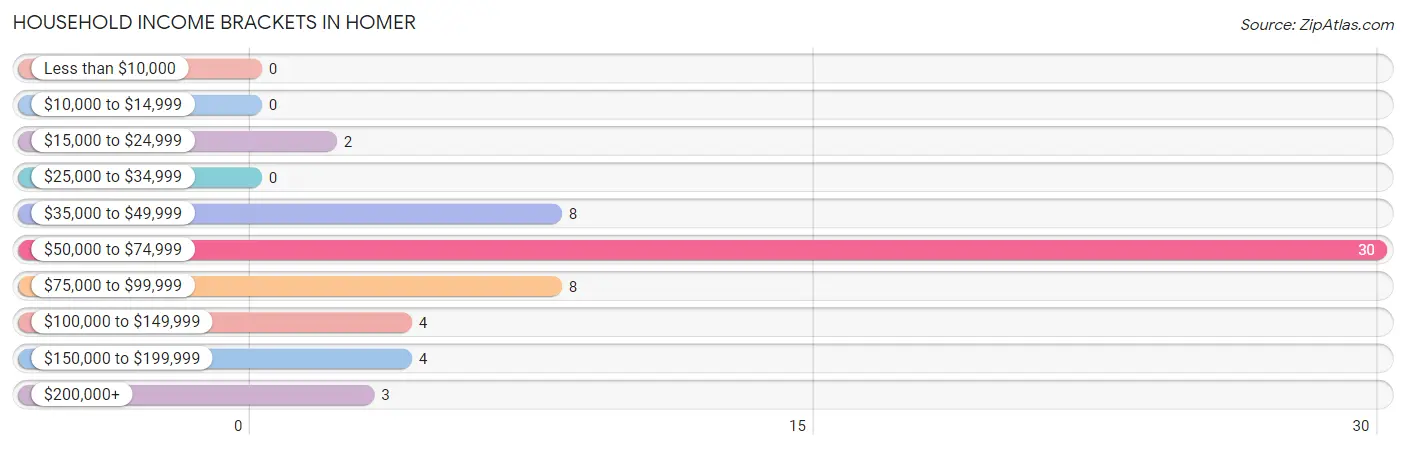
| Income Bracket | # Households | % Households |
| Less than $10,000 | 0 | 0.0% |
| $10,000 to $14,999 | 0 | 0.0% |
| $15,000 to $24,999 | 2 | 3.4% |
| $25,000 to $34,999 | 0 | 0.0% |
| $35,000 to $49,999 | 8 | 13.6% |
| $50,000 to $74,999 | 30 | 50.8% |
| $75,000 to $99,999 | 8 | 13.6% |
| $100,000 to $149,999 | 4 | 6.8% |
| $150,000 to $199,999 | 4 | 6.8% |
| $200,000+ | 3 | 5.1% |
Household Income by Householder Age in Homer
The median household income in Homer is $58,839, with the highest median household income of $71,875 found in the 65+ years age bracket for the primary householder. A total of 37 households (62.7%) fall into this category. Meanwhile, the 15 to 24 years age bracket for the primary householder has the lowest median household income of $0, with 6 households (10.2%) in this group.
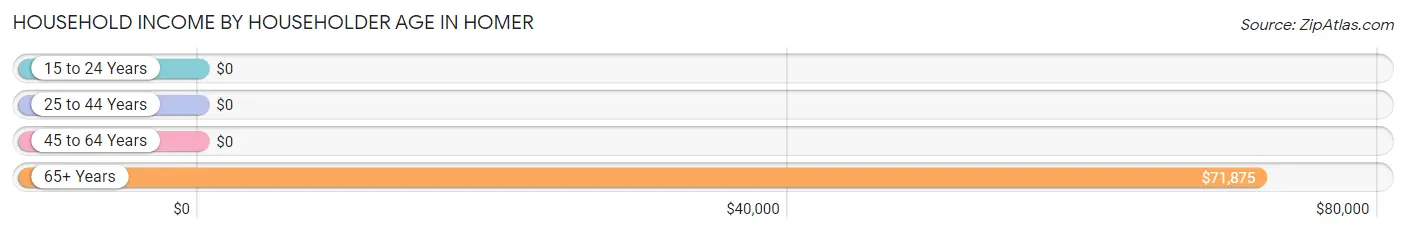
| Income Bracket | # Households | Median Income |
| 15 to 24 Years | 6 (10.2%) | $0 |
| 25 to 44 Years | 6 (10.2%) | $0 |
| 45 to 64 Years | 10 (17.0%) | $0 |
| 65+ Years | 37 (62.7%) | $71,875 |
| Total | 59 (100.0%) | $58,839 |
Poverty in Homer
Income Below Poverty by Sex and Age in Homer
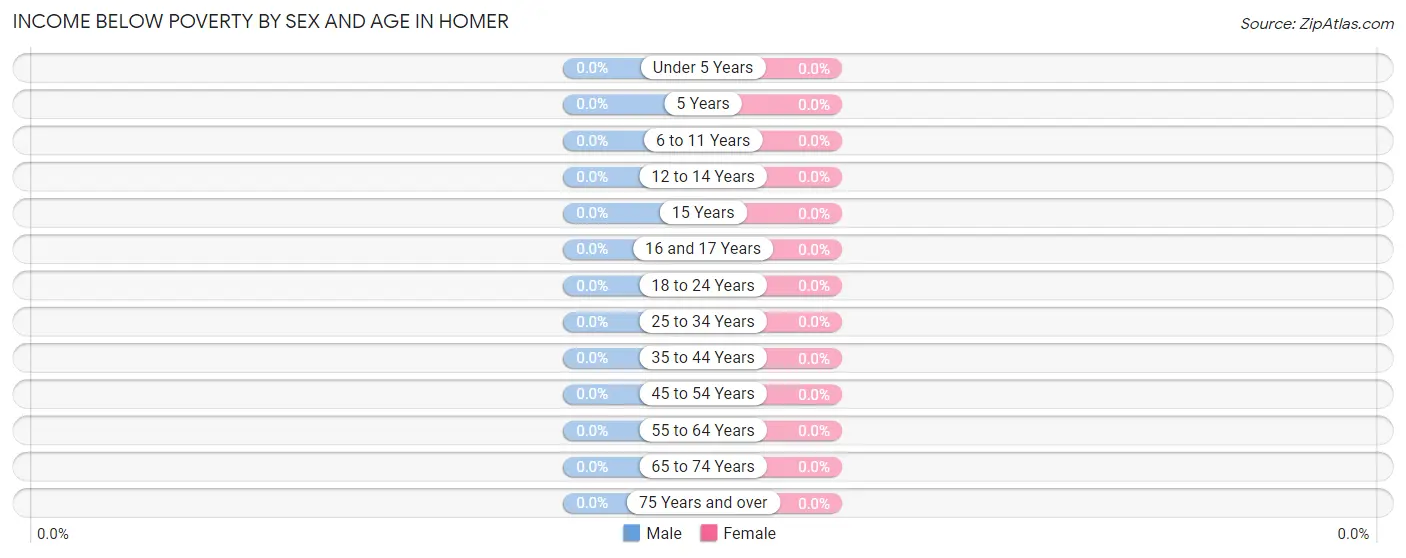
| Age Bracket | Male | Female |
| Under 5 Years | 0 (0.0%) | 0 (0.0%) |
| 5 Years | 0 (0.0%) | 0 (0.0%) |
| 6 to 11 Years | 0 (0.0%) | 0 (0.0%) |
| 12 to 14 Years | 0 (0.0%) | 0 (0.0%) |
| 15 Years | 0 (0.0%) | 0 (0.0%) |
| 16 and 17 Years | 0 (0.0%) | 0 (0.0%) |
| 18 to 24 Years | 0 (0.0%) | 0 (0.0%) |
| 25 to 34 Years | 0 (0.0%) | 0 (0.0%) |
| 35 to 44 Years | 0 (0.0%) | 0 (0.0%) |
| 45 to 54 Years | 0 (0.0%) | 0 (0.0%) |
| 55 to 64 Years | 0 (0.0%) | 0 (0.0%) |
| 65 to 74 Years | 0 (0.0%) | 0 (0.0%) |
| 75 Years and over | 0 (0.0%) | 0 (0.0%) |
| Total | 0 (0.0%) | 0 (0.0%) |
Income Above Poverty by Sex and Age in Homer
According to the poverty statistics in Homer, males aged 6 to 11 years and females aged 18 to 24 years are the age groups that are most secure financially, with 100.0% of males and 100.0% of females in these age groups living above the poverty line.
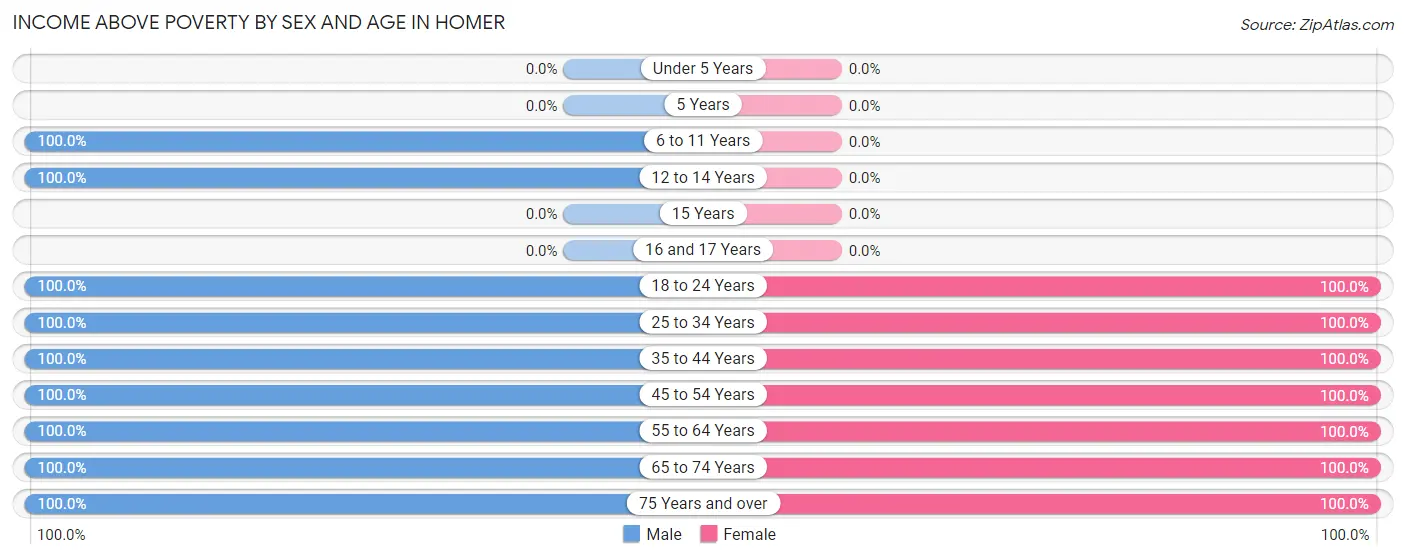
| Age Bracket | Male | Female |
| Under 5 Years | 0 (0.0%) | 0 (0.0%) |
| 5 Years | 0 (0.0%) | 0 (0.0%) |
| 6 to 11 Years | 6 (100.0%) | 0 (0.0%) |
| 12 to 14 Years | 3 (100.0%) | 0 (0.0%) |
| 15 Years | 0 (0.0%) | 0 (0.0%) |
| 16 and 17 Years | 0 (0.0%) | 0 (0.0%) |
| 18 to 24 Years | 13 (100.0%) | 8 (100.0%) |
| 25 to 34 Years | 6 (100.0%) | 3 (100.0%) |
| 35 to 44 Years | 4 (100.0%) | 3 (100.0%) |
| 45 to 54 Years | 7 (100.0%) | 3 (100.0%) |
| 55 to 64 Years | 3 (100.0%) | 7 (100.0%) |
| 65 to 74 Years | 26 (100.0%) | 27 (100.0%) |
| 75 Years and over | 6 (100.0%) | 6 (100.0%) |
| Total | 74 (100.0%) | 57 (100.0%) |
Income Below Poverty Among Married-Couple Families in Homer
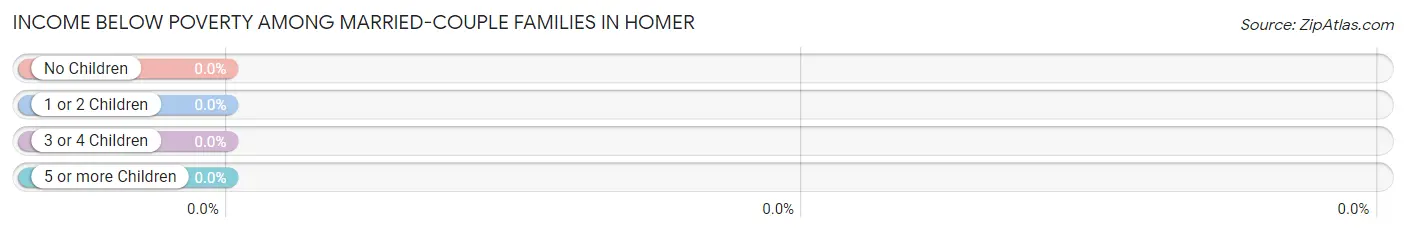
| Children | Above Poverty | Below Poverty |
| No Children | 42 (100.0%) | 0 (0.0%) |
| 1 or 2 Children | 7 (100.0%) | 0 (0.0%) |
| 3 or 4 Children | 0 (0.0%) | 0 (0.0%) |
| 5 or more Children | 0 (0.0%) | 0 (0.0%) |
| Total | 49 (100.0%) | 0 (0.0%) |
Income Below Poverty Among Single-Parent Households in Homer
| Children | Single Father | Single Mother |
| No Children | 0 (0.0%) | 0 (0.0%) |
| 1 or 2 Children | 0 (0.0%) | 0 (0.0%) |
| 3 or 4 Children | 0 (0.0%) | 0 (0.0%) |
| 5 or more Children | 0 (0.0%) | 0 (0.0%) |
| Total | 0 (0.0%) | 0 (0.0%) |
Income Below Poverty Among Married-Couple vs Single-Parent Households in Homer
| Children | Married-Couple Families | Single-Parent Households |
| No Children | 0 (0.0%) | 0 (0.0%) |
| 1 or 2 Children | 0 (0.0%) | 0 (0.0%) |
| 3 or 4 Children | 0 (0.0%) | 0 (0.0%) |
| 5 or more Children | 0 (0.0%) | 0 (0.0%) |
| Total | 0 (0.0%) | 0 (0.0%) |
Race in Homer
The most populous races in Homer are , and White / Caucasian (131 | 100.0%).
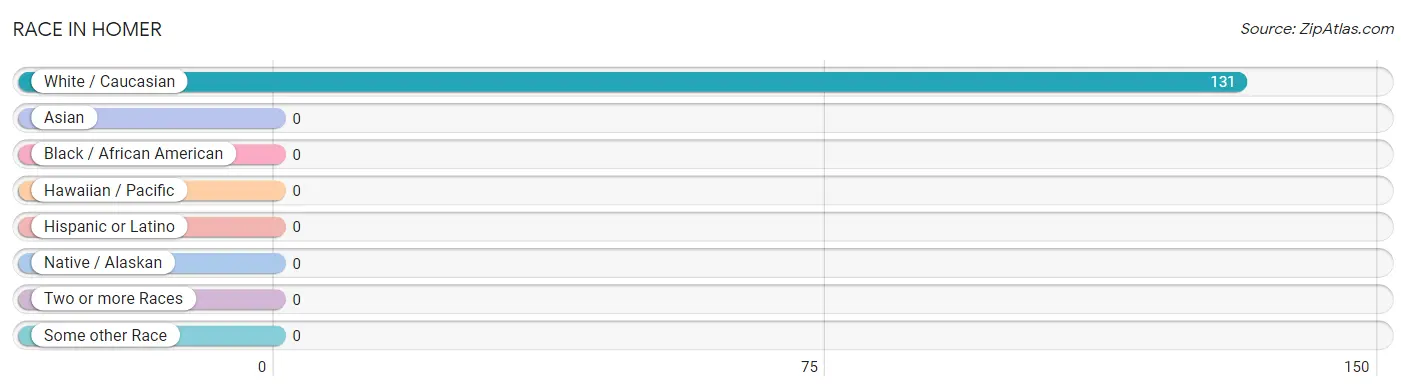
| Race | # Population | % Population |
| Asian | 0 | 0.0% |
| Black / African American | 0 | 0.0% |
| Hawaiian / Pacific | 0 | 0.0% |
| Hispanic or Latino | 0 | 0.0% |
| Native / Alaskan | 0 | 0.0% |
| White / Caucasian | 131 | 100.0% |
| Two or more Races | 0 | 0.0% |
| Some other Race | 0 | 0.0% |
| Total | 131 | 100.0% |
Ancestry in Homer
The most populous ancestries reported in Homer are German (39 | 29.8%), Polish (34 | 26.0%), Norwegian (33 | 25.2%), Irish (21 | 16.0%), and French (9 | 6.9%), together accounting for 103.8% of all Homer residents.
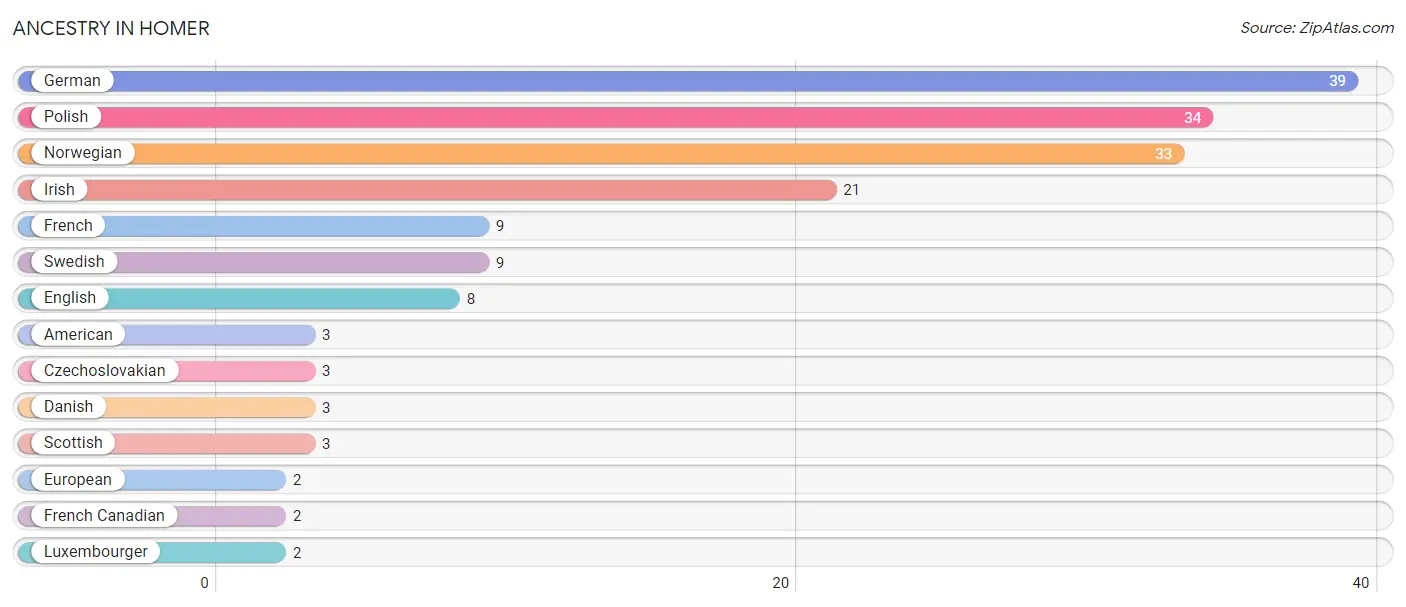
| Ancestry | # Population | % Population |
| American | 3 | 2.3% |
| Czechoslovakian | 3 | 2.3% |
| Danish | 3 | 2.3% |
| English | 8 | 6.1% |
| European | 2 | 1.5% |
| French | 9 | 6.9% |
| French Canadian | 2 | 1.5% |
| German | 39 | 29.8% |
| Irish | 21 | 16.0% |
| Luxembourger | 2 | 1.5% |
| Norwegian | 33 | 25.2% |
| Polish | 34 | 26.0% |
| Scottish | 3 | 2.3% |
| Swedish | 9 | 6.9% | View All 14 Rows |
Immigrants in Homer

| Immigration Origin | # Population | % Population | View All 0 Rows |
Sex and Age in Homer
Sex and Age in Homer
The most populous age groups in Homer are 65 to 69 Years (15 | 20.3%) for men and 70 to 74 Years (15 | 26.3%) for women.
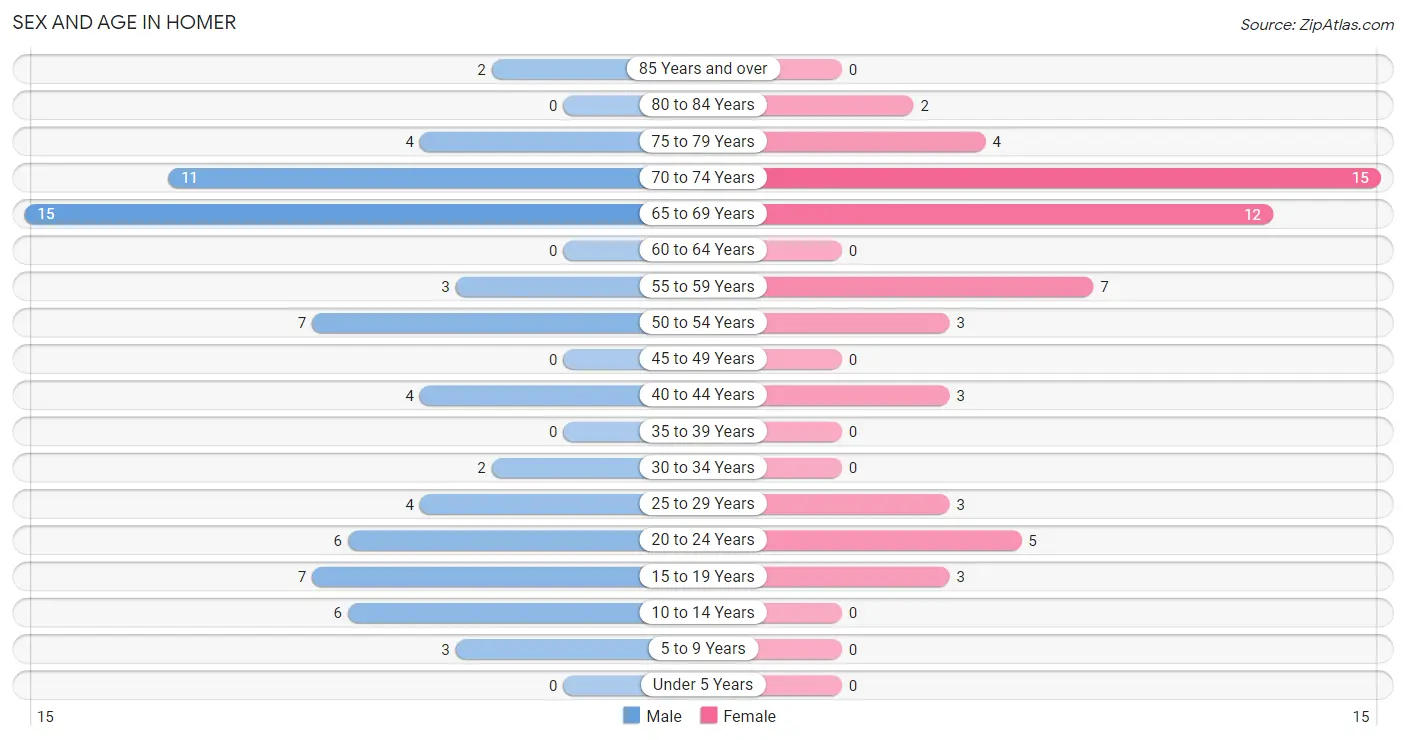
| Age Bracket | Male | Female |
| Under 5 Years | 0 (0.0%) | 0 (0.0%) |
| 5 to 9 Years | 3 (4.1%) | 0 (0.0%) |
| 10 to 14 Years | 6 (8.1%) | 0 (0.0%) |
| 15 to 19 Years | 7 (9.5%) | 3 (5.3%) |
| 20 to 24 Years | 6 (8.1%) | 5 (8.8%) |
| 25 to 29 Years | 4 (5.4%) | 3 (5.3%) |
| 30 to 34 Years | 2 (2.7%) | 0 (0.0%) |
| 35 to 39 Years | 0 (0.0%) | 0 (0.0%) |
| 40 to 44 Years | 4 (5.4%) | 3 (5.3%) |
| 45 to 49 Years | 0 (0.0%) | 0 (0.0%) |
| 50 to 54 Years | 7 (9.5%) | 3 (5.3%) |
| 55 to 59 Years | 3 (4.1%) | 7 (12.3%) |
| 60 to 64 Years | 0 (0.0%) | 0 (0.0%) |
| 65 to 69 Years | 15 (20.3%) | 12 (21.0%) |
| 70 to 74 Years | 11 (14.9%) | 15 (26.3%) |
| 75 to 79 Years | 4 (5.4%) | 4 (7.0%) |
| 80 to 84 Years | 0 (0.0%) | 2 (3.5%) |
| 85 Years and over | 2 (2.7%) | 0 (0.0%) |
| Total | 74 (100.0%) | 57 (100.0%) |
Families and Households in Homer
Median Family Size in Homer
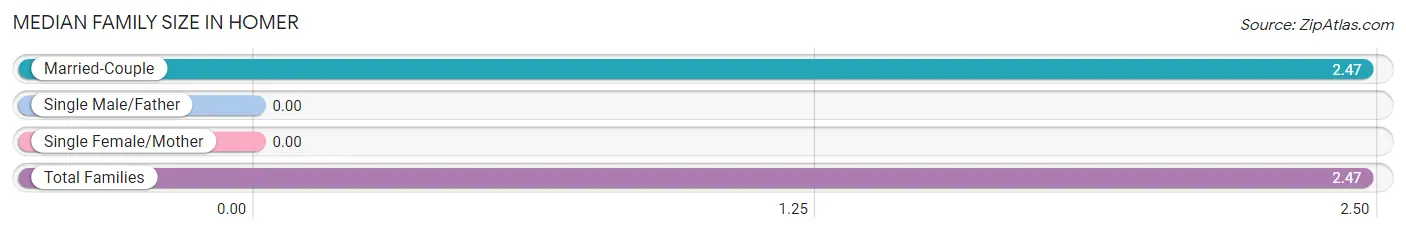
| Family Type | # Families | Family Size |
| Married-Couple | 49 (100.0%) | 2.47 |
| Single Male/Father | 0 (0.0%) | - |
| Single Female/Mother | 0 (0.0%) | - |
| Total Families | 49 (100.0%) | 2.47 |
Median Household Size in Homer
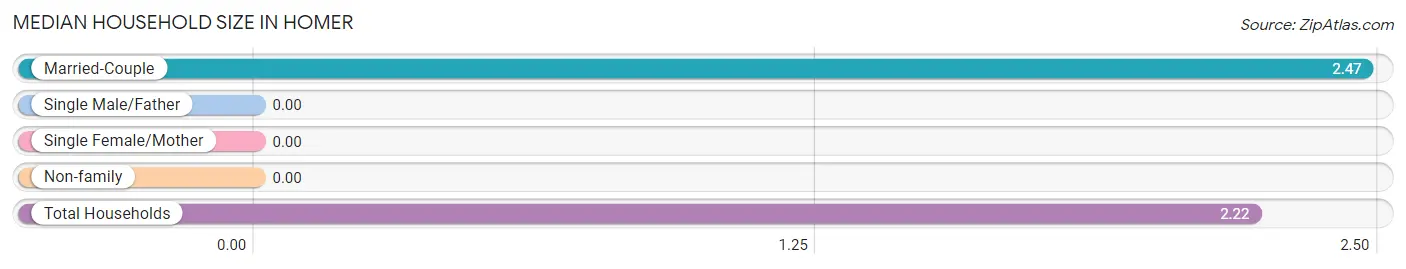
| Household Type | # Households | Household Size |
| Married-Couple | 49 (83.1%) | 2.47 |
| Single Male/Father | 0 (0.0%) | - |
| Single Female/Mother | 0 (0.0%) | - |
| Non-family | 10 (17.0%) | - |
| Total Households | 59 (100.0%) | 2.22 |
Household Size by Marriage Status in Homer
Out of a total of 59 households in Homer, 49 (83.1%) are family households, while 10 (17.0%) are nonfamily households. The most numerous type of family households are 2-person households, comprising 38, and the most common type of nonfamily households are 1-person households, comprising 10.
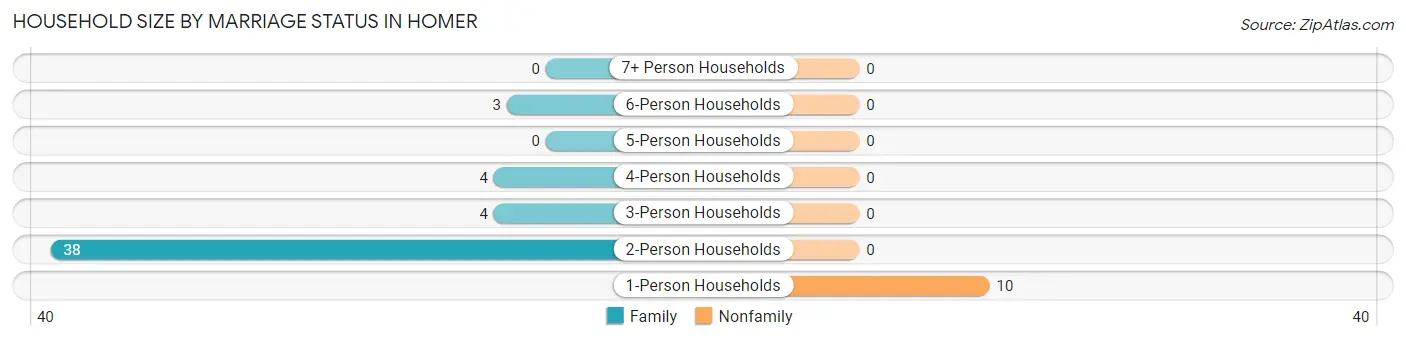
| Household Size | Family Households | Nonfamily Households |
| 1-Person Households | - | 10 (17.0%) |
| 2-Person Households | 38 (64.4%) | 0 (0.0%) |
| 3-Person Households | 4 (6.8%) | 0 (0.0%) |
| 4-Person Households | 4 (6.8%) | 0 (0.0%) |
| 5-Person Households | 0 (0.0%) | 0 (0.0%) |
| 6-Person Households | 3 (5.1%) | 0 (0.0%) |
| 7+ Person Households | 0 (0.0%) | 0 (0.0%) |
| Total | 49 (83.1%) | 10 (17.0%) |
Female Fertility in Homer
Fertility by Age in Homer
| Age Bracket | Women with Births | Births / 1,000 Women |
| 15 to 19 years | 0 (0.0%) | 0.0 |
| 20 to 34 years | 0 (0.0%) | 0.0 |
| 35 to 50 years | 0 (0.0%) | 0.0 |
| Total | 0 (0.0%) | 0.0 |
Fertility by Age by Marriage Status in Homer
| Age Bracket | Married | Unmarried |
| 15 to 19 years | 0 (0.0%) | 0 (0.0%) |
| 20 to 34 years | 0 (0.0%) | 0 (0.0%) |
| 35 to 50 years | 0 (0.0%) | 0 (0.0%) |
| Total | 0 (0.0%) | 0 (0.0%) |
Fertility by Education in Homer
| Educational Attainment | Women with Births | Births / 1,000 Women |
| Less than High School | 0 (0.0%) | 0.0 |
| High School Diploma | 0 (0.0%) | 0.0 |
| College or Associate's Degree | 0 (0.0%) | 0.0 |
| Bachelor's Degree | 0 (0.0%) | 0.0 |
| Graduate Degree | 0 (0.0%) | 0.0 |
| Total | 0 (0.0%) | 0.0 |
Fertility by Education by Marriage Status in Homer
| Educational Attainment | Married | Unmarried |
| Less than High School | 0 (0.0%) | 0 (0.0%) |
| High School Diploma | 0 (0.0%) | 0 (0.0%) |
| College or Associate's Degree | 0 (0.0%) | 0 (0.0%) |
| Bachelor's Degree | 0 (0.0%) | 0 (0.0%) |
| Graduate Degree | 0 (0.0%) | 0 (0.0%) |
| Total | 0 (0.0%) | 0 (0.0%) |
Employment Characteristics in Homer
Employment by Class of Employer in Homer
Among the 63 employed individuals in Homer, private company employees (36 | 57.1%), self-employed (not incorporated) (12 | 19.1%), and not-for-profit organizations (10 | 15.9%) make up the most common classes of employment.
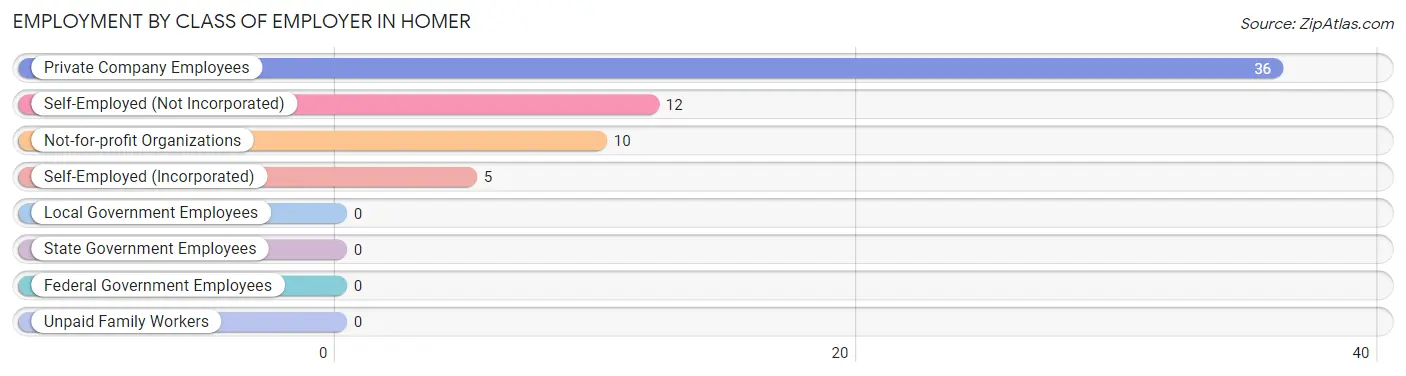
| Employer Class | # Employees | % Employees |
| Private Company Employees | 36 | 57.1% |
| Self-Employed (Incorporated) | 5 | 7.9% |
| Self-Employed (Not Incorporated) | 12 | 19.1% |
| Not-for-profit Organizations | 10 | 15.9% |
| Local Government Employees | 0 | 0.0% |
| State Government Employees | 0 | 0.0% |
| Federal Government Employees | 0 | 0.0% |
| Unpaid Family Workers | 0 | 0.0% |
| Total | 63 | 100.0% |
Employment Status by Age in Homer
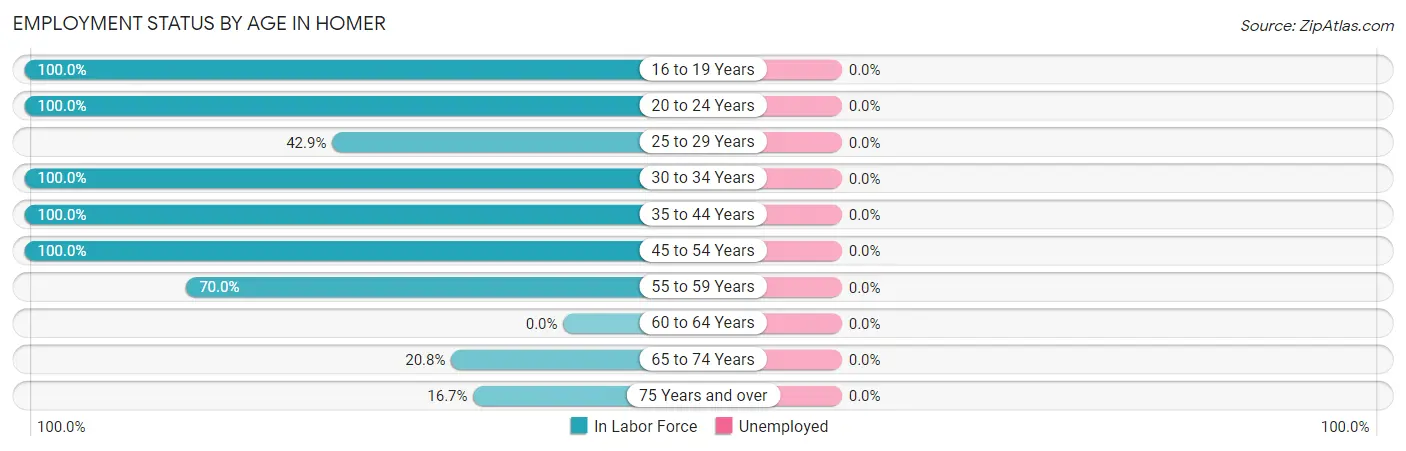
| Age Bracket | In Labor Force | Unemployed |
| 16 to 19 Years | 10 (100.0%) | 0 (0.0%) |
| 20 to 24 Years | 11 (100.0%) | 0 (0.0%) |
| 25 to 29 Years | 3 (42.9%) | 0 (0.0%) |
| 30 to 34 Years | 2 (100.0%) | 0 (0.0%) |
| 35 to 44 Years | 7 (100.0%) | 0 (0.0%) |
| 45 to 54 Years | 10 (100.0%) | 0 (0.0%) |
| 55 to 59 Years | 7 (70.0%) | 0 (0.0%) |
| 60 to 64 Years | 0 (0.0%) | 0 (0.0%) |
| 65 to 74 Years | 11 (20.8%) | 0 (0.0%) |
| 75 Years and over | 2 (16.7%) | 0 (0.0%) |
| Total | 63 (51.6%) | 0 (0.0%) |
Employment Status by Educational Attainment in Homer
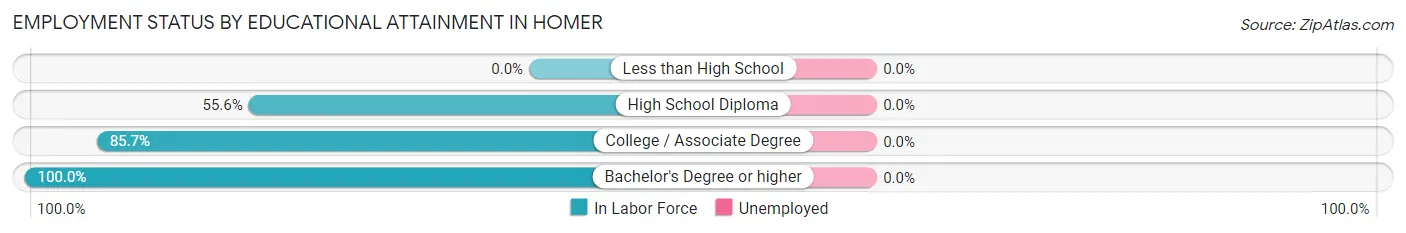
| Educational Attainment | In Labor Force | Unemployed |
| Less than High School | 0 (0.0%) | 0 (0.0%) |
| High School Diploma | 5 (55.6%) | 0 (0.0%) |
| College / Associate Degree | 18 (85.7%) | 0 (0.0%) |
| Bachelor's Degree or higher | 6 (100.0%) | 0 (0.0%) |
| Total | 29 (80.6%) | 0 (0.0%) |
Employment Occupations by Sex in Homer
Management, Business, Science and Arts Occupations
The most common Management, Business, Science and Arts occupations in Homer are Management (6 | 9.5%), Computers, Engineering & Science (4 | 6.4%), Computers & Mathematics (4 | 6.4%), Health Diagnosing & Treating (4 | 6.4%), and Health Technologists (4 | 6.4%).

Management, Business, Science and Arts Occupations by Sex
Within the Management, Business, Science and Arts occupations in Homer, the most male-oriented occupations are Computers, Engineering & Science (100.0%), Computers & Mathematics (100.0%), and Community & Social Service (100.0%), while the most female-oriented occupations are Business & Financial (100.0%), Health Diagnosing & Treating (100.0%), and Health Technologists (100.0%).
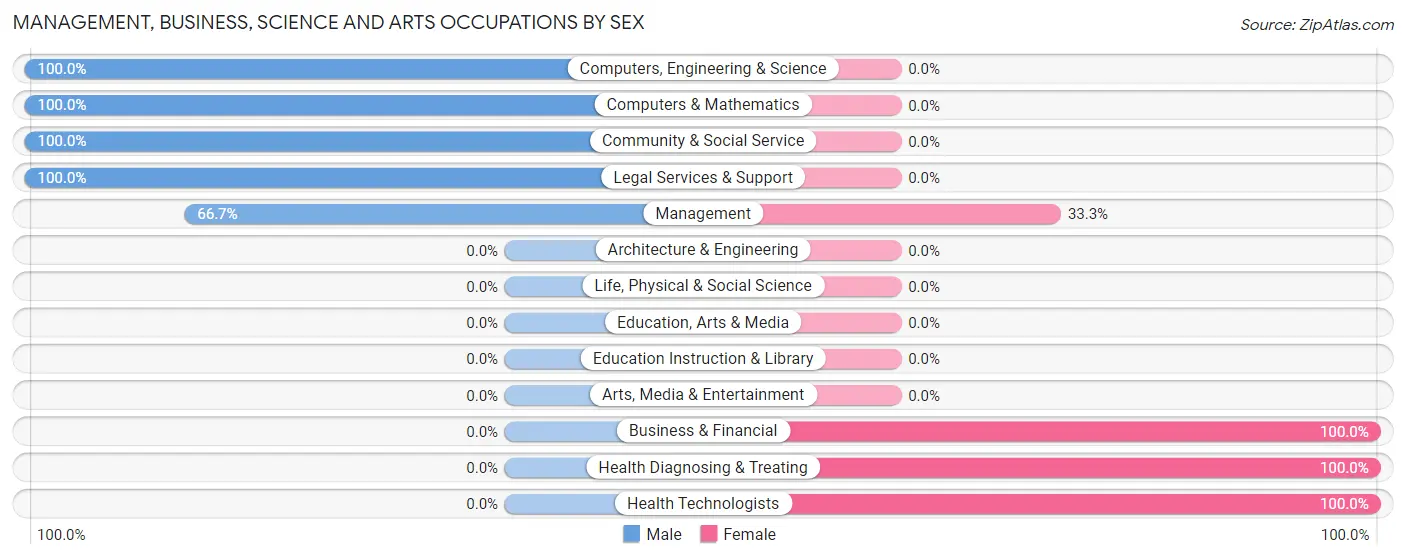
| Occupation | Male | Female |
| Management | 4 (66.7%) | 2 (33.3%) |
| Business & Financial | 0 (0.0%) | 3 (100.0%) |
| Computers, Engineering & Science | 4 (100.0%) | 0 (0.0%) |
| Computers & Mathematics | 4 (100.0%) | 0 (0.0%) |
| Architecture & Engineering | 0 (0.0%) | 0 (0.0%) |
| Life, Physical & Social Science | 0 (0.0%) | 0 (0.0%) |
| Community & Social Service | 3 (100.0%) | 0 (0.0%) |
| Education, Arts & Media | 0 (0.0%) | 0 (0.0%) |
| Legal Services & Support | 3 (100.0%) | 0 (0.0%) |
| Education Instruction & Library | 0 (0.0%) | 0 (0.0%) |
| Arts, Media & Entertainment | 0 (0.0%) | 0 (0.0%) |
| Health Diagnosing & Treating | 0 (0.0%) | 4 (100.0%) |
| Health Technologists | 0 (0.0%) | 4 (100.0%) |
| Total (Category) | 11 (55.0%) | 9 (45.0%) |
| Total (Overall) | 36 (57.1%) | 27 (42.9%) |
Services Occupations
The most common Services occupations in Homer are Food Preparation & Serving (7 | 11.1%), Healthcare Support (5 | 7.9%), Cleaning & Maintenance (3 | 4.8%), and Personal Care & Service (2 | 3.2%).
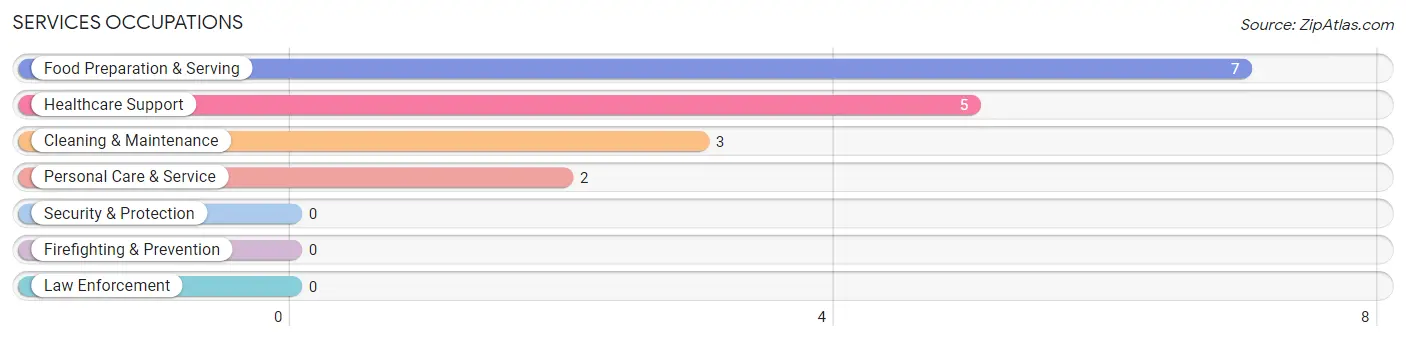
Services Occupations by Sex
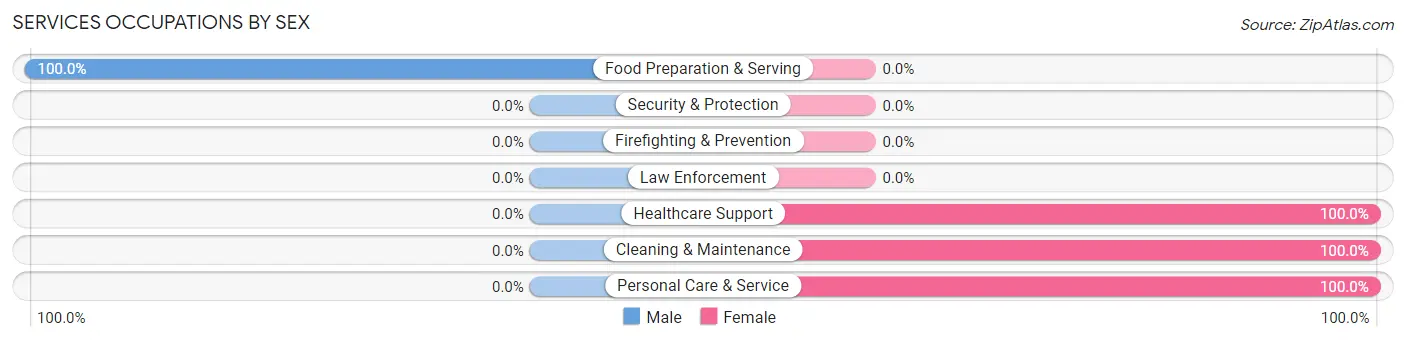
| Occupation | Male | Female |
| Healthcare Support | 0 (0.0%) | 5 (100.0%) |
| Security & Protection | 0 (0.0%) | 0 (0.0%) |
| Firefighting & Prevention | 0 (0.0%) | 0 (0.0%) |
| Law Enforcement | 0 (0.0%) | 0 (0.0%) |
| Food Preparation & Serving | 7 (100.0%) | 0 (0.0%) |
| Cleaning & Maintenance | 0 (0.0%) | 3 (100.0%) |
| Personal Care & Service | 0 (0.0%) | 2 (100.0%) |
| Total (Category) | 7 (41.2%) | 10 (58.8%) |
| Total (Overall) | 36 (57.1%) | 27 (42.9%) |
Sales and Office Occupations
The most common Sales and Office occupations in Homer are Office & Administration (3 | 4.8%), and Sales & Related (2 | 3.2%).
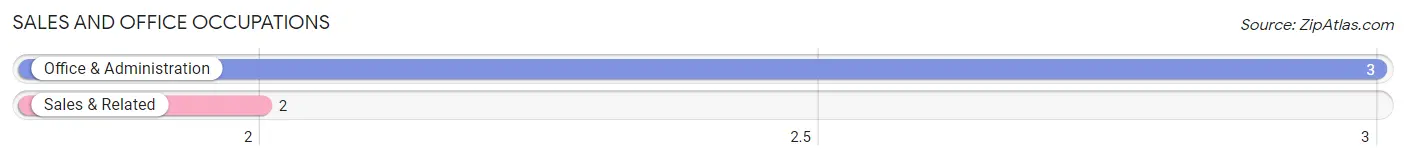
Sales and Office Occupations by Sex
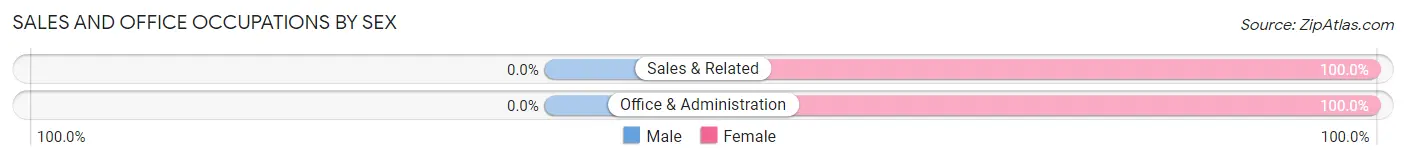
| Occupation | Male | Female |
| Sales & Related | 0 (0.0%) | 2 (100.0%) |
| Office & Administration | 0 (0.0%) | 3 (100.0%) |
| Total (Category) | 0 (0.0%) | 5 (100.0%) |
| Total (Overall) | 36 (57.1%) | 27 (42.9%) |
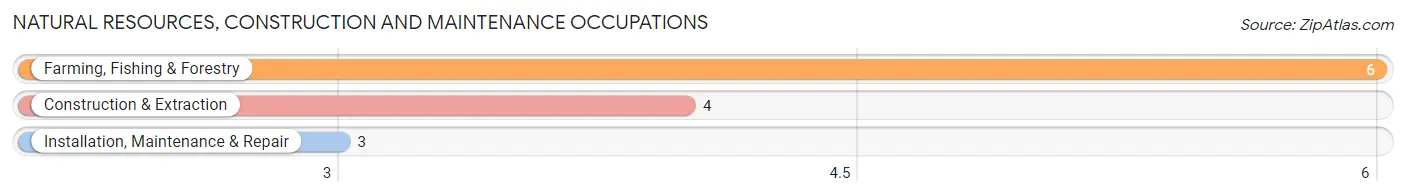
Natural Resources, Construction and Maintenance Occupations
The most common Natural Resources, Construction and Maintenance occupations in Homer are Farming, Fishing & Forestry (6 | 9.5%), Construction & Extraction (4 | 6.4%), and Installation, Maintenance & Repair (3 | 4.8%).
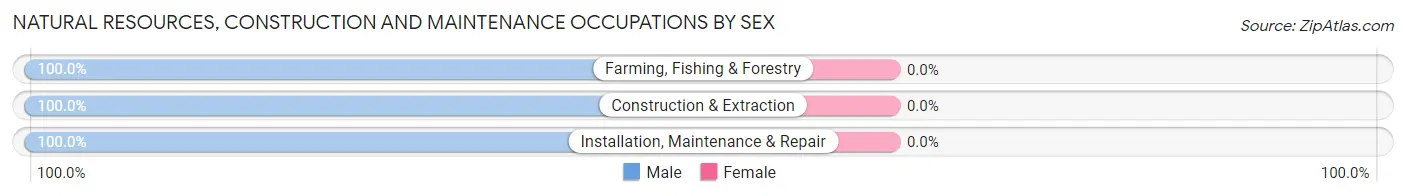
Natural Resources, Construction and Maintenance Occupations by Sex
| Occupation | Male | Female |
| Farming, Fishing & Forestry | 6 (100.0%) | 0 (0.0%) |
| Construction & Extraction | 4 (100.0%) | 0 (0.0%) |
| Installation, Maintenance & Repair | 3 (100.0%) | 0 (0.0%) |
| Total (Category) | 13 (100.0%) | 0 (0.0%) |
| Total (Overall) | 36 (57.1%) | 27 (42.9%) |
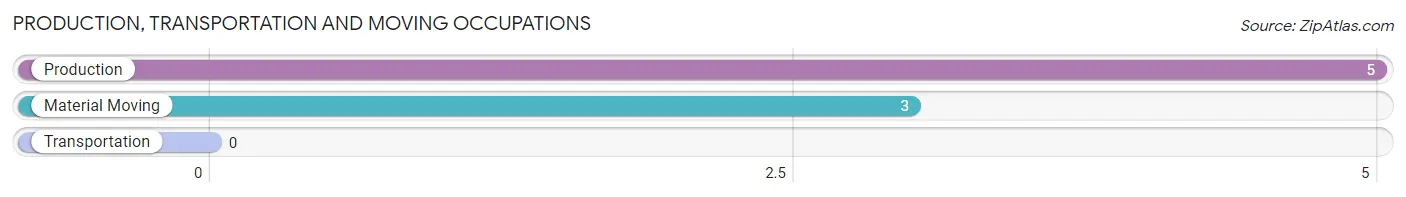
Production, Transportation and Moving Occupations
The most common Production, Transportation and Moving occupations in Homer are Production (5 | 7.9%), and Material Moving (3 | 4.8%).
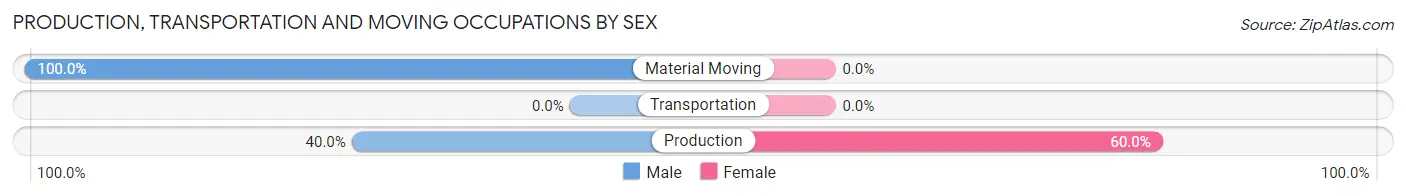
Production, Transportation and Moving Occupations by Sex
| Occupation | Male | Female |
| Production | 2 (40.0%) | 3 (60.0%) |
| Transportation | 0 (0.0%) | 0 (0.0%) |
| Material Moving | 3 (100.0%) | 0 (0.0%) |
| Total (Category) | 5 (62.5%) | 3 (37.5%) |
| Total (Overall) | 36 (57.1%) | 27 (42.9%) |
Employment Industries by Sex in Homer
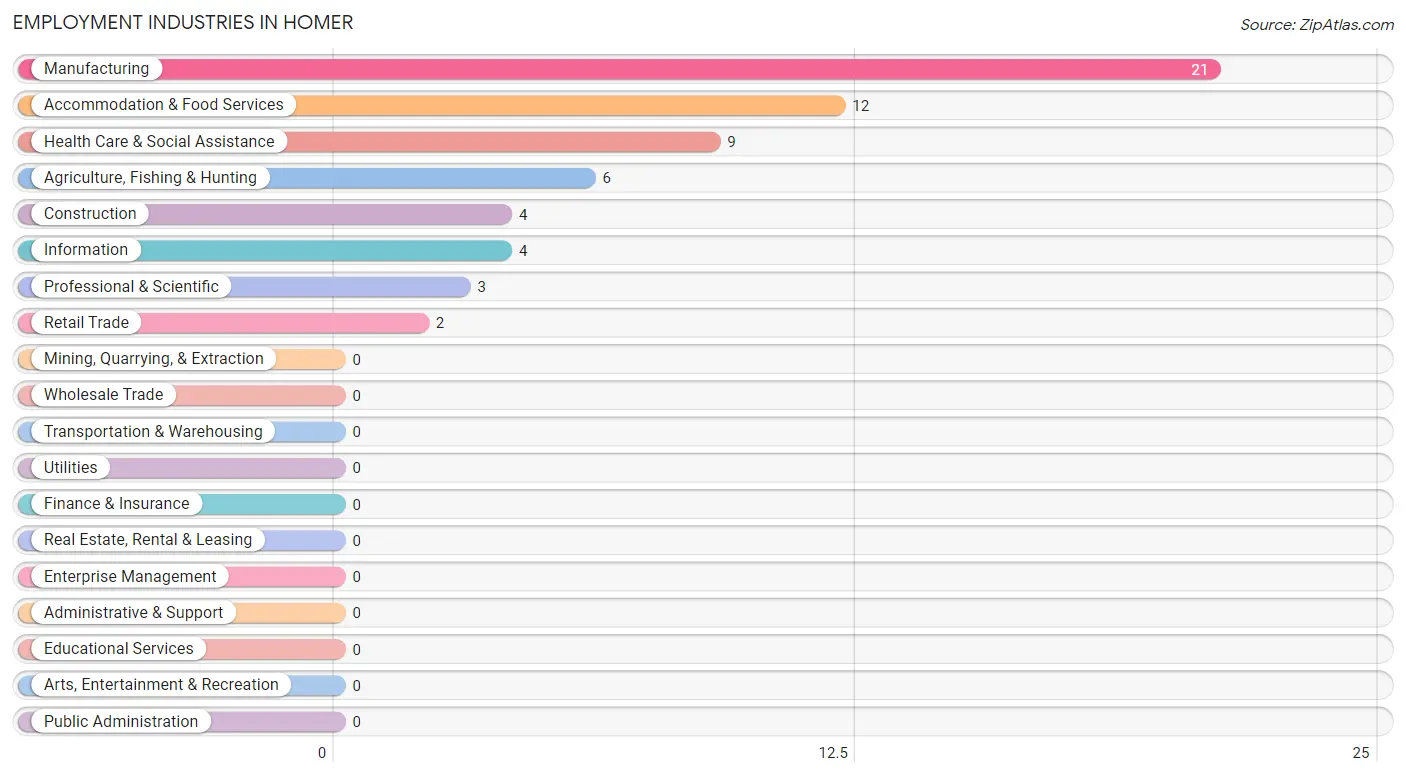
Employment Industries in Homer
The major employment industries in Homer include Manufacturing (21 | 33.3%), Accommodation & Food Services (12 | 19.1%), Health Care & Social Assistance (9 | 14.3%), Agriculture, Fishing & Hunting (6 | 9.5%), and Construction (4 | 6.4%).
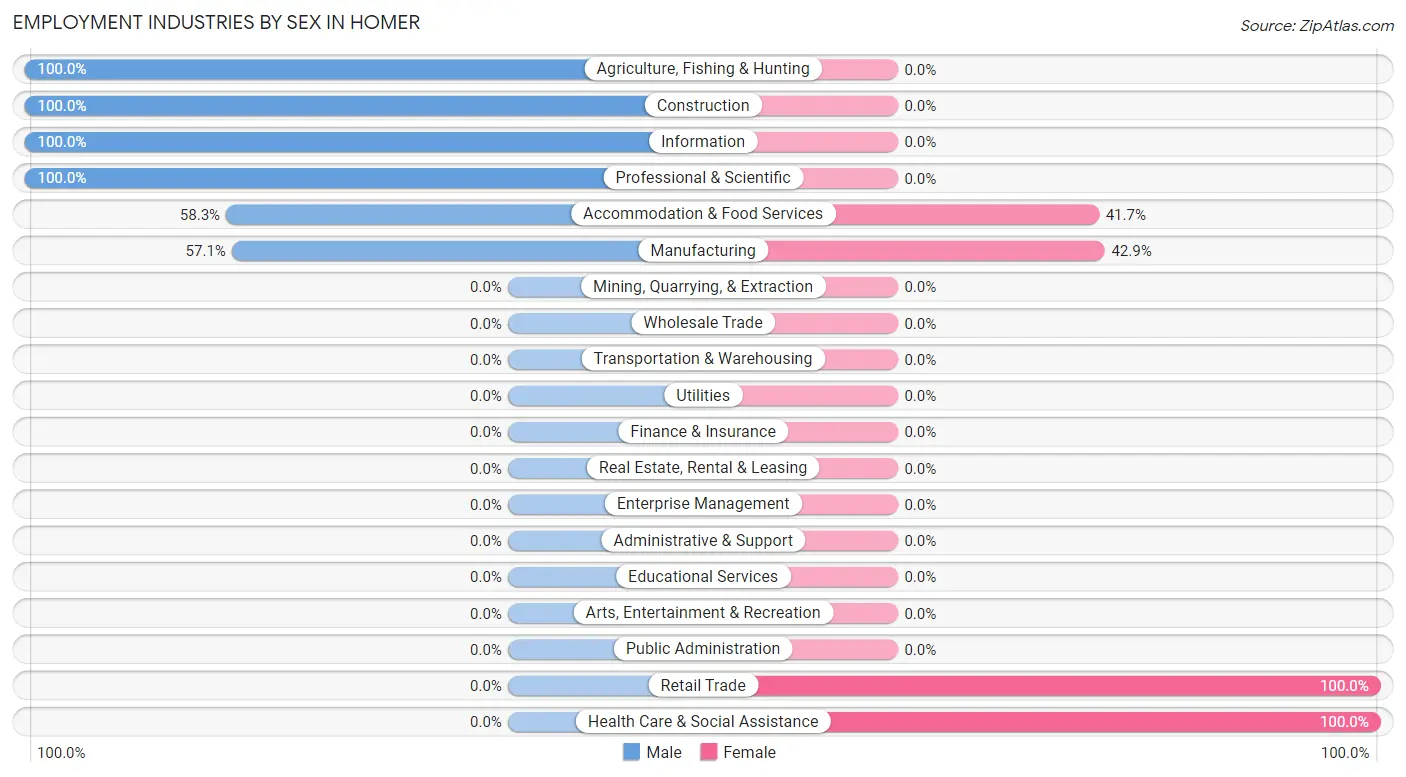
Employment Industries by Sex in Homer
The Homer industries that see more men than women are Agriculture, Fishing & Hunting (100.0%), Construction (100.0%), and Information (100.0%), whereas the industries that tend to have a higher number of women are Retail Trade (100.0%), Health Care & Social Assistance (100.0%), and Manufacturing (42.9%).
| Industry | Male | Female |
| Agriculture, Fishing & Hunting | 6 (100.0%) | 0 (0.0%) |
| Mining, Quarrying, & Extraction | 0 (0.0%) | 0 (0.0%) |
| Construction | 4 (100.0%) | 0 (0.0%) |
| Manufacturing | 12 (57.1%) | 9 (42.9%) |
| Wholesale Trade | 0 (0.0%) | 0 (0.0%) |
| Retail Trade | 0 (0.0%) | 2 (100.0%) |
| Transportation & Warehousing | 0 (0.0%) | 0 (0.0%) |
| Utilities | 0 (0.0%) | 0 (0.0%) |
| Information | 4 (100.0%) | 0 (0.0%) |
| Finance & Insurance | 0 (0.0%) | 0 (0.0%) |
| Real Estate, Rental & Leasing | 0 (0.0%) | 0 (0.0%) |
| Professional & Scientific | 3 (100.0%) | 0 (0.0%) |
| Enterprise Management | 0 (0.0%) | 0 (0.0%) |
| Administrative & Support | 0 (0.0%) | 0 (0.0%) |
| Educational Services | 0 (0.0%) | 0 (0.0%) |
| Health Care & Social Assistance | 0 (0.0%) | 9 (100.0%) |
| Arts, Entertainment & Recreation | 0 (0.0%) | 0 (0.0%) |
| Accommodation & Food Services | 7 (58.3%) | 5 (41.7%) |
| Public Administration | 0 (0.0%) | 0 (0.0%) |
| Total | 36 (57.1%) | 27 (42.9%) |
Education in Homer
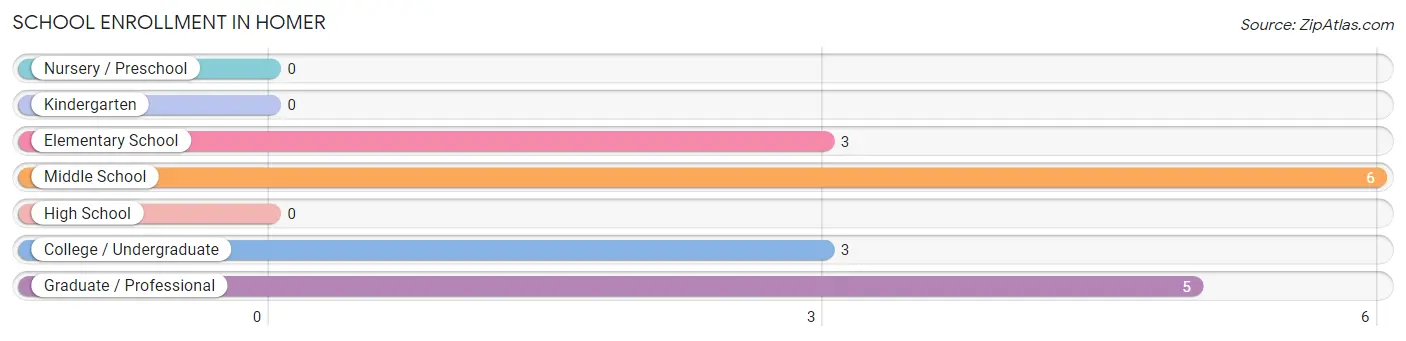
School Enrollment in Homer
The most common levels of schooling among the 17 students in Homer are middle school (6 | 35.3%), graduate / professional (5 | 29.4%), and elementary school (3 | 17.6%).
| School Level | # Students | % Students |
| Nursery / Preschool | 0 | 0.0% |
| Kindergarten | 0 | 0.0% |
| Elementary School | 3 | 17.6% |
| Middle School | 6 | 35.3% |
| High School | 0 | 0.0% |
| College / Undergraduate | 3 | 17.6% |
| Graduate / Professional | 5 | 29.4% |
| Total | 17 | 100.0% |
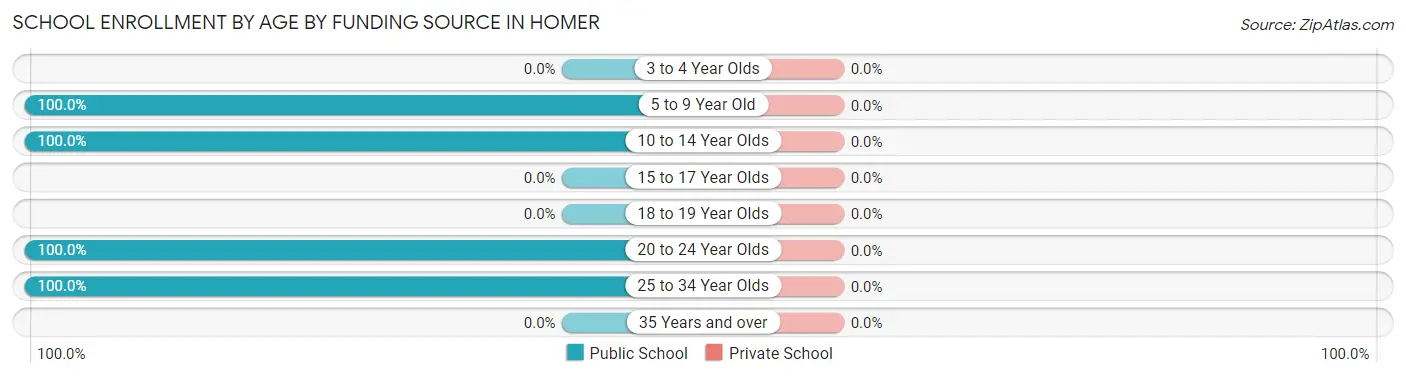
School Enrollment by Age by Funding Source in Homer
| Age Bracket | Public School | Private School |
| 3 to 4 Year Olds | 0 (0.0%) | 0 (0.0%) |
| 5 to 9 Year Old | 3 (100.0%) | 0 (0.0%) |
| 10 to 14 Year Olds | 6 (100.0%) | 0 (0.0%) |
| 15 to 17 Year Olds | 0 (0.0%) | 0 (0.0%) |
| 18 to 19 Year Olds | 0 (0.0%) | 0 (0.0%) |
| 20 to 24 Year Olds | 5 (100.0%) | 0 (0.0%) |
| 25 to 34 Year Olds | 3 (100.0%) | 0 (0.0%) |
| 35 Years and over | 0 (0.0%) | 0 (0.0%) |
| Total | 17 (100.0%) | 0 (0.0%) |
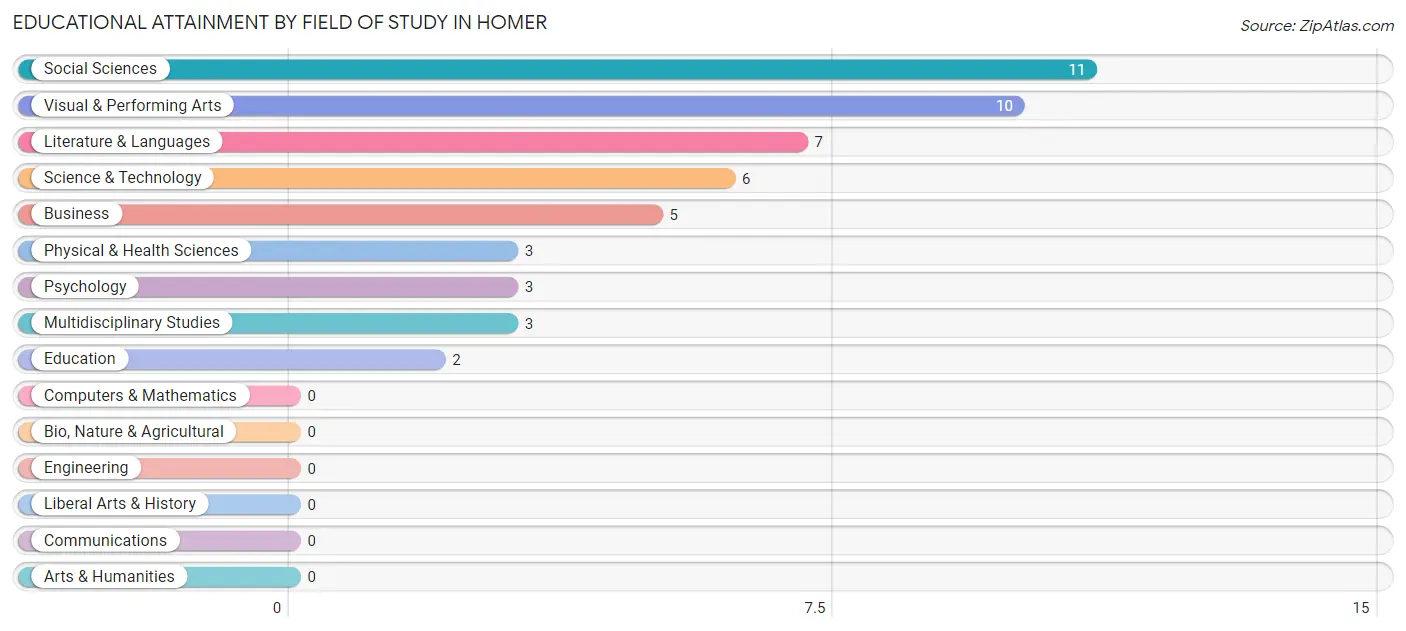
Educational Attainment by Field of Study in Homer
Social sciences (11 | 22.0%), visual & performing arts (10 | 20.0%), literature & languages (7 | 14.0%), science & technology (6 | 12.0%), and business (5 | 10.0%) are the most common fields of study among 50 individuals in Homer who have obtained a bachelor's degree or higher.
| Field of Study | # Graduates | % Graduates |
| Computers & Mathematics | 0 | 0.0% |
| Bio, Nature & Agricultural | 0 | 0.0% |
| Physical & Health Sciences | 3 | 6.0% |
| Psychology | 3 | 6.0% |
| Social Sciences | 11 | 22.0% |
| Engineering | 0 | 0.0% |
| Multidisciplinary Studies | 3 | 6.0% |
| Science & Technology | 6 | 12.0% |
| Business | 5 | 10.0% |
| Education | 2 | 4.0% |
| Literature & Languages | 7 | 14.0% |
| Liberal Arts & History | 0 | 0.0% |
| Visual & Performing Arts | 10 | 20.0% |
| Communications | 0 | 0.0% |
| Arts & Humanities | 0 | 0.0% |
| Total | 50 | 100.0% |
Transportation & Commute in Homer
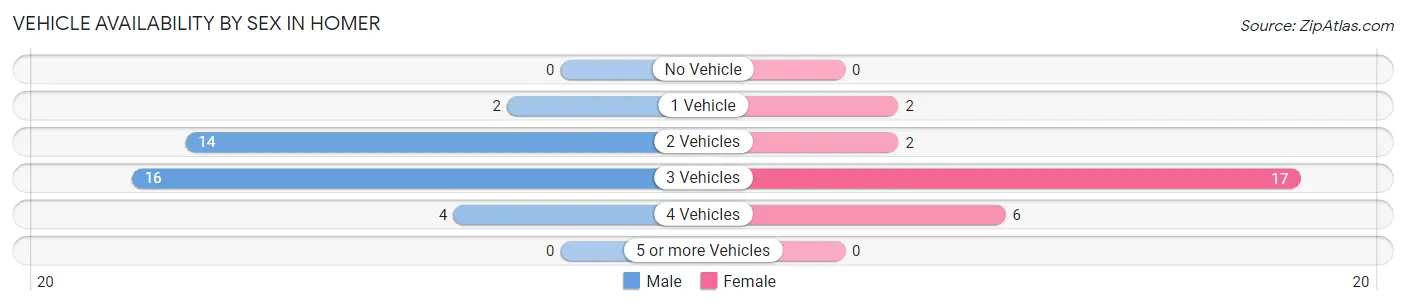
Vehicle Availability by Sex in Homer
The most prevalent vehicle ownership categories in Homer are males with 3 vehicles (16, accounting for 44.4%) and females with 3 vehicles (17, making up 59.3%).
| Vehicles Available | Male | Female |
| No Vehicle | 0 (0.0%) | 0 (0.0%) |
| 1 Vehicle | 2 (5.6%) | 2 (7.4%) |
| 2 Vehicles | 14 (38.9%) | 2 (7.4%) |
| 3 Vehicles | 16 (44.4%) | 17 (63.0%) |
| 4 Vehicles | 4 (11.1%) | 6 (22.2%) |
| 5 or more Vehicles | 0 (0.0%) | 0 (0.0%) |
| Total | 36 (100.0%) | 27 (100.0%) |
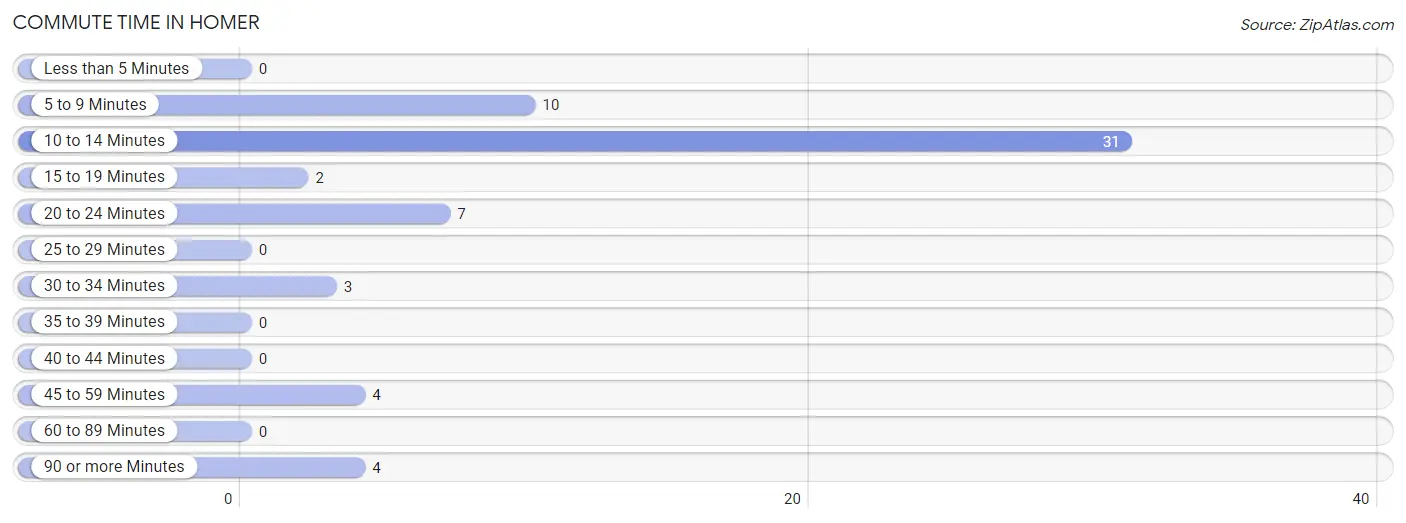
Commute Time in Homer
The most frequently occuring commute durations in Homer are 10 to 14 minutes (31 commuters, 50.8%), 5 to 9 minutes (10 commuters, 16.4%), and 20 to 24 minutes (7 commuters, 11.5%).
| Commute Time | # Commuters | % Commuters |
| Less than 5 Minutes | 0 | 0.0% |
| 5 to 9 Minutes | 10 | 16.4% |
| 10 to 14 Minutes | 31 | 50.8% |
| 15 to 19 Minutes | 2 | 3.3% |
| 20 to 24 Minutes | 7 | 11.5% |
| 25 to 29 Minutes | 0 | 0.0% |
| 30 to 34 Minutes | 3 | 4.9% |
| 35 to 39 Minutes | 0 | 0.0% |
| 40 to 44 Minutes | 0 | 0.0% |
| 45 to 59 Minutes | 4 | 6.6% |
| 60 to 89 Minutes | 0 | 0.0% |
| 90 or more Minutes | 4 | 6.6% |
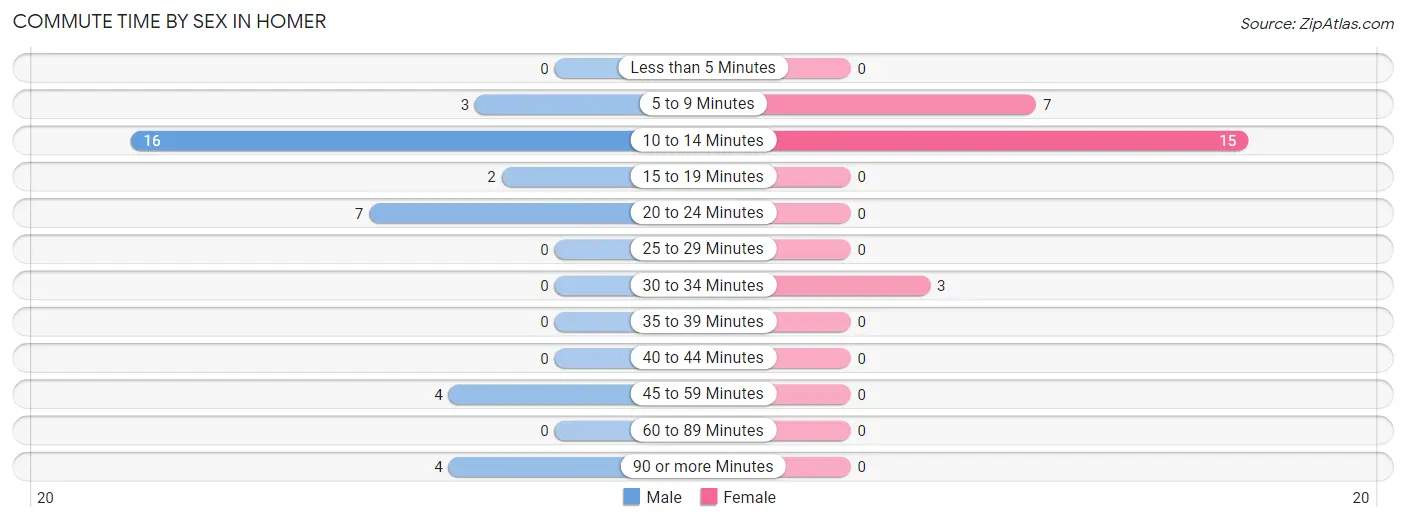
Commute Time by Sex in Homer
The most common commute times in Homer are 10 to 14 minutes (16 commuters, 44.4%) for males and 10 to 14 minutes (15 commuters, 60.0%) for females.
| Commute Time | Male | Female |
| Less than 5 Minutes | 0 (0.0%) | 0 (0.0%) |
| 5 to 9 Minutes | 3 (8.3%) | 7 (28.0%) |
| 10 to 14 Minutes | 16 (44.4%) | 15 (60.0%) |
| 15 to 19 Minutes | 2 (5.6%) | 0 (0.0%) |
| 20 to 24 Minutes | 7 (19.4%) | 0 (0.0%) |
| 25 to 29 Minutes | 0 (0.0%) | 0 (0.0%) |
| 30 to 34 Minutes | 0 (0.0%) | 3 (12.0%) |
| 35 to 39 Minutes | 0 (0.0%) | 0 (0.0%) |
| 40 to 44 Minutes | 0 (0.0%) | 0 (0.0%) |
| 45 to 59 Minutes | 4 (11.1%) | 0 (0.0%) |
| 60 to 89 Minutes | 0 (0.0%) | 0 (0.0%) |
| 90 or more Minutes | 4 (11.1%) | 0 (0.0%) |
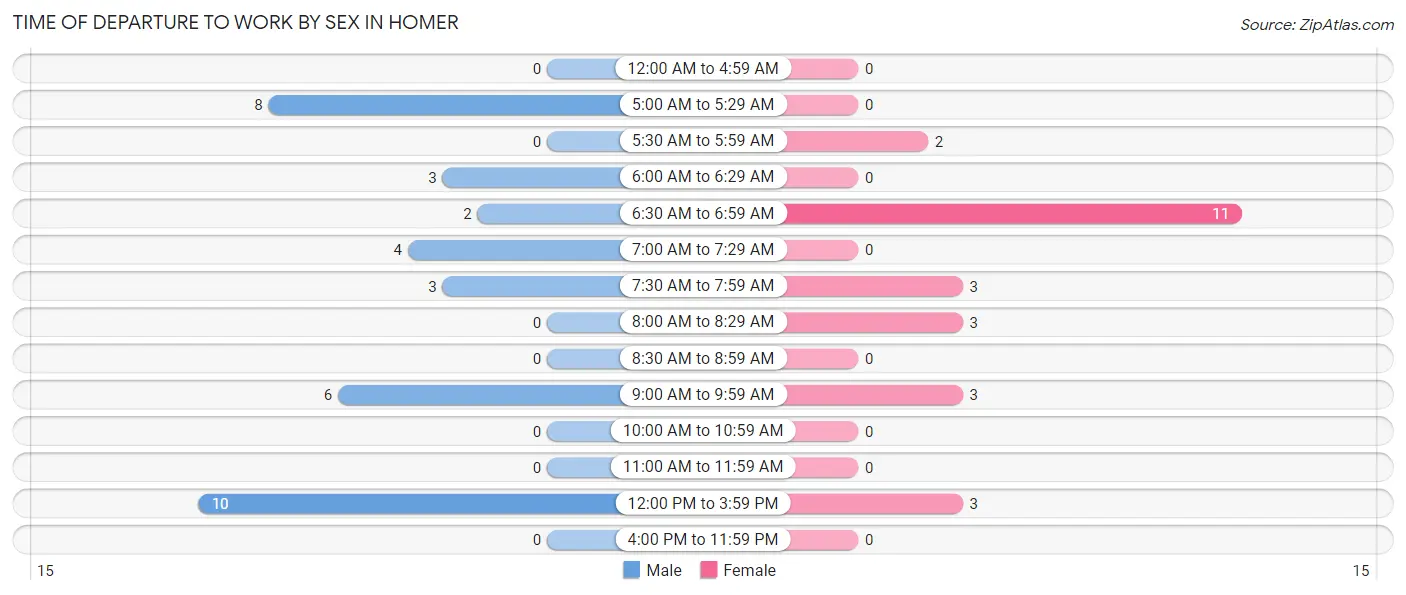
Time of Departure to Work by Sex in Homer
The most frequent times of departure to work in Homer are 12:00 PM to 3:59 PM (10, 27.8%) for males and 6:30 AM to 6:59 AM (11, 44.0%) for females.
| Time of Departure | Male | Female |
| 12:00 AM to 4:59 AM | 0 (0.0%) | 0 (0.0%) |
| 5:00 AM to 5:29 AM | 8 (22.2%) | 0 (0.0%) |
| 5:30 AM to 5:59 AM | 0 (0.0%) | 2 (8.0%) |
| 6:00 AM to 6:29 AM | 3 (8.3%) | 0 (0.0%) |
| 6:30 AM to 6:59 AM | 2 (5.6%) | 11 (44.0%) |
| 7:00 AM to 7:29 AM | 4 (11.1%) | 0 (0.0%) |
| 7:30 AM to 7:59 AM | 3 (8.3%) | 3 (12.0%) |
| 8:00 AM to 8:29 AM | 0 (0.0%) | 3 (12.0%) |
| 8:30 AM to 8:59 AM | 0 (0.0%) | 0 (0.0%) |
| 9:00 AM to 9:59 AM | 6 (16.7%) | 3 (12.0%) |
| 10:00 AM to 10:59 AM | 0 (0.0%) | 0 (0.0%) |
| 11:00 AM to 11:59 AM | 0 (0.0%) | 0 (0.0%) |
| 12:00 PM to 3:59 PM | 10 (27.8%) | 3 (12.0%) |
| 4:00 PM to 11:59 PM | 0 (0.0%) | 0 (0.0%) |
| Total | 36 (100.0%) | 25 (100.0%) |
Housing Occupancy in Homer
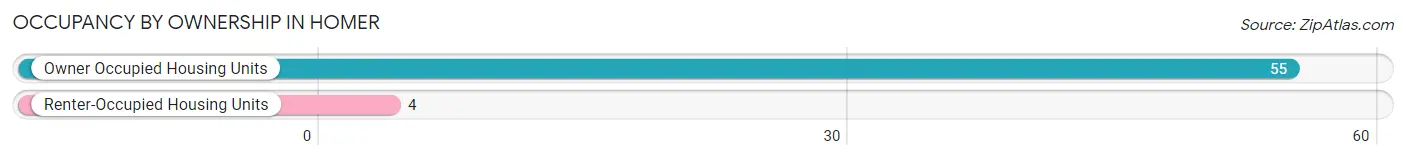
Occupancy by Ownership in Homer
Of the total 59 dwellings in Homer, owner-occupied units account for 55 (93.2%), while renter-occupied units make up 4 (6.8%).
| Occupancy | # Housing Units | % Housing Units |
| Owner Occupied Housing Units | 55 | 93.2% |
| Renter-Occupied Housing Units | 4 | 6.8% |
| Total Occupied Housing Units | 59 | 100.0% |
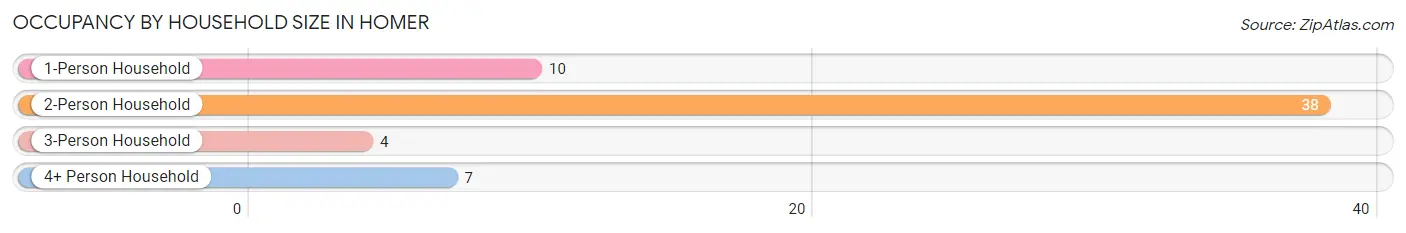
Occupancy by Household Size in Homer
| Household Size | # Housing Units | % Housing Units |
| 1-Person Household | 10 | 17.0% |
| 2-Person Household | 38 | 64.4% |
| 3-Person Household | 4 | 6.8% |
| 4+ Person Household | 7 | 11.9% |
| Total Housing Units | 59 | 100.0% |
Occupancy by Ownership by Household Size in Homer
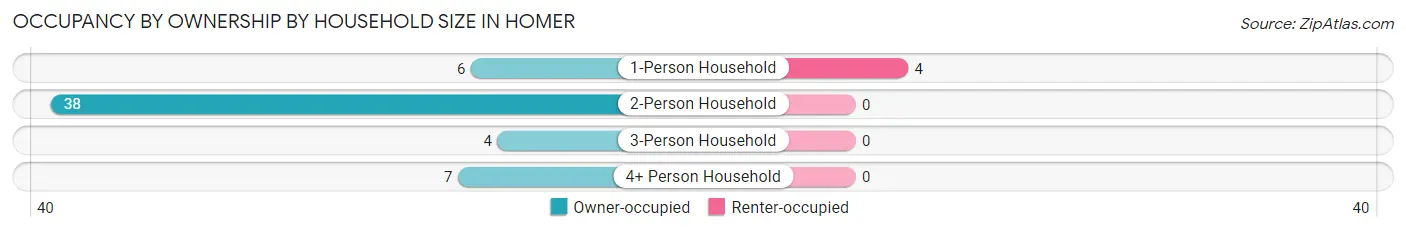
| Household Size | Owner-occupied | Renter-occupied |
| 1-Person Household | 6 (60.0%) | 4 (40.0%) |
| 2-Person Household | 38 (100.0%) | 0 (0.0%) |
| 3-Person Household | 4 (100.0%) | 0 (0.0%) |
| 4+ Person Household | 7 (100.0%) | 0 (0.0%) |
| Total Housing Units | 55 (93.2%) | 4 (6.8%) |
Occupancy by Educational Attainment in Homer
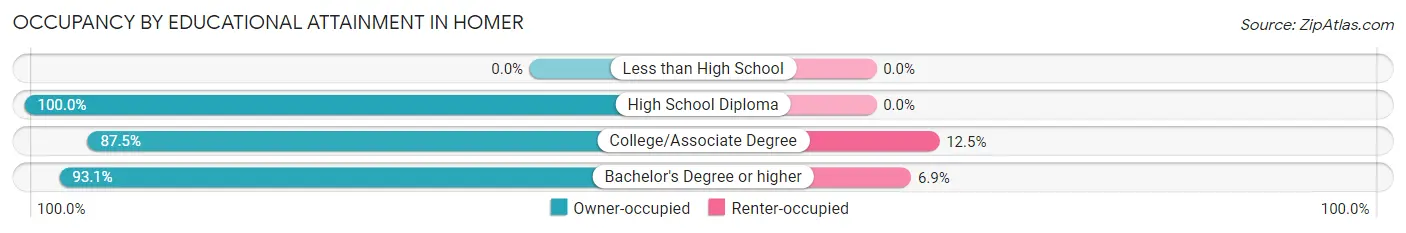
| Household Size | Owner-occupied | Renter-occupied |
| Less than High School | 0 (0.0%) | 0 (0.0%) |
| High School Diploma | 14 (100.0%) | 0 (0.0%) |
| College/Associate Degree | 14 (87.5%) | 2 (12.5%) |
| Bachelor's Degree or higher | 27 (93.1%) | 2 (6.9%) |
Occupancy by Age of Householder in Homer
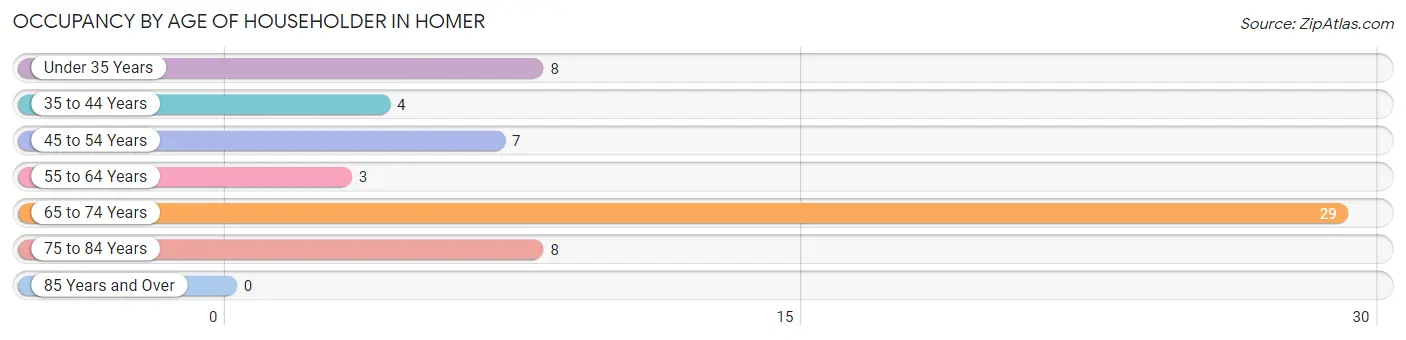
| Age Bracket | # Households | % Households |
| Under 35 Years | 8 | 13.6% |
| 35 to 44 Years | 4 | 6.8% |
| 45 to 54 Years | 7 | 11.9% |
| 55 to 64 Years | 3 | 5.1% |
| 65 to 74 Years | 29 | 49.1% |
| 75 to 84 Years | 8 | 13.6% |
| 85 Years and Over | 0 | 0.0% |
| Total | 59 | 100.0% |
Housing Finances in Homer
Median Income by Occupancy in Homer
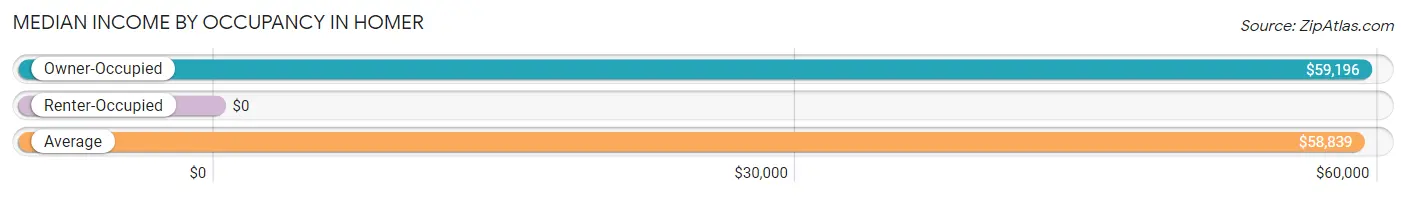
| Occupancy Type | # Households | Median Income |
| Owner-Occupied | 55 (93.2%) | $59,196 |
| Renter-Occupied | 4 (6.8%) | $0 |
| Average | 59 (100.0%) | $58,839 |
Occupancy by Householder Income Bracket in Homer
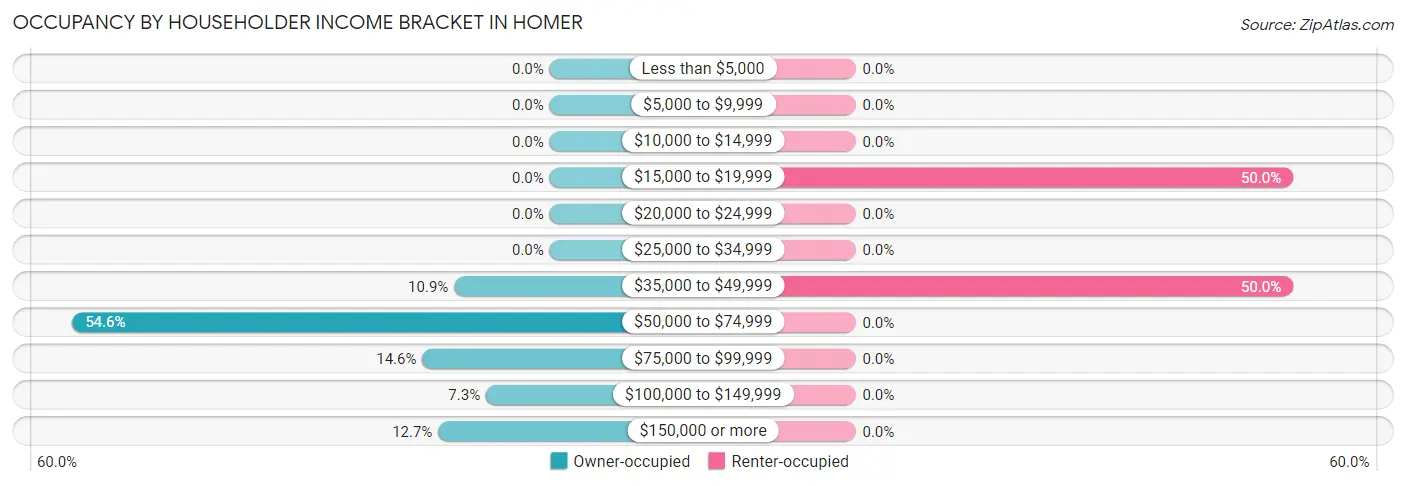
| Income Bracket | Owner-occupied | Renter-occupied |
| Less than $5,000 | 0 (0.0%) | 0 (0.0%) |
| $5,000 to $9,999 | 0 (0.0%) | 0 (0.0%) |
| $10,000 to $14,999 | 0 (0.0%) | 0 (0.0%) |
| $15,000 to $19,999 | 0 (0.0%) | 2 (50.0%) |
| $20,000 to $24,999 | 0 (0.0%) | 0 (0.0%) |
| $25,000 to $34,999 | 0 (0.0%) | 0 (0.0%) |
| $35,000 to $49,999 | 6 (10.9%) | 2 (50.0%) |
| $50,000 to $74,999 | 30 (54.5%) | 0 (0.0%) |
| $75,000 to $99,999 | 8 (14.5%) | 0 (0.0%) |
| $100,000 to $149,999 | 4 (7.3%) | 0 (0.0%) |
| $150,000 or more | 7 (12.7%) | 0 (0.0%) |
| Total | 55 (100.0%) | 4 (100.0%) |
Monthly Housing Cost Tiers in Homer
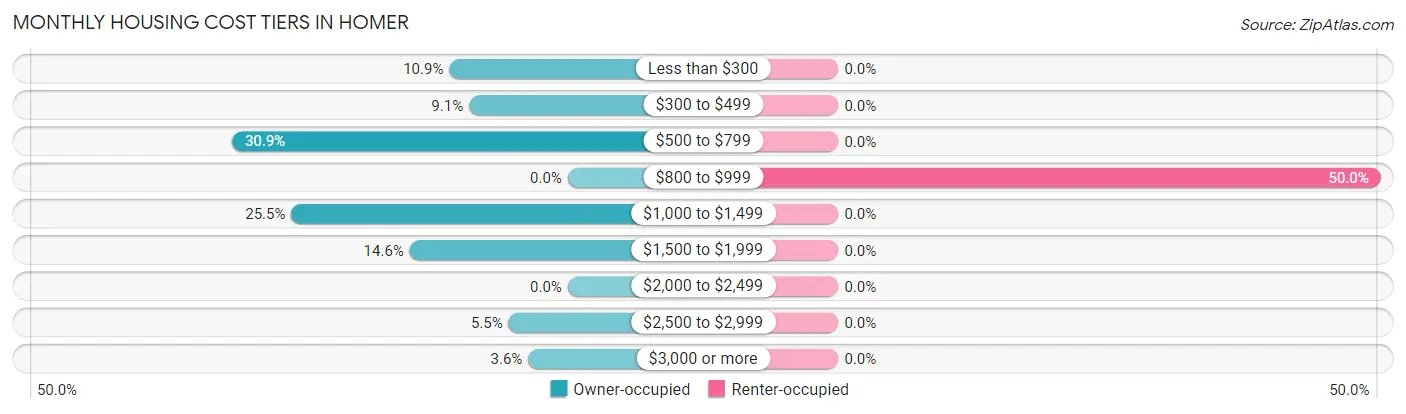
| Monthly Cost | Owner-occupied | Renter-occupied |
| Less than $300 | 6 (10.9%) | 0 (0.0%) |
| $300 to $499 | 5 (9.1%) | 0 (0.0%) |
| $500 to $799 | 17 (30.9%) | 0 (0.0%) |
| $800 to $999 | 0 (0.0%) | 2 (50.0%) |
| $1,000 to $1,499 | 14 (25.5%) | 0 (0.0%) |
| $1,500 to $1,999 | 8 (14.5%) | 0 (0.0%) |
| $2,000 to $2,499 | 0 (0.0%) | 0 (0.0%) |
| $2,500 to $2,999 | 3 (5.4%) | 0 (0.0%) |
| $3,000 or more | 2 (3.6%) | 0 (0.0%) |
| Total | 55 (100.0%) | 4 (100.0%) |
Physical Housing Characteristics in Homer
Housing Structures in Homer
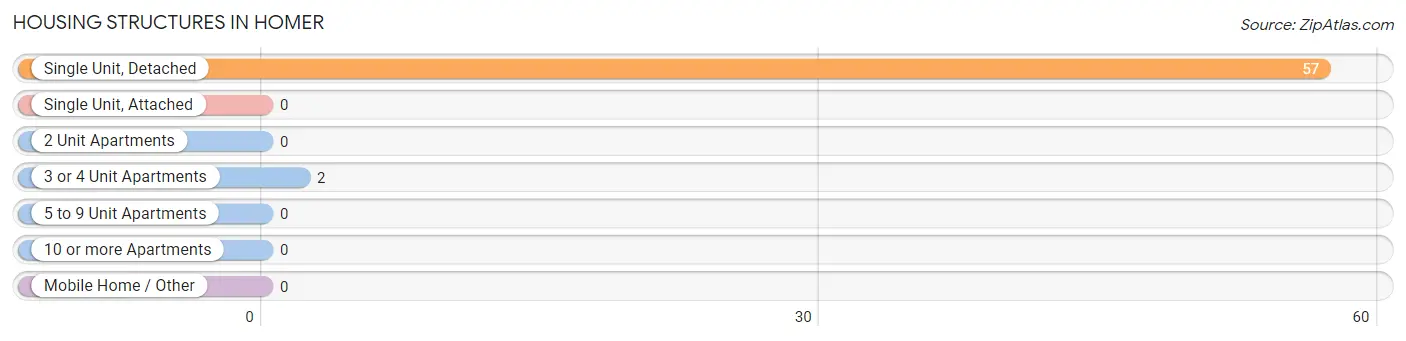
| Structure Type | # Housing Units | % Housing Units |
| Single Unit, Detached | 57 | 96.6% |
| Single Unit, Attached | 0 | 0.0% |
| 2 Unit Apartments | 0 | 0.0% |
| 3 or 4 Unit Apartments | 2 | 3.4% |
| 5 to 9 Unit Apartments | 0 | 0.0% |
| 10 or more Apartments | 0 | 0.0% |
| Mobile Home / Other | 0 | 0.0% |
| Total | 59 | 100.0% |
Housing Structures by Occupancy in Homer
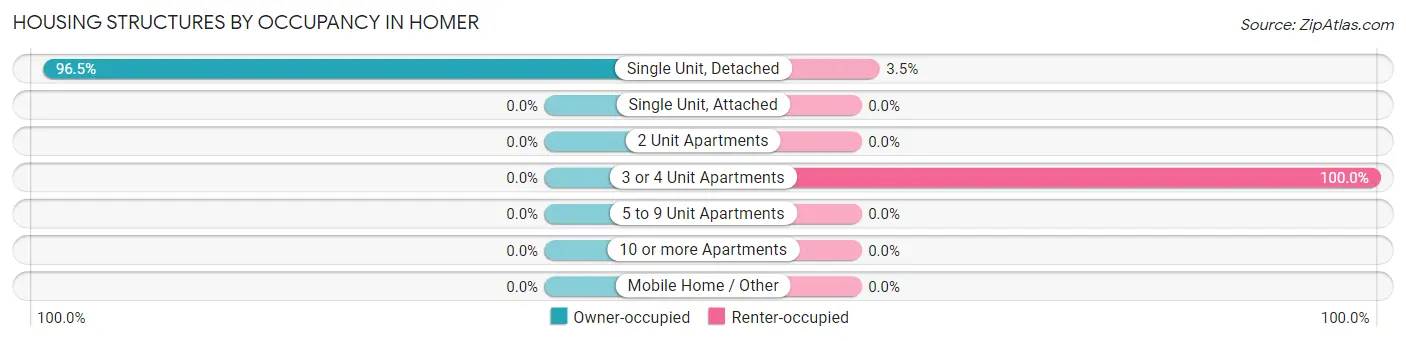
| Structure Type | Owner-occupied | Renter-occupied |
| Single Unit, Detached | 55 (96.5%) | 2 (3.5%) |
| Single Unit, Attached | 0 (0.0%) | 0 (0.0%) |
| 2 Unit Apartments | 0 (0.0%) | 0 (0.0%) |
| 3 or 4 Unit Apartments | 0 (0.0%) | 2 (100.0%) |
| 5 to 9 Unit Apartments | 0 (0.0%) | 0 (0.0%) |
| 10 or more Apartments | 0 (0.0%) | 0 (0.0%) |
| Mobile Home / Other | 0 (0.0%) | 0 (0.0%) |
| Total | 55 (93.2%) | 4 (6.8%) |
Housing Structures by Number of Rooms in Homer
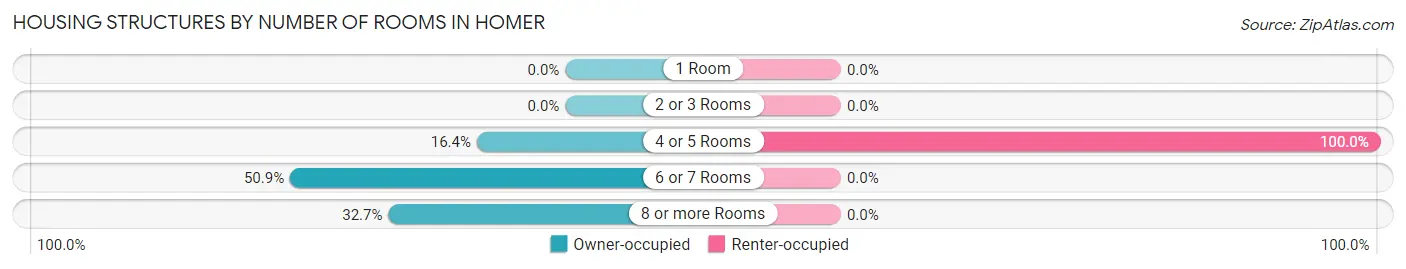
| Number of Rooms | Owner-occupied | Renter-occupied |
| 1 Room | 0 (0.0%) | 0 (0.0%) |
| 2 or 3 Rooms | 0 (0.0%) | 0 (0.0%) |
| 4 or 5 Rooms | 9 (16.4%) | 4 (100.0%) |
| 6 or 7 Rooms | 28 (50.9%) | 0 (0.0%) |
| 8 or more Rooms | 18 (32.7%) | 0 (0.0%) |
| Total | 55 (100.0%) | 4 (100.0%) |
Housing Structure by Heating Type in Homer
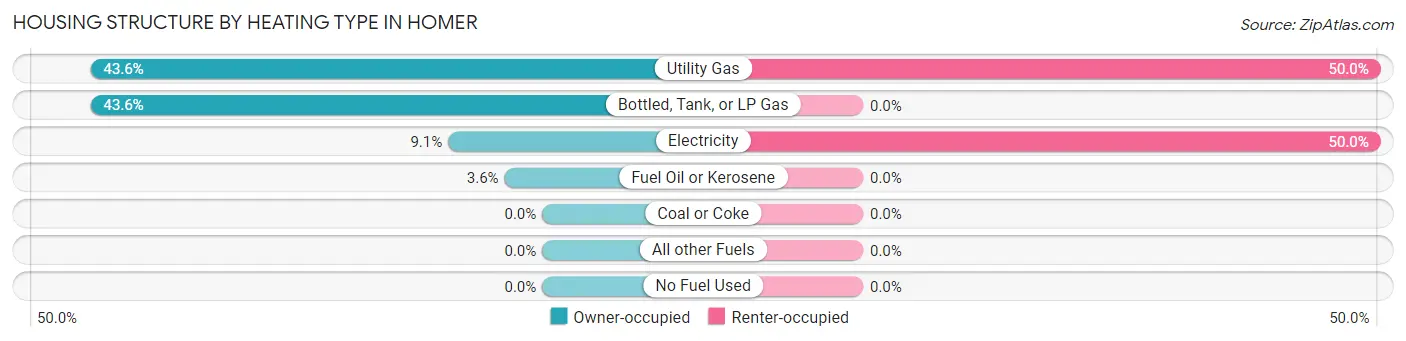
| Heating Type | Owner-occupied | Renter-occupied |
| Utility Gas | 24 (43.6%) | 2 (50.0%) |
| Bottled, Tank, or LP Gas | 24 (43.6%) | 0 (0.0%) |
| Electricity | 5 (9.1%) | 2 (50.0%) |
| Fuel Oil or Kerosene | 2 (3.6%) | 0 (0.0%) |
| Coal or Coke | 0 (0.0%) | 0 (0.0%) |
| All other Fuels | 0 (0.0%) | 0 (0.0%) |
| No Fuel Used | 0 (0.0%) | 0 (0.0%) |
| Total | 55 (100.0%) | 4 (100.0%) |
Household Vehicle Usage in Homer
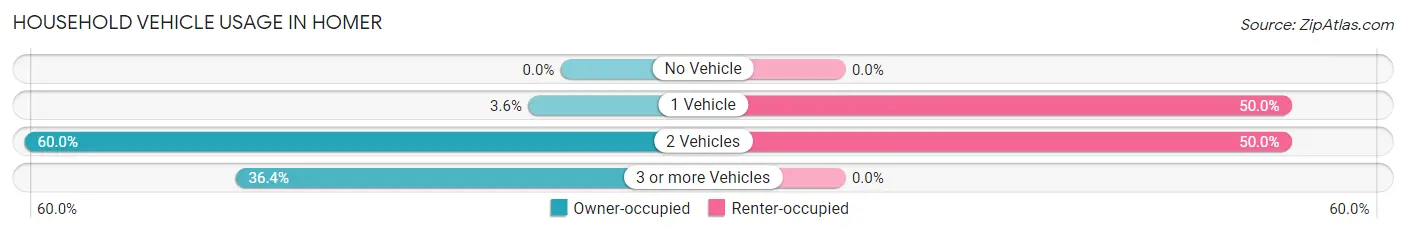
| Vehicles per Household | Owner-occupied | Renter-occupied |
| No Vehicle | 0 (0.0%) | 0 (0.0%) |
| 1 Vehicle | 2 (3.6%) | 2 (50.0%) |
| 2 Vehicles | 33 (60.0%) | 2 (50.0%) |
| 3 or more Vehicles | 20 (36.4%) | 0 (0.0%) |
| Total | 55 (100.0%) | 4 (100.0%) |
Real Estate & Mortgages in Homer
Real Estate and Mortgage Overview in Homer
| Characteristic | Without Mortgage | With Mortgage |
| Housing Units | 30 | 25 |
| Median Property Value | - | - |
| Median Household Income | $71,250 | $4 |
| Monthly Housing Costs | $622 | $2 |
| Real Estate Taxes | $3,200 | $0 |
Property Value by Mortgage Status in Homer
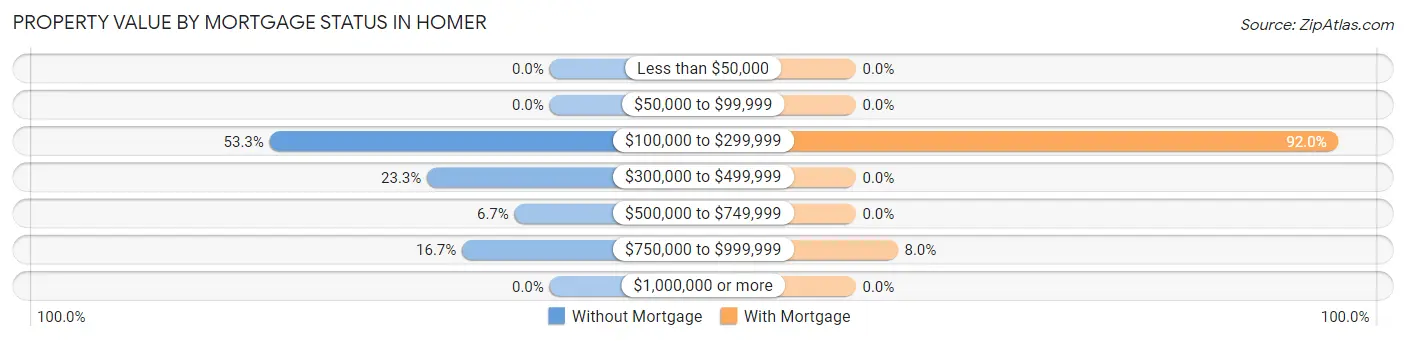
| Property Value | Without Mortgage | With Mortgage |
| Less than $50,000 | 0 (0.0%) | 0 (0.0%) |
| $50,000 to $99,999 | 0 (0.0%) | 0 (0.0%) |
| $100,000 to $299,999 | 16 (53.3%) | 23 (92.0%) |
| $300,000 to $499,999 | 7 (23.3%) | 0 (0.0%) |
| $500,000 to $749,999 | 2 (6.7%) | 0 (0.0%) |
| $750,000 to $999,999 | 5 (16.7%) | 2 (8.0%) |
| $1,000,000 or more | 0 (0.0%) | 0 (0.0%) |
| Total | 30 (100.0%) | 25 (100.0%) |
Household Income by Mortgage Status in Homer
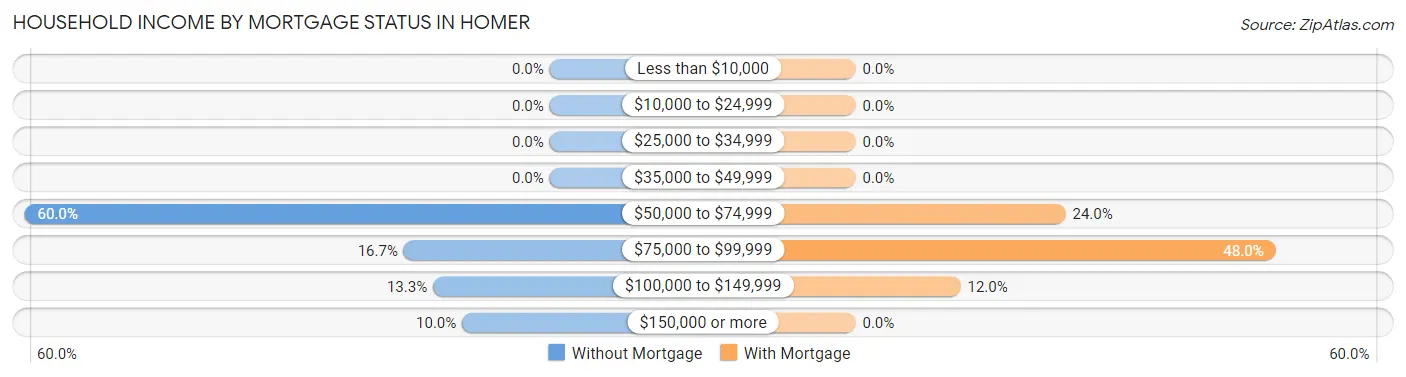
| Household Income | Without Mortgage | With Mortgage |
| Less than $10,000 | 0 (0.0%) | 0 (0.0%) |
| $10,000 to $24,999 | 0 (0.0%) | 0 (0.0%) |
| $25,000 to $34,999 | 0 (0.0%) | 0 (0.0%) |
| $35,000 to $49,999 | 0 (0.0%) | 0 (0.0%) |
| $50,000 to $74,999 | 18 (60.0%) | 6 (24.0%) |
| $75,000 to $99,999 | 5 (16.7%) | 12 (48.0%) |
| $100,000 to $149,999 | 4 (13.3%) | 3 (12.0%) |
| $150,000 or more | 3 (10.0%) | 0 (0.0%) |
| Total | 30 (100.0%) | 25 (100.0%) |
Property Value to Household Income Ratio in Homer
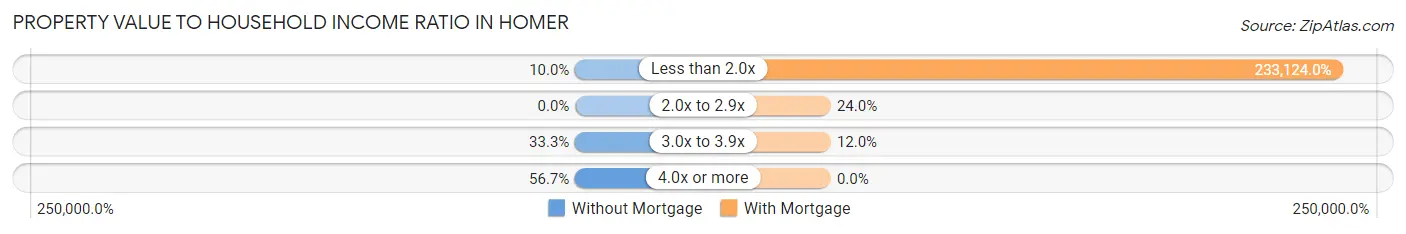
| Value-to-Income Ratio | Without Mortgage | With Mortgage |
| Less than 2.0x | 3 (10.0%) | 58,281 (233,124.0%) |
| 2.0x to 2.9x | 0 (0.0%) | 6 (24.0%) |
| 3.0x to 3.9x | 10 (33.3%) | 3 (12.0%) |
| 4.0x or more | 17 (56.7%) | 0 (0.0%) |
| Total | 30 (100.0%) | 25 (100.0%) |
Real Estate Taxes by Mortgage Status in Homer

| Property Taxes | Without Mortgage | With Mortgage |
| Less than $800 | 0 (0.0%) | 0 (0.0%) |
| $800 to $1,499 | 0 (0.0%) | 4 (16.0%) |
| $800 to $1,499 | 30 (100.0%) | 2 (8.0%) |
| Total | 30 (100.0%) | 25 (100.0%) |
Health & Disability in Homer
Health Insurance Coverage by Age in Homer
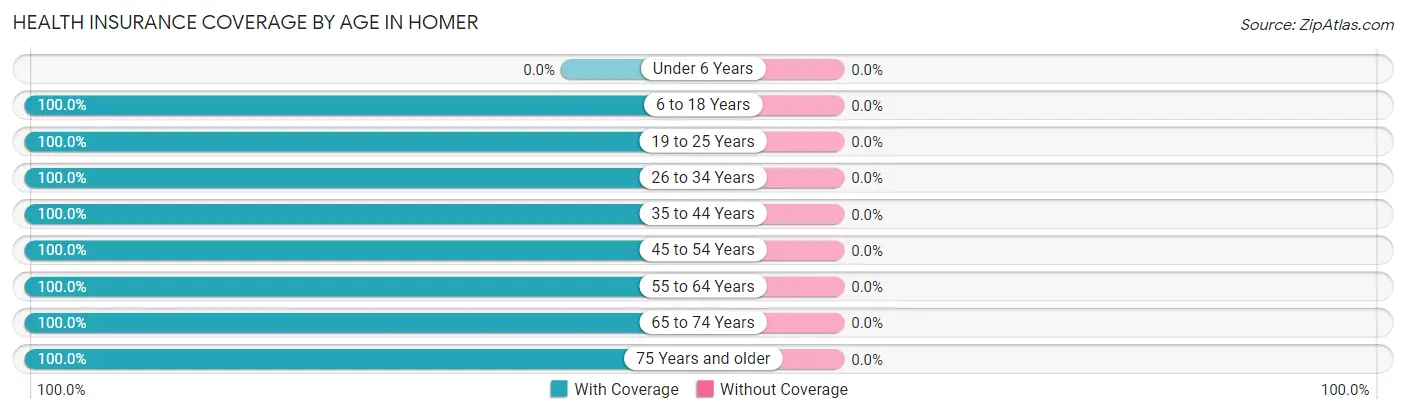
| Age Bracket | With Coverage | Without Coverage |
| Under 6 Years | 0 (0.0%) | 0 (0.0%) |
| 6 to 18 Years | 9 (100.0%) | 0 (0.0%) |
| 19 to 25 Years | 21 (100.0%) | 0 (0.0%) |
| 26 to 34 Years | 9 (100.0%) | 0 (0.0%) |
| 35 to 44 Years | 7 (100.0%) | 0 (0.0%) |
| 45 to 54 Years | 10 (100.0%) | 0 (0.0%) |
| 55 to 64 Years | 10 (100.0%) | 0 (0.0%) |
| 65 to 74 Years | 53 (100.0%) | 0 (0.0%) |
| 75 Years and older | 12 (100.0%) | 0 (0.0%) |
| Total | 131 (100.0%) | 0 (0.0%) |
Health Insurance Coverage by Citizenship Status in Homer
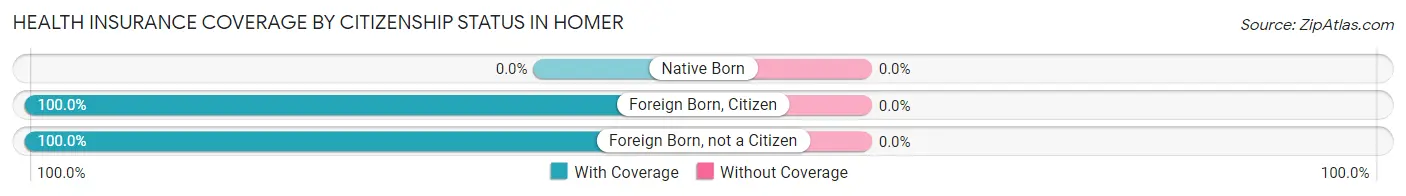
| Citizenship Status | With Coverage | Without Coverage |
| Native Born | 0 (0.0%) | 0 (0.0%) |
| Foreign Born, Citizen | 9 (100.0%) | 0 (0.0%) |
| Foreign Born, not a Citizen | 21 (100.0%) | 0 (0.0%) |
Health Insurance Coverage by Household Income in Homer
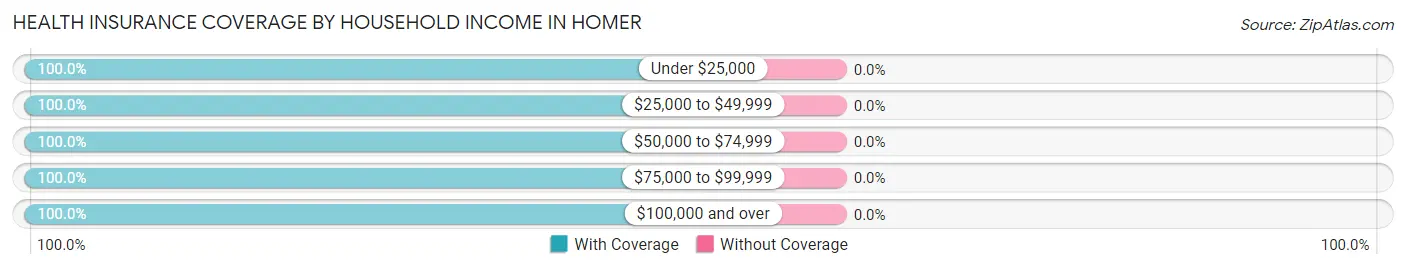
| Household Income | With Coverage | Without Coverage |
| Under $25,000 | 2 (100.0%) | 0 (0.0%) |
| $25,000 to $49,999 | 11 (100.0%) | 0 (0.0%) |
| $50,000 to $74,999 | 77 (100.0%) | 0 (0.0%) |
| $75,000 to $99,999 | 15 (100.0%) | 0 (0.0%) |
| $100,000 and over | 26 (100.0%) | 0 (0.0%) |
Public vs Private Health Insurance Coverage by Age in Homer
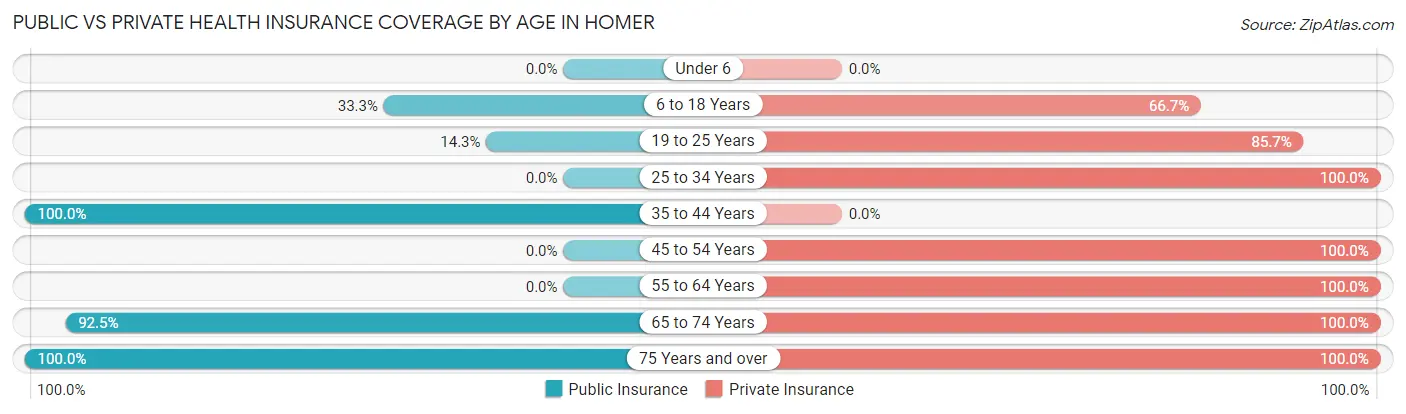
| Age Bracket | Public Insurance | Private Insurance |
| Under 6 | 0 (0.0%) | 0 (0.0%) |
| 6 to 18 Years | 3 (33.3%) | 6 (66.7%) |
| 19 to 25 Years | 3 (14.3%) | 18 (85.7%) |
| 25 to 34 Years | 0 (0.0%) | 9 (100.0%) |
| 35 to 44 Years | 7 (100.0%) | 0 (0.0%) |
| 45 to 54 Years | 0 (0.0%) | 10 (100.0%) |
| 55 to 64 Years | 0 (0.0%) | 10 (100.0%) |
| 65 to 74 Years | 49 (92.4%) | 53 (100.0%) |
| 75 Years and over | 12 (100.0%) | 12 (100.0%) |
| Total | 74 (56.5%) | 118 (90.1%) |
Disability Status by Sex by Age in Homer
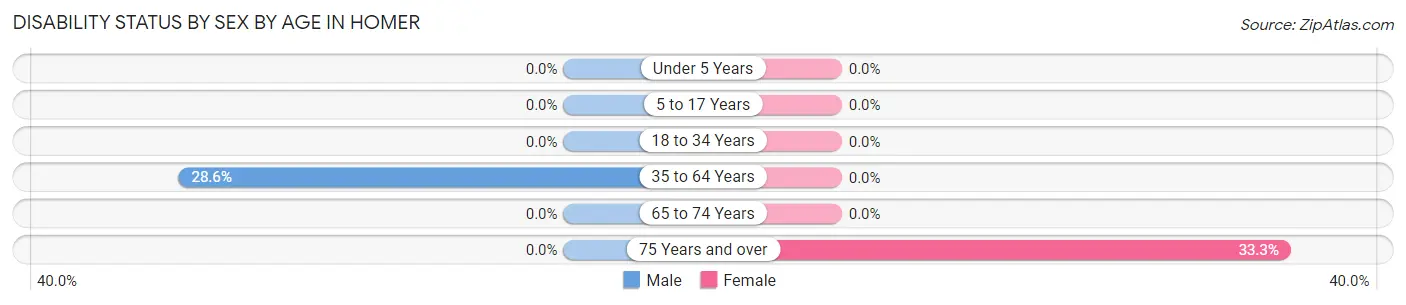
| Age Bracket | Male | Female |
| Under 5 Years | 0 (0.0%) | 0 (0.0%) |
| 5 to 17 Years | 0 (0.0%) | 0 (0.0%) |
| 18 to 34 Years | 0 (0.0%) | 0 (0.0%) |
| 35 to 64 Years | 4 (28.6%) | 0 (0.0%) |
| 65 to 74 Years | 0 (0.0%) | 0 (0.0%) |
| 75 Years and over | 0 (0.0%) | 2 (33.3%) |
Disability Class by Sex by Age in Homer
Disability Class: Hearing Difficulty
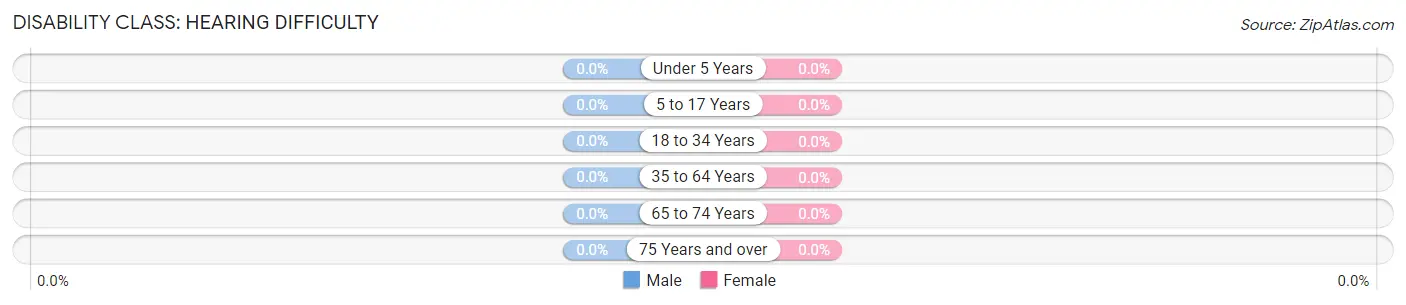
| Age Bracket | Male | Female |
| Under 5 Years | 0 (0.0%) | 0 (0.0%) |
| 5 to 17 Years | 0 (0.0%) | 0 (0.0%) |
| 18 to 34 Years | 0 (0.0%) | 0 (0.0%) |
| 35 to 64 Years | 0 (0.0%) | 0 (0.0%) |
| 65 to 74 Years | 0 (0.0%) | 0 (0.0%) |
| 75 Years and over | 0 (0.0%) | 0 (0.0%) |
Disability Class: Vision Difficulty
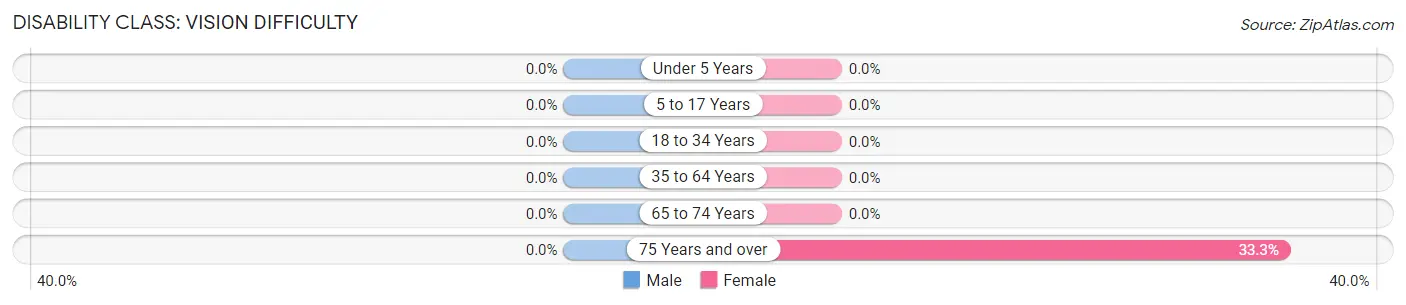
| Age Bracket | Male | Female |
| Under 5 Years | 0 (0.0%) | 0 (0.0%) |
| 5 to 17 Years | 0 (0.0%) | 0 (0.0%) |
| 18 to 34 Years | 0 (0.0%) | 0 (0.0%) |
| 35 to 64 Years | 0 (0.0%) | 0 (0.0%) |
| 65 to 74 Years | 0 (0.0%) | 0 (0.0%) |
| 75 Years and over | 0 (0.0%) | 2 (33.3%) |
Disability Class: Cognitive Difficulty
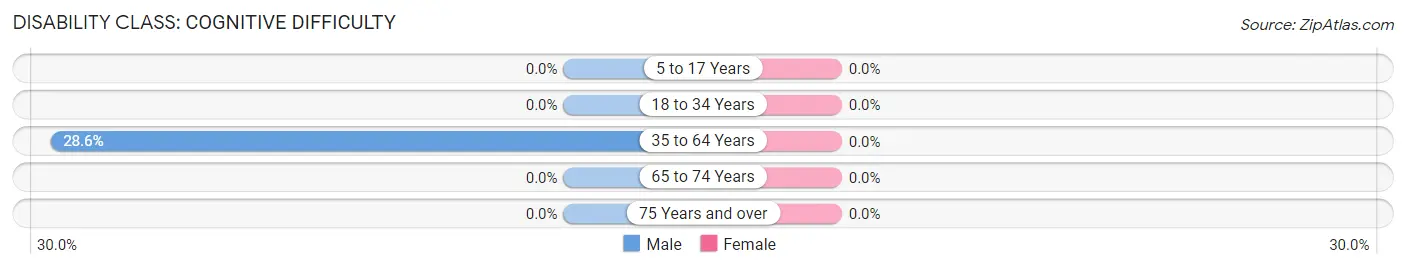
| Age Bracket | Male | Female |
| 5 to 17 Years | 0 (0.0%) | 0 (0.0%) |
| 18 to 34 Years | 0 (0.0%) | 0 (0.0%) |
| 35 to 64 Years | 4 (28.6%) | 0 (0.0%) |
| 65 to 74 Years | 0 (0.0%) | 0 (0.0%) |
| 75 Years and over | 0 (0.0%) | 0 (0.0%) |
Disability Class: Ambulatory Difficulty
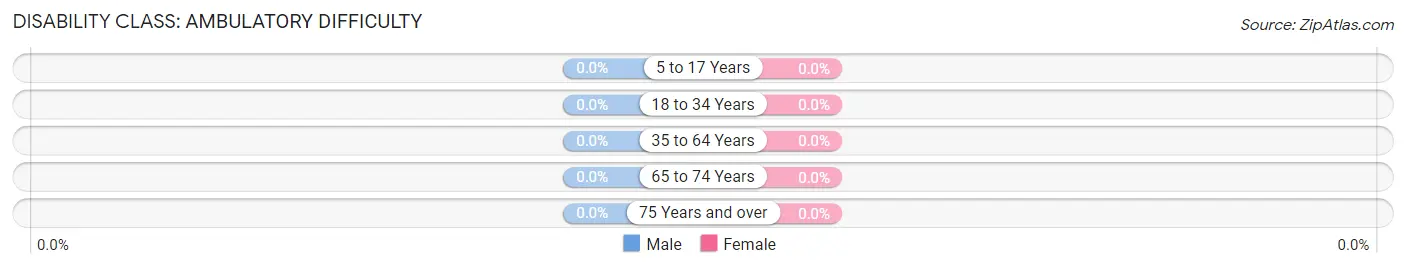
| Age Bracket | Male | Female |
| 5 to 17 Years | 0 (0.0%) | 0 (0.0%) |
| 18 to 34 Years | 0 (0.0%) | 0 (0.0%) |
| 35 to 64 Years | 0 (0.0%) | 0 (0.0%) |
| 65 to 74 Years | 0 (0.0%) | 0 (0.0%) |
| 75 Years and over | 0 (0.0%) | 0 (0.0%) |
Disability Class: Self-Care Difficulty
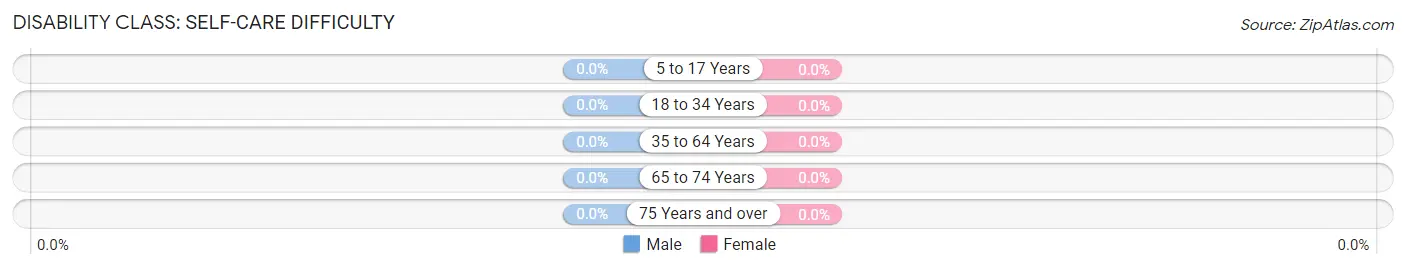
| Age Bracket | Male | Female |
| 5 to 17 Years | 0 (0.0%) | 0 (0.0%) |
| 18 to 34 Years | 0 (0.0%) | 0 (0.0%) |
| 35 to 64 Years | 0 (0.0%) | 0 (0.0%) |
| 65 to 74 Years | 0 (0.0%) | 0 (0.0%) |
| 75 Years and over | 0 (0.0%) | 0 (0.0%) |
Technology Access in Homer
Computing Device Access in Homer
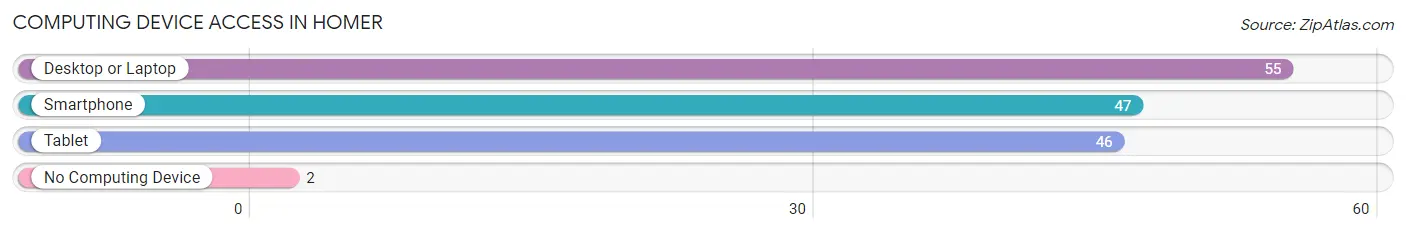
| Device Type | # Households | % Households |
| Desktop or Laptop | 55 | 93.2% |
| Smartphone | 47 | 79.7% |
| Tablet | 46 | 78.0% |
| No Computing Device | 2 | 3.4% |
| Total | 59 | 100.0% |
Internet Access in Homer
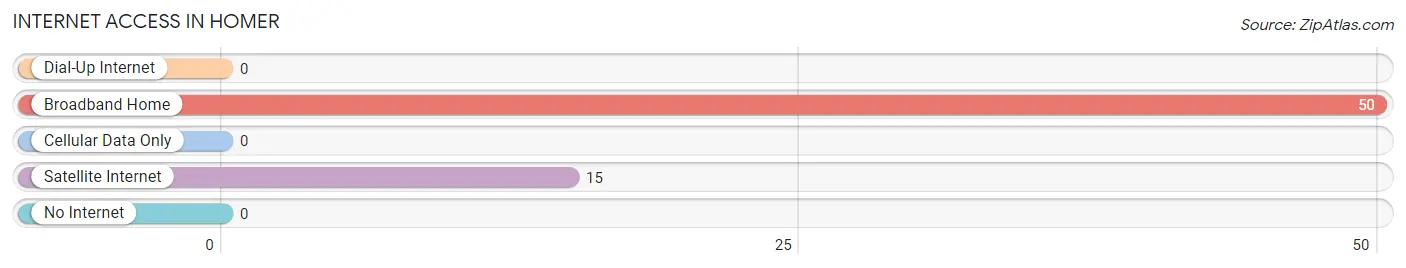
| Internet Type | # Households | % Households |
| Dial-Up Internet | 0 | 0.0% |
| Broadband Home | 50 | 84.8% |
| Cellular Data Only | 0 | 0.0% |
| Satellite Internet | 15 | 25.4% |
| No Internet | 0 | 0.0% |
| Total | 59 | 100.0% |
Homer Summary
Homer, Minnesota is a small town located in the southeastern corner of the state, near the border of Iowa. It is situated in the rolling hills of the Driftless Area, a region of the Midwest that was not glaciated during the last ice age. The town is home to just over 500 people, and is known for its rural charm and friendly atmosphere.
Geography
Homer is located in the southeastern corner of Minnesota, near the border of Iowa. It is situated in the rolling hills of the Driftless Area, a region of the Midwest that was not glaciated during the last ice age. The town is surrounded by lush farmland and rolling hills, and is located near the Root River, which is a popular destination for fishing and canoeing. The town is located about an hour and a half from the Twin Cities, and is easily accessible by car.
History
Homer was founded in 1856 by a group of settlers from New York. The town was named after the Greek poet Homer, and was originally intended to be a farming community. The town grew slowly over the years, and by the early 1900s, it had become a thriving agricultural center. The town was also home to a number of small businesses, including a general store, a blacksmith, and a sawmill.
In the 1950s, the town began to decline as many of its residents moved away in search of better economic opportunities. However, in the late 1970s, the town began to experience a resurgence as people began to move back to the area. Today, Homer is a small but vibrant community, with a population of just over 500 people.
Economy
Homer’s economy is largely based on agriculture. The town is surrounded by lush farmland, and many of its residents are involved in farming and related activities. The town is also home to a number of small businesses, including a general store, a hardware store, and a restaurant. In addition, the town is home to a number of small manufacturing companies, which produce a variety of products, including furniture and clothing.
Demographics
As of the 2010 census, Homer had a population of 517 people. The town is predominantly white, with 94.3% of the population identifying as such. The median household income is $45,000, and the median age is 44. The town is also home to a number of churches, including the United Methodist Church, the Lutheran Church, and the Catholic Church.
Conclusion
Homer, Minnesota is a small town located in the southeastern corner of the state, near the border of Iowa. It is situated in the rolling hills of the Driftless Area, and is known for its rural charm and friendly atmosphere. The town’s economy is largely based on agriculture, and it is home to a number of small businesses. The town is predominantly white, with a median household income of $45,000 and a median age of 44. Homer is a small but vibrant community, and is a great place to live and work.
Common Questions
What is Per Capita Income in Homer?
Per Capita income in Homer is $37,544.
What is the Median Family Income in Homer?
Median Family Income in Homer is $59,688.
What is the Median Household income in Homer?
Median Household Income in Homer is $58,839.
What is Inequality or Gini Index in Homer?
Inequality or Gini Index in Homer is 0.35.
What is the Total Population of Homer?
Total Population of Homer is 131.
What is the Total Male Population of Homer?
Total Male Population of Homer is 74.
What is the Total Female Population of Homer?
Total Female Population of Homer is 57.
What is the Ratio of Males per 100 Females in Homer?
There are 129.82 Males per 100 Females in Homer.
What is the Ratio of Females per 100 Males in Homer?
There are 77.03 Females per 100 Males in Homer.
What is the Median Population Age in Homer?
Median Population Age in Homer is 59.8 Years.
What is the Average Family Size in Homer
Average Family Size in Homer is 2.5 People.
What is the Average Household Size in Homer
Average Household Size in Homer is 2.2 People.
How Large is the Labor Force in Homer?
There are 63 People in the Labor Forcein in Homer.
What is the Percentage of People in the Labor Force in Homer?
51.6% of People are in the Labor Force in Homer.