Harding, MN Map & Demographics
Harding Map
Harding Overview
$28,145
PER CAPITA INCOME
$111,250
AVG FAMILY INCOME
$63,750
AVG HOUSEHOLD INCOME
0.43
INEQUALITY / GINI INDEX
139
TOTAL POPULATION
97
MALE POPULATION
42
FEMALE POPULATION
230.95
MALES / 100 FEMALES
43.30
FEMALES / 100 MALES
51.8
MEDIAN AGE
2.8
AVG FAMILY SIZE
2.3
AVG HOUSEHOLD SIZE
58
LABOR FORCE [ PEOPLE ]
46.4%
PERCENT IN LABOR FORCE
Harding Area Codes
Income in Harding
Income Overview in Harding
Per Capita Income in Harding is $28,145, while median incomes of families and households are $111,250 and $63,750 respectively.
| Characteristic | Number | Measure |
| Per Capita Income | 139 | $28,145 |
| Median Family Income | 34 | $111,250 |
| Mean Family Income | 34 | $91,262 |
| Median Household Income | 46 | $63,750 |
| Mean Household Income | 46 | $75,578 |
| Income Deficit | 34 | $0 |
| Wage / Income Gap (%) | 139 | 0.00% |
| Wage / Income Gap ($) | 139 | 100.00¢ per $1 |
| Gini / Inequality Index | 139 | 0.43 |
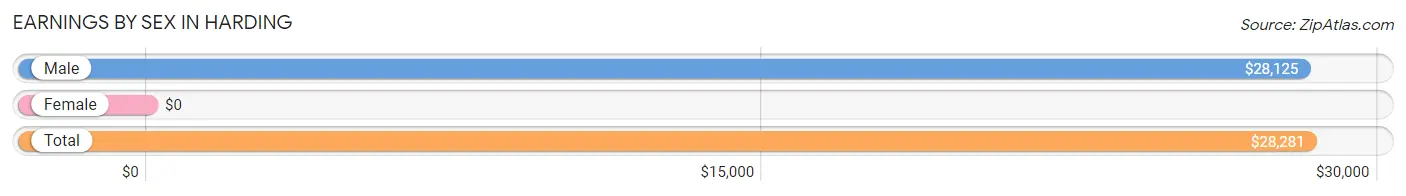
Earnings by Sex in Harding
| Sex | Number | Average Earnings |
| Male | 49 (67.1%) | $28,125 |
| Female | 24 (32.9%) | $0 |
| Total | 73 (100.0%) | $28,281 |
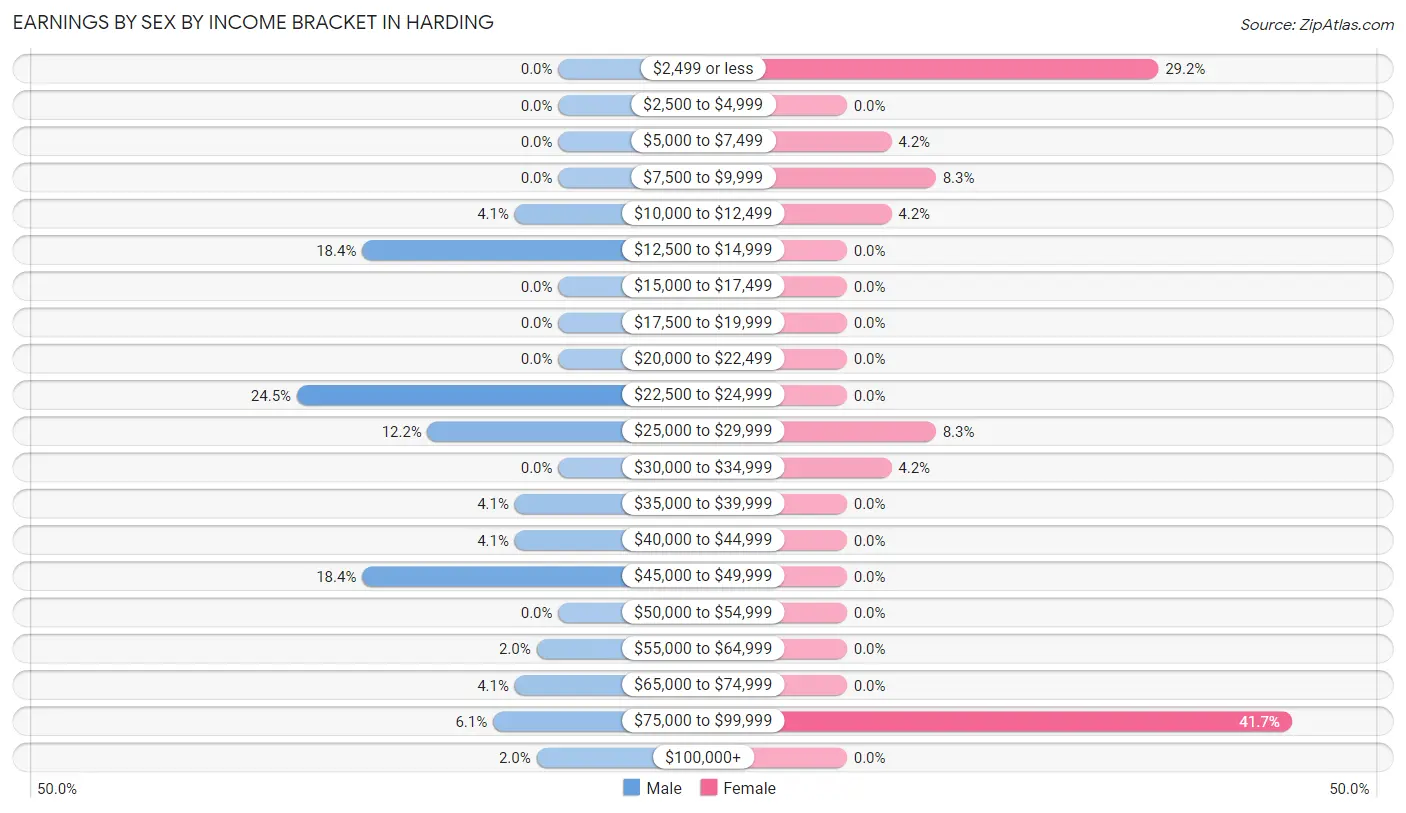
Earnings by Sex by Income Bracket in Harding
The most common earnings brackets in Harding are $22,500 to $24,999 for men (12 | 24.5%) and $75,000 to $99,999 for women (10 | 41.7%).
| Income | Male | Female |
| $2,499 or less | 0 (0.0%) | 7 (29.2%) |
| $2,500 to $4,999 | 0 (0.0%) | 0 (0.0%) |
| $5,000 to $7,499 | 0 (0.0%) | 1 (4.2%) |
| $7,500 to $9,999 | 0 (0.0%) | 2 (8.3%) |
| $10,000 to $12,499 | 2 (4.1%) | 1 (4.2%) |
| $12,500 to $14,999 | 9 (18.4%) | 0 (0.0%) |
| $15,000 to $17,499 | 0 (0.0%) | 0 (0.0%) |
| $17,500 to $19,999 | 0 (0.0%) | 0 (0.0%) |
| $20,000 to $22,499 | 0 (0.0%) | 0 (0.0%) |
| $22,500 to $24,999 | 12 (24.5%) | 0 (0.0%) |
| $25,000 to $29,999 | 6 (12.2%) | 2 (8.3%) |
| $30,000 to $34,999 | 0 (0.0%) | 1 (4.2%) |
| $35,000 to $39,999 | 2 (4.1%) | 0 (0.0%) |
| $40,000 to $44,999 | 2 (4.1%) | 0 (0.0%) |
| $45,000 to $49,999 | 9 (18.4%) | 0 (0.0%) |
| $50,000 to $54,999 | 0 (0.0%) | 0 (0.0%) |
| $55,000 to $64,999 | 1 (2.0%) | 0 (0.0%) |
| $65,000 to $74,999 | 2 (4.1%) | 0 (0.0%) |
| $75,000 to $99,999 | 3 (6.1%) | 10 (41.7%) |
| $100,000+ | 1 (2.0%) | 0 (0.0%) |
| Total | 49 (100.0%) | 24 (100.0%) |
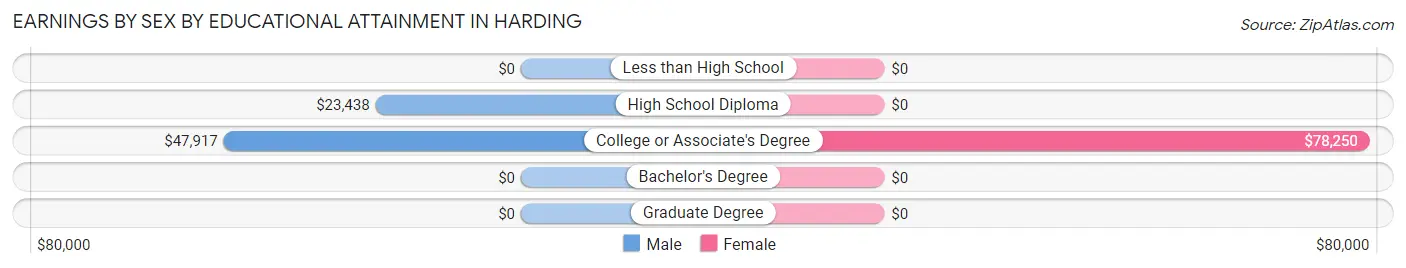
Earnings by Sex by Educational Attainment in Harding
| Educational Attainment | Male Income | Female Income |
| Less than High School | - | - |
| High School Diploma | $23,438 | $0 |
| College or Associate's Degree | $47,917 | $78,250 |
| Bachelor's Degree | - | - |
| Graduate Degree | - | - |
| Total | $28,125 | $0 |
Family Income in Harding
Family Income Brackets in Harding
According to the Harding family income data, there are 14 families falling into the $100,000 to $149,999 income range, which is the most common income bracket and makes up 41.2% of all families.
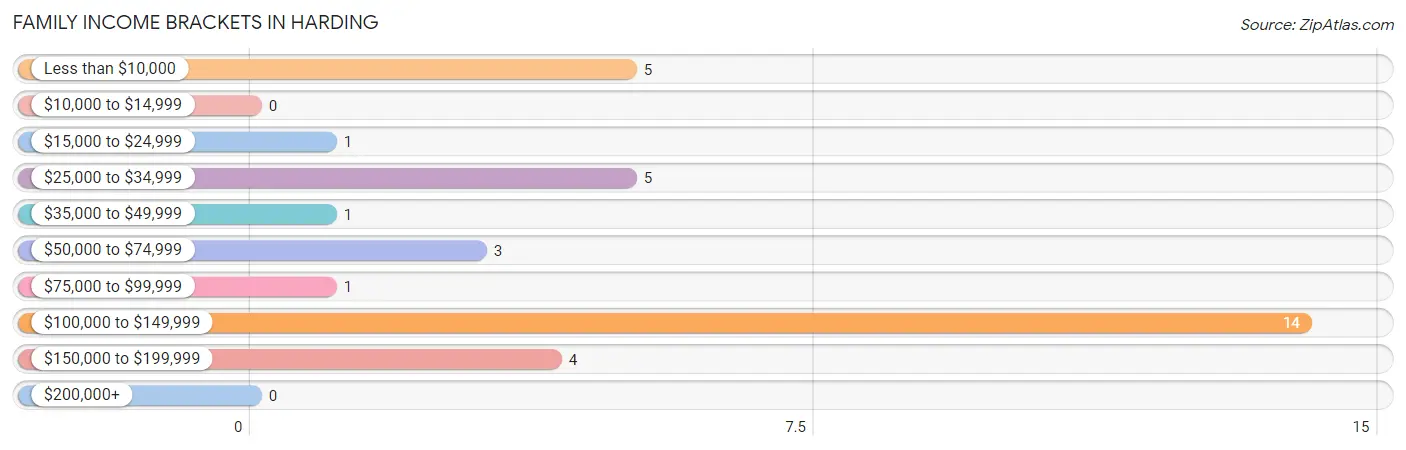
| Income Bracket | # Families | % Families |
| Less than $10,000 | 5 | 14.7% |
| $10,000 to $14,999 | 0 | 0.0% |
| $15,000 to $24,999 | 1 | 2.9% |
| $25,000 to $34,999 | 5 | 14.7% |
| $35,000 to $49,999 | 1 | 2.9% |
| $50,000 to $74,999 | 3 | 8.8% |
| $75,000 to $99,999 | 1 | 2.9% |
| $100,000 to $149,999 | 14 | 41.2% |
| $150,000 to $199,999 | 4 | 11.8% |
| $200,000+ | 0 | 0.0% |
Family Income by Famaliy Size in Harding
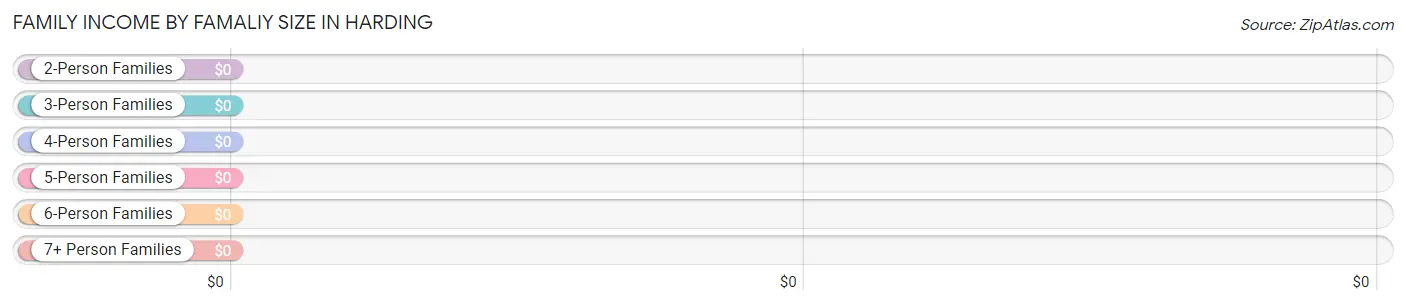
| Income Bracket | # Families | Median Income |
| 2-Person Families | 18 (52.9%) | $0 |
| 3-Person Families | 7 (20.6%) | $0 |
| 4-Person Families | 7 (20.6%) | $0 |
| 5-Person Families | 2 (5.9%) | $0 |
| 6-Person Families | 0 (0.0%) | $0 |
| 7+ Person Families | 0 (0.0%) | $0 |
| Total | 34 (100.0%) | $111,250 |
Family Income by Number of Earners in Harding
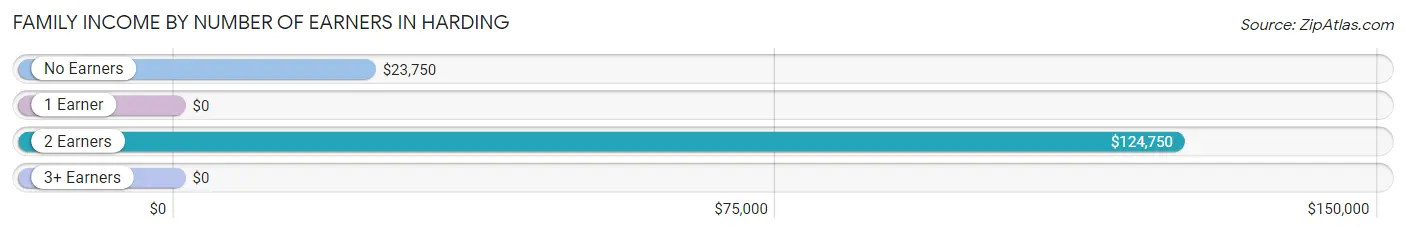
| Number of Earners | # Families | Median Income |
| No Earners | 7 (20.6%) | $23,750 |
| 1 Earner | 4 (11.8%) | $0 |
| 2 Earners | 21 (61.8%) | $124,750 |
| 3+ Earners | 2 (5.9%) | $0 |
| Total | 34 (100.0%) | $111,250 |
Household Income in Harding
Household Income Brackets in Harding
With 14 households falling in the category, the $100,000 to $149,999 income range is the most frequent in Harding, accounting for 30.4% of all households.
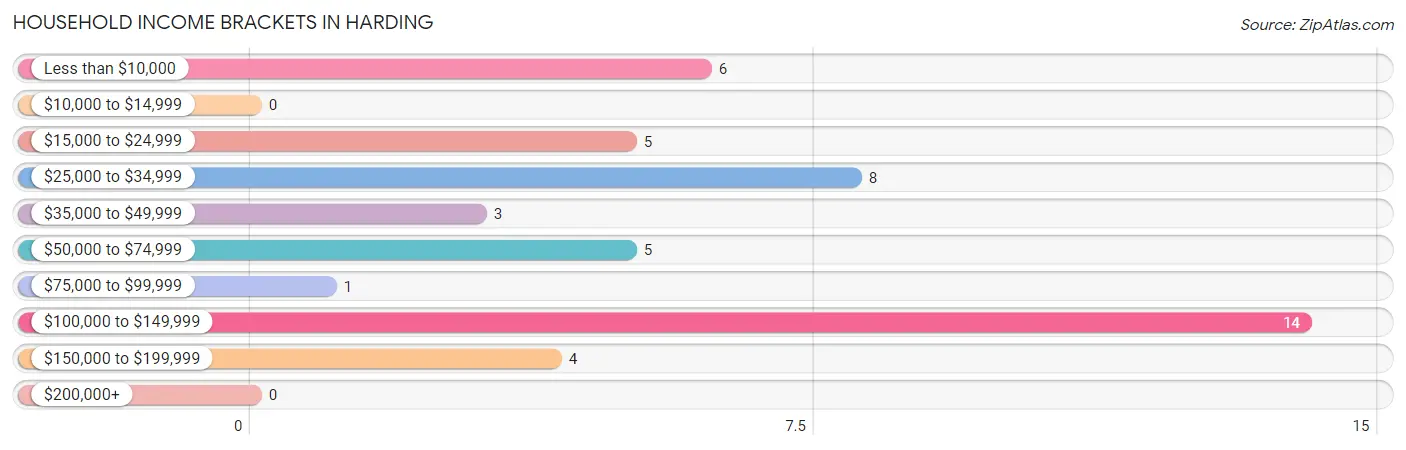
| Income Bracket | # Households | % Households |
| Less than $10,000 | 6 | 13.0% |
| $10,000 to $14,999 | 0 | 0.0% |
| $15,000 to $24,999 | 5 | 10.9% |
| $25,000 to $34,999 | 8 | 17.4% |
| $35,000 to $49,999 | 3 | 6.5% |
| $50,000 to $74,999 | 5 | 10.9% |
| $75,000 to $99,999 | 1 | 2.2% |
| $100,000 to $149,999 | 14 | 30.4% |
| $150,000 to $199,999 | 4 | 8.7% |
| $200,000+ | 0 | 0.0% |
Household Income by Householder Age in Harding
The median household income in Harding is $63,750, with the highest median household income of $47,500 found in the 25 to 44 years age bracket for the primary householder. A total of 8 households (17.4%) fall into this category.
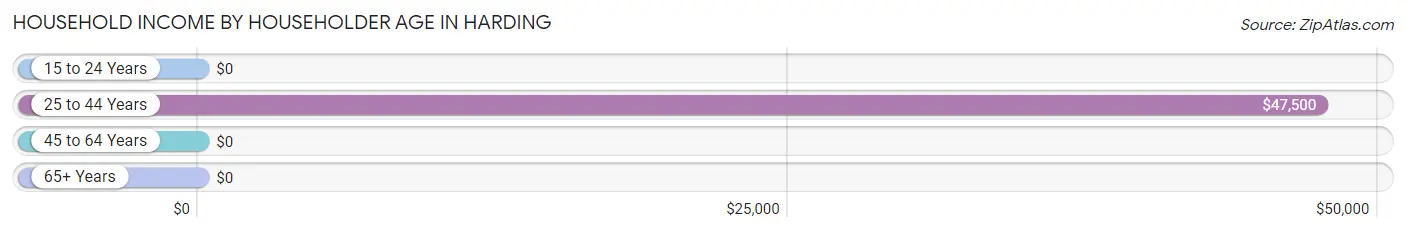
| Income Bracket | # Households | Median Income |
| 15 to 24 Years | 0 (0.0%) | $0 |
| 25 to 44 Years | 8 (17.4%) | $47,500 |
| 45 to 64 Years | 22 (47.8%) | $0 |
| 65+ Years | 16 (34.8%) | $0 |
| Total | 46 (100.0%) | $63,750 |
Poverty in Harding
Income Below Poverty by Sex and Age in Harding
With 19.6% poverty level for males and 19.1% for females among the residents of Harding, 75 year old and over males and 75 year old and over females are the most vulnerable to poverty, with 3 males (75.0%) and 4 females (66.7%) in their respective age groups living below the poverty level.
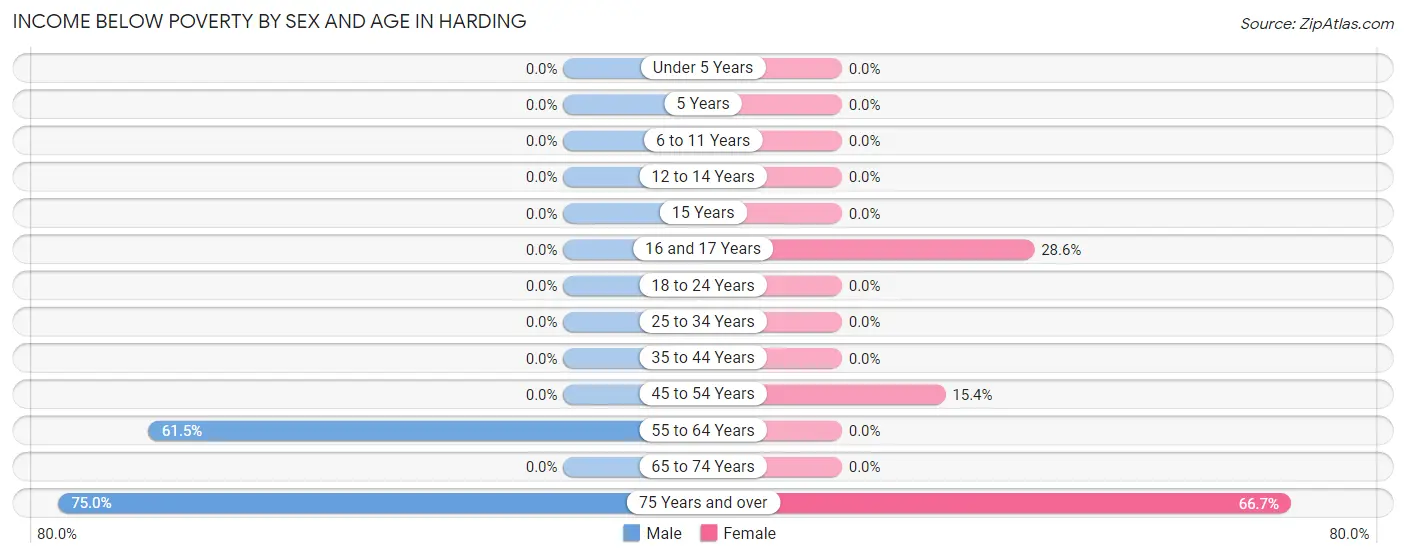
| Age Bracket | Male | Female |
| Under 5 Years | 0 (0.0%) | 0 (0.0%) |
| 5 Years | 0 (0.0%) | 0 (0.0%) |
| 6 to 11 Years | 0 (0.0%) | 0 (0.0%) |
| 12 to 14 Years | 0 (0.0%) | 0 (0.0%) |
| 15 Years | 0 (0.0%) | 0 (0.0%) |
| 16 and 17 Years | 0 (0.0%) | 2 (28.6%) |
| 18 to 24 Years | 0 (0.0%) | 0 (0.0%) |
| 25 to 34 Years | 0 (0.0%) | 0 (0.0%) |
| 35 to 44 Years | 0 (0.0%) | 0 (0.0%) |
| 45 to 54 Years | 0 (0.0%) | 2 (15.4%) |
| 55 to 64 Years | 16 (61.5%) | 0 (0.0%) |
| 65 to 74 Years | 0 (0.0%) | 0 (0.0%) |
| 75 Years and over | 3 (75.0%) | 4 (66.7%) |
| Total | 19 (19.6%) | 8 (19.1%) |
Income Above Poverty by Sex and Age in Harding
According to the poverty statistics in Harding, males aged under 5 years and females aged under 5 years are the age groups that are most secure financially, with 100.0% of males and 100.0% of females in these age groups living above the poverty line.
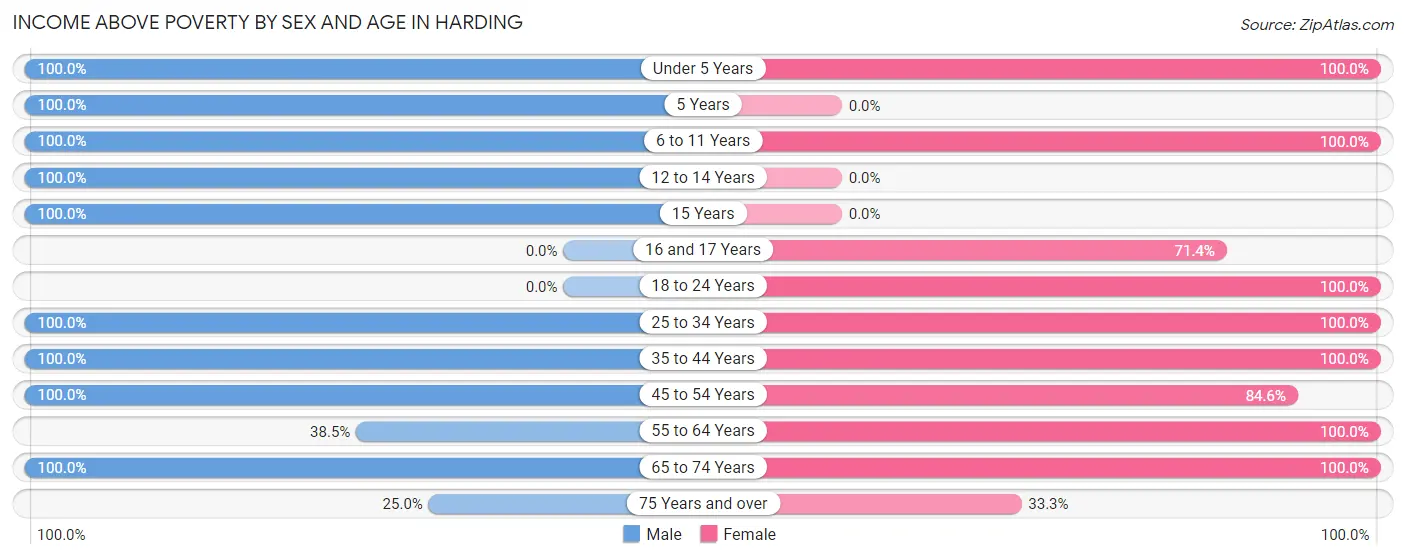
| Age Bracket | Male | Female |
| Under 5 Years | 2 (100.0%) | 1 (100.0%) |
| 5 Years | 2 (100.0%) | 0 (0.0%) |
| 6 to 11 Years | 5 (100.0%) | 1 (100.0%) |
| 12 to 14 Years | 2 (100.0%) | 0 (0.0%) |
| 15 Years | 1 (100.0%) | 0 (0.0%) |
| 16 and 17 Years | 0 (0.0%) | 5 (71.4%) |
| 18 to 24 Years | 0 (0.0%) | 2 (100.0%) |
| 25 to 34 Years | 22 (100.0%) | 1 (100.0%) |
| 35 to 44 Years | 5 (100.0%) | 5 (100.0%) |
| 45 to 54 Years | 12 (100.0%) | 11 (84.6%) |
| 55 to 64 Years | 10 (38.5%) | 3 (100.0%) |
| 65 to 74 Years | 16 (100.0%) | 3 (100.0%) |
| 75 Years and over | 1 (25.0%) | 2 (33.3%) |
| Total | 78 (80.4%) | 34 (80.9%) |
Income Below Poverty Among Married-Couple Families in Harding
The poverty statistics for married-couple families in Harding show that 10.7% or 3 of the total 28 families live below the poverty line. Families with no children have the highest poverty rate of 15.8%, comprising of 3 families. On the other hand, families with 1 or 2 children have the lowest poverty rate of 0.0%, which includes 0 families.
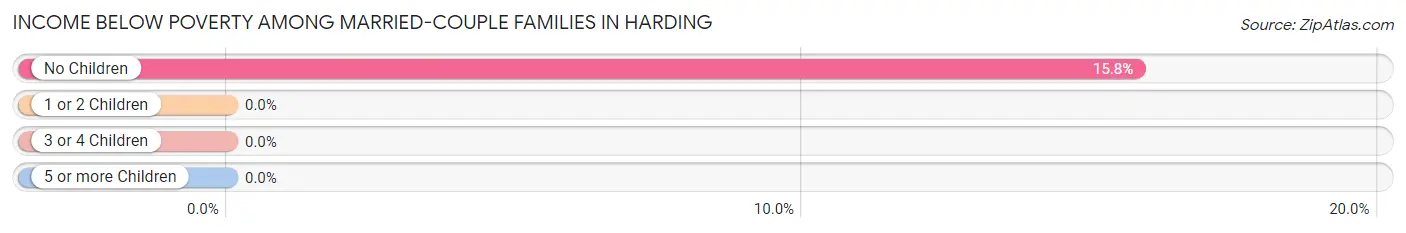
| Children | Above Poverty | Below Poverty |
| No Children | 16 (84.2%) | 3 (15.8%) |
| 1 or 2 Children | 9 (100.0%) | 0 (0.0%) |
| 3 or 4 Children | 0 (0.0%) | 0 (0.0%) |
| 5 or more Children | 0 (0.0%) | 0 (0.0%) |
| Total | 25 (89.3%) | 3 (10.7%) |
Income Below Poverty Among Single-Parent Households in Harding
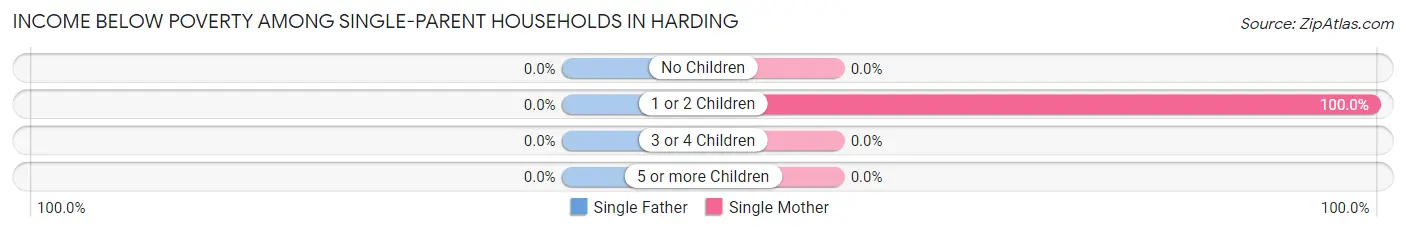
| Children | Single Father | Single Mother |
| No Children | 0 (0.0%) | 0 (0.0%) |
| 1 or 2 Children | 0 (0.0%) | 2 (100.0%) |
| 3 or 4 Children | 0 (0.0%) | 0 (0.0%) |
| 5 or more Children | 0 (0.0%) | 0 (0.0%) |
| Total | 0 (0.0%) | 2 (66.7%) |
Income Below Poverty Among Married-Couple vs Single-Parent Households in Harding
The poverty data for Harding shows that 3 of the married-couple family households (10.7%) and 2 of the single-parent households (33.3%) are living below the poverty level. Within the married-couple family households, those with no children have the highest poverty rate, with 3 households (15.8%) falling below the poverty line. Among the single-parent households, those with 1 or 2 children have the highest poverty rate, with 2 household (100.0%) living below poverty.
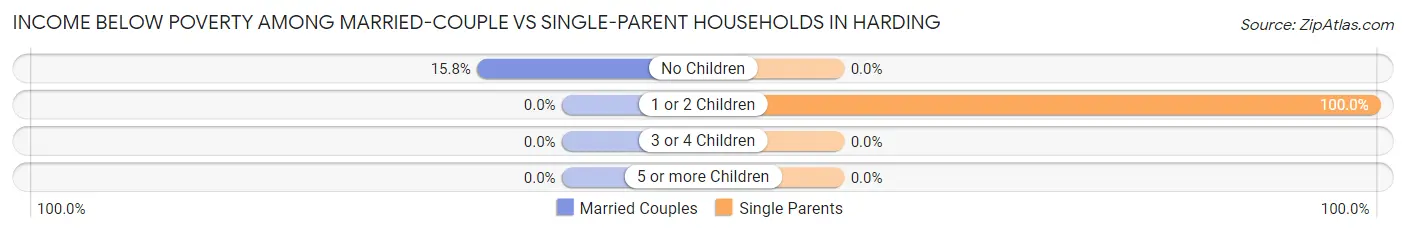
| Children | Married-Couple Families | Single-Parent Households |
| No Children | 3 (15.8%) | 0 (0.0%) |
| 1 or 2 Children | 0 (0.0%) | 2 (100.0%) |
| 3 or 4 Children | 0 (0.0%) | 0 (0.0%) |
| 5 or more Children | 0 (0.0%) | 0 (0.0%) |
| Total | 3 (10.7%) | 2 (33.3%) |
Race in Harding
The most populous races in Harding are White / Caucasian (129 | 92.8%), and Asian (10 | 7.2%).
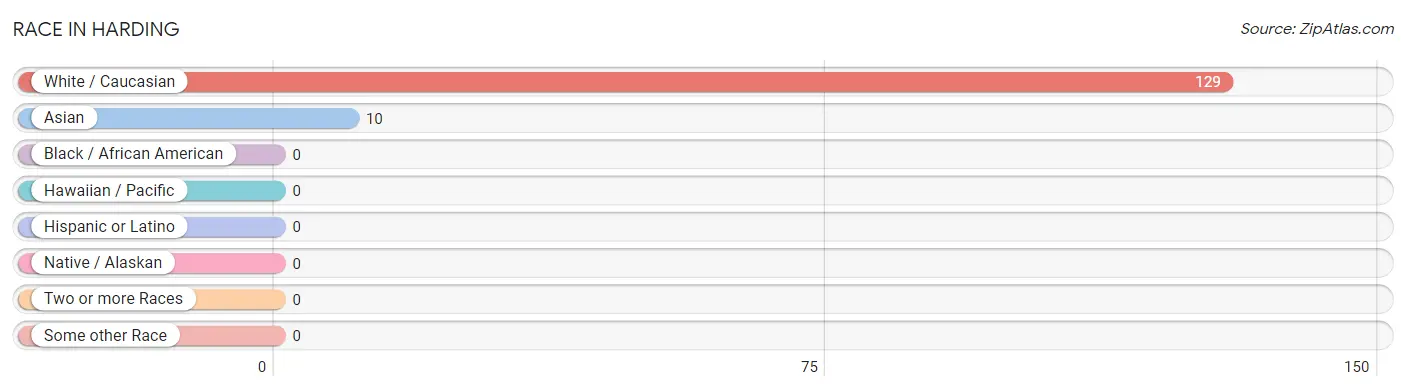
| Race | # Population | % Population |
| Asian | 10 | 7.2% |
| Black / African American | 0 | 0.0% |
| Hawaiian / Pacific | 0 | 0.0% |
| Hispanic or Latino | 0 | 0.0% |
| Native / Alaskan | 0 | 0.0% |
| White / Caucasian | 129 | 92.8% |
| Two or more Races | 0 | 0.0% |
| Some other Race | 0 | 0.0% |
| Total | 139 | 100.0% |
Ancestry in Harding
The most populous ancestries reported in Harding are German (61 | 43.9%), Polish (24 | 17.3%), Scandinavian (11 | 7.9%), Norwegian (9 | 6.5%), and Welsh (9 | 6.5%), together accounting for 82.0% of all Harding residents.
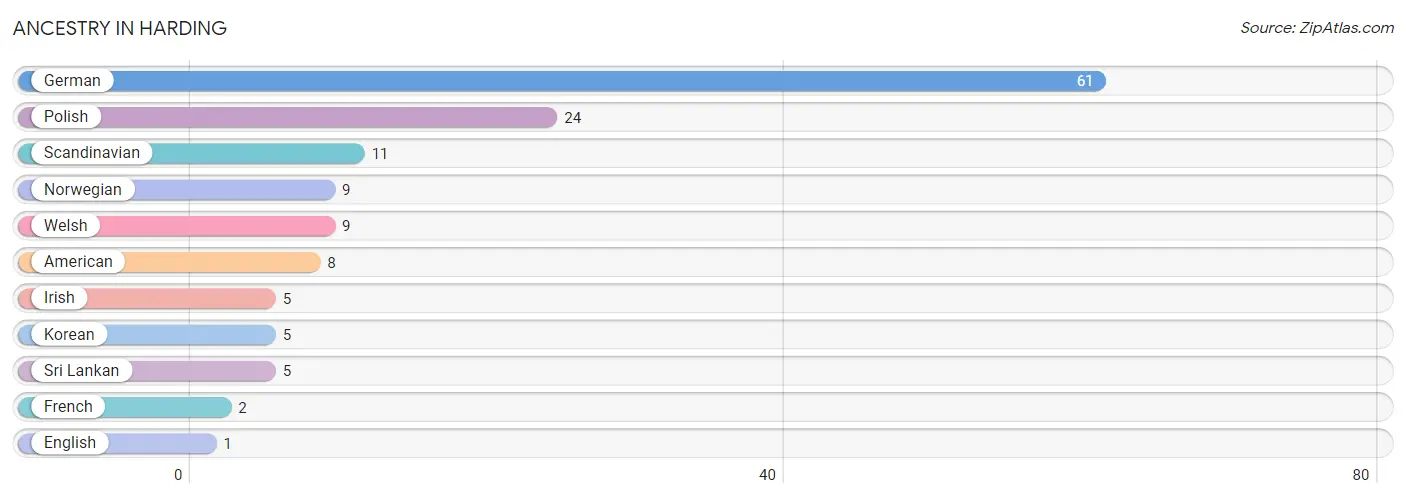
| Ancestry | # Population | % Population |
| American | 8 | 5.8% |
| English | 1 | 0.7% |
| French | 2 | 1.4% |
| German | 61 | 43.9% |
| Irish | 5 | 3.6% |
| Korean | 5 | 3.6% |
| Norwegian | 9 | 6.5% |
| Polish | 24 | 17.3% |
| Scandinavian | 11 | 7.9% |
| Sri Lankan | 5 | 3.6% |
| Welsh | 9 | 6.5% | View All 11 Rows |
Immigrants in Harding
The most numerous immigrant groups reported in Harding came from Asia (7 | 5.0%), South Eastern Asia (7 | 5.0%), Philippines (5 | 3.6%), and Vietnam (2 | 1.4%), together accounting for 15.1% of all Harding residents.
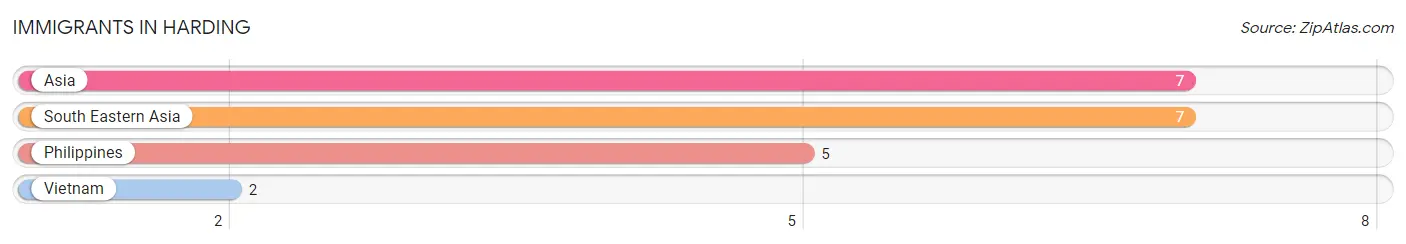
| Immigration Origin | # Population | % Population |
| Asia | 7 | 5.0% |
| Philippines | 5 | 3.6% |
| South Eastern Asia | 7 | 5.0% |
| Vietnam | 2 | 1.4% | View All 4 Rows |
Sex and Age in Harding
Sex and Age in Harding
The most populous age groups in Harding are 60 to 64 Years (19 | 19.6%) for men and 15 to 19 Years (8 | 19.1%) for women.
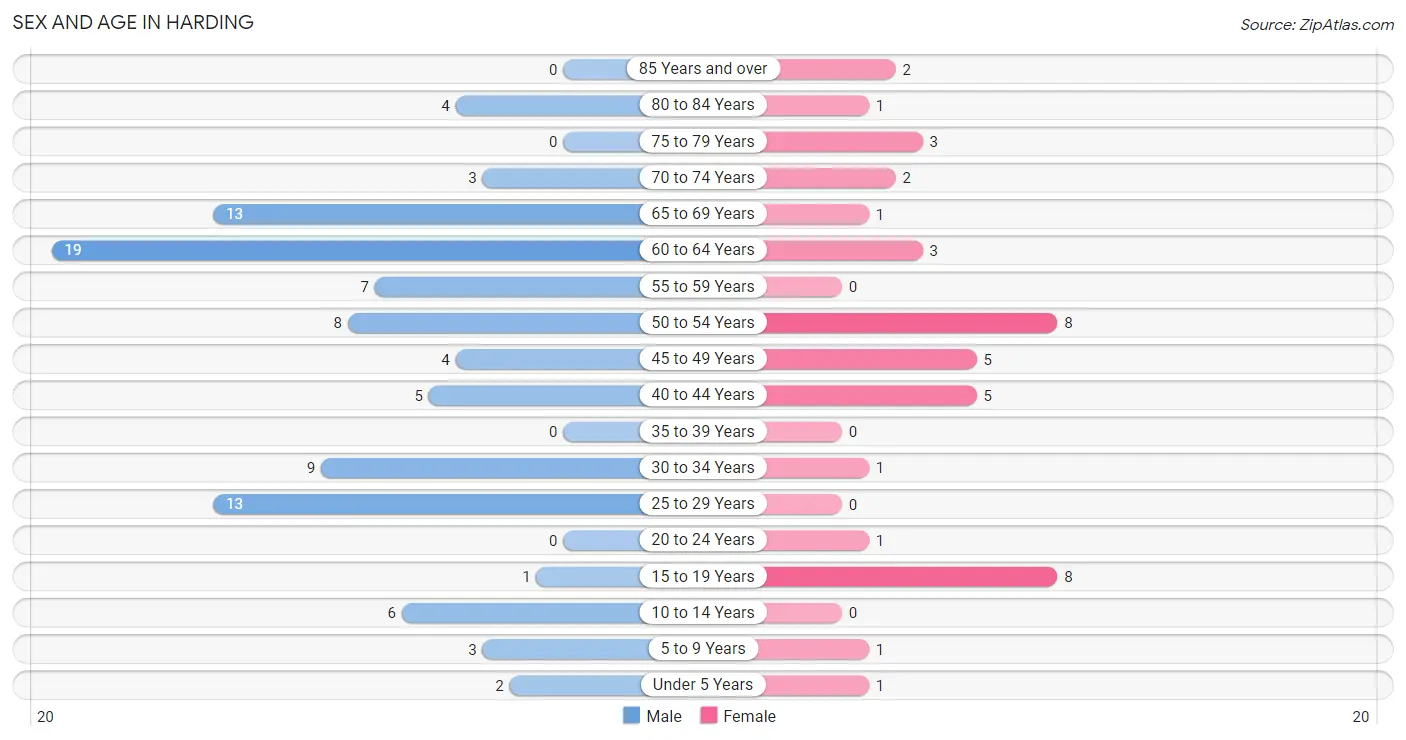
| Age Bracket | Male | Female |
| Under 5 Years | 2 (2.1%) | 1 (2.4%) |
| 5 to 9 Years | 3 (3.1%) | 1 (2.4%) |
| 10 to 14 Years | 6 (6.2%) | 0 (0.0%) |
| 15 to 19 Years | 1 (1.0%) | 8 (19.1%) |
| 20 to 24 Years | 0 (0.0%) | 1 (2.4%) |
| 25 to 29 Years | 13 (13.4%) | 0 (0.0%) |
| 30 to 34 Years | 9 (9.3%) | 1 (2.4%) |
| 35 to 39 Years | 0 (0.0%) | 0 (0.0%) |
| 40 to 44 Years | 5 (5.1%) | 5 (11.9%) |
| 45 to 49 Years | 4 (4.1%) | 5 (11.9%) |
| 50 to 54 Years | 8 (8.3%) | 8 (19.1%) |
| 55 to 59 Years | 7 (7.2%) | 0 (0.0%) |
| 60 to 64 Years | 19 (19.6%) | 3 (7.1%) |
| 65 to 69 Years | 13 (13.4%) | 1 (2.4%) |
| 70 to 74 Years | 3 (3.1%) | 2 (4.8%) |
| 75 to 79 Years | 0 (0.0%) | 3 (7.1%) |
| 80 to 84 Years | 4 (4.1%) | 1 (2.4%) |
| 85 Years and over | 0 (0.0%) | 2 (4.8%) |
| Total | 97 (100.0%) | 42 (100.0%) |
Families and Households in Harding
Median Family Size in Harding
The median family size in Harding is 2.76 persons per family, with married-couple families (28 | 82.4%) accounting for the largest median family size of 2.89 persons per family. On the other hand, single male/father families (3 | 8.8%) represent the smallest median family size with 2.00 persons per family.
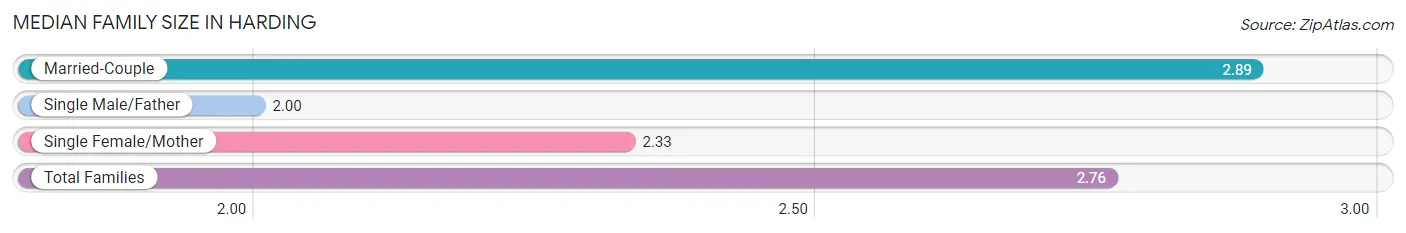
| Family Type | # Families | Family Size |
| Married-Couple | 28 (82.4%) | 2.89 |
| Single Male/Father | 3 (8.8%) | 2.00 |
| Single Female/Mother | 3 (8.8%) | 2.33 |
| Total Families | 34 (100.0%) | 2.76 |
Median Household Size in Harding
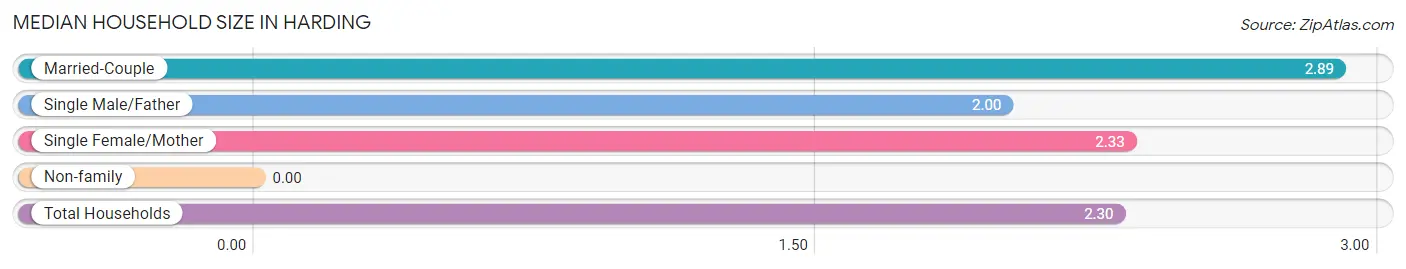
| Household Type | # Households | Household Size |
| Married-Couple | 28 (60.9%) | 2.89 |
| Single Male/Father | 3 (6.5%) | 2.00 |
| Single Female/Mother | 3 (6.5%) | 2.33 |
| Non-family | 12 (26.1%) | - |
| Total Households | 46 (100.0%) | 2.30 |
Household Size by Marriage Status in Harding
Out of a total of 46 households in Harding, 34 (73.9%) are family households, while 12 (26.1%) are nonfamily households. The most numerous type of family households are 2-person households, comprising 18, and the most common type of nonfamily households are 1-person households, comprising 12.
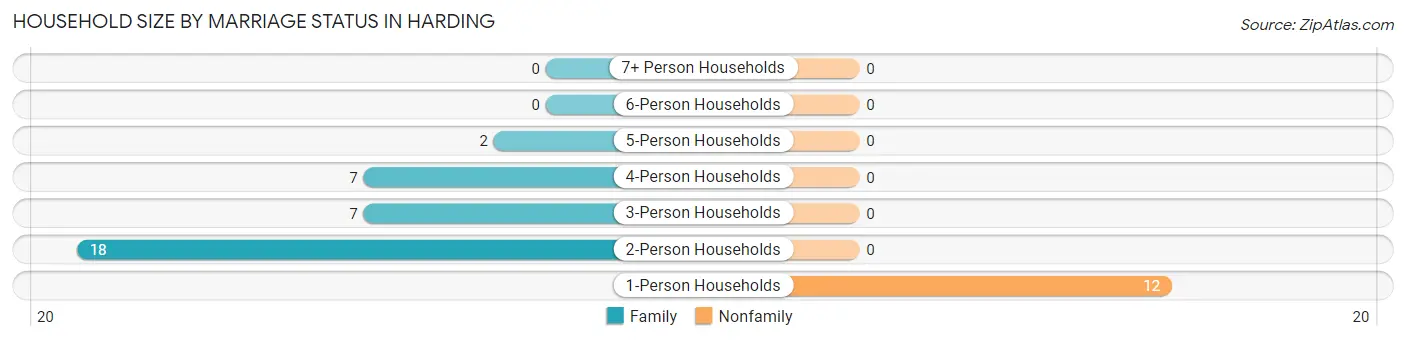
| Household Size | Family Households | Nonfamily Households |
| 1-Person Households | - | 12 (26.1%) |
| 2-Person Households | 18 (39.1%) | 0 (0.0%) |
| 3-Person Households | 7 (15.2%) | 0 (0.0%) |
| 4-Person Households | 7 (15.2%) | 0 (0.0%) |
| 5-Person Households | 2 (4.3%) | 0 (0.0%) |
| 6-Person Households | 0 (0.0%) | 0 (0.0%) |
| 7+ Person Households | 0 (0.0%) | 0 (0.0%) |
| Total | 34 (73.9%) | 12 (26.1%) |
Female Fertility in Harding
Fertility by Age in Harding
| Age Bracket | Women with Births | Births / 1,000 Women |
| 15 to 19 years | 0 (0.0%) | 0.0 |
| 20 to 34 years | 0 (0.0%) | 0.0 |
| 35 to 50 years | 0 (0.0%) | 0.0 |
| Total | 0 (0.0%) | 0.0 |
Fertility by Age by Marriage Status in Harding
| Age Bracket | Married | Unmarried |
| 15 to 19 years | 0 (0.0%) | 0 (0.0%) |
| 20 to 34 years | 0 (0.0%) | 0 (0.0%) |
| 35 to 50 years | 0 (0.0%) | 0 (0.0%) |
| Total | 0 (0.0%) | 0 (0.0%) |
Fertility by Education in Harding
| Educational Attainment | Women with Births | Births / 1,000 Women |
| Less than High School | 0 (0.0%) | 0.0 |
| High School Diploma | 0 (0.0%) | 0.0 |
| College or Associate's Degree | 0 (0.0%) | 0.0 |
| Bachelor's Degree | 0 (0.0%) | 0.0 |
| Graduate Degree | 0 (0.0%) | 0.0 |
| Total | 0 (0.0%) | 0.0 |
Fertility by Education by Marriage Status in Harding
| Educational Attainment | Married | Unmarried |
| Less than High School | 0 (0.0%) | 0 (0.0%) |
| High School Diploma | 0 (0.0%) | 0 (0.0%) |
| College or Associate's Degree | 0 (0.0%) | 0 (0.0%) |
| Bachelor's Degree | 0 (0.0%) | 0 (0.0%) |
| Graduate Degree | 0 (0.0%) | 0 (0.0%) |
| Total | 0 (0.0%) | 0 (0.0%) |
Employment Characteristics in Harding
Employment by Class of Employer in Harding
Among the 58 employed individuals in Harding, private company employees (35 | 60.3%), not-for-profit organizations (11 | 19.0%), and self-employed (not incorporated) (8 | 13.8%) make up the most common classes of employment.
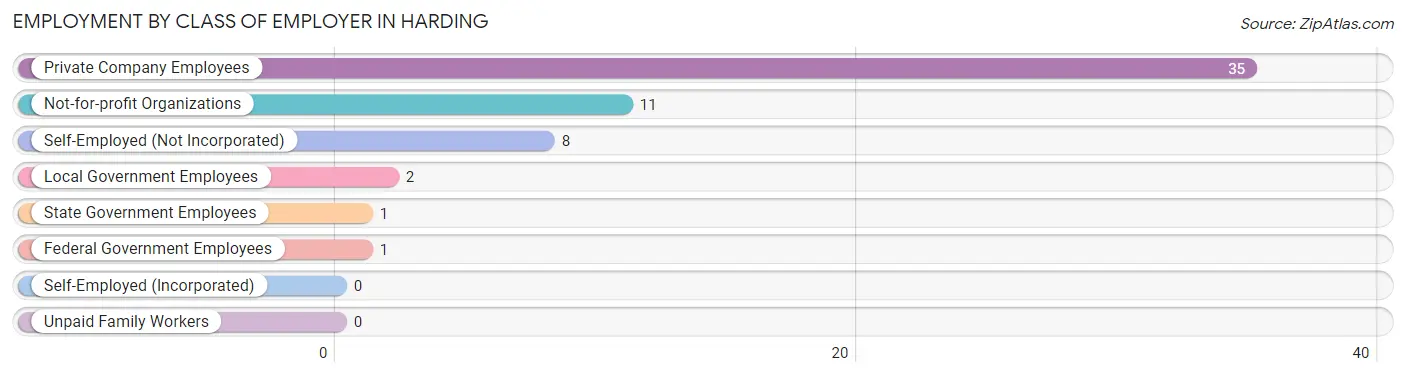
| Employer Class | # Employees | % Employees |
| Private Company Employees | 35 | 60.3% |
| Self-Employed (Incorporated) | 0 | 0.0% |
| Self-Employed (Not Incorporated) | 8 | 13.8% |
| Not-for-profit Organizations | 11 | 19.0% |
| Local Government Employees | 2 | 3.5% |
| State Government Employees | 1 | 1.7% |
| Federal Government Employees | 1 | 1.7% |
| Unpaid Family Workers | 0 | 0.0% |
| Total | 58 | 100.0% |
Employment Status by Age in Harding
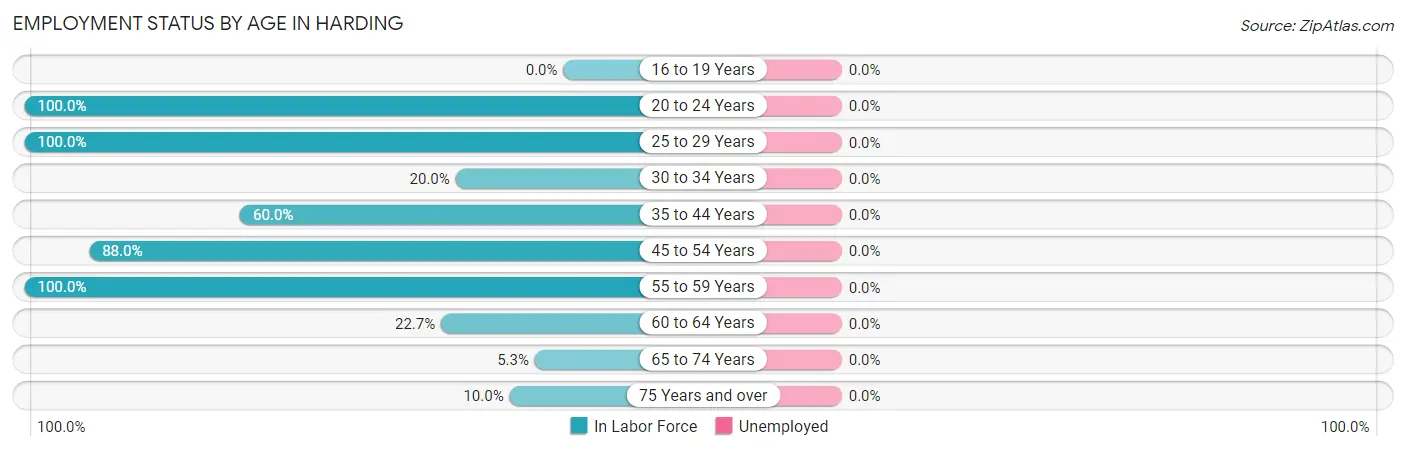
| Age Bracket | In Labor Force | Unemployed |
| 16 to 19 Years | 0 (0.0%) | 0 (0.0%) |
| 20 to 24 Years | 1 (100.0%) | 0 (0.0%) |
| 25 to 29 Years | 13 (100.0%) | 0 (0.0%) |
| 30 to 34 Years | 2 (20.0%) | 0 (0.0%) |
| 35 to 44 Years | 6 (60.0%) | 0 (0.0%) |
| 45 to 54 Years | 22 (88.0%) | 0 (0.0%) |
| 55 to 59 Years | 7 (100.0%) | 0 (0.0%) |
| 60 to 64 Years | 5 (22.7%) | 0 (0.0%) |
| 65 to 74 Years | 1 (5.3%) | 0 (0.0%) |
| 75 Years and over | 1 (10.0%) | 0 (0.0%) |
| Total | 58 (46.4%) | 0 (0.0%) |
Employment Status by Educational Attainment in Harding
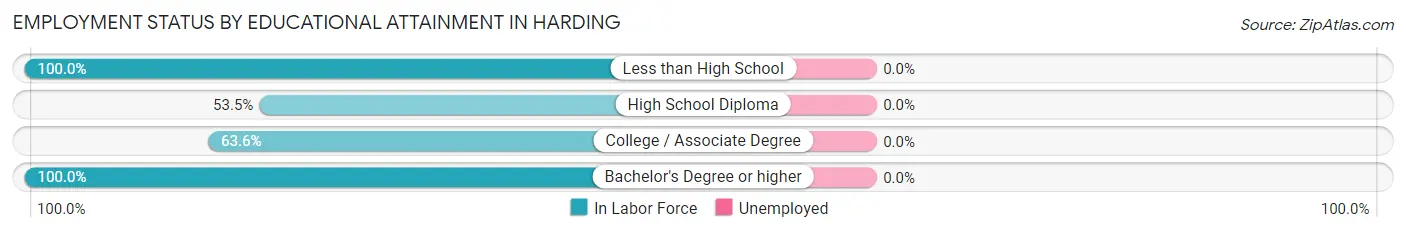
| Educational Attainment | In Labor Force | Unemployed |
| Less than High School | 6 (100.0%) | 0 (0.0%) |
| High School Diploma | 23 (53.5%) | 0 (0.0%) |
| College / Associate Degree | 21 (63.6%) | 0 (0.0%) |
| Bachelor's Degree or higher | 5 (100.0%) | 0 (0.0%) |
| Total | 55 (63.2%) | 0 (0.0%) |
Employment Occupations by Sex in Harding
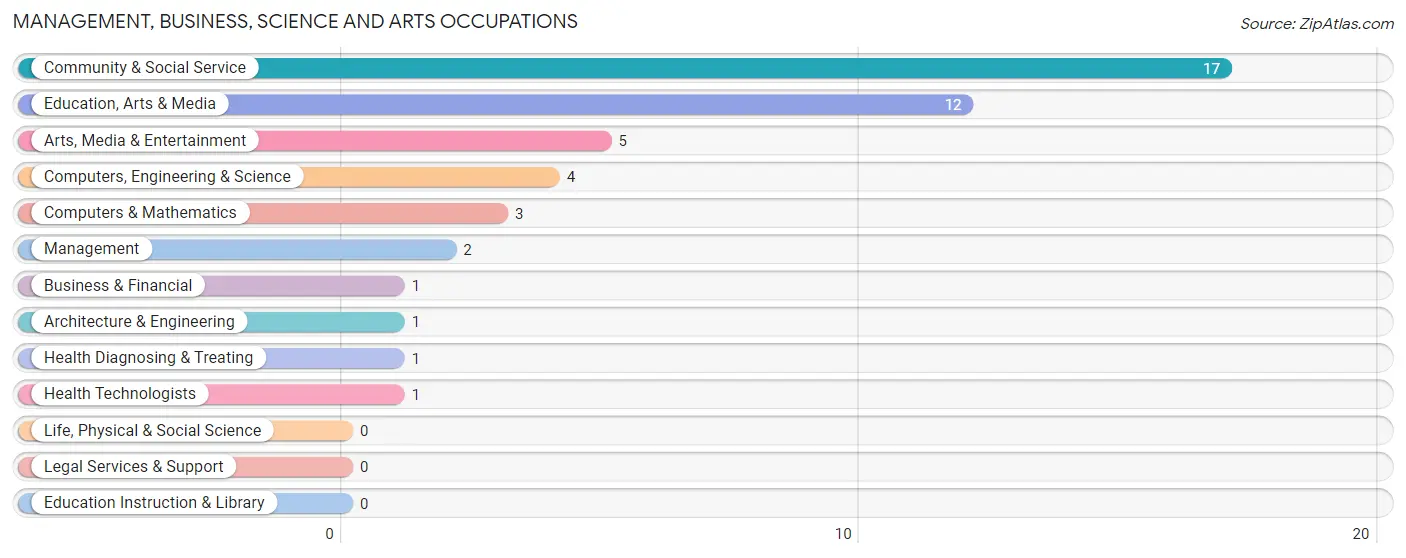
Management, Business, Science and Arts Occupations
The most common Management, Business, Science and Arts occupations in Harding are Community & Social Service (17 | 29.3%), Education, Arts & Media (12 | 20.7%), Arts, Media & Entertainment (5 | 8.6%), Computers, Engineering & Science (4 | 6.9%), and Computers & Mathematics (3 | 5.2%).
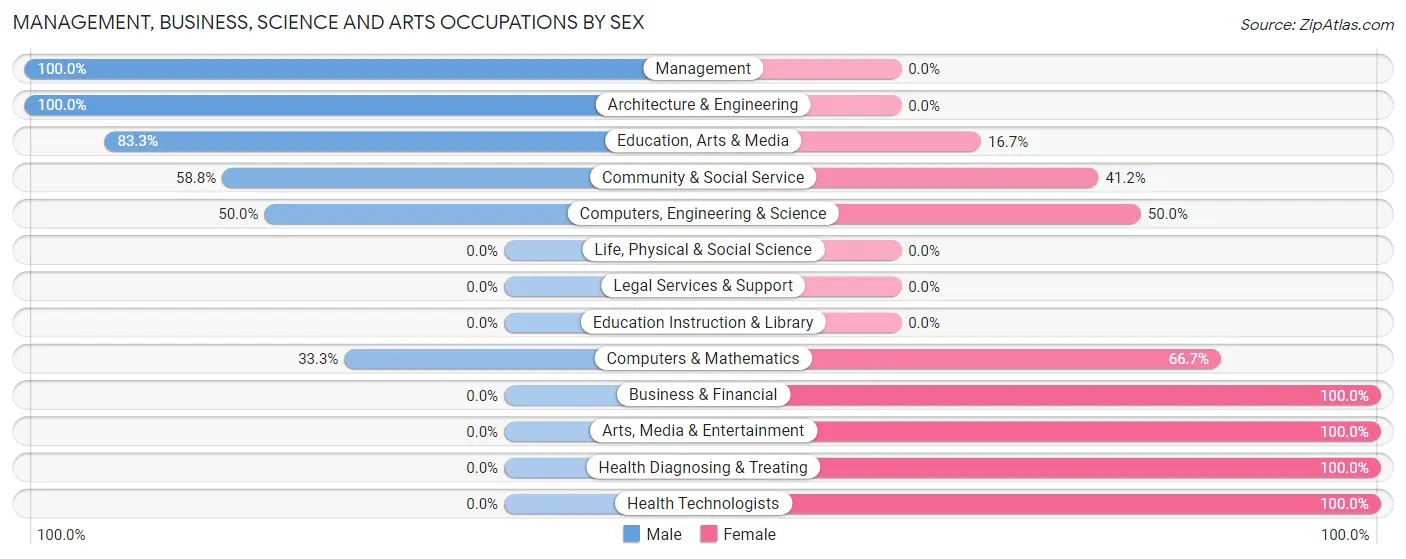
Management, Business, Science and Arts Occupations by Sex
Within the Management, Business, Science and Arts occupations in Harding, the most male-oriented occupations are Management (100.0%), Architecture & Engineering (100.0%), and Education, Arts & Media (83.3%), while the most female-oriented occupations are Business & Financial (100.0%), Arts, Media & Entertainment (100.0%), and Health Diagnosing & Treating (100.0%).
| Occupation | Male | Female |
| Management | 2 (100.0%) | 0 (0.0%) |
| Business & Financial | 0 (0.0%) | 1 (100.0%) |
| Computers, Engineering & Science | 2 (50.0%) | 2 (50.0%) |
| Computers & Mathematics | 1 (33.3%) | 2 (66.7%) |
| Architecture & Engineering | 1 (100.0%) | 0 (0.0%) |
| Life, Physical & Social Science | 0 (0.0%) | 0 (0.0%) |
| Community & Social Service | 10 (58.8%) | 7 (41.2%) |
| Education, Arts & Media | 10 (83.3%) | 2 (16.7%) |
| Legal Services & Support | 0 (0.0%) | 0 (0.0%) |
| Education Instruction & Library | 0 (0.0%) | 0 (0.0%) |
| Arts, Media & Entertainment | 0 (0.0%) | 5 (100.0%) |
| Health Diagnosing & Treating | 0 (0.0%) | 1 (100.0%) |
| Health Technologists | 0 (0.0%) | 1 (100.0%) |
| Total (Category) | 14 (56.0%) | 11 (44.0%) |
| Total (Overall) | 41 (70.7%) | 17 (29.3%) |
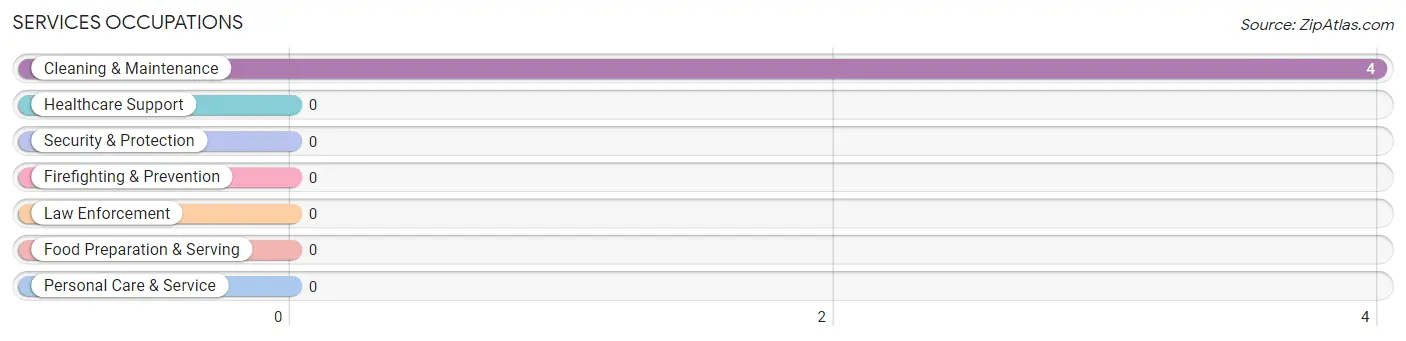
Services Occupations
The most common Services occupations in Harding are , and Cleaning & Maintenance (4 | 6.9%).
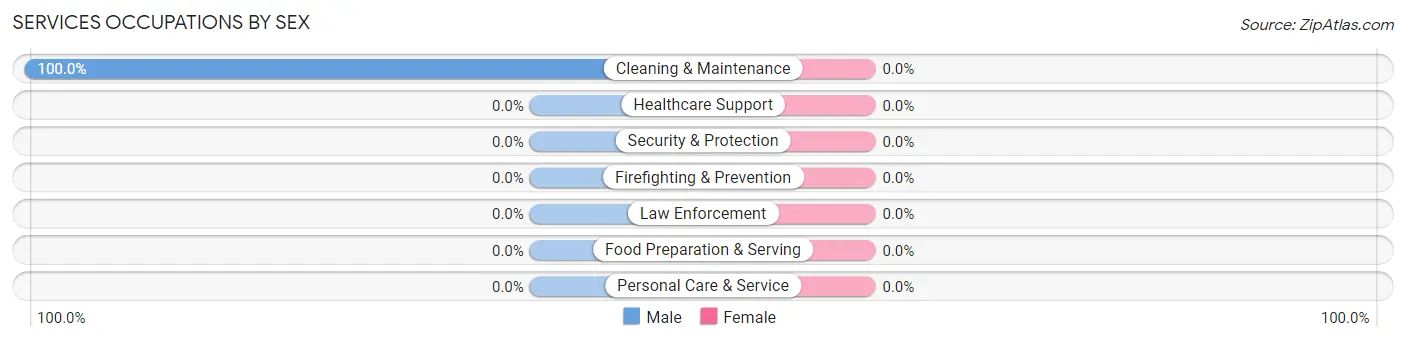
Services Occupations by Sex
| Occupation | Male | Female |
| Healthcare Support | 0 (0.0%) | 0 (0.0%) |
| Security & Protection | 0 (0.0%) | 0 (0.0%) |
| Firefighting & Prevention | 0 (0.0%) | 0 (0.0%) |
| Law Enforcement | 0 (0.0%) | 0 (0.0%) |
| Food Preparation & Serving | 0 (0.0%) | 0 (0.0%) |
| Cleaning & Maintenance | 4 (100.0%) | 0 (0.0%) |
| Personal Care & Service | 0 (0.0%) | 0 (0.0%) |
| Total (Category) | 4 (100.0%) | 0 (0.0%) |
| Total (Overall) | 41 (70.7%) | 17 (29.3%) |
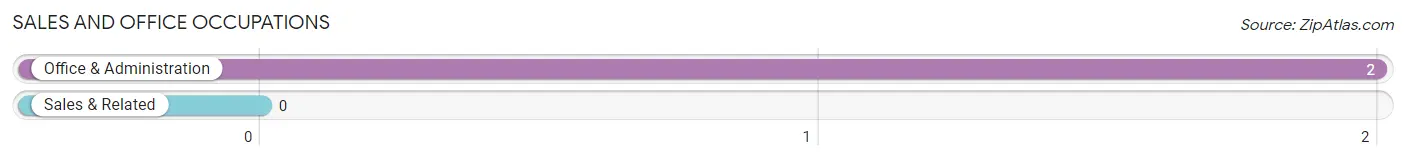
Sales and Office Occupations
The most common Sales and Office occupations in Harding are , and Office & Administration (2 | 3.5%).
Sales and Office Occupations by Sex
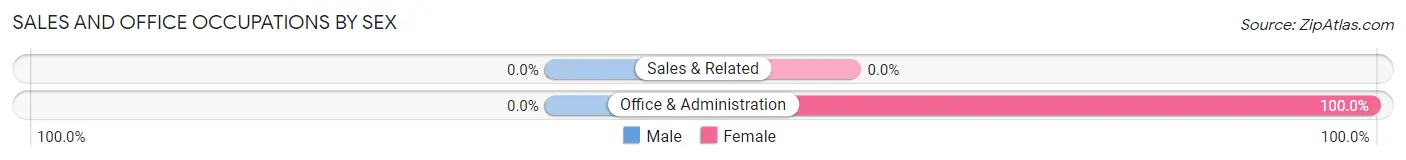
| Occupation | Male | Female |
| Sales & Related | 0 (0.0%) | 0 (0.0%) |
| Office & Administration | 0 (0.0%) | 2 (100.0%) |
| Total (Category) | 0 (0.0%) | 2 (100.0%) |
| Total (Overall) | 41 (70.7%) | 17 (29.3%) |
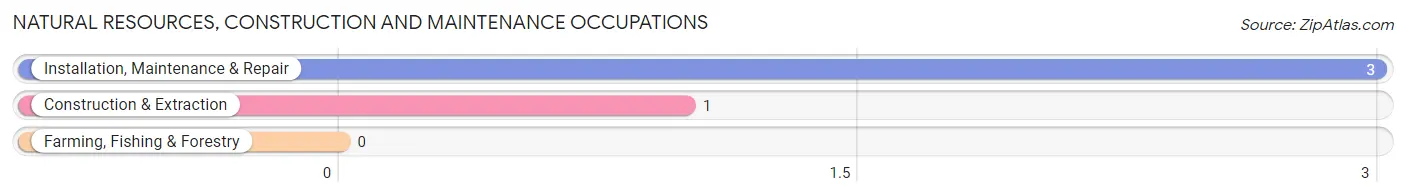
Natural Resources, Construction and Maintenance Occupations
The most common Natural Resources, Construction and Maintenance occupations in Harding are Installation, Maintenance & Repair (3 | 5.2%), and Construction & Extraction (1 | 1.7%).
Natural Resources, Construction and Maintenance Occupations by Sex
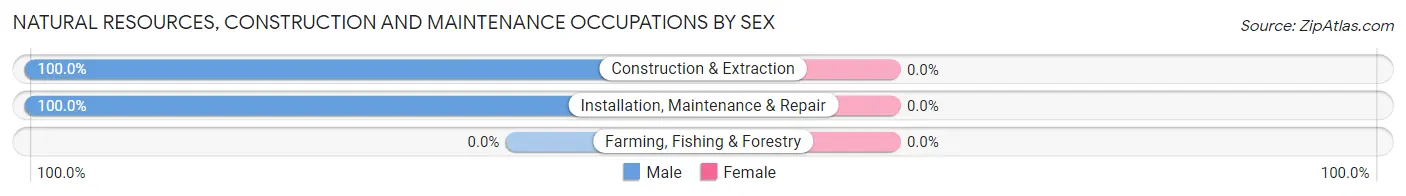
| Occupation | Male | Female |
| Farming, Fishing & Forestry | 0 (0.0%) | 0 (0.0%) |
| Construction & Extraction | 1 (100.0%) | 0 (0.0%) |
| Installation, Maintenance & Repair | 3 (100.0%) | 0 (0.0%) |
| Total (Category) | 4 (100.0%) | 0 (0.0%) |
| Total (Overall) | 41 (70.7%) | 17 (29.3%) |
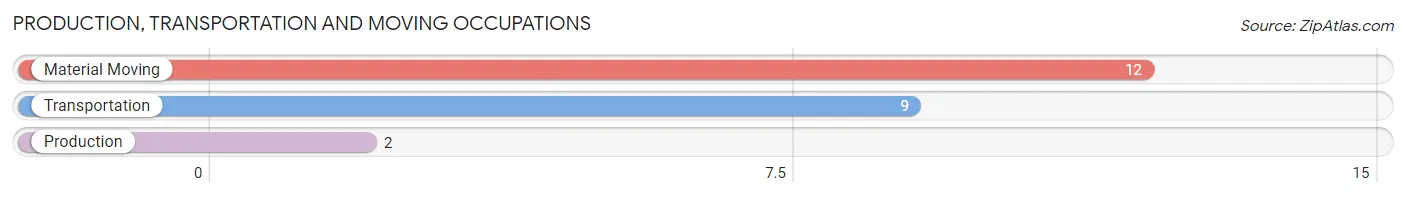
Production, Transportation and Moving Occupations
The most common Production, Transportation and Moving occupations in Harding are Material Moving (12 | 20.7%), Transportation (9 | 15.5%), and Production (2 | 3.5%).
Production, Transportation and Moving Occupations by Sex
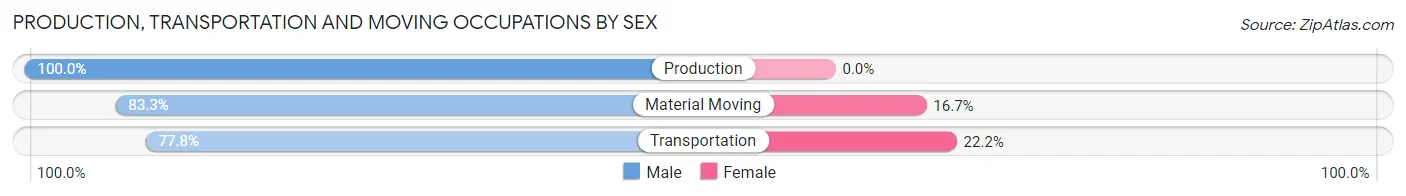
| Occupation | Male | Female |
| Production | 2 (100.0%) | 0 (0.0%) |
| Transportation | 7 (77.8%) | 2 (22.2%) |
| Material Moving | 10 (83.3%) | 2 (16.7%) |
| Total (Category) | 19 (82.6%) | 4 (17.4%) |
| Total (Overall) | 41 (70.7%) | 17 (29.3%) |
Employment Industries by Sex in Harding
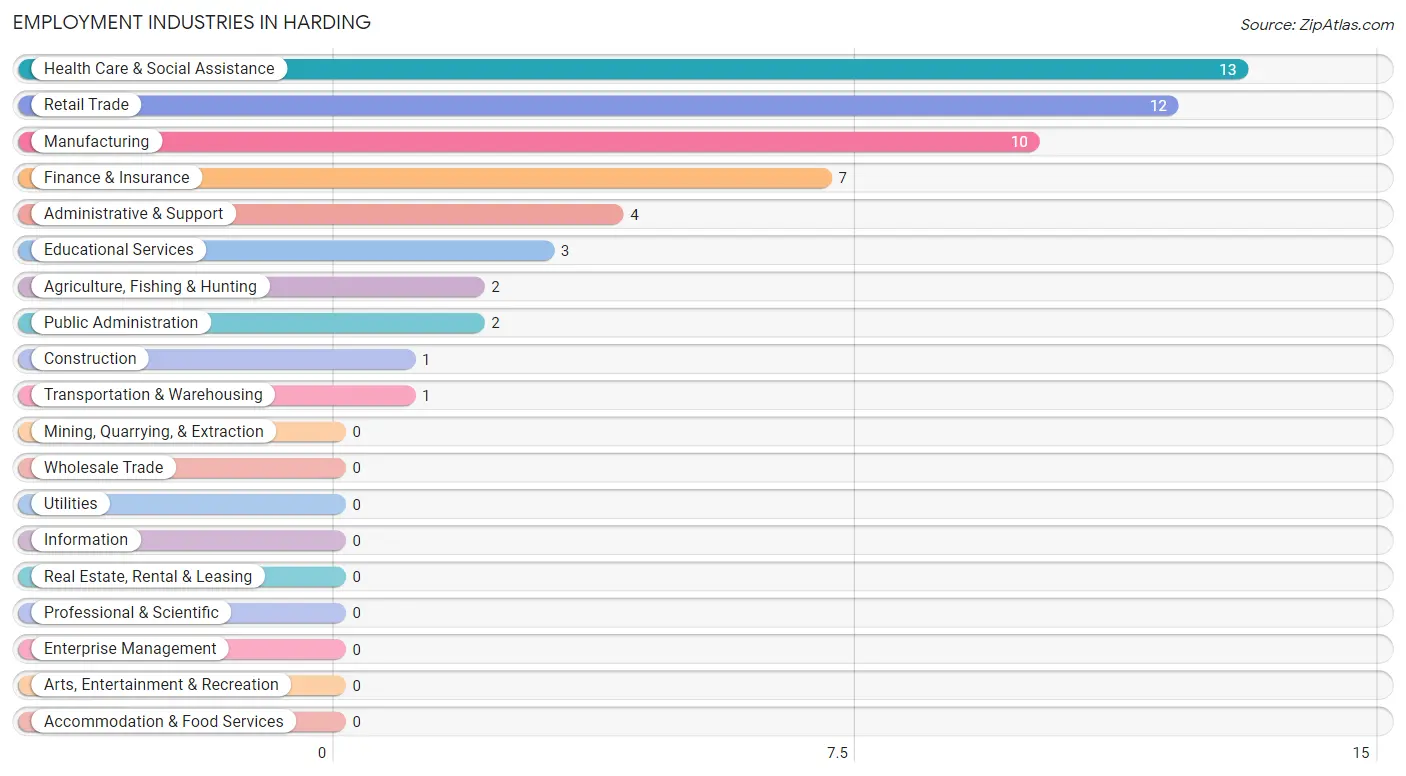
Employment Industries in Harding
The major employment industries in Harding include Health Care & Social Assistance (13 | 22.4%), Retail Trade (12 | 20.7%), Manufacturing (10 | 17.2%), Finance & Insurance (7 | 12.1%), and Administrative & Support (4 | 6.9%).
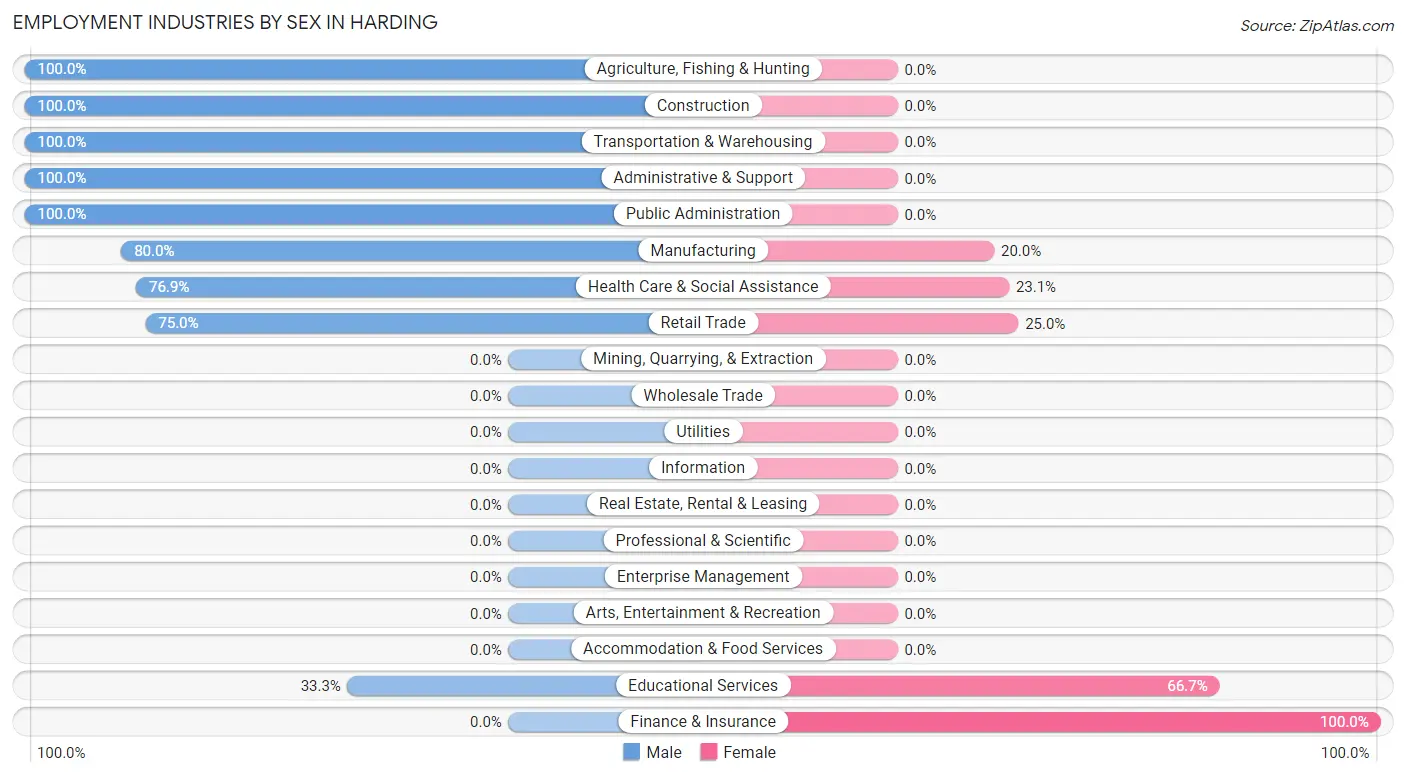
Employment Industries by Sex in Harding
The Harding industries that see more men than women are Agriculture, Fishing & Hunting (100.0%), Construction (100.0%), and Transportation & Warehousing (100.0%), whereas the industries that tend to have a higher number of women are Finance & Insurance (100.0%), Educational Services (66.7%), and Retail Trade (25.0%).
| Industry | Male | Female |
| Agriculture, Fishing & Hunting | 2 (100.0%) | 0 (0.0%) |
| Mining, Quarrying, & Extraction | 0 (0.0%) | 0 (0.0%) |
| Construction | 1 (100.0%) | 0 (0.0%) |
| Manufacturing | 8 (80.0%) | 2 (20.0%) |
| Wholesale Trade | 0 (0.0%) | 0 (0.0%) |
| Retail Trade | 9 (75.0%) | 3 (25.0%) |
| Transportation & Warehousing | 1 (100.0%) | 0 (0.0%) |
| Utilities | 0 (0.0%) | 0 (0.0%) |
| Information | 0 (0.0%) | 0 (0.0%) |
| Finance & Insurance | 0 (0.0%) | 7 (100.0%) |
| Real Estate, Rental & Leasing | 0 (0.0%) | 0 (0.0%) |
| Professional & Scientific | 0 (0.0%) | 0 (0.0%) |
| Enterprise Management | 0 (0.0%) | 0 (0.0%) |
| Administrative & Support | 4 (100.0%) | 0 (0.0%) |
| Educational Services | 1 (33.3%) | 2 (66.7%) |
| Health Care & Social Assistance | 10 (76.9%) | 3 (23.1%) |
| Arts, Entertainment & Recreation | 0 (0.0%) | 0 (0.0%) |
| Accommodation & Food Services | 0 (0.0%) | 0 (0.0%) |
| Public Administration | 2 (100.0%) | 0 (0.0%) |
| Total | 41 (70.7%) | 17 (29.3%) |
Education in Harding
School Enrollment in Harding
The most common levels of schooling among the 20 students in Harding are high school (9 | 45.0%), elementary school (6 | 30.0%), and kindergarten (2 | 10.0%).
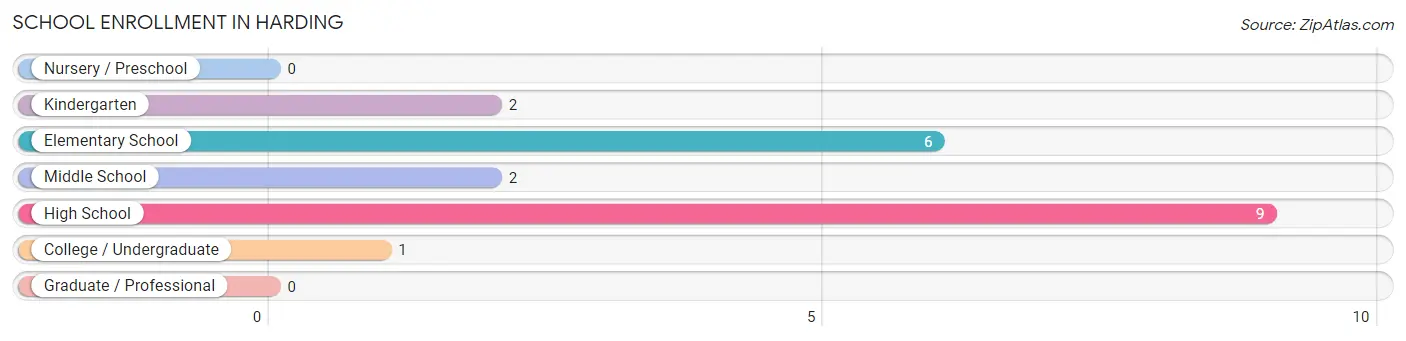
| School Level | # Students | % Students |
| Nursery / Preschool | 0 | 0.0% |
| Kindergarten | 2 | 10.0% |
| Elementary School | 6 | 30.0% |
| Middle School | 2 | 10.0% |
| High School | 9 | 45.0% |
| College / Undergraduate | 1 | 5.0% |
| Graduate / Professional | 0 | 0.0% |
| Total | 20 | 100.0% |
School Enrollment by Age by Funding Source in Harding
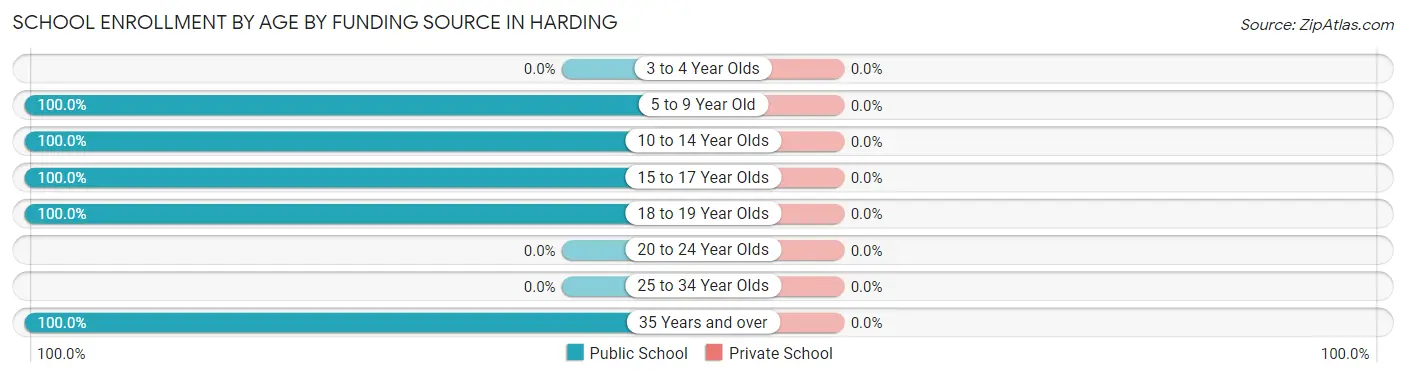
| Age Bracket | Public School | Private School |
| 3 to 4 Year Olds | 0 (0.0%) | 0 (0.0%) |
| 5 to 9 Year Old | 4 (100.0%) | 0 (0.0%) |
| 10 to 14 Year Olds | 6 (100.0%) | 0 (0.0%) |
| 15 to 17 Year Olds | 8 (100.0%) | 0 (0.0%) |
| 18 to 19 Year Olds | 1 (100.0%) | 0 (0.0%) |
| 20 to 24 Year Olds | 0 (0.0%) | 0 (0.0%) |
| 25 to 34 Year Olds | 0 (0.0%) | 0 (0.0%) |
| 35 Years and over | 1 (100.0%) | 0 (0.0%) |
| Total | 20 (100.0%) | 0 (0.0%) |
Educational Attainment by Field of Study in Harding
Business (9 | 69.2%), arts & humanities (2 | 15.4%), computers & mathematics (1 | 7.7%), and social sciences (1 | 7.7%) are the most common fields of study among 13 individuals in Harding who have obtained a bachelor's degree or higher.
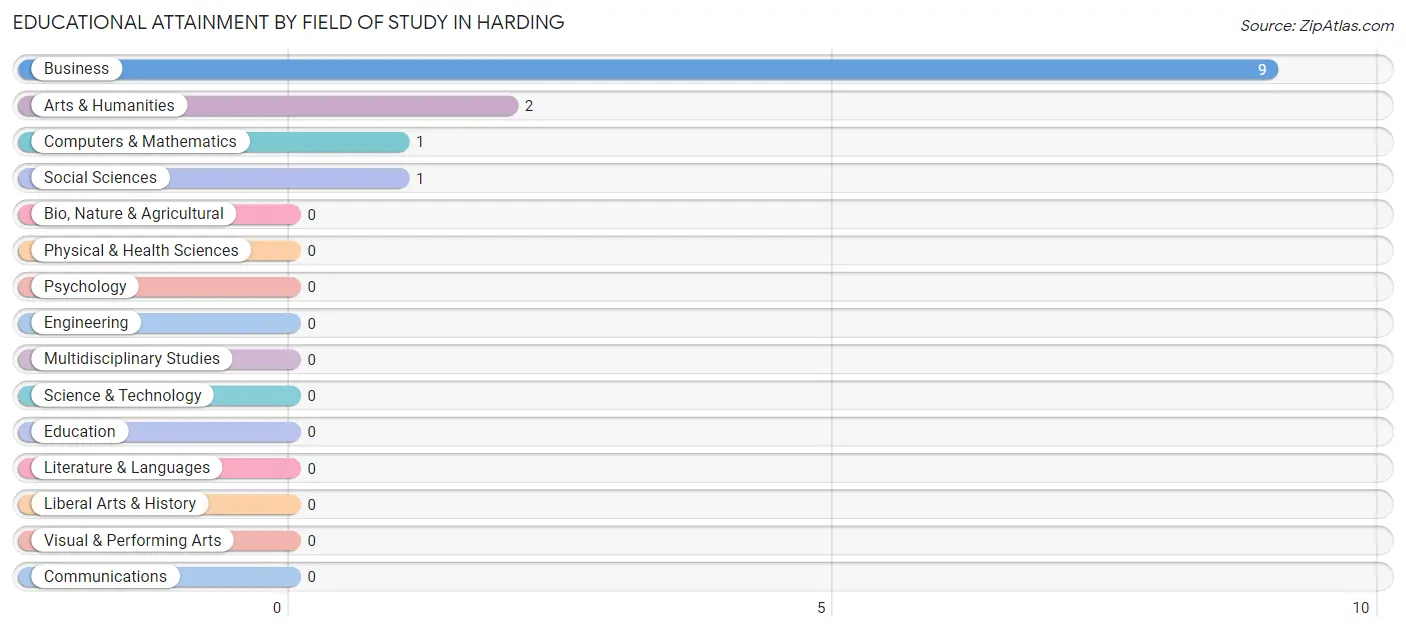
| Field of Study | # Graduates | % Graduates |
| Computers & Mathematics | 1 | 7.7% |
| Bio, Nature & Agricultural | 0 | 0.0% |
| Physical & Health Sciences | 0 | 0.0% |
| Psychology | 0 | 0.0% |
| Social Sciences | 1 | 7.7% |
| Engineering | 0 | 0.0% |
| Multidisciplinary Studies | 0 | 0.0% |
| Science & Technology | 0 | 0.0% |
| Business | 9 | 69.2% |
| Education | 0 | 0.0% |
| Literature & Languages | 0 | 0.0% |
| Liberal Arts & History | 0 | 0.0% |
| Visual & Performing Arts | 0 | 0.0% |
| Communications | 0 | 0.0% |
| Arts & Humanities | 2 | 15.4% |
| Total | 13 | 100.0% |
Transportation & Commute in Harding
Vehicle Availability by Sex in Harding
The most prevalent vehicle ownership categories in Harding are males with 2 vehicles (14, accounting for 43.8%) and females with 2 vehicles (12, making up 82.4%).
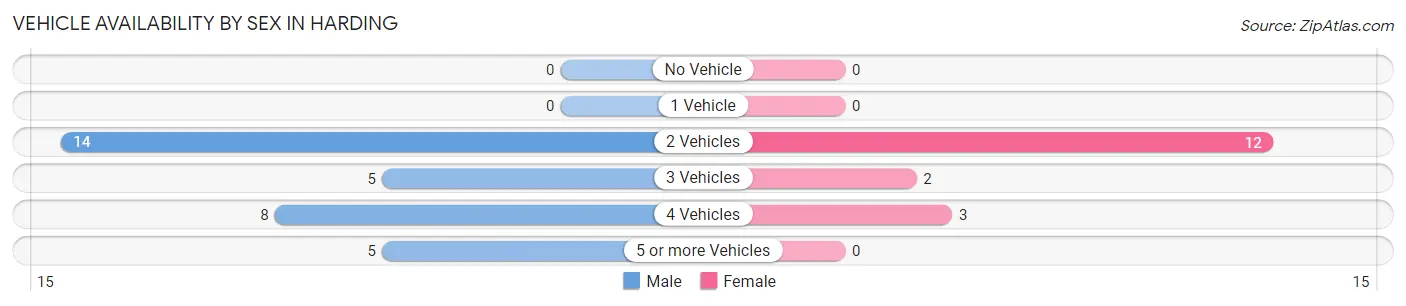
| Vehicles Available | Male | Female |
| No Vehicle | 0 (0.0%) | 0 (0.0%) |
| 1 Vehicle | 0 (0.0%) | 0 (0.0%) |
| 2 Vehicles | 14 (43.8%) | 12 (70.6%) |
| 3 Vehicles | 5 (15.6%) | 2 (11.8%) |
| 4 Vehicles | 8 (25.0%) | 3 (17.6%) |
| 5 or more Vehicles | 5 (15.6%) | 0 (0.0%) |
| Total | 32 (100.0%) | 17 (100.0%) |
Commute Time in Harding
The most frequently occuring commute durations in Harding are 10 to 14 minutes (9 commuters, 18.4%), 5 to 9 minutes (8 commuters, 16.3%), and 30 to 34 minutes (8 commuters, 16.3%).
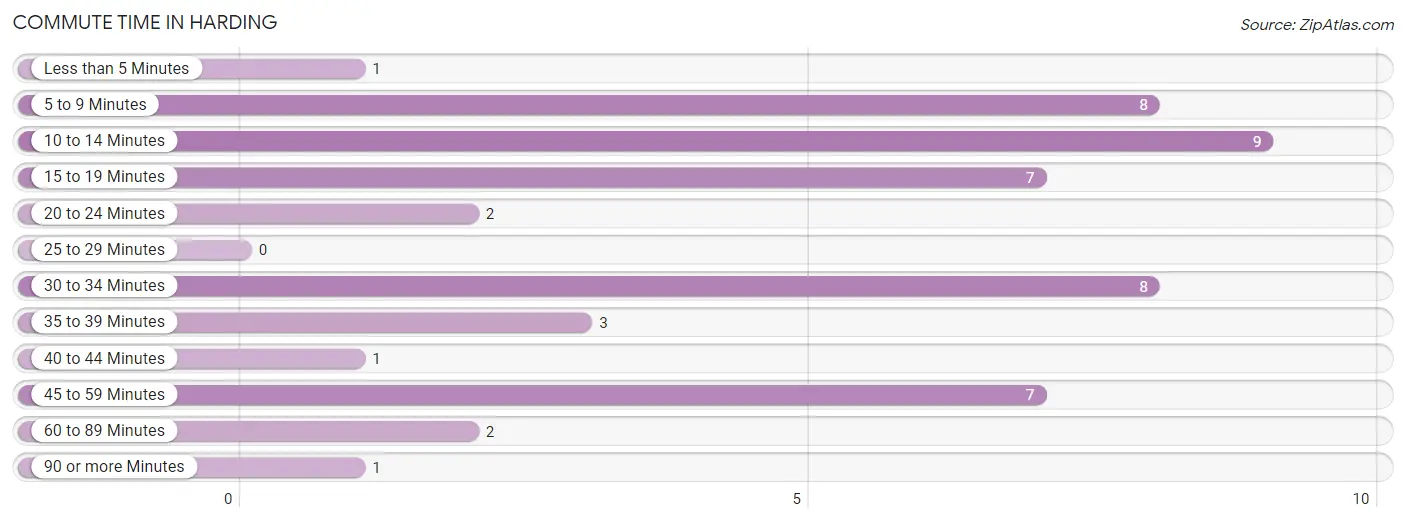
| Commute Time | # Commuters | % Commuters |
| Less than 5 Minutes | 1 | 2.0% |
| 5 to 9 Minutes | 8 | 16.3% |
| 10 to 14 Minutes | 9 | 18.4% |
| 15 to 19 Minutes | 7 | 14.3% |
| 20 to 24 Minutes | 2 | 4.1% |
| 25 to 29 Minutes | 0 | 0.0% |
| 30 to 34 Minutes | 8 | 16.3% |
| 35 to 39 Minutes | 3 | 6.1% |
| 40 to 44 Minutes | 1 | 2.0% |
| 45 to 59 Minutes | 7 | 14.3% |
| 60 to 89 Minutes | 2 | 4.1% |
| 90 or more Minutes | 1 | 2.0% |
Commute Time by Sex in Harding
The most common commute times in Harding are 10 to 14 minutes (9 commuters, 23.1%) for males and 35 to 39 minutes (3 commuters, 30.0%) for females.
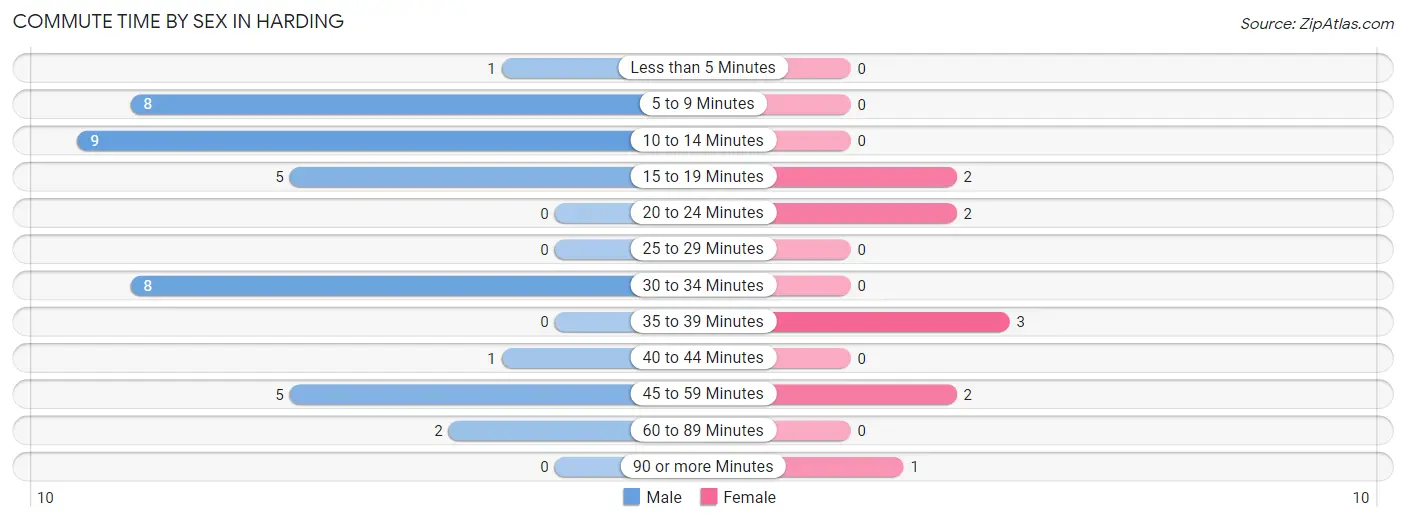
| Commute Time | Male | Female |
| Less than 5 Minutes | 1 (2.6%) | 0 (0.0%) |
| 5 to 9 Minutes | 8 (20.5%) | 0 (0.0%) |
| 10 to 14 Minutes | 9 (23.1%) | 0 (0.0%) |
| 15 to 19 Minutes | 5 (12.8%) | 2 (20.0%) |
| 20 to 24 Minutes | 0 (0.0%) | 2 (20.0%) |
| 25 to 29 Minutes | 0 (0.0%) | 0 (0.0%) |
| 30 to 34 Minutes | 8 (20.5%) | 0 (0.0%) |
| 35 to 39 Minutes | 0 (0.0%) | 3 (30.0%) |
| 40 to 44 Minutes | 1 (2.6%) | 0 (0.0%) |
| 45 to 59 Minutes | 5 (12.8%) | 2 (20.0%) |
| 60 to 89 Minutes | 2 (5.1%) | 0 (0.0%) |
| 90 or more Minutes | 0 (0.0%) | 1 (10.0%) |
Time of Departure to Work by Sex in Harding
The most frequent times of departure to work in Harding are 7:00 AM to 7:29 AM (9, 23.1%) for males and 5:00 AM to 5:29 AM (3, 30.0%) for females.
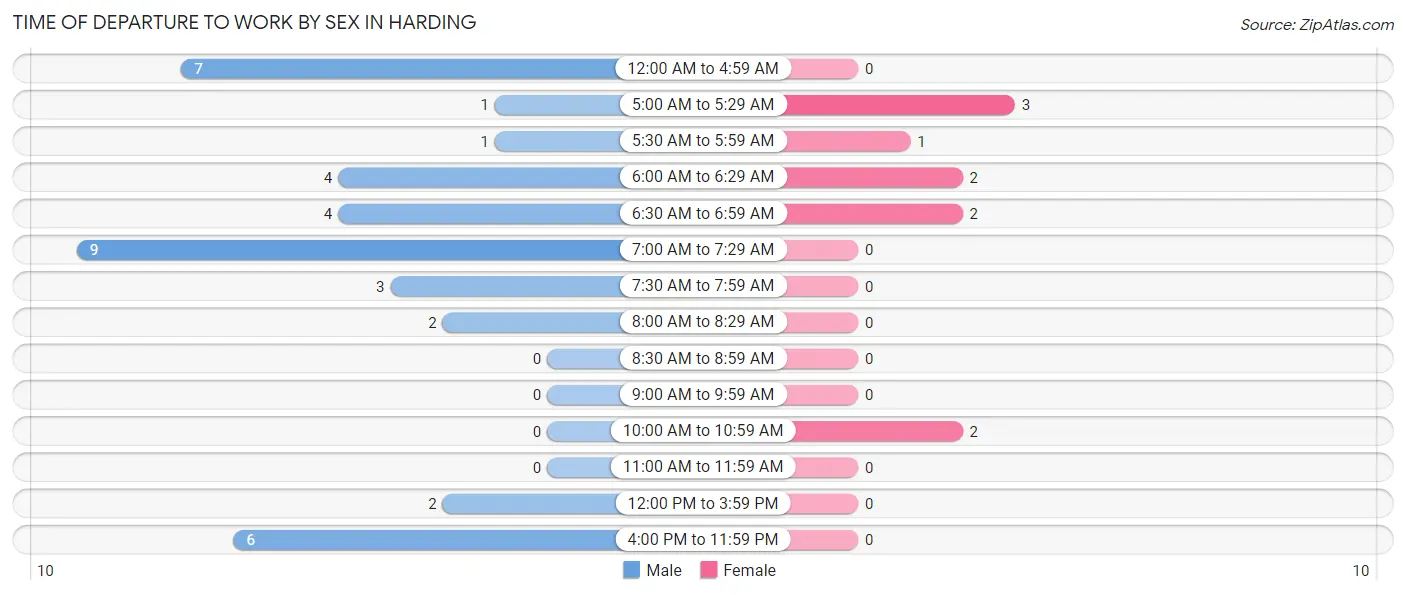
| Time of Departure | Male | Female |
| 12:00 AM to 4:59 AM | 7 (17.9%) | 0 (0.0%) |
| 5:00 AM to 5:29 AM | 1 (2.6%) | 3 (30.0%) |
| 5:30 AM to 5:59 AM | 1 (2.6%) | 1 (10.0%) |
| 6:00 AM to 6:29 AM | 4 (10.3%) | 2 (20.0%) |
| 6:30 AM to 6:59 AM | 4 (10.3%) | 2 (20.0%) |
| 7:00 AM to 7:29 AM | 9 (23.1%) | 0 (0.0%) |
| 7:30 AM to 7:59 AM | 3 (7.7%) | 0 (0.0%) |
| 8:00 AM to 8:29 AM | 2 (5.1%) | 0 (0.0%) |
| 8:30 AM to 8:59 AM | 0 (0.0%) | 0 (0.0%) |
| 9:00 AM to 9:59 AM | 0 (0.0%) | 0 (0.0%) |
| 10:00 AM to 10:59 AM | 0 (0.0%) | 2 (20.0%) |
| 11:00 AM to 11:59 AM | 0 (0.0%) | 0 (0.0%) |
| 12:00 PM to 3:59 PM | 2 (5.1%) | 0 (0.0%) |
| 4:00 PM to 11:59 PM | 6 (15.4%) | 0 (0.0%) |
| Total | 39 (100.0%) | 10 (100.0%) |
Housing Occupancy in Harding
Occupancy by Ownership in Harding
Of the total 46 dwellings in Harding, owner-occupied units account for 42 (91.3%), while renter-occupied units make up 4 (8.7%).
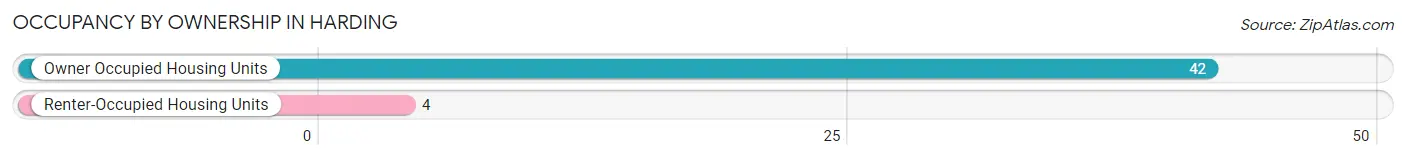
| Occupancy | # Housing Units | % Housing Units |
| Owner Occupied Housing Units | 42 | 91.3% |
| Renter-Occupied Housing Units | 4 | 8.7% |
| Total Occupied Housing Units | 46 | 100.0% |
Occupancy by Household Size in Harding
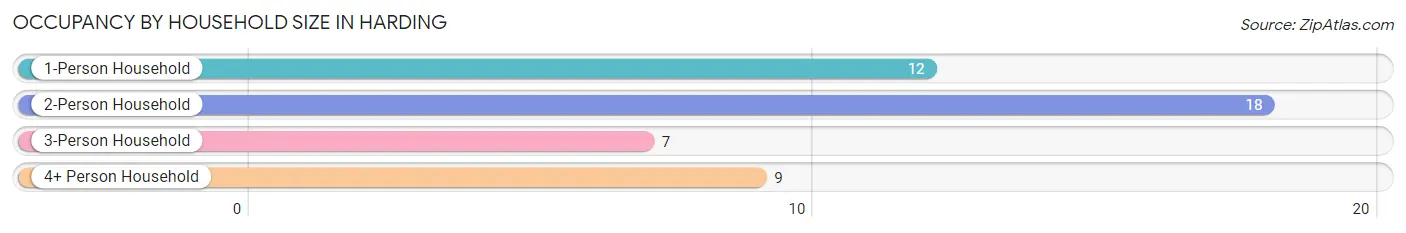
| Household Size | # Housing Units | % Housing Units |
| 1-Person Household | 12 | 26.1% |
| 2-Person Household | 18 | 39.1% |
| 3-Person Household | 7 | 15.2% |
| 4+ Person Household | 9 | 19.6% |
| Total Housing Units | 46 | 100.0% |
Occupancy by Ownership by Household Size in Harding
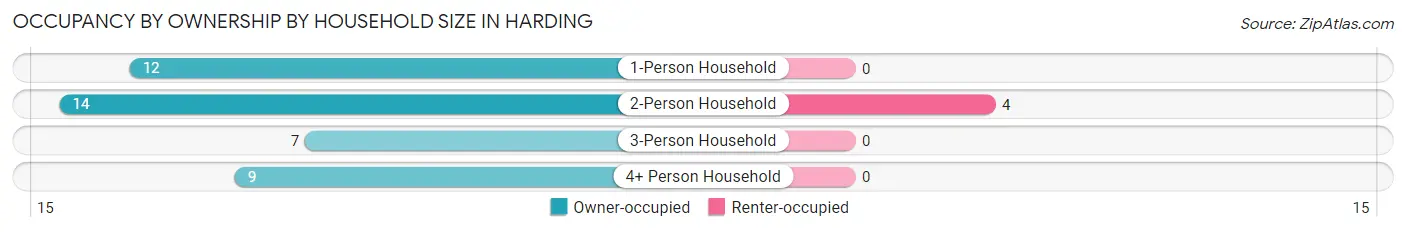
| Household Size | Owner-occupied | Renter-occupied |
| 1-Person Household | 12 (100.0%) | 0 (0.0%) |
| 2-Person Household | 14 (77.8%) | 4 (22.2%) |
| 3-Person Household | 7 (100.0%) | 0 (0.0%) |
| 4+ Person Household | 9 (100.0%) | 0 (0.0%) |
| Total Housing Units | 42 (91.3%) | 4 (8.7%) |
Occupancy by Educational Attainment in Harding
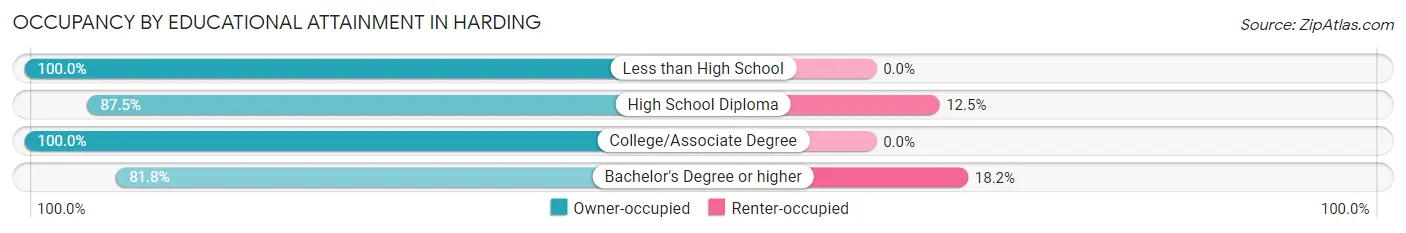
| Household Size | Owner-occupied | Renter-occupied |
| Less than High School | 5 (100.0%) | 0 (0.0%) |
| High School Diploma | 14 (87.5%) | 2 (12.5%) |
| College/Associate Degree | 14 (100.0%) | 0 (0.0%) |
| Bachelor's Degree or higher | 9 (81.8%) | 2 (18.2%) |
Occupancy by Age of Householder in Harding
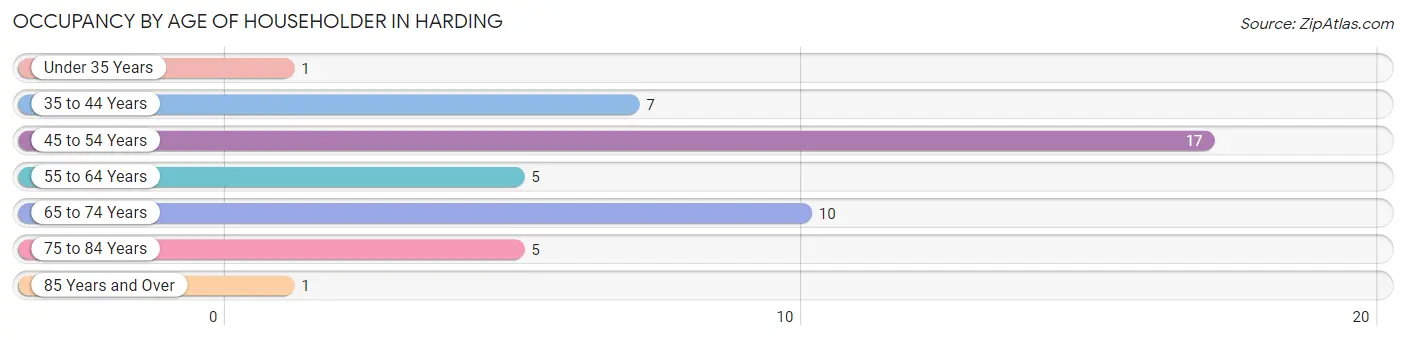
| Age Bracket | # Households | % Households |
| Under 35 Years | 1 | 2.2% |
| 35 to 44 Years | 7 | 15.2% |
| 45 to 54 Years | 17 | 37.0% |
| 55 to 64 Years | 5 | 10.9% |
| 65 to 74 Years | 10 | 21.7% |
| 75 to 84 Years | 5 | 10.9% |
| 85 Years and Over | 1 | 2.2% |
| Total | 46 | 100.0% |
Housing Finances in Harding
Median Income by Occupancy in Harding
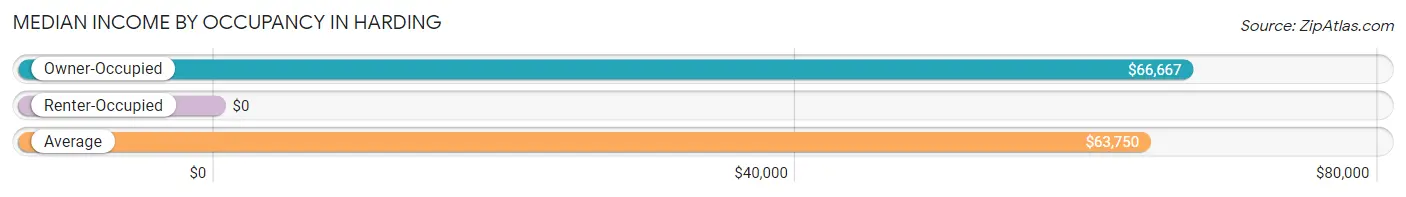
| Occupancy Type | # Households | Median Income |
| Owner-Occupied | 42 (91.3%) | $66,667 |
| Renter-Occupied | 4 (8.7%) | $0 |
| Average | 46 (100.0%) | $63,750 |
Occupancy by Householder Income Bracket in Harding
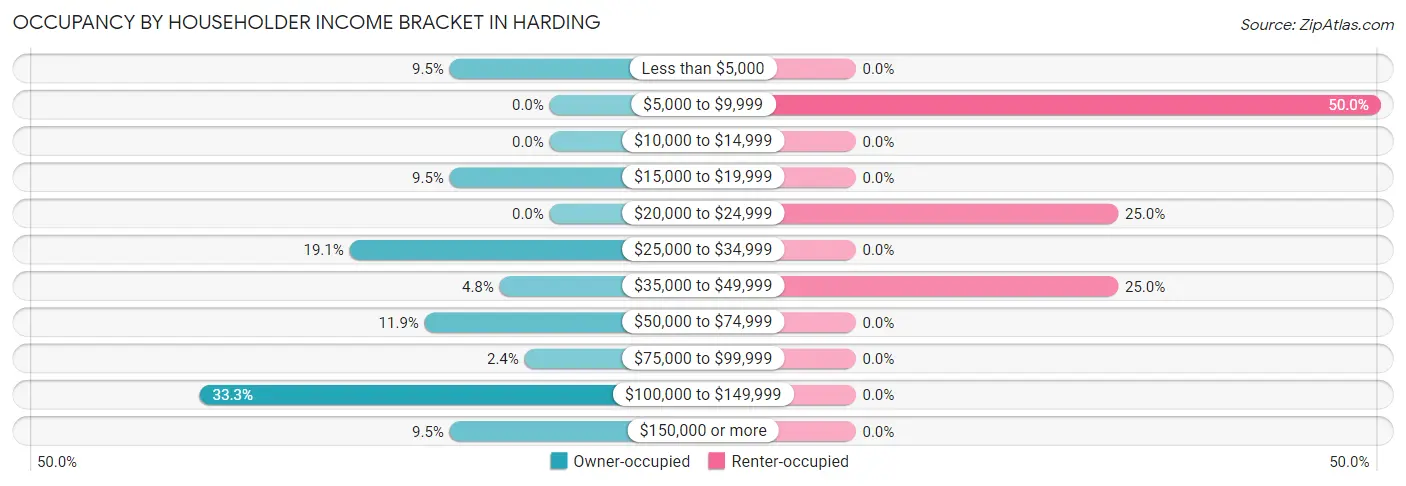
| Income Bracket | Owner-occupied | Renter-occupied |
| Less than $5,000 | 4 (9.5%) | 0 (0.0%) |
| $5,000 to $9,999 | 0 (0.0%) | 2 (50.0%) |
| $10,000 to $14,999 | 0 (0.0%) | 0 (0.0%) |
| $15,000 to $19,999 | 4 (9.5%) | 0 (0.0%) |
| $20,000 to $24,999 | 0 (0.0%) | 1 (25.0%) |
| $25,000 to $34,999 | 8 (19.1%) | 0 (0.0%) |
| $35,000 to $49,999 | 2 (4.8%) | 1 (25.0%) |
| $50,000 to $74,999 | 5 (11.9%) | 0 (0.0%) |
| $75,000 to $99,999 | 1 (2.4%) | 0 (0.0%) |
| $100,000 to $149,999 | 14 (33.3%) | 0 (0.0%) |
| $150,000 or more | 4 (9.5%) | 0 (0.0%) |
| Total | 42 (100.0%) | 4 (100.0%) |
Monthly Housing Cost Tiers in Harding
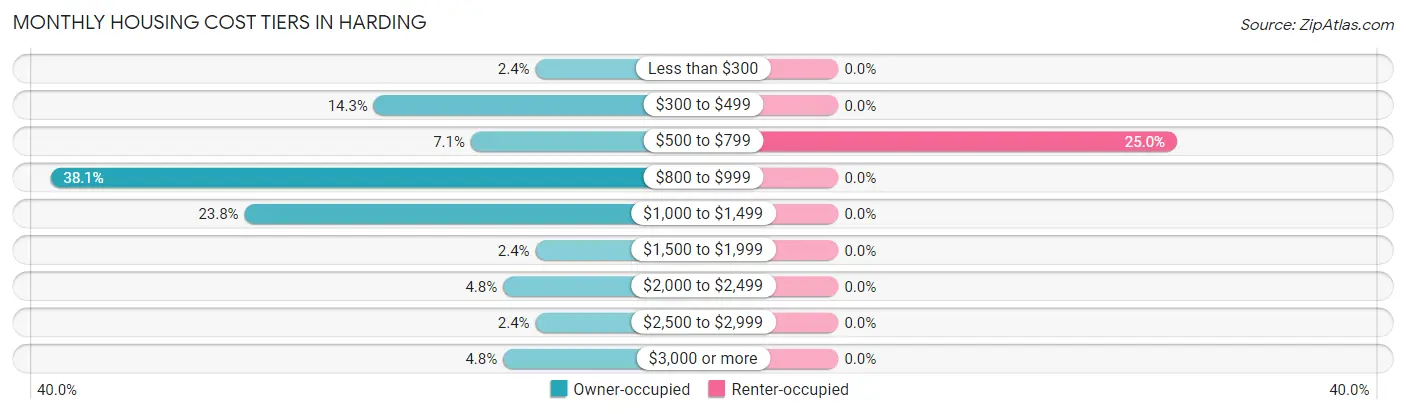
| Monthly Cost | Owner-occupied | Renter-occupied |
| Less than $300 | 1 (2.4%) | 0 (0.0%) |
| $300 to $499 | 6 (14.3%) | 0 (0.0%) |
| $500 to $799 | 3 (7.1%) | 1 (25.0%) |
| $800 to $999 | 16 (38.1%) | 0 (0.0%) |
| $1,000 to $1,499 | 10 (23.8%) | 0 (0.0%) |
| $1,500 to $1,999 | 1 (2.4%) | 0 (0.0%) |
| $2,000 to $2,499 | 2 (4.8%) | 0 (0.0%) |
| $2,500 to $2,999 | 1 (2.4%) | 0 (0.0%) |
| $3,000 or more | 2 (4.8%) | 0 (0.0%) |
| Total | 42 (100.0%) | 4 (100.0%) |
Physical Housing Characteristics in Harding
Housing Structures in Harding
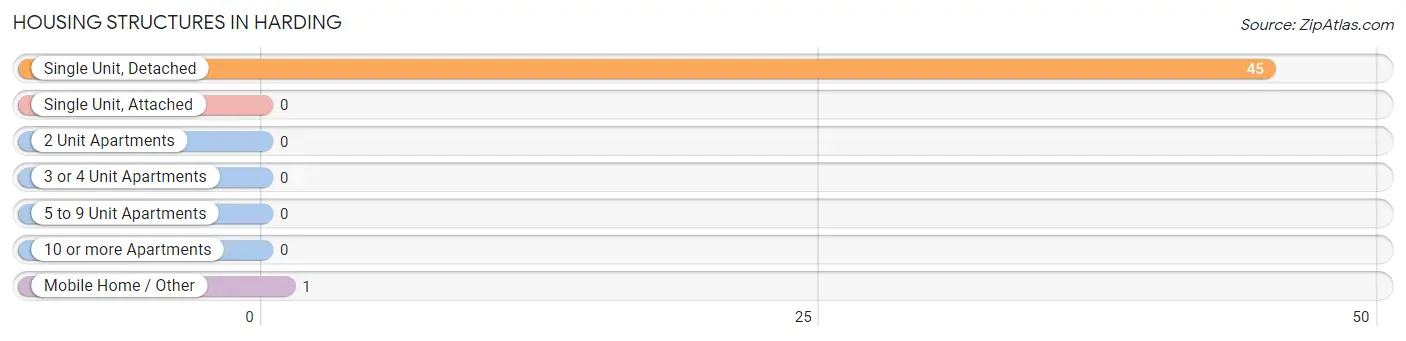
| Structure Type | # Housing Units | % Housing Units |
| Single Unit, Detached | 45 | 97.8% |
| Single Unit, Attached | 0 | 0.0% |
| 2 Unit Apartments | 0 | 0.0% |
| 3 or 4 Unit Apartments | 0 | 0.0% |
| 5 to 9 Unit Apartments | 0 | 0.0% |
| 10 or more Apartments | 0 | 0.0% |
| Mobile Home / Other | 1 | 2.2% |
| Total | 46 | 100.0% |
Housing Structures by Occupancy in Harding
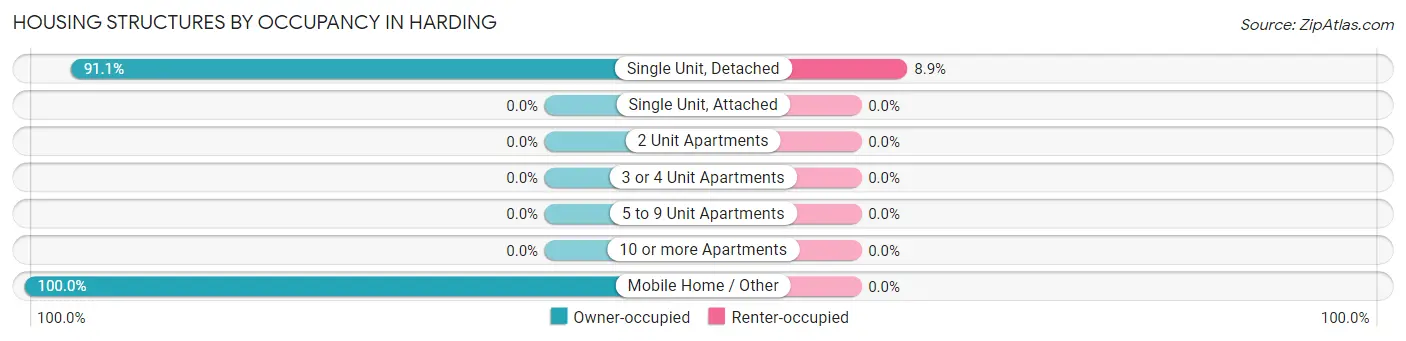
| Structure Type | Owner-occupied | Renter-occupied |
| Single Unit, Detached | 41 (91.1%) | 4 (8.9%) |
| Single Unit, Attached | 0 (0.0%) | 0 (0.0%) |
| 2 Unit Apartments | 0 (0.0%) | 0 (0.0%) |
| 3 or 4 Unit Apartments | 0 (0.0%) | 0 (0.0%) |
| 5 to 9 Unit Apartments | 0 (0.0%) | 0 (0.0%) |
| 10 or more Apartments | 0 (0.0%) | 0 (0.0%) |
| Mobile Home / Other | 1 (100.0%) | 0 (0.0%) |
| Total | 42 (91.3%) | 4 (8.7%) |
Housing Structures by Number of Rooms in Harding
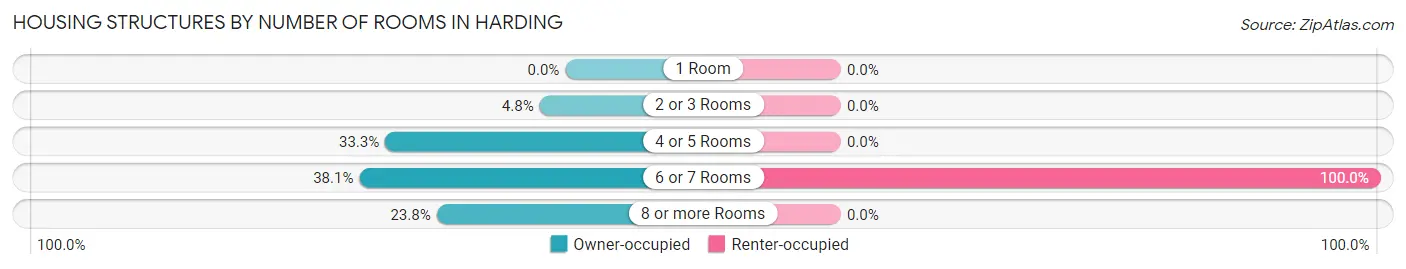
| Number of Rooms | Owner-occupied | Renter-occupied |
| 1 Room | 0 (0.0%) | 0 (0.0%) |
| 2 or 3 Rooms | 2 (4.8%) | 0 (0.0%) |
| 4 or 5 Rooms | 14 (33.3%) | 0 (0.0%) |
| 6 or 7 Rooms | 16 (38.1%) | 4 (100.0%) |
| 8 or more Rooms | 10 (23.8%) | 0 (0.0%) |
| Total | 42 (100.0%) | 4 (100.0%) |
Housing Structure by Heating Type in Harding
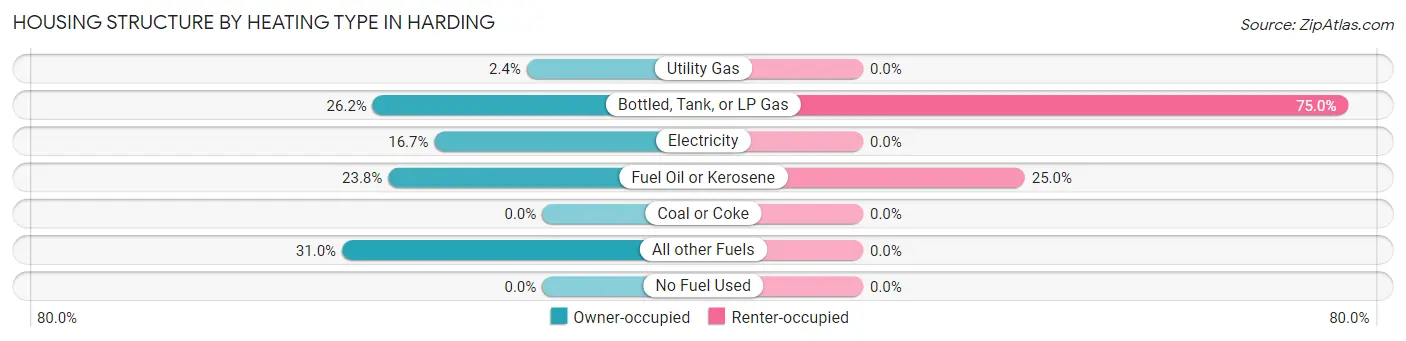
| Heating Type | Owner-occupied | Renter-occupied |
| Utility Gas | 1 (2.4%) | 0 (0.0%) |
| Bottled, Tank, or LP Gas | 11 (26.2%) | 3 (75.0%) |
| Electricity | 7 (16.7%) | 0 (0.0%) |
| Fuel Oil or Kerosene | 10 (23.8%) | 1 (25.0%) |
| Coal or Coke | 0 (0.0%) | 0 (0.0%) |
| All other Fuels | 13 (30.9%) | 0 (0.0%) |
| No Fuel Used | 0 (0.0%) | 0 (0.0%) |
| Total | 42 (100.0%) | 4 (100.0%) |
Household Vehicle Usage in Harding
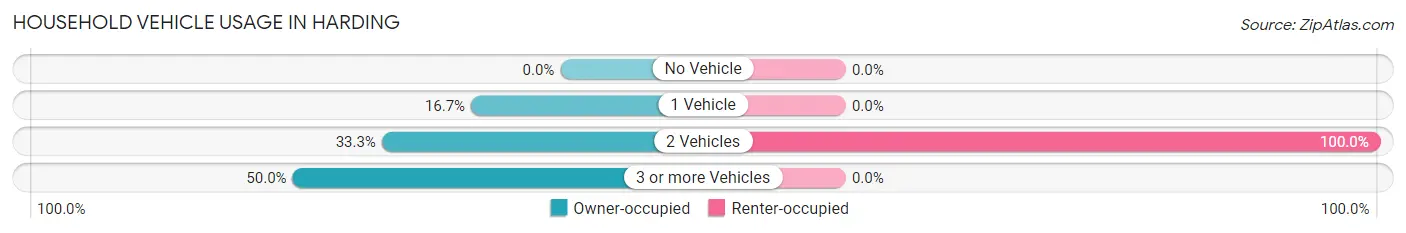
| Vehicles per Household | Owner-occupied | Renter-occupied |
| No Vehicle | 0 (0.0%) | 0 (0.0%) |
| 1 Vehicle | 7 (16.7%) | 0 (0.0%) |
| 2 Vehicles | 14 (33.3%) | 4 (100.0%) |
| 3 or more Vehicles | 21 (50.0%) | 0 (0.0%) |
| Total | 42 (100.0%) | 4 (100.0%) |
Real Estate & Mortgages in Harding
Real Estate and Mortgage Overview in Harding
| Characteristic | Without Mortgage | With Mortgage |
| Housing Units | 12 | 30 |
| Median Property Value | $125,000 | $160,700 |
| Median Household Income | - | - |
| Monthly Housing Costs | $388 | $2 |
| Real Estate Taxes | $800 | $0 |
Property Value by Mortgage Status in Harding
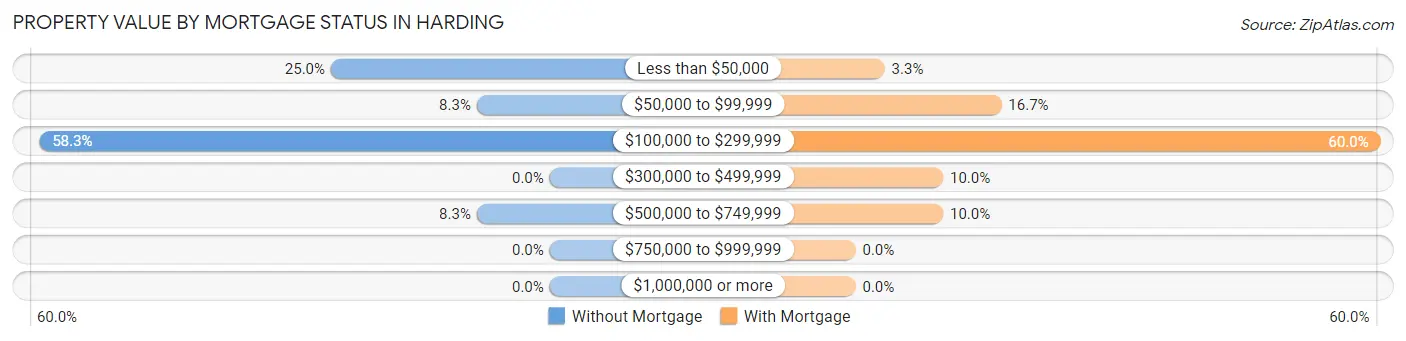
| Property Value | Without Mortgage | With Mortgage |
| Less than $50,000 | 3 (25.0%) | 1 (3.3%) |
| $50,000 to $99,999 | 1 (8.3%) | 5 (16.7%) |
| $100,000 to $299,999 | 7 (58.3%) | 18 (60.0%) |
| $300,000 to $499,999 | 0 (0.0%) | 3 (10.0%) |
| $500,000 to $749,999 | 1 (8.3%) | 3 (10.0%) |
| $750,000 to $999,999 | 0 (0.0%) | 0 (0.0%) |
| $1,000,000 or more | 0 (0.0%) | 0 (0.0%) |
| Total | 12 (100.0%) | 30 (100.0%) |
Household Income by Mortgage Status in Harding
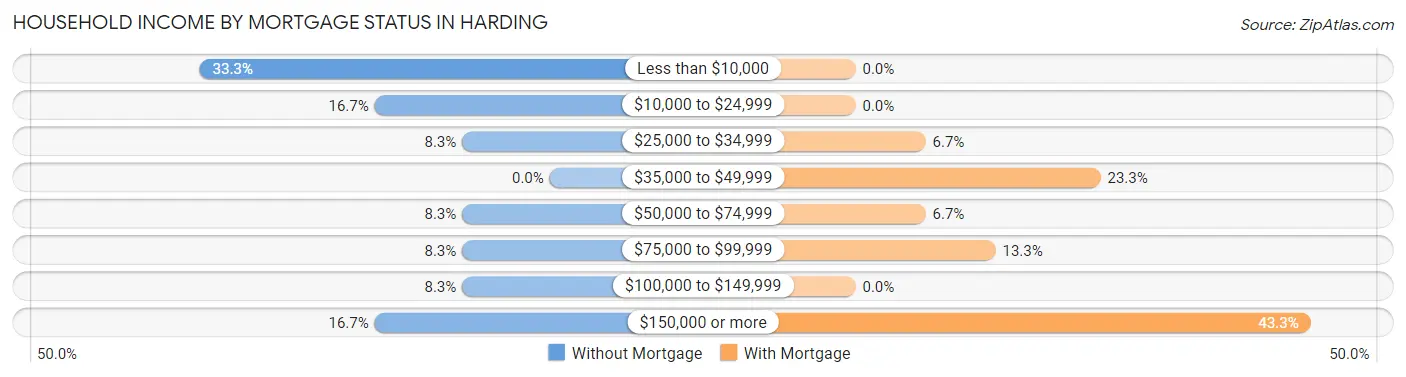
| Household Income | Without Mortgage | With Mortgage |
| Less than $10,000 | 4 (33.3%) | 0 (0.0%) |
| $10,000 to $24,999 | 2 (16.7%) | 0 (0.0%) |
| $25,000 to $34,999 | 1 (8.3%) | 2 (6.7%) |
| $35,000 to $49,999 | 0 (0.0%) | 7 (23.3%) |
| $50,000 to $74,999 | 1 (8.3%) | 2 (6.7%) |
| $75,000 to $99,999 | 1 (8.3%) | 4 (13.3%) |
| $100,000 to $149,999 | 1 (8.3%) | 0 (0.0%) |
| $150,000 or more | 2 (16.7%) | 13 (43.3%) |
| Total | 12 (100.0%) | 30 (100.0%) |
Property Value to Household Income Ratio in Harding
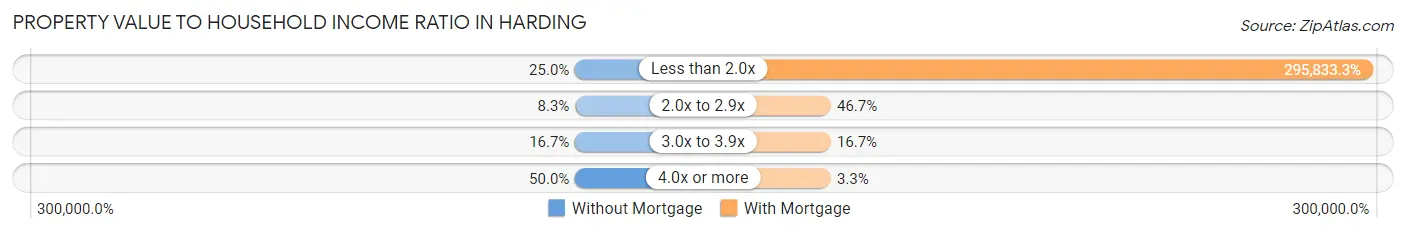
| Value-to-Income Ratio | Without Mortgage | With Mortgage |
| Less than 2.0x | 3 (25.0%) | 88,750 (295,833.3%) |
| 2.0x to 2.9x | 1 (8.3%) | 14 (46.7%) |
| 3.0x to 3.9x | 2 (16.7%) | 5 (16.7%) |
| 4.0x or more | 6 (50.0%) | 1 (3.3%) |
| Total | 12 (100.0%) | 30 (100.0%) |
Real Estate Taxes by Mortgage Status in Harding
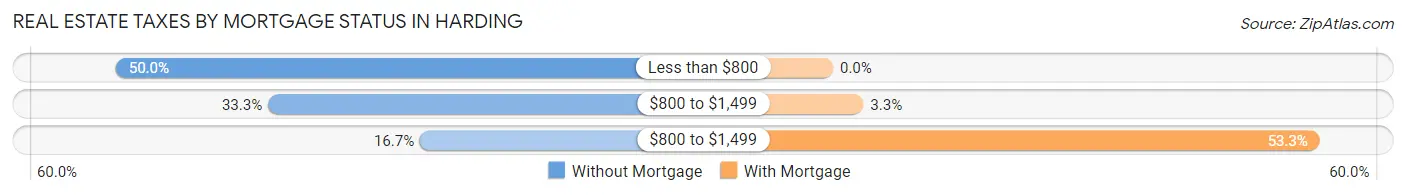
| Property Taxes | Without Mortgage | With Mortgage |
| Less than $800 | 6 (50.0%) | 0 (0.0%) |
| $800 to $1,499 | 4 (33.3%) | 1 (3.3%) |
| $800 to $1,499 | 2 (16.7%) | 16 (53.3%) |
| Total | 12 (100.0%) | 30 (100.0%) |
Health & Disability in Harding
Health Insurance Coverage by Age in Harding
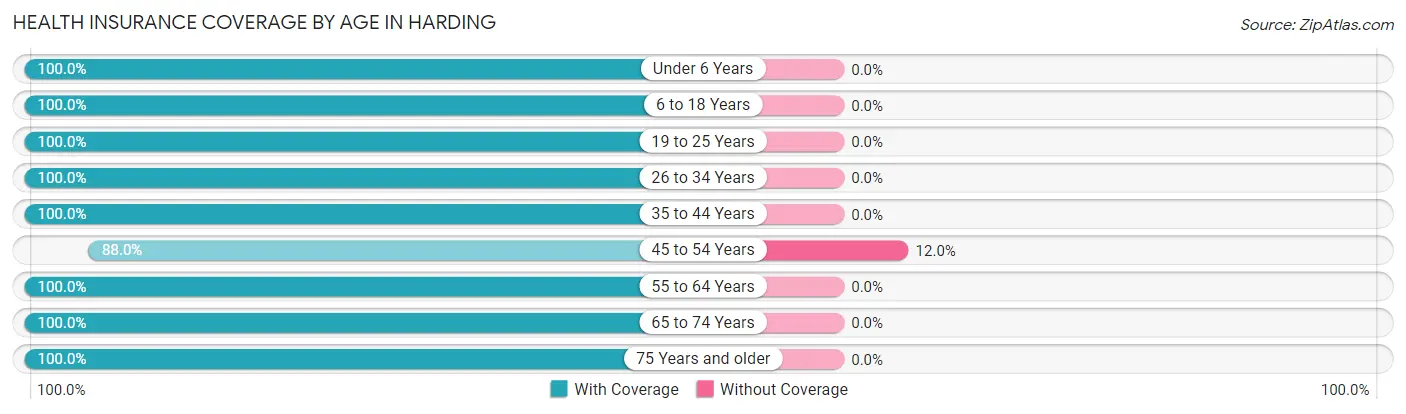
| Age Bracket | With Coverage | Without Coverage |
| Under 6 Years | 5 (100.0%) | 0 (0.0%) |
| 6 to 18 Years | 17 (100.0%) | 0 (0.0%) |
| 19 to 25 Years | 11 (100.0%) | 0 (0.0%) |
| 26 to 34 Years | 13 (100.0%) | 0 (0.0%) |
| 35 to 44 Years | 10 (100.0%) | 0 (0.0%) |
| 45 to 54 Years | 22 (88.0%) | 3 (12.0%) |
| 55 to 64 Years | 29 (100.0%) | 0 (0.0%) |
| 65 to 74 Years | 19 (100.0%) | 0 (0.0%) |
| 75 Years and older | 10 (100.0%) | 0 (0.0%) |
| Total | 136 (97.8%) | 3 (2.2%) |
Health Insurance Coverage by Citizenship Status in Harding
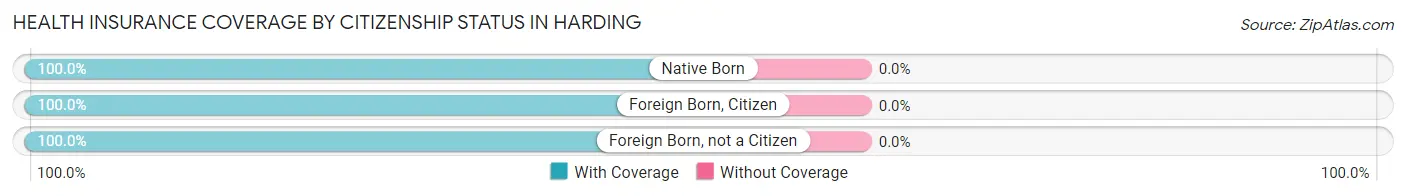
| Citizenship Status | With Coverage | Without Coverage |
| Native Born | 5 (100.0%) | 0 (0.0%) |
| Foreign Born, Citizen | 17 (100.0%) | 0 (0.0%) |
| Foreign Born, not a Citizen | 11 (100.0%) | 0 (0.0%) |
Health Insurance Coverage by Household Income in Harding
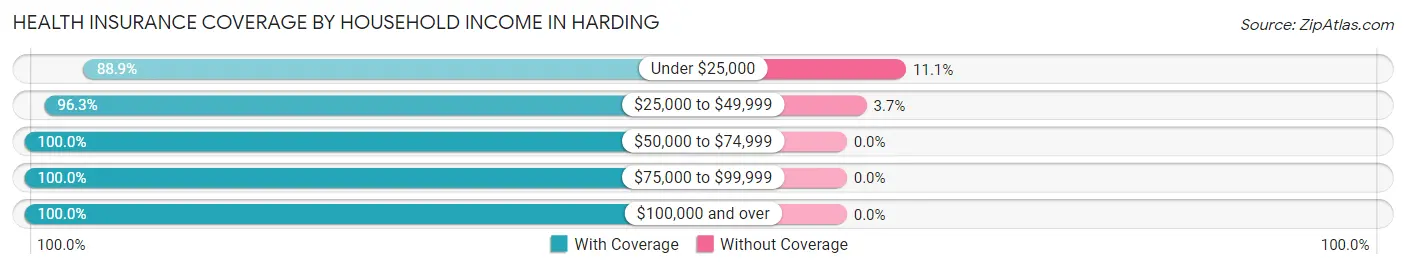
| Household Income | With Coverage | Without Coverage |
| Under $25,000 | 16 (88.9%) | 2 (11.1%) |
| $25,000 to $49,999 | 26 (96.3%) | 1 (3.7%) |
| $50,000 to $74,999 | 15 (100.0%) | 0 (0.0%) |
| $75,000 to $99,999 | 3 (100.0%) | 0 (0.0%) |
| $100,000 and over | 43 (100.0%) | 0 (0.0%) |
Public vs Private Health Insurance Coverage by Age in Harding
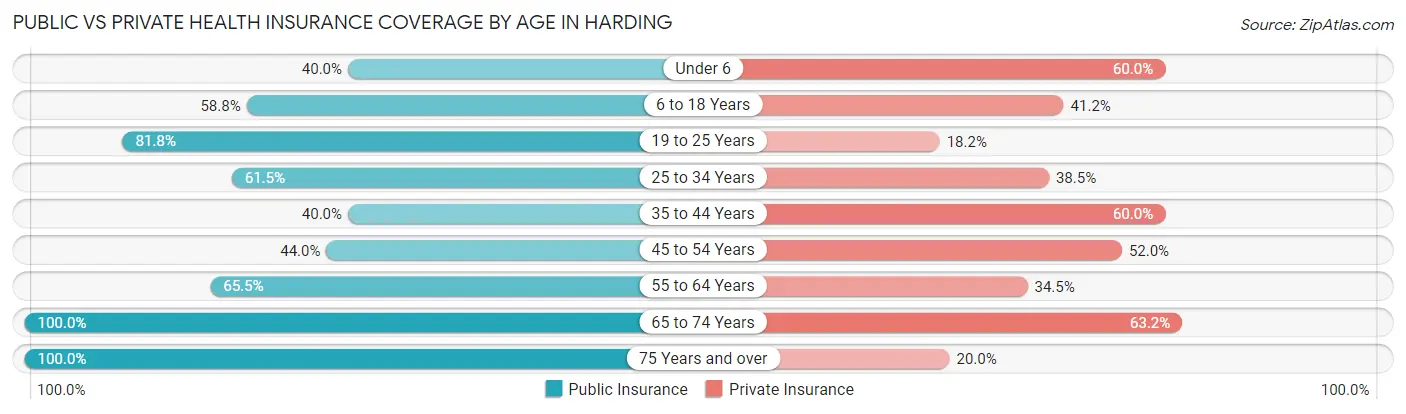
| Age Bracket | Public Insurance | Private Insurance |
| Under 6 | 2 (40.0%) | 3 (60.0%) |
| 6 to 18 Years | 10 (58.8%) | 7 (41.2%) |
| 19 to 25 Years | 9 (81.8%) | 2 (18.2%) |
| 25 to 34 Years | 8 (61.5%) | 5 (38.5%) |
| 35 to 44 Years | 4 (40.0%) | 6 (60.0%) |
| 45 to 54 Years | 11 (44.0%) | 13 (52.0%) |
| 55 to 64 Years | 19 (65.5%) | 10 (34.5%) |
| 65 to 74 Years | 19 (100.0%) | 12 (63.2%) |
| 75 Years and over | 10 (100.0%) | 2 (20.0%) |
| Total | 92 (66.2%) | 60 (43.2%) |
Disability Status by Sex by Age in Harding
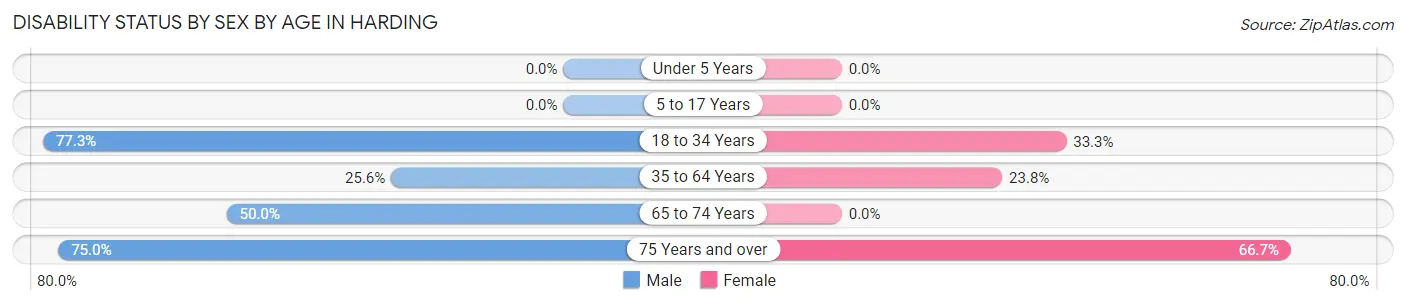
| Age Bracket | Male | Female |
| Under 5 Years | 0 (0.0%) | 0 (0.0%) |
| 5 to 17 Years | 0 (0.0%) | 0 (0.0%) |
| 18 to 34 Years | 17 (77.3%) | 1 (33.3%) |
| 35 to 64 Years | 11 (25.6%) | 5 (23.8%) |
| 65 to 74 Years | 8 (50.0%) | 0 (0.0%) |
| 75 Years and over | 3 (75.0%) | 4 (66.7%) |
Disability Class by Sex by Age in Harding
Disability Class: Hearing Difficulty
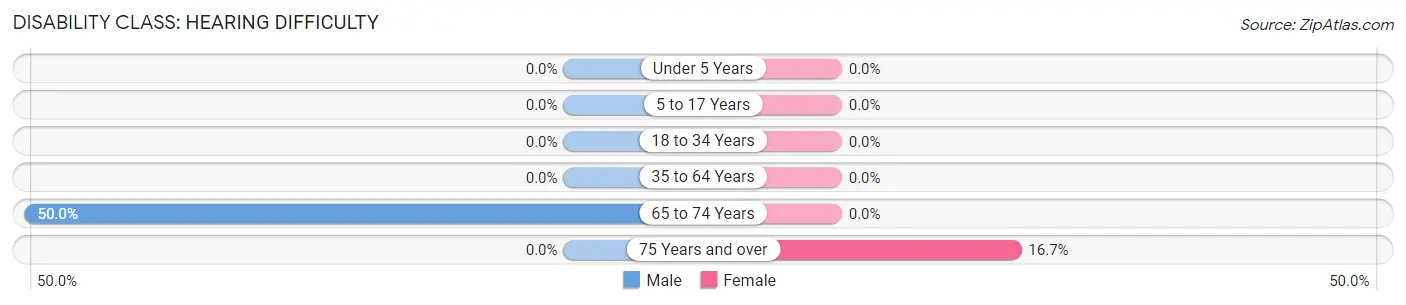
| Age Bracket | Male | Female |
| Under 5 Years | 0 (0.0%) | 0 (0.0%) |
| 5 to 17 Years | 0 (0.0%) | 0 (0.0%) |
| 18 to 34 Years | 0 (0.0%) | 0 (0.0%) |
| 35 to 64 Years | 0 (0.0%) | 0 (0.0%) |
| 65 to 74 Years | 8 (50.0%) | 0 (0.0%) |
| 75 Years and over | 0 (0.0%) | 1 (16.7%) |
Disability Class: Vision Difficulty
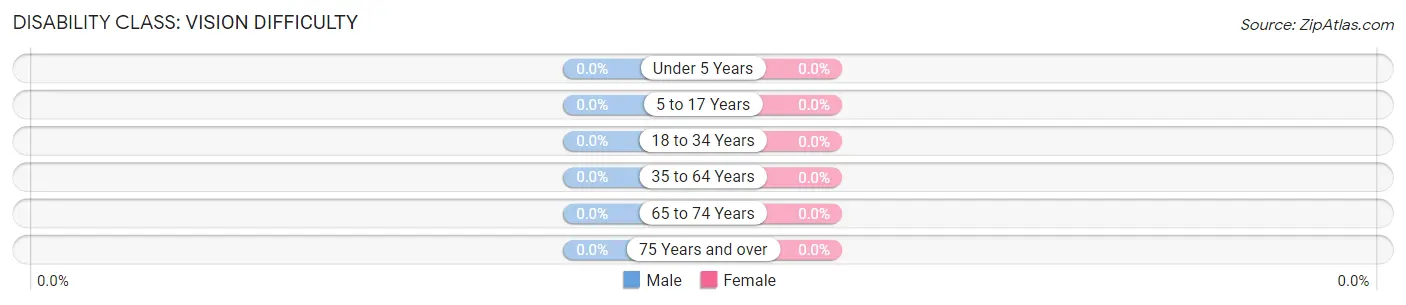
| Age Bracket | Male | Female |
| Under 5 Years | 0 (0.0%) | 0 (0.0%) |
| 5 to 17 Years | 0 (0.0%) | 0 (0.0%) |
| 18 to 34 Years | 0 (0.0%) | 0 (0.0%) |
| 35 to 64 Years | 0 (0.0%) | 0 (0.0%) |
| 65 to 74 Years | 0 (0.0%) | 0 (0.0%) |
| 75 Years and over | 0 (0.0%) | 0 (0.0%) |
Disability Class: Cognitive Difficulty
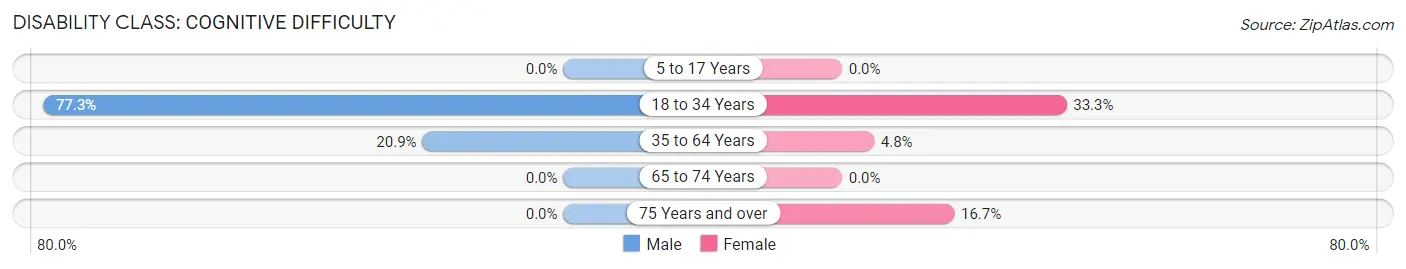
| Age Bracket | Male | Female |
| 5 to 17 Years | 0 (0.0%) | 0 (0.0%) |
| 18 to 34 Years | 17 (77.3%) | 1 (33.3%) |
| 35 to 64 Years | 9 (20.9%) | 1 (4.8%) |
| 65 to 74 Years | 0 (0.0%) | 0 (0.0%) |
| 75 Years and over | 0 (0.0%) | 1 (16.7%) |
Disability Class: Ambulatory Difficulty
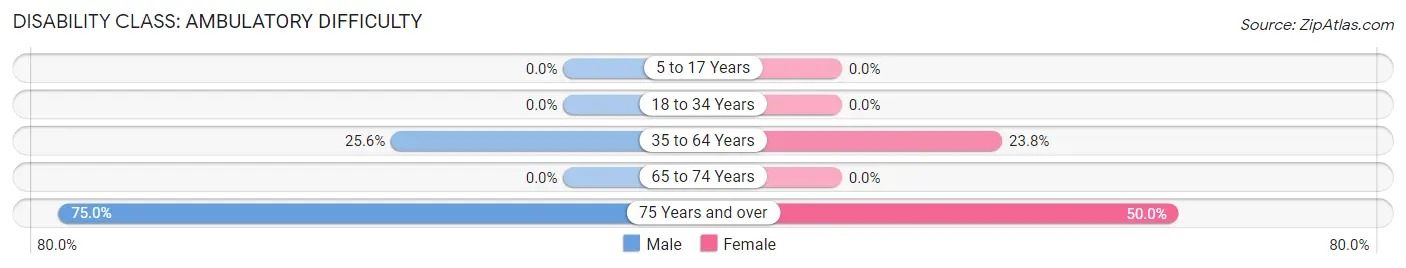
| Age Bracket | Male | Female |
| 5 to 17 Years | 0 (0.0%) | 0 (0.0%) |
| 18 to 34 Years | 0 (0.0%) | 0 (0.0%) |
| 35 to 64 Years | 11 (25.6%) | 5 (23.8%) |
| 65 to 74 Years | 0 (0.0%) | 0 (0.0%) |
| 75 Years and over | 3 (75.0%) | 3 (50.0%) |
Disability Class: Self-Care Difficulty
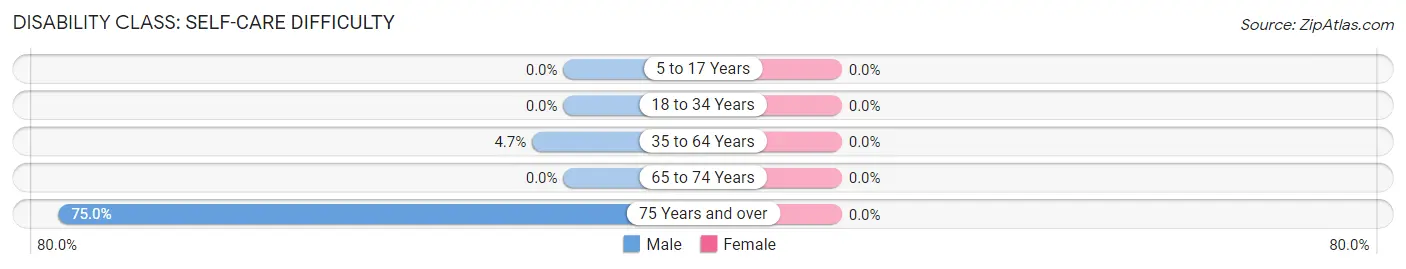
| Age Bracket | Male | Female |
| 5 to 17 Years | 0 (0.0%) | 0 (0.0%) |
| 18 to 34 Years | 0 (0.0%) | 0 (0.0%) |
| 35 to 64 Years | 2 (4.6%) | 0 (0.0%) |
| 65 to 74 Years | 0 (0.0%) | 0 (0.0%) |
| 75 Years and over | 3 (75.0%) | 0 (0.0%) |
Technology Access in Harding
Computing Device Access in Harding
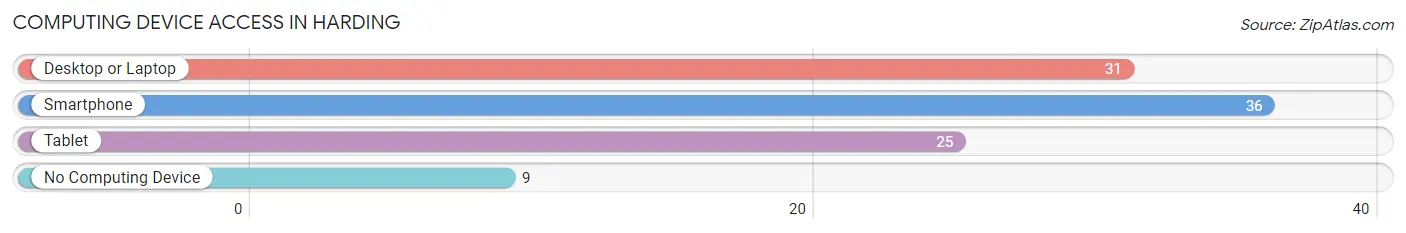
| Device Type | # Households | % Households |
| Desktop or Laptop | 31 | 67.4% |
| Smartphone | 36 | 78.3% |
| Tablet | 25 | 54.3% |
| No Computing Device | 9 | 19.6% |
| Total | 46 | 100.0% |
Internet Access in Harding
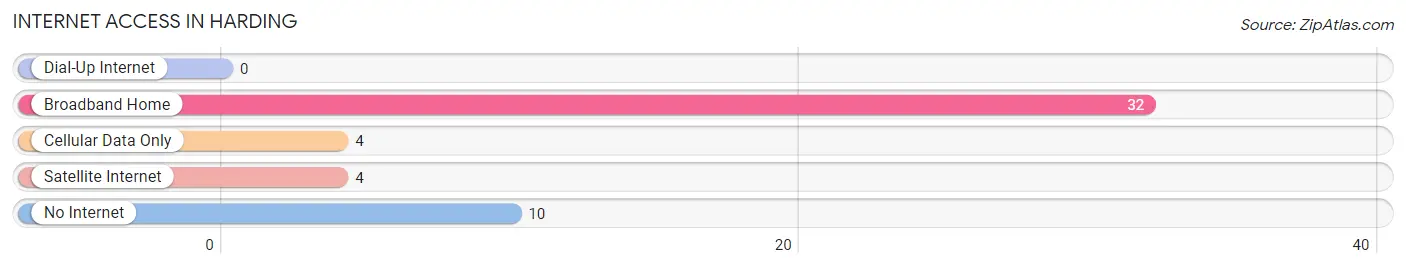
| Internet Type | # Households | % Households |
| Dial-Up Internet | 0 | 0.0% |
| Broadband Home | 32 | 69.6% |
| Cellular Data Only | 4 | 8.7% |
| Satellite Internet | 4 | 8.7% |
| No Internet | 10 | 21.7% |
| Total | 46 | 100.0% |
Harding Summary
Harding is a small city located in the state of Minnesota, United States. It is situated in the south-central part of the state, in the county of Stearns. The city has a population of approximately 1,000 people, according to the 2010 census.
Geography
Harding is located in the south-central part of Minnesota, in Stearns County. It is situated on the banks of the Sauk River, which flows through the city. The city is surrounded by rolling hills and is located in the Sauk River Valley. The city is located approximately 25 miles south of St. Cloud and about 50 miles northwest of Minneapolis.
The city has a total area of 0.7 square miles, all of which is land. The city is located at an elevation of 890 feet above sea level. The climate in Harding is classified as humid continental, with cold winters and warm summers.
History
Harding was founded in 1856 by a group of settlers from Germany. The city was named after President Warren G. Harding, who was in office at the time. The city was incorporated in 1887.
In the early 1900s, the city was a major center for the lumber industry. The city was also home to a number of sawmills and other wood-related businesses. The city was also home to a number of other businesses, including a flour mill, a creamery, and a brickyard.
In the 1950s, the city began to experience a decline in population as people moved away to larger cities. The city has since experienced a resurgence in population, with the population increasing by nearly 10% between 2000 and 2010.
Economy
The economy of Harding is largely based on agriculture and tourism. The city is home to a number of farms, which produce a variety of crops, including corn, soybeans, and wheat. The city is also home to a number of tourist attractions, including the Harding Historical Museum and the Harding County Park.
The city is also home to a number of businesses, including a number of restaurants, retail stores, and service providers. The city is also home to a number of manufacturing businesses, including a number of wood-related businesses.
Demographics
According to the 2010 census, the population of Harding was 1,000. The racial makeup of the city was 97.2% White, 0.7% African American, 0.3% Native American, 0.3% Asian, 0.1% Pacific Islander, and 1.5% from other races. The median household income in the city was $41,250, and the median family income was $50,000.
The city has a large number of people who are of German descent, with nearly 40% of the population claiming German ancestry. The city also has a large number of people who are of Norwegian descent, with nearly 20% of the population claiming Norwegian ancestry.
Conclusion
Harding is a small city located in the south-central part of Minnesota. The city has a population of approximately 1,000 people, according to the 2010 census. The economy of the city is largely based on agriculture and tourism, and the city is home to a number of businesses, including a number of restaurants, retail stores, and service providers. The city has a large number of people who are of German and Norwegian descent.
Common Questions
What is Per Capita Income in Harding?
Per Capita income in Harding is $28,145.
What is the Median Family Income in Harding?
Median Family Income in Harding is $111,250.
What is the Median Household income in Harding?
Median Household Income in Harding is $63,750.
What is Inequality or Gini Index in Harding?
Inequality or Gini Index in Harding is 0.43.
What is the Total Population of Harding?
Total Population of Harding is 139.
What is the Total Male Population of Harding?
Total Male Population of Harding is 97.
What is the Total Female Population of Harding?
Total Female Population of Harding is 42.
What is the Ratio of Males per 100 Females in Harding?
There are 230.95 Males per 100 Females in Harding.
What is the Ratio of Females per 100 Males in Harding?
There are 43.30 Females per 100 Males in Harding.
What is the Median Population Age in Harding?
Median Population Age in Harding is 51.8 Years.
What is the Average Family Size in Harding
Average Family Size in Harding is 2.8 People.
What is the Average Household Size in Harding
Average Household Size in Harding is 2.3 People.
How Large is the Labor Force in Harding?
There are 58 People in the Labor Forcein in Harding.
What is the Percentage of People in the Labor Force in Harding?
46.4% of People are in the Labor Force in Harding.