Circle Pines, MN Map & Demographics
Circle Pines Map
Circle Pines Overview
$42,614
PER CAPITA INCOME
$115,030
AVG FAMILY INCOME
$97,083
AVG HOUSEHOLD INCOME
16.8%
WAGE / INCOME GAP [ % ]
83.2¢/ $1
WAGE / INCOME GAP [ $ ]
0.36
INEQUALITY / GINI INDEX
4,996
TOTAL POPULATION
2,368
MALE POPULATION
2,628
FEMALE POPULATION
90.11
MALES / 100 FEMALES
110.98
FEMALES / 100 MALES
38.4
MEDIAN AGE
3.1
AVG FAMILY SIZE
2.6
AVG HOUSEHOLD SIZE
3,073
LABOR FORCE [ PEOPLE ]
76.3%
PERCENT IN LABOR FORCE
3.8%
UNEMPLOYMENT RATE
Circle Pines Zip Codes
Income in Circle Pines
Income Overview in Circle Pines
Per Capita Income in Circle Pines is $42,614, while median incomes of families and households are $115,030 and $97,083 respectively.
| Characteristic | Number | Measure |
| Per Capita Income | 4,996 | $42,614 |
| Median Family Income | 1,303 | $115,030 |
| Mean Family Income | 1,303 | $130,177 |
| Median Household Income | 1,938 | $97,083 |
| Mean Household Income | 1,938 | $107,028 |
| Income Deficit | 1,303 | $0 |
| Wage / Income Gap (%) | 4,996 | 16.77% |
| Wage / Income Gap ($) | 4,996 | 83.23¢ per $1 |
| Gini / Inequality Index | 4,996 | 0.36 |
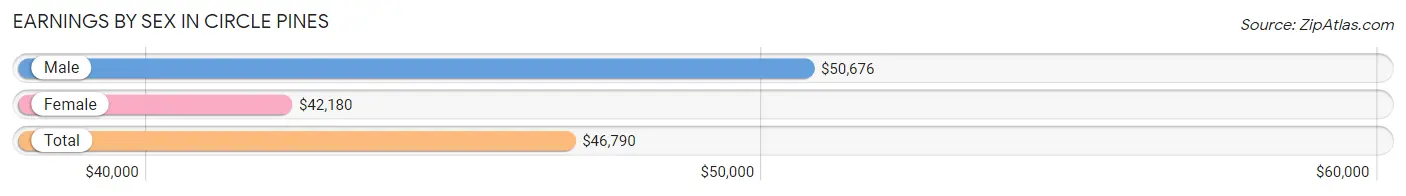
Earnings by Sex in Circle Pines
Average Earnings in Circle Pines are $46,790, $50,676 for men and $42,180 for women, a difference of 16.8%.
| Sex | Number | Average Earnings |
| Male | 1,617 (51.4%) | $50,676 |
| Female | 1,531 (48.6%) | $42,180 |
| Total | 3,148 (100.0%) | $46,790 |
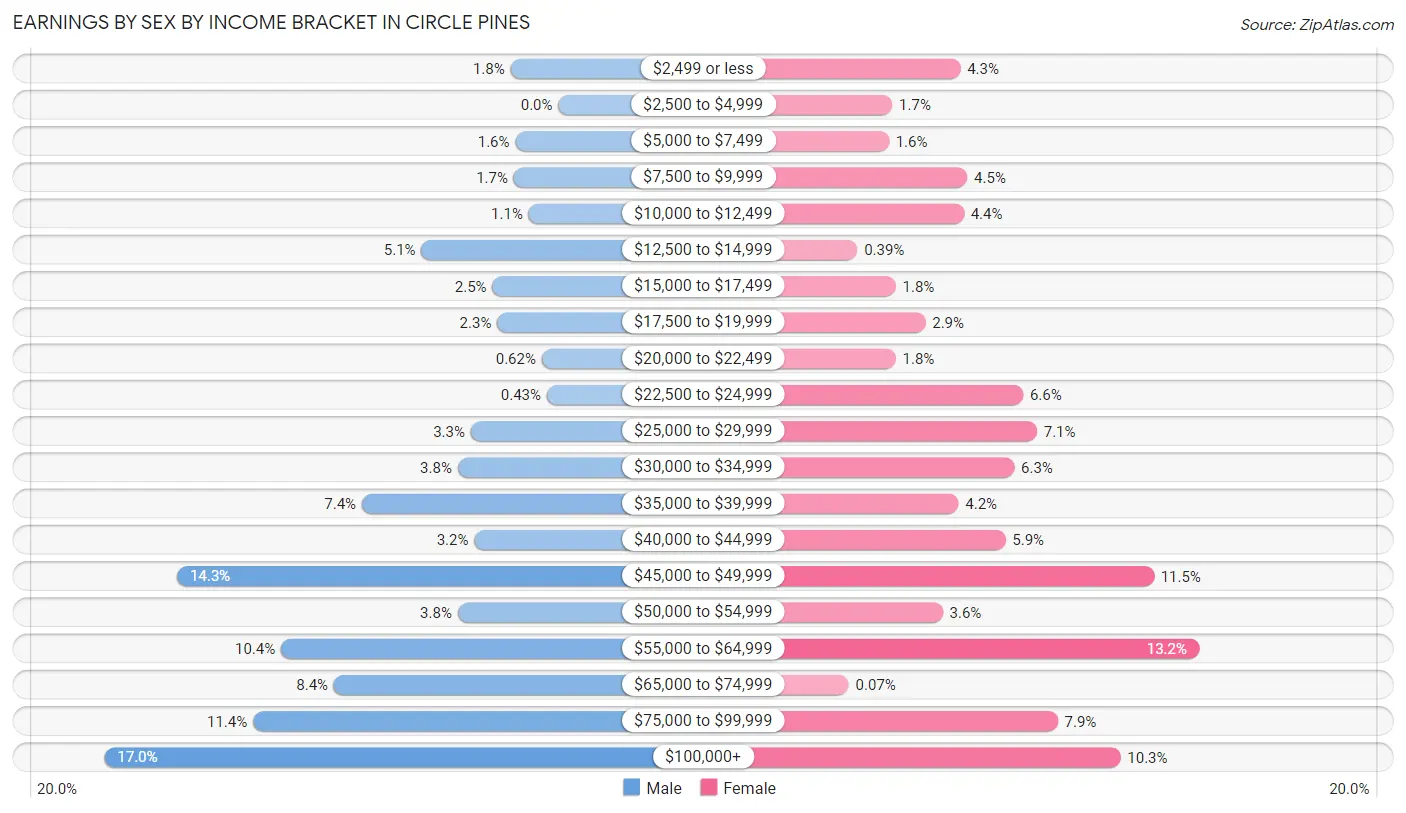
Earnings by Sex by Income Bracket in Circle Pines
The most common earnings brackets in Circle Pines are $100,000+ for men (275 | 17.0%) and $55,000 to $64,999 for women (202 | 13.2%).
| Income | Male | Female |
| $2,499 or less | 29 (1.8%) | 65 (4.3%) |
| $2,500 to $4,999 | 0 (0.0%) | 26 (1.7%) |
| $5,000 to $7,499 | 26 (1.6%) | 24 (1.6%) |
| $7,500 to $9,999 | 27 (1.7%) | 69 (4.5%) |
| $10,000 to $12,499 | 18 (1.1%) | 67 (4.4%) |
| $12,500 to $14,999 | 83 (5.1%) | 6 (0.4%) |
| $15,000 to $17,499 | 40 (2.5%) | 28 (1.8%) |
| $17,500 to $19,999 | 37 (2.3%) | 45 (2.9%) |
| $20,000 to $22,499 | 10 (0.6%) | 28 (1.8%) |
| $22,500 to $24,999 | 7 (0.4%) | 101 (6.6%) |
| $25,000 to $29,999 | 53 (3.3%) | 109 (7.1%) |
| $30,000 to $34,999 | 61 (3.8%) | 96 (6.3%) |
| $35,000 to $39,999 | 119 (7.4%) | 64 (4.2%) |
| $40,000 to $44,999 | 51 (3.2%) | 91 (5.9%) |
| $45,000 to $49,999 | 231 (14.3%) | 176 (11.5%) |
| $50,000 to $54,999 | 61 (3.8%) | 55 (3.6%) |
| $55,000 to $64,999 | 168 (10.4%) | 202 (13.2%) |
| $65,000 to $74,999 | 136 (8.4%) | 1 (0.1%) |
| $75,000 to $99,999 | 185 (11.4%) | 121 (7.9%) |
| $100,000+ | 275 (17.0%) | 157 (10.2%) |
| Total | 1,617 (100.0%) | 1,531 (100.0%) |
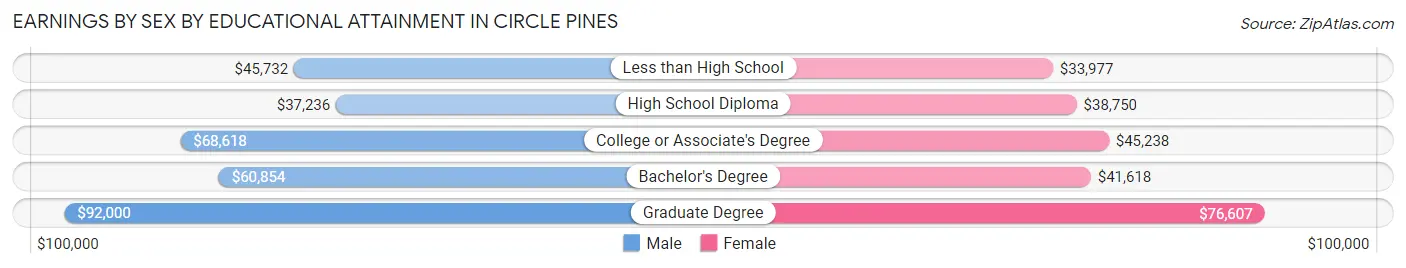
Earnings by Sex by Educational Attainment in Circle Pines
Average earnings in Circle Pines are $58,770 for men and $44,375 for women, a difference of 24.5%. Men with an educational attainment of graduate degree enjoy the highest average annual earnings of $92,000, while those with high school diploma education earn the least with $37,236. Women with an educational attainment of graduate degree earn the most with the average annual earnings of $76,607, while those with less than high school education have the smallest earnings of $33,977.
| Educational Attainment | Male Income | Female Income |
| Less than High School | $45,732 | $33,977 |
| High School Diploma | $37,236 | $38,750 |
| College or Associate's Degree | $68,618 | $45,238 |
| Bachelor's Degree | $60,854 | $41,618 |
| Graduate Degree | $92,000 | $76,607 |
| Total | $58,770 | $44,375 |
Family Income in Circle Pines
Family Income Brackets in Circle Pines
According to the Circle Pines family income data, there are 364 families falling into the $100,000 to $149,999 income range, which is the most common income bracket and makes up 27.9% of all families.
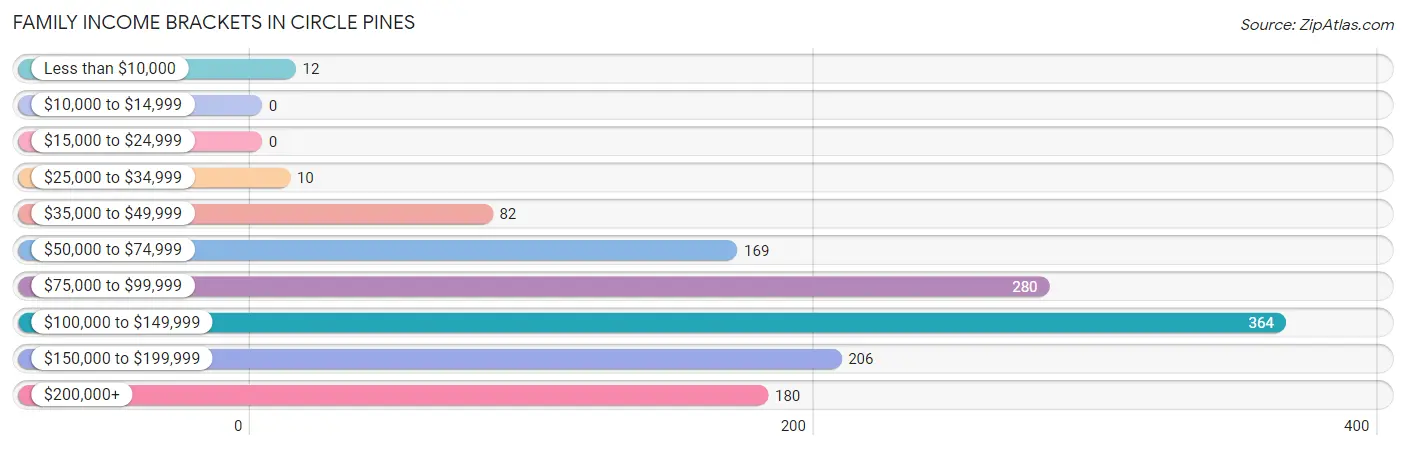
| Income Bracket | # Families | % Families |
| Less than $10,000 | 12 | 0.9% |
| $10,000 to $14,999 | 0 | 0.0% |
| $15,000 to $24,999 | 0 | 0.0% |
| $25,000 to $34,999 | 10 | 0.8% |
| $35,000 to $49,999 | 82 | 6.3% |
| $50,000 to $74,999 | 169 | 13.0% |
| $75,000 to $99,999 | 280 | 21.5% |
| $100,000 to $149,999 | 364 | 27.9% |
| $150,000 to $199,999 | 206 | 15.8% |
| $200,000+ | 180 | 13.8% |
Family Income by Famaliy Size in Circle Pines
5-person families (86 | 6.6%) account for the highest median family income in Circle Pines with $144,688 per family, while 2-person families (612 | 47.0%) have the highest median income of $49,423 per family member.
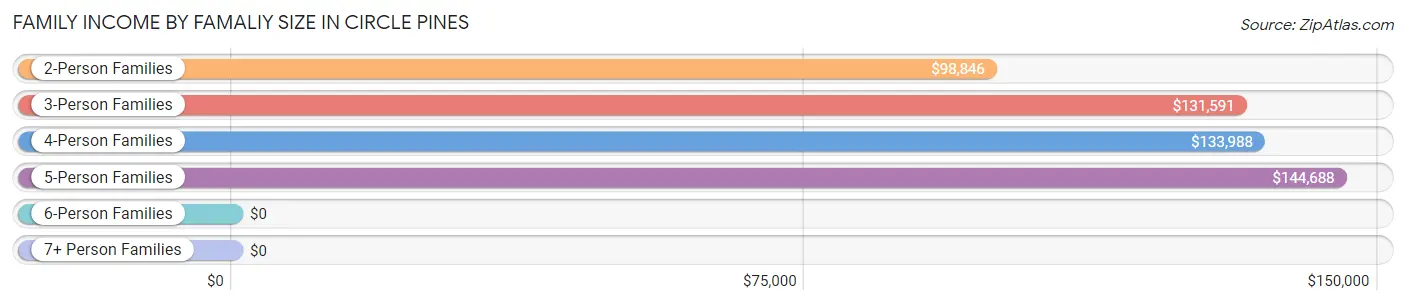
| Income Bracket | # Families | Median Income |
| 2-Person Families | 612 (47.0%) | $98,846 |
| 3-Person Families | 286 (22.0%) | $131,591 |
| 4-Person Families | 271 (20.8%) | $133,988 |
| 5-Person Families | 86 (6.6%) | $144,688 |
| 6-Person Families | 31 (2.4%) | $0 |
| 7+ Person Families | 17 (1.3%) | $0 |
| Total | 1,303 (100.0%) | $115,030 |
Family Income by Number of Earners in Circle Pines
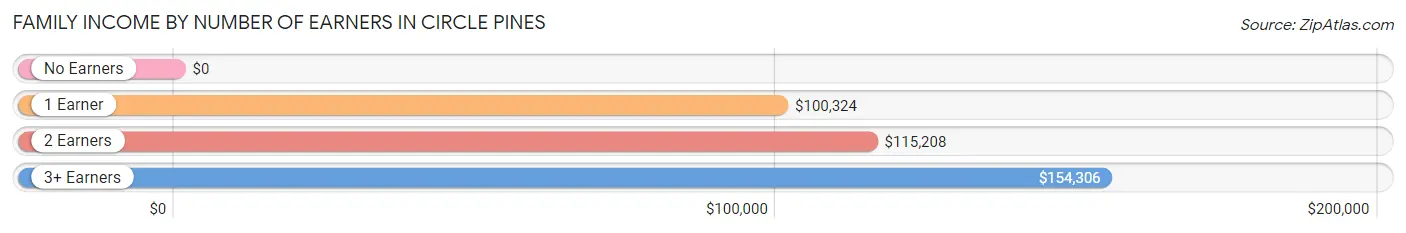
| Number of Earners | # Families | Median Income |
| No Earners | 11 (0.8%) | $0 |
| 1 Earner | 315 (24.2%) | $100,324 |
| 2 Earners | 813 (62.4%) | $115,208 |
| 3+ Earners | 164 (12.6%) | $154,306 |
| Total | 1,303 (100.0%) | $115,030 |
Household Income in Circle Pines
Household Income Brackets in Circle Pines
With 419 households falling in the category, the $100,000 to $149,999 income range is the most frequent in Circle Pines, accounting for 21.6% of all households. In contrast, only 31 households (1.6%) fall into the $10,000 to $14,999 income bracket, making it the least populous group.
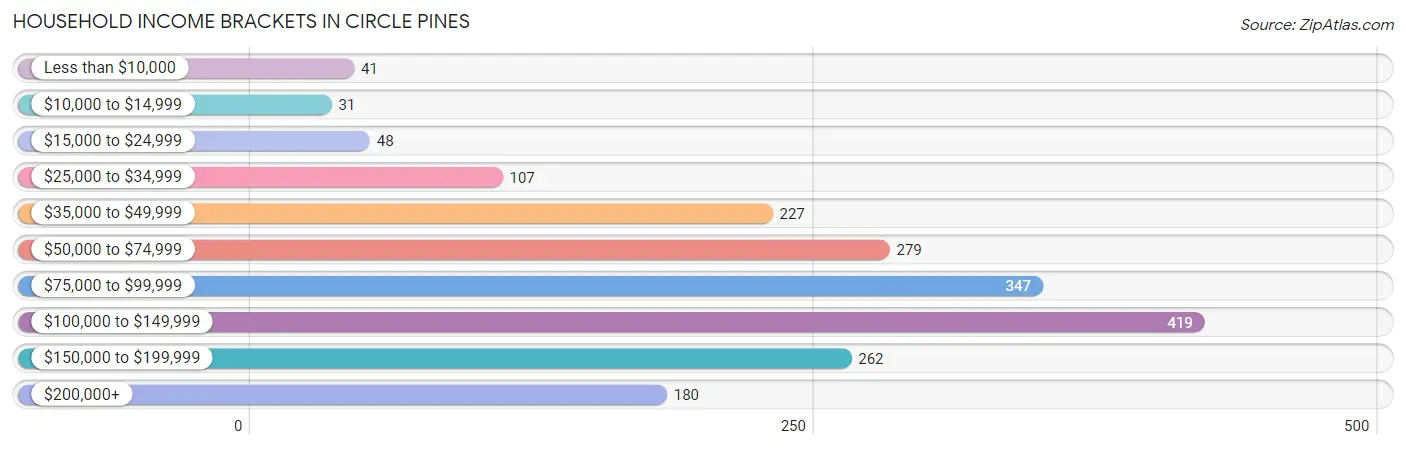
| Income Bracket | # Households | % Households |
| Less than $10,000 | 41 | 2.1% |
| $10,000 to $14,999 | 31 | 1.6% |
| $15,000 to $24,999 | 48 | 2.5% |
| $25,000 to $34,999 | 107 | 5.5% |
| $35,000 to $49,999 | 227 | 11.7% |
| $50,000 to $74,999 | 279 | 14.4% |
| $75,000 to $99,999 | 347 | 17.9% |
| $100,000 to $149,999 | 419 | 21.6% |
| $150,000 to $199,999 | 262 | 13.5% |
| $200,000+ | 180 | 9.3% |
Household Income by Householder Age in Circle Pines
The median household income in Circle Pines is $97,083, with the highest median household income of $103,846 found in the 25 to 44 years age bracket for the primary householder. A total of 610 households (31.5%) fall into this category. Meanwhile, the 65+ years age bracket for the primary householder has the lowest median household income of $67,000, with 520 households (26.8%) in this group.
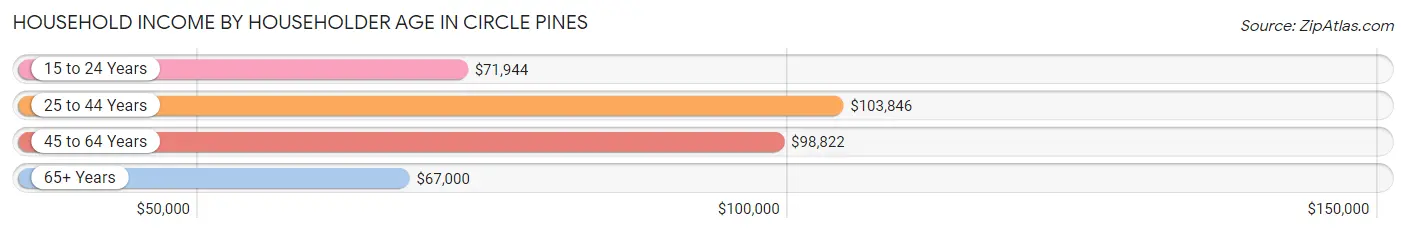
| Income Bracket | # Households | Median Income |
| 15 to 24 Years | 56 (2.9%) | $71,944 |
| 25 to 44 Years | 610 (31.5%) | $103,846 |
| 45 to 64 Years | 752 (38.8%) | $98,822 |
| 65+ Years | 520 (26.8%) | $67,000 |
| Total | 1,938 (100.0%) | $97,083 |
Poverty in Circle Pines
Income Below Poverty by Sex and Age in Circle Pines
With 3.9% poverty level for males and 5.6% for females among the residents of Circle Pines, 75 year old and over males and 12 to 14 year old females are the most vulnerable to poverty, with 10 males (17.9%) and 15 females (23.4%) in their respective age groups living below the poverty level.
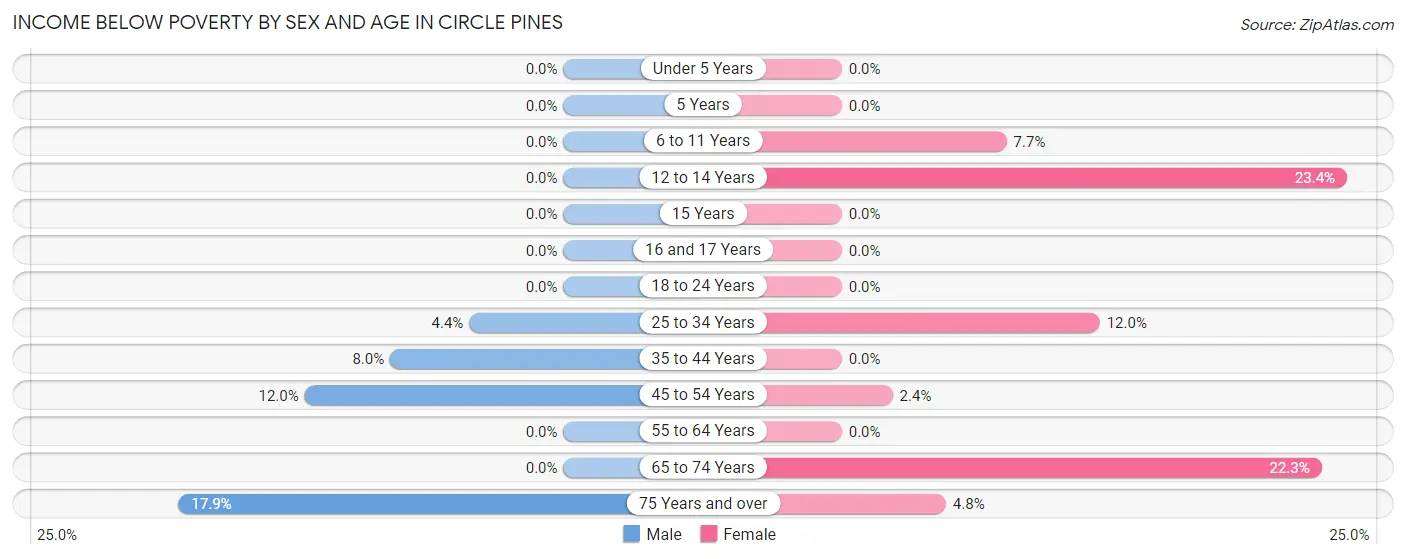
| Age Bracket | Male | Female |
| Under 5 Years | 0 (0.0%) | 0 (0.0%) |
| 5 Years | 0 (0.0%) | 0 (0.0%) |
| 6 to 11 Years | 0 (0.0%) | 14 (7.6%) |
| 12 to 14 Years | 0 (0.0%) | 15 (23.4%) |
| 15 Years | 0 (0.0%) | 0 (0.0%) |
| 16 and 17 Years | 0 (0.0%) | 0 (0.0%) |
| 18 to 24 Years | 0 (0.0%) | 0 (0.0%) |
| 25 to 34 Years | 17 (4.4%) | 37 (12.0%) |
| 35 to 44 Years | 27 (8.0%) | 0 (0.0%) |
| 45 to 54 Years | 37 (12.0%) | 10 (2.4%) |
| 55 to 64 Years | 0 (0.0%) | 0 (0.0%) |
| 65 to 74 Years | 0 (0.0%) | 61 (22.3%) |
| 75 Years and over | 10 (17.9%) | 10 (4.8%) |
| Total | 91 (3.9%) | 147 (5.6%) |
Income Above Poverty by Sex and Age in Circle Pines
According to the poverty statistics in Circle Pines, males aged under 5 years and females aged under 5 years are the age groups that are most secure financially, with 100.0% of males and 100.0% of females in these age groups living above the poverty line.
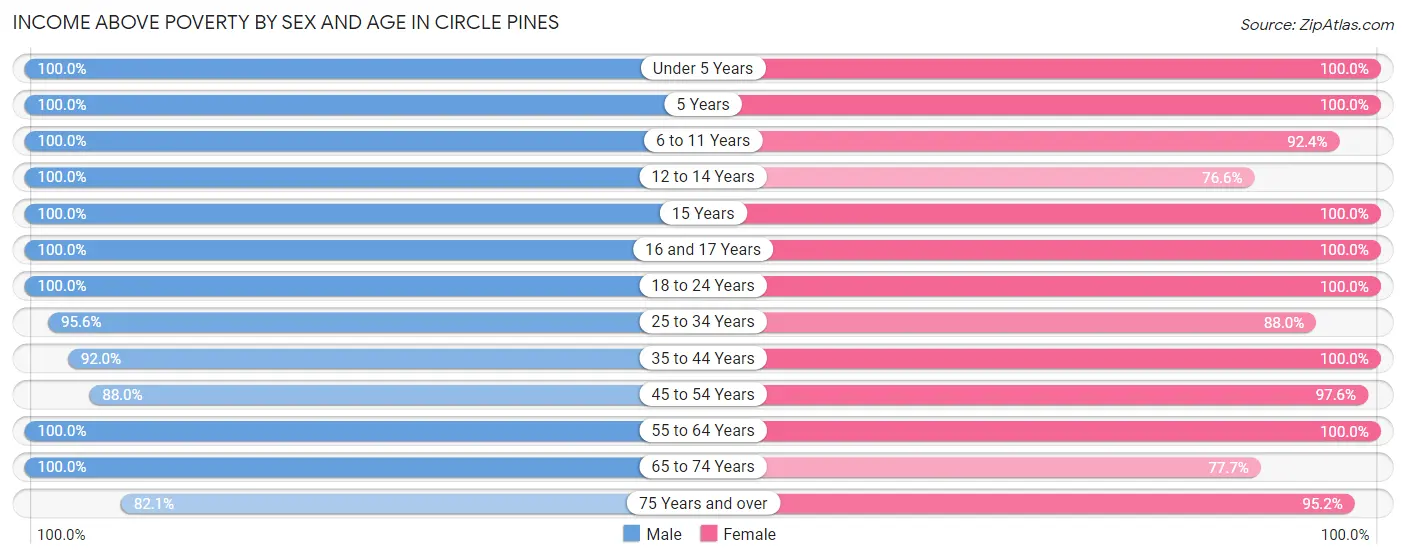
| Age Bracket | Male | Female |
| Under 5 Years | 86 (100.0%) | 217 (100.0%) |
| 5 Years | 64 (100.0%) | 31 (100.0%) |
| 6 to 11 Years | 152 (100.0%) | 169 (92.3%) |
| 12 to 14 Years | 62 (100.0%) | 49 (76.6%) |
| 15 Years | 53 (100.0%) | 42 (100.0%) |
| 16 and 17 Years | 113 (100.0%) | 53 (100.0%) |
| 18 to 24 Years | 169 (100.0%) | 210 (100.0%) |
| 25 to 34 Years | 372 (95.6%) | 272 (88.0%) |
| 35 to 44 Years | 309 (92.0%) | 294 (100.0%) |
| 45 to 54 Years | 271 (88.0%) | 413 (97.6%) |
| 55 to 64 Years | 366 (100.0%) | 321 (100.0%) |
| 65 to 74 Years | 200 (100.0%) | 213 (77.7%) |
| 75 Years and over | 46 (82.1%) | 197 (95.2%) |
| Total | 2,263 (96.1%) | 2,481 (94.4%) |
Income Below Poverty Among Married-Couple Families in Circle Pines
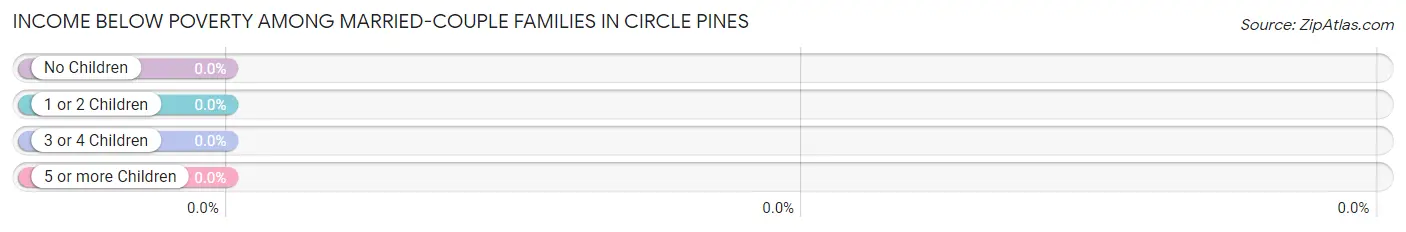
| Children | Above Poverty | Below Poverty |
| No Children | 638 (100.0%) | 0 (0.0%) |
| 1 or 2 Children | 366 (100.0%) | 0 (0.0%) |
| 3 or 4 Children | 60 (100.0%) | 0 (0.0%) |
| 5 or more Children | 9 (100.0%) | 0 (0.0%) |
| Total | 1,073 (100.0%) | 0 (0.0%) |
Income Below Poverty Among Single-Parent Households in Circle Pines
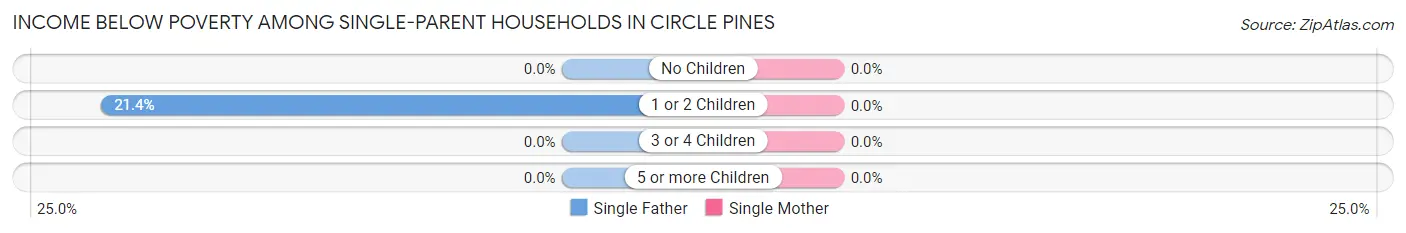
| Children | Single Father | Single Mother |
| No Children | 0 (0.0%) | 0 (0.0%) |
| 1 or 2 Children | 12 (21.4%) | 0 (0.0%) |
| 3 or 4 Children | 0 (0.0%) | 0 (0.0%) |
| 5 or more Children | 0 (0.0%) | 0 (0.0%) |
| Total | 12 (13.3%) | 0 (0.0%) |
Income Below Poverty Among Married-Couple vs Single-Parent Households in Circle Pines
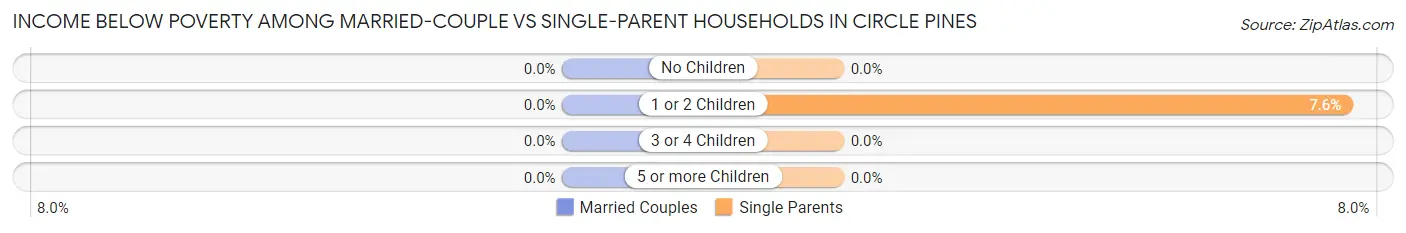
| Children | Married-Couple Families | Single-Parent Households |
| No Children | 0 (0.0%) | 0 (0.0%) |
| 1 or 2 Children | 0 (0.0%) | 12 (7.6%) |
| 3 or 4 Children | 0 (0.0%) | 0 (0.0%) |
| 5 or more Children | 0 (0.0%) | 0 (0.0%) |
| Total | 0 (0.0%) | 12 (5.2%) |
Race in Circle Pines
The most populous races in Circle Pines are White / Caucasian (4,475 | 89.6%), Asian (215 | 4.3%), and Hispanic or Latino (161 | 3.2%).
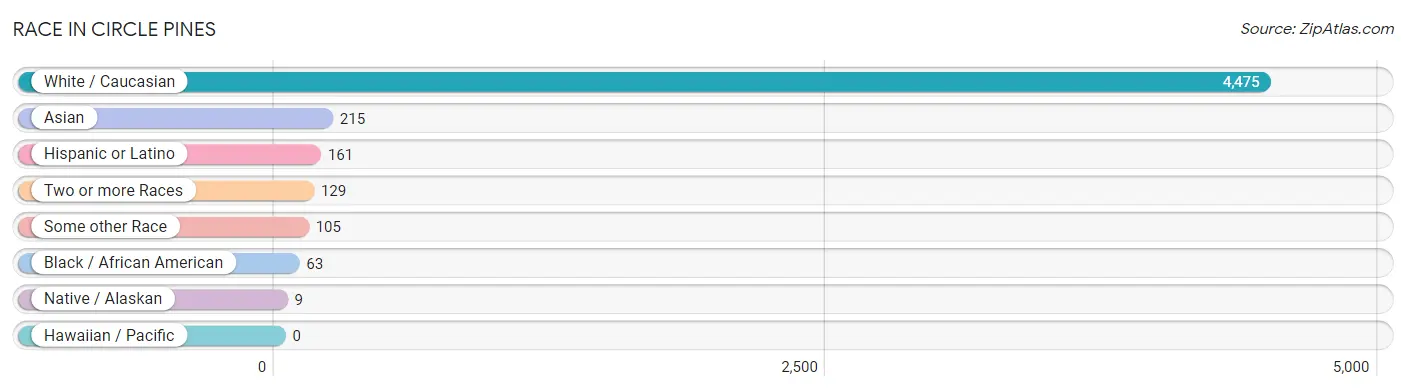
| Race | # Population | % Population |
| Asian | 215 | 4.3% |
| Black / African American | 63 | 1.3% |
| Hawaiian / Pacific | 0 | 0.0% |
| Hispanic or Latino | 161 | 3.2% |
| Native / Alaskan | 9 | 0.2% |
| White / Caucasian | 4,475 | 89.6% |
| Two or more Races | 129 | 2.6% |
| Some other Race | 105 | 2.1% |
| Total | 4,996 | 100.0% |
Ancestry in Circle Pines
The most populous ancestries reported in Circle Pines are German (1,309 | 26.2%), Irish (598 | 12.0%), Norwegian (504 | 10.1%), Swedish (364 | 7.3%), and Polish (258 | 5.2%), together accounting for 60.7% of all Circle Pines residents.
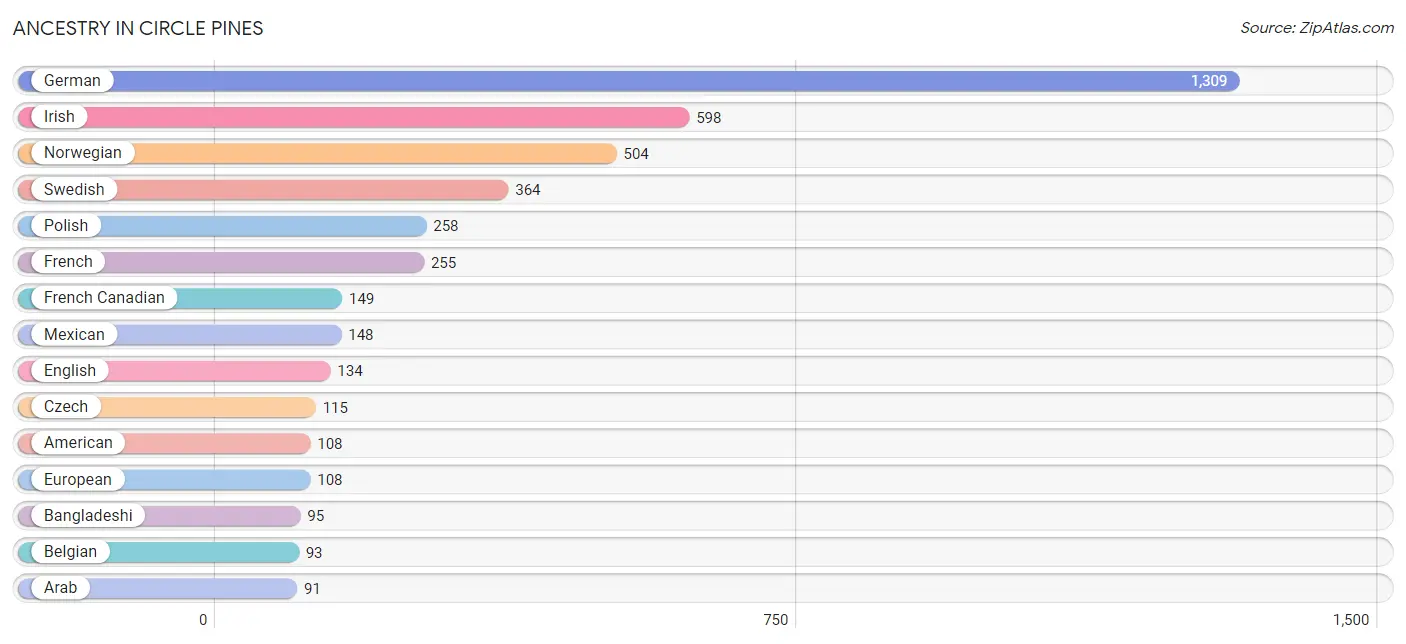
| Ancestry | # Population | % Population |
| American | 108 | 2.2% |
| Arab | 91 | 1.8% |
| Bangladeshi | 95 | 1.9% |
| Belgian | 93 | 1.9% |
| British | 47 | 0.9% |
| Central American | 13 | 0.3% |
| Chippewa | 9 | 0.2% |
| Czech | 115 | 2.3% |
| Czechoslovakian | 37 | 0.7% |
| Danish | 78 | 1.6% |
| Dutch | 26 | 0.5% |
| English | 134 | 2.7% |
| Ethiopian | 9 | 0.2% |
| European | 108 | 2.2% |
| Finnish | 80 | 1.6% |
| French | 255 | 5.1% |
| French Canadian | 149 | 3.0% |
| German | 1,309 | 26.2% |
| Hungarian | 8 | 0.2% |
| Indian (Asian) | 77 | 1.5% |
| Irish | 598 | 12.0% |
| Italian | 77 | 1.5% |
| Japanese | 51 | 1.0% |
| Korean | 1 | 0.0% |
| Lumbee | 31 | 0.6% |
| Mexican | 148 | 3.0% |
| Norwegian | 504 | 10.1% |
| Polish | 258 | 5.2% |
| Salvadoran | 13 | 0.3% |
| Scandinavian | 21 | 0.4% |
| Scottish | 90 | 1.8% |
| Serbian | 8 | 0.2% |
| Slovene | 44 | 0.9% |
| Subsaharan African | 17 | 0.3% |
| Swedish | 364 | 7.3% |
| Swiss | 14 | 0.3% |
| Ukrainian | 12 | 0.2% | View All 37 Rows |
Immigrants in Circle Pines
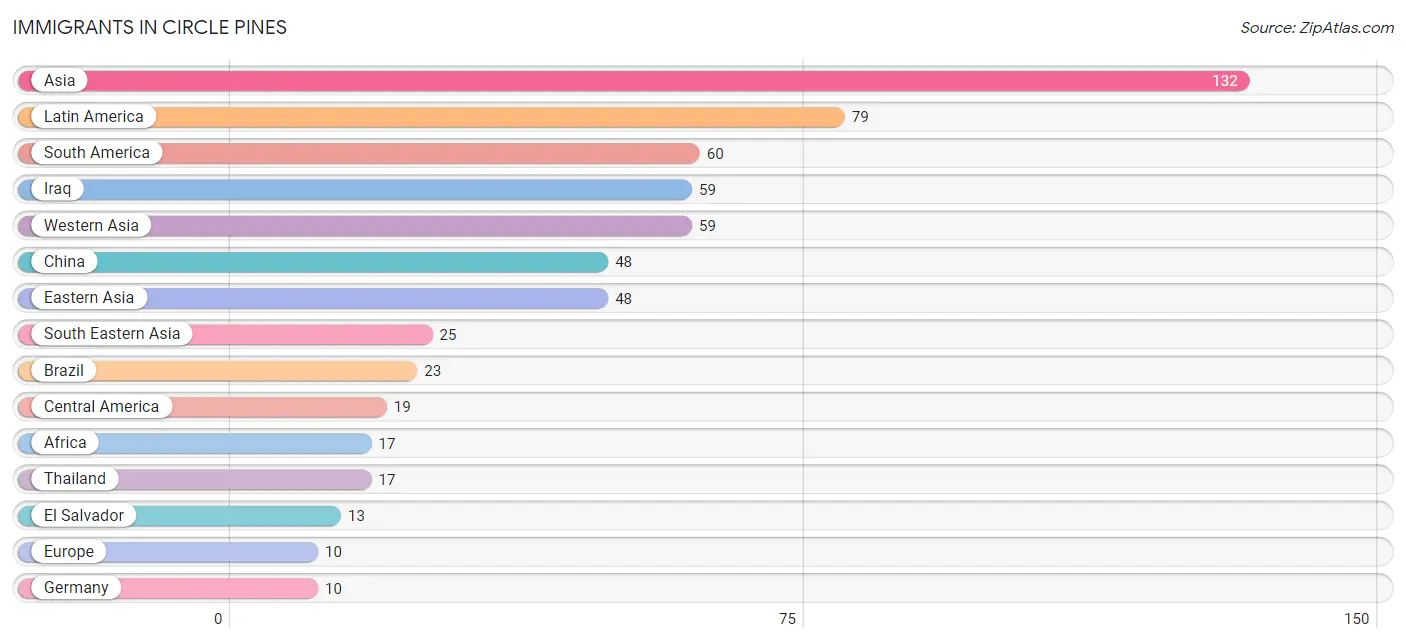
The most numerous immigrant groups reported in Circle Pines came from Asia (132 | 2.6%), Latin America (79 | 1.6%), South America (60 | 1.2%), Iraq (59 | 1.2%), and Western Asia (59 | 1.2%), together accounting for 7.8% of all Circle Pines residents.
| Immigration Origin | # Population | % Population |
| Africa | 17 | 0.3% |
| Asia | 132 | 2.6% |
| Brazil | 23 | 0.5% |
| Central America | 19 | 0.4% |
| China | 48 | 1.0% |
| Eastern Africa | 9 | 0.2% |
| Eastern Asia | 48 | 1.0% |
| El Salvador | 13 | 0.3% |
| Ethiopia | 9 | 0.2% |
| Europe | 10 | 0.2% |
| Germany | 10 | 0.2% |
| Iraq | 59 | 1.2% |
| Latin America | 79 | 1.6% |
| Malaysia | 8 | 0.2% |
| Mexico | 6 | 0.1% |
| South America | 60 | 1.2% |
| South Eastern Asia | 25 | 0.5% |
| Thailand | 17 | 0.3% |
| Western Africa | 8 | 0.2% |
| Western Asia | 59 | 1.2% |
| Western Europe | 10 | 0.2% | View All 21 Rows |
Sex and Age in Circle Pines
Sex and Age in Circle Pines
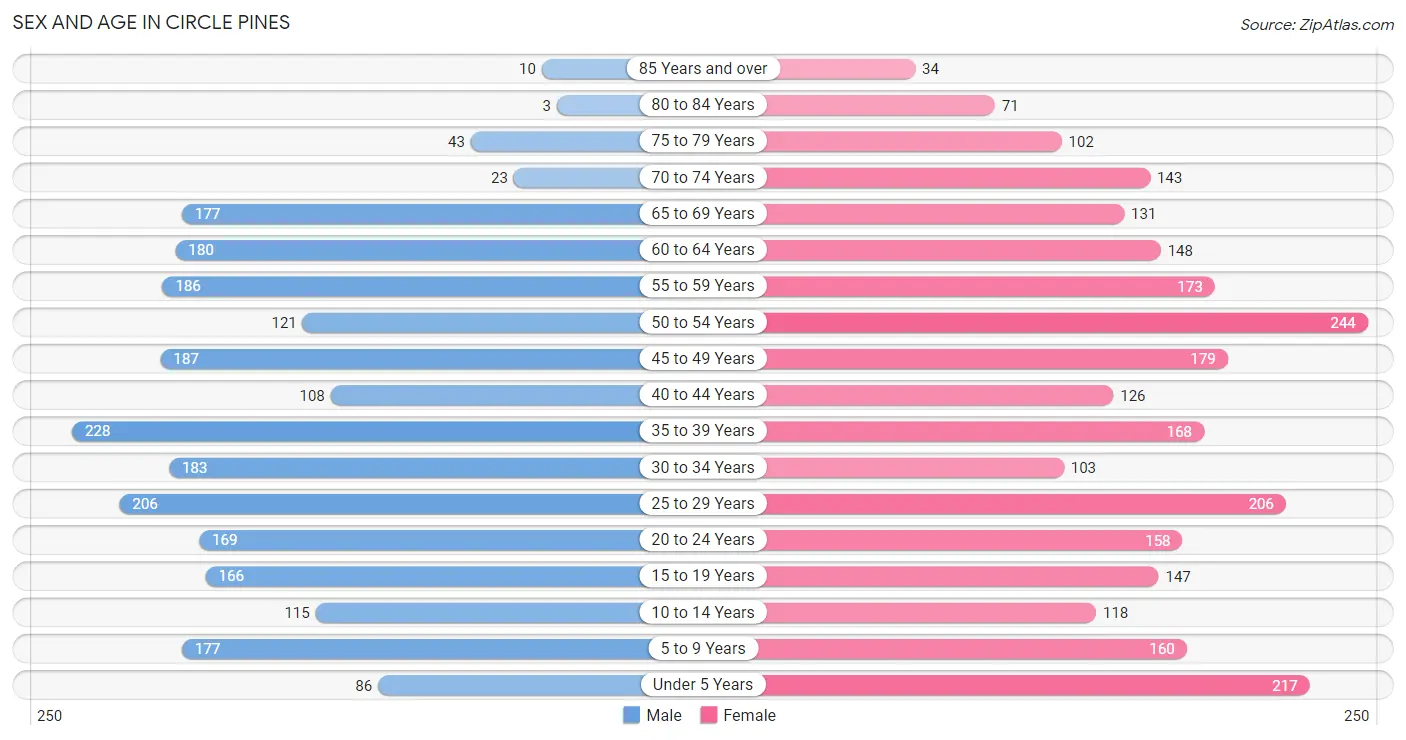
The most populous age groups in Circle Pines are 35 to 39 Years (228 | 9.6%) for men and 50 to 54 Years (244 | 9.3%) for women.
| Age Bracket | Male | Female |
| Under 5 Years | 86 (3.6%) | 217 (8.3%) |
| 5 to 9 Years | 177 (7.5%) | 160 (6.1%) |
| 10 to 14 Years | 115 (4.9%) | 118 (4.5%) |
| 15 to 19 Years | 166 (7.0%) | 147 (5.6%) |
| 20 to 24 Years | 169 (7.1%) | 158 (6.0%) |
| 25 to 29 Years | 206 (8.7%) | 206 (7.8%) |
| 30 to 34 Years | 183 (7.7%) | 103 (3.9%) |
| 35 to 39 Years | 228 (9.6%) | 168 (6.4%) |
| 40 to 44 Years | 108 (4.6%) | 126 (4.8%) |
| 45 to 49 Years | 187 (7.9%) | 179 (6.8%) |
| 50 to 54 Years | 121 (5.1%) | 244 (9.3%) |
| 55 to 59 Years | 186 (7.9%) | 173 (6.6%) |
| 60 to 64 Years | 180 (7.6%) | 148 (5.6%) |
| 65 to 69 Years | 177 (7.5%) | 131 (5.0%) |
| 70 to 74 Years | 23 (1.0%) | 143 (5.4%) |
| 75 to 79 Years | 43 (1.8%) | 102 (3.9%) |
| 80 to 84 Years | 3 (0.1%) | 71 (2.7%) |
| 85 Years and over | 10 (0.4%) | 34 (1.3%) |
| Total | 2,368 (100.0%) | 2,628 (100.0%) |
Families and Households in Circle Pines
Median Family Size in Circle Pines
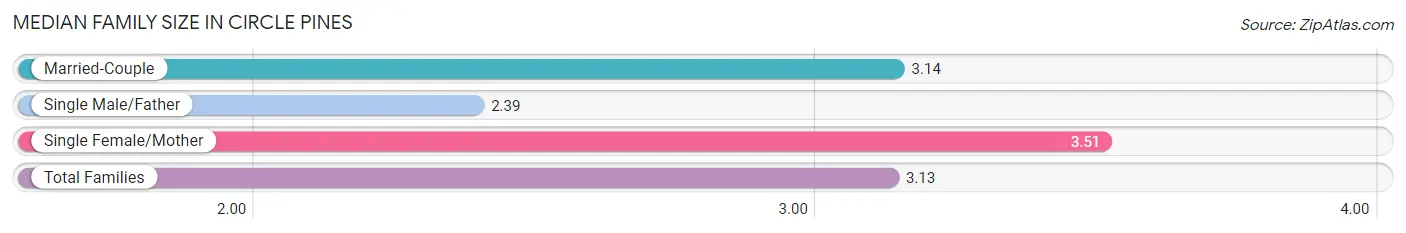
The median family size in Circle Pines is 3.13 persons per family, with single female/mother families (140 | 10.7%) accounting for the largest median family size of 3.51 persons per family. On the other hand, single male/father families (90 | 6.9%) represent the smallest median family size with 2.39 persons per family.
| Family Type | # Families | Family Size |
| Married-Couple | 1,073 (82.4%) | 3.14 |
| Single Male/Father | 90 (6.9%) | 2.39 |
| Single Female/Mother | 140 (10.7%) | 3.51 |
| Total Families | 1,303 (100.0%) | 3.13 |
Median Household Size in Circle Pines
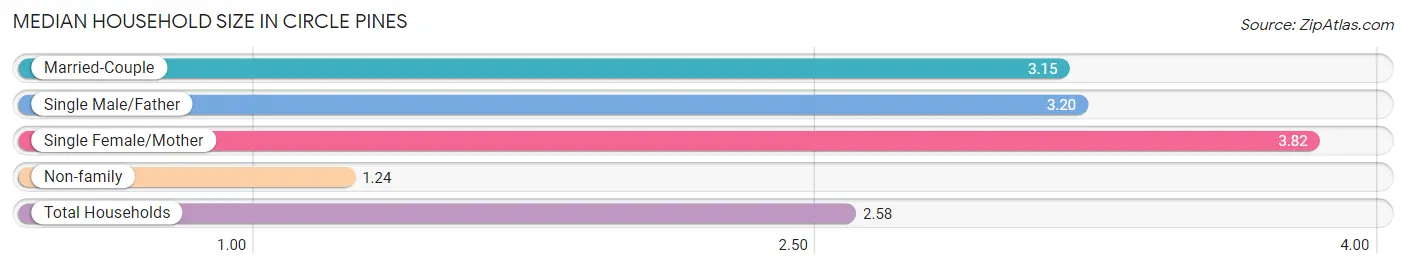
The median household size in Circle Pines is 2.58 persons per household, with single female/mother households (140 | 7.2%) accounting for the largest median household size of 3.82 persons per household. non-family households (635 | 32.8%) represent the smallest median household size with 1.24 persons per household.
| Household Type | # Households | Household Size |
| Married-Couple | 1,073 (55.4%) | 3.15 |
| Single Male/Father | 90 (4.6%) | 3.20 |
| Single Female/Mother | 140 (7.2%) | 3.82 |
| Non-family | 635 (32.8%) | 1.24 |
| Total Households | 1,938 (100.0%) | 2.58 |
Household Size by Marriage Status in Circle Pines
Out of a total of 1,938 households in Circle Pines, 1,303 (67.2%) are family households, while 635 (32.8%) are nonfamily households. The most numerous type of family households are 2-person households, comprising 588, and the most common type of nonfamily households are 1-person households, comprising 496.
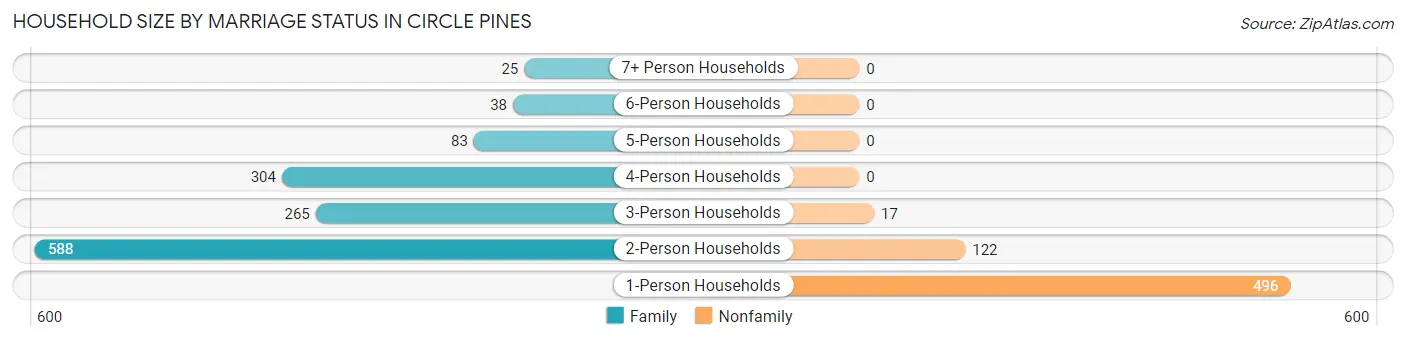
| Household Size | Family Households | Nonfamily Households |
| 1-Person Households | - | 496 (25.6%) |
| 2-Person Households | 588 (30.3%) | 122 (6.3%) |
| 3-Person Households | 265 (13.7%) | 17 (0.9%) |
| 4-Person Households | 304 (15.7%) | 0 (0.0%) |
| 5-Person Households | 83 (4.3%) | 0 (0.0%) |
| 6-Person Households | 38 (2.0%) | 0 (0.0%) |
| 7+ Person Households | 25 (1.3%) | 0 (0.0%) |
| Total | 1,303 (67.2%) | 635 (32.8%) |
Female Fertility in Circle Pines
Fertility by Age in Circle Pines
Average fertility rate in Circle Pines is 54.0 births per 1,000 women. Women in the age bracket of 35 to 50 years have the highest fertility rate with 74.0 births per 1,000 women. Women in the age bracket of 35 to 50 years acount for 59.3% of all women with births.
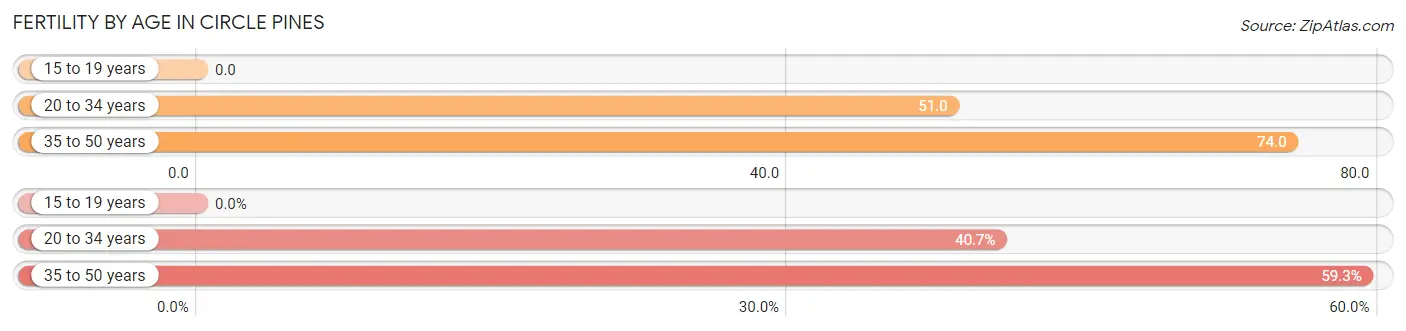
| Age Bracket | Women with Births | Births / 1,000 Women |
| 15 to 19 years | 0 (0.0%) | 0.0 |
| 20 to 34 years | 24 (40.7%) | 51.0 |
| 35 to 50 years | 35 (59.3%) | 74.0 |
| Total | 59 (100.0%) | 54.0 |
Fertility by Age by Marriage Status in Circle Pines
86.4% of women with births (59) in Circle Pines are married. The highest percentage of unmarried women with births falls into 20 to 34 years age bracket with 33.3% of them unmarried at the time of birth, while the lowest percentage of unmarried women with births belong to 35 to 50 years age bracket with 0.0% of them unmarried.
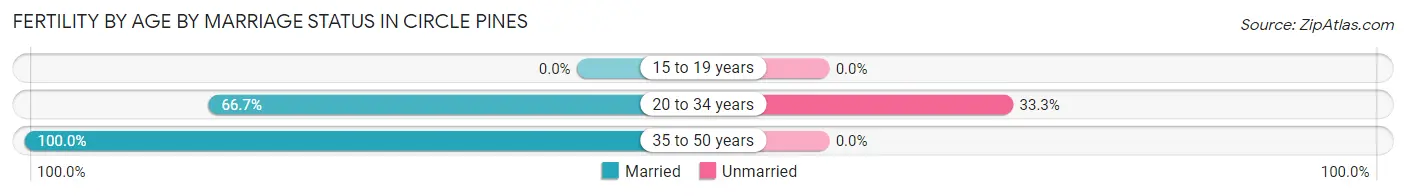
| Age Bracket | Married | Unmarried |
| 15 to 19 years | 0 (0.0%) | 0 (0.0%) |
| 20 to 34 years | 16 (66.7%) | 8 (33.3%) |
| 35 to 50 years | 35 (100.0%) | 0 (0.0%) |
| Total | 51 (86.4%) | 8 (13.6%) |
Fertility by Education in Circle Pines
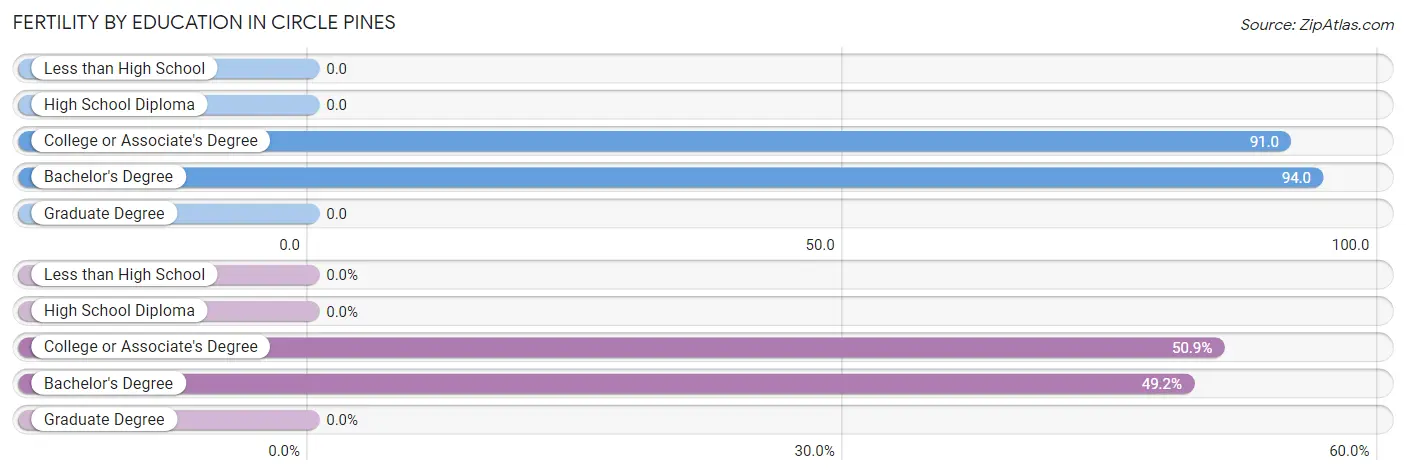
| Educational Attainment | Women with Births | Births / 1,000 Women |
| Less than High School | 0 (0.0%) | 0.0 |
| High School Diploma | 0 (0.0%) | 0.0 |
| College or Associate's Degree | 30 (50.8%) | 91.0 |
| Bachelor's Degree | 29 (49.1%) | 94.0 |
| Graduate Degree | 0 (0.0%) | 0.0 |
| Total | 59 (100.0%) | 54.0 |
Fertility by Education by Marriage Status in Circle Pines
13.6% of women with births in Circle Pines are unmarried. Women with the educational attainment of bachelor's degree are most likely to be married with 100.0% of them married at childbirth, while women with the educational attainment of college or associate's degree are least likely to be married with 26.7% of them unmarried at childbirth.
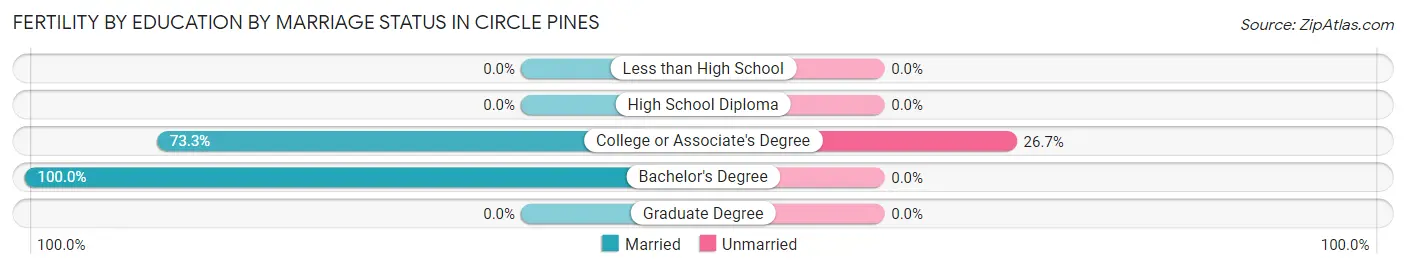
| Educational Attainment | Married | Unmarried |
| Less than High School | 0 (0.0%) | 0 (0.0%) |
| High School Diploma | 0 (0.0%) | 0 (0.0%) |
| College or Associate's Degree | 22 (73.3%) | 8 (26.7%) |
| Bachelor's Degree | 29 (100.0%) | 0 (0.0%) |
| Graduate Degree | 0 (0.0%) | 0 (0.0%) |
| Total | 51 (86.4%) | 8 (13.6%) |
Employment Characteristics in Circle Pines
Employment by Class of Employer in Circle Pines
Among the 2,895 employed individuals in Circle Pines, private company employees (2,083 | 72.0%), not-for-profit organizations (299 | 10.3%), and local government employees (178 | 6.1%) make up the most common classes of employment.

| Employer Class | # Employees | % Employees |
| Private Company Employees | 2,083 | 72.0% |
| Self-Employed (Incorporated) | 66 | 2.3% |
| Self-Employed (Not Incorporated) | 140 | 4.8% |
| Not-for-profit Organizations | 299 | 10.3% |
| Local Government Employees | 178 | 6.1% |
| State Government Employees | 77 | 2.7% |
| Federal Government Employees | 38 | 1.3% |
| Unpaid Family Workers | 14 | 0.5% |
| Total | 2,895 | 100.0% |
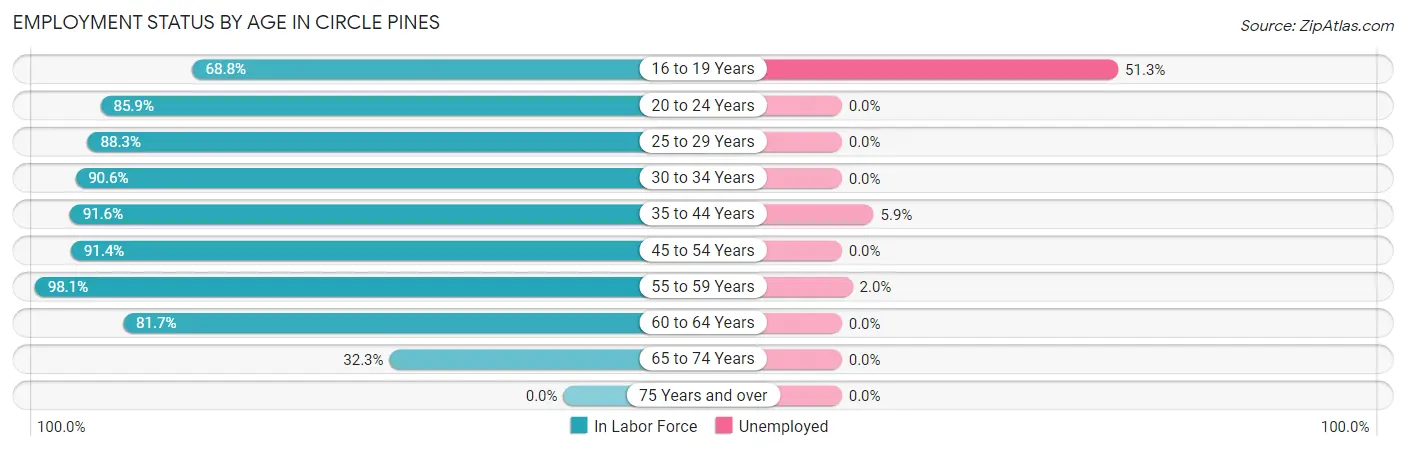
Employment Status by Age in Circle Pines
According to the labor force statistics for Circle Pines, out of the total population over 16 years of age (4,028), 76.3% or 3,073 individuals are in the labor force, with 3.8% or 117 of them unemployed. The age group with the highest labor force participation rate is 55 to 59 years, with 98.1% or 352 individuals in the labor force. Within the labor force, the 16 to 19 years age range has the highest percentage of unemployed individuals, with 51.3% or 77 of them being unemployed.
| Age Bracket | In Labor Force | Unemployed |
| 16 to 19 Years | 150 (68.8%) | 77 (51.3%) |
| 20 to 24 Years | 281 (85.9%) | 0 (0.0%) |
| 25 to 29 Years | 364 (88.3%) | 0 (0.0%) |
| 30 to 34 Years | 259 (90.6%) | 0 (0.0%) |
| 35 to 44 Years | 577 (91.6%) | 34 (5.9%) |
| 45 to 54 Years | 668 (91.4%) | 0 (0.0%) |
| 55 to 59 Years | 352 (98.1%) | 7 (2.0%) |
| 60 to 64 Years | 268 (81.7%) | 0 (0.0%) |
| 65 to 74 Years | 153 (32.3%) | 0 (0.0%) |
| 75 Years and over | 0 (0.0%) | 0 (0.0%) |
| Total | 3,073 (76.3%) | 117 (3.8%) |
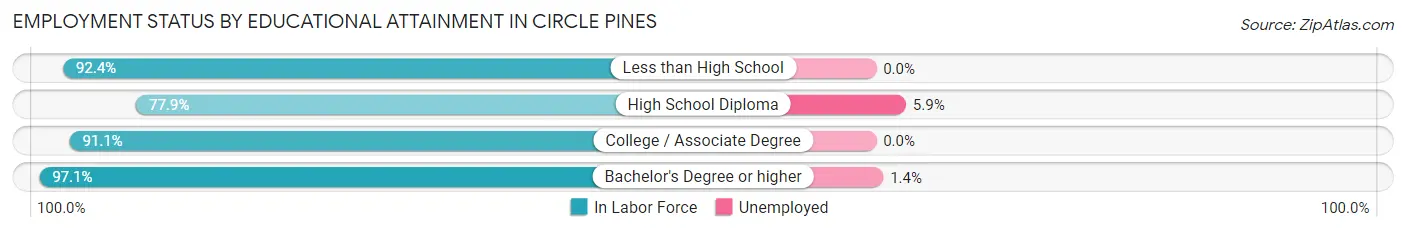
Employment Status by Educational Attainment in Circle Pines
According to labor force statistics for Circle Pines, 90.6% of individuals (2,488) out of the total population between 25 and 64 years of age (2,746) are in the labor force, with 1.6% or 40 of them being unemployed. The group with the highest labor force participation rate are those with the educational attainment of bachelor's degree or higher, with 97.1% or 1,015 individuals in the labor force. Within the labor force, individuals with high school diploma education have the highest percentage of unemployment, with 5.9% or 27 of them being unemployed.
| Educational Attainment | In Labor Force | Unemployed |
| Less than High School | 133 (92.4%) | 0 (0.0%) |
| High School Diploma | 461 (77.9%) | 35 (5.9%) |
| College / Associate Degree | 879 (91.1%) | 0 (0.0%) |
| Bachelor's Degree or higher | 1,015 (97.1%) | 15 (1.4%) |
| Total | 2,488 (90.6%) | 44 (1.6%) |
Employment Occupations by Sex in Circle Pines
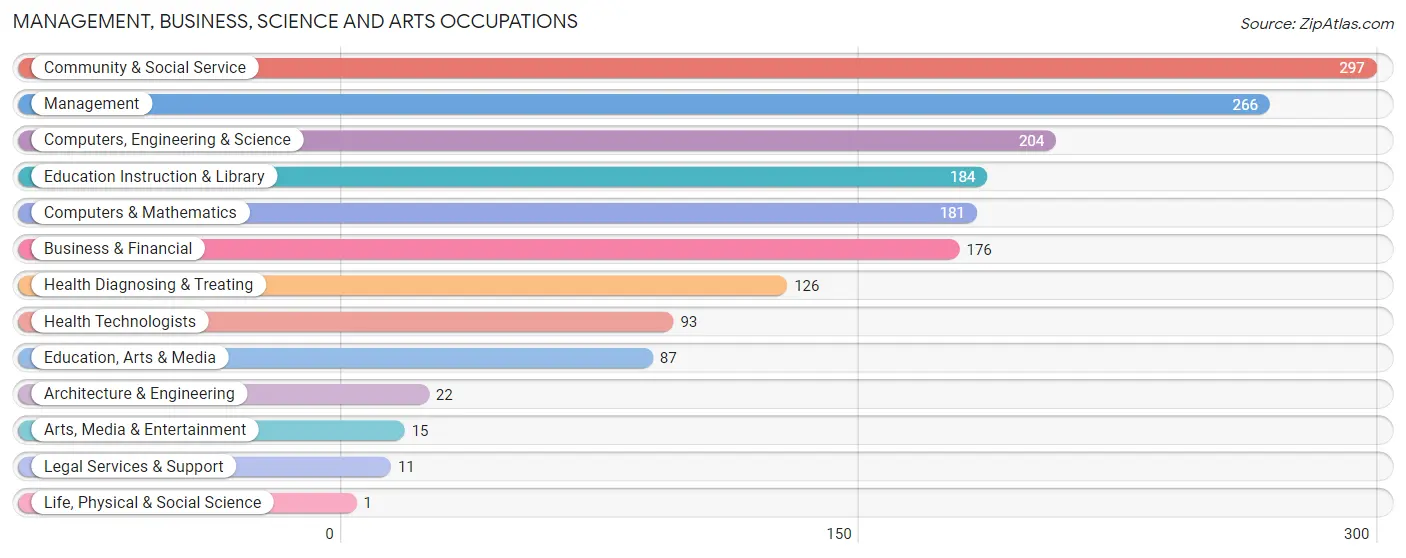
Management, Business, Science and Arts Occupations
The most common Management, Business, Science and Arts occupations in Circle Pines are Community & Social Service (297 | 10.1%), Management (266 | 9.0%), Computers, Engineering & Science (204 | 6.9%), Education Instruction & Library (184 | 6.2%), and Computers & Mathematics (181 | 6.1%).
Management, Business, Science and Arts Occupations by Sex
Within the Management, Business, Science and Arts occupations in Circle Pines, the most male-oriented occupations are Architecture & Engineering (100.0%), Management (58.7%), and Health Technologists (49.5%), while the most female-oriented occupations are Life, Physical & Social Science (100.0%), Legal Services & Support (100.0%), and Education, Arts & Media (90.8%).
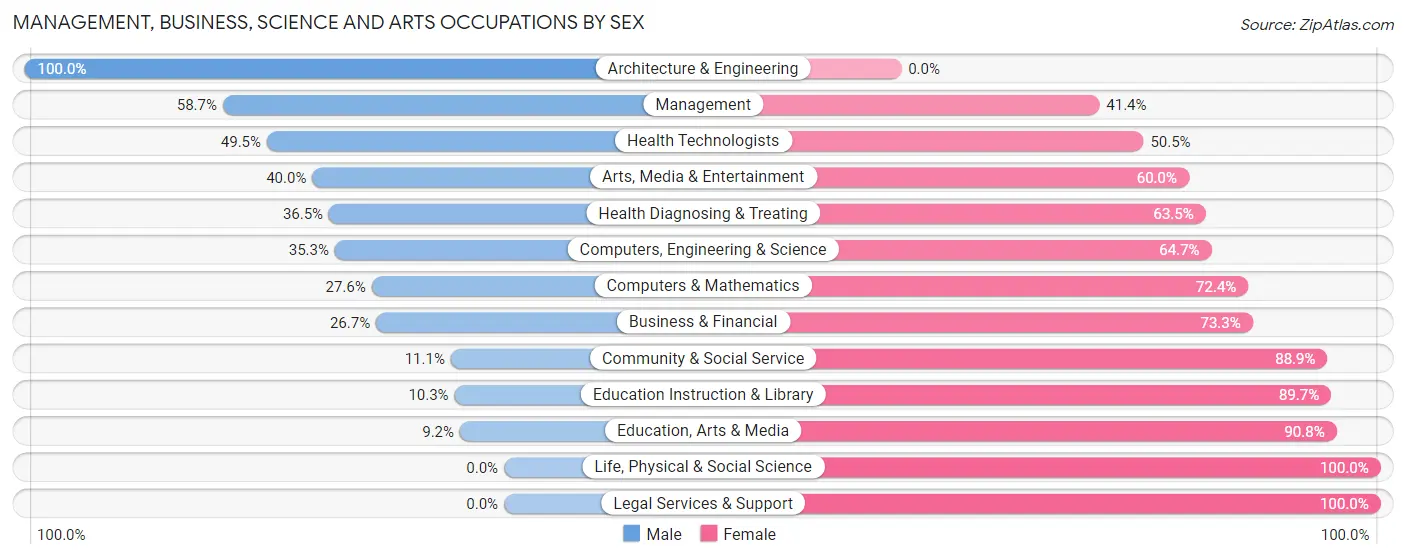
| Occupation | Male | Female |
| Management | 156 (58.7%) | 110 (41.3%) |
| Business & Financial | 47 (26.7%) | 129 (73.3%) |
| Computers, Engineering & Science | 72 (35.3%) | 132 (64.7%) |
| Computers & Mathematics | 50 (27.6%) | 131 (72.4%) |
| Architecture & Engineering | 22 (100.0%) | 0 (0.0%) |
| Life, Physical & Social Science | 0 (0.0%) | 1 (100.0%) |
| Community & Social Service | 33 (11.1%) | 264 (88.9%) |
| Education, Arts & Media | 8 (9.2%) | 79 (90.8%) |
| Legal Services & Support | 0 (0.0%) | 11 (100.0%) |
| Education Instruction & Library | 19 (10.3%) | 165 (89.7%) |
| Arts, Media & Entertainment | 6 (40.0%) | 9 (60.0%) |
| Health Diagnosing & Treating | 46 (36.5%) | 80 (63.5%) |
| Health Technologists | 46 (49.5%) | 47 (50.5%) |
| Total (Category) | 354 (33.1%) | 715 (66.9%) |
| Total (Overall) | 1,564 (52.9%) | 1,390 (47.0%) |
Services Occupations
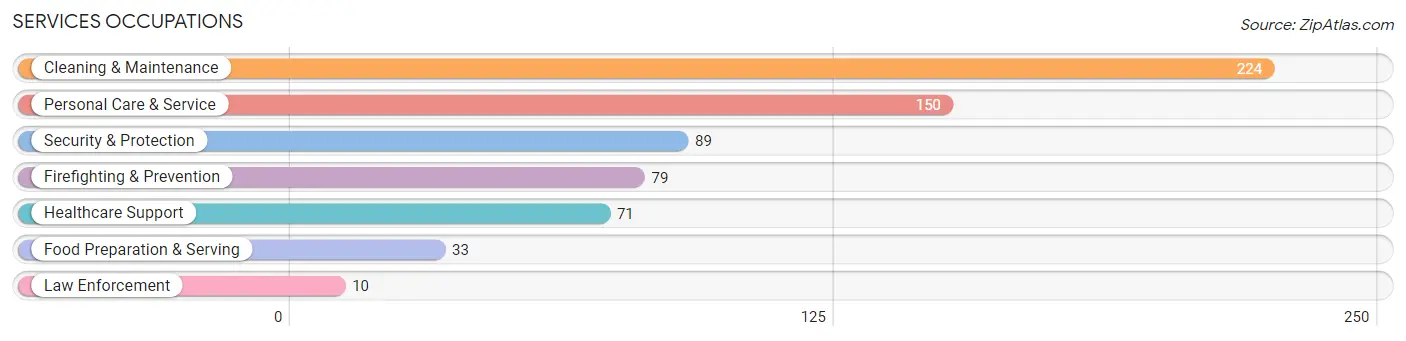
The most common Services occupations in Circle Pines are Cleaning & Maintenance (224 | 7.6%), Personal Care & Service (150 | 5.1%), Security & Protection (89 | 3.0%), Firefighting & Prevention (79 | 2.7%), and Healthcare Support (71 | 2.4%).
Services Occupations by Sex
Within the Services occupations in Circle Pines, the most male-oriented occupations are Security & Protection (100.0%), Firefighting & Prevention (100.0%), and Law Enforcement (100.0%), while the most female-oriented occupations are Healthcare Support (100.0%), Personal Care & Service (86.7%), and Food Preparation & Serving (72.7%).
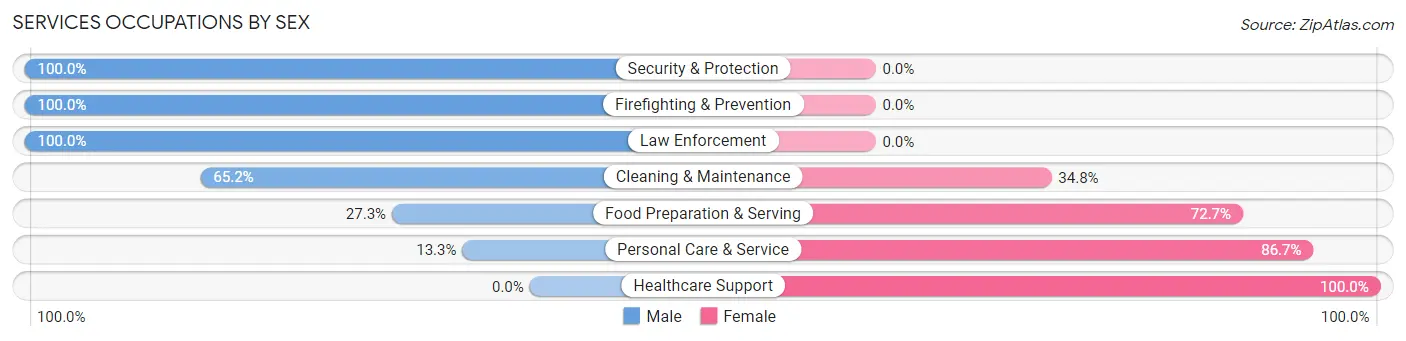
| Occupation | Male | Female |
| Healthcare Support | 0 (0.0%) | 71 (100.0%) |
| Security & Protection | 89 (100.0%) | 0 (0.0%) |
| Firefighting & Prevention | 79 (100.0%) | 0 (0.0%) |
| Law Enforcement | 10 (100.0%) | 0 (0.0%) |
| Food Preparation & Serving | 9 (27.3%) | 24 (72.7%) |
| Cleaning & Maintenance | 146 (65.2%) | 78 (34.8%) |
| Personal Care & Service | 20 (13.3%) | 130 (86.7%) |
| Total (Category) | 264 (46.6%) | 303 (53.4%) |
| Total (Overall) | 1,564 (52.9%) | 1,390 (47.0%) |
Sales and Office Occupations
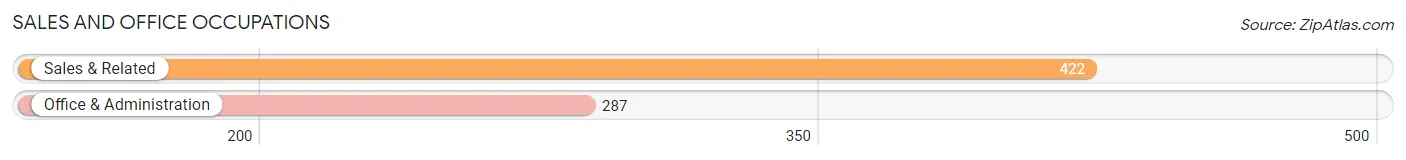
The most common Sales and Office occupations in Circle Pines are Sales & Related (422 | 14.3%), and Office & Administration (287 | 9.7%).
Sales and Office Occupations by Sex
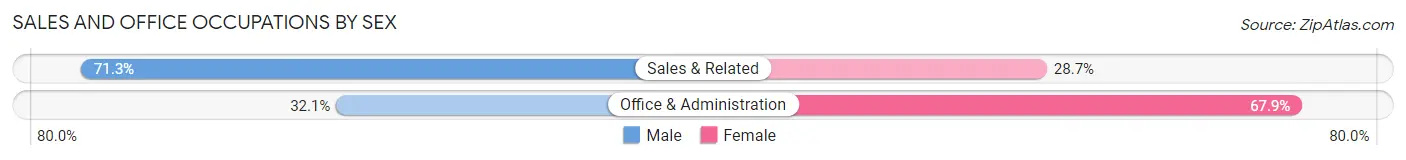
| Occupation | Male | Female |
| Sales & Related | 301 (71.3%) | 121 (28.7%) |
| Office & Administration | 92 (32.1%) | 195 (67.9%) |
| Total (Category) | 393 (55.4%) | 316 (44.6%) |
| Total (Overall) | 1,564 (52.9%) | 1,390 (47.0%) |
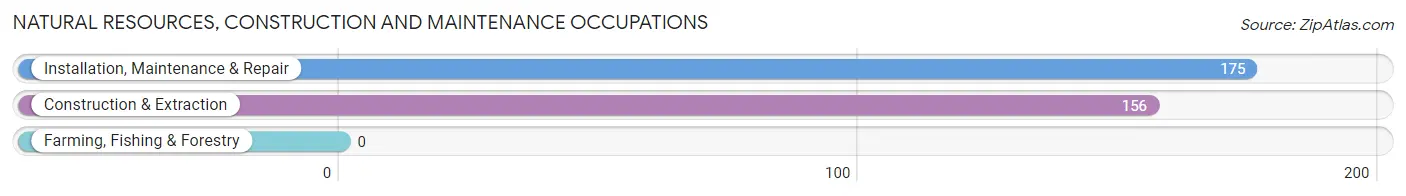
Natural Resources, Construction and Maintenance Occupations
The most common Natural Resources, Construction and Maintenance occupations in Circle Pines are Installation, Maintenance & Repair (175 | 5.9%), and Construction & Extraction (156 | 5.3%).
Natural Resources, Construction and Maintenance Occupations by Sex
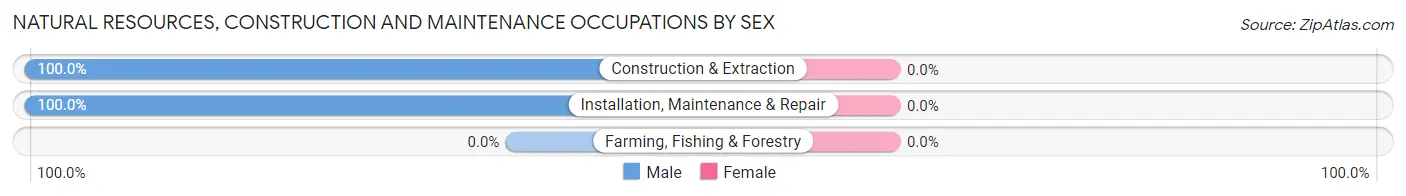
| Occupation | Male | Female |
| Farming, Fishing & Forestry | 0 (0.0%) | 0 (0.0%) |
| Construction & Extraction | 156 (100.0%) | 0 (0.0%) |
| Installation, Maintenance & Repair | 175 (100.0%) | 0 (0.0%) |
| Total (Category) | 331 (100.0%) | 0 (0.0%) |
| Total (Overall) | 1,564 (52.9%) | 1,390 (47.0%) |
Production, Transportation and Moving Occupations
The most common Production, Transportation and Moving occupations in Circle Pines are Production (113 | 3.8%), Material Moving (104 | 3.5%), and Transportation (61 | 2.1%).
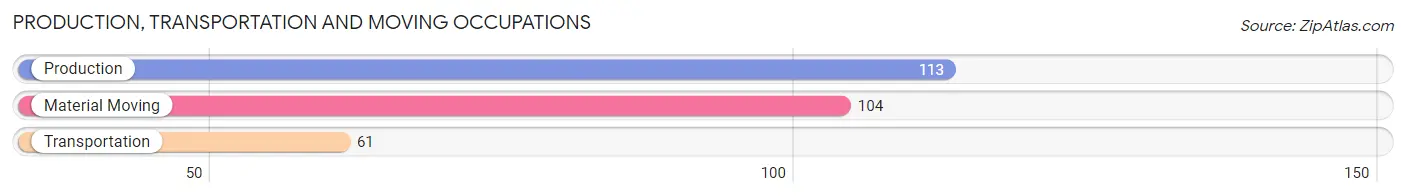
Production, Transportation and Moving Occupations by Sex
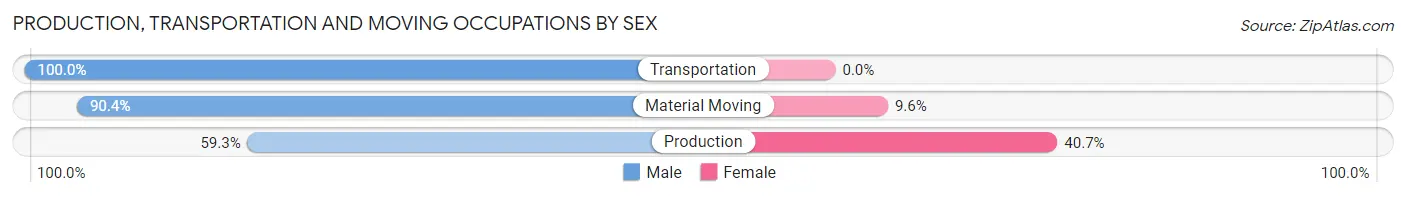
| Occupation | Male | Female |
| Production | 67 (59.3%) | 46 (40.7%) |
| Transportation | 61 (100.0%) | 0 (0.0%) |
| Material Moving | 94 (90.4%) | 10 (9.6%) |
| Total (Category) | 222 (79.9%) | 56 (20.1%) |
| Total (Overall) | 1,564 (52.9%) | 1,390 (47.0%) |
Employment Industries by Sex in Circle Pines
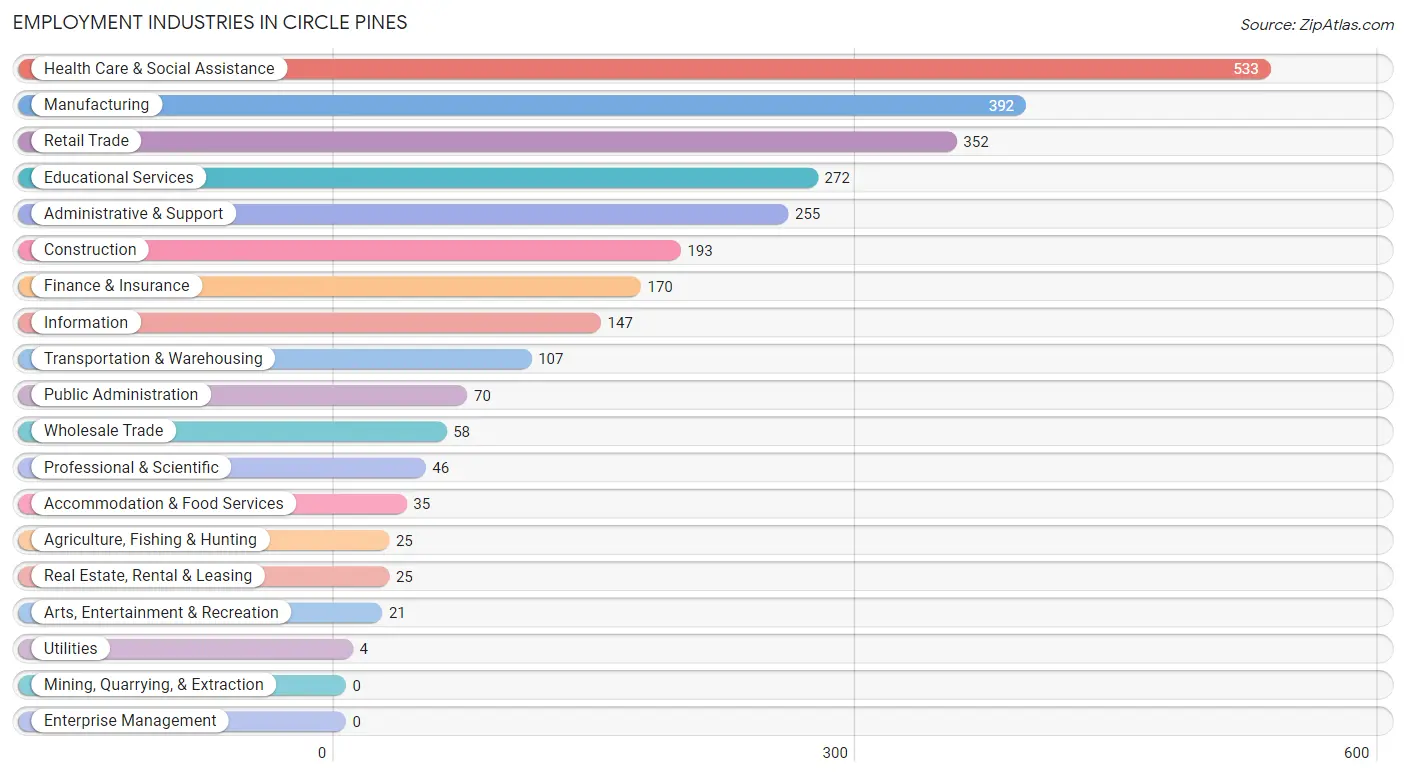
Employment Industries in Circle Pines
The major employment industries in Circle Pines include Health Care & Social Assistance (533 | 18.0%), Manufacturing (392 | 13.3%), Retail Trade (352 | 11.9%), Educational Services (272 | 9.2%), and Administrative & Support (255 | 8.6%).
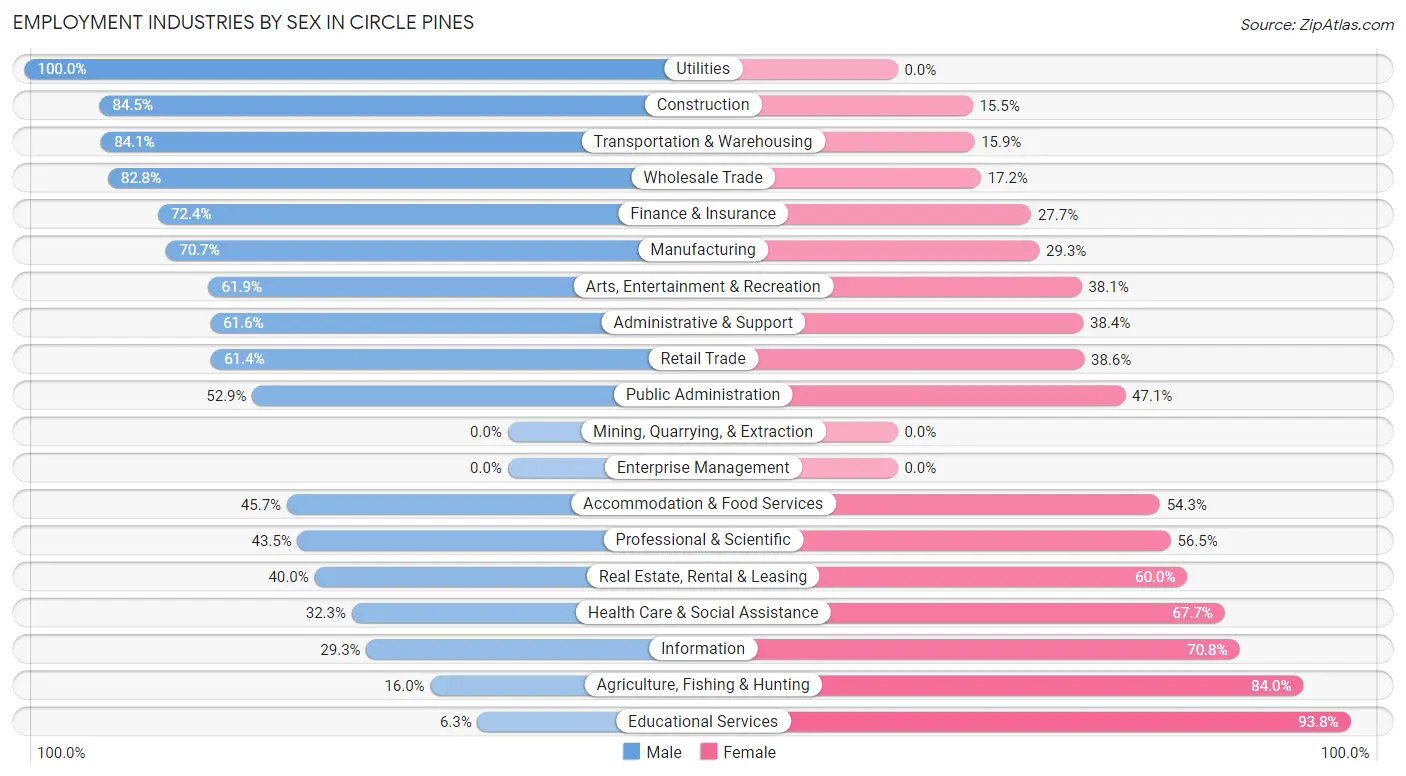
Employment Industries by Sex in Circle Pines
The Circle Pines industries that see more men than women are Utilities (100.0%), Construction (84.5%), and Transportation & Warehousing (84.1%), whereas the industries that tend to have a higher number of women are Educational Services (93.8%), Agriculture, Fishing & Hunting (84.0%), and Information (70.8%).
| Industry | Male | Female |
| Agriculture, Fishing & Hunting | 4 (16.0%) | 21 (84.0%) |
| Mining, Quarrying, & Extraction | 0 (0.0%) | 0 (0.0%) |
| Construction | 163 (84.5%) | 30 (15.5%) |
| Manufacturing | 277 (70.7%) | 115 (29.3%) |
| Wholesale Trade | 48 (82.8%) | 10 (17.2%) |
| Retail Trade | 216 (61.4%) | 136 (38.6%) |
| Transportation & Warehousing | 90 (84.1%) | 17 (15.9%) |
| Utilities | 4 (100.0%) | 0 (0.0%) |
| Information | 43 (29.2%) | 104 (70.8%) |
| Finance & Insurance | 123 (72.4%) | 47 (27.7%) |
| Real Estate, Rental & Leasing | 10 (40.0%) | 15 (60.0%) |
| Professional & Scientific | 20 (43.5%) | 26 (56.5%) |
| Enterprise Management | 0 (0.0%) | 0 (0.0%) |
| Administrative & Support | 157 (61.6%) | 98 (38.4%) |
| Educational Services | 17 (6.2%) | 255 (93.8%) |
| Health Care & Social Assistance | 172 (32.3%) | 361 (67.7%) |
| Arts, Entertainment & Recreation | 13 (61.9%) | 8 (38.1%) |
| Accommodation & Food Services | 16 (45.7%) | 19 (54.3%) |
| Public Administration | 37 (52.9%) | 33 (47.1%) |
| Total | 1,564 (52.9%) | 1,390 (47.0%) |
Education in Circle Pines
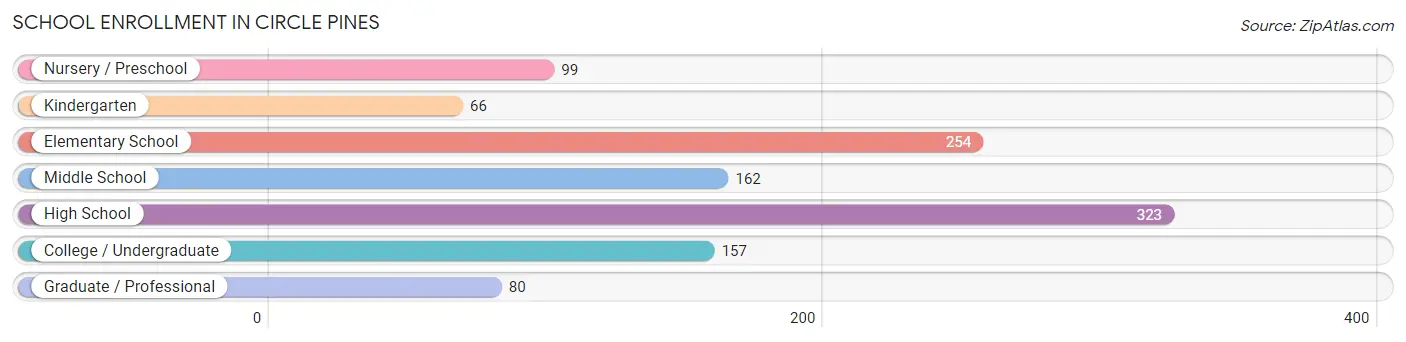
School Enrollment in Circle Pines
The most common levels of schooling among the 1,141 students in Circle Pines are high school (323 | 28.3%), elementary school (254 | 22.3%), and middle school (162 | 14.2%).
| School Level | # Students | % Students |
| Nursery / Preschool | 99 | 8.7% |
| Kindergarten | 66 | 5.8% |
| Elementary School | 254 | 22.3% |
| Middle School | 162 | 14.2% |
| High School | 323 | 28.3% |
| College / Undergraduate | 157 | 13.8% |
| Graduate / Professional | 80 | 7.0% |
| Total | 1,141 | 100.0% |
School Enrollment by Age by Funding Source in Circle Pines
Out of a total of 1,141 students who are enrolled in schools in Circle Pines, 105 (9.2%) attend a private institution, while the remaining 1,036 (90.8%) are enrolled in public schools. The age group of 25 to 34 year olds has the highest likelihood of being enrolled in private schools, with 37 (80.4% in the age bracket) enrolled. Conversely, the age group of 15 to 17 year olds has the lowest likelihood of being enrolled in a private school, with 261 (100.0% in the age bracket) attending a public institution.
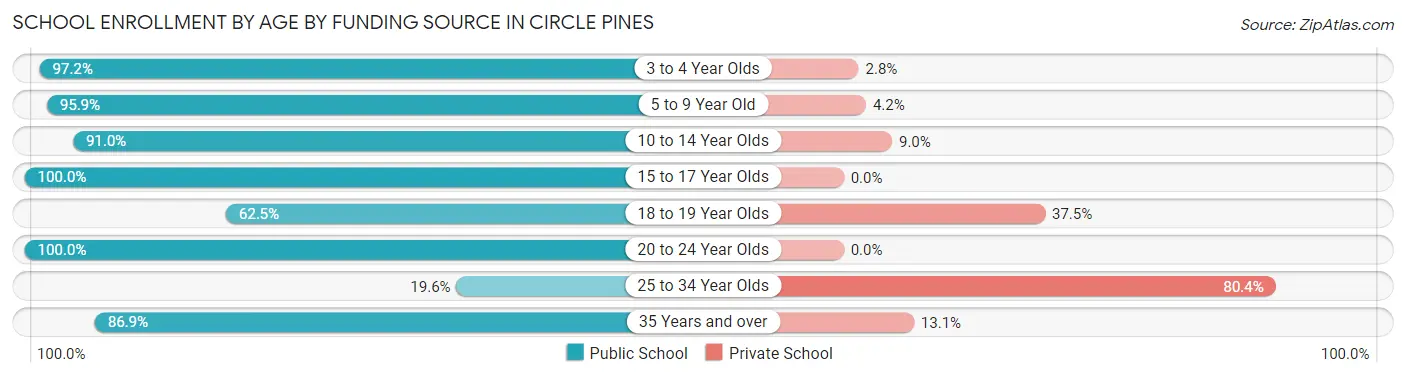
| Age Bracket | Public School | Private School |
| 3 to 4 Year Olds | 35 (97.2%) | 1 (2.8%) |
| 5 to 9 Year Old | 323 (95.9%) | 14 (4.2%) |
| 10 to 14 Year Olds | 212 (91.0%) | 21 (9.0%) |
| 15 to 17 Year Olds | 261 (100.0%) | 0 (0.0%) |
| 18 to 19 Year Olds | 25 (62.5%) | 15 (37.5%) |
| 20 to 24 Year Olds | 58 (100.0%) | 0 (0.0%) |
| 25 to 34 Year Olds | 9 (19.6%) | 37 (80.4%) |
| 35 Years and over | 113 (86.9%) | 17 (13.1%) |
| Total | 1,036 (90.8%) | 105 (9.2%) |
Educational Attainment by Field of Study in Circle Pines
Business (391 | 23.7%), arts & humanities (307 | 18.6%), education (161 | 9.8%), psychology (136 | 8.2%), and computers & mathematics (98 | 5.9%) are the most common fields of study among 1,650 individuals in Circle Pines who have obtained a bachelor's degree or higher.
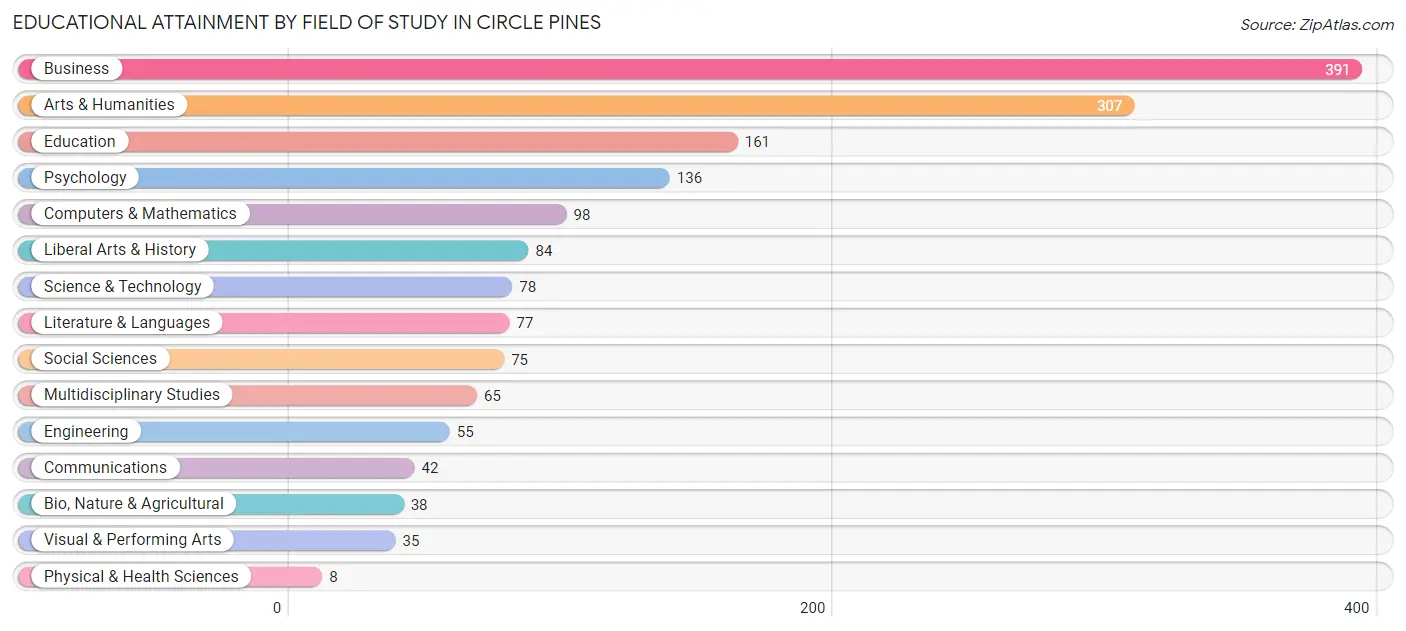
| Field of Study | # Graduates | % Graduates |
| Computers & Mathematics | 98 | 5.9% |
| Bio, Nature & Agricultural | 38 | 2.3% |
| Physical & Health Sciences | 8 | 0.5% |
| Psychology | 136 | 8.2% |
| Social Sciences | 75 | 4.5% |
| Engineering | 55 | 3.3% |
| Multidisciplinary Studies | 65 | 3.9% |
| Science & Technology | 78 | 4.7% |
| Business | 391 | 23.7% |
| Education | 161 | 9.8% |
| Literature & Languages | 77 | 4.7% |
| Liberal Arts & History | 84 | 5.1% |
| Visual & Performing Arts | 35 | 2.1% |
| Communications | 42 | 2.5% |
| Arts & Humanities | 307 | 18.6% |
| Total | 1,650 | 100.0% |
Transportation & Commute in Circle Pines
Vehicle Availability by Sex in Circle Pines
The most prevalent vehicle ownership categories in Circle Pines are males with 2 vehicles (554, accounting for 36.0%) and females with 2 vehicles (460, making up 40.8%).
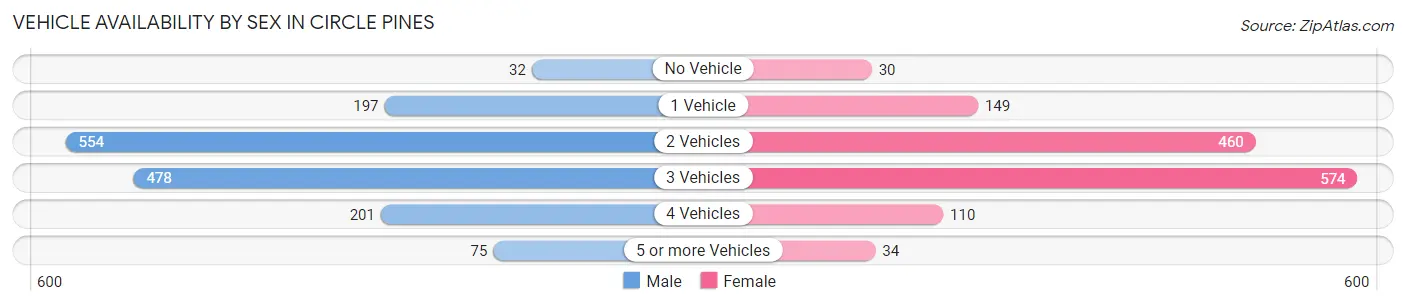
| Vehicles Available | Male | Female |
| No Vehicle | 32 (2.1%) | 30 (2.2%) |
| 1 Vehicle | 197 (12.8%) | 149 (11.0%) |
| 2 Vehicles | 554 (36.0%) | 460 (33.9%) |
| 3 Vehicles | 478 (31.1%) | 574 (42.3%) |
| 4 Vehicles | 201 (13.1%) | 110 (8.1%) |
| 5 or more Vehicles | 75 (4.9%) | 34 (2.5%) |
| Total | 1,537 (100.0%) | 1,357 (100.0%) |
Commute Time in Circle Pines
The most frequently occuring commute durations in Circle Pines are 20 to 24 minutes (659 commuters, 25.7%), 30 to 34 minutes (579 commuters, 22.6%), and 15 to 19 minutes (251 commuters, 9.8%).
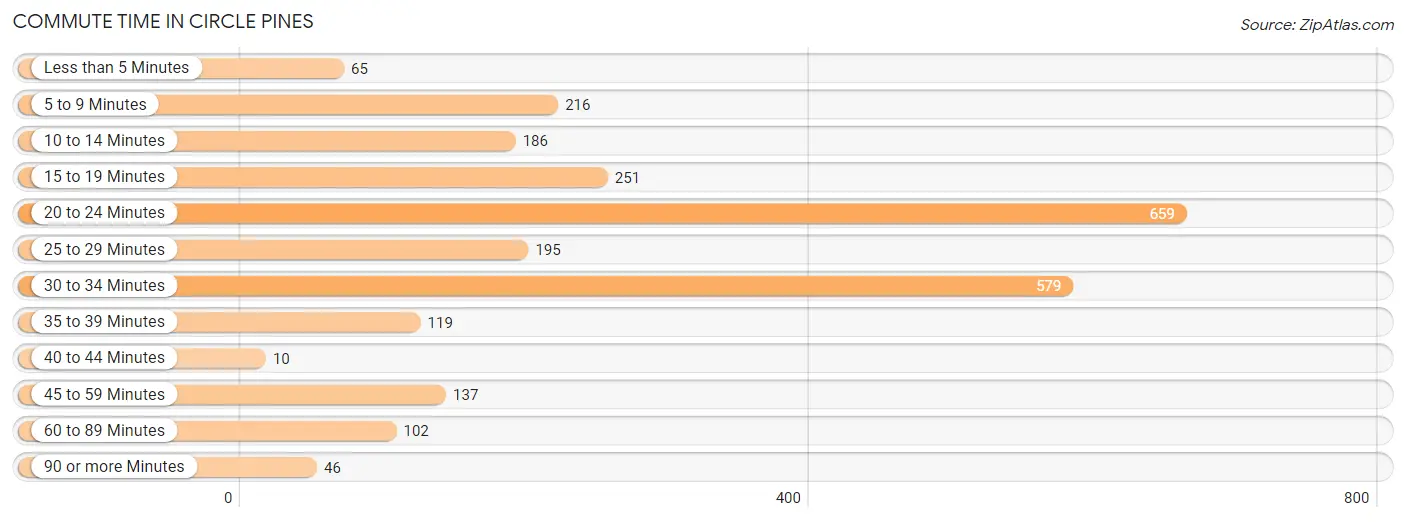
| Commute Time | # Commuters | % Commuters |
| Less than 5 Minutes | 65 | 2.5% |
| 5 to 9 Minutes | 216 | 8.4% |
| 10 to 14 Minutes | 186 | 7.2% |
| 15 to 19 Minutes | 251 | 9.8% |
| 20 to 24 Minutes | 659 | 25.7% |
| 25 to 29 Minutes | 195 | 7.6% |
| 30 to 34 Minutes | 579 | 22.6% |
| 35 to 39 Minutes | 119 | 4.6% |
| 40 to 44 Minutes | 10 | 0.4% |
| 45 to 59 Minutes | 137 | 5.3% |
| 60 to 89 Minutes | 102 | 4.0% |
| 90 or more Minutes | 46 | 1.8% |
Commute Time by Sex in Circle Pines
The most common commute times in Circle Pines are 20 to 24 minutes (391 commuters, 28.5%) for males and 30 to 34 minutes (271 commuters, 22.8%) for females.
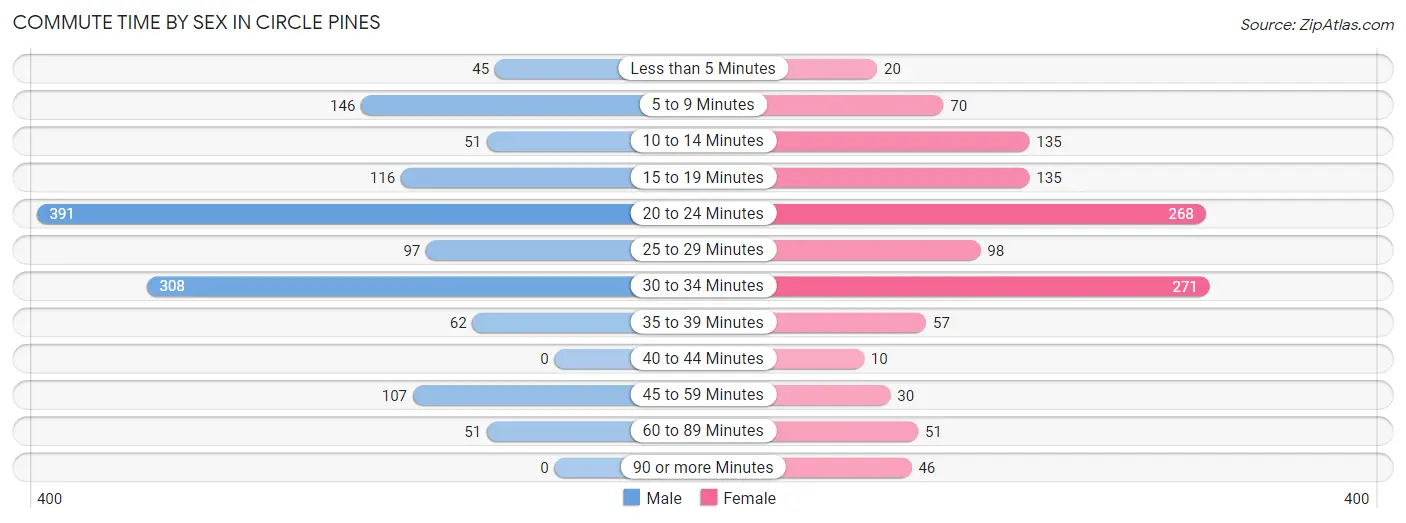
| Commute Time | Male | Female |
| Less than 5 Minutes | 45 (3.3%) | 20 (1.7%) |
| 5 to 9 Minutes | 146 (10.6%) | 70 (5.9%) |
| 10 to 14 Minutes | 51 (3.7%) | 135 (11.3%) |
| 15 to 19 Minutes | 116 (8.4%) | 135 (11.3%) |
| 20 to 24 Minutes | 391 (28.5%) | 268 (22.5%) |
| 25 to 29 Minutes | 97 (7.1%) | 98 (8.2%) |
| 30 to 34 Minutes | 308 (22.4%) | 271 (22.8%) |
| 35 to 39 Minutes | 62 (4.5%) | 57 (4.8%) |
| 40 to 44 Minutes | 0 (0.0%) | 10 (0.8%) |
| 45 to 59 Minutes | 107 (7.8%) | 30 (2.5%) |
| 60 to 89 Minutes | 51 (3.7%) | 51 (4.3%) |
| 90 or more Minutes | 0 (0.0%) | 46 (3.9%) |
Time of Departure to Work by Sex in Circle Pines
The most frequent times of departure to work in Circle Pines are 8:00 AM to 8:29 AM (178, 13.0%) for males and 8:00 AM to 8:29 AM (325, 27.3%) for females.
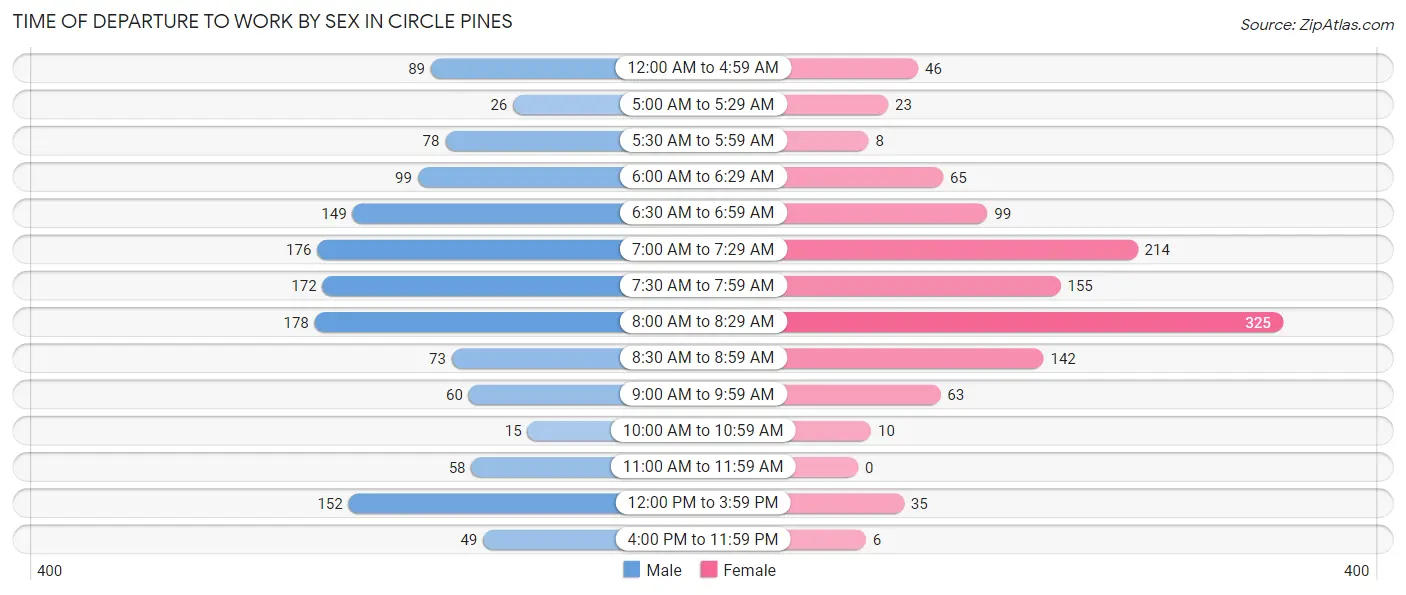
| Time of Departure | Male | Female |
| 12:00 AM to 4:59 AM | 89 (6.5%) | 46 (3.9%) |
| 5:00 AM to 5:29 AM | 26 (1.9%) | 23 (1.9%) |
| 5:30 AM to 5:59 AM | 78 (5.7%) | 8 (0.7%) |
| 6:00 AM to 6:29 AM | 99 (7.2%) | 65 (5.5%) |
| 6:30 AM to 6:59 AM | 149 (10.8%) | 99 (8.3%) |
| 7:00 AM to 7:29 AM | 176 (12.8%) | 214 (18.0%) |
| 7:30 AM to 7:59 AM | 172 (12.5%) | 155 (13.0%) |
| 8:00 AM to 8:29 AM | 178 (13.0%) | 325 (27.3%) |
| 8:30 AM to 8:59 AM | 73 (5.3%) | 142 (11.9%) |
| 9:00 AM to 9:59 AM | 60 (4.4%) | 63 (5.3%) |
| 10:00 AM to 10:59 AM | 15 (1.1%) | 10 (0.8%) |
| 11:00 AM to 11:59 AM | 58 (4.2%) | 0 (0.0%) |
| 12:00 PM to 3:59 PM | 152 (11.1%) | 35 (2.9%) |
| 4:00 PM to 11:59 PM | 49 (3.6%) | 6 (0.5%) |
| Total | 1,374 (100.0%) | 1,191 (100.0%) |
Housing Occupancy in Circle Pines
Occupancy by Ownership in Circle Pines
Of the total 1,938 dwellings in Circle Pines, owner-occupied units account for 1,534 (79.1%), while renter-occupied units make up 404 (20.8%).
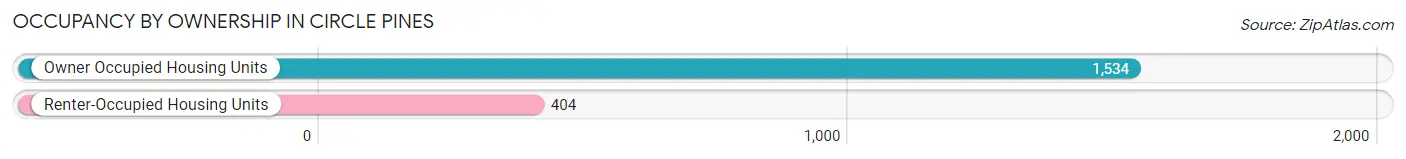
| Occupancy | # Housing Units | % Housing Units |
| Owner Occupied Housing Units | 1,534 | 79.1% |
| Renter-Occupied Housing Units | 404 | 20.8% |
| Total Occupied Housing Units | 1,938 | 100.0% |
Occupancy by Household Size in Circle Pines
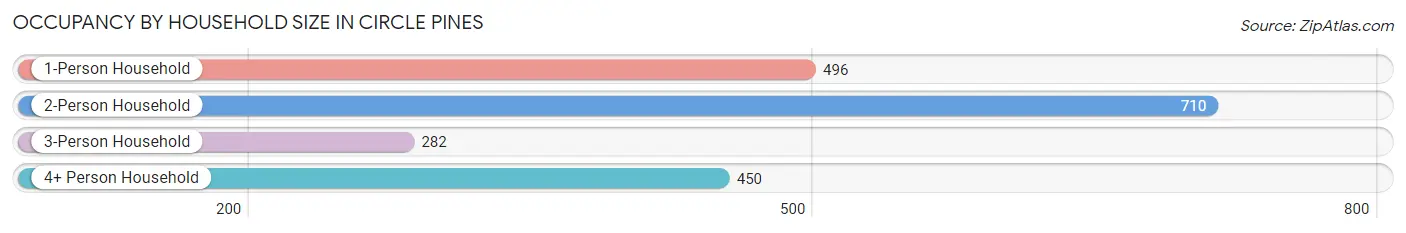
| Household Size | # Housing Units | % Housing Units |
| 1-Person Household | 496 | 25.6% |
| 2-Person Household | 710 | 36.6% |
| 3-Person Household | 282 | 14.5% |
| 4+ Person Household | 450 | 23.2% |
| Total Housing Units | 1,938 | 100.0% |
Occupancy by Ownership by Household Size in Circle Pines
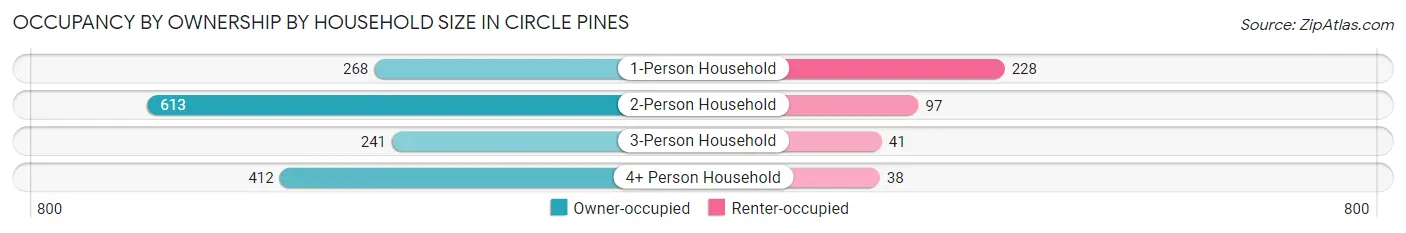
| Household Size | Owner-occupied | Renter-occupied |
| 1-Person Household | 268 (54.0%) | 228 (46.0%) |
| 2-Person Household | 613 (86.3%) | 97 (13.7%) |
| 3-Person Household | 241 (85.5%) | 41 (14.5%) |
| 4+ Person Household | 412 (91.6%) | 38 (8.4%) |
| Total Housing Units | 1,534 (79.1%) | 404 (20.8%) |
Occupancy by Educational Attainment in Circle Pines
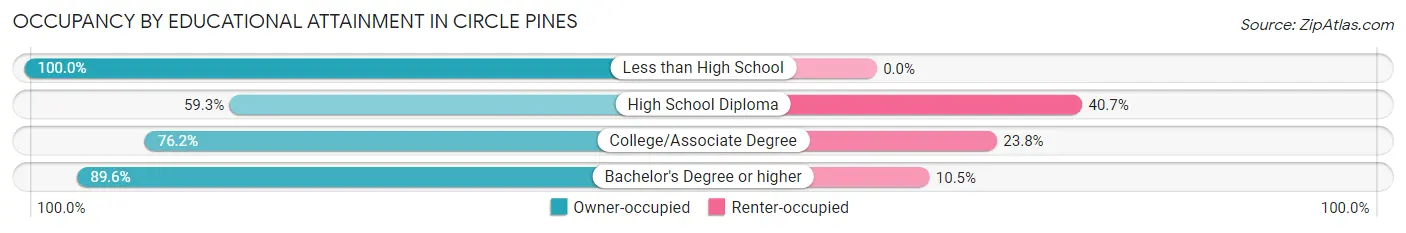
| Household Size | Owner-occupied | Renter-occupied |
| Less than High School | 26 (100.0%) | 0 (0.0%) |
| High School Diploma | 214 (59.3%) | 147 (40.7%) |
| College/Associate Degree | 540 (76.2%) | 169 (23.8%) |
| Bachelor's Degree or higher | 754 (89.5%) | 88 (10.4%) |
Occupancy by Age of Householder in Circle Pines
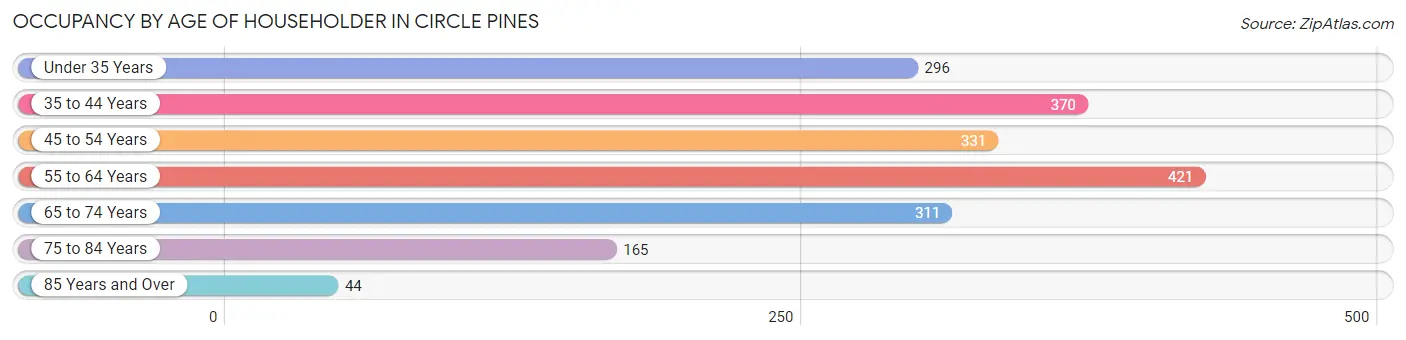
| Age Bracket | # Households | % Households |
| Under 35 Years | 296 | 15.3% |
| 35 to 44 Years | 370 | 19.1% |
| 45 to 54 Years | 331 | 17.1% |
| 55 to 64 Years | 421 | 21.7% |
| 65 to 74 Years | 311 | 16.1% |
| 75 to 84 Years | 165 | 8.5% |
| 85 Years and Over | 44 | 2.3% |
| Total | 1,938 | 100.0% |
Housing Finances in Circle Pines
Median Income by Occupancy in Circle Pines
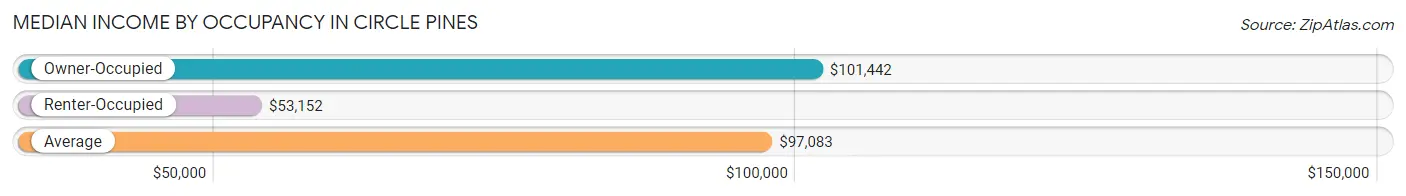
| Occupancy Type | # Households | Median Income |
| Owner-Occupied | 1,534 (79.1%) | $101,442 |
| Renter-Occupied | 404 (20.8%) | $53,152 |
| Average | 1,938 (100.0%) | $97,083 |
Occupancy by Householder Income Bracket in Circle Pines
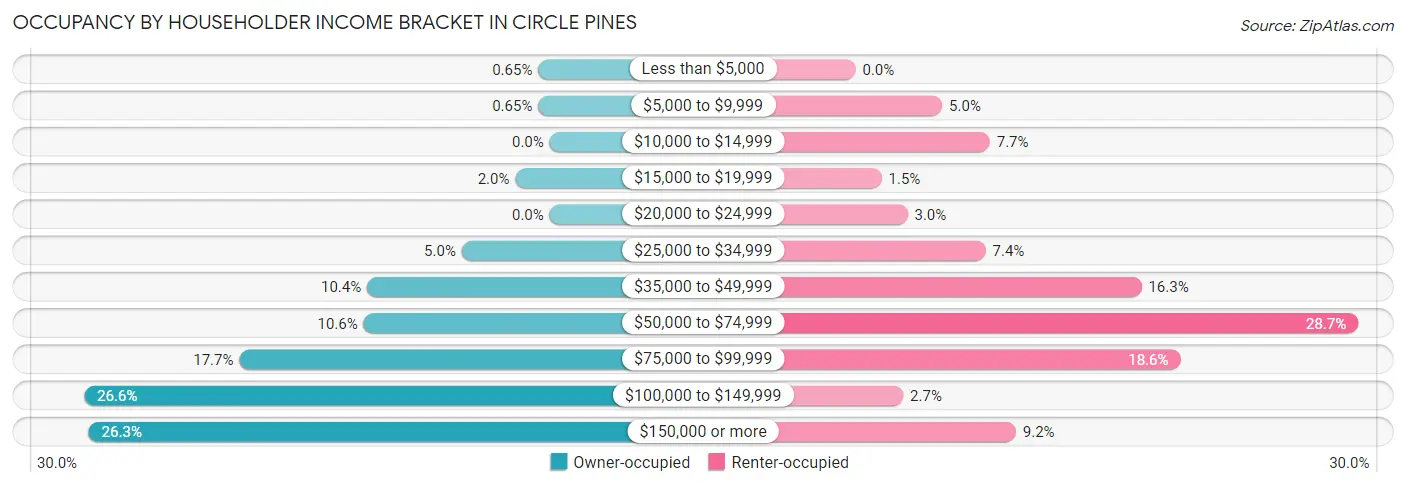
| Income Bracket | Owner-occupied | Renter-occupied |
| Less than $5,000 | 10 (0.6%) | 0 (0.0%) |
| $5,000 to $9,999 | 10 (0.6%) | 20 (5.0%) |
| $10,000 to $14,999 | 0 (0.0%) | 31 (7.7%) |
| $15,000 to $19,999 | 30 (2.0%) | 6 (1.5%) |
| $20,000 to $24,999 | 0 (0.0%) | 12 (3.0%) |
| $25,000 to $34,999 | 77 (5.0%) | 30 (7.4%) |
| $35,000 to $49,999 | 160 (10.4%) | 66 (16.3%) |
| $50,000 to $74,999 | 163 (10.6%) | 116 (28.7%) |
| $75,000 to $99,999 | 272 (17.7%) | 75 (18.6%) |
| $100,000 to $149,999 | 408 (26.6%) | 11 (2.7%) |
| $150,000 or more | 404 (26.3%) | 37 (9.2%) |
| Total | 1,534 (100.0%) | 404 (100.0%) |
Monthly Housing Cost Tiers in Circle Pines
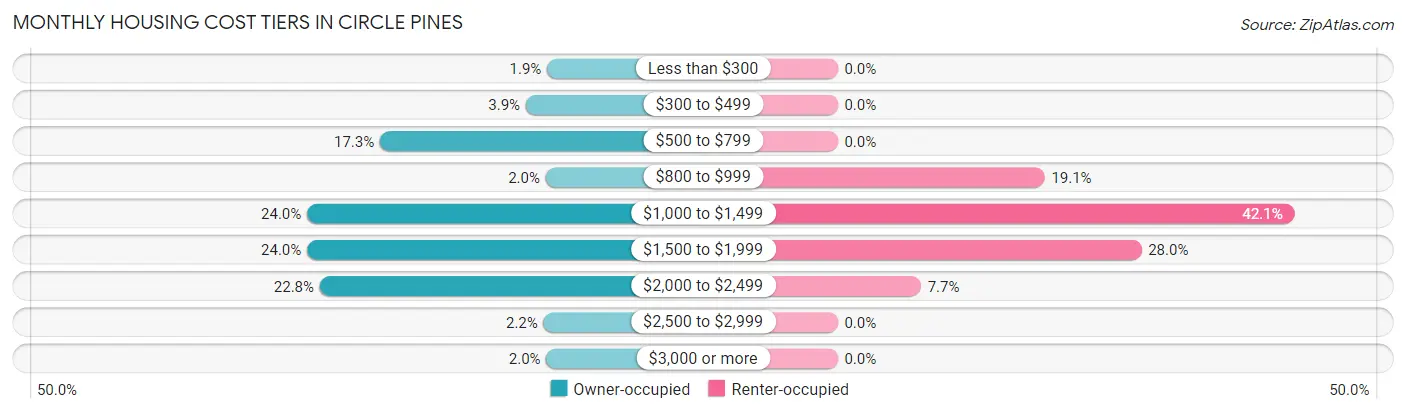
| Monthly Cost | Owner-occupied | Renter-occupied |
| Less than $300 | 29 (1.9%) | 0 (0.0%) |
| $300 to $499 | 59 (3.8%) | 0 (0.0%) |
| $500 to $799 | 265 (17.3%) | 0 (0.0%) |
| $800 to $999 | 31 (2.0%) | 77 (19.1%) |
| $1,000 to $1,499 | 368 (24.0%) | 170 (42.1%) |
| $1,500 to $1,999 | 368 (24.0%) | 113 (28.0%) |
| $2,000 to $2,499 | 350 (22.8%) | 31 (7.7%) |
| $2,500 to $2,999 | 34 (2.2%) | 0 (0.0%) |
| $3,000 or more | 30 (2.0%) | 0 (0.0%) |
| Total | 1,534 (100.0%) | 404 (100.0%) |
Physical Housing Characteristics in Circle Pines
Housing Structures in Circle Pines
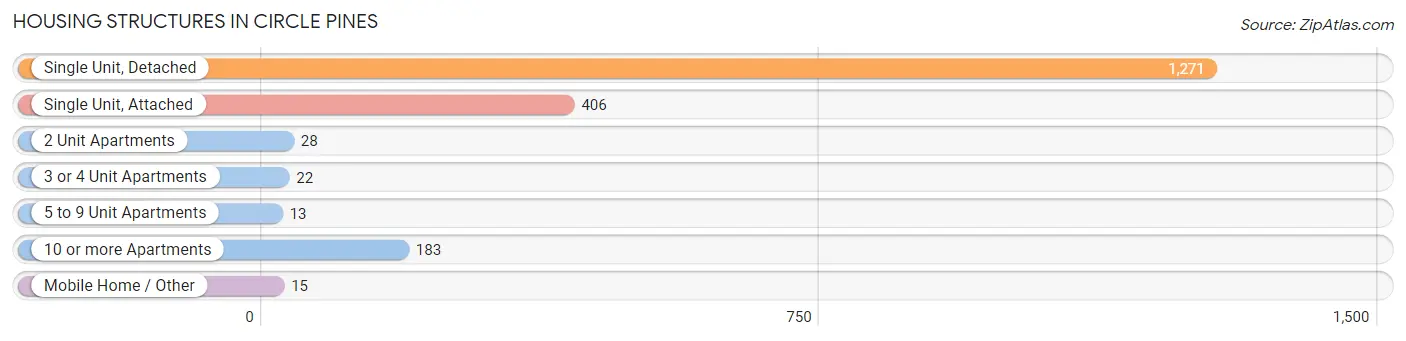
| Structure Type | # Housing Units | % Housing Units |
| Single Unit, Detached | 1,271 | 65.6% |
| Single Unit, Attached | 406 | 20.9% |
| 2 Unit Apartments | 28 | 1.4% |
| 3 or 4 Unit Apartments | 22 | 1.1% |
| 5 to 9 Unit Apartments | 13 | 0.7% |
| 10 or more Apartments | 183 | 9.4% |
| Mobile Home / Other | 15 | 0.8% |
| Total | 1,938 | 100.0% |
Housing Structures by Occupancy in Circle Pines
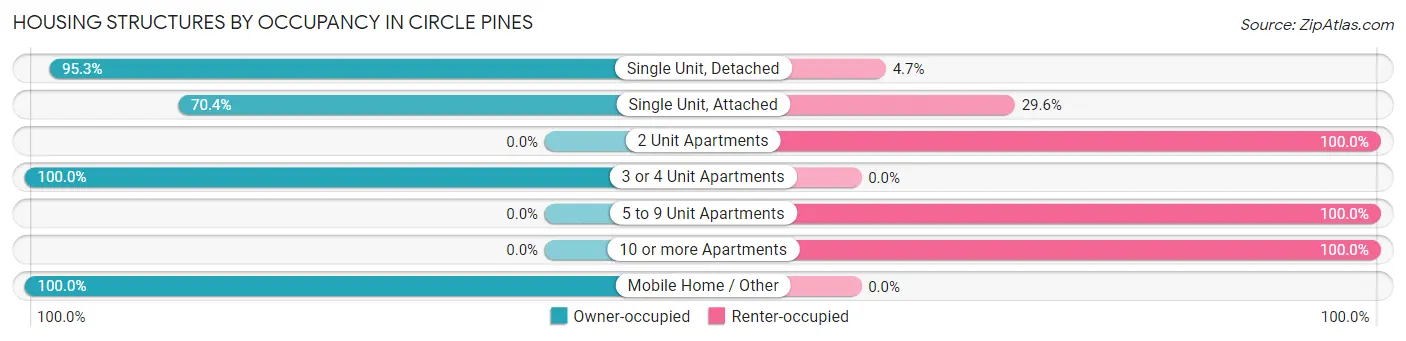
| Structure Type | Owner-occupied | Renter-occupied |
| Single Unit, Detached | 1,211 (95.3%) | 60 (4.7%) |
| Single Unit, Attached | 286 (70.4%) | 120 (29.6%) |
| 2 Unit Apartments | 0 (0.0%) | 28 (100.0%) |
| 3 or 4 Unit Apartments | 22 (100.0%) | 0 (0.0%) |
| 5 to 9 Unit Apartments | 0 (0.0%) | 13 (100.0%) |
| 10 or more Apartments | 0 (0.0%) | 183 (100.0%) |
| Mobile Home / Other | 15 (100.0%) | 0 (0.0%) |
| Total | 1,534 (79.1%) | 404 (20.8%) |
Housing Structures by Number of Rooms in Circle Pines
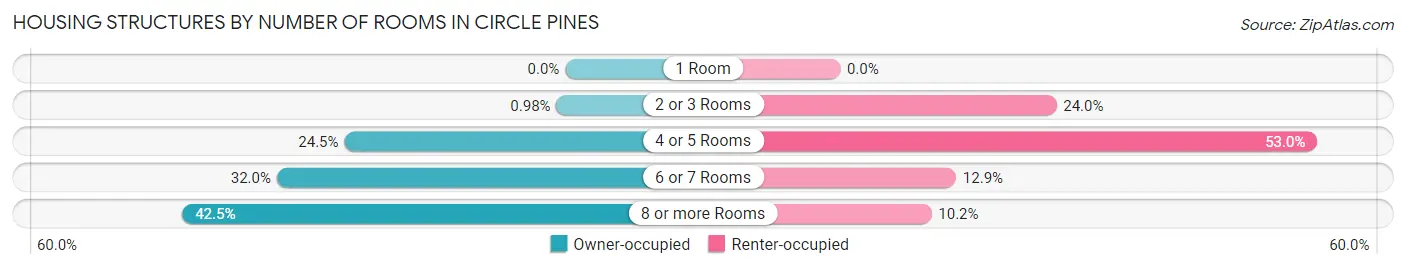
| Number of Rooms | Owner-occupied | Renter-occupied |
| 1 Room | 0 (0.0%) | 0 (0.0%) |
| 2 or 3 Rooms | 15 (1.0%) | 97 (24.0%) |
| 4 or 5 Rooms | 376 (24.5%) | 214 (53.0%) |
| 6 or 7 Rooms | 491 (32.0%) | 52 (12.9%) |
| 8 or more Rooms | 652 (42.5%) | 41 (10.2%) |
| Total | 1,534 (100.0%) | 404 (100.0%) |
Housing Structure by Heating Type in Circle Pines
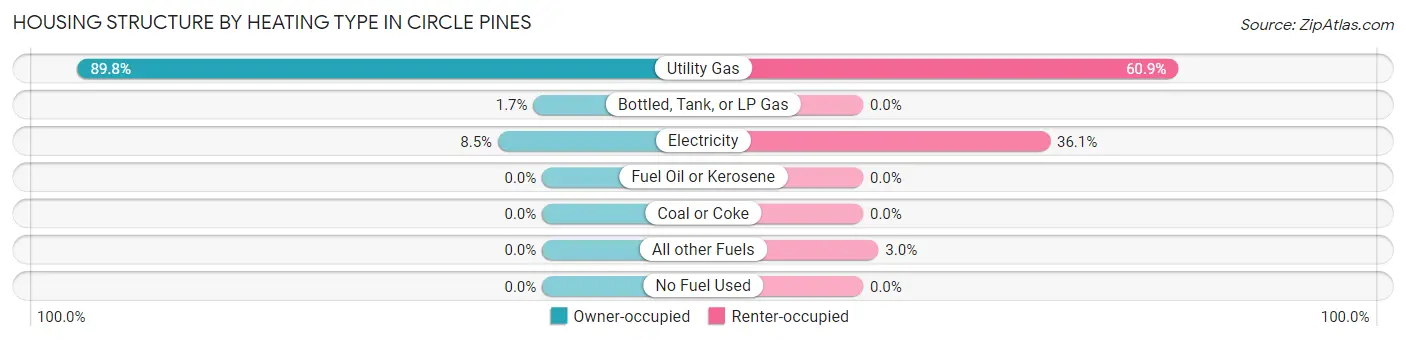
| Heating Type | Owner-occupied | Renter-occupied |
| Utility Gas | 1,377 (89.8%) | 246 (60.9%) |
| Bottled, Tank, or LP Gas | 26 (1.7%) | 0 (0.0%) |
| Electricity | 131 (8.5%) | 146 (36.1%) |
| Fuel Oil or Kerosene | 0 (0.0%) | 0 (0.0%) |
| Coal or Coke | 0 (0.0%) | 0 (0.0%) |
| All other Fuels | 0 (0.0%) | 12 (3.0%) |
| No Fuel Used | 0 (0.0%) | 0 (0.0%) |
| Total | 1,534 (100.0%) | 404 (100.0%) |
Household Vehicle Usage in Circle Pines
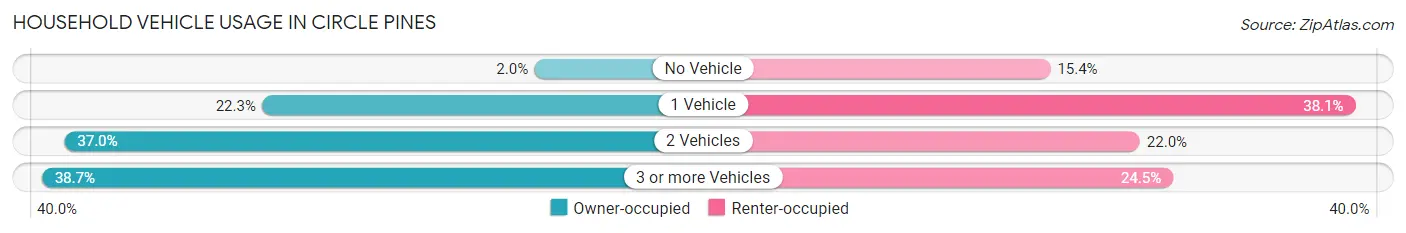
| Vehicles per Household | Owner-occupied | Renter-occupied |
| No Vehicle | 30 (2.0%) | 62 (15.3%) |
| 1 Vehicle | 342 (22.3%) | 154 (38.1%) |
| 2 Vehicles | 568 (37.0%) | 89 (22.0%) |
| 3 or more Vehicles | 594 (38.7%) | 99 (24.5%) |
| Total | 1,534 (100.0%) | 404 (100.0%) |
Real Estate & Mortgages in Circle Pines
Real Estate and Mortgage Overview in Circle Pines
| Characteristic | Without Mortgage | With Mortgage |
| Housing Units | 357 | 1,177 |
| Median Property Value | $264,400 | $246,500 |
| Median Household Income | $100,505 | $348 |
| Monthly Housing Costs | $648 | $30 |
| Real Estate Taxes | $3,715 | $62 |
Property Value by Mortgage Status in Circle Pines
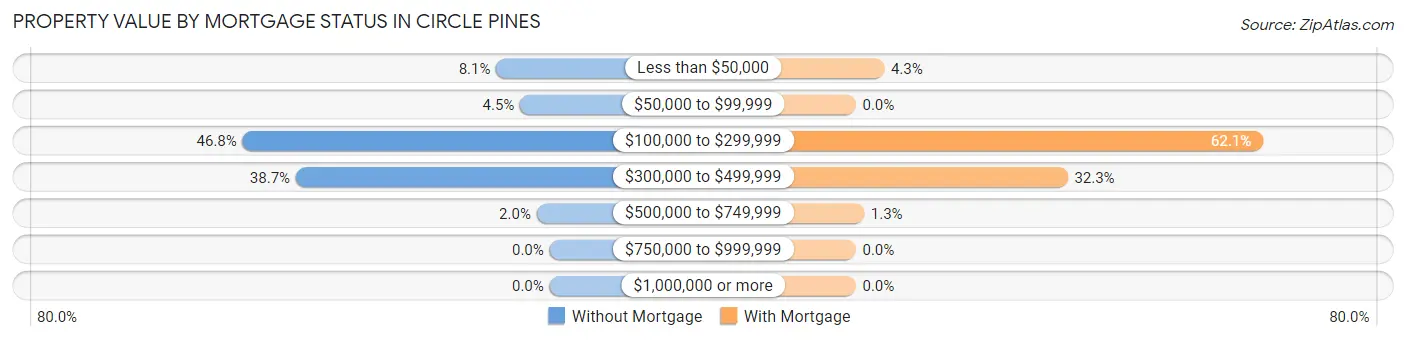
| Property Value | Without Mortgage | With Mortgage |
| Less than $50,000 | 29 (8.1%) | 51 (4.3%) |
| $50,000 to $99,999 | 16 (4.5%) | 0 (0.0%) |
| $100,000 to $299,999 | 167 (46.8%) | 731 (62.1%) |
| $300,000 to $499,999 | 138 (38.7%) | 380 (32.3%) |
| $500,000 to $749,999 | 7 (2.0%) | 15 (1.3%) |
| $750,000 to $999,999 | 0 (0.0%) | 0 (0.0%) |
| $1,000,000 or more | 0 (0.0%) | 0 (0.0%) |
| Total | 357 (100.0%) | 1,177 (100.0%) |
Household Income by Mortgage Status in Circle Pines
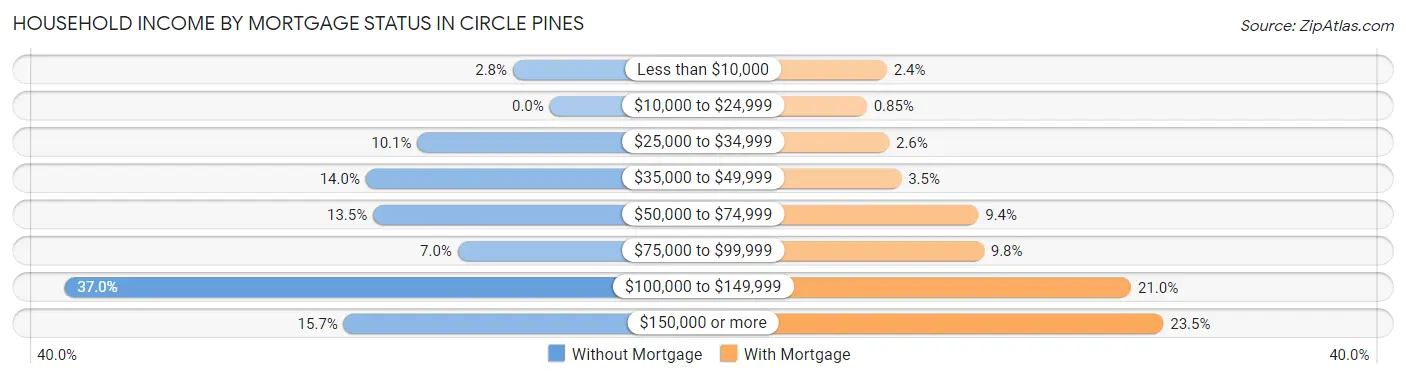
| Household Income | Without Mortgage | With Mortgage |
| Less than $10,000 | 10 (2.8%) | 28 (2.4%) |
| $10,000 to $24,999 | 0 (0.0%) | 10 (0.9%) |
| $25,000 to $34,999 | 36 (10.1%) | 30 (2.5%) |
| $35,000 to $49,999 | 50 (14.0%) | 41 (3.5%) |
| $50,000 to $74,999 | 48 (13.5%) | 110 (9.3%) |
| $75,000 to $99,999 | 25 (7.0%) | 115 (9.8%) |
| $100,000 to $149,999 | 132 (37.0%) | 247 (21.0%) |
| $150,000 or more | 56 (15.7%) | 276 (23.4%) |
| Total | 357 (100.0%) | 1,177 (100.0%) |
Property Value to Household Income Ratio in Circle Pines
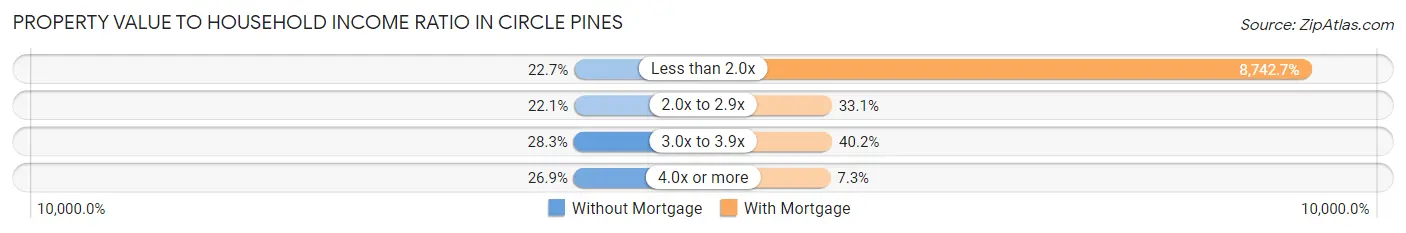
| Value-to-Income Ratio | Without Mortgage | With Mortgage |
| Less than 2.0x | 81 (22.7%) | 102,902 (8,742.7%) |
| 2.0x to 2.9x | 79 (22.1%) | 389 (33.1%) |
| 3.0x to 3.9x | 101 (28.3%) | 473 (40.2%) |
| 4.0x or more | 96 (26.9%) | 86 (7.3%) |
| Total | 357 (100.0%) | 1,177 (100.0%) |
Real Estate Taxes by Mortgage Status in Circle Pines
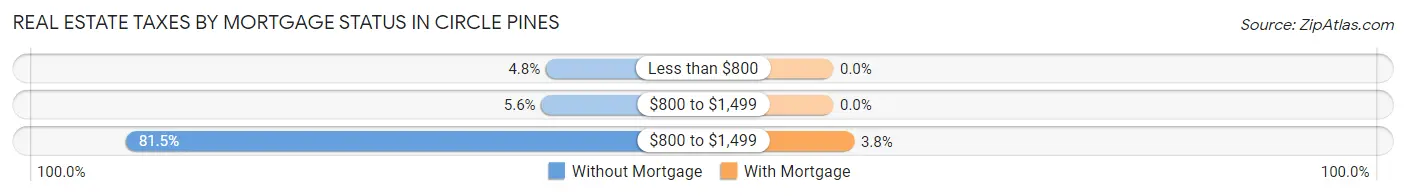
| Property Taxes | Without Mortgage | With Mortgage |
| Less than $800 | 17 (4.8%) | 0 (0.0%) |
| $800 to $1,499 | 20 (5.6%) | 0 (0.0%) |
| $800 to $1,499 | 291 (81.5%) | 45 (3.8%) |
| Total | 357 (100.0%) | 1,177 (100.0%) |
Health & Disability in Circle Pines
Health Insurance Coverage by Age in Circle Pines
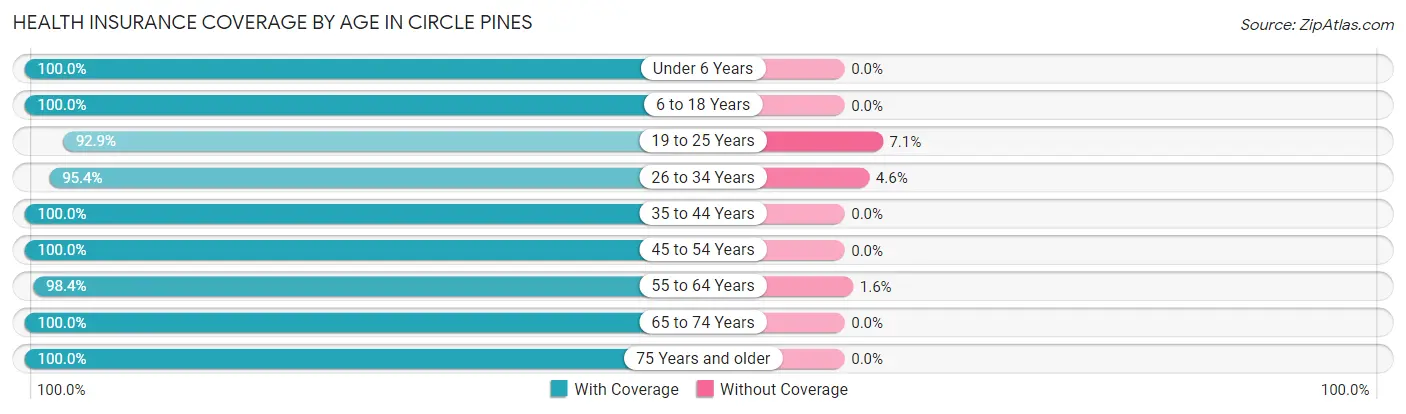
| Age Bracket | With Coverage | Without Coverage |
| Under 6 Years | 398 (100.0%) | 0 (0.0%) |
| 6 to 18 Years | 741 (100.0%) | 0 (0.0%) |
| 19 to 25 Years | 470 (92.9%) | 36 (7.1%) |
| 26 to 34 Years | 540 (95.4%) | 26 (4.6%) |
| 35 to 44 Years | 630 (100.0%) | 0 (0.0%) |
| 45 to 54 Years | 731 (100.0%) | 0 (0.0%) |
| 55 to 64 Years | 676 (98.4%) | 11 (1.6%) |
| 65 to 74 Years | 474 (100.0%) | 0 (0.0%) |
| 75 Years and older | 263 (100.0%) | 0 (0.0%) |
| Total | 4,923 (98.5%) | 73 (1.5%) |
Health Insurance Coverage by Citizenship Status in Circle Pines
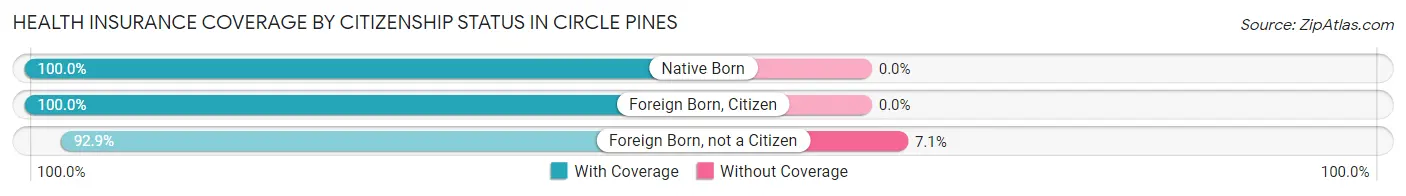
| Citizenship Status | With Coverage | Without Coverage |
| Native Born | 398 (100.0%) | 0 (0.0%) |
| Foreign Born, Citizen | 741 (100.0%) | 0 (0.0%) |
| Foreign Born, not a Citizen | 470 (92.9%) | 36 (7.1%) |
Health Insurance Coverage by Household Income in Circle Pines
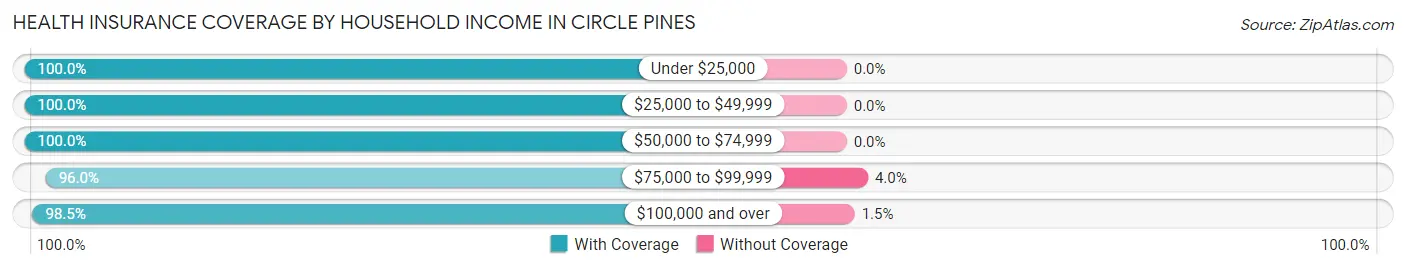
| Household Income | With Coverage | Without Coverage |
| Under $25,000 | 119 (100.0%) | 0 (0.0%) |
| $25,000 to $49,999 | 642 (100.0%) | 0 (0.0%) |
| $50,000 to $74,999 | 621 (100.0%) | 0 (0.0%) |
| $75,000 to $99,999 | 752 (96.0%) | 31 (4.0%) |
| $100,000 and over | 2,788 (98.5%) | 42 (1.5%) |
Public vs Private Health Insurance Coverage by Age in Circle Pines
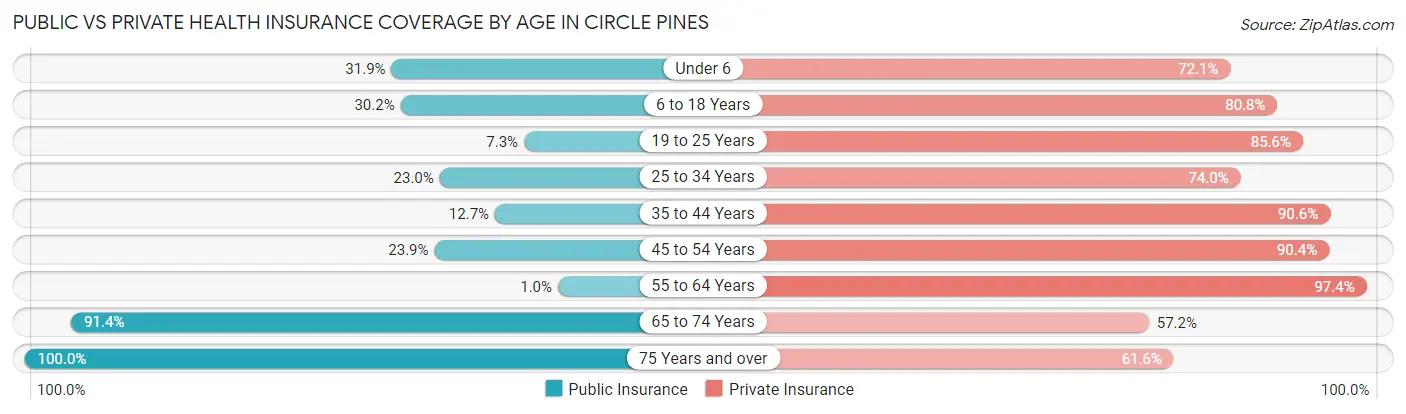
| Age Bracket | Public Insurance | Private Insurance |
| Under 6 | 127 (31.9%) | 287 (72.1%) |
| 6 to 18 Years | 224 (30.2%) | 599 (80.8%) |
| 19 to 25 Years | 37 (7.3%) | 433 (85.6%) |
| 25 to 34 Years | 130 (23.0%) | 419 (74.0%) |
| 35 to 44 Years | 80 (12.7%) | 571 (90.6%) |
| 45 to 54 Years | 175 (23.9%) | 661 (90.4%) |
| 55 to 64 Years | 7 (1.0%) | 669 (97.4%) |
| 65 to 74 Years | 433 (91.3%) | 271 (57.2%) |
| 75 Years and over | 263 (100.0%) | 162 (61.6%) |
| Total | 1,476 (29.5%) | 4,072 (81.5%) |
Disability Status by Sex by Age in Circle Pines
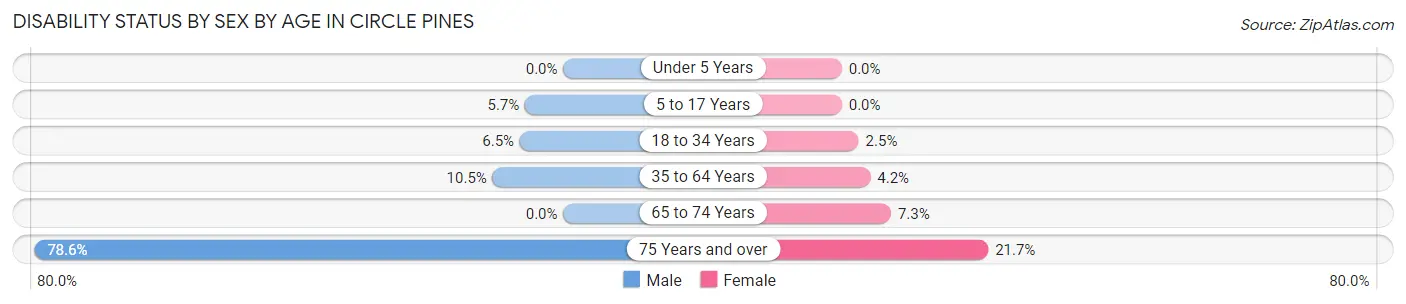
| Age Bracket | Male | Female |
| Under 5 Years | 0 (0.0%) | 0 (0.0%) |
| 5 to 17 Years | 26 (5.7%) | 0 (0.0%) |
| 18 to 34 Years | 36 (6.5%) | 13 (2.5%) |
| 35 to 64 Years | 106 (10.5%) | 44 (4.2%) |
| 65 to 74 Years | 0 (0.0%) | 20 (7.3%) |
| 75 Years and over | 44 (78.6%) | 45 (21.7%) |
Disability Class by Sex by Age in Circle Pines
Disability Class: Hearing Difficulty
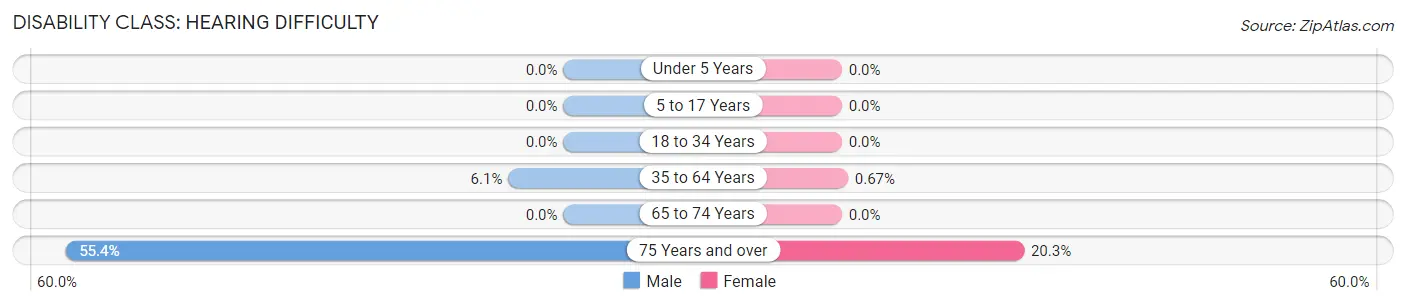
| Age Bracket | Male | Female |
| Under 5 Years | 0 (0.0%) | 0 (0.0%) |
| 5 to 17 Years | 0 (0.0%) | 0 (0.0%) |
| 18 to 34 Years | 0 (0.0%) | 0 (0.0%) |
| 35 to 64 Years | 62 (6.1%) | 7 (0.7%) |
| 65 to 74 Years | 0 (0.0%) | 0 (0.0%) |
| 75 Years and over | 31 (55.4%) | 42 (20.3%) |
Disability Class: Vision Difficulty
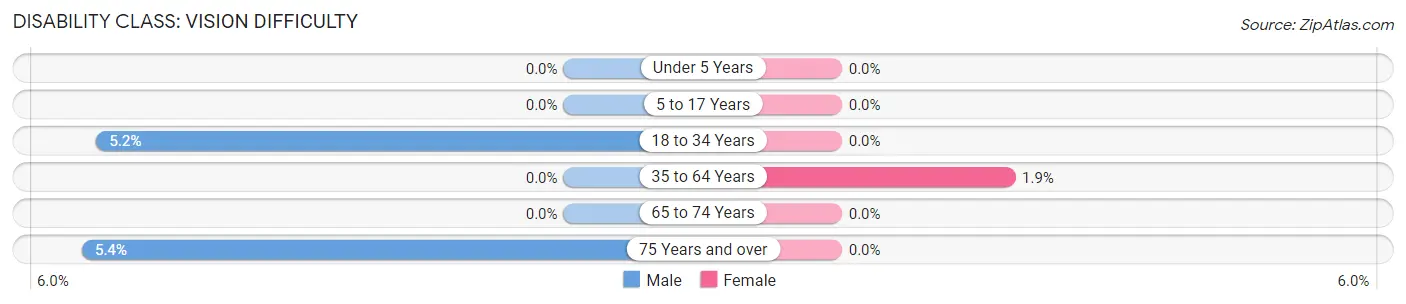
| Age Bracket | Male | Female |
| Under 5 Years | 0 (0.0%) | 0 (0.0%) |
| 5 to 17 Years | 0 (0.0%) | 0 (0.0%) |
| 18 to 34 Years | 29 (5.2%) | 0 (0.0%) |
| 35 to 64 Years | 0 (0.0%) | 20 (1.9%) |
| 65 to 74 Years | 0 (0.0%) | 0 (0.0%) |
| 75 Years and over | 3 (5.4%) | 0 (0.0%) |
Disability Class: Cognitive Difficulty
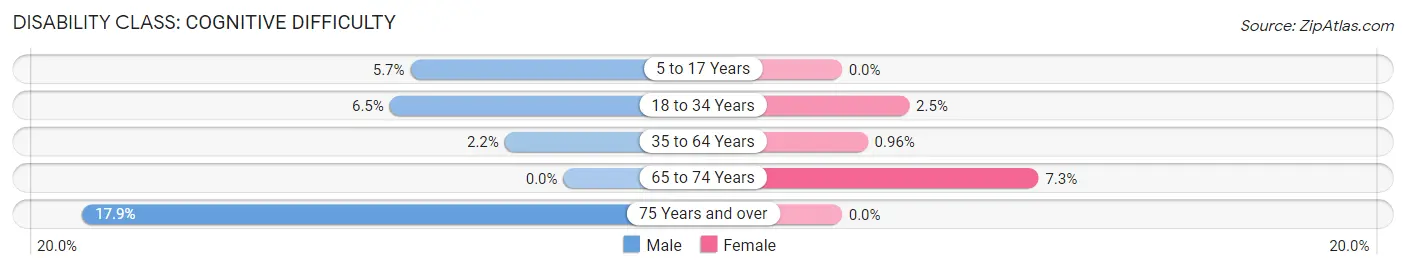
| Age Bracket | Male | Female |
| 5 to 17 Years | 26 (5.7%) | 0 (0.0%) |
| 18 to 34 Years | 36 (6.5%) | 13 (2.5%) |
| 35 to 64 Years | 22 (2.2%) | 10 (1.0%) |
| 65 to 74 Years | 0 (0.0%) | 20 (7.3%) |
| 75 Years and over | 10 (17.9%) | 0 (0.0%) |
Disability Class: Ambulatory Difficulty
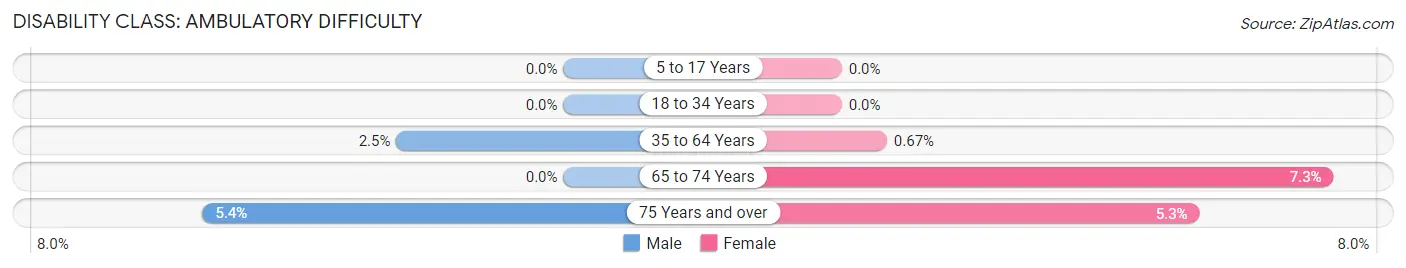
| Age Bracket | Male | Female |
| 5 to 17 Years | 0 (0.0%) | 0 (0.0%) |
| 18 to 34 Years | 0 (0.0%) | 0 (0.0%) |
| 35 to 64 Years | 25 (2.5%) | 7 (0.7%) |
| 65 to 74 Years | 0 (0.0%) | 20 (7.3%) |
| 75 Years and over | 3 (5.4%) | 11 (5.3%) |
Disability Class: Self-Care Difficulty
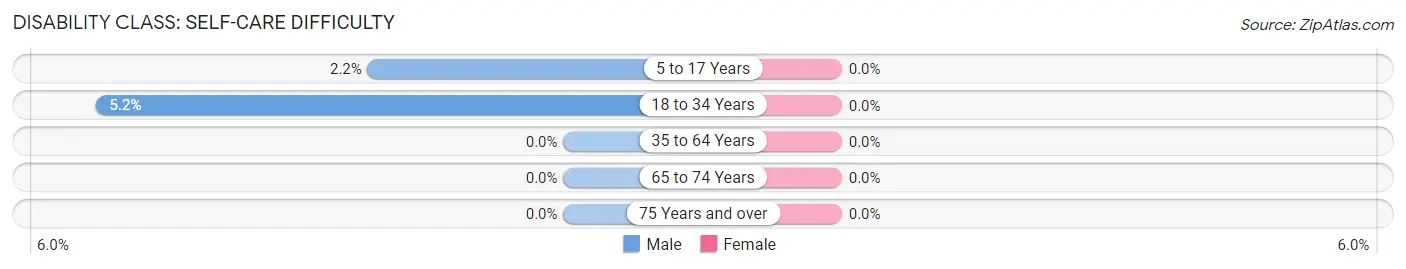
| Age Bracket | Male | Female |
| 5 to 17 Years | 10 (2.2%) | 0 (0.0%) |
| 18 to 34 Years | 29 (5.2%) | 0 (0.0%) |
| 35 to 64 Years | 0 (0.0%) | 0 (0.0%) |
| 65 to 74 Years | 0 (0.0%) | 0 (0.0%) |
| 75 Years and over | 0 (0.0%) | 0 (0.0%) |
Technology Access in Circle Pines
Computing Device Access in Circle Pines
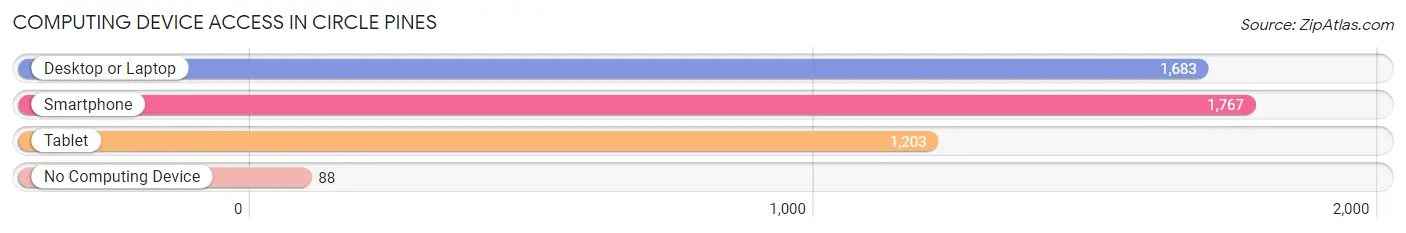
| Device Type | # Households | % Households |
| Desktop or Laptop | 1,683 | 86.8% |
| Smartphone | 1,767 | 91.2% |
| Tablet | 1,203 | 62.1% |
| No Computing Device | 88 | 4.5% |
| Total | 1,938 | 100.0% |
Internet Access in Circle Pines
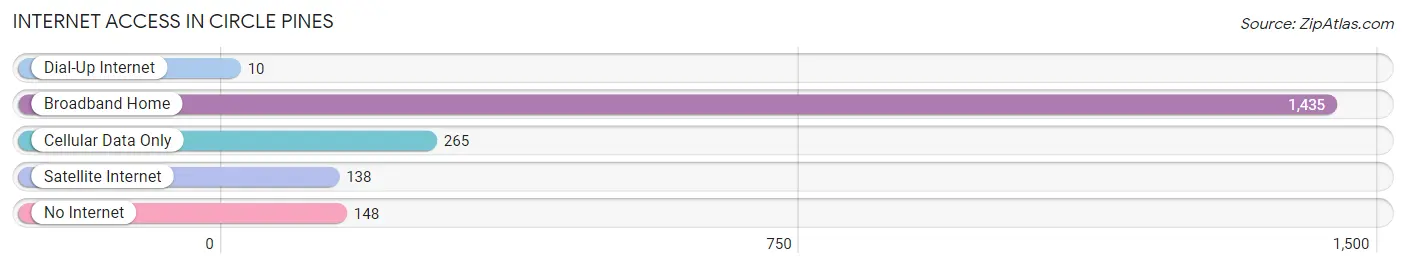
| Internet Type | # Households | % Households |
| Dial-Up Internet | 10 | 0.5% |
| Broadband Home | 1,435 | 74.1% |
| Cellular Data Only | 265 | 13.7% |
| Satellite Internet | 138 | 7.1% |
| No Internet | 148 | 7.6% |
| Total | 1,938 | 100.0% |
Circle Pines Summary
Circle Pines, Minnesota is a small city located in Anoka County, approximately 20 miles north of Minneapolis. The city was founded in the late 1800s and has a population of approximately 8,000 people. The city is known for its small-town charm and is home to a variety of businesses, parks, and recreational activities.
Geography
Circle Pines is located in the northern part of Anoka County, Minnesota. It is bordered by the cities of Blaine, Centerville, Lexington, and Lino Lakes. The city is situated on the banks of the Rum River, which flows through the city and is a popular spot for fishing and canoeing. The city is also located near the Twin Cities metropolitan area, which provides easy access to the many amenities of the larger cities.
The city is divided into two distinct areas: the north and south sides. The north side is primarily residential, while the south side is home to a variety of businesses, including retail stores, restaurants, and professional offices. The city is also home to several parks, including Central Park, which is located in the center of the city and features a playground, picnic area, and walking trails.
Economy
Circle Pines is home to a variety of businesses, including retail stores, restaurants, and professional offices. The city is also home to several manufacturing companies, including 3M, which has a large manufacturing facility in the city. The city is also home to a variety of small businesses, including a variety of restaurants, retail stores, and professional offices.
The city is also home to a variety of educational institutions, including Centennial High School, which is part of the Centennial School District. The city is also home to a variety of parks and recreational activities, including a golf course, tennis courts, and a swimming pool.
Demographics
As of the 2010 census, the population of Circle Pines was 8,037. The racial makeup of the city was 87.3% White, 5.2% African American, 0.4% Native American, 2.2% Asian, 0.1% Pacific Islander, 2.2% from other races, and 2.7% from two or more races. Hispanic or Latino of any race were 4.3% of the population.
The median income for a household in the city was $60,945, and the median income for a family was $71,945. The per capita income for the city was $27,945. About 4.3% of families and 5.7% of the population were below the poverty line, including 6.3% of those under age 18 and 4.2% of those age 65 or over.
Conclusion
Circle Pines, Minnesota is a small city located in Anoka County, approximately 20 miles north of Minneapolis. The city was founded in the late 1800s and has a population of approximately 8,000 people. The city is known for its small-town charm and is home to a variety of businesses, parks, and recreational activities. The city is home to a variety of businesses, including retail stores, restaurants, and professional offices. The city is also home to a variety of educational institutions, including Centennial High School, which is part of the Centennial School District. The city is also home to a variety of parks and recreational activities, including a golf course, tennis courts, and a swimming pool. The median income for a household in the city was $60,945, and the median income for a family was $71,945. The per capita income for the city was $27,945.
Common Questions
What is Per Capita Income in Circle Pines?
Per Capita income in Circle Pines is $42,614.
What is the Median Family Income in Circle Pines?
Median Family Income in Circle Pines is $115,030.
What is the Median Household income in Circle Pines?
Median Household Income in Circle Pines is $97,083.
What is Income or Wage Gap in Circle Pines?
Income or Wage Gap in Circle Pines is 16.8%.
Women in Circle Pines earn 83.2 cents for every dollar earned by a man.
What is Inequality or Gini Index in Circle Pines?
Inequality or Gini Index in Circle Pines is 0.36.
What is the Total Population of Circle Pines?
Total Population of Circle Pines is 4,996.
What is the Total Male Population of Circle Pines?
Total Male Population of Circle Pines is 2,368.
What is the Total Female Population of Circle Pines?
Total Female Population of Circle Pines is 2,628.
What is the Ratio of Males per 100 Females in Circle Pines?
There are 90.11 Males per 100 Females in Circle Pines.
What is the Ratio of Females per 100 Males in Circle Pines?
There are 110.98 Females per 100 Males in Circle Pines.
What is the Median Population Age in Circle Pines?
Median Population Age in Circle Pines is 38.4 Years.
What is the Average Family Size in Circle Pines
Average Family Size in Circle Pines is 3.1 People.
What is the Average Household Size in Circle Pines
Average Household Size in Circle Pines is 2.6 People.
How Large is the Labor Force in Circle Pines?
There are 3,073 People in the Labor Forcein in Circle Pines.
What is the Percentage of People in the Labor Force in Circle Pines?
76.3% of People are in the Labor Force in Circle Pines.
What is the Unemployment Rate in Circle Pines?
Unemployment Rate in Circle Pines is 3.8%.