Zip Codes with the Highest Percentage of Population Employed in Computer & Mathematics in Minnesota
RELATED REPORTS & OPTIONS
Computer & Mathematics
Minnesota
Compare Zip Codes
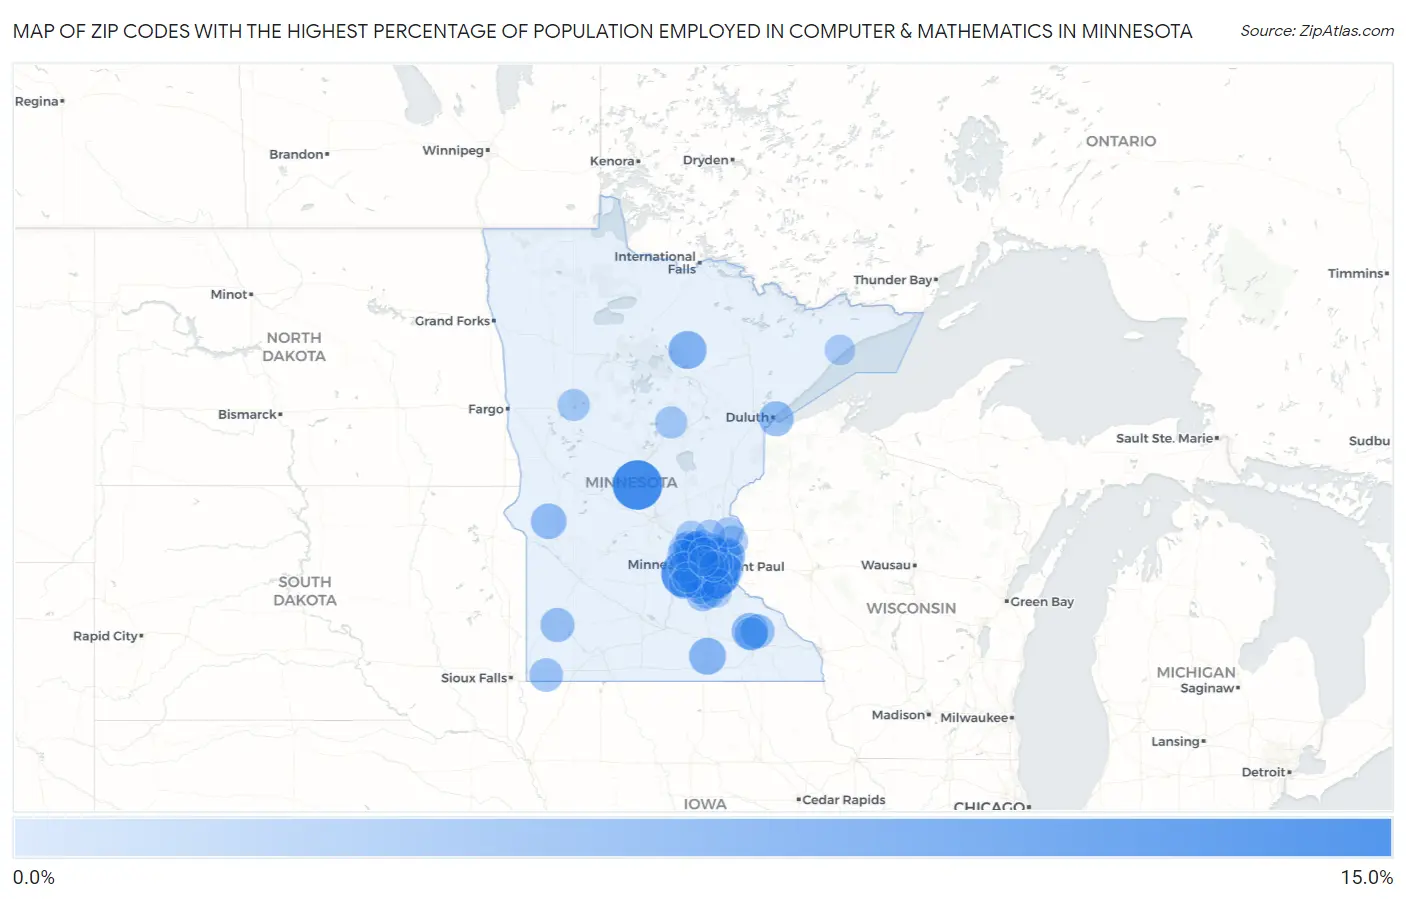
Map of Zip Codes with the Highest Percentage of Population Employed in Computer & Mathematics in Minnesota
0.0%
15.0%
Zip Codes with the Highest Percentage of Population Employed in Computer & Mathematics in Minnesota
| Zip Code | % Employed | vs State | vs National | |
| 1. | 56328 | 13.5% | 3.9%(+9.61)#1 | 3.5%(+9.96)#335 |
| 2. | 55415 | 12.7% | 3.9%(+8.80)#2 | 3.5%(+9.14)#385 |
| 3. | 55402 | 12.6% | 3.9%(+8.70)#3 | 3.5%(+9.04)#393 |
| 4. | 55386 | 12.5% | 3.9%(+8.62)#4 | 3.5%(+8.97)#400 |
| 5. | 55344 | 11.8% | 3.9%(+7.96)#5 | 3.5%(+8.30)#459 |
| 6. | 55446 | 11.2% | 3.9%(+7.28)#6 | 3.5%(+7.63)#542 |
| 7. | 55123 | 10.1% | 3.9%(+6.24)#7 | 3.5%(+6.59)#688 |
| 8. | 55346 | 9.5% | 3.9%(+5.67)#8 | 3.5%(+6.02)#787 |
| 9. | 55436 | 8.9% | 3.9%(+5.03)#9 | 3.5%(+5.37)#927 |
| 10. | 55417 | 8.6% | 3.9%(+4.70)#10 | 3.5%(+5.04)#1,031 |
| 11. | 55077 | 8.5% | 3.9%(+4.67)#11 | 3.5%(+5.02)#1,037 |
| 12. | 55311 | 8.5% | 3.9%(+4.62)#12 | 3.5%(+4.97)#1,052 |
| 13. | 55401 | 8.4% | 3.9%(+4.48)#13 | 3.5%(+4.83)#1,093 |
| 14. | 55343 | 8.1% | 3.9%(+4.25)#14 | 3.5%(+4.59)#1,172 |
| 15. | 56657 | 8.1% | 3.9%(+4.19)#15 | 3.5%(+4.54)#1,191 |
| 16. | 55115 | 7.9% | 3.9%(+4.03)#16 | 3.5%(+4.37)#1,235 |
| 17. | 55435 | 7.8% | 3.9%(+3.94)#17 | 3.5%(+4.29)#1,272 |
| 18. | 55439 | 7.7% | 3.9%(+3.84)#18 | 3.5%(+4.18)#1,315 |
| 19. | 55076 | 7.6% | 3.9%(+3.77)#19 | 3.5%(+4.12)#1,335 |
| 20. | 56035 | 7.6% | 3.9%(+3.71)#20 | 3.5%(+4.06)#1,355 |
| 21. | 55437 | 7.6% | 3.9%(+3.70)#21 | 3.5%(+4.04)#1,364 |
| 22. | 55960 | 7.5% | 3.9%(+3.59)#22 | 3.5%(+3.93)#1,402 |
| 23. | 55101 | 7.4% | 3.9%(+3.57)#23 | 3.5%(+3.92)#1,406 |
| 24. | 55447 | 7.4% | 3.9%(+3.57)#24 | 3.5%(+3.92)#1,407 |
| 25. | 55431 | 7.4% | 3.9%(+3.57)#25 | 3.5%(+3.91)#1,411 |
| 26. | 55127 | 7.4% | 3.9%(+3.51)#26 | 3.5%(+3.85)#1,435 |
| 27. | 55305 | 7.3% | 3.9%(+3.46)#27 | 3.5%(+3.80)#1,449 |
| 28. | 55345 | 7.3% | 3.9%(+3.42)#28 | 3.5%(+3.76)#1,471 |
| 29. | 55416 | 7.3% | 3.9%(+3.39)#29 | 3.5%(+3.74)#1,486 |
| 30. | 55347 | 7.2% | 3.9%(+3.32)#30 | 3.5%(+3.67)#1,516 |
| 31. | 55090 | 7.1% | 3.9%(+3.27)#31 | 3.5%(+3.62)#1,546 |
| 32. | 55423 | 7.1% | 3.9%(+3.27)#32 | 3.5%(+3.61)#1,553 |
| 33. | 55124 | 7.1% | 3.9%(+3.23)#33 | 3.5%(+3.58)#1,571 |
| 34. | 56207 | 7.0% | 3.9%(+3.10)#34 | 3.5%(+3.45)#1,637 |
| 35. | 55113 | 6.9% | 3.9%(+3.06)#35 | 3.5%(+3.40)#1,664 |
| 36. | 55403 | 6.8% | 3.9%(+2.96)#36 | 3.5%(+3.31)#1,717 |
| 37. | 55426 | 6.8% | 3.9%(+2.92)#37 | 3.5%(+3.27)#1,739 |
| 38. | 55122 | 6.8% | 3.9%(+2.91)#38 | 3.5%(+3.26)#1,746 |
| 39. | 55316 | 6.7% | 3.9%(+2.85)#39 | 3.5%(+3.20)#1,777 |
| 40. | 55107 | 6.7% | 3.9%(+2.85)#40 | 3.5%(+3.19)#1,782 |
| 41. | 55802 | 6.7% | 3.9%(+2.81)#41 | 3.5%(+3.16)#1,807 |
| 42. | 55408 | 6.6% | 3.9%(+2.75)#42 | 3.5%(+3.10)#1,841 |
| 43. | 55306 | 6.6% | 3.9%(+2.72)#43 | 3.5%(+3.07)#1,868 |
| 44. | 55044 | 6.5% | 3.9%(+2.64)#44 | 3.5%(+2.99)#1,918 |
| 45. | 55405 | 6.5% | 3.9%(+2.59)#45 | 3.5%(+2.94)#1,957 |
| 46. | 55126 | 6.4% | 3.9%(+2.56)#46 | 3.5%(+2.91)#1,976 |
| 47. | 55441 | 6.4% | 3.9%(+2.54)#47 | 3.5%(+2.89)#1,997 |
| 48. | 55369 | 6.4% | 3.9%(+2.49)#48 | 3.5%(+2.84)#2,035 |
| 49. | 55906 | 6.3% | 3.9%(+2.45)#49 | 3.5%(+2.79)#2,063 |
| 50. | 56115 | 6.3% | 3.9%(+2.42)#50 | 3.5%(+2.76)#2,091 |
| 51. | 55413 | 6.3% | 3.9%(+2.41)#51 | 3.5%(+2.76)#2,094 |
| 52. | 55118 | 6.2% | 3.9%(+2.37)#52 | 3.5%(+2.72)#2,119 |
| 53. | 55114 | 6.2% | 3.9%(+2.30)#53 | 3.5%(+2.65)#2,164 |
| 54. | 55438 | 6.2% | 3.9%(+2.30)#54 | 3.5%(+2.64)#2,167 |
| 55. | 55419 | 6.2% | 3.9%(+2.29)#55 | 3.5%(+2.64)#2,172 |
| 56. | 55374 | 6.1% | 3.9%(+2.26)#56 | 3.5%(+2.61)#2,196 |
| 57. | 56146 | 6.1% | 3.9%(+2.19)#57 | 3.5%(+2.54)#2,266 |
| 58. | 55901 | 5.9% | 3.9%(+2.07)#58 | 3.5%(+2.42)#2,366 |
| 59. | 55427 | 5.9% | 3.9%(+2.02)#59 | 3.5%(+2.37)#2,414 |
| 60. | 55317 | 5.9% | 3.9%(+2.01)#60 | 3.5%(+2.35)#2,428 |
| 61. | 55112 | 5.8% | 3.9%(+1.94)#61 | 3.5%(+2.29)#2,487 |
| 62. | 55409 | 5.8% | 3.9%(+1.90)#62 | 3.5%(+2.25)#2,521 |
| 63. | 55412 | 5.7% | 3.9%(+1.87)#63 | 3.5%(+2.21)#2,546 |
| 64. | 55150 | 5.7% | 3.9%(+1.84)#64 | 3.5%(+2.19)#2,569 |
| 65. | 55102 | 5.7% | 3.9%(+1.79)#65 | 3.5%(+2.14)#2,623 |
| 66. | 55410 | 5.7% | 3.9%(+1.79)#66 | 3.5%(+2.14)#2,626 |
| 67. | 55020 | 5.6% | 3.9%(+1.71)#67 | 3.5%(+2.06)#2,693 |
| 68. | 55121 | 5.5% | 3.9%(+1.64)#68 | 3.5%(+1.99)#2,765 |
| 69. | 56447 | 5.4% | 3.9%(+1.56)#69 | 3.5%(+1.91)#2,857 |
| 70. | 55418 | 5.4% | 3.9%(+1.54)#70 | 3.5%(+1.89)#2,879 |
| 71. | 55406 | 5.4% | 3.9%(+1.50)#71 | 3.5%(+1.85)#2,922 |
| 72. | 56578 | 5.4% | 3.9%(+1.50)#72 | 3.5%(+1.85)#2,924 |
| 73. | 55337 | 5.3% | 3.9%(+1.45)#73 | 3.5%(+1.79)#2,984 |
| 74. | 55341 | 5.3% | 3.9%(+1.41)#74 | 3.5%(+1.76)#3,025 |
| 75. | 55391 | 5.2% | 3.9%(+1.32)#75 | 3.5%(+1.66)#3,141 |
| 76. | 55378 | 5.1% | 3.9%(+1.25)#76 | 3.5%(+1.60)#3,202 |
| 77. | 55073 | 5.0% | 3.9%(+1.13)#77 | 3.5%(+1.48)#3,343 |
| 78. | 55379 | 4.9% | 3.9%(+1.06)#78 | 3.5%(+1.41)#3,455 |
| 79. | 55129 | 4.9% | 3.9%(+1.05)#79 | 3.5%(+1.39)#3,478 |
| 80. | 55330 | 4.9% | 3.9%(+1.03)#80 | 3.5%(+1.38)#3,496 |
| 81. | 55125 | 4.9% | 3.9%(+1.02)#81 | 3.5%(+1.37)#3,512 |
| 82. | 55116 | 4.9% | 3.9%(+0.995)#82 | 3.5%(+1.34)#3,541 |
| 83. | 55013 | 4.8% | 3.9%(+0.960)#83 | 3.5%(+1.31)#3,596 |
| 84. | 55372 | 4.8% | 3.9%(+0.956)#84 | 3.5%(+1.30)#3,603 |
| 85. | 55340 | 4.8% | 3.9%(+0.938)#85 | 3.5%(+1.29)#3,634 |
| 86. | 55117 | 4.8% | 3.9%(+0.911)#86 | 3.5%(+1.26)#3,665 |
| 87. | 55449 | 4.8% | 3.9%(+0.904)#87 | 3.5%(+1.25)#3,676 |
| 88. | 55327 | 4.8% | 3.9%(+0.900)#88 | 3.5%(+1.25)#3,683 |
| 89. | 55404 | 4.8% | 3.9%(+0.899)#89 | 3.5%(+1.25)#3,684 |
| 90. | 55068 | 4.8% | 3.9%(+0.883)#90 | 3.5%(+1.23)#3,706 |
| 91. | 55011 | 4.8% | 3.9%(+0.881)#91 | 3.5%(+1.23)#3,709 |
| 92. | 55373 | 4.7% | 3.9%(+0.861)#92 | 3.5%(+1.21)#3,741 |
| 93. | 55364 | 4.7% | 3.9%(+0.860)#93 | 3.5%(+1.21)#3,743 |
| 94. | 55613 | 4.7% | 3.9%(+0.845)#94 | 3.5%(+1.19)#3,769 |
| 95. | 55443 | 4.7% | 3.9%(+0.778)#95 | 3.5%(+1.13)#3,868 |
| 96. | 55315 | 4.6% | 3.9%(+0.765)#96 | 3.5%(+1.11)#3,884 |
| 97. | 55024 | 4.6% | 3.9%(+0.753)#97 | 3.5%(+1.10)#3,905 |
| 98. | 55104 | 4.6% | 3.9%(+0.742)#98 | 3.5%(+1.09)#3,922 |
| 99. | 55318 | 4.6% | 3.9%(+0.742)#99 | 3.5%(+1.09)#3,923 |
| 100. | 55422 | 4.6% | 3.9%(+0.727)#100 | 3.5%(+1.07)#3,945 |
Common Questions
What are the Top 10 Zip Codes with the Highest Percentage of Population Employed in Computer & Mathematics in Minnesota?
Top 10 Zip Codes with the Highest Percentage of Population Employed in Computer & Mathematics in Minnesota are:
What zip code has the Highest Percentage of Population Employed in Computer & Mathematics in Minnesota?
56328 has the Highest Percentage of Population Employed in Computer & Mathematics in Minnesota with 13.5%.
What is the Percentage of Population Employed in Computer & Mathematics in the State of Minnesota?
Percentage of Population Employed in Computer & Mathematics in Minnesota is 3.9%.
What is the Percentage of Population Employed in Computer & Mathematics in the United States?
Percentage of Population Employed in Computer & Mathematics in the United States is 3.5%.