Portage, IN Map & Demographics
Portage Map
Portage Overview
$32,637
PER CAPITA INCOME
$84,025
AVG FAMILY INCOME
$71,317
AVG HOUSEHOLD INCOME
41.0%
WAGE / INCOME GAP [ % ]
59.0¢/ $1
WAGE / INCOME GAP [ $ ]
$9,118
FAMILY INCOME DEFICIT
0.40
INEQUALITY / GINI INDEX
37,737
TOTAL POPULATION
18,385
MALE POPULATION
19,352
FEMALE POPULATION
95.00
MALES / 100 FEMALES
105.26
FEMALES / 100 MALES
38.7
MEDIAN AGE
3.1
AVG FAMILY SIZE
2.5
AVG HOUSEHOLD SIZE
19,402
LABOR FORCE [ PEOPLE ]
63.8%
PERCENT IN LABOR FORCE
6.6%
UNEMPLOYMENT RATE
Portage Zip Codes
Portage Area Codes
Income in Portage
Income Overview in Portage
Per Capita Income in Portage is $32,637, while median incomes of families and households are $84,025 and $71,317 respectively.
| Characteristic | Number | Measure |
| Per Capita Income | 37,737 | $32,637 |
| Median Family Income | 9,944 | $84,025 |
| Mean Family Income | 9,944 | $91,713 |
| Median Household Income | 14,993 | $71,317 |
| Mean Household Income | 14,993 | $81,447 |
| Income Deficit | 9,944 | $9,118 |
| Wage / Income Gap (%) | 37,737 | 41.02% |
| Wage / Income Gap ($) | 37,737 | 58.98¢ per $1 |
| Gini / Inequality Index | 37,737 | 0.40 |
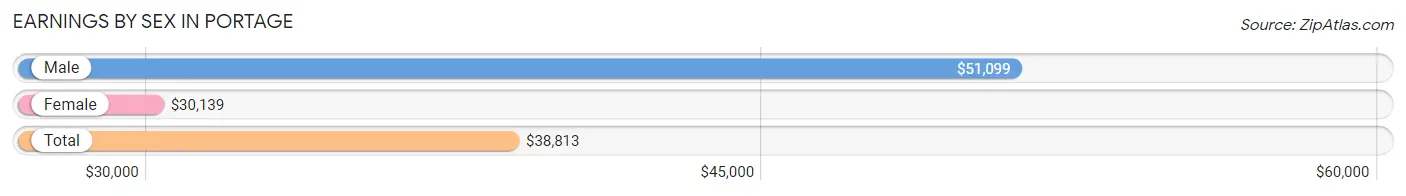
Earnings by Sex in Portage
Average Earnings in Portage are $38,813, $51,099 for men and $30,139 for women, a difference of 41.0%.
| Sex | Number | Average Earnings |
| Male | 10,521 (52.6%) | $51,099 |
| Female | 9,483 (47.4%) | $30,139 |
| Total | 20,004 (100.0%) | $38,813 |
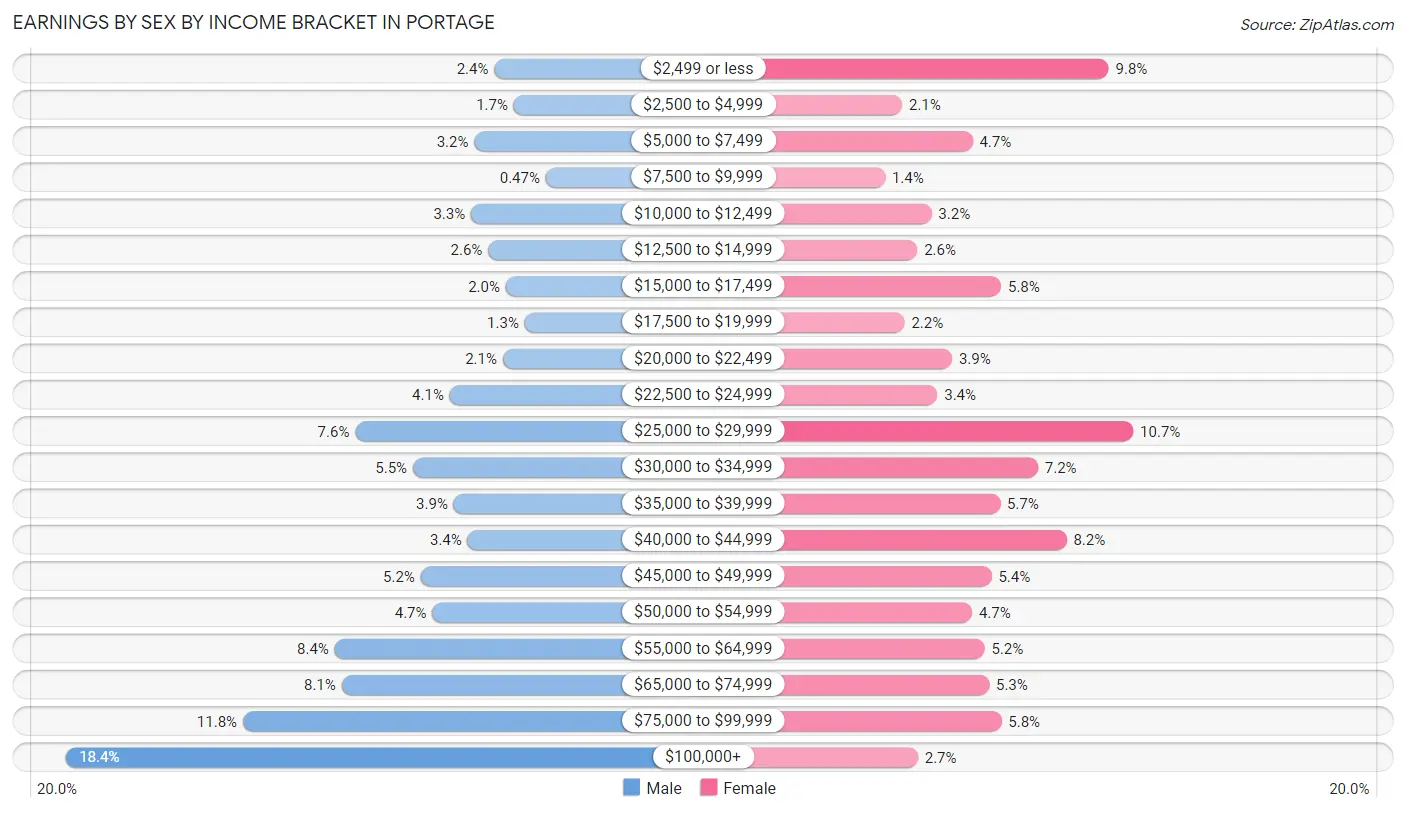
Earnings by Sex by Income Bracket in Portage
The most common earnings brackets in Portage are $100,000+ for men (1,940 | 18.4%) and $25,000 to $29,999 for women (1,018 | 10.7%).
| Income | Male | Female |
| $2,499 or less | 253 (2.4%) | 930 (9.8%) |
| $2,500 to $4,999 | 176 (1.7%) | 196 (2.1%) |
| $5,000 to $7,499 | 331 (3.2%) | 447 (4.7%) |
| $7,500 to $9,999 | 49 (0.5%) | 136 (1.4%) |
| $10,000 to $12,499 | 344 (3.3%) | 301 (3.2%) |
| $12,500 to $14,999 | 277 (2.6%) | 250 (2.6%) |
| $15,000 to $17,499 | 207 (2.0%) | 548 (5.8%) |
| $17,500 to $19,999 | 133 (1.3%) | 205 (2.2%) |
| $20,000 to $22,499 | 219 (2.1%) | 374 (3.9%) |
| $22,500 to $24,999 | 428 (4.1%) | 321 (3.4%) |
| $25,000 to $29,999 | 801 (7.6%) | 1,018 (10.7%) |
| $30,000 to $34,999 | 573 (5.4%) | 679 (7.2%) |
| $35,000 to $39,999 | 412 (3.9%) | 544 (5.7%) |
| $40,000 to $44,999 | 358 (3.4%) | 780 (8.2%) |
| $45,000 to $49,999 | 543 (5.2%) | 514 (5.4%) |
| $50,000 to $54,999 | 497 (4.7%) | 445 (4.7%) |
| $55,000 to $64,999 | 882 (8.4%) | 489 (5.2%) |
| $65,000 to $74,999 | 854 (8.1%) | 505 (5.3%) |
| $75,000 to $99,999 | 1,244 (11.8%) | 549 (5.8%) |
| $100,000+ | 1,940 (18.4%) | 252 (2.7%) |
| Total | 10,521 (100.0%) | 9,483 (100.0%) |
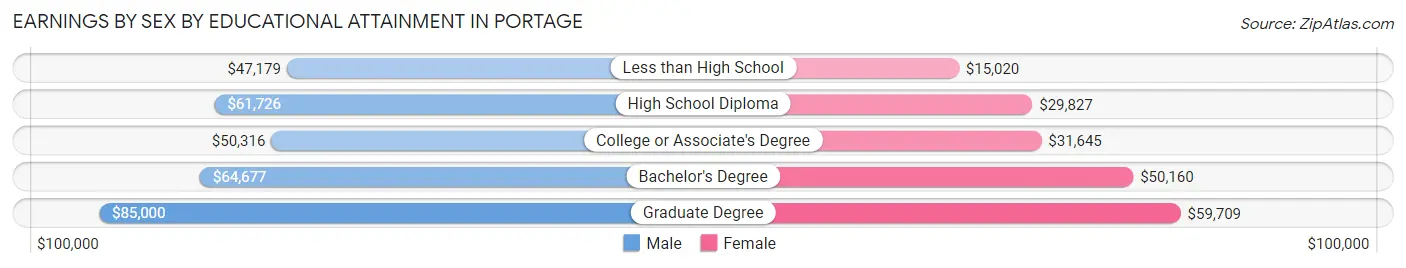
Earnings by Sex by Educational Attainment in Portage
Average earnings in Portage are $58,634 for men and $33,922 for women, a difference of 42.1%. Men with an educational attainment of graduate degree enjoy the highest average annual earnings of $85,000, while those with less than high school education earn the least with $47,179. Women with an educational attainment of graduate degree earn the most with the average annual earnings of $59,709, while those with less than high school education have the smallest earnings of $15,020.
| Educational Attainment | Male Income | Female Income |
| Less than High School | $47,179 | $15,020 |
| High School Diploma | $61,726 | $29,827 |
| College or Associate's Degree | $50,316 | $31,645 |
| Bachelor's Degree | $64,677 | $50,160 |
| Graduate Degree | $85,000 | $59,709 |
| Total | $58,634 | $33,922 |
Family Income in Portage
Family Income Brackets in Portage
According to the Portage family income data, there are 2,227 families falling into the $75,000 to $99,999 income range, which is the most common income bracket and makes up 22.4% of all families. Conversely, the $10,000 to $14,999 income bracket is the least frequent group with only 70 families (0.7%) belonging to this category.
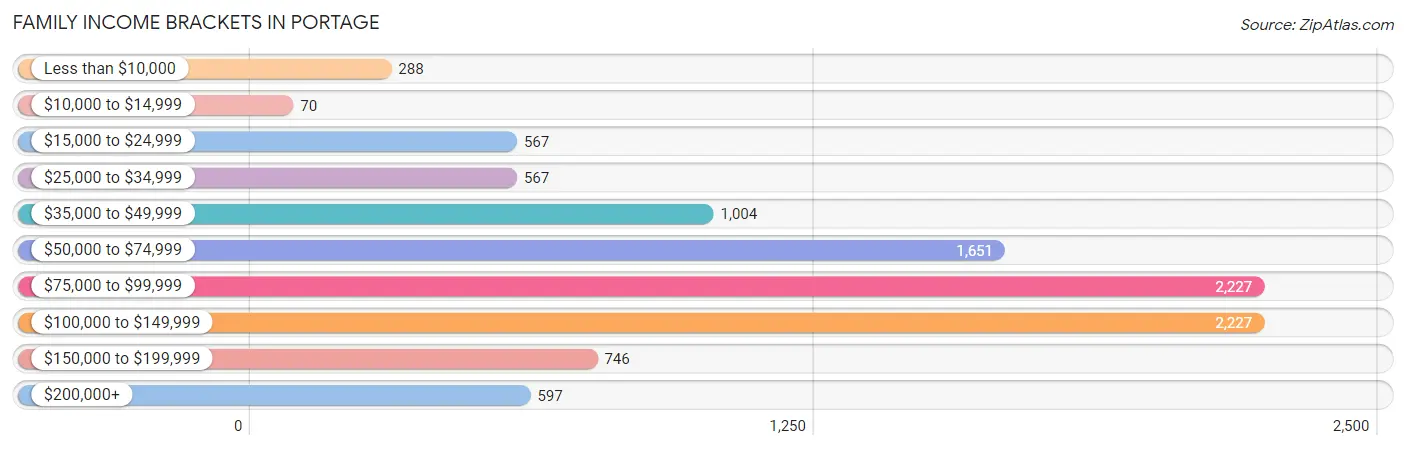
| Income Bracket | # Families | % Families |
| Less than $10,000 | 288 | 2.9% |
| $10,000 to $14,999 | 70 | 0.7% |
| $15,000 to $24,999 | 567 | 5.7% |
| $25,000 to $34,999 | 567 | 5.7% |
| $35,000 to $49,999 | 1,004 | 10.1% |
| $50,000 to $74,999 | 1,651 | 16.6% |
| $75,000 to $99,999 | 2,227 | 22.4% |
| $100,000 to $149,999 | 2,227 | 22.4% |
| $150,000 to $199,999 | 746 | 7.5% |
| $200,000+ | 597 | 6.0% |
Family Income by Famaliy Size in Portage
7+ person families (255 | 2.6%) account for the highest median family income in Portage with $104,002 per family, while 2-person families (4,350 | 43.7%) have the highest median income of $37,763 per family member.
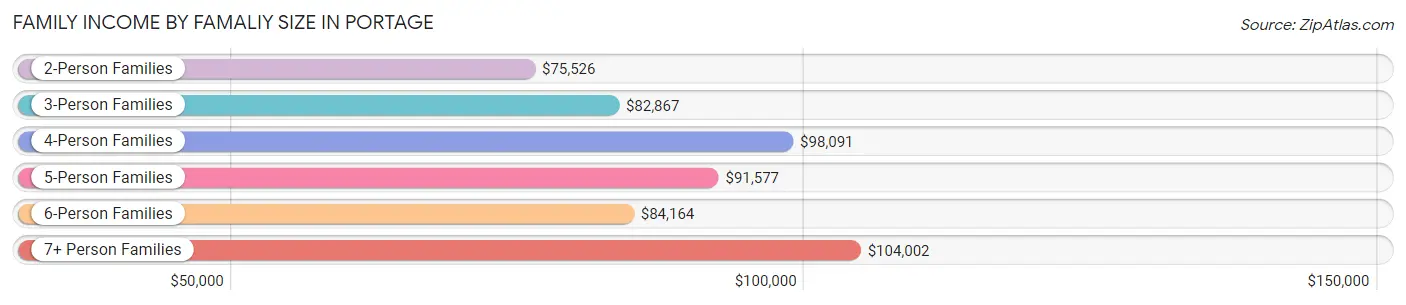
| Income Bracket | # Families | Median Income |
| 2-Person Families | 4,350 (43.7%) | $75,526 |
| 3-Person Families | 2,040 (20.5%) | $82,867 |
| 4-Person Families | 2,063 (20.7%) | $98,091 |
| 5-Person Families | 901 (9.1%) | $91,577 |
| 6-Person Families | 335 (3.4%) | $84,164 |
| 7+ Person Families | 255 (2.6%) | $104,002 |
| Total | 9,944 (100.0%) | $84,025 |
Family Income by Number of Earners in Portage
The median family income in Portage is $84,025, with families comprising 3+ earners (1,290) having the highest median family income of $122,619, while families with no earners (1,579) have the lowest median family income of $50,425, accounting for 13.0% and 15.9% of families, respectively.
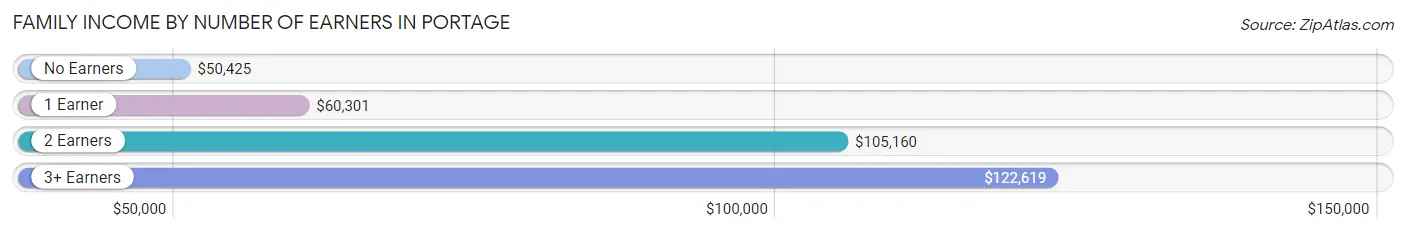
| Number of Earners | # Families | Median Income |
| No Earners | 1,579 (15.9%) | $50,425 |
| 1 Earner | 3,079 (31.0%) | $60,301 |
| 2 Earners | 3,996 (40.2%) | $105,160 |
| 3+ Earners | 1,290 (13.0%) | $122,619 |
| Total | 9,944 (100.0%) | $84,025 |
Household Income in Portage
Household Income Brackets in Portage
With 3,149 households falling in the category, the $100,000 to $149,999 income range is the most frequent in Portage, accounting for 21.0% of all households. In contrast, only 435 households (2.9%) fall into the $10,000 to $14,999 income bracket, making it the least populous group.
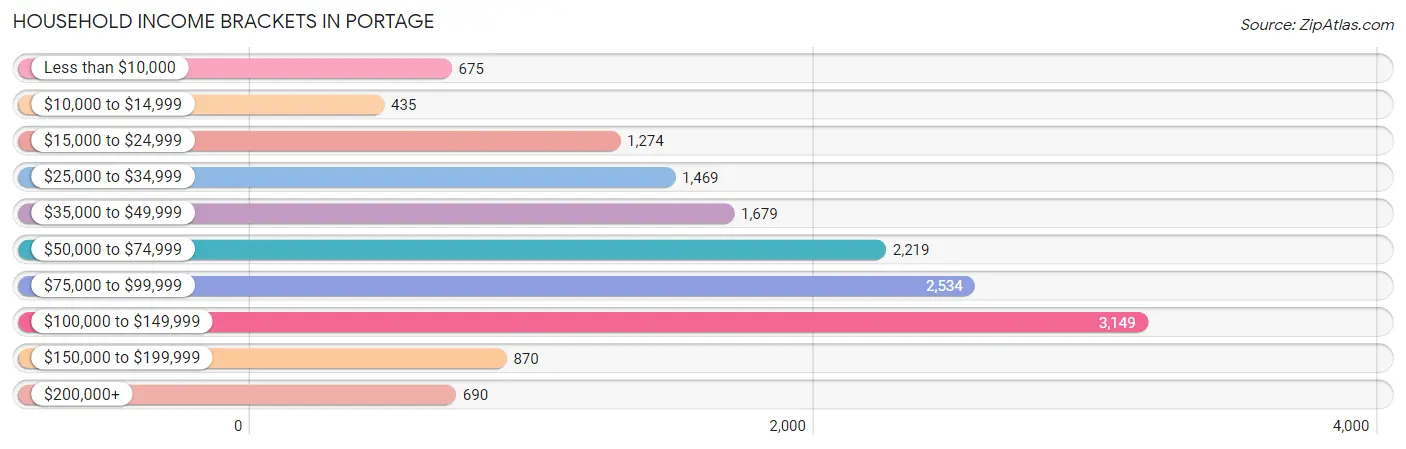
| Income Bracket | # Households | % Households |
| Less than $10,000 | 675 | 4.5% |
| $10,000 to $14,999 | 435 | 2.9% |
| $15,000 to $24,999 | 1,274 | 8.5% |
| $25,000 to $34,999 | 1,469 | 9.8% |
| $35,000 to $49,999 | 1,679 | 11.2% |
| $50,000 to $74,999 | 2,219 | 14.8% |
| $75,000 to $99,999 | 2,534 | 16.9% |
| $100,000 to $149,999 | 3,149 | 21.0% |
| $150,000 to $199,999 | 870 | 5.8% |
| $200,000+ | 690 | 4.6% |
Household Income by Householder Age in Portage
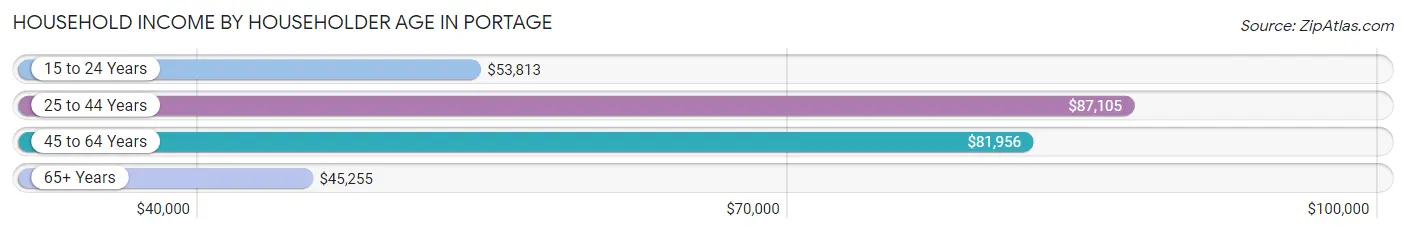
The median household income in Portage is $71,317, with the highest median household income of $87,105 found in the 25 to 44 years age bracket for the primary householder. A total of 4,614 households (30.8%) fall into this category. Meanwhile, the 65+ years age bracket for the primary householder has the lowest median household income of $45,255, with 3,697 households (24.7%) in this group.
| Income Bracket | # Households | Median Income |
| 15 to 24 Years | 483 (3.2%) | $53,813 |
| 25 to 44 Years | 4,614 (30.8%) | $87,105 |
| 45 to 64 Years | 6,199 (41.3%) | $81,956 |
| 65+ Years | 3,697 (24.7%) | $45,255 |
| Total | 14,993 (100.0%) | $71,317 |
Poverty in Portage
Income Below Poverty by Sex and Age in Portage
With 10.0% poverty level for males and 12.7% for females among the residents of Portage, 5 year old males and 12 to 14 year old females are the most vulnerable to poverty, with 54 males (32.0%) and 109 females (19.8%) in their respective age groups living below the poverty level.
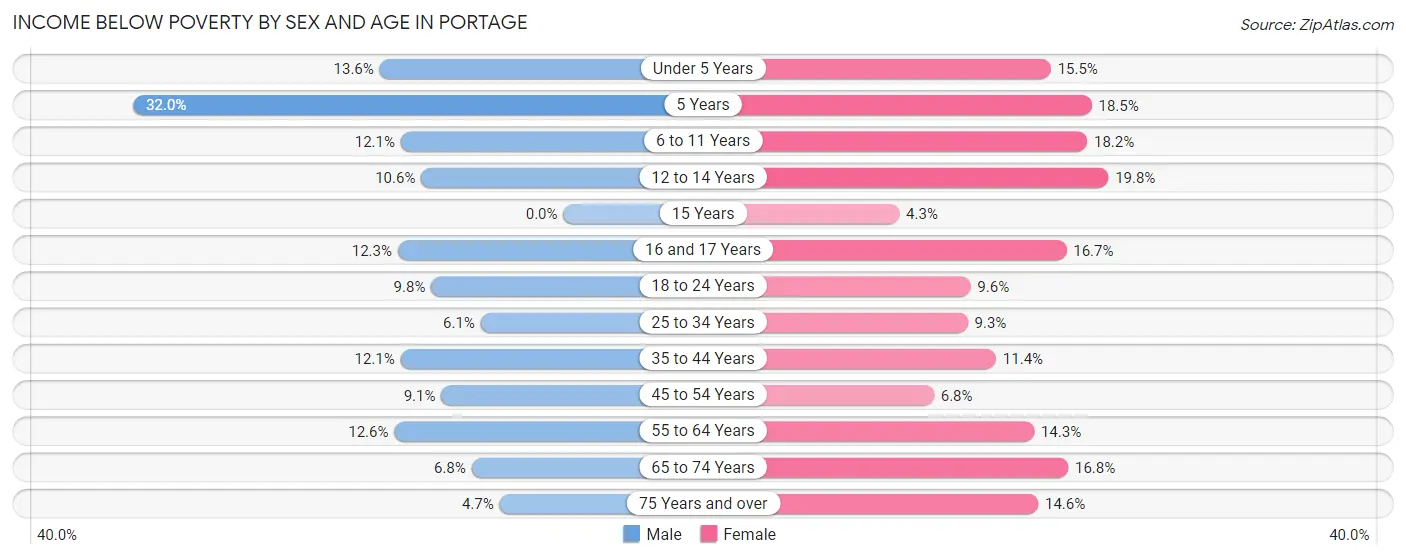
| Age Bracket | Male | Female |
| Under 5 Years | 133 (13.6%) | 147 (15.5%) |
| 5 Years | 54 (32.0%) | 28 (18.5%) |
| 6 to 11 Years | 179 (12.1%) | 317 (18.2%) |
| 12 to 14 Years | 87 (10.5%) | 109 (19.8%) |
| 15 Years | 0 (0.0%) | 8 (4.3%) |
| 16 and 17 Years | 58 (12.3%) | 72 (16.7%) |
| 18 to 24 Years | 167 (9.8%) | 159 (9.6%) |
| 25 to 34 Years | 162 (6.1%) | 278 (9.3%) |
| 35 to 44 Years | 271 (12.1%) | 270 (11.4%) |
| 45 to 54 Years | 211 (9.1%) | 159 (6.8%) |
| 55 to 64 Years | 353 (12.6%) | 371 (14.3%) |
| 65 to 74 Years | 113 (6.8%) | 365 (16.8%) |
| 75 Years and over | 32 (4.7%) | 162 (14.6%) |
| Total | 1,820 (10.0%) | 2,445 (12.7%) |
Income Above Poverty by Sex and Age in Portage
According to the poverty statistics in Portage, males aged 15 years and females aged 15 years are the age groups that are most secure financially, with 100.0% of males and 95.7% of females in these age groups living above the poverty line.
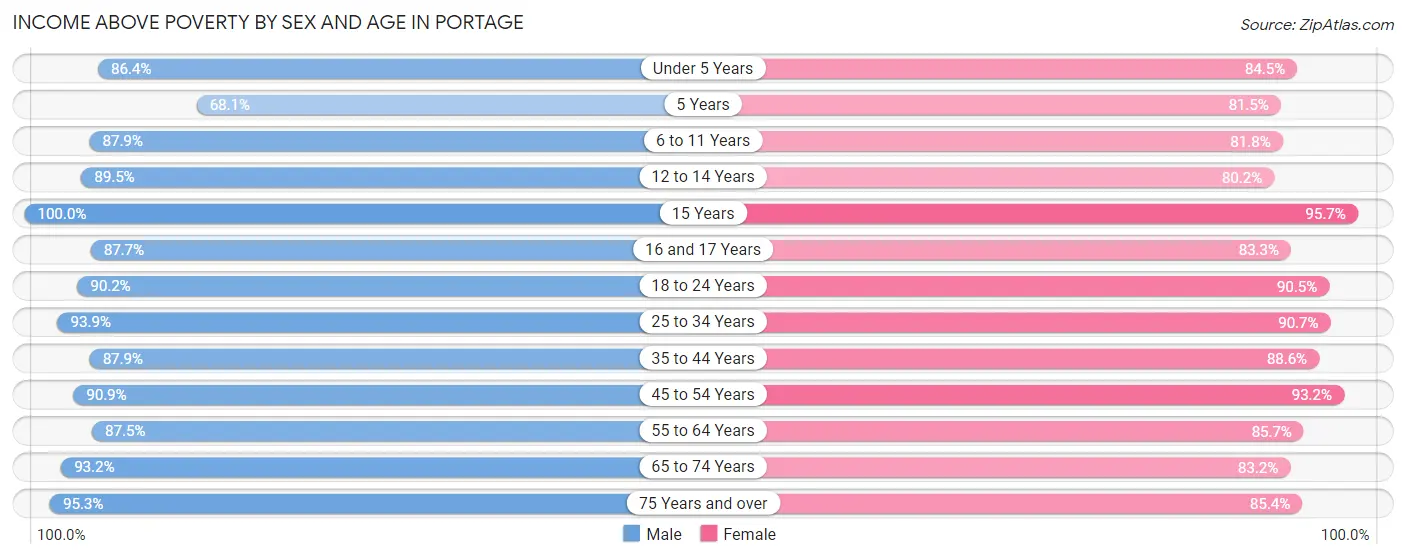
| Age Bracket | Male | Female |
| Under 5 Years | 842 (86.4%) | 801 (84.5%) |
| 5 Years | 115 (68.0%) | 123 (81.5%) |
| 6 to 11 Years | 1,304 (87.9%) | 1,424 (81.8%) |
| 12 to 14 Years | 738 (89.4%) | 442 (80.2%) |
| 15 Years | 157 (100.0%) | 180 (95.7%) |
| 16 and 17 Years | 414 (87.7%) | 360 (83.3%) |
| 18 to 24 Years | 1,535 (90.2%) | 1,506 (90.4%) |
| 25 to 34 Years | 2,475 (93.9%) | 2,698 (90.7%) |
| 35 to 44 Years | 1,970 (87.9%) | 2,091 (88.6%) |
| 45 to 54 Years | 2,119 (90.9%) | 2,169 (93.2%) |
| 55 to 64 Years | 2,460 (87.5%) | 2,228 (85.7%) |
| 65 to 74 Years | 1,546 (93.2%) | 1,808 (83.2%) |
| 75 Years and over | 643 (95.3%) | 950 (85.4%) |
| Total | 16,318 (90.0%) | 16,780 (87.3%) |
Income Below Poverty Among Married-Couple Families in Portage
The poverty statistics for married-couple families in Portage show that 4.3% or 308 of the total 7,079 families live below the poverty line. Families with 3 or 4 children have the highest poverty rate of 9.9%, comprising of 62 families. On the other hand, families with 5 or more children have the lowest poverty rate of 0.0%, which includes 0 families.
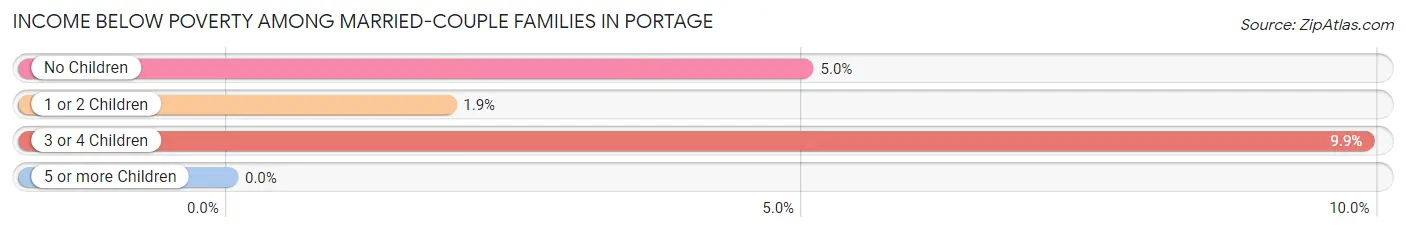
| Children | Above Poverty | Below Poverty |
| No Children | 3,851 (95.0%) | 203 (5.0%) |
| 1 or 2 Children | 2,221 (98.1%) | 43 (1.9%) |
| 3 or 4 Children | 565 (90.1%) | 62 (9.9%) |
| 5 or more Children | 134 (100.0%) | 0 (0.0%) |
| Total | 6,771 (95.7%) | 308 (4.3%) |
Income Below Poverty Among Single-Parent Households in Portage
According to the poverty data in Portage, 13.0% or 105 single-father households and 22.8% or 468 single-mother households are living below the poverty line. Among single-father households, those with 3 or 4 children have the highest poverty rate, with 19 households (25.3%) experiencing poverty. Likewise, among single-mother households, those with 3 or 4 children have the highest poverty rate, with 143 households (52.2%) falling below the poverty line.
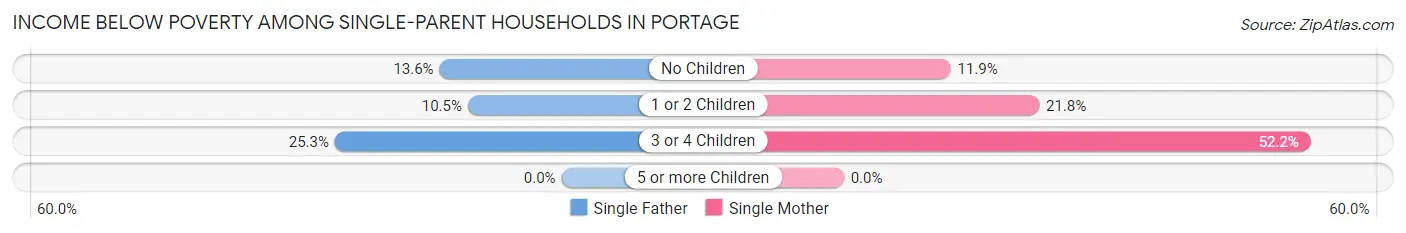
| Children | Single Father | Single Mother |
| No Children | 39 (13.6%) | 77 (11.9%) |
| 1 or 2 Children | 47 (10.5%) | 248 (21.8%) |
| 3 or 4 Children | 19 (25.3%) | 143 (52.2%) |
| 5 or more Children | 0 (0.0%) | 0 (0.0%) |
| Total | 105 (13.0%) | 468 (22.8%) |
Income Below Poverty Among Married-Couple vs Single-Parent Households in Portage
The poverty data for Portage shows that 308 of the married-couple family households (4.3%) and 573 of the single-parent households (20.0%) are living below the poverty level. Within the married-couple family households, those with 3 or 4 children have the highest poverty rate, with 62 households (9.9%) falling below the poverty line. Among the single-parent households, those with 3 or 4 children have the highest poverty rate, with 162 household (46.4%) living below poverty.
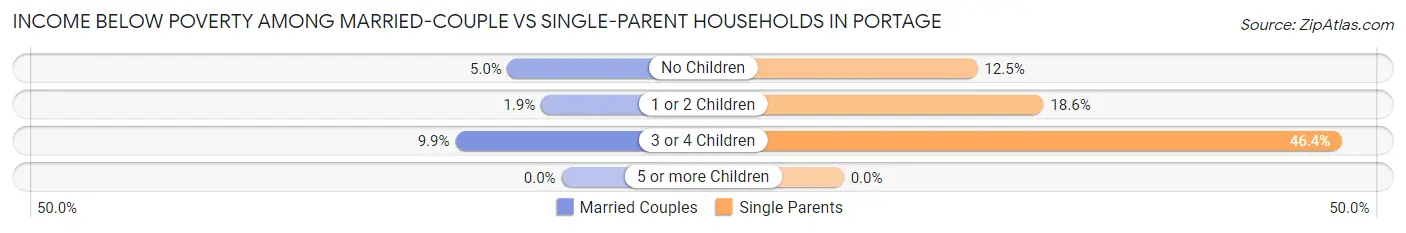
| Children | Married-Couple Families | Single-Parent Households |
| No Children | 203 (5.0%) | 116 (12.5%) |
| 1 or 2 Children | 43 (1.9%) | 295 (18.6%) |
| 3 or 4 Children | 62 (9.9%) | 162 (46.4%) |
| 5 or more Children | 0 (0.0%) | 0 (0.0%) |
| Total | 308 (4.3%) | 573 (20.0%) |
Race in Portage
The most populous races in Portage are White / Caucasian (29,300 | 77.6%), Hispanic or Latino (7,261 | 19.2%), and Black / African American (3,598 | 9.5%).
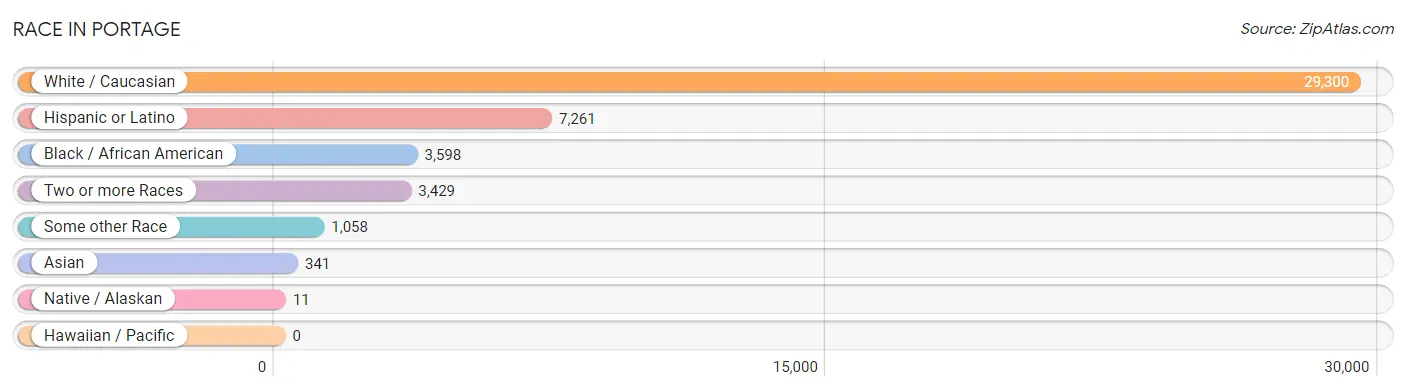
| Race | # Population | % Population |
| Asian | 341 | 0.9% |
| Black / African American | 3,598 | 9.5% |
| Hawaiian / Pacific | 0 | 0.0% |
| Hispanic or Latino | 7,261 | 19.2% |
| Native / Alaskan | 11 | 0.0% |
| White / Caucasian | 29,300 | 77.6% |
| Two or more Races | 3,429 | 9.1% |
| Some other Race | 1,058 | 2.8% |
| Total | 37,737 | 100.0% |
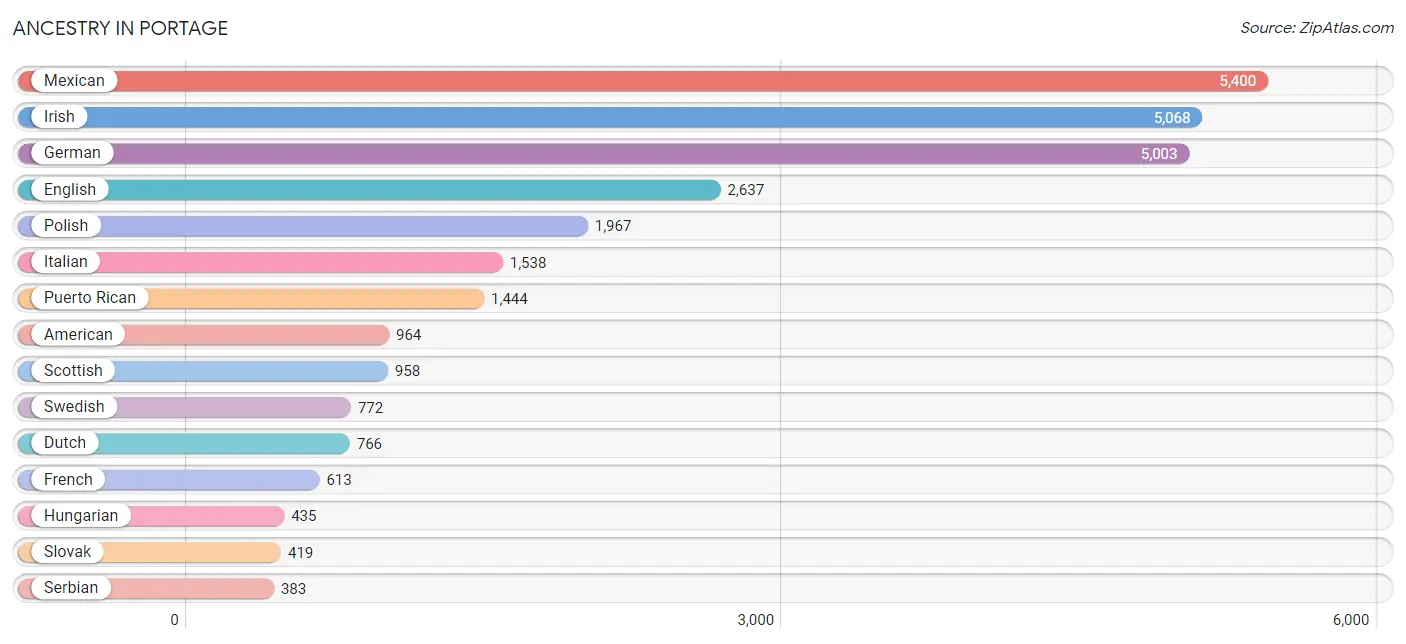
Ancestry in Portage
The most populous ancestries reported in Portage are Mexican (5,400 | 14.3%), Irish (5,068 | 13.4%), German (5,003 | 13.3%), English (2,637 | 7.0%), and Polish (1,967 | 5.2%), together accounting for 53.2% of all Portage residents.
| Ancestry | # Population | % Population |
| African | 86 | 0.2% |
| American | 964 | 2.5% |
| Arab | 34 | 0.1% |
| Assyrian / Chaldean / Syriac | 7 | 0.0% |
| Austrian | 13 | 0.0% |
| Belgian | 24 | 0.1% |
| Bhutanese | 31 | 0.1% |
| British | 55 | 0.2% |
| Burmese | 27 | 0.1% |
| Canadian | 168 | 0.4% |
| Central American | 82 | 0.2% |
| Cherokee | 139 | 0.4% |
| Choctaw | 26 | 0.1% |
| Creek | 19 | 0.1% |
| Croatian | 221 | 0.6% |
| Czech | 217 | 0.6% |
| Czechoslovakian | 22 | 0.1% |
| Danish | 52 | 0.1% |
| Dutch | 766 | 2.0% |
| Eastern European | 111 | 0.3% |
| English | 2,637 | 7.0% |
| European | 160 | 0.4% |
| Finnish | 112 | 0.3% |
| French | 613 | 1.6% |
| French Canadian | 49 | 0.1% |
| German | 5,003 | 13.3% |
| Greek | 140 | 0.4% |
| Honduran | 59 | 0.2% |
| Hungarian | 435 | 1.1% |
| Indian (Asian) | 182 | 0.5% |
| Iranian | 7 | 0.0% |
| Irish | 5,068 | 13.4% |
| Italian | 1,538 | 4.1% |
| Japanese | 22 | 0.1% |
| Korean | 124 | 0.3% |
| Lebanese | 10 | 0.0% |
| Lithuanian | 119 | 0.3% |
| Macedonian | 80 | 0.2% |
| Mexican | 5,400 | 14.3% |
| Nigerian | 108 | 0.3% |
| Northern European | 26 | 0.1% |
| Norwegian | 73 | 0.2% |
| Pakistani | 36 | 0.1% |
| Palestinian | 24 | 0.1% |
| Panamanian | 14 | 0.0% |
| Polish | 1,967 | 5.2% |
| Portuguese | 29 | 0.1% |
| Puerto Rican | 1,444 | 3.8% |
| Romanian | 128 | 0.3% |
| Russian | 75 | 0.2% |
| Salvadoran | 9 | 0.0% |
| Scotch-Irish | 213 | 0.6% |
| Scottish | 958 | 2.5% |
| Serbian | 383 | 1.0% |
| Slavic | 16 | 0.0% |
| Slovak | 419 | 1.1% |
| Spaniard | 143 | 0.4% |
| Spanish | 184 | 0.5% |
| Sri Lankan | 41 | 0.1% |
| Subsaharan African | 194 | 0.5% |
| Swedish | 772 | 2.1% |
| Swiss | 81 | 0.2% |
| Thai | 12 | 0.0% |
| Ukrainian | 48 | 0.1% |
| Welsh | 57 | 0.2% |
| Yugoslavian | 9 | 0.0% | View All 66 Rows |
Immigrants in Portage
The most numerous immigrant groups reported in Portage came from Latin America (733 | 1.9%), Central America (705 | 1.9%), Mexico (682 | 1.8%), Europe (262 | 0.7%), and Eastern Europe (209 | 0.5%), together accounting for 6.9% of all Portage residents.
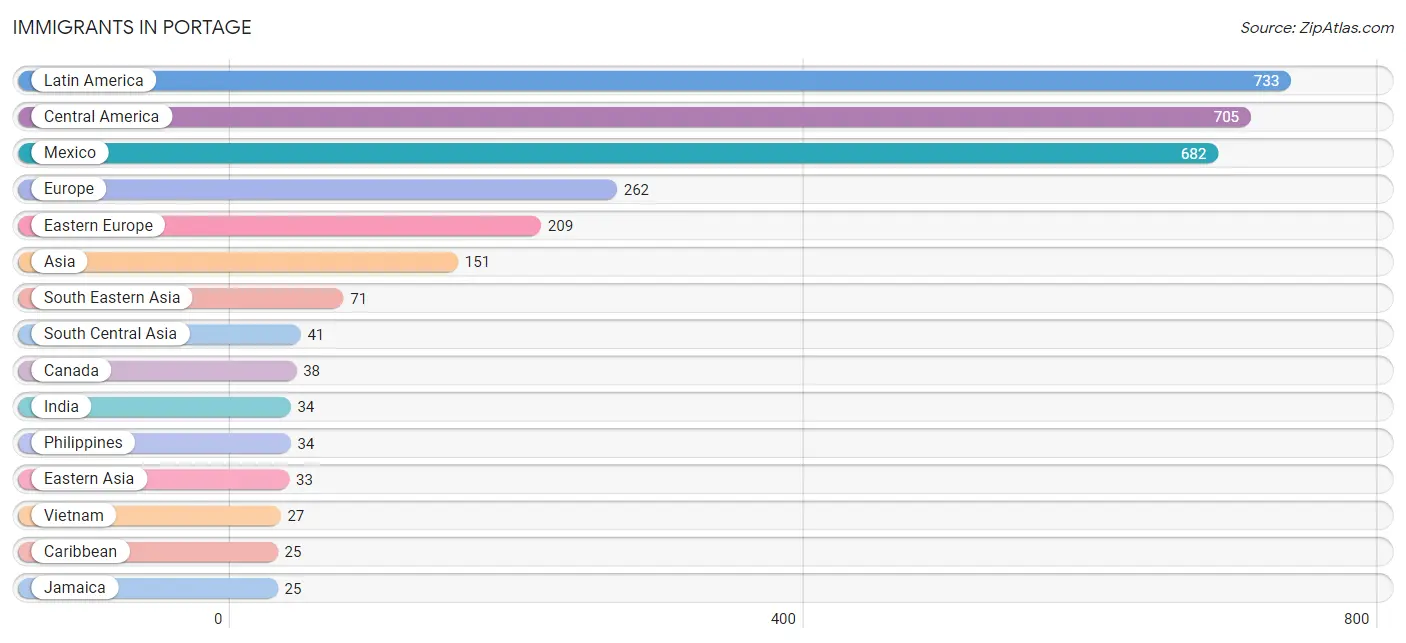
| Immigration Origin | # Population | % Population |
| Africa | 14 | 0.0% |
| Asia | 151 | 0.4% |
| Brazil | 3 | 0.0% |
| Canada | 38 | 0.1% |
| Caribbean | 25 | 0.1% |
| Central America | 705 | 1.9% |
| China | 21 | 0.1% |
| Czechoslovakia | 10 | 0.0% |
| Eastern Asia | 33 | 0.1% |
| Eastern Europe | 209 | 0.5% |
| El Salvador | 9 | 0.0% |
| England | 12 | 0.0% |
| Europe | 262 | 0.7% |
| France | 17 | 0.1% |
| Germany | 5 | 0.0% |
| Greece | 19 | 0.1% |
| Hungary | 2 | 0.0% |
| India | 34 | 0.1% |
| Iran | 7 | 0.0% |
| Jamaica | 25 | 0.1% |
| Korea | 12 | 0.0% |
| Latin America | 733 | 1.9% |
| Mexico | 682 | 1.8% |
| Nigeria | 14 | 0.0% |
| Northern Europe | 12 | 0.0% |
| Panama | 14 | 0.0% |
| Philippines | 34 | 0.1% |
| Serbia | 4 | 0.0% |
| South America | 3 | 0.0% |
| South Central Asia | 41 | 0.1% |
| South Eastern Asia | 71 | 0.2% |
| Southern Europe | 19 | 0.1% |
| Thailand | 10 | 0.0% |
| Vietnam | 27 | 0.1% |
| Western Africa | 14 | 0.0% |
| Western Europe | 22 | 0.1% | View All 36 Rows |
Sex and Age in Portage
Sex and Age in Portage
The most populous age groups in Portage are 25 to 29 Years (1,479 | 8.0%) for men and 30 to 34 Years (1,499 | 7.7%) for women.
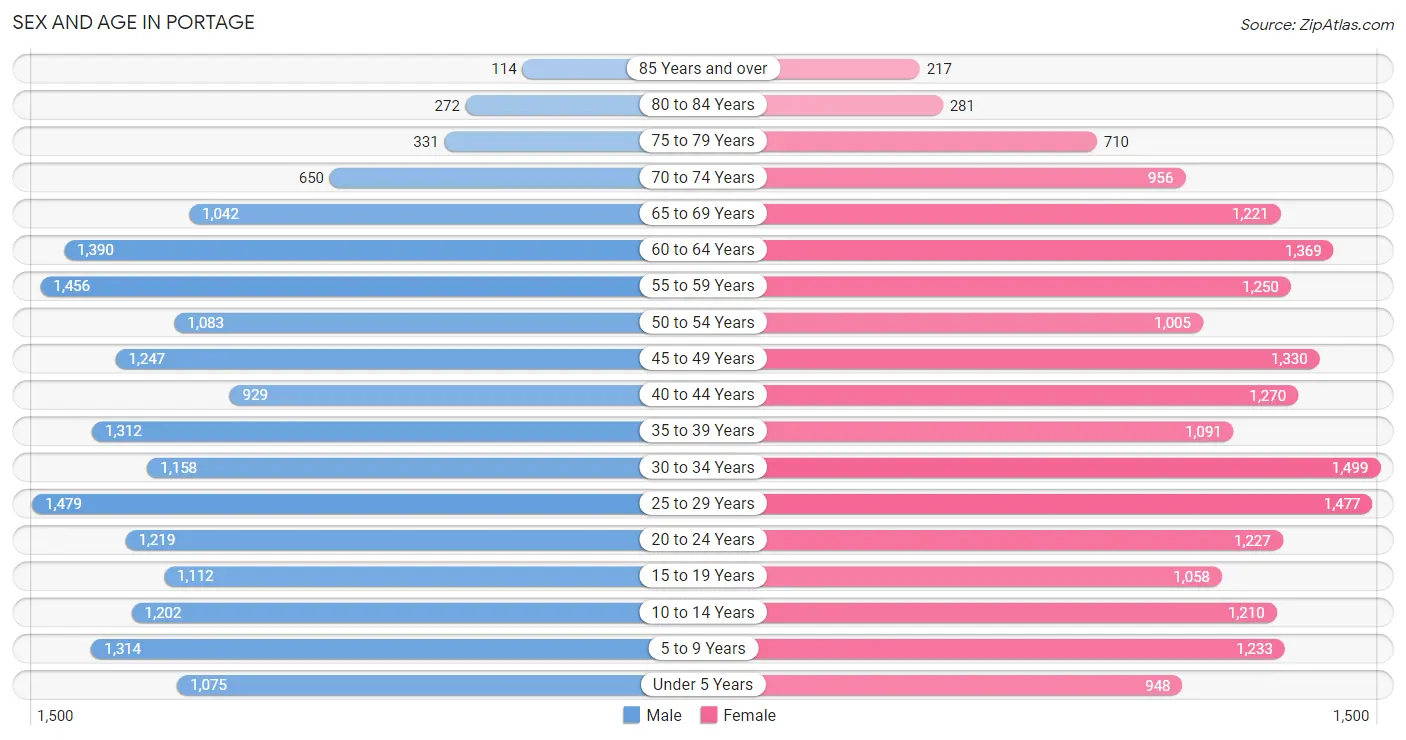
| Age Bracket | Male | Female |
| Under 5 Years | 1,075 (5.9%) | 948 (4.9%) |
| 5 to 9 Years | 1,314 (7.1%) | 1,233 (6.4%) |
| 10 to 14 Years | 1,202 (6.5%) | 1,210 (6.2%) |
| 15 to 19 Years | 1,112 (6.0%) | 1,058 (5.5%) |
| 20 to 24 Years | 1,219 (6.6%) | 1,227 (6.3%) |
| 25 to 29 Years | 1,479 (8.0%) | 1,477 (7.6%) |
| 30 to 34 Years | 1,158 (6.3%) | 1,499 (7.7%) |
| 35 to 39 Years | 1,312 (7.1%) | 1,091 (5.6%) |
| 40 to 44 Years | 929 (5.1%) | 1,270 (6.6%) |
| 45 to 49 Years | 1,247 (6.8%) | 1,330 (6.9%) |
| 50 to 54 Years | 1,083 (5.9%) | 1,005 (5.2%) |
| 55 to 59 Years | 1,456 (7.9%) | 1,250 (6.5%) |
| 60 to 64 Years | 1,390 (7.6%) | 1,369 (7.1%) |
| 65 to 69 Years | 1,042 (5.7%) | 1,221 (6.3%) |
| 70 to 74 Years | 650 (3.5%) | 956 (4.9%) |
| 75 to 79 Years | 331 (1.8%) | 710 (3.7%) |
| 80 to 84 Years | 272 (1.5%) | 281 (1.5%) |
| 85 Years and over | 114 (0.6%) | 217 (1.1%) |
| Total | 18,385 (100.0%) | 19,352 (100.0%) |
Families and Households in Portage
Median Family Size in Portage
The median family size in Portage is 3.06 persons per family, with single female/mother families (2,055 | 20.7%) accounting for the largest median family size of 3.1 persons per family. On the other hand, single male/father families (810 | 8.2%) represent the smallest median family size with 2.89 persons per family.
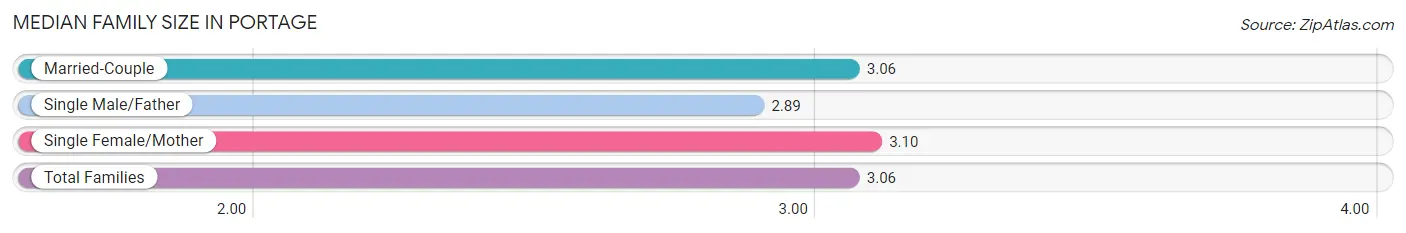
| Family Type | # Families | Family Size |
| Married-Couple | 7,079 (71.2%) | 3.06 |
| Single Male/Father | 810 (8.2%) | 2.89 |
| Single Female/Mother | 2,055 (20.7%) | 3.10 |
| Total Families | 9,944 (100.0%) | 3.06 |
Median Household Size in Portage
The median household size in Portage is 2.50 persons per household, with single female/mother households (2,055 | 13.7%) accounting for the largest median household size of 3.26 persons per household. non-family households (5,049 | 33.7%) represent the smallest median household size with 1.18 persons per household.
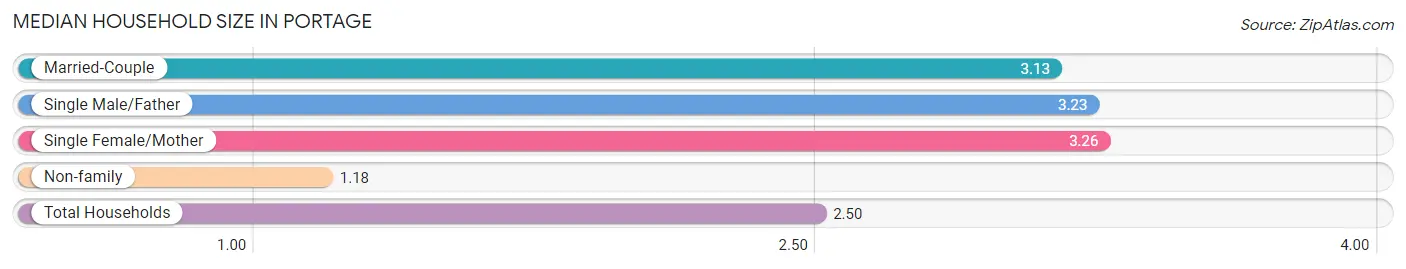
| Household Type | # Households | Household Size |
| Married-Couple | 7,079 (47.2%) | 3.13 |
| Single Male/Father | 810 (5.4%) | 3.23 |
| Single Female/Mother | 2,055 (13.7%) | 3.26 |
| Non-family | 5,049 (33.7%) | 1.18 |
| Total Households | 14,993 (100.0%) | 2.50 |
Household Size by Marriage Status in Portage
Out of a total of 14,993 households in Portage, 9,944 (66.3%) are family households, while 5,049 (33.7%) are nonfamily households. The most numerous type of family households are 2-person households, comprising 4,049, and the most common type of nonfamily households are 1-person households, comprising 4,268.
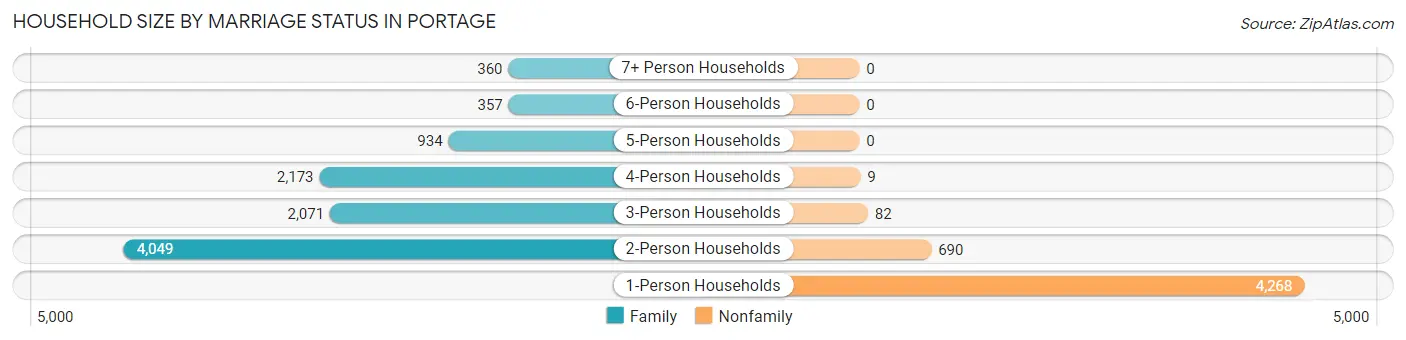
| Household Size | Family Households | Nonfamily Households |
| 1-Person Households | - | 4,268 (28.5%) |
| 2-Person Households | 4,049 (27.0%) | 690 (4.6%) |
| 3-Person Households | 2,071 (13.8%) | 82 (0.5%) |
| 4-Person Households | 2,173 (14.5%) | 9 (0.1%) |
| 5-Person Households | 934 (6.2%) | 0 (0.0%) |
| 6-Person Households | 357 (2.4%) | 0 (0.0%) |
| 7+ Person Households | 360 (2.4%) | 0 (0.0%) |
| Total | 9,944 (66.3%) | 5,049 (33.7%) |
Female Fertility in Portage
Fertility by Age in Portage
Average fertility rate in Portage is 44.0 births per 1,000 women. Women in the age bracket of 20 to 34 years have the highest fertility rate with 90.0 births per 1,000 women. Women in the age bracket of 20 to 34 years acount for 93.8% of all women with births.
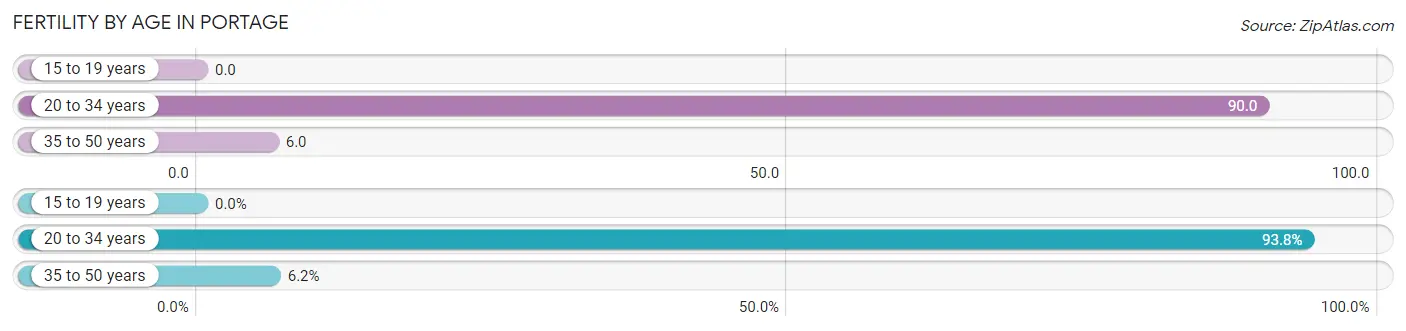
| Age Bracket | Women with Births | Births / 1,000 Women |
| 15 to 19 years | 0 (0.0%) | 0.0 |
| 20 to 34 years | 380 (93.8%) | 90.0 |
| 35 to 50 years | 25 (6.2%) | 6.0 |
| Total | 405 (100.0%) | 44.0 |
Fertility by Age by Marriage Status in Portage
85.4% of women with births (405) in Portage are married. The highest percentage of unmarried women with births falls into 20 to 34 years age bracket with 15.5% of them unmarried at the time of birth, while the lowest percentage of unmarried women with births belong to 35 to 50 years age bracket with 0.0% of them unmarried.
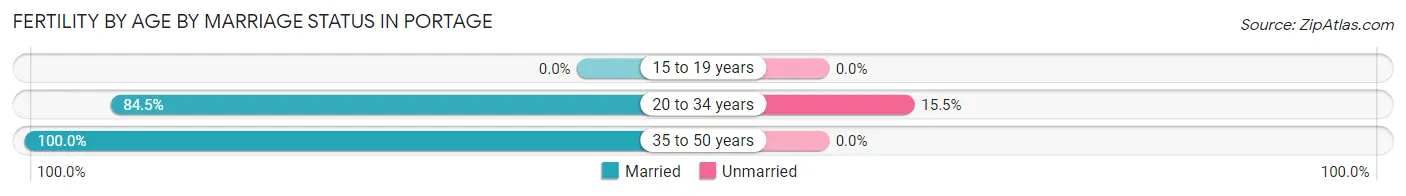
| Age Bracket | Married | Unmarried |
| 15 to 19 years | 0 (0.0%) | 0 (0.0%) |
| 20 to 34 years | 321 (84.5%) | 59 (15.5%) |
| 35 to 50 years | 25 (100.0%) | 0 (0.0%) |
| Total | 346 (85.4%) | 59 (14.6%) |
Fertility by Education in Portage
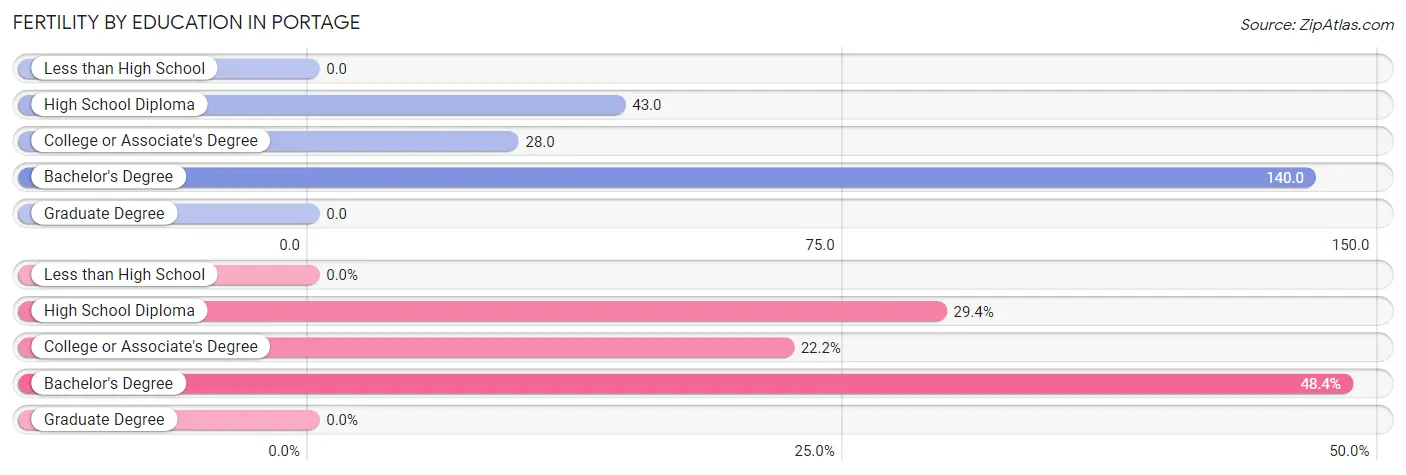
| Educational Attainment | Women with Births | Births / 1,000 Women |
| Less than High School | 0 (0.0%) | 0.0 |
| High School Diploma | 119 (29.4%) | 43.0 |
| College or Associate's Degree | 90 (22.2%) | 28.0 |
| Bachelor's Degree | 196 (48.4%) | 140.0 |
| Graduate Degree | 0 (0.0%) | 0.0 |
| Total | 405 (100.0%) | 44.0 |
Fertility by Education by Marriage Status in Portage
14.6% of women with births in Portage are unmarried. Women with the educational attainment of high school diploma are most likely to be married with 94.1% of them married at childbirth, while women with the educational attainment of college or associate's degree are least likely to be married with 23.3% of them unmarried at childbirth.
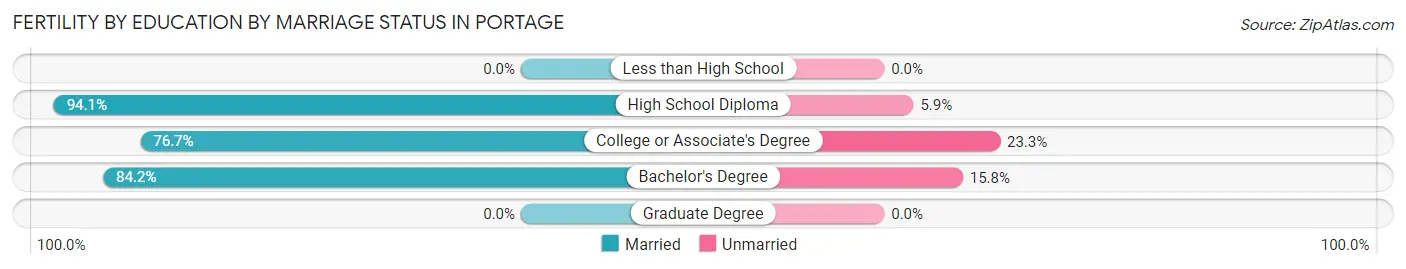
| Educational Attainment | Married | Unmarried |
| Less than High School | 0 (0.0%) | 0 (0.0%) |
| High School Diploma | 112 (94.1%) | 7 (5.9%) |
| College or Associate's Degree | 69 (76.7%) | 21 (23.3%) |
| Bachelor's Degree | 165 (84.2%) | 31 (15.8%) |
| Graduate Degree | 0 (0.0%) | 0 (0.0%) |
| Total | 346 (85.4%) | 59 (14.6%) |
Employment Characteristics in Portage
Employment by Class of Employer in Portage
Among the 17,624 employed individuals in Portage, private company employees (13,299 | 75.5%), local government employees (1,350 | 7.7%), and not-for-profit organizations (1,198 | 6.8%) make up the most common classes of employment.
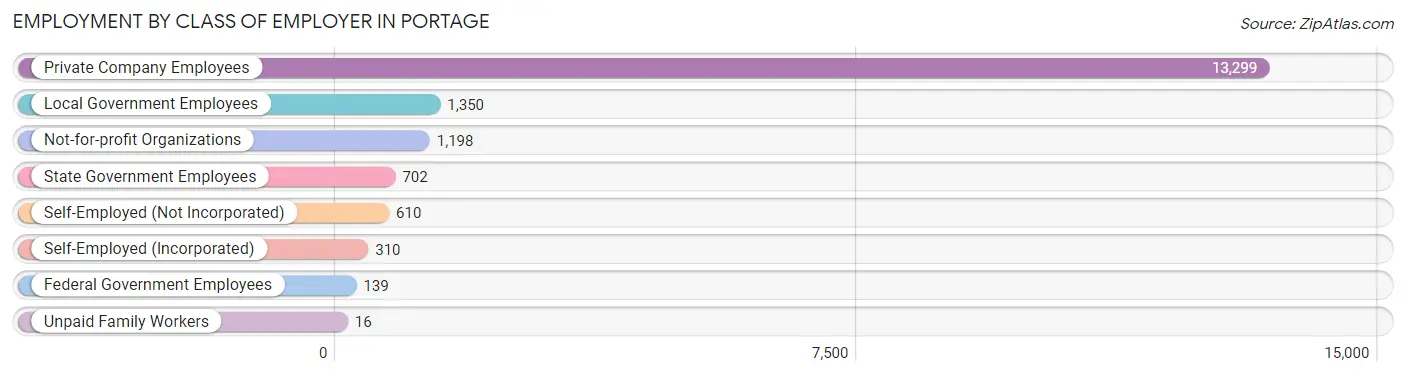
| Employer Class | # Employees | % Employees |
| Private Company Employees | 13,299 | 75.5% |
| Self-Employed (Incorporated) | 310 | 1.8% |
| Self-Employed (Not Incorporated) | 610 | 3.5% |
| Not-for-profit Organizations | 1,198 | 6.8% |
| Local Government Employees | 1,350 | 7.7% |
| State Government Employees | 702 | 4.0% |
| Federal Government Employees | 139 | 0.8% |
| Unpaid Family Workers | 16 | 0.1% |
| Total | 17,624 | 100.0% |
Employment Status by Age in Portage
According to the labor force statistics for Portage, out of the total population over 16 years of age (30,410), 63.8% or 19,402 individuals are in the labor force, with 6.6% or 1,281 of them unemployed. The age group with the highest labor force participation rate is 25 to 29 years, with 88.0% or 2,601 individuals in the labor force. Within the labor force, the 55 to 59 years age range has the highest percentage of unemployed individuals, with 16.0% or 345 of them being unemployed.
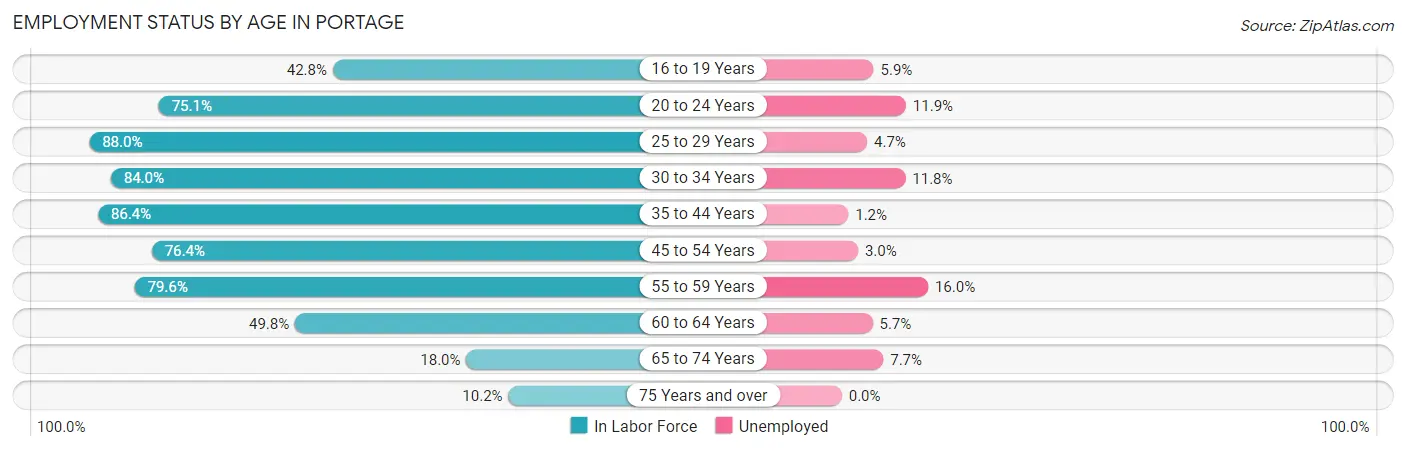
| Age Bracket | In Labor Force | Unemployed |
| 16 to 19 Years | 781 (42.8%) | 46 (5.9%) |
| 20 to 24 Years | 1,837 (75.1%) | 219 (11.9%) |
| 25 to 29 Years | 2,601 (88.0%) | 122 (4.7%) |
| 30 to 34 Years | 2,232 (84.0%) | 263 (11.8%) |
| 35 to 44 Years | 3,976 (86.4%) | 48 (1.2%) |
| 45 to 54 Years | 3,564 (76.4%) | 107 (3.0%) |
| 55 to 59 Years | 2,154 (79.6%) | 345 (16.0%) |
| 60 to 64 Years | 1,374 (49.8%) | 78 (5.7%) |
| 65 to 74 Years | 696 (18.0%) | 54 (7.7%) |
| 75 Years and over | 196 (10.2%) | 0 (0.0%) |
| Total | 19,402 (63.8%) | 1,281 (6.6%) |
Employment Status by Educational Attainment in Portage
According to labor force statistics for Portage, 78.2% of individuals (15,910) out of the total population between 25 and 64 years of age (20,345) are in the labor force, with 6.1% or 971 of them being unemployed. The group with the highest labor force participation rate are those with the educational attainment of bachelor's degree or higher, with 96.2% or 3,010 individuals in the labor force. Within the labor force, individuals with less than high school education have the highest percentage of unemployment, with 7.2% or 86 of them being unemployed.

| Educational Attainment | In Labor Force | Unemployed |
| Less than High School | 1,198 (64.9%) | 133 (7.2%) |
| High School Diploma | 5,788 (72.4%) | 544 (6.8%) |
| College / Associate Degree | 5,900 (80.0%) | 509 (6.9%) |
| Bachelor's Degree or higher | 3,010 (96.2%) | 78 (2.5%) |
| Total | 15,910 (78.2%) | 1,241 (6.1%) |
Employment Occupations by Sex in Portage
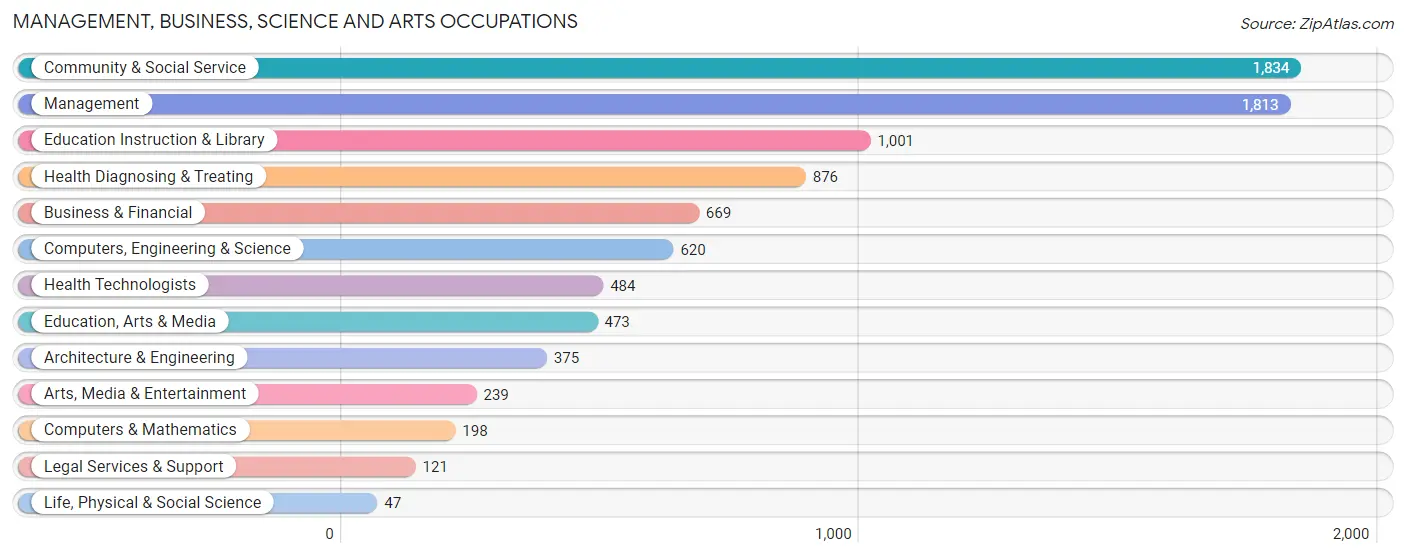
Management, Business, Science and Arts Occupations
The most common Management, Business, Science and Arts occupations in Portage are Community & Social Service (1,834 | 10.1%), Management (1,813 | 10.0%), Education Instruction & Library (1,001 | 5.5%), Health Diagnosing & Treating (876 | 4.8%), and Business & Financial (669 | 3.7%).
Management, Business, Science and Arts Occupations by Sex
Within the Management, Business, Science and Arts occupations in Portage, the most male-oriented occupations are Architecture & Engineering (93.3%), Computers & Mathematics (87.9%), and Computers, Engineering & Science (84.5%), while the most female-oriented occupations are Life, Physical & Social Science (100.0%), Education Instruction & Library (85.0%), and Legal Services & Support (83.5%).
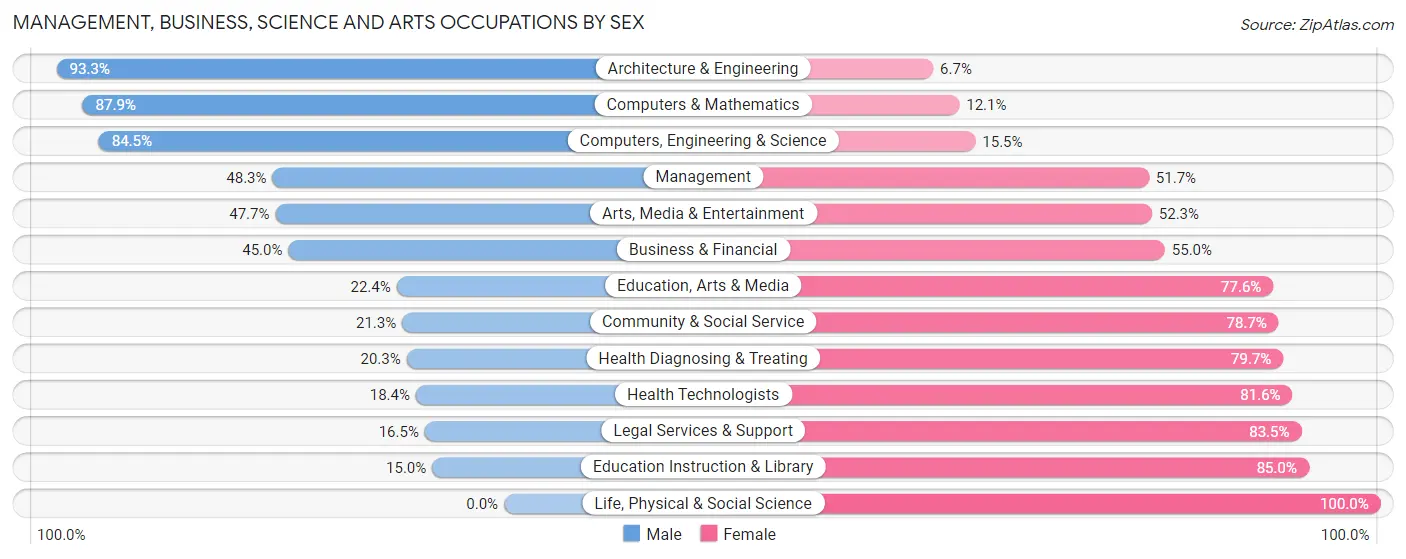
| Occupation | Male | Female |
| Management | 876 (48.3%) | 937 (51.7%) |
| Business & Financial | 301 (45.0%) | 368 (55.0%) |
| Computers, Engineering & Science | 524 (84.5%) | 96 (15.5%) |
| Computers & Mathematics | 174 (87.9%) | 24 (12.1%) |
| Architecture & Engineering | 350 (93.3%) | 25 (6.7%) |
| Life, Physical & Social Science | 0 (0.0%) | 47 (100.0%) |
| Community & Social Service | 390 (21.3%) | 1,444 (78.7%) |
| Education, Arts & Media | 106 (22.4%) | 367 (77.6%) |
| Legal Services & Support | 20 (16.5%) | 101 (83.5%) |
| Education Instruction & Library | 150 (15.0%) | 851 (85.0%) |
| Arts, Media & Entertainment | 114 (47.7%) | 125 (52.3%) |
| Health Diagnosing & Treating | 178 (20.3%) | 698 (79.7%) |
| Health Technologists | 89 (18.4%) | 395 (81.6%) |
| Total (Category) | 2,269 (39.0%) | 3,543 (61.0%) |
| Total (Overall) | 9,592 (52.9%) | 8,536 (47.1%) |
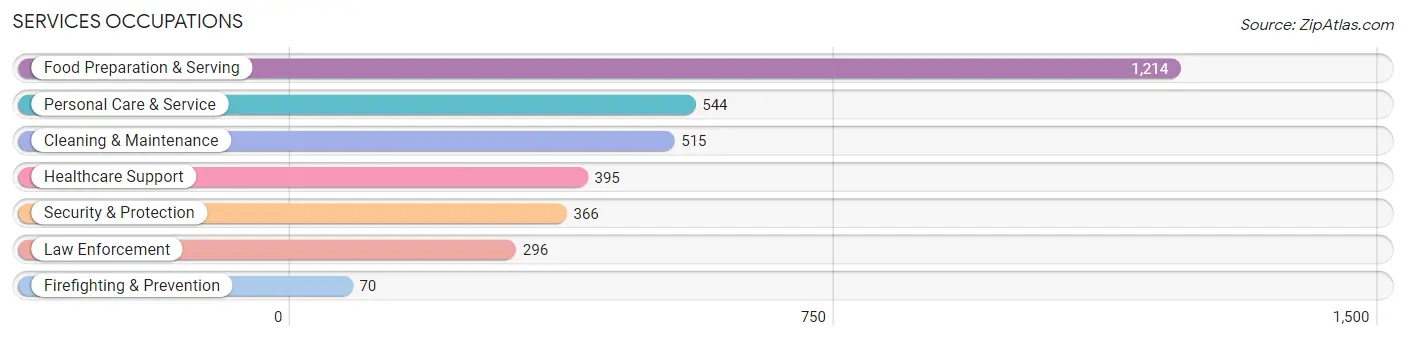
Services Occupations
The most common Services occupations in Portage are Food Preparation & Serving (1,214 | 6.7%), Personal Care & Service (544 | 3.0%), Cleaning & Maintenance (515 | 2.8%), Healthcare Support (395 | 2.2%), and Security & Protection (366 | 2.0%).
Services Occupations by Sex
Within the Services occupations in Portage, the most male-oriented occupations are Firefighting & Prevention (90.0%), Security & Protection (85.3%), and Law Enforcement (84.1%), while the most female-oriented occupations are Personal Care & Service (93.8%), Healthcare Support (88.1%), and Food Preparation & Serving (39.5%).
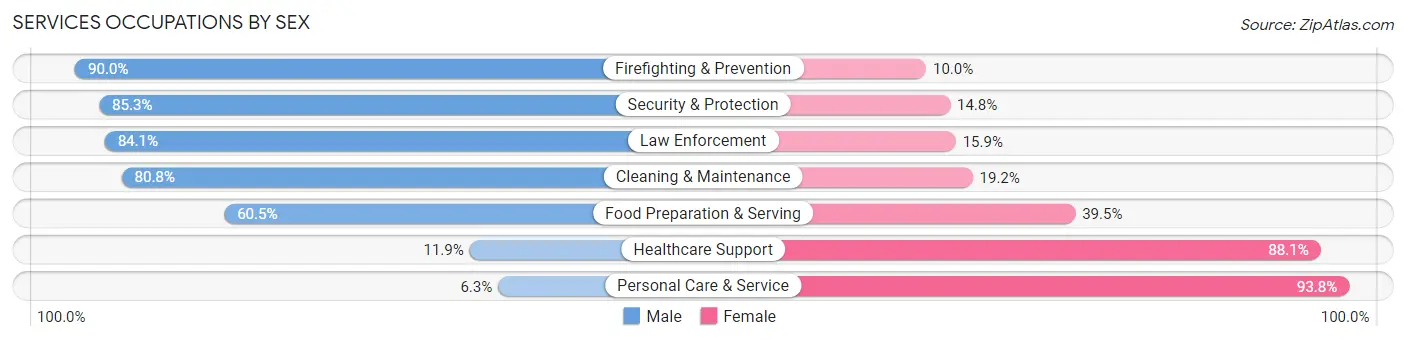
| Occupation | Male | Female |
| Healthcare Support | 47 (11.9%) | 348 (88.1%) |
| Security & Protection | 312 (85.3%) | 54 (14.7%) |
| Firefighting & Prevention | 63 (90.0%) | 7 (10.0%) |
| Law Enforcement | 249 (84.1%) | 47 (15.9%) |
| Food Preparation & Serving | 734 (60.5%) | 480 (39.5%) |
| Cleaning & Maintenance | 416 (80.8%) | 99 (19.2%) |
| Personal Care & Service | 34 (6.2%) | 510 (93.8%) |
| Total (Category) | 1,543 (50.9%) | 1,491 (49.1%) |
| Total (Overall) | 9,592 (52.9%) | 8,536 (47.1%) |
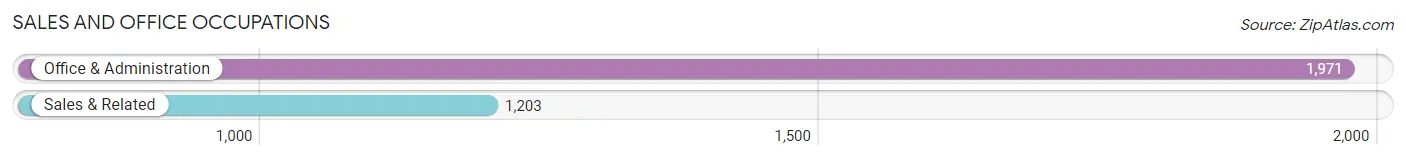
Sales and Office Occupations
The most common Sales and Office occupations in Portage are Office & Administration (1,971 | 10.9%), and Sales & Related (1,203 | 6.6%).
Sales and Office Occupations by Sex
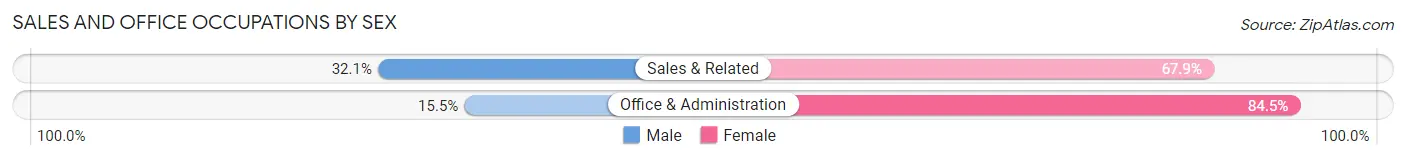
| Occupation | Male | Female |
| Sales & Related | 386 (32.1%) | 817 (67.9%) |
| Office & Administration | 305 (15.5%) | 1,666 (84.5%) |
| Total (Category) | 691 (21.8%) | 2,483 (78.2%) |
| Total (Overall) | 9,592 (52.9%) | 8,536 (47.1%) |
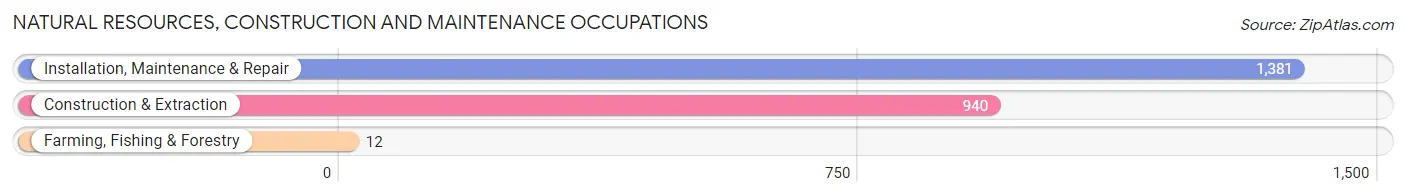
Natural Resources, Construction and Maintenance Occupations
The most common Natural Resources, Construction and Maintenance occupations in Portage are Installation, Maintenance & Repair (1,381 | 7.6%), Construction & Extraction (940 | 5.2%), and Farming, Fishing & Forestry (12 | 0.1%).
Natural Resources, Construction and Maintenance Occupations by Sex
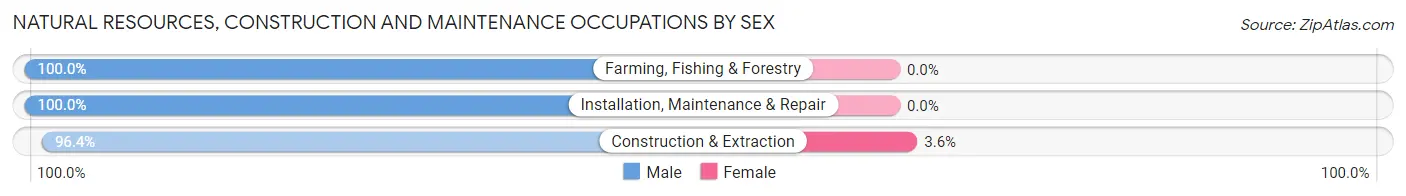
| Occupation | Male | Female |
| Farming, Fishing & Forestry | 12 (100.0%) | 0 (0.0%) |
| Construction & Extraction | 906 (96.4%) | 34 (3.6%) |
| Installation, Maintenance & Repair | 1,381 (100.0%) | 0 (0.0%) |
| Total (Category) | 2,299 (98.5%) | 34 (1.5%) |
| Total (Overall) | 9,592 (52.9%) | 8,536 (47.1%) |
Production, Transportation and Moving Occupations
The most common Production, Transportation and Moving occupations in Portage are Production (1,464 | 8.1%), Material Moving (1,444 | 8.0%), and Transportation (867 | 4.8%).
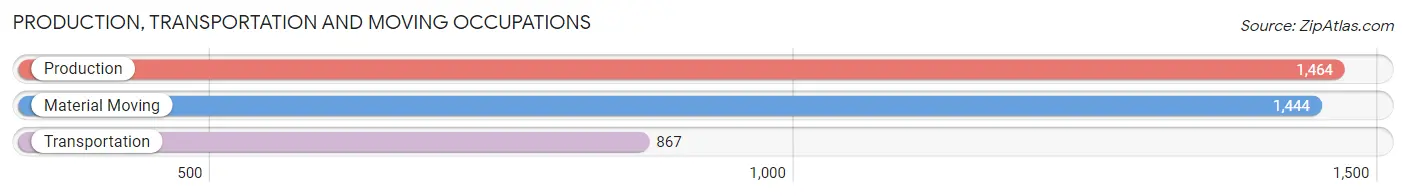
Production, Transportation and Moving Occupations by Sex
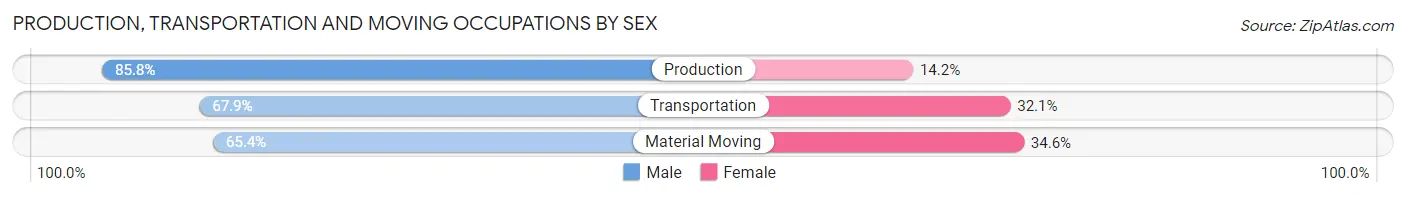
| Occupation | Male | Female |
| Production | 1,256 (85.8%) | 208 (14.2%) |
| Transportation | 589 (67.9%) | 278 (32.1%) |
| Material Moving | 945 (65.4%) | 499 (34.6%) |
| Total (Category) | 2,790 (73.9%) | 985 (26.1%) |
| Total (Overall) | 9,592 (52.9%) | 8,536 (47.1%) |
Employment Industries by Sex in Portage
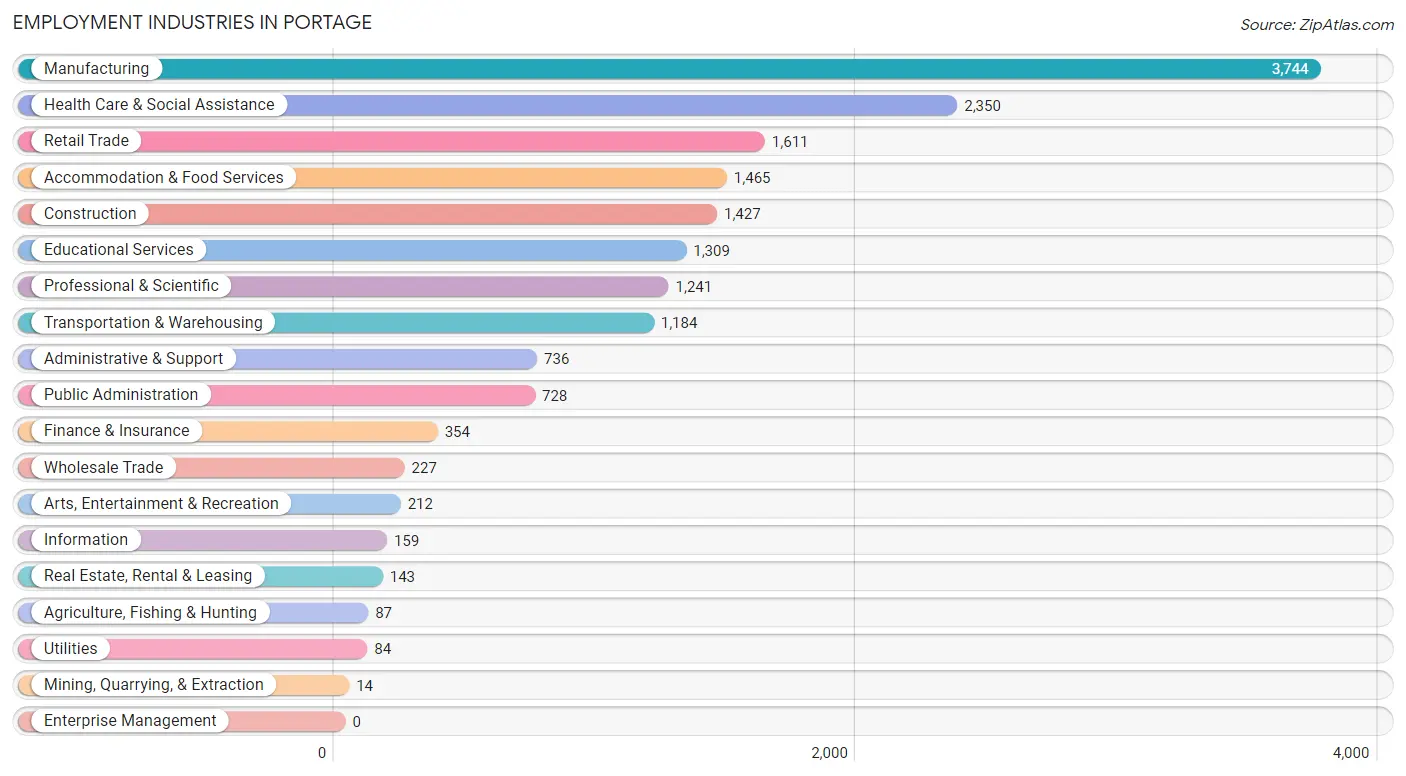
Employment Industries in Portage
The major employment industries in Portage include Manufacturing (3,744 | 20.6%), Health Care & Social Assistance (2,350 | 13.0%), Retail Trade (1,611 | 8.9%), Accommodation & Food Services (1,465 | 8.1%), and Construction (1,427 | 7.9%).
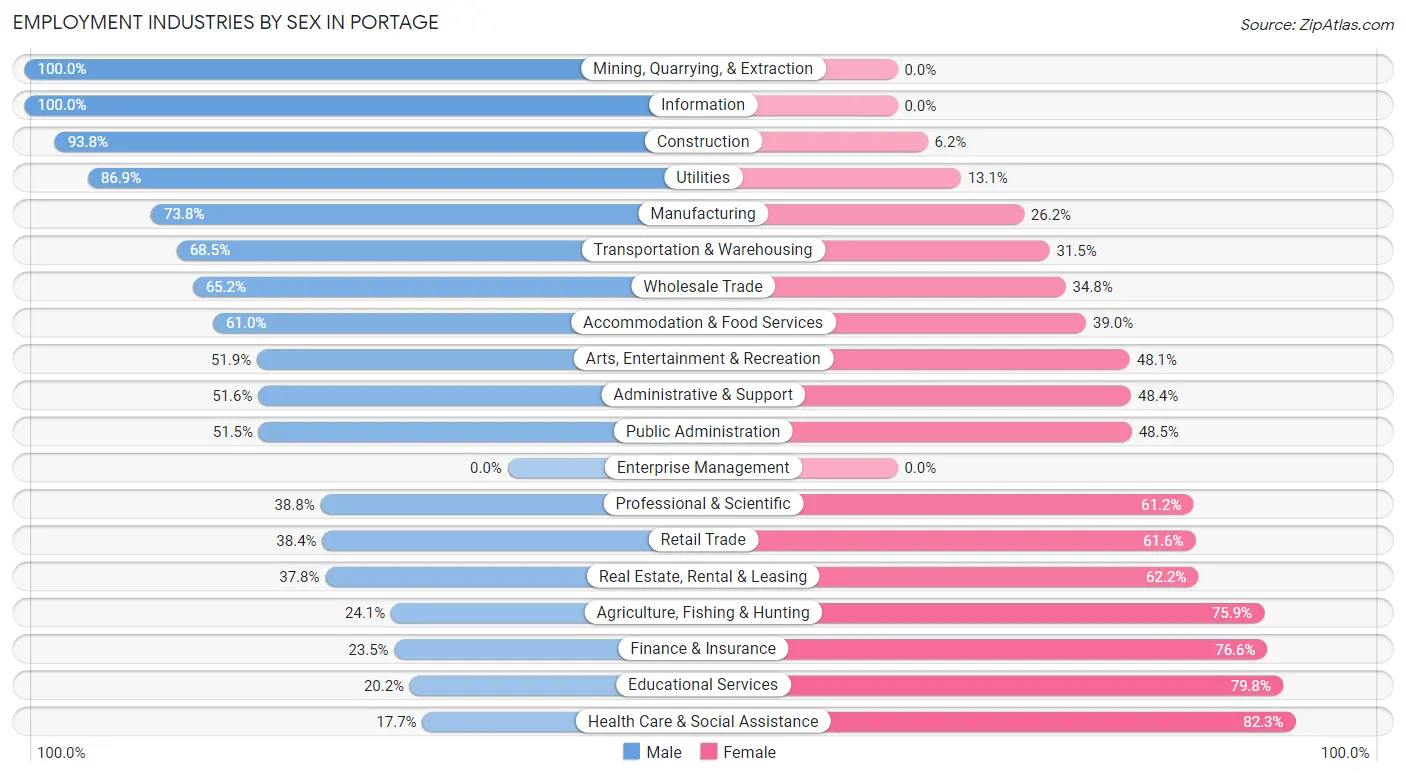
Employment Industries by Sex in Portage
The Portage industries that see more men than women are Mining, Quarrying, & Extraction (100.0%), Information (100.0%), and Construction (93.8%), whereas the industries that tend to have a higher number of women are Health Care & Social Assistance (82.3%), Educational Services (79.8%), and Finance & Insurance (76.5%).
| Industry | Male | Female |
| Agriculture, Fishing & Hunting | 21 (24.1%) | 66 (75.9%) |
| Mining, Quarrying, & Extraction | 14 (100.0%) | 0 (0.0%) |
| Construction | 1,338 (93.8%) | 89 (6.2%) |
| Manufacturing | 2,764 (73.8%) | 980 (26.2%) |
| Wholesale Trade | 148 (65.2%) | 79 (34.8%) |
| Retail Trade | 618 (38.4%) | 993 (61.6%) |
| Transportation & Warehousing | 811 (68.5%) | 373 (31.5%) |
| Utilities | 73 (86.9%) | 11 (13.1%) |
| Information | 159 (100.0%) | 0 (0.0%) |
| Finance & Insurance | 83 (23.4%) | 271 (76.5%) |
| Real Estate, Rental & Leasing | 54 (37.8%) | 89 (62.2%) |
| Professional & Scientific | 481 (38.8%) | 760 (61.2%) |
| Enterprise Management | 0 (0.0%) | 0 (0.0%) |
| Administrative & Support | 380 (51.6%) | 356 (48.4%) |
| Educational Services | 265 (20.2%) | 1,044 (79.8%) |
| Health Care & Social Assistance | 415 (17.7%) | 1,935 (82.3%) |
| Arts, Entertainment & Recreation | 110 (51.9%) | 102 (48.1%) |
| Accommodation & Food Services | 893 (61.0%) | 572 (39.0%) |
| Public Administration | 375 (51.5%) | 353 (48.5%) |
| Total | 9,592 (52.9%) | 8,536 (47.1%) |
Education in Portage
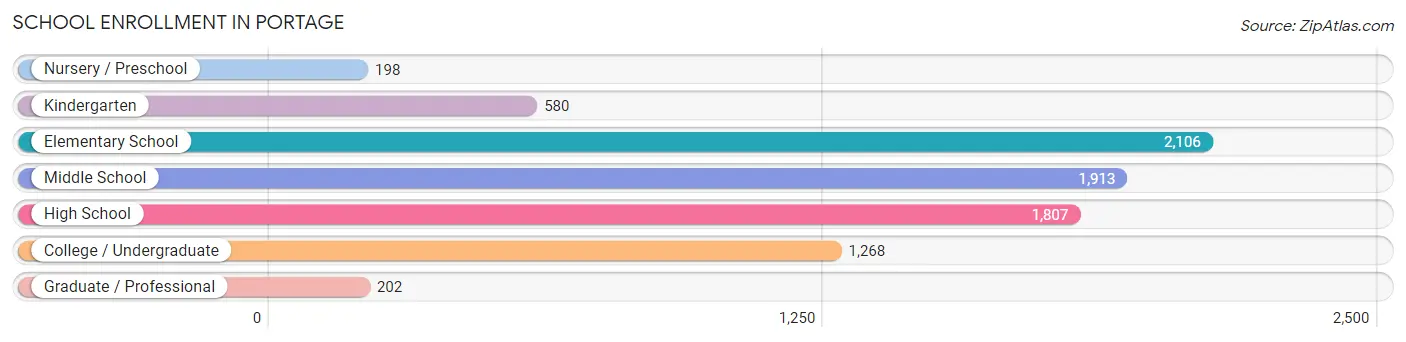
School Enrollment in Portage
The most common levels of schooling among the 8,074 students in Portage are elementary school (2,106 | 26.1%), middle school (1,913 | 23.7%), and high school (1,807 | 22.4%).
| School Level | # Students | % Students |
| Nursery / Preschool | 198 | 2.5% |
| Kindergarten | 580 | 7.2% |
| Elementary School | 2,106 | 26.1% |
| Middle School | 1,913 | 23.7% |
| High School | 1,807 | 22.4% |
| College / Undergraduate | 1,268 | 15.7% |
| Graduate / Professional | 202 | 2.5% |
| Total | 8,074 | 100.0% |
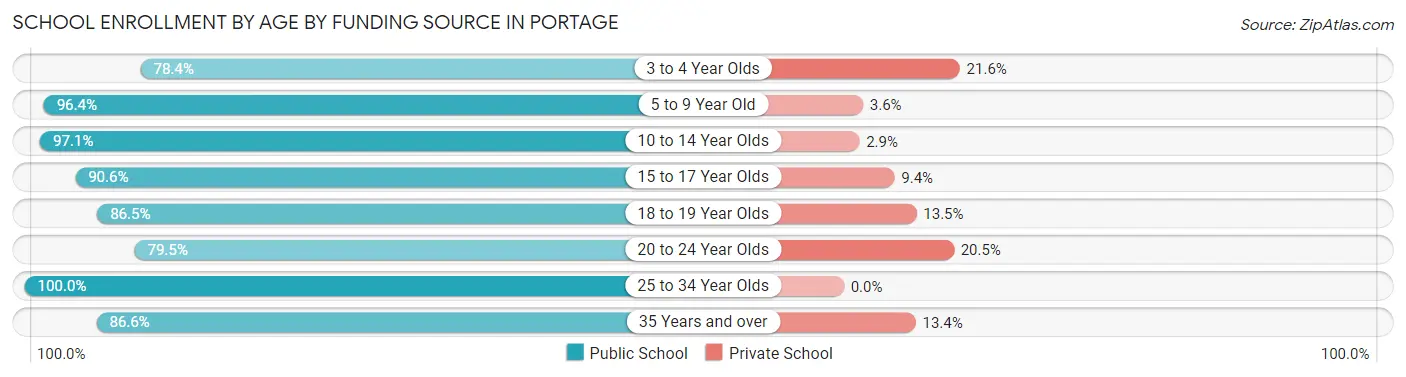
School Enrollment by Age by Funding Source in Portage
Out of a total of 8,074 students who are enrolled in schools in Portage, 517 (6.4%) attend a private institution, while the remaining 7,557 (93.6%) are enrolled in public schools. The age group of 3 to 4 year olds has the highest likelihood of being enrolled in private schools, with 35 (21.6% in the age bracket) enrolled. Conversely, the age group of 25 to 34 year olds has the lowest likelihood of being enrolled in a private school, with 493 (100.0% in the age bracket) attending a public institution.
| Age Bracket | Public School | Private School |
| 3 to 4 Year Olds | 127 (78.4%) | 35 (21.6%) |
| 5 to 9 Year Old | 2,350 (96.4%) | 87 (3.6%) |
| 10 to 14 Year Olds | 2,322 (97.1%) | 69 (2.9%) |
| 15 to 17 Year Olds | 1,103 (90.6%) | 115 (9.4%) |
| 18 to 19 Year Olds | 530 (86.5%) | 83 (13.5%) |
| 20 to 24 Year Olds | 260 (79.5%) | 67 (20.5%) |
| 25 to 34 Year Olds | 493 (100.0%) | 0 (0.0%) |
| 35 Years and over | 375 (86.6%) | 58 (13.4%) |
| Total | 7,557 (93.6%) | 517 (6.4%) |
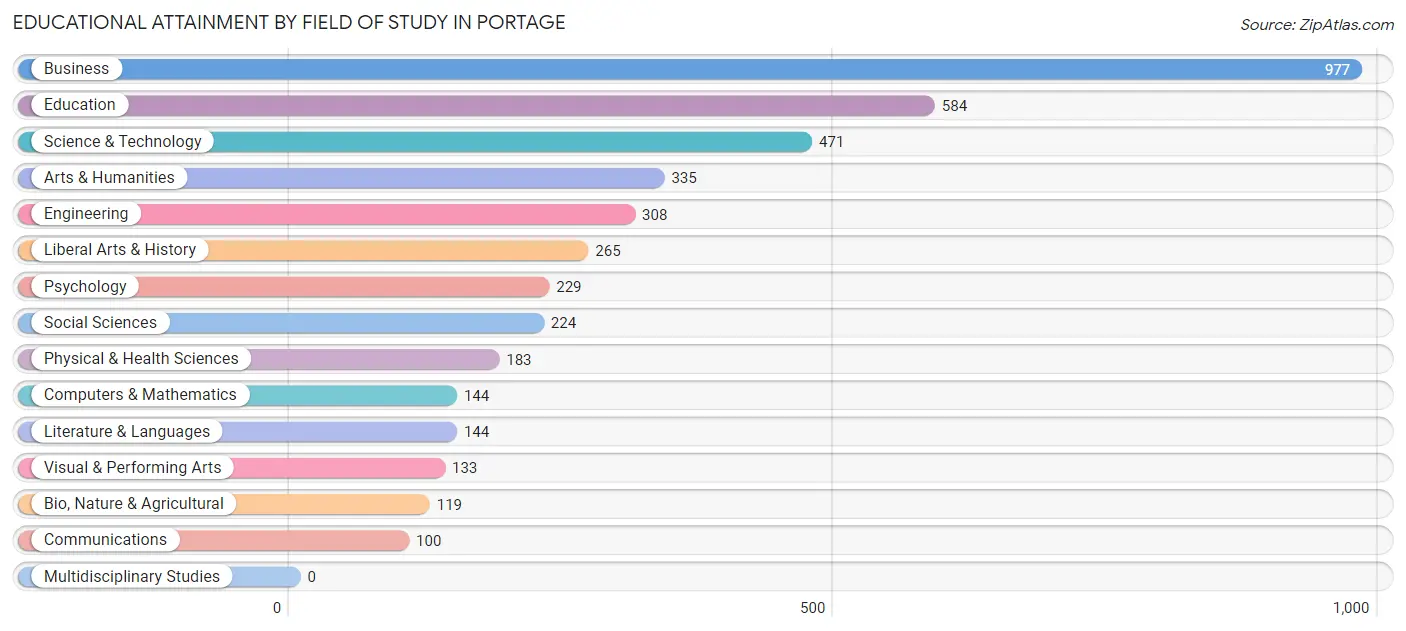
Educational Attainment by Field of Study in Portage
Business (977 | 23.2%), education (584 | 13.9%), science & technology (471 | 11.2%), arts & humanities (335 | 8.0%), and engineering (308 | 7.3%) are the most common fields of study among 4,216 individuals in Portage who have obtained a bachelor's degree or higher.
| Field of Study | # Graduates | % Graduates |
| Computers & Mathematics | 144 | 3.4% |
| Bio, Nature & Agricultural | 119 | 2.8% |
| Physical & Health Sciences | 183 | 4.3% |
| Psychology | 229 | 5.4% |
| Social Sciences | 224 | 5.3% |
| Engineering | 308 | 7.3% |
| Multidisciplinary Studies | 0 | 0.0% |
| Science & Technology | 471 | 11.2% |
| Business | 977 | 23.2% |
| Education | 584 | 13.9% |
| Literature & Languages | 144 | 3.4% |
| Liberal Arts & History | 265 | 6.3% |
| Visual & Performing Arts | 133 | 3.2% |
| Communications | 100 | 2.4% |
| Arts & Humanities | 335 | 8.0% |
| Total | 4,216 | 100.0% |
Transportation & Commute in Portage
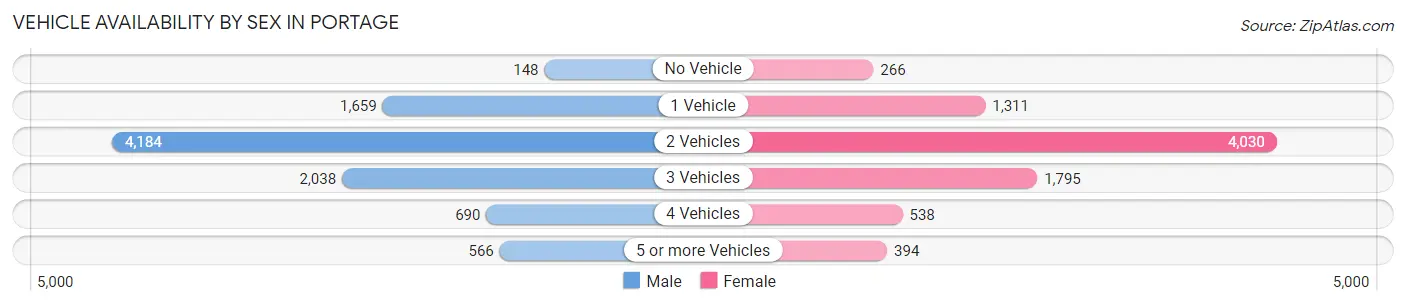
Vehicle Availability by Sex in Portage
The most prevalent vehicle ownership categories in Portage are males with 2 vehicles (4,184, accounting for 45.1%) and females with 2 vehicles (4,030, making up 50.2%).
| Vehicles Available | Male | Female |
| No Vehicle | 148 (1.6%) | 266 (3.2%) |
| 1 Vehicle | 1,659 (17.9%) | 1,311 (15.7%) |
| 2 Vehicles | 4,184 (45.1%) | 4,030 (48.4%) |
| 3 Vehicles | 2,038 (22.0%) | 1,795 (21.5%) |
| 4 Vehicles | 690 (7.4%) | 538 (6.5%) |
| 5 or more Vehicles | 566 (6.1%) | 394 (4.7%) |
| Total | 9,285 (100.0%) | 8,334 (100.0%) |
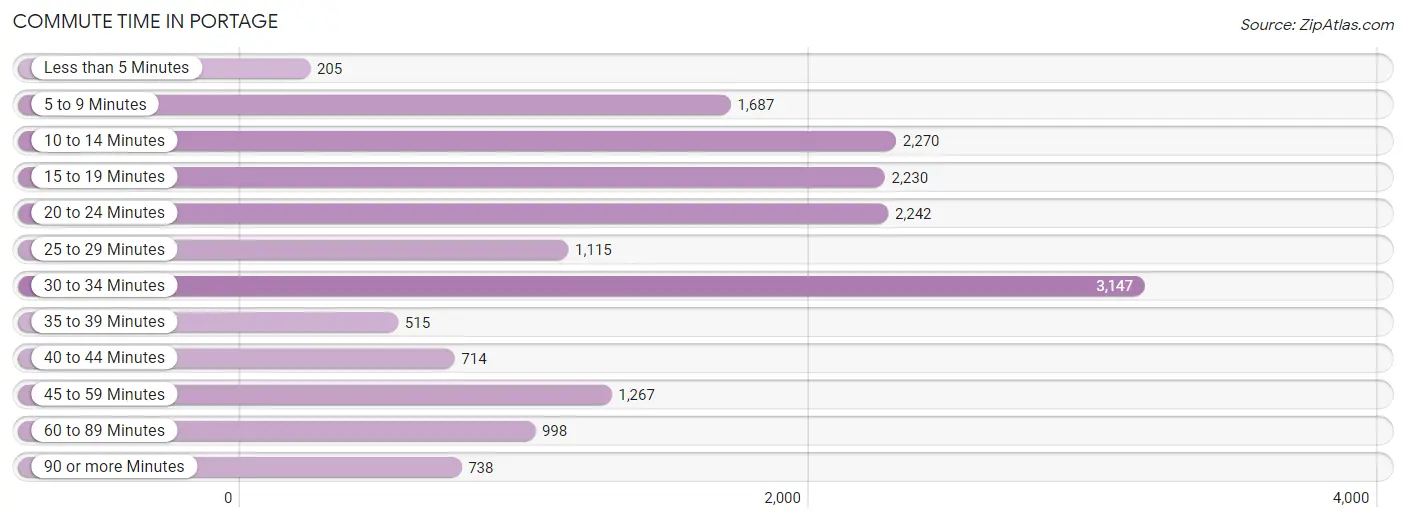
Commute Time in Portage
The most frequently occuring commute durations in Portage are 30 to 34 minutes (3,147 commuters, 18.4%), 10 to 14 minutes (2,270 commuters, 13.3%), and 20 to 24 minutes (2,242 commuters, 13.1%).
| Commute Time | # Commuters | % Commuters |
| Less than 5 Minutes | 205 | 1.2% |
| 5 to 9 Minutes | 1,687 | 9.9% |
| 10 to 14 Minutes | 2,270 | 13.3% |
| 15 to 19 Minutes | 2,230 | 13.0% |
| 20 to 24 Minutes | 2,242 | 13.1% |
| 25 to 29 Minutes | 1,115 | 6.5% |
| 30 to 34 Minutes | 3,147 | 18.4% |
| 35 to 39 Minutes | 515 | 3.0% |
| 40 to 44 Minutes | 714 | 4.2% |
| 45 to 59 Minutes | 1,267 | 7.4% |
| 60 to 89 Minutes | 998 | 5.8% |
| 90 or more Minutes | 738 | 4.3% |
Commute Time by Sex in Portage
The most common commute times in Portage are 30 to 34 minutes (1,598 commuters, 17.8%) for males and 30 to 34 minutes (1,549 commuters, 19.0%) for females.
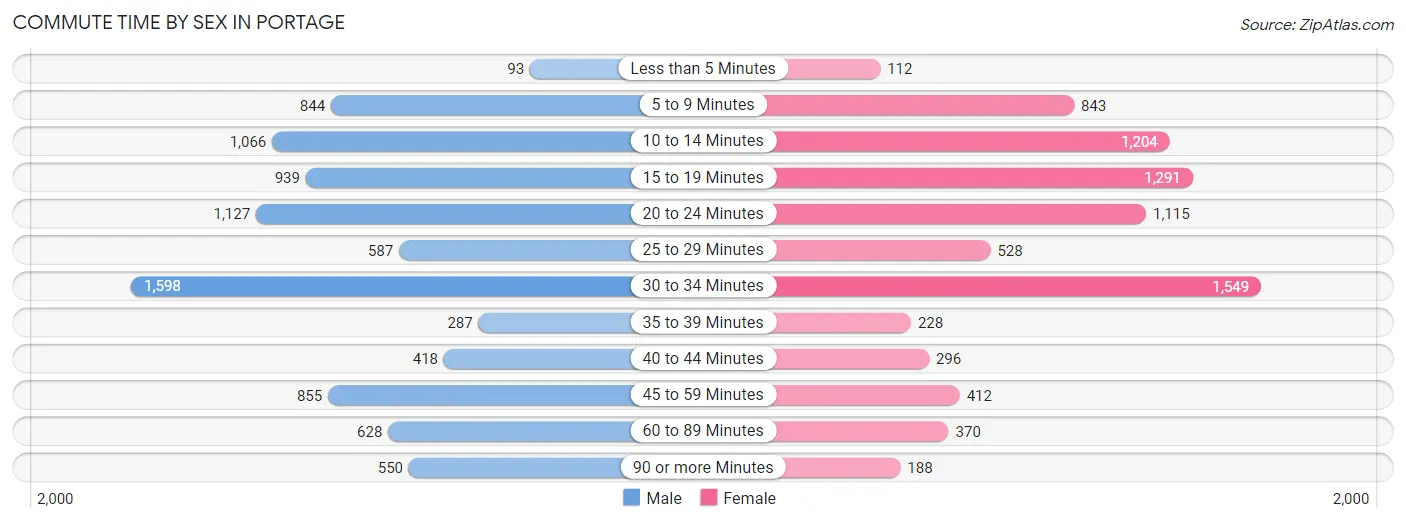
| Commute Time | Male | Female |
| Less than 5 Minutes | 93 (1.0%) | 112 (1.4%) |
| 5 to 9 Minutes | 844 (9.4%) | 843 (10.4%) |
| 10 to 14 Minutes | 1,066 (11.8%) | 1,204 (14.8%) |
| 15 to 19 Minutes | 939 (10.4%) | 1,291 (15.9%) |
| 20 to 24 Minutes | 1,127 (12.5%) | 1,115 (13.7%) |
| 25 to 29 Minutes | 587 (6.5%) | 528 (6.5%) |
| 30 to 34 Minutes | 1,598 (17.8%) | 1,549 (19.0%) |
| 35 to 39 Minutes | 287 (3.2%) | 228 (2.8%) |
| 40 to 44 Minutes | 418 (4.6%) | 296 (3.6%) |
| 45 to 59 Minutes | 855 (9.5%) | 412 (5.1%) |
| 60 to 89 Minutes | 628 (7.0%) | 370 (4.5%) |
| 90 or more Minutes | 550 (6.1%) | 188 (2.3%) |
Time of Departure to Work by Sex in Portage
The most frequent times of departure to work in Portage are 6:00 AM to 6:29 AM (1,308, 14.5%) for males and 7:30 AM to 7:59 AM (1,139, 14.0%) for females.
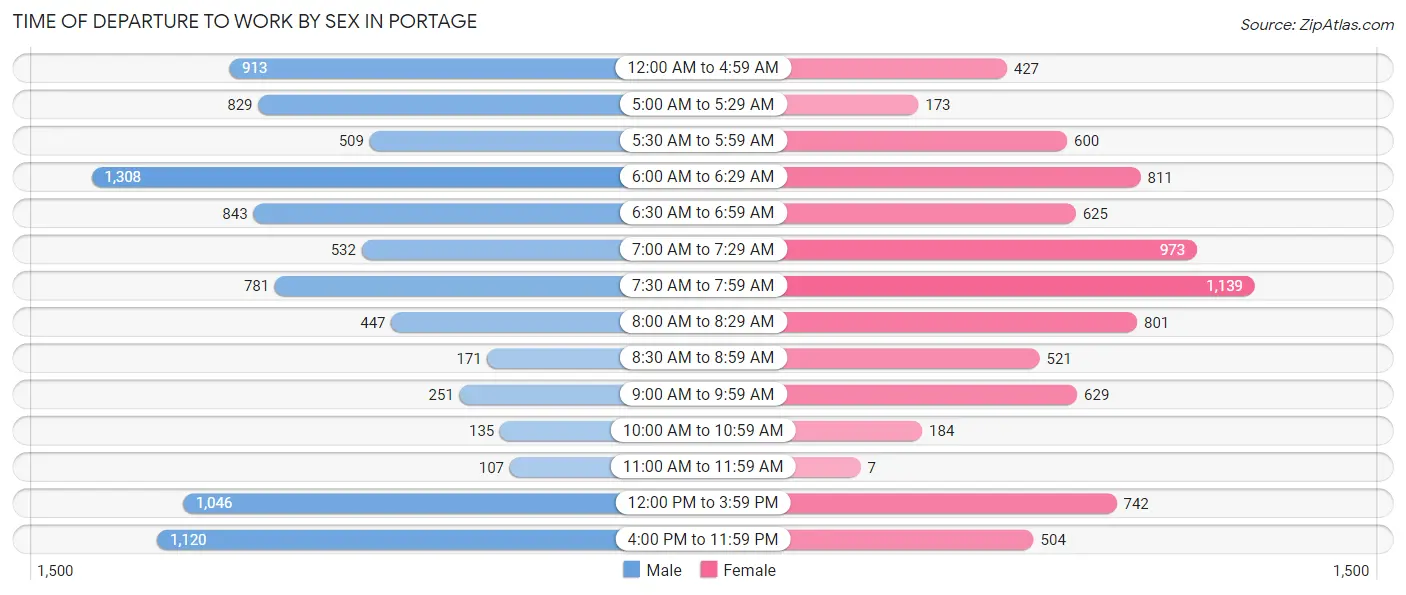
| Time of Departure | Male | Female |
| 12:00 AM to 4:59 AM | 913 (10.2%) | 427 (5.2%) |
| 5:00 AM to 5:29 AM | 829 (9.2%) | 173 (2.1%) |
| 5:30 AM to 5:59 AM | 509 (5.7%) | 600 (7.4%) |
| 6:00 AM to 6:29 AM | 1,308 (14.5%) | 811 (10.0%) |
| 6:30 AM to 6:59 AM | 843 (9.4%) | 625 (7.7%) |
| 7:00 AM to 7:29 AM | 532 (5.9%) | 973 (12.0%) |
| 7:30 AM to 7:59 AM | 781 (8.7%) | 1,139 (14.0%) |
| 8:00 AM to 8:29 AM | 447 (5.0%) | 801 (9.9%) |
| 8:30 AM to 8:59 AM | 171 (1.9%) | 521 (6.4%) |
| 9:00 AM to 9:59 AM | 251 (2.8%) | 629 (7.7%) |
| 10:00 AM to 10:59 AM | 135 (1.5%) | 184 (2.3%) |
| 11:00 AM to 11:59 AM | 107 (1.2%) | 7 (0.1%) |
| 12:00 PM to 3:59 PM | 1,046 (11.6%) | 742 (9.1%) |
| 4:00 PM to 11:59 PM | 1,120 (12.5%) | 504 (6.2%) |
| Total | 8,992 (100.0%) | 8,136 (100.0%) |
Housing Occupancy in Portage
Occupancy by Ownership in Portage
Of the total 14,993 dwellings in Portage, owner-occupied units account for 10,933 (72.9%), while renter-occupied units make up 4,060 (27.1%).
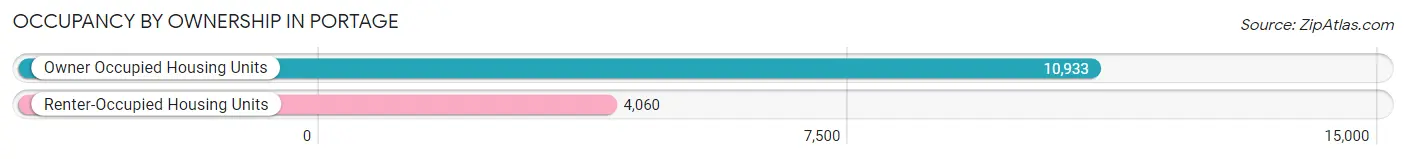
| Occupancy | # Housing Units | % Housing Units |
| Owner Occupied Housing Units | 10,933 | 72.9% |
| Renter-Occupied Housing Units | 4,060 | 27.1% |
| Total Occupied Housing Units | 14,993 | 100.0% |
Occupancy by Household Size in Portage
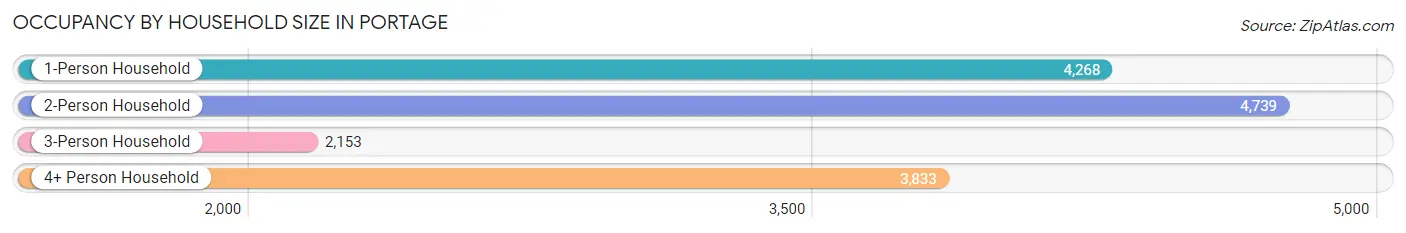
| Household Size | # Housing Units | % Housing Units |
| 1-Person Household | 4,268 | 28.5% |
| 2-Person Household | 4,739 | 31.6% |
| 3-Person Household | 2,153 | 14.4% |
| 4+ Person Household | 3,833 | 25.6% |
| Total Housing Units | 14,993 | 100.0% |
Occupancy by Ownership by Household Size in Portage
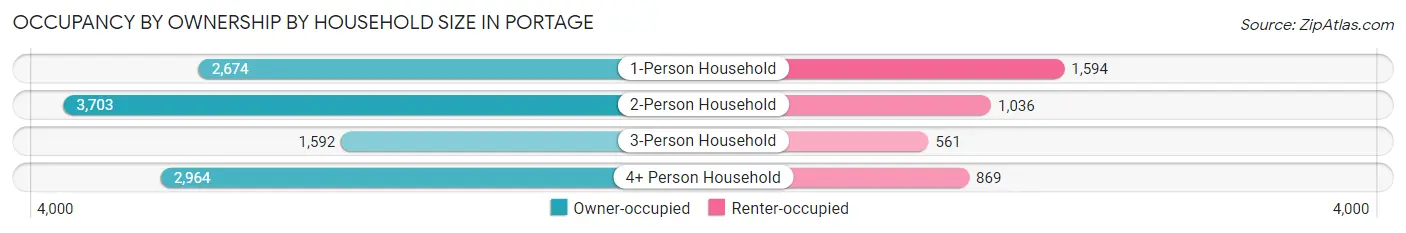
| Household Size | Owner-occupied | Renter-occupied |
| 1-Person Household | 2,674 (62.6%) | 1,594 (37.3%) |
| 2-Person Household | 3,703 (78.1%) | 1,036 (21.9%) |
| 3-Person Household | 1,592 (73.9%) | 561 (26.1%) |
| 4+ Person Household | 2,964 (77.3%) | 869 (22.7%) |
| Total Housing Units | 10,933 (72.9%) | 4,060 (27.1%) |
Occupancy by Educational Attainment in Portage
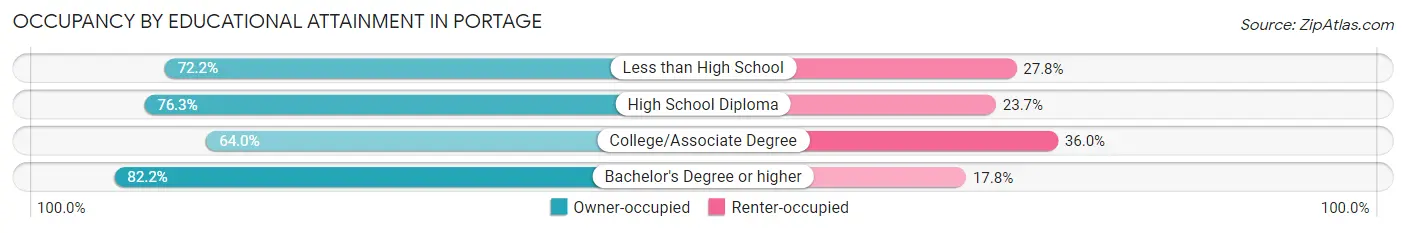
| Household Size | Owner-occupied | Renter-occupied |
| Less than High School | 777 (72.2%) | 299 (27.8%) |
| High School Diploma | 4,721 (76.3%) | 1,469 (23.7%) |
| College/Associate Degree | 3,216 (64.0%) | 1,811 (36.0%) |
| Bachelor's Degree or higher | 2,219 (82.2%) | 481 (17.8%) |
Occupancy by Age of Householder in Portage
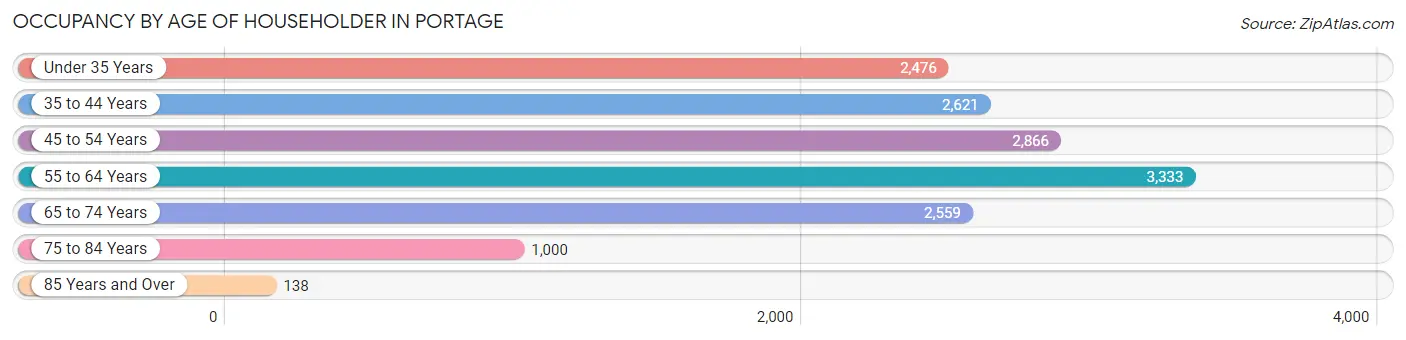
| Age Bracket | # Households | % Households |
| Under 35 Years | 2,476 | 16.5% |
| 35 to 44 Years | 2,621 | 17.5% |
| 45 to 54 Years | 2,866 | 19.1% |
| 55 to 64 Years | 3,333 | 22.2% |
| 65 to 74 Years | 2,559 | 17.1% |
| 75 to 84 Years | 1,000 | 6.7% |
| 85 Years and Over | 138 | 0.9% |
| Total | 14,993 | 100.0% |
Housing Finances in Portage
Median Income by Occupancy in Portage
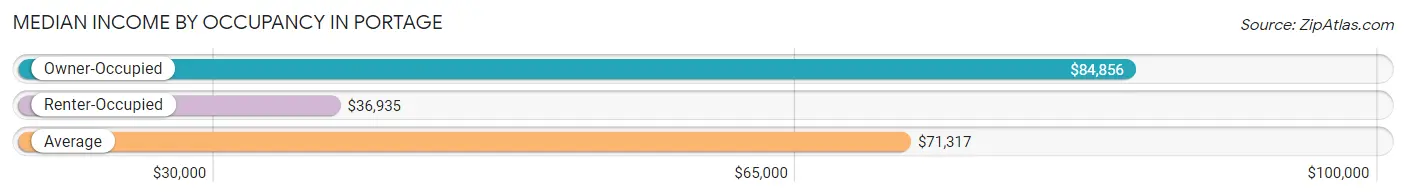
| Occupancy Type | # Households | Median Income |
| Owner-Occupied | 10,933 (72.9%) | $84,856 |
| Renter-Occupied | 4,060 (27.1%) | $36,935 |
| Average | 14,993 (100.0%) | $71,317 |
Occupancy by Householder Income Bracket in Portage
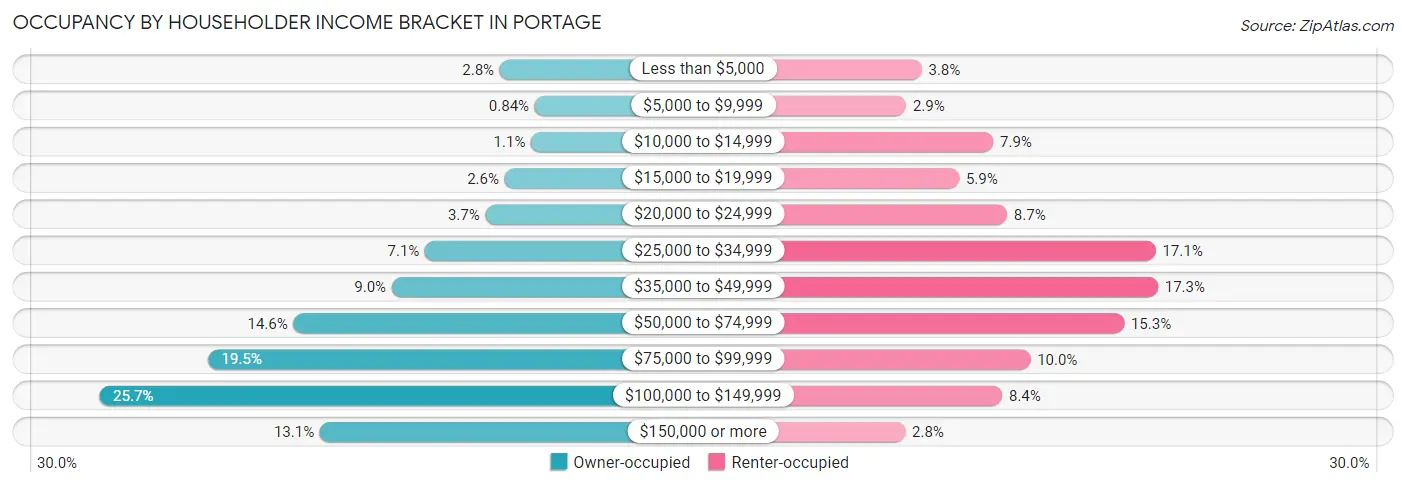
| Income Bracket | Owner-occupied | Renter-occupied |
| Less than $5,000 | 311 (2.8%) | 153 (3.8%) |
| $5,000 to $9,999 | 92 (0.8%) | 117 (2.9%) |
| $10,000 to $14,999 | 115 (1.1%) | 319 (7.9%) |
| $15,000 to $19,999 | 280 (2.6%) | 240 (5.9%) |
| $20,000 to $24,999 | 400 (3.7%) | 351 (8.6%) |
| $25,000 to $34,999 | 777 (7.1%) | 696 (17.1%) |
| $35,000 to $49,999 | 985 (9.0%) | 701 (17.3%) |
| $50,000 to $74,999 | 1,600 (14.6%) | 623 (15.3%) |
| $75,000 to $99,999 | 2,131 (19.5%) | 405 (10.0%) |
| $100,000 to $149,999 | 2,808 (25.7%) | 340 (8.4%) |
| $150,000 or more | 1,434 (13.1%) | 115 (2.8%) |
| Total | 10,933 (100.0%) | 4,060 (100.0%) |
Monthly Housing Cost Tiers in Portage
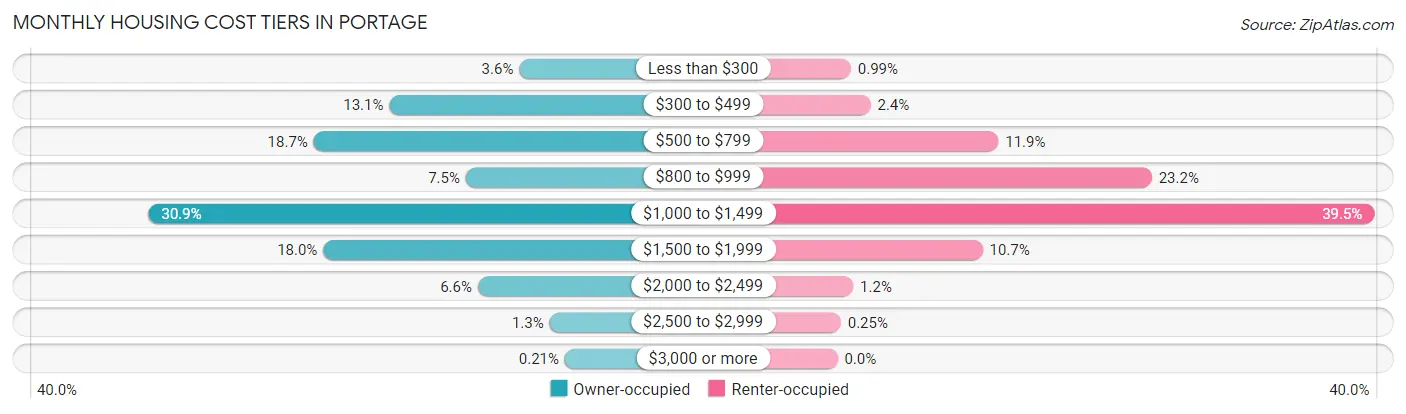
| Monthly Cost | Owner-occupied | Renter-occupied |
| Less than $300 | 390 (3.6%) | 40 (1.0%) |
| $300 to $499 | 1,437 (13.1%) | 99 (2.4%) |
| $500 to $799 | 2,046 (18.7%) | 481 (11.8%) |
| $800 to $999 | 821 (7.5%) | 940 (23.2%) |
| $1,000 to $1,499 | 3,377 (30.9%) | 1,605 (39.5%) |
| $1,500 to $1,999 | 1,969 (18.0%) | 434 (10.7%) |
| $2,000 to $2,499 | 724 (6.6%) | 47 (1.2%) |
| $2,500 to $2,999 | 146 (1.3%) | 10 (0.3%) |
| $3,000 or more | 23 (0.2%) | 0 (0.0%) |
| Total | 10,933 (100.0%) | 4,060 (100.0%) |
Physical Housing Characteristics in Portage
Housing Structures in Portage
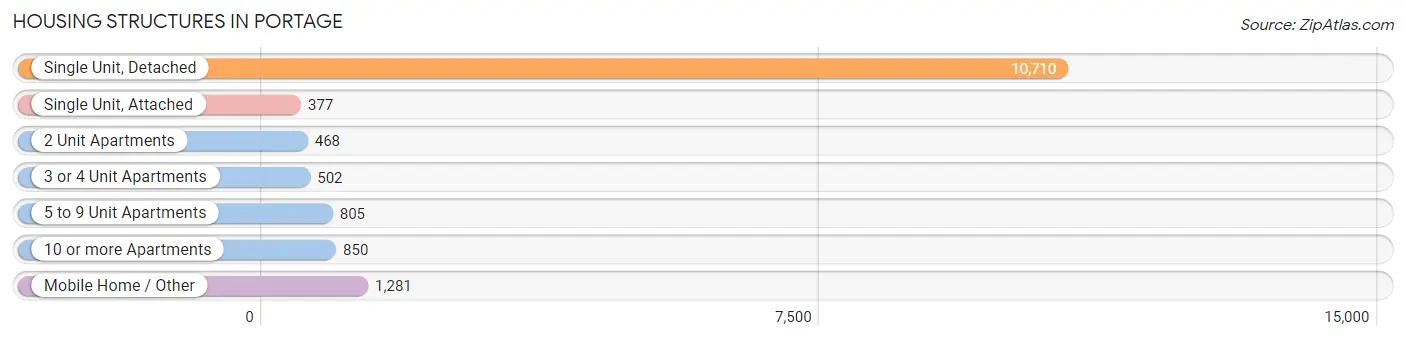
| Structure Type | # Housing Units | % Housing Units |
| Single Unit, Detached | 10,710 | 71.4% |
| Single Unit, Attached | 377 | 2.5% |
| 2 Unit Apartments | 468 | 3.1% |
| 3 or 4 Unit Apartments | 502 | 3.4% |
| 5 to 9 Unit Apartments | 805 | 5.4% |
| 10 or more Apartments | 850 | 5.7% |
| Mobile Home / Other | 1,281 | 8.5% |
| Total | 14,993 | 100.0% |
Housing Structures by Occupancy in Portage
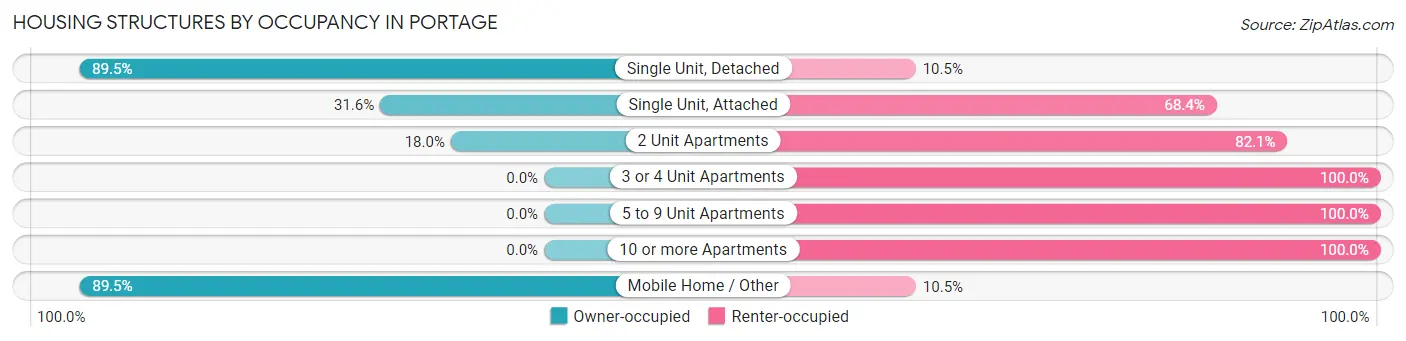
| Structure Type | Owner-occupied | Renter-occupied |
| Single Unit, Detached | 9,584 (89.5%) | 1,126 (10.5%) |
| Single Unit, Attached | 119 (31.6%) | 258 (68.4%) |
| 2 Unit Apartments | 84 (17.9%) | 384 (82.1%) |
| 3 or 4 Unit Apartments | 0 (0.0%) | 502 (100.0%) |
| 5 to 9 Unit Apartments | 0 (0.0%) | 805 (100.0%) |
| 10 or more Apartments | 0 (0.0%) | 850 (100.0%) |
| Mobile Home / Other | 1,146 (89.5%) | 135 (10.5%) |
| Total | 10,933 (72.9%) | 4,060 (27.1%) |
Housing Structures by Number of Rooms in Portage
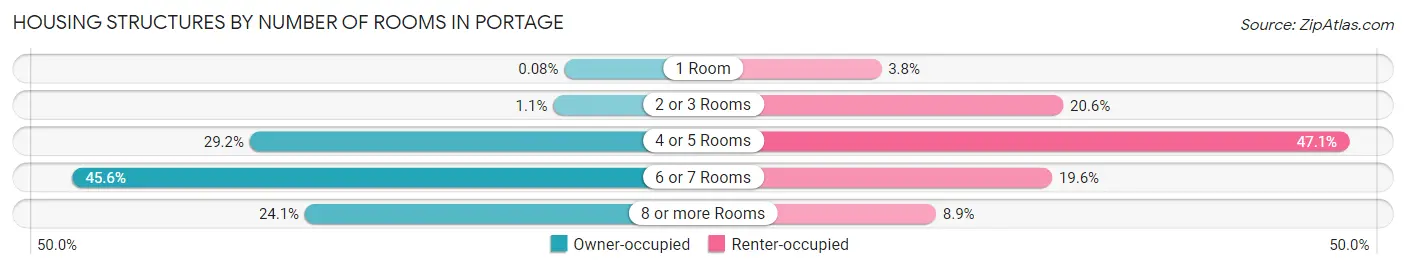
| Number of Rooms | Owner-occupied | Renter-occupied |
| 1 Room | 9 (0.1%) | 155 (3.8%) |
| 2 or 3 Rooms | 121 (1.1%) | 838 (20.6%) |
| 4 or 5 Rooms | 3,189 (29.2%) | 1,911 (47.1%) |
| 6 or 7 Rooms | 4,982 (45.6%) | 796 (19.6%) |
| 8 or more Rooms | 2,632 (24.1%) | 360 (8.9%) |
| Total | 10,933 (100.0%) | 4,060 (100.0%) |
Housing Structure by Heating Type in Portage
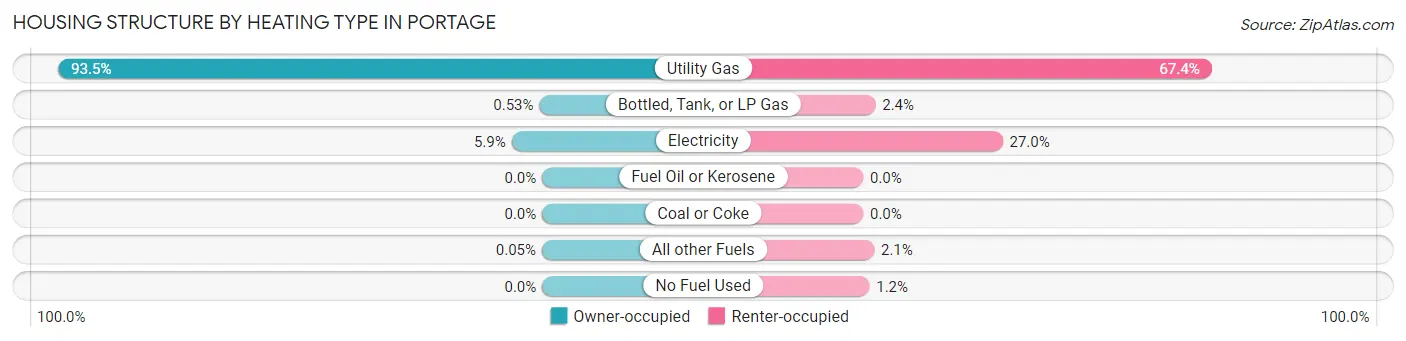
| Heating Type | Owner-occupied | Renter-occupied |
| Utility Gas | 10,224 (93.5%) | 2,735 (67.4%) |
| Bottled, Tank, or LP Gas | 58 (0.5%) | 96 (2.4%) |
| Electricity | 646 (5.9%) | 1,094 (27.0%) |
| Fuel Oil or Kerosene | 0 (0.0%) | 0 (0.0%) |
| Coal or Coke | 0 (0.0%) | 0 (0.0%) |
| All other Fuels | 5 (0.1%) | 86 (2.1%) |
| No Fuel Used | 0 (0.0%) | 49 (1.2%) |
| Total | 10,933 (100.0%) | 4,060 (100.0%) |
Household Vehicle Usage in Portage
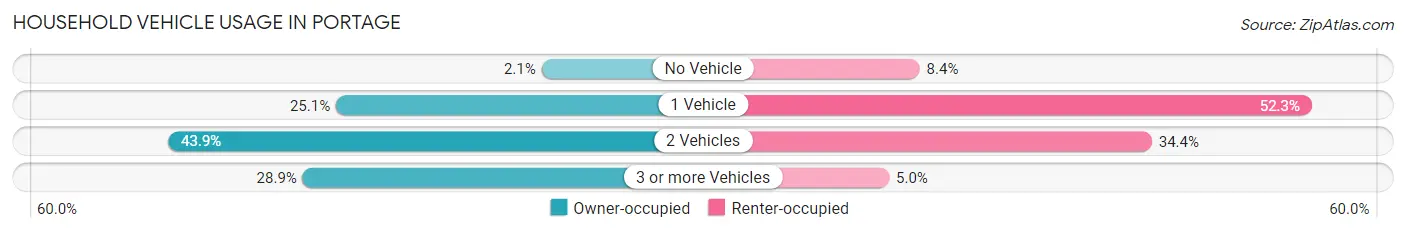
| Vehicles per Household | Owner-occupied | Renter-occupied |
| No Vehicle | 229 (2.1%) | 340 (8.4%) |
| 1 Vehicle | 2,746 (25.1%) | 2,123 (52.3%) |
| 2 Vehicles | 4,804 (43.9%) | 1,396 (34.4%) |
| 3 or more Vehicles | 3,154 (28.8%) | 201 (5.0%) |
| Total | 10,933 (100.0%) | 4,060 (100.0%) |
Real Estate & Mortgages in Portage
Real Estate and Mortgage Overview in Portage
| Characteristic | Without Mortgage | With Mortgage |
| Housing Units | 3,889 | 7,044 |
| Median Property Value | $152,400 | $205,700 |
| Median Household Income | $62,908 | $1,094 |
| Monthly Housing Costs | $519 | $23 |
| Real Estate Taxes | $1,332 | $53 |
Property Value by Mortgage Status in Portage
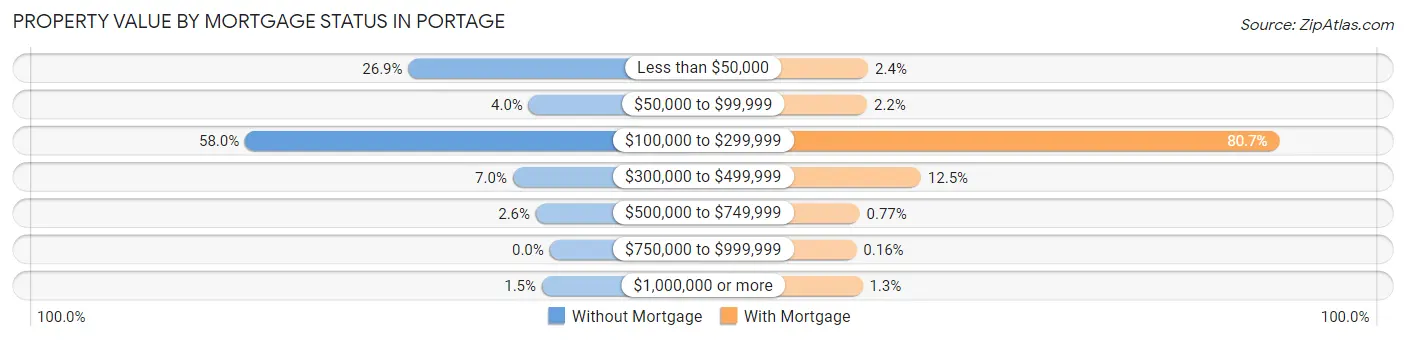
| Property Value | Without Mortgage | With Mortgage |
| Less than $50,000 | 1,046 (26.9%) | 169 (2.4%) |
| $50,000 to $99,999 | 155 (4.0%) | 154 (2.2%) |
| $100,000 to $299,999 | 2,256 (58.0%) | 5,687 (80.7%) |
| $300,000 to $499,999 | 273 (7.0%) | 877 (12.4%) |
| $500,000 to $749,999 | 102 (2.6%) | 54 (0.8%) |
| $750,000 to $999,999 | 0 (0.0%) | 11 (0.2%) |
| $1,000,000 or more | 57 (1.5%) | 92 (1.3%) |
| Total | 3,889 (100.0%) | 7,044 (100.0%) |
Household Income by Mortgage Status in Portage
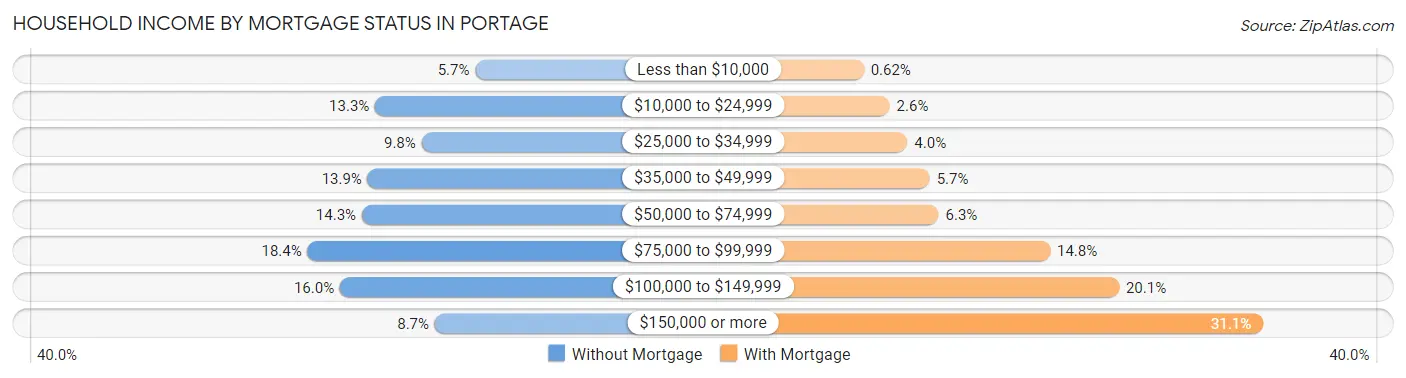
| Household Income | Without Mortgage | With Mortgage |
| Less than $10,000 | 220 (5.7%) | 44 (0.6%) |
| $10,000 to $24,999 | 517 (13.3%) | 183 (2.6%) |
| $25,000 to $34,999 | 379 (9.8%) | 278 (4.0%) |
| $35,000 to $49,999 | 539 (13.9%) | 398 (5.7%) |
| $50,000 to $74,999 | 556 (14.3%) | 446 (6.3%) |
| $75,000 to $99,999 | 717 (18.4%) | 1,044 (14.8%) |
| $100,000 to $149,999 | 621 (16.0%) | 1,414 (20.1%) |
| $150,000 or more | 340 (8.7%) | 2,187 (31.0%) |
| Total | 3,889 (100.0%) | 7,044 (100.0%) |
Property Value to Household Income Ratio in Portage
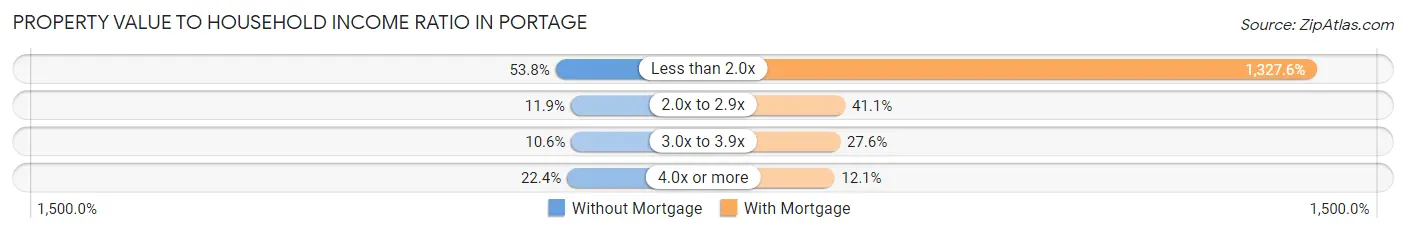
| Value-to-Income Ratio | Without Mortgage | With Mortgage |
| Less than 2.0x | 2,093 (53.8%) | 93,513 (1,327.6%) |
| 2.0x to 2.9x | 464 (11.9%) | 2,898 (41.1%) |
| 3.0x to 3.9x | 412 (10.6%) | 1,945 (27.6%) |
| 4.0x or more | 871 (22.4%) | 850 (12.1%) |
| Total | 3,889 (100.0%) | 7,044 (100.0%) |
Real Estate Taxes by Mortgage Status in Portage
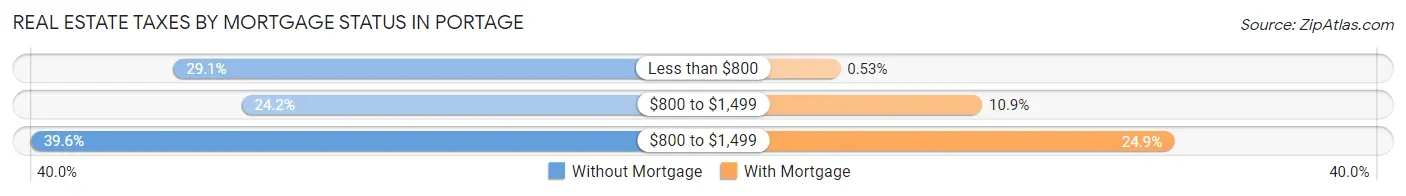
| Property Taxes | Without Mortgage | With Mortgage |
| Less than $800 | 1,133 (29.1%) | 37 (0.5%) |
| $800 to $1,499 | 939 (24.1%) | 767 (10.9%) |
| $800 to $1,499 | 1,538 (39.6%) | 1,755 (24.9%) |
| Total | 3,889 (100.0%) | 7,044 (100.0%) |
Health & Disability in Portage
Health Insurance Coverage by Age in Portage
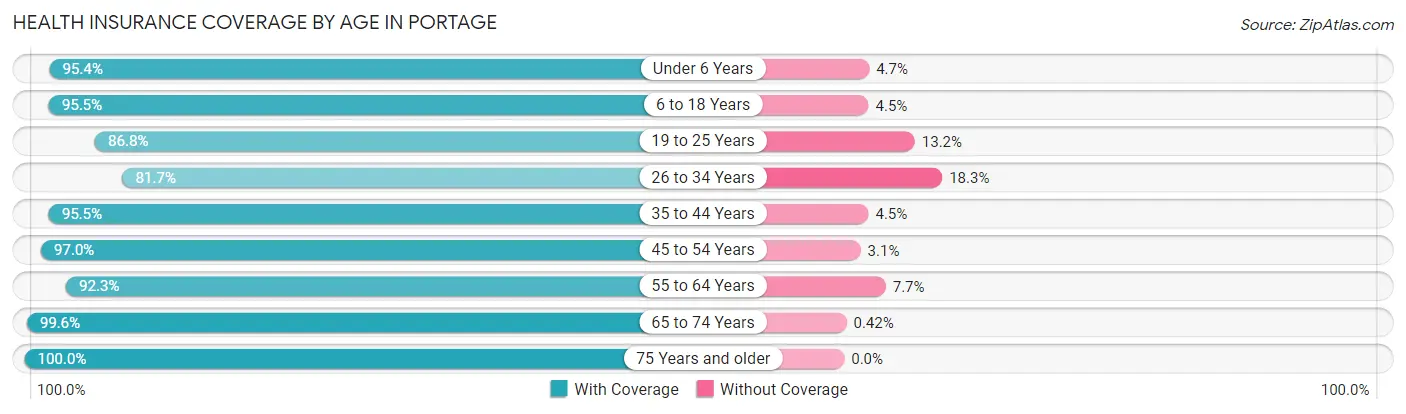
| Age Bracket | With Coverage | Without Coverage |
| Under 6 Years | 2,234 (95.4%) | 109 (4.6%) |
| 6 to 18 Years | 6,047 (95.5%) | 287 (4.5%) |
| 19 to 25 Years | 3,068 (86.8%) | 465 (13.2%) |
| 26 to 34 Years | 4,088 (81.7%) | 913 (18.3%) |
| 35 to 44 Years | 4,394 (95.5%) | 208 (4.5%) |
| 45 to 54 Years | 4,516 (97.0%) | 142 (3.0%) |
| 55 to 64 Years | 4,993 (92.3%) | 419 (7.7%) |
| 65 to 74 Years | 3,816 (99.6%) | 16 (0.4%) |
| 75 Years and older | 1,787 (100.0%) | 0 (0.0%) |
| Total | 34,943 (93.2%) | 2,559 (6.8%) |
Health Insurance Coverage by Citizenship Status in Portage
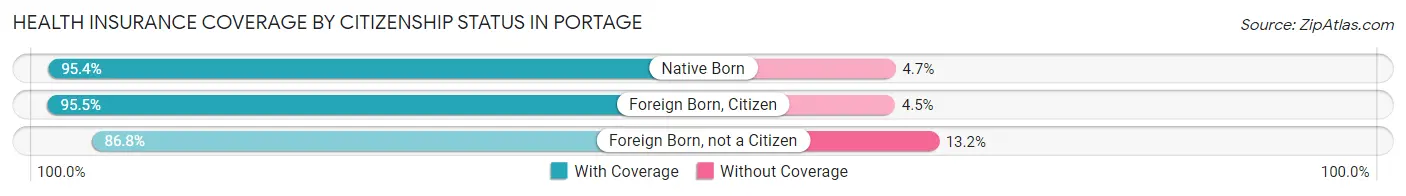
| Citizenship Status | With Coverage | Without Coverage |
| Native Born | 2,234 (95.4%) | 109 (4.6%) |
| Foreign Born, Citizen | 6,047 (95.5%) | 287 (4.5%) |
| Foreign Born, not a Citizen | 3,068 (86.8%) | 465 (13.2%) |
Health Insurance Coverage by Household Income in Portage
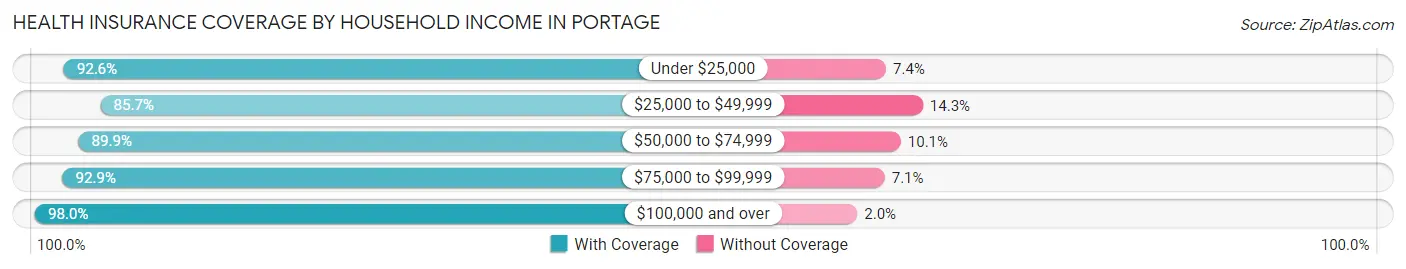
| Household Income | With Coverage | Without Coverage |
| Under $25,000 | 3,548 (92.6%) | 282 (7.4%) |
| $25,000 to $49,999 | 5,512 (85.7%) | 917 (14.3%) |
| $50,000 to $74,999 | 4,935 (89.9%) | 556 (10.1%) |
| $75,000 to $99,999 | 6,782 (92.9%) | 520 (7.1%) |
| $100,000 and over | 14,114 (98.0%) | 284 (2.0%) |
Public vs Private Health Insurance Coverage by Age in Portage
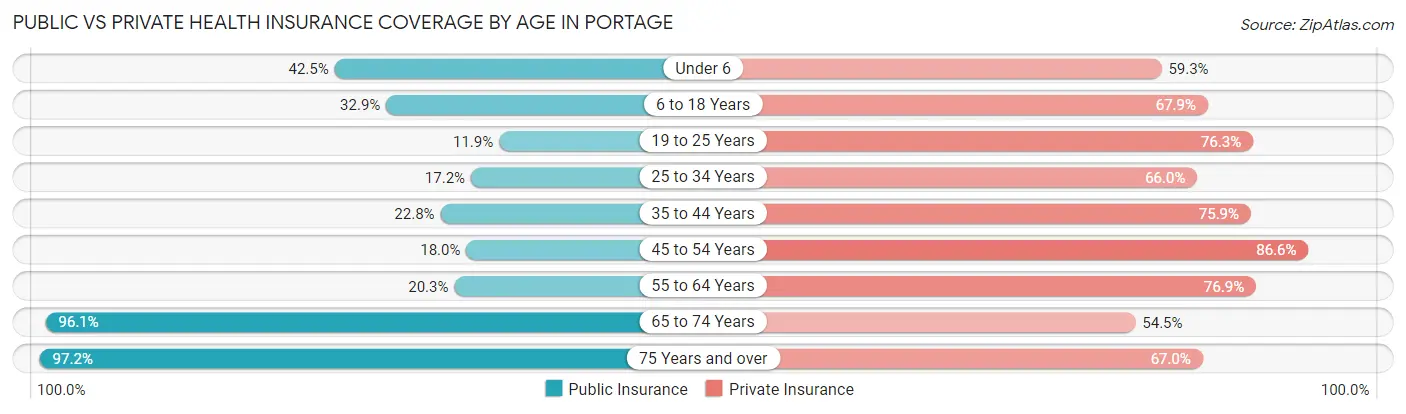
| Age Bracket | Public Insurance | Private Insurance |
| Under 6 | 995 (42.5%) | 1,390 (59.3%) |
| 6 to 18 Years | 2,083 (32.9%) | 4,302 (67.9%) |
| 19 to 25 Years | 422 (11.9%) | 2,697 (76.3%) |
| 25 to 34 Years | 858 (17.2%) | 3,299 (66.0%) |
| 35 to 44 Years | 1,050 (22.8%) | 3,494 (75.9%) |
| 45 to 54 Years | 839 (18.0%) | 4,034 (86.6%) |
| 55 to 64 Years | 1,096 (20.3%) | 4,161 (76.9%) |
| 65 to 74 Years | 3,684 (96.1%) | 2,088 (54.5%) |
| 75 Years and over | 1,737 (97.2%) | 1,197 (67.0%) |
| Total | 12,764 (34.0%) | 26,662 (71.1%) |
Disability Status by Sex by Age in Portage
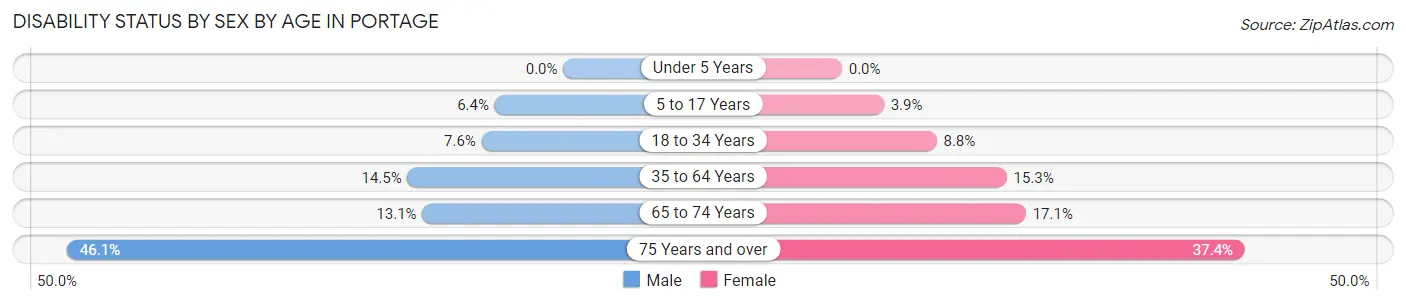
| Age Bracket | Male | Female |
| Under 5 Years | 0 (0.0%) | 0 (0.0%) |
| 5 to 17 Years | 200 (6.4%) | 119 (3.9%) |
| 18 to 34 Years | 329 (7.6%) | 408 (8.8%) |
| 35 to 64 Years | 1,068 (14.5%) | 1,114 (15.3%) |
| 65 to 74 Years | 217 (13.1%) | 371 (17.1%) |
| 75 Years and over | 311 (46.1%) | 416 (37.4%) |
Disability Class by Sex by Age in Portage
Disability Class: Hearing Difficulty
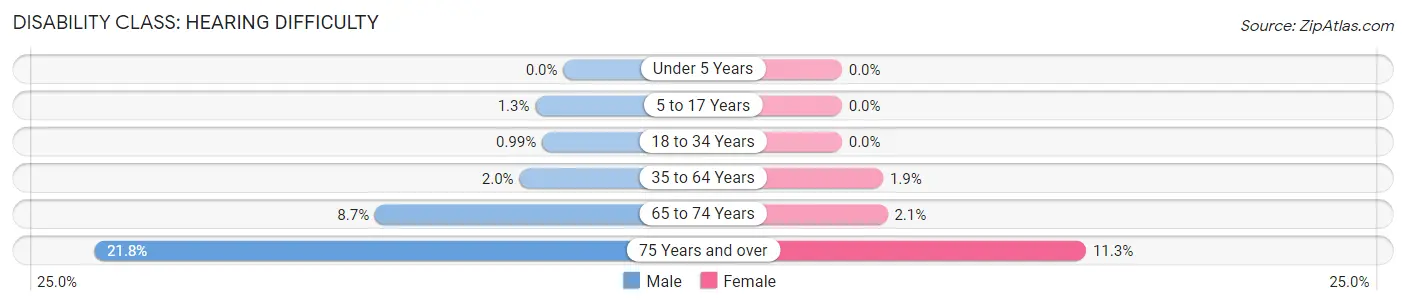
| Age Bracket | Male | Female |
| Under 5 Years | 0 (0.0%) | 0 (0.0%) |
| 5 to 17 Years | 41 (1.3%) | 0 (0.0%) |
| 18 to 34 Years | 43 (1.0%) | 0 (0.0%) |
| 35 to 64 Years | 151 (2.0%) | 139 (1.9%) |
| 65 to 74 Years | 145 (8.7%) | 46 (2.1%) |
| 75 Years and over | 147 (21.8%) | 126 (11.3%) |
Disability Class: Vision Difficulty
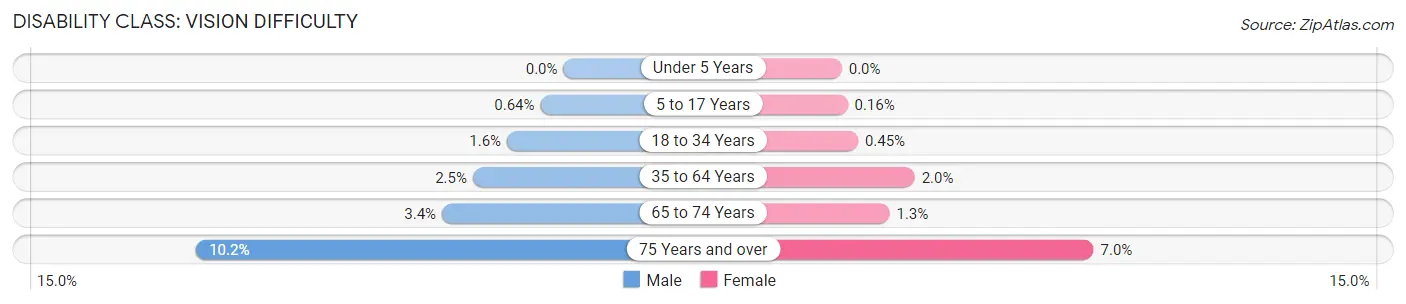
| Age Bracket | Male | Female |
| Under 5 Years | 0 (0.0%) | 0 (0.0%) |
| 5 to 17 Years | 20 (0.6%) | 5 (0.2%) |
| 18 to 34 Years | 68 (1.6%) | 21 (0.4%) |
| 35 to 64 Years | 186 (2.5%) | 148 (2.0%) |
| 65 to 74 Years | 56 (3.4%) | 29 (1.3%) |
| 75 Years and over | 69 (10.2%) | 78 (7.0%) |
Disability Class: Cognitive Difficulty
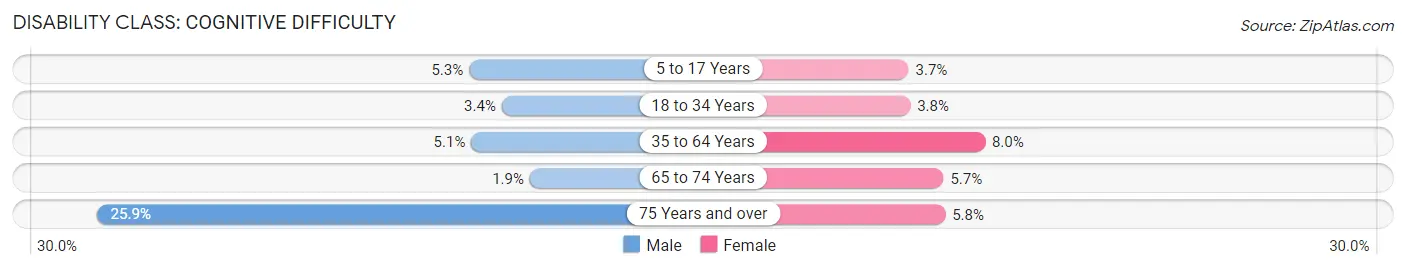
| Age Bracket | Male | Female |
| 5 to 17 Years | 165 (5.2%) | 114 (3.7%) |
| 18 to 34 Years | 149 (3.4%) | 177 (3.8%) |
| 35 to 64 Years | 379 (5.1%) | 581 (8.0%) |
| 65 to 74 Years | 31 (1.9%) | 123 (5.7%) |
| 75 Years and over | 175 (25.9%) | 64 (5.8%) |
Disability Class: Ambulatory Difficulty
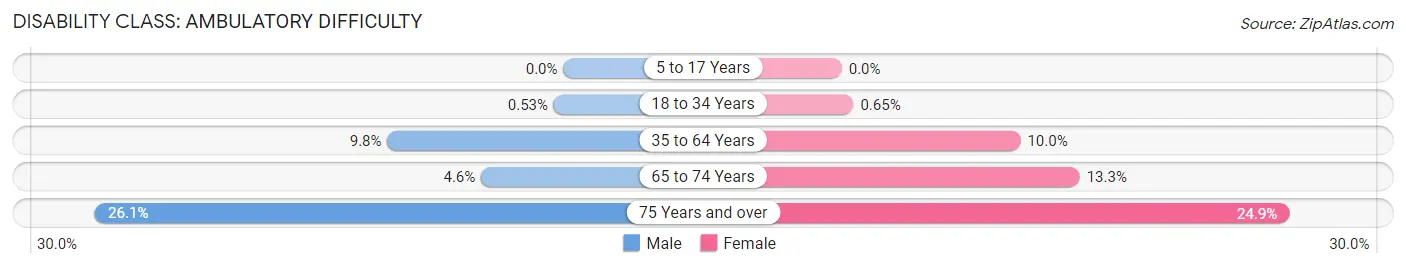
| Age Bracket | Male | Female |
| 5 to 17 Years | 0 (0.0%) | 0 (0.0%) |
| 18 to 34 Years | 23 (0.5%) | 30 (0.6%) |
| 35 to 64 Years | 724 (9.8%) | 725 (10.0%) |
| 65 to 74 Years | 76 (4.6%) | 288 (13.3%) |
| 75 Years and over | 176 (26.1%) | 277 (24.9%) |
Disability Class: Self-Care Difficulty
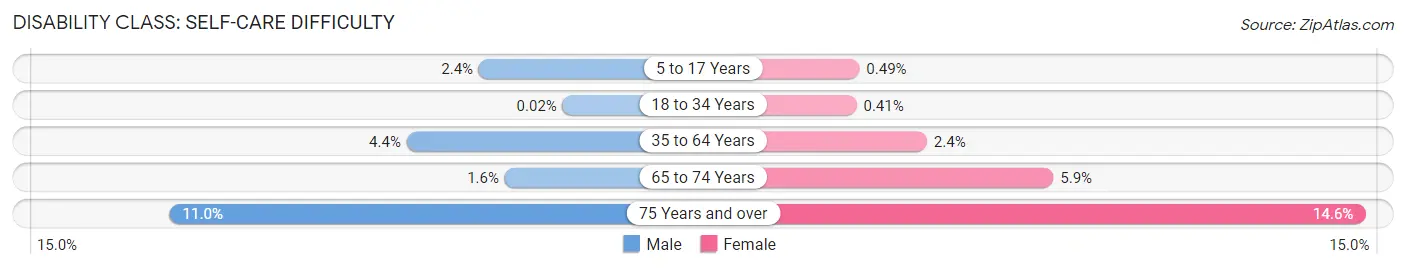
| Age Bracket | Male | Female |
| 5 to 17 Years | 74 (2.4%) | 15 (0.5%) |
| 18 to 34 Years | 1 (0.0%) | 19 (0.4%) |
| 35 to 64 Years | 322 (4.4%) | 173 (2.4%) |
| 65 to 74 Years | 27 (1.6%) | 128 (5.9%) |
| 75 Years and over | 74 (11.0%) | 162 (14.6%) |
Technology Access in Portage
Computing Device Access in Portage
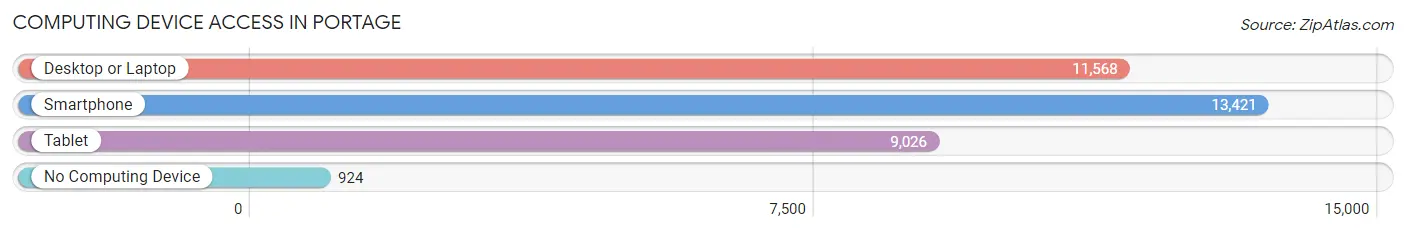
| Device Type | # Households | % Households |
| Desktop or Laptop | 11,568 | 77.2% |
| Smartphone | 13,421 | 89.5% |
| Tablet | 9,026 | 60.2% |
| No Computing Device | 924 | 6.2% |
| Total | 14,993 | 100.0% |
Internet Access in Portage
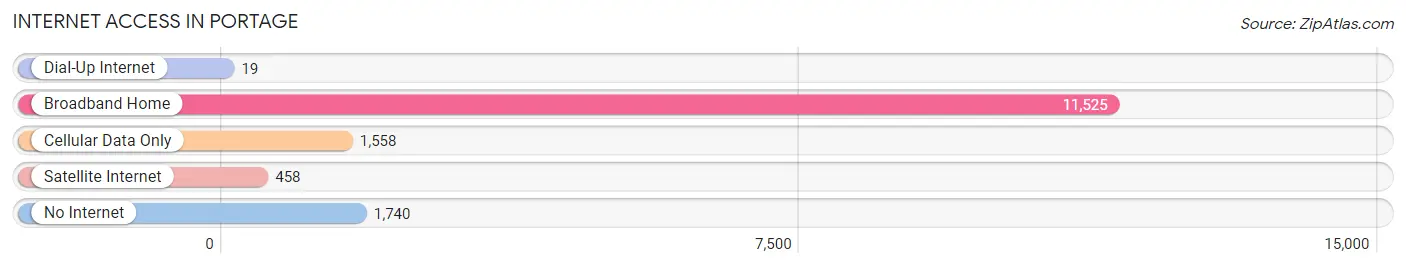
| Internet Type | # Households | % Households |
| Dial-Up Internet | 19 | 0.1% |
| Broadband Home | 11,525 | 76.9% |
| Cellular Data Only | 1,558 | 10.4% |
| Satellite Internet | 458 | 3.0% |
| No Internet | 1,740 | 11.6% |
| Total | 14,993 | 100.0% |
Portage Summary
Portage, Indiana is a city located in Porter County, Indiana, United States. The population was 36,828 at the 2010 census. It is the largest city in Porter County, and is part of the Chicago metropolitan area.
History
Portage was founded in 1832 by settlers from New York. The city was named after the portage between the Little Calumet River and the Deep River. The first post office in Portage was established in 1834.
In 1836, the first school was built in Portage. The first church was built in 1837. The first newspaper, the Portage Gazette, was established in 1845.
In 1851 the first railroad line was built in Portage This line connected Portage to Chicago
In 1853 the first bank was established in Portage
In 1855 the first fire department was established in Portage
In 1858 the first public library was established in Portage
In 1864 the first hospital was established in Portage
In 1871 the first telephone line was established in Portage
In 1872 the first electric light plant was established in Portage
In 1873 the first waterworks was established in Portage
In 1875 the first public park was established in Portage
In 1876 the first public school was established in Portage
In 1877 the first street railway was established in Portage
In 1878 the first telephone exchange was established in Portage
In 1879 the first electric street railway was established in Portage
In 1881 the first public library building was constructed in Portage
In 1883 the first high school was established in Portage
In 1884 the first public sewer system was established in Portage
In 1885 the first electric streetcar line was established in Portage
In 1886 the first public park was established in Portage
In 1887 the first public library building was constructed in Portage
In 1888 the first public hospital was established in Portage
In 1889 the first public library building was constructed in Portage
In 1890 the first public park was established in Portage
In 1891 the first public library building was constructed in Portage
In 1892 the first public park was established in Portage
In 1893 the first public library building was constructed in Portage
In 1894 the first public park was established in Portage
In 1895 the first public library building was constructed in Portage
In 1896 the first public park was established in Portage
In 1897 the first public library building was constructed in Portage
In 1898 the first public park was established in Portage
In 1899 the first public library building was constructed in Portage
Geography
Portage is located at 41°33′N 87°10′W (41.55, -87.17). According to the 2010 census, Portage has a total area of 16.9 square miles (43.7 km2), of which 16.8 square miles (43.5 km2) is land and 0.1 square miles (0.2 km2) is water.
Economy
Portage is home to a variety of businesses and industries. The city is home to several large employers, including the U.S. Steel Corporation, ArcelorMittal, and the Portage Township School Corporation.
The city is also home to a number of small businesses, including restaurants, retail stores, and professional services.
Demographics
As of the 2010 census, there were 36,828 people, 14,845 households, and 9,845 families residing in the city. The population density was 2,192.3 people per square mile (845.2/km2). There were 15,845 housing units at an average density of 945.2 per square mile (364.7/km2). The racial makeup of the city was 87.2% White, 5.3% African American, 0.3% Native American, 2.2% Asian, 0.1% Pacific Islander, 2.7% from other races, and 2.4% from two or more races. Hispanic or Latino of any race were 6.7% of the population.
There were 14,845 households, out of which 30.2% had children under the age of 18 living with them, 48.2% were married couples living together, 12.7% had a female householder with no husband present, and 34.3% were non-families. 28.3% of all households were made up of individuals, and 10.3% had someone living alone who was 65 years of age or older. The average household size was 2.45 and the average family size was 3.00.
In the city, the population was spread out, with 24.2% under the age of 18, 8.2% from 18 to 24, 29.3% from 25 to 44, 23.2% from 45 to 64, and 15.1% who were 65 years of age or older. The median age was 37 years. For every 100 females, there were 93.2 males. For every 100 females age 18 and over, there were 89.7 males.
The median income for a household in the city was $45,945, and the median income for a family was $54,945. Males had a median income of $41,945 versus $30,945 for females. The per capita income for the city was $22,945. About 5.2% of families and 7.2% of the population were below the poverty line, including 9.2% of those under age 18 and 6.2% of those age 65 or over.
Common Questions
What is Per Capita Income in Portage?
Per Capita income in Portage is $32,637.
What is the Median Family Income in Portage?
Median Family Income in Portage is $84,025.
What is the Median Household income in Portage?
Median Household Income in Portage is $71,317.
What is Income or Wage Gap in Portage?
Income or Wage Gap in Portage is 41.0%.
Women in Portage earn 59.0 cents for every dollar earned by a man.
What is Family Income Deficit in Portage?
Family Income Deficit in Portage is $9,118.
Families that are below poverty line in Portage earn $9,118 less on average than the poverty threshold level.
What is Inequality or Gini Index in Portage?
Inequality or Gini Index in Portage is 0.40.
What is the Total Population of Portage?
Total Population of Portage is 37,737.
What is the Total Male Population of Portage?
Total Male Population of Portage is 18,385.
What is the Total Female Population of Portage?
Total Female Population of Portage is 19,352.
What is the Ratio of Males per 100 Females in Portage?
There are 95.00 Males per 100 Females in Portage.
What is the Ratio of Females per 100 Males in Portage?
There are 105.26 Females per 100 Males in Portage.
What is the Median Population Age in Portage?
Median Population Age in Portage is 38.7 Years.
What is the Average Family Size in Portage
Average Family Size in Portage is 3.1 People.
What is the Average Household Size in Portage
Average Household Size in Portage is 2.5 People.
How Large is the Labor Force in Portage?
There are 19,402 People in the Labor Forcein in Portage.
What is the Percentage of People in the Labor Force in Portage?
63.8% of People are in the Labor Force in Portage.
What is the Unemployment Rate in Portage?
Unemployment Rate in Portage is 6.6%.