Elkhart, IN Map & Demographics
Elkhart Map
Elkhart Overview
$25,494
PER CAPITA INCOME
$52,741
AVG FAMILY INCOME
$46,534
AVG HOUSEHOLD INCOME
34.2%
WAGE / INCOME GAP [ % ]
65.8¢/ $1
WAGE / INCOME GAP [ $ ]
$14,271
FAMILY INCOME DEFICIT
0.45
INEQUALITY / GINI INDEX
53,785
TOTAL POPULATION
25,672
MALE POPULATION
28,113
FEMALE POPULATION
91.32
MALES / 100 FEMALES
109.51
FEMALES / 100 MALES
34.5
MEDIAN AGE
3.3
AVG FAMILY SIZE
2.5
AVG HOUSEHOLD SIZE
25,923
LABOR FORCE [ PEOPLE ]
63.5%
PERCENT IN LABOR FORCE
3.9%
UNEMPLOYMENT RATE
Elkhart Area Codes
Income in Elkhart
Income Overview in Elkhart
Per Capita Income in Elkhart is $25,494, while median incomes of families and households are $52,741 and $46,534 respectively.
| Characteristic | Number | Measure |
| Per Capita Income | 53,785 | $25,494 |
| Median Family Income | 12,142 | $52,741 |
| Mean Family Income | 12,142 | $67,755 |
| Median Household Income | 21,375 | $46,534 |
| Mean Household Income | 21,375 | $60,069 |
| Income Deficit | 12,142 | $14,271 |
| Wage / Income Gap (%) | 53,785 | 34.23% |
| Wage / Income Gap ($) | 53,785 | 65.77¢ per $1 |
| Gini / Inequality Index | 53,785 | 0.45 |
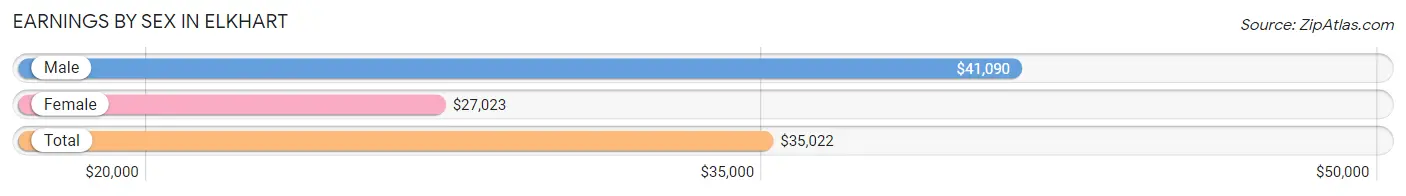
Earnings by Sex in Elkhart
Average Earnings in Elkhart are $35,022, $41,090 for men and $27,023 for women, a difference of 34.2%.
| Sex | Number | Average Earnings |
| Male | 14,351 (53.7%) | $41,090 |
| Female | 12,395 (46.3%) | $27,023 |
| Total | 26,746 (100.0%) | $35,022 |
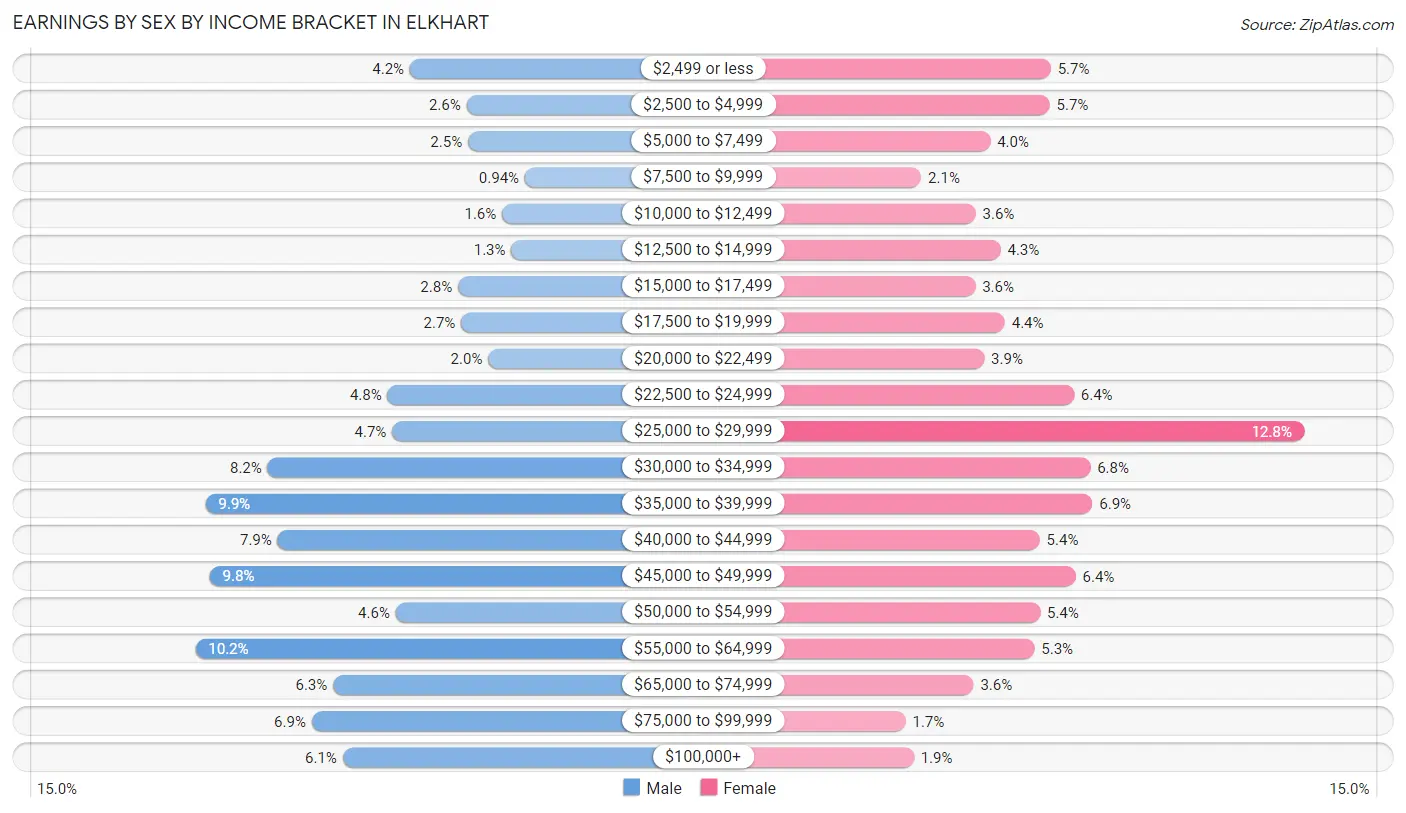
Earnings by Sex by Income Bracket in Elkhart
The most common earnings brackets in Elkhart are $55,000 to $64,999 for men (1,464 | 10.2%) and $25,000 to $29,999 for women (1,592 | 12.8%).
| Income | Male | Female |
| $2,499 or less | 598 (4.2%) | 710 (5.7%) |
| $2,500 to $4,999 | 370 (2.6%) | 707 (5.7%) |
| $5,000 to $7,499 | 365 (2.5%) | 499 (4.0%) |
| $7,500 to $9,999 | 135 (0.9%) | 259 (2.1%) |
| $10,000 to $12,499 | 227 (1.6%) | 449 (3.6%) |
| $12,500 to $14,999 | 190 (1.3%) | 535 (4.3%) |
| $15,000 to $17,499 | 405 (2.8%) | 448 (3.6%) |
| $17,500 to $19,999 | 392 (2.7%) | 550 (4.4%) |
| $20,000 to $22,499 | 282 (2.0%) | 479 (3.9%) |
| $22,500 to $24,999 | 689 (4.8%) | 791 (6.4%) |
| $25,000 to $29,999 | 670 (4.7%) | 1,592 (12.8%) |
| $30,000 to $34,999 | 1,173 (8.2%) | 848 (6.8%) |
| $35,000 to $39,999 | 1,424 (9.9%) | 855 (6.9%) |
| $40,000 to $44,999 | 1,132 (7.9%) | 672 (5.4%) |
| $45,000 to $49,999 | 1,406 (9.8%) | 797 (6.4%) |
| $50,000 to $54,999 | 656 (4.6%) | 673 (5.4%) |
| $55,000 to $64,999 | 1,464 (10.2%) | 653 (5.3%) |
| $65,000 to $74,999 | 909 (6.3%) | 441 (3.6%) |
| $75,000 to $99,999 | 994 (6.9%) | 204 (1.7%) |
| $100,000+ | 870 (6.1%) | 233 (1.9%) |
| Total | 14,351 (100.0%) | 12,395 (100.0%) |
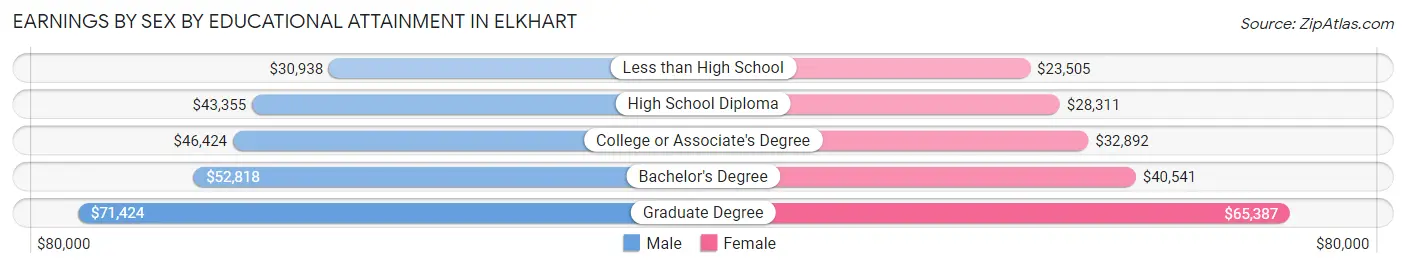
Earnings by Sex by Educational Attainment in Elkhart
Average earnings in Elkhart are $45,124 for men and $32,061 for women, a difference of 28.9%. Men with an educational attainment of graduate degree enjoy the highest average annual earnings of $71,424, while those with less than high school education earn the least with $30,938. Women with an educational attainment of graduate degree earn the most with the average annual earnings of $65,387, while those with less than high school education have the smallest earnings of $23,505.
| Educational Attainment | Male Income | Female Income |
| Less than High School | $30,938 | $23,505 |
| High School Diploma | $43,355 | $28,311 |
| College or Associate's Degree | $46,424 | $32,892 |
| Bachelor's Degree | $52,818 | $40,541 |
| Graduate Degree | $71,424 | $65,387 |
| Total | $45,124 | $32,061 |
Family Income in Elkhart
Family Income Brackets in Elkhart
According to the Elkhart family income data, there are 2,234 families falling into the $50,000 to $74,999 income range, which is the most common income bracket and makes up 18.4% of all families. Conversely, the $150,000 to $199,999 income bracket is the least frequent group with only 413 families (3.4%) belonging to this category.
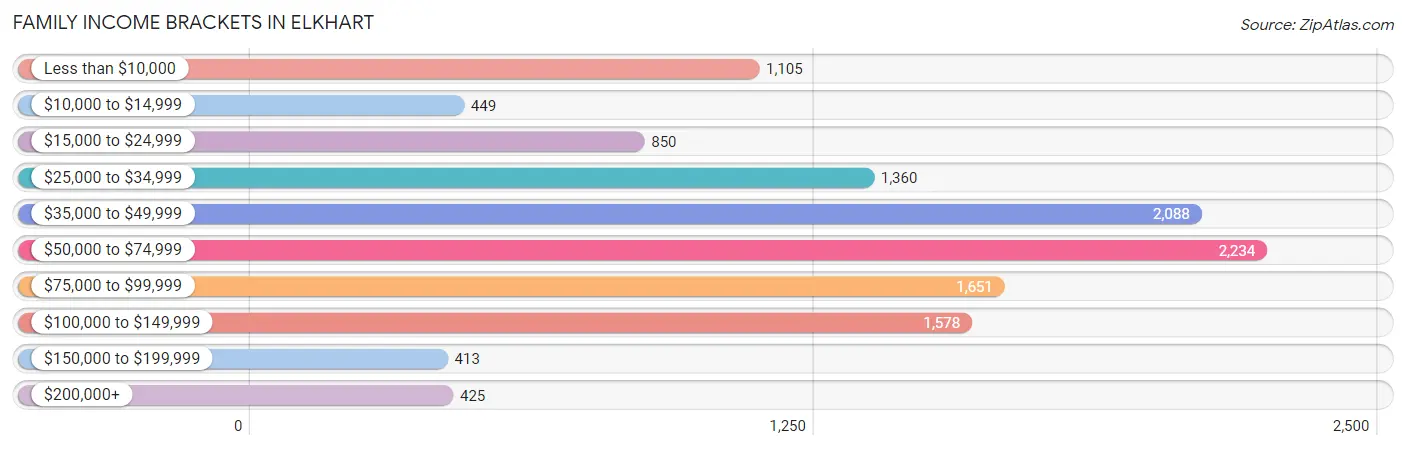
| Income Bracket | # Families | % Families |
| Less than $10,000 | 1,105 | 9.1% |
| $10,000 to $14,999 | 449 | 3.7% |
| $15,000 to $24,999 | 850 | 7.0% |
| $25,000 to $34,999 | 1,360 | 11.2% |
| $35,000 to $49,999 | 2,088 | 17.2% |
| $50,000 to $74,999 | 2,234 | 18.4% |
| $75,000 to $99,999 | 1,651 | 13.6% |
| $100,000 to $149,999 | 1,578 | 13.0% |
| $150,000 to $199,999 | 413 | 3.4% |
| $200,000+ | 425 | 3.5% |
Family Income by Famaliy Size in Elkhart
7+ person families (280 | 2.3%) account for the highest median family income in Elkhart with $87,768 per family, while 2-person families (6,101 | 50.2%) have the highest median income of $24,780 per family member.
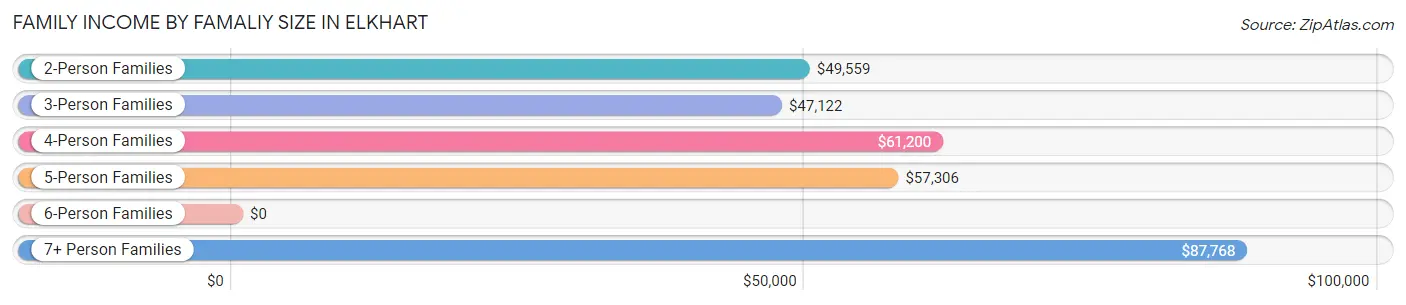
| Income Bracket | # Families | Median Income |
| 2-Person Families | 6,101 (50.2%) | $49,559 |
| 3-Person Families | 3,099 (25.5%) | $47,122 |
| 4-Person Families | 1,789 (14.7%) | $61,200 |
| 5-Person Families | 671 (5.5%) | $57,306 |
| 6-Person Families | 202 (1.7%) | $0 |
| 7+ Person Families | 280 (2.3%) | $87,768 |
| Total | 12,142 (100.0%) | $52,741 |
Family Income by Number of Earners in Elkhart
The median family income in Elkhart is $52,741, with families comprising 3+ earners (1,024) having the highest median family income of $95,259, while families with no earners (2,212) have the lowest median family income of $18,485, accounting for 8.4% and 18.2% of families, respectively.
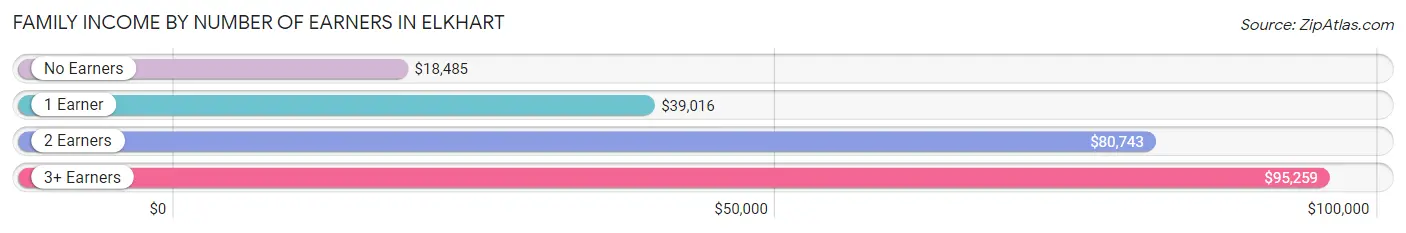
| Number of Earners | # Families | Median Income |
| No Earners | 2,212 (18.2%) | $18,485 |
| 1 Earner | 4,384 (36.1%) | $39,016 |
| 2 Earners | 4,522 (37.2%) | $80,743 |
| 3+ Earners | 1,024 (8.4%) | $95,259 |
| Total | 12,142 (100.0%) | $52,741 |
Household Income in Elkhart
Household Income Brackets in Elkhart
With 4,040 households falling in the category, the $50,000 to $74,999 income range is the most frequent in Elkhart, accounting for 18.9% of all households. In contrast, only 534 households (2.5%) fall into the $150,000 to $199,999 income bracket, making it the least populous group.
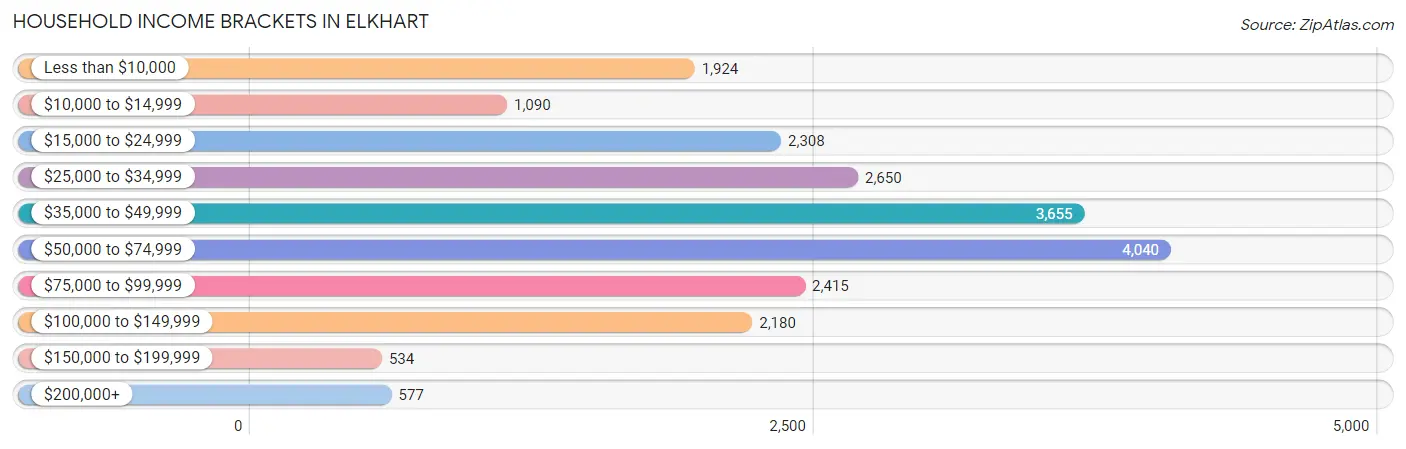
| Income Bracket | # Households | % Households |
| Less than $10,000 | 1,924 | 9.0% |
| $10,000 to $14,999 | 1,090 | 5.1% |
| $15,000 to $24,999 | 2,308 | 10.8% |
| $25,000 to $34,999 | 2,650 | 12.4% |
| $35,000 to $49,999 | 3,655 | 17.1% |
| $50,000 to $74,999 | 4,040 | 18.9% |
| $75,000 to $99,999 | 2,415 | 11.3% |
| $100,000 to $149,999 | 2,180 | 10.2% |
| $150,000 to $199,999 | 534 | 2.5% |
| $200,000+ | 577 | 2.7% |
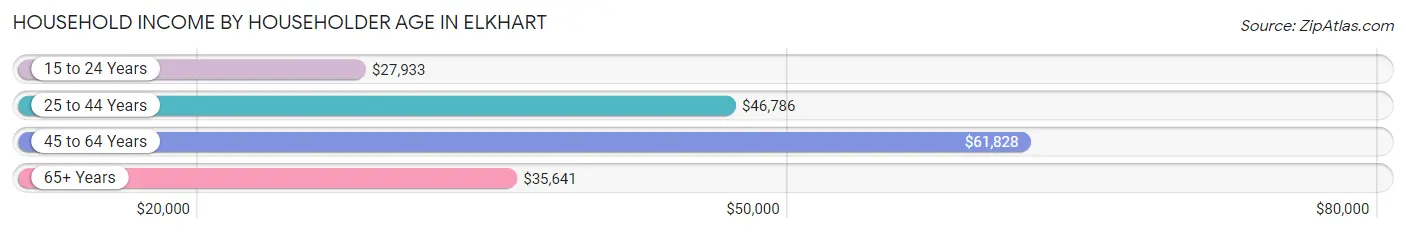
Household Income by Householder Age in Elkhart
The median household income in Elkhart is $46,534, with the highest median household income of $61,828 found in the 45 to 64 years age bracket for the primary householder. A total of 7,868 households (36.8%) fall into this category. Meanwhile, the 15 to 24 years age bracket for the primary householder has the lowest median household income of $27,933, with 1,524 households (7.1%) in this group.
| Income Bracket | # Households | Median Income |
| 15 to 24 Years | 1,524 (7.1%) | $27,933 |
| 25 to 44 Years | 7,167 (33.5%) | $46,786 |
| 45 to 64 Years | 7,868 (36.8%) | $61,828 |
| 65+ Years | 4,816 (22.5%) | $35,641 |
| Total | 21,375 (100.0%) | $46,534 |
Poverty in Elkhart
Income Below Poverty by Sex and Age in Elkhart
With 18.7% poverty level for males and 20.4% for females among the residents of Elkhart, under 5 year old males and 5 year old females are the most vulnerable to poverty, with 867 males (39.6%) and 75 females (32.2%) in their respective age groups living below the poverty level.
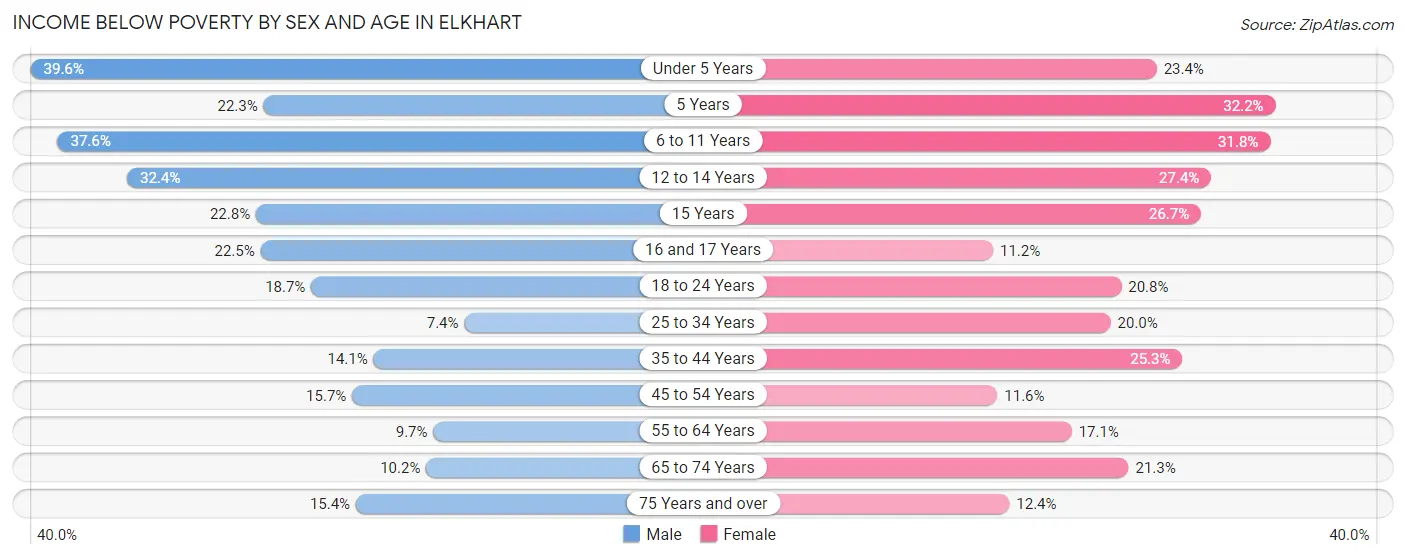
| Age Bracket | Male | Female |
| Under 5 Years | 867 (39.6%) | 463 (23.4%) |
| 5 Years | 69 (22.3%) | 75 (32.2%) |
| 6 to 11 Years | 884 (37.6%) | 760 (31.8%) |
| 12 to 14 Years | 366 (32.4%) | 416 (27.4%) |
| 15 Years | 102 (22.8%) | 60 (26.7%) |
| 16 and 17 Years | 118 (22.5%) | 101 (11.2%) |
| 18 to 24 Years | 438 (18.7%) | 576 (20.7%) |
| 25 to 34 Years | 270 (7.3%) | 794 (20.0%) |
| 35 to 44 Years | 470 (14.1%) | 679 (25.3%) |
| 45 to 54 Years | 550 (15.7%) | 374 (11.6%) |
| 55 to 64 Years | 256 (9.7%) | 559 (17.1%) |
| 65 to 74 Years | 185 (10.2%) | 533 (21.3%) |
| 75 Years and over | 136 (15.4%) | 247 (12.4%) |
| Total | 4,711 (18.7%) | 5,637 (20.4%) |
Income Above Poverty by Sex and Age in Elkhart
According to the poverty statistics in Elkhart, males aged 25 to 34 years and females aged 16 and 17 years are the age groups that are most secure financially, with 92.6% of males and 88.8% of females in these age groups living above the poverty line.
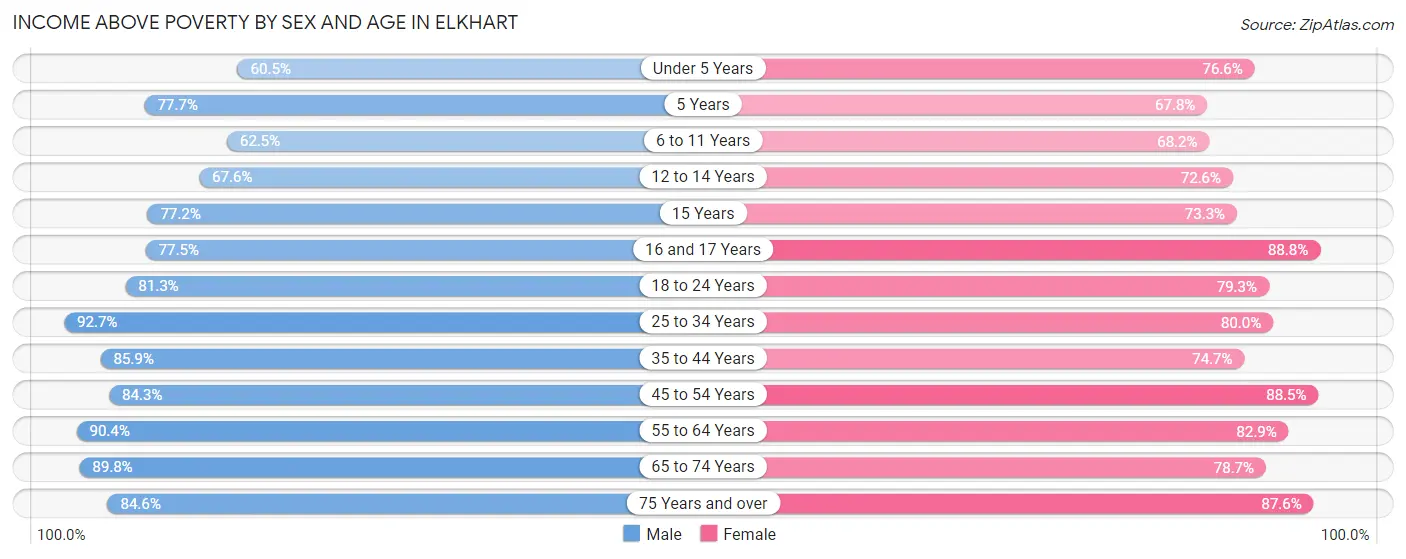
| Age Bracket | Male | Female |
| Under 5 Years | 1,325 (60.5%) | 1,517 (76.6%) |
| 5 Years | 241 (77.7%) | 158 (67.8%) |
| 6 to 11 Years | 1,470 (62.5%) | 1,630 (68.2%) |
| 12 to 14 Years | 764 (67.6%) | 1,101 (72.6%) |
| 15 Years | 345 (77.2%) | 165 (73.3%) |
| 16 and 17 Years | 407 (77.5%) | 798 (88.8%) |
| 18 to 24 Years | 1,902 (81.3%) | 2,200 (79.2%) |
| 25 to 34 Years | 3,402 (92.6%) | 3,183 (80.0%) |
| 35 to 44 Years | 2,865 (85.9%) | 2,007 (74.7%) |
| 45 to 54 Years | 2,958 (84.3%) | 2,864 (88.4%) |
| 55 to 64 Years | 2,398 (90.3%) | 2,715 (82.9%) |
| 65 to 74 Years | 1,633 (89.8%) | 1,970 (78.7%) |
| 75 Years and over | 747 (84.6%) | 1,739 (87.6%) |
| Total | 20,457 (81.3%) | 22,047 (79.6%) |
Income Below Poverty Among Married-Couple Families in Elkhart
The poverty statistics for married-couple families in Elkhart show that 7.1% or 485 of the total 6,780 families live below the poverty line. Families with 3 or 4 children have the highest poverty rate of 26.4%, comprising of 123 families. On the other hand, families with no children have the lowest poverty rate of 3.4%, which includes 144 families.
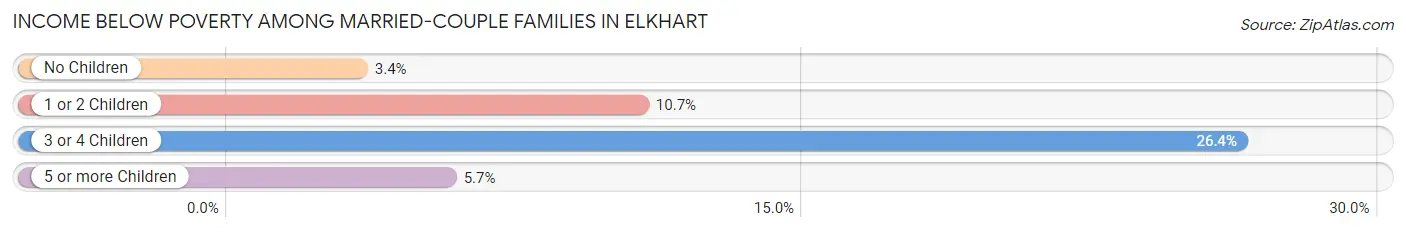
| Children | Above Poverty | Below Poverty |
| No Children | 4,105 (96.6%) | 144 (3.4%) |
| 1 or 2 Children | 1,781 (89.3%) | 214 (10.7%) |
| 3 or 4 Children | 343 (73.6%) | 123 (26.4%) |
| 5 or more Children | 66 (94.3%) | 4 (5.7%) |
| Total | 6,295 (92.8%) | 485 (7.1%) |
Income Below Poverty Among Single-Parent Households in Elkhart
According to the poverty data in Elkhart, 14.0% or 149 single-father households and 34.4% or 1,479 single-mother households are living below the poverty line. Among single-father households, those with 3 or 4 children have the highest poverty rate, with 81 households (44.3%) experiencing poverty. Likewise, among single-mother households, those with 3 or 4 children have the highest poverty rate, with 369 households (59.7%) falling below the poverty line.
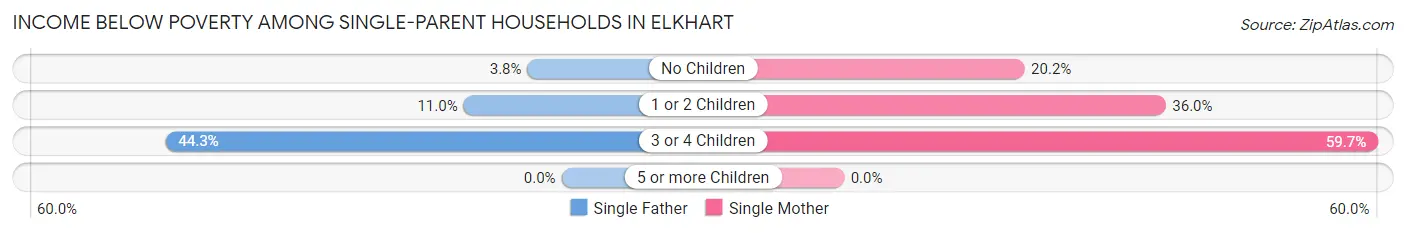
| Children | Single Father | Single Mother |
| No Children | 15 (3.8%) | 266 (20.2%) |
| 1 or 2 Children | 53 (11.0%) | 844 (35.9%) |
| 3 or 4 Children | 81 (44.3%) | 369 (59.7%) |
| 5 or more Children | 0 (0.0%) | 0 (0.0%) |
| Total | 149 (14.0%) | 1,479 (34.4%) |
Income Below Poverty Among Married-Couple vs Single-Parent Households in Elkhart
The poverty data for Elkhart shows that 485 of the married-couple family households (7.1%) and 1,628 of the single-parent households (30.4%) are living below the poverty level. Within the married-couple family households, those with 3 or 4 children have the highest poverty rate, with 123 households (26.4%) falling below the poverty line. Among the single-parent households, those with 3 or 4 children have the highest poverty rate, with 450 household (56.2%) living below poverty.
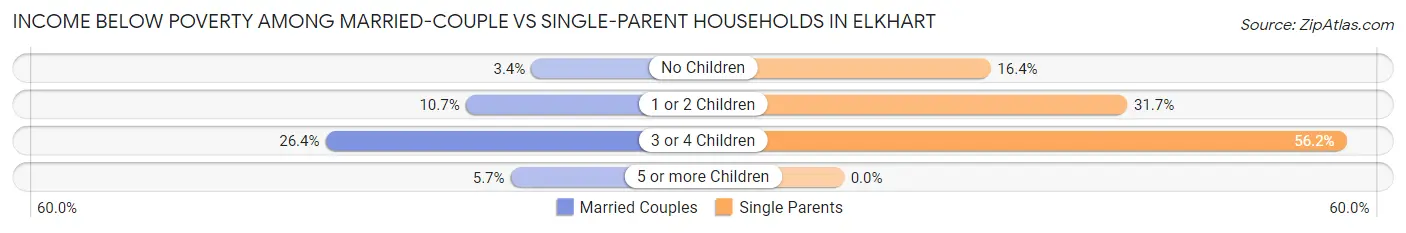
| Children | Married-Couple Families | Single-Parent Households |
| No Children | 144 (3.4%) | 281 (16.4%) |
| 1 or 2 Children | 214 (10.7%) | 897 (31.7%) |
| 3 or 4 Children | 123 (26.4%) | 450 (56.2%) |
| 5 or more Children | 4 (5.7%) | 0 (0.0%) |
| Total | 485 (7.1%) | 1,628 (30.4%) |
Race in Elkhart
The most populous races in Elkhart are White / Caucasian (36,793 | 68.4%), Hispanic or Latino (14,096 | 26.2%), and Black / African American (6,600 | 12.3%).
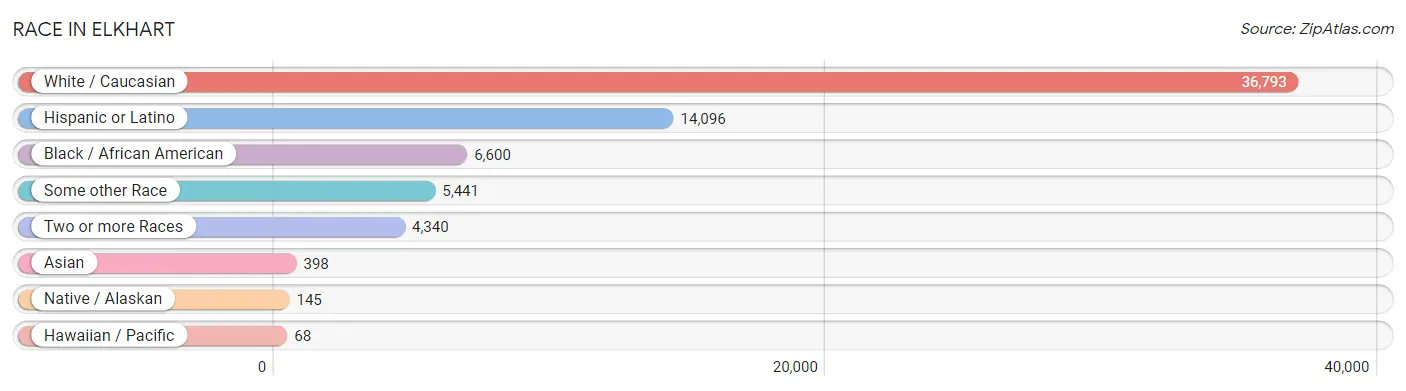
| Race | # Population | % Population |
| Asian | 398 | 0.7% |
| Black / African American | 6,600 | 12.3% |
| Hawaiian / Pacific | 68 | 0.1% |
| Hispanic or Latino | 14,096 | 26.2% |
| Native / Alaskan | 145 | 0.3% |
| White / Caucasian | 36,793 | 68.4% |
| Two or more Races | 4,340 | 8.1% |
| Some other Race | 5,441 | 10.1% |
| Total | 53,785 | 100.0% |
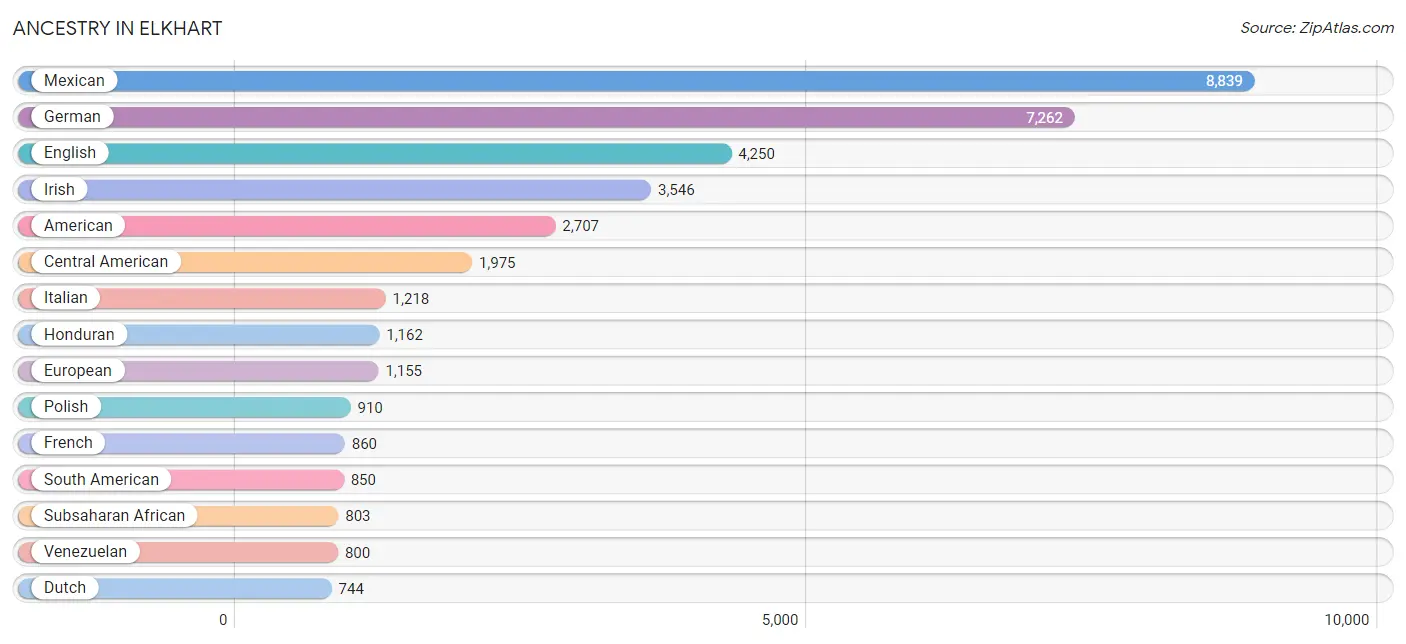
Ancestry in Elkhart
The most populous ancestries reported in Elkhart are Mexican (8,839 | 16.4%), German (7,262 | 13.5%), English (4,250 | 7.9%), Irish (3,546 | 6.6%), and American (2,707 | 5.0%), together accounting for 49.5% of all Elkhart residents.
| Ancestry | # Population | % Population |
| African | 624 | 1.2% |
| American | 2,707 | 5.0% |
| Arab | 101 | 0.2% |
| Argentinean | 3 | 0.0% |
| Austrian | 38 | 0.1% |
| Belgian | 74 | 0.1% |
| Bhutanese | 47 | 0.1% |
| Blackfeet | 55 | 0.1% |
| Bolivian | 47 | 0.1% |
| Brazilian | 312 | 0.6% |
| British | 420 | 0.8% |
| Bulgarian | 16 | 0.0% |
| Burmese | 74 | 0.1% |
| Canadian | 104 | 0.2% |
| Central American | 1,975 | 3.7% |
| Cherokee | 261 | 0.5% |
| Choctaw | 20 | 0.0% |
| Costa Rican | 15 | 0.0% |
| Croatian | 40 | 0.1% |
| Cuban | 302 | 0.6% |
| Czech | 32 | 0.1% |
| Danish | 76 | 0.1% |
| Dominican | 222 | 0.4% |
| Dutch | 744 | 1.4% |
| Eastern European | 66 | 0.1% |
| Egyptian | 9 | 0.0% |
| English | 4,250 | 7.9% |
| Ethiopian | 12 | 0.0% |
| European | 1,155 | 2.1% |
| Fijian | 68 | 0.1% |
| Finnish | 69 | 0.1% |
| French | 860 | 1.6% |
| French Canadian | 29 | 0.1% |
| German | 7,262 | 13.5% |
| Ghanaian | 23 | 0.0% |
| Greek | 65 | 0.1% |
| Guatemalan | 189 | 0.4% |
| Haitian | 16 | 0.0% |
| Honduran | 1,162 | 2.2% |
| Hungarian | 219 | 0.4% |
| Indian (Asian) | 24 | 0.0% |
| Irish | 3,546 | 6.6% |
| Iroquois | 12 | 0.0% |
| Italian | 1,218 | 2.3% |
| Japanese | 56 | 0.1% |
| Korean | 189 | 0.4% |
| Latvian | 7 | 0.0% |
| Lebanese | 49 | 0.1% |
| Lithuanian | 19 | 0.0% |
| Malaysian | 62 | 0.1% |
| Mexican | 8,839 | 16.4% |
| Mexican American Indian | 83 | 0.2% |
| Native Hawaiian | 3 | 0.0% |
| Nigerian | 18 | 0.0% |
| Northern European | 104 | 0.2% |
| Norwegian | 111 | 0.2% |
| Pakistani | 23 | 0.0% |
| Pennsylvania German | 179 | 0.3% |
| Polish | 910 | 1.7% |
| Portuguese | 12 | 0.0% |
| Potawatomi | 4 | 0.0% |
| Puerto Rican | 734 | 1.4% |
| Russian | 110 | 0.2% |
| Salvadoran | 609 | 1.1% |
| Scandinavian | 38 | 0.1% |
| Scotch-Irish | 148 | 0.3% |
| Scottish | 422 | 0.8% |
| Seminole | 5 | 0.0% |
| Serbian | 9 | 0.0% |
| Sioux | 14 | 0.0% |
| Slovak | 149 | 0.3% |
| South African | 20 | 0.0% |
| South American | 850 | 1.6% |
| South American Indian | 47 | 0.1% |
| Spaniard | 71 | 0.1% |
| Spanish | 240 | 0.4% |
| Spanish American | 24 | 0.0% |
| Sri Lankan | 22 | 0.0% |
| Subsaharan African | 803 | 1.5% |
| Swedish | 395 | 0.7% |
| Swiss | 262 | 0.5% |
| Syrian | 14 | 0.0% |
| Thai | 183 | 0.3% |
| Turkish | 32 | 0.1% |
| Ukrainian | 5 | 0.0% |
| Venezuelan | 800 | 1.5% |
| Welsh | 108 | 0.2% | View All 87 Rows |
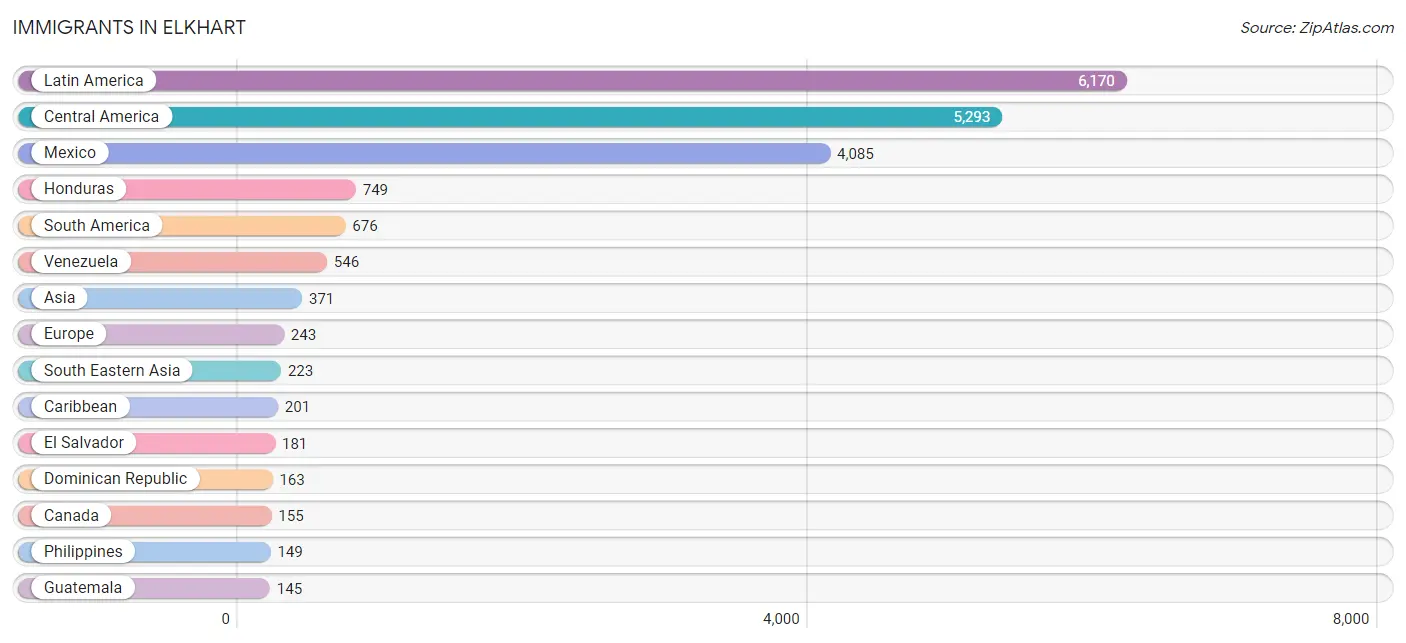
Immigrants in Elkhart
The most numerous immigrant groups reported in Elkhart came from Latin America (6,170 | 11.5%), Central America (5,293 | 9.8%), Mexico (4,085 | 7.6%), Honduras (749 | 1.4%), and South America (676 | 1.3%), together accounting for 31.6% of all Elkhart residents.
| Immigration Origin | # Population | % Population |
| Africa | 62 | 0.1% |
| Argentina | 3 | 0.0% |
| Asia | 371 | 0.7% |
| Belize | 118 | 0.2% |
| Bolivia | 47 | 0.1% |
| Brazil | 80 | 0.2% |
| Cambodia | 29 | 0.1% |
| Canada | 155 | 0.3% |
| Caribbean | 201 | 0.4% |
| Central America | 5,293 | 9.8% |
| Costa Rica | 15 | 0.0% |
| Dominican Republic | 163 | 0.3% |
| Eastern Africa | 19 | 0.0% |
| Eastern Asia | 70 | 0.1% |
| Eastern Europe | 24 | 0.0% |
| El Salvador | 181 | 0.3% |
| Ethiopia | 12 | 0.0% |
| Europe | 243 | 0.4% |
| Germany | 90 | 0.2% |
| Ghana | 23 | 0.0% |
| Guatemala | 145 | 0.3% |
| Haiti | 25 | 0.1% |
| Honduras | 749 | 1.4% |
| Hungary | 7 | 0.0% |
| India | 78 | 0.2% |
| Italy | 27 | 0.1% |
| Japan | 14 | 0.0% |
| Korea | 56 | 0.1% |
| Laos | 45 | 0.1% |
| Latin America | 6,170 | 11.5% |
| Mexico | 4,085 | 7.6% |
| Netherlands | 44 | 0.1% |
| Northern Europe | 58 | 0.1% |
| Oceania | 43 | 0.1% |
| Philippines | 149 | 0.3% |
| Poland | 3 | 0.0% |
| Russia | 11 | 0.0% |
| Scotland | 9 | 0.0% |
| South Africa | 20 | 0.0% |
| South America | 676 | 1.3% |
| South Central Asia | 78 | 0.2% |
| South Eastern Asia | 223 | 0.4% |
| Southern Europe | 27 | 0.1% |
| Ukraine | 3 | 0.0% |
| Venezuela | 546 | 1.0% |
| West Indies | 13 | 0.0% |
| Western Africa | 23 | 0.0% |
| Western Europe | 134 | 0.3% | View All 48 Rows |
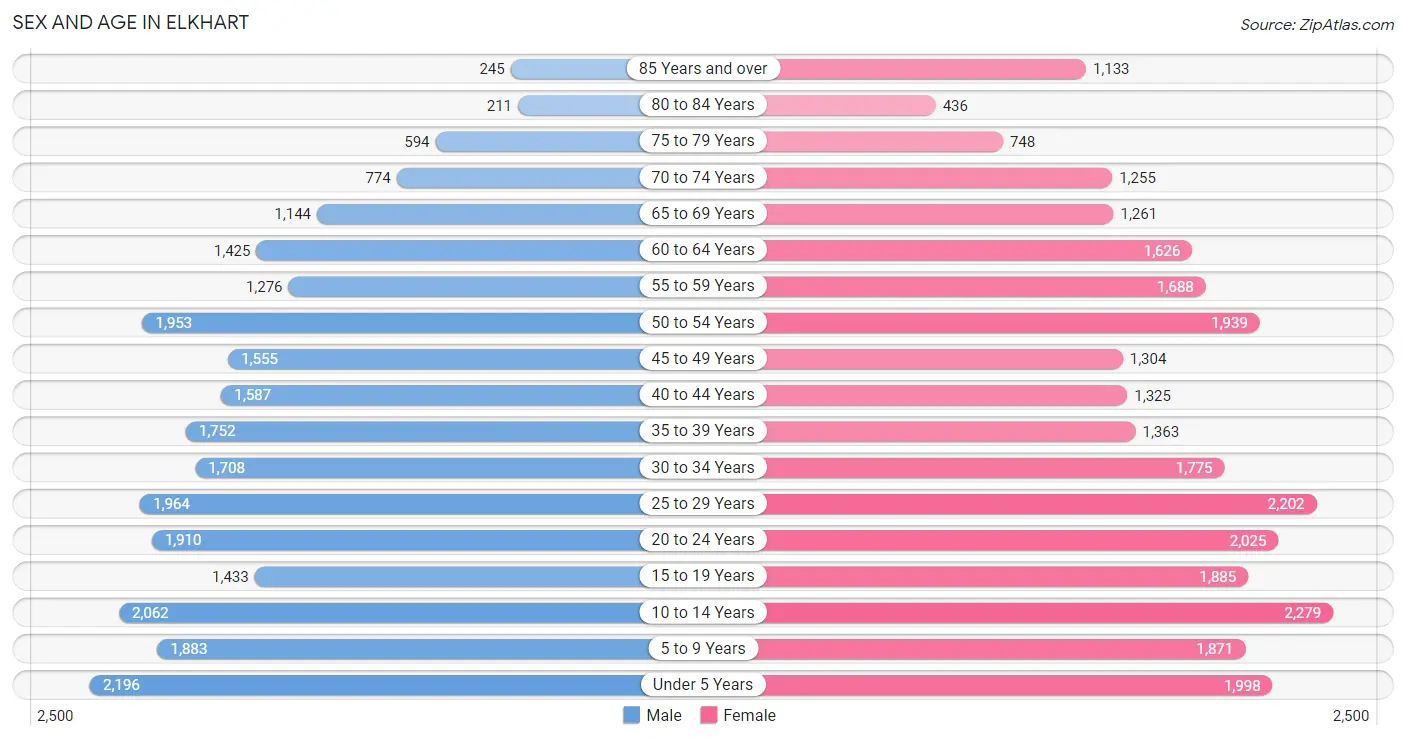
Sex and Age in Elkhart
Sex and Age in Elkhart
The most populous age groups in Elkhart are Under 5 Years (2,196 | 8.6%) for men and 10 to 14 Years (2,279 | 8.1%) for women.
| Age Bracket | Male | Female |
| Under 5 Years | 2,196 (8.6%) | 1,998 (7.1%) |
| 5 to 9 Years | 1,883 (7.3%) | 1,871 (6.7%) |
| 10 to 14 Years | 2,062 (8.0%) | 2,279 (8.1%) |
| 15 to 19 Years | 1,433 (5.6%) | 1,885 (6.7%) |
| 20 to 24 Years | 1,910 (7.4%) | 2,025 (7.2%) |
| 25 to 29 Years | 1,964 (7.6%) | 2,202 (7.8%) |
| 30 to 34 Years | 1,708 (6.7%) | 1,775 (6.3%) |
| 35 to 39 Years | 1,752 (6.8%) | 1,363 (4.9%) |
| 40 to 44 Years | 1,587 (6.2%) | 1,325 (4.7%) |
| 45 to 49 Years | 1,555 (6.1%) | 1,304 (4.6%) |
| 50 to 54 Years | 1,953 (7.6%) | 1,939 (6.9%) |
| 55 to 59 Years | 1,276 (5.0%) | 1,688 (6.0%) |
| 60 to 64 Years | 1,425 (5.6%) | 1,626 (5.8%) |
| 65 to 69 Years | 1,144 (4.5%) | 1,261 (4.5%) |
| 70 to 74 Years | 774 (3.0%) | 1,255 (4.5%) |
| 75 to 79 Years | 594 (2.3%) | 748 (2.7%) |
| 80 to 84 Years | 211 (0.8%) | 436 (1.5%) |
| 85 Years and over | 245 (0.9%) | 1,133 (4.0%) |
| Total | 25,672 (100.0%) | 28,113 (100.0%) |
Families and Households in Elkhart
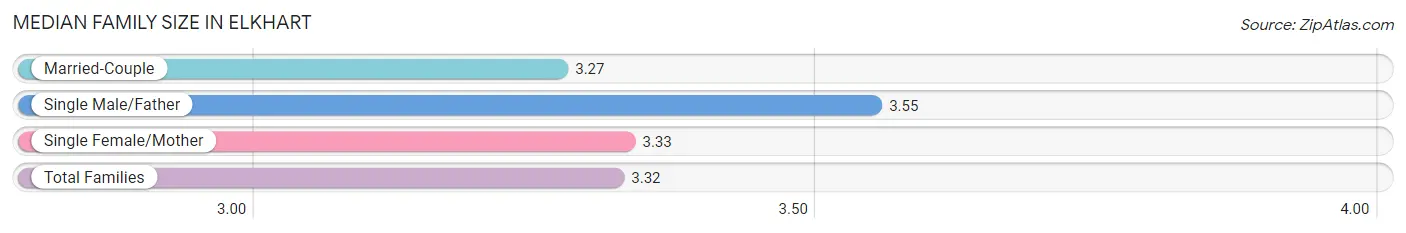
Median Family Size in Elkhart
The median family size in Elkhart is 3.32 persons per family, with single male/father families (1,061 | 8.7%) accounting for the largest median family size of 3.55 persons per family. On the other hand, married-couple families (6,780 | 55.8%) represent the smallest median family size with 3.27 persons per family.
| Family Type | # Families | Family Size |
| Married-Couple | 6,780 (55.8%) | 3.27 |
| Single Male/Father | 1,061 (8.7%) | 3.55 |
| Single Female/Mother | 4,301 (35.4%) | 3.33 |
| Total Families | 12,142 (100.0%) | 3.32 |
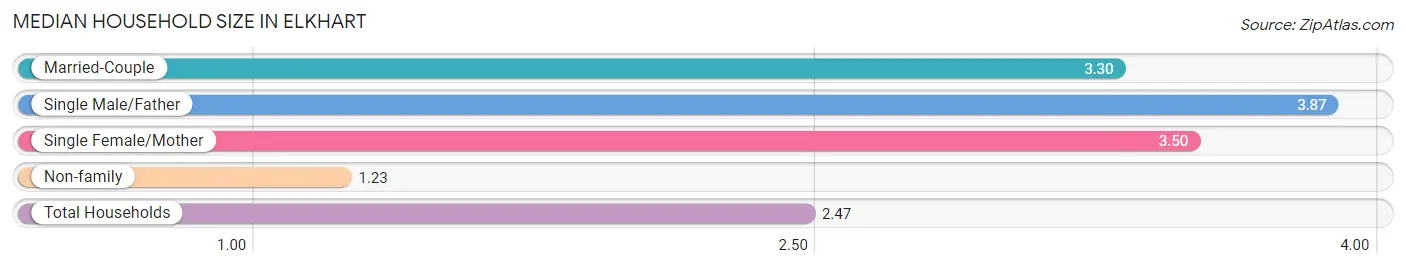
Median Household Size in Elkhart
The median household size in Elkhart is 2.47 persons per household, with single male/father households (1,061 | 5.0%) accounting for the largest median household size of 3.87 persons per household. non-family households (9,233 | 43.2%) represent the smallest median household size with 1.23 persons per household.
| Household Type | # Households | Household Size |
| Married-Couple | 6,780 (31.7%) | 3.30 |
| Single Male/Father | 1,061 (5.0%) | 3.87 |
| Single Female/Mother | 4,301 (20.1%) | 3.50 |
| Non-family | 9,233 (43.2%) | 1.23 |
| Total Households | 21,375 (100.0%) | 2.47 |
Household Size by Marriage Status in Elkhart
Out of a total of 21,375 households in Elkhart, 12,142 (56.8%) are family households, while 9,233 (43.2%) are nonfamily households. The most numerous type of family households are 2-person households, comprising 5,610, and the most common type of nonfamily households are 1-person households, comprising 8,027.
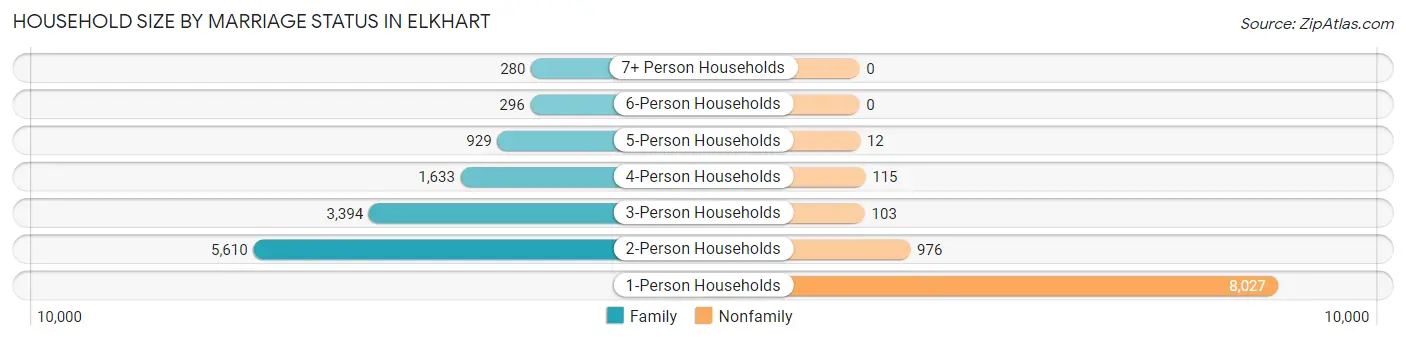
| Household Size | Family Households | Nonfamily Households |
| 1-Person Households | - | 8,027 (37.6%) |
| 2-Person Households | 5,610 (26.3%) | 976 (4.6%) |
| 3-Person Households | 3,394 (15.9%) | 103 (0.5%) |
| 4-Person Households | 1,633 (7.6%) | 115 (0.5%) |
| 5-Person Households | 929 (4.3%) | 12 (0.1%) |
| 6-Person Households | 296 (1.4%) | 0 (0.0%) |
| 7+ Person Households | 280 (1.3%) | 0 (0.0%) |
| Total | 12,142 (56.8%) | 9,233 (43.2%) |
Female Fertility in Elkhart
Fertility by Age in Elkhart
Average fertility rate in Elkhart is 48.0 births per 1,000 women. Women in the age bracket of 20 to 34 years have the highest fertility rate with 80.0 births per 1,000 women. Women in the age bracket of 20 to 34 years acount for 80.8% of all women with births.
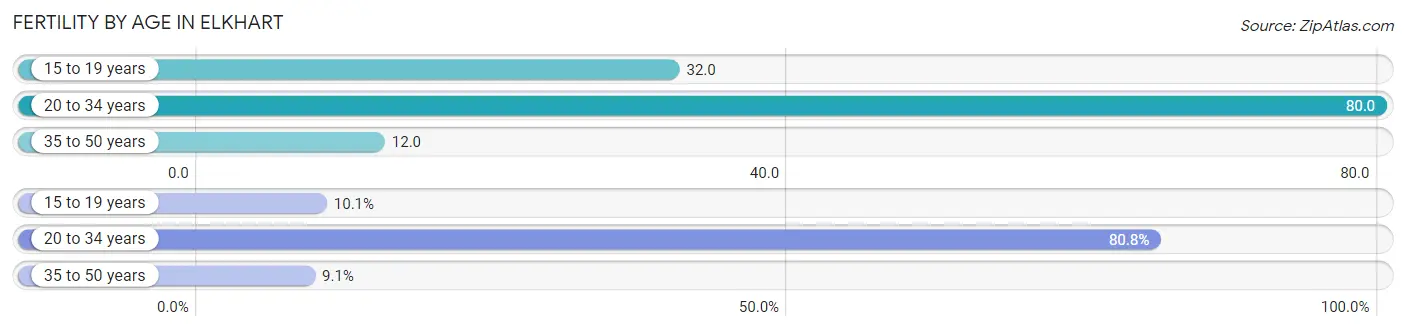
| Age Bracket | Women with Births | Births / 1,000 Women |
| 15 to 19 years | 60 (10.1%) | 32.0 |
| 20 to 34 years | 481 (80.8%) | 80.0 |
| 35 to 50 years | 54 (9.1%) | 12.0 |
| Total | 595 (100.0%) | 48.0 |
Fertility by Age by Marriage Status in Elkhart
48.1% of women with births (595) in Elkhart are married. The highest percentage of unmarried women with births falls into 15 to 19 years age bracket with 100.0% of them unmarried at the time of birth, while the lowest percentage of unmarried women with births belong to 35 to 50 years age bracket with 0.0% of them unmarried.
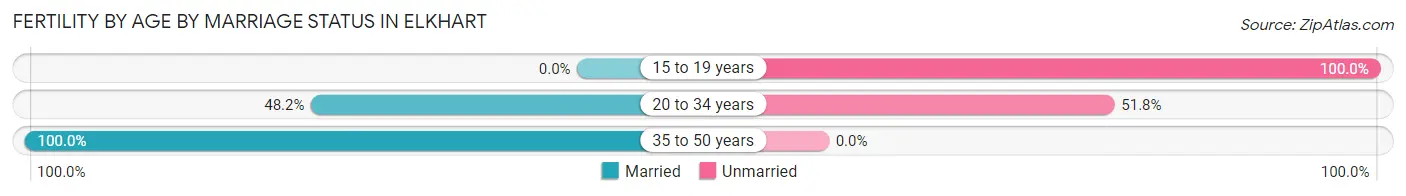
| Age Bracket | Married | Unmarried |
| 15 to 19 years | 0 (0.0%) | 60 (100.0%) |
| 20 to 34 years | 232 (48.2%) | 249 (51.8%) |
| 35 to 50 years | 54 (100.0%) | 0 (0.0%) |
| Total | 286 (48.1%) | 309 (51.9%) |
Fertility by Education in Elkhart
Average fertility rate in Elkhart is 48.0 births per 1,000 women. Women with the education attainment of less than high school have the highest fertility rate of 72.0 births per 1,000 women, while women with the education attainment of college or associate's degree have the lowest fertility at 30.0 births per 1,000 women. Women with the education attainment of less than high school represent 43.5% of all women with births.
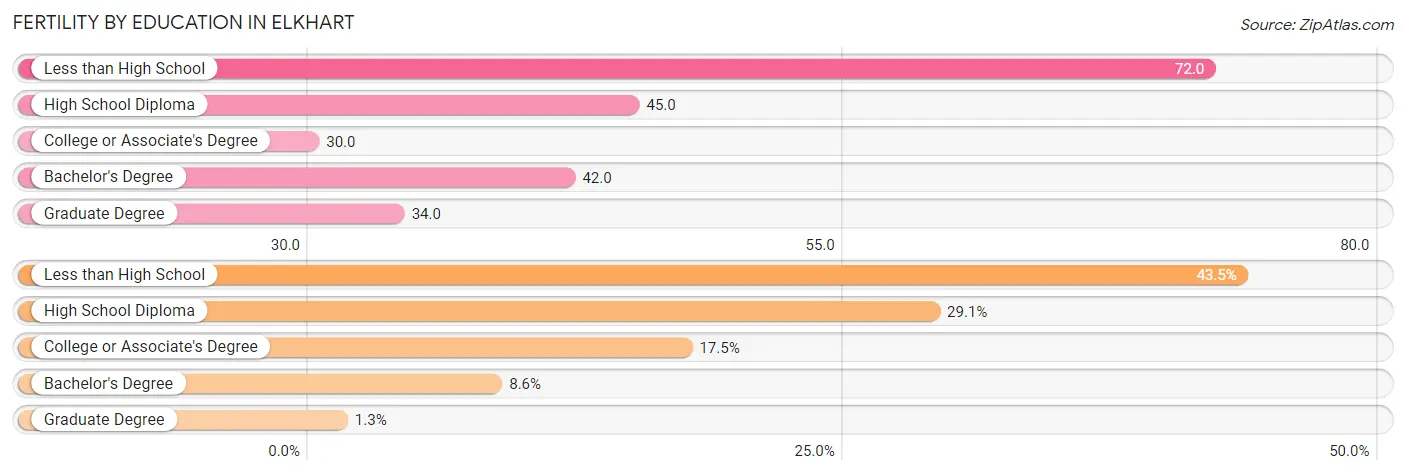
| Educational Attainment | Women with Births | Births / 1,000 Women |
| Less than High School | 259 (43.5%) | 72.0 |
| High School Diploma | 173 (29.1%) | 45.0 |
| College or Associate's Degree | 104 (17.5%) | 30.0 |
| Bachelor's Degree | 51 (8.6%) | 42.0 |
| Graduate Degree | 8 (1.3%) | 34.0 |
| Total | 595 (100.0%) | 48.0 |
Fertility by Education by Marriage Status in Elkhart
51.9% of women with births in Elkhart are unmarried. Women with the educational attainment of bachelor's degree are most likely to be married with 100.0% of them married at childbirth, while women with the educational attainment of less than high school are least likely to be married with 64.5% of them unmarried at childbirth.
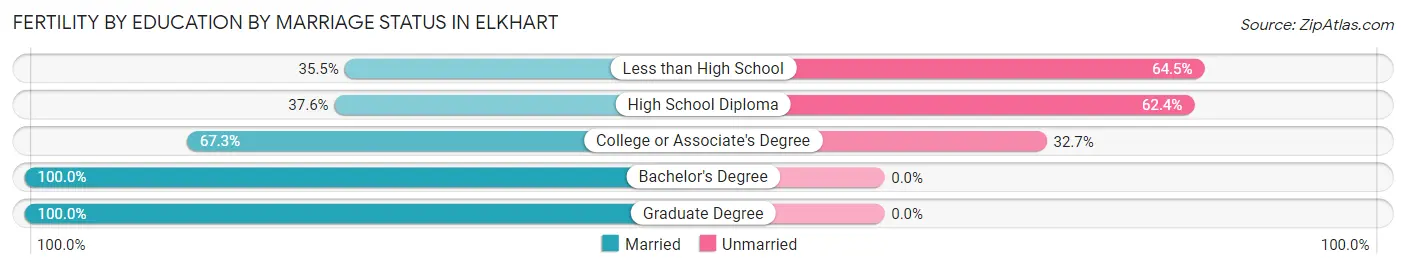
| Educational Attainment | Married | Unmarried |
| Less than High School | 92 (35.5%) | 167 (64.5%) |
| High School Diploma | 65 (37.6%) | 108 (62.4%) |
| College or Associate's Degree | 70 (67.3%) | 34 (32.7%) |
| Bachelor's Degree | 51 (100.0%) | 0 (0.0%) |
| Graduate Degree | 8 (100.0%) | 0 (0.0%) |
| Total | 286 (48.1%) | 309 (51.9%) |
Employment Characteristics in Elkhart
Employment by Class of Employer in Elkhart
Among the 24,369 employed individuals in Elkhart, private company employees (19,365 | 79.5%), not-for-profit organizations (2,116 | 8.7%), and local government employees (1,111 | 4.6%) make up the most common classes of employment.
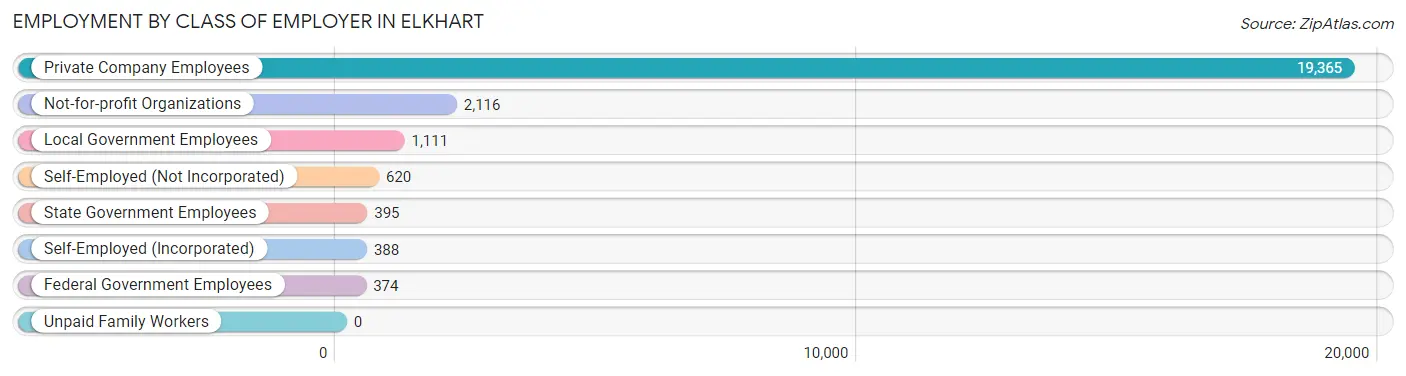
| Employer Class | # Employees | % Employees |
| Private Company Employees | 19,365 | 79.5% |
| Self-Employed (Incorporated) | 388 | 1.6% |
| Self-Employed (Not Incorporated) | 620 | 2.5% |
| Not-for-profit Organizations | 2,116 | 8.7% |
| Local Government Employees | 1,111 | 4.6% |
| State Government Employees | 395 | 1.6% |
| Federal Government Employees | 374 | 1.5% |
| Unpaid Family Workers | 0 | 0.0% |
| Total | 24,369 | 100.0% |
Employment Status by Age in Elkhart
According to the labor force statistics for Elkhart, out of the total population over 16 years of age (40,824), 63.5% or 25,923 individuals are in the labor force, with 3.9% or 1,011 of them unemployed. The age group with the highest labor force participation rate is 30 to 34 years, with 83.2% or 2,898 individuals in the labor force. Within the labor force, the 16 to 19 years age range has the highest percentage of unemployed individuals, with 11.6% or 165 of them being unemployed.
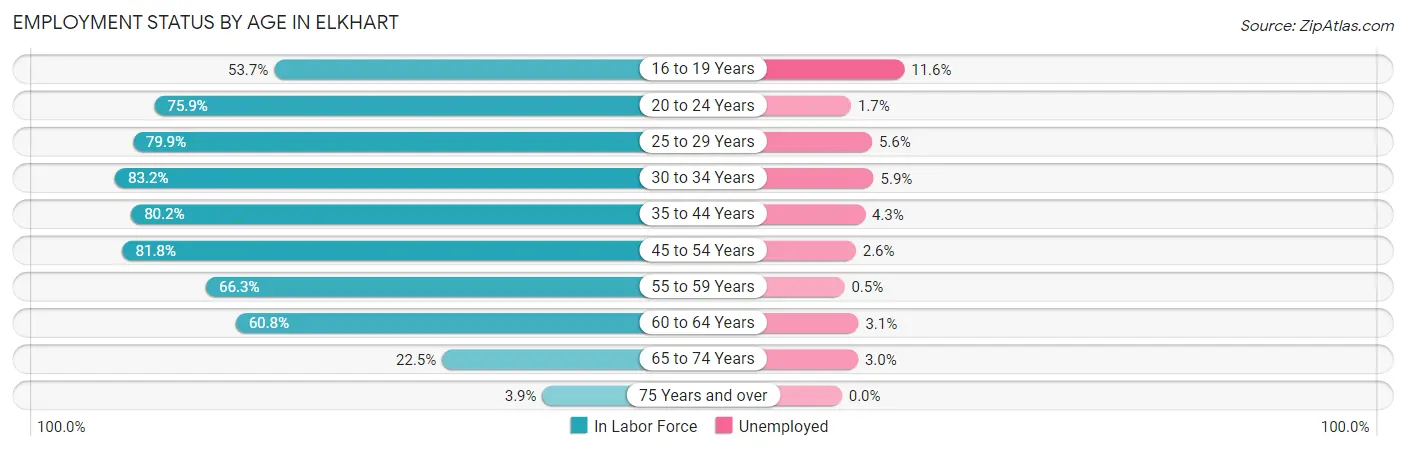
| Age Bracket | In Labor Force | Unemployed |
| 16 to 19 Years | 1,421 (53.7%) | 165 (11.6%) |
| 20 to 24 Years | 2,987 (75.9%) | 51 (1.7%) |
| 25 to 29 Years | 3,329 (79.9%) | 186 (5.6%) |
| 30 to 34 Years | 2,898 (83.2%) | 171 (5.9%) |
| 35 to 44 Years | 4,834 (80.2%) | 208 (4.3%) |
| 45 to 54 Years | 5,522 (81.8%) | 144 (2.6%) |
| 55 to 59 Years | 1,965 (66.3%) | 10 (0.5%) |
| 60 to 64 Years | 1,855 (60.8%) | 58 (3.1%) |
| 65 to 74 Years | 998 (22.5%) | 30 (3.0%) |
| 75 Years and over | 131 (3.9%) | 0 (0.0%) |
| Total | 25,923 (63.5%) | 1,011 (3.9%) |
Employment Status by Educational Attainment in Elkhart
According to labor force statistics for Elkhart, 77.2% of individuals (20,413) out of the total population between 25 and 64 years of age (26,442) are in the labor force, with 3.8% or 776 of them being unemployed. The group with the highest labor force participation rate are those with the educational attainment of bachelor's degree or higher, with 93.2% or 3,840 individuals in the labor force. Within the labor force, individuals with less than high school education have the highest percentage of unemployment, with 8.4% or 245 of them being unemployed.
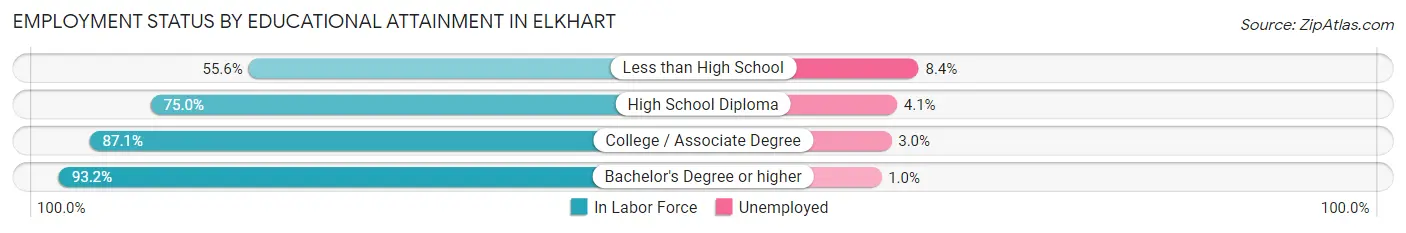
| Educational Attainment | In Labor Force | Unemployed |
| Less than High School | 2,913 (55.6%) | 440 (8.4%) |
| High School Diploma | 7,607 (75.0%) | 416 (4.1%) |
| College / Associate Degree | 6,045 (87.1%) | 208 (3.0%) |
| Bachelor's Degree or higher | 3,840 (93.2%) | 41 (1.0%) |
| Total | 20,413 (77.2%) | 1,005 (3.8%) |
Employment Occupations by Sex in Elkhart
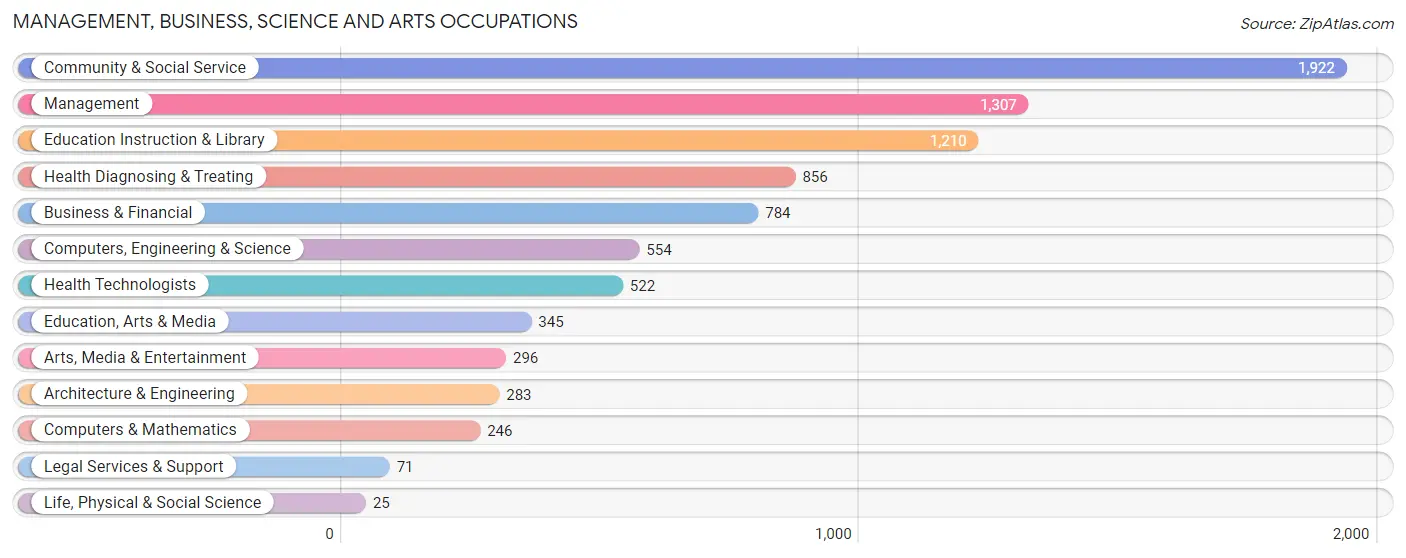
Management, Business, Science and Arts Occupations
The most common Management, Business, Science and Arts occupations in Elkhart are Community & Social Service (1,922 | 7.7%), Management (1,307 | 5.2%), Education Instruction & Library (1,210 | 4.9%), Health Diagnosing & Treating (856 | 3.4%), and Business & Financial (784 | 3.2%).
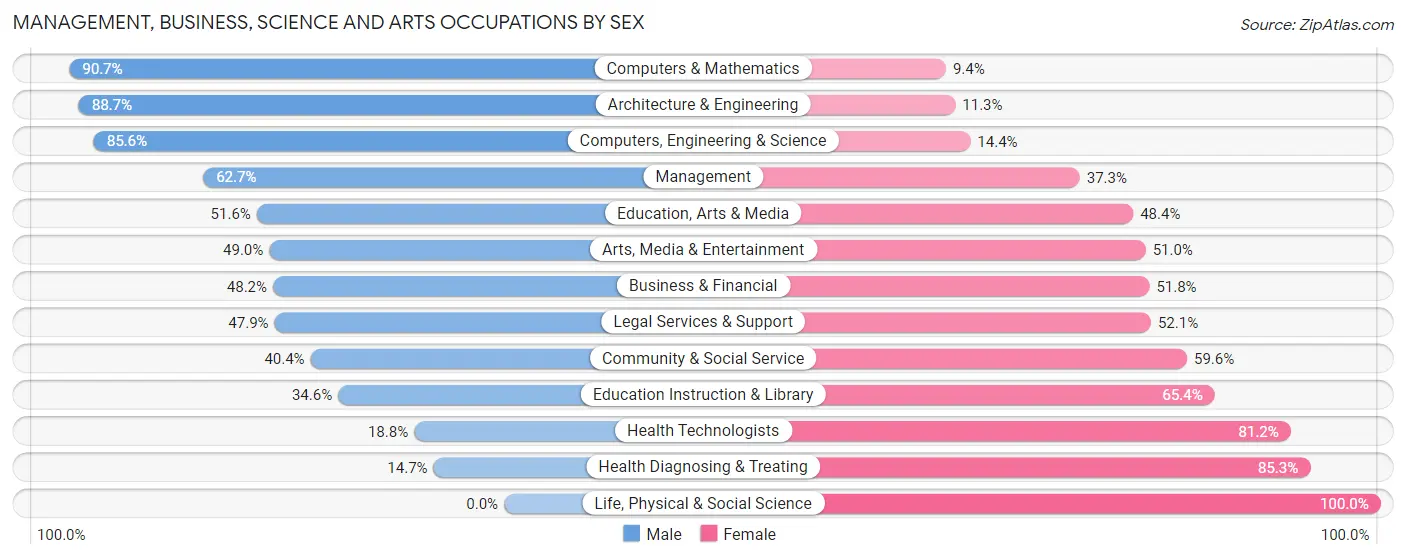
Management, Business, Science and Arts Occupations by Sex
Within the Management, Business, Science and Arts occupations in Elkhart, the most male-oriented occupations are Computers & Mathematics (90.6%), Architecture & Engineering (88.7%), and Computers, Engineering & Science (85.6%), while the most female-oriented occupations are Life, Physical & Social Science (100.0%), Health Diagnosing & Treating (85.3%), and Health Technologists (81.2%).
| Occupation | Male | Female |
| Management | 820 (62.7%) | 487 (37.3%) |
| Business & Financial | 378 (48.2%) | 406 (51.8%) |
| Computers, Engineering & Science | 474 (85.6%) | 80 (14.4%) |
| Computers & Mathematics | 223 (90.6%) | 23 (9.3%) |
| Architecture & Engineering | 251 (88.7%) | 32 (11.3%) |
| Life, Physical & Social Science | 0 (0.0%) | 25 (100.0%) |
| Community & Social Service | 776 (40.4%) | 1,146 (59.6%) |
| Education, Arts & Media | 178 (51.6%) | 167 (48.4%) |
| Legal Services & Support | 34 (47.9%) | 37 (52.1%) |
| Education Instruction & Library | 419 (34.6%) | 791 (65.4%) |
| Arts, Media & Entertainment | 145 (49.0%) | 151 (51.0%) |
| Health Diagnosing & Treating | 126 (14.7%) | 730 (85.3%) |
| Health Technologists | 98 (18.8%) | 424 (81.2%) |
| Total (Category) | 2,574 (47.5%) | 2,849 (52.5%) |
| Total (Overall) | 13,441 (53.9%) | 11,471 (46.1%) |
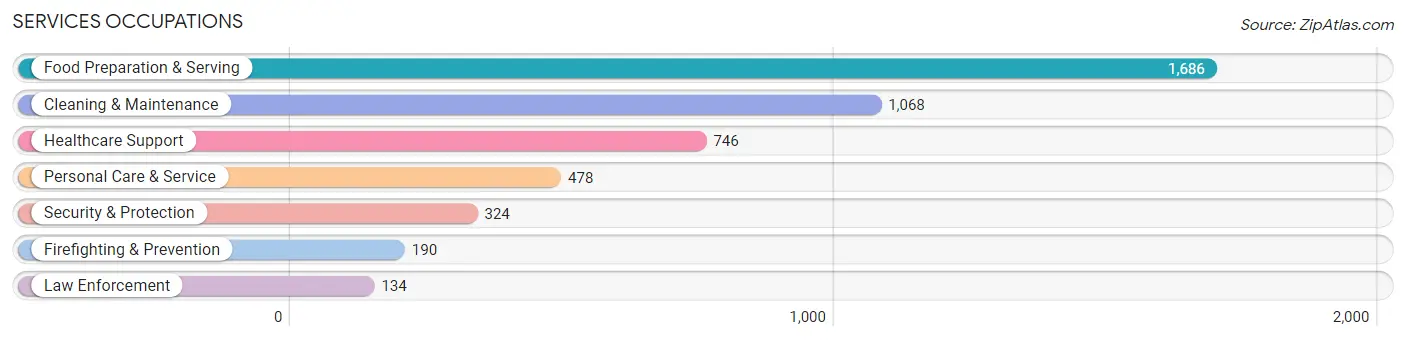
Services Occupations
The most common Services occupations in Elkhart are Food Preparation & Serving (1,686 | 6.8%), Cleaning & Maintenance (1,068 | 4.3%), Healthcare Support (746 | 3.0%), Personal Care & Service (478 | 1.9%), and Security & Protection (324 | 1.3%).
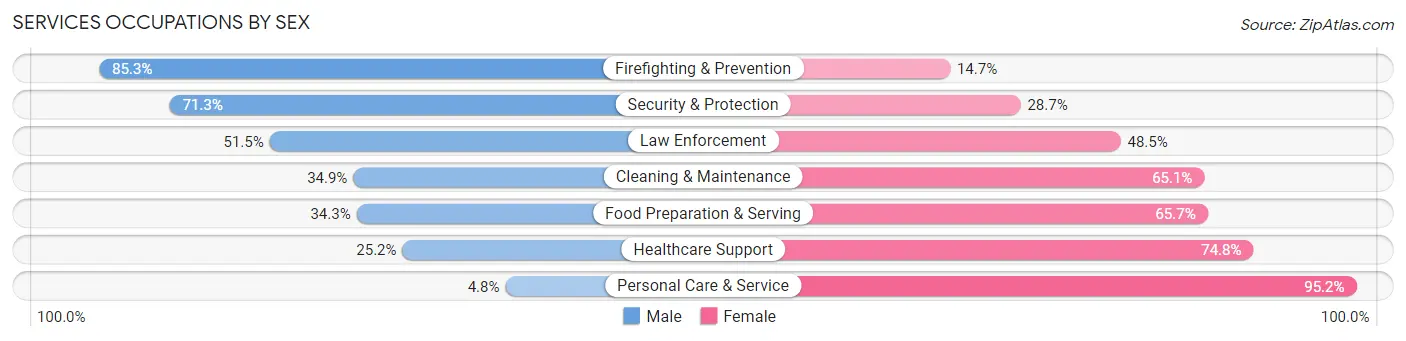
Services Occupations by Sex
Within the Services occupations in Elkhart, the most male-oriented occupations are Firefighting & Prevention (85.3%), Security & Protection (71.3%), and Law Enforcement (51.5%), while the most female-oriented occupations are Personal Care & Service (95.2%), Healthcare Support (74.8%), and Food Preparation & Serving (65.7%).
| Occupation | Male | Female |
| Healthcare Support | 188 (25.2%) | 558 (74.8%) |
| Security & Protection | 231 (71.3%) | 93 (28.7%) |
| Firefighting & Prevention | 162 (85.3%) | 28 (14.7%) |
| Law Enforcement | 69 (51.5%) | 65 (48.5%) |
| Food Preparation & Serving | 578 (34.3%) | 1,108 (65.7%) |
| Cleaning & Maintenance | 373 (34.9%) | 695 (65.1%) |
| Personal Care & Service | 23 (4.8%) | 455 (95.2%) |
| Total (Category) | 1,393 (32.4%) | 2,909 (67.6%) |
| Total (Overall) | 13,441 (53.9%) | 11,471 (46.1%) |
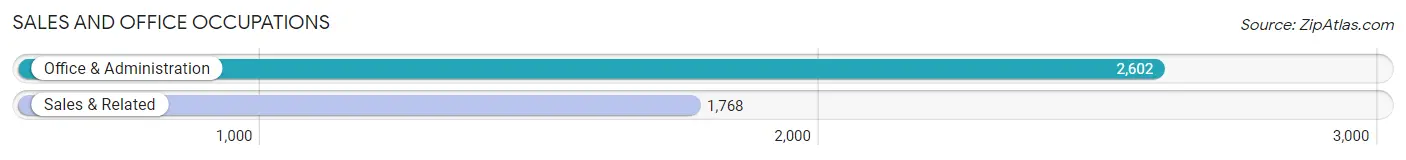
Sales and Office Occupations
The most common Sales and Office occupations in Elkhart are Office & Administration (2,602 | 10.4%), and Sales & Related (1,768 | 7.1%).
Sales and Office Occupations by Sex
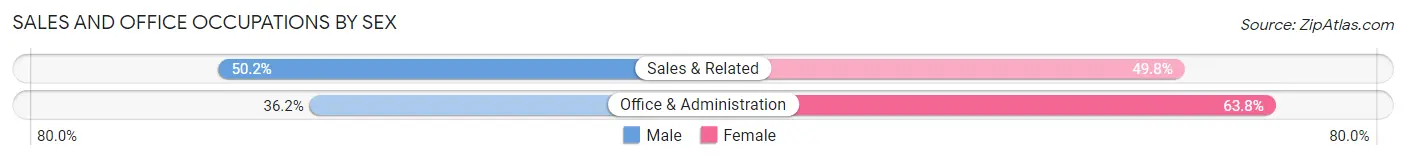
| Occupation | Male | Female |
| Sales & Related | 887 (50.2%) | 881 (49.8%) |
| Office & Administration | 941 (36.2%) | 1,661 (63.8%) |
| Total (Category) | 1,828 (41.8%) | 2,542 (58.2%) |
| Total (Overall) | 13,441 (53.9%) | 11,471 (46.1%) |
Natural Resources, Construction and Maintenance Occupations
The most common Natural Resources, Construction and Maintenance occupations in Elkhart are Construction & Extraction (1,112 | 4.5%), Installation, Maintenance & Repair (440 | 1.8%), and Farming, Fishing & Forestry (106 | 0.4%).

Natural Resources, Construction and Maintenance Occupations by Sex
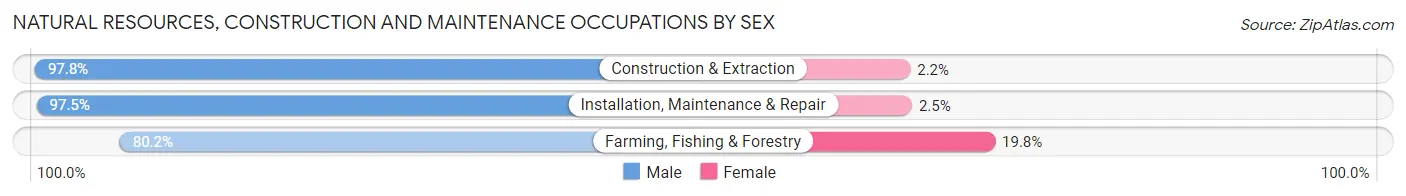
| Occupation | Male | Female |
| Farming, Fishing & Forestry | 85 (80.2%) | 21 (19.8%) |
| Construction & Extraction | 1,088 (97.8%) | 24 (2.2%) |
| Installation, Maintenance & Repair | 429 (97.5%) | 11 (2.5%) |
| Total (Category) | 1,602 (96.6%) | 56 (3.4%) |
| Total (Overall) | 13,441 (53.9%) | 11,471 (46.1%) |
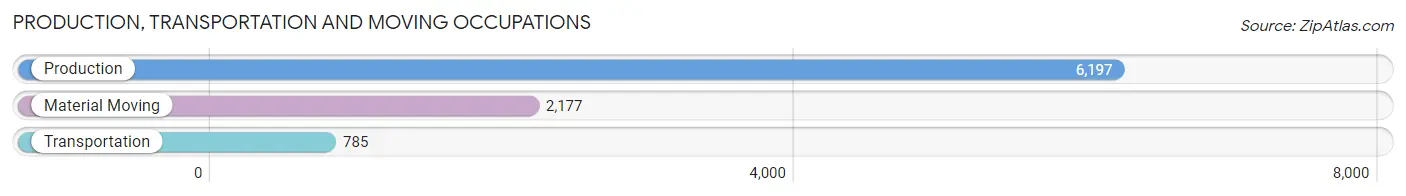
Production, Transportation and Moving Occupations
The most common Production, Transportation and Moving occupations in Elkhart are Production (6,197 | 24.9%), Material Moving (2,177 | 8.7%), and Transportation (785 | 3.2%).
Production, Transportation and Moving Occupations by Sex
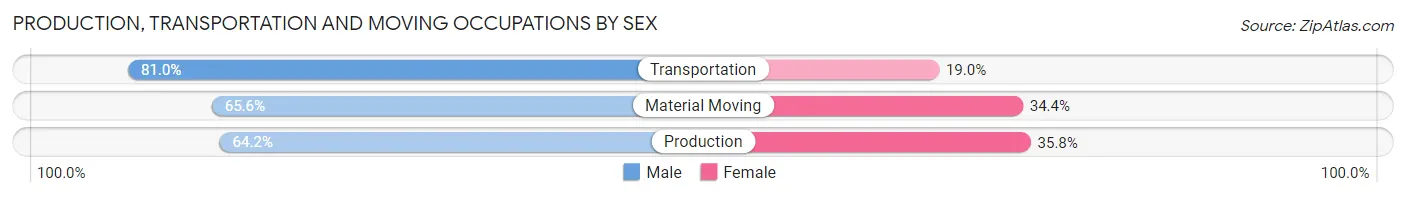
| Occupation | Male | Female |
| Production | 3,979 (64.2%) | 2,218 (35.8%) |
| Transportation | 636 (81.0%) | 149 (19.0%) |
| Material Moving | 1,429 (65.6%) | 748 (34.4%) |
| Total (Category) | 6,044 (66.0%) | 3,115 (34.0%) |
| Total (Overall) | 13,441 (53.9%) | 11,471 (46.1%) |
Employment Industries by Sex in Elkhart
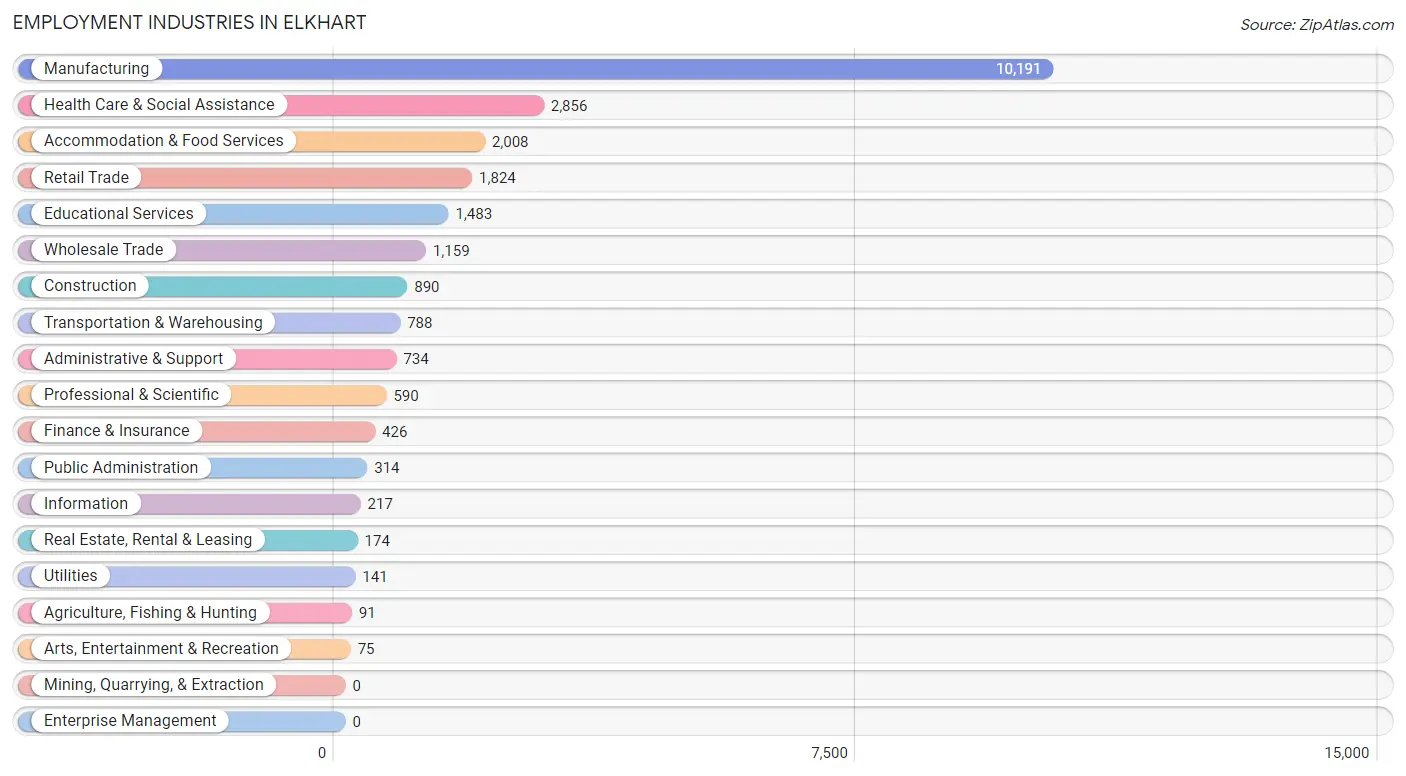
Employment Industries in Elkhart
The major employment industries in Elkhart include Manufacturing (10,191 | 40.9%), Health Care & Social Assistance (2,856 | 11.5%), Accommodation & Food Services (2,008 | 8.1%), Retail Trade (1,824 | 7.3%), and Educational Services (1,483 | 5.9%).
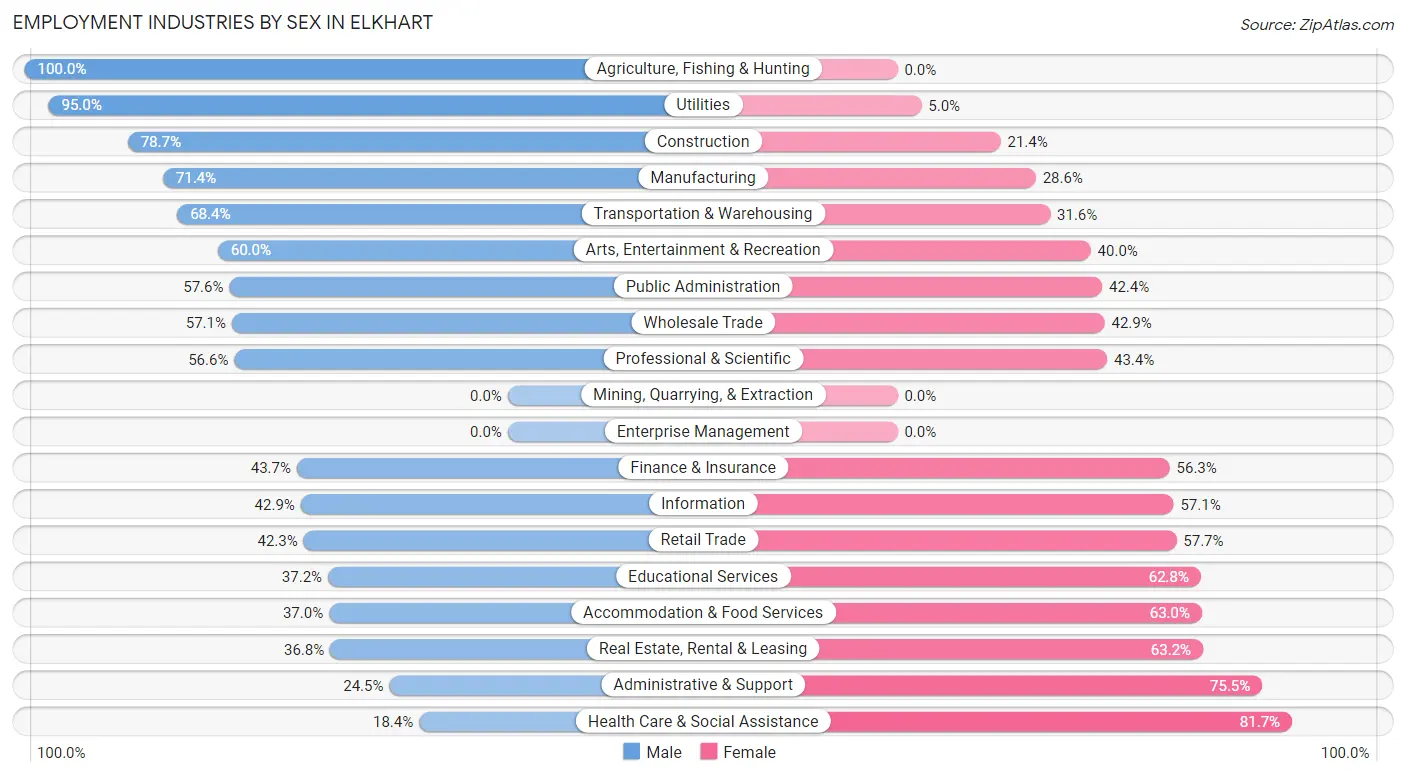
Employment Industries by Sex in Elkhart
The Elkhart industries that see more men than women are Agriculture, Fishing & Hunting (100.0%), Utilities (95.0%), and Construction (78.6%), whereas the industries that tend to have a higher number of women are Health Care & Social Assistance (81.7%), Administrative & Support (75.5%), and Real Estate, Rental & Leasing (63.2%).
| Industry | Male | Female |
| Agriculture, Fishing & Hunting | 91 (100.0%) | 0 (0.0%) |
| Mining, Quarrying, & Extraction | 0 (0.0%) | 0 (0.0%) |
| Construction | 700 (78.6%) | 190 (21.3%) |
| Manufacturing | 7,274 (71.4%) | 2,917 (28.6%) |
| Wholesale Trade | 662 (57.1%) | 497 (42.9%) |
| Retail Trade | 771 (42.3%) | 1,053 (57.7%) |
| Transportation & Warehousing | 539 (68.4%) | 249 (31.6%) |
| Utilities | 134 (95.0%) | 7 (5.0%) |
| Information | 93 (42.9%) | 124 (57.1%) |
| Finance & Insurance | 186 (43.7%) | 240 (56.3%) |
| Real Estate, Rental & Leasing | 64 (36.8%) | 110 (63.2%) |
| Professional & Scientific | 334 (56.6%) | 256 (43.4%) |
| Enterprise Management | 0 (0.0%) | 0 (0.0%) |
| Administrative & Support | 180 (24.5%) | 554 (75.5%) |
| Educational Services | 552 (37.2%) | 931 (62.8%) |
| Health Care & Social Assistance | 524 (18.3%) | 2,332 (81.7%) |
| Arts, Entertainment & Recreation | 45 (60.0%) | 30 (40.0%) |
| Accommodation & Food Services | 743 (37.0%) | 1,265 (63.0%) |
| Public Administration | 181 (57.6%) | 133 (42.4%) |
| Total | 13,441 (53.9%) | 11,471 (46.1%) |
Education in Elkhart
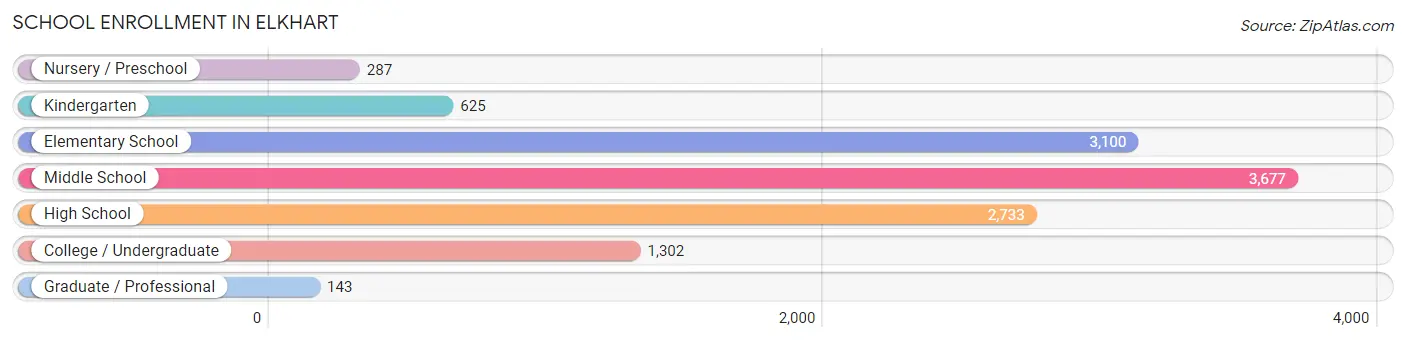
School Enrollment in Elkhart
The most common levels of schooling among the 11,867 students in Elkhart are middle school (3,677 | 31.0%), elementary school (3,100 | 26.1%), and high school (2,733 | 23.0%).
| School Level | # Students | % Students |
| Nursery / Preschool | 287 | 2.4% |
| Kindergarten | 625 | 5.3% |
| Elementary School | 3,100 | 26.1% |
| Middle School | 3,677 | 31.0% |
| High School | 2,733 | 23.0% |
| College / Undergraduate | 1,302 | 11.0% |
| Graduate / Professional | 143 | 1.2% |
| Total | 11,867 | 100.0% |
School Enrollment by Age by Funding Source in Elkhart
Out of a total of 11,867 students who are enrolled in schools in Elkhart, 1,222 (10.3%) attend a private institution, while the remaining 10,645 (89.7%) are enrolled in public schools. The age group of 35 years and over has the highest likelihood of being enrolled in private schools, with 123 (39.2% in the age bracket) enrolled. Conversely, the age group of 10 to 14 year olds has the lowest likelihood of being enrolled in a private school, with 4,098 (94.8% in the age bracket) attending a public institution.
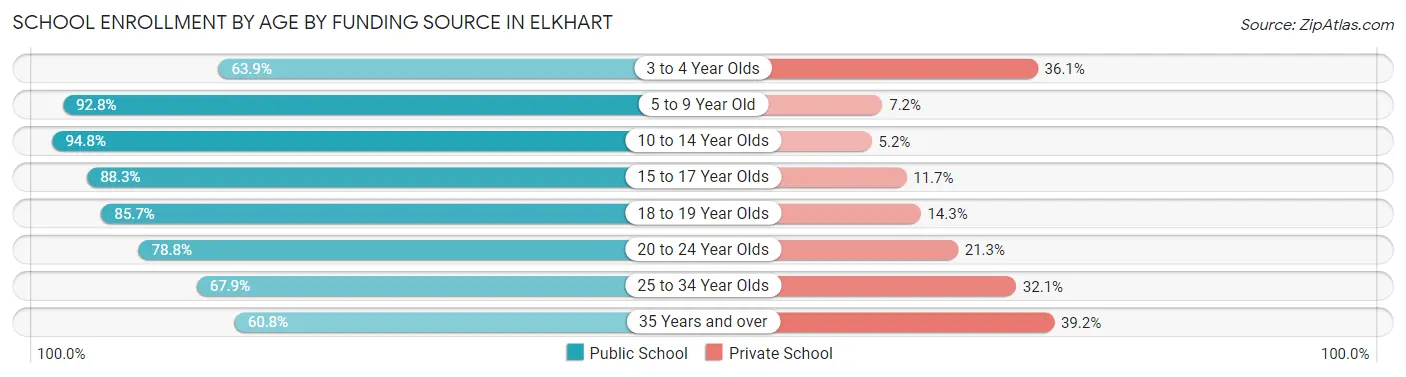
| Age Bracket | Public School | Private School |
| 3 to 4 Year Olds | 145 (63.9%) | 82 (36.1%) |
| 5 to 9 Year Old | 3,304 (92.8%) | 256 (7.2%) |
| 10 to 14 Year Olds | 4,098 (94.8%) | 225 (5.2%) |
| 15 to 17 Year Olds | 1,748 (88.3%) | 231 (11.7%) |
| 18 to 19 Year Olds | 467 (85.7%) | 78 (14.3%) |
| 20 to 24 Year Olds | 515 (78.7%) | 139 (21.2%) |
| 25 to 34 Year Olds | 180 (67.9%) | 85 (32.1%) |
| 35 Years and over | 191 (60.8%) | 123 (39.2%) |
| Total | 10,645 (89.7%) | 1,222 (10.3%) |
Educational Attainment by Field of Study in Elkhart
Education (1,456 | 23.7%), business (1,068 | 17.4%), science & technology (671 | 10.9%), liberal arts & history (520 | 8.5%), and psychology (416 | 6.8%) are the most common fields of study among 6,138 individuals in Elkhart who have obtained a bachelor's degree or higher.
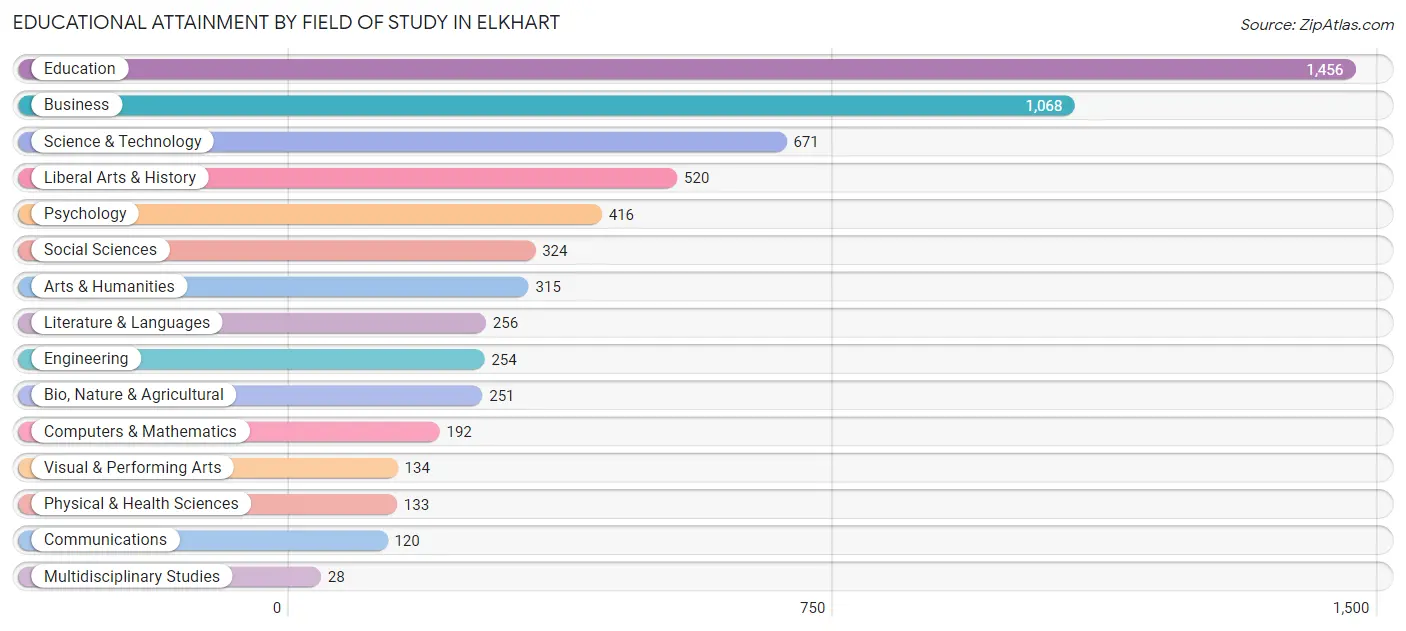
| Field of Study | # Graduates | % Graduates |
| Computers & Mathematics | 192 | 3.1% |
| Bio, Nature & Agricultural | 251 | 4.1% |
| Physical & Health Sciences | 133 | 2.2% |
| Psychology | 416 | 6.8% |
| Social Sciences | 324 | 5.3% |
| Engineering | 254 | 4.1% |
| Multidisciplinary Studies | 28 | 0.5% |
| Science & Technology | 671 | 10.9% |
| Business | 1,068 | 17.4% |
| Education | 1,456 | 23.7% |
| Literature & Languages | 256 | 4.2% |
| Liberal Arts & History | 520 | 8.5% |
| Visual & Performing Arts | 134 | 2.2% |
| Communications | 120 | 2.0% |
| Arts & Humanities | 315 | 5.1% |
| Total | 6,138 | 100.0% |
Transportation & Commute in Elkhart
Vehicle Availability by Sex in Elkhart
The most prevalent vehicle ownership categories in Elkhart are males with 2 vehicles (5,440, accounting for 41.0%) and females with 2 vehicles (4,633, making up 49.2%).
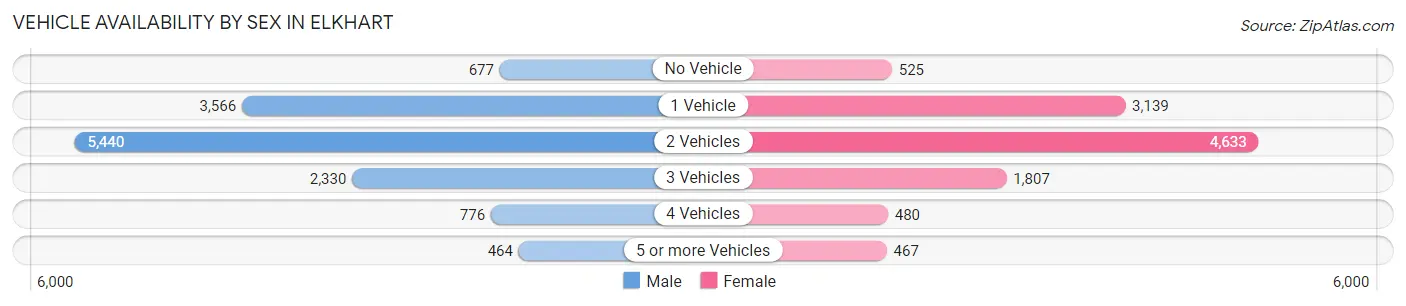
| Vehicles Available | Male | Female |
| No Vehicle | 677 (5.1%) | 525 (4.8%) |
| 1 Vehicle | 3,566 (26.9%) | 3,139 (28.4%) |
| 2 Vehicles | 5,440 (41.0%) | 4,633 (41.9%) |
| 3 Vehicles | 2,330 (17.6%) | 1,807 (16.4%) |
| 4 Vehicles | 776 (5.9%) | 480 (4.3%) |
| 5 or more Vehicles | 464 (3.5%) | 467 (4.2%) |
| Total | 13,253 (100.0%) | 11,051 (100.0%) |
Commute Time in Elkhart
The most frequently occuring commute durations in Elkhart are 10 to 14 minutes (5,452 commuters, 23.0%), 15 to 19 minutes (4,316 commuters, 18.2%), and 20 to 24 minutes (3,658 commuters, 15.4%).
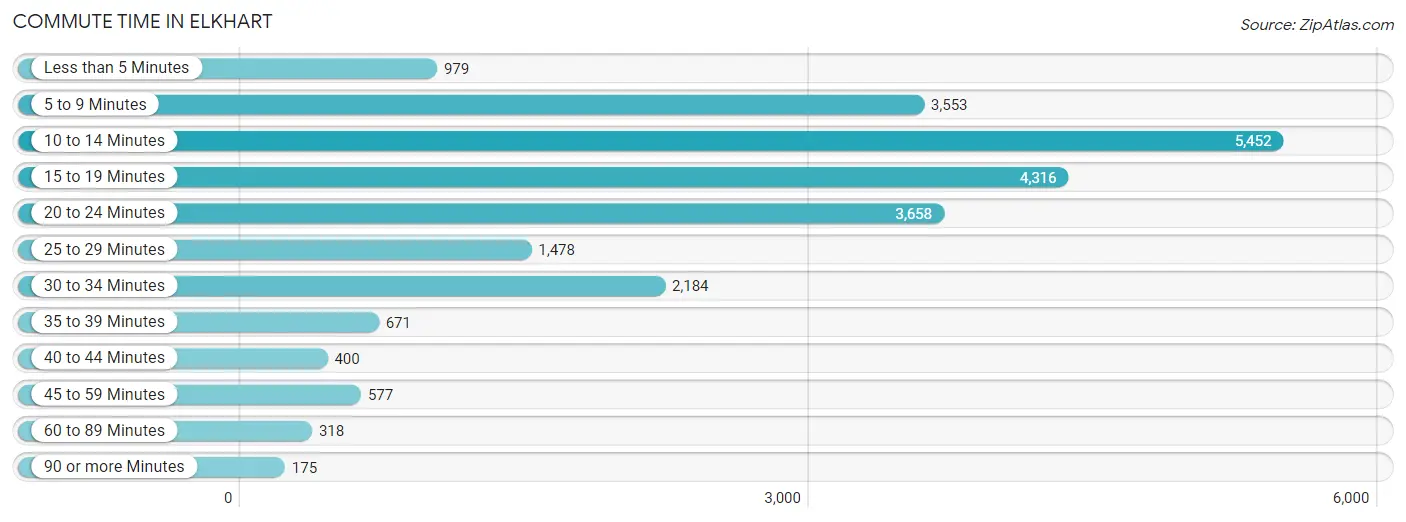
| Commute Time | # Commuters | % Commuters |
| Less than 5 Minutes | 979 | 4.1% |
| 5 to 9 Minutes | 3,553 | 14.9% |
| 10 to 14 Minutes | 5,452 | 23.0% |
| 15 to 19 Minutes | 4,316 | 18.2% |
| 20 to 24 Minutes | 3,658 | 15.4% |
| 25 to 29 Minutes | 1,478 | 6.2% |
| 30 to 34 Minutes | 2,184 | 9.2% |
| 35 to 39 Minutes | 671 | 2.8% |
| 40 to 44 Minutes | 400 | 1.7% |
| 45 to 59 Minutes | 577 | 2.4% |
| 60 to 89 Minutes | 318 | 1.3% |
| 90 or more Minutes | 175 | 0.7% |
Commute Time by Sex in Elkhart
The most common commute times in Elkhart are 10 to 14 minutes (3,057 commuters, 23.6%) for males and 10 to 14 minutes (2,395 commuters, 22.2%) for females.
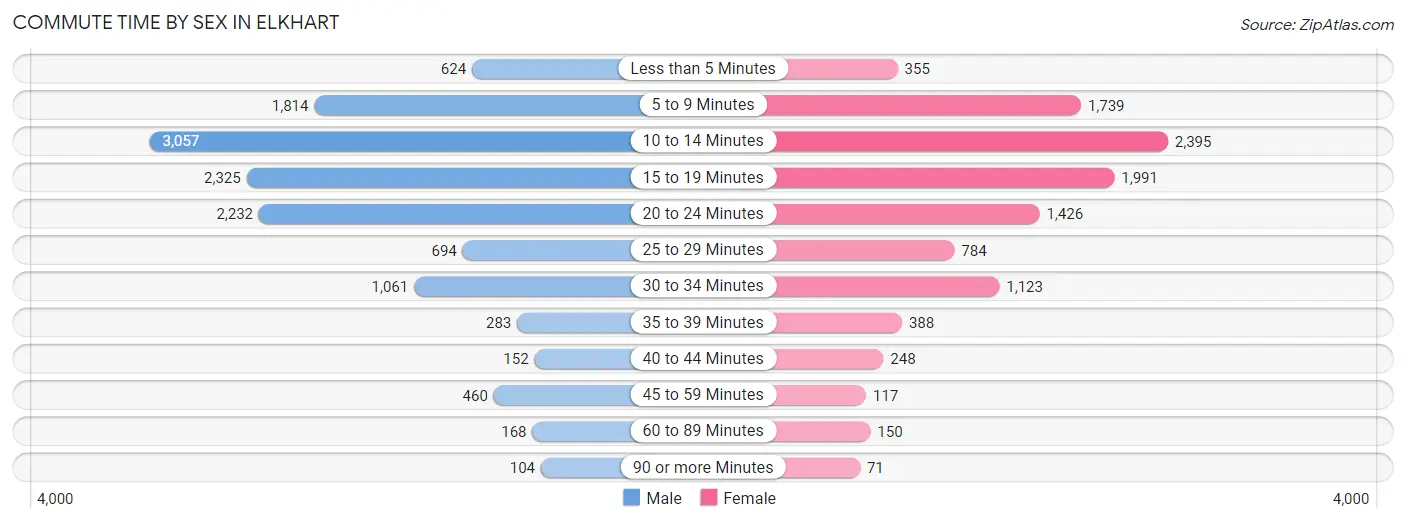
| Commute Time | Male | Female |
| Less than 5 Minutes | 624 (4.8%) | 355 (3.3%) |
| 5 to 9 Minutes | 1,814 (14.0%) | 1,739 (16.1%) |
| 10 to 14 Minutes | 3,057 (23.6%) | 2,395 (22.2%) |
| 15 to 19 Minutes | 2,325 (17.9%) | 1,991 (18.5%) |
| 20 to 24 Minutes | 2,232 (17.2%) | 1,426 (13.2%) |
| 25 to 29 Minutes | 694 (5.3%) | 784 (7.3%) |
| 30 to 34 Minutes | 1,061 (8.2%) | 1,123 (10.4%) |
| 35 to 39 Minutes | 283 (2.2%) | 388 (3.6%) |
| 40 to 44 Minutes | 152 (1.2%) | 248 (2.3%) |
| 45 to 59 Minutes | 460 (3.5%) | 117 (1.1%) |
| 60 to 89 Minutes | 168 (1.3%) | 150 (1.4%) |
| 90 or more Minutes | 104 (0.8%) | 71 (0.7%) |
Time of Departure to Work by Sex in Elkhart
The most frequent times of departure to work in Elkhart are 12:00 AM to 4:59 AM (3,174, 24.5%) for males and 7:00 AM to 7:29 AM (1,454, 13.5%) for females.
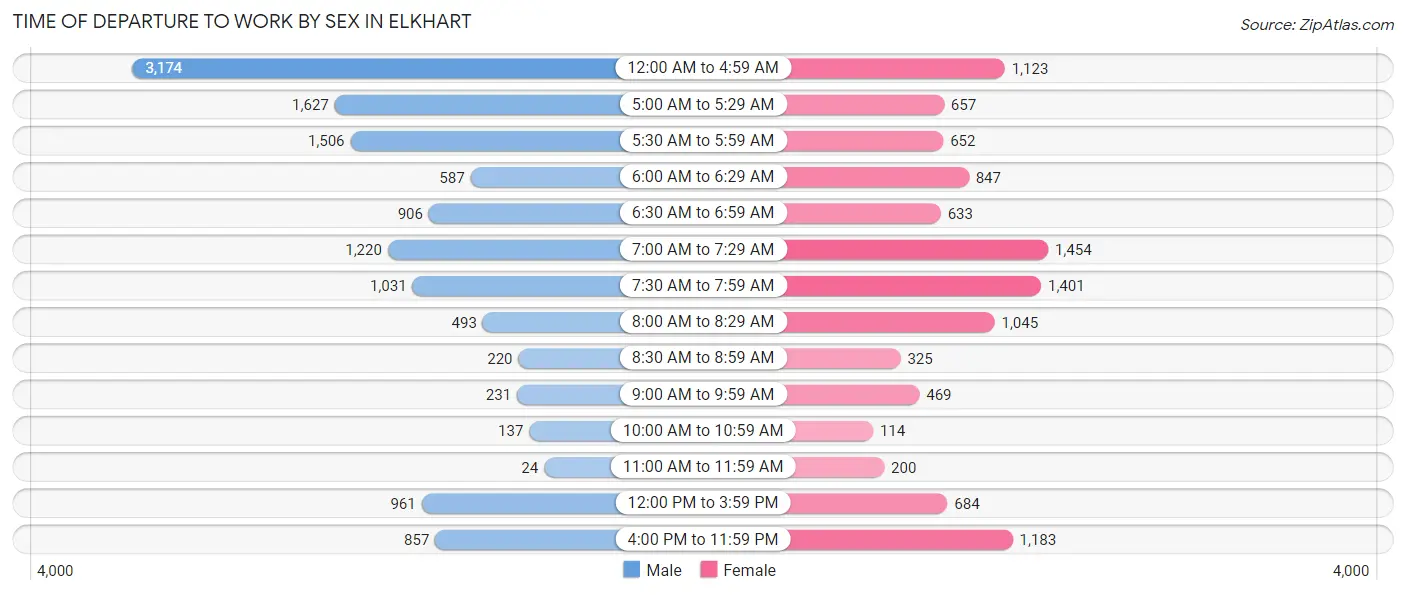
| Time of Departure | Male | Female |
| 12:00 AM to 4:59 AM | 3,174 (24.5%) | 1,123 (10.4%) |
| 5:00 AM to 5:29 AM | 1,627 (12.5%) | 657 (6.1%) |
| 5:30 AM to 5:59 AM | 1,506 (11.6%) | 652 (6.0%) |
| 6:00 AM to 6:29 AM | 587 (4.5%) | 847 (7.9%) |
| 6:30 AM to 6:59 AM | 906 (7.0%) | 633 (5.9%) |
| 7:00 AM to 7:29 AM | 1,220 (9.4%) | 1,454 (13.5%) |
| 7:30 AM to 7:59 AM | 1,031 (8.0%) | 1,401 (13.0%) |
| 8:00 AM to 8:29 AM | 493 (3.8%) | 1,045 (9.7%) |
| 8:30 AM to 8:59 AM | 220 (1.7%) | 325 (3.0%) |
| 9:00 AM to 9:59 AM | 231 (1.8%) | 469 (4.3%) |
| 10:00 AM to 10:59 AM | 137 (1.1%) | 114 (1.1%) |
| 11:00 AM to 11:59 AM | 24 (0.2%) | 200 (1.8%) |
| 12:00 PM to 3:59 PM | 961 (7.4%) | 684 (6.3%) |
| 4:00 PM to 11:59 PM | 857 (6.6%) | 1,183 (11.0%) |
| Total | 12,974 (100.0%) | 10,787 (100.0%) |
Housing Occupancy in Elkhart
Occupancy by Ownership in Elkhart
Of the total 21,375 dwellings in Elkhart, owner-occupied units account for 11,232 (52.5%), while renter-occupied units make up 10,143 (47.4%).
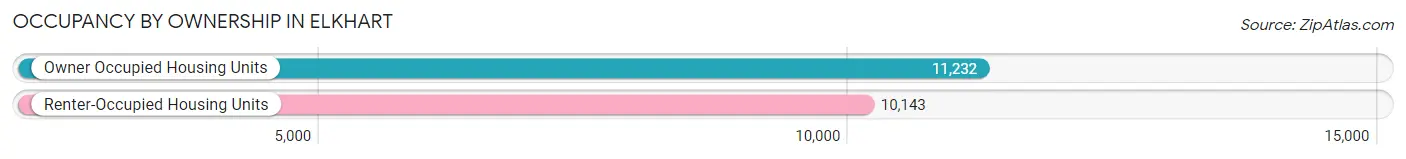
| Occupancy | # Housing Units | % Housing Units |
| Owner Occupied Housing Units | 11,232 | 52.5% |
| Renter-Occupied Housing Units | 10,143 | 47.4% |
| Total Occupied Housing Units | 21,375 | 100.0% |
Occupancy by Household Size in Elkhart
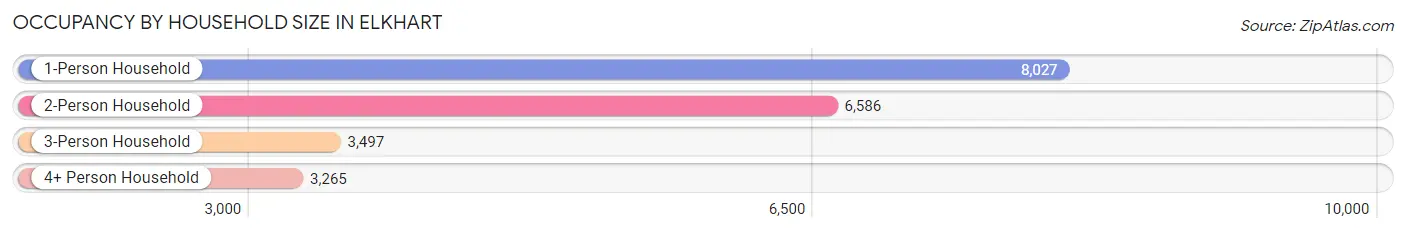
| Household Size | # Housing Units | % Housing Units |
| 1-Person Household | 8,027 | 37.6% |
| 2-Person Household | 6,586 | 30.8% |
| 3-Person Household | 3,497 | 16.4% |
| 4+ Person Household | 3,265 | 15.3% |
| Total Housing Units | 21,375 | 100.0% |
Occupancy by Ownership by Household Size in Elkhart
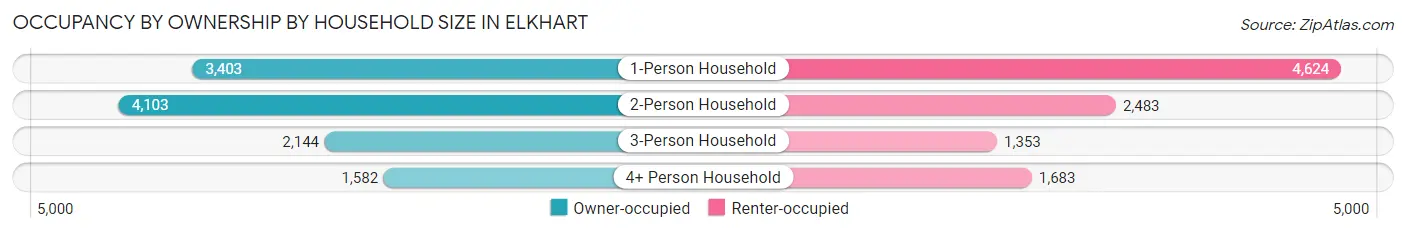
| Household Size | Owner-occupied | Renter-occupied |
| 1-Person Household | 3,403 (42.4%) | 4,624 (57.6%) |
| 2-Person Household | 4,103 (62.3%) | 2,483 (37.7%) |
| 3-Person Household | 2,144 (61.3%) | 1,353 (38.7%) |
| 4+ Person Household | 1,582 (48.4%) | 1,683 (51.5%) |
| Total Housing Units | 11,232 (52.5%) | 10,143 (47.4%) |
Occupancy by Educational Attainment in Elkhart
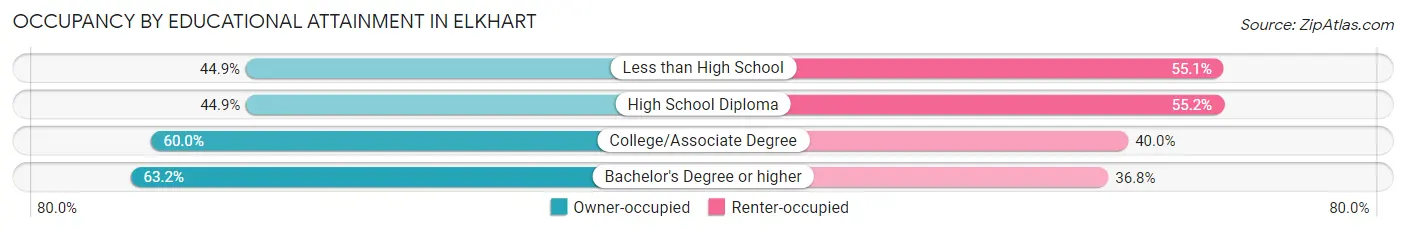
| Household Size | Owner-occupied | Renter-occupied |
| Less than High School | 1,496 (44.9%) | 1,836 (55.1%) |
| High School Diploma | 3,568 (44.9%) | 4,388 (55.1%) |
| College/Associate Degree | 3,885 (60.0%) | 2,588 (40.0%) |
| Bachelor's Degree or higher | 2,283 (63.2%) | 1,331 (36.8%) |
Occupancy by Age of Householder in Elkhart
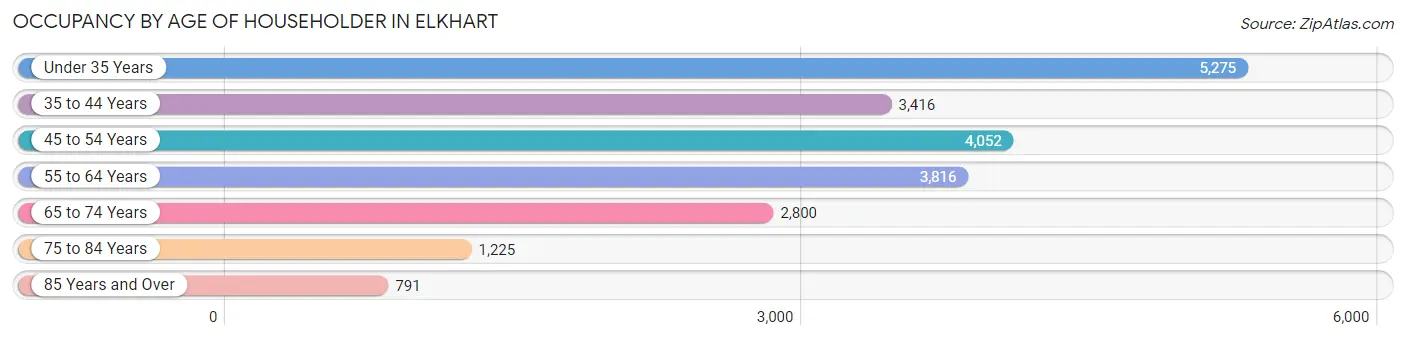
| Age Bracket | # Households | % Households |
| Under 35 Years | 5,275 | 24.7% |
| 35 to 44 Years | 3,416 | 16.0% |
| 45 to 54 Years | 4,052 | 19.0% |
| 55 to 64 Years | 3,816 | 17.8% |
| 65 to 74 Years | 2,800 | 13.1% |
| 75 to 84 Years | 1,225 | 5.7% |
| 85 Years and Over | 791 | 3.7% |
| Total | 21,375 | 100.0% |
Housing Finances in Elkhart
Median Income by Occupancy in Elkhart
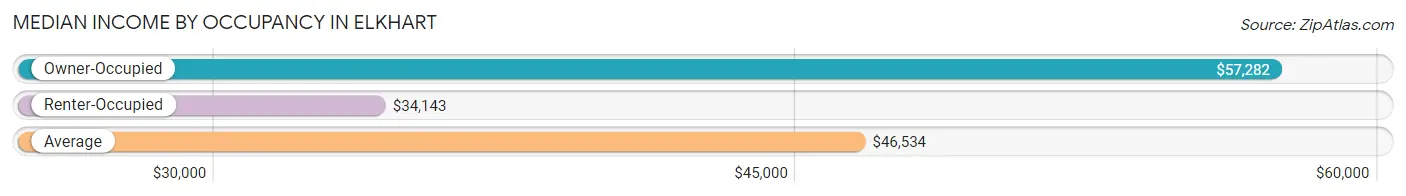
| Occupancy Type | # Households | Median Income |
| Owner-Occupied | 11,232 (52.5%) | $57,282 |
| Renter-Occupied | 10,143 (47.4%) | $34,143 |
| Average | 21,375 (100.0%) | $46,534 |
Occupancy by Householder Income Bracket in Elkhart
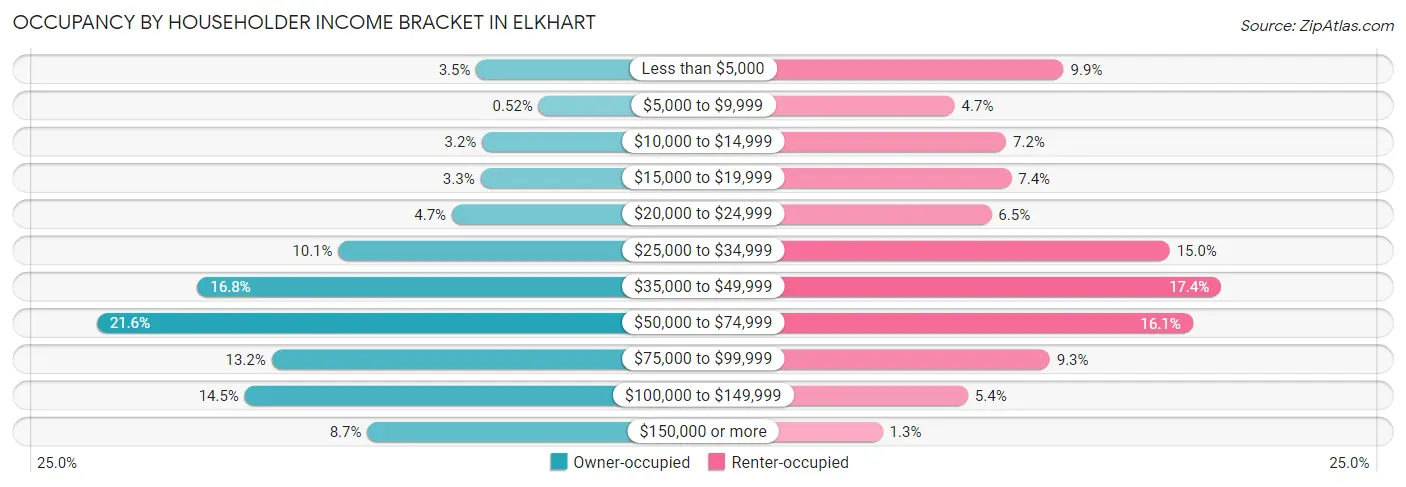
| Income Bracket | Owner-occupied | Renter-occupied |
| Less than $5,000 | 392 (3.5%) | 1,005 (9.9%) |
| $5,000 to $9,999 | 58 (0.5%) | 479 (4.7%) |
| $10,000 to $14,999 | 361 (3.2%) | 727 (7.2%) |
| $15,000 to $19,999 | 370 (3.3%) | 753 (7.4%) |
| $20,000 to $24,999 | 522 (4.6%) | 656 (6.5%) |
| $25,000 to $34,999 | 1,130 (10.1%) | 1,517 (15.0%) |
| $35,000 to $49,999 | 1,884 (16.8%) | 1,766 (17.4%) |
| $50,000 to $74,999 | 2,422 (21.6%) | 1,628 (16.1%) |
| $75,000 to $99,999 | 1,487 (13.2%) | 938 (9.2%) |
| $100,000 to $149,999 | 1,631 (14.5%) | 543 (5.3%) |
| $150,000 or more | 975 (8.7%) | 131 (1.3%) |
| Total | 11,232 (100.0%) | 10,143 (100.0%) |
Monthly Housing Cost Tiers in Elkhart
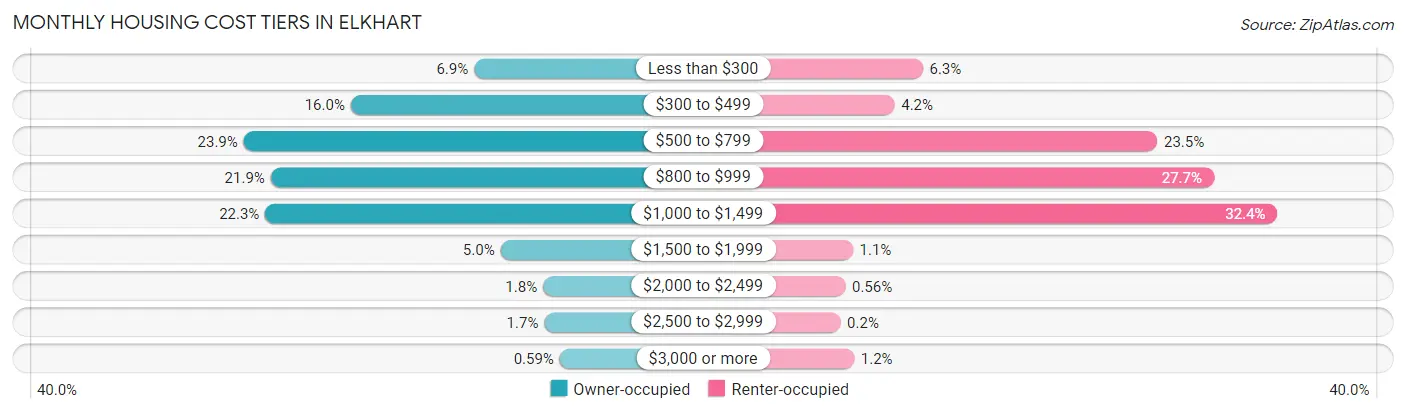
| Monthly Cost | Owner-occupied | Renter-occupied |
| Less than $300 | 775 (6.9%) | 636 (6.3%) |
| $300 to $499 | 1,795 (16.0%) | 425 (4.2%) |
| $500 to $799 | 2,681 (23.9%) | 2,388 (23.5%) |
| $800 to $999 | 2,458 (21.9%) | 2,812 (27.7%) |
| $1,000 to $1,499 | 2,503 (22.3%) | 3,286 (32.4%) |
| $1,500 to $1,999 | 556 (5.0%) | 114 (1.1%) |
| $2,000 to $2,499 | 204 (1.8%) | 57 (0.6%) |
| $2,500 to $2,999 | 194 (1.7%) | 20 (0.2%) |
| $3,000 or more | 66 (0.6%) | 123 (1.2%) |
| Total | 11,232 (100.0%) | 10,143 (100.0%) |
Physical Housing Characteristics in Elkhart
Housing Structures in Elkhart
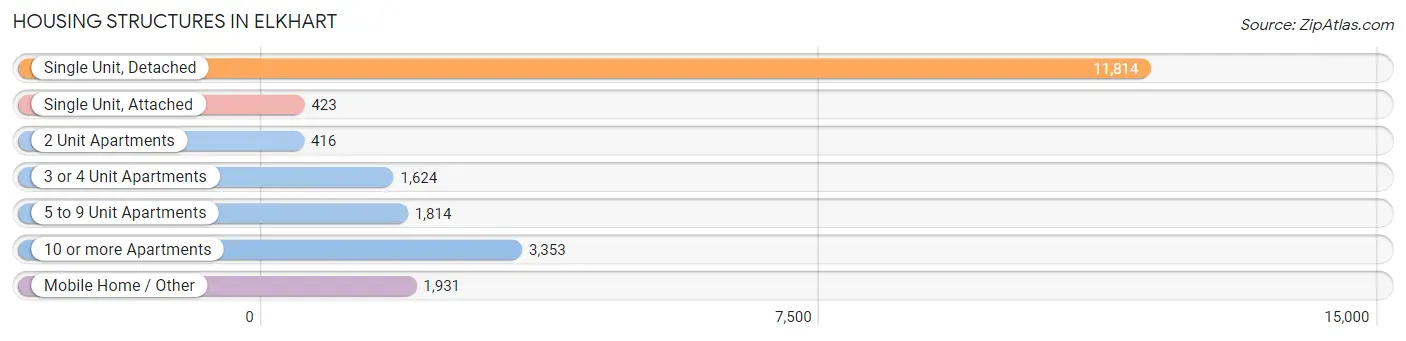
| Structure Type | # Housing Units | % Housing Units |
| Single Unit, Detached | 11,814 | 55.3% |
| Single Unit, Attached | 423 | 2.0% |
| 2 Unit Apartments | 416 | 1.9% |
| 3 or 4 Unit Apartments | 1,624 | 7.6% |
| 5 to 9 Unit Apartments | 1,814 | 8.5% |
| 10 or more Apartments | 3,353 | 15.7% |
| Mobile Home / Other | 1,931 | 9.0% |
| Total | 21,375 | 100.0% |
Housing Structures by Occupancy in Elkhart
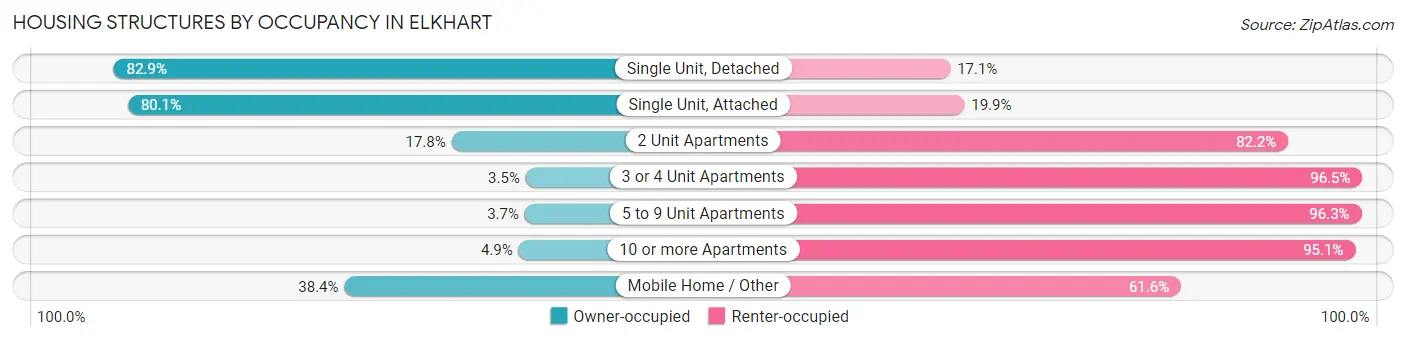
| Structure Type | Owner-occupied | Renter-occupied |
| Single Unit, Detached | 9,789 (82.9%) | 2,025 (17.1%) |
| Single Unit, Attached | 339 (80.1%) | 84 (19.9%) |
| 2 Unit Apartments | 74 (17.8%) | 342 (82.2%) |
| 3 or 4 Unit Apartments | 57 (3.5%) | 1,567 (96.5%) |
| 5 to 9 Unit Apartments | 67 (3.7%) | 1,747 (96.3%) |
| 10 or more Apartments | 164 (4.9%) | 3,189 (95.1%) |
| Mobile Home / Other | 742 (38.4%) | 1,189 (61.6%) |
| Total | 11,232 (52.5%) | 10,143 (47.4%) |
Housing Structures by Number of Rooms in Elkhart
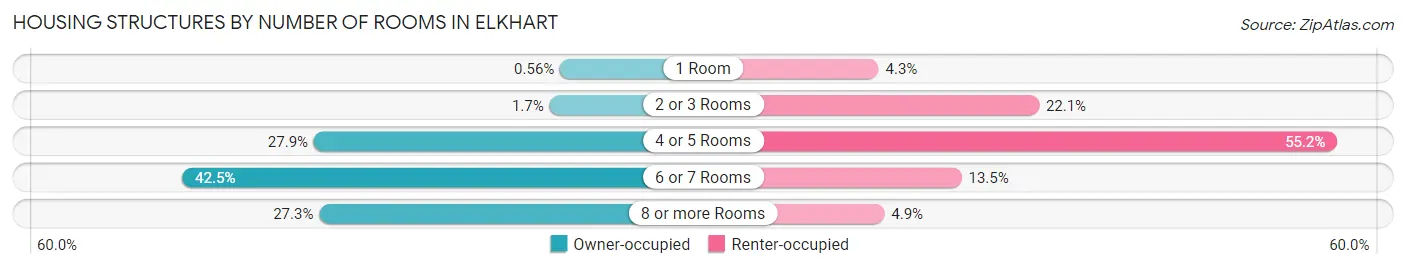
| Number of Rooms | Owner-occupied | Renter-occupied |
| 1 Room | 63 (0.6%) | 435 (4.3%) |
| 2 or 3 Rooms | 195 (1.7%) | 2,241 (22.1%) |
| 4 or 5 Rooms | 3,133 (27.9%) | 5,598 (55.2%) |
| 6 or 7 Rooms | 4,775 (42.5%) | 1,369 (13.5%) |
| 8 or more Rooms | 3,066 (27.3%) | 500 (4.9%) |
| Total | 11,232 (100.0%) | 10,143 (100.0%) |
Housing Structure by Heating Type in Elkhart
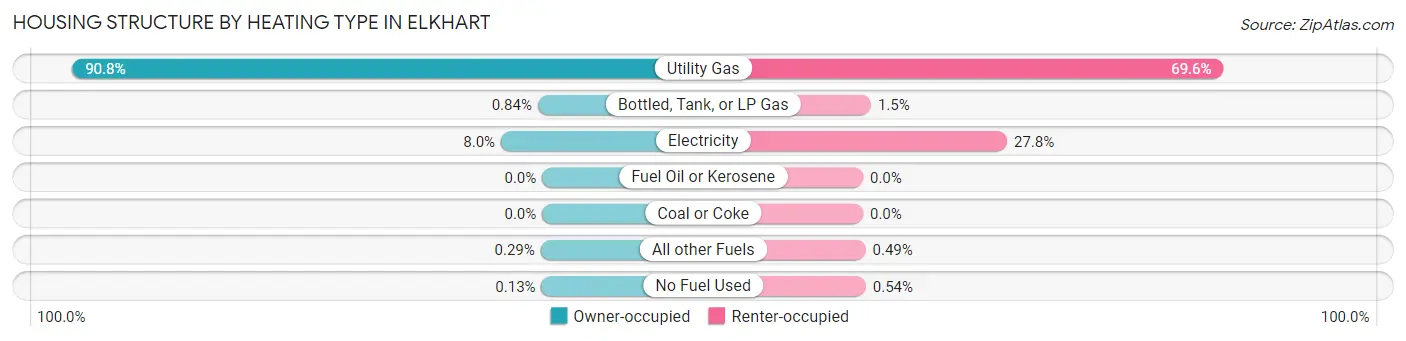
| Heating Type | Owner-occupied | Renter-occupied |
| Utility Gas | 10,197 (90.8%) | 7,061 (69.6%) |
| Bottled, Tank, or LP Gas | 94 (0.8%) | 155 (1.5%) |
| Electricity | 893 (8.0%) | 2,822 (27.8%) |
| Fuel Oil or Kerosene | 0 (0.0%) | 0 (0.0%) |
| Coal or Coke | 0 (0.0%) | 0 (0.0%) |
| All other Fuels | 33 (0.3%) | 50 (0.5%) |
| No Fuel Used | 15 (0.1%) | 55 (0.5%) |
| Total | 11,232 (100.0%) | 10,143 (100.0%) |
Household Vehicle Usage in Elkhart
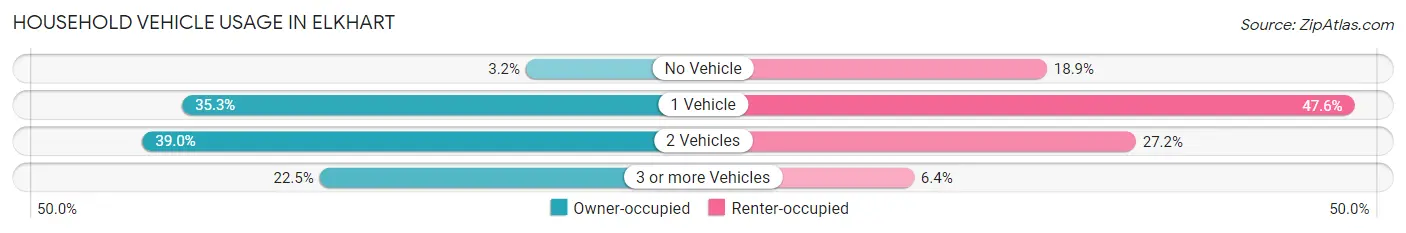
| Vehicles per Household | Owner-occupied | Renter-occupied |
| No Vehicle | 361 (3.2%) | 1,912 (18.9%) |
| 1 Vehicle | 3,966 (35.3%) | 4,824 (47.6%) |
| 2 Vehicles | 4,381 (39.0%) | 2,754 (27.2%) |
| 3 or more Vehicles | 2,524 (22.5%) | 653 (6.4%) |
| Total | 11,232 (100.0%) | 10,143 (100.0%) |
Real Estate & Mortgages in Elkhart
Real Estate and Mortgage Overview in Elkhart
| Characteristic | Without Mortgage | With Mortgage |
| Housing Units | 4,394 | 6,838 |
| Median Property Value | $104,300 | $125,600 |
| Median Household Income | $49,416 | $617 |
| Monthly Housing Costs | $465 | $66 |
| Real Estate Taxes | $947 | $182 |
Property Value by Mortgage Status in Elkhart
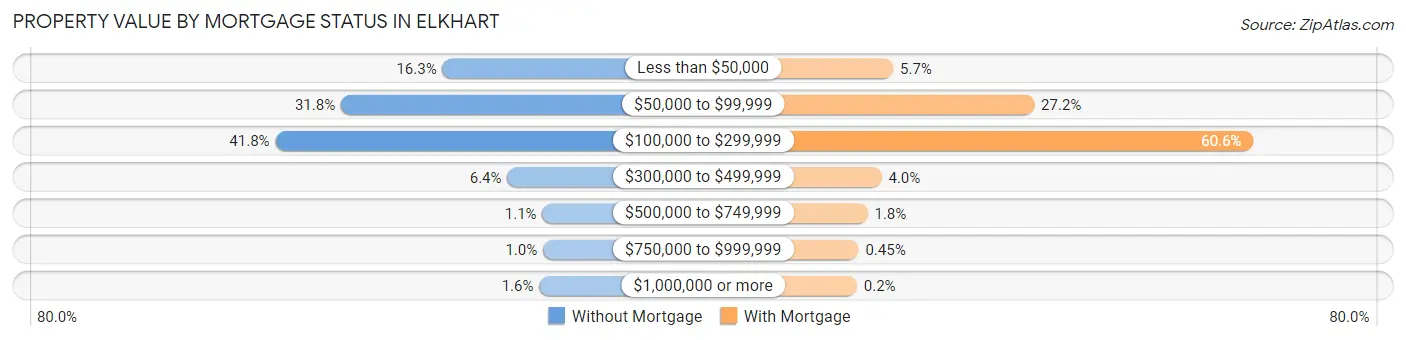
| Property Value | Without Mortgage | With Mortgage |
| Less than $50,000 | 717 (16.3%) | 391 (5.7%) |
| $50,000 to $99,999 | 1,397 (31.8%) | 1,861 (27.2%) |
| $100,000 to $299,999 | 1,836 (41.8%) | 4,145 (60.6%) |
| $300,000 to $499,999 | 283 (6.4%) | 271 (4.0%) |
| $500,000 to $749,999 | 48 (1.1%) | 125 (1.8%) |
| $750,000 to $999,999 | 44 (1.0%) | 31 (0.4%) |
| $1,000,000 or more | 69 (1.6%) | 14 (0.2%) |
| Total | 4,394 (100.0%) | 6,838 (100.0%) |
Household Income by Mortgage Status in Elkhart
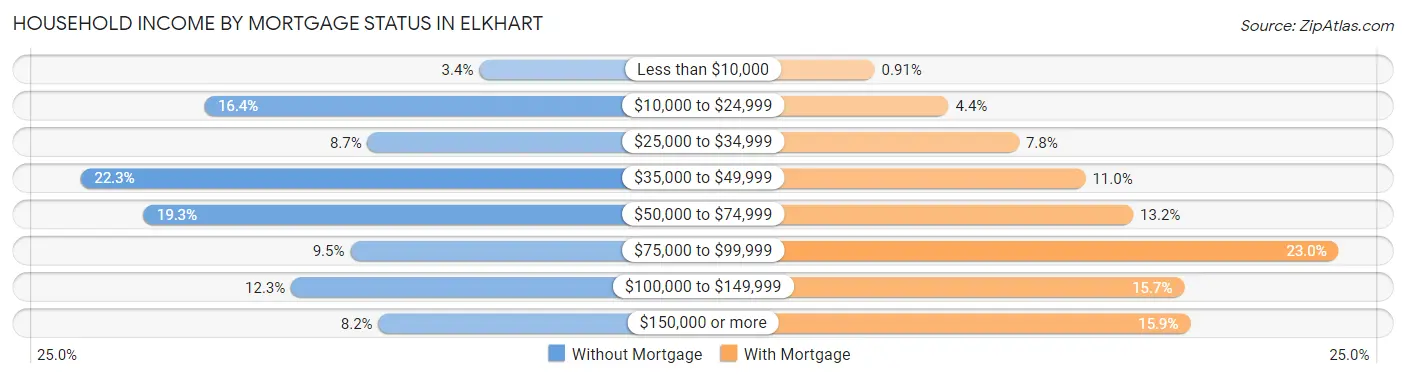
| Household Income | Without Mortgage | With Mortgage |
| Less than $10,000 | 147 (3.4%) | 62 (0.9%) |
| $10,000 to $24,999 | 721 (16.4%) | 303 (4.4%) |
| $25,000 to $34,999 | 381 (8.7%) | 532 (7.8%) |
| $35,000 to $49,999 | 980 (22.3%) | 749 (11.0%) |
| $50,000 to $74,999 | 849 (19.3%) | 904 (13.2%) |
| $75,000 to $99,999 | 417 (9.5%) | 1,573 (23.0%) |
| $100,000 to $149,999 | 541 (12.3%) | 1,070 (15.7%) |
| $150,000 or more | 358 (8.2%) | 1,090 (15.9%) |
| Total | 4,394 (100.0%) | 6,838 (100.0%) |
Property Value to Household Income Ratio in Elkhart
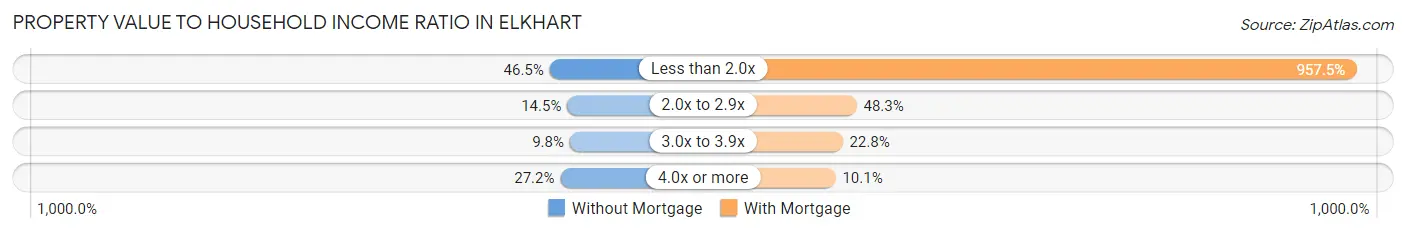
| Value-to-Income Ratio | Without Mortgage | With Mortgage |
| Less than 2.0x | 2,045 (46.5%) | 65,473 (957.5%) |
| 2.0x to 2.9x | 639 (14.5%) | 3,302 (48.3%) |
| 3.0x to 3.9x | 431 (9.8%) | 1,562 (22.8%) |
| 4.0x or more | 1,193 (27.2%) | 693 (10.1%) |
| Total | 4,394 (100.0%) | 6,838 (100.0%) |
Real Estate Taxes by Mortgage Status in Elkhart
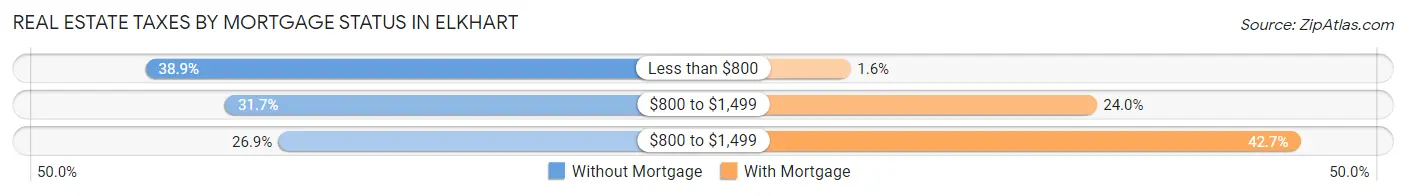
| Property Taxes | Without Mortgage | With Mortgage |
| Less than $800 | 1,711 (38.9%) | 108 (1.6%) |
| $800 to $1,499 | 1,392 (31.7%) | 1,644 (24.0%) |
| $800 to $1,499 | 1,180 (26.9%) | 2,918 (42.7%) |
| Total | 4,394 (100.0%) | 6,838 (100.0%) |
Health & Disability in Elkhart
Health Insurance Coverage by Age in Elkhart
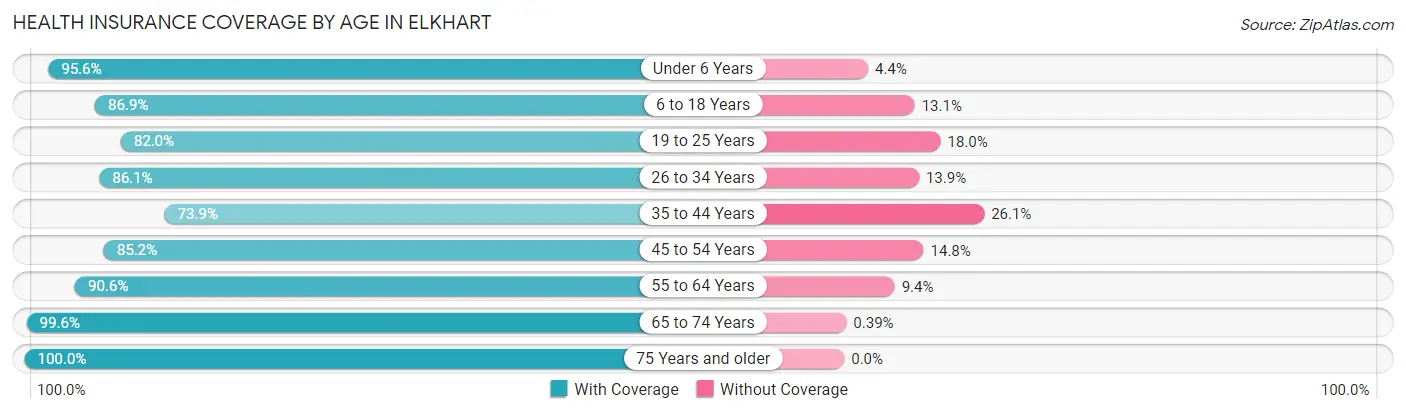
| Age Bracket | With Coverage | Without Coverage |
| Under 6 Years | 4,527 (95.6%) | 210 (4.4%) |
| 6 to 18 Years | 8,958 (86.9%) | 1,355 (13.1%) |
| 19 to 25 Years | 4,336 (82.0%) | 949 (18.0%) |
| 26 to 34 Years | 5,901 (86.1%) | 955 (13.9%) |
| 35 to 44 Years | 4,450 (73.9%) | 1,571 (26.1%) |
| 45 to 54 Years | 5,748 (85.2%) | 998 (14.8%) |
| 55 to 64 Years | 5,370 (90.6%) | 558 (9.4%) |
| 65 to 74 Years | 4,304 (99.6%) | 17 (0.4%) |
| 75 Years and older | 2,869 (100.0%) | 0 (0.0%) |
| Total | 46,463 (87.5%) | 6,613 (12.5%) |
Health Insurance Coverage by Citizenship Status in Elkhart
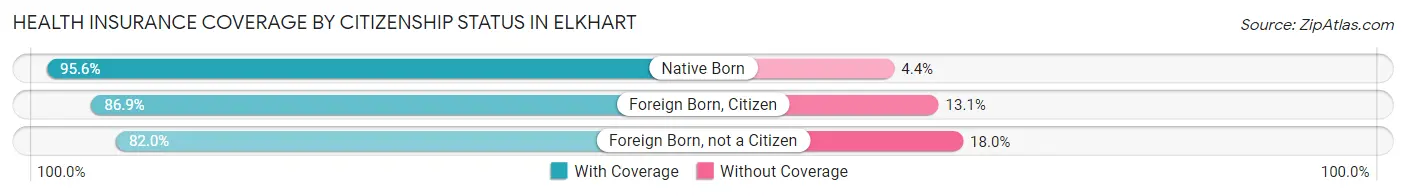
| Citizenship Status | With Coverage | Without Coverage |
| Native Born | 4,527 (95.6%) | 210 (4.4%) |
| Foreign Born, Citizen | 8,958 (86.9%) | 1,355 (13.1%) |
| Foreign Born, not a Citizen | 4,336 (82.0%) | 949 (18.0%) |
Health Insurance Coverage by Household Income in Elkhart
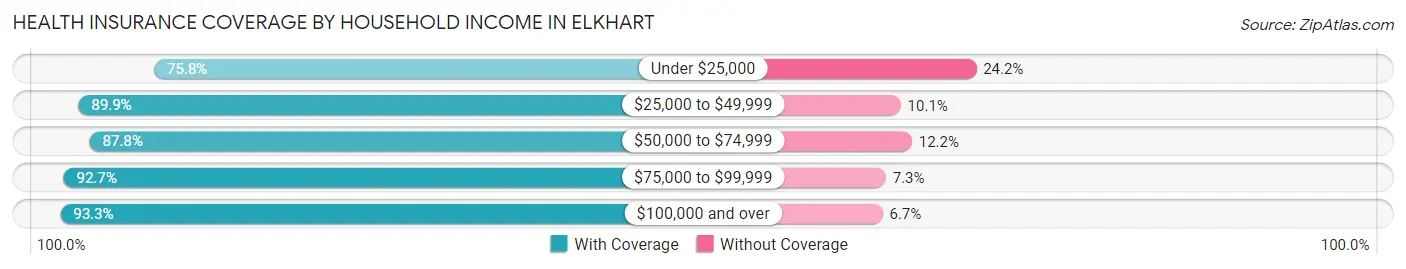
| Household Income | With Coverage | Without Coverage |
| Under $25,000 | 8,364 (75.8%) | 2,676 (24.2%) |
| $25,000 to $49,999 | 11,562 (89.9%) | 1,298 (10.1%) |
| $50,000 to $74,999 | 9,457 (87.8%) | 1,312 (12.2%) |
| $75,000 to $99,999 | 7,783 (92.7%) | 614 (7.3%) |
| $100,000 and over | 9,149 (93.3%) | 657 (6.7%) |
Public vs Private Health Insurance Coverage by Age in Elkhart
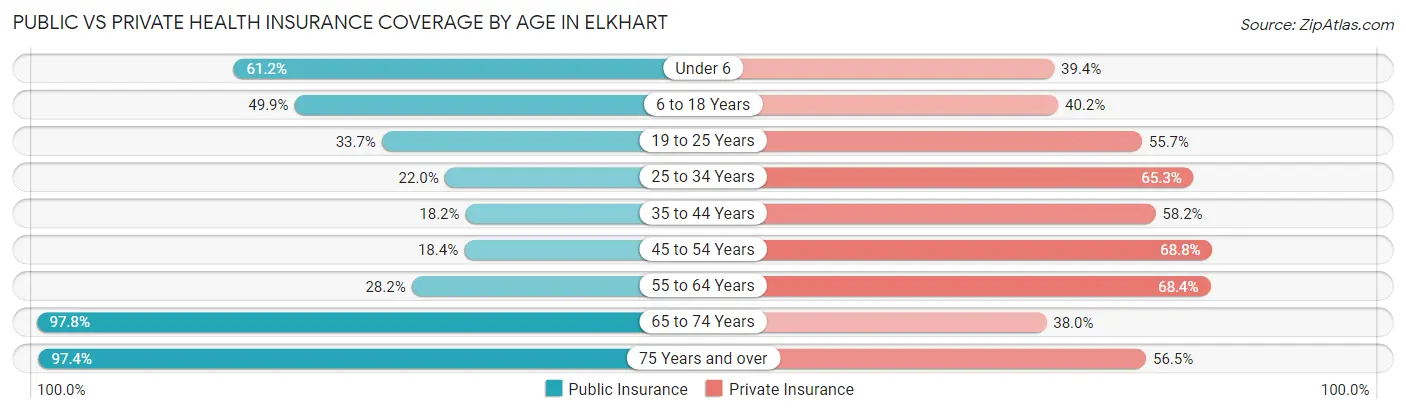
| Age Bracket | Public Insurance | Private Insurance |
| Under 6 | 2,899 (61.2%) | 1,867 (39.4%) |
| 6 to 18 Years | 5,149 (49.9%) | 4,141 (40.2%) |
| 19 to 25 Years | 1,782 (33.7%) | 2,944 (55.7%) |
| 25 to 34 Years | 1,511 (22.0%) | 4,477 (65.3%) |
| 35 to 44 Years | 1,095 (18.2%) | 3,505 (58.2%) |
| 45 to 54 Years | 1,244 (18.4%) | 4,640 (68.8%) |
| 55 to 64 Years | 1,671 (28.2%) | 4,055 (68.4%) |
| 65 to 74 Years | 4,225 (97.8%) | 1,640 (38.0%) |
| 75 Years and over | 2,794 (97.4%) | 1,620 (56.5%) |
| Total | 22,370 (42.1%) | 28,889 (54.4%) |
Disability Status by Sex by Age in Elkhart
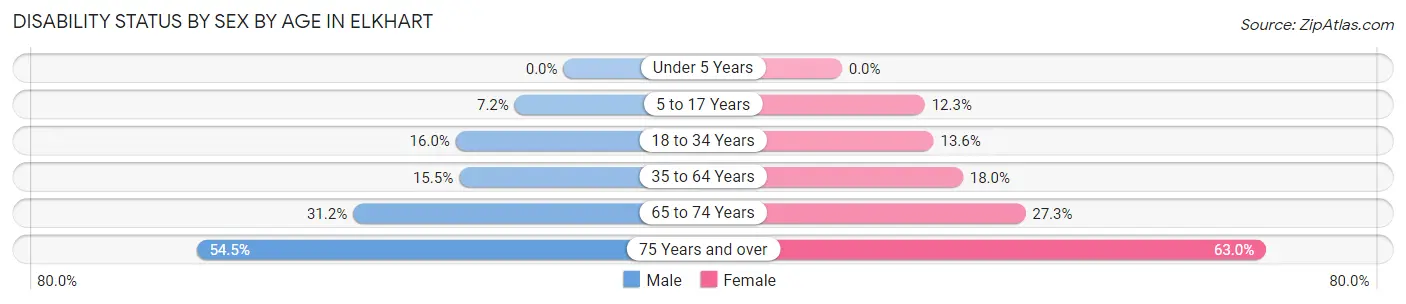
| Age Bracket | Male | Female |
| Under 5 Years | 0 (0.0%) | 0 (0.0%) |
| 5 to 17 Years | 356 (7.2%) | 650 (12.3%) |
| 18 to 34 Years | 966 (16.0%) | 922 (13.6%) |
| 35 to 64 Years | 1,472 (15.5%) | 1,653 (18.0%) |
| 65 to 74 Years | 568 (31.2%) | 682 (27.3%) |
| 75 Years and over | 481 (54.5%) | 1,251 (63.0%) |
Disability Class by Sex by Age in Elkhart
Disability Class: Hearing Difficulty
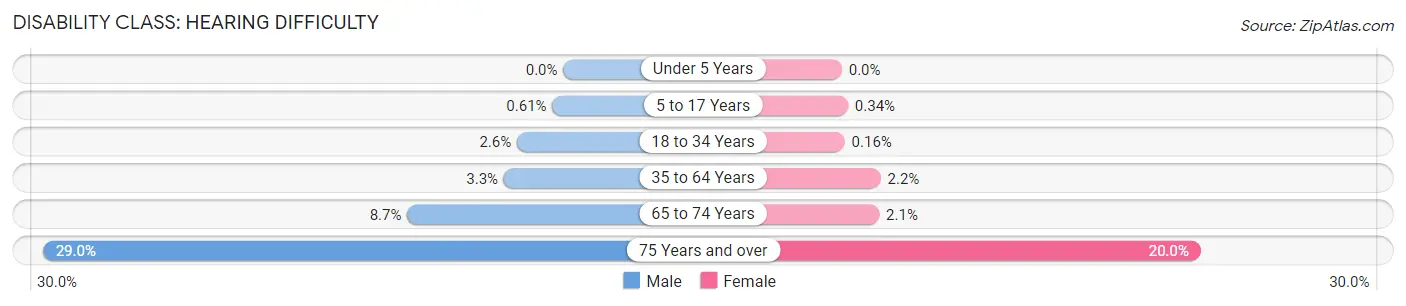
| Age Bracket | Male | Female |
| Under 5 Years | 0 (0.0%) | 0 (0.0%) |
| 5 to 17 Years | 30 (0.6%) | 18 (0.3%) |
| 18 to 34 Years | 156 (2.6%) | 11 (0.2%) |
| 35 to 64 Years | 314 (3.3%) | 199 (2.2%) |
| 65 to 74 Years | 158 (8.7%) | 52 (2.1%) |
| 75 Years and over | 256 (29.0%) | 397 (20.0%) |
Disability Class: Vision Difficulty
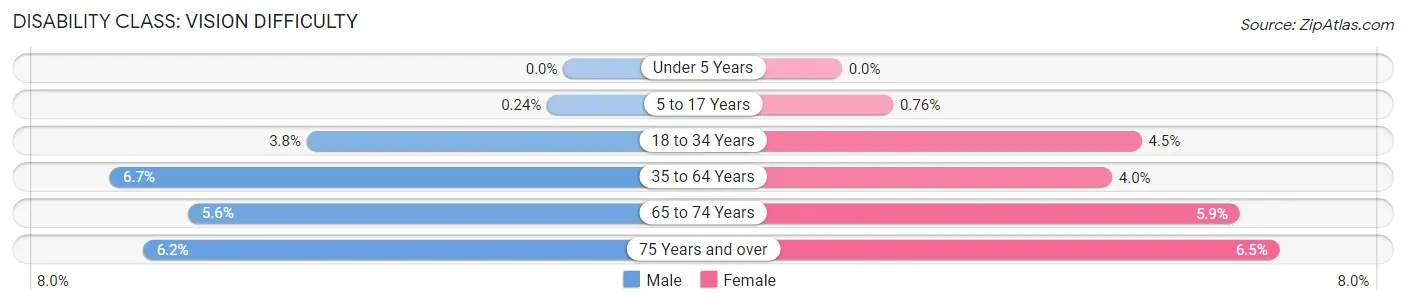
| Age Bracket | Male | Female |
| Under 5 Years | 0 (0.0%) | 0 (0.0%) |
| 5 to 17 Years | 12 (0.2%) | 40 (0.8%) |
| 18 to 34 Years | 230 (3.8%) | 301 (4.4%) |
| 35 to 64 Years | 639 (6.7%) | 369 (4.0%) |
| 65 to 74 Years | 101 (5.6%) | 148 (5.9%) |
| 75 Years and over | 55 (6.2%) | 129 (6.5%) |
Disability Class: Cognitive Difficulty
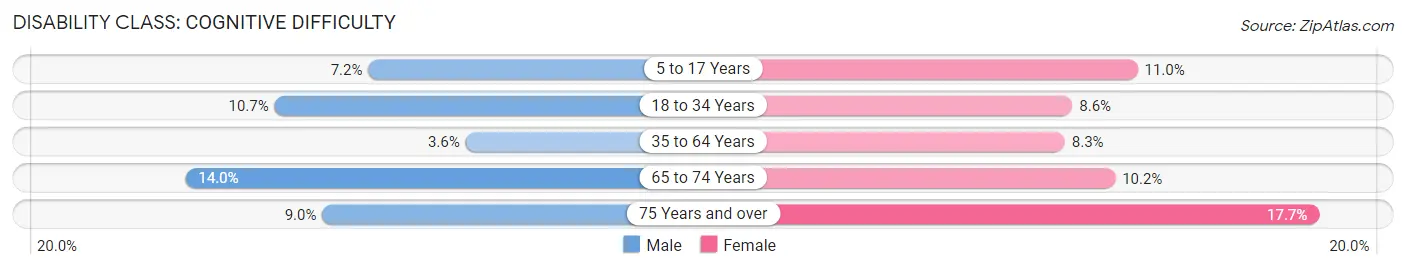
| Age Bracket | Male | Female |
| 5 to 17 Years | 356 (7.2%) | 579 (11.0%) |
| 18 to 34 Years | 648 (10.7%) | 579 (8.6%) |
| 35 to 64 Years | 345 (3.6%) | 762 (8.3%) |
| 65 to 74 Years | 255 (14.0%) | 254 (10.2%) |
| 75 Years and over | 79 (8.9%) | 352 (17.7%) |
Disability Class: Ambulatory Difficulty
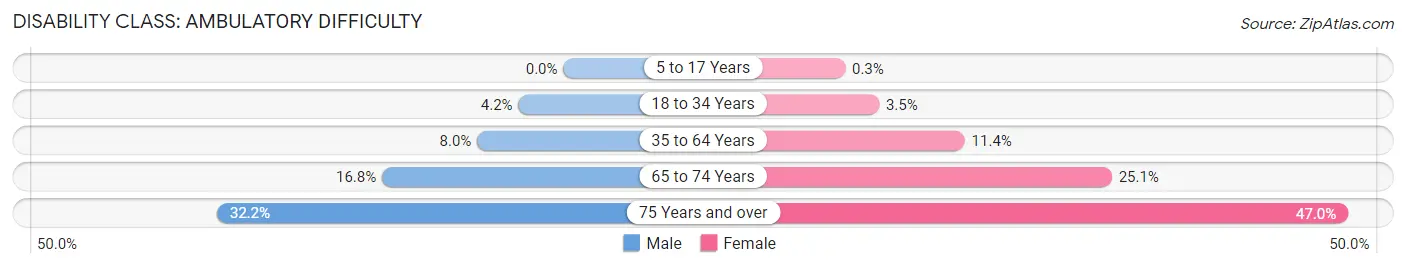
| Age Bracket | Male | Female |
| 5 to 17 Years | 0 (0.0%) | 16 (0.3%) |
| 18 to 34 Years | 252 (4.2%) | 233 (3.5%) |
| 35 to 64 Years | 760 (8.0%) | 1,049 (11.4%) |
| 65 to 74 Years | 306 (16.8%) | 627 (25.1%) |
| 75 Years and over | 284 (32.2%) | 933 (47.0%) |
Disability Class: Self-Care Difficulty
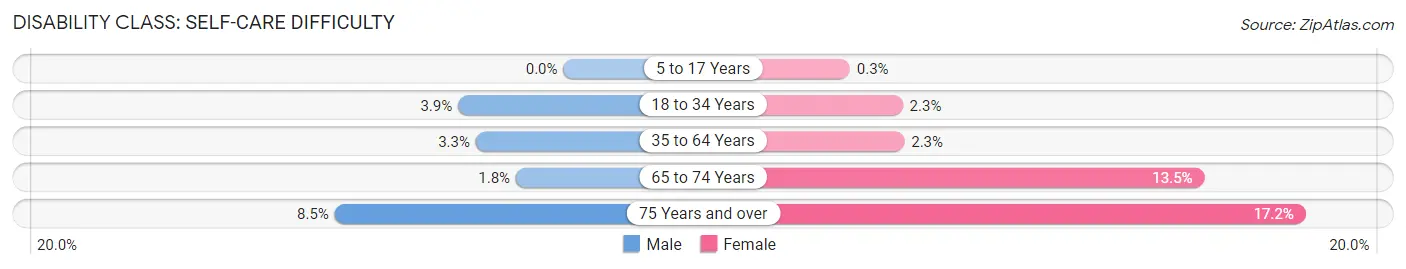
| Age Bracket | Male | Female |
| 5 to 17 Years | 0 (0.0%) | 16 (0.3%) |
| 18 to 34 Years | 236 (3.9%) | 153 (2.3%) |
| 35 to 64 Years | 309 (3.3%) | 213 (2.3%) |
| 65 to 74 Years | 32 (1.8%) | 337 (13.5%) |
| 75 Years and over | 75 (8.5%) | 342 (17.2%) |
Technology Access in Elkhart
Computing Device Access in Elkhart
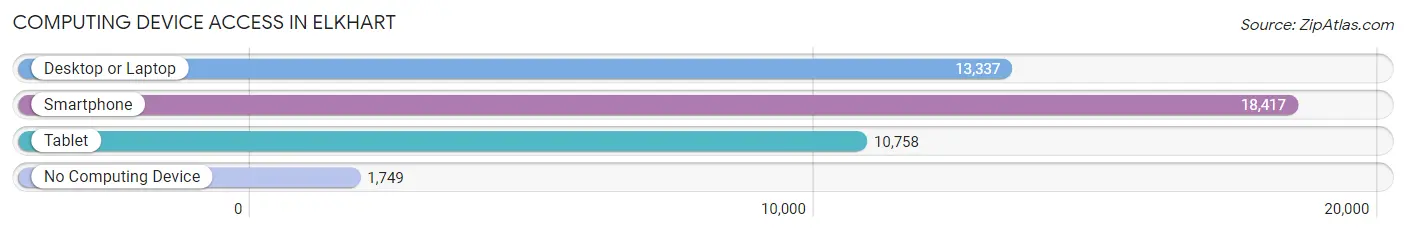
| Device Type | # Households | % Households |
| Desktop or Laptop | 13,337 | 62.4% |
| Smartphone | 18,417 | 86.2% |
| Tablet | 10,758 | 50.3% |
| No Computing Device | 1,749 | 8.2% |
| Total | 21,375 | 100.0% |
Internet Access in Elkhart
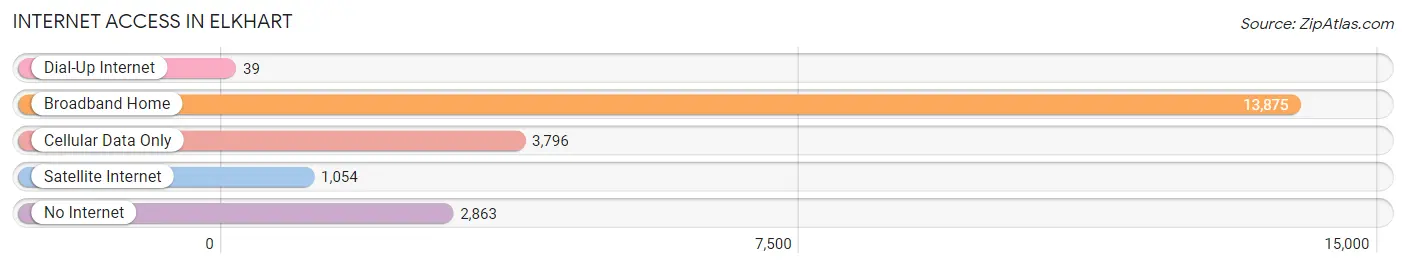
| Internet Type | # Households | % Households |
| Dial-Up Internet | 39 | 0.2% |
| Broadband Home | 13,875 | 64.9% |
| Cellular Data Only | 3,796 | 17.8% |
| Satellite Internet | 1,054 | 4.9% |
| No Internet | 2,863 | 13.4% |
| Total | 21,375 | 100.0% |
Elkhart Summary
Elkhart, Indiana is a city located in Elkhart County, Indiana, United States. It is the county seat of Elkhart County and is located in the northern part of the state, about 15 miles east of South Bend. The city is situated on the St. Joseph River and is part of the South Bend-Elkhart metropolitan area. As of the 2010 census, the city had a population of 50,949, making it the third largest city in Indiana.
History
The area that is now Elkhart was first settled in 1829 by a group of settlers from New York. The city was originally known as Pulaski, after the Revolutionary War hero Casimir Pulaski. The city was renamed Elkhart in 1851, after the Elkhart River, which runs through the city.
The city was an important stop on the Underground Railroad, and was home to several abolitionists. During the Civil War, Elkhart was a major supplier of arms and ammunition to the Union Army.
In the late 19th century, Elkhart became an important center for the manufacture of carriages and wagons. The city was also home to several large factories, including the Studebaker Corporation, which produced automobiles from 1902 to 1963.
Geography
Elkhart is located in northern Indiana, about 15 miles east of South Bend. The city is situated on the St. Joseph River and is part of the South Bend-Elkhart metropolitan area. The city has a total area of 16.3 square miles, of which 16.2 square miles is land and 0.1 square miles is water.
Economy
Elkhart is a major manufacturing center, with a diverse economy. The city is home to several large companies, including the recreational vehicle manufacturer Thor Industries, the musical instrument manufacturer Conn-Selmer, and the medical device manufacturer Zimmer Biomet. The city is also home to several smaller companies, including the RV manufacturer Forest River, the musical instrument manufacturer Conn-Selmer, and the medical device manufacturer Zimmer Biomet.
The city is also home to several educational institutions, including Elkhart Community College, Indiana University South Bend, and Bethel College.
Demographics
As of the 2010 census, the city had a population of 50,949. The racial makeup of the city was 79.2% White, 11.3% African American, 0.4% Native American, 1.2% Asian, 0.1% Pacific Islander, 5.2% from other races, and 2.7% from two or more races. Hispanic or Latino of any race were 10.2% of the population.
The median income for a household in the city was $37,945, and the median income for a family was $45,919. The per capita income for the city was $20,945. About 13.2% of families and 16.3% of the population were below the poverty line, including 24.2% of those under age 18 and 8.2% of those age 65 or over.
Common Questions
What is Per Capita Income in Elkhart?
Per Capita income in Elkhart is $25,494.
What is the Median Family Income in Elkhart?
Median Family Income in Elkhart is $52,741.
What is the Median Household income in Elkhart?
Median Household Income in Elkhart is $46,534.
What is Income or Wage Gap in Elkhart?
Income or Wage Gap in Elkhart is 34.2%.
Women in Elkhart earn 65.8 cents for every dollar earned by a man.
What is Family Income Deficit in Elkhart?
Family Income Deficit in Elkhart is $14,271.
Families that are below poverty line in Elkhart earn $14,271 less on average than the poverty threshold level.
What is Inequality or Gini Index in Elkhart?
Inequality or Gini Index in Elkhart is 0.45.
What is the Total Population of Elkhart?
Total Population of Elkhart is 53,785.
What is the Total Male Population of Elkhart?
Total Male Population of Elkhart is 25,672.
What is the Total Female Population of Elkhart?
Total Female Population of Elkhart is 28,113.
What is the Ratio of Males per 100 Females in Elkhart?
There are 91.32 Males per 100 Females in Elkhart.
What is the Ratio of Females per 100 Males in Elkhart?
There are 109.51 Females per 100 Males in Elkhart.
What is the Median Population Age in Elkhart?
Median Population Age in Elkhart is 34.5 Years.
What is the Average Family Size in Elkhart
Average Family Size in Elkhart is 3.3 People.
What is the Average Household Size in Elkhart
Average Household Size in Elkhart is 2.5 People.
How Large is the Labor Force in Elkhart?
There are 25,923 People in the Labor Forcein in Elkhart.
What is the Percentage of People in the Labor Force in Elkhart?
63.5% of People are in the Labor Force in Elkhart.
What is the Unemployment Rate in Elkhart?
Unemployment Rate in Elkhart is 3.9%.