Lawndale, CA Map & Demographics
Lawndale Map
Lawndale Overview
$29,330
PER CAPITA INCOME
$76,349
AVG FAMILY INCOME
$76,213
AVG HOUSEHOLD INCOME
25.7%
WAGE / INCOME GAP [ % ]
74.3¢/ $1
WAGE / INCOME GAP [ $ ]
$10,446
FAMILY INCOME DEFICIT
0.38
INEQUALITY / GINI INDEX
31,553
TOTAL POPULATION
16,613
MALE POPULATION
14,940
FEMALE POPULATION
111.20
MALES / 100 FEMALES
89.93
FEMALES / 100 MALES
35.4
MEDIAN AGE
3.6
AVG FAMILY SIZE
3.2
AVG HOUSEHOLD SIZE
18,276
LABOR FORCE [ PEOPLE ]
72.6%
PERCENT IN LABOR FORCE
8.3%
UNEMPLOYMENT RATE
Lawndale Zip Codes
Lawndale Area Codes
Income in Lawndale
Income Overview in Lawndale
Per Capita Income in Lawndale is $29,330, while median incomes of families and households are $76,349 and $76,213 respectively.
| Characteristic | Number | Measure |
| Per Capita Income | 31,553 | $29,330 |
| Median Family Income | 7,309 | $76,349 |
| Mean Family Income | 7,309 | $92,624 |
| Median Household Income | 9,684 | $76,213 |
| Mean Household Income | 9,684 | $91,676 |
| Income Deficit | 7,309 | $10,446 |
| Wage / Income Gap (%) | 31,553 | 25.73% |
| Wage / Income Gap ($) | 31,553 | 74.27¢ per $1 |
| Gini / Inequality Index | 31,553 | 0.38 |
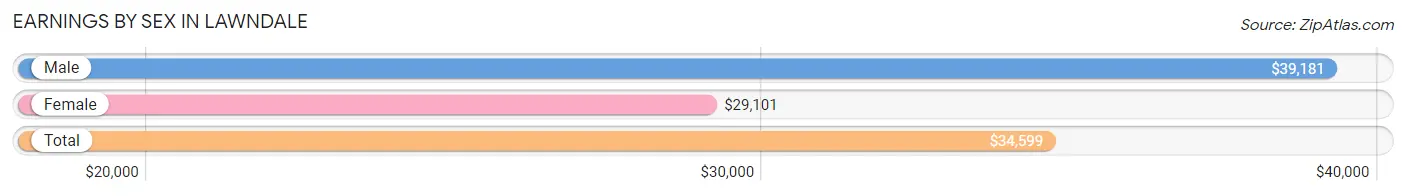
Earnings by Sex in Lawndale
Average Earnings in Lawndale are $34,599, $39,181 for men and $29,101 for women, a difference of 25.7%.
| Sex | Number | Average Earnings |
| Male | 10,741 (58.3%) | $39,181 |
| Female | 7,689 (41.7%) | $29,101 |
| Total | 18,430 (100.0%) | $34,599 |
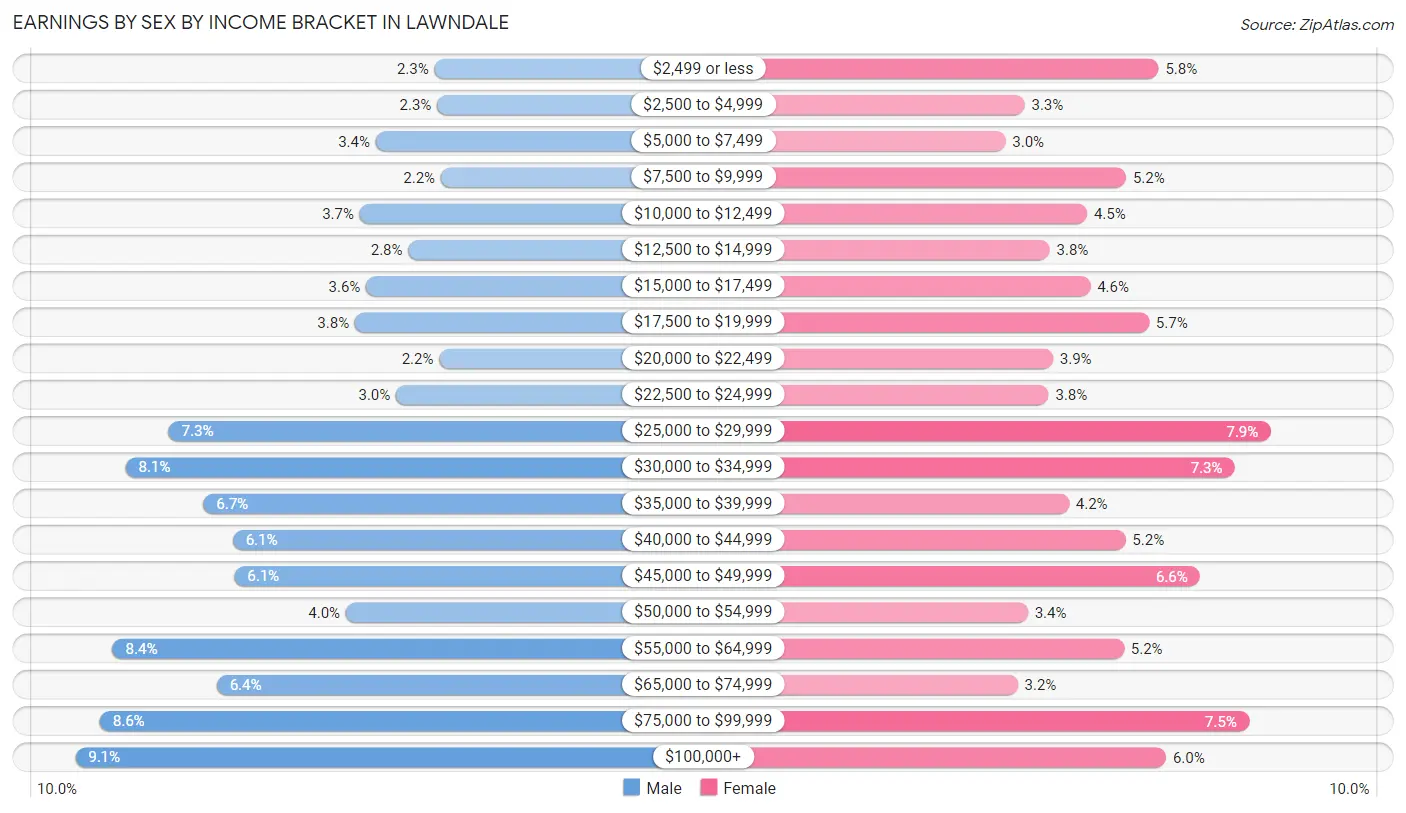
Earnings by Sex by Income Bracket in Lawndale
The most common earnings brackets in Lawndale are $100,000+ for men (972 | 9.0%) and $25,000 to $29,999 for women (610 | 7.9%).
| Income | Male | Female |
| $2,499 or less | 249 (2.3%) | 449 (5.8%) |
| $2,500 to $4,999 | 244 (2.3%) | 256 (3.3%) |
| $5,000 to $7,499 | 367 (3.4%) | 228 (3.0%) |
| $7,500 to $9,999 | 236 (2.2%) | 402 (5.2%) |
| $10,000 to $12,499 | 400 (3.7%) | 346 (4.5%) |
| $12,500 to $14,999 | 302 (2.8%) | 292 (3.8%) |
| $15,000 to $17,499 | 387 (3.6%) | 351 (4.6%) |
| $17,500 to $19,999 | 409 (3.8%) | 435 (5.7%) |
| $20,000 to $22,499 | 239 (2.2%) | 297 (3.9%) |
| $22,500 to $24,999 | 326 (3.0%) | 291 (3.8%) |
| $25,000 to $29,999 | 784 (7.3%) | 610 (7.9%) |
| $30,000 to $34,999 | 871 (8.1%) | 558 (7.3%) |
| $35,000 to $39,999 | 714 (6.7%) | 320 (4.2%) |
| $40,000 to $44,999 | 655 (6.1%) | 401 (5.2%) |
| $45,000 to $49,999 | 652 (6.1%) | 508 (6.6%) |
| $50,000 to $54,999 | 427 (4.0%) | 261 (3.4%) |
| $55,000 to $64,999 | 897 (8.4%) | 399 (5.2%) |
| $65,000 to $74,999 | 687 (6.4%) | 246 (3.2%) |
| $75,000 to $99,999 | 923 (8.6%) | 579 (7.5%) |
| $100,000+ | 972 (9.0%) | 460 (6.0%) |
| Total | 10,741 (100.0%) | 7,689 (100.0%) |
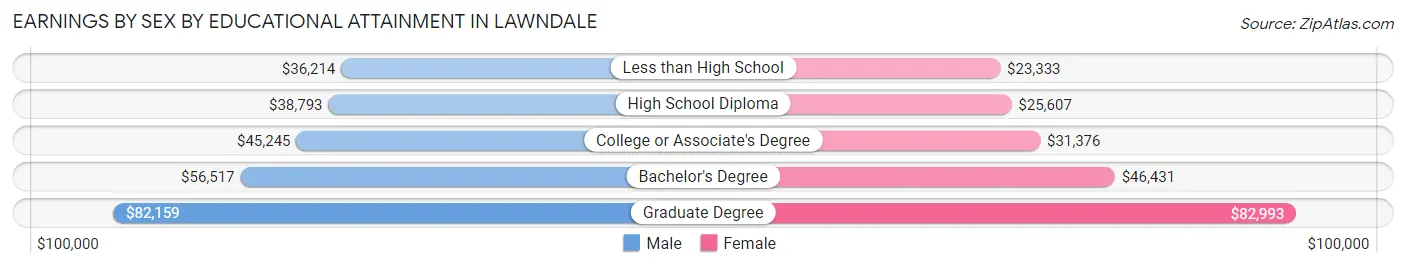
Earnings by Sex by Educational Attainment in Lawndale
Average earnings in Lawndale are $42,694 for men and $32,249 for women, a difference of 24.5%. Men with an educational attainment of graduate degree enjoy the highest average annual earnings of $82,159, while those with less than high school education earn the least with $36,214. Women with an educational attainment of graduate degree earn the most with the average annual earnings of $82,993, while those with less than high school education have the smallest earnings of $23,333.
| Educational Attainment | Male Income | Female Income |
| Less than High School | $36,214 | $23,333 |
| High School Diploma | $38,793 | $25,607 |
| College or Associate's Degree | $45,245 | $31,376 |
| Bachelor's Degree | $56,517 | $46,431 |
| Graduate Degree | $82,159 | $82,993 |
| Total | $42,694 | $32,249 |
Family Income in Lawndale
Family Income Brackets in Lawndale
According to the Lawndale family income data, there are 1,491 families falling into the $50,000 to $74,999 income range, which is the most common income bracket and makes up 20.4% of all families. Conversely, the less than $10,000 income bracket is the least frequent group with only 95 families (1.3%) belonging to this category.
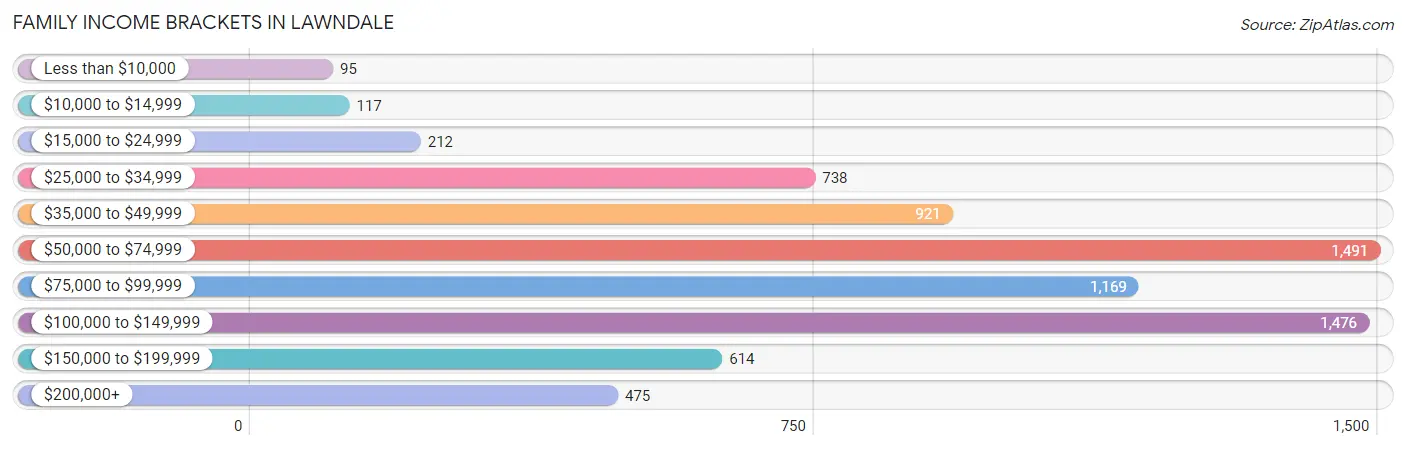
| Income Bracket | # Families | % Families |
| Less than $10,000 | 95 | 1.3% |
| $10,000 to $14,999 | 117 | 1.6% |
| $15,000 to $24,999 | 212 | 2.9% |
| $25,000 to $34,999 | 738 | 10.1% |
| $35,000 to $49,999 | 921 | 12.6% |
| $50,000 to $74,999 | 1,491 | 20.4% |
| $75,000 to $99,999 | 1,169 | 16.0% |
| $100,000 to $149,999 | 1,476 | 20.2% |
| $150,000 to $199,999 | 614 | 8.4% |
| $200,000+ | 475 | 6.5% |
Family Income by Famaliy Size in Lawndale
6-person families (361 | 4.9%) account for the highest median family income in Lawndale with $112,596 per family, while 2-person families (2,564 | 35.1%) have the highest median income of $36,698 per family member.
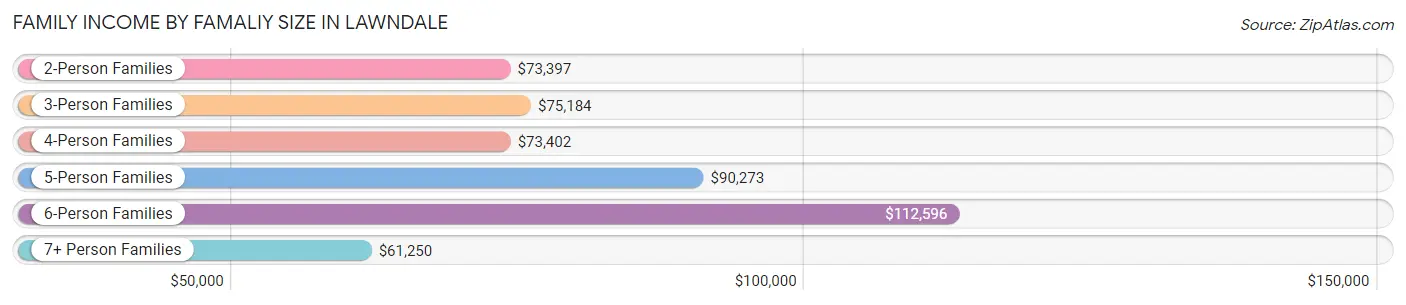
| Income Bracket | # Families | Median Income |
| 2-Person Families | 2,564 (35.1%) | $73,397 |
| 3-Person Families | 1,827 (25.0%) | $75,184 |
| 4-Person Families | 1,442 (19.7%) | $73,402 |
| 5-Person Families | 1,008 (13.8%) | $90,273 |
| 6-Person Families | 361 (4.9%) | $112,596 |
| 7+ Person Families | 107 (1.5%) | $61,250 |
| Total | 7,309 (100.0%) | $76,349 |
Family Income by Number of Earners in Lawndale
The median family income in Lawndale is $76,349, with families comprising 3+ earners (1,497) having the highest median family income of $116,076, while families with no earners (402) have the lowest median family income of $38,355, accounting for 20.5% and 5.5% of families, respectively.
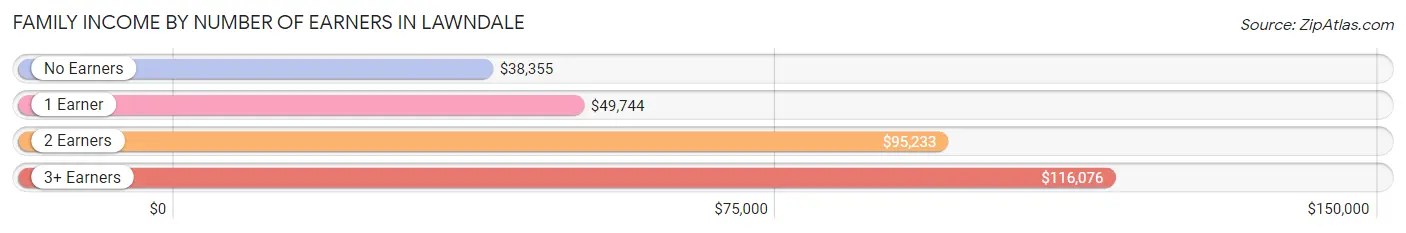
| Number of Earners | # Families | Median Income |
| No Earners | 402 (5.5%) | $38,355 |
| 1 Earner | 2,361 (32.3%) | $49,744 |
| 2 Earners | 3,049 (41.7%) | $95,233 |
| 3+ Earners | 1,497 (20.5%) | $116,076 |
| Total | 7,309 (100.0%) | $76,349 |
Household Income in Lawndale
Household Income Brackets in Lawndale
With 1,976 households falling in the category, the $100,000 to $149,999 income range is the most frequent in Lawndale, accounting for 20.4% of all households. In contrast, only 155 households (1.6%) fall into the less than $10,000 income bracket, making it the least populous group.
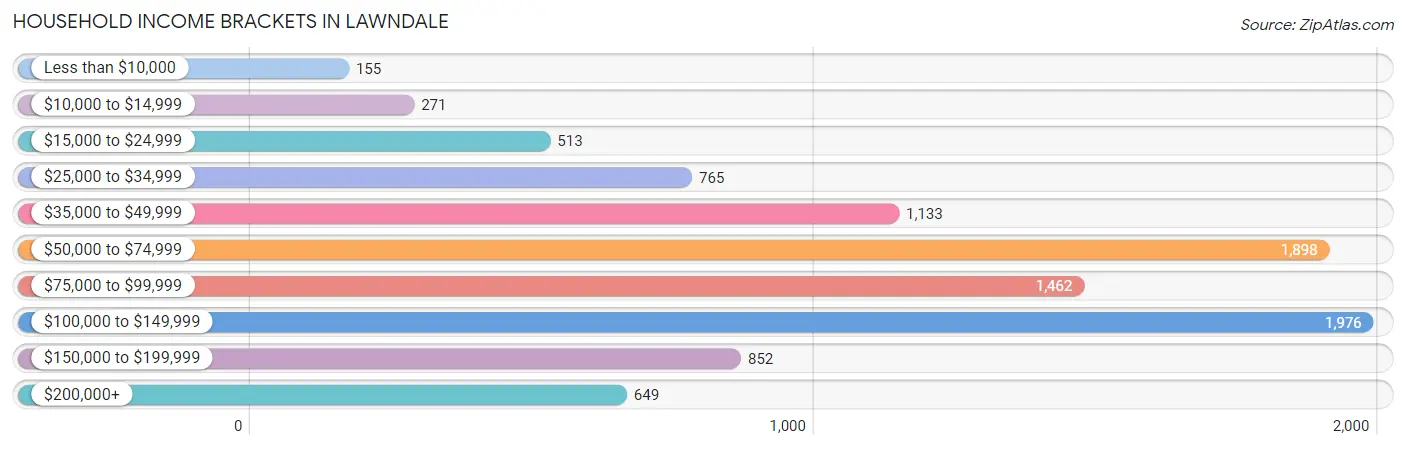
| Income Bracket | # Households | % Households |
| Less than $10,000 | 155 | 1.6% |
| $10,000 to $14,999 | 271 | 2.8% |
| $15,000 to $24,999 | 513 | 5.3% |
| $25,000 to $34,999 | 765 | 7.9% |
| $35,000 to $49,999 | 1,133 | 11.7% |
| $50,000 to $74,999 | 1,898 | 19.6% |
| $75,000 to $99,999 | 1,462 | 15.1% |
| $100,000 to $149,999 | 1,976 | 20.4% |
| $150,000 to $199,999 | 852 | 8.8% |
| $200,000+ | 649 | 6.7% |
Household Income by Householder Age in Lawndale
The median household income in Lawndale is $76,213, with the highest median household income of $87,333 found in the 45 to 64 years age bracket for the primary householder. A total of 4,180 households (43.2%) fall into this category. Meanwhile, the 65+ years age bracket for the primary householder has the lowest median household income of $46,803, with 1,532 households (15.8%) in this group.
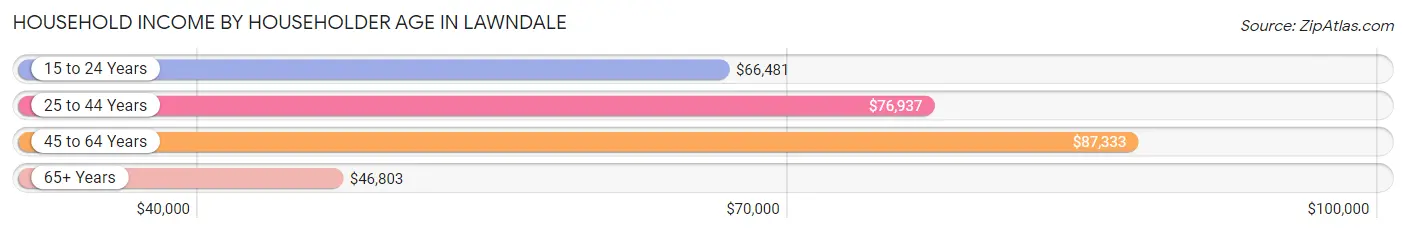
| Income Bracket | # Households | Median Income |
| 15 to 24 Years | 274 (2.8%) | $66,481 |
| 25 to 44 Years | 3,698 (38.2%) | $76,937 |
| 45 to 64 Years | 4,180 (43.2%) | $87,333 |
| 65+ Years | 1,532 (15.8%) | $46,803 |
| Total | 9,684 (100.0%) | $76,213 |
Poverty in Lawndale
Income Below Poverty by Sex and Age in Lawndale
With 9.8% poverty level for males and 11.2% for females among the residents of Lawndale, 5 year old males and 15 year old females are the most vulnerable to poverty, with 46 males (21.0%) and 56 females (26.7%) in their respective age groups living below the poverty level.
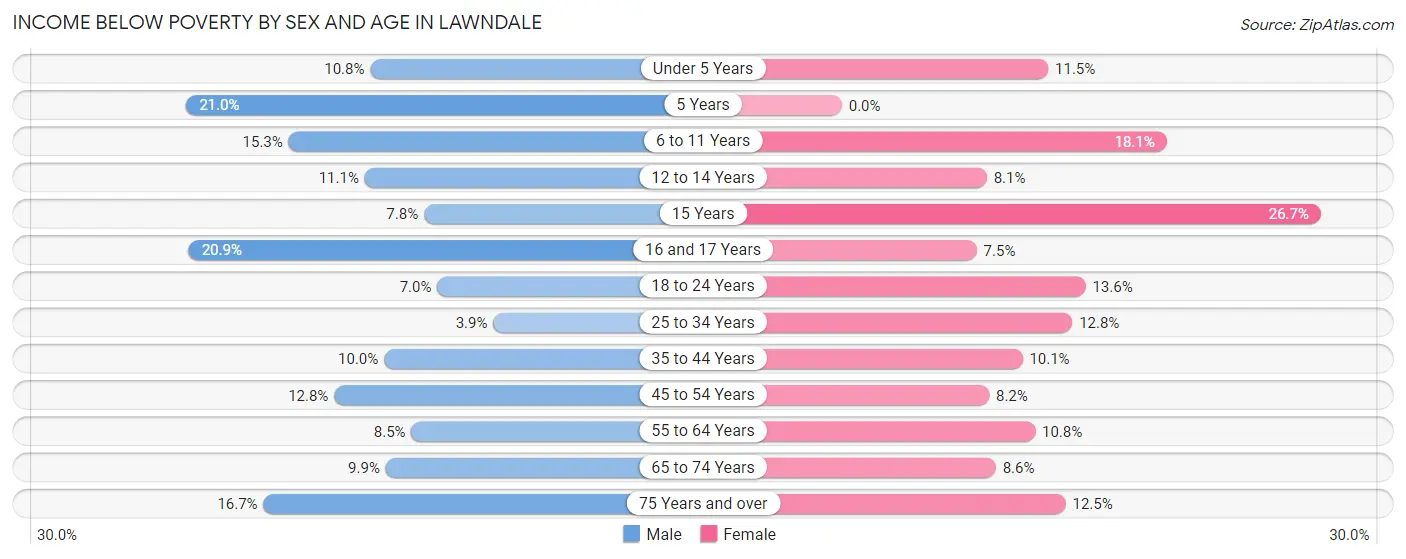
| Age Bracket | Male | Female |
| Under 5 Years | 89 (10.7%) | 108 (11.5%) |
| 5 Years | 46 (21.0%) | 0 (0.0%) |
| 6 to 11 Years | 123 (15.3%) | 189 (18.1%) |
| 12 to 14 Years | 67 (11.1%) | 71 (8.1%) |
| 15 Years | 33 (7.8%) | 56 (26.7%) |
| 16 and 17 Years | 87 (20.9%) | 39 (7.5%) |
| 18 to 24 Years | 126 (7.0%) | 167 (13.6%) |
| 25 to 34 Years | 106 (3.9%) | 318 (12.8%) |
| 35 to 44 Years | 246 (10.0%) | 197 (10.1%) |
| 45 to 54 Years | 340 (12.8%) | 167 (8.2%) |
| 55 to 64 Years | 163 (8.5%) | 196 (10.8%) |
| 65 to 74 Years | 102 (9.9%) | 80 (8.6%) |
| 75 Years and over | 80 (16.7%) | 87 (12.5%) |
| Total | 1,608 (9.8%) | 1,675 (11.2%) |
Income Above Poverty by Sex and Age in Lawndale
According to the poverty statistics in Lawndale, males aged 25 to 34 years and females aged 5 years are the age groups that are most secure financially, with 96.1% of males and 100.0% of females in these age groups living above the poverty line.
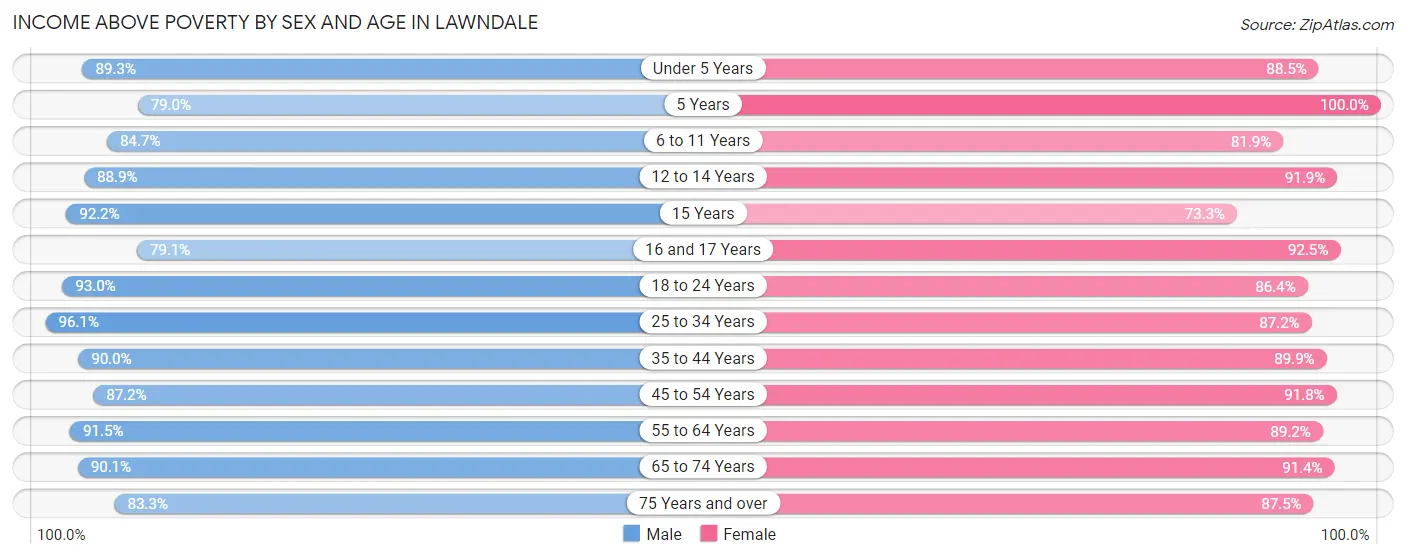
| Age Bracket | Male | Female |
| Under 5 Years | 739 (89.2%) | 832 (88.5%) |
| 5 Years | 173 (79.0%) | 173 (100.0%) |
| 6 to 11 Years | 681 (84.7%) | 856 (81.9%) |
| 12 to 14 Years | 539 (88.9%) | 809 (91.9%) |
| 15 Years | 392 (92.2%) | 154 (73.3%) |
| 16 and 17 Years | 330 (79.1%) | 480 (92.5%) |
| 18 to 24 Years | 1,670 (93.0%) | 1,064 (86.4%) |
| 25 to 34 Years | 2,611 (96.1%) | 2,160 (87.2%) |
| 35 to 44 Years | 2,218 (90.0%) | 1,761 (89.9%) |
| 45 to 54 Years | 2,324 (87.2%) | 1,870 (91.8%) |
| 55 to 64 Years | 1,763 (91.5%) | 1,626 (89.2%) |
| 65 to 74 Years | 929 (90.1%) | 854 (91.4%) |
| 75 Years and over | 399 (83.3%) | 611 (87.5%) |
| Total | 14,768 (90.2%) | 13,250 (88.8%) |
Income Below Poverty Among Married-Couple Families in Lawndale
The poverty statistics for married-couple families in Lawndale show that 5.1% or 240 of the total 4,696 families live below the poverty line. Families with 3 or 4 children have the highest poverty rate of 21.7%, comprising of 110 families. On the other hand, families with 5 or more children have the lowest poverty rate of 0.0%, which includes 0 families.
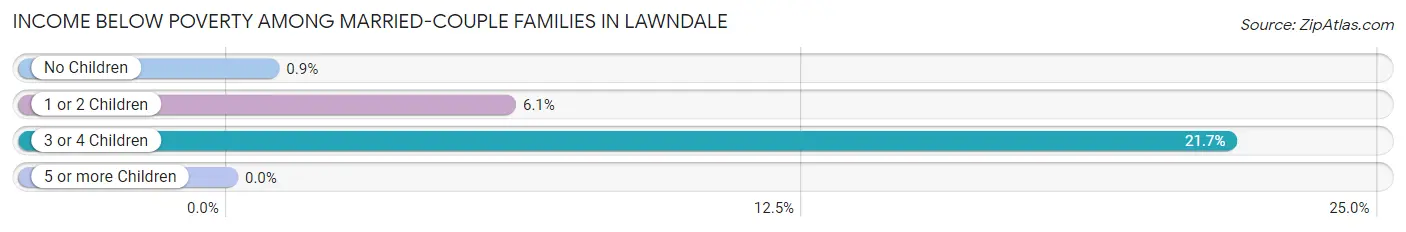
| Children | Above Poverty | Below Poverty |
| No Children | 2,316 (99.1%) | 21 (0.9%) |
| 1 or 2 Children | 1,693 (94.0%) | 109 (6.0%) |
| 3 or 4 Children | 396 (78.3%) | 110 (21.7%) |
| 5 or more Children | 51 (100.0%) | 0 (0.0%) |
| Total | 4,456 (94.9%) | 240 (5.1%) |
Income Below Poverty Among Single-Parent Households in Lawndale
According to the poverty data in Lawndale, 6.9% or 82 single-father households and 12.5% or 178 single-mother households are living below the poverty line. Among single-father households, those with 3 or 4 children have the highest poverty rate, with 10 households (18.5%) experiencing poverty. Likewise, among single-mother households, those with 3 or 4 children have the highest poverty rate, with 36 households (22.4%) falling below the poverty line.
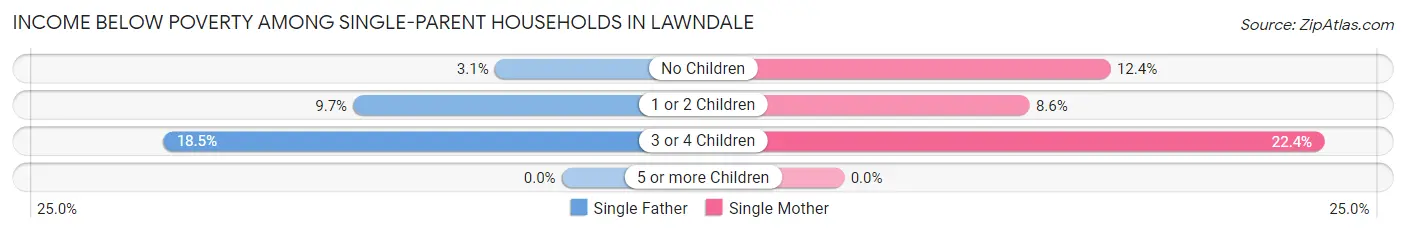
| Children | Single Father | Single Mother |
| No Children | 18 (3.1%) | 110 (12.4%) |
| 1 or 2 Children | 54 (9.7%) | 32 (8.6%) |
| 3 or 4 Children | 10 (18.5%) | 36 (22.4%) |
| 5 or more Children | 0 (0.0%) | 0 (0.0%) |
| Total | 82 (6.9%) | 178 (12.5%) |
Income Below Poverty Among Married-Couple vs Single-Parent Households in Lawndale
The poverty data for Lawndale shows that 240 of the married-couple family households (5.1%) and 260 of the single-parent households (10.0%) are living below the poverty level. Within the married-couple family households, those with 3 or 4 children have the highest poverty rate, with 110 households (21.7%) falling below the poverty line. Among the single-parent households, those with 3 or 4 children have the highest poverty rate, with 46 household (21.4%) living below poverty.
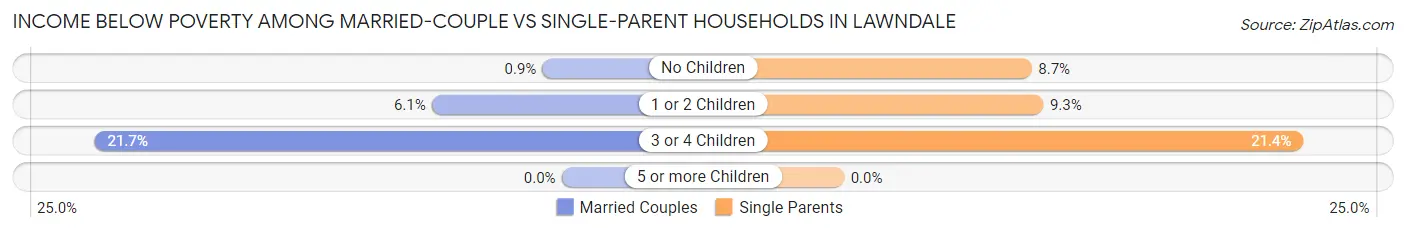
| Children | Married-Couple Families | Single-Parent Households |
| No Children | 21 (0.9%) | 128 (8.7%) |
| 1 or 2 Children | 109 (6.0%) | 86 (9.3%) |
| 3 or 4 Children | 110 (21.7%) | 46 (21.4%) |
| 5 or more Children | 0 (0.0%) | 0 (0.0%) |
| Total | 240 (5.1%) | 260 (10.0%) |
Race in Lawndale
The most populous races in Lawndale are Hispanic or Latino (20,451 | 64.8%), White / Caucasian (11,944 | 37.9%), and Two or more Races (6,951 | 22.0%).
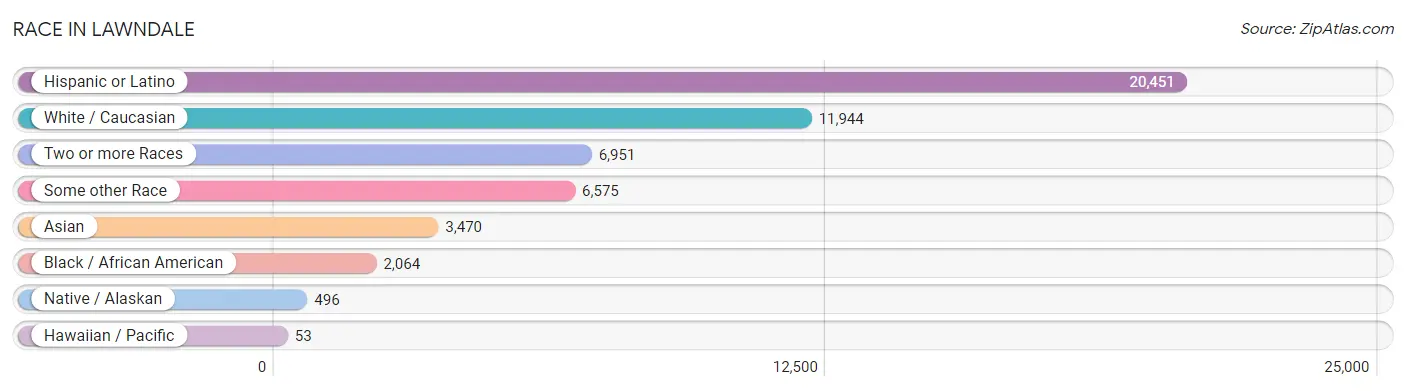
| Race | # Population | % Population |
| Asian | 3,470 | 11.0% |
| Black / African American | 2,064 | 6.5% |
| Hawaiian / Pacific | 53 | 0.2% |
| Hispanic or Latino | 20,451 | 64.8% |
| Native / Alaskan | 496 | 1.6% |
| White / Caucasian | 11,944 | 37.9% |
| Two or more Races | 6,951 | 22.0% |
| Some other Race | 6,575 | 20.8% |
| Total | 31,553 | 100.0% |
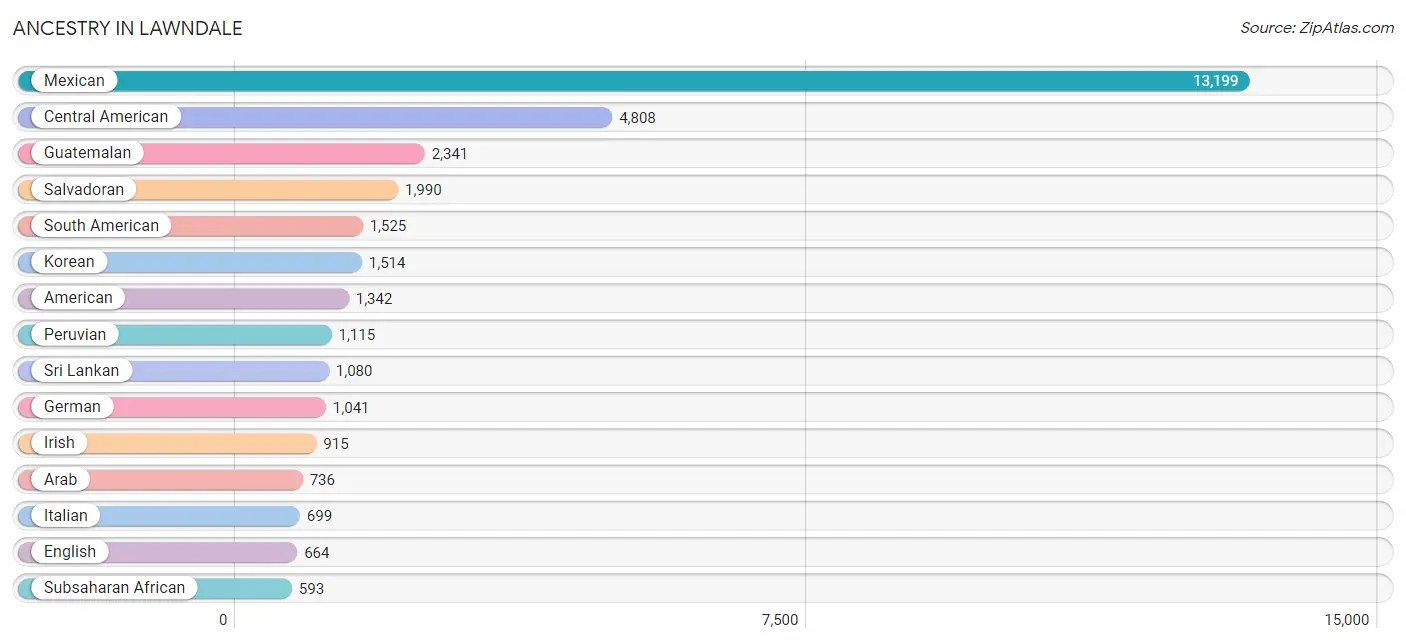
Ancestry in Lawndale
The most populous ancestries reported in Lawndale are Mexican (13,199 | 41.8%), Central American (4,808 | 15.2%), Guatemalan (2,341 | 7.4%), Salvadoran (1,990 | 6.3%), and South American (1,525 | 4.8%), together accounting for 75.6% of all Lawndale residents.
| Ancestry | # Population | % Population |
| African | 210 | 0.7% |
| American | 1,342 | 4.3% |
| Apache | 35 | 0.1% |
| Arab | 736 | 2.3% |
| Argentinean | 71 | 0.2% |
| Armenian | 16 | 0.1% |
| Assyrian / Chaldean / Syriac | 29 | 0.1% |
| Basque | 8 | 0.0% |
| Belizean | 37 | 0.1% |
| Bhutanese | 459 | 1.5% |
| Blackfeet | 21 | 0.1% |
| Bolivian | 7 | 0.0% |
| Bulgarian | 18 | 0.1% |
| Burmese | 138 | 0.4% |
| Canadian | 105 | 0.3% |
| Central American | 4,808 | 15.2% |
| Central American Indian | 210 | 0.7% |
| Cherokee | 56 | 0.2% |
| Chilean | 52 | 0.2% |
| Chippewa | 9 | 0.0% |
| Colombian | 182 | 0.6% |
| Costa Rican | 113 | 0.4% |
| Cuban | 235 | 0.7% |
| Czech | 21 | 0.1% |
| Danish | 33 | 0.1% |
| Dominican | 12 | 0.0% |
| Dutch | 60 | 0.2% |
| Ecuadorian | 17 | 0.1% |
| Egyptian | 371 | 1.2% |
| English | 664 | 2.1% |
| Ethiopian | 45 | 0.1% |
| European | 425 | 1.3% |
| French | 396 | 1.3% |
| French Canadian | 100 | 0.3% |
| German | 1,041 | 3.3% |
| German Russian | 9 | 0.0% |
| Greek | 8 | 0.0% |
| Guatemalan | 2,341 | 7.4% |
| Haitian | 38 | 0.1% |
| Honduran | 253 | 0.8% |
| Hungarian | 6 | 0.0% |
| Icelander | 60 | 0.2% |
| Indian (Asian) | 216 | 0.7% |
| Indonesian | 200 | 0.6% |
| Inupiat | 30 | 0.1% |
| Iranian | 13 | 0.0% |
| Irish | 915 | 2.9% |
| Israeli | 8 | 0.0% |
| Italian | 699 | 2.2% |
| Jamaican | 41 | 0.1% |
| Kenyan | 14 | 0.0% |
| Korean | 1,514 | 4.8% |
| Laotian | 19 | 0.1% |
| Latvian | 17 | 0.1% |
| Lebanese | 61 | 0.2% |
| Mexican | 13,199 | 41.8% |
| Mexican American Indian | 254 | 0.8% |
| Moroccan | 9 | 0.0% |
| Navajo | 54 | 0.2% |
| Nicaraguan | 111 | 0.4% |
| Nigerian | 324 | 1.0% |
| Northern European | 61 | 0.2% |
| Norwegian | 140 | 0.4% |
| Pakistani | 8 | 0.0% |
| Peruvian | 1,115 | 3.5% |
| Polish | 417 | 1.3% |
| Portuguese | 34 | 0.1% |
| Puerto Rican | 129 | 0.4% |
| Romanian | 53 | 0.2% |
| Russian | 184 | 0.6% |
| Salvadoran | 1,990 | 6.3% |
| Samoan | 104 | 0.3% |
| Scandinavian | 37 | 0.1% |
| Scotch-Irish | 54 | 0.2% |
| Scottish | 107 | 0.3% |
| Serbian | 88 | 0.3% |
| Sioux | 14 | 0.0% |
| Slovak | 5 | 0.0% |
| South American | 1,525 | 4.8% |
| Spaniard | 122 | 0.4% |
| Spanish | 56 | 0.2% |
| Sri Lankan | 1,080 | 3.4% |
| Subsaharan African | 593 | 1.9% |
| Swedish | 61 | 0.2% |
| Syrian | 156 | 0.5% |
| Thai | 218 | 0.7% |
| Tongan | 9 | 0.0% |
| Turkish | 18 | 0.1% |
| Ukrainian | 15 | 0.1% |
| Uruguayan | 56 | 0.2% |
| Vietnamese | 23 | 0.1% |
| Welsh | 22 | 0.1% | View All 92 Rows |
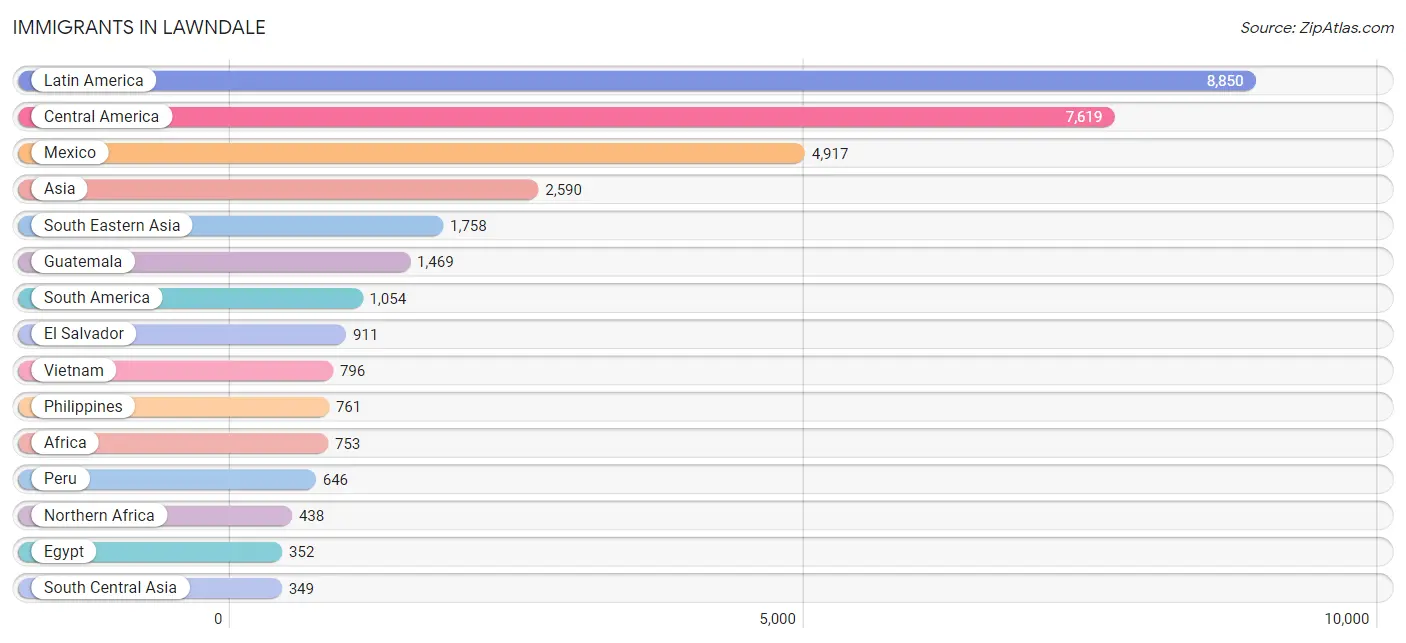
Immigrants in Lawndale
The most numerous immigrant groups reported in Lawndale came from Latin America (8,850 | 28.1%), Central America (7,619 | 24.1%), Mexico (4,917 | 15.6%), Asia (2,590 | 8.2%), and South Eastern Asia (1,758 | 5.6%), together accounting for 81.6% of all Lawndale residents.
| Immigration Origin | # Population | % Population |
| Africa | 753 | 2.4% |
| Argentina | 77 | 0.2% |
| Asia | 2,590 | 8.2% |
| Bangladesh | 23 | 0.1% |
| Belize | 22 | 0.1% |
| Brazil | 154 | 0.5% |
| Bulgaria | 10 | 0.0% |
| Cambodia | 2 | 0.0% |
| Canada | 88 | 0.3% |
| Caribbean | 177 | 0.6% |
| Central America | 7,619 | 24.1% |
| Chile | 26 | 0.1% |
| China | 42 | 0.1% |
| Colombia | 89 | 0.3% |
| Costa Rica | 42 | 0.1% |
| Cuba | 98 | 0.3% |
| Dominican Republic | 38 | 0.1% |
| Eastern Africa | 60 | 0.2% |
| Eastern Asia | 156 | 0.5% |
| Eastern Europe | 175 | 0.5% |
| Ecuador | 32 | 0.1% |
| Egypt | 352 | 1.1% |
| El Salvador | 911 | 2.9% |
| England | 17 | 0.1% |
| Eritrea | 60 | 0.2% |
| Europe | 347 | 1.1% |
| Fiji | 16 | 0.1% |
| Germany | 106 | 0.3% |
| Guatemala | 1,469 | 4.7% |
| Honduras | 176 | 0.6% |
| Hong Kong | 21 | 0.1% |
| India | 137 | 0.4% |
| Indonesia | 19 | 0.1% |
| Iran | 27 | 0.1% |
| Jamaica | 41 | 0.1% |
| Japan | 18 | 0.1% |
| Jordan | 16 | 0.1% |
| Korea | 96 | 0.3% |
| Latin America | 8,850 | 28.1% |
| Lebanon | 35 | 0.1% |
| Malaysia | 8 | 0.0% |
| Mexico | 4,917 | 15.6% |
| Moldova | 19 | 0.1% |
| Morocco | 34 | 0.1% |
| Nicaragua | 60 | 0.2% |
| Nigeria | 241 | 0.8% |
| Northern Africa | 438 | 1.4% |
| Northern Europe | 66 | 0.2% |
| Oceania | 25 | 0.1% |
| Pakistan | 89 | 0.3% |
| Peru | 646 | 2.1% |
| Philippines | 761 | 2.4% |
| Poland | 93 | 0.3% |
| Russia | 44 | 0.1% |
| Saudi Arabia | 21 | 0.1% |
| South America | 1,054 | 3.3% |
| South Central Asia | 349 | 1.1% |
| South Eastern Asia | 1,758 | 5.6% |
| Sri Lanka | 73 | 0.2% |
| Sudan | 52 | 0.2% |
| Syria | 245 | 0.8% |
| Uruguay | 30 | 0.1% |
| Vietnam | 796 | 2.5% |
| Western Africa | 255 | 0.8% |
| Western Asia | 327 | 1.0% |
| Western Europe | 106 | 0.3% |
| Yemen | 10 | 0.0% | View All 67 Rows |
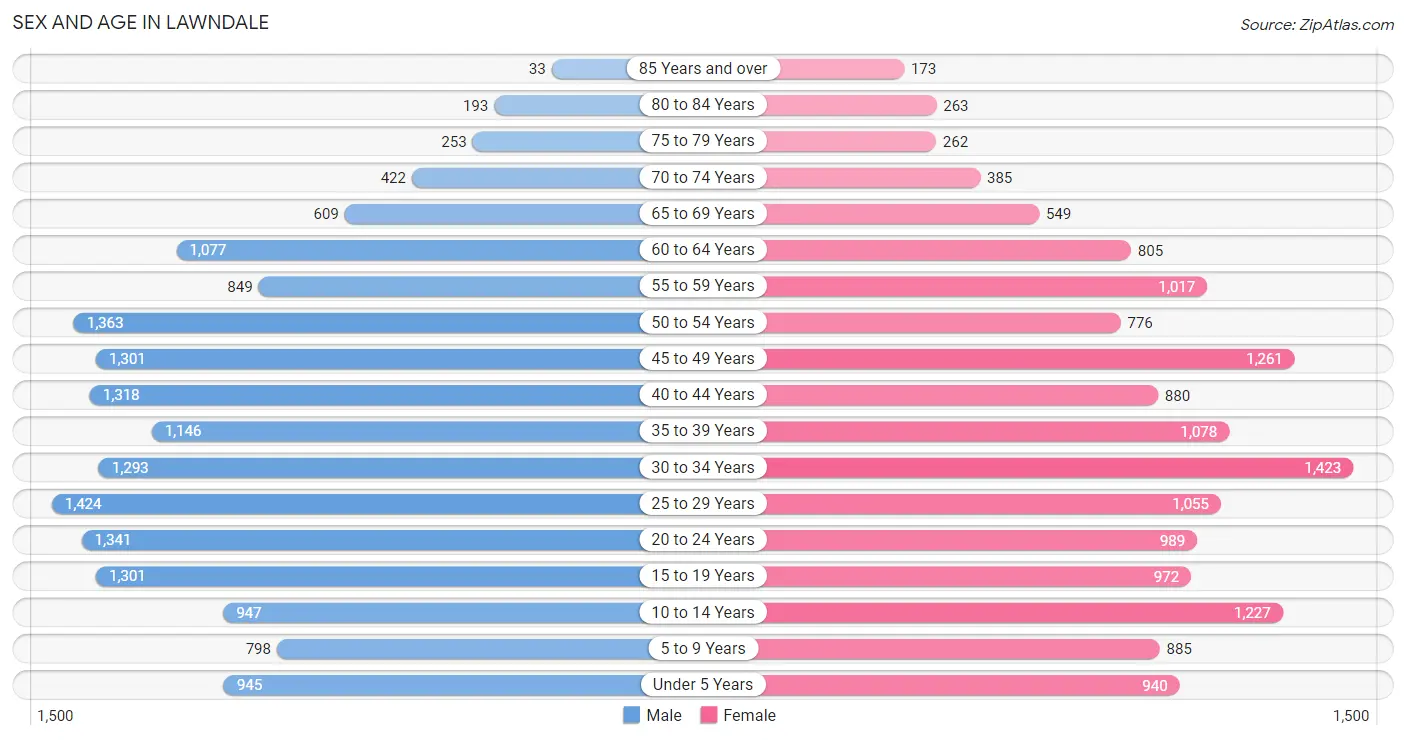
Sex and Age in Lawndale
Sex and Age in Lawndale
The most populous age groups in Lawndale are 25 to 29 Years (1,424 | 8.6%) for men and 30 to 34 Years (1,423 | 9.5%) for women.
| Age Bracket | Male | Female |
| Under 5 Years | 945 (5.7%) | 940 (6.3%) |
| 5 to 9 Years | 798 (4.8%) | 885 (5.9%) |
| 10 to 14 Years | 947 (5.7%) | 1,227 (8.2%) |
| 15 to 19 Years | 1,301 (7.8%) | 972 (6.5%) |
| 20 to 24 Years | 1,341 (8.1%) | 989 (6.6%) |
| 25 to 29 Years | 1,424 (8.6%) | 1,055 (7.1%) |
| 30 to 34 Years | 1,293 (7.8%) | 1,423 (9.5%) |
| 35 to 39 Years | 1,146 (6.9%) | 1,078 (7.2%) |
| 40 to 44 Years | 1,318 (7.9%) | 880 (5.9%) |
| 45 to 49 Years | 1,301 (7.8%) | 1,261 (8.4%) |
| 50 to 54 Years | 1,363 (8.2%) | 776 (5.2%) |
| 55 to 59 Years | 849 (5.1%) | 1,017 (6.8%) |
| 60 to 64 Years | 1,077 (6.5%) | 805 (5.4%) |
| 65 to 69 Years | 609 (3.7%) | 549 (3.7%) |
| 70 to 74 Years | 422 (2.5%) | 385 (2.6%) |
| 75 to 79 Years | 253 (1.5%) | 262 (1.8%) |
| 80 to 84 Years | 193 (1.2%) | 263 (1.8%) |
| 85 Years and over | 33 (0.2%) | 173 (1.2%) |
| Total | 16,613 (100.0%) | 14,940 (100.0%) |
Families and Households in Lawndale
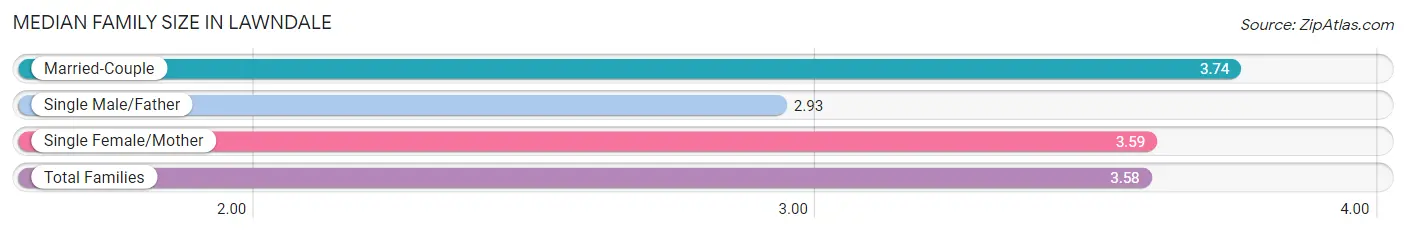
Median Family Size in Lawndale
The median family size in Lawndale is 3.58 persons per family, with married-couple families (4,696 | 64.2%) accounting for the largest median family size of 3.74 persons per family. On the other hand, single male/father families (1,187 | 16.2%) represent the smallest median family size with 2.93 persons per family.
| Family Type | # Families | Family Size |
| Married-Couple | 4,696 (64.2%) | 3.74 |
| Single Male/Father | 1,187 (16.2%) | 2.93 |
| Single Female/Mother | 1,426 (19.5%) | 3.59 |
| Total Families | 7,309 (100.0%) | 3.58 |
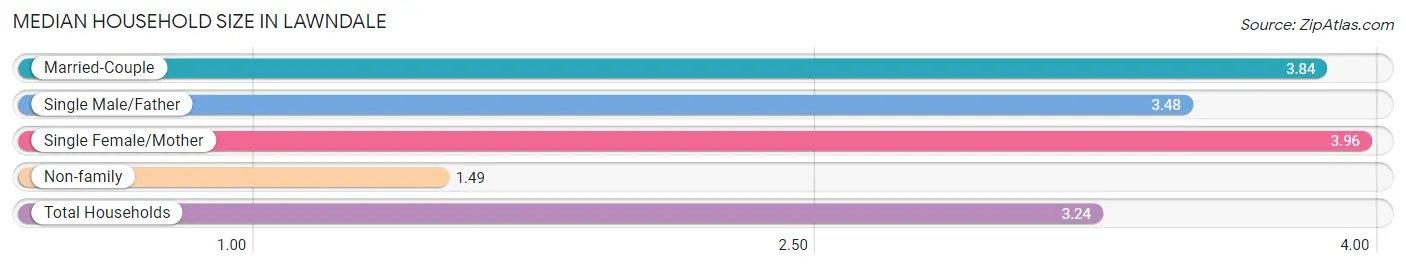
Median Household Size in Lawndale
The median household size in Lawndale is 3.24 persons per household, with single female/mother households (1,426 | 14.7%) accounting for the largest median household size of 3.96 persons per household. non-family households (2,375 | 24.5%) represent the smallest median household size with 1.49 persons per household.
| Household Type | # Households | Household Size |
| Married-Couple | 4,696 (48.5%) | 3.84 |
| Single Male/Father | 1,187 (12.3%) | 3.48 |
| Single Female/Mother | 1,426 (14.7%) | 3.96 |
| Non-family | 2,375 (24.5%) | 1.49 |
| Total Households | 9,684 (100.0%) | 3.24 |
Household Size by Marriage Status in Lawndale
Out of a total of 9,684 households in Lawndale, 7,309 (75.5%) are family households, while 2,375 (24.5%) are nonfamily households. The most numerous type of family households are 2-person households, comprising 2,214, and the most common type of nonfamily households are 1-person households, comprising 1,658.
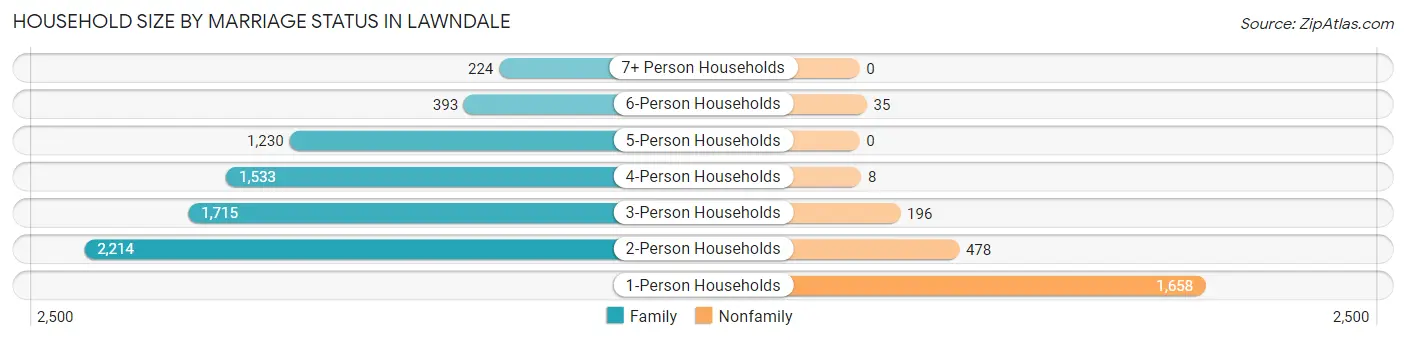
| Household Size | Family Households | Nonfamily Households |
| 1-Person Households | - | 1,658 (17.1%) |
| 2-Person Households | 2,214 (22.9%) | 478 (4.9%) |
| 3-Person Households | 1,715 (17.7%) | 196 (2.0%) |
| 4-Person Households | 1,533 (15.8%) | 8 (0.1%) |
| 5-Person Households | 1,230 (12.7%) | 0 (0.0%) |
| 6-Person Households | 393 (4.1%) | 35 (0.4%) |
| 7+ Person Households | 224 (2.3%) | 0 (0.0%) |
| Total | 7,309 (75.5%) | 2,375 (24.5%) |
Female Fertility in Lawndale
Fertility by Age in Lawndale
Average fertility rate in Lawndale is 40.0 births per 1,000 women. Women in the age bracket of 20 to 34 years have the highest fertility rate with 63.0 births per 1,000 women. Women in the age bracket of 20 to 34 years acount for 70.4% of all women with births.
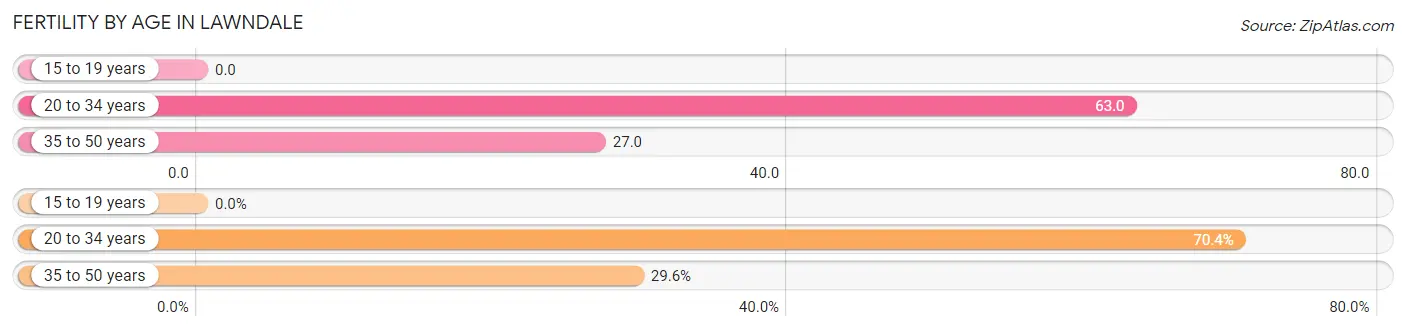
| Age Bracket | Women with Births | Births / 1,000 Women |
| 15 to 19 years | 0 (0.0%) | 0.0 |
| 20 to 34 years | 219 (70.4%) | 63.0 |
| 35 to 50 years | 92 (29.6%) | 27.0 |
| Total | 311 (100.0%) | 40.0 |
Fertility by Age by Marriage Status in Lawndale
54.0% of women with births (311) in Lawndale are married. The highest percentage of unmarried women with births falls into 20 to 34 years age bracket with 56.2% of them unmarried at the time of birth, while the lowest percentage of unmarried women with births belong to 35 to 50 years age bracket with 21.7% of them unmarried.
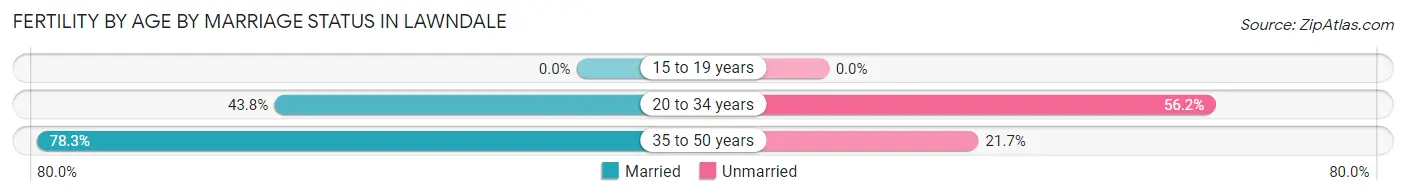
| Age Bracket | Married | Unmarried |
| 15 to 19 years | 0 (0.0%) | 0 (0.0%) |
| 20 to 34 years | 96 (43.8%) | 123 (56.2%) |
| 35 to 50 years | 72 (78.3%) | 20 (21.7%) |
| Total | 168 (54.0%) | 143 (46.0%) |
Fertility by Education in Lawndale
Average fertility rate in Lawndale is 40.0 births per 1,000 women. Women with the education attainment of high school diploma have the highest fertility rate of 91.0 births per 1,000 women, while women with the education attainment of bachelor's degree have the lowest fertility at 19.0 births per 1,000 women. Women with the education attainment of high school diploma represent 40.8% of all women with births.
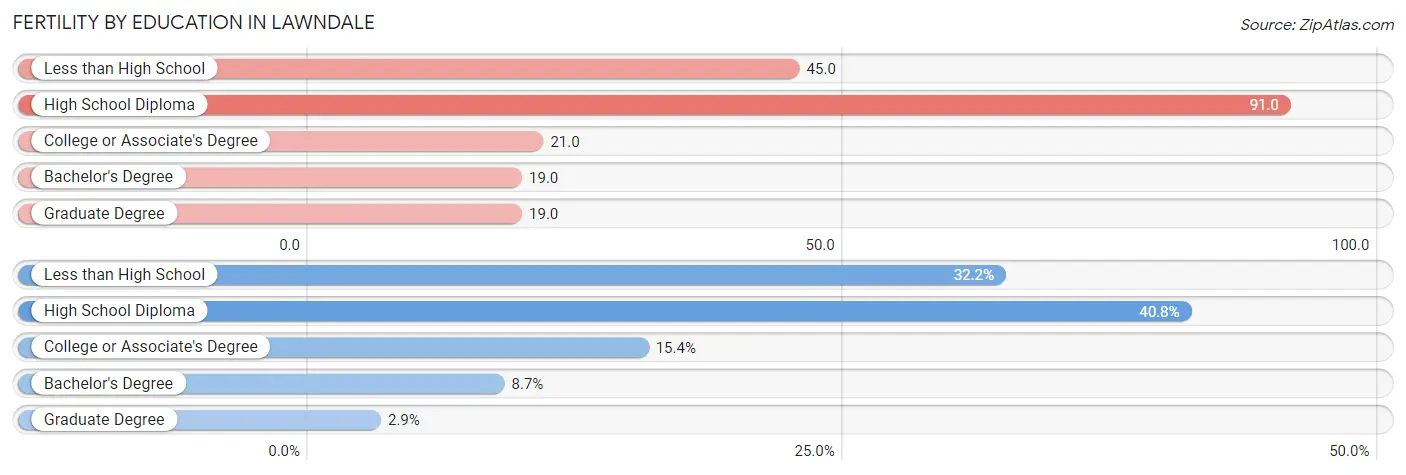
| Educational Attainment | Women with Births | Births / 1,000 Women |
| Less than High School | 100 (32.2%) | 45.0 |
| High School Diploma | 127 (40.8%) | 91.0 |
| College or Associate's Degree | 48 (15.4%) | 21.0 |
| Bachelor's Degree | 27 (8.7%) | 19.0 |
| Graduate Degree | 9 (2.9%) | 19.0 |
| Total | 311 (100.0%) | 40.0 |
Fertility by Education by Marriage Status in Lawndale
46.0% of women with births in Lawndale are unmarried. Women with the educational attainment of bachelor's degree are most likely to be married with 100.0% of them married at childbirth, while women with the educational attainment of less than high school are least likely to be married with 72.0% of them unmarried at childbirth.
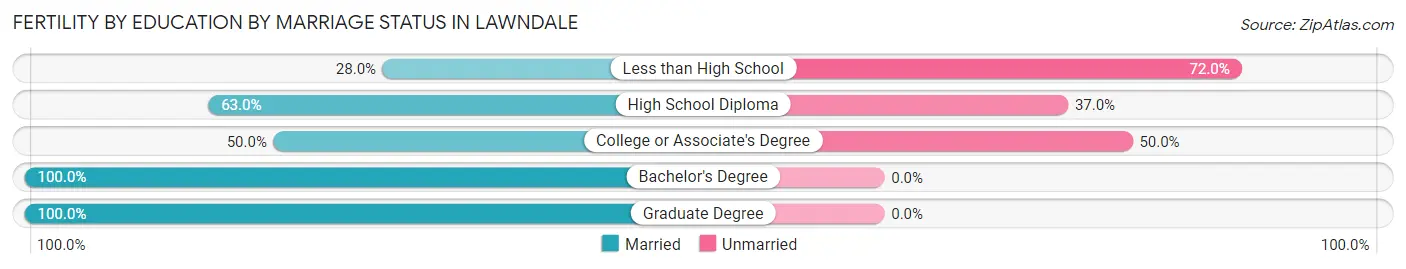
| Educational Attainment | Married | Unmarried |
| Less than High School | 28 (28.0%) | 72 (72.0%) |
| High School Diploma | 80 (63.0%) | 47 (37.0%) |
| College or Associate's Degree | 24 (50.0%) | 24 (50.0%) |
| Bachelor's Degree | 27 (100.0%) | 0 (0.0%) |
| Graduate Degree | 9 (100.0%) | 0 (0.0%) |
| Total | 168 (54.0%) | 143 (46.0%) |
Employment Characteristics in Lawndale
Employment by Class of Employer in Lawndale
Among the 16,116 employed individuals in Lawndale, private company employees (11,689 | 72.5%), local government employees (1,127 | 7.0%), and self-employed (not incorporated) (1,069 | 6.6%) make up the most common classes of employment.
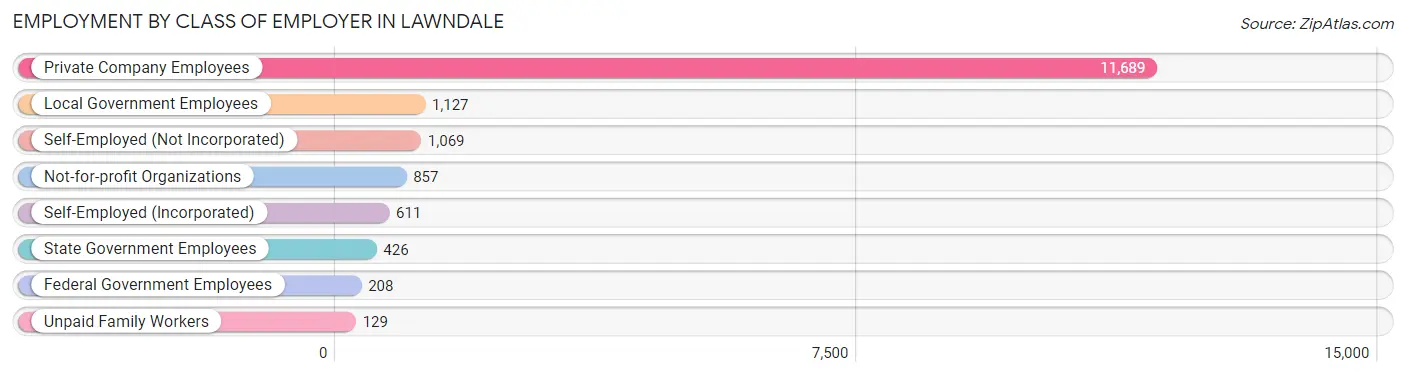
| Employer Class | # Employees | % Employees |
| Private Company Employees | 11,689 | 72.5% |
| Self-Employed (Incorporated) | 611 | 3.8% |
| Self-Employed (Not Incorporated) | 1,069 | 6.6% |
| Not-for-profit Organizations | 857 | 5.3% |
| Local Government Employees | 1,127 | 7.0% |
| State Government Employees | 426 | 2.6% |
| Federal Government Employees | 208 | 1.3% |
| Unpaid Family Workers | 129 | 0.8% |
| Total | 16,116 | 100.0% |
Employment Status by Age in Lawndale
According to the labor force statistics for Lawndale, out of the total population over 16 years of age (25,174), 72.6% or 18,276 individuals are in the labor force, with 8.3% or 1,517 of them unemployed. The age group with the highest labor force participation rate is 25 to 29 years, with 89.6% or 2,221 individuals in the labor force. Within the labor force, the 25 to 29 years age range has the highest percentage of unemployed individuals, with 17.5% or 389 of them being unemployed.
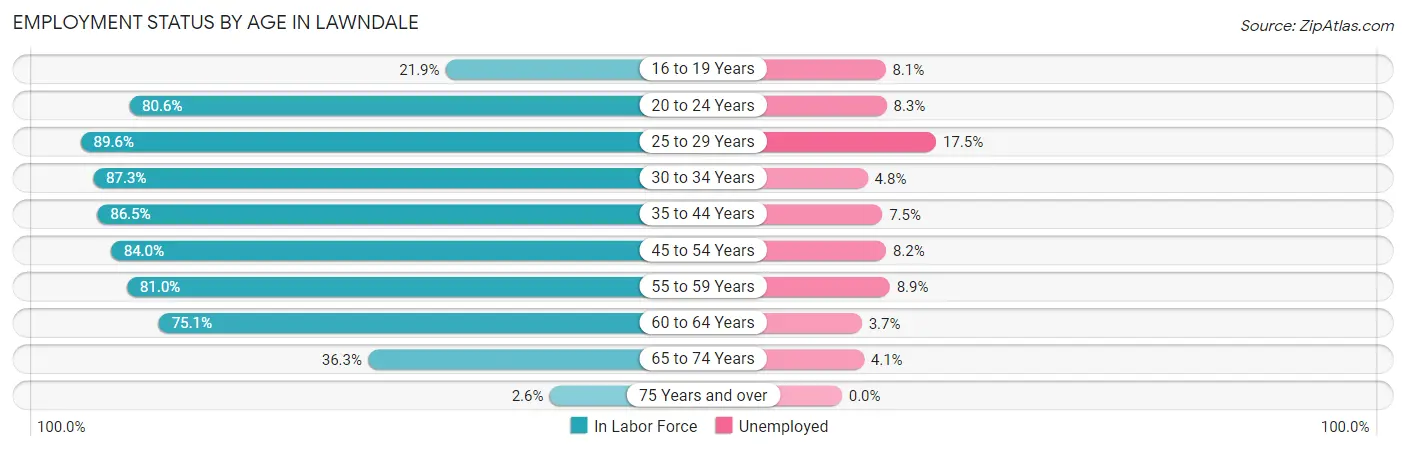
| Age Bracket | In Labor Force | Unemployed |
| 16 to 19 Years | 358 (21.9%) | 29 (8.1%) |
| 20 to 24 Years | 1,878 (80.6%) | 156 (8.3%) |
| 25 to 29 Years | 2,221 (89.6%) | 389 (17.5%) |
| 30 to 34 Years | 2,371 (87.3%) | 114 (4.8%) |
| 35 to 44 Years | 3,825 (86.5%) | 287 (7.5%) |
| 45 to 54 Years | 3,949 (84.0%) | 324 (8.2%) |
| 55 to 59 Years | 1,511 (81.0%) | 134 (8.9%) |
| 60 to 64 Years | 1,413 (75.1%) | 52 (3.7%) |
| 65 to 74 Years | 713 (36.3%) | 29 (4.1%) |
| 75 Years and over | 31 (2.6%) | 0 (0.0%) |
| Total | 18,276 (72.6%) | 1,517 (8.3%) |
Employment Status by Educational Attainment in Lawndale
According to labor force statistics for Lawndale, 84.6% of individuals (15,284) out of the total population between 25 and 64 years of age (18,066) are in the labor force, with 8.5% or 1,299 of them being unemployed. The group with the highest labor force participation rate are those with the educational attainment of bachelor's degree or higher, with 88.4% or 3,371 individuals in the labor force. Within the labor force, individuals with high school diploma education have the highest percentage of unemployment, with 16.7% or 685 of them being unemployed.
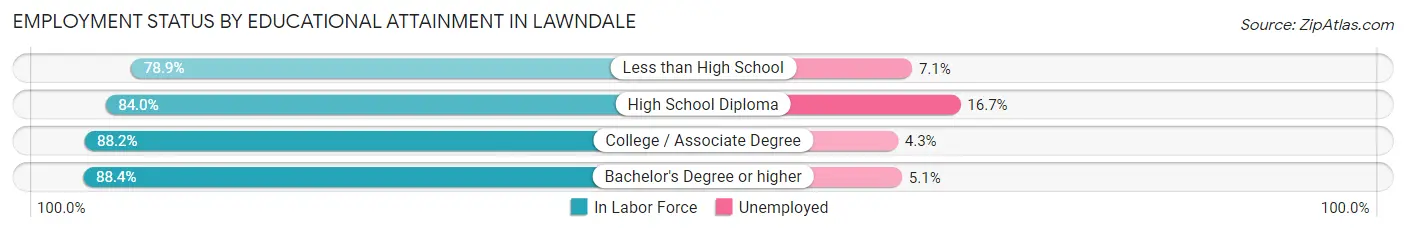
| Educational Attainment | In Labor Force | Unemployed |
| Less than High School | 3,818 (78.9%) | 344 (7.1%) |
| High School Diploma | 4,100 (84.0%) | 815 (16.7%) |
| College / Associate Degree | 3,998 (88.2%) | 195 (4.3%) |
| Bachelor's Degree or higher | 3,371 (88.4%) | 194 (5.1%) |
| Total | 15,284 (84.6%) | 1,536 (8.5%) |
Employment Occupations by Sex in Lawndale
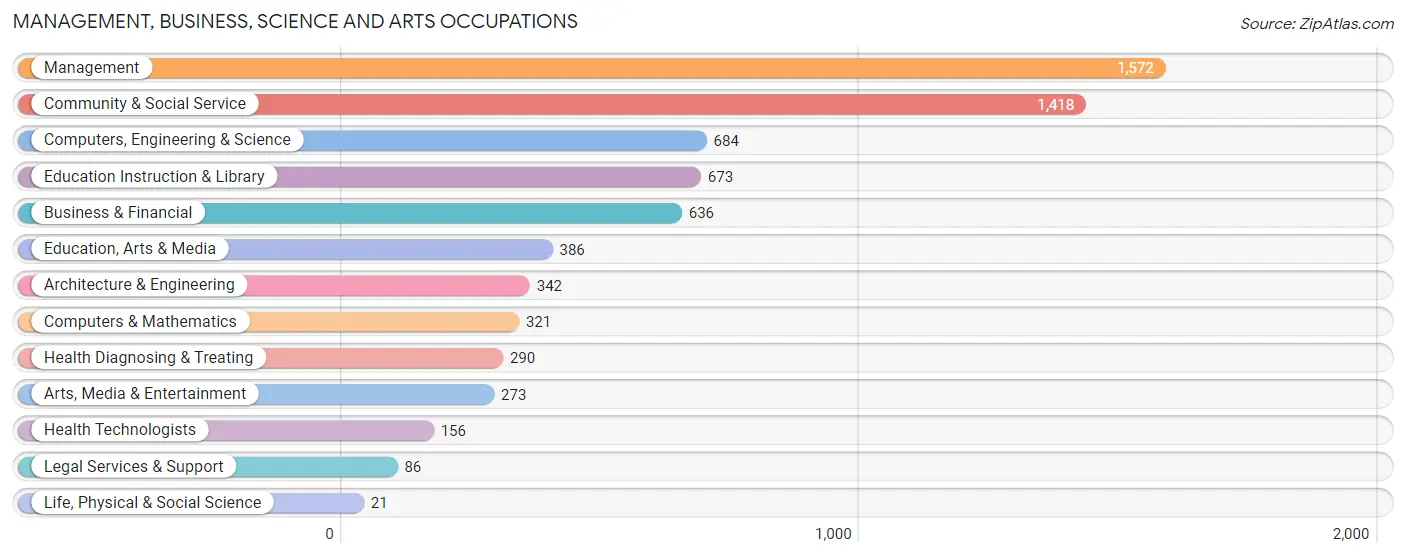
Management, Business, Science and Arts Occupations
The most common Management, Business, Science and Arts occupations in Lawndale are Management (1,572 | 9.4%), Community & Social Service (1,418 | 8.5%), Computers, Engineering & Science (684 | 4.1%), Education Instruction & Library (673 | 4.0%), and Business & Financial (636 | 3.8%).
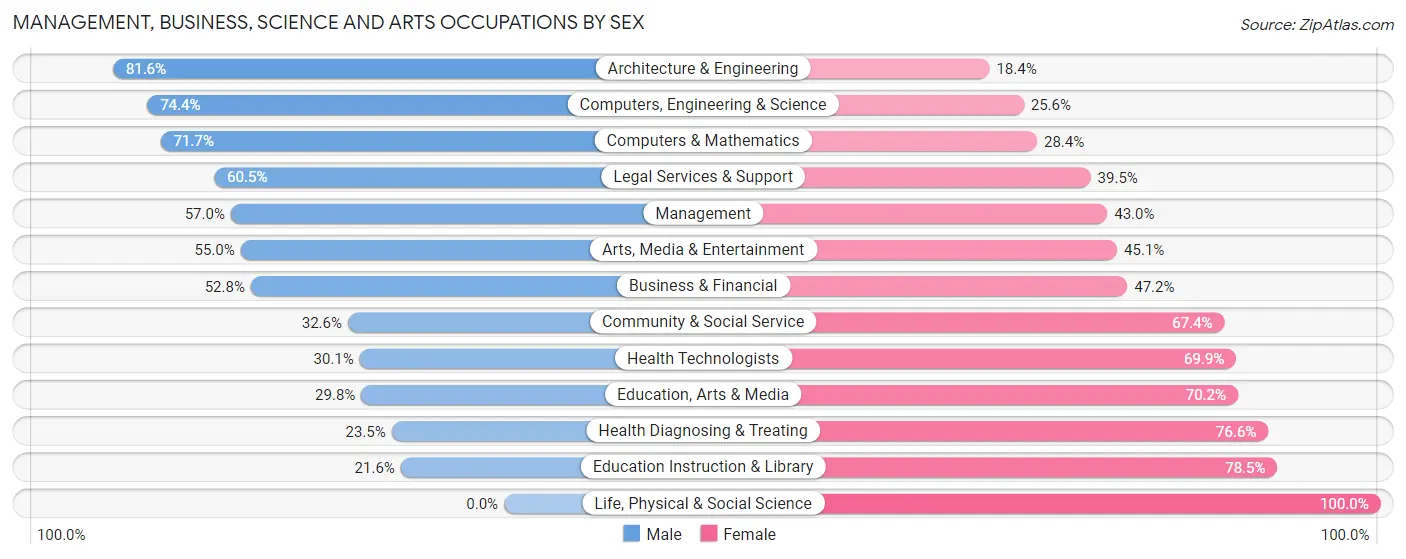
Management, Business, Science and Arts Occupations by Sex
Within the Management, Business, Science and Arts occupations in Lawndale, the most male-oriented occupations are Architecture & Engineering (81.6%), Computers, Engineering & Science (74.4%), and Computers & Mathematics (71.7%), while the most female-oriented occupations are Life, Physical & Social Science (100.0%), Education Instruction & Library (78.4%), and Health Diagnosing & Treating (76.5%).
| Occupation | Male | Female |
| Management | 896 (57.0%) | 676 (43.0%) |
| Business & Financial | 336 (52.8%) | 300 (47.2%) |
| Computers, Engineering & Science | 509 (74.4%) | 175 (25.6%) |
| Computers & Mathematics | 230 (71.7%) | 91 (28.3%) |
| Architecture & Engineering | 279 (81.6%) | 63 (18.4%) |
| Life, Physical & Social Science | 0 (0.0%) | 21 (100.0%) |
| Community & Social Service | 462 (32.6%) | 956 (67.4%) |
| Education, Arts & Media | 115 (29.8%) | 271 (70.2%) |
| Legal Services & Support | 52 (60.5%) | 34 (39.5%) |
| Education Instruction & Library | 145 (21.5%) | 528 (78.4%) |
| Arts, Media & Entertainment | 150 (54.9%) | 123 (45.1%) |
| Health Diagnosing & Treating | 68 (23.4%) | 222 (76.5%) |
| Health Technologists | 47 (30.1%) | 109 (69.9%) |
| Total (Category) | 2,271 (49.4%) | 2,329 (50.6%) |
| Total (Overall) | 9,708 (57.9%) | 7,048 (42.1%) |
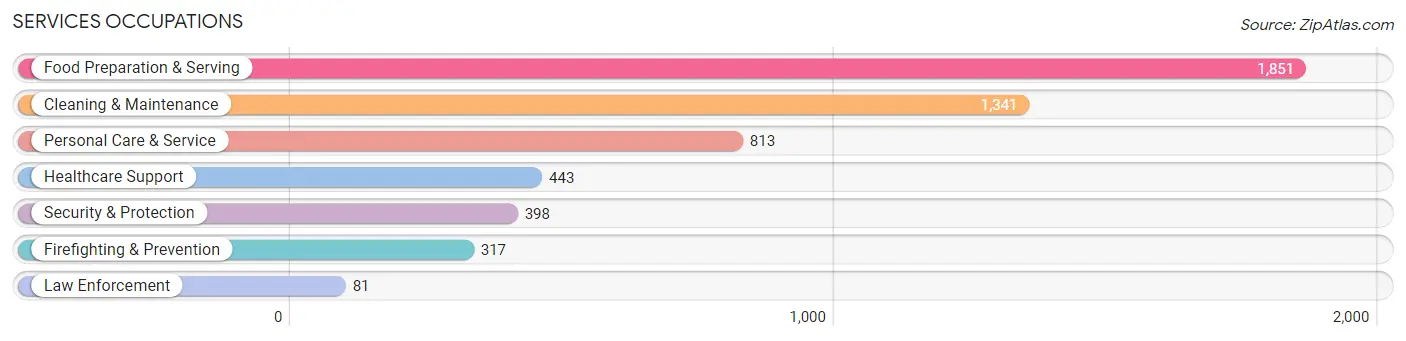
Services Occupations
The most common Services occupations in Lawndale are Food Preparation & Serving (1,851 | 11.1%), Cleaning & Maintenance (1,341 | 8.0%), Personal Care & Service (813 | 4.9%), Healthcare Support (443 | 2.6%), and Security & Protection (398 | 2.4%).
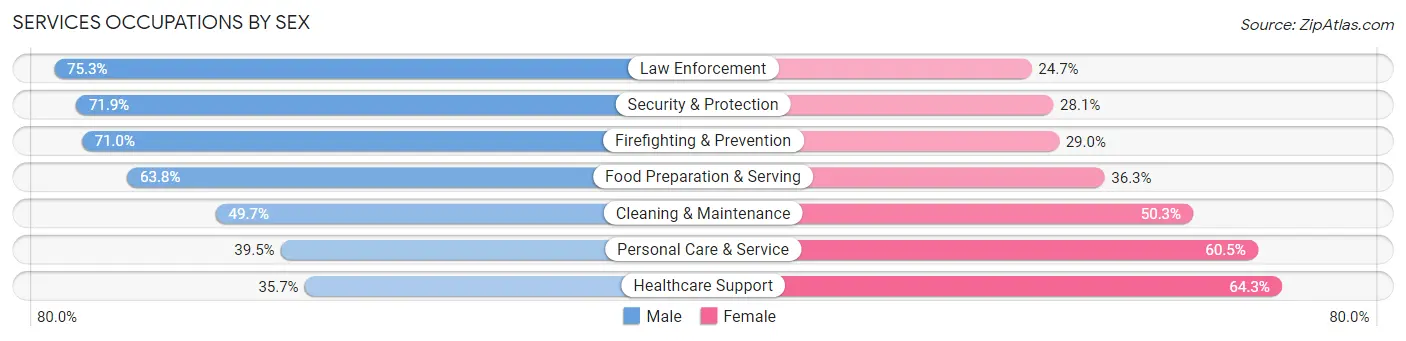
Services Occupations by Sex
Within the Services occupations in Lawndale, the most male-oriented occupations are Law Enforcement (75.3%), Security & Protection (71.9%), and Firefighting & Prevention (71.0%), while the most female-oriented occupations are Healthcare Support (64.3%), Personal Care & Service (60.5%), and Cleaning & Maintenance (50.3%).
| Occupation | Male | Female |
| Healthcare Support | 158 (35.7%) | 285 (64.3%) |
| Security & Protection | 286 (71.9%) | 112 (28.1%) |
| Firefighting & Prevention | 225 (71.0%) | 92 (29.0%) |
| Law Enforcement | 61 (75.3%) | 20 (24.7%) |
| Food Preparation & Serving | 1,180 (63.7%) | 671 (36.2%) |
| Cleaning & Maintenance | 667 (49.7%) | 674 (50.3%) |
| Personal Care & Service | 321 (39.5%) | 492 (60.5%) |
| Total (Category) | 2,612 (53.9%) | 2,234 (46.1%) |
| Total (Overall) | 9,708 (57.9%) | 7,048 (42.1%) |
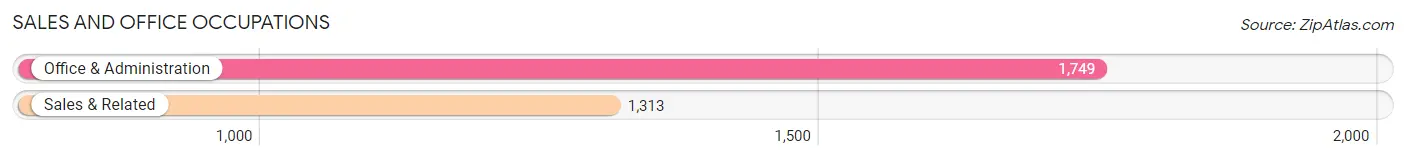
Sales and Office Occupations
The most common Sales and Office occupations in Lawndale are Office & Administration (1,749 | 10.4%), and Sales & Related (1,313 | 7.8%).
Sales and Office Occupations by Sex
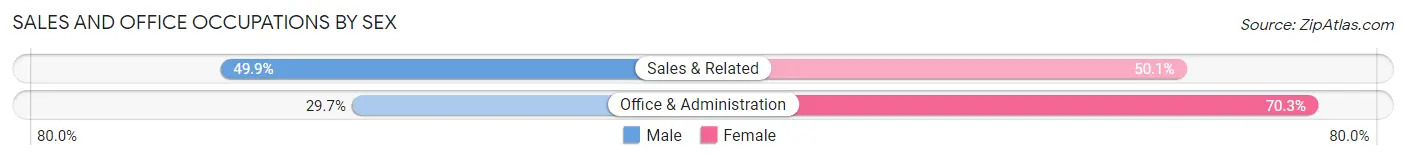
| Occupation | Male | Female |
| Sales & Related | 655 (49.9%) | 658 (50.1%) |
| Office & Administration | 519 (29.7%) | 1,230 (70.3%) |
| Total (Category) | 1,174 (38.3%) | 1,888 (61.7%) |
| Total (Overall) | 9,708 (57.9%) | 7,048 (42.1%) |
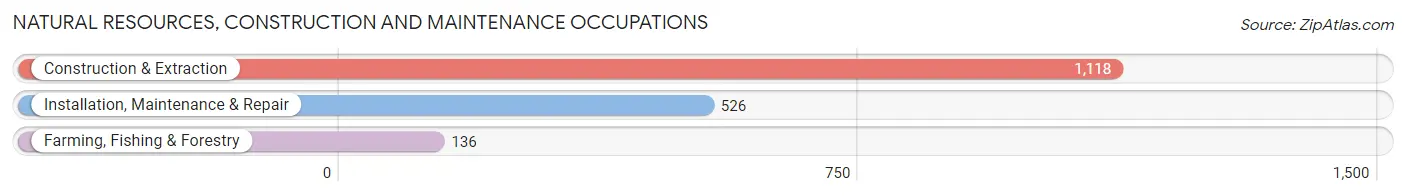
Natural Resources, Construction and Maintenance Occupations
The most common Natural Resources, Construction and Maintenance occupations in Lawndale are Construction & Extraction (1,118 | 6.7%), Installation, Maintenance & Repair (526 | 3.1%), and Farming, Fishing & Forestry (136 | 0.8%).
Natural Resources, Construction and Maintenance Occupations by Sex
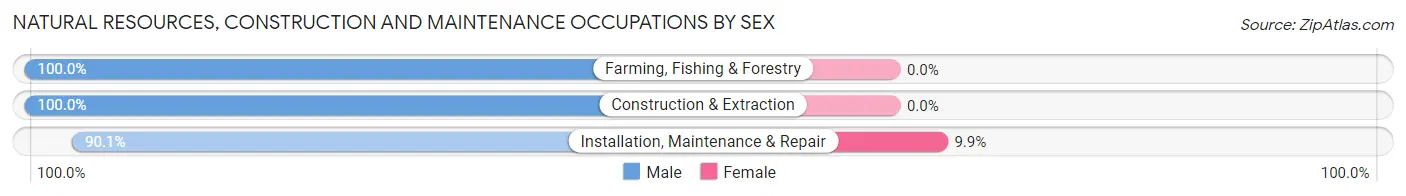
| Occupation | Male | Female |
| Farming, Fishing & Forestry | 136 (100.0%) | 0 (0.0%) |
| Construction & Extraction | 1,118 (100.0%) | 0 (0.0%) |
| Installation, Maintenance & Repair | 474 (90.1%) | 52 (9.9%) |
| Total (Category) | 1,728 (97.1%) | 52 (2.9%) |
| Total (Overall) | 9,708 (57.9%) | 7,048 (42.1%) |
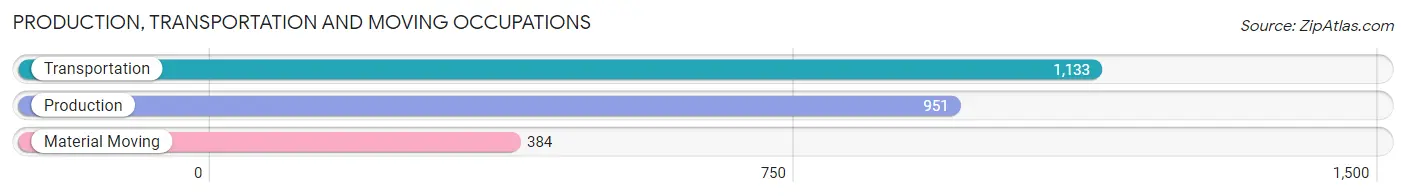
Production, Transportation and Moving Occupations
The most common Production, Transportation and Moving occupations in Lawndale are Transportation (1,133 | 6.8%), Production (951 | 5.7%), and Material Moving (384 | 2.3%).
Production, Transportation and Moving Occupations by Sex
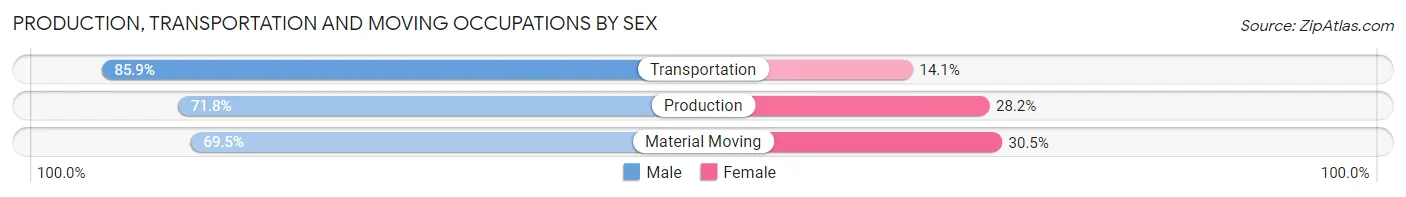
| Occupation | Male | Female |
| Production | 683 (71.8%) | 268 (28.2%) |
| Transportation | 973 (85.9%) | 160 (14.1%) |
| Material Moving | 267 (69.5%) | 117 (30.5%) |
| Total (Category) | 1,923 (77.9%) | 545 (22.1%) |
| Total (Overall) | 9,708 (57.9%) | 7,048 (42.1%) |
Employment Industries by Sex in Lawndale
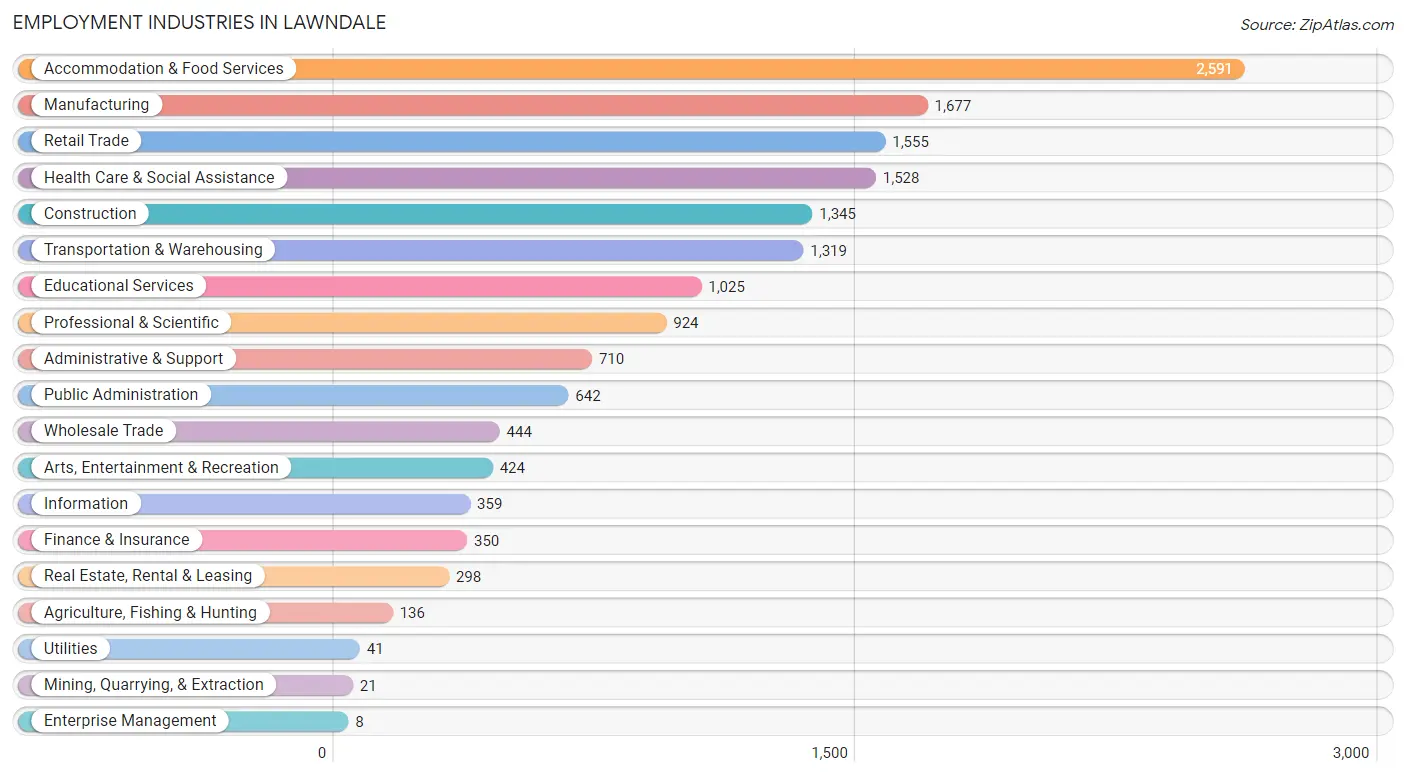
Employment Industries in Lawndale
The major employment industries in Lawndale include Accommodation & Food Services (2,591 | 15.5%), Manufacturing (1,677 | 10.0%), Retail Trade (1,555 | 9.3%), Health Care & Social Assistance (1,528 | 9.1%), and Construction (1,345 | 8.0%).
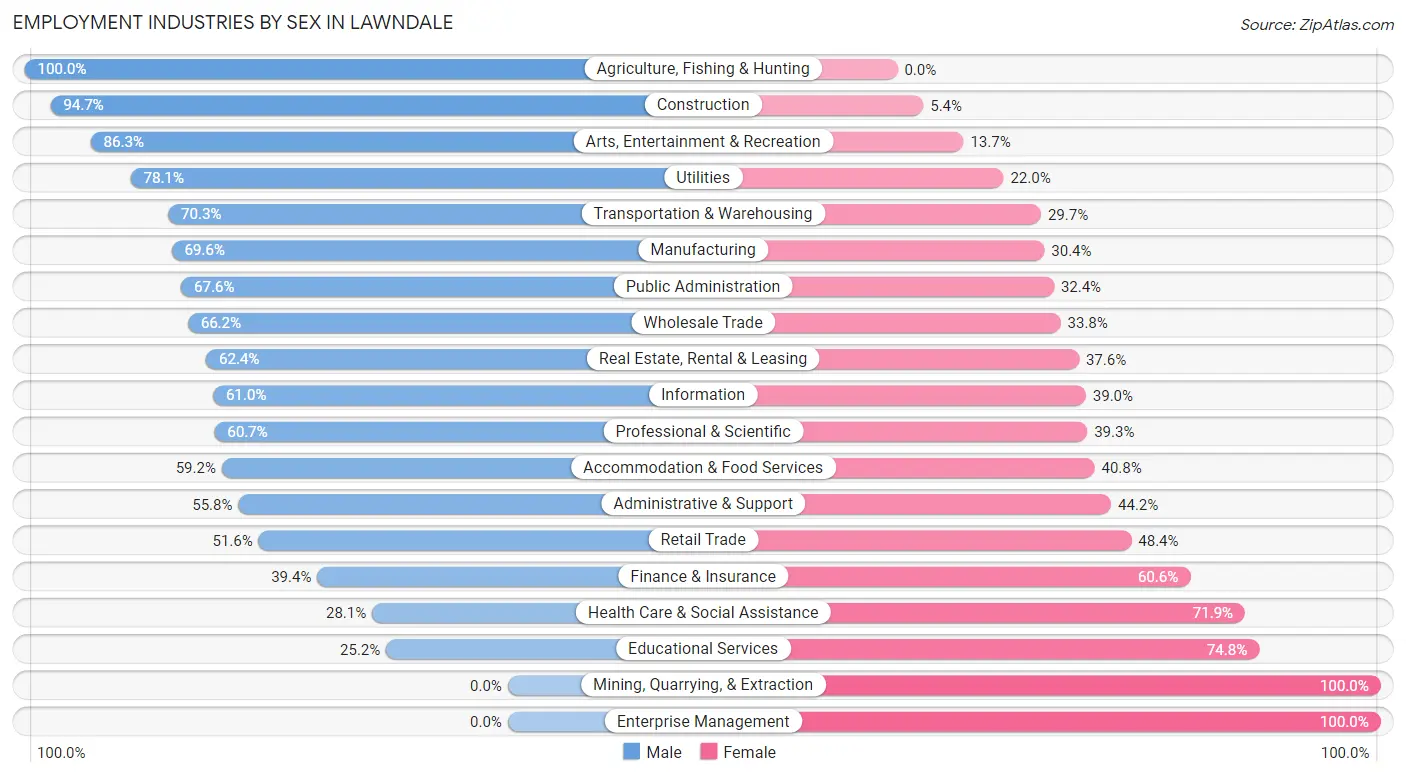
Employment Industries by Sex in Lawndale
The Lawndale industries that see more men than women are Agriculture, Fishing & Hunting (100.0%), Construction (94.7%), and Arts, Entertainment & Recreation (86.3%), whereas the industries that tend to have a higher number of women are Mining, Quarrying, & Extraction (100.0%), Enterprise Management (100.0%), and Educational Services (74.8%).
| Industry | Male | Female |
| Agriculture, Fishing & Hunting | 136 (100.0%) | 0 (0.0%) |
| Mining, Quarrying, & Extraction | 0 (0.0%) | 21 (100.0%) |
| Construction | 1,273 (94.7%) | 72 (5.3%) |
| Manufacturing | 1,167 (69.6%) | 510 (30.4%) |
| Wholesale Trade | 294 (66.2%) | 150 (33.8%) |
| Retail Trade | 802 (51.6%) | 753 (48.4%) |
| Transportation & Warehousing | 927 (70.3%) | 392 (29.7%) |
| Utilities | 32 (78.0%) | 9 (22.0%) |
| Information | 219 (61.0%) | 140 (39.0%) |
| Finance & Insurance | 138 (39.4%) | 212 (60.6%) |
| Real Estate, Rental & Leasing | 186 (62.4%) | 112 (37.6%) |
| Professional & Scientific | 561 (60.7%) | 363 (39.3%) |
| Enterprise Management | 0 (0.0%) | 8 (100.0%) |
| Administrative & Support | 396 (55.8%) | 314 (44.2%) |
| Educational Services | 258 (25.2%) | 767 (74.8%) |
| Health Care & Social Assistance | 429 (28.1%) | 1,099 (71.9%) |
| Arts, Entertainment & Recreation | 366 (86.3%) | 58 (13.7%) |
| Accommodation & Food Services | 1,534 (59.2%) | 1,057 (40.8%) |
| Public Administration | 434 (67.6%) | 208 (32.4%) |
| Total | 9,708 (57.9%) | 7,048 (42.1%) |
Education in Lawndale
School Enrollment in Lawndale
The most common levels of schooling among the 8,449 students in Lawndale are high school (2,270 | 26.9%), college / undergraduate (2,120 | 25.1%), and middle school (1,544 | 18.3%).
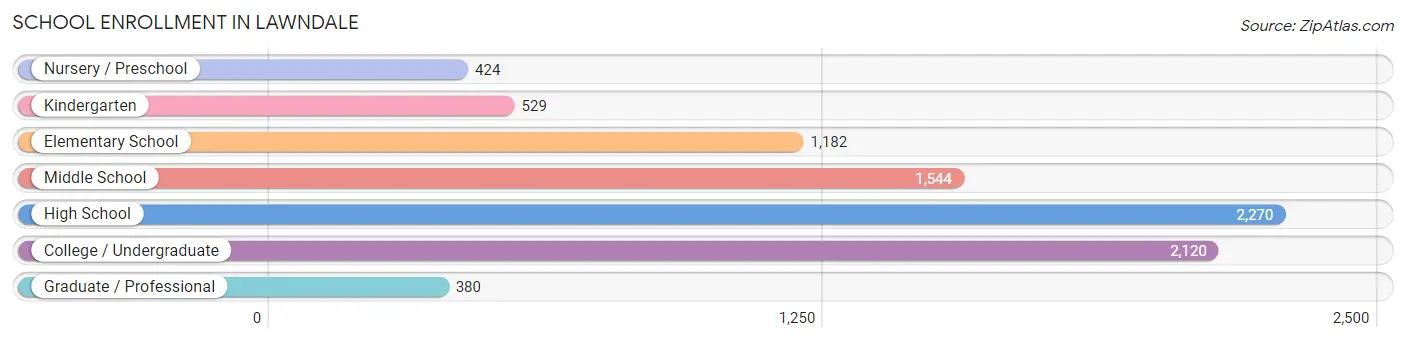
| School Level | # Students | % Students |
| Nursery / Preschool | 424 | 5.0% |
| Kindergarten | 529 | 6.3% |
| Elementary School | 1,182 | 14.0% |
| Middle School | 1,544 | 18.3% |
| High School | 2,270 | 26.9% |
| College / Undergraduate | 2,120 | 25.1% |
| Graduate / Professional | 380 | 4.5% |
| Total | 8,449 | 100.0% |
School Enrollment by Age by Funding Source in Lawndale
Out of a total of 8,449 students who are enrolled in schools in Lawndale, 769 (9.1%) attend a private institution, while the remaining 7,680 (90.9%) are enrolled in public schools. The age group of 35 years and over has the highest likelihood of being enrolled in private schools, with 157 (24.3% in the age bracket) enrolled. Conversely, the age group of 25 to 34 year olds has the lowest likelihood of being enrolled in a private school, with 435 (97.1% in the age bracket) attending a public institution.
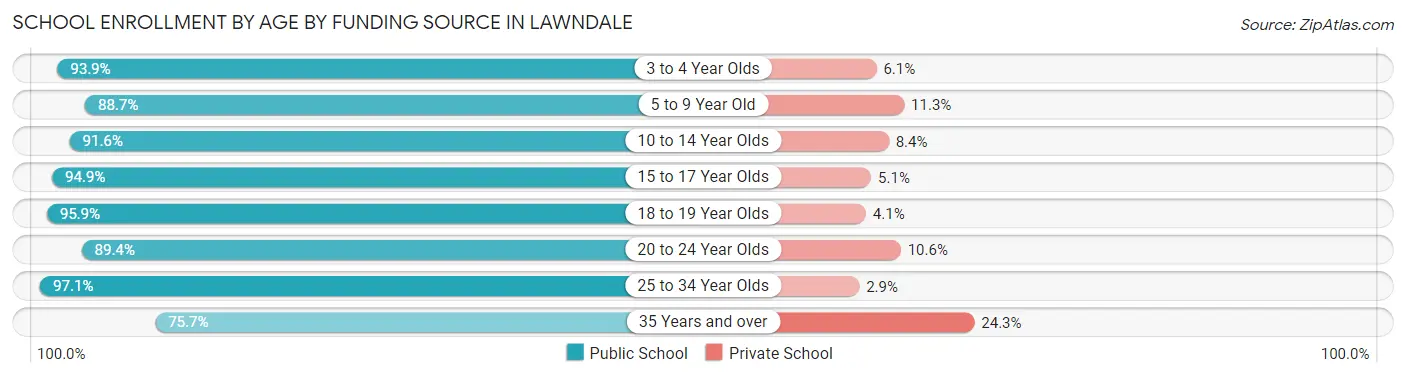
| Age Bracket | Public School | Private School |
| 3 to 4 Year Olds | 446 (93.9%) | 29 (6.1%) |
| 5 to 9 Year Old | 1,323 (88.7%) | 168 (11.3%) |
| 10 to 14 Year Olds | 1,955 (91.6%) | 179 (8.4%) |
| 15 to 17 Year Olds | 1,464 (94.9%) | 79 (5.1%) |
| 18 to 19 Year Olds | 533 (95.9%) | 23 (4.1%) |
| 20 to 24 Year Olds | 1,034 (89.4%) | 123 (10.6%) |
| 25 to 34 Year Olds | 435 (97.1%) | 13 (2.9%) |
| 35 Years and over | 488 (75.7%) | 157 (24.3%) |
| Total | 7,680 (90.9%) | 769 (9.1%) |
Educational Attainment by Field of Study in Lawndale
Business (996 | 21.8%), engineering (511 | 11.2%), arts & humanities (429 | 9.4%), science & technology (423 | 9.2%), and social sciences (394 | 8.6%) are the most common fields of study among 4,572 individuals in Lawndale who have obtained a bachelor's degree or higher.
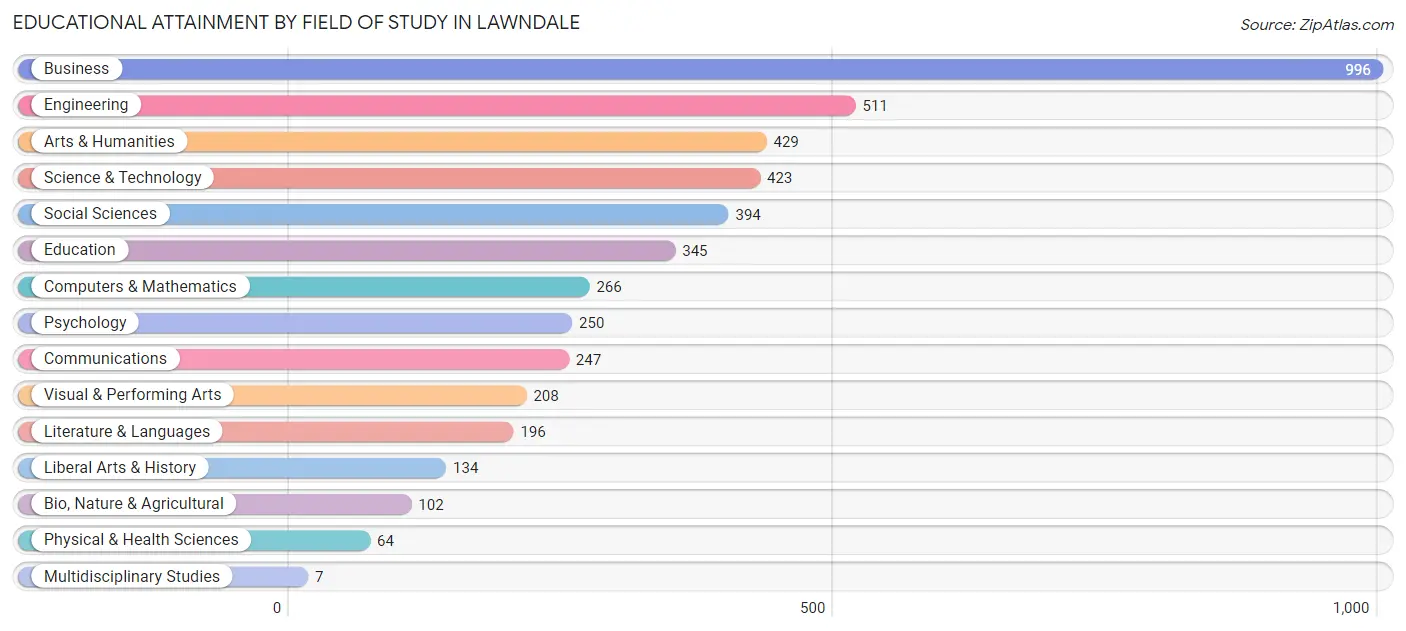
| Field of Study | # Graduates | % Graduates |
| Computers & Mathematics | 266 | 5.8% |
| Bio, Nature & Agricultural | 102 | 2.2% |
| Physical & Health Sciences | 64 | 1.4% |
| Psychology | 250 | 5.5% |
| Social Sciences | 394 | 8.6% |
| Engineering | 511 | 11.2% |
| Multidisciplinary Studies | 7 | 0.2% |
| Science & Technology | 423 | 9.2% |
| Business | 996 | 21.8% |
| Education | 345 | 7.5% |
| Literature & Languages | 196 | 4.3% |
| Liberal Arts & History | 134 | 2.9% |
| Visual & Performing Arts | 208 | 4.5% |
| Communications | 247 | 5.4% |
| Arts & Humanities | 429 | 9.4% |
| Total | 4,572 | 100.0% |
Transportation & Commute in Lawndale
Vehicle Availability by Sex in Lawndale
The most prevalent vehicle ownership categories in Lawndale are males with 2 vehicles (3,965, accounting for 42.0%) and females with 2 vehicles (2,761, making up 59.5%).
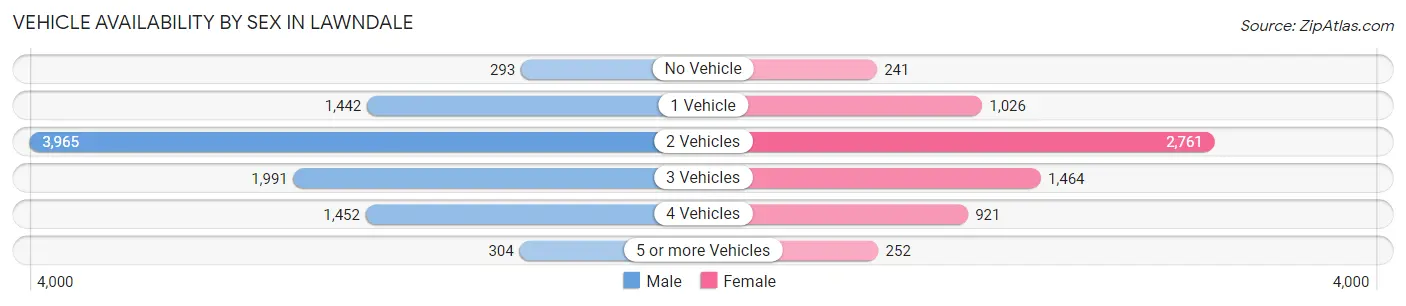
| Vehicles Available | Male | Female |
| No Vehicle | 293 (3.1%) | 241 (3.6%) |
| 1 Vehicle | 1,442 (15.3%) | 1,026 (15.4%) |
| 2 Vehicles | 3,965 (42.0%) | 2,761 (41.4%) |
| 3 Vehicles | 1,991 (21.1%) | 1,464 (22.0%) |
| 4 Vehicles | 1,452 (15.4%) | 921 (13.8%) |
| 5 or more Vehicles | 304 (3.2%) | 252 (3.8%) |
| Total | 9,447 (100.0%) | 6,665 (100.0%) |
Commute Time in Lawndale
The most frequently occuring commute durations in Lawndale are 15 to 19 minutes (3,045 commuters, 20.0%), 10 to 14 minutes (2,470 commuters, 16.3%), and 20 to 24 minutes (2,362 commuters, 15.5%).
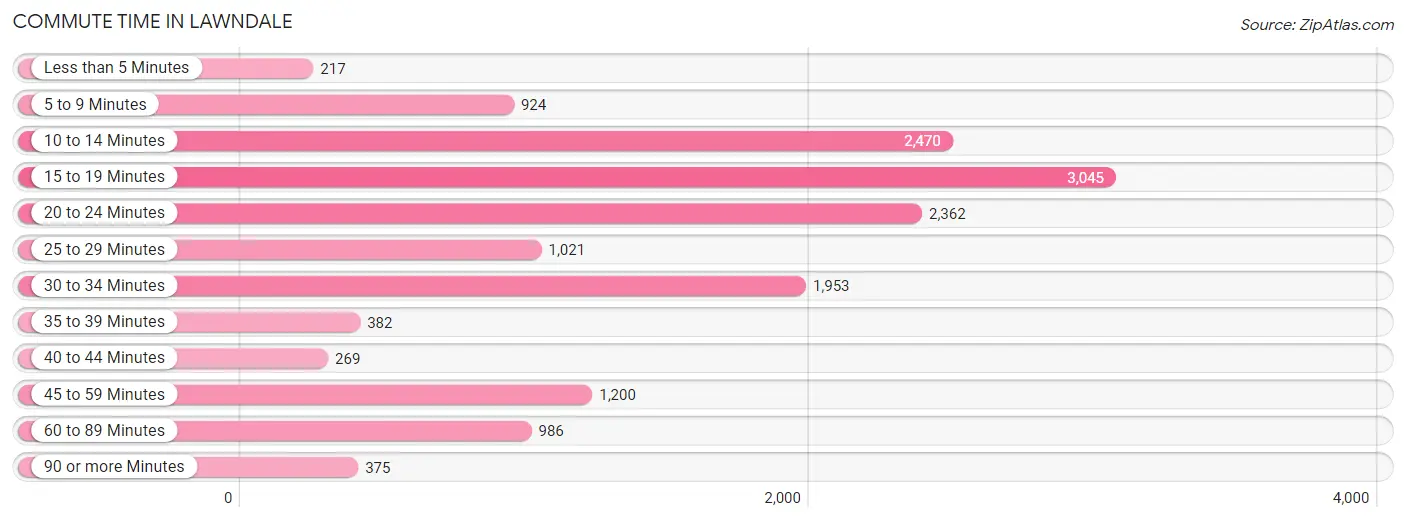
| Commute Time | # Commuters | % Commuters |
| Less than 5 Minutes | 217 | 1.4% |
| 5 to 9 Minutes | 924 | 6.1% |
| 10 to 14 Minutes | 2,470 | 16.3% |
| 15 to 19 Minutes | 3,045 | 20.0% |
| 20 to 24 Minutes | 2,362 | 15.5% |
| 25 to 29 Minutes | 1,021 | 6.7% |
| 30 to 34 Minutes | 1,953 | 12.9% |
| 35 to 39 Minutes | 382 | 2.5% |
| 40 to 44 Minutes | 269 | 1.8% |
| 45 to 59 Minutes | 1,200 | 7.9% |
| 60 to 89 Minutes | 986 | 6.5% |
| 90 or more Minutes | 375 | 2.5% |
Commute Time by Sex in Lawndale
The most common commute times in Lawndale are 10 to 14 minutes (1,593 commuters, 17.7%) for males and 15 to 19 minutes (1,479 commuters, 23.8%) for females.
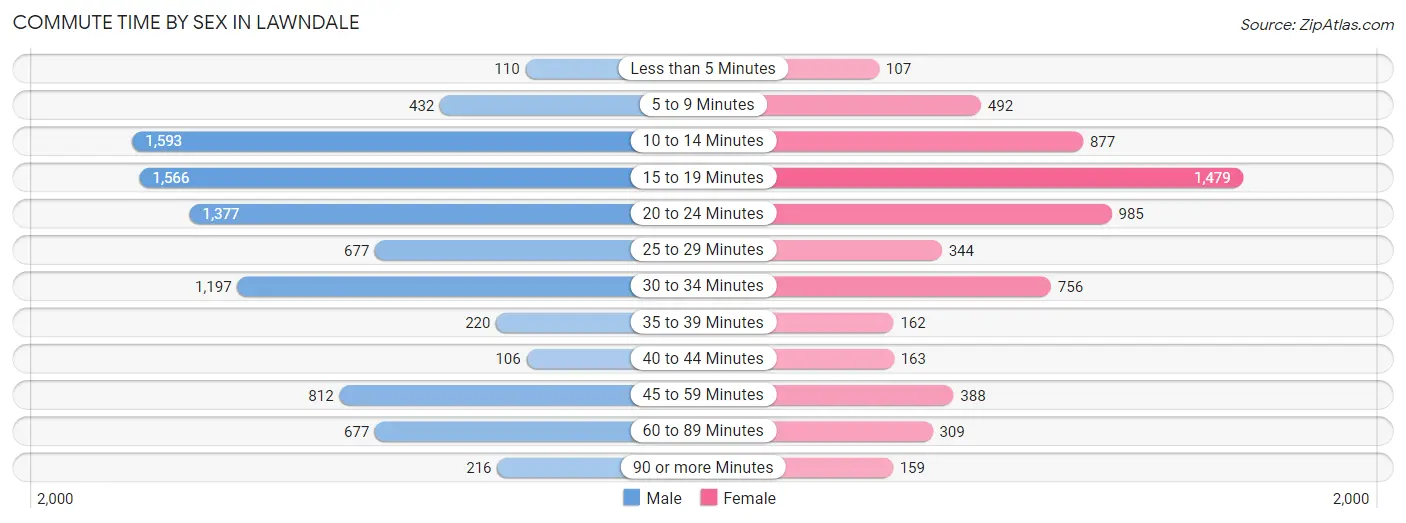
| Commute Time | Male | Female |
| Less than 5 Minutes | 110 (1.2%) | 107 (1.7%) |
| 5 to 9 Minutes | 432 (4.8%) | 492 (7.9%) |
| 10 to 14 Minutes | 1,593 (17.7%) | 877 (14.1%) |
| 15 to 19 Minutes | 1,566 (17.4%) | 1,479 (23.8%) |
| 20 to 24 Minutes | 1,377 (15.3%) | 985 (15.8%) |
| 25 to 29 Minutes | 677 (7.5%) | 344 (5.5%) |
| 30 to 34 Minutes | 1,197 (13.3%) | 756 (12.1%) |
| 35 to 39 Minutes | 220 (2.5%) | 162 (2.6%) |
| 40 to 44 Minutes | 106 (1.2%) | 163 (2.6%) |
| 45 to 59 Minutes | 812 (9.0%) | 388 (6.2%) |
| 60 to 89 Minutes | 677 (7.5%) | 309 (5.0%) |
| 90 or more Minutes | 216 (2.4%) | 159 (2.6%) |
Time of Departure to Work by Sex in Lawndale
The most frequent times of departure to work in Lawndale are 7:00 AM to 7:29 AM (1,189, 13.2%) for males and 8:00 AM to 8:29 AM (981, 15.8%) for females.
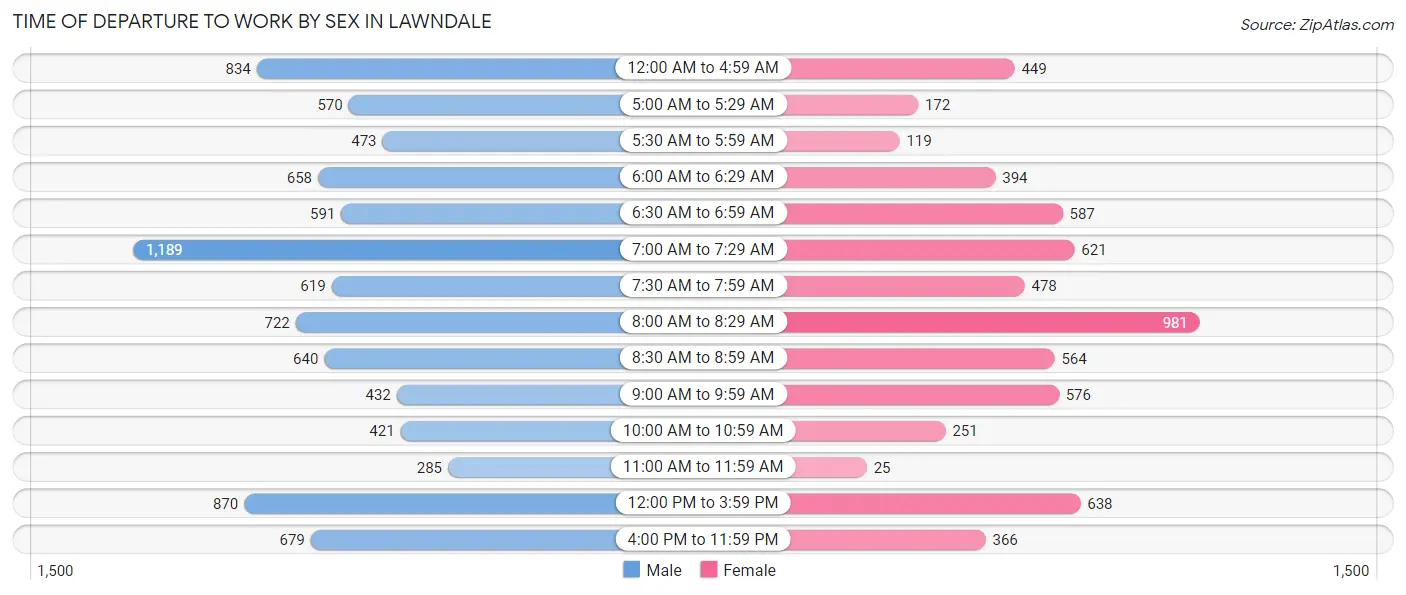
| Time of Departure | Male | Female |
| 12:00 AM to 4:59 AM | 834 (9.3%) | 449 (7.2%) |
| 5:00 AM to 5:29 AM | 570 (6.4%) | 172 (2.8%) |
| 5:30 AM to 5:59 AM | 473 (5.3%) | 119 (1.9%) |
| 6:00 AM to 6:29 AM | 658 (7.3%) | 394 (6.3%) |
| 6:30 AM to 6:59 AM | 591 (6.6%) | 587 (9.4%) |
| 7:00 AM to 7:29 AM | 1,189 (13.2%) | 621 (10.0%) |
| 7:30 AM to 7:59 AM | 619 (6.9%) | 478 (7.7%) |
| 8:00 AM to 8:29 AM | 722 (8.0%) | 981 (15.8%) |
| 8:30 AM to 8:59 AM | 640 (7.1%) | 564 (9.1%) |
| 9:00 AM to 9:59 AM | 432 (4.8%) | 576 (9.3%) |
| 10:00 AM to 10:59 AM | 421 (4.7%) | 251 (4.0%) |
| 11:00 AM to 11:59 AM | 285 (3.2%) | 25 (0.4%) |
| 12:00 PM to 3:59 PM | 870 (9.7%) | 638 (10.3%) |
| 4:00 PM to 11:59 PM | 679 (7.6%) | 366 (5.9%) |
| Total | 8,983 (100.0%) | 6,221 (100.0%) |
Housing Occupancy in Lawndale
Occupancy by Ownership in Lawndale
Of the total 9,684 dwellings in Lawndale, owner-occupied units account for 3,580 (37.0%), while renter-occupied units make up 6,104 (63.0%).
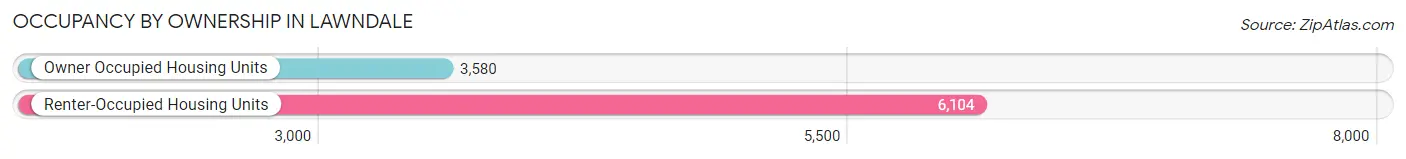
| Occupancy | # Housing Units | % Housing Units |
| Owner Occupied Housing Units | 3,580 | 37.0% |
| Renter-Occupied Housing Units | 6,104 | 63.0% |
| Total Occupied Housing Units | 9,684 | 100.0% |
Occupancy by Household Size in Lawndale
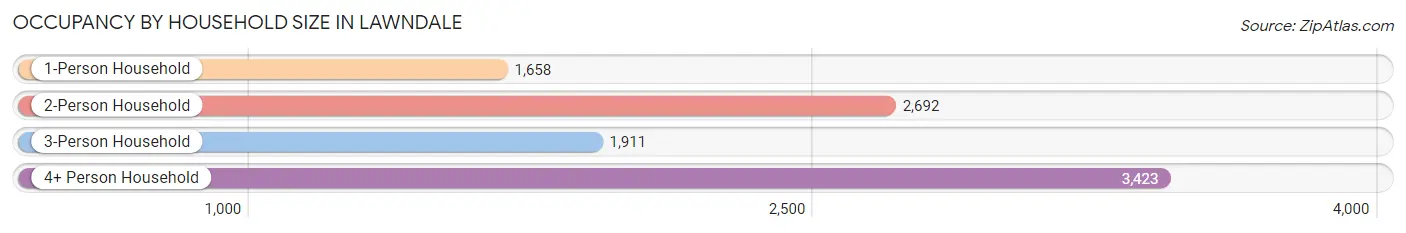
| Household Size | # Housing Units | % Housing Units |
| 1-Person Household | 1,658 | 17.1% |
| 2-Person Household | 2,692 | 27.8% |
| 3-Person Household | 1,911 | 19.7% |
| 4+ Person Household | 3,423 | 35.3% |
| Total Housing Units | 9,684 | 100.0% |
Occupancy by Ownership by Household Size in Lawndale
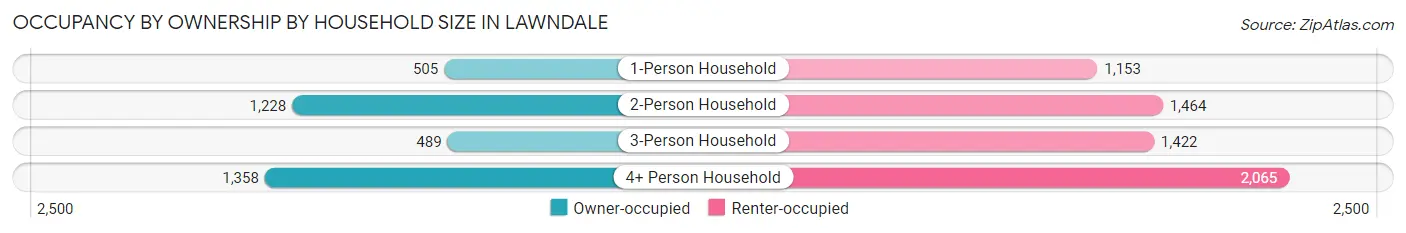
| Household Size | Owner-occupied | Renter-occupied |
| 1-Person Household | 505 (30.5%) | 1,153 (69.5%) |
| 2-Person Household | 1,228 (45.6%) | 1,464 (54.4%) |
| 3-Person Household | 489 (25.6%) | 1,422 (74.4%) |
| 4+ Person Household | 1,358 (39.7%) | 2,065 (60.3%) |
| Total Housing Units | 3,580 (37.0%) | 6,104 (63.0%) |
Occupancy by Educational Attainment in Lawndale
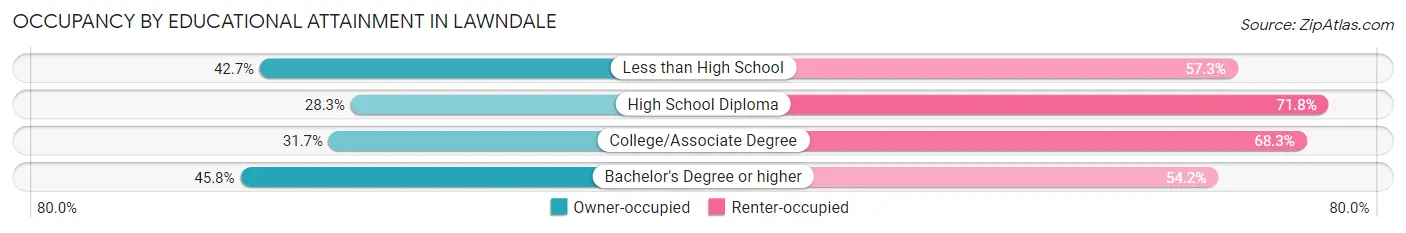
| Household Size | Owner-occupied | Renter-occupied |
| Less than High School | 1,002 (42.7%) | 1,346 (57.3%) |
| High School Diploma | 617 (28.2%) | 1,567 (71.8%) |
| College/Associate Degree | 899 (31.7%) | 1,933 (68.3%) |
| Bachelor's Degree or higher | 1,062 (45.8%) | 1,258 (54.2%) |
Occupancy by Age of Householder in Lawndale
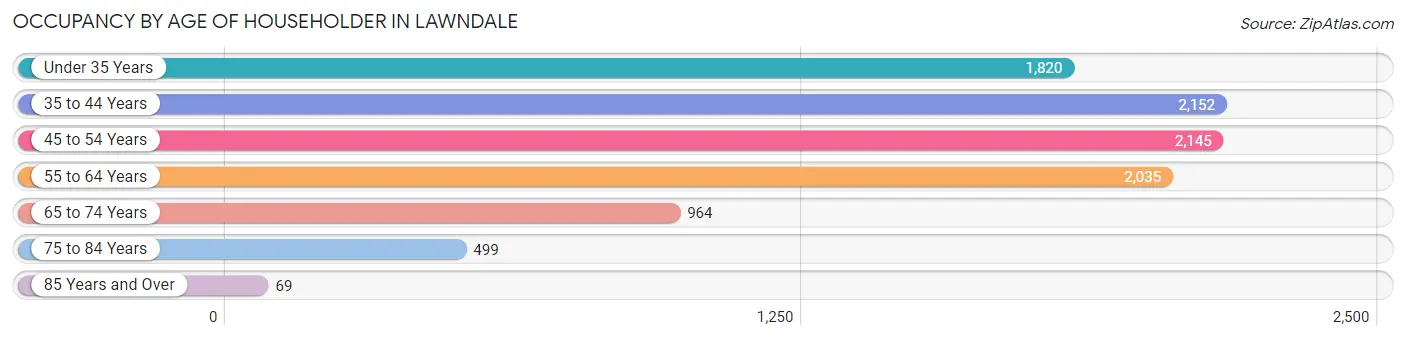
| Age Bracket | # Households | % Households |
| Under 35 Years | 1,820 | 18.8% |
| 35 to 44 Years | 2,152 | 22.2% |
| 45 to 54 Years | 2,145 | 22.2% |
| 55 to 64 Years | 2,035 | 21.0% |
| 65 to 74 Years | 964 | 10.0% |
| 75 to 84 Years | 499 | 5.1% |
| 85 Years and Over | 69 | 0.7% |
| Total | 9,684 | 100.0% |
Housing Finances in Lawndale
Median Income by Occupancy in Lawndale
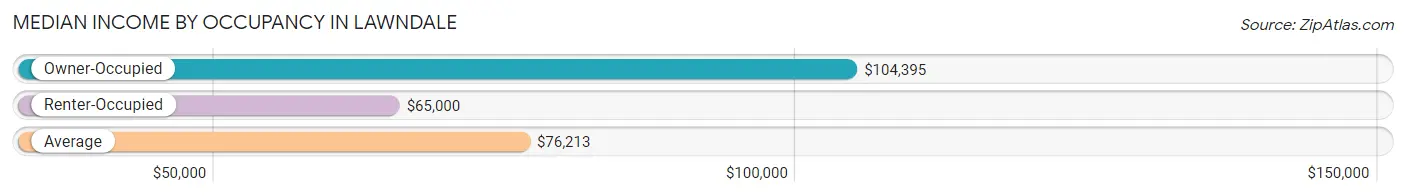
| Occupancy Type | # Households | Median Income |
| Owner-Occupied | 3,580 (37.0%) | $104,395 |
| Renter-Occupied | 6,104 (63.0%) | $65,000 |
| Average | 9,684 (100.0%) | $76,213 |
Occupancy by Householder Income Bracket in Lawndale
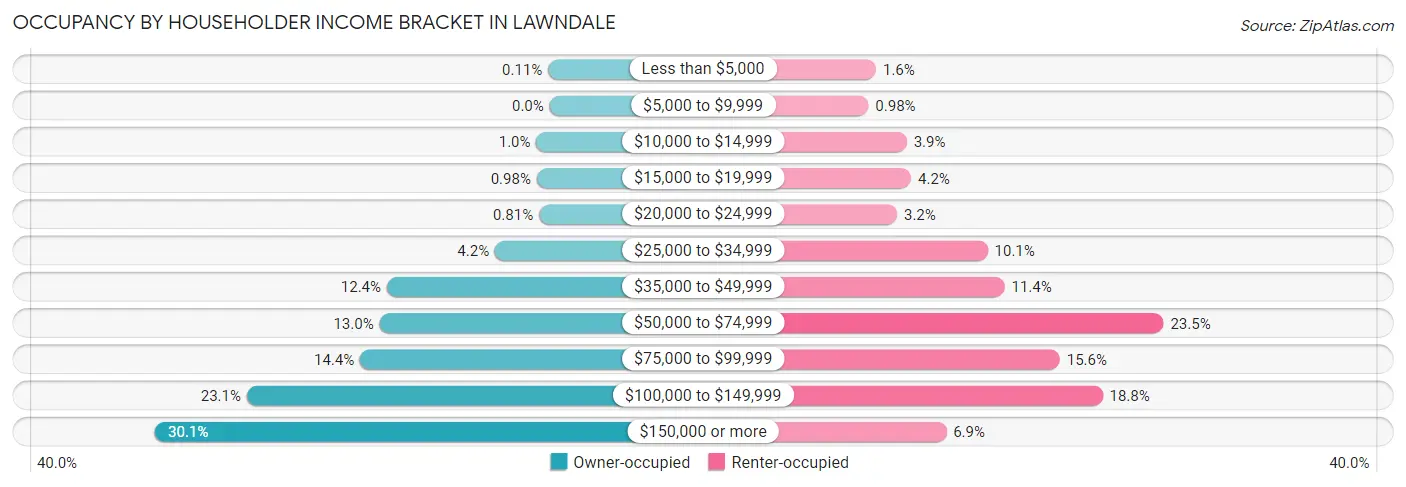
| Income Bracket | Owner-occupied | Renter-occupied |
| Less than $5,000 | 4 (0.1%) | 95 (1.6%) |
| $5,000 to $9,999 | 0 (0.0%) | 60 (1.0%) |
| $10,000 to $14,999 | 36 (1.0%) | 238 (3.9%) |
| $15,000 to $19,999 | 35 (1.0%) | 258 (4.2%) |
| $20,000 to $24,999 | 29 (0.8%) | 193 (3.2%) |
| $25,000 to $34,999 | 149 (4.2%) | 614 (10.1%) |
| $35,000 to $49,999 | 444 (12.4%) | 693 (11.4%) |
| $50,000 to $74,999 | 464 (13.0%) | 1,432 (23.5%) |
| $75,000 to $99,999 | 517 (14.4%) | 950 (15.6%) |
| $100,000 to $149,999 | 826 (23.1%) | 1,149 (18.8%) |
| $150,000 or more | 1,076 (30.1%) | 422 (6.9%) |
| Total | 3,580 (100.0%) | 6,104 (100.0%) |
Monthly Housing Cost Tiers in Lawndale
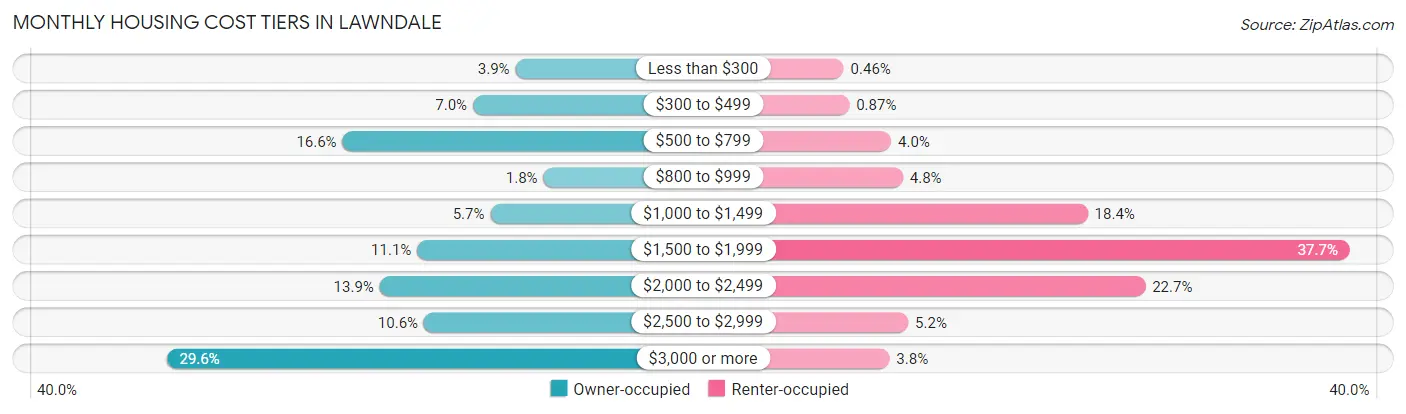
| Monthly Cost | Owner-occupied | Renter-occupied |
| Less than $300 | 138 (3.8%) | 28 (0.5%) |
| $300 to $499 | 250 (7.0%) | 53 (0.9%) |
| $500 to $799 | 594 (16.6%) | 241 (4.0%) |
| $800 to $999 | 64 (1.8%) | 294 (4.8%) |
| $1,000 to $1,499 | 204 (5.7%) | 1,125 (18.4%) |
| $1,500 to $1,999 | 397 (11.1%) | 2,303 (37.7%) |
| $2,000 to $2,499 | 496 (13.9%) | 1,384 (22.7%) |
| $2,500 to $2,999 | 379 (10.6%) | 318 (5.2%) |
| $3,000 or more | 1,058 (29.5%) | 234 (3.8%) |
| Total | 3,580 (100.0%) | 6,104 (100.0%) |
Physical Housing Characteristics in Lawndale
Housing Structures in Lawndale
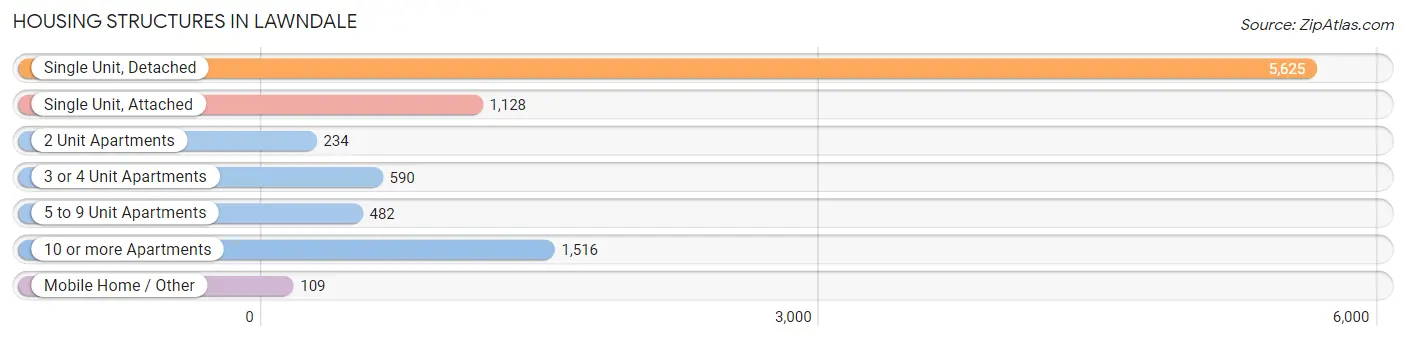
| Structure Type | # Housing Units | % Housing Units |
| Single Unit, Detached | 5,625 | 58.1% |
| Single Unit, Attached | 1,128 | 11.7% |
| 2 Unit Apartments | 234 | 2.4% |
| 3 or 4 Unit Apartments | 590 | 6.1% |
| 5 to 9 Unit Apartments | 482 | 5.0% |
| 10 or more Apartments | 1,516 | 15.7% |
| Mobile Home / Other | 109 | 1.1% |
| Total | 9,684 | 100.0% |
Housing Structures by Occupancy in Lawndale
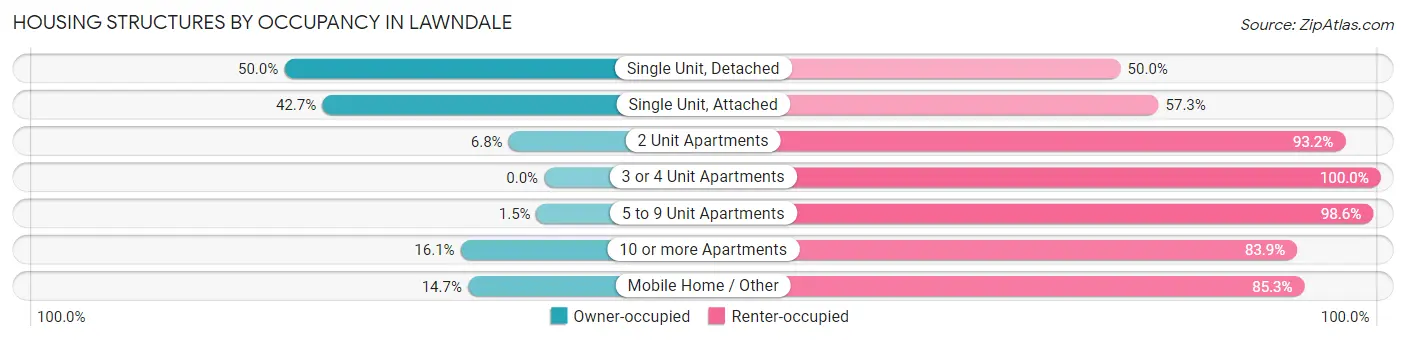
| Structure Type | Owner-occupied | Renter-occupied |
| Single Unit, Detached | 2,815 (50.0%) | 2,810 (50.0%) |
| Single Unit, Attached | 482 (42.7%) | 646 (57.3%) |
| 2 Unit Apartments | 16 (6.8%) | 218 (93.2%) |
| 3 or 4 Unit Apartments | 0 (0.0%) | 590 (100.0%) |
| 5 to 9 Unit Apartments | 7 (1.5%) | 475 (98.6%) |
| 10 or more Apartments | 244 (16.1%) | 1,272 (83.9%) |
| Mobile Home / Other | 16 (14.7%) | 93 (85.3%) |
| Total | 3,580 (37.0%) | 6,104 (63.0%) |
Housing Structures by Number of Rooms in Lawndale
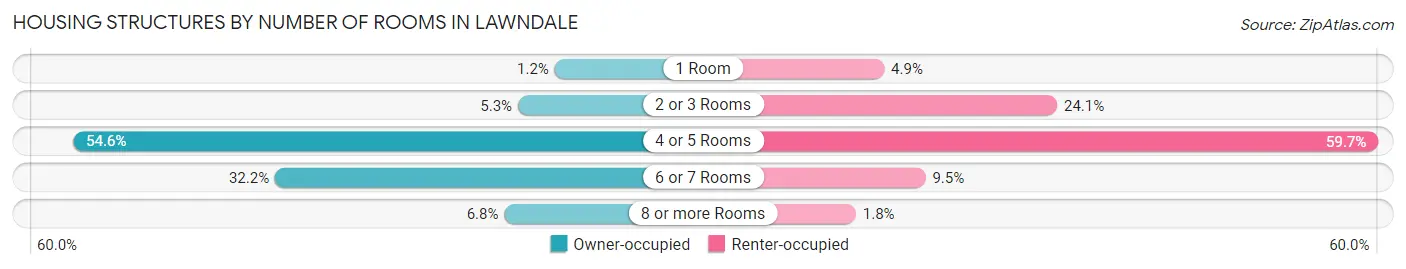
| Number of Rooms | Owner-occupied | Renter-occupied |
| 1 Room | 42 (1.2%) | 300 (4.9%) |
| 2 or 3 Rooms | 188 (5.2%) | 1,471 (24.1%) |
| 4 or 5 Rooms | 1,955 (54.6%) | 3,646 (59.7%) |
| 6 or 7 Rooms | 1,153 (32.2%) | 579 (9.5%) |
| 8 or more Rooms | 242 (6.8%) | 108 (1.8%) |
| Total | 3,580 (100.0%) | 6,104 (100.0%) |
Housing Structure by Heating Type in Lawndale
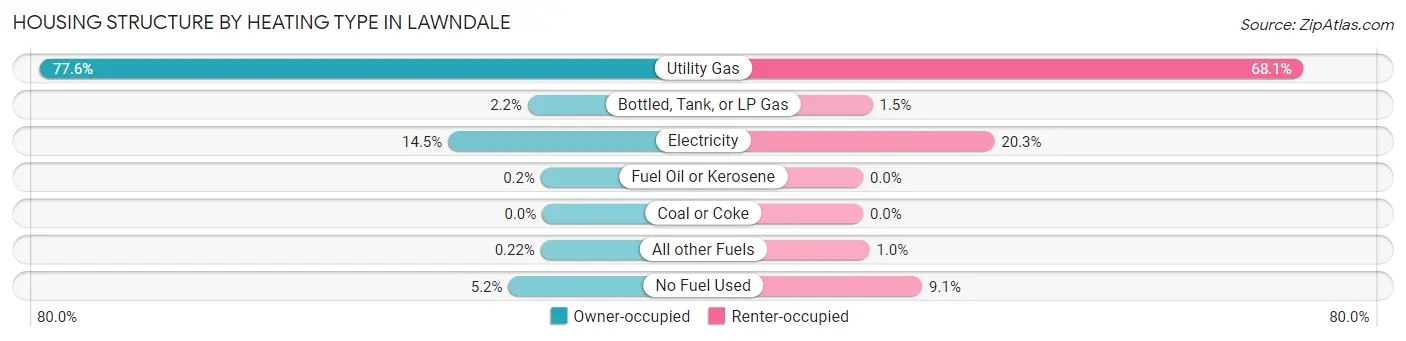
| Heating Type | Owner-occupied | Renter-occupied |
| Utility Gas | 2,779 (77.6%) | 4,156 (68.1%) |
| Bottled, Tank, or LP Gas | 79 (2.2%) | 90 (1.5%) |
| Electricity | 520 (14.5%) | 1,239 (20.3%) |
| Fuel Oil or Kerosene | 7 (0.2%) | 0 (0.0%) |
| Coal or Coke | 0 (0.0%) | 0 (0.0%) |
| All other Fuels | 8 (0.2%) | 61 (1.0%) |
| No Fuel Used | 187 (5.2%) | 558 (9.1%) |
| Total | 3,580 (100.0%) | 6,104 (100.0%) |
Household Vehicle Usage in Lawndale
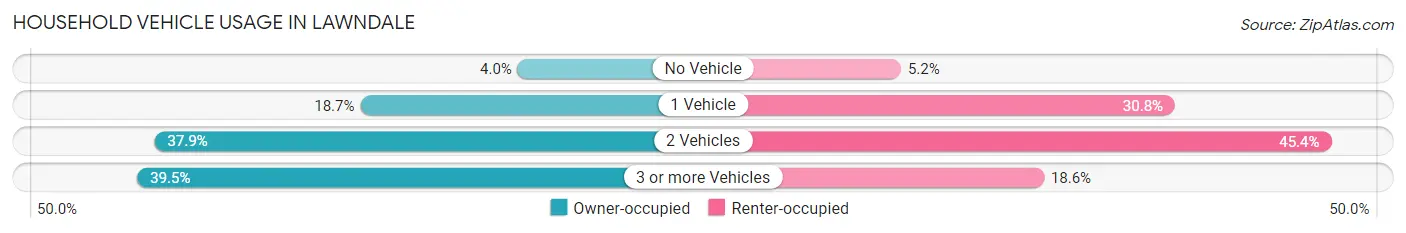
| Vehicles per Household | Owner-occupied | Renter-occupied |
| No Vehicle | 142 (4.0%) | 319 (5.2%) |
| 1 Vehicle | 668 (18.7%) | 1,880 (30.8%) |
| 2 Vehicles | 1,356 (37.9%) | 2,771 (45.4%) |
| 3 or more Vehicles | 1,414 (39.5%) | 1,134 (18.6%) |
| Total | 3,580 (100.0%) | 6,104 (100.0%) |
Real Estate & Mortgages in Lawndale
Real Estate and Mortgage Overview in Lawndale
| Characteristic | Without Mortgage | With Mortgage |
| Housing Units | 1,093 | 2,487 |
| Median Property Value | $661,800 | $697,900 |
| Median Household Income | $100,938 | $888 |
| Monthly Housing Costs | $548 | $1,058 |
| Real Estate Taxes | $4,146 | $30 |
Property Value by Mortgage Status in Lawndale
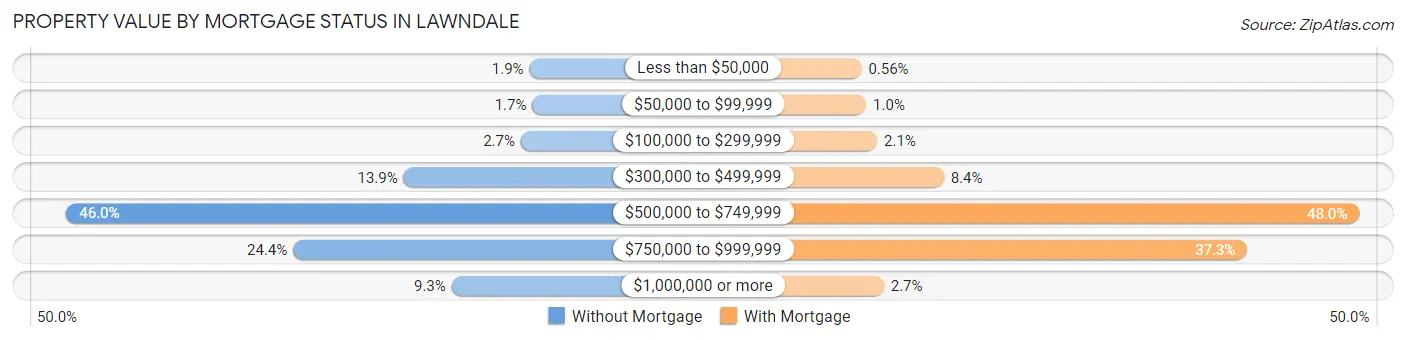
| Property Value | Without Mortgage | With Mortgage |
| Less than $50,000 | 21 (1.9%) | 14 (0.6%) |
| $50,000 to $99,999 | 18 (1.7%) | 25 (1.0%) |
| $100,000 to $299,999 | 30 (2.7%) | 51 (2.1%) |
| $300,000 to $499,999 | 152 (13.9%) | 209 (8.4%) |
| $500,000 to $749,999 | 503 (46.0%) | 1,193 (48.0%) |
| $750,000 to $999,999 | 267 (24.4%) | 928 (37.3%) |
| $1,000,000 or more | 102 (9.3%) | 67 (2.7%) |
| Total | 1,093 (100.0%) | 2,487 (100.0%) |
Household Income by Mortgage Status in Lawndale
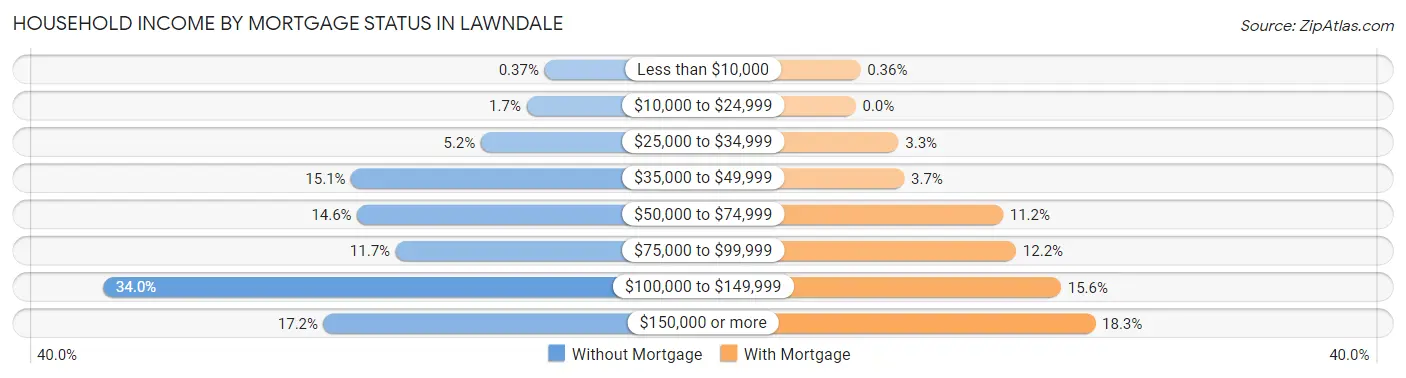
| Household Income | Without Mortgage | With Mortgage |
| Less than $10,000 | 4 (0.4%) | 9 (0.4%) |
| $10,000 to $24,999 | 19 (1.7%) | 0 (0.0%) |
| $25,000 to $34,999 | 57 (5.2%) | 81 (3.3%) |
| $35,000 to $49,999 | 165 (15.1%) | 92 (3.7%) |
| $50,000 to $74,999 | 160 (14.6%) | 279 (11.2%) |
| $75,000 to $99,999 | 128 (11.7%) | 304 (12.2%) |
| $100,000 to $149,999 | 372 (34.0%) | 389 (15.6%) |
| $150,000 or more | 188 (17.2%) | 454 (18.2%) |
| Total | 1,093 (100.0%) | 2,487 (100.0%) |
Property Value to Household Income Ratio in Lawndale
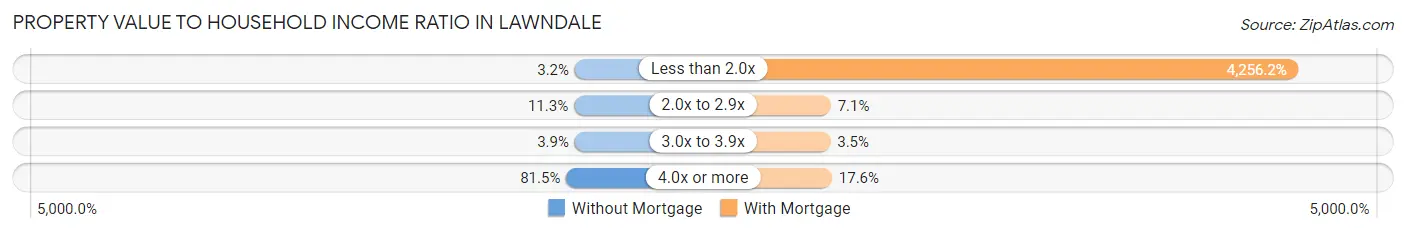
| Value-to-Income Ratio | Without Mortgage | With Mortgage |
| Less than 2.0x | 35 (3.2%) | 105,852 (4,256.2%) |
| 2.0x to 2.9x | 124 (11.3%) | 176 (7.1%) |
| 3.0x to 3.9x | 43 (3.9%) | 87 (3.5%) |
| 4.0x or more | 891 (81.5%) | 437 (17.6%) |
| Total | 1,093 (100.0%) | 2,487 (100.0%) |
Real Estate Taxes by Mortgage Status in Lawndale
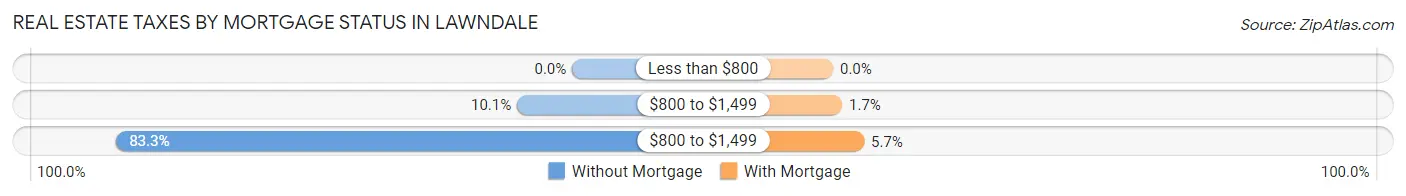
| Property Taxes | Without Mortgage | With Mortgage |
| Less than $800 | 0 (0.0%) | 0 (0.0%) |
| $800 to $1,499 | 110 (10.1%) | 41 (1.7%) |
| $800 to $1,499 | 910 (83.3%) | 141 (5.7%) |
| Total | 1,093 (100.0%) | 2,487 (100.0%) |
Health & Disability in Lawndale
Health Insurance Coverage by Age in Lawndale
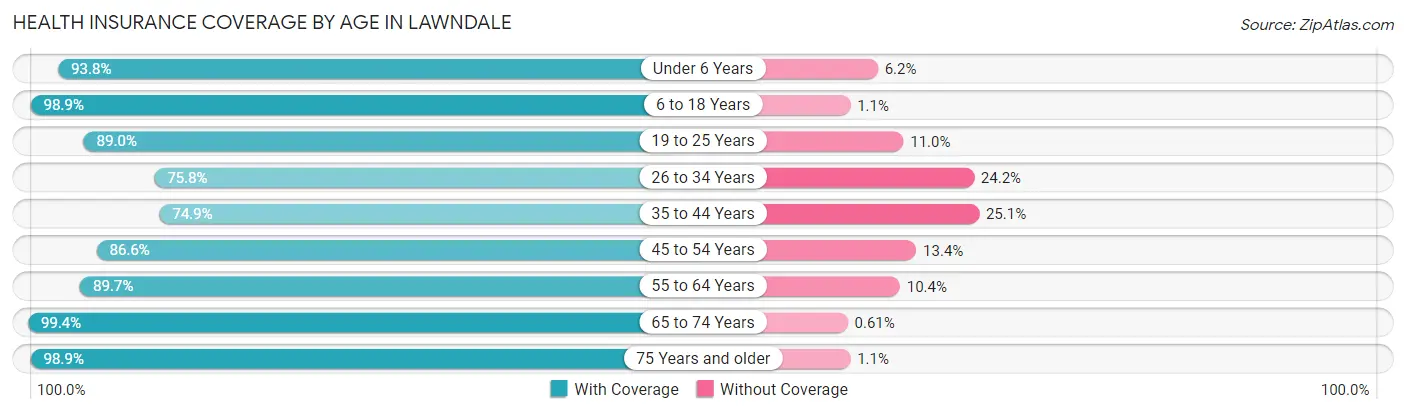
| Age Bracket | With Coverage | Without Coverage |
| Under 6 Years | 2,196 (93.8%) | 146 (6.2%) |
| 6 to 18 Years | 5,276 (98.9%) | 59 (1.1%) |
| 19 to 25 Years | 2,990 (89.0%) | 370 (11.0%) |
| 26 to 34 Years | 3,410 (75.8%) | 1,087 (24.2%) |
| 35 to 44 Years | 3,311 (74.9%) | 1,111 (25.1%) |
| 45 to 54 Years | 4,071 (86.6%) | 630 (13.4%) |
| 55 to 64 Years | 3,360 (89.6%) | 388 (10.3%) |
| 65 to 74 Years | 1,953 (99.4%) | 12 (0.6%) |
| 75 Years and older | 1,164 (98.9%) | 13 (1.1%) |
| Total | 27,731 (87.9%) | 3,816 (12.1%) |
Health Insurance Coverage by Citizenship Status in Lawndale
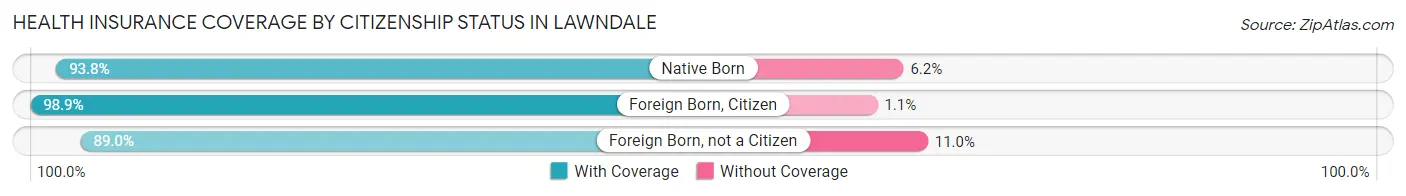
| Citizenship Status | With Coverage | Without Coverage |
| Native Born | 2,196 (93.8%) | 146 (6.2%) |
| Foreign Born, Citizen | 5,276 (98.9%) | 59 (1.1%) |
| Foreign Born, not a Citizen | 2,990 (89.0%) | 370 (11.0%) |
Health Insurance Coverage by Household Income in Lawndale
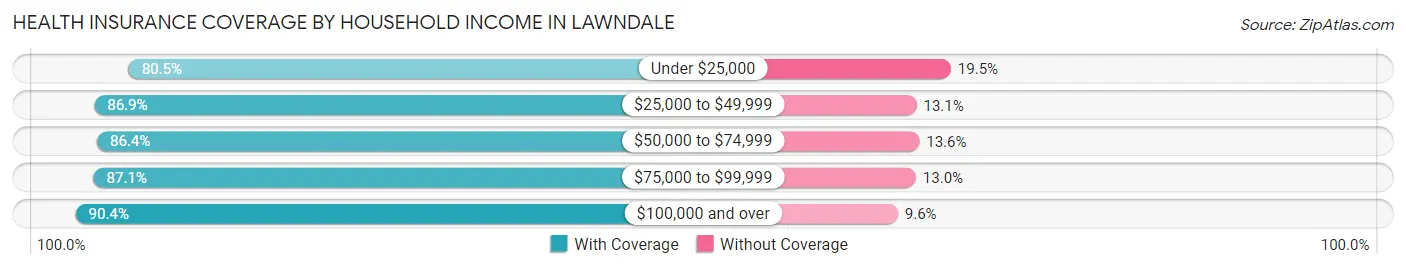
| Household Income | With Coverage | Without Coverage |
| Under $25,000 | 1,551 (80.5%) | 376 (19.5%) |
| $25,000 to $49,999 | 4,703 (86.9%) | 707 (13.1%) |
| $50,000 to $74,999 | 5,053 (86.4%) | 794 (13.6%) |
| $75,000 to $99,999 | 4,969 (87.1%) | 739 (13.0%) |
| $100,000 and over | 11,273 (90.4%) | 1,192 (9.6%) |
Public vs Private Health Insurance Coverage by Age in Lawndale
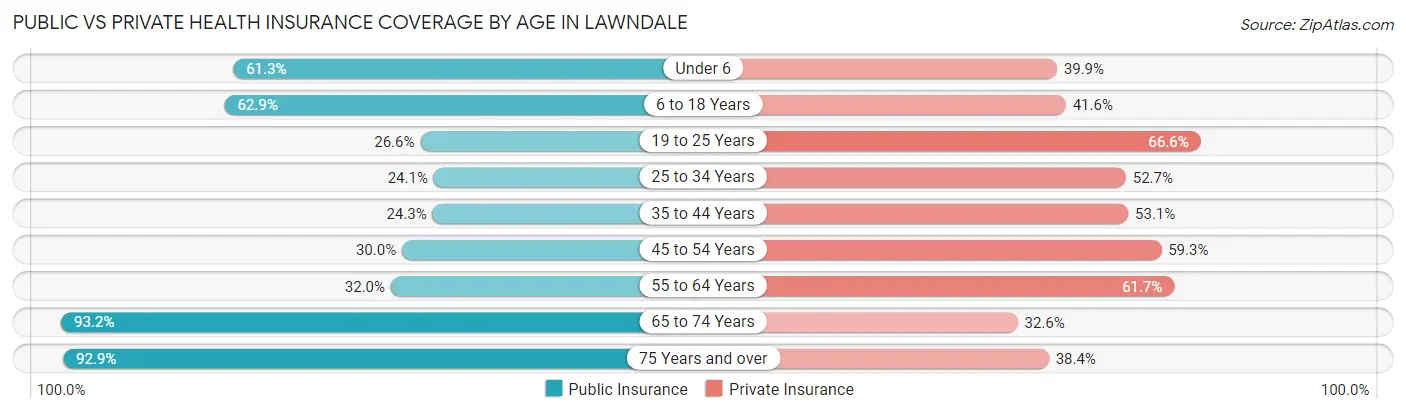
| Age Bracket | Public Insurance | Private Insurance |
| Under 6 | 1,435 (61.3%) | 935 (39.9%) |
| 6 to 18 Years | 3,355 (62.9%) | 2,218 (41.6%) |
| 19 to 25 Years | 892 (26.6%) | 2,237 (66.6%) |
| 25 to 34 Years | 1,082 (24.1%) | 2,371 (52.7%) |
| 35 to 44 Years | 1,074 (24.3%) | 2,350 (53.1%) |
| 45 to 54 Years | 1,408 (29.9%) | 2,787 (59.3%) |
| 55 to 64 Years | 1,200 (32.0%) | 2,312 (61.7%) |
| 65 to 74 Years | 1,832 (93.2%) | 641 (32.6%) |
| 75 Years and over | 1,093 (92.9%) | 452 (38.4%) |
| Total | 13,371 (42.4%) | 16,303 (51.7%) |
Disability Status by Sex by Age in Lawndale
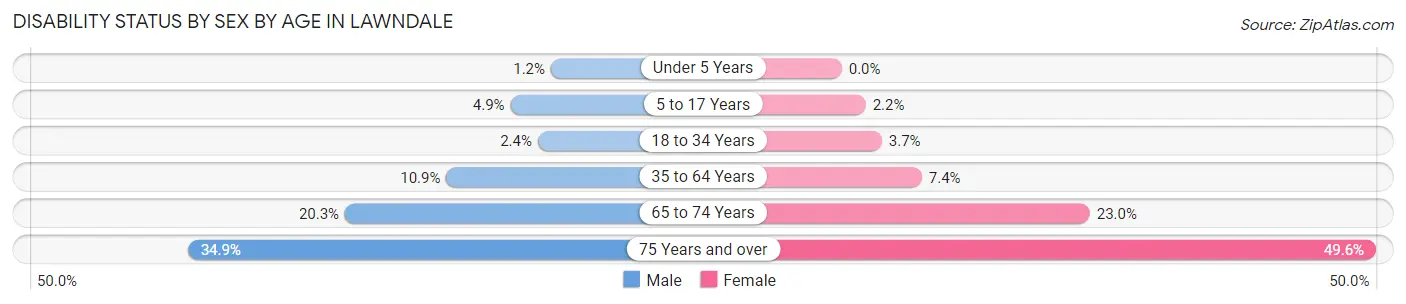
| Age Bracket | Male | Female |
| Under 5 Years | 11 (1.2%) | 0 (0.0%) |
| 5 to 17 Years | 127 (4.9%) | 63 (2.2%) |
| 18 to 34 Years | 107 (2.4%) | 138 (3.7%) |
| 35 to 64 Years | 766 (10.9%) | 432 (7.4%) |
| 65 to 74 Years | 209 (20.3%) | 215 (23.0%) |
| 75 Years and over | 167 (34.9%) | 346 (49.6%) |
Disability Class by Sex by Age in Lawndale
Disability Class: Hearing Difficulty
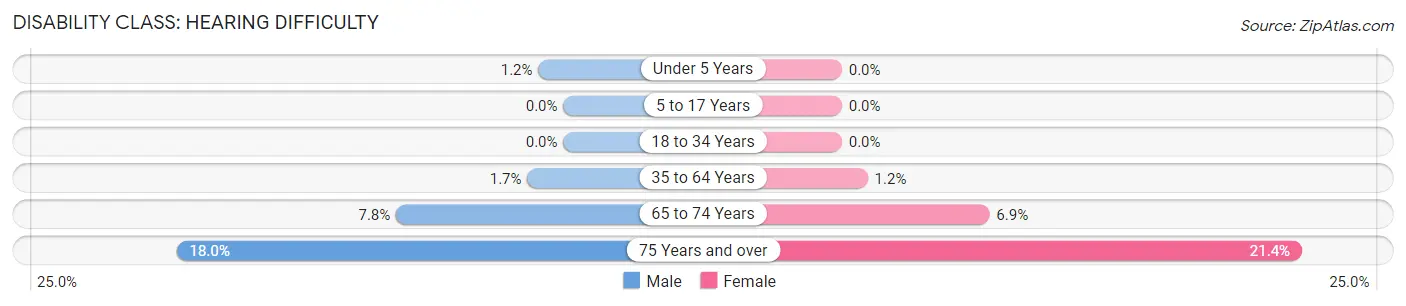
| Age Bracket | Male | Female |
| Under 5 Years | 11 (1.2%) | 0 (0.0%) |
| 5 to 17 Years | 0 (0.0%) | 0 (0.0%) |
| 18 to 34 Years | 0 (0.0%) | 0 (0.0%) |
| 35 to 64 Years | 118 (1.7%) | 70 (1.2%) |
| 65 to 74 Years | 80 (7.8%) | 64 (6.9%) |
| 75 Years and over | 86 (17.9%) | 149 (21.3%) |
Disability Class: Vision Difficulty
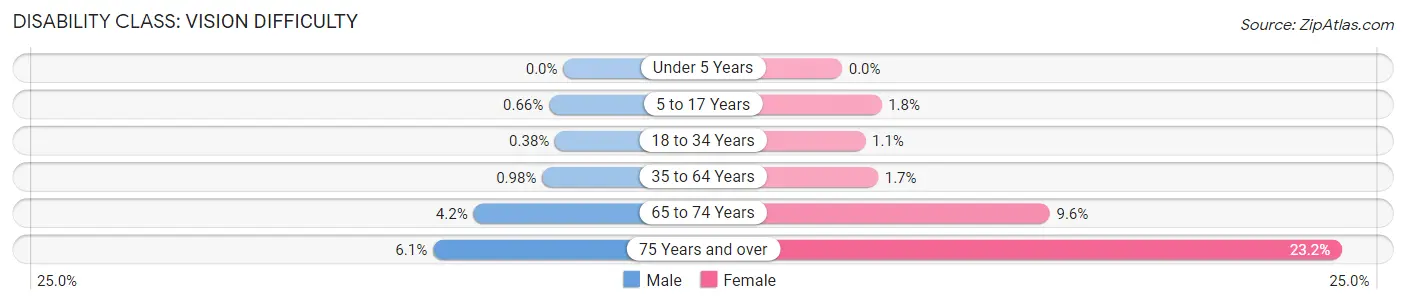
| Age Bracket | Male | Female |
| Under 5 Years | 0 (0.0%) | 0 (0.0%) |
| 5 to 17 Years | 17 (0.7%) | 52 (1.8%) |
| 18 to 34 Years | 17 (0.4%) | 40 (1.1%) |
| 35 to 64 Years | 69 (1.0%) | 97 (1.7%) |
| 65 to 74 Years | 43 (4.2%) | 90 (9.6%) |
| 75 Years and over | 29 (6.0%) | 162 (23.2%) |
Disability Class: Cognitive Difficulty
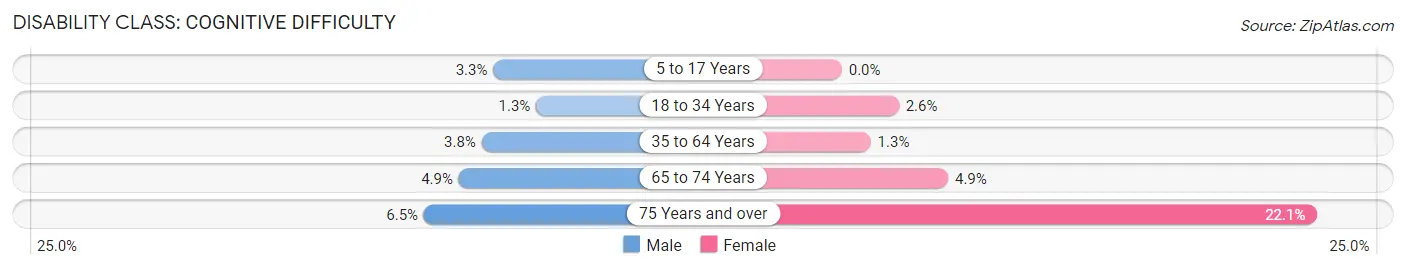
| Age Bracket | Male | Female |
| 5 to 17 Years | 84 (3.3%) | 0 (0.0%) |
| 18 to 34 Years | 57 (1.3%) | 98 (2.6%) |
| 35 to 64 Years | 267 (3.8%) | 78 (1.3%) |
| 65 to 74 Years | 50 (4.9%) | 46 (4.9%) |
| 75 Years and over | 31 (6.5%) | 154 (22.1%) |
Disability Class: Ambulatory Difficulty
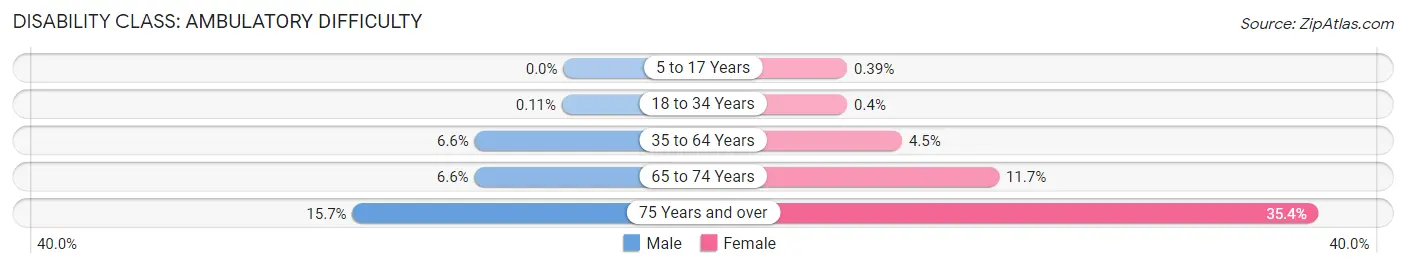
| Age Bracket | Male | Female |
| 5 to 17 Years | 0 (0.0%) | 11 (0.4%) |
| 18 to 34 Years | 5 (0.1%) | 15 (0.4%) |
| 35 to 64 Years | 465 (6.6%) | 260 (4.5%) |
| 65 to 74 Years | 68 (6.6%) | 109 (11.7%) |
| 75 Years and over | 75 (15.7%) | 247 (35.4%) |
Disability Class: Self-Care Difficulty
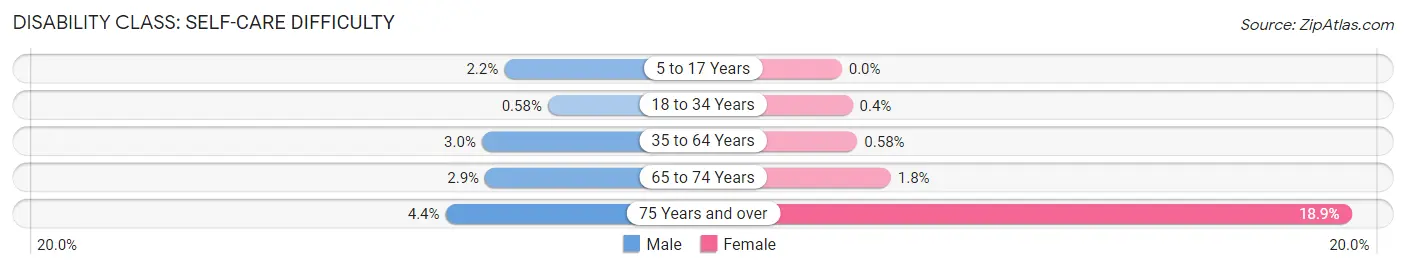
| Age Bracket | Male | Female |
| 5 to 17 Years | 57 (2.2%) | 0 (0.0%) |
| 18 to 34 Years | 26 (0.6%) | 15 (0.4%) |
| 35 to 64 Years | 214 (3.0%) | 34 (0.6%) |
| 65 to 74 Years | 30 (2.9%) | 17 (1.8%) |
| 75 Years and over | 21 (4.4%) | 132 (18.9%) |
Technology Access in Lawndale
Computing Device Access in Lawndale
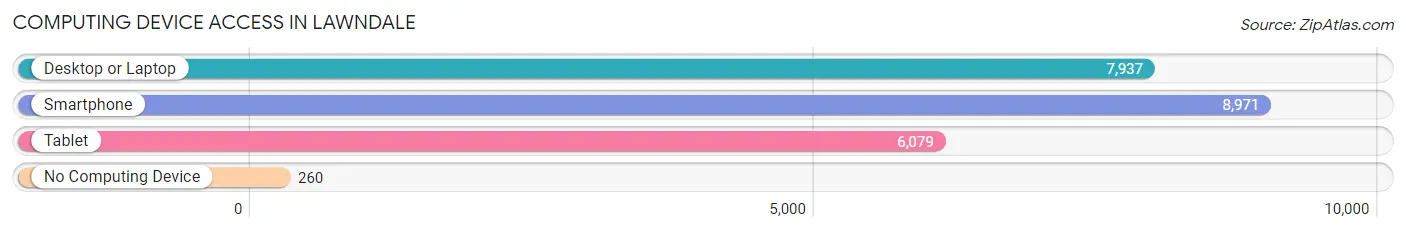
| Device Type | # Households | % Households |
| Desktop or Laptop | 7,937 | 82.0% |
| Smartphone | 8,971 | 92.6% |
| Tablet | 6,079 | 62.8% |
| No Computing Device | 260 | 2.7% |
| Total | 9,684 | 100.0% |
Internet Access in Lawndale
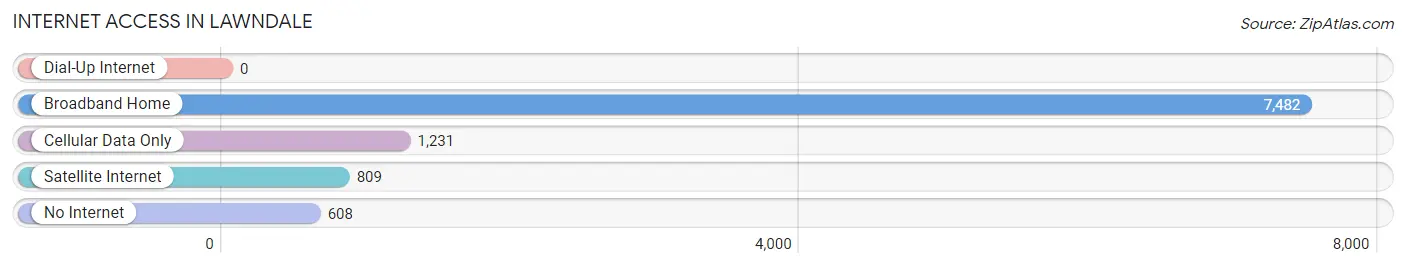
| Internet Type | # Households | % Households |
| Dial-Up Internet | 0 | 0.0% |
| Broadband Home | 7,482 | 77.3% |
| Cellular Data Only | 1,231 | 12.7% |
| Satellite Internet | 809 | 8.4% |
| No Internet | 608 | 6.3% |
| Total | 9,684 | 100.0% |
Lawndale Summary
Lawndale is a city located in Los Angeles County, California, United States. The city is located in the South Bay region of the Greater Los Angeles Area and is bordered by Hawthorne on the north, Torrance on the south, Redondo Beach on the west, and Inglewood on the east. The population of Lawndale was 32,769 at the 2010 census, up from 31,711 according to the 2000 census.
History
Lawndale was originally part of the Rancho Sausal Redondo, a Mexican land grant given to Juan Jose Dominguez in 1836. In 1905, the area was divided into five parcels, with the center of the city being the intersection of Hawthorne Boulevard and Marine Avenue. The city was incorporated in 1959 and was named after the Lawndale neighborhood in Chicago, Illinois.
Geography
Lawndale is located at 33°53'N 118°19'W (33.88, -118.32). According to the United States Census Bureau, the city has a total area of 2.0 square miles (5.2 km2), all of it land.
Economy
Lawndale is home to a variety of businesses, including aerospace, automotive, and manufacturing companies. The city is also home to the South Bay Galleria, a shopping mall with over 150 stores and restaurants.
Demographics
As of the 2010 census, there were 32,769 people, 11,958 households, and 8,039 families residing in the city. The population density was 16,417.3 people per square mile (6,323.2/km2). There were 12,670 housing units at an average density of 6,325.3 per square mile (2,443.2/km2). The racial makeup of the city was 33.6% White, 8.7% African American, 0.8% Native American, 10.0% Asian, 0.3% Pacific Islander, 32.8% from other races, and 4.8% from two or more races. Hispanic or Latino of any race were 54.2% of the population.
There were 11,958 households, out of which 37.3% had children under the age of 18 living with them, 44.3% were married couples living together, 16.4% had a female householder with no husband present, and 32.9% were non-families. 25.7% of all households were made up of individuals, and 8.4% had someone living alone who was 65 years of age or older. The average household size was 2.73 and the average family size was 3.30.
In the city, the population was spread out, with 25.7% under the age of 18, 10.4% from 18 to 24, 32.1% from 25 to 44, 21.3% from 45 to 64, and 10.5% who were 65 years of age or older. The median age was 34 years. For every 100 females, there were 95.1 males. For every 100 females age 18 and over, there were 92.0 males.
The median income for a household in the city was $41,254, and the median income for a family was $46,006. Males had a median income of $35,909 versus $30,811 for females. The per capita income for the city was $17,548. About 11.8% of families and 14.7% of the population were below the poverty line, including 19.6% of those under age 18 and 8.4% of those age 65 or over.
Common Questions
What is Per Capita Income in Lawndale?
Per Capita income in Lawndale is $29,330.
What is the Median Family Income in Lawndale?
Median Family Income in Lawndale is $76,349.
What is the Median Household income in Lawndale?
Median Household Income in Lawndale is $76,213.
What is Income or Wage Gap in Lawndale?
Income or Wage Gap in Lawndale is 25.7%.
Women in Lawndale earn 74.3 cents for every dollar earned by a man.
What is Family Income Deficit in Lawndale?
Family Income Deficit in Lawndale is $10,446.
Families that are below poverty line in Lawndale earn $10,446 less on average than the poverty threshold level.
What is Inequality or Gini Index in Lawndale?
Inequality or Gini Index in Lawndale is 0.38.
What is the Total Population of Lawndale?
Total Population of Lawndale is 31,553.
What is the Total Male Population of Lawndale?
Total Male Population of Lawndale is 16,613.
What is the Total Female Population of Lawndale?
Total Female Population of Lawndale is 14,940.
What is the Ratio of Males per 100 Females in Lawndale?
There are 111.20 Males per 100 Females in Lawndale.
What is the Ratio of Females per 100 Males in Lawndale?
There are 89.93 Females per 100 Males in Lawndale.
What is the Median Population Age in Lawndale?
Median Population Age in Lawndale is 35.4 Years.
What is the Average Family Size in Lawndale
Average Family Size in Lawndale is 3.6 People.
What is the Average Household Size in Lawndale
Average Household Size in Lawndale is 3.2 People.
How Large is the Labor Force in Lawndale?
There are 18,276 People in the Labor Forcein in Lawndale.
What is the Percentage of People in the Labor Force in Lawndale?
72.6% of People are in the Labor Force in Lawndale.
What is the Unemployment Rate in Lawndale?
Unemployment Rate in Lawndale is 8.3%.