La Verne, CA Map & Demographics
La Verne Map
La Verne Overview
$48,567
PER CAPITA INCOME
$125,226
AVG FAMILY INCOME
$103,816
AVG HOUSEHOLD INCOME
36.4%
WAGE / INCOME GAP [ % ]
63.6¢/ $1
WAGE / INCOME GAP [ $ ]
0.44
INEQUALITY / GINI INDEX
31,239
TOTAL POPULATION
15,111
MALE POPULATION
16,128
FEMALE POPULATION
93.69
MALES / 100 FEMALES
106.73
FEMALES / 100 MALES
45.8
MEDIAN AGE
3.1
AVG FAMILY SIZE
2.6
AVG HOUSEHOLD SIZE
15,663
LABOR FORCE [ PEOPLE ]
60.3%
PERCENT IN LABOR FORCE
6.4%
UNEMPLOYMENT RATE
La Verne Zip Codes
Income in La Verne
Income Overview in La Verne
Per Capita Income in La Verne is $48,567, while median incomes of families and households are $125,226 and $103,816 respectively.
| Characteristic | Number | Measure |
| Per Capita Income | 31,239 | $48,567 |
| Median Family Income | 8,220 | $125,226 |
| Mean Family Income | 8,220 | $147,978 |
| Median Household Income | 11,590 | $103,816 |
| Mean Household Income | 11,590 | $127,913 |
| Income Deficit | 8,220 | $0 |
| Wage / Income Gap (%) | 31,239 | 36.39% |
| Wage / Income Gap ($) | 31,239 | 63.61¢ per $1 |
| Gini / Inequality Index | 31,239 | 0.44 |
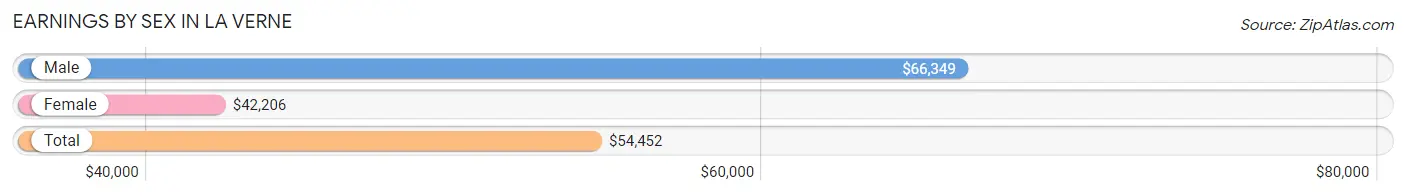
Earnings by Sex in La Verne
Average Earnings in La Verne are $54,452, $66,349 for men and $42,206 for women, a difference of 36.4%.
| Sex | Number | Average Earnings |
| Male | 8,454 (52.9%) | $66,349 |
| Female | 7,520 (47.1%) | $42,206 |
| Total | 15,974 (100.0%) | $54,452 |
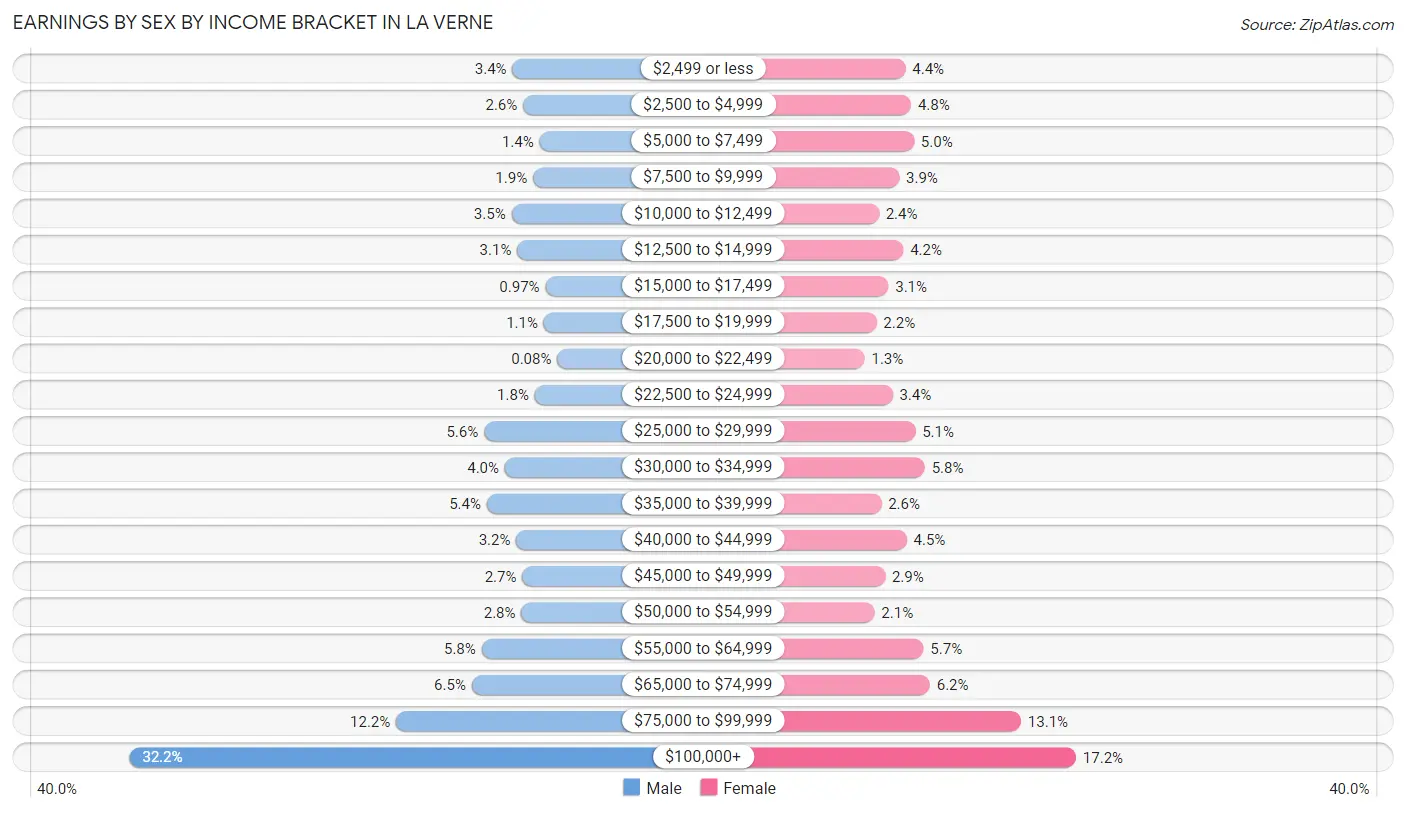
Earnings by Sex by Income Bracket in La Verne
The most common earnings brackets in La Verne are $100,000+ for men (2,718 | 32.2%) and $100,000+ for women (1,291 | 17.2%).
| Income | Male | Female |
| $2,499 or less | 291 (3.4%) | 330 (4.4%) |
| $2,500 to $4,999 | 223 (2.6%) | 362 (4.8%) |
| $5,000 to $7,499 | 119 (1.4%) | 378 (5.0%) |
| $7,500 to $9,999 | 161 (1.9%) | 295 (3.9%) |
| $10,000 to $12,499 | 297 (3.5%) | 180 (2.4%) |
| $12,500 to $14,999 | 260 (3.1%) | 318 (4.2%) |
| $15,000 to $17,499 | 82 (1.0%) | 234 (3.1%) |
| $17,500 to $19,999 | 92 (1.1%) | 167 (2.2%) |
| $20,000 to $22,499 | 7 (0.1%) | 100 (1.3%) |
| $22,500 to $24,999 | 150 (1.8%) | 257 (3.4%) |
| $25,000 to $29,999 | 471 (5.6%) | 386 (5.1%) |
| $30,000 to $34,999 | 339 (4.0%) | 439 (5.8%) |
| $35,000 to $39,999 | 453 (5.4%) | 194 (2.6%) |
| $40,000 to $44,999 | 266 (3.2%) | 337 (4.5%) |
| $45,000 to $49,999 | 228 (2.7%) | 215 (2.9%) |
| $50,000 to $54,999 | 234 (2.8%) | 156 (2.1%) |
| $55,000 to $64,999 | 486 (5.8%) | 432 (5.7%) |
| $65,000 to $74,999 | 549 (6.5%) | 468 (6.2%) |
| $75,000 to $99,999 | 1,028 (12.2%) | 981 (13.1%) |
| $100,000+ | 2,718 (32.2%) | 1,291 (17.2%) |
| Total | 8,454 (100.0%) | 7,520 (100.0%) |
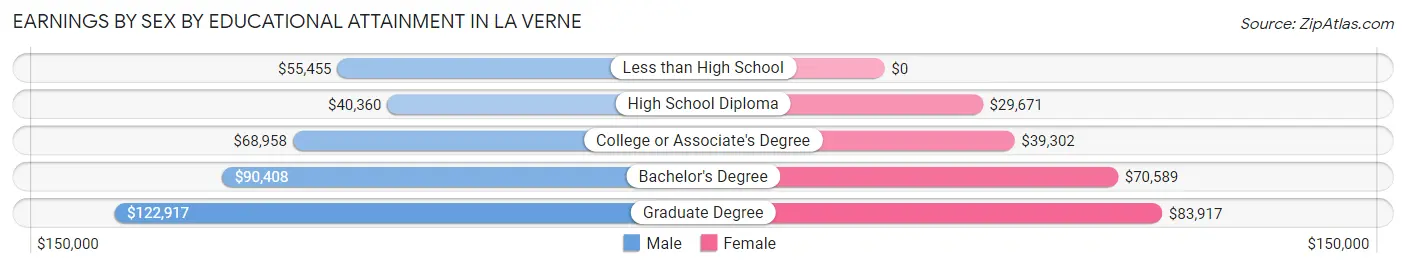
Earnings by Sex by Educational Attainment in La Verne
Average earnings in La Verne are $75,270 for men and $50,439 for women, a difference of 33.0%. Men with an educational attainment of graduate degree enjoy the highest average annual earnings of $122,917, while those with high school diploma education earn the least with $40,360. Women with an educational attainment of graduate degree earn the most with the average annual earnings of $83,917, while those with high school diploma education have the smallest earnings of $29,671.
| Educational Attainment | Male Income | Female Income |
| Less than High School | $55,455 | $0 |
| High School Diploma | $40,360 | $29,671 |
| College or Associate's Degree | $68,958 | $39,302 |
| Bachelor's Degree | $90,408 | $70,589 |
| Graduate Degree | $122,917 | $83,917 |
| Total | $75,270 | $50,439 |
Family Income in La Verne
Family Income Brackets in La Verne
According to the La Verne family income data, there are 1,923 families falling into the $200,000+ income range, which is the most common income bracket and makes up 23.4% of all families. Conversely, the $15,000 to $24,999 income bracket is the least frequent group with only 173 families (2.1%) belonging to this category.
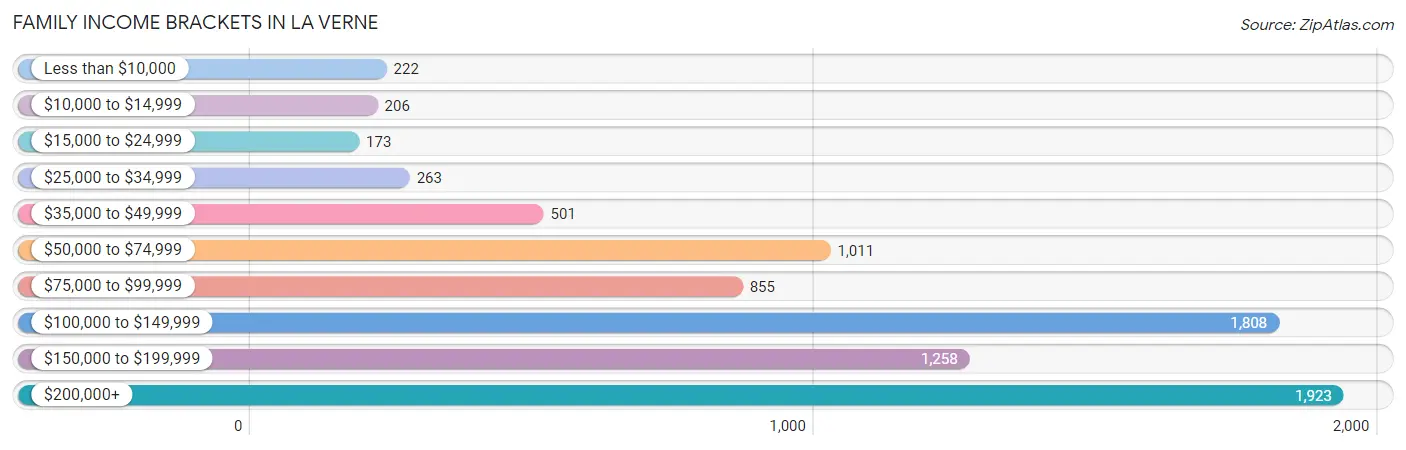
| Income Bracket | # Families | % Families |
| Less than $10,000 | 222 | 2.7% |
| $10,000 to $14,999 | 206 | 2.5% |
| $15,000 to $24,999 | 173 | 2.1% |
| $25,000 to $34,999 | 263 | 3.2% |
| $35,000 to $49,999 | 501 | 6.1% |
| $50,000 to $74,999 | 1,011 | 12.3% |
| $75,000 to $99,999 | 855 | 10.4% |
| $100,000 to $149,999 | 1,808 | 22.0% |
| $150,000 to $199,999 | 1,258 | 15.3% |
| $200,000+ | 1,923 | 23.4% |
Family Income by Famaliy Size in La Verne
5-person families (440 | 5.3%) account for the highest median family income in La Verne with $193,600 per family, while 2-person families (3,789 | 46.1%) have the highest median income of $47,211 per family member.
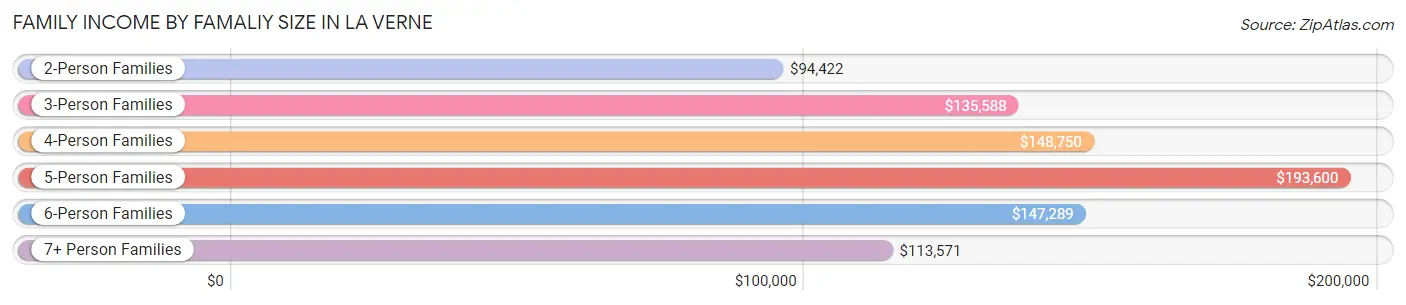
| Income Bracket | # Families | Median Income |
| 2-Person Families | 3,789 (46.1%) | $94,422 |
| 3-Person Families | 1,780 (21.6%) | $135,588 |
| 4-Person Families | 1,898 (23.1%) | $148,750 |
| 5-Person Families | 440 (5.3%) | $193,600 |
| 6-Person Families | 287 (3.5%) | $147,289 |
| 7+ Person Families | 26 (0.3%) | $113,571 |
| Total | 8,220 (100.0%) | $125,226 |
Family Income by Number of Earners in La Verne
The median family income in La Verne is $125,226, with families comprising 3+ earners (1,067) having the highest median family income of $205,859, while families with no earners (1,427) have the lowest median family income of $68,057, accounting for 13.0% and 17.4% of families, respectively.
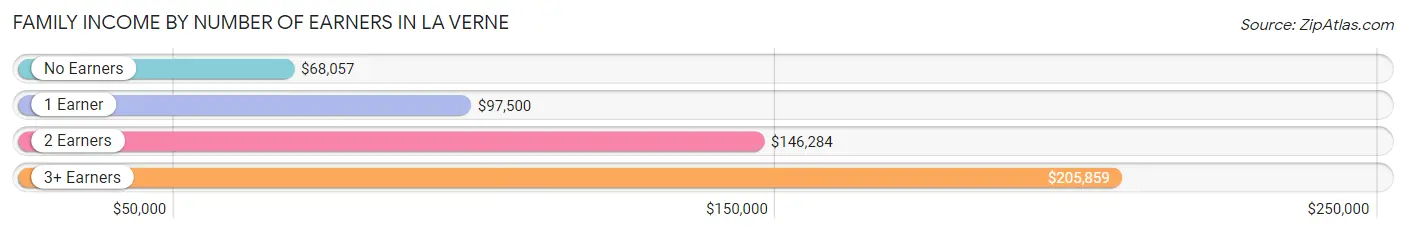
| Number of Earners | # Families | Median Income |
| No Earners | 1,427 (17.4%) | $68,057 |
| 1 Earner | 2,514 (30.6%) | $97,500 |
| 2 Earners | 3,212 (39.1%) | $146,284 |
| 3+ Earners | 1,067 (13.0%) | $205,859 |
| Total | 8,220 (100.0%) | $125,226 |
Household Income in La Verne
Household Income Brackets in La Verne
With 2,318 households falling in the category, the $100,000 to $149,999 income range is the most frequent in La Verne, accounting for 20.0% of all households. In contrast, only 394 households (3.4%) fall into the less than $10,000 income bracket, making it the least populous group.
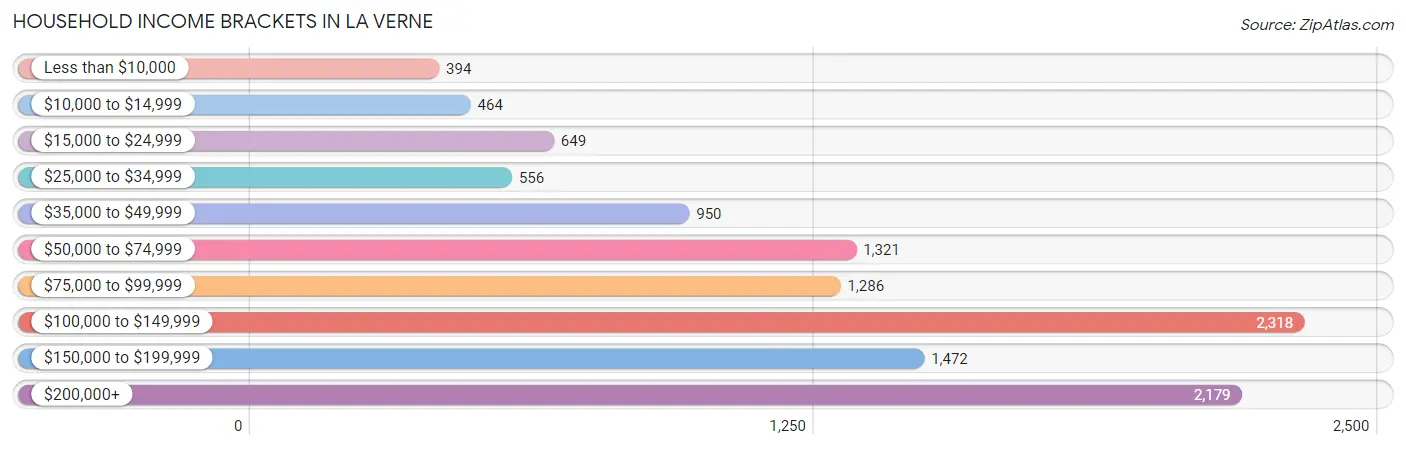
| Income Bracket | # Households | % Households |
| Less than $10,000 | 394 | 3.4% |
| $10,000 to $14,999 | 464 | 4.0% |
| $15,000 to $24,999 | 649 | 5.6% |
| $25,000 to $34,999 | 556 | 4.8% |
| $35,000 to $49,999 | 950 | 8.2% |
| $50,000 to $74,999 | 1,321 | 11.4% |
| $75,000 to $99,999 | 1,286 | 11.1% |
| $100,000 to $149,999 | 2,318 | 20.0% |
| $150,000 to $199,999 | 1,472 | 12.7% |
| $200,000+ | 2,179 | 18.8% |
Household Income by Householder Age in La Verne
The median household income in La Verne is $103,816, with the highest median household income of $143,560 found in the 45 to 64 years age bracket for the primary householder. A total of 4,729 households (40.8%) fall into this category. Meanwhile, the 65+ years age bracket for the primary householder has the lowest median household income of $60,670, with 3,971 households (34.3%) in this group.
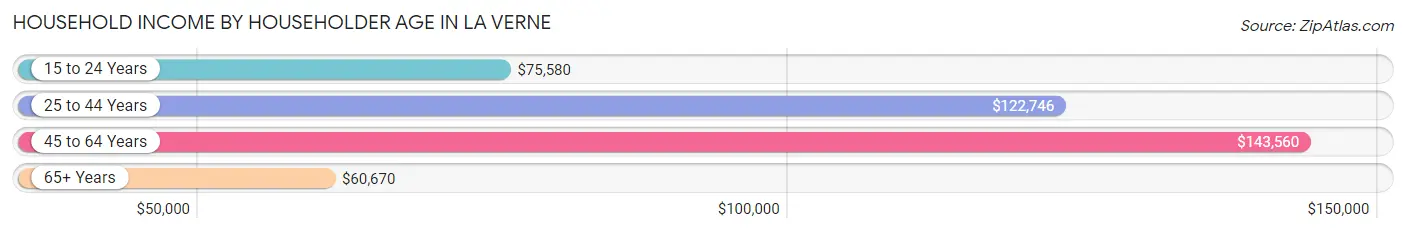
| Income Bracket | # Households | Median Income |
| 15 to 24 Years | 307 (2.6%) | $75,580 |
| 25 to 44 Years | 2,583 (22.3%) | $122,746 |
| 45 to 64 Years | 4,729 (40.8%) | $143,560 |
| 65+ Years | 3,971 (34.3%) | $60,670 |
| Total | 11,590 (100.0%) | $103,816 |
Poverty in La Verne
Income Below Poverty by Sex and Age in La Verne
With 7.2% poverty level for males and 9.7% for females among the residents of La Verne, 75 year old and over males and 25 to 34 year old females are the most vulnerable to poverty, with 138 males (13.2%) and 246 females (18.2%) in their respective age groups living below the poverty level.
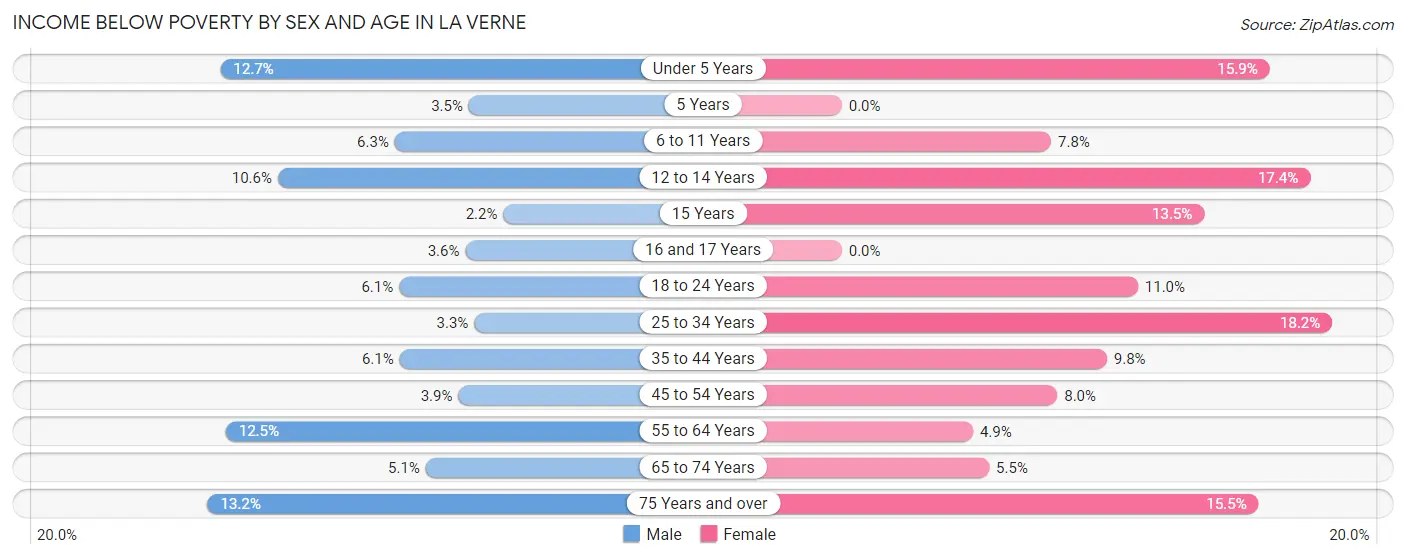
| Age Bracket | Male | Female |
| Under 5 Years | 77 (12.7%) | 91 (15.9%) |
| 5 Years | 8 (3.5%) | 0 (0.0%) |
| 6 to 11 Years | 55 (6.3%) | 85 (7.8%) |
| 12 to 14 Years | 71 (10.6%) | 102 (17.4%) |
| 15 Years | 6 (2.2%) | 30 (13.5%) |
| 16 and 17 Years | 12 (3.6%) | 0 (0.0%) |
| 18 to 24 Years | 79 (6.1%) | 135 (11.0%) |
| 25 to 34 Years | 60 (3.3%) | 246 (18.2%) |
| 35 to 44 Years | 98 (6.1%) | 179 (9.8%) |
| 45 to 54 Years | 73 (3.9%) | 172 (8.0%) |
| 55 to 64 Years | 304 (12.5%) | 113 (4.9%) |
| 65 to 74 Years | 97 (5.1%) | 134 (5.5%) |
| 75 Years and over | 138 (13.2%) | 246 (15.5%) |
| Total | 1,078 (7.2%) | 1,533 (9.7%) |
Income Above Poverty by Sex and Age in La Verne
According to the poverty statistics in La Verne, males aged 15 years and females aged 5 years are the age groups that are most secure financially, with 97.8% of males and 100.0% of females in these age groups living above the poverty line.
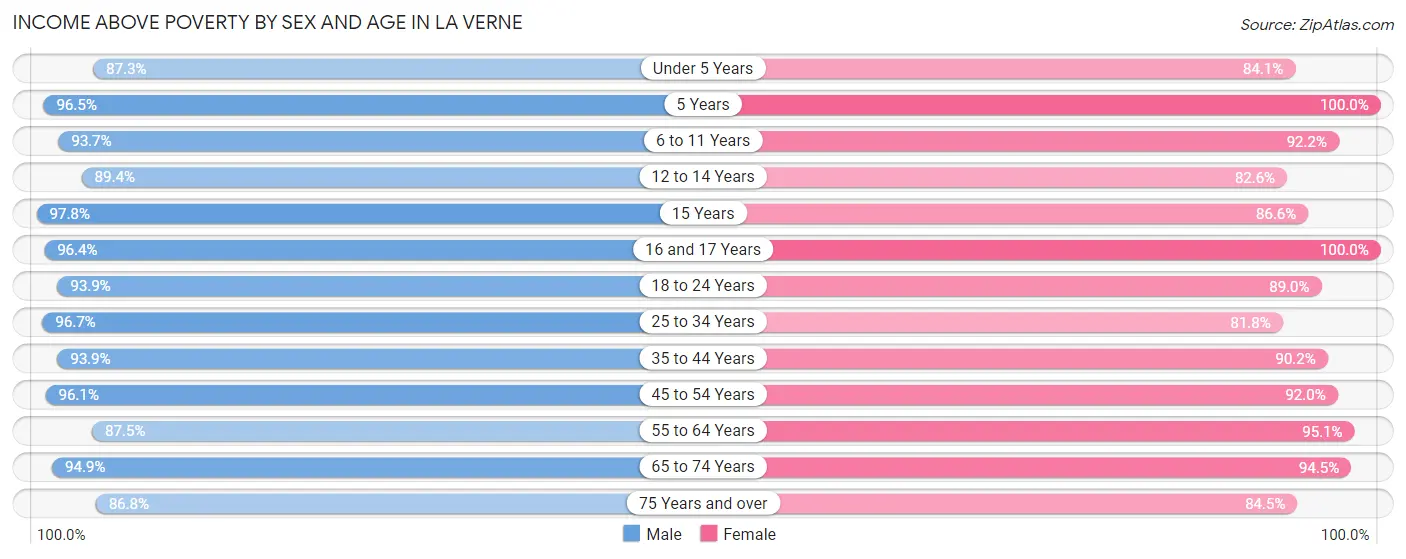
| Age Bracket | Male | Female |
| Under 5 Years | 528 (87.3%) | 482 (84.1%) |
| 5 Years | 220 (96.5%) | 90 (100.0%) |
| 6 to 11 Years | 823 (93.7%) | 1,009 (92.2%) |
| 12 to 14 Years | 599 (89.4%) | 485 (82.6%) |
| 15 Years | 263 (97.8%) | 193 (86.6%) |
| 16 and 17 Years | 318 (96.4%) | 334 (100.0%) |
| 18 to 24 Years | 1,217 (93.9%) | 1,093 (89.0%) |
| 25 to 34 Years | 1,752 (96.7%) | 1,106 (81.8%) |
| 35 to 44 Years | 1,513 (93.9%) | 1,640 (90.2%) |
| 45 to 54 Years | 1,798 (96.1%) | 1,979 (92.0%) |
| 55 to 64 Years | 2,122 (87.5%) | 2,209 (95.1%) |
| 65 to 74 Years | 1,800 (94.9%) | 2,316 (94.5%) |
| 75 Years and over | 907 (86.8%) | 1,344 (84.5%) |
| Total | 13,860 (92.8%) | 14,280 (90.3%) |
Income Below Poverty Among Married-Couple Families in La Verne
The poverty statistics for married-couple families in La Verne show that 2.9% or 176 of the total 6,180 families live below the poverty line. Families with 3 or 4 children have the highest poverty rate of 3.0%, comprising of 10 families. On the other hand, families with 1 or 2 children have the lowest poverty rate of 2.5%, which includes 47 families.
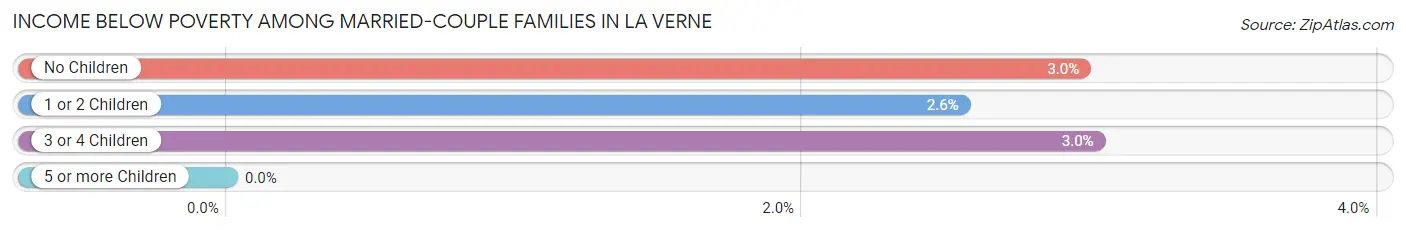
| Children | Above Poverty | Below Poverty |
| No Children | 3,888 (97.0%) | 119 (3.0%) |
| 1 or 2 Children | 1,795 (97.5%) | 47 (2.5%) |
| 3 or 4 Children | 321 (97.0%) | 10 (3.0%) |
| 5 or more Children | 0 (0.0%) | 0 (0.0%) |
| Total | 6,004 (97.2%) | 176 (2.9%) |
Income Below Poverty Among Single-Parent Households in La Verne
According to the poverty data in La Verne, 4.6% or 25 single-father households and 23.3% or 349 single-mother households are living below the poverty line. Among single-father households, those with no children have the highest poverty rate, with 25 households (8.4%) experiencing poverty. Likewise, among single-mother households, those with 1 or 2 children have the highest poverty rate, with 277 households (49.5%) falling below the poverty line.
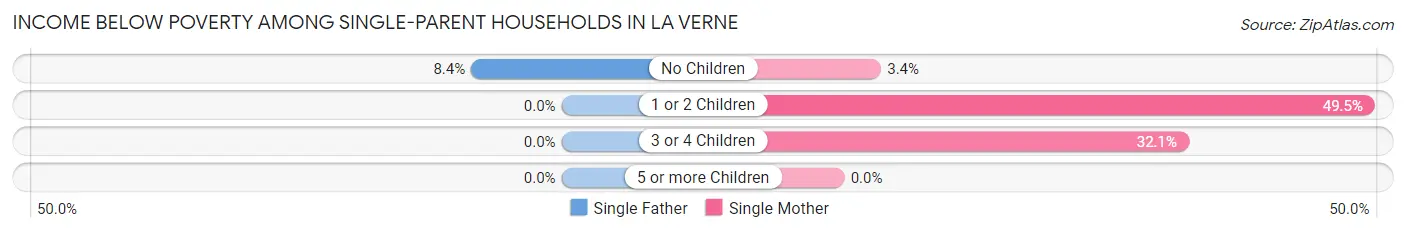
| Children | Single Father | Single Mother |
| No Children | 25 (8.4%) | 27 (3.4%) |
| 1 or 2 Children | 0 (0.0%) | 277 (49.5%) |
| 3 or 4 Children | 0 (0.0%) | 45 (32.1%) |
| 5 or more Children | 0 (0.0%) | 0 (0.0%) |
| Total | 25 (4.6%) | 349 (23.3%) |
Income Below Poverty Among Married-Couple vs Single-Parent Households in La Verne
The poverty data for La Verne shows that 176 of the married-couple family households (2.9%) and 374 of the single-parent households (18.3%) are living below the poverty level. Within the married-couple family households, those with 3 or 4 children have the highest poverty rate, with 10 households (3.0%) falling below the poverty line. Among the single-parent households, those with 1 or 2 children have the highest poverty rate, with 277 household (38.6%) living below poverty.
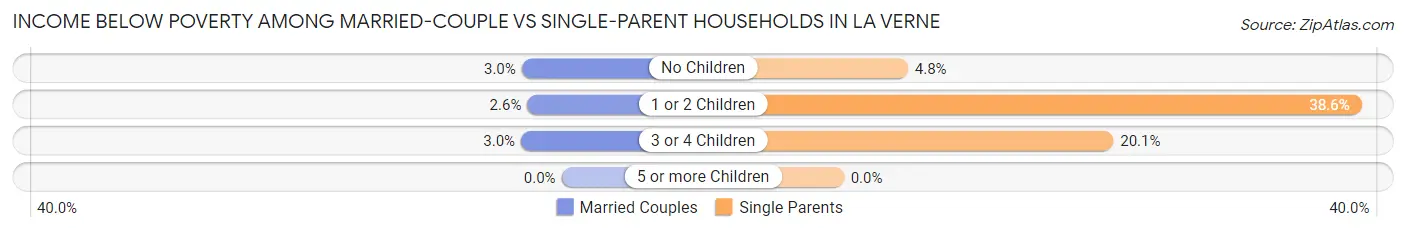
| Children | Married-Couple Families | Single-Parent Households |
| No Children | 119 (3.0%) | 52 (4.8%) |
| 1 or 2 Children | 47 (2.5%) | 277 (38.6%) |
| 3 or 4 Children | 10 (3.0%) | 45 (20.1%) |
| 5 or more Children | 0 (0.0%) | 0 (0.0%) |
| Total | 176 (2.9%) | 374 (18.3%) |
Race in La Verne
The most populous races in La Verne are White / Caucasian (18,236 | 58.4%), Hispanic or Latino (11,349 | 36.3%), and Two or more Races (5,445 | 17.4%).
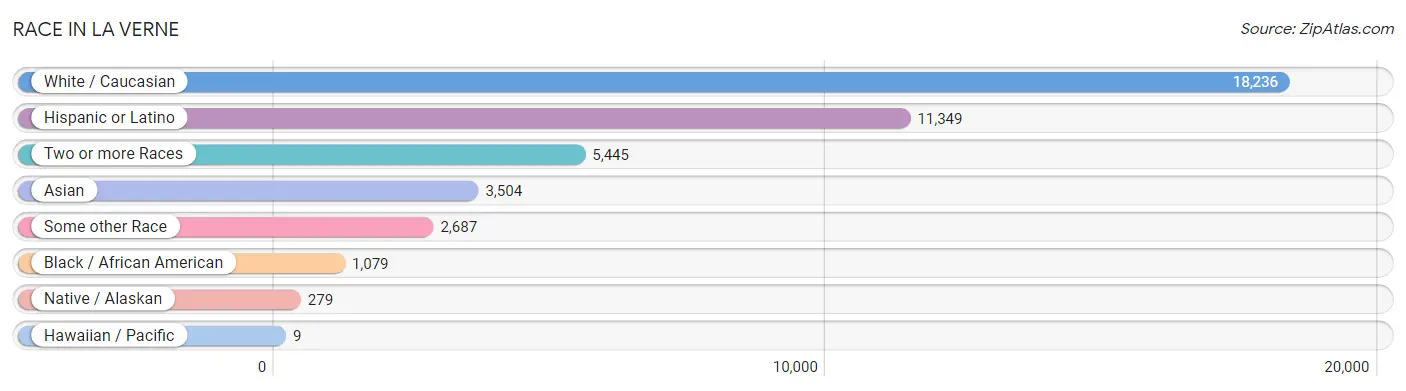
| Race | # Population | % Population |
| Asian | 3,504 | 11.2% |
| Black / African American | 1,079 | 3.5% |
| Hawaiian / Pacific | 9 | 0.0% |
| Hispanic or Latino | 11,349 | 36.3% |
| Native / Alaskan | 279 | 0.9% |
| White / Caucasian | 18,236 | 58.4% |
| Two or more Races | 5,445 | 17.4% |
| Some other Race | 2,687 | 8.6% |
| Total | 31,239 | 100.0% |
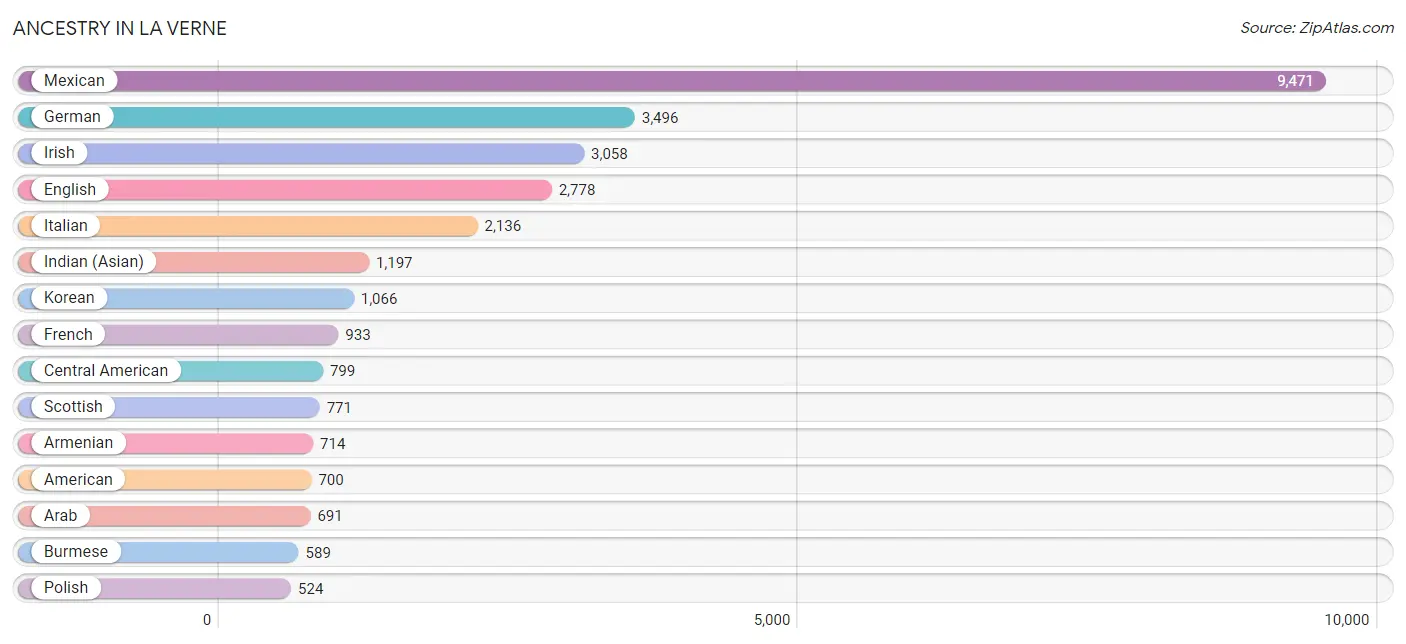
Ancestry in La Verne
The most populous ancestries reported in La Verne are Mexican (9,471 | 30.3%), German (3,496 | 11.2%), Irish (3,058 | 9.8%), English (2,778 | 8.9%), and Italian (2,136 | 6.8%), together accounting for 67.0% of all La Verne residents.
| Ancestry | # Population | % Population |
| African | 115 | 0.4% |
| Alaska Native | 9 | 0.0% |
| American | 700 | 2.2% |
| Apache | 33 | 0.1% |
| Arab | 691 | 2.2% |
| Argentinean | 24 | 0.1% |
| Armenian | 714 | 2.3% |
| Australian | 14 | 0.0% |
| Austrian | 28 | 0.1% |
| Barbadian | 18 | 0.1% |
| Basque | 17 | 0.1% |
| Belizean | 56 | 0.2% |
| Bhutanese | 322 | 1.0% |
| Blackfeet | 14 | 0.0% |
| Bolivian | 88 | 0.3% |
| Brazilian | 6 | 0.0% |
| British | 280 | 0.9% |
| Burmese | 589 | 1.9% |
| Canadian | 214 | 0.7% |
| Celtic | 7 | 0.0% |
| Central American | 799 | 2.6% |
| Cherokee | 22 | 0.1% |
| Chilean | 95 | 0.3% |
| Choctaw | 52 | 0.2% |
| Colombian | 32 | 0.1% |
| Costa Rican | 9 | 0.0% |
| Creek | 14 | 0.0% |
| Croatian | 8 | 0.0% |
| Cuban | 142 | 0.4% |
| Czech | 40 | 0.1% |
| Czechoslovakian | 77 | 0.3% |
| Danish | 83 | 0.3% |
| Dominican | 13 | 0.0% |
| Dutch | 350 | 1.1% |
| Eastern European | 43 | 0.1% |
| Ecuadorian | 8 | 0.0% |
| Egyptian | 5 | 0.0% |
| English | 2,778 | 8.9% |
| Ethiopian | 8 | 0.0% |
| European | 323 | 1.0% |
| Filipino | 185 | 0.6% |
| Finnish | 22 | 0.1% |
| French | 933 | 3.0% |
| French Canadian | 172 | 0.5% |
| German | 3,496 | 11.2% |
| Ghanaian | 13 | 0.0% |
| Greek | 246 | 0.8% |
| Guamanian / Chamorro | 17 | 0.1% |
| Guatemalan | 75 | 0.2% |
| Hungarian | 107 | 0.3% |
| Icelander | 16 | 0.1% |
| Indian (Asian) | 1,197 | 3.8% |
| Indonesian | 32 | 0.1% |
| Iranian | 46 | 0.2% |
| Irish | 3,058 | 9.8% |
| Israeli | 8 | 0.0% |
| Italian | 2,136 | 6.8% |
| Jamaican | 59 | 0.2% |
| Japanese | 57 | 0.2% |
| Jordanian | 205 | 0.7% |
| Kenyan | 7 | 0.0% |
| Korean | 1,066 | 3.4% |
| Laotian | 35 | 0.1% |
| Latvian | 42 | 0.1% |
| Lebanese | 245 | 0.8% |
| Lithuanian | 7 | 0.0% |
| Mexican | 9,471 | 30.3% |
| Mexican American Indian | 154 | 0.5% |
| Mongolian | 26 | 0.1% |
| Native Hawaiian | 23 | 0.1% |
| Nicaraguan | 308 | 1.0% |
| Nigerian | 49 | 0.2% |
| Northern European | 96 | 0.3% |
| Norwegian | 413 | 1.3% |
| Ottawa | 11 | 0.0% |
| Pakistani | 157 | 0.5% |
| Palestinian | 15 | 0.1% |
| Pennsylvania German | 11 | 0.0% |
| Peruvian | 127 | 0.4% |
| Polish | 524 | 1.7% |
| Portuguese | 113 | 0.4% |
| Puerto Rican | 216 | 0.7% |
| Russian | 86 | 0.3% |
| Salvadoran | 407 | 1.3% |
| Scandinavian | 183 | 0.6% |
| Scotch-Irish | 226 | 0.7% |
| Scottish | 771 | 2.5% |
| Sioux | 12 | 0.0% |
| Slovak | 31 | 0.1% |
| South American | 374 | 1.2% |
| South American Indian | 8 | 0.0% |
| Spaniard | 207 | 0.7% |
| Spanish | 104 | 0.3% |
| Sri Lankan | 216 | 0.7% |
| Subsaharan African | 192 | 0.6% |
| Swedish | 307 | 1.0% |
| Swiss | 54 | 0.2% |
| Syrian | 166 | 0.5% |
| Thai | 283 | 0.9% |
| Tohono O'Odham | 46 | 0.2% |
| Ukrainian | 58 | 0.2% |
| Welsh | 82 | 0.3% |
| Yugoslavian | 3 | 0.0% | View All 103 Rows |
Immigrants in La Verne
The most numerous immigrant groups reported in La Verne came from Asia (2,916 | 9.3%), Latin America (1,757 | 5.6%), Central America (1,491 | 4.8%), Eastern Asia (1,173 | 3.7%), and Mexico (1,103 | 3.5%), together accounting for 27.0% of all La Verne residents.
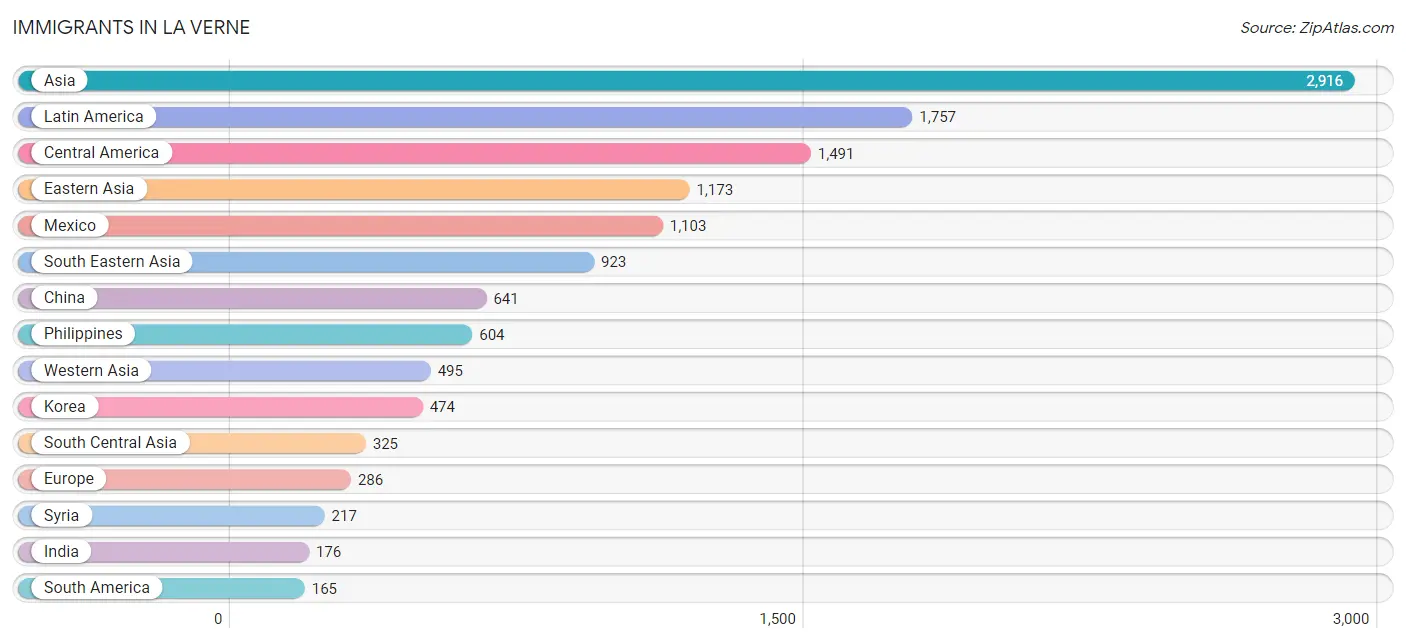
| Immigration Origin | # Population | % Population |
| Africa | 163 | 0.5% |
| Argentina | 32 | 0.1% |
| Armenia | 25 | 0.1% |
| Asia | 2,916 | 9.3% |
| Australia | 95 | 0.3% |
| Austria | 6 | 0.0% |
| Belize | 38 | 0.1% |
| Bolivia | 35 | 0.1% |
| Cambodia | 27 | 0.1% |
| Canada | 80 | 0.3% |
| Caribbean | 101 | 0.3% |
| Central America | 1,491 | 4.8% |
| Chile | 5 | 0.0% |
| China | 641 | 2.1% |
| Colombia | 20 | 0.1% |
| Croatia | 8 | 0.0% |
| Cuba | 101 | 0.3% |
| Eastern Africa | 55 | 0.2% |
| Eastern Asia | 1,173 | 3.7% |
| Eastern Europe | 118 | 0.4% |
| Ecuador | 8 | 0.0% |
| El Salvador | 116 | 0.4% |
| England | 59 | 0.2% |
| Ethiopia | 8 | 0.0% |
| Europe | 286 | 0.9% |
| Germany | 32 | 0.1% |
| Ghana | 13 | 0.0% |
| Guatemala | 75 | 0.2% |
| Hong Kong | 25 | 0.1% |
| Hungary | 8 | 0.0% |
| India | 176 | 0.6% |
| Indonesia | 20 | 0.1% |
| Iran | 54 | 0.2% |
| Ireland | 12 | 0.0% |
| Italy | 15 | 0.1% |
| Japan | 58 | 0.2% |
| Jordan | 147 | 0.5% |
| Kazakhstan | 7 | 0.0% |
| Kenya | 7 | 0.0% |
| Korea | 474 | 1.5% |
| Kuwait | 10 | 0.0% |
| Latin America | 1,757 | 5.6% |
| Lebanon | 96 | 0.3% |
| Malaysia | 8 | 0.0% |
| Mexico | 1,103 | 3.5% |
| Netherlands | 16 | 0.1% |
| Nicaragua | 159 | 0.5% |
| Nigeria | 54 | 0.2% |
| Northern Europe | 99 | 0.3% |
| Oceania | 110 | 0.4% |
| Pakistan | 60 | 0.2% |
| Peru | 65 | 0.2% |
| Philippines | 604 | 1.9% |
| Poland | 18 | 0.1% |
| Romania | 9 | 0.0% |
| Russia | 49 | 0.2% |
| South America | 165 | 0.5% |
| South Central Asia | 325 | 1.0% |
| South Eastern Asia | 923 | 2.9% |
| Southern Europe | 15 | 0.1% |
| Sri Lanka | 28 | 0.1% |
| Syria | 217 | 0.7% |
| Taiwan | 50 | 0.2% |
| Thailand | 138 | 0.4% |
| Ukraine | 19 | 0.1% |
| Vietnam | 111 | 0.4% |
| Western Africa | 73 | 0.2% |
| Western Asia | 495 | 1.6% |
| Western Europe | 54 | 0.2% | View All 69 Rows |
Sex and Age in La Verne
Sex and Age in La Verne
The most populous age groups in La Verne are 60 to 64 Years (1,276 | 8.4%) for men and 65 to 69 Years (1,440 | 8.9%) for women.
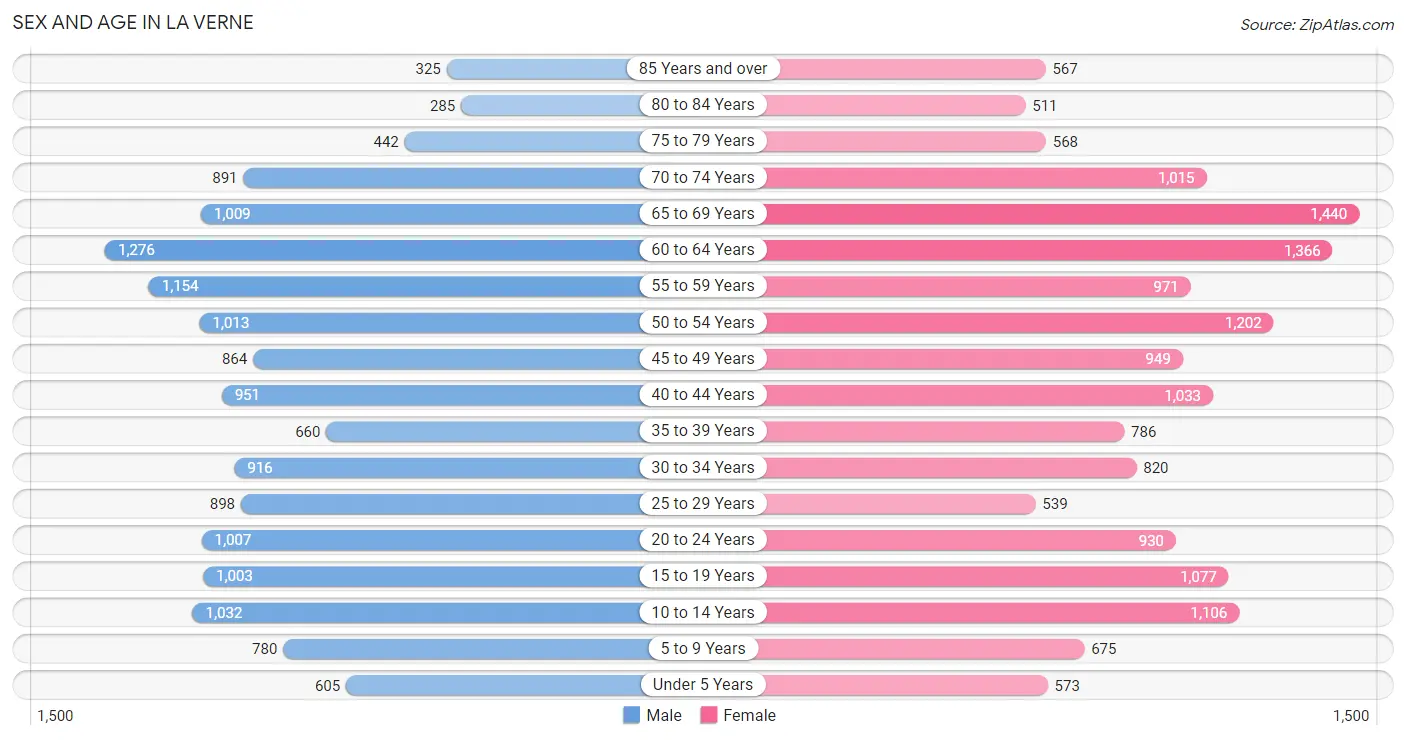
| Age Bracket | Male | Female |
| Under 5 Years | 605 (4.0%) | 573 (3.5%) |
| 5 to 9 Years | 780 (5.2%) | 675 (4.2%) |
| 10 to 14 Years | 1,032 (6.8%) | 1,106 (6.9%) |
| 15 to 19 Years | 1,003 (6.6%) | 1,077 (6.7%) |
| 20 to 24 Years | 1,007 (6.7%) | 930 (5.8%) |
| 25 to 29 Years | 898 (5.9%) | 539 (3.3%) |
| 30 to 34 Years | 916 (6.1%) | 820 (5.1%) |
| 35 to 39 Years | 660 (4.4%) | 786 (4.9%) |
| 40 to 44 Years | 951 (6.3%) | 1,033 (6.4%) |
| 45 to 49 Years | 864 (5.7%) | 949 (5.9%) |
| 50 to 54 Years | 1,013 (6.7%) | 1,202 (7.4%) |
| 55 to 59 Years | 1,154 (7.6%) | 971 (6.0%) |
| 60 to 64 Years | 1,276 (8.4%) | 1,366 (8.5%) |
| 65 to 69 Years | 1,009 (6.7%) | 1,440 (8.9%) |
| 70 to 74 Years | 891 (5.9%) | 1,015 (6.3%) |
| 75 to 79 Years | 442 (2.9%) | 568 (3.5%) |
| 80 to 84 Years | 285 (1.9%) | 511 (3.2%) |
| 85 Years and over | 325 (2.1%) | 567 (3.5%) |
| Total | 15,111 (100.0%) | 16,128 (100.0%) |
Families and Households in La Verne
Median Family Size in La Verne
The median family size in La Verne is 3.13 persons per family, with single female/mother families (1,501 | 18.3%) accounting for the largest median family size of 3.19 persons per family. On the other hand, single male/father families (539 | 6.6%) represent the smallest median family size with 2.80 persons per family.
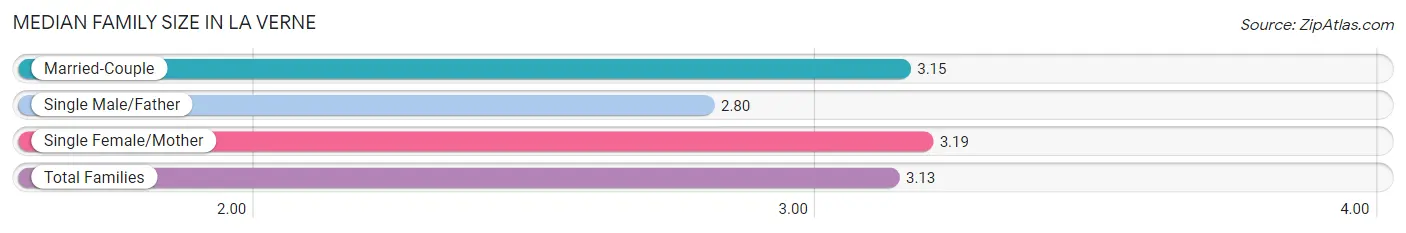
| Family Type | # Families | Family Size |
| Married-Couple | 6,180 (75.2%) | 3.15 |
| Single Male/Father | 539 (6.6%) | 2.80 |
| Single Female/Mother | 1,501 (18.3%) | 3.19 |
| Total Families | 8,220 (100.0%) | 3.13 |
Median Household Size in La Verne
The median household size in La Verne is 2.64 persons per household, with single female/mother households (1,501 | 13.0%) accounting for the largest median household size of 3.37 persons per household. non-family households (3,370 | 29.1%) represent the smallest median household size with 1.27 persons per household.
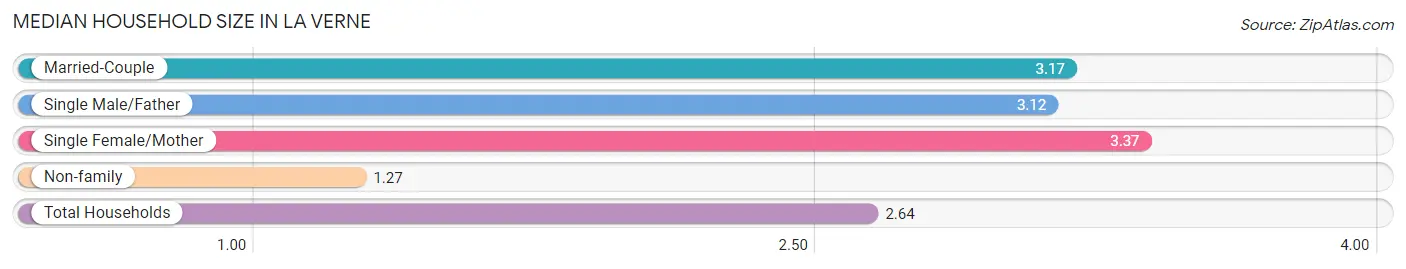
| Household Type | # Households | Household Size |
| Married-Couple | 6,180 (53.3%) | 3.17 |
| Single Male/Father | 539 (4.6%) | 3.12 |
| Single Female/Mother | 1,501 (13.0%) | 3.37 |
| Non-family | 3,370 (29.1%) | 1.27 |
| Total Households | 11,590 (100.0%) | 2.64 |
Household Size by Marriage Status in La Verne
Out of a total of 11,590 households in La Verne, 8,220 (70.9%) are family households, while 3,370 (29.1%) are nonfamily households. The most numerous type of family households are 2-person households, comprising 3,656, and the most common type of nonfamily households are 1-person households, comprising 2,760.
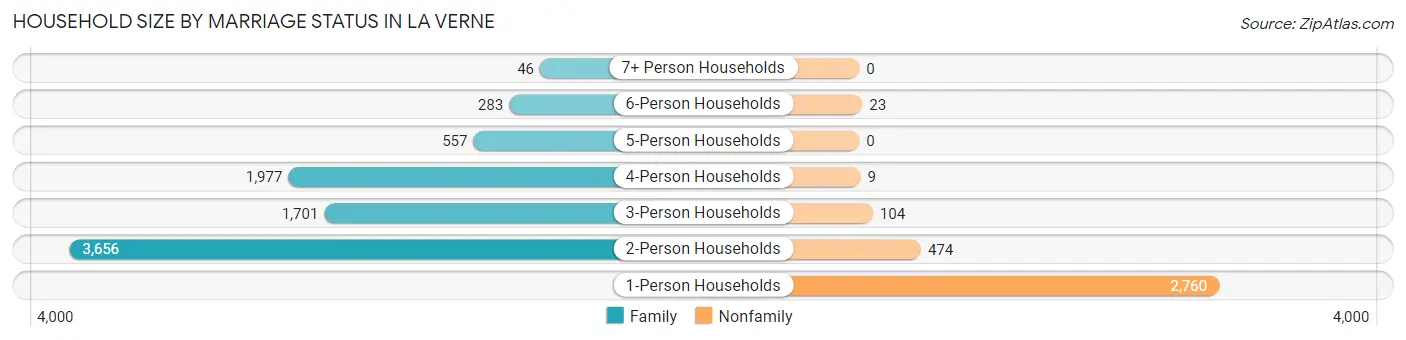
| Household Size | Family Households | Nonfamily Households |
| 1-Person Households | - | 2,760 (23.8%) |
| 2-Person Households | 3,656 (31.5%) | 474 (4.1%) |
| 3-Person Households | 1,701 (14.7%) | 104 (0.9%) |
| 4-Person Households | 1,977 (17.1%) | 9 (0.1%) |
| 5-Person Households | 557 (4.8%) | 0 (0.0%) |
| 6-Person Households | 283 (2.4%) | 23 (0.2%) |
| 7+ Person Households | 46 (0.4%) | 0 (0.0%) |
| Total | 8,220 (70.9%) | 3,370 (29.1%) |
Female Fertility in La Verne
Fertility by Age in La Verne
Average fertility rate in La Verne is 29.0 births per 1,000 women. Women in the age bracket of 15 to 19 years have the highest fertility rate with 37.0 births per 1,000 women. Women in the age bracket of 35 to 50 years acount for 51.9% of all women with births.
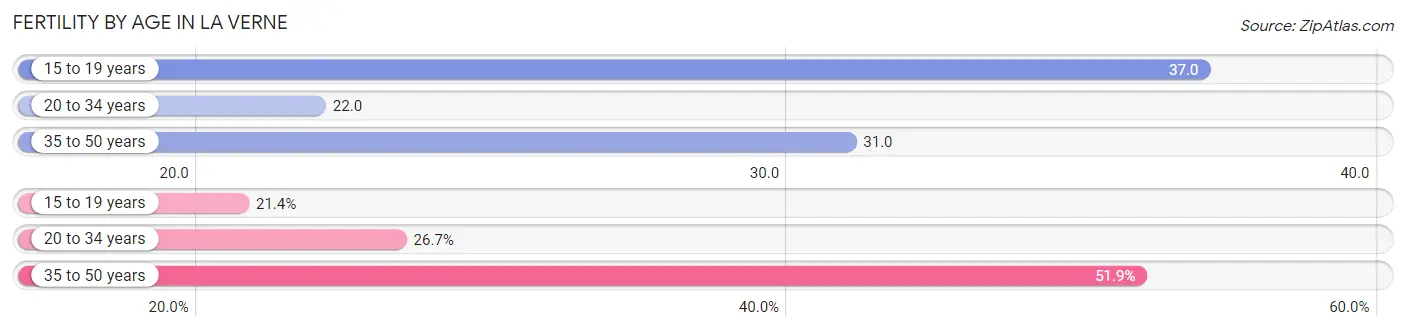
| Age Bracket | Women with Births | Births / 1,000 Women |
| 15 to 19 years | 40 (21.4%) | 37.0 |
| 20 to 34 years | 50 (26.7%) | 22.0 |
| 35 to 50 years | 97 (51.9%) | 31.0 |
| Total | 187 (100.0%) | 29.0 |
Fertility by Age by Marriage Status in La Verne
52.4% of women with births (187) in La Verne are married. The highest percentage of unmarried women with births falls into 15 to 19 years age bracket with 100.0% of them unmarried at the time of birth, while the lowest percentage of unmarried women with births belong to 35 to 50 years age bracket with 28.9% of them unmarried.
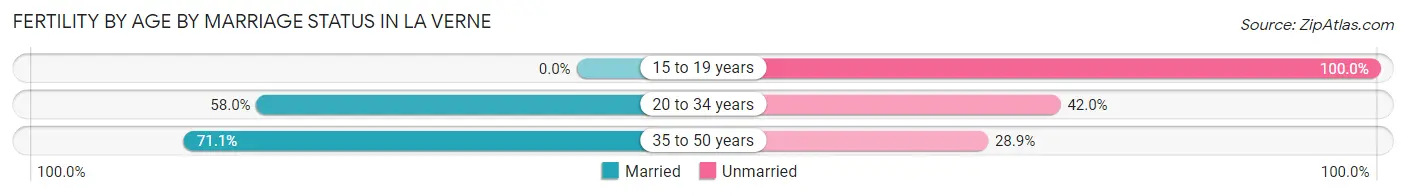
| Age Bracket | Married | Unmarried |
| 15 to 19 years | 0 (0.0%) | 40 (100.0%) |
| 20 to 34 years | 29 (58.0%) | 21 (42.0%) |
| 35 to 50 years | 69 (71.1%) | 28 (28.9%) |
| Total | 98 (52.4%) | 89 (47.6%) |
Fertility by Education in La Verne
Average fertility rate in La Verne is 29.0 births per 1,000 women. Women with the education attainment of graduate degree have the highest fertility rate of 46.0 births per 1,000 women, while women with the education attainment of high school diploma have the lowest fertility at 9.0 births per 1,000 women. Women with the education attainment of college or associate's degree represent 36.4% of all women with births.
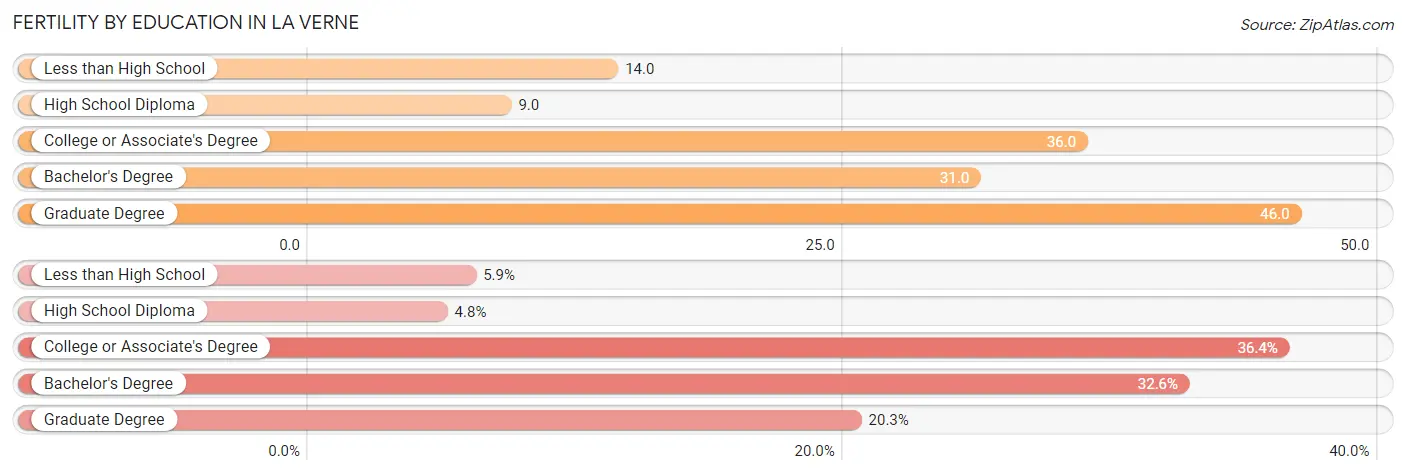
| Educational Attainment | Women with Births | Births / 1,000 Women |
| Less than High School | 11 (5.9%) | 14.0 |
| High School Diploma | 9 (4.8%) | 9.0 |
| College or Associate's Degree | 68 (36.4%) | 36.0 |
| Bachelor's Degree | 61 (32.6%) | 31.0 |
| Graduate Degree | 38 (20.3%) | 46.0 |
| Total | 187 (100.0%) | 29.0 |
Fertility by Education by Marriage Status in La Verne
47.6% of women with births in La Verne are unmarried. Women with the educational attainment of less than high school are most likely to be married with 100.0% of them married at childbirth, while women with the educational attainment of college or associate's degree are least likely to be married with 100.0% of them unmarried at childbirth.
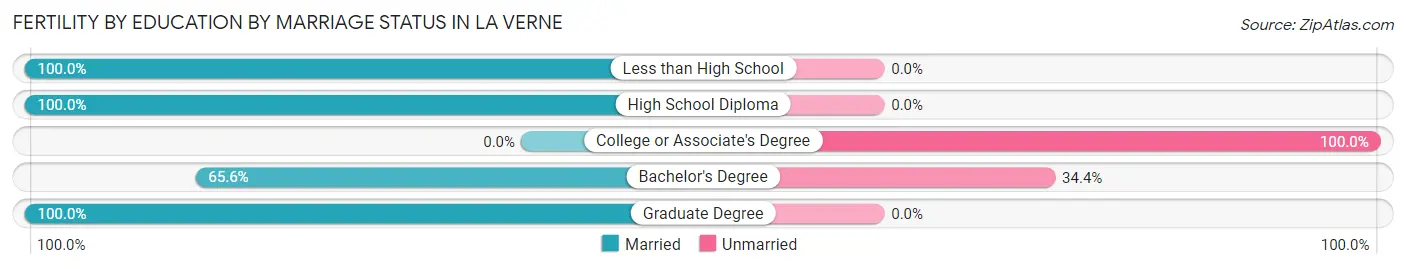
| Educational Attainment | Married | Unmarried |
| Less than High School | 11 (100.0%) | 0 (0.0%) |
| High School Diploma | 9 (100.0%) | 0 (0.0%) |
| College or Associate's Degree | 0 (0.0%) | 68 (100.0%) |
| Bachelor's Degree | 40 (65.6%) | 21 (34.4%) |
| Graduate Degree | 38 (100.0%) | 0 (0.0%) |
| Total | 98 (52.4%) | 89 (47.6%) |
Employment Characteristics in La Verne
Employment by Class of Employer in La Verne
Among the 14,155 employed individuals in La Verne, private company employees (8,173 | 57.7%), local government employees (1,743 | 12.3%), and not-for-profit organizations (1,531 | 10.8%) make up the most common classes of employment.
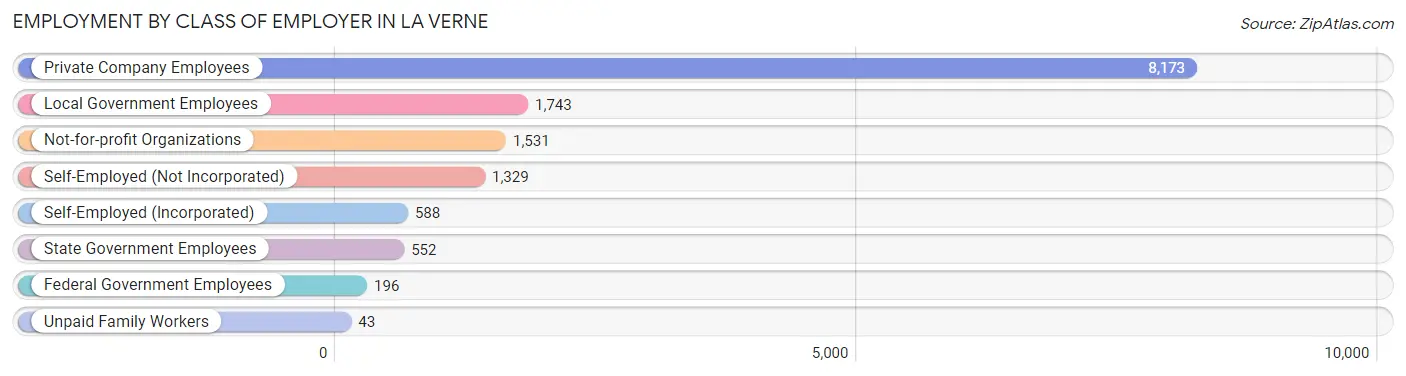
| Employer Class | # Employees | % Employees |
| Private Company Employees | 8,173 | 57.7% |
| Self-Employed (Incorporated) | 588 | 4.2% |
| Self-Employed (Not Incorporated) | 1,329 | 9.4% |
| Not-for-profit Organizations | 1,531 | 10.8% |
| Local Government Employees | 1,743 | 12.3% |
| State Government Employees | 552 | 3.9% |
| Federal Government Employees | 196 | 1.4% |
| Unpaid Family Workers | 43 | 0.3% |
| Total | 14,155 | 100.0% |
Employment Status by Age in La Verne
According to the labor force statistics for La Verne, out of the total population over 16 years of age (25,975), 60.3% or 15,663 individuals are in the labor force, with 6.4% or 1,002 of them unemployed. The age group with the highest labor force participation rate is 30 to 34 years, with 86.2% or 1,496 individuals in the labor force. Within the labor force, the 20 to 24 years age range has the highest percentage of unemployed individuals, with 13.1% or 195 of them being unemployed.
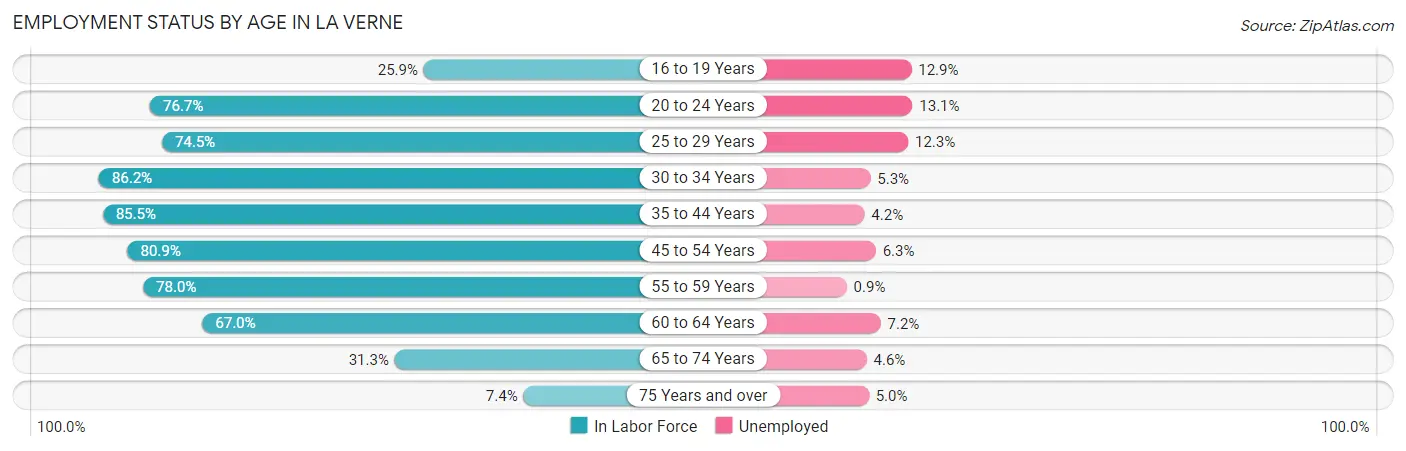
| Age Bracket | In Labor Force | Unemployed |
| 16 to 19 Years | 411 (25.9%) | 53 (12.9%) |
| 20 to 24 Years | 1,486 (76.7%) | 195 (13.1%) |
| 25 to 29 Years | 1,071 (74.5%) | 132 (12.3%) |
| 30 to 34 Years | 1,496 (86.2%) | 79 (5.3%) |
| 35 to 44 Years | 2,933 (85.5%) | 123 (4.2%) |
| 45 to 54 Years | 3,259 (80.9%) | 205 (6.3%) |
| 55 to 59 Years | 1,658 (78.0%) | 15 (0.9%) |
| 60 to 64 Years | 1,770 (67.0%) | 127 (7.2%) |
| 65 to 74 Years | 1,363 (31.3%) | 63 (4.6%) |
| 75 Years and over | 200 (7.4%) | 10 (5.0%) |
| Total | 15,663 (60.3%) | 1,002 (6.4%) |
Employment Status by Educational Attainment in La Verne
According to labor force statistics for La Verne, 79.2% of individuals (12,195) out of the total population between 25 and 64 years of age (15,398) are in the labor force, with 5.6% or 683 of them being unemployed. The group with the highest labor force participation rate are those with the educational attainment of bachelor's degree or higher, with 85.4% or 5,845 individuals in the labor force. Within the labor force, individuals with high school diploma education have the highest percentage of unemployment, with 8.9% or 165 of them being unemployed.
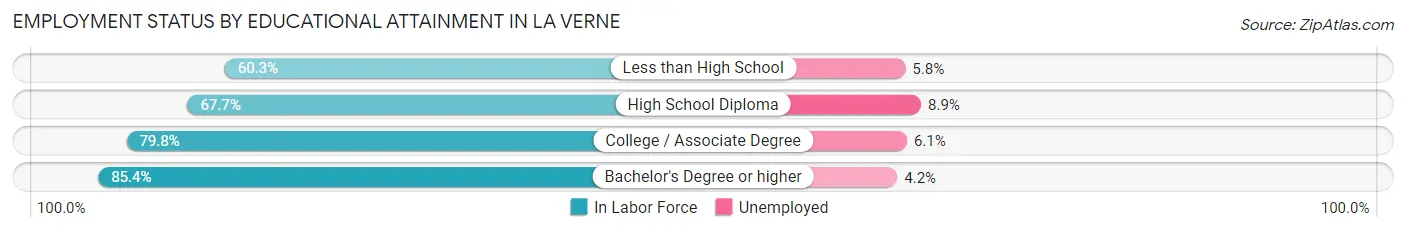
| Educational Attainment | In Labor Force | Unemployed |
| Less than High School | 465 (60.3%) | 45 (5.8%) |
| High School Diploma | 1,859 (67.7%) | 244 (8.9%) |
| College / Associate Degree | 4,020 (79.8%) | 307 (6.1%) |
| Bachelor's Degree or higher | 5,845 (85.4%) | 287 (4.2%) |
| Total | 12,195 (79.2%) | 862 (5.6%) |
Employment Occupations by Sex in La Verne
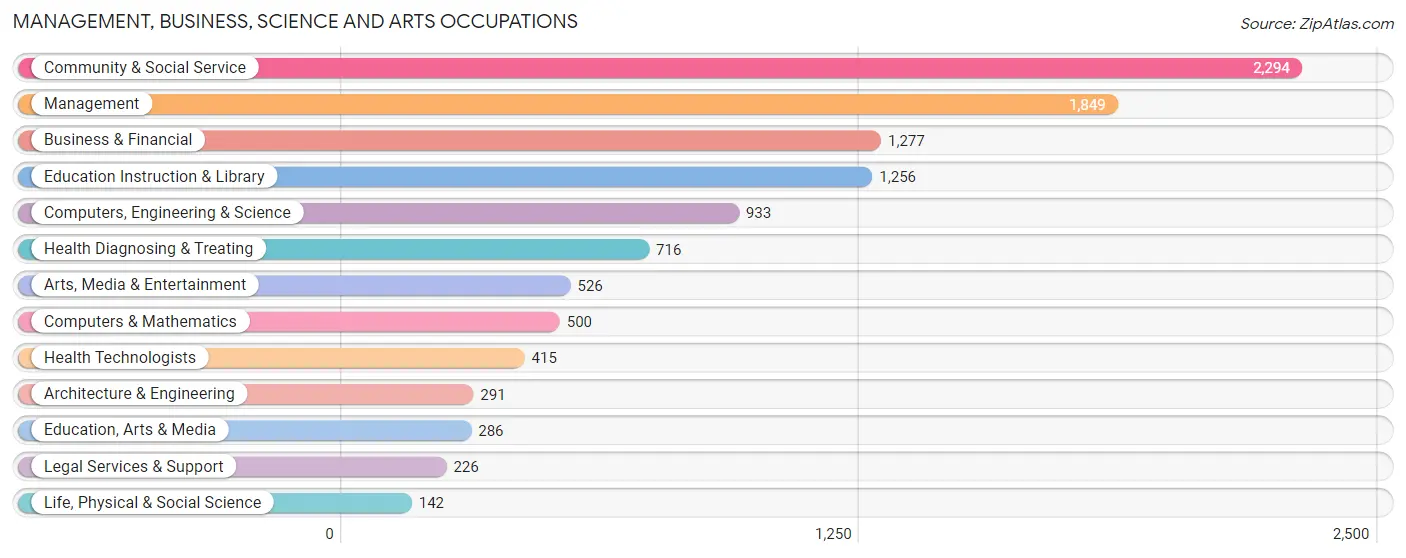
Management, Business, Science and Arts Occupations
The most common Management, Business, Science and Arts occupations in La Verne are Community & Social Service (2,294 | 15.7%), Management (1,849 | 12.6%), Business & Financial (1,277 | 8.7%), Education Instruction & Library (1,256 | 8.6%), and Computers, Engineering & Science (933 | 6.4%).
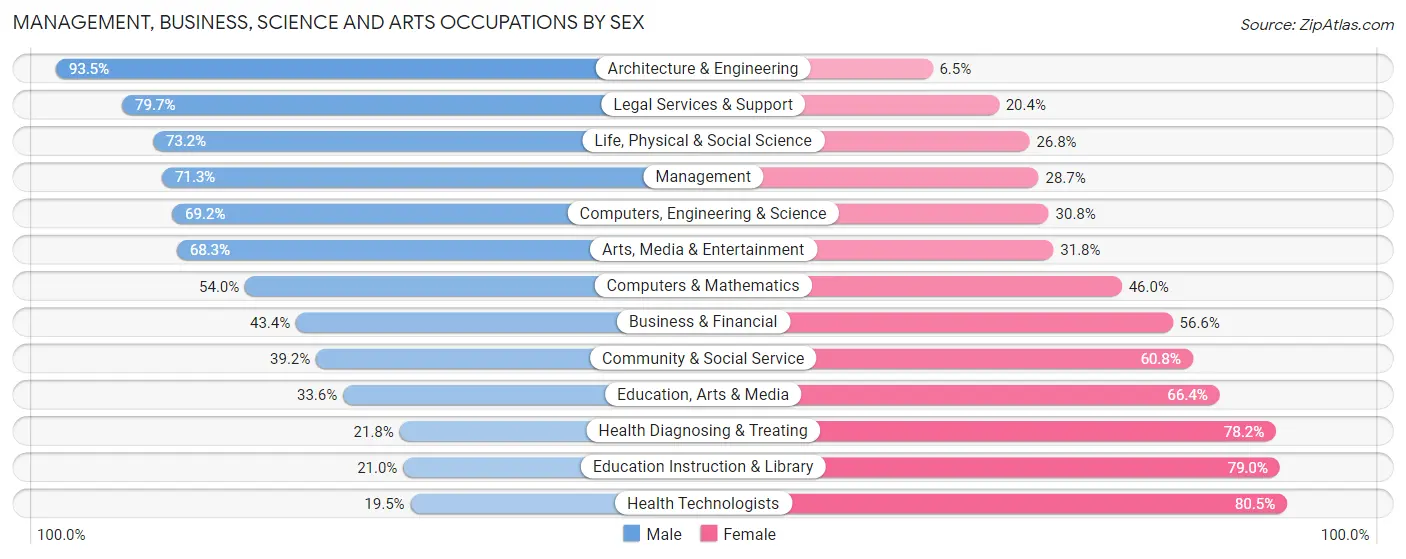
Management, Business, Science and Arts Occupations by Sex
Within the Management, Business, Science and Arts occupations in La Verne, the most male-oriented occupations are Architecture & Engineering (93.5%), Legal Services & Support (79.6%), and Life, Physical & Social Science (73.2%), while the most female-oriented occupations are Health Technologists (80.5%), Education Instruction & Library (79.0%), and Health Diagnosing & Treating (78.2%).
| Occupation | Male | Female |
| Management | 1,319 (71.3%) | 530 (28.7%) |
| Business & Financial | 554 (43.4%) | 723 (56.6%) |
| Computers, Engineering & Science | 646 (69.2%) | 287 (30.8%) |
| Computers & Mathematics | 270 (54.0%) | 230 (46.0%) |
| Architecture & Engineering | 272 (93.5%) | 19 (6.5%) |
| Life, Physical & Social Science | 104 (73.2%) | 38 (26.8%) |
| Community & Social Service | 899 (39.2%) | 1,395 (60.8%) |
| Education, Arts & Media | 96 (33.6%) | 190 (66.4%) |
| Legal Services & Support | 180 (79.6%) | 46 (20.3%) |
| Education Instruction & Library | 264 (21.0%) | 992 (79.0%) |
| Arts, Media & Entertainment | 359 (68.2%) | 167 (31.8%) |
| Health Diagnosing & Treating | 156 (21.8%) | 560 (78.2%) |
| Health Technologists | 81 (19.5%) | 334 (80.5%) |
| Total (Category) | 3,574 (50.6%) | 3,495 (49.4%) |
| Total (Overall) | 7,856 (53.6%) | 6,790 (46.4%) |
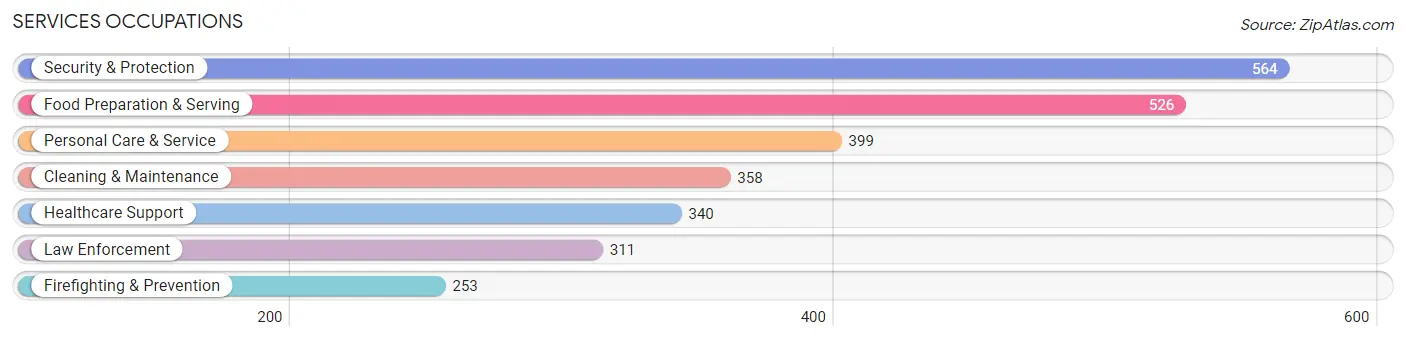
Services Occupations
The most common Services occupations in La Verne are Security & Protection (564 | 3.8%), Food Preparation & Serving (526 | 3.6%), Personal Care & Service (399 | 2.7%), Cleaning & Maintenance (358 | 2.4%), and Healthcare Support (340 | 2.3%).
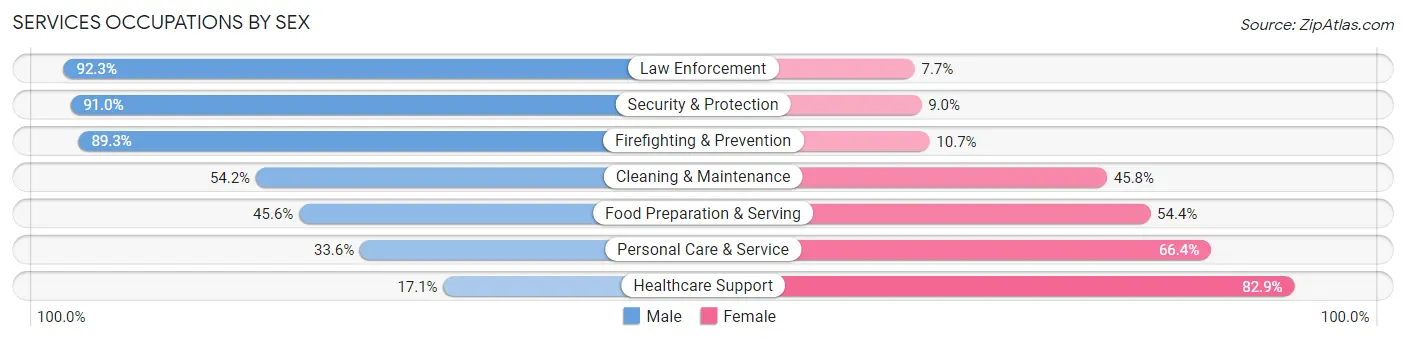
Services Occupations by Sex
Within the Services occupations in La Verne, the most male-oriented occupations are Law Enforcement (92.3%), Security & Protection (91.0%), and Firefighting & Prevention (89.3%), while the most female-oriented occupations are Healthcare Support (82.9%), Personal Care & Service (66.4%), and Food Preparation & Serving (54.4%).
| Occupation | Male | Female |
| Healthcare Support | 58 (17.1%) | 282 (82.9%) |
| Security & Protection | 513 (91.0%) | 51 (9.0%) |
| Firefighting & Prevention | 226 (89.3%) | 27 (10.7%) |
| Law Enforcement | 287 (92.3%) | 24 (7.7%) |
| Food Preparation & Serving | 240 (45.6%) | 286 (54.4%) |
| Cleaning & Maintenance | 194 (54.2%) | 164 (45.8%) |
| Personal Care & Service | 134 (33.6%) | 265 (66.4%) |
| Total (Category) | 1,139 (52.1%) | 1,048 (47.9%) |
| Total (Overall) | 7,856 (53.6%) | 6,790 (46.4%) |
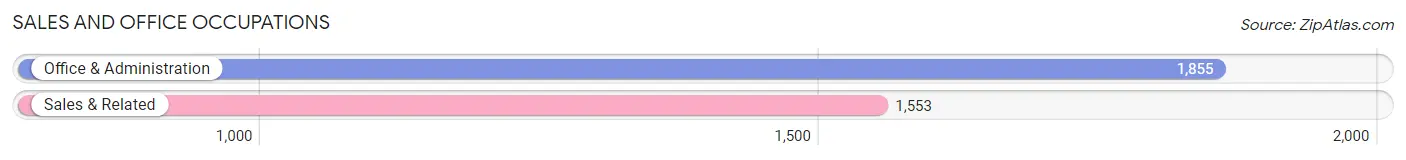
Sales and Office Occupations
The most common Sales and Office occupations in La Verne are Office & Administration (1,855 | 12.7%), and Sales & Related (1,553 | 10.6%).
Sales and Office Occupations by Sex
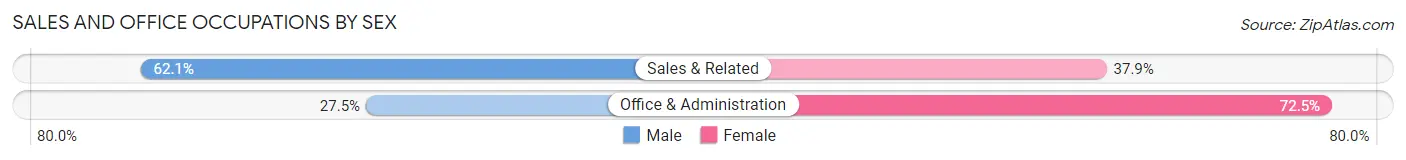
| Occupation | Male | Female |
| Sales & Related | 965 (62.1%) | 588 (37.9%) |
| Office & Administration | 510 (27.5%) | 1,345 (72.5%) |
| Total (Category) | 1,475 (43.3%) | 1,933 (56.7%) |
| Total (Overall) | 7,856 (53.6%) | 6,790 (46.4%) |
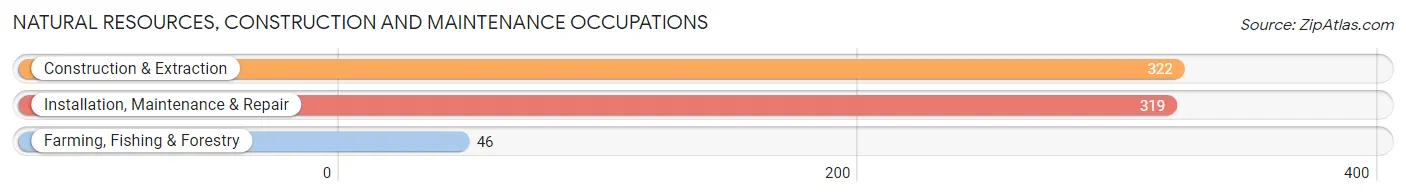
Natural Resources, Construction and Maintenance Occupations
The most common Natural Resources, Construction and Maintenance occupations in La Verne are Construction & Extraction (322 | 2.2%), Installation, Maintenance & Repair (319 | 2.2%), and Farming, Fishing & Forestry (46 | 0.3%).
Natural Resources, Construction and Maintenance Occupations by Sex
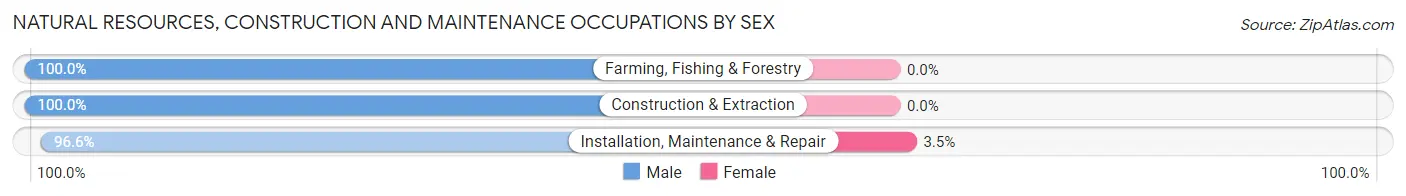
| Occupation | Male | Female |
| Farming, Fishing & Forestry | 46 (100.0%) | 0 (0.0%) |
| Construction & Extraction | 322 (100.0%) | 0 (0.0%) |
| Installation, Maintenance & Repair | 308 (96.6%) | 11 (3.5%) |
| Total (Category) | 676 (98.4%) | 11 (1.6%) |
| Total (Overall) | 7,856 (53.6%) | 6,790 (46.4%) |
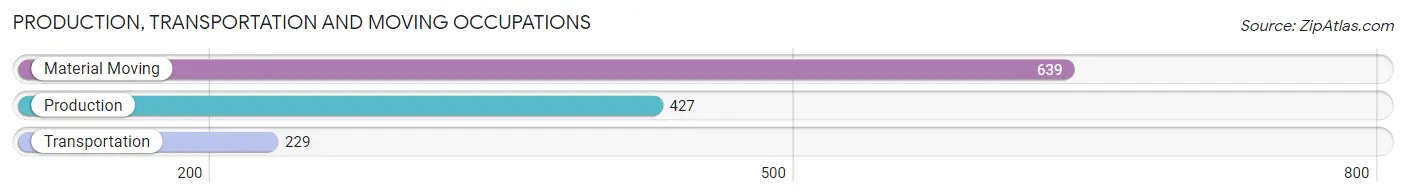
Production, Transportation and Moving Occupations
The most common Production, Transportation and Moving occupations in La Verne are Material Moving (639 | 4.4%), Production (427 | 2.9%), and Transportation (229 | 1.6%).
Production, Transportation and Moving Occupations by Sex
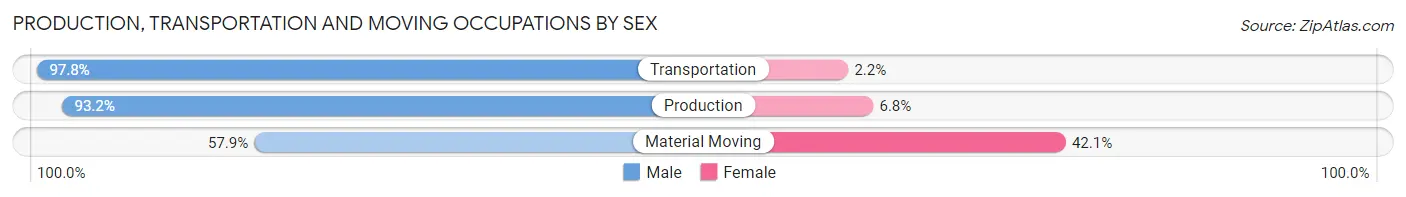
| Occupation | Male | Female |
| Production | 398 (93.2%) | 29 (6.8%) |
| Transportation | 224 (97.8%) | 5 (2.2%) |
| Material Moving | 370 (57.9%) | 269 (42.1%) |
| Total (Category) | 992 (76.6%) | 303 (23.4%) |
| Total (Overall) | 7,856 (53.6%) | 6,790 (46.4%) |
Employment Industries by Sex in La Verne
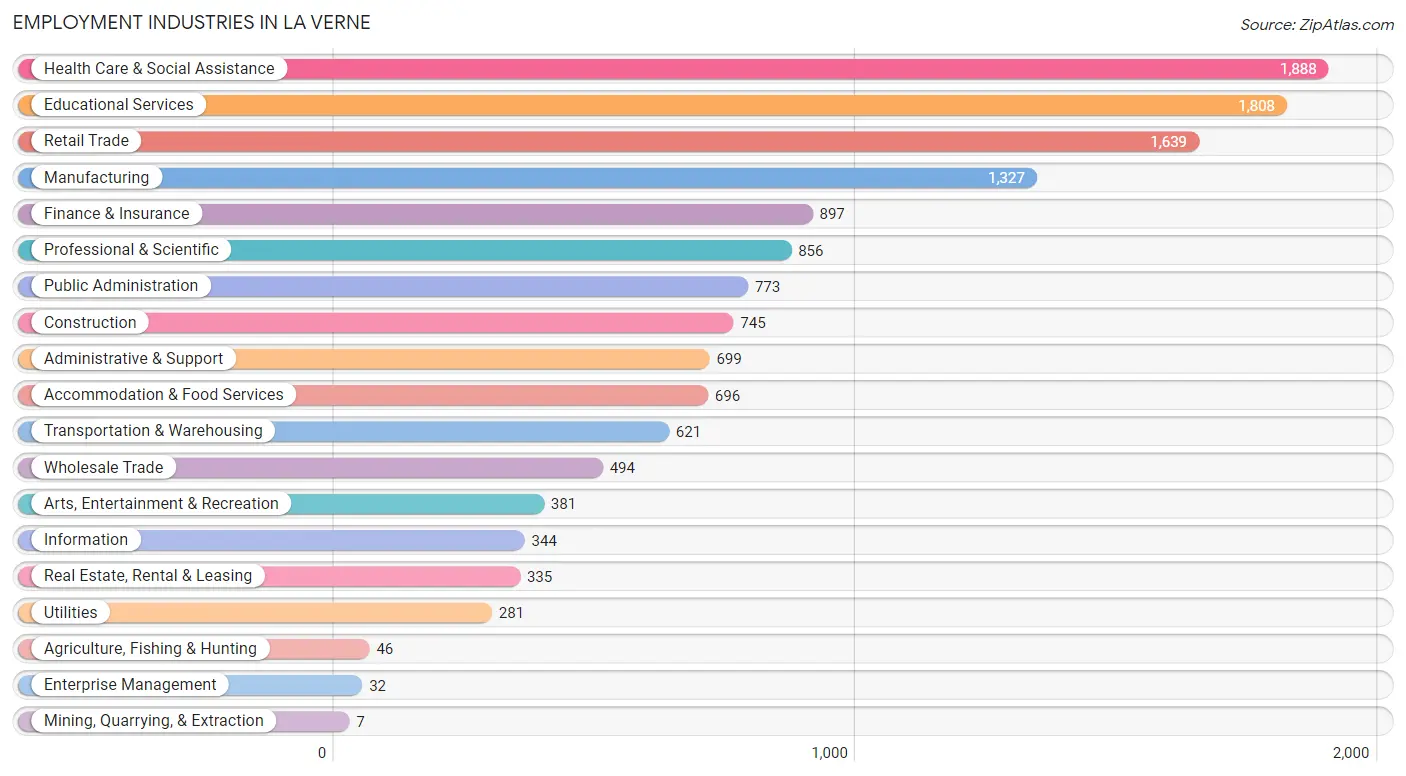
Employment Industries in La Verne
The major employment industries in La Verne include Health Care & Social Assistance (1,888 | 12.9%), Educational Services (1,808 | 12.3%), Retail Trade (1,639 | 11.2%), Manufacturing (1,327 | 9.1%), and Finance & Insurance (897 | 6.1%).
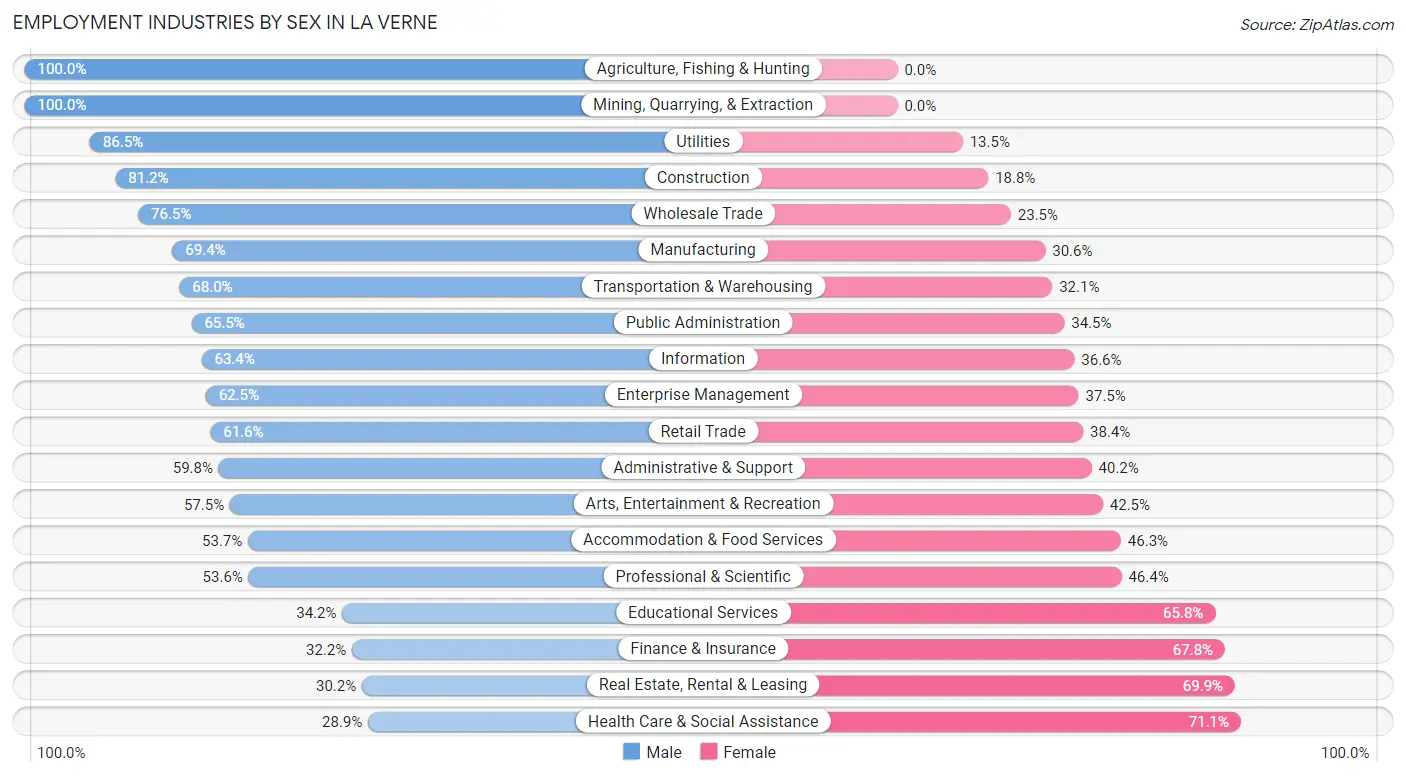
Employment Industries by Sex in La Verne
The La Verne industries that see more men than women are Agriculture, Fishing & Hunting (100.0%), Mining, Quarrying, & Extraction (100.0%), and Utilities (86.5%), whereas the industries that tend to have a higher number of women are Health Care & Social Assistance (71.1%), Real Estate, Rental & Leasing (69.9%), and Finance & Insurance (67.8%).
| Industry | Male | Female |
| Agriculture, Fishing & Hunting | 46 (100.0%) | 0 (0.0%) |
| Mining, Quarrying, & Extraction | 7 (100.0%) | 0 (0.0%) |
| Construction | 605 (81.2%) | 140 (18.8%) |
| Manufacturing | 921 (69.4%) | 406 (30.6%) |
| Wholesale Trade | 378 (76.5%) | 116 (23.5%) |
| Retail Trade | 1,009 (61.6%) | 630 (38.4%) |
| Transportation & Warehousing | 422 (67.9%) | 199 (32.1%) |
| Utilities | 243 (86.5%) | 38 (13.5%) |
| Information | 218 (63.4%) | 126 (36.6%) |
| Finance & Insurance | 289 (32.2%) | 608 (67.8%) |
| Real Estate, Rental & Leasing | 101 (30.1%) | 234 (69.9%) |
| Professional & Scientific | 459 (53.6%) | 397 (46.4%) |
| Enterprise Management | 20 (62.5%) | 12 (37.5%) |
| Administrative & Support | 418 (59.8%) | 281 (40.2%) |
| Educational Services | 619 (34.2%) | 1,189 (65.8%) |
| Health Care & Social Assistance | 546 (28.9%) | 1,342 (71.1%) |
| Arts, Entertainment & Recreation | 219 (57.5%) | 162 (42.5%) |
| Accommodation & Food Services | 374 (53.7%) | 322 (46.3%) |
| Public Administration | 506 (65.5%) | 267 (34.5%) |
| Total | 7,856 (53.6%) | 6,790 (46.4%) |
Education in La Verne
School Enrollment in La Verne
The most common levels of schooling among the 8,058 students in La Verne are college / undergraduate (2,126 | 26.4%), high school (1,731 | 21.5%), and middle school (1,550 | 19.2%).
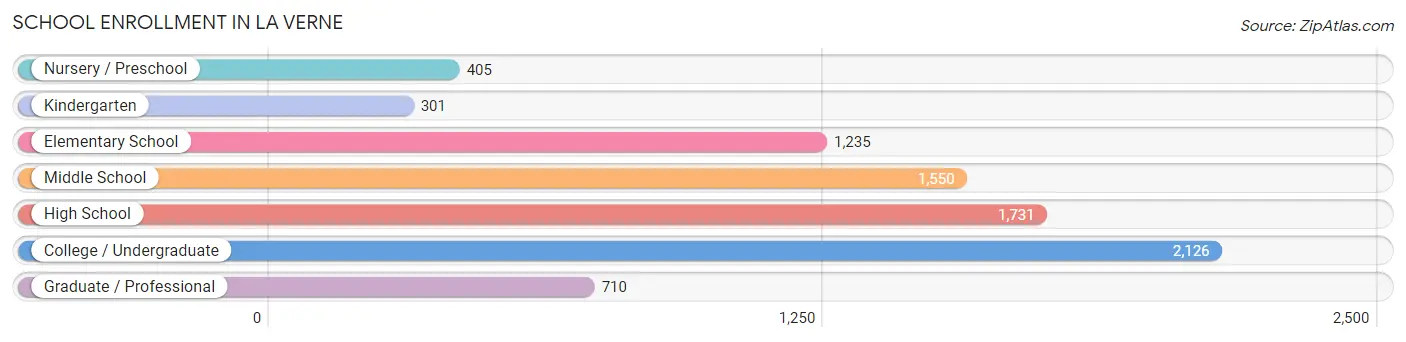
| School Level | # Students | % Students |
| Nursery / Preschool | 405 | 5.0% |
| Kindergarten | 301 | 3.7% |
| Elementary School | 1,235 | 15.3% |
| Middle School | 1,550 | 19.2% |
| High School | 1,731 | 21.5% |
| College / Undergraduate | 2,126 | 26.4% |
| Graduate / Professional | 710 | 8.8% |
| Total | 8,058 | 100.0% |
School Enrollment by Age by Funding Source in La Verne
Out of a total of 8,058 students who are enrolled in schools in La Verne, 2,103 (26.1%) attend a private institution, while the remaining 5,955 (73.9%) are enrolled in public schools. The age group of 25 to 34 year olds has the highest likelihood of being enrolled in private schools, with 419 (65.2% in the age bracket) enrolled. Conversely, the age group of 10 to 14 year olds has the lowest likelihood of being enrolled in a private school, with 1,844 (87.2% in the age bracket) attending a public institution.
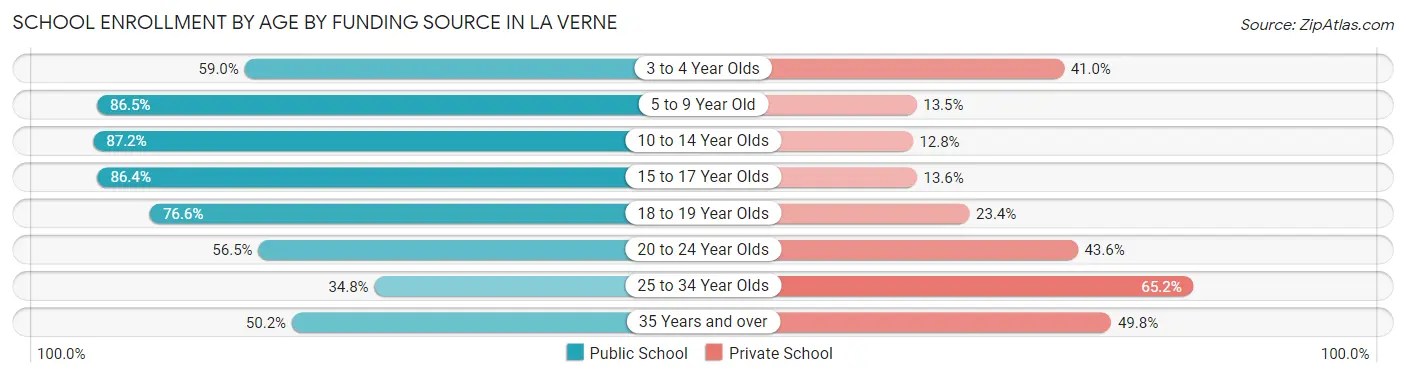
| Age Bracket | Public School | Private School |
| 3 to 4 Year Olds | 229 (59.0%) | 159 (41.0%) |
| 5 to 9 Year Old | 1,177 (86.5%) | 184 (13.5%) |
| 10 to 14 Year Olds | 1,844 (87.2%) | 271 (12.8%) |
| 15 to 17 Year Olds | 1,012 (86.4%) | 159 (13.6%) |
| 18 to 19 Year Olds | 584 (76.6%) | 178 (23.4%) |
| 20 to 24 Year Olds | 648 (56.5%) | 500 (43.5%) |
| 25 to 34 Year Olds | 224 (34.8%) | 419 (65.2%) |
| 35 Years and over | 236 (50.2%) | 234 (49.8%) |
| Total | 5,955 (73.9%) | 2,103 (26.1%) |
Educational Attainment by Field of Study in La Verne
Business (1,710 | 17.2%), social sciences (974 | 9.8%), science & technology (969 | 9.8%), engineering (826 | 8.3%), and arts & humanities (727 | 7.3%) are the most common fields of study among 9,943 individuals in La Verne who have obtained a bachelor's degree or higher.
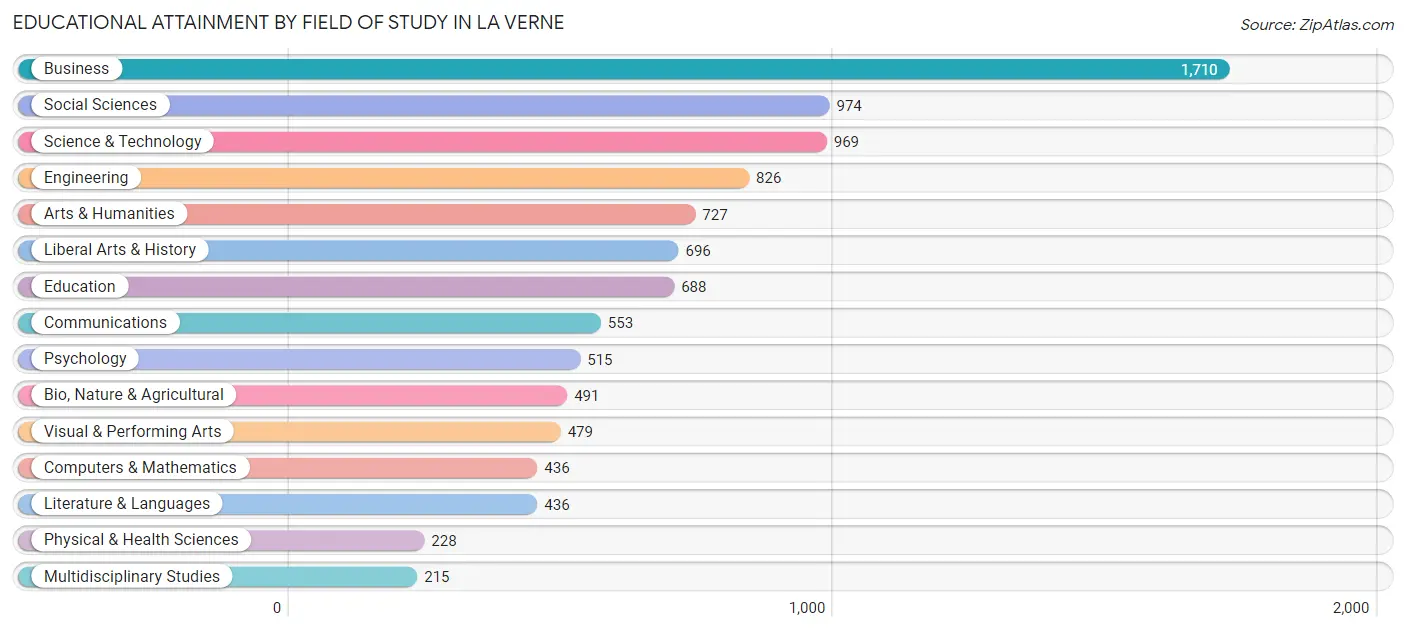
| Field of Study | # Graduates | % Graduates |
| Computers & Mathematics | 436 | 4.4% |
| Bio, Nature & Agricultural | 491 | 4.9% |
| Physical & Health Sciences | 228 | 2.3% |
| Psychology | 515 | 5.2% |
| Social Sciences | 974 | 9.8% |
| Engineering | 826 | 8.3% |
| Multidisciplinary Studies | 215 | 2.2% |
| Science & Technology | 969 | 9.8% |
| Business | 1,710 | 17.2% |
| Education | 688 | 6.9% |
| Literature & Languages | 436 | 4.4% |
| Liberal Arts & History | 696 | 7.0% |
| Visual & Performing Arts | 479 | 4.8% |
| Communications | 553 | 5.6% |
| Arts & Humanities | 727 | 7.3% |
| Total | 9,943 | 100.0% |
Transportation & Commute in La Verne
Vehicle Availability by Sex in La Verne
The most prevalent vehicle ownership categories in La Verne are males with 2 vehicles (3,005, accounting for 39.8%) and females with 2 vehicles (2,324, making up 46.6%).
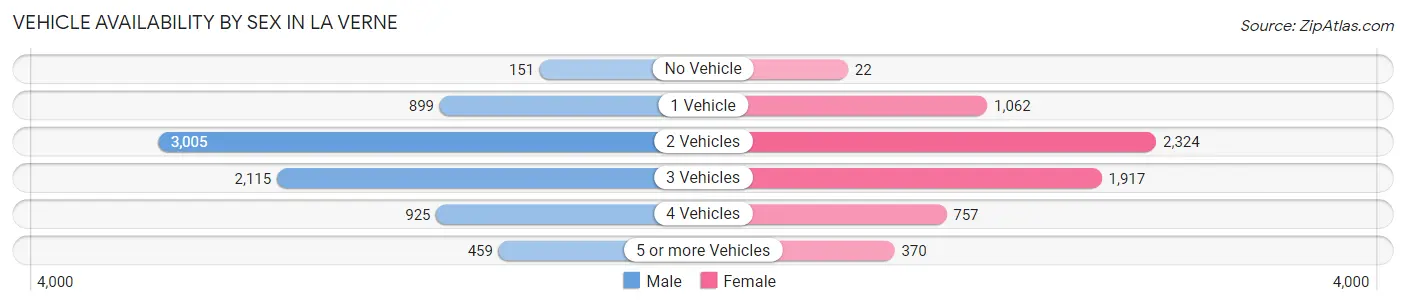
| Vehicles Available | Male | Female |
| No Vehicle | 151 (2.0%) | 22 (0.3%) |
| 1 Vehicle | 899 (11.9%) | 1,062 (16.5%) |
| 2 Vehicles | 3,005 (39.8%) | 2,324 (36.0%) |
| 3 Vehicles | 2,115 (28.0%) | 1,917 (29.7%) |
| 4 Vehicles | 925 (12.2%) | 757 (11.7%) |
| 5 or more Vehicles | 459 (6.1%) | 370 (5.7%) |
| Total | 7,554 (100.0%) | 6,452 (100.0%) |
Commute Time in La Verne
The most frequently occuring commute durations in La Verne are 10 to 14 minutes (1,545 commuters, 13.0%), 20 to 24 minutes (1,490 commuters, 12.6%), and 30 to 34 minutes (1,488 commuters, 12.5%).
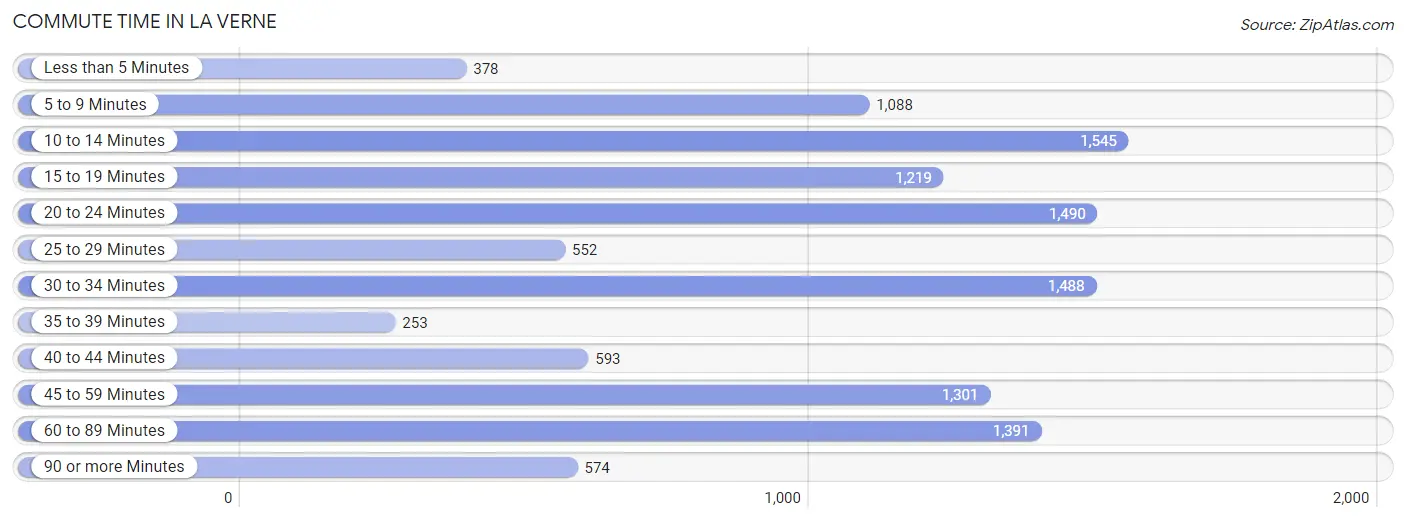
| Commute Time | # Commuters | % Commuters |
| Less than 5 Minutes | 378 | 3.2% |
| 5 to 9 Minutes | 1,088 | 9.2% |
| 10 to 14 Minutes | 1,545 | 13.0% |
| 15 to 19 Minutes | 1,219 | 10.3% |
| 20 to 24 Minutes | 1,490 | 12.6% |
| 25 to 29 Minutes | 552 | 4.6% |
| 30 to 34 Minutes | 1,488 | 12.5% |
| 35 to 39 Minutes | 253 | 2.1% |
| 40 to 44 Minutes | 593 | 5.0% |
| 45 to 59 Minutes | 1,301 | 11.0% |
| 60 to 89 Minutes | 1,391 | 11.7% |
| 90 or more Minutes | 574 | 4.8% |
Commute Time by Sex in La Verne
The most common commute times in La Verne are 10 to 14 minutes (904 commuters, 13.5%) for males and 20 to 24 minutes (689 commuters, 13.4%) for females.
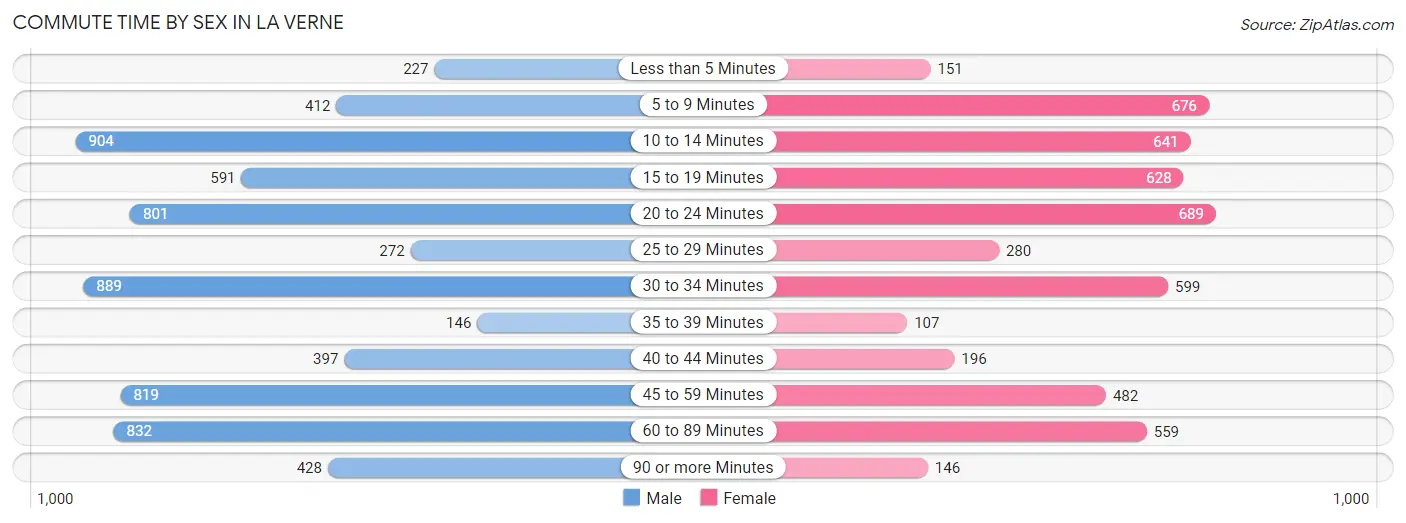
| Commute Time | Male | Female |
| Less than 5 Minutes | 227 (3.4%) | 151 (2.9%) |
| 5 to 9 Minutes | 412 (6.1%) | 676 (13.1%) |
| 10 to 14 Minutes | 904 (13.5%) | 641 (12.4%) |
| 15 to 19 Minutes | 591 (8.8%) | 628 (12.2%) |
| 20 to 24 Minutes | 801 (11.9%) | 689 (13.4%) |
| 25 to 29 Minutes | 272 (4.1%) | 280 (5.4%) |
| 30 to 34 Minutes | 889 (13.2%) | 599 (11.6%) |
| 35 to 39 Minutes | 146 (2.2%) | 107 (2.1%) |
| 40 to 44 Minutes | 397 (5.9%) | 196 (3.8%) |
| 45 to 59 Minutes | 819 (12.2%) | 482 (9.3%) |
| 60 to 89 Minutes | 832 (12.4%) | 559 (10.8%) |
| 90 or more Minutes | 428 (6.4%) | 146 (2.8%) |
Time of Departure to Work by Sex in La Verne
The most frequent times of departure to work in La Verne are 8:00 AM to 8:29 AM (997, 14.8%) for males and 7:30 AM to 7:59 AM (904, 17.5%) for females.
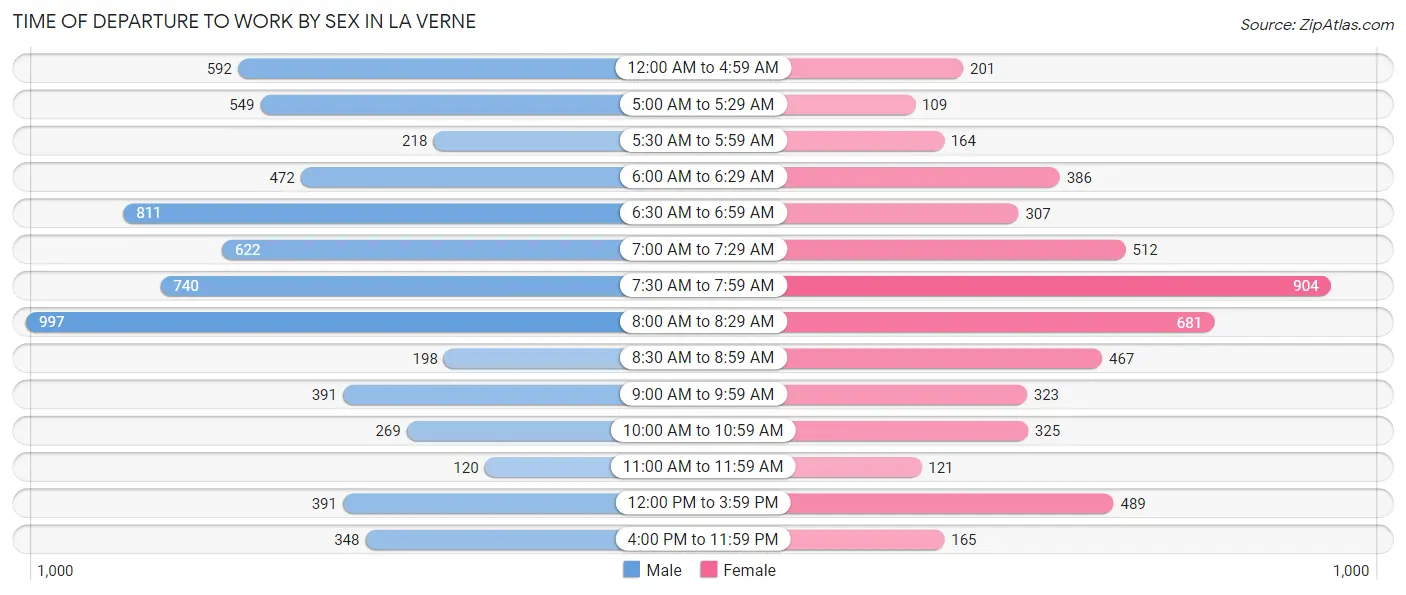
| Time of Departure | Male | Female |
| 12:00 AM to 4:59 AM | 592 (8.8%) | 201 (3.9%) |
| 5:00 AM to 5:29 AM | 549 (8.2%) | 109 (2.1%) |
| 5:30 AM to 5:59 AM | 218 (3.3%) | 164 (3.2%) |
| 6:00 AM to 6:29 AM | 472 (7.0%) | 386 (7.5%) |
| 6:30 AM to 6:59 AM | 811 (12.1%) | 307 (6.0%) |
| 7:00 AM to 7:29 AM | 622 (9.3%) | 512 (9.9%) |
| 7:30 AM to 7:59 AM | 740 (11.0%) | 904 (17.5%) |
| 8:00 AM to 8:29 AM | 997 (14.8%) | 681 (13.2%) |
| 8:30 AM to 8:59 AM | 198 (2.9%) | 467 (9.1%) |
| 9:00 AM to 9:59 AM | 391 (5.8%) | 323 (6.3%) |
| 10:00 AM to 10:59 AM | 269 (4.0%) | 325 (6.3%) |
| 11:00 AM to 11:59 AM | 120 (1.8%) | 121 (2.4%) |
| 12:00 PM to 3:59 PM | 391 (5.8%) | 489 (9.5%) |
| 4:00 PM to 11:59 PM | 348 (5.2%) | 165 (3.2%) |
| Total | 6,718 (100.0%) | 5,154 (100.0%) |
Housing Occupancy in La Verne
Occupancy by Ownership in La Verne
Of the total 11,590 dwellings in La Verne, owner-occupied units account for 7,851 (67.7%), while renter-occupied units make up 3,739 (32.3%).
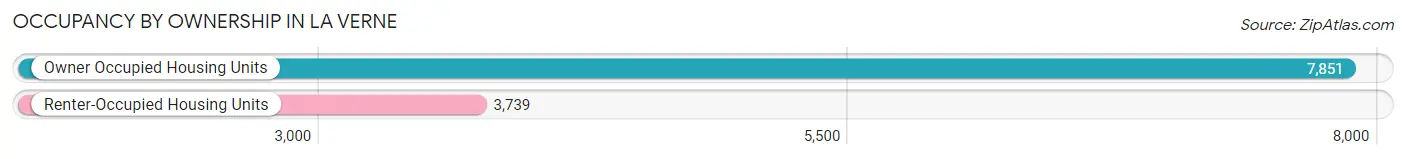
| Occupancy | # Housing Units | % Housing Units |
| Owner Occupied Housing Units | 7,851 | 67.7% |
| Renter-Occupied Housing Units | 3,739 | 32.3% |
| Total Occupied Housing Units | 11,590 | 100.0% |
Occupancy by Household Size in La Verne
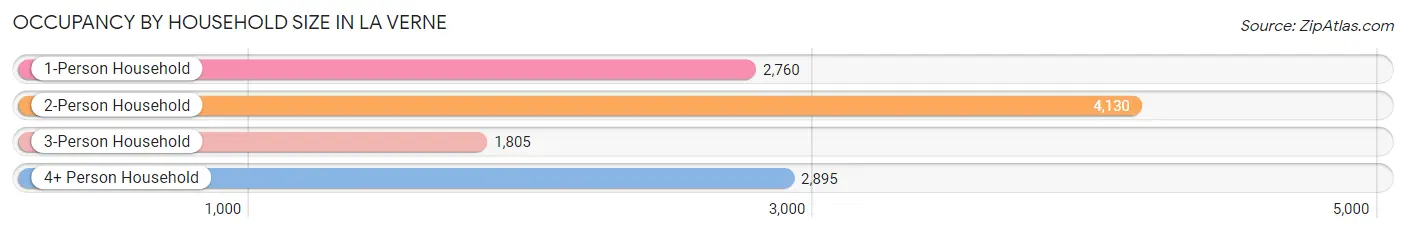
| Household Size | # Housing Units | % Housing Units |
| 1-Person Household | 2,760 | 23.8% |
| 2-Person Household | 4,130 | 35.6% |
| 3-Person Household | 1,805 | 15.6% |
| 4+ Person Household | 2,895 | 25.0% |
| Total Housing Units | 11,590 | 100.0% |
Occupancy by Ownership by Household Size in La Verne
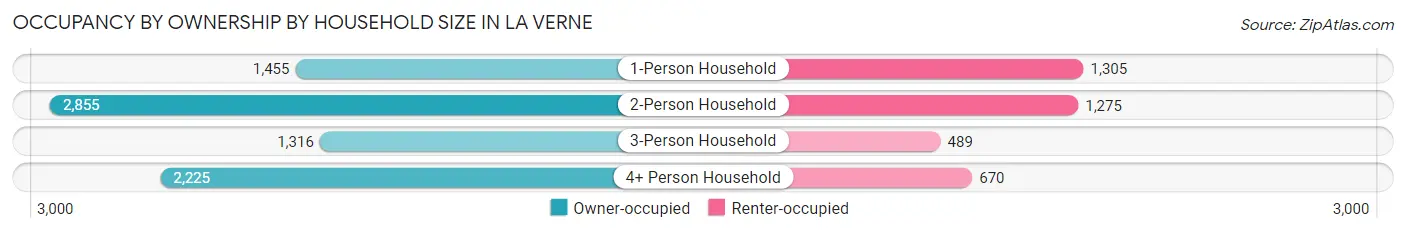
| Household Size | Owner-occupied | Renter-occupied |
| 1-Person Household | 1,455 (52.7%) | 1,305 (47.3%) |
| 2-Person Household | 2,855 (69.1%) | 1,275 (30.9%) |
| 3-Person Household | 1,316 (72.9%) | 489 (27.1%) |
| 4+ Person Household | 2,225 (76.9%) | 670 (23.1%) |
| Total Housing Units | 7,851 (67.7%) | 3,739 (32.3%) |
Occupancy by Educational Attainment in La Verne
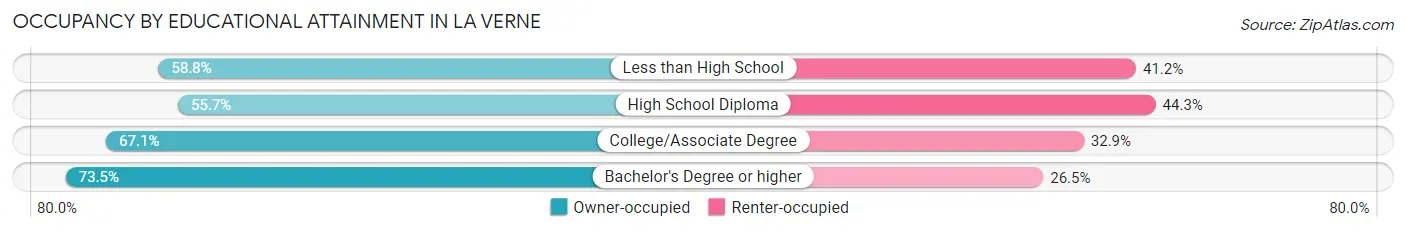
| Household Size | Owner-occupied | Renter-occupied |
| Less than High School | 375 (58.8%) | 263 (41.2%) |
| High School Diploma | 992 (55.7%) | 790 (44.3%) |
| College/Associate Degree | 2,659 (67.1%) | 1,306 (32.9%) |
| Bachelor's Degree or higher | 3,825 (73.5%) | 1,380 (26.5%) |
Occupancy by Age of Householder in La Verne
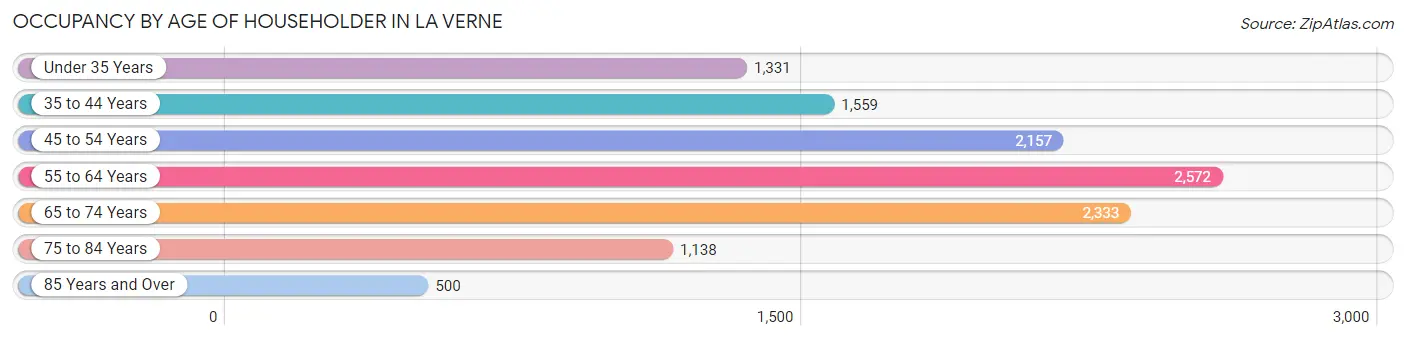
| Age Bracket | # Households | % Households |
| Under 35 Years | 1,331 | 11.5% |
| 35 to 44 Years | 1,559 | 13.5% |
| 45 to 54 Years | 2,157 | 18.6% |
| 55 to 64 Years | 2,572 | 22.2% |
| 65 to 74 Years | 2,333 | 20.1% |
| 75 to 84 Years | 1,138 | 9.8% |
| 85 Years and Over | 500 | 4.3% |
| Total | 11,590 | 100.0% |
Housing Finances in La Verne
Median Income by Occupancy in La Verne
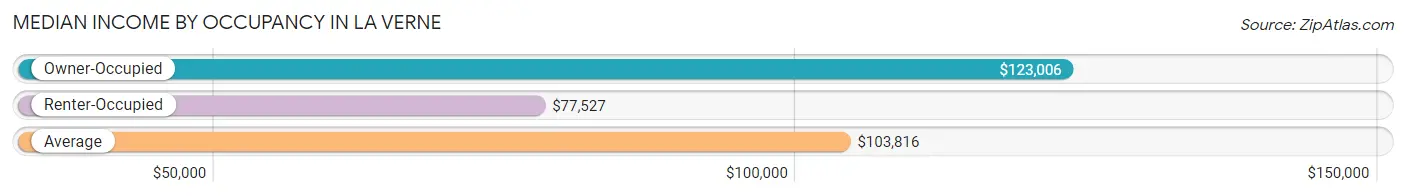
| Occupancy Type | # Households | Median Income |
| Owner-Occupied | 7,851 (67.7%) | $123,006 |
| Renter-Occupied | 3,739 (32.3%) | $77,527 |
| Average | 11,590 (100.0%) | $103,816 |
Occupancy by Householder Income Bracket in La Verne
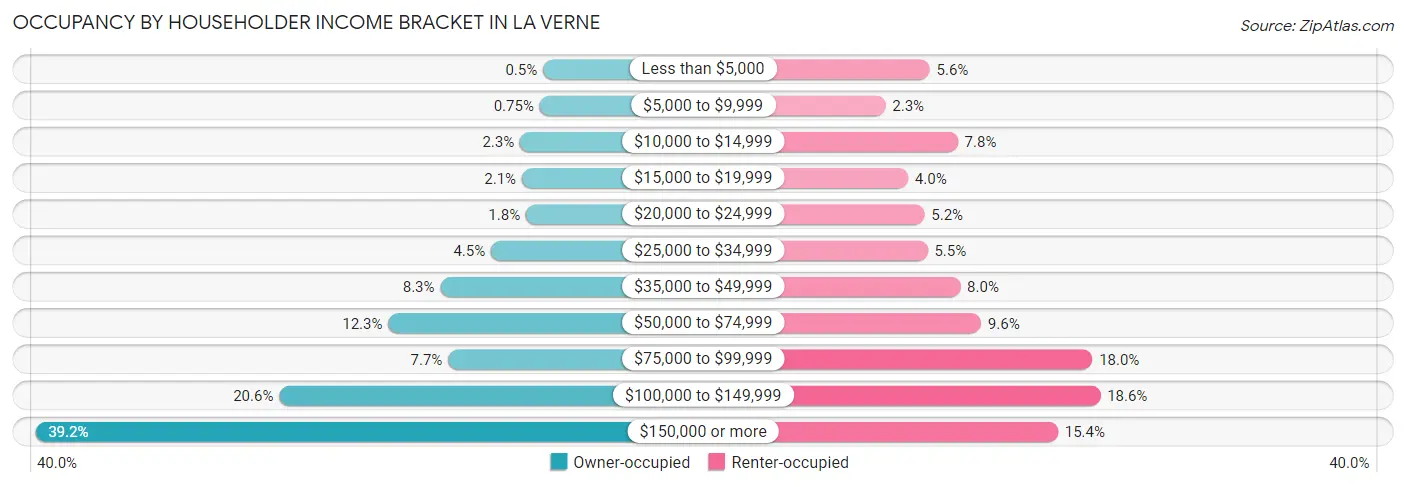
| Income Bracket | Owner-occupied | Renter-occupied |
| Less than $5,000 | 39 (0.5%) | 211 (5.6%) |
| $5,000 to $9,999 | 59 (0.7%) | 85 (2.3%) |
| $10,000 to $14,999 | 177 (2.2%) | 291 (7.8%) |
| $15,000 to $19,999 | 166 (2.1%) | 149 (4.0%) |
| $20,000 to $24,999 | 141 (1.8%) | 196 (5.2%) |
| $25,000 to $34,999 | 350 (4.5%) | 205 (5.5%) |
| $35,000 to $49,999 | 653 (8.3%) | 298 (8.0%) |
| $50,000 to $74,999 | 965 (12.3%) | 357 (9.6%) |
| $75,000 to $99,999 | 607 (7.7%) | 674 (18.0%) |
| $100,000 to $149,999 | 1,617 (20.6%) | 697 (18.6%) |
| $150,000 or more | 3,077 (39.2%) | 576 (15.4%) |
| Total | 7,851 (100.0%) | 3,739 (100.0%) |
Monthly Housing Cost Tiers in La Verne
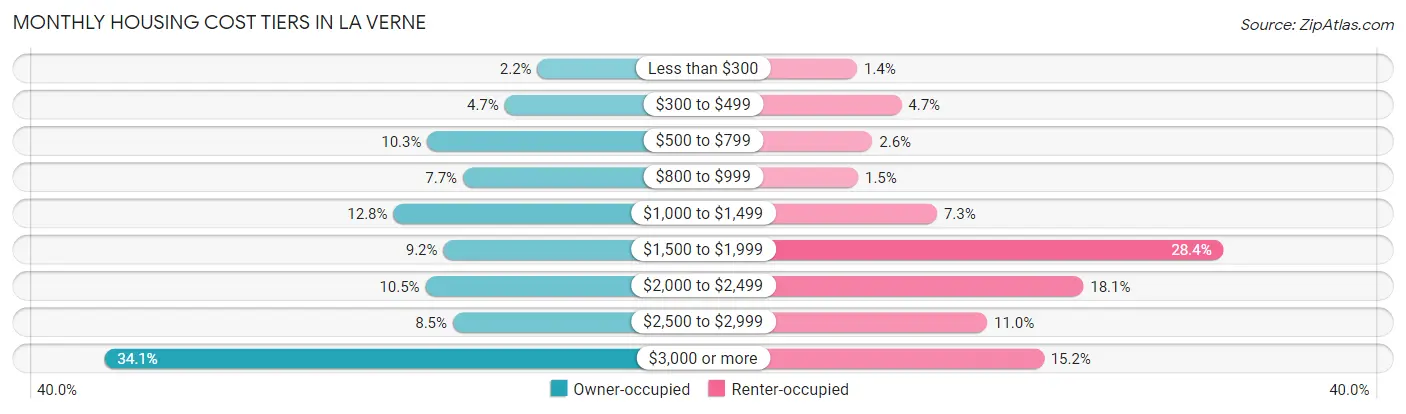
| Monthly Cost | Owner-occupied | Renter-occupied |
| Less than $300 | 175 (2.2%) | 54 (1.4%) |
| $300 to $499 | 365 (4.6%) | 176 (4.7%) |
| $500 to $799 | 812 (10.3%) | 96 (2.6%) |
| $800 to $999 | 606 (7.7%) | 57 (1.5%) |
| $1,000 to $1,499 | 1,008 (12.8%) | 274 (7.3%) |
| $1,500 to $1,999 | 719 (9.2%) | 1,063 (28.4%) |
| $2,000 to $2,499 | 823 (10.5%) | 677 (18.1%) |
| $2,500 to $2,999 | 664 (8.5%) | 412 (11.0%) |
| $3,000 or more | 2,679 (34.1%) | 568 (15.2%) |
| Total | 7,851 (100.0%) | 3,739 (100.0%) |
Physical Housing Characteristics in La Verne
Housing Structures in La Verne
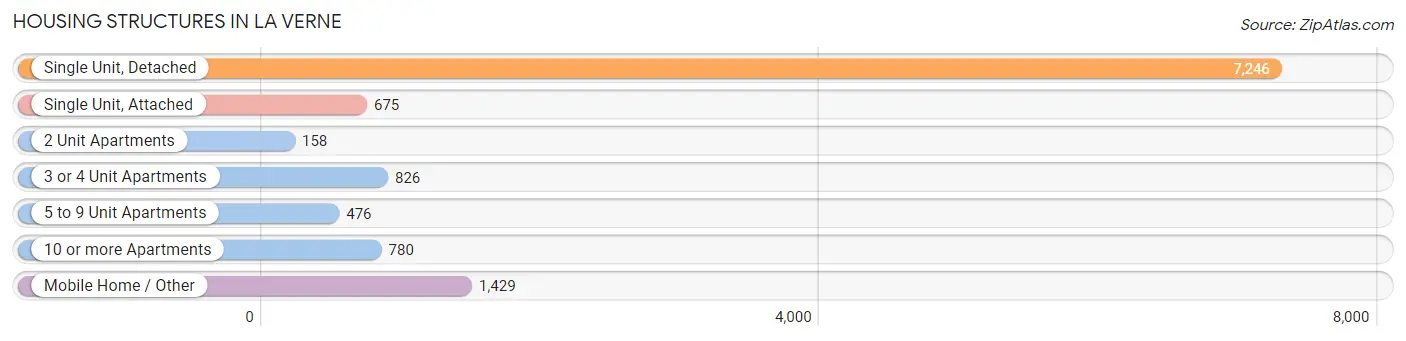
| Structure Type | # Housing Units | % Housing Units |
| Single Unit, Detached | 7,246 | 62.5% |
| Single Unit, Attached | 675 | 5.8% |
| 2 Unit Apartments | 158 | 1.4% |
| 3 or 4 Unit Apartments | 826 | 7.1% |
| 5 to 9 Unit Apartments | 476 | 4.1% |
| 10 or more Apartments | 780 | 6.7% |
| Mobile Home / Other | 1,429 | 12.3% |
| Total | 11,590 | 100.0% |
Housing Structures by Occupancy in La Verne
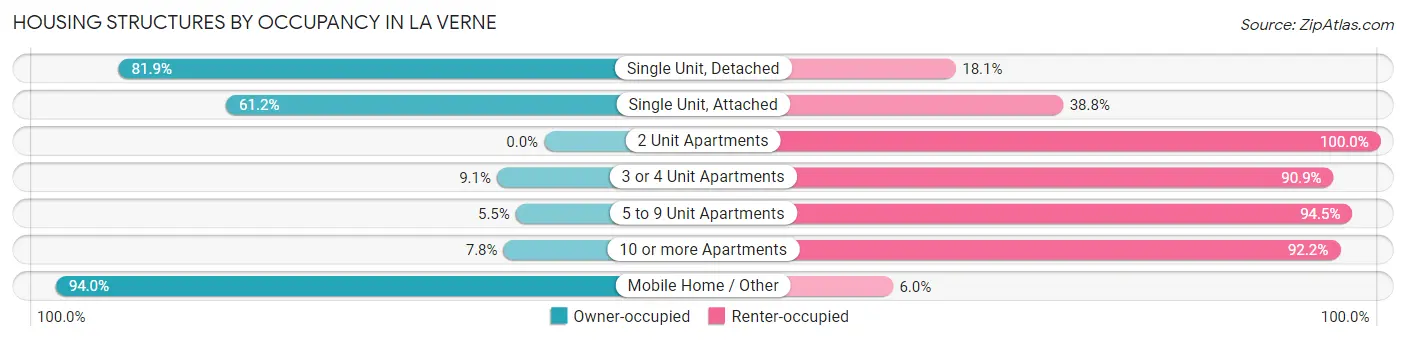
| Structure Type | Owner-occupied | Renter-occupied |
| Single Unit, Detached | 5,933 (81.9%) | 1,313 (18.1%) |
| Single Unit, Attached | 413 (61.2%) | 262 (38.8%) |
| 2 Unit Apartments | 0 (0.0%) | 158 (100.0%) |
| 3 or 4 Unit Apartments | 75 (9.1%) | 751 (90.9%) |
| 5 to 9 Unit Apartments | 26 (5.5%) | 450 (94.5%) |
| 10 or more Apartments | 61 (7.8%) | 719 (92.2%) |
| Mobile Home / Other | 1,343 (94.0%) | 86 (6.0%) |
| Total | 7,851 (67.7%) | 3,739 (32.3%) |
Housing Structures by Number of Rooms in La Verne
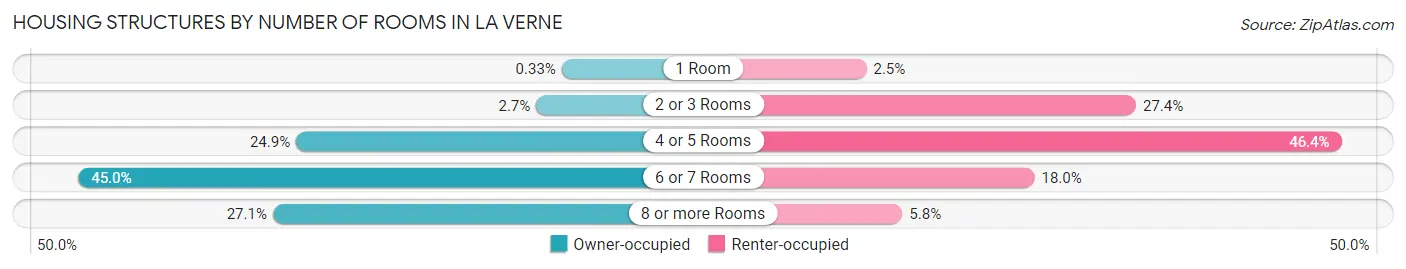
| Number of Rooms | Owner-occupied | Renter-occupied |
| 1 Room | 26 (0.3%) | 92 (2.5%) |
| 2 or 3 Rooms | 211 (2.7%) | 1,024 (27.4%) |
| 4 or 5 Rooms | 1,955 (24.9%) | 1,734 (46.4%) |
| 6 or 7 Rooms | 3,535 (45.0%) | 673 (18.0%) |
| 8 or more Rooms | 2,124 (27.1%) | 216 (5.8%) |
| Total | 7,851 (100.0%) | 3,739 (100.0%) |
Housing Structure by Heating Type in La Verne
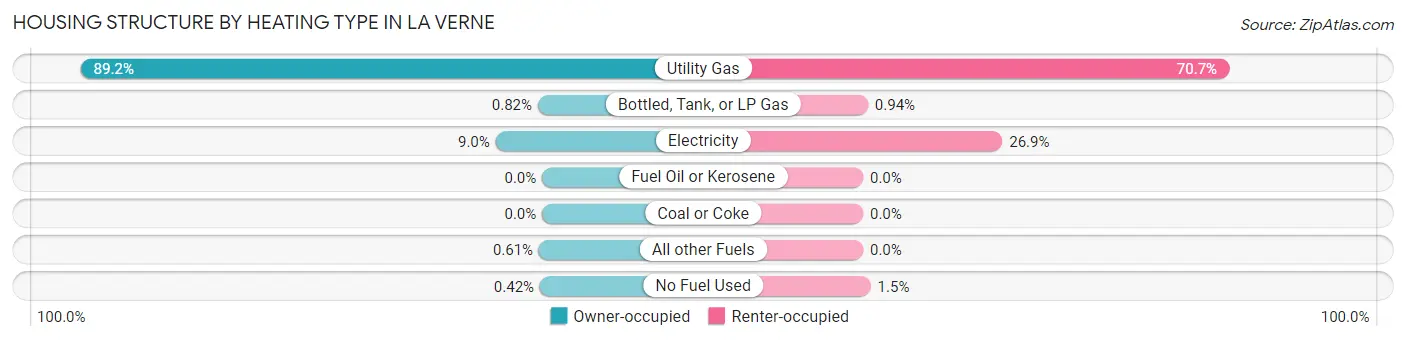
| Heating Type | Owner-occupied | Renter-occupied |
| Utility Gas | 7,001 (89.2%) | 2,643 (70.7%) |
| Bottled, Tank, or LP Gas | 64 (0.8%) | 35 (0.9%) |
| Electricity | 705 (9.0%) | 1,006 (26.9%) |
| Fuel Oil or Kerosene | 0 (0.0%) | 0 (0.0%) |
| Coal or Coke | 0 (0.0%) | 0 (0.0%) |
| All other Fuels | 48 (0.6%) | 0 (0.0%) |
| No Fuel Used | 33 (0.4%) | 55 (1.5%) |
| Total | 7,851 (100.0%) | 3,739 (100.0%) |
Household Vehicle Usage in La Verne
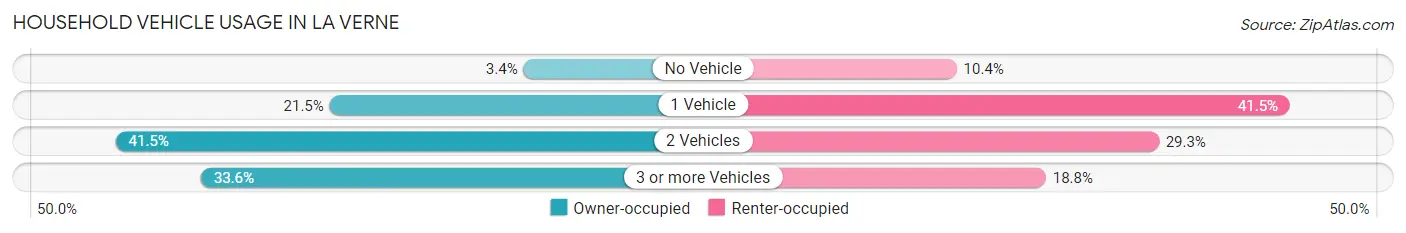
| Vehicles per Household | Owner-occupied | Renter-occupied |
| No Vehicle | 269 (3.4%) | 390 (10.4%) |
| 1 Vehicle | 1,690 (21.5%) | 1,553 (41.5%) |
| 2 Vehicles | 3,258 (41.5%) | 1,095 (29.3%) |
| 3 or more Vehicles | 2,634 (33.6%) | 701 (18.8%) |
| Total | 7,851 (100.0%) | 3,739 (100.0%) |
Real Estate & Mortgages in La Verne
Real Estate and Mortgage Overview in La Verne
| Characteristic | Without Mortgage | With Mortgage |
| Housing Units | 2,827 | 5,024 |
| Median Property Value | $601,500 | $787,800 |
| Median Household Income | $69,764 | $2,500 |
| Monthly Housing Costs | $834 | $2,679 |
| Real Estate Taxes | $3,074 | $55 |
Property Value by Mortgage Status in La Verne
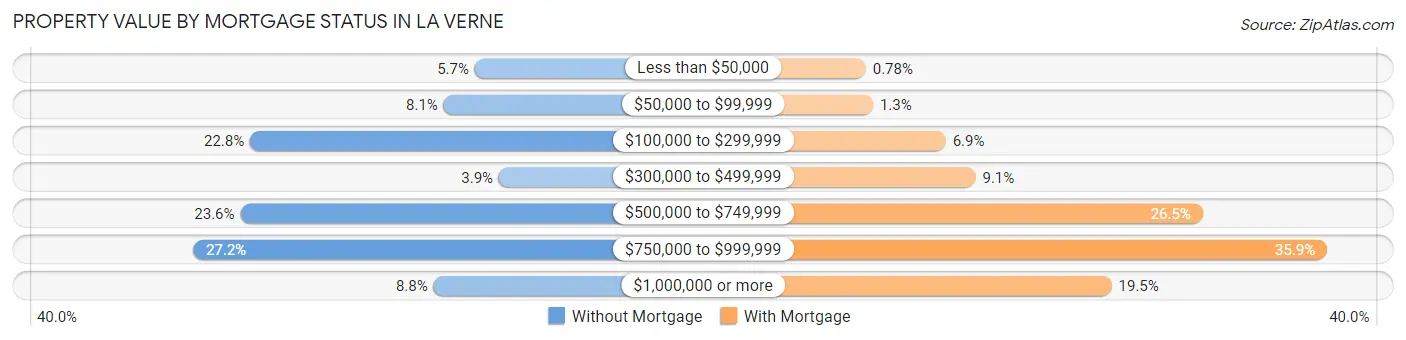
| Property Value | Without Mortgage | With Mortgage |
| Less than $50,000 | 161 (5.7%) | 39 (0.8%) |
| $50,000 to $99,999 | 228 (8.1%) | 67 (1.3%) |
| $100,000 to $299,999 | 645 (22.8%) | 345 (6.9%) |
| $300,000 to $499,999 | 109 (3.9%) | 459 (9.1%) |
| $500,000 to $749,999 | 666 (23.6%) | 1,329 (26.5%) |
| $750,000 to $999,999 | 768 (27.2%) | 1,805 (35.9%) |
| $1,000,000 or more | 250 (8.8%) | 980 (19.5%) |
| Total | 2,827 (100.0%) | 5,024 (100.0%) |
Household Income by Mortgage Status in La Verne
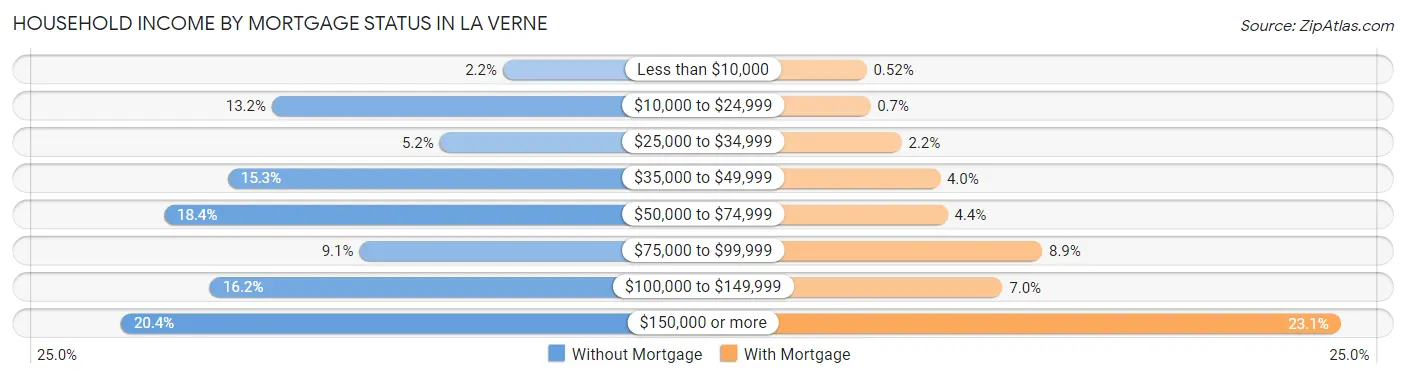
| Household Income | Without Mortgage | With Mortgage |
| Less than $10,000 | 63 (2.2%) | 26 (0.5%) |
| $10,000 to $24,999 | 374 (13.2%) | 35 (0.7%) |
| $25,000 to $34,999 | 148 (5.2%) | 110 (2.2%) |
| $35,000 to $49,999 | 433 (15.3%) | 202 (4.0%) |
| $50,000 to $74,999 | 519 (18.4%) | 220 (4.4%) |
| $75,000 to $99,999 | 256 (9.1%) | 446 (8.9%) |
| $100,000 to $149,999 | 457 (16.2%) | 351 (7.0%) |
| $150,000 or more | 577 (20.4%) | 1,160 (23.1%) |
| Total | 2,827 (100.0%) | 5,024 (100.0%) |
Property Value to Household Income Ratio in La Verne
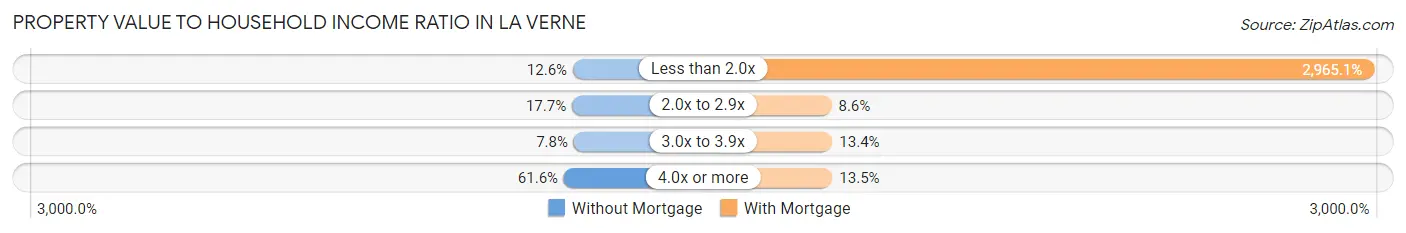
| Value-to-Income Ratio | Without Mortgage | With Mortgage |
| Less than 2.0x | 357 (12.6%) | 148,966 (2,965.1%) |
| 2.0x to 2.9x | 501 (17.7%) | 434 (8.6%) |
| 3.0x to 3.9x | 221 (7.8%) | 674 (13.4%) |
| 4.0x or more | 1,740 (61.6%) | 677 (13.5%) |
| Total | 2,827 (100.0%) | 5,024 (100.0%) |
Real Estate Taxes by Mortgage Status in La Verne
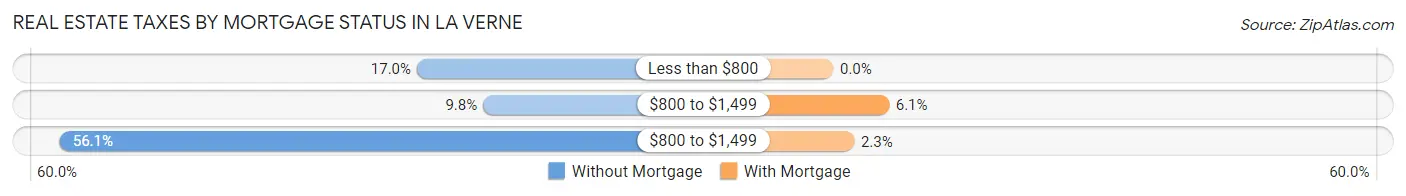
| Property Taxes | Without Mortgage | With Mortgage |
| Less than $800 | 481 (17.0%) | 0 (0.0%) |
| $800 to $1,499 | 276 (9.8%) | 307 (6.1%) |
| $800 to $1,499 | 1,587 (56.1%) | 115 (2.3%) |
| Total | 2,827 (100.0%) | 5,024 (100.0%) |
Health & Disability in La Verne
Health Insurance Coverage by Age in La Verne

| Age Bracket | With Coverage | Without Coverage |
| Under 6 Years | 1,488 (98.2%) | 28 (1.8%) |
| 6 to 18 Years | 4,765 (98.0%) | 99 (2.0%) |
| 19 to 25 Years | 2,489 (94.7%) | 140 (5.3%) |
| 26 to 34 Years | 2,713 (93.1%) | 202 (6.9%) |
| 35 to 44 Years | 3,145 (91.7%) | 285 (8.3%) |
| 45 to 54 Years | 3,833 (95.3%) | 189 (4.7%) |
| 55 to 64 Years | 4,591 (96.7%) | 157 (3.3%) |
| 65 to 74 Years | 4,327 (99.5%) | 20 (0.5%) |
| 75 Years and older | 2,631 (99.9%) | 4 (0.2%) |
| Total | 29,982 (96.4%) | 1,124 (3.6%) |
Health Insurance Coverage by Citizenship Status in La Verne
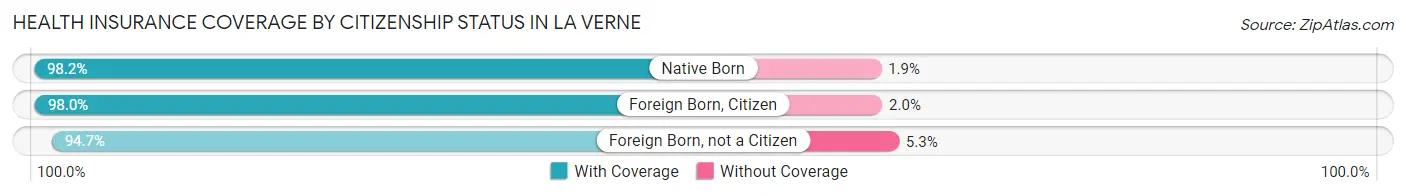
| Citizenship Status | With Coverage | Without Coverage |
| Native Born | 1,488 (98.2%) | 28 (1.8%) |
| Foreign Born, Citizen | 4,765 (98.0%) | 99 (2.0%) |
| Foreign Born, not a Citizen | 2,489 (94.7%) | 140 (5.3%) |
Health Insurance Coverage by Household Income in La Verne
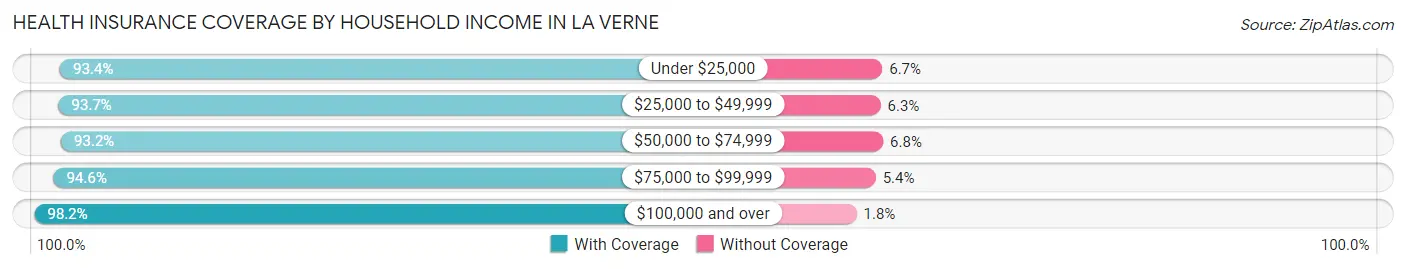
| Household Income | With Coverage | Without Coverage |
| Under $25,000 | 2,163 (93.3%) | 154 (6.7%) |
| $25,000 to $49,999 | 2,571 (93.7%) | 174 (6.3%) |
| $50,000 to $74,999 | 2,943 (93.2%) | 215 (6.8%) |
| $75,000 to $99,999 | 3,212 (94.6%) | 184 (5.4%) |
| $100,000 and over | 18,604 (98.2%) | 348 (1.8%) |
Public vs Private Health Insurance Coverage by Age in La Verne
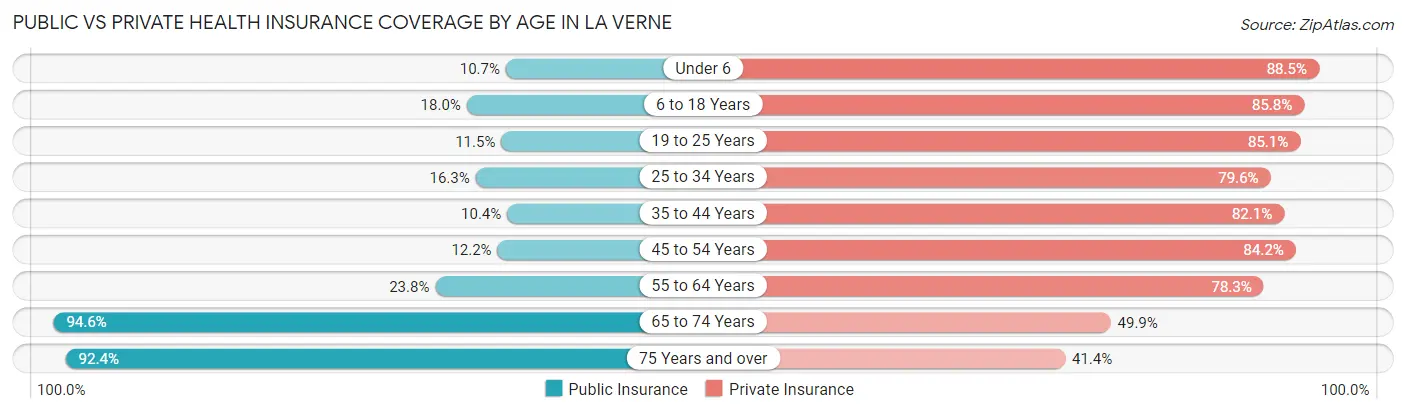
| Age Bracket | Public Insurance | Private Insurance |
| Under 6 | 162 (10.7%) | 1,342 (88.5%) |
| 6 to 18 Years | 873 (17.9%) | 4,173 (85.8%) |
| 19 to 25 Years | 303 (11.5%) | 2,236 (85.1%) |
| 25 to 34 Years | 475 (16.3%) | 2,319 (79.5%) |
| 35 to 44 Years | 358 (10.4%) | 2,815 (82.1%) |
| 45 to 54 Years | 492 (12.2%) | 3,388 (84.2%) |
| 55 to 64 Years | 1,129 (23.8%) | 3,717 (78.3%) |
| 65 to 74 Years | 4,114 (94.6%) | 2,169 (49.9%) |
| 75 Years and over | 2,434 (92.4%) | 1,092 (41.4%) |
| Total | 10,340 (33.2%) | 23,251 (74.8%) |
Disability Status by Sex by Age in La Verne
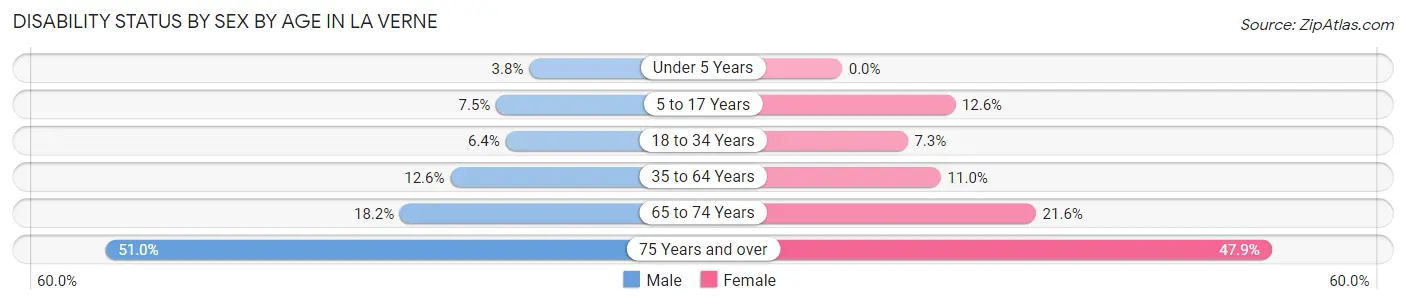
| Age Bracket | Male | Female |
| Under 5 Years | 23 (3.8%) | 0 (0.0%) |
| 5 to 17 Years | 180 (7.5%) | 295 (12.6%) |
| 18 to 34 Years | 207 (6.4%) | 203 (7.3%) |
| 35 to 64 Years | 744 (12.6%) | 693 (11.0%) |
| 65 to 74 Years | 345 (18.2%) | 529 (21.6%) |
| 75 Years and over | 533 (51.0%) | 761 (47.9%) |
Disability Class by Sex by Age in La Verne
Disability Class: Hearing Difficulty
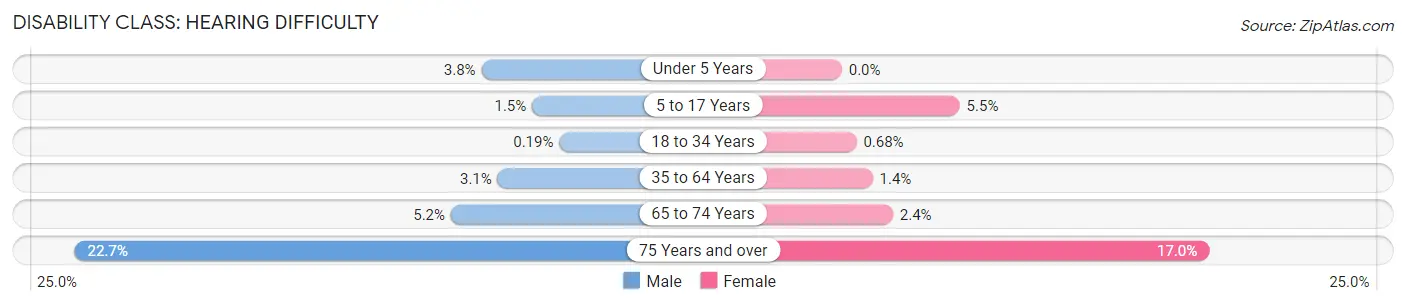
| Age Bracket | Male | Female |
| Under 5 Years | 23 (3.8%) | 0 (0.0%) |
| 5 to 17 Years | 35 (1.5%) | 128 (5.5%) |
| 18 to 34 Years | 6 (0.2%) | 19 (0.7%) |
| 35 to 64 Years | 180 (3.0%) | 90 (1.4%) |
| 65 to 74 Years | 99 (5.2%) | 58 (2.4%) |
| 75 Years and over | 237 (22.7%) | 271 (17.0%) |
Disability Class: Vision Difficulty
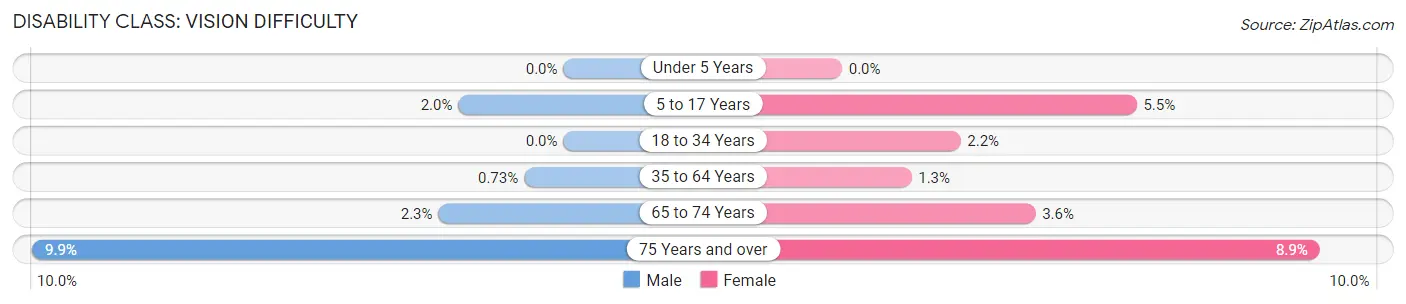
| Age Bracket | Male | Female |
| Under 5 Years | 0 (0.0%) | 0 (0.0%) |
| 5 to 17 Years | 47 (1.9%) | 128 (5.5%) |
| 18 to 34 Years | 0 (0.0%) | 61 (2.2%) |
| 35 to 64 Years | 43 (0.7%) | 81 (1.3%) |
| 65 to 74 Years | 44 (2.3%) | 88 (3.6%) |
| 75 Years and over | 103 (9.9%) | 141 (8.9%) |
Disability Class: Cognitive Difficulty
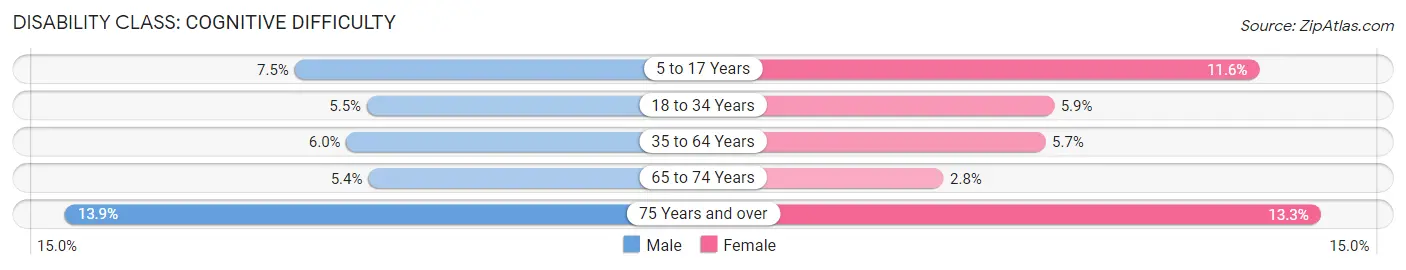
| Age Bracket | Male | Female |
| 5 to 17 Years | 180 (7.5%) | 272 (11.6%) |
| 18 to 34 Years | 176 (5.5%) | 164 (5.9%) |
| 35 to 64 Years | 357 (6.0%) | 356 (5.7%) |
| 65 to 74 Years | 103 (5.4%) | 69 (2.8%) |
| 75 Years and over | 145 (13.9%) | 212 (13.3%) |
Disability Class: Ambulatory Difficulty
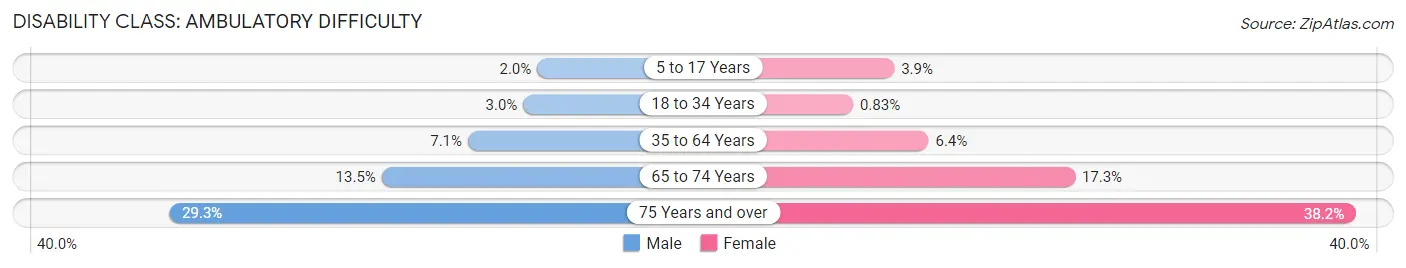
| Age Bracket | Male | Female |
| 5 to 17 Years | 47 (1.9%) | 91 (3.9%) |
| 18 to 34 Years | 96 (3.0%) | 23 (0.8%) |
| 35 to 64 Years | 419 (7.1%) | 405 (6.4%) |
| 65 to 74 Years | 256 (13.5%) | 424 (17.3%) |
| 75 Years and over | 306 (29.3%) | 607 (38.2%) |
Disability Class: Self-Care Difficulty
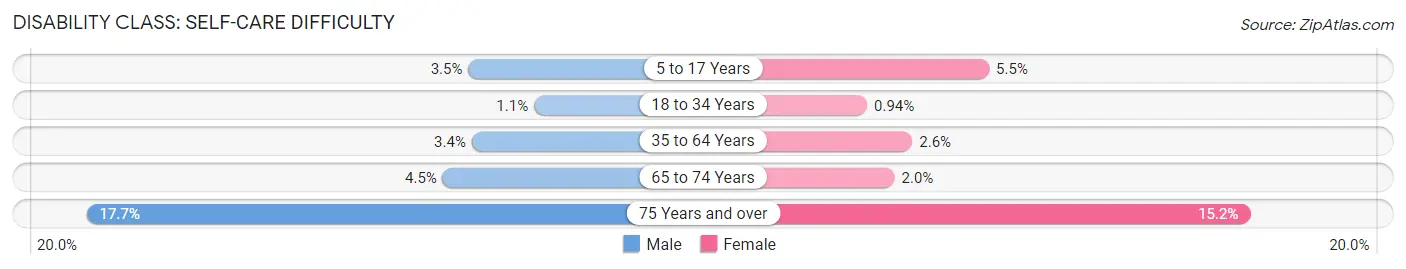
| Age Bracket | Male | Female |
| 5 to 17 Years | 85 (3.5%) | 128 (5.5%) |
| 18 to 34 Years | 35 (1.1%) | 26 (0.9%) |
| 35 to 64 Years | 201 (3.4%) | 165 (2.6%) |
| 65 to 74 Years | 85 (4.5%) | 48 (2.0%) |
| 75 Years and over | 185 (17.7%) | 241 (15.2%) |
Technology Access in La Verne
Computing Device Access in La Verne
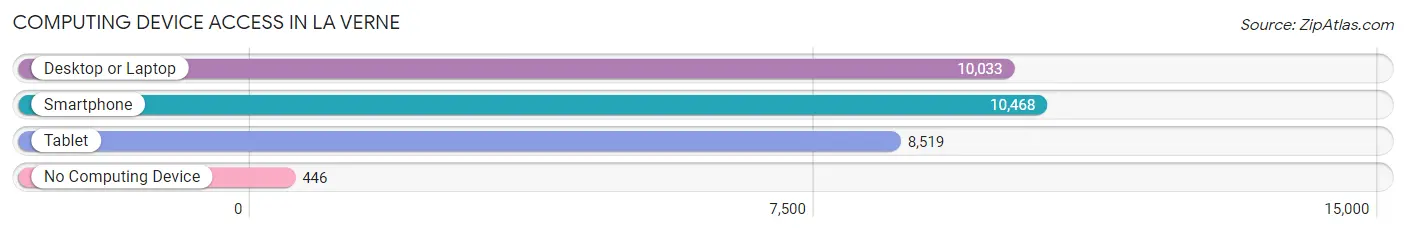
| Device Type | # Households | % Households |
| Desktop or Laptop | 10,033 | 86.6% |
| Smartphone | 10,468 | 90.3% |
| Tablet | 8,519 | 73.5% |
| No Computing Device | 446 | 3.8% |
| Total | 11,590 | 100.0% |
Internet Access in La Verne
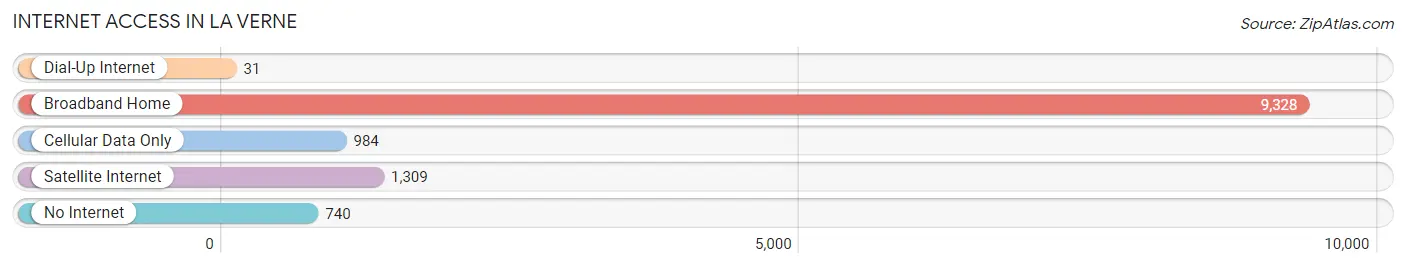
| Internet Type | # Households | % Households |
| Dial-Up Internet | 31 | 0.3% |
| Broadband Home | 9,328 | 80.5% |
| Cellular Data Only | 984 | 8.5% |
| Satellite Internet | 1,309 | 11.3% |
| No Internet | 740 | 6.4% |
| Total | 11,590 | 100.0% |
La Verne Summary
La Verne is a city located in Los Angeles County, California, United States. It is situated in the foothills of the San Gabriel Mountains, about 30 miles east of downtown Los Angeles. The population was 31,063 at the 2010 census, up from 29,000 at the 2000 census. La Verne is part of the Greater Los Angeles Area.
History
The area that is now La Verne was originally inhabited by the Tongva Native Americans. The first Europeans to settle in the area were the Spanish, who established the Rancho San Jose in 1837. The area was later acquired by the San Gabriel Mission in 1845. The area was then divided into several large land grants, including the Rancho La Verne, which was granted to the family of Isaac Lankershim in 1882.
The area was developed in the late 19th century, with the establishment of the La Verne Land and Water Company in 1887. The company was responsible for the development of the town, which was named after the Spanish phrase for “the green”. The town was incorporated in 1906, and the first mayor was elected in 1907.
Geography
La Verne is located at 34°7′N 117°48′W (34.1167, -117.8000). According to the United States Census Bureau, the city has a total area of 8.2 square miles (21.2 km2), all of it land.
La Verne is located in the foothills of the San Gabriel Mountains, about 30 miles east of downtown Los Angeles. The city is bordered by the cities of San Dimas to the north, Claremont to the northeast, Pomona to the east, and Glendora to the south.
Economy
La Verne’s economy is largely based on the service industry, with many residents employed in retail, healthcare, and education. The city is also home to several large employers, including the University of La Verne, the La Verne Unified School District, and the La Verne Medical Center.
Demographics
As of the 2010 census, there were 31,063 people, 10,717 households, and 7,845 families residing in the city. The population density was 3,788.3 people per square mile (1,461.2/km2). There were 11,068 housing units at an average density of 1,346.2 per square mile (519.3/km2). The racial makeup of the city was 68.2% White, 4.2% African American, 0.5% Native American, 16.2% Asian, 0.2% Pacific Islander, 6.3% from other races, and 4.5% from two or more races. Hispanic or Latino of any race were 20.2% of the population.
There were 10,717 households, out of which 33.2% had children under the age of 18 living with them, 54.2% were married couples living together, 11.7% had a female householder with no husband present, and 29.2% were non-families. 22.7% of all households were made up of individuals, and 8.2% had someone living alone who was 65 years of age or older. The average household size was 2.86 and the average family size was 3.37.
In the city, the population was spread out, with 25.2% under the age of 18, 11.2% from 18 to 24, 27.2% from 25 to 44, 24.2% from 45 to 64, and 12.2% who were 65 years of age or older. The median age was 36 years. For every 100 females, there were 93.2 males. For every 100 females age 18 and over, there were 89.7 males.
The median income for a household in the city was $60,872, and the median income for a family was $68,927. Males had a median income of $50,945 versus $37,845 for females. The per capita income for the city was $25,945. About 5.2% of families and 7.2% of the population were below the poverty line, including 8.2% of those under age 18 and 6.2% of those age 65 or over.
Common Questions
What is Per Capita Income in La Verne?
Per Capita income in La Verne is $48,567.
What is the Median Family Income in La Verne?
Median Family Income in La Verne is $125,226.
What is the Median Household income in La Verne?
Median Household Income in La Verne is $103,816.
What is Income or Wage Gap in La Verne?
Income or Wage Gap in La Verne is 36.4%.
Women in La Verne earn 63.6 cents for every dollar earned by a man.
What is Inequality or Gini Index in La Verne?
Inequality or Gini Index in La Verne is 0.44.
What is the Total Population of La Verne?
Total Population of La Verne is 31,239.
What is the Total Male Population of La Verne?
Total Male Population of La Verne is 15,111.
What is the Total Female Population of La Verne?
Total Female Population of La Verne is 16,128.
What is the Ratio of Males per 100 Females in La Verne?
There are 93.69 Males per 100 Females in La Verne.
What is the Ratio of Females per 100 Males in La Verne?
There are 106.73 Females per 100 Males in La Verne.
What is the Median Population Age in La Verne?
Median Population Age in La Verne is 45.8 Years.
What is the Average Family Size in La Verne
Average Family Size in La Verne is 3.1 People.
What is the Average Household Size in La Verne
Average Household Size in La Verne is 2.6 People.
How Large is the Labor Force in La Verne?
There are 15,663 People in the Labor Forcein in La Verne.
What is the Percentage of People in the Labor Force in La Verne?
60.3% of People are in the Labor Force in La Verne.
What is the Unemployment Rate in La Verne?
Unemployment Rate in La Verne is 6.4%.