Cities with the Most Immigrants from Syria in New Jersey
RELATED REPORTS & OPTIONS
Syria
New Jersey
Compare Cities
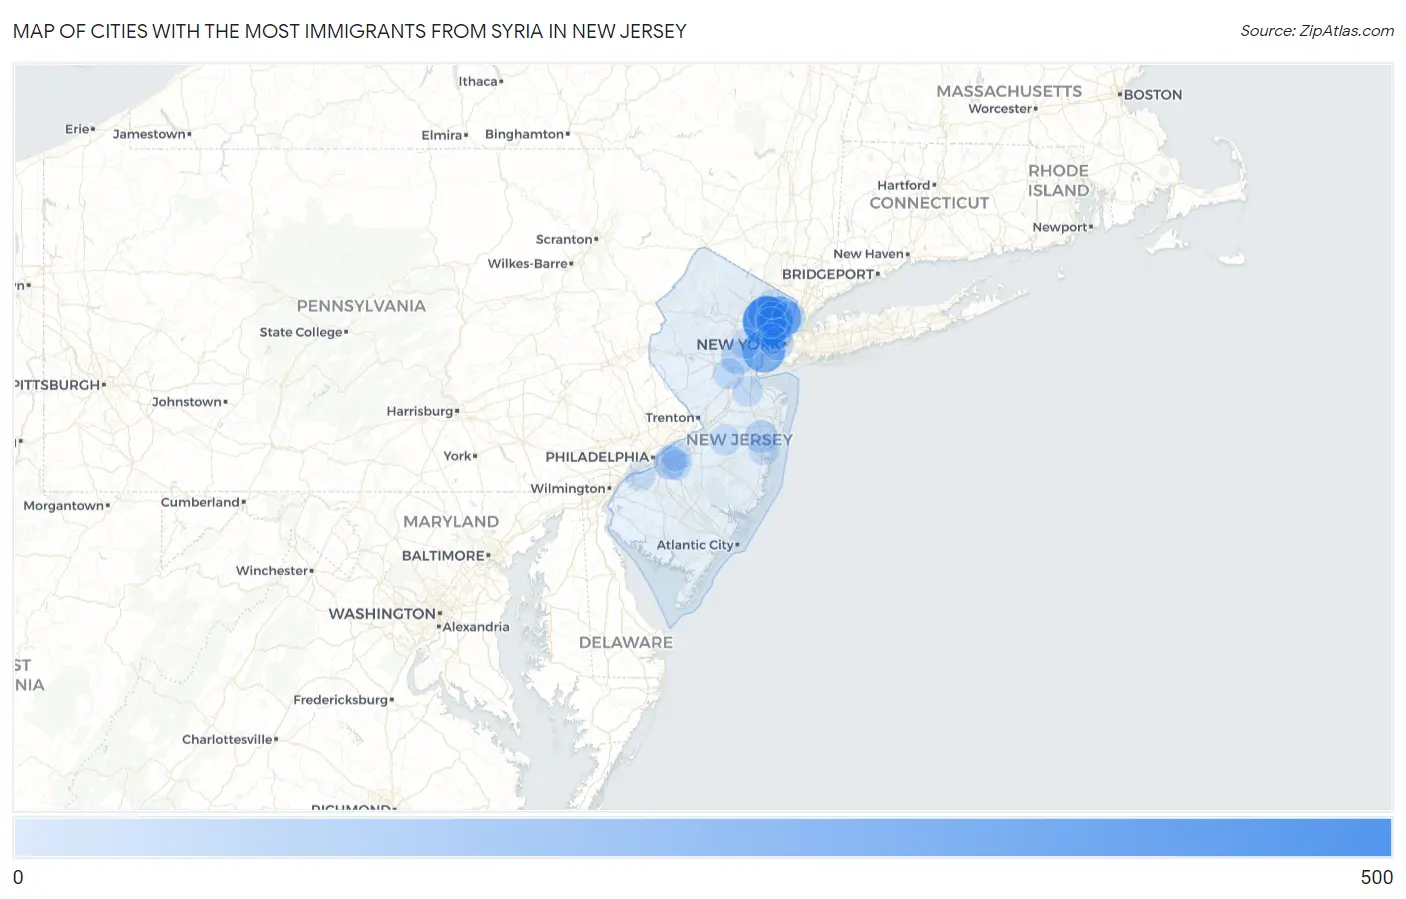
Map of Cities with the Most Immigrants from Syria in New Jersey
0
500
Cities with the Most Immigrants from Syria in New Jersey
| City | Syria | vs State | vs National | |
| 1. | Clifton | 455 | 5,966(7.63%)#1 | 108,470(0.42%)#29 |
| 2. | Elizabeth | 290 | 5,966(4.86%)#2 | 108,470(0.27%)#64 |
| 3. | Hackensack | 281 | 5,966(4.71%)#3 | 108,470(0.26%)#70 |
| 4. | Preakness | 279 | 5,966(4.68%)#4 | 108,470(0.26%)#72 |
| 5. | Washington Borough | 259 | 5,966(4.34%)#5 | 108,470(0.24%)#76 |
| 6. | Keansburg Borough | 200 | 5,966(3.35%)#6 | 108,470(0.18%)#104 |
| 7. | Franklin Lakes Borough | 189 | 5,966(3.17%)#7 | 108,470(0.17%)#109 |
| 8. | Elmwood Park Borough | 173 | 5,966(2.90%)#8 | 108,470(0.16%)#121 |
| 9. | Paterson | 156 | 5,966(2.61%)#9 | 108,470(0.14%)#142 |
| 10. | Hillsborough | 148 | 5,966(2.48%)#10 | 108,470(0.14%)#153 |
| 11. | Edgewater Borough | 144 | 5,966(2.41%)#11 | 108,470(0.13%)#159 |
| 12. | Fort Lee Borough | 127 | 5,966(2.13%)#12 | 108,470(0.12%)#172 |
| 13. | Lodi Borough | 118 | 5,966(1.98%)#13 | 108,470(0.11%)#182 |
| 14. | Paramus Borough | 107 | 5,966(1.79%)#14 | 108,470(0.10%)#201 |
| 15. | Woodland Park Borough | 107 | 5,966(1.79%)#15 | 108,470(0.10%)#202 |
| 16. | Totowa Borough | 86 | 5,966(1.44%)#16 | 108,470(0.08%)#238 |
| 17. | Garfield | 84 | 5,966(1.41%)#17 | 108,470(0.08%)#246 |
| 18. | Ellisburg | 80 | 5,966(1.34%)#18 | 108,470(0.07%)#262 |
| 19. | North Haledon Borough | 79 | 5,966(1.32%)#19 | 108,470(0.07%)#266 |
| 20. | Westwood Borough | 73 | 5,966(1.22%)#20 | 108,470(0.07%)#291 |
| 21. | Palisades Park Borough | 72 | 5,966(1.21%)#21 | 108,470(0.07%)#294 |
| 22. | Englewood | 71 | 5,966(1.19%)#22 | 108,470(0.07%)#295 |
| 23. | Plainfield | 67 | 5,966(1.12%)#23 | 108,470(0.06%)#307 |
| 24. | Paulsboro Borough | 67 | 5,966(1.12%)#24 | 108,470(0.06%)#310 |
| 25. | Prospect Park Borough | 66 | 5,966(1.11%)#25 | 108,470(0.06%)#315 |
| 26. | Jersey City | 62 | 5,966(1.04%)#26 | 108,470(0.06%)#328 |
| 27. | Saddle River Borough | 62 | 5,966(1.04%)#27 | 108,470(0.06%)#333 |
| 28. | Lakewood | 61 | 5,966(1.02%)#28 | 108,470(0.06%)#335 |
| 29. | Hawthorne Borough | 60 | 5,966(1.01%)#29 | 108,470(0.06%)#339 |
| 30. | Pines Lake | 57 | 5,966(0.96%)#30 | 108,470(0.05%)#348 |
| 31. | New Milford Borough | 52 | 5,966(0.87%)#31 | 108,470(0.05%)#364 |
| 32. | Dumont Borough | 50 | 5,966(0.84%)#32 | 108,470(0.05%)#373 |
| 33. | Fairview Borough | 48 | 5,966(0.80%)#33 | 108,470(0.04%)#380 |
| 34. | Madison Borough | 45 | 5,966(0.75%)#34 | 108,470(0.04%)#402 |
| 35. | Pompton Lakes Borough | 37 | 5,966(0.62%)#35 | 108,470(0.03%)#463 |
| 36. | Whippany | 37 | 5,966(0.62%)#36 | 108,470(0.03%)#464 |
| 37. | Ho Ho Kus Borough | 37 | 5,966(0.62%)#37 | 108,470(0.03%)#465 |
| 38. | Sayreville Borough | 33 | 5,966(0.55%)#38 | 108,470(0.03%)#498 |
| 39. | Haledon Borough | 31 | 5,966(0.52%)#39 | 108,470(0.03%)#515 |
| 40. | Somerset | 28 | 5,966(0.47%)#40 | 108,470(0.03%)#543 |
| 41. | Wanaque Borough | 28 | 5,966(0.47%)#41 | 108,470(0.03%)#550 |
| 42. | Maywood Borough | 27 | 5,966(0.45%)#42 | 108,470(0.02%)#558 |
| 43. | Mckee | 27 | 5,966(0.45%)#43 | 108,470(0.02%)#559 |
| 44. | Emerson Borough | 27 | 5,966(0.45%)#44 | 108,470(0.02%)#561 |
| 45. | Lebanon Borough | 27 | 5,966(0.45%)#45 | 108,470(0.02%)#563 |
| 46. | Eatontown Borough | 26 | 5,966(0.44%)#46 | 108,470(0.02%)#574 |
| 47. | Great Notch | 24 | 5,966(0.40%)#47 | 108,470(0.02%)#607 |
| 48. | New Egypt | 22 | 5,966(0.37%)#48 | 108,470(0.02%)#644 |
| 49. | Secaucus | 20 | 5,966(0.34%)#49 | 108,470(0.02%)#673 |
| 50. | Park Ridge Borough | 20 | 5,966(0.34%)#50 | 108,470(0.02%)#674 |
| 51. | Butler Borough | 20 | 5,966(0.34%)#51 | 108,470(0.02%)#675 |
| 52. | Rutherford Borough | 18 | 5,966(0.30%)#52 | 108,470(0.02%)#709 |
| 53. | Cliffside Park Borough | 17 | 5,966(0.28%)#53 | 108,470(0.02%)#731 |
| 54. | Greentree | 17 | 5,966(0.28%)#54 | 108,470(0.02%)#736 |
| 55. | Closter Borough | 17 | 5,966(0.28%)#55 | 108,470(0.02%)#737 |
| 56. | Toms River | 16 | 5,966(0.27%)#56 | 108,470(0.01%)#743 |
| 57. | North Arlington Borough | 16 | 5,966(0.27%)#57 | 108,470(0.01%)#758 |
| 58. | Somerville Borough | 16 | 5,966(0.27%)#58 | 108,470(0.01%)#760 |
| 59. | Oradell Borough | 15 | 5,966(0.25%)#59 | 108,470(0.01%)#789 |
| 60. | Far Hills Borough | 14 | 5,966(0.23%)#60 | 108,470(0.01%)#810 |
| 61. | Old Bridge | 13 | 5,966(0.22%)#61 | 108,470(0.01%)#824 |
| 62. | Highland Park Borough | 13 | 5,966(0.22%)#62 | 108,470(0.01%)#826 |
| 63. | Packanack Lake | 13 | 5,966(0.22%)#63 | 108,470(0.01%)#833 |
| 64. | Haworth Borough | 13 | 5,966(0.22%)#64 | 108,470(0.01%)#836 |
| 65. | Cresskill Borough | 12 | 5,966(0.20%)#65 | 108,470(0.01%)#855 |
| 66. | Upper Saddle River Borough | 12 | 5,966(0.20%)#66 | 108,470(0.01%)#856 |
| 67. | Bradley Beach Borough | 12 | 5,966(0.20%)#67 | 108,470(0.01%)#858 |
| 68. | Kearny | 11 | 5,966(0.18%)#68 | 108,470(0.01%)#870 |
| 69. | Moorestown Lenola | 11 | 5,966(0.18%)#69 | 108,470(0.01%)#876 |
| 70. | Lincoln Park Borough | 11 | 5,966(0.18%)#70 | 108,470(0.01%)#880 |
| 71. | Passaic | 10 | 5,966(0.17%)#71 | 108,470(0.01%)#886 |
| 72. | Gibbstown | 10 | 5,966(0.17%)#72 | 108,470(0.01%)#910 |
| 73. | Summit | 9 | 5,966(0.15%)#73 | 108,470(0.01%)#931 |
| 74. | South River Borough | 9 | 5,966(0.15%)#74 | 108,470(0.01%)#940 |
| 75. | Waldwick Borough | 9 | 5,966(0.15%)#75 | 108,470(0.01%)#946 |
| 76. | Parsippany | 8 | 5,966(0.13%)#76 | 108,470(0.01%)#964 |
| 77. | Somerdale Borough | 8 | 5,966(0.13%)#77 | 108,470(0.01%)#969 |
| 78. | Ridgewood | 6 | 5,966(0.10%)#78 | 108,470(0.01%)#1,008 |
| 79. | Andover Borough | 4 | 5,966(0.07%)#79 | 108,470(0.00%)#1,055 |
| 80. | Deal Borough | 4 | 5,966(0.07%)#80 | 108,470(0.00%)#1,056 |
| 81. | Ringwood Borough | 2 | 5,966(0.03%)#81 | 108,470(0.00%)#1,068 |
| 82. | Alpine Borough | 2 | 5,966(0.03%)#82 | 108,470(0.00%)#1,069 |
Common Questions
What are the Top 10 Cities with the Most Immigrants from Syria in New Jersey?
Top 10 Cities with the Most Immigrants from Syria in New Jersey are:
#1
455
#2
290
#3
281
#4
156
#5
84
#6
80
#7
71
#8
67
#9
62
#10
61
What city has the Most Immigrants from Syria in New Jersey?
Clifton has the Most Immigrants from Syria in New Jersey with 455.
What is the Total Immigrants from Syria in the State of New Jersey?
Total Immigrants from Syria in New Jersey is 5,966.
What is the Total Immigrants from Syria in the United States?
Total Immigrants from Syria in the United States is 108,470.