Mill Valley, CA Map & Demographics
Mill Valley Map
Mill Valley Overview
$120,154
PER CAPITA INCOME
$250,001
AVG FAMILY INCOME
$202,986
AVG HOUSEHOLD INCOME
33.4%
WAGE / INCOME GAP [ % ]
66.6¢/ $1
WAGE / INCOME GAP [ $ ]
0.50
INEQUALITY / GINI INDEX
14,199
TOTAL POPULATION
6,679
MALE POPULATION
7,520
FEMALE POPULATION
88.82
MALES / 100 FEMALES
112.59
FEMALES / 100 MALES
47.1
MEDIAN AGE
3.0
AVG FAMILY SIZE
2.5
AVG HOUSEHOLD SIZE
7,183
LABOR FORCE [ PEOPLE ]
61.4%
PERCENT IN LABOR FORCE
7.4%
UNEMPLOYMENT RATE
Mill Valley Zip Codes
Mill Valley Area Codes
Income in Mill Valley
Income Overview in Mill Valley
Per Capita Income in Mill Valley is $120,154, while median incomes of families and households are $250,001 and $202,986 respectively.
| Characteristic | Number | Measure |
| Per Capita Income | 14,199 | $120,154 |
| Median Family Income | 3,752 | $250,001 |
| Mean Family Income | 3,752 | $377,632 |
| Median Household Income | 5,592 | $202,986 |
| Mean Household Income | 5,592 | $303,623 |
| Income Deficit | 3,752 | $0 |
| Wage / Income Gap (%) | 14,199 | 33.38% |
| Wage / Income Gap ($) | 14,199 | 66.62¢ per $1 |
| Gini / Inequality Index | 14,199 | 0.50 |
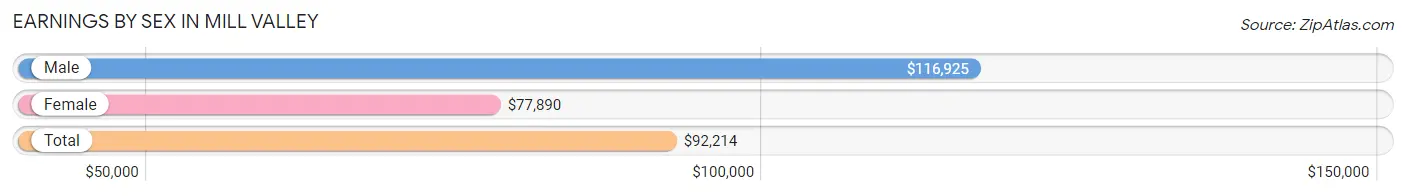
Earnings by Sex in Mill Valley
Average Earnings in Mill Valley are $92,214, $116,925 for men and $77,890 for women, a difference of 33.4%.
| Sex | Number | Average Earnings |
| Male | 4,257 (55.0%) | $116,925 |
| Female | 3,477 (45.0%) | $77,890 |
| Total | 7,734 (100.0%) | $92,214 |
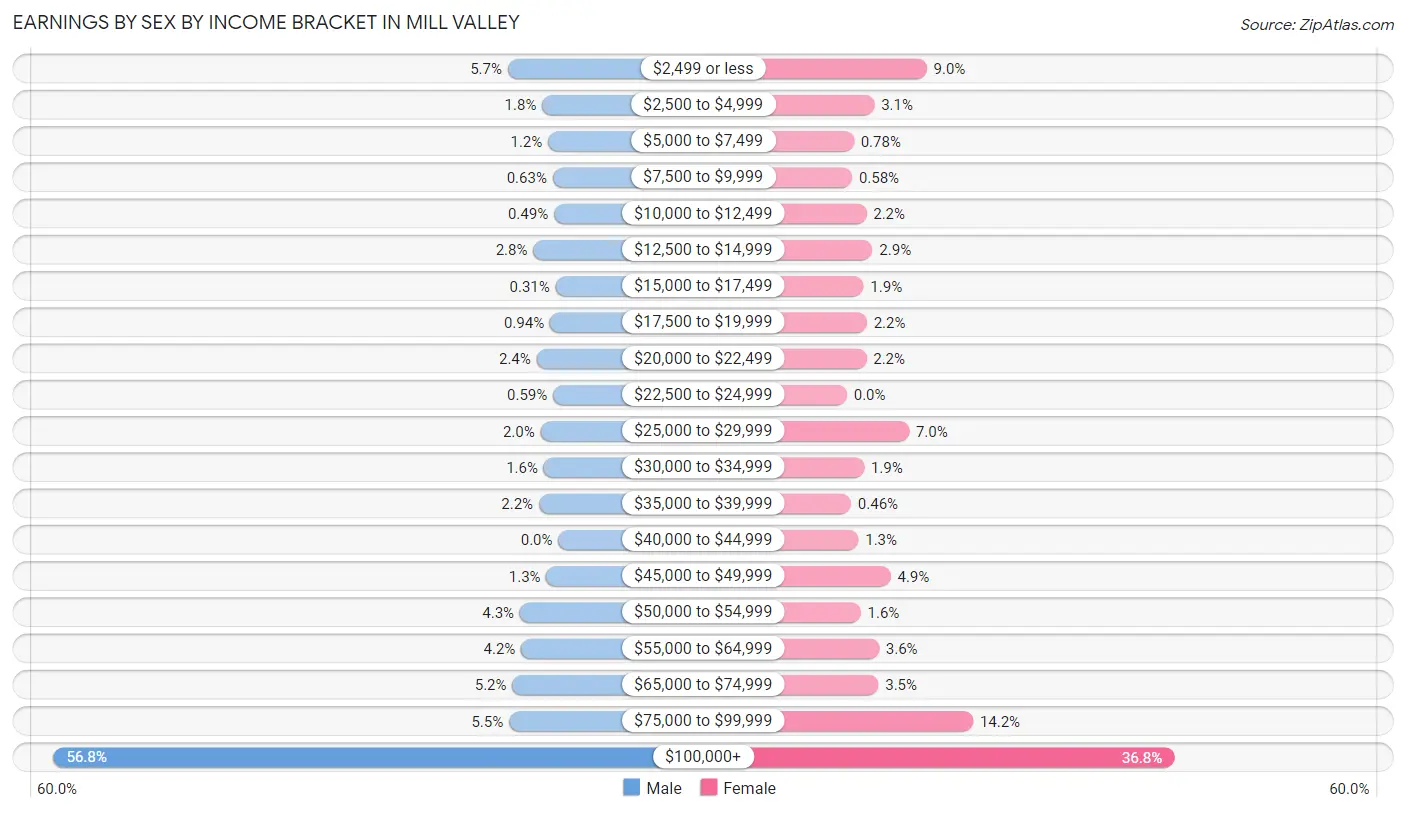
Earnings by Sex by Income Bracket in Mill Valley
The most common earnings brackets in Mill Valley are $100,000+ for men (2,416 | 56.8%) and $100,000+ for women (1,279 | 36.8%).
| Income | Male | Female |
| $2,499 or less | 242 (5.7%) | 312 (9.0%) |
| $2,500 to $4,999 | 77 (1.8%) | 107 (3.1%) |
| $5,000 to $7,499 | 49 (1.1%) | 27 (0.8%) |
| $7,500 to $9,999 | 27 (0.6%) | 20 (0.6%) |
| $10,000 to $12,499 | 21 (0.5%) | 76 (2.2%) |
| $12,500 to $14,999 | 120 (2.8%) | 100 (2.9%) |
| $15,000 to $17,499 | 13 (0.3%) | 65 (1.9%) |
| $17,500 to $19,999 | 40 (0.9%) | 78 (2.2%) |
| $20,000 to $22,499 | 104 (2.4%) | 76 (2.2%) |
| $22,500 to $24,999 | 25 (0.6%) | 0 (0.0%) |
| $25,000 to $29,999 | 85 (2.0%) | 243 (7.0%) |
| $30,000 to $34,999 | 70 (1.6%) | 67 (1.9%) |
| $35,000 to $39,999 | 93 (2.2%) | 16 (0.5%) |
| $40,000 to $44,999 | 0 (0.0%) | 45 (1.3%) |
| $45,000 to $49,999 | 57 (1.3%) | 171 (4.9%) |
| $50,000 to $54,999 | 184 (4.3%) | 54 (1.5%) |
| $55,000 to $64,999 | 178 (4.2%) | 125 (3.6%) |
| $65,000 to $74,999 | 220 (5.2%) | 123 (3.5%) |
| $75,000 to $99,999 | 236 (5.5%) | 493 (14.2%) |
| $100,000+ | 2,416 (56.8%) | 1,279 (36.8%) |
| Total | 4,257 (100.0%) | 3,477 (100.0%) |
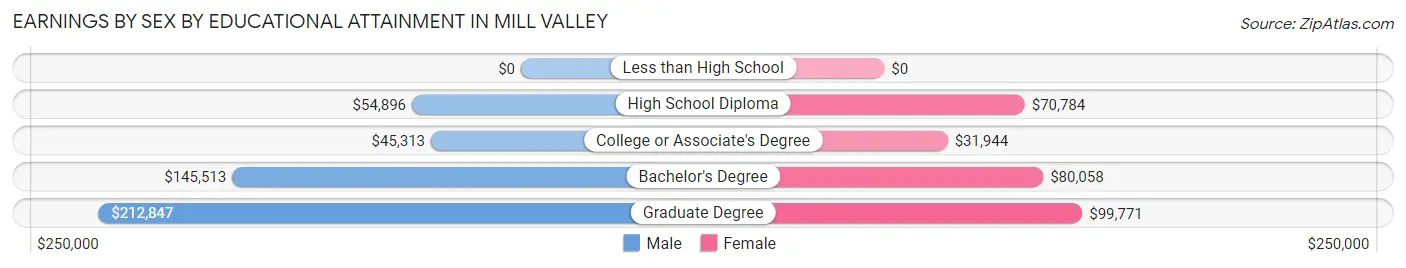
Earnings by Sex by Educational Attainment in Mill Valley
Average earnings in Mill Valley are $155,384 for men and $81,478 for women, a difference of 47.6%. Men with an educational attainment of graduate degree enjoy the highest average annual earnings of $212,847, while those with college or associate's degree education earn the least with $45,313. Women with an educational attainment of graduate degree earn the most with the average annual earnings of $99,771, while those with college or associate's degree education have the smallest earnings of $31,944.
| Educational Attainment | Male Income | Female Income |
| Less than High School | - | - |
| High School Diploma | $54,896 | $70,784 |
| College or Associate's Degree | $45,313 | $31,944 |
| Bachelor's Degree | $145,513 | $80,058 |
| Graduate Degree | $212,847 | $99,771 |
| Total | $155,384 | $81,478 |
Family Income in Mill Valley
Family Income Brackets in Mill Valley
According to the Mill Valley family income data, there are 2,349 families falling into the $200,000+ income range, which is the most common income bracket and makes up 62.6% of all families. Conversely, the $15,000 to $24,999 income bracket is the least frequent group with only 11 families (0.3%) belonging to this category.
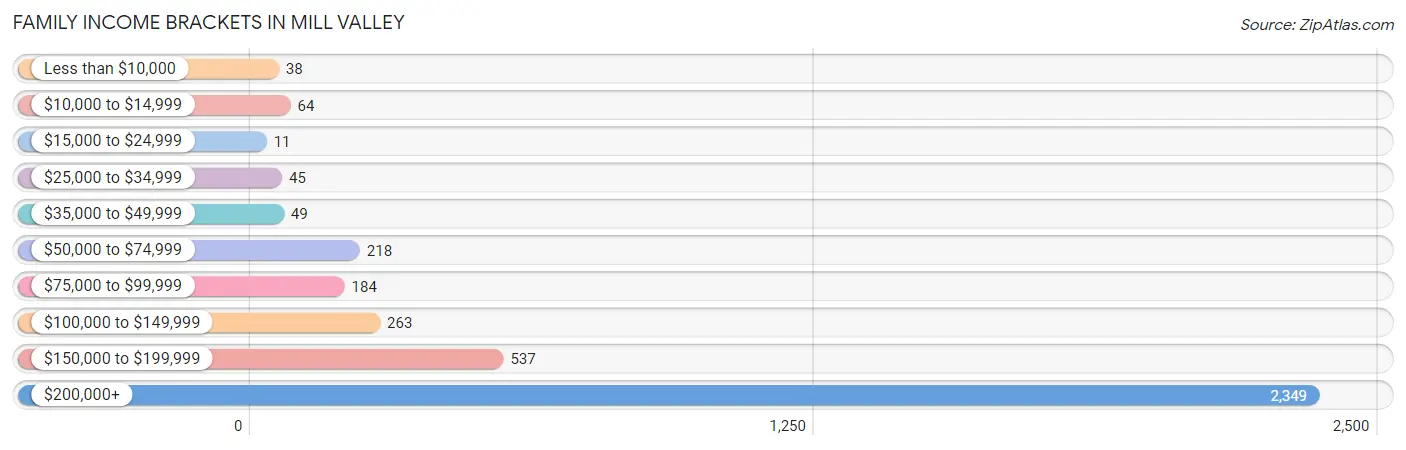
| Income Bracket | # Families | % Families |
| Less than $10,000 | 38 | 1.0% |
| $10,000 to $14,999 | 64 | 1.7% |
| $15,000 to $24,999 | 11 | 0.3% |
| $25,000 to $34,999 | 45 | 1.2% |
| $35,000 to $49,999 | 49 | 1.3% |
| $50,000 to $74,999 | 218 | 5.8% |
| $75,000 to $99,999 | 184 | 4.9% |
| $100,000 to $149,999 | 263 | 7.0% |
| $150,000 to $199,999 | 537 | 14.3% |
| $200,000+ | 2,349 | 62.6% |
Family Income by Famaliy Size in Mill Valley
3-person families (764 | 20.4%) account for the highest median family income in Mill Valley with $250,001 per family, while 2-person families (1,726 | 46.0%) have the highest median income of $105,214 per family member.
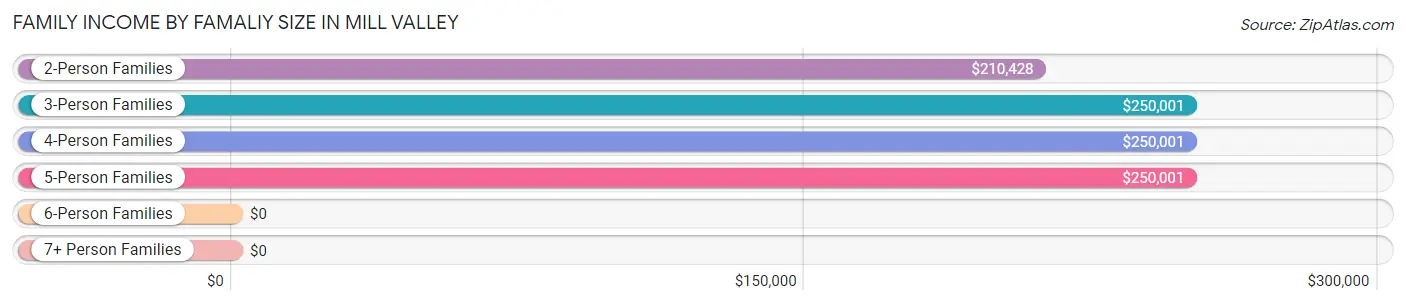
| Income Bracket | # Families | Median Income |
| 2-Person Families | 1,726 (46.0%) | $210,428 |
| 3-Person Families | 764 (20.4%) | $250,001 |
| 4-Person Families | 975 (26.0%) | $250,001 |
| 5-Person Families | 273 (7.3%) | $250,001 |
| 6-Person Families | 14 (0.4%) | $0 |
| 7+ Person Families | 0 (0.0%) | $0 |
| Total | 3,752 (100.0%) | $250,001 |
Family Income by Number of Earners in Mill Valley
The median family income in Mill Valley is $250,001, with families comprising 2 earners (1,820) having the highest median family income of $250,001, while families with no earners (497) have the lowest median family income of $134,917, accounting for 48.5% and 13.3% of families, respectively.
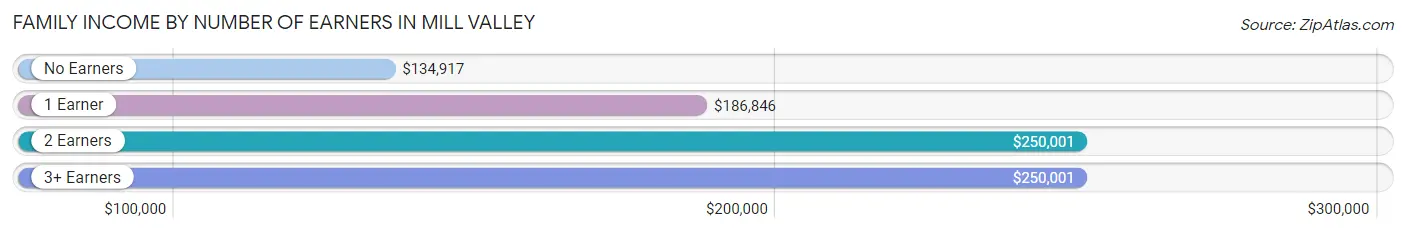
| Number of Earners | # Families | Median Income |
| No Earners | 497 (13.3%) | $134,917 |
| 1 Earner | 1,168 (31.1%) | $186,846 |
| 2 Earners | 1,820 (48.5%) | $250,001 |
| 3+ Earners | 267 (7.1%) | $250,001 |
| Total | 3,752 (100.0%) | $250,001 |
Household Income in Mill Valley
Household Income Brackets in Mill Valley
With 2,802 households falling in the category, the $200,000+ income range is the most frequent in Mill Valley, accounting for 50.1% of all households. In contrast, only 95 households (1.7%) fall into the $15,000 to $24,999 income bracket, making it the least populous group.
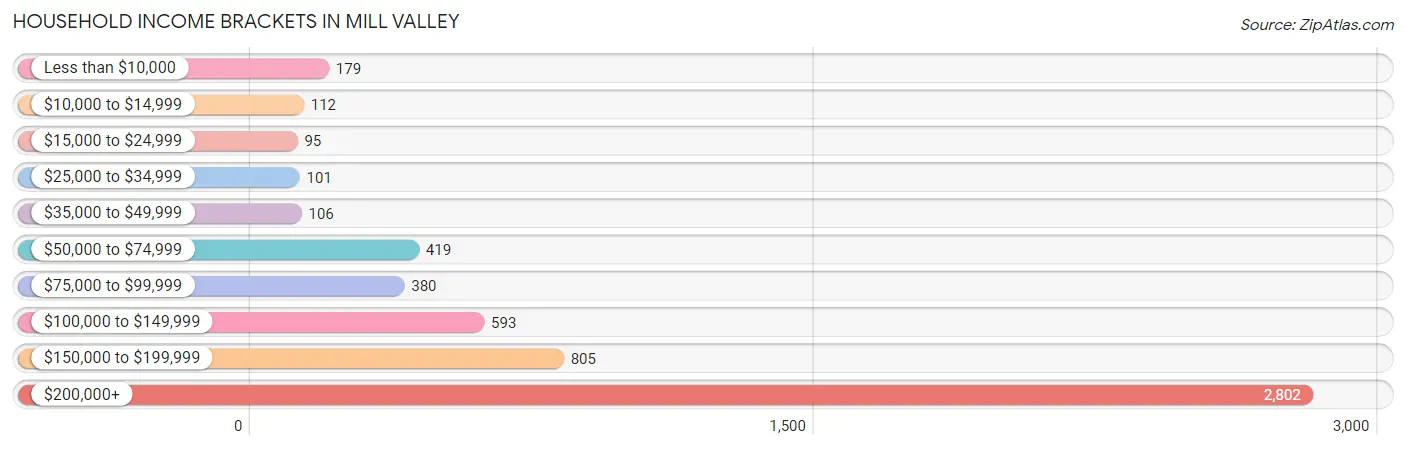
| Income Bracket | # Households | % Households |
| Less than $10,000 | 179 | 3.2% |
| $10,000 to $14,999 | 112 | 2.0% |
| $15,000 to $24,999 | 95 | 1.7% |
| $25,000 to $34,999 | 101 | 1.8% |
| $35,000 to $49,999 | 106 | 1.9% |
| $50,000 to $74,999 | 419 | 7.5% |
| $75,000 to $99,999 | 380 | 6.8% |
| $100,000 to $149,999 | 593 | 10.6% |
| $150,000 to $199,999 | 805 | 14.4% |
| $200,000+ | 2,802 | 50.1% |
Household Income by Householder Age in Mill Valley
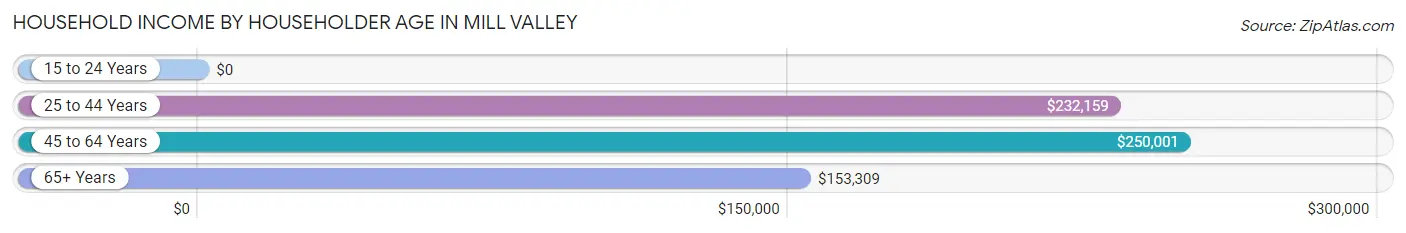
The median household income in Mill Valley is $202,986, with the highest median household income of $250,001 found in the 45 to 64 years age bracket for the primary householder. A total of 2,396 households (42.8%) fall into this category.
| Income Bracket | # Households | Median Income |
| 15 to 24 Years | 0 (0.0%) | $0 |
| 25 to 44 Years | 1,141 (20.4%) | $232,159 |
| 45 to 64 Years | 2,396 (42.8%) | $250,001 |
| 65+ Years | 2,055 (36.7%) | $153,309 |
| Total | 5,592 (100.0%) | $202,986 |
Poverty in Mill Valley
Income Below Poverty by Sex and Age in Mill Valley
With 4.7% poverty level for males and 4.6% for females among the residents of Mill Valley, 15 year old males and under 5 year old females are the most vulnerable to poverty, with 17 males (11.5%) and 26 females (9.9%) in their respective age groups living below the poverty level.
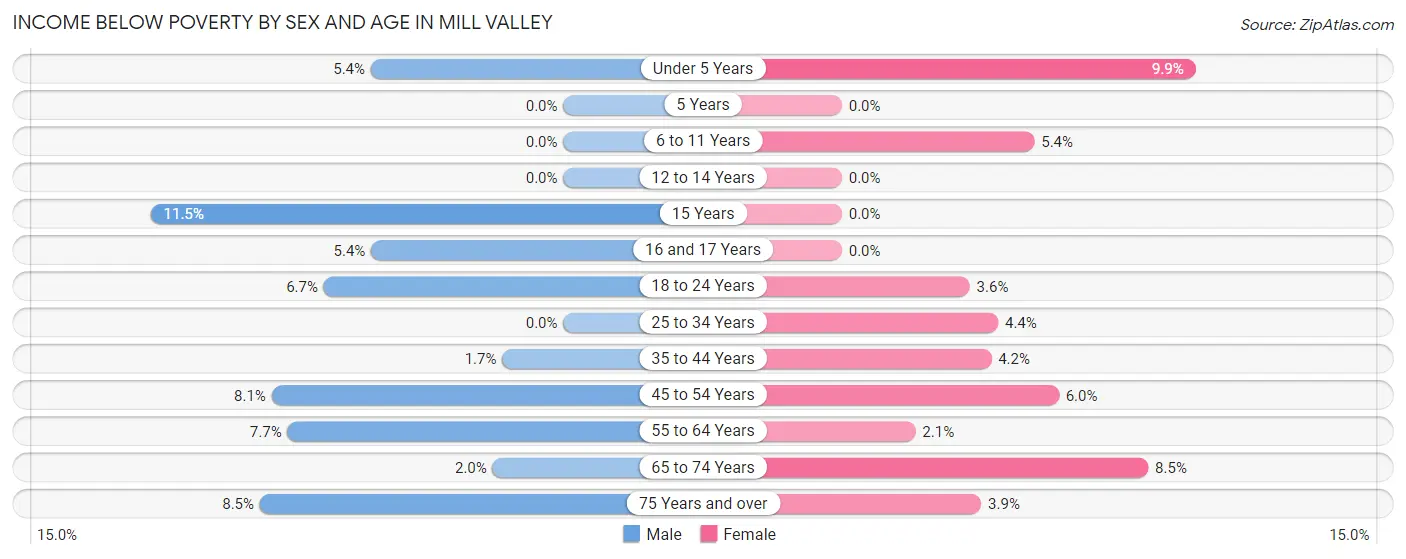
| Age Bracket | Male | Female |
| Under 5 Years | 14 (5.4%) | 26 (9.9%) |
| 5 Years | 0 (0.0%) | 0 (0.0%) |
| 6 to 11 Years | 0 (0.0%) | 29 (5.4%) |
| 12 to 14 Years | 0 (0.0%) | 0 (0.0%) |
| 15 Years | 17 (11.5%) | 0 (0.0%) |
| 16 and 17 Years | 16 (5.3%) | 0 (0.0%) |
| 18 to 24 Years | 22 (6.7%) | 16 (3.6%) |
| 25 to 34 Years | 0 (0.0%) | 24 (4.3%) |
| 35 to 44 Years | 12 (1.7%) | 35 (4.2%) |
| 45 to 54 Years | 91 (8.1%) | 85 (6.0%) |
| 55 to 64 Years | 83 (7.7%) | 19 (2.1%) |
| 65 to 74 Years | 15 (2.0%) | 80 (8.5%) |
| 75 Years and over | 43 (8.5%) | 30 (3.9%) |
| Total | 313 (4.7%) | 344 (4.6%) |
Income Above Poverty by Sex and Age in Mill Valley
According to the poverty statistics in Mill Valley, males aged 5 years and females aged 5 years are the age groups that are most secure financially, with 100.0% of males and 100.0% of females in these age groups living above the poverty line.
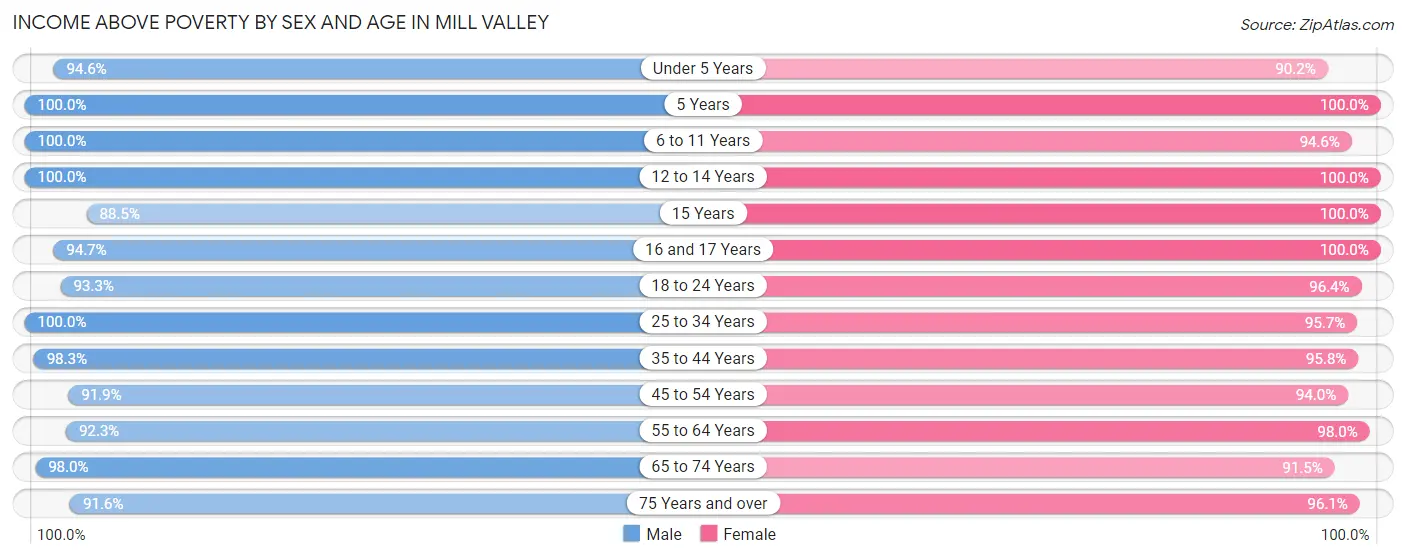
| Age Bracket | Male | Female |
| Under 5 Years | 247 (94.6%) | 238 (90.1%) |
| 5 Years | 12 (100.0%) | 66 (100.0%) |
| 6 to 11 Years | 497 (100.0%) | 512 (94.6%) |
| 12 to 14 Years | 220 (100.0%) | 373 (100.0%) |
| 15 Years | 131 (88.5%) | 118 (100.0%) |
| 16 and 17 Years | 283 (94.7%) | 220 (100.0%) |
| 18 to 24 Years | 308 (93.3%) | 434 (96.4%) |
| 25 to 34 Years | 723 (100.0%) | 528 (95.7%) |
| 35 to 44 Years | 695 (98.3%) | 806 (95.8%) |
| 45 to 54 Years | 1,029 (91.9%) | 1,323 (94.0%) |
| 55 to 64 Years | 998 (92.3%) | 910 (98.0%) |
| 65 to 74 Years | 745 (98.0%) | 858 (91.5%) |
| 75 Years and over | 466 (91.5%) | 743 (96.1%) |
| Total | 6,354 (95.3%) | 7,129 (95.4%) |
Income Below Poverty Among Married-Couple Families in Mill Valley
The poverty statistics for married-couple families in Mill Valley show that 2.0% or 63 of the total 3,147 families live below the poverty line. Families with no children have the highest poverty rate of 3.0%, comprising of 53 families. On the other hand, families with 3 or 4 children have the lowest poverty rate of 0.0%, which includes 0 families.
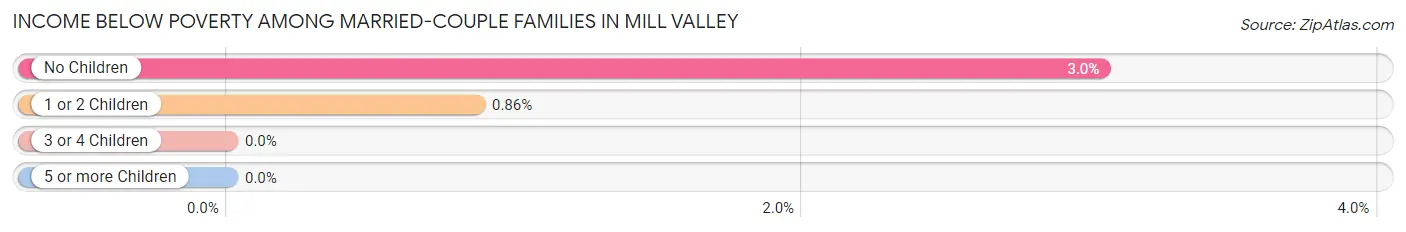
| Children | Above Poverty | Below Poverty |
| No Children | 1,693 (97.0%) | 53 (3.0%) |
| 1 or 2 Children | 1,157 (99.1%) | 10 (0.9%) |
| 3 or 4 Children | 234 (100.0%) | 0 (0.0%) |
| 5 or more Children | 0 (0.0%) | 0 (0.0%) |
| Total | 3,084 (98.0%) | 63 (2.0%) |
Income Below Poverty Among Single-Parent Households in Mill Valley
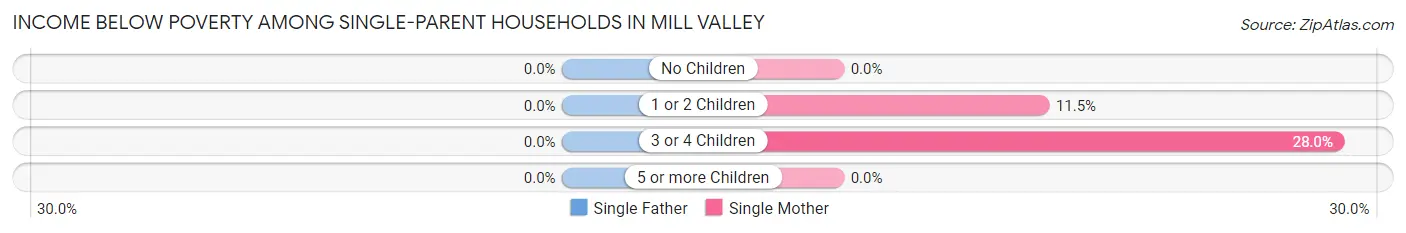
| Children | Single Father | Single Mother |
| No Children | 0 (0.0%) | 0 (0.0%) |
| 1 or 2 Children | 0 (0.0%) | 25 (11.5%) |
| 3 or 4 Children | 0 (0.0%) | 14 (28.0%) |
| 5 or more Children | 0 (0.0%) | 0 (0.0%) |
| Total | 0 (0.0%) | 39 (8.0%) |
Income Below Poverty Among Married-Couple vs Single-Parent Households in Mill Valley
The poverty data for Mill Valley shows that 63 of the married-couple family households (2.0%) and 39 of the single-parent households (6.5%) are living below the poverty level. Within the married-couple family households, those with no children have the highest poverty rate, with 53 households (3.0%) falling below the poverty line. Among the single-parent households, those with 3 or 4 children have the highest poverty rate, with 14 household (28.0%) living below poverty.
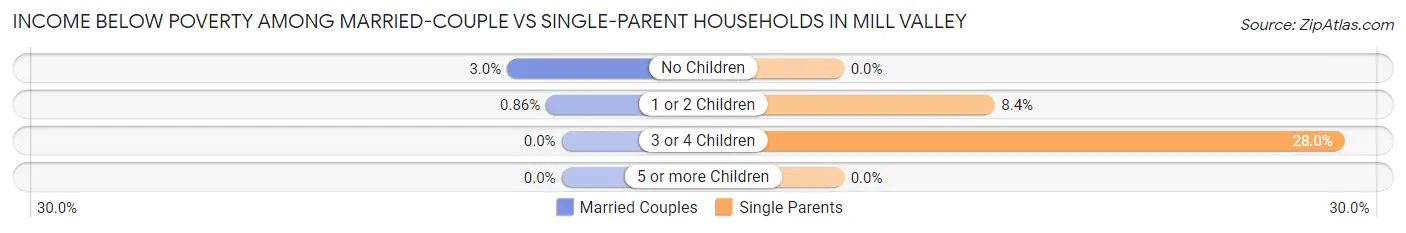
| Children | Married-Couple Families | Single-Parent Households |
| No Children | 53 (3.0%) | 0 (0.0%) |
| 1 or 2 Children | 10 (0.9%) | 25 (8.4%) |
| 3 or 4 Children | 0 (0.0%) | 14 (28.0%) |
| 5 or more Children | 0 (0.0%) | 0 (0.0%) |
| Total | 63 (2.0%) | 39 (6.5%) |
Race in Mill Valley
The most populous races in Mill Valley are White / Caucasian (11,874 | 83.6%), Asian (1,104 | 7.8%), and Two or more Races (808 | 5.7%).
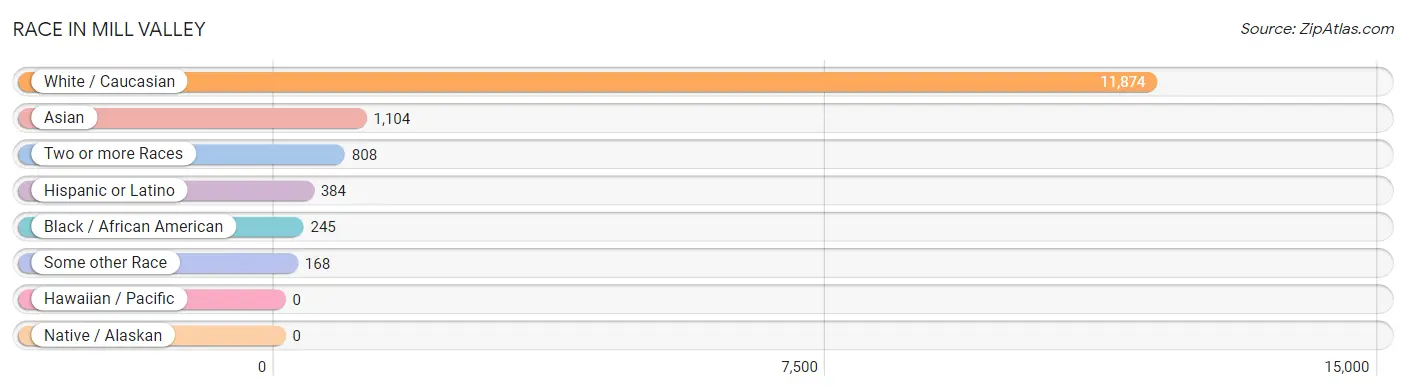
| Race | # Population | % Population |
| Asian | 1,104 | 7.8% |
| Black / African American | 245 | 1.7% |
| Hawaiian / Pacific | 0 | 0.0% |
| Hispanic or Latino | 384 | 2.7% |
| Native / Alaskan | 0 | 0.0% |
| White / Caucasian | 11,874 | 83.6% |
| Two or more Races | 808 | 5.7% |
| Some other Race | 168 | 1.2% |
| Total | 14,199 | 100.0% |
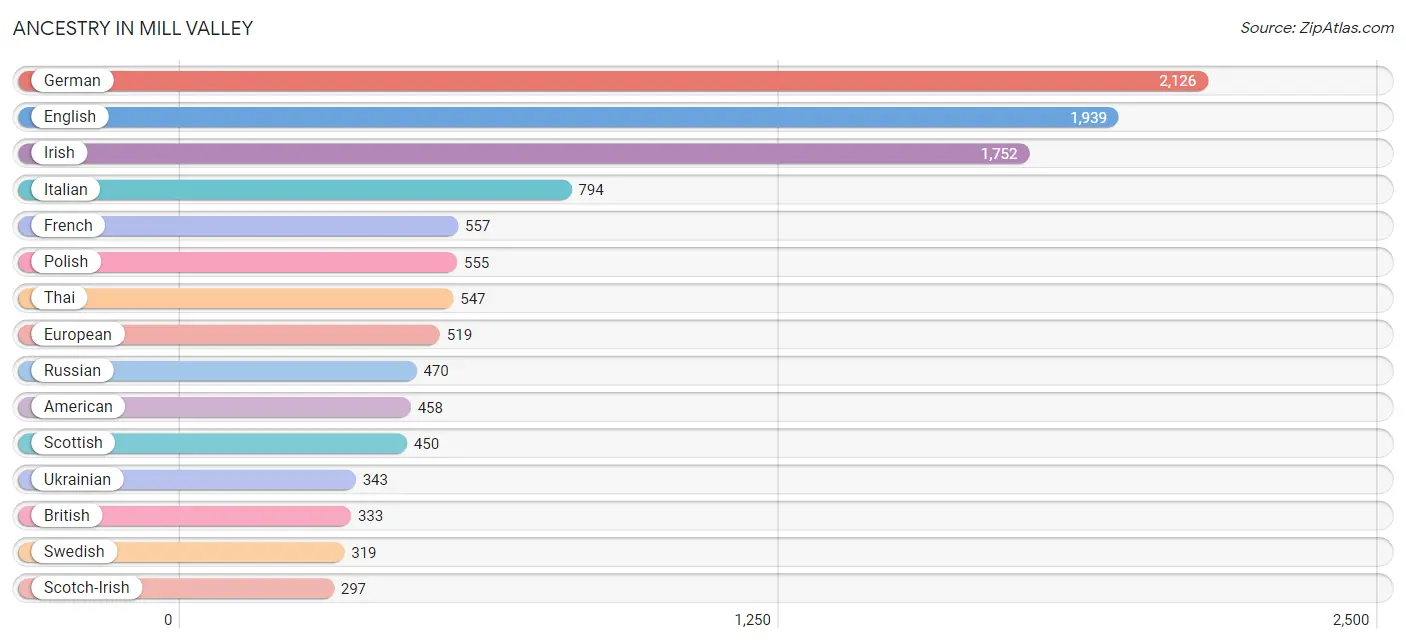
Ancestry in Mill Valley
The most populous ancestries reported in Mill Valley are German (2,126 | 15.0%), English (1,939 | 13.7%), Irish (1,752 | 12.3%), Italian (794 | 5.6%), and French (557 | 3.9%), together accounting for 50.5% of all Mill Valley residents.
| Ancestry | # Population | % Population |
| Albanian | 16 | 0.1% |
| American | 458 | 3.2% |
| Arab | 53 | 0.4% |
| Armenian | 23 | 0.2% |
| Australian | 38 | 0.3% |
| Austrian | 77 | 0.5% |
| Bhutanese | 186 | 1.3% |
| British | 333 | 2.4% |
| Burmese | 84 | 0.6% |
| Canadian | 232 | 1.6% |
| Celtic | 25 | 0.2% |
| Central American | 21 | 0.2% |
| Cherokee | 57 | 0.4% |
| Chippewa | 25 | 0.2% |
| Choctaw | 24 | 0.2% |
| Colombian | 61 | 0.4% |
| Costa Rican | 12 | 0.1% |
| Croatian | 26 | 0.2% |
| Czech | 92 | 0.6% |
| Czechoslovakian | 53 | 0.4% |
| Danish | 278 | 2.0% |
| Dutch | 121 | 0.9% |
| Eastern European | 106 | 0.7% |
| English | 1,939 | 13.7% |
| European | 519 | 3.7% |
| Finnish | 13 | 0.1% |
| French | 557 | 3.9% |
| French Canadian | 55 | 0.4% |
| German | 2,126 | 15.0% |
| Greek | 83 | 0.6% |
| Hungarian | 94 | 0.7% |
| Indian (Asian) | 275 | 1.9% |
| Iranian | 29 | 0.2% |
| Irish | 1,752 | 12.3% |
| Israeli | 34 | 0.2% |
| Italian | 794 | 5.6% |
| Korean | 13 | 0.1% |
| Latvian | 21 | 0.2% |
| Lebanese | 51 | 0.4% |
| Lithuanian | 79 | 0.6% |
| Luxembourger | 13 | 0.1% |
| Maltese | 35 | 0.3% |
| Mexican | 200 | 1.4% |
| Nigerian | 87 | 0.6% |
| Northern European | 259 | 1.8% |
| Norwegian | 247 | 1.7% |
| Pakistani | 133 | 0.9% |
| Palestinian | 2 | 0.0% |
| Polish | 555 | 3.9% |
| Portuguese | 153 | 1.1% |
| Romanian | 20 | 0.1% |
| Russian | 470 | 3.3% |
| Salvadoran | 9 | 0.1% |
| Scandinavian | 11 | 0.1% |
| Scotch-Irish | 297 | 2.1% |
| Scottish | 450 | 3.2% |
| Slovak | 41 | 0.3% |
| South African | 70 | 0.5% |
| South American | 61 | 0.4% |
| Spaniard | 37 | 0.3% |
| Spanish | 65 | 0.5% |
| Sri Lankan | 74 | 0.5% |
| Subsaharan African | 157 | 1.1% |
| Swedish | 319 | 2.2% |
| Swiss | 80 | 0.6% |
| Syrian | 12 | 0.1% |
| Thai | 547 | 3.8% |
| Ukrainian | 343 | 2.4% |
| Welsh | 70 | 0.5% | View All 69 Rows |
Immigrants in Mill Valley
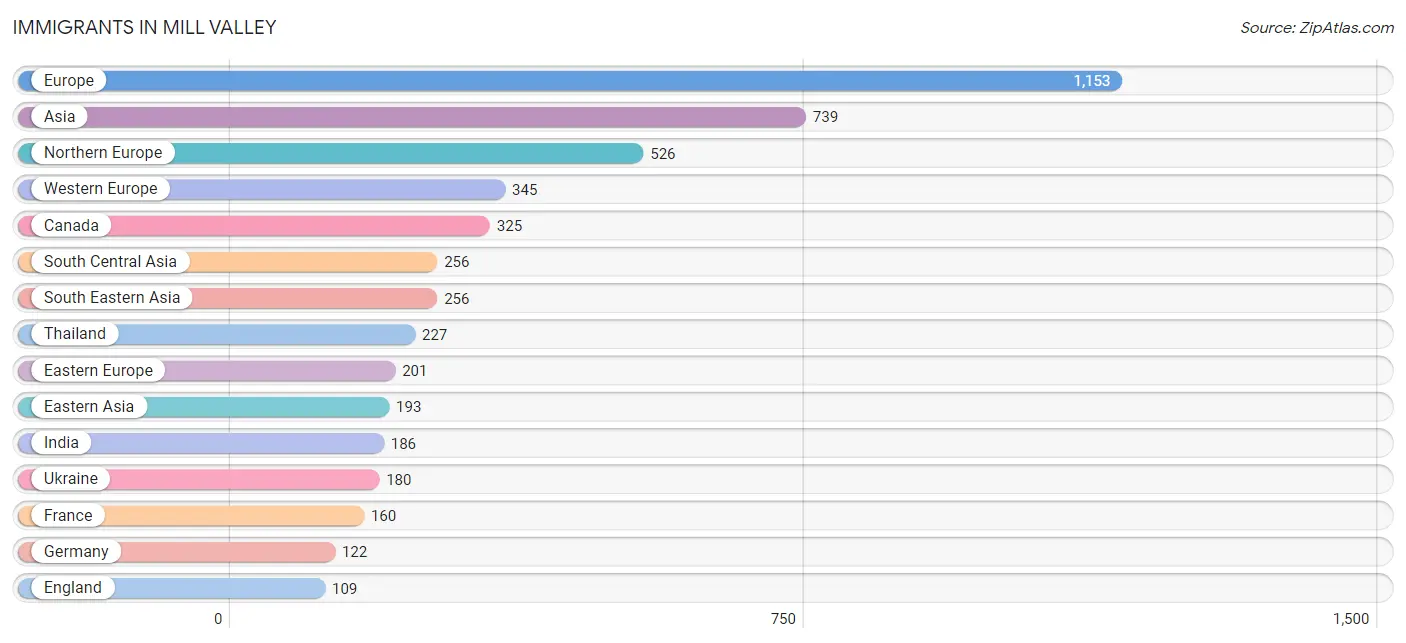
The most numerous immigrant groups reported in Mill Valley came from Europe (1,153 | 8.1%), Asia (739 | 5.2%), Northern Europe (526 | 3.7%), Western Europe (345 | 2.4%), and Canada (325 | 2.3%), together accounting for 21.7% of all Mill Valley residents.
| Immigration Origin | # Population | % Population |
| Africa | 100 | 0.7% |
| Asia | 739 | 5.2% |
| Australia | 15 | 0.1% |
| Brazil | 12 | 0.1% |
| Canada | 325 | 2.3% |
| Central America | 5 | 0.0% |
| China | 88 | 0.6% |
| Colombia | 9 | 0.1% |
| Eastern Asia | 193 | 1.4% |
| Eastern Europe | 201 | 1.4% |
| Egypt | 26 | 0.2% |
| England | 109 | 0.8% |
| Europe | 1,153 | 8.1% |
| France | 160 | 1.1% |
| Germany | 122 | 0.9% |
| Greece | 24 | 0.2% |
| India | 186 | 1.3% |
| Iran | 58 | 0.4% |
| Ireland | 41 | 0.3% |
| Israel | 34 | 0.2% |
| Italy | 22 | 0.2% |
| Japan | 43 | 0.3% |
| Korea | 62 | 0.4% |
| Latin America | 26 | 0.2% |
| Mexico | 5 | 0.0% |
| Morocco | 15 | 0.1% |
| Netherlands | 8 | 0.1% |
| Northern Africa | 41 | 0.3% |
| Northern Europe | 526 | 3.7% |
| Oceania | 15 | 0.1% |
| Pakistan | 12 | 0.1% |
| Philippines | 13 | 0.1% |
| Portugal | 10 | 0.1% |
| Russia | 21 | 0.2% |
| Scotland | 54 | 0.4% |
| South Africa | 59 | 0.4% |
| South America | 21 | 0.2% |
| South Central Asia | 256 | 1.8% |
| South Eastern Asia | 256 | 1.8% |
| Southern Europe | 81 | 0.6% |
| Spain | 25 | 0.2% |
| Sweden | 82 | 0.6% |
| Switzerland | 55 | 0.4% |
| Taiwan | 15 | 0.1% |
| Thailand | 227 | 1.6% |
| Ukraine | 180 | 1.3% |
| Vietnam | 16 | 0.1% |
| Western Asia | 34 | 0.2% |
| Western Europe | 345 | 2.4% | View All 49 Rows |
Sex and Age in Mill Valley
Sex and Age in Mill Valley
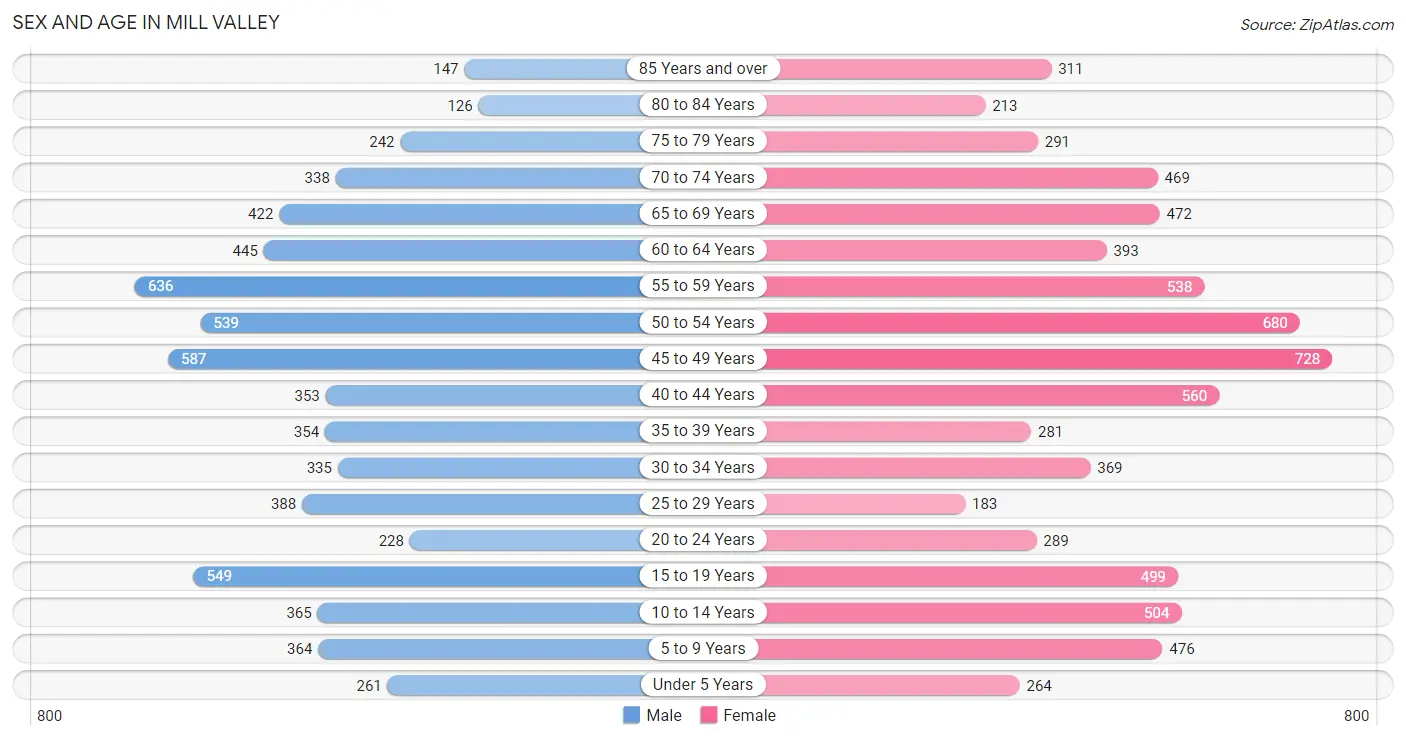
The most populous age groups in Mill Valley are 55 to 59 Years (636 | 9.5%) for men and 45 to 49 Years (728 | 9.7%) for women.
| Age Bracket | Male | Female |
| Under 5 Years | 261 (3.9%) | 264 (3.5%) |
| 5 to 9 Years | 364 (5.4%) | 476 (6.3%) |
| 10 to 14 Years | 365 (5.5%) | 504 (6.7%) |
| 15 to 19 Years | 549 (8.2%) | 499 (6.6%) |
| 20 to 24 Years | 228 (3.4%) | 289 (3.8%) |
| 25 to 29 Years | 388 (5.8%) | 183 (2.4%) |
| 30 to 34 Years | 335 (5.0%) | 369 (4.9%) |
| 35 to 39 Years | 354 (5.3%) | 281 (3.7%) |
| 40 to 44 Years | 353 (5.3%) | 560 (7.4%) |
| 45 to 49 Years | 587 (8.8%) | 728 (9.7%) |
| 50 to 54 Years | 539 (8.1%) | 680 (9.0%) |
| 55 to 59 Years | 636 (9.5%) | 538 (7.1%) |
| 60 to 64 Years | 445 (6.7%) | 393 (5.2%) |
| 65 to 69 Years | 422 (6.3%) | 472 (6.3%) |
| 70 to 74 Years | 338 (5.1%) | 469 (6.2%) |
| 75 to 79 Years | 242 (3.6%) | 291 (3.9%) |
| 80 to 84 Years | 126 (1.9%) | 213 (2.8%) |
| 85 Years and over | 147 (2.2%) | 311 (4.1%) |
| Total | 6,679 (100.0%) | 7,520 (100.0%) |
Families and Households in Mill Valley
Median Family Size in Mill Valley
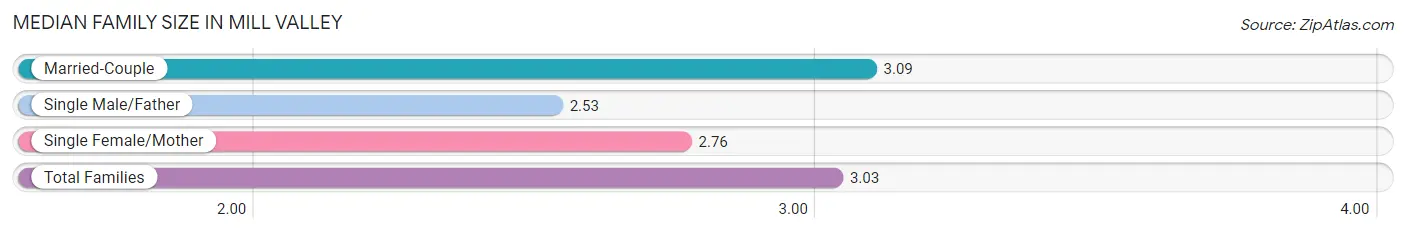
The median family size in Mill Valley is 3.03 persons per family, with married-couple families (3,147 | 83.9%) accounting for the largest median family size of 3.09 persons per family. On the other hand, single male/father families (117 | 3.1%) represent the smallest median family size with 2.53 persons per family.
| Family Type | # Families | Family Size |
| Married-Couple | 3,147 (83.9%) | 3.09 |
| Single Male/Father | 117 (3.1%) | 2.53 |
| Single Female/Mother | 488 (13.0%) | 2.76 |
| Total Families | 3,752 (100.0%) | 3.03 |
Median Household Size in Mill Valley
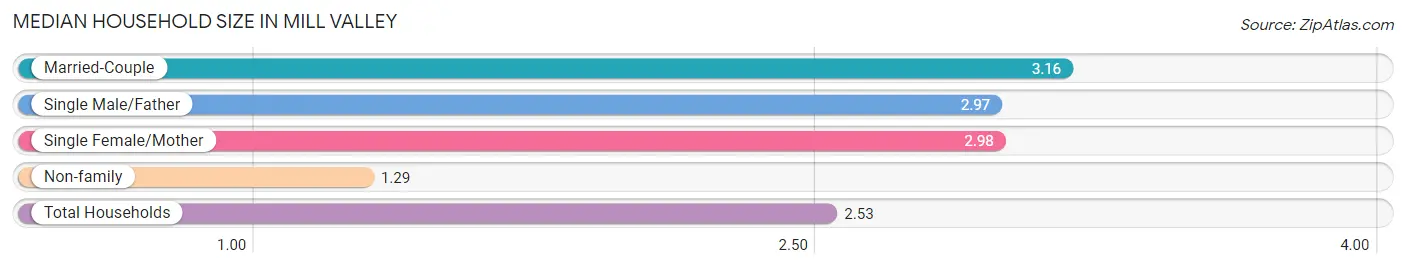
The median household size in Mill Valley is 2.53 persons per household, with married-couple households (3,147 | 56.3%) accounting for the largest median household size of 3.16 persons per household. non-family households (1,840 | 32.9%) represent the smallest median household size with 1.29 persons per household.
| Household Type | # Households | Household Size |
| Married-Couple | 3,147 (56.3%) | 3.16 |
| Single Male/Father | 117 (2.1%) | 2.97 |
| Single Female/Mother | 488 (8.7%) | 2.98 |
| Non-family | 1,840 (32.9%) | 1.29 |
| Total Households | 5,592 (100.0%) | 2.53 |
Household Size by Marriage Status in Mill Valley
Out of a total of 5,592 households in Mill Valley, 3,752 (67.1%) are family households, while 1,840 (32.9%) are nonfamily households. The most numerous type of family households are 2-person households, comprising 1,601, and the most common type of nonfamily households are 1-person households, comprising 1,391.
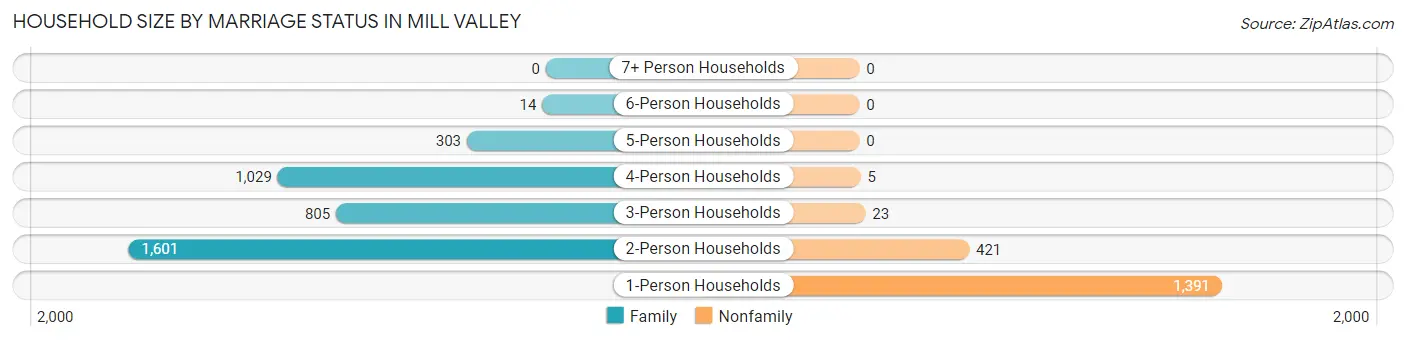
| Household Size | Family Households | Nonfamily Households |
| 1-Person Households | - | 1,391 (24.9%) |
| 2-Person Households | 1,601 (28.6%) | 421 (7.5%) |
| 3-Person Households | 805 (14.4%) | 23 (0.4%) |
| 4-Person Households | 1,029 (18.4%) | 5 (0.1%) |
| 5-Person Households | 303 (5.4%) | 0 (0.0%) |
| 6-Person Households | 14 (0.3%) | 0 (0.0%) |
| 7+ Person Households | 0 (0.0%) | 0 (0.0%) |
| Total | 3,752 (67.1%) | 1,840 (32.9%) |
Female Fertility in Mill Valley
Fertility by Age in Mill Valley
Average fertility rate in Mill Valley is 32.0 births per 1,000 women. Women in the age bracket of 20 to 34 years have the highest fertility rate with 61.0 births per 1,000 women. Women in the age bracket of 20 to 34 years acount for 52.6% of all women with births.
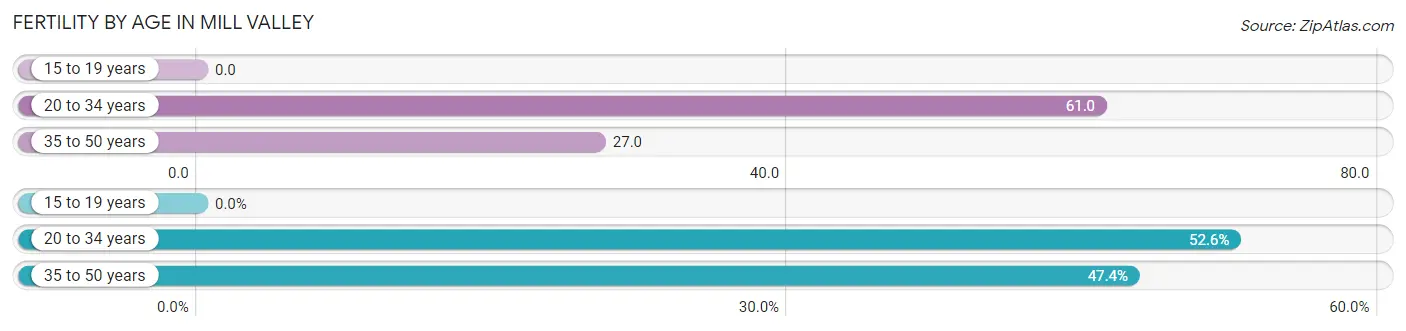
| Age Bracket | Women with Births | Births / 1,000 Women |
| 15 to 19 years | 0 (0.0%) | 0.0 |
| 20 to 34 years | 51 (52.6%) | 61.0 |
| 35 to 50 years | 46 (47.4%) | 27.0 |
| Total | 97 (100.0%) | 32.0 |
Fertility by Age by Marriage Status in Mill Valley
70.1% of women with births (97) in Mill Valley are married. The highest percentage of unmarried women with births falls into 35 to 50 years age bracket with 63.0% of them unmarried at the time of birth, while the lowest percentage of unmarried women with births belong to 20 to 34 years age bracket with 0.0% of them unmarried.
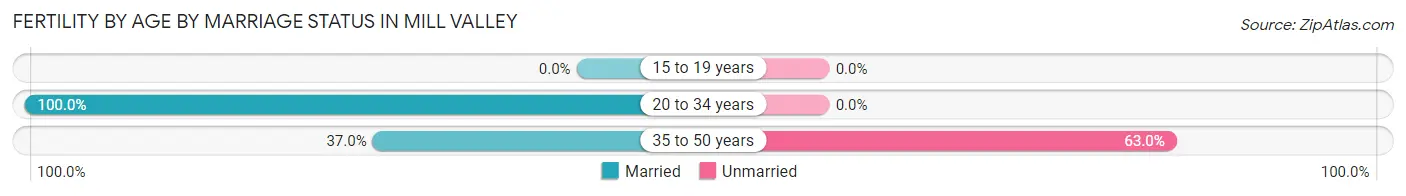
| Age Bracket | Married | Unmarried |
| 15 to 19 years | 0 (0.0%) | 0 (0.0%) |
| 20 to 34 years | 51 (100.0%) | 0 (0.0%) |
| 35 to 50 years | 17 (37.0%) | 29 (63.0%) |
| Total | 68 (70.1%) | 29 (29.9%) |
Fertility by Education in Mill Valley
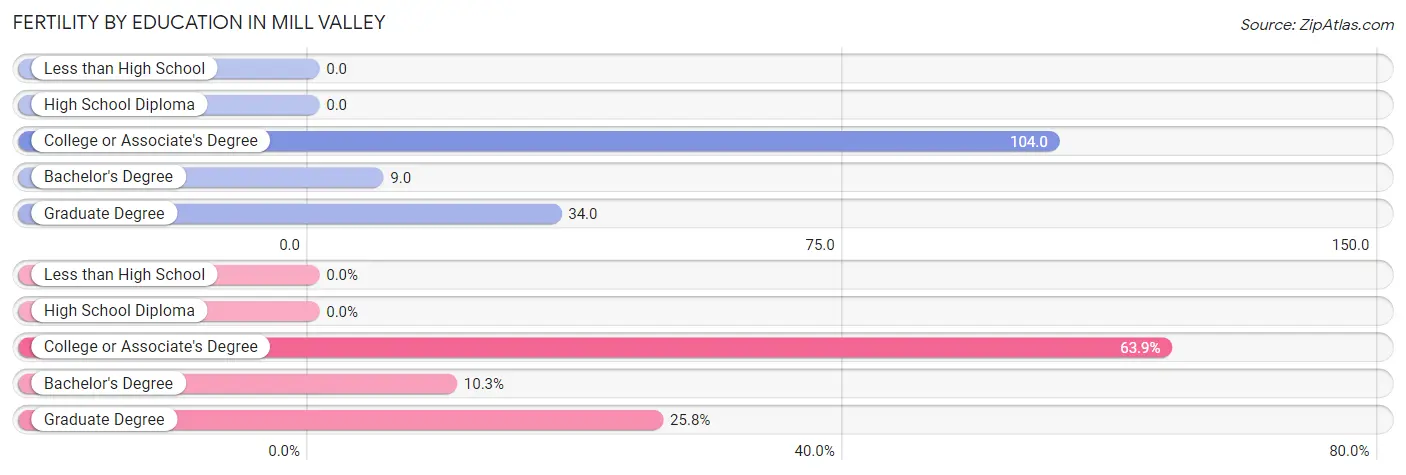
| Educational Attainment | Women with Births | Births / 1,000 Women |
| Less than High School | 0 (0.0%) | 0.0 |
| High School Diploma | 0 (0.0%) | 0.0 |
| College or Associate's Degree | 62 (63.9%) | 104.0 |
| Bachelor's Degree | 10 (10.3%) | 9.0 |
| Graduate Degree | 25 (25.8%) | 34.0 |
| Total | 97 (100.0%) | 32.0 |
Fertility by Education by Marriage Status in Mill Valley
29.9% of women with births in Mill Valley are unmarried. Women with the educational attainment of bachelor's degree are most likely to be married with 100.0% of them married at childbirth, while women with the educational attainment of college or associate's degree are least likely to be married with 46.8% of them unmarried at childbirth.
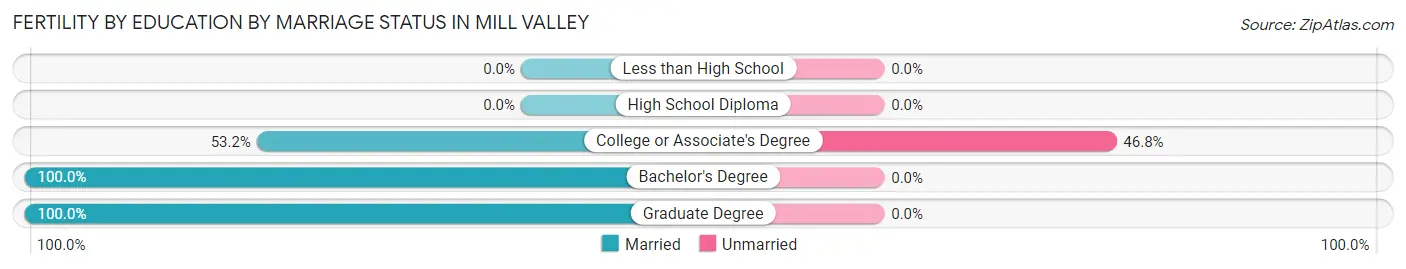
| Educational Attainment | Married | Unmarried |
| Less than High School | 0 (0.0%) | 0 (0.0%) |
| High School Diploma | 0 (0.0%) | 0 (0.0%) |
| College or Associate's Degree | 33 (53.2%) | 29 (46.8%) |
| Bachelor's Degree | 10 (100.0%) | 0 (0.0%) |
| Graduate Degree | 25 (100.0%) | 0 (0.0%) |
| Total | 68 (70.1%) | 29 (29.9%) |
Employment Characteristics in Mill Valley
Employment by Class of Employer in Mill Valley
Among the 6,572 employed individuals in Mill Valley, private company employees (4,062 | 61.8%), self-employed (not incorporated) (695 | 10.6%), and self-employed (incorporated) (600 | 9.1%) make up the most common classes of employment.
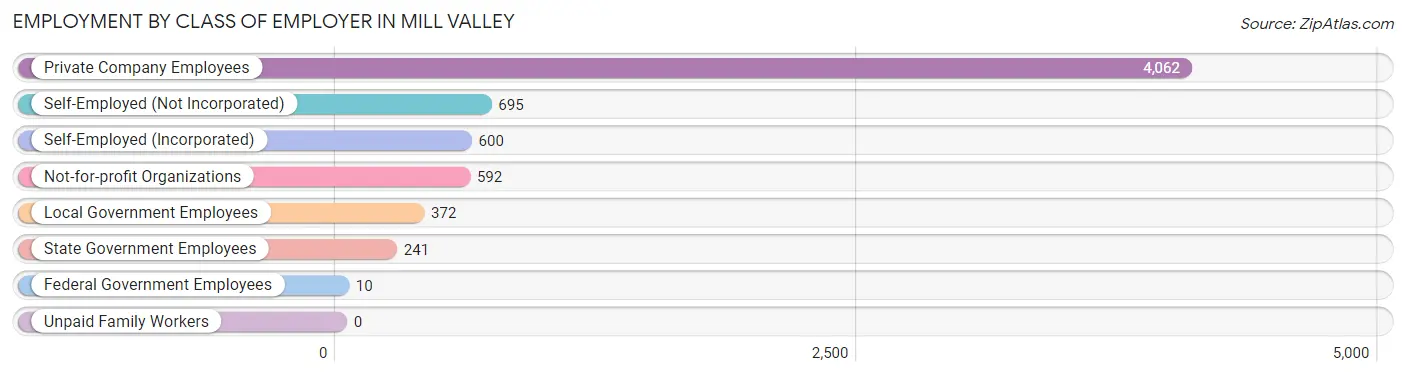
| Employer Class | # Employees | % Employees |
| Private Company Employees | 4,062 | 61.8% |
| Self-Employed (Incorporated) | 600 | 9.1% |
| Self-Employed (Not Incorporated) | 695 | 10.6% |
| Not-for-profit Organizations | 592 | 9.0% |
| Local Government Employees | 372 | 5.7% |
| State Government Employees | 241 | 3.7% |
| Federal Government Employees | 10 | 0.2% |
| Unpaid Family Workers | 0 | 0.0% |
| Total | 6,572 | 100.0% |
Employment Status by Age in Mill Valley
According to the labor force statistics for Mill Valley, out of the total population over 16 years of age (11,699), 61.4% or 7,183 individuals are in the labor force, with 7.4% or 532 of them unemployed. The age group with the highest labor force participation rate is 25 to 29 years, with 93.0% or 531 individuals in the labor force. Within the labor force, the 20 to 24 years age range has the highest percentage of unemployed individuals, with 27.5% or 56 of them being unemployed.
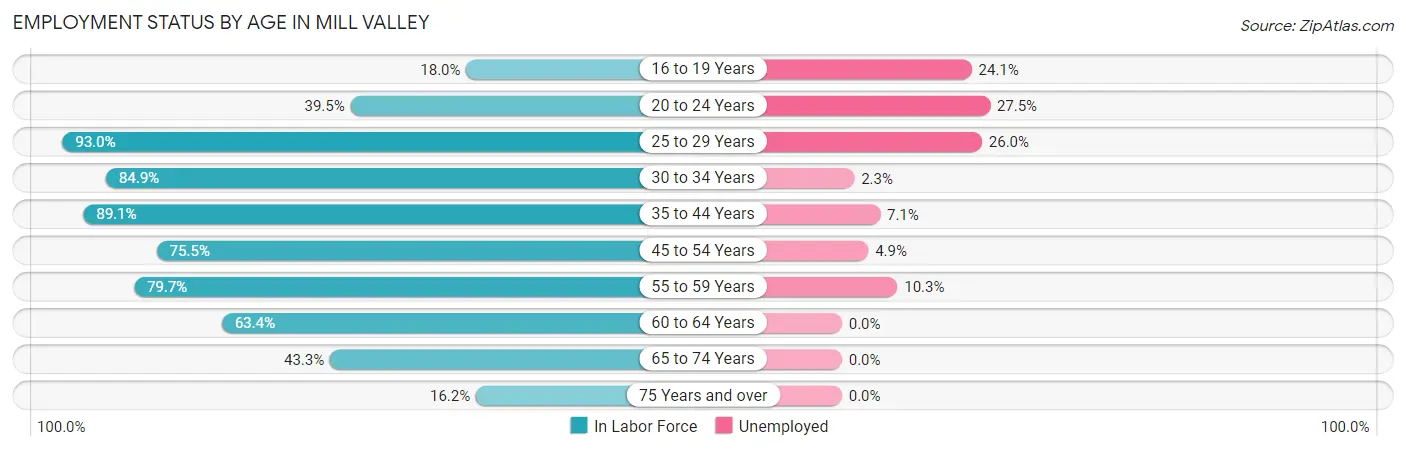
| Age Bracket | In Labor Force | Unemployed |
| 16 to 19 Years | 141 (18.0%) | 34 (24.1%) |
| 20 to 24 Years | 204 (39.5%) | 56 (27.5%) |
| 25 to 29 Years | 531 (93.0%) | 138 (26.0%) |
| 30 to 34 Years | 598 (84.9%) | 14 (2.3%) |
| 35 to 44 Years | 1,379 (89.1%) | 98 (7.1%) |
| 45 to 54 Years | 1,913 (75.5%) | 94 (4.9%) |
| 55 to 59 Years | 936 (79.7%) | 96 (10.3%) |
| 60 to 64 Years | 531 (63.4%) | 0 (0.0%) |
| 65 to 74 Years | 737 (43.3%) | 0 (0.0%) |
| 75 Years and over | 215 (16.2%) | 0 (0.0%) |
| Total | 7,183 (61.4%) | 532 (7.4%) |
Employment Status by Educational Attainment in Mill Valley
According to labor force statistics for Mill Valley, 79.9% of individuals (5,888) out of the total population between 25 and 64 years of age (7,369) are in the labor force, with 7.5% or 442 of them being unemployed. The group with the highest labor force participation rate are those with the educational attainment of less than high school, with 83.3% or 30 individuals in the labor force. Within the labor force, individuals with college / associate degree education have the highest percentage of unemployment, with 30.6% or 258 of them being unemployed.
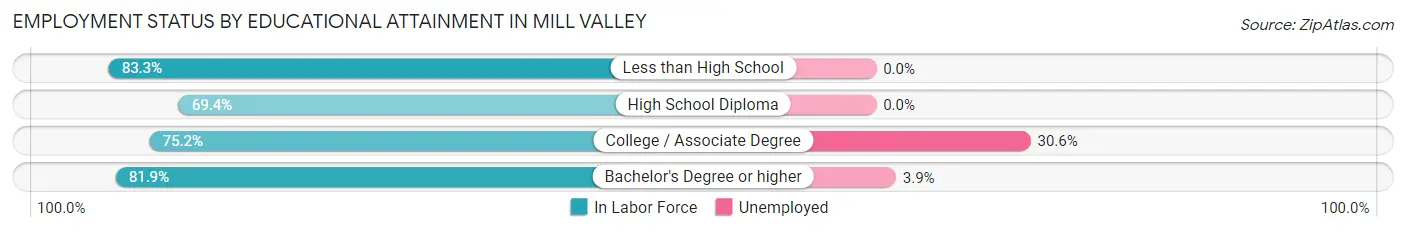
| Educational Attainment | In Labor Force | Unemployed |
| Less than High School | 30 (83.3%) | 0 (0.0%) |
| High School Diploma | 387 (69.4%) | 0 (0.0%) |
| College / Associate Degree | 843 (75.2%) | 343 (30.6%) |
| Bachelor's Degree or higher | 4,631 (81.9%) | 221 (3.9%) |
| Total | 5,888 (79.9%) | 553 (7.5%) |
Employment Occupations by Sex in Mill Valley
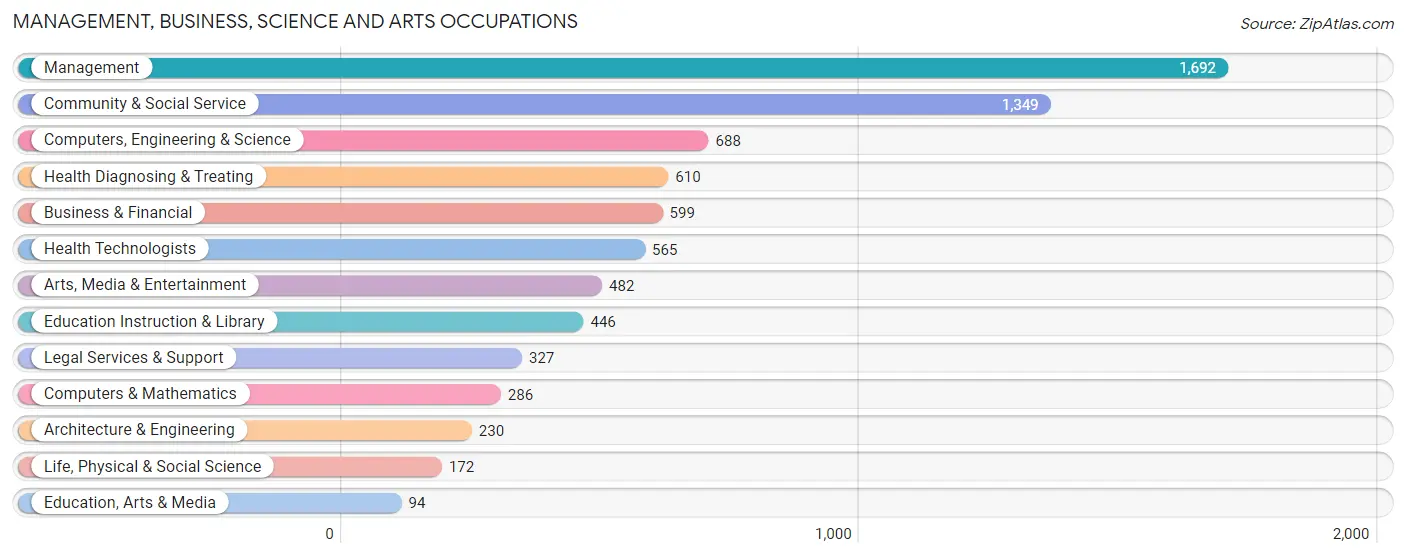
Management, Business, Science and Arts Occupations
The most common Management, Business, Science and Arts occupations in Mill Valley are Management (1,692 | 25.4%), Community & Social Service (1,349 | 20.3%), Computers, Engineering & Science (688 | 10.3%), Health Diagnosing & Treating (610 | 9.2%), and Business & Financial (599 | 9.0%).
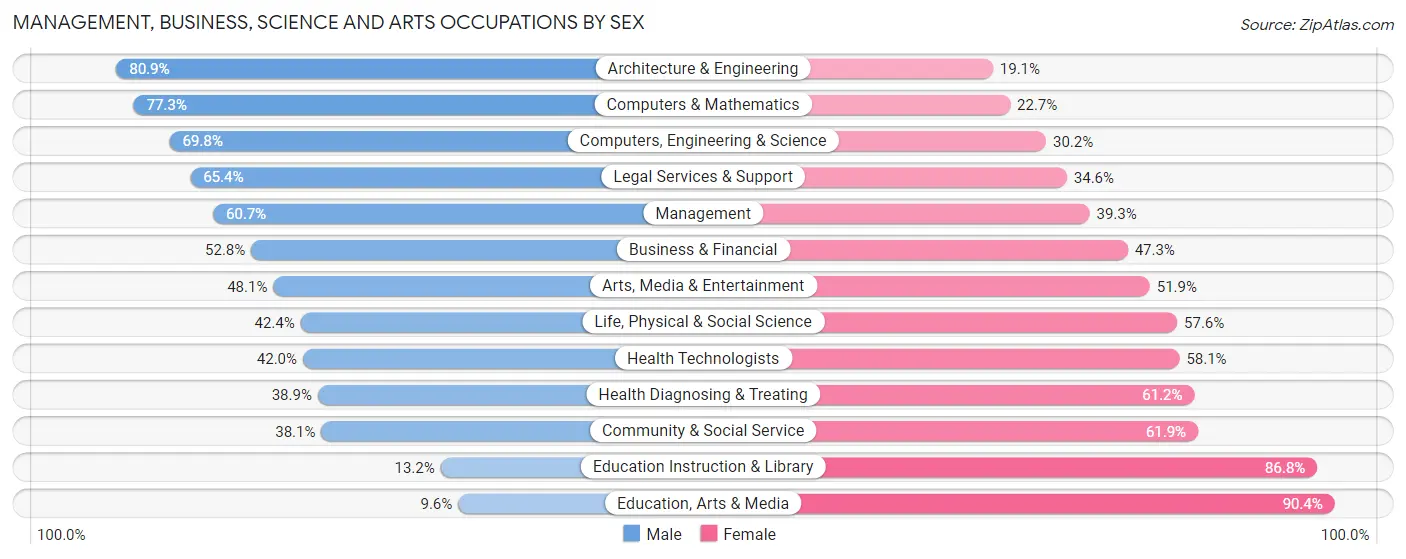
Management, Business, Science and Arts Occupations by Sex
Within the Management, Business, Science and Arts occupations in Mill Valley, the most male-oriented occupations are Architecture & Engineering (80.9%), Computers & Mathematics (77.3%), and Computers, Engineering & Science (69.8%), while the most female-oriented occupations are Education, Arts & Media (90.4%), Education Instruction & Library (86.8%), and Community & Social Service (61.9%).
| Occupation | Male | Female |
| Management | 1,027 (60.7%) | 665 (39.3%) |
| Business & Financial | 316 (52.7%) | 283 (47.2%) |
| Computers, Engineering & Science | 480 (69.8%) | 208 (30.2%) |
| Computers & Mathematics | 221 (77.3%) | 65 (22.7%) |
| Architecture & Engineering | 186 (80.9%) | 44 (19.1%) |
| Life, Physical & Social Science | 73 (42.4%) | 99 (57.6%) |
| Community & Social Service | 514 (38.1%) | 835 (61.9%) |
| Education, Arts & Media | 9 (9.6%) | 85 (90.4%) |
| Legal Services & Support | 214 (65.4%) | 113 (34.6%) |
| Education Instruction & Library | 59 (13.2%) | 387 (86.8%) |
| Arts, Media & Entertainment | 232 (48.1%) | 250 (51.9%) |
| Health Diagnosing & Treating | 237 (38.9%) | 373 (61.2%) |
| Health Technologists | 237 (41.9%) | 328 (58.1%) |
| Total (Category) | 2,574 (52.1%) | 2,364 (47.9%) |
| Total (Overall) | 3,641 (54.7%) | 3,015 (45.3%) |
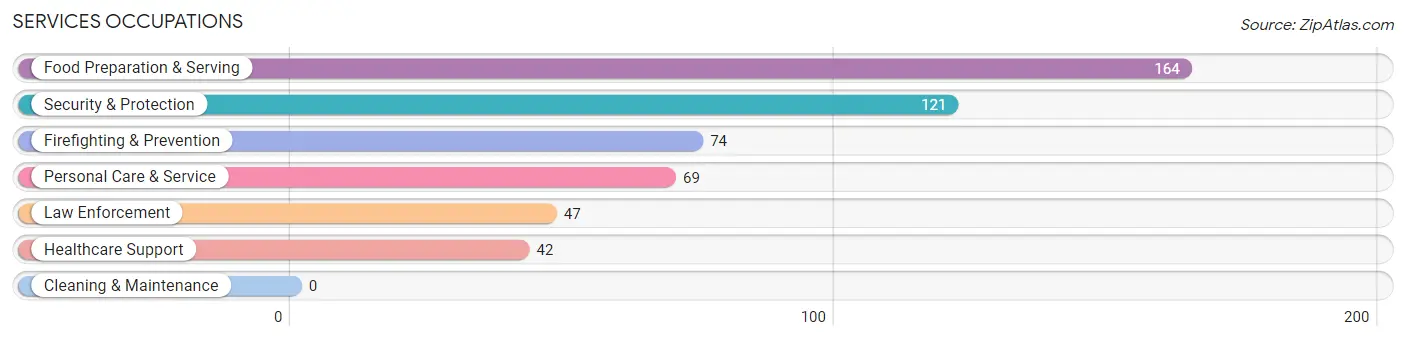
Services Occupations
The most common Services occupations in Mill Valley are Food Preparation & Serving (164 | 2.5%), Security & Protection (121 | 1.8%), Firefighting & Prevention (74 | 1.1%), Personal Care & Service (69 | 1.0%), and Law Enforcement (47 | 0.7%).
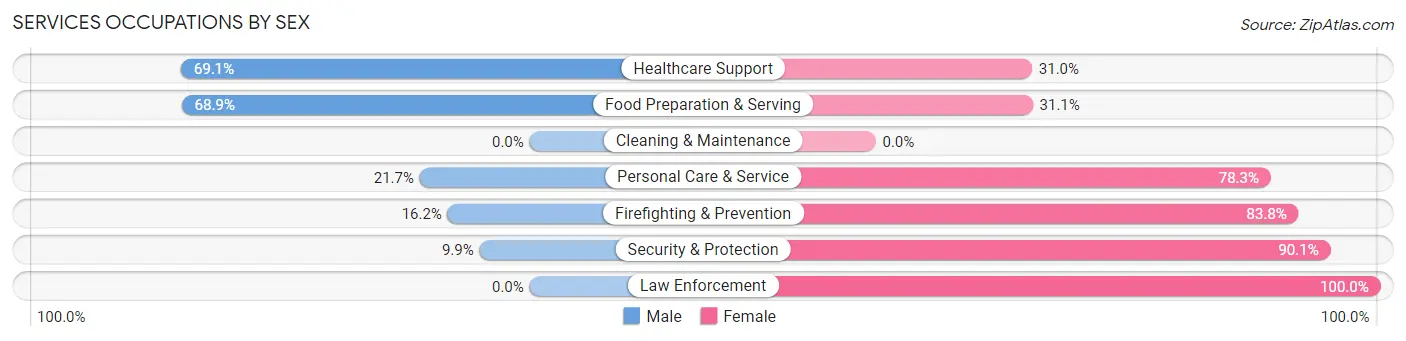
Services Occupations by Sex
Within the Services occupations in Mill Valley, the most male-oriented occupations are Healthcare Support (69.1%), Food Preparation & Serving (68.9%), and Personal Care & Service (21.7%), while the most female-oriented occupations are Law Enforcement (100.0%), Security & Protection (90.1%), and Firefighting & Prevention (83.8%).
| Occupation | Male | Female |
| Healthcare Support | 29 (69.1%) | 13 (30.9%) |
| Security & Protection | 12 (9.9%) | 109 (90.1%) |
| Firefighting & Prevention | 12 (16.2%) | 62 (83.8%) |
| Law Enforcement | 0 (0.0%) | 47 (100.0%) |
| Food Preparation & Serving | 113 (68.9%) | 51 (31.1%) |
| Cleaning & Maintenance | 0 (0.0%) | 0 (0.0%) |
| Personal Care & Service | 15 (21.7%) | 54 (78.3%) |
| Total (Category) | 169 (42.7%) | 227 (57.3%) |
| Total (Overall) | 3,641 (54.7%) | 3,015 (45.3%) |
Sales and Office Occupations
The most common Sales and Office occupations in Mill Valley are Sales & Related (740 | 11.1%), and Office & Administration (290 | 4.4%).
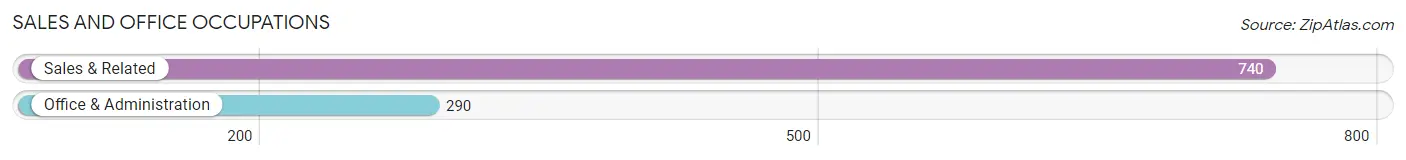
Sales and Office Occupations by Sex
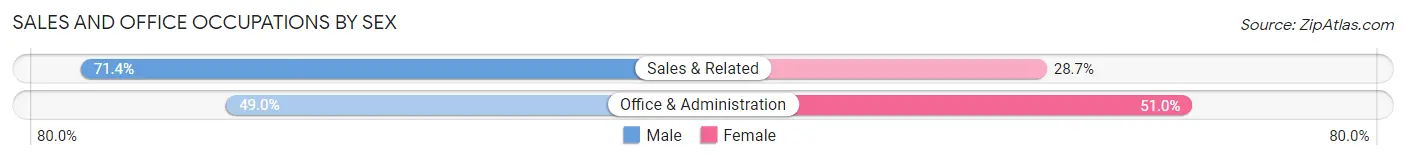
| Occupation | Male | Female |
| Sales & Related | 528 (71.4%) | 212 (28.6%) |
| Office & Administration | 142 (49.0%) | 148 (51.0%) |
| Total (Category) | 670 (65.0%) | 360 (34.9%) |
| Total (Overall) | 3,641 (54.7%) | 3,015 (45.3%) |
Natural Resources, Construction and Maintenance Occupations
The most common Natural Resources, Construction and Maintenance occupations in Mill Valley are Installation, Maintenance & Repair (52 | 0.8%), and Construction & Extraction (28 | 0.4%).
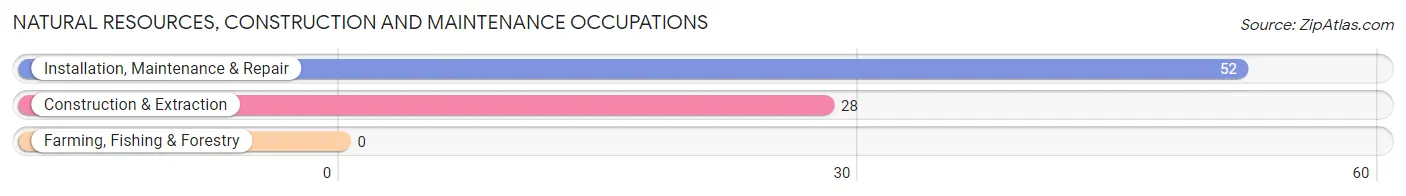
Natural Resources, Construction and Maintenance Occupations by Sex
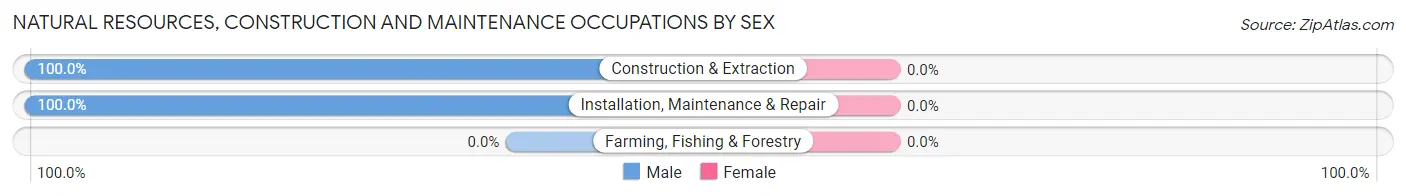
| Occupation | Male | Female |
| Farming, Fishing & Forestry | 0 (0.0%) | 0 (0.0%) |
| Construction & Extraction | 28 (100.0%) | 0 (0.0%) |
| Installation, Maintenance & Repair | 52 (100.0%) | 0 (0.0%) |
| Total (Category) | 80 (100.0%) | 0 (0.0%) |
| Total (Overall) | 3,641 (54.7%) | 3,015 (45.3%) |
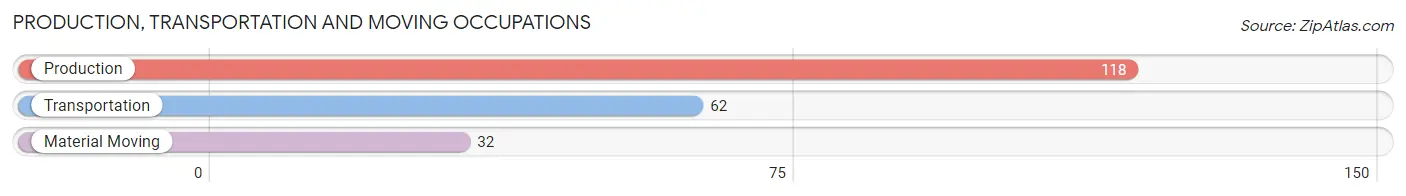
Production, Transportation and Moving Occupations
The most common Production, Transportation and Moving occupations in Mill Valley are Production (118 | 1.8%), Transportation (62 | 0.9%), and Material Moving (32 | 0.5%).
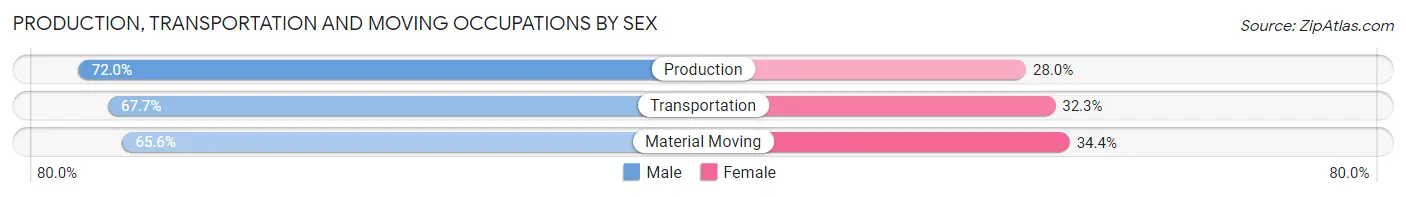
Production, Transportation and Moving Occupations by Sex
| Occupation | Male | Female |
| Production | 85 (72.0%) | 33 (28.0%) |
| Transportation | 42 (67.7%) | 20 (32.3%) |
| Material Moving | 21 (65.6%) | 11 (34.4%) |
| Total (Category) | 148 (69.8%) | 64 (30.2%) |
| Total (Overall) | 3,641 (54.7%) | 3,015 (45.3%) |
Employment Industries by Sex in Mill Valley
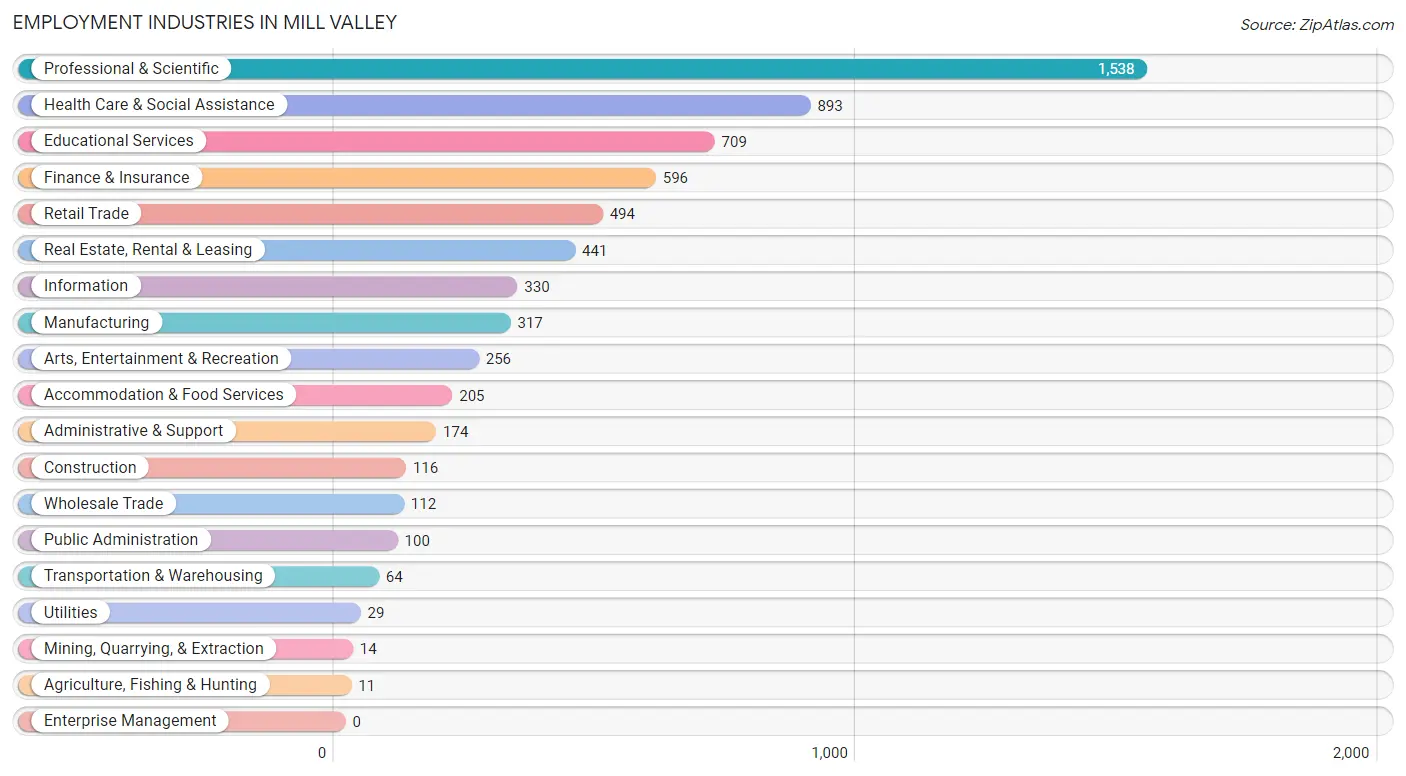
Employment Industries in Mill Valley
The major employment industries in Mill Valley include Professional & Scientific (1,538 | 23.1%), Health Care & Social Assistance (893 | 13.4%), Educational Services (709 | 10.6%), Finance & Insurance (596 | 8.9%), and Retail Trade (494 | 7.4%).
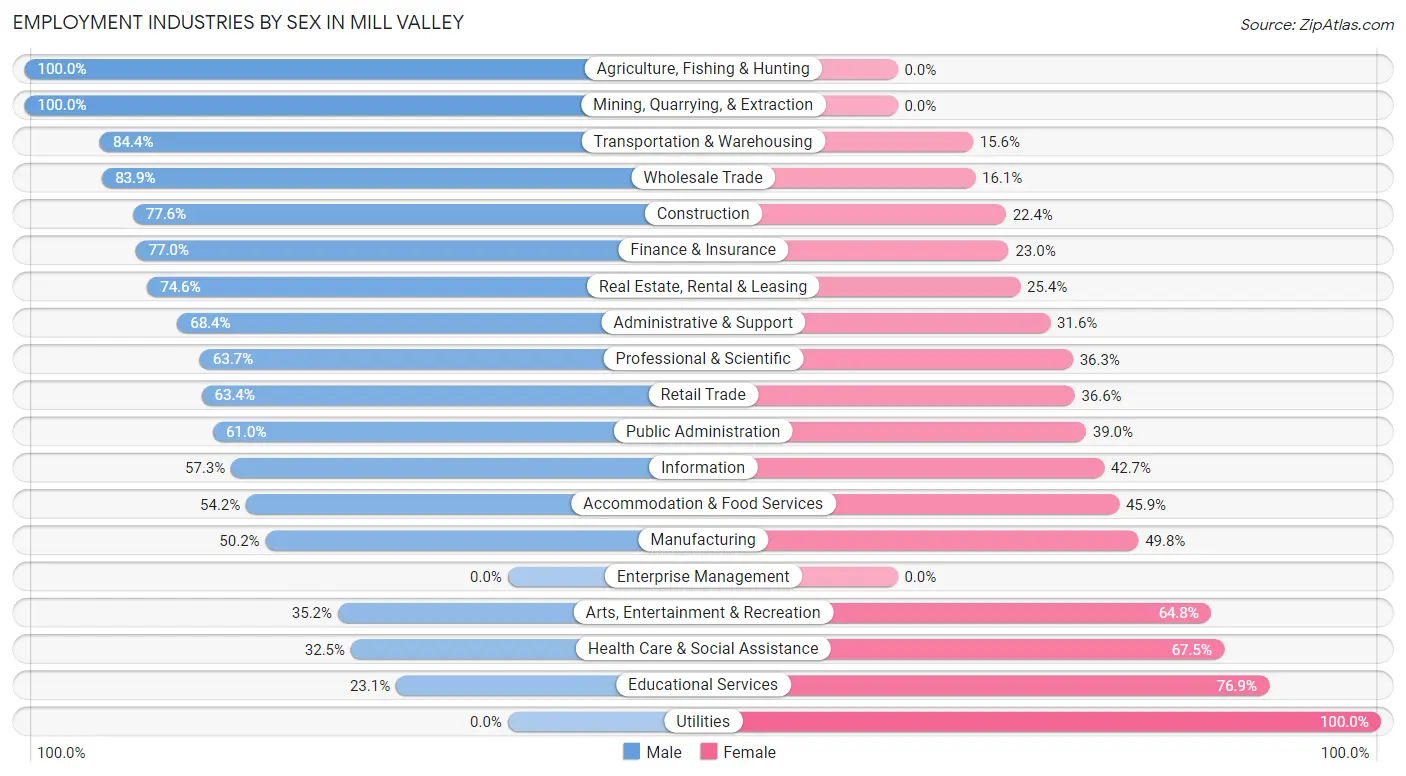
Employment Industries by Sex in Mill Valley
The Mill Valley industries that see more men than women are Agriculture, Fishing & Hunting (100.0%), Mining, Quarrying, & Extraction (100.0%), and Transportation & Warehousing (84.4%), whereas the industries that tend to have a higher number of women are Utilities (100.0%), Educational Services (76.9%), and Health Care & Social Assistance (67.5%).
| Industry | Male | Female |
| Agriculture, Fishing & Hunting | 11 (100.0%) | 0 (0.0%) |
| Mining, Quarrying, & Extraction | 14 (100.0%) | 0 (0.0%) |
| Construction | 90 (77.6%) | 26 (22.4%) |
| Manufacturing | 159 (50.2%) | 158 (49.8%) |
| Wholesale Trade | 94 (83.9%) | 18 (16.1%) |
| Retail Trade | 313 (63.4%) | 181 (36.6%) |
| Transportation & Warehousing | 54 (84.4%) | 10 (15.6%) |
| Utilities | 0 (0.0%) | 29 (100.0%) |
| Information | 189 (57.3%) | 141 (42.7%) |
| Finance & Insurance | 459 (77.0%) | 137 (23.0%) |
| Real Estate, Rental & Leasing | 329 (74.6%) | 112 (25.4%) |
| Professional & Scientific | 980 (63.7%) | 558 (36.3%) |
| Enterprise Management | 0 (0.0%) | 0 (0.0%) |
| Administrative & Support | 119 (68.4%) | 55 (31.6%) |
| Educational Services | 164 (23.1%) | 545 (76.9%) |
| Health Care & Social Assistance | 290 (32.5%) | 603 (67.5%) |
| Arts, Entertainment & Recreation | 90 (35.2%) | 166 (64.8%) |
| Accommodation & Food Services | 111 (54.1%) | 94 (45.9%) |
| Public Administration | 61 (61.0%) | 39 (39.0%) |
| Total | 3,641 (54.7%) | 3,015 (45.3%) |
Education in Mill Valley
School Enrollment in Mill Valley
The most common levels of schooling among the 3,480 students in Mill Valley are high school (1,088 | 31.3%), middle school (713 | 20.5%), and elementary school (601 | 17.3%).
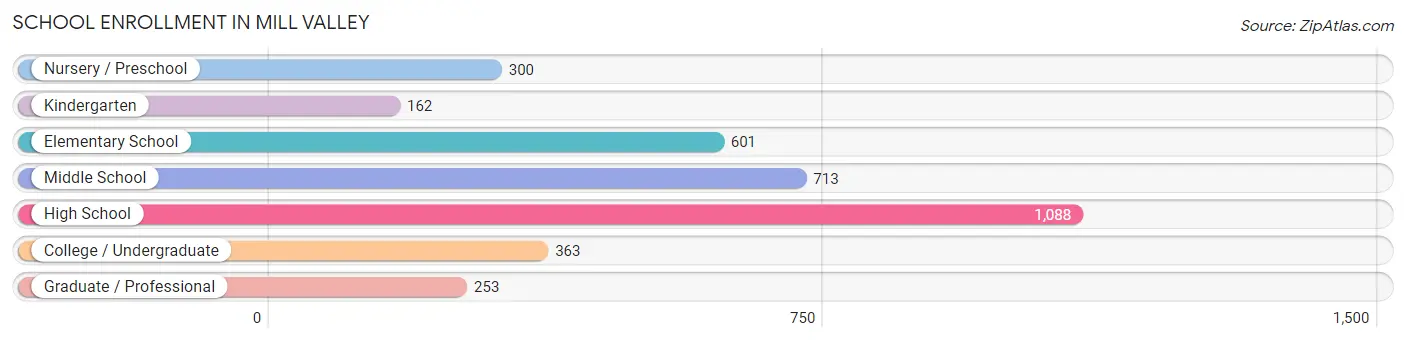
| School Level | # Students | % Students |
| Nursery / Preschool | 300 | 8.6% |
| Kindergarten | 162 | 4.7% |
| Elementary School | 601 | 17.3% |
| Middle School | 713 | 20.5% |
| High School | 1,088 | 31.3% |
| College / Undergraduate | 363 | 10.4% |
| Graduate / Professional | 253 | 7.3% |
| Total | 3,480 | 100.0% |
School Enrollment by Age by Funding Source in Mill Valley
Out of a total of 3,480 students who are enrolled in schools in Mill Valley, 1,326 (38.1%) attend a private institution, while the remaining 2,154 (61.9%) are enrolled in public schools. The age group of 35 years and over has the highest likelihood of being enrolled in private schools, with 125 (93.3% in the age bracket) enrolled. Conversely, the age group of 20 to 24 year olds has the lowest likelihood of being enrolled in a private school, with 271 (81.9% in the age bracket) attending a public institution.
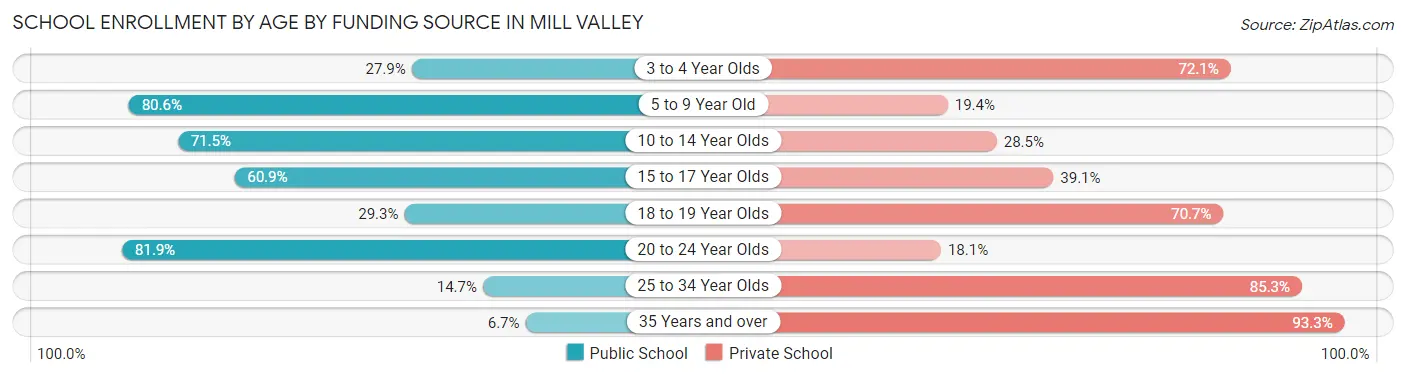
| Age Bracket | Public School | Private School |
| 3 to 4 Year Olds | 62 (27.9%) | 160 (72.1%) |
| 5 to 9 Year Old | 640 (80.6%) | 154 (19.4%) |
| 10 to 14 Year Olds | 609 (71.5%) | 243 (28.5%) |
| 15 to 17 Year Olds | 468 (60.9%) | 300 (39.1%) |
| 18 to 19 Year Olds | 77 (29.3%) | 186 (70.7%) |
| 20 to 24 Year Olds | 271 (81.9%) | 60 (18.1%) |
| 25 to 34 Year Olds | 17 (14.7%) | 99 (85.3%) |
| 35 Years and over | 9 (6.7%) | 125 (93.3%) |
| Total | 2,154 (61.9%) | 1,326 (38.1%) |
Educational Attainment by Field of Study in Mill Valley
Social sciences (1,454 | 16.7%), business (1,293 | 14.8%), literature & languages (875 | 10.0%), visual & performing arts (797 | 9.1%), and liberal arts & history (609 | 7.0%) are the most common fields of study among 8,724 individuals in Mill Valley who have obtained a bachelor's degree or higher.
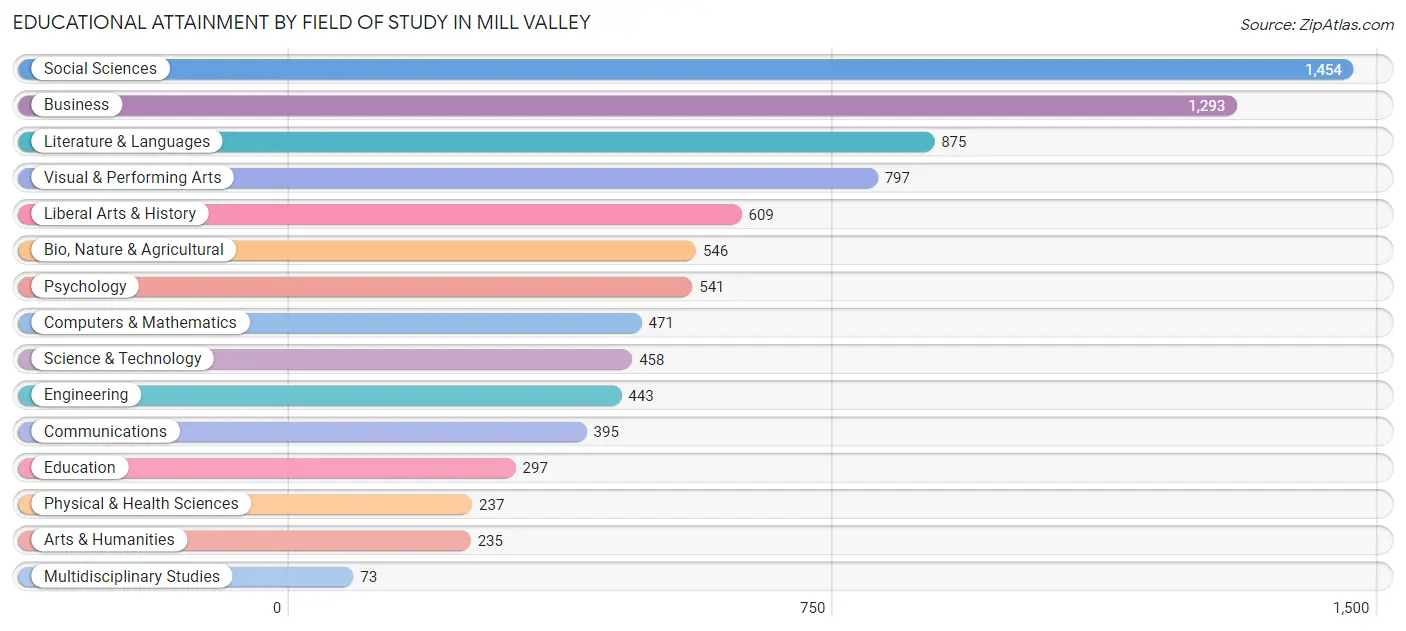
| Field of Study | # Graduates | % Graduates |
| Computers & Mathematics | 471 | 5.4% |
| Bio, Nature & Agricultural | 546 | 6.3% |
| Physical & Health Sciences | 237 | 2.7% |
| Psychology | 541 | 6.2% |
| Social Sciences | 1,454 | 16.7% |
| Engineering | 443 | 5.1% |
| Multidisciplinary Studies | 73 | 0.8% |
| Science & Technology | 458 | 5.2% |
| Business | 1,293 | 14.8% |
| Education | 297 | 3.4% |
| Literature & Languages | 875 | 10.0% |
| Liberal Arts & History | 609 | 7.0% |
| Visual & Performing Arts | 797 | 9.1% |
| Communications | 395 | 4.5% |
| Arts & Humanities | 235 | 2.7% |
| Total | 8,724 | 100.0% |
Transportation & Commute in Mill Valley
Vehicle Availability by Sex in Mill Valley
The most prevalent vehicle ownership categories in Mill Valley are males with 2 vehicles (1,632, accounting for 45.1%) and females with 2 vehicles (1,165, making up 55.4%).
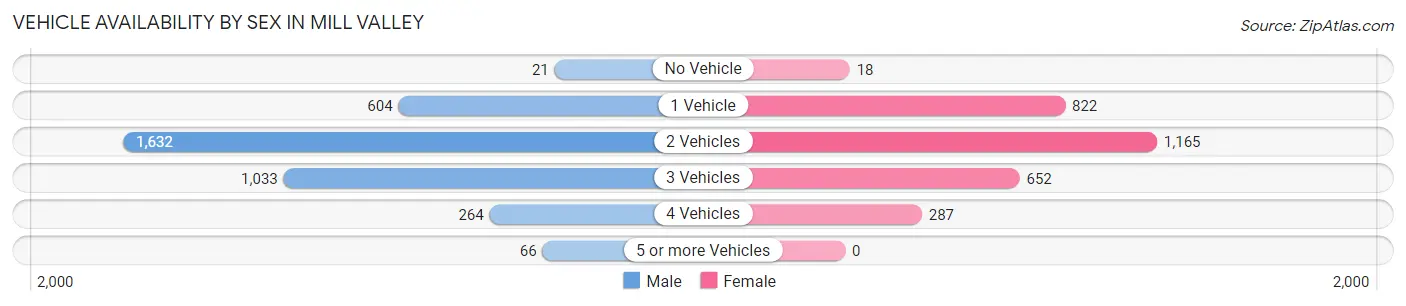
| Vehicles Available | Male | Female |
| No Vehicle | 21 (0.6%) | 18 (0.6%) |
| 1 Vehicle | 604 (16.7%) | 822 (27.9%) |
| 2 Vehicles | 1,632 (45.1%) | 1,165 (39.6%) |
| 3 Vehicles | 1,033 (28.5%) | 652 (22.2%) |
| 4 Vehicles | 264 (7.3%) | 287 (9.8%) |
| 5 or more Vehicles | 66 (1.8%) | 0 (0.0%) |
| Total | 3,620 (100.0%) | 2,944 (100.0%) |
Commute Time in Mill Valley
The most frequently occuring commute durations in Mill Valley are 15 to 19 minutes (738 commuters, 15.7%), 5 to 9 minutes (632 commuters, 13.4%), and 60 to 89 minutes (626 commuters, 13.3%).
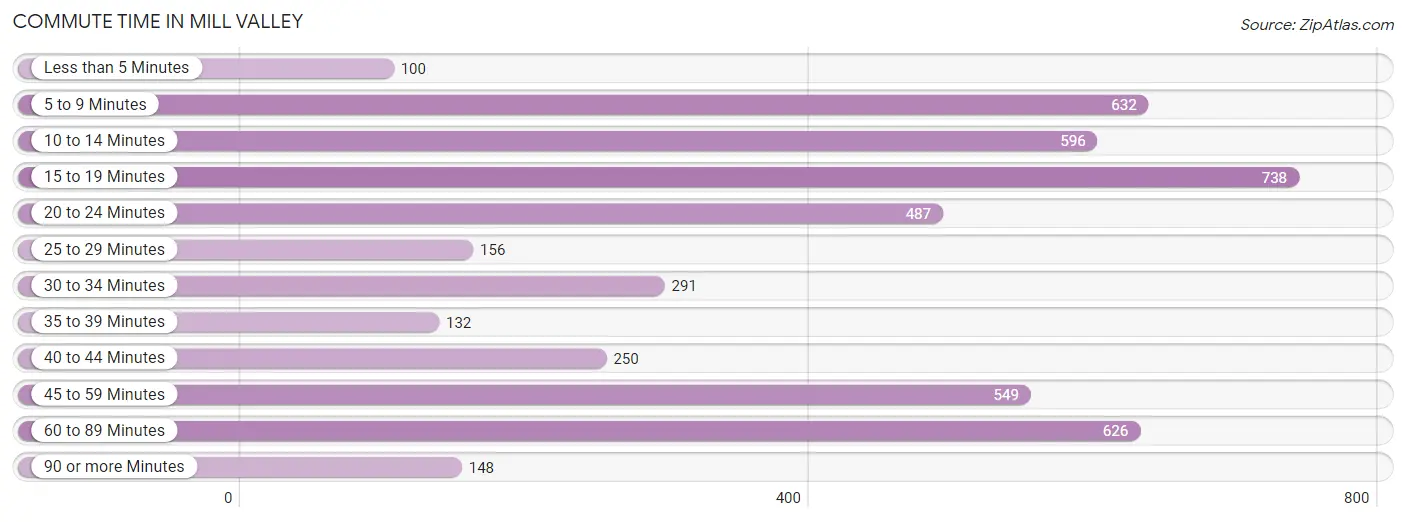
| Commute Time | # Commuters | % Commuters |
| Less than 5 Minutes | 100 | 2.1% |
| 5 to 9 Minutes | 632 | 13.4% |
| 10 to 14 Minutes | 596 | 12.7% |
| 15 to 19 Minutes | 738 | 15.7% |
| 20 to 24 Minutes | 487 | 10.3% |
| 25 to 29 Minutes | 156 | 3.3% |
| 30 to 34 Minutes | 291 | 6.2% |
| 35 to 39 Minutes | 132 | 2.8% |
| 40 to 44 Minutes | 250 | 5.3% |
| 45 to 59 Minutes | 549 | 11.7% |
| 60 to 89 Minutes | 626 | 13.3% |
| 90 or more Minutes | 148 | 3.2% |
Commute Time by Sex in Mill Valley
The most common commute times in Mill Valley are 15 to 19 minutes (431 commuters, 16.8%) for males and 5 to 9 minutes (457 commuters, 21.4%) for females.
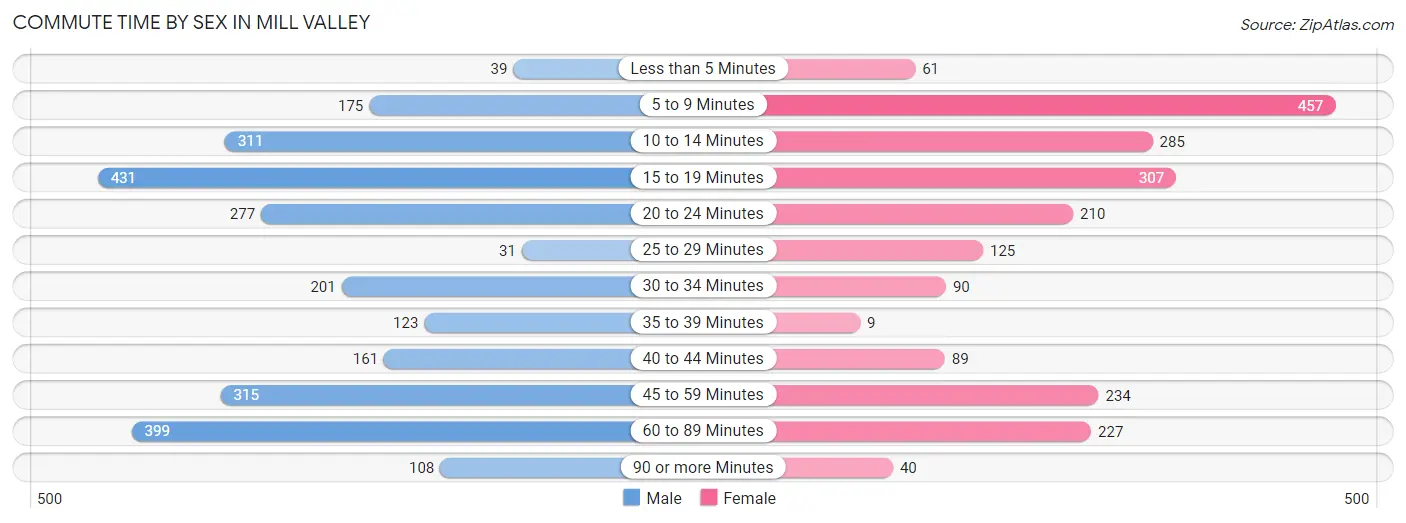
| Commute Time | Male | Female |
| Less than 5 Minutes | 39 (1.5%) | 61 (2.9%) |
| 5 to 9 Minutes | 175 (6.8%) | 457 (21.4%) |
| 10 to 14 Minutes | 311 (12.1%) | 285 (13.4%) |
| 15 to 19 Minutes | 431 (16.8%) | 307 (14.4%) |
| 20 to 24 Minutes | 277 (10.8%) | 210 (9.8%) |
| 25 to 29 Minutes | 31 (1.2%) | 125 (5.9%) |
| 30 to 34 Minutes | 201 (7.8%) | 90 (4.2%) |
| 35 to 39 Minutes | 123 (4.8%) | 9 (0.4%) |
| 40 to 44 Minutes | 161 (6.3%) | 89 (4.2%) |
| 45 to 59 Minutes | 315 (12.2%) | 234 (11.0%) |
| 60 to 89 Minutes | 399 (15.5%) | 227 (10.6%) |
| 90 or more Minutes | 108 (4.2%) | 40 (1.9%) |
Time of Departure to Work by Sex in Mill Valley
The most frequent times of departure to work in Mill Valley are 7:00 AM to 7:29 AM (387, 15.0%) for males and 8:00 AM to 8:29 AM (504, 23.6%) for females.
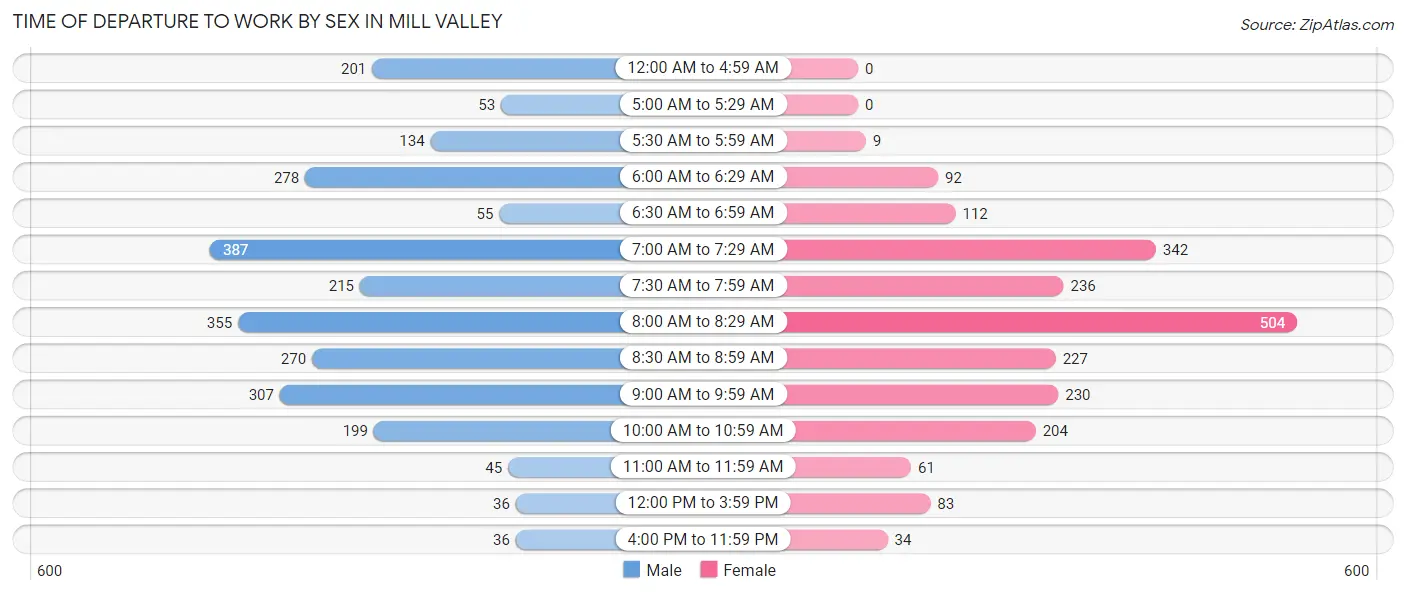
| Time of Departure | Male | Female |
| 12:00 AM to 4:59 AM | 201 (7.8%) | 0 (0.0%) |
| 5:00 AM to 5:29 AM | 53 (2.1%) | 0 (0.0%) |
| 5:30 AM to 5:59 AM | 134 (5.2%) | 9 (0.4%) |
| 6:00 AM to 6:29 AM | 278 (10.8%) | 92 (4.3%) |
| 6:30 AM to 6:59 AM | 55 (2.1%) | 112 (5.2%) |
| 7:00 AM to 7:29 AM | 387 (15.0%) | 342 (16.0%) |
| 7:30 AM to 7:59 AM | 215 (8.4%) | 236 (11.1%) |
| 8:00 AM to 8:29 AM | 355 (13.8%) | 504 (23.6%) |
| 8:30 AM to 8:59 AM | 270 (10.5%) | 227 (10.6%) |
| 9:00 AM to 9:59 AM | 307 (11.9%) | 230 (10.8%) |
| 10:00 AM to 10:59 AM | 199 (7.7%) | 204 (9.6%) |
| 11:00 AM to 11:59 AM | 45 (1.8%) | 61 (2.9%) |
| 12:00 PM to 3:59 PM | 36 (1.4%) | 83 (3.9%) |
| 4:00 PM to 11:59 PM | 36 (1.4%) | 34 (1.6%) |
| Total | 2,571 (100.0%) | 2,134 (100.0%) |
Housing Occupancy in Mill Valley
Occupancy by Ownership in Mill Valley
Of the total 5,592 dwellings in Mill Valley, owner-occupied units account for 3,699 (66.1%), while renter-occupied units make up 1,893 (33.9%).
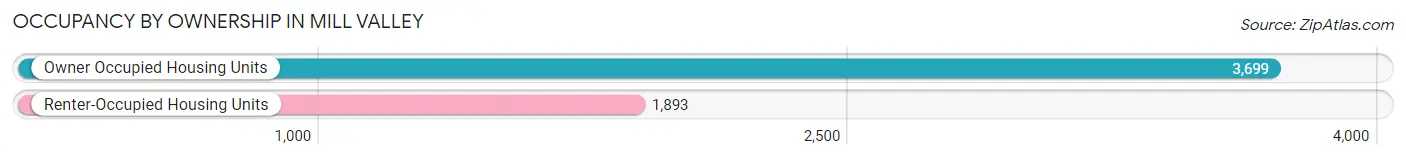
| Occupancy | # Housing Units | % Housing Units |
| Owner Occupied Housing Units | 3,699 | 66.1% |
| Renter-Occupied Housing Units | 1,893 | 33.9% |
| Total Occupied Housing Units | 5,592 | 100.0% |
Occupancy by Household Size in Mill Valley
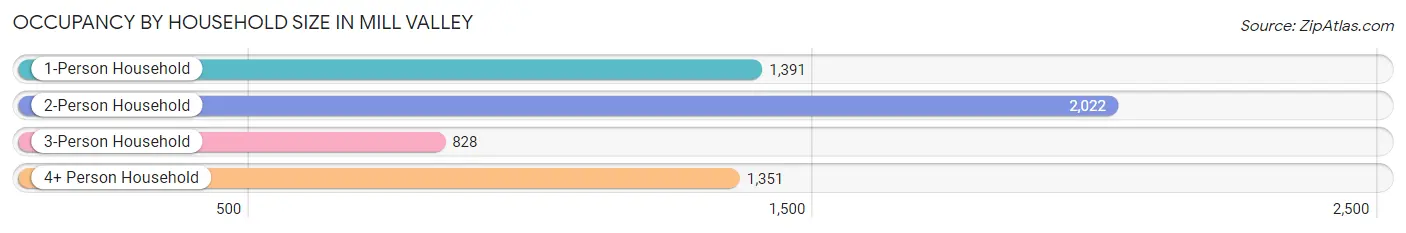
| Household Size | # Housing Units | % Housing Units |
| 1-Person Household | 1,391 | 24.9% |
| 2-Person Household | 2,022 | 36.2% |
| 3-Person Household | 828 | 14.8% |
| 4+ Person Household | 1,351 | 24.2% |
| Total Housing Units | 5,592 | 100.0% |
Occupancy by Ownership by Household Size in Mill Valley
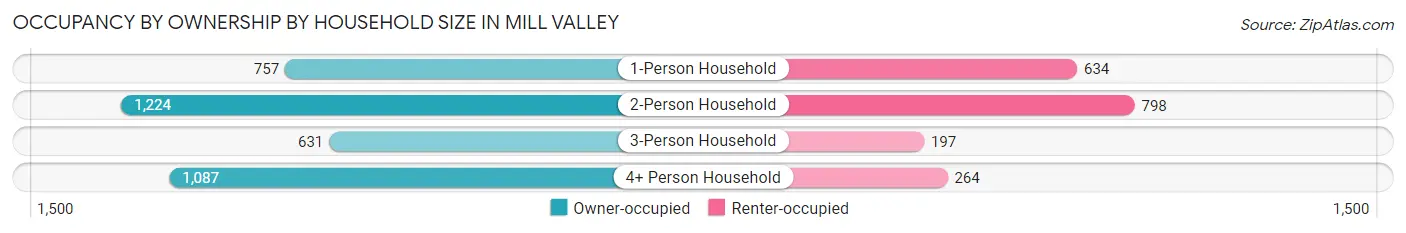
| Household Size | Owner-occupied | Renter-occupied |
| 1-Person Household | 757 (54.4%) | 634 (45.6%) |
| 2-Person Household | 1,224 (60.5%) | 798 (39.5%) |
| 3-Person Household | 631 (76.2%) | 197 (23.8%) |
| 4+ Person Household | 1,087 (80.5%) | 264 (19.5%) |
| Total Housing Units | 3,699 (66.1%) | 1,893 (33.9%) |
Occupancy by Educational Attainment in Mill Valley
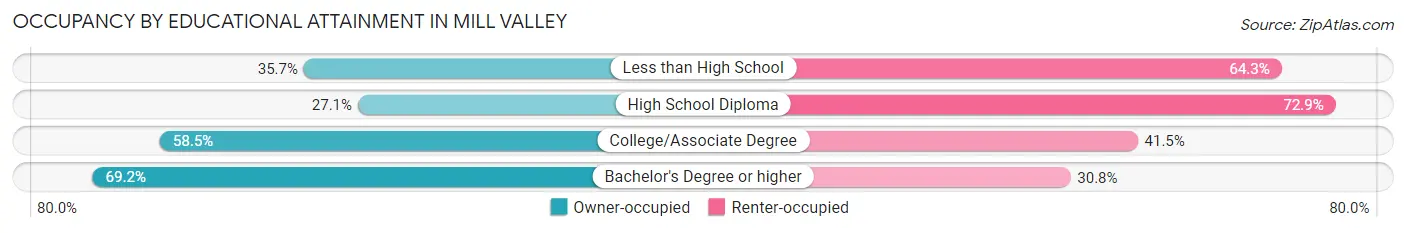
| Household Size | Owner-occupied | Renter-occupied |
| Less than High School | 15 (35.7%) | 27 (64.3%) |
| High School Diploma | 57 (27.1%) | 153 (72.9%) |
| College/Associate Degree | 374 (58.5%) | 265 (41.5%) |
| Bachelor's Degree or higher | 3,253 (69.2%) | 1,448 (30.8%) |
Occupancy by Age of Householder in Mill Valley
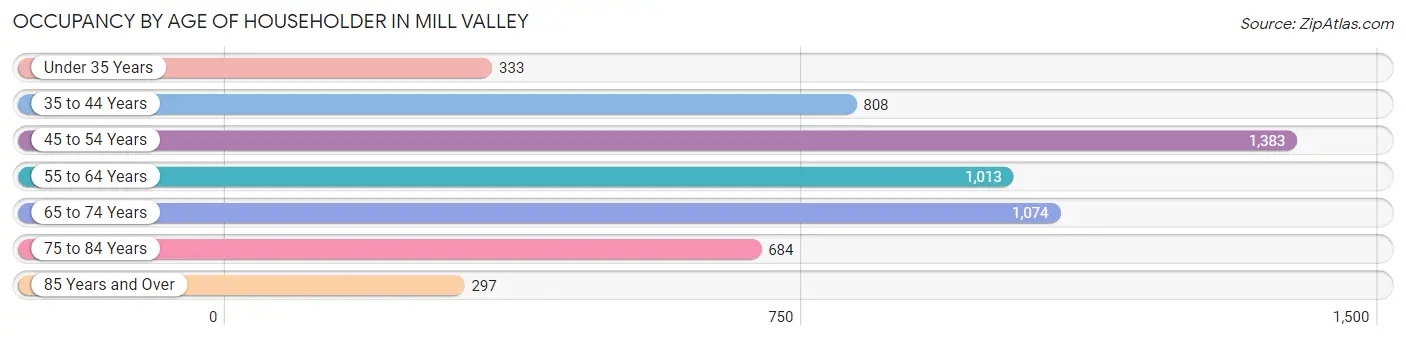
| Age Bracket | # Households | % Households |
| Under 35 Years | 333 | 5.9% |
| 35 to 44 Years | 808 | 14.4% |
| 45 to 54 Years | 1,383 | 24.7% |
| 55 to 64 Years | 1,013 | 18.1% |
| 65 to 74 Years | 1,074 | 19.2% |
| 75 to 84 Years | 684 | 12.2% |
| 85 Years and Over | 297 | 5.3% |
| Total | 5,592 | 100.0% |
Housing Finances in Mill Valley
Median Income by Occupancy in Mill Valley
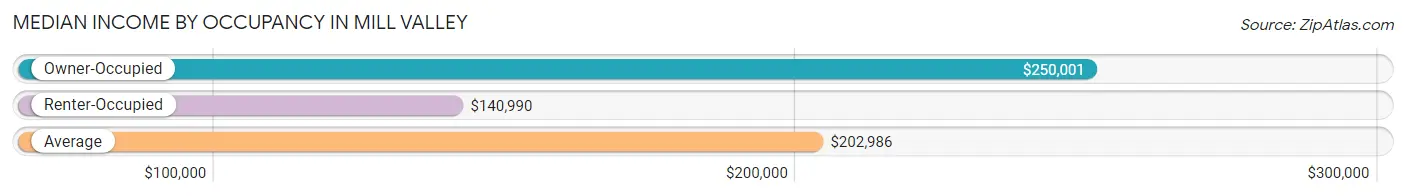
| Occupancy Type | # Households | Median Income |
| Owner-Occupied | 3,699 (66.1%) | $250,001 |
| Renter-Occupied | 1,893 (33.9%) | $140,990 |
| Average | 5,592 (100.0%) | $202,986 |
Occupancy by Householder Income Bracket in Mill Valley
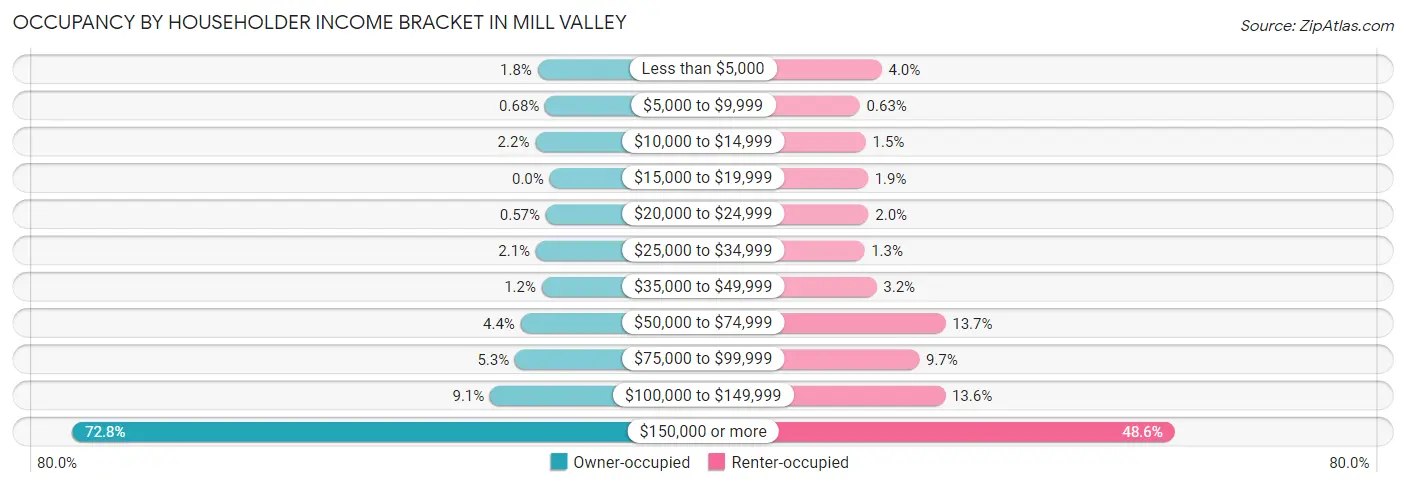
| Income Bracket | Owner-occupied | Renter-occupied |
| Less than $5,000 | 67 (1.8%) | 75 (4.0%) |
| $5,000 to $9,999 | 25 (0.7%) | 12 (0.6%) |
| $10,000 to $14,999 | 81 (2.2%) | 29 (1.5%) |
| $15,000 to $19,999 | 0 (0.0%) | 35 (1.8%) |
| $20,000 to $24,999 | 21 (0.6%) | 37 (1.9%) |
| $25,000 to $34,999 | 77 (2.1%) | 25 (1.3%) |
| $35,000 to $49,999 | 44 (1.2%) | 60 (3.2%) |
| $50,000 to $74,999 | 163 (4.4%) | 259 (13.7%) |
| $75,000 to $99,999 | 195 (5.3%) | 183 (9.7%) |
| $100,000 to $149,999 | 335 (9.1%) | 258 (13.6%) |
| $150,000 or more | 2,691 (72.8%) | 920 (48.6%) |
| Total | 3,699 (100.0%) | 1,893 (100.0%) |
Monthly Housing Cost Tiers in Mill Valley
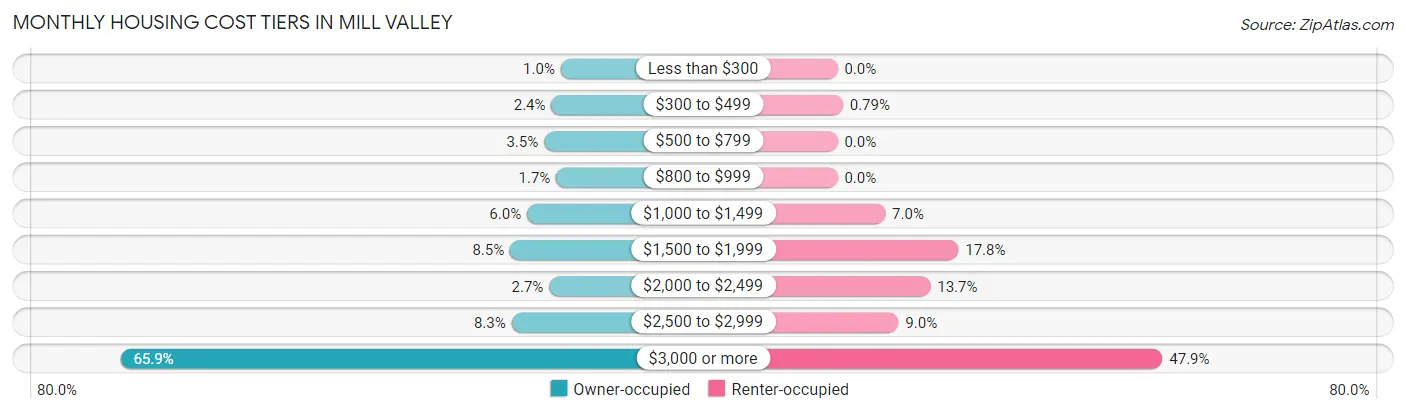
| Monthly Cost | Owner-occupied | Renter-occupied |
| Less than $300 | 38 (1.0%) | 0 (0.0%) |
| $300 to $499 | 89 (2.4%) | 15 (0.8%) |
| $500 to $799 | 129 (3.5%) | 0 (0.0%) |
| $800 to $999 | 63 (1.7%) | 0 (0.0%) |
| $1,000 to $1,499 | 222 (6.0%) | 133 (7.0%) |
| $1,500 to $1,999 | 314 (8.5%) | 337 (17.8%) |
| $2,000 to $2,499 | 101 (2.7%) | 259 (13.7%) |
| $2,500 to $2,999 | 306 (8.3%) | 170 (9.0%) |
| $3,000 or more | 2,437 (65.9%) | 906 (47.9%) |
| Total | 3,699 (100.0%) | 1,893 (100.0%) |
Physical Housing Characteristics in Mill Valley
Housing Structures in Mill Valley
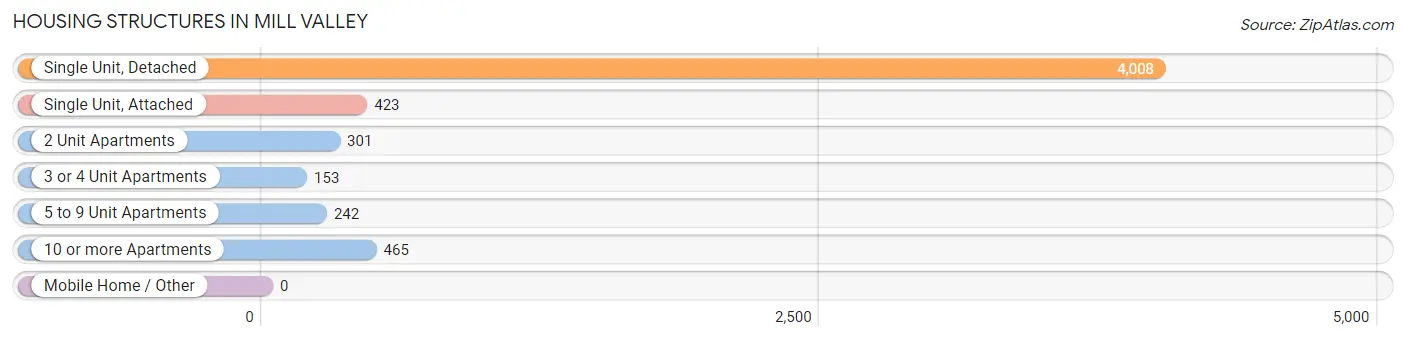
| Structure Type | # Housing Units | % Housing Units |
| Single Unit, Detached | 4,008 | 71.7% |
| Single Unit, Attached | 423 | 7.6% |
| 2 Unit Apartments | 301 | 5.4% |
| 3 or 4 Unit Apartments | 153 | 2.7% |
| 5 to 9 Unit Apartments | 242 | 4.3% |
| 10 or more Apartments | 465 | 8.3% |
| Mobile Home / Other | 0 | 0.0% |
| Total | 5,592 | 100.0% |
Housing Structures by Occupancy in Mill Valley
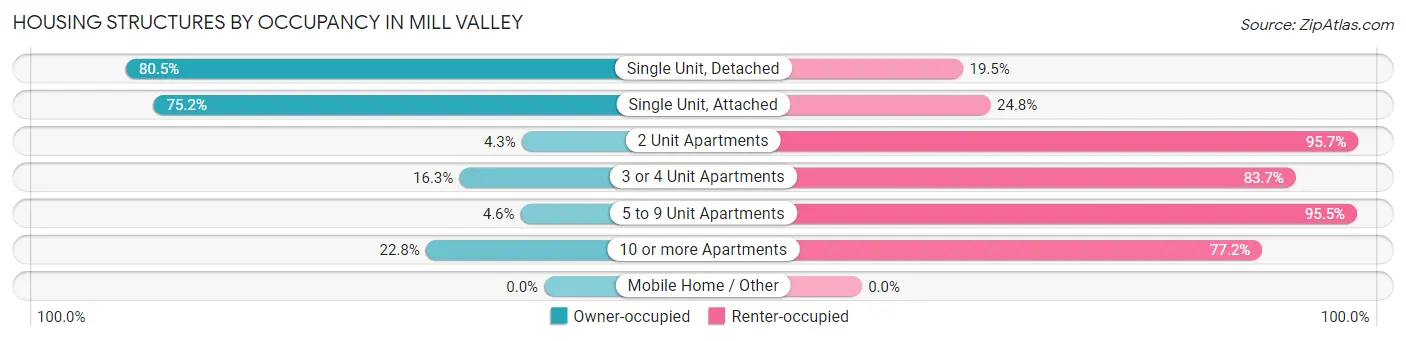
| Structure Type | Owner-occupied | Renter-occupied |
| Single Unit, Detached | 3,226 (80.5%) | 782 (19.5%) |
| Single Unit, Attached | 318 (75.2%) | 105 (24.8%) |
| 2 Unit Apartments | 13 (4.3%) | 288 (95.7%) |
| 3 or 4 Unit Apartments | 25 (16.3%) | 128 (83.7%) |
| 5 to 9 Unit Apartments | 11 (4.5%) | 231 (95.5%) |
| 10 or more Apartments | 106 (22.8%) | 359 (77.2%) |
| Mobile Home / Other | 0 (0.0%) | 0 (0.0%) |
| Total | 3,699 (66.1%) | 1,893 (33.9%) |
Housing Structures by Number of Rooms in Mill Valley
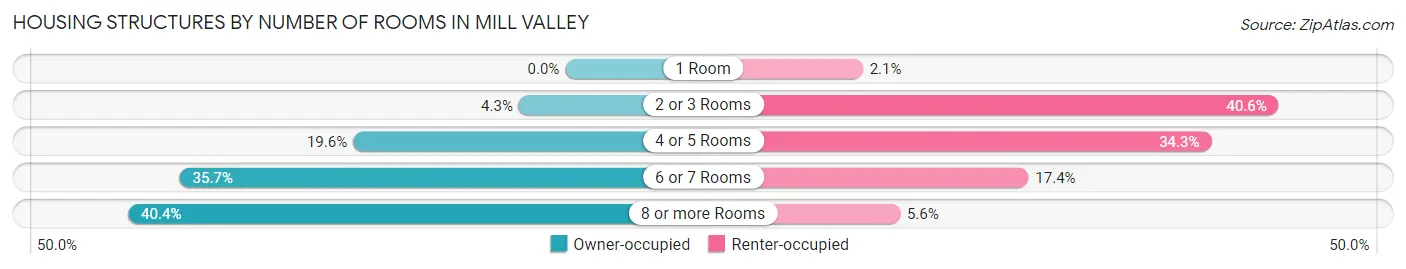
| Number of Rooms | Owner-occupied | Renter-occupied |
| 1 Room | 0 (0.0%) | 40 (2.1%) |
| 2 or 3 Rooms | 159 (4.3%) | 768 (40.6%) |
| 4 or 5 Rooms | 726 (19.6%) | 650 (34.3%) |
| 6 or 7 Rooms | 1,319 (35.7%) | 330 (17.4%) |
| 8 or more Rooms | 1,495 (40.4%) | 105 (5.6%) |
| Total | 3,699 (100.0%) | 1,893 (100.0%) |
Housing Structure by Heating Type in Mill Valley
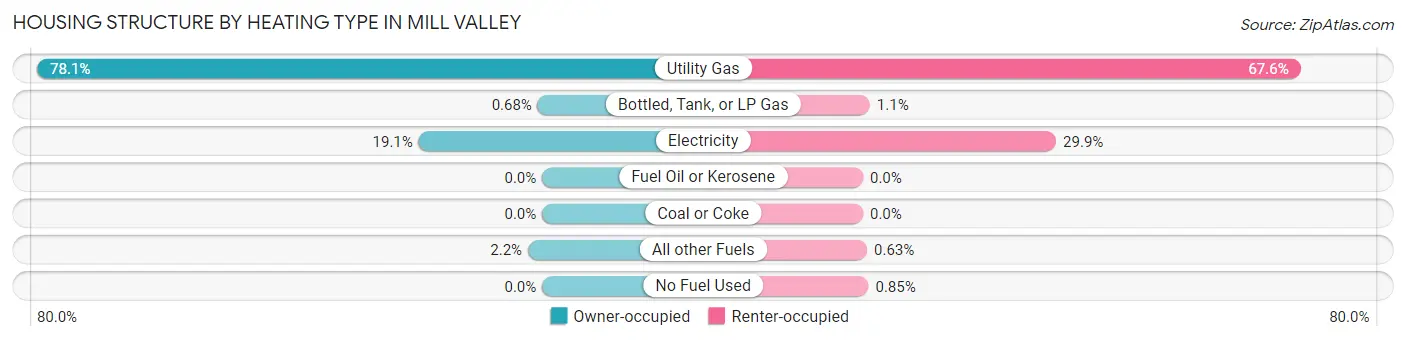
| Heating Type | Owner-occupied | Renter-occupied |
| Utility Gas | 2,887 (78.0%) | 1,280 (67.6%) |
| Bottled, Tank, or LP Gas | 25 (0.7%) | 20 (1.1%) |
| Electricity | 706 (19.1%) | 565 (29.8%) |
| Fuel Oil or Kerosene | 0 (0.0%) | 0 (0.0%) |
| Coal or Coke | 0 (0.0%) | 0 (0.0%) |
| All other Fuels | 81 (2.2%) | 12 (0.6%) |
| No Fuel Used | 0 (0.0%) | 16 (0.9%) |
| Total | 3,699 (100.0%) | 1,893 (100.0%) |
Household Vehicle Usage in Mill Valley
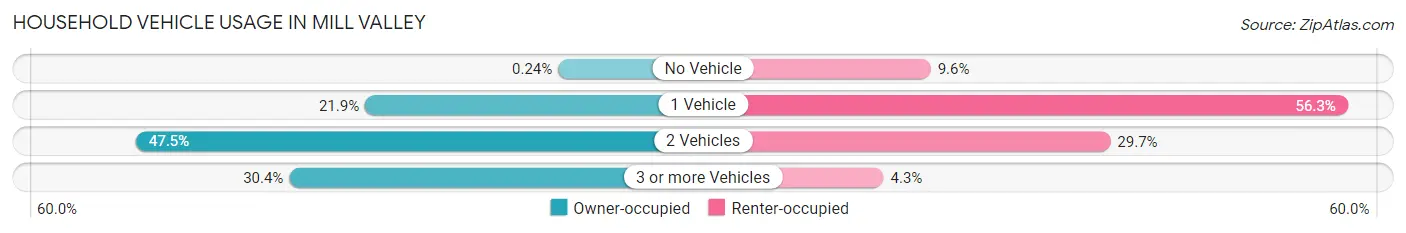
| Vehicles per Household | Owner-occupied | Renter-occupied |
| No Vehicle | 9 (0.2%) | 182 (9.6%) |
| 1 Vehicle | 809 (21.9%) | 1,066 (56.3%) |
| 2 Vehicles | 1,758 (47.5%) | 563 (29.7%) |
| 3 or more Vehicles | 1,123 (30.4%) | 82 (4.3%) |
| Total | 3,699 (100.0%) | 1,893 (100.0%) |
Real Estate & Mortgages in Mill Valley
Real Estate and Mortgage Overview in Mill Valley
| Characteristic | Without Mortgage | With Mortgage |
| Housing Units | 1,148 | 2,551 |
| Median Property Value | $1,790,000 | $2,000,001 |
| Median Household Income | $198,111 | $1,966 |
| Monthly Housing Costs | $1,501 | $2,291 |
| Real Estate Taxes | $10,001 | $11 |
Property Value by Mortgage Status in Mill Valley
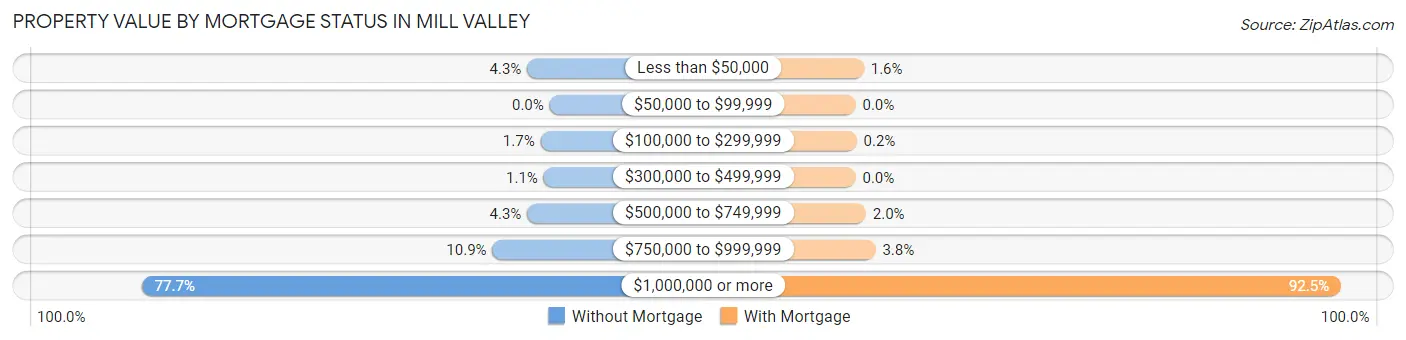
| Property Value | Without Mortgage | With Mortgage |
| Less than $50,000 | 49 (4.3%) | 40 (1.6%) |
| $50,000 to $99,999 | 0 (0.0%) | 0 (0.0%) |
| $100,000 to $299,999 | 20 (1.7%) | 5 (0.2%) |
| $300,000 to $499,999 | 13 (1.1%) | 0 (0.0%) |
| $500,000 to $749,999 | 49 (4.3%) | 50 (2.0%) |
| $750,000 to $999,999 | 125 (10.9%) | 97 (3.8%) |
| $1,000,000 or more | 892 (77.7%) | 2,359 (92.5%) |
| Total | 1,148 (100.0%) | 2,551 (100.0%) |
Household Income by Mortgage Status in Mill Valley
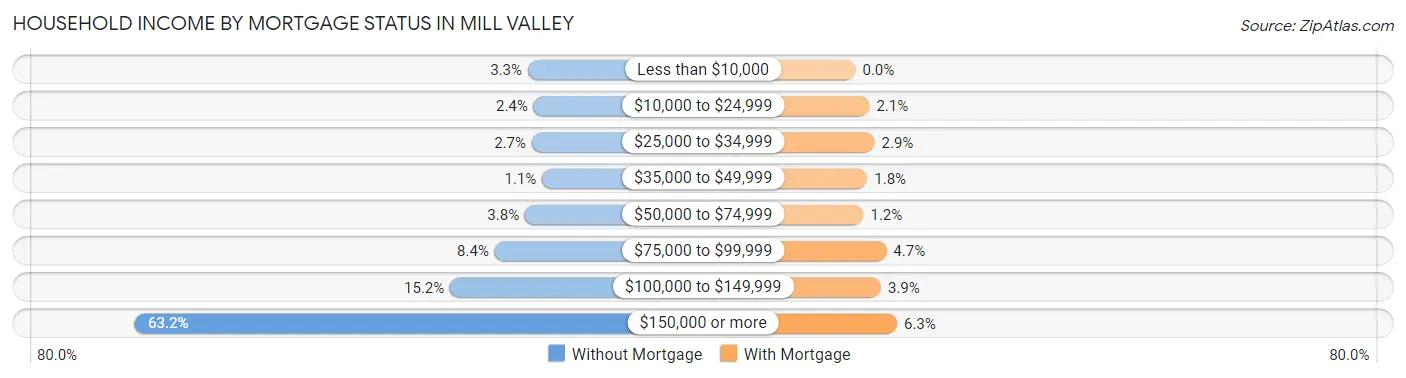
| Household Income | Without Mortgage | With Mortgage |
| Less than $10,000 | 38 (3.3%) | 0 (0.0%) |
| $10,000 to $24,999 | 28 (2.4%) | 54 (2.1%) |
| $25,000 to $34,999 | 31 (2.7%) | 74 (2.9%) |
| $35,000 to $49,999 | 13 (1.1%) | 46 (1.8%) |
| $50,000 to $74,999 | 43 (3.7%) | 31 (1.2%) |
| $75,000 to $99,999 | 96 (8.4%) | 120 (4.7%) |
| $100,000 to $149,999 | 174 (15.2%) | 99 (3.9%) |
| $150,000 or more | 725 (63.1%) | 161 (6.3%) |
| Total | 1,148 (100.0%) | 2,551 (100.0%) |
Property Value to Household Income Ratio in Mill Valley
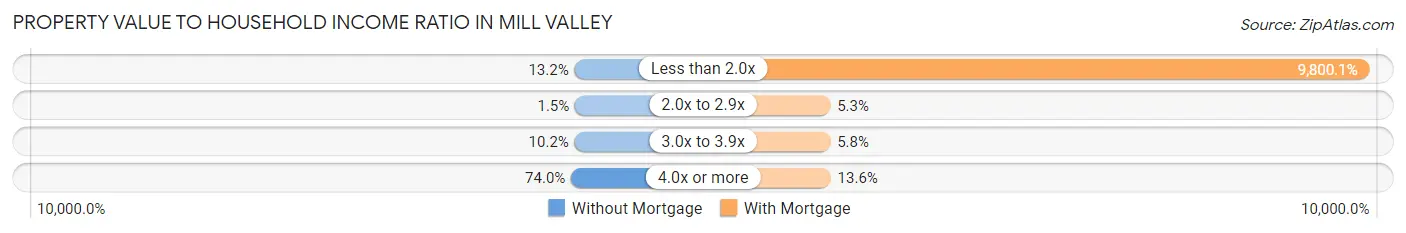
| Value-to-Income Ratio | Without Mortgage | With Mortgage |
| Less than 2.0x | 151 (13.2%) | 250,001 (9,800.1%) |
| 2.0x to 2.9x | 17 (1.5%) | 135 (5.3%) |
| 3.0x to 3.9x | 117 (10.2%) | 149 (5.8%) |
| 4.0x or more | 850 (74.0%) | 348 (13.6%) |
| Total | 1,148 (100.0%) | 2,551 (100.0%) |
Real Estate Taxes by Mortgage Status in Mill Valley
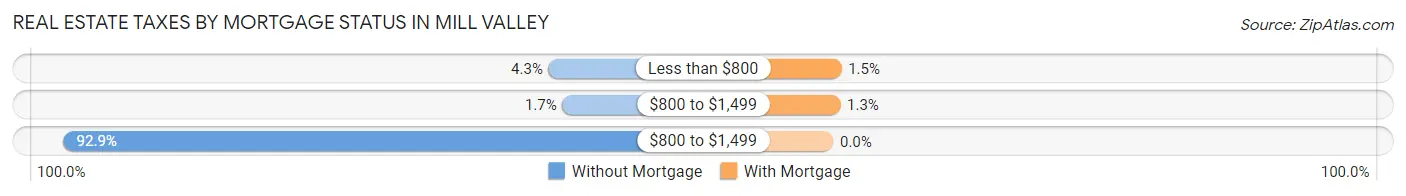
| Property Taxes | Without Mortgage | With Mortgage |
| Less than $800 | 49 (4.3%) | 38 (1.5%) |
| $800 to $1,499 | 20 (1.7%) | 33 (1.3%) |
| $800 to $1,499 | 1,066 (92.9%) | 0 (0.0%) |
| Total | 1,148 (100.0%) | 2,551 (100.0%) |
Health & Disability in Mill Valley
Health Insurance Coverage by Age in Mill Valley
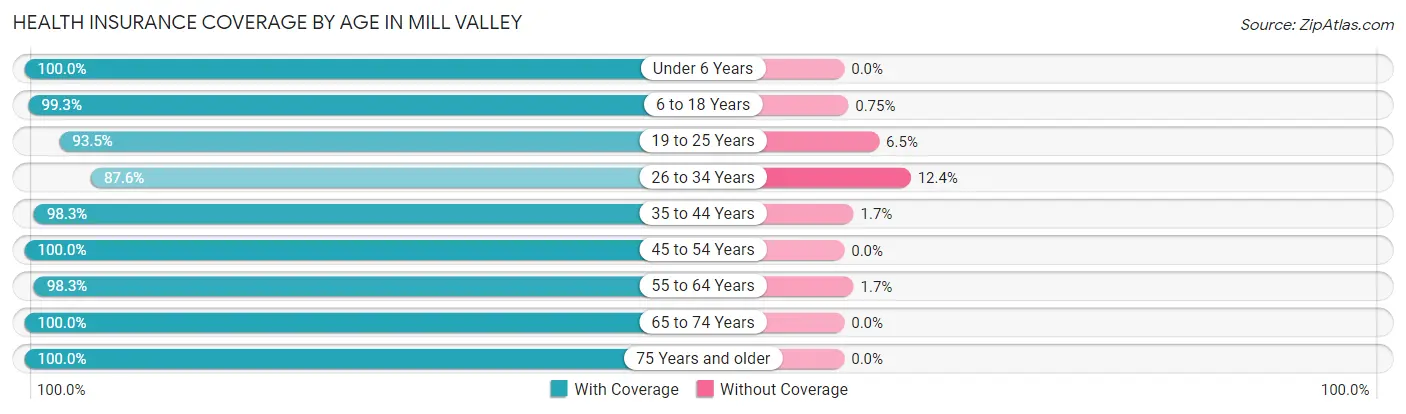
| Age Bracket | With Coverage | Without Coverage |
| Under 6 Years | 603 (100.0%) | 0 (0.0%) |
| 6 to 18 Years | 2,638 (99.3%) | 20 (0.7%) |
| 19 to 25 Years | 547 (93.5%) | 38 (6.5%) |
| 26 to 34 Years | 1,076 (87.6%) | 152 (12.4%) |
| 35 to 44 Years | 1,521 (98.3%) | 27 (1.7%) |
| 45 to 54 Years | 2,528 (100.0%) | 0 (0.0%) |
| 55 to 64 Years | 1,975 (98.3%) | 35 (1.7%) |
| 65 to 74 Years | 1,698 (100.0%) | 0 (0.0%) |
| 75 Years and older | 1,282 (100.0%) | 0 (0.0%) |
| Total | 13,868 (98.1%) | 272 (1.9%) |
Health Insurance Coverage by Citizenship Status in Mill Valley
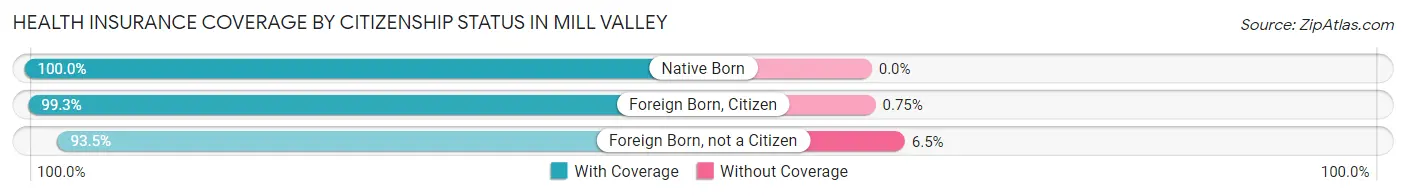
| Citizenship Status | With Coverage | Without Coverage |
| Native Born | 603 (100.0%) | 0 (0.0%) |
| Foreign Born, Citizen | 2,638 (99.3%) | 20 (0.7%) |
| Foreign Born, not a Citizen | 547 (93.5%) | 38 (6.5%) |
Health Insurance Coverage by Household Income in Mill Valley
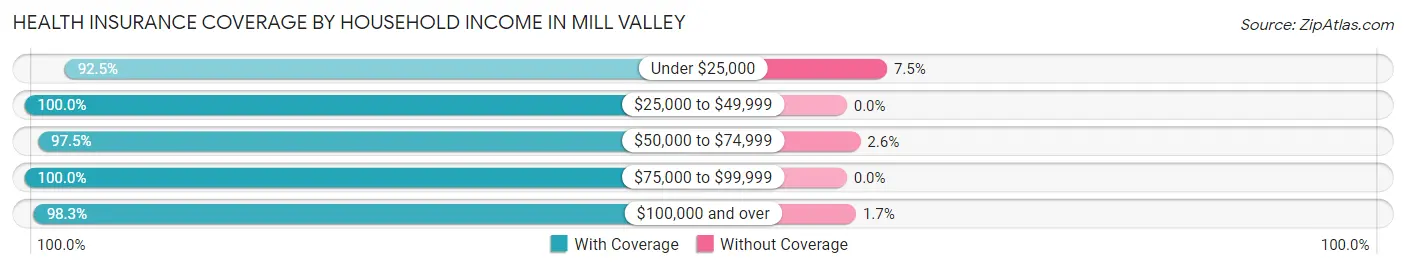
| Household Income | With Coverage | Without Coverage |
| Under $25,000 | 615 (92.5%) | 50 (7.5%) |
| $25,000 to $49,999 | 383 (100.0%) | 0 (0.0%) |
| $50,000 to $74,999 | 764 (97.5%) | 20 (2.5%) |
| $75,000 to $99,999 | 687 (100.0%) | 0 (0.0%) |
| $100,000 and over | 11,410 (98.3%) | 200 (1.7%) |
Public vs Private Health Insurance Coverage by Age in Mill Valley
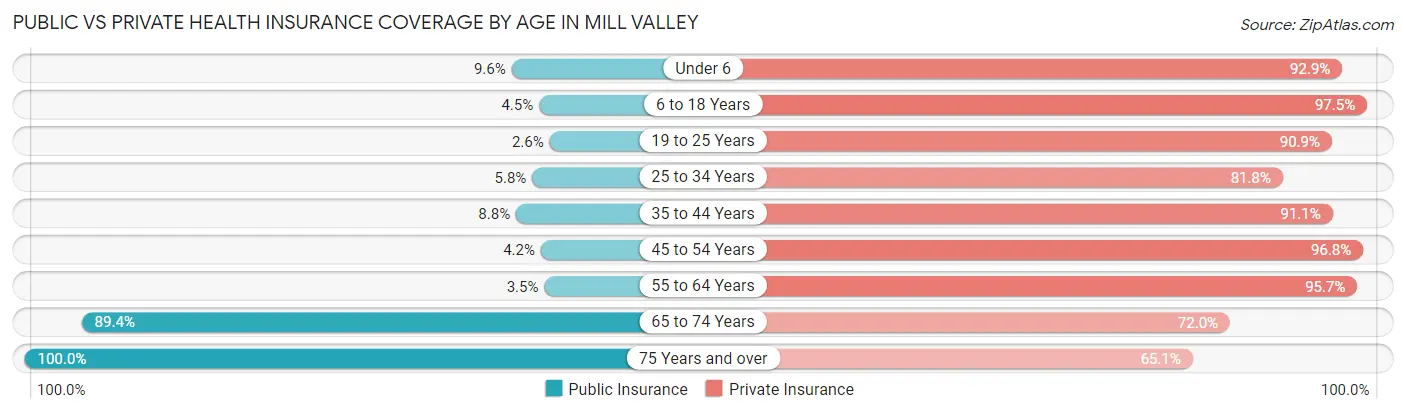
| Age Bracket | Public Insurance | Private Insurance |
| Under 6 | 58 (9.6%) | 560 (92.9%) |
| 6 to 18 Years | 120 (4.5%) | 2,591 (97.5%) |
| 19 to 25 Years | 15 (2.6%) | 532 (90.9%) |
| 25 to 34 Years | 71 (5.8%) | 1,005 (81.8%) |
| 35 to 44 Years | 136 (8.8%) | 1,410 (91.1%) |
| 45 to 54 Years | 106 (4.2%) | 2,446 (96.8%) |
| 55 to 64 Years | 71 (3.5%) | 1,923 (95.7%) |
| 65 to 74 Years | 1,518 (89.4%) | 1,223 (72.0%) |
| 75 Years and over | 1,282 (100.0%) | 835 (65.1%) |
| Total | 3,377 (23.9%) | 12,525 (88.6%) |
Disability Status by Sex by Age in Mill Valley
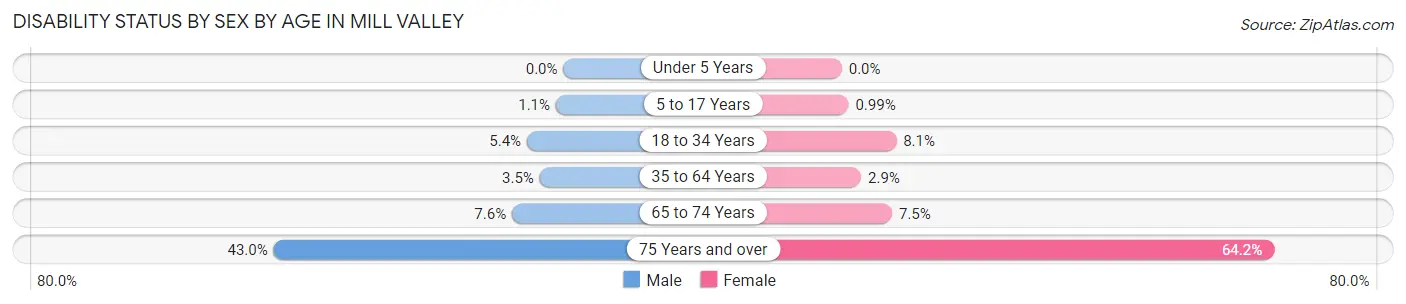
| Age Bracket | Male | Female |
| Under 5 Years | 0 (0.0%) | 0 (0.0%) |
| 5 to 17 Years | 13 (1.1%) | 13 (1.0%) |
| 18 to 34 Years | 57 (5.4%) | 81 (8.1%) |
| 35 to 64 Years | 102 (3.5%) | 91 (2.9%) |
| 65 to 74 Years | 58 (7.6%) | 70 (7.5%) |
| 75 Years and over | 219 (43.0%) | 496 (64.2%) |
Disability Class by Sex by Age in Mill Valley
Disability Class: Hearing Difficulty
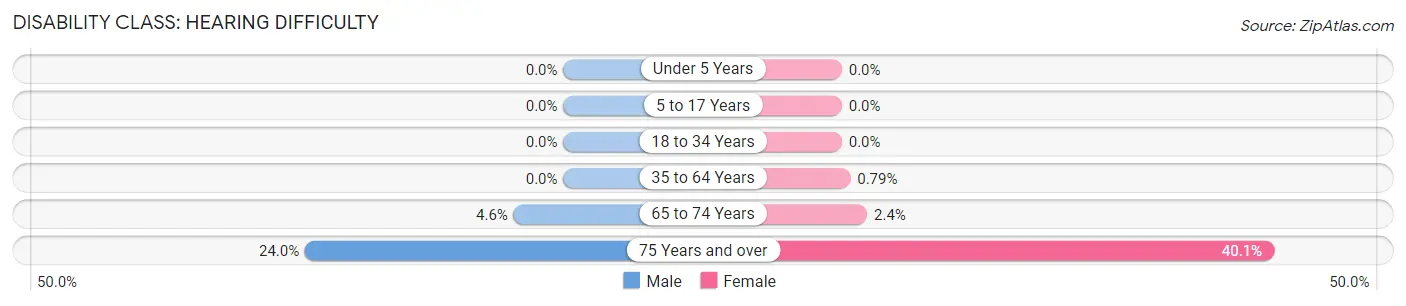
| Age Bracket | Male | Female |
| Under 5 Years | 0 (0.0%) | 0 (0.0%) |
| 5 to 17 Years | 0 (0.0%) | 0 (0.0%) |
| 18 to 34 Years | 0 (0.0%) | 0 (0.0%) |
| 35 to 64 Years | 0 (0.0%) | 25 (0.8%) |
| 65 to 74 Years | 35 (4.6%) | 22 (2.4%) |
| 75 Years and over | 122 (24.0%) | 310 (40.1%) |
Disability Class: Vision Difficulty
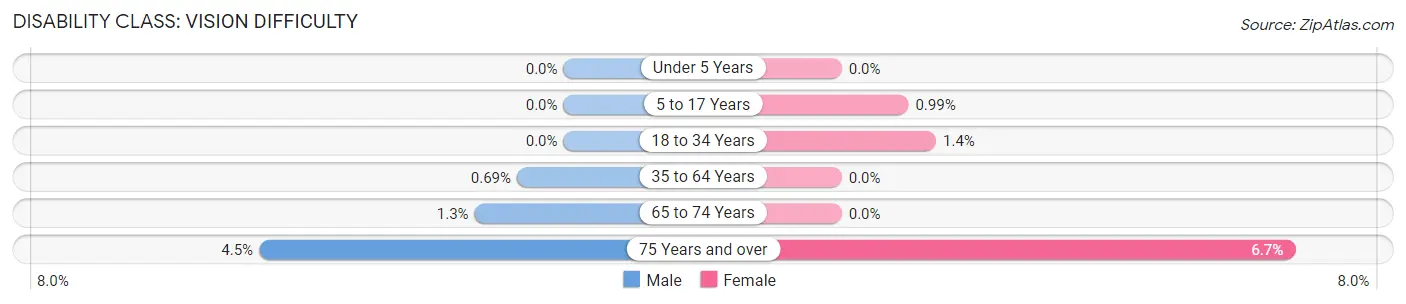
| Age Bracket | Male | Female |
| Under 5 Years | 0 (0.0%) | 0 (0.0%) |
| 5 to 17 Years | 0 (0.0%) | 13 (1.0%) |
| 18 to 34 Years | 0 (0.0%) | 14 (1.4%) |
| 35 to 64 Years | 20 (0.7%) | 0 (0.0%) |
| 65 to 74 Years | 10 (1.3%) | 0 (0.0%) |
| 75 Years and over | 23 (4.5%) | 52 (6.7%) |
Disability Class: Cognitive Difficulty
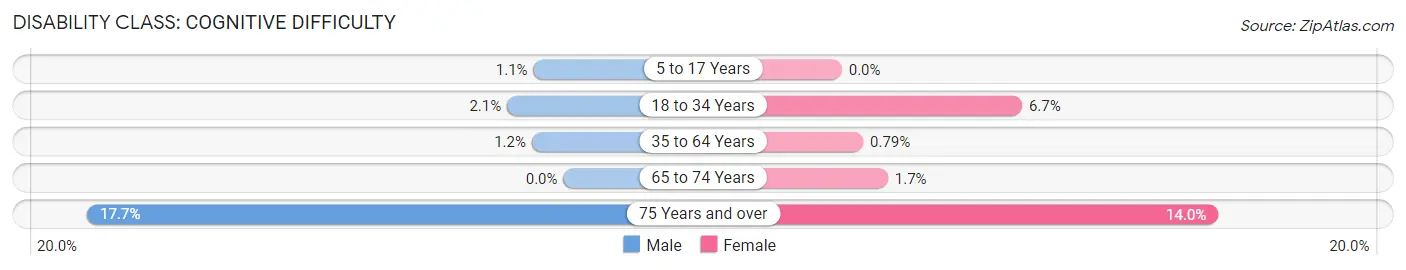
| Age Bracket | Male | Female |
| 5 to 17 Years | 13 (1.1%) | 0 (0.0%) |
| 18 to 34 Years | 22 (2.1%) | 67 (6.7%) |
| 35 to 64 Years | 34 (1.2%) | 25 (0.8%) |
| 65 to 74 Years | 0 (0.0%) | 16 (1.7%) |
| 75 Years and over | 90 (17.7%) | 108 (14.0%) |
Disability Class: Ambulatory Difficulty
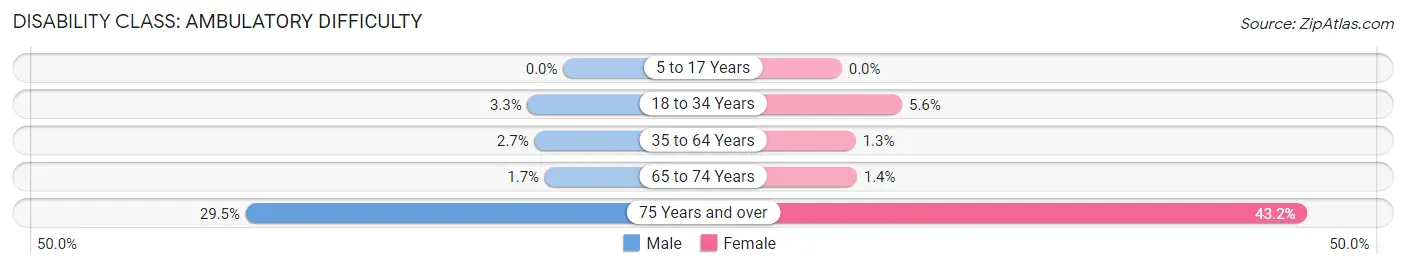
| Age Bracket | Male | Female |
| 5 to 17 Years | 0 (0.0%) | 0 (0.0%) |
| 18 to 34 Years | 35 (3.3%) | 56 (5.6%) |
| 35 to 64 Years | 78 (2.7%) | 41 (1.3%) |
| 65 to 74 Years | 13 (1.7%) | 13 (1.4%) |
| 75 Years and over | 150 (29.5%) | 334 (43.2%) |
Disability Class: Self-Care Difficulty
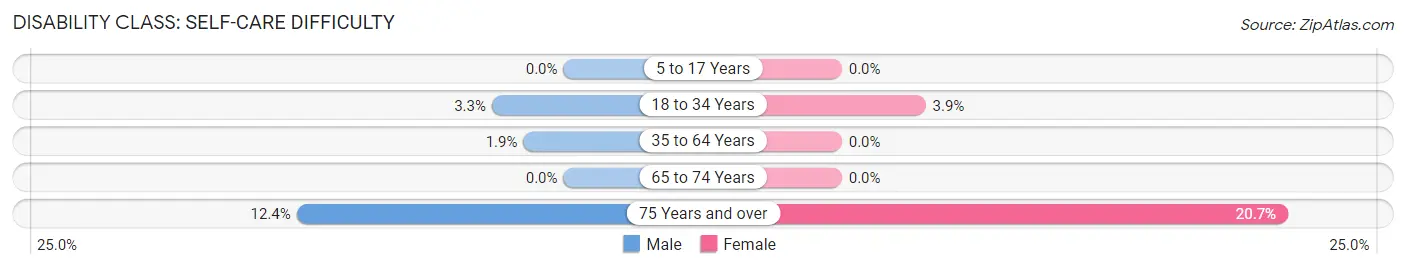
| Age Bracket | Male | Female |
| 5 to 17 Years | 0 (0.0%) | 0 (0.0%) |
| 18 to 34 Years | 35 (3.3%) | 39 (3.9%) |
| 35 to 64 Years | 54 (1.9%) | 0 (0.0%) |
| 65 to 74 Years | 0 (0.0%) | 0 (0.0%) |
| 75 Years and over | 63 (12.4%) | 160 (20.7%) |
Technology Access in Mill Valley
Computing Device Access in Mill Valley
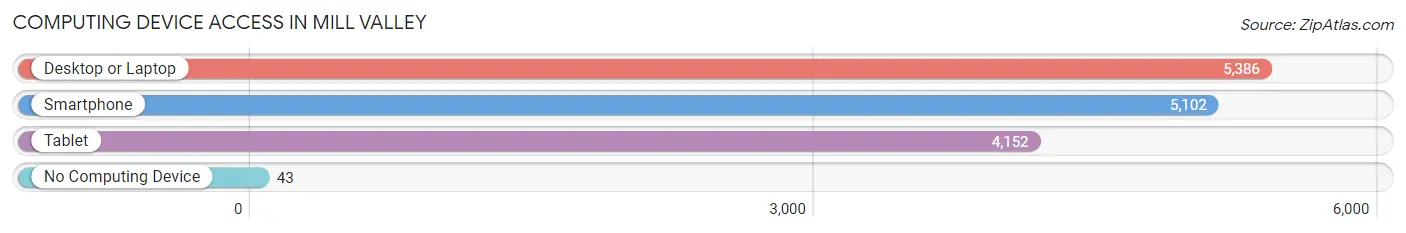
| Device Type | # Households | % Households |
| Desktop or Laptop | 5,386 | 96.3% |
| Smartphone | 5,102 | 91.2% |
| Tablet | 4,152 | 74.3% |
| No Computing Device | 43 | 0.8% |
| Total | 5,592 | 100.0% |
Internet Access in Mill Valley
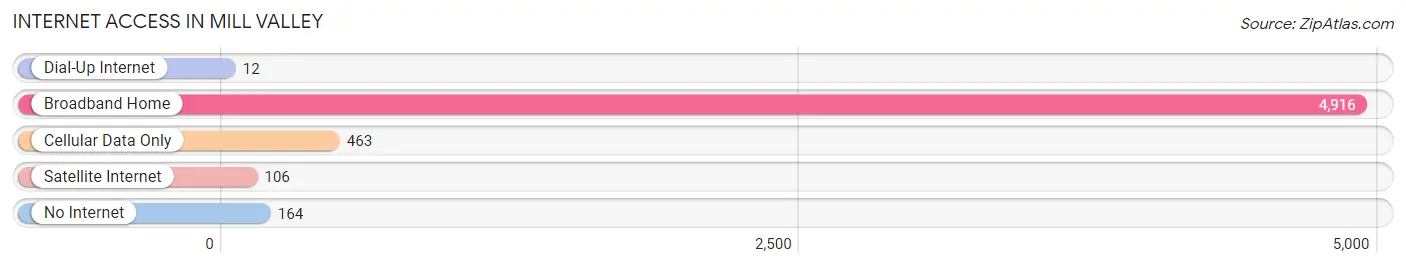
| Internet Type | # Households | % Households |
| Dial-Up Internet | 12 | 0.2% |
| Broadband Home | 4,916 | 87.9% |
| Cellular Data Only | 463 | 8.3% |
| Satellite Internet | 106 | 1.9% |
| No Internet | 164 | 2.9% |
| Total | 5,592 | 100.0% |
Mill Valley Summary
Introduction
Mill Valley is a city located in Marin County, California, United States. It is situated in the San Francisco Bay Area, about 10 miles north of San Francisco. The city has a population of approximately 14,000 people and is known for its picturesque views, outdoor recreation, and vibrant culture.
History
Mill Valley was first settled in the mid-1800s by a group of pioneers from New England. The area was originally known as “Mountain View” and was home to a small community of farmers and ranchers. In 1887, the town was renamed “Mill Valley” after a local sawmill.
The city experienced a period of growth in the early 1900s, when the railroad was extended to the area and the population began to increase. The city was incorporated in 1900 and the population continued to grow throughout the 20th century.
Geography
Mill Valley is located in the San Francisco Bay Area, about 10 miles north of San Francisco. The city is situated in a valley surrounded by hills and mountains, including Mount Tamalpais, which is the highest peak in the area. The city is located on the San Francisco Bay, and is bordered by the cities of Sausalito, Tiburon, and Corte Madera.
The climate in Mill Valley is mild and temperate, with warm summers and cool winters. The average annual temperature is around 60 degrees Fahrenheit.
Economy
Mill Valley’s economy is largely based on tourism and retail. The city is home to a number of popular tourist attractions, including Muir Woods National Monument, the Mill Valley Film Festival, and the Marin County Fair. The city also has a vibrant retail sector, with a variety of shops, restaurants, and galleries.
The city is also home to a number of technology companies, including Autodesk, Oracle, and Salesforce. These companies provide a significant number of jobs to the local economy.
Demographics
As of the 2010 census, the population of Mill Valley was 13,903. The racial makeup of the city was 79.3% White, 8.2% Asian, 6.2% Hispanic or Latino, and 4.3% African American. The median household income was $107,817, and the median age was 44.
Conclusion
Mill Valley is a vibrant city located in Marin County, California. The city has a rich history, beautiful geography, and a thriving economy. The population is diverse and the median household income is high. Mill Valley is a great place to live, work, and visit.
Common Questions
What is Per Capita Income in Mill Valley?
Per Capita income in Mill Valley is $120,154.
What is the Median Family Income in Mill Valley?
Median Family Income in Mill Valley is $250,001.
What is the Median Household income in Mill Valley?
Median Household Income in Mill Valley is $202,986.
What is Income or Wage Gap in Mill Valley?
Income or Wage Gap in Mill Valley is 33.4%.
Women in Mill Valley earn 66.6 cents for every dollar earned by a man.
What is Inequality or Gini Index in Mill Valley?
Inequality or Gini Index in Mill Valley is 0.50.
What is the Total Population of Mill Valley?
Total Population of Mill Valley is 14,199.
What is the Total Male Population of Mill Valley?
Total Male Population of Mill Valley is 6,679.
What is the Total Female Population of Mill Valley?
Total Female Population of Mill Valley is 7,520.
What is the Ratio of Males per 100 Females in Mill Valley?
There are 88.82 Males per 100 Females in Mill Valley.
What is the Ratio of Females per 100 Males in Mill Valley?
There are 112.59 Females per 100 Males in Mill Valley.
What is the Median Population Age in Mill Valley?
Median Population Age in Mill Valley is 47.1 Years.
What is the Average Family Size in Mill Valley
Average Family Size in Mill Valley is 3.0 People.
What is the Average Household Size in Mill Valley
Average Household Size in Mill Valley is 2.5 People.
How Large is the Labor Force in Mill Valley?
There are 7,183 People in the Labor Forcein in Mill Valley.
What is the Percentage of People in the Labor Force in Mill Valley?
61.4% of People are in the Labor Force in Mill Valley.
What is the Unemployment Rate in Mill Valley?
Unemployment Rate in Mill Valley is 7.4%.