South Elgin, IL Map & Demographics
South Elgin Map
South Elgin Overview
$49,615
PER CAPITA INCOME
$129,616
AVG FAMILY INCOME
$118,293
AVG HOUSEHOLD INCOME
34.5%
WAGE / INCOME GAP [ % ]
65.5¢/ $1
WAGE / INCOME GAP [ $ ]
0.40
INEQUALITY / GINI INDEX
23,841
TOTAL POPULATION
12,338
MALE POPULATION
11,503
FEMALE POPULATION
107.26
MALES / 100 FEMALES
93.23
FEMALES / 100 MALES
38.6
MEDIAN AGE
3.3
AVG FAMILY SIZE
2.9
AVG HOUSEHOLD SIZE
13,989
LABOR FORCE [ PEOPLE ]
73.3%
PERCENT IN LABOR FORCE
3.4%
UNEMPLOYMENT RATE
South Elgin Zip Codes
Income in South Elgin
Income Overview in South Elgin
Per Capita Income in South Elgin is $49,615, while median incomes of families and households are $129,616 and $118,293 respectively.
| Characteristic | Number | Measure |
| Per Capita Income | 23,841 | $49,615 |
| Median Family Income | 6,307 | $129,616 |
| Mean Family Income | 6,307 | $158,867 |
| Median Household Income | 8,225 | $118,293 |
| Mean Household Income | 8,225 | $141,554 |
| Income Deficit | 6,307 | $0 |
| Wage / Income Gap (%) | 23,841 | 34.49% |
| Wage / Income Gap ($) | 23,841 | 65.51¢ per $1 |
| Gini / Inequality Index | 23,841 | 0.40 |
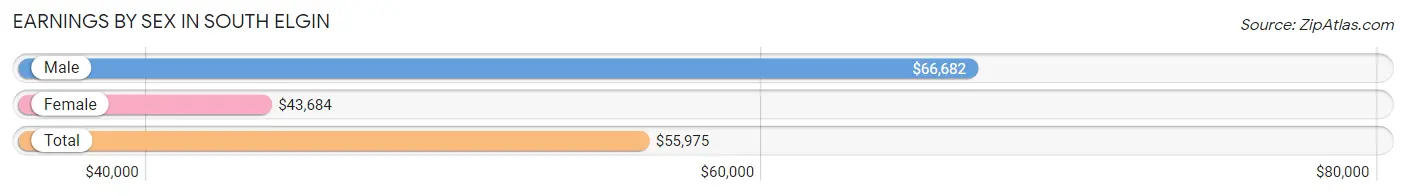
Earnings by Sex in South Elgin
Average Earnings in South Elgin are $55,975, $66,682 for men and $43,684 for women, a difference of 34.5%.
| Sex | Number | Average Earnings |
| Male | 7,659 (53.4%) | $66,682 |
| Female | 6,677 (46.6%) | $43,684 |
| Total | 14,336 (100.0%) | $55,975 |
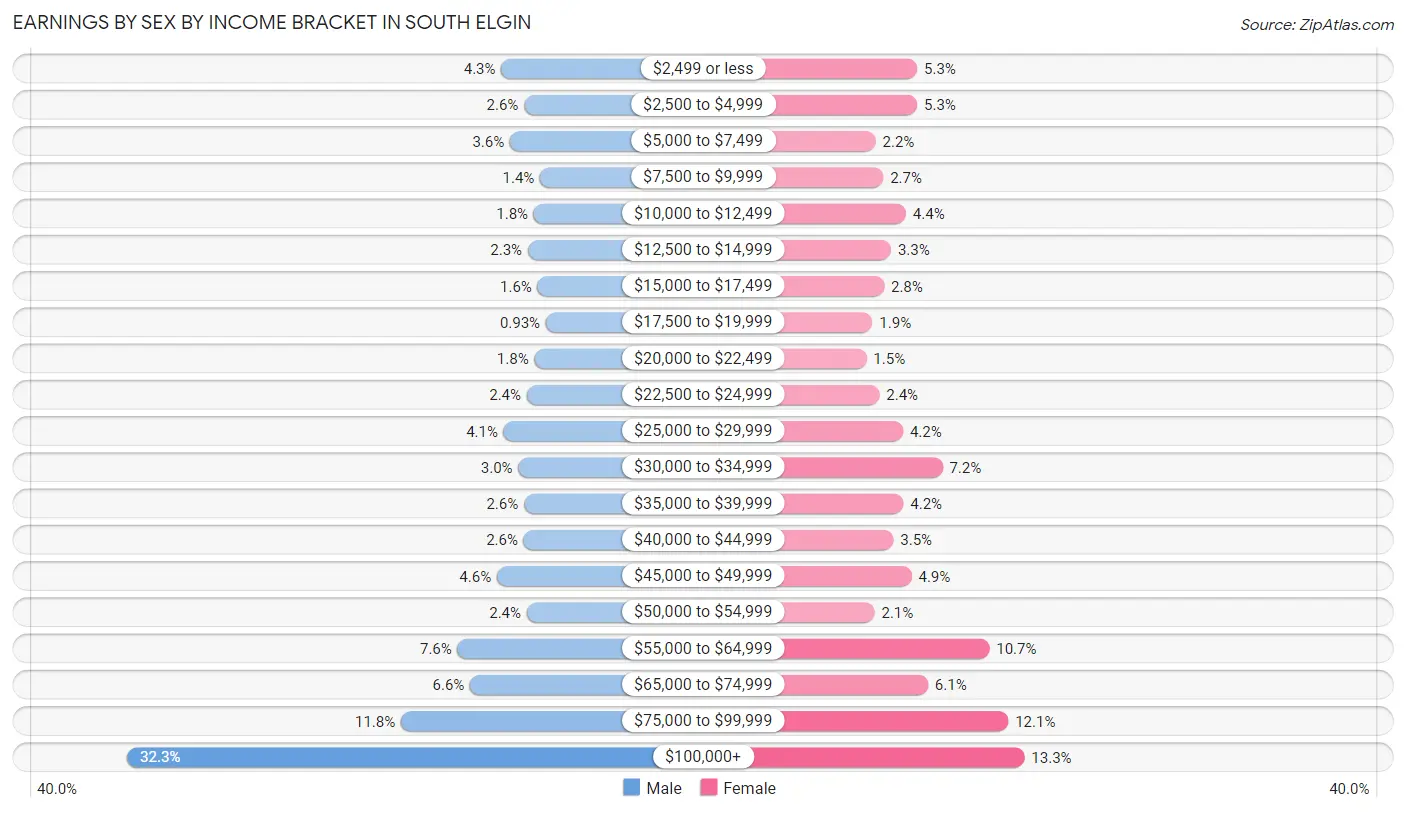
Earnings by Sex by Income Bracket in South Elgin
The most common earnings brackets in South Elgin are $100,000+ for men (2,475 | 32.3%) and $100,000+ for women (889 | 13.3%).
| Income | Male | Female |
| $2,499 or less | 327 (4.3%) | 352 (5.3%) |
| $2,500 to $4,999 | 196 (2.6%) | 352 (5.3%) |
| $5,000 to $7,499 | 277 (3.6%) | 144 (2.2%) |
| $7,500 to $9,999 | 104 (1.4%) | 182 (2.7%) |
| $10,000 to $12,499 | 140 (1.8%) | 296 (4.4%) |
| $12,500 to $14,999 | 175 (2.3%) | 221 (3.3%) |
| $15,000 to $17,499 | 119 (1.5%) | 186 (2.8%) |
| $17,500 to $19,999 | 71 (0.9%) | 128 (1.9%) |
| $20,000 to $22,499 | 137 (1.8%) | 98 (1.5%) |
| $22,500 to $24,999 | 181 (2.4%) | 163 (2.4%) |
| $25,000 to $29,999 | 313 (4.1%) | 281 (4.2%) |
| $30,000 to $34,999 | 229 (3.0%) | 479 (7.2%) |
| $35,000 to $39,999 | 197 (2.6%) | 283 (4.2%) |
| $40,000 to $44,999 | 198 (2.6%) | 233 (3.5%) |
| $45,000 to $49,999 | 352 (4.6%) | 324 (4.9%) |
| $50,000 to $54,999 | 181 (2.4%) | 139 (2.1%) |
| $55,000 to $64,999 | 578 (7.5%) | 713 (10.7%) |
| $65,000 to $74,999 | 506 (6.6%) | 406 (6.1%) |
| $75,000 to $99,999 | 903 (11.8%) | 808 (12.1%) |
| $100,000+ | 2,475 (32.3%) | 889 (13.3%) |
| Total | 7,659 (100.0%) | 6,677 (100.0%) |
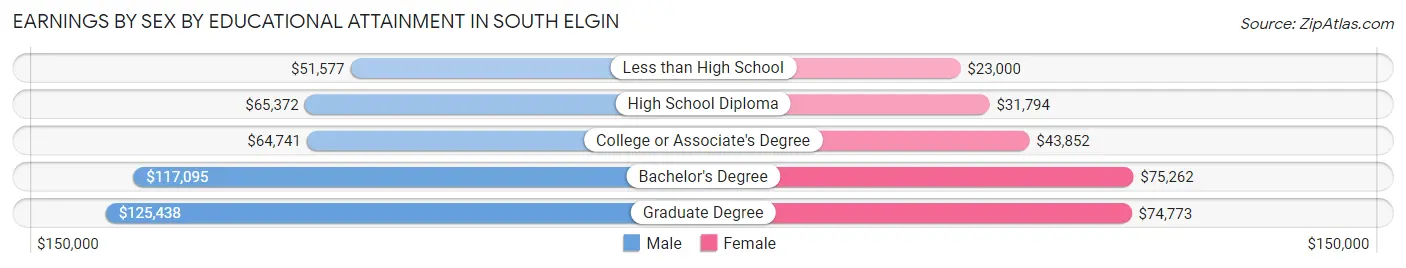
Earnings by Sex by Educational Attainment in South Elgin
Average earnings in South Elgin are $77,442 for men and $53,460 for women, a difference of 31.0%. Men with an educational attainment of graduate degree enjoy the highest average annual earnings of $125,438, while those with less than high school education earn the least with $51,577. Women with an educational attainment of bachelor's degree earn the most with the average annual earnings of $75,262, while those with less than high school education have the smallest earnings of $23,000.
| Educational Attainment | Male Income | Female Income |
| Less than High School | $51,577 | $23,000 |
| High School Diploma | $65,372 | $31,794 |
| College or Associate's Degree | $64,741 | $43,852 |
| Bachelor's Degree | $117,095 | $75,262 |
| Graduate Degree | $125,438 | $74,773 |
| Total | $77,442 | $53,460 |
Family Income in South Elgin
Family Income Brackets in South Elgin
According to the South Elgin family income data, there are 1,684 families falling into the $100,000 to $149,999 income range, which is the most common income bracket and makes up 26.7% of all families. Conversely, the $15,000 to $24,999 income bracket is the least frequent group with only 13 families (0.2%) belonging to this category.
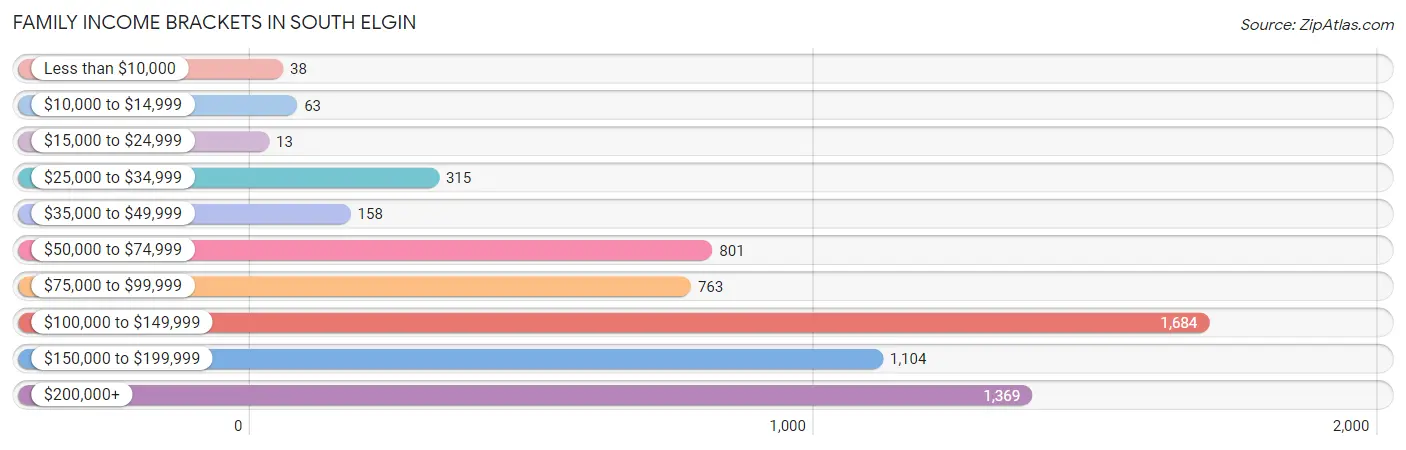
| Income Bracket | # Families | % Families |
| Less than $10,000 | 38 | 0.6% |
| $10,000 to $14,999 | 63 | 1.0% |
| $15,000 to $24,999 | 13 | 0.2% |
| $25,000 to $34,999 | 315 | 5.0% |
| $35,000 to $49,999 | 158 | 2.5% |
| $50,000 to $74,999 | 801 | 12.7% |
| $75,000 to $99,999 | 763 | 12.1% |
| $100,000 to $149,999 | 1,684 | 26.7% |
| $150,000 to $199,999 | 1,104 | 17.5% |
| $200,000+ | 1,369 | 21.7% |
Family Income by Famaliy Size in South Elgin
7+ person families (76 | 1.2%) account for the highest median family income in South Elgin with $250,001 per family, while 2-person families (2,222 | 35.2%) have the highest median income of $59,398 per family member.
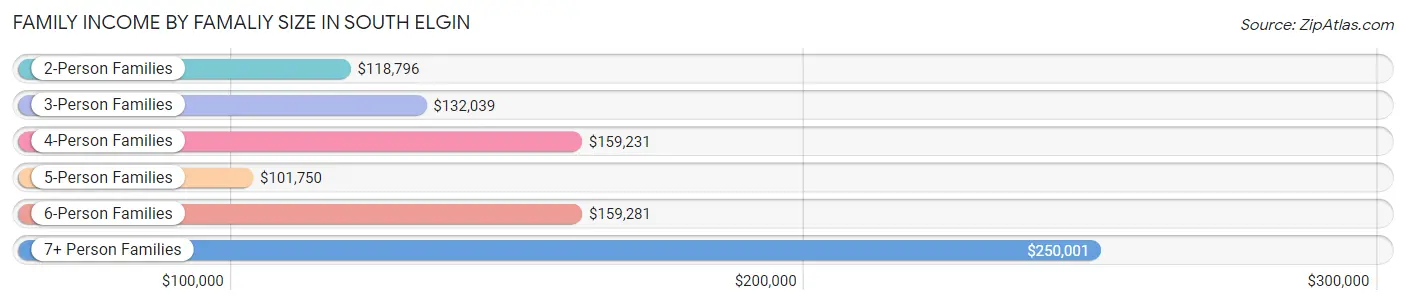
| Income Bracket | # Families | Median Income |
| 2-Person Families | 2,222 (35.2%) | $118,796 |
| 3-Person Families | 1,426 (22.6%) | $132,039 |
| 4-Person Families | 1,566 (24.8%) | $159,231 |
| 5-Person Families | 850 (13.5%) | $101,750 |
| 6-Person Families | 167 (2.6%) | $159,281 |
| 7+ Person Families | 76 (1.2%) | $250,001 |
| Total | 6,307 (100.0%) | $129,616 |
Family Income by Number of Earners in South Elgin
The median family income in South Elgin is $129,616, with families comprising 3+ earners (1,559) having the highest median family income of $166,475, while families with no earners (518) have the lowest median family income of $61,603, accounting for 24.7% and 8.2% of families, respectively.
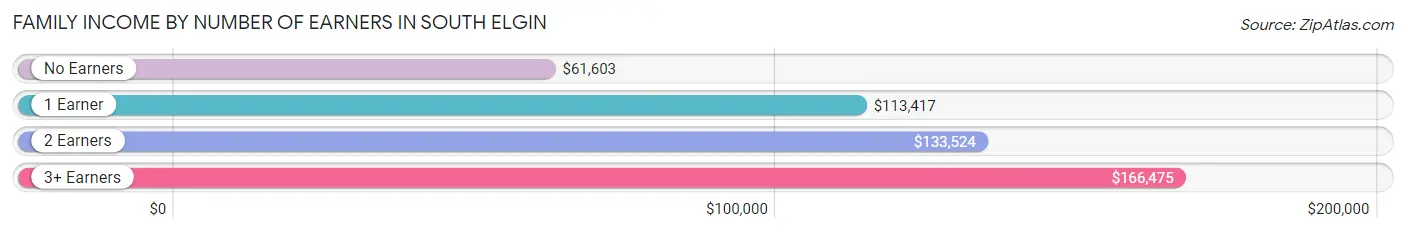
| Number of Earners | # Families | Median Income |
| No Earners | 518 (8.2%) | $61,603 |
| 1 Earner | 1,490 (23.6%) | $113,417 |
| 2 Earners | 2,740 (43.4%) | $133,524 |
| 3+ Earners | 1,559 (24.7%) | $166,475 |
| Total | 6,307 (100.0%) | $129,616 |
Household Income in South Elgin
Household Income Brackets in South Elgin
With 2,015 households falling in the category, the $100,000 to $149,999 income range is the most frequent in South Elgin, accounting for 24.5% of all households. In contrast, only 58 households (0.7%) fall into the less than $10,000 income bracket, making it the least populous group.
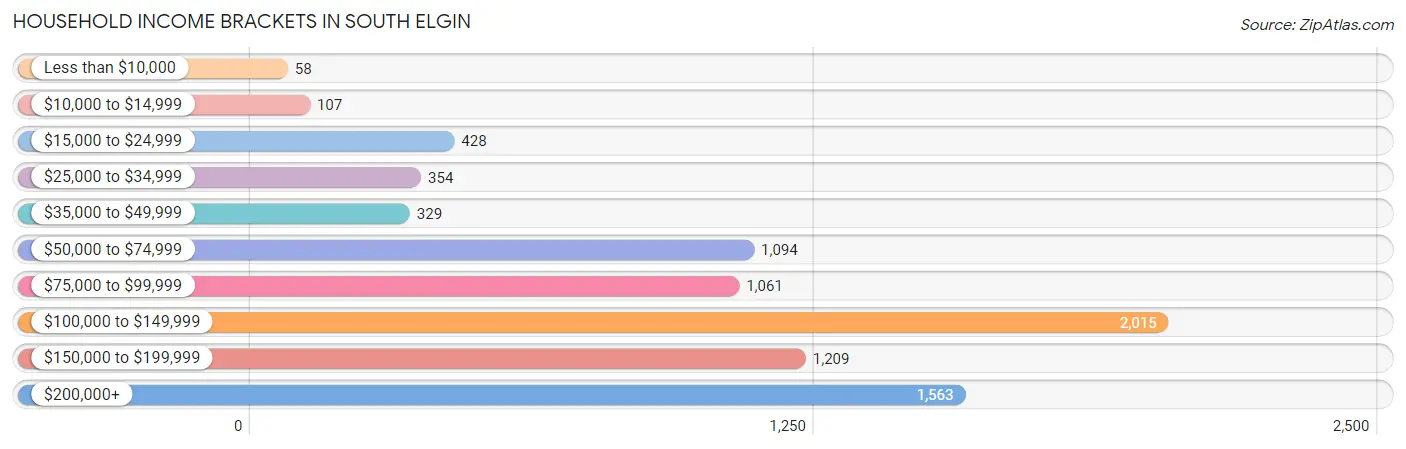
| Income Bracket | # Households | % Households |
| Less than $10,000 | 58 | 0.7% |
| $10,000 to $14,999 | 107 | 1.3% |
| $15,000 to $24,999 | 428 | 5.2% |
| $25,000 to $34,999 | 354 | 4.3% |
| $35,000 to $49,999 | 329 | 4.0% |
| $50,000 to $74,999 | 1,094 | 13.3% |
| $75,000 to $99,999 | 1,061 | 12.9% |
| $100,000 to $149,999 | 2,015 | 24.5% |
| $150,000 to $199,999 | 1,209 | 14.7% |
| $200,000+ | 1,563 | 19.0% |
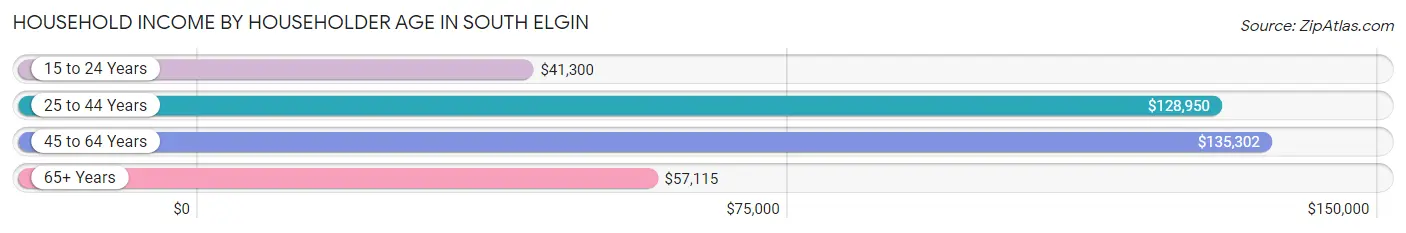
Household Income by Householder Age in South Elgin
The median household income in South Elgin is $118,293, with the highest median household income of $135,302 found in the 45 to 64 years age bracket for the primary householder. A total of 3,958 households (48.1%) fall into this category. Meanwhile, the 15 to 24 years age bracket for the primary householder has the lowest median household income of $41,300, with 62 households (0.7%) in this group.
| Income Bracket | # Households | Median Income |
| 15 to 24 Years | 62 (0.7%) | $41,300 |
| 25 to 44 Years | 2,777 (33.8%) | $128,950 |
| 45 to 64 Years | 3,958 (48.1%) | $135,302 |
| 65+ Years | 1,428 (17.4%) | $57,115 |
| Total | 8,225 (100.0%) | $118,293 |
Poverty in South Elgin
Income Below Poverty by Sex and Age in South Elgin
With 7.2% poverty level for males and 4.2% for females among the residents of South Elgin, under 5 year old males and 16 and 17 year old females are the most vulnerable to poverty, with 154 males (25.7%) and 41 females (10.0%) in their respective age groups living below the poverty level.
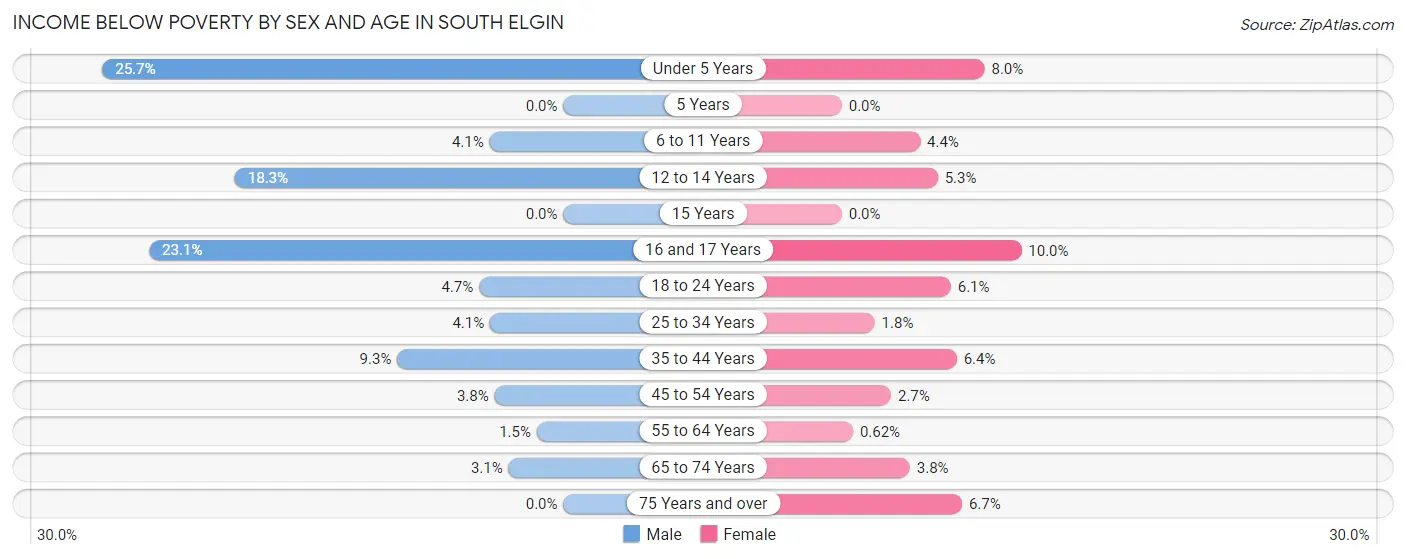
| Age Bracket | Male | Female |
| Under 5 Years | 154 (25.7%) | 38 (8.0%) |
| 5 Years | 0 (0.0%) | 0 (0.0%) |
| 6 to 11 Years | 40 (4.1%) | 34 (4.4%) |
| 12 to 14 Years | 118 (18.3%) | 25 (5.3%) |
| 15 Years | 0 (0.0%) | 0 (0.0%) |
| 16 and 17 Years | 152 (23.1%) | 41 (10.0%) |
| 18 to 24 Years | 59 (4.7%) | 54 (6.1%) |
| 25 to 34 Years | 45 (4.1%) | 18 (1.8%) |
| 35 to 44 Years | 191 (9.2%) | 124 (6.4%) |
| 45 to 54 Years | 85 (3.8%) | 57 (2.7%) |
| 55 to 64 Years | 19 (1.5%) | 9 (0.6%) |
| 65 to 74 Years | 18 (3.0%) | 37 (3.8%) |
| 75 Years and over | 0 (0.0%) | 34 (6.7%) |
| Total | 881 (7.2%) | 471 (4.2%) |
Income Above Poverty by Sex and Age in South Elgin
According to the poverty statistics in South Elgin, males aged 5 years and females aged 5 years are the age groups that are most secure financially, with 100.0% of males and 100.0% of females in these age groups living above the poverty line.
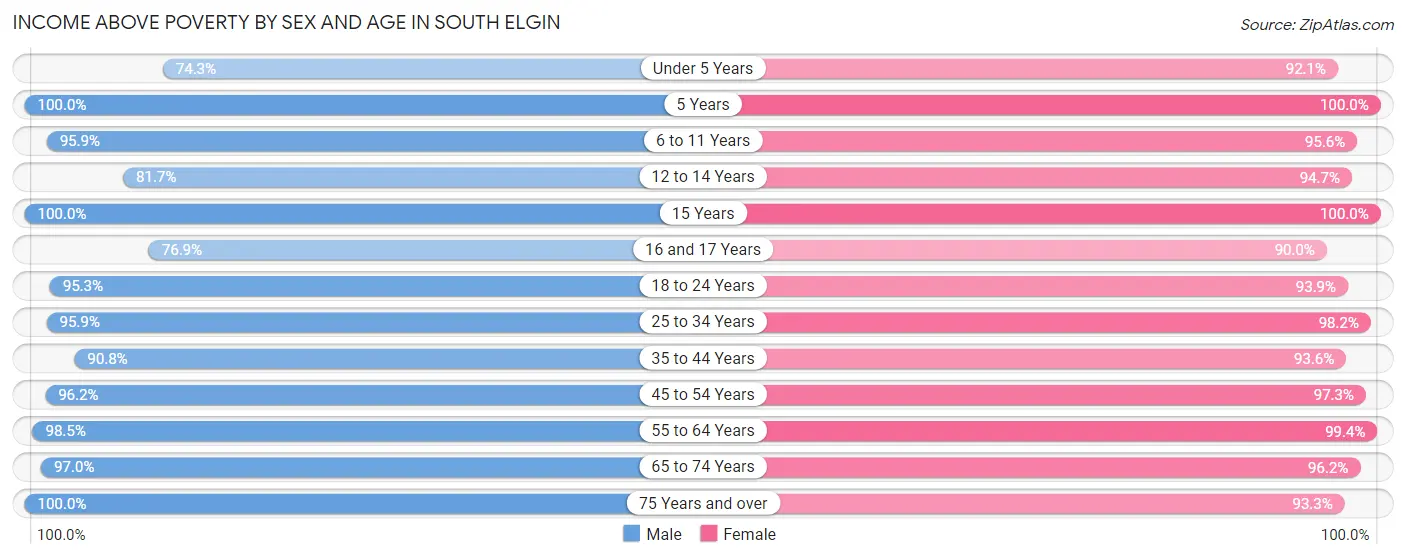
| Age Bracket | Male | Female |
| Under 5 Years | 446 (74.3%) | 440 (92.0%) |
| 5 Years | 126 (100.0%) | 280 (100.0%) |
| 6 to 11 Years | 933 (95.9%) | 746 (95.6%) |
| 12 to 14 Years | 527 (81.7%) | 443 (94.7%) |
| 15 Years | 301 (100.0%) | 105 (100.0%) |
| 16 and 17 Years | 507 (76.9%) | 369 (90.0%) |
| 18 to 24 Years | 1,200 (95.3%) | 836 (93.9%) |
| 25 to 34 Years | 1,058 (95.9%) | 968 (98.2%) |
| 35 to 44 Years | 1,874 (90.7%) | 1,813 (93.6%) |
| 45 to 54 Years | 2,134 (96.2%) | 2,024 (97.3%) |
| 55 to 64 Years | 1,267 (98.5%) | 1,450 (99.4%) |
| 65 to 74 Years | 573 (97.0%) | 940 (96.2%) |
| 75 Years and over | 395 (100.0%) | 474 (93.3%) |
| Total | 11,341 (92.8%) | 10,888 (95.9%) |
Income Below Poverty Among Married-Couple Families in South Elgin
The poverty statistics for married-couple families in South Elgin show that 3.8% or 197 of the total 5,130 families live below the poverty line. Families with 3 or 4 children have the highest poverty rate of 27.5%, comprising of 141 families. On the other hand, families with 5 or more children have the lowest poverty rate of 0.0%, which includes 0 families.

| Children | Above Poverty | Below Poverty |
| No Children | 2,467 (99.3%) | 18 (0.7%) |
| 1 or 2 Children | 2,079 (98.2%) | 38 (1.8%) |
| 3 or 4 Children | 372 (72.5%) | 141 (27.5%) |
| 5 or more Children | 15 (100.0%) | 0 (0.0%) |
| Total | 4,933 (96.2%) | 197 (3.8%) |
Income Below Poverty Among Single-Parent Households in South Elgin
According to the poverty data in South Elgin, 8.3% or 31 single-father households and 5.6% or 45 single-mother households are living below the poverty line. Among single-father households, those with 1 or 2 children have the highest poverty rate, with 31 households (21.4%) experiencing poverty. Likewise, among single-mother households, those with 1 or 2 children have the highest poverty rate, with 27 households (8.4%) falling below the poverty line.
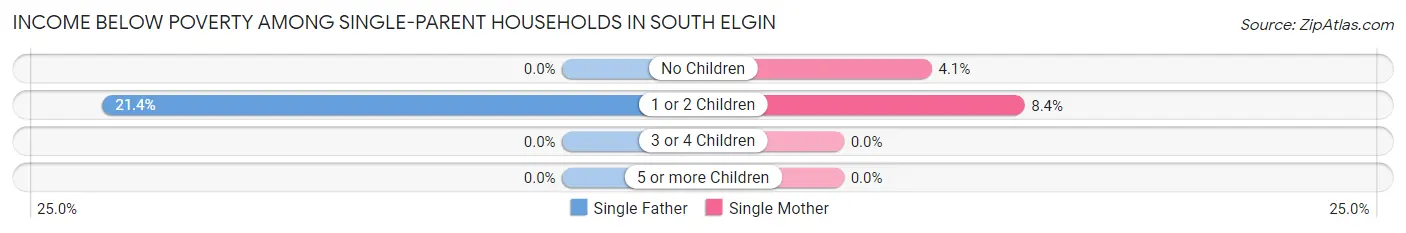
| Children | Single Father | Single Mother |
| No Children | 0 (0.0%) | 18 (4.1%) |
| 1 or 2 Children | 31 (21.4%) | 27 (8.4%) |
| 3 or 4 Children | 0 (0.0%) | 0 (0.0%) |
| 5 or more Children | 0 (0.0%) | 0 (0.0%) |
| Total | 31 (8.3%) | 45 (5.6%) |
Income Below Poverty Among Married-Couple vs Single-Parent Households in South Elgin
The poverty data for South Elgin shows that 197 of the married-couple family households (3.8%) and 76 of the single-parent households (6.5%) are living below the poverty level. Within the married-couple family households, those with 3 or 4 children have the highest poverty rate, with 141 households (27.5%) falling below the poverty line. Among the single-parent households, those with 1 or 2 children have the highest poverty rate, with 58 household (12.4%) living below poverty.
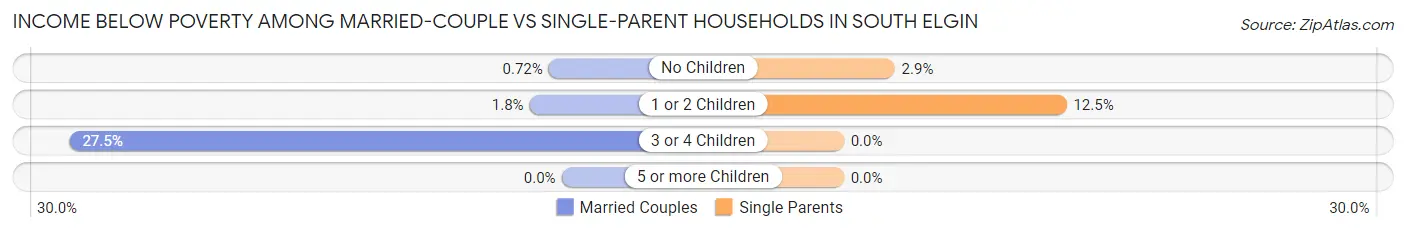
| Children | Married-Couple Families | Single-Parent Households |
| No Children | 18 (0.7%) | 18 (2.9%) |
| 1 or 2 Children | 38 (1.8%) | 58 (12.4%) |
| 3 or 4 Children | 141 (27.5%) | 0 (0.0%) |
| 5 or more Children | 0 (0.0%) | 0 (0.0%) |
| Total | 197 (3.8%) | 76 (6.5%) |
Race in South Elgin
The most populous races in South Elgin are White / Caucasian (16,381 | 68.7%), Hispanic or Latino (5,653 | 23.7%), and Asian (2,255 | 9.5%).
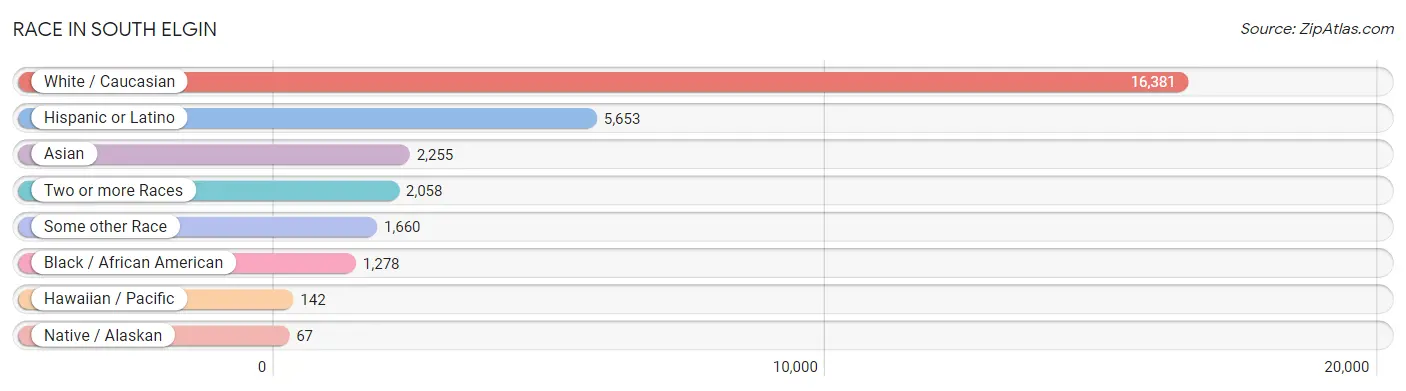
| Race | # Population | % Population |
| Asian | 2,255 | 9.5% |
| Black / African American | 1,278 | 5.4% |
| Hawaiian / Pacific | 142 | 0.6% |
| Hispanic or Latino | 5,653 | 23.7% |
| Native / Alaskan | 67 | 0.3% |
| White / Caucasian | 16,381 | 68.7% |
| Two or more Races | 2,058 | 8.6% |
| Some other Race | 1,660 | 7.0% |
| Total | 23,841 | 100.0% |
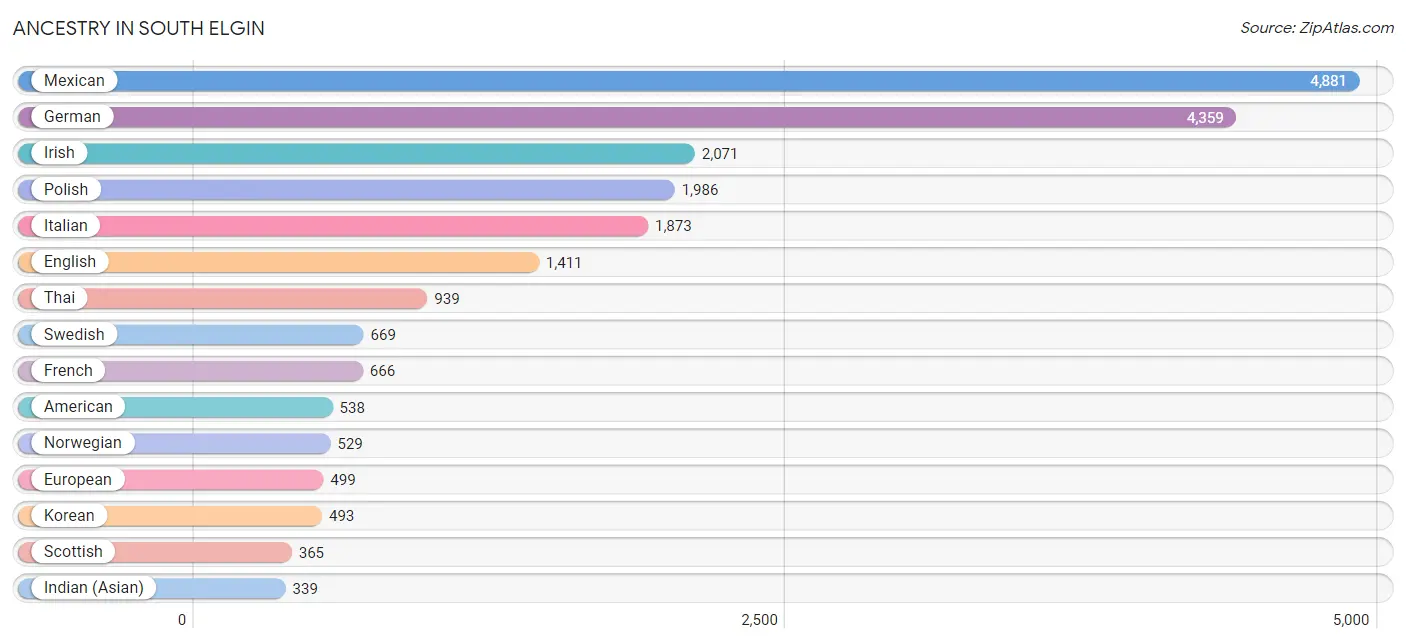
Ancestry in South Elgin
The most populous ancestries reported in South Elgin are Mexican (4,881 | 20.5%), German (4,359 | 18.3%), Irish (2,071 | 8.7%), Polish (1,986 | 8.3%), and Italian (1,873 | 7.9%), together accounting for 63.6% of all South Elgin residents.
| Ancestry | # Population | % Population |
| Albanian | 85 | 0.4% |
| American | 538 | 2.3% |
| Arab | 55 | 0.2% |
| Austrian | 18 | 0.1% |
| Belgian | 18 | 0.1% |
| Belizean | 29 | 0.1% |
| Bhutanese | 152 | 0.6% |
| Blackfeet | 11 | 0.1% |
| British | 41 | 0.2% |
| Burmese | 229 | 1.0% |
| Canadian | 120 | 0.5% |
| Central American | 98 | 0.4% |
| Central American Indian | 40 | 0.2% |
| Colombian | 95 | 0.4% |
| Croatian | 24 | 0.1% |
| Cuban | 100 | 0.4% |
| Czech | 227 | 0.9% |
| Czechoslovakian | 43 | 0.2% |
| Danish | 47 | 0.2% |
| Dutch | 198 | 0.8% |
| Eastern European | 76 | 0.3% |
| English | 1,411 | 5.9% |
| European | 499 | 2.1% |
| Filipino | 9 | 0.0% |
| Finnish | 60 | 0.3% |
| French | 666 | 2.8% |
| French Canadian | 24 | 0.1% |
| German | 4,359 | 18.3% |
| Greek | 119 | 0.5% |
| Guatemalan | 98 | 0.4% |
| Hungarian | 106 | 0.4% |
| Indian (Asian) | 339 | 1.4% |
| Irish | 2,071 | 8.7% |
| Italian | 1,873 | 7.9% |
| Jamaican | 27 | 0.1% |
| Jordanian | 12 | 0.1% |
| Korean | 493 | 2.1% |
| Lithuanian | 64 | 0.3% |
| Luxembourger | 84 | 0.4% |
| Malaysian | 266 | 1.1% |
| Mexican | 4,881 | 20.5% |
| Moroccan | 19 | 0.1% |
| Northern European | 134 | 0.6% |
| Norwegian | 529 | 2.2% |
| Pakistani | 55 | 0.2% |
| Palestinian | 13 | 0.1% |
| Polish | 1,986 | 8.3% |
| Portuguese | 18 | 0.1% |
| Puerto Rican | 274 | 1.1% |
| Romanian | 115 | 0.5% |
| Russian | 106 | 0.4% |
| Samoan | 142 | 0.6% |
| Scandinavian | 29 | 0.1% |
| Scotch-Irish | 31 | 0.1% |
| Scottish | 365 | 1.5% |
| Sioux | 25 | 0.1% |
| Slavic | 22 | 0.1% |
| Slovak | 20 | 0.1% |
| Slovene | 11 | 0.1% |
| South American | 229 | 1.0% |
| Spaniard | 47 | 0.2% |
| Sri Lankan | 87 | 0.4% |
| Swedish | 669 | 2.8% |
| Swiss | 45 | 0.2% |
| Thai | 939 | 3.9% |
| Ukrainian | 319 | 1.3% |
| Welsh | 104 | 0.4% |
| Yugoslavian | 10 | 0.0% | View All 68 Rows |
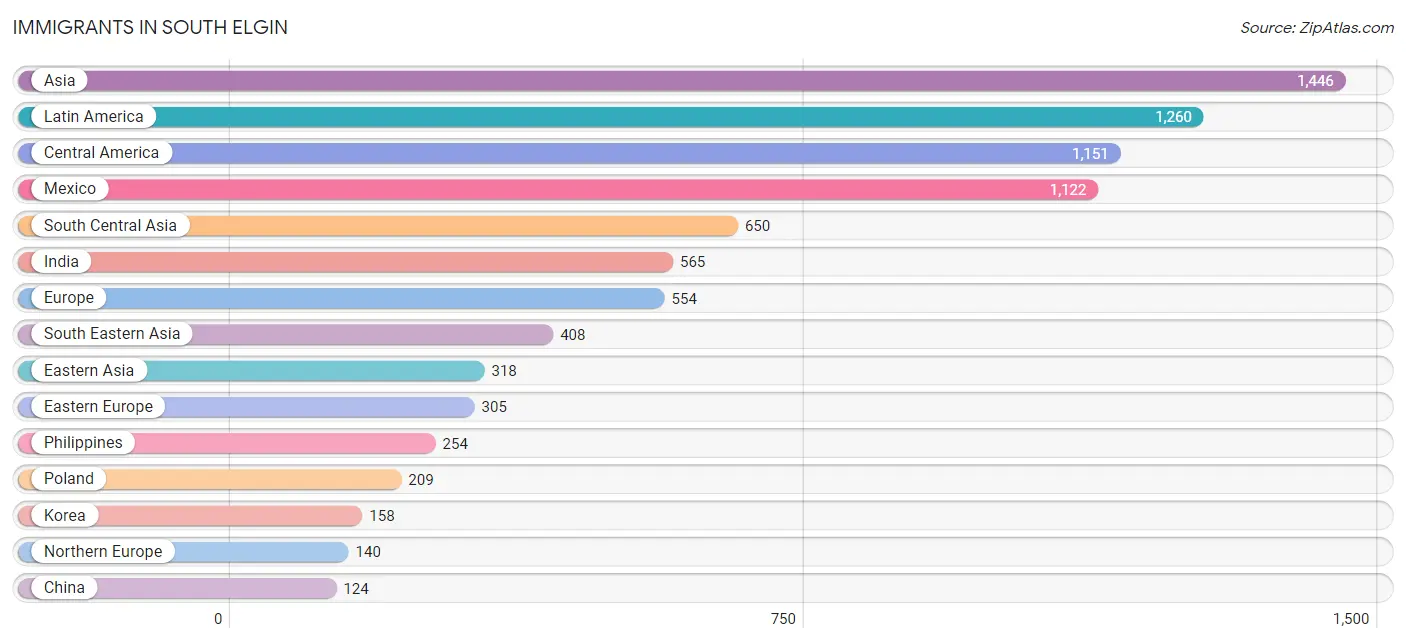
Immigrants in South Elgin
The most numerous immigrant groups reported in South Elgin came from Asia (1,446 | 6.1%), Latin America (1,260 | 5.3%), Central America (1,151 | 4.8%), Mexico (1,122 | 4.7%), and South Central Asia (650 | 2.7%), together accounting for 23.6% of all South Elgin residents.
| Immigration Origin | # Population | % Population |
| Africa | 29 | 0.1% |
| Asia | 1,446 | 6.1% |
| Austria | 19 | 0.1% |
| Belgium | 9 | 0.0% |
| Belize | 29 | 0.1% |
| Canada | 33 | 0.1% |
| Caribbean | 14 | 0.1% |
| Central America | 1,151 | 4.8% |
| China | 124 | 0.5% |
| Colombia | 95 | 0.4% |
| Cuba | 14 | 0.1% |
| Eastern Africa | 10 | 0.0% |
| Eastern Asia | 318 | 1.3% |
| Eastern Europe | 305 | 1.3% |
| England | 31 | 0.1% |
| Europe | 554 | 2.3% |
| Germany | 10 | 0.0% |
| Greece | 34 | 0.1% |
| India | 565 | 2.4% |
| Iraq | 23 | 0.1% |
| Italy | 30 | 0.1% |
| Japan | 36 | 0.2% |
| Jordan | 12 | 0.1% |
| Korea | 158 | 0.7% |
| Laos | 120 | 0.5% |
| Latin America | 1,260 | 5.3% |
| Mexico | 1,122 | 4.7% |
| Morocco | 19 | 0.1% |
| North Macedonia | 20 | 0.1% |
| Northern Africa | 19 | 0.1% |
| Northern Europe | 140 | 0.6% |
| Pakistan | 63 | 0.3% |
| Philippines | 254 | 1.1% |
| Poland | 209 | 0.9% |
| Romania | 69 | 0.3% |
| Russia | 7 | 0.0% |
| Scotland | 13 | 0.1% |
| South America | 95 | 0.4% |
| South Central Asia | 650 | 2.7% |
| South Eastern Asia | 408 | 1.7% |
| Southern Europe | 64 | 0.3% |
| Sri Lanka | 22 | 0.1% |
| Sweden | 83 | 0.4% |
| Switzerland | 7 | 0.0% |
| Taiwan | 9 | 0.0% |
| Thailand | 34 | 0.1% |
| Western Asia | 35 | 0.2% |
| Western Europe | 45 | 0.2% |
| Zimbabwe | 10 | 0.0% | View All 49 Rows |
Sex and Age in South Elgin
Sex and Age in South Elgin
The most populous age groups in South Elgin are 15 to 19 Years (1,435 | 11.6%) for men and 35 to 39 Years (1,352 | 11.7%) for women.
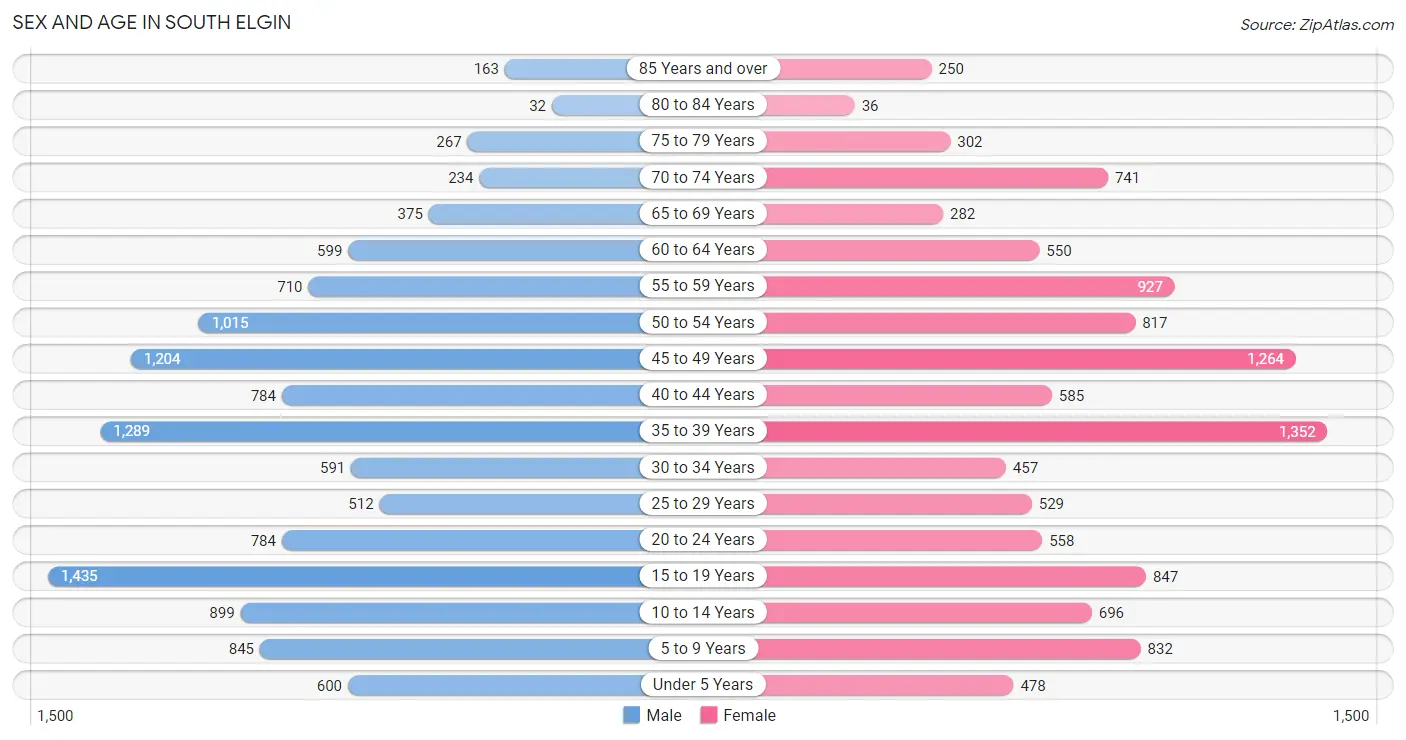
| Age Bracket | Male | Female |
| Under 5 Years | 600 (4.9%) | 478 (4.2%) |
| 5 to 9 Years | 845 (6.9%) | 832 (7.2%) |
| 10 to 14 Years | 899 (7.3%) | 696 (6.0%) |
| 15 to 19 Years | 1,435 (11.6%) | 847 (7.4%) |
| 20 to 24 Years | 784 (6.4%) | 558 (4.9%) |
| 25 to 29 Years | 512 (4.2%) | 529 (4.6%) |
| 30 to 34 Years | 591 (4.8%) | 457 (4.0%) |
| 35 to 39 Years | 1,289 (10.4%) | 1,352 (11.7%) |
| 40 to 44 Years | 784 (6.4%) | 585 (5.1%) |
| 45 to 49 Years | 1,204 (9.8%) | 1,264 (11.0%) |
| 50 to 54 Years | 1,015 (8.2%) | 817 (7.1%) |
| 55 to 59 Years | 710 (5.8%) | 927 (8.1%) |
| 60 to 64 Years | 599 (4.9%) | 550 (4.8%) |
| 65 to 69 Years | 375 (3.0%) | 282 (2.5%) |
| 70 to 74 Years | 234 (1.9%) | 741 (6.4%) |
| 75 to 79 Years | 267 (2.2%) | 302 (2.6%) |
| 80 to 84 Years | 32 (0.3%) | 36 (0.3%) |
| 85 Years and over | 163 (1.3%) | 250 (2.2%) |
| Total | 12,338 (100.0%) | 11,503 (100.0%) |
Families and Households in South Elgin
Median Family Size in South Elgin
The median family size in South Elgin is 3.31 persons per family, with married-couple families (5,130 | 81.3%) accounting for the largest median family size of 3.36 persons per family. On the other hand, single male/father families (373 | 5.9%) represent the smallest median family size with 3.02 persons per family.
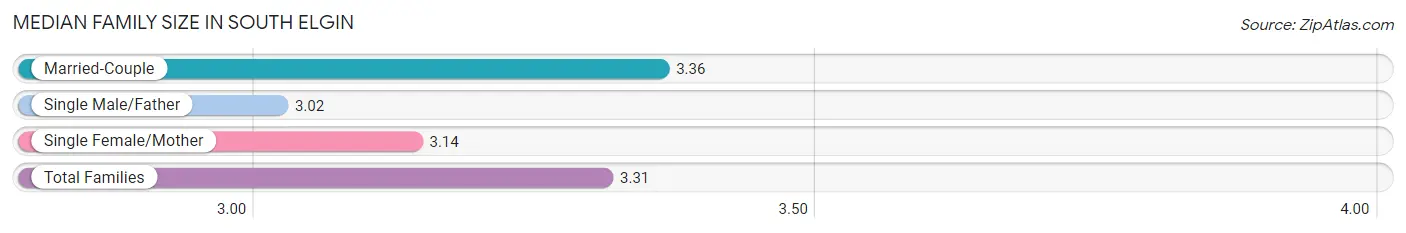
| Family Type | # Families | Family Size |
| Married-Couple | 5,130 (81.3%) | 3.36 |
| Single Male/Father | 373 (5.9%) | 3.02 |
| Single Female/Mother | 804 (12.8%) | 3.14 |
| Total Families | 6,307 (100.0%) | 3.31 |
Median Household Size in South Elgin
The median household size in South Elgin is 2.87 persons per household, with single female/mother households (804 | 9.8%) accounting for the largest median household size of 3.42 persons per household. non-family households (1,918 | 23.3%) represent the smallest median household size with 1.19 persons per household.
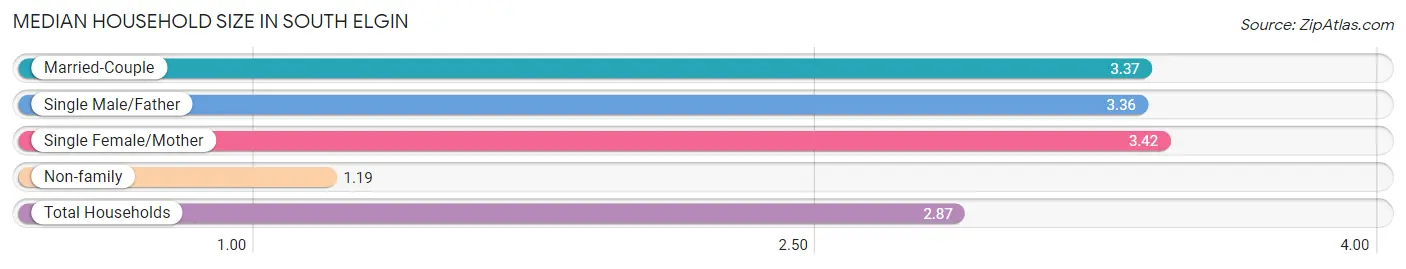
| Household Type | # Households | Household Size |
| Married-Couple | 5,130 (62.4%) | 3.37 |
| Single Male/Father | 373 (4.5%) | 3.36 |
| Single Female/Mother | 804 (9.8%) | 3.42 |
| Non-family | 1,918 (23.3%) | 1.19 |
| Total Households | 8,225 (100.0%) | 2.87 |
Household Size by Marriage Status in South Elgin
Out of a total of 8,225 households in South Elgin, 6,307 (76.7%) are family households, while 1,918 (23.3%) are nonfamily households. The most numerous type of family households are 2-person households, comprising 2,163, and the most common type of nonfamily households are 1-person households, comprising 1,614.
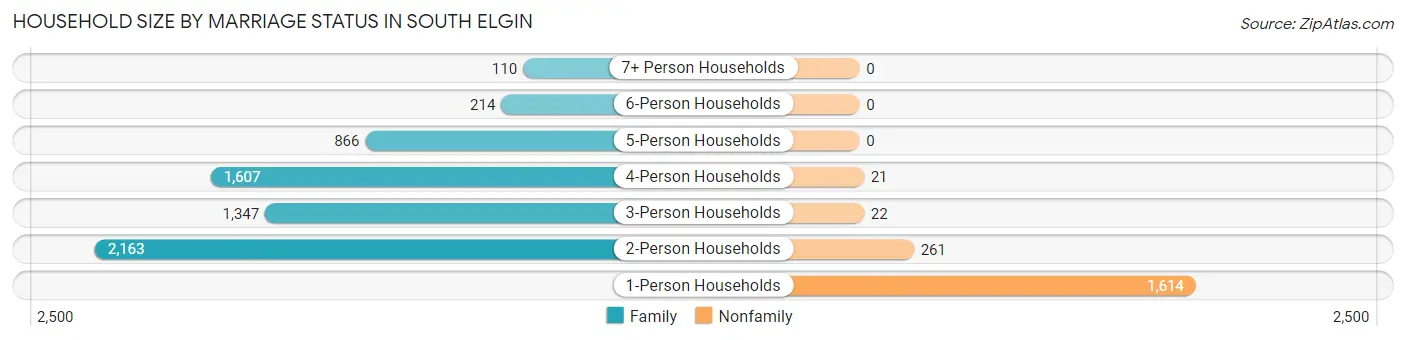
| Household Size | Family Households | Nonfamily Households |
| 1-Person Households | - | 1,614 (19.6%) |
| 2-Person Households | 2,163 (26.3%) | 261 (3.2%) |
| 3-Person Households | 1,347 (16.4%) | 22 (0.3%) |
| 4-Person Households | 1,607 (19.5%) | 21 (0.3%) |
| 5-Person Households | 866 (10.5%) | 0 (0.0%) |
| 6-Person Households | 214 (2.6%) | 0 (0.0%) |
| 7+ Person Households | 110 (1.3%) | 0 (0.0%) |
| Total | 6,307 (76.7%) | 1,918 (23.3%) |
Female Fertility in South Elgin
Fertility by Age in South Elgin
Average fertility rate in South Elgin is 50.0 births per 1,000 women. Women in the age bracket of 20 to 34 years have the highest fertility rate with 106.0 births per 1,000 women. Women in the age bracket of 20 to 34 years acount for 57.1% of all women with births.
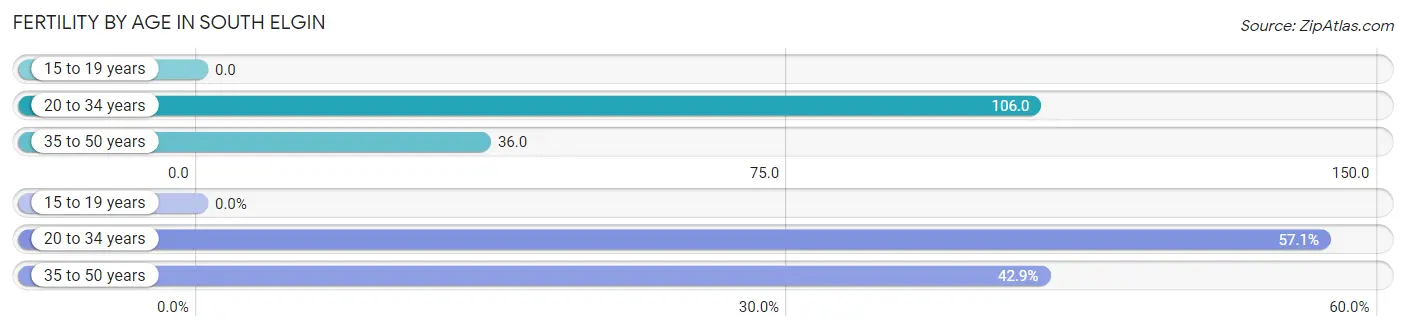
| Age Bracket | Women with Births | Births / 1,000 Women |
| 15 to 19 years | 0 (0.0%) | 0.0 |
| 20 to 34 years | 164 (57.1%) | 106.0 |
| 35 to 50 years | 123 (42.9%) | 36.0 |
| Total | 287 (100.0%) | 50.0 |
Fertility by Age by Marriage Status in South Elgin
72.1% of women with births (287) in South Elgin are married. The highest percentage of unmarried women with births falls into 20 to 34 years age bracket with 40.2% of them unmarried at the time of birth, while the lowest percentage of unmarried women with births belong to 35 to 50 years age bracket with 11.4% of them unmarried.
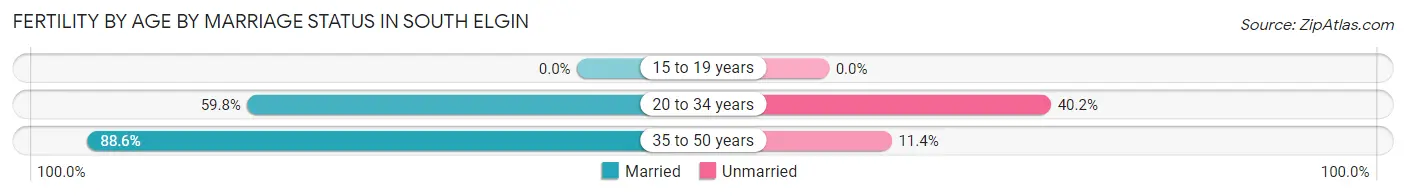
| Age Bracket | Married | Unmarried |
| 15 to 19 years | 0 (0.0%) | 0 (0.0%) |
| 20 to 34 years | 98 (59.8%) | 66 (40.2%) |
| 35 to 50 years | 109 (88.6%) | 14 (11.4%) |
| Total | 207 (72.1%) | 80 (27.9%) |
Fertility by Education in South Elgin
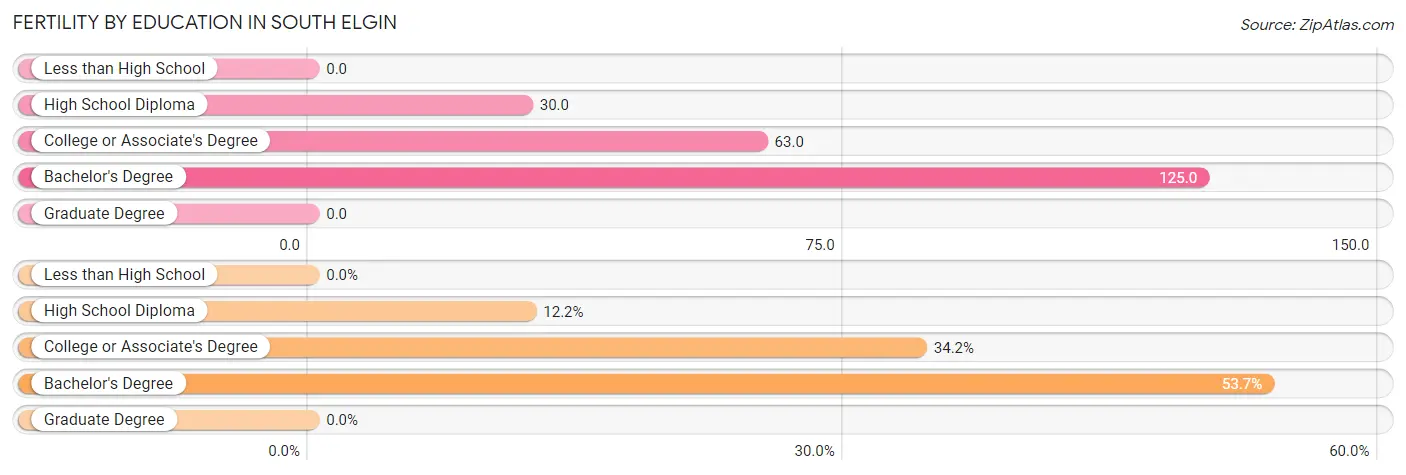
| Educational Attainment | Women with Births | Births / 1,000 Women |
| Less than High School | 0 (0.0%) | 0.0 |
| High School Diploma | 35 (12.2%) | 30.0 |
| College or Associate's Degree | 98 (34.2%) | 63.0 |
| Bachelor's Degree | 154 (53.7%) | 125.0 |
| Graduate Degree | 0 (0.0%) | 0.0 |
| Total | 287 (100.0%) | 50.0 |
Fertility by Education by Marriage Status in South Elgin
27.9% of women with births in South Elgin are unmarried. Women with the educational attainment of high school diploma are most likely to be married with 100.0% of them married at childbirth, while women with the educational attainment of college or associate's degree are least likely to be married with 40.8% of them unmarried at childbirth.
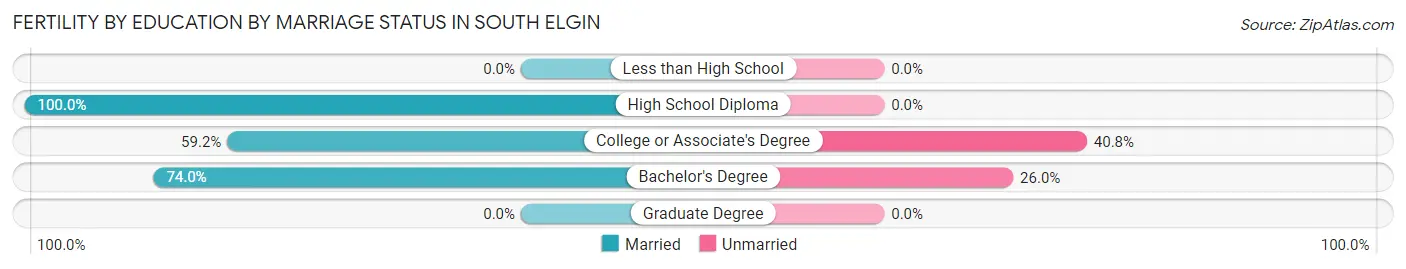
| Educational Attainment | Married | Unmarried |
| Less than High School | 0 (0.0%) | 0 (0.0%) |
| High School Diploma | 35 (100.0%) | 0 (0.0%) |
| College or Associate's Degree | 58 (59.2%) | 40 (40.8%) |
| Bachelor's Degree | 114 (74.0%) | 40 (26.0%) |
| Graduate Degree | 0 (0.0%) | 0 (0.0%) |
| Total | 207 (72.1%) | 80 (27.9%) |
Employment Characteristics in South Elgin
Employment by Class of Employer in South Elgin
Among the 13,224 employed individuals in South Elgin, private company employees (9,321 | 70.5%), local government employees (906 | 6.9%), and not-for-profit organizations (876 | 6.6%) make up the most common classes of employment.
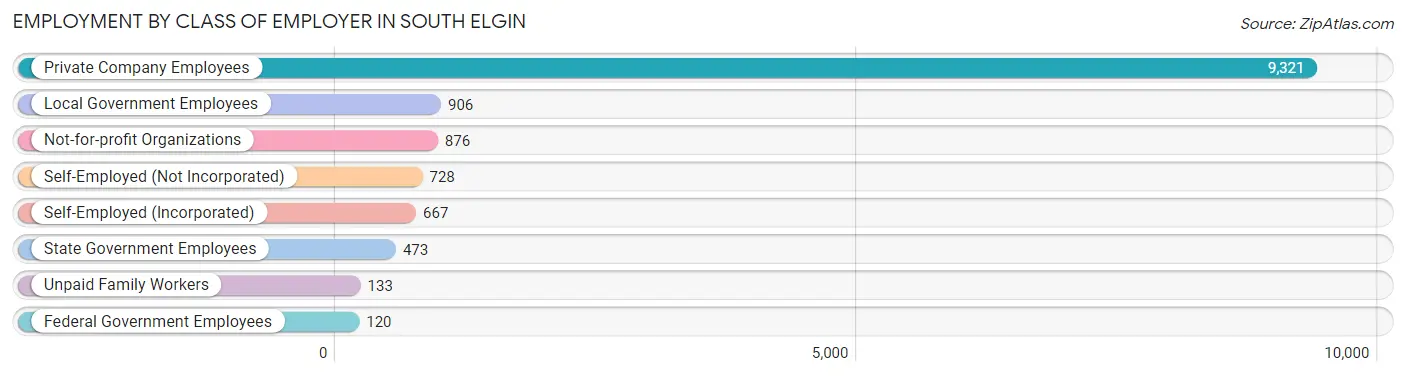
| Employer Class | # Employees | % Employees |
| Private Company Employees | 9,321 | 70.5% |
| Self-Employed (Incorporated) | 667 | 5.0% |
| Self-Employed (Not Incorporated) | 728 | 5.5% |
| Not-for-profit Organizations | 876 | 6.6% |
| Local Government Employees | 906 | 6.9% |
| State Government Employees | 473 | 3.6% |
| Federal Government Employees | 120 | 0.9% |
| Unpaid Family Workers | 133 | 1.0% |
| Total | 13,224 | 100.0% |
Employment Status by Age in South Elgin
According to the labor force statistics for South Elgin, out of the total population over 16 years of age (19,085), 73.3% or 13,989 individuals are in the labor force, with 3.4% or 476 of them unemployed. The age group with the highest labor force participation rate is 25 to 29 years, with 95.9% or 998 individuals in the labor force. Within the labor force, the 16 to 19 years age range has the highest percentage of unemployed individuals, with 14.6% or 145 of them being unemployed.
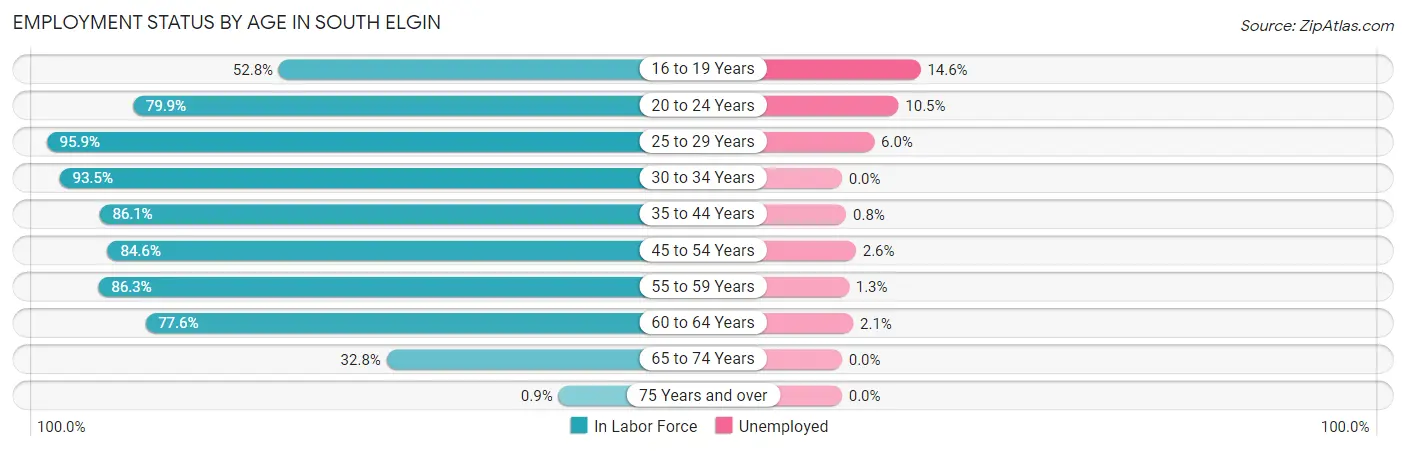
| Age Bracket | In Labor Force | Unemployed |
| 16 to 19 Years | 991 (52.8%) | 145 (14.6%) |
| 20 to 24 Years | 1,072 (79.9%) | 113 (10.5%) |
| 25 to 29 Years | 998 (95.9%) | 60 (6.0%) |
| 30 to 34 Years | 980 (93.5%) | 0 (0.0%) |
| 35 to 44 Years | 3,453 (86.1%) | 28 (0.8%) |
| 45 to 54 Years | 3,638 (84.6%) | 95 (2.6%) |
| 55 to 59 Years | 1,413 (86.3%) | 18 (1.3%) |
| 60 to 64 Years | 892 (77.6%) | 19 (2.1%) |
| 65 to 74 Years | 535 (32.8%) | 0 (0.0%) |
| 75 Years and over | 9 (0.9%) | 0 (0.0%) |
| Total | 13,989 (73.3%) | 476 (3.4%) |
Employment Status by Educational Attainment in South Elgin
According to labor force statistics for South Elgin, 86.3% of individuals (11,379) out of the total population between 25 and 64 years of age (13,185) are in the labor force, with 1.9% or 216 of them being unemployed. The group with the highest labor force participation rate are those with the educational attainment of college / associate degree, with 87.7% or 3,303 individuals in the labor force. Within the labor force, individuals with less than high school education have the highest percentage of unemployment, with 4.0% or 38 of them being unemployed.
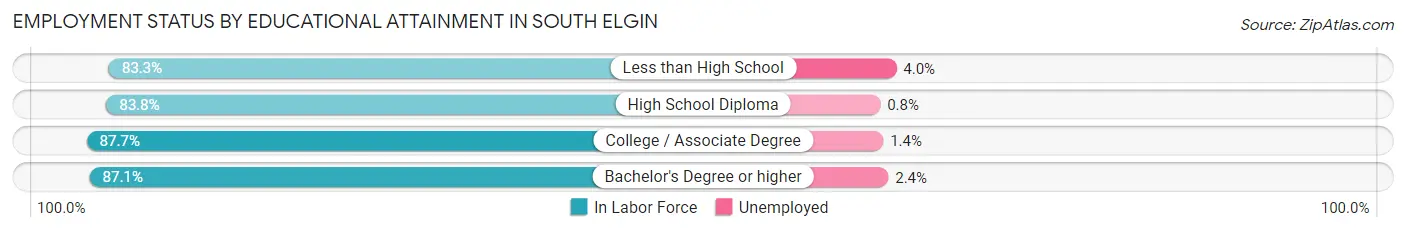
| Educational Attainment | In Labor Force | Unemployed |
| Less than High School | 947 (83.3%) | 45 (4.0%) |
| High School Diploma | 2,291 (83.8%) | 22 (0.8%) |
| College / Associate Degree | 3,303 (87.7%) | 53 (1.4%) |
| Bachelor's Degree or higher | 4,832 (87.1%) | 133 (2.4%) |
| Total | 11,379 (86.3%) | 251 (1.9%) |
Employment Occupations by Sex in South Elgin
Management, Business, Science and Arts Occupations
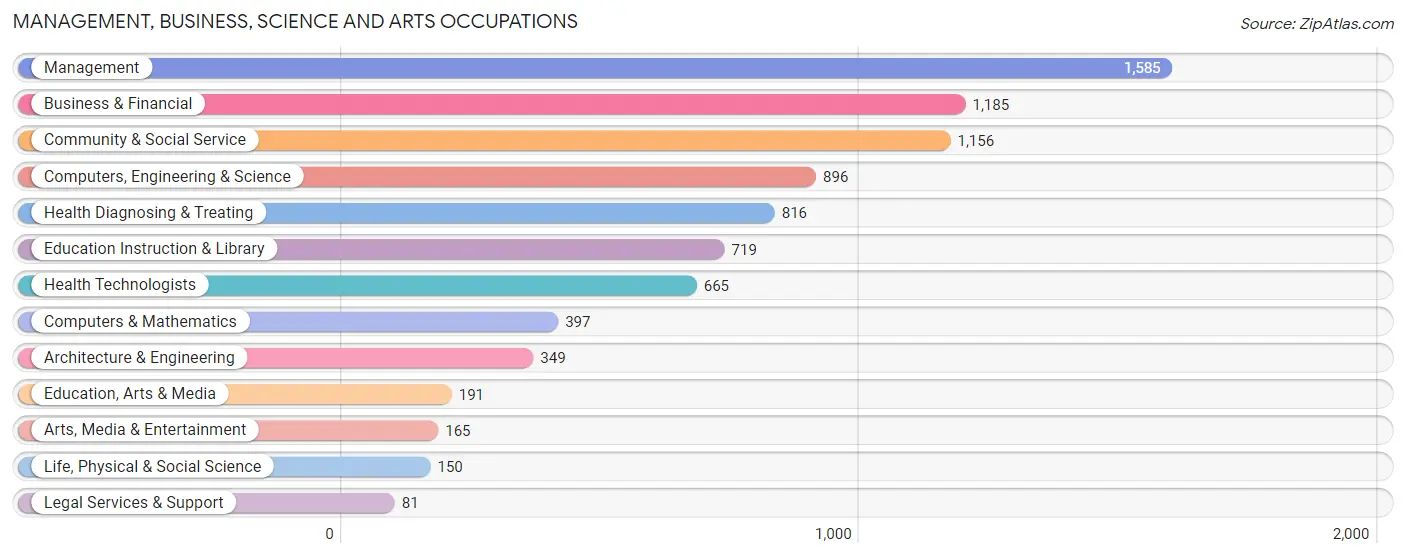
The most common Management, Business, Science and Arts occupations in South Elgin are Management (1,585 | 11.7%), Business & Financial (1,185 | 8.8%), Community & Social Service (1,156 | 8.6%), Computers, Engineering & Science (896 | 6.6%), and Health Diagnosing & Treating (816 | 6.0%).
Management, Business, Science and Arts Occupations by Sex
Within the Management, Business, Science and Arts occupations in South Elgin, the most male-oriented occupations are Computers & Mathematics (85.1%), Management (80.2%), and Computers, Engineering & Science (75.6%), while the most female-oriented occupations are Education Instruction & Library (84.6%), Health Diagnosing & Treating (78.9%), and Community & Social Service (78.5%).
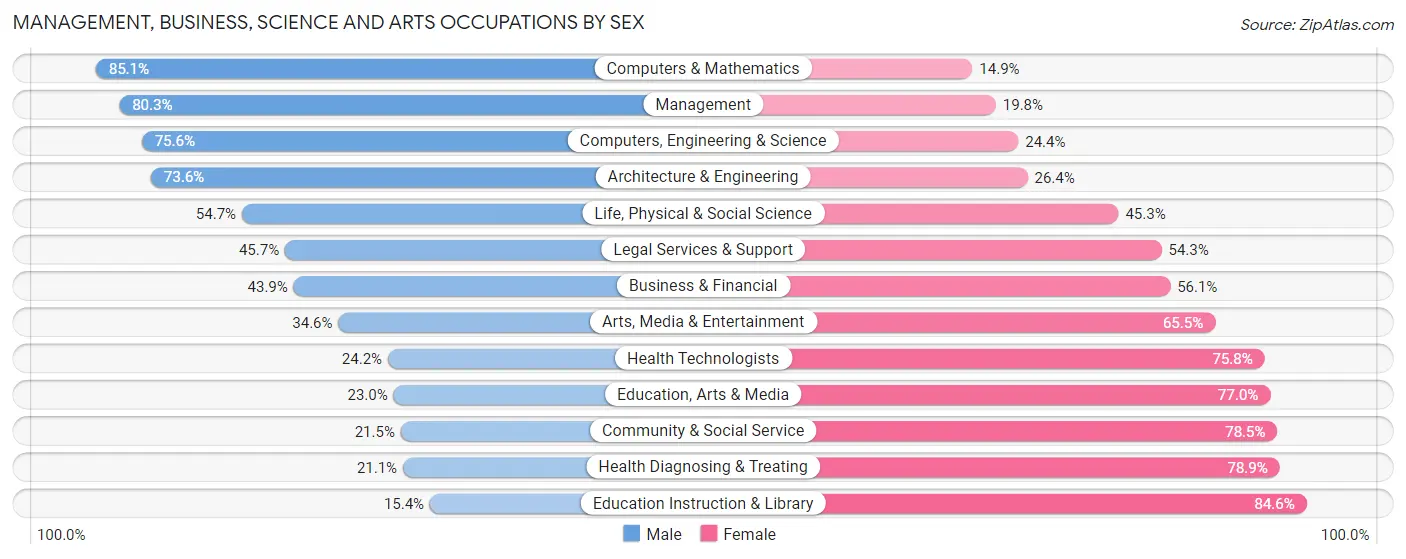
| Occupation | Male | Female |
| Management | 1,272 (80.2%) | 313 (19.8%) |
| Business & Financial | 520 (43.9%) | 665 (56.1%) |
| Computers, Engineering & Science | 677 (75.6%) | 219 (24.4%) |
| Computers & Mathematics | 338 (85.1%) | 59 (14.9%) |
| Architecture & Engineering | 257 (73.6%) | 92 (26.4%) |
| Life, Physical & Social Science | 82 (54.7%) | 68 (45.3%) |
| Community & Social Service | 249 (21.5%) | 907 (78.5%) |
| Education, Arts & Media | 44 (23.0%) | 147 (77.0%) |
| Legal Services & Support | 37 (45.7%) | 44 (54.3%) |
| Education Instruction & Library | 111 (15.4%) | 608 (84.6%) |
| Arts, Media & Entertainment | 57 (34.5%) | 108 (65.4%) |
| Health Diagnosing & Treating | 172 (21.1%) | 644 (78.9%) |
| Health Technologists | 161 (24.2%) | 504 (75.8%) |
| Total (Category) | 2,890 (51.3%) | 2,748 (48.7%) |
| Total (Overall) | 7,264 (53.8%) | 6,238 (46.2%) |
Services Occupations
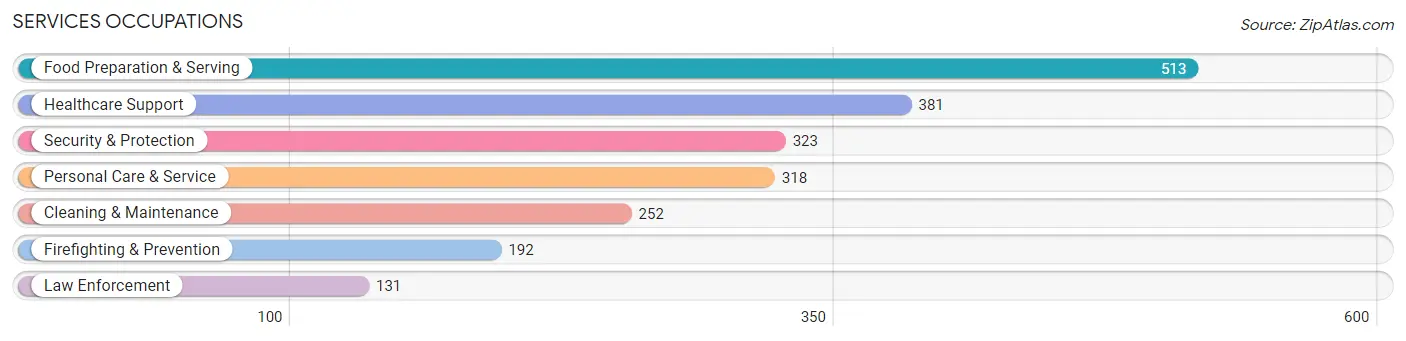
The most common Services occupations in South Elgin are Food Preparation & Serving (513 | 3.8%), Healthcare Support (381 | 2.8%), Security & Protection (323 | 2.4%), Personal Care & Service (318 | 2.4%), and Cleaning & Maintenance (252 | 1.9%).
Services Occupations by Sex
Within the Services occupations in South Elgin, the most male-oriented occupations are Firefighting & Prevention (88.5%), Security & Protection (79.9%), and Law Enforcement (67.2%), while the most female-oriented occupations are Healthcare Support (85.6%), Personal Care & Service (85.5%), and Food Preparation & Serving (55.6%).
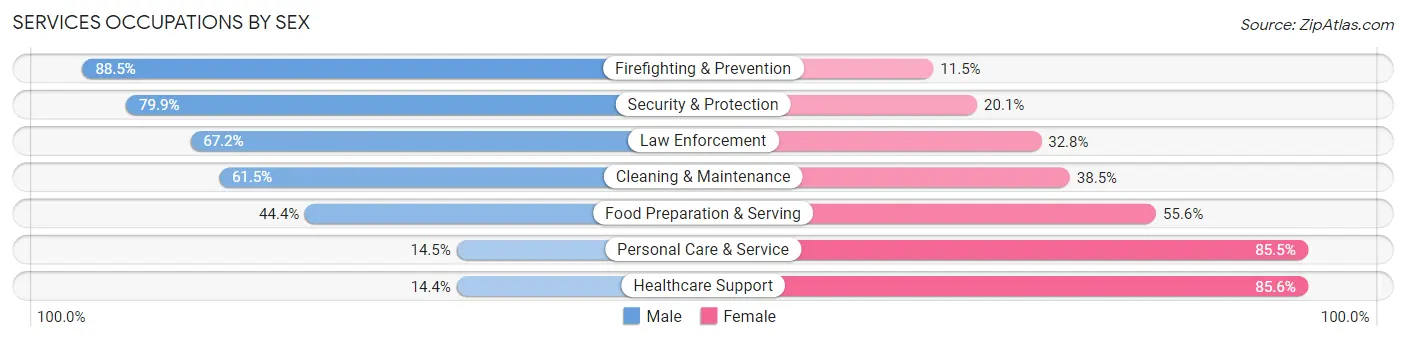
| Occupation | Male | Female |
| Healthcare Support | 55 (14.4%) | 326 (85.6%) |
| Security & Protection | 258 (79.9%) | 65 (20.1%) |
| Firefighting & Prevention | 170 (88.5%) | 22 (11.5%) |
| Law Enforcement | 88 (67.2%) | 43 (32.8%) |
| Food Preparation & Serving | 228 (44.4%) | 285 (55.6%) |
| Cleaning & Maintenance | 155 (61.5%) | 97 (38.5%) |
| Personal Care & Service | 46 (14.5%) | 272 (85.5%) |
| Total (Category) | 742 (41.5%) | 1,045 (58.5%) |
| Total (Overall) | 7,264 (53.8%) | 6,238 (46.2%) |
Sales and Office Occupations
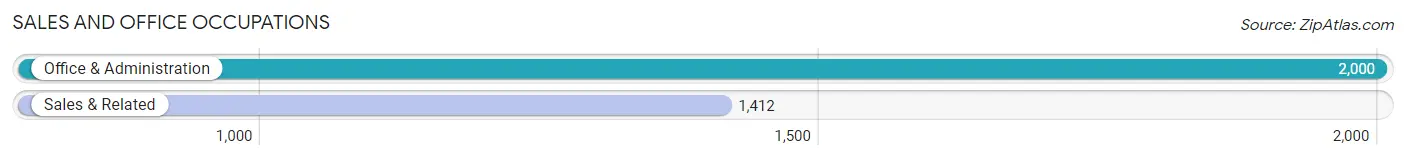
The most common Sales and Office occupations in South Elgin are Office & Administration (2,000 | 14.8%), and Sales & Related (1,412 | 10.5%).
Sales and Office Occupations by Sex
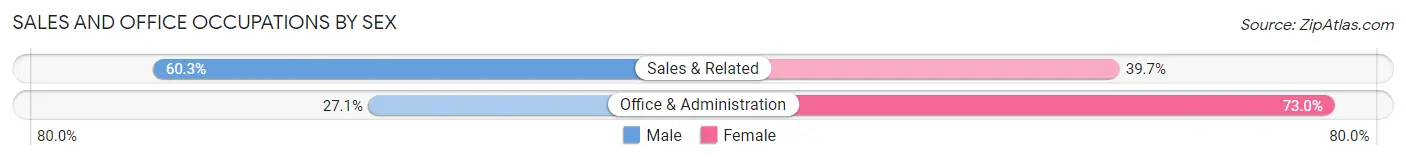
| Occupation | Male | Female |
| Sales & Related | 851 (60.3%) | 561 (39.7%) |
| Office & Administration | 541 (27.1%) | 1,459 (73.0%) |
| Total (Category) | 1,392 (40.8%) | 2,020 (59.2%) |
| Total (Overall) | 7,264 (53.8%) | 6,238 (46.2%) |
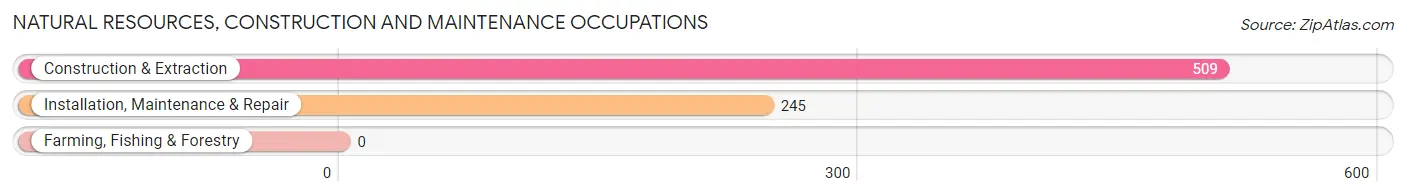
Natural Resources, Construction and Maintenance Occupations
The most common Natural Resources, Construction and Maintenance occupations in South Elgin are Construction & Extraction (509 | 3.8%), and Installation, Maintenance & Repair (245 | 1.8%).
Natural Resources, Construction and Maintenance Occupations by Sex
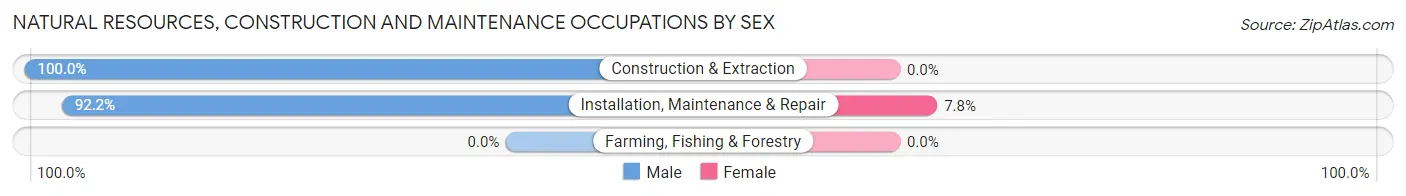
| Occupation | Male | Female |
| Farming, Fishing & Forestry | 0 (0.0%) | 0 (0.0%) |
| Construction & Extraction | 509 (100.0%) | 0 (0.0%) |
| Installation, Maintenance & Repair | 226 (92.2%) | 19 (7.8%) |
| Total (Category) | 735 (97.5%) | 19 (2.5%) |
| Total (Overall) | 7,264 (53.8%) | 6,238 (46.2%) |
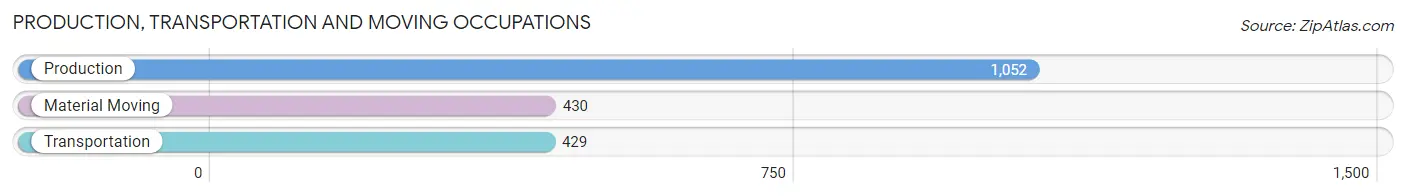
Production, Transportation and Moving Occupations
The most common Production, Transportation and Moving occupations in South Elgin are Production (1,052 | 7.8%), Material Moving (430 | 3.2%), and Transportation (429 | 3.2%).
Production, Transportation and Moving Occupations by Sex
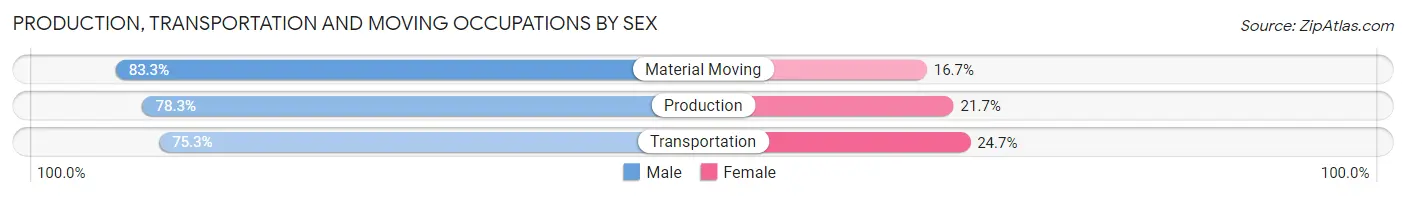
| Occupation | Male | Female |
| Production | 824 (78.3%) | 228 (21.7%) |
| Transportation | 323 (75.3%) | 106 (24.7%) |
| Material Moving | 358 (83.3%) | 72 (16.7%) |
| Total (Category) | 1,505 (78.7%) | 406 (21.2%) |
| Total (Overall) | 7,264 (53.8%) | 6,238 (46.2%) |
Employment Industries by Sex in South Elgin
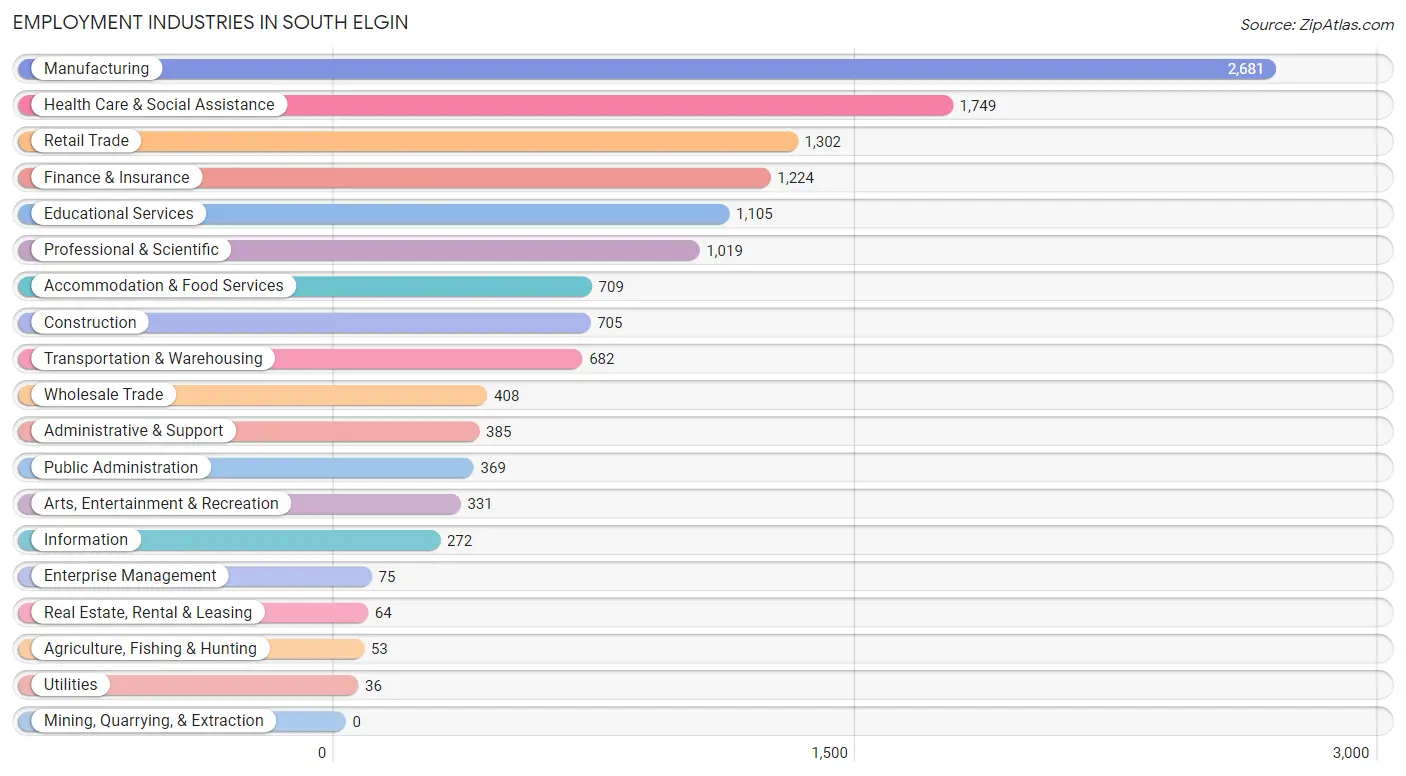
Employment Industries in South Elgin
The major employment industries in South Elgin include Manufacturing (2,681 | 19.9%), Health Care & Social Assistance (1,749 | 13.0%), Retail Trade (1,302 | 9.6%), Finance & Insurance (1,224 | 9.1%), and Educational Services (1,105 | 8.2%).
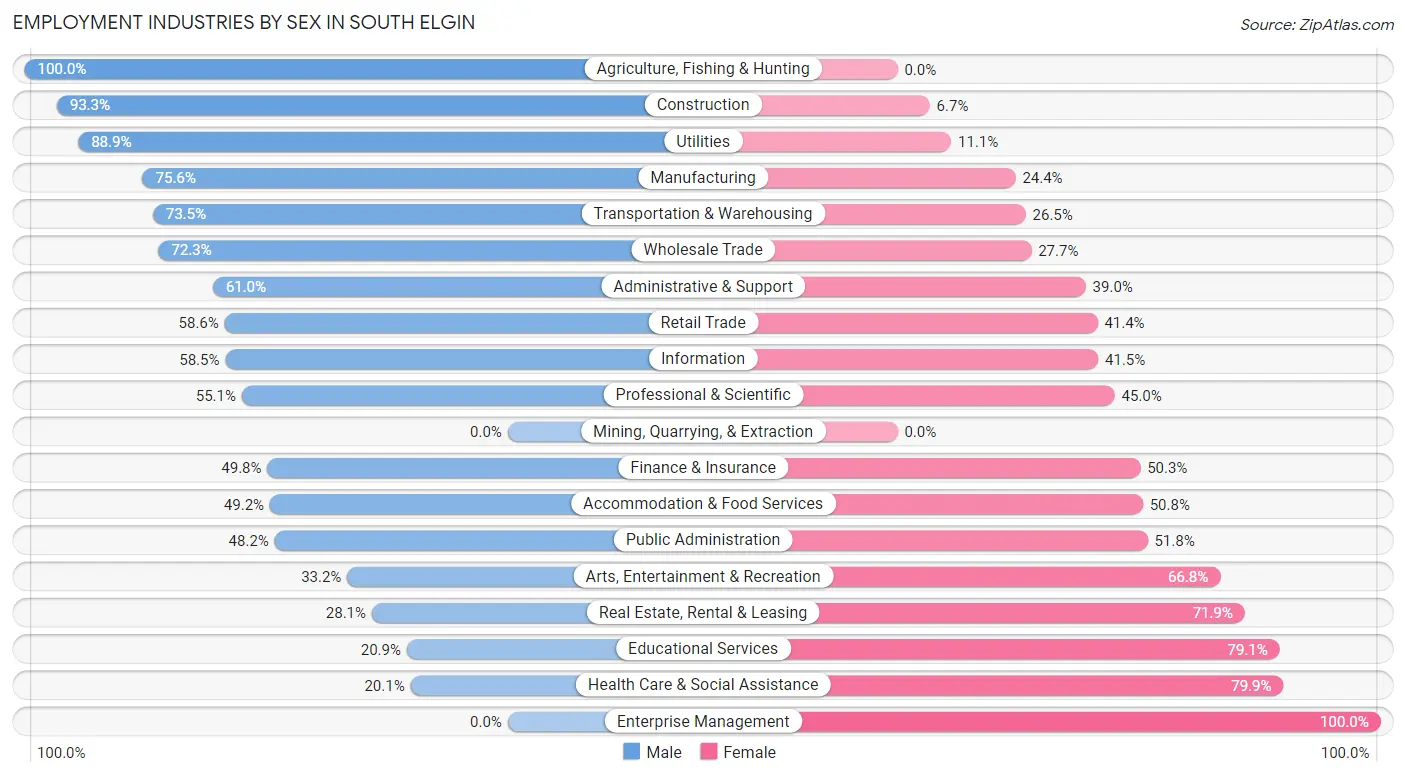
Employment Industries by Sex in South Elgin
The South Elgin industries that see more men than women are Agriculture, Fishing & Hunting (100.0%), Construction (93.3%), and Utilities (88.9%), whereas the industries that tend to have a higher number of women are Enterprise Management (100.0%), Health Care & Social Assistance (79.9%), and Educational Services (79.1%).
| Industry | Male | Female |
| Agriculture, Fishing & Hunting | 53 (100.0%) | 0 (0.0%) |
| Mining, Quarrying, & Extraction | 0 (0.0%) | 0 (0.0%) |
| Construction | 658 (93.3%) | 47 (6.7%) |
| Manufacturing | 2,026 (75.6%) | 655 (24.4%) |
| Wholesale Trade | 295 (72.3%) | 113 (27.7%) |
| Retail Trade | 763 (58.6%) | 539 (41.4%) |
| Transportation & Warehousing | 501 (73.5%) | 181 (26.5%) |
| Utilities | 32 (88.9%) | 4 (11.1%) |
| Information | 159 (58.5%) | 113 (41.5%) |
| Finance & Insurance | 609 (49.7%) | 615 (50.2%) |
| Real Estate, Rental & Leasing | 18 (28.1%) | 46 (71.9%) |
| Professional & Scientific | 561 (55.0%) | 458 (45.0%) |
| Enterprise Management | 0 (0.0%) | 75 (100.0%) |
| Administrative & Support | 235 (61.0%) | 150 (39.0%) |
| Educational Services | 231 (20.9%) | 874 (79.1%) |
| Health Care & Social Assistance | 352 (20.1%) | 1,397 (79.9%) |
| Arts, Entertainment & Recreation | 110 (33.2%) | 221 (66.8%) |
| Accommodation & Food Services | 349 (49.2%) | 360 (50.8%) |
| Public Administration | 178 (48.2%) | 191 (51.8%) |
| Total | 7,264 (53.8%) | 6,238 (46.2%) |
Education in South Elgin
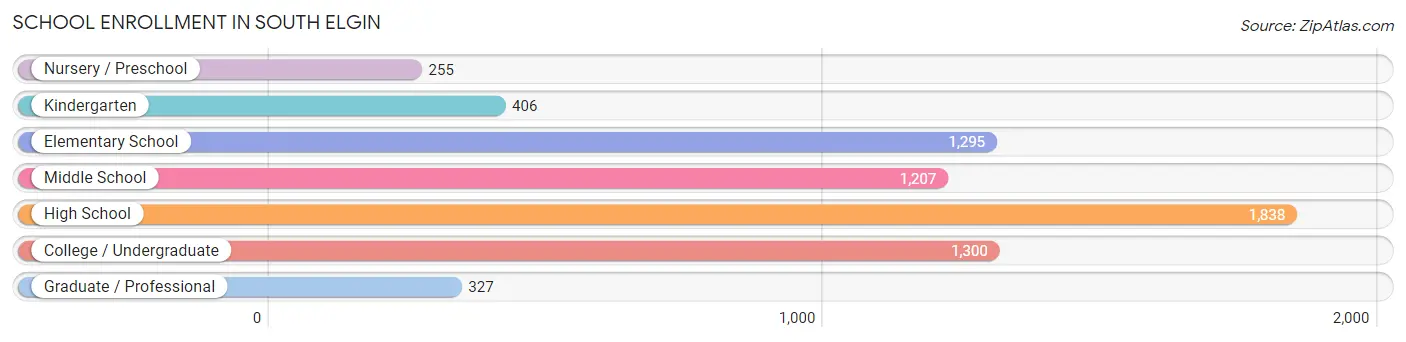
School Enrollment in South Elgin
The most common levels of schooling among the 6,628 students in South Elgin are high school (1,838 | 27.7%), college / undergraduate (1,300 | 19.6%), and elementary school (1,295 | 19.5%).
| School Level | # Students | % Students |
| Nursery / Preschool | 255 | 3.8% |
| Kindergarten | 406 | 6.1% |
| Elementary School | 1,295 | 19.5% |
| Middle School | 1,207 | 18.2% |
| High School | 1,838 | 27.7% |
| College / Undergraduate | 1,300 | 19.6% |
| Graduate / Professional | 327 | 4.9% |
| Total | 6,628 | 100.0% |
School Enrollment by Age by Funding Source in South Elgin
Out of a total of 6,628 students who are enrolled in schools in South Elgin, 809 (12.2%) attend a private institution, while the remaining 5,819 (87.8%) are enrolled in public schools. The age group of 3 to 4 year olds has the highest likelihood of being enrolled in private schools, with 101 (61.2% in the age bracket) enrolled. Conversely, the age group of 10 to 14 year olds has the lowest likelihood of being enrolled in a private school, with 1,545 (97.9% in the age bracket) attending a public institution.
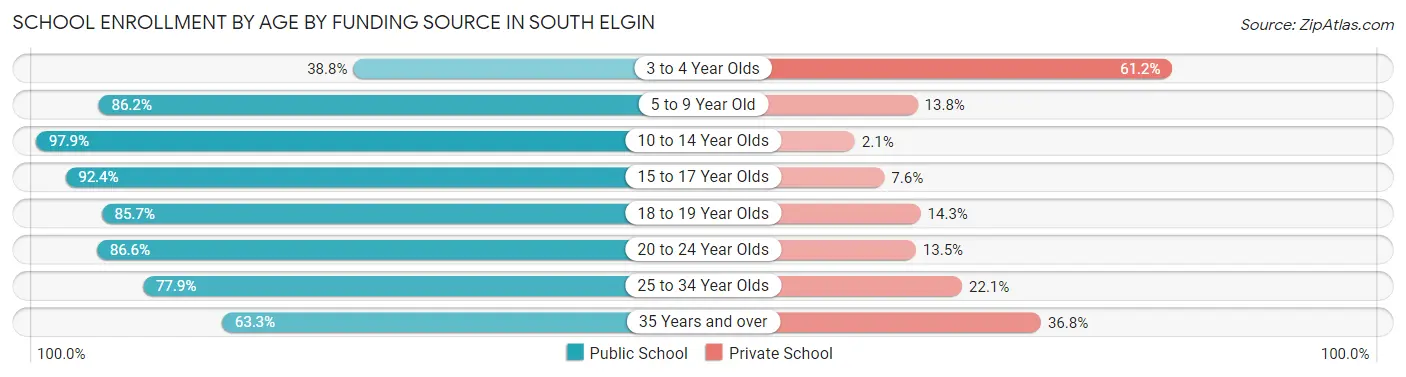
| Age Bracket | Public School | Private School |
| 3 to 4 Year Olds | 64 (38.8%) | 101 (61.2%) |
| 5 to 9 Year Old | 1,364 (86.2%) | 218 (13.8%) |
| 10 to 14 Year Olds | 1,545 (97.9%) | 33 (2.1%) |
| 15 to 17 Year Olds | 1,339 (92.4%) | 110 (7.6%) |
| 18 to 19 Year Olds | 496 (85.7%) | 83 (14.3%) |
| 20 to 24 Year Olds | 682 (86.6%) | 106 (13.5%) |
| 25 to 34 Year Olds | 106 (77.9%) | 30 (22.1%) |
| 35 Years and over | 222 (63.2%) | 129 (36.7%) |
| Total | 5,819 (87.8%) | 809 (12.2%) |
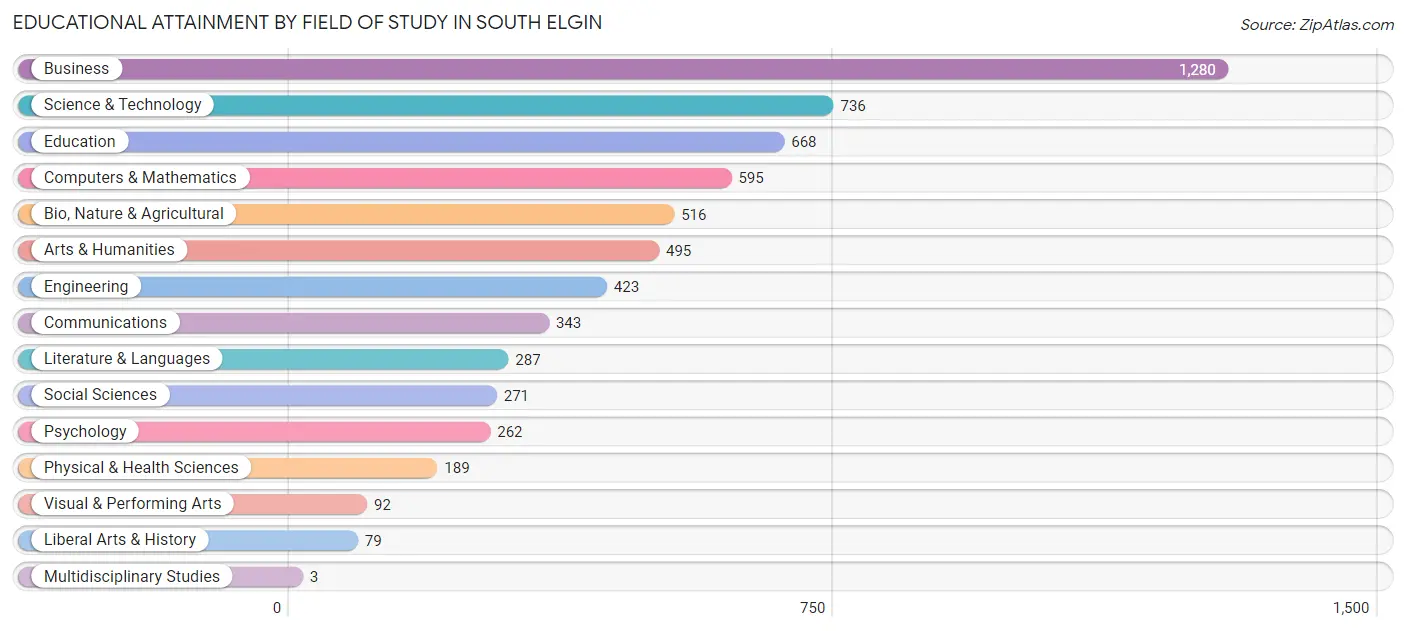
Educational Attainment by Field of Study in South Elgin
Business (1,280 | 20.5%), science & technology (736 | 11.8%), education (668 | 10.7%), computers & mathematics (595 | 9.5%), and bio, nature & agricultural (516 | 8.3%) are the most common fields of study among 6,239 individuals in South Elgin who have obtained a bachelor's degree or higher.
| Field of Study | # Graduates | % Graduates |
| Computers & Mathematics | 595 | 9.5% |
| Bio, Nature & Agricultural | 516 | 8.3% |
| Physical & Health Sciences | 189 | 3.0% |
| Psychology | 262 | 4.2% |
| Social Sciences | 271 | 4.3% |
| Engineering | 423 | 6.8% |
| Multidisciplinary Studies | 3 | 0.1% |
| Science & Technology | 736 | 11.8% |
| Business | 1,280 | 20.5% |
| Education | 668 | 10.7% |
| Literature & Languages | 287 | 4.6% |
| Liberal Arts & History | 79 | 1.3% |
| Visual & Performing Arts | 92 | 1.5% |
| Communications | 343 | 5.5% |
| Arts & Humanities | 495 | 7.9% |
| Total | 6,239 | 100.0% |
Transportation & Commute in South Elgin
Vehicle Availability by Sex in South Elgin
The most prevalent vehicle ownership categories in South Elgin are males with 2 vehicles (3,073, accounting for 42.9%) and females with 2 vehicles (2,773, making up 50.8%).
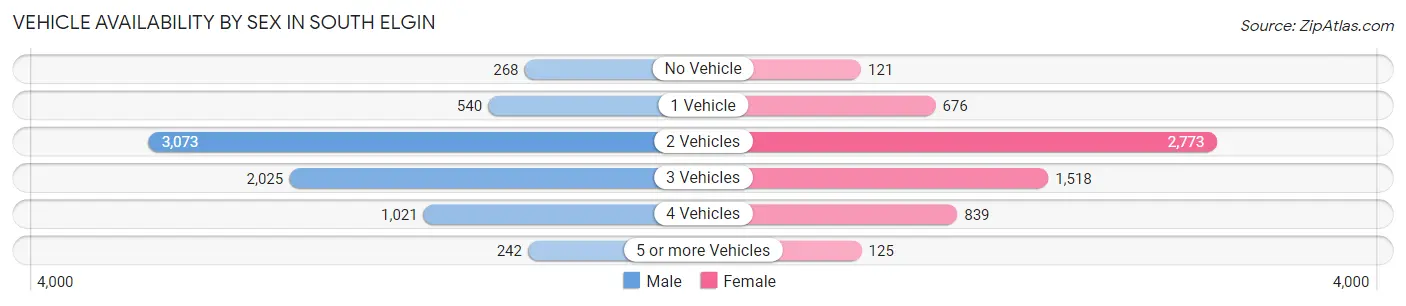
| Vehicles Available | Male | Female |
| No Vehicle | 268 (3.7%) | 121 (2.0%) |
| 1 Vehicle | 540 (7.5%) | 676 (11.2%) |
| 2 Vehicles | 3,073 (42.9%) | 2,773 (45.8%) |
| 3 Vehicles | 2,025 (28.2%) | 1,518 (25.1%) |
| 4 Vehicles | 1,021 (14.2%) | 839 (13.9%) |
| 5 or more Vehicles | 242 (3.4%) | 125 (2.1%) |
| Total | 7,169 (100.0%) | 6,052 (100.0%) |
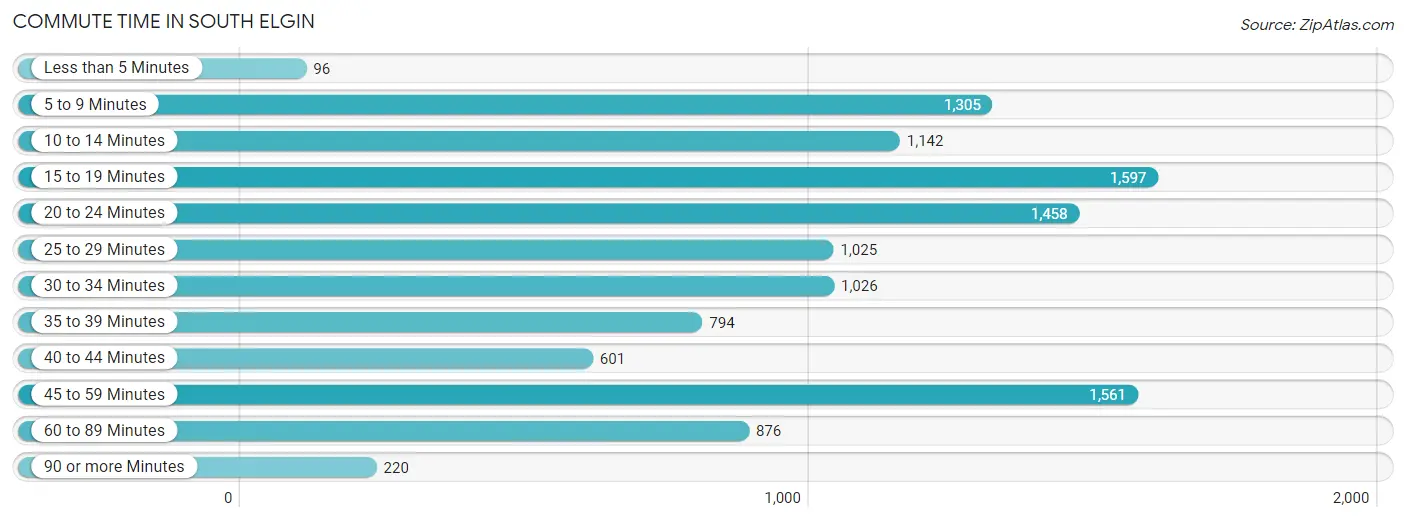
Commute Time in South Elgin
The most frequently occuring commute durations in South Elgin are 15 to 19 minutes (1,597 commuters, 13.7%), 45 to 59 minutes (1,561 commuters, 13.3%), and 20 to 24 minutes (1,458 commuters, 12.5%).
| Commute Time | # Commuters | % Commuters |
| Less than 5 Minutes | 96 | 0.8% |
| 5 to 9 Minutes | 1,305 | 11.2% |
| 10 to 14 Minutes | 1,142 | 9.8% |
| 15 to 19 Minutes | 1,597 | 13.7% |
| 20 to 24 Minutes | 1,458 | 12.5% |
| 25 to 29 Minutes | 1,025 | 8.8% |
| 30 to 34 Minutes | 1,026 | 8.8% |
| 35 to 39 Minutes | 794 | 6.8% |
| 40 to 44 Minutes | 601 | 5.1% |
| 45 to 59 Minutes | 1,561 | 13.3% |
| 60 to 89 Minutes | 876 | 7.5% |
| 90 or more Minutes | 220 | 1.9% |
Commute Time by Sex in South Elgin
The most common commute times in South Elgin are 45 to 59 minutes (1,128 commuters, 17.4%) for males and 15 to 19 minutes (852 commuters, 16.4%) for females.
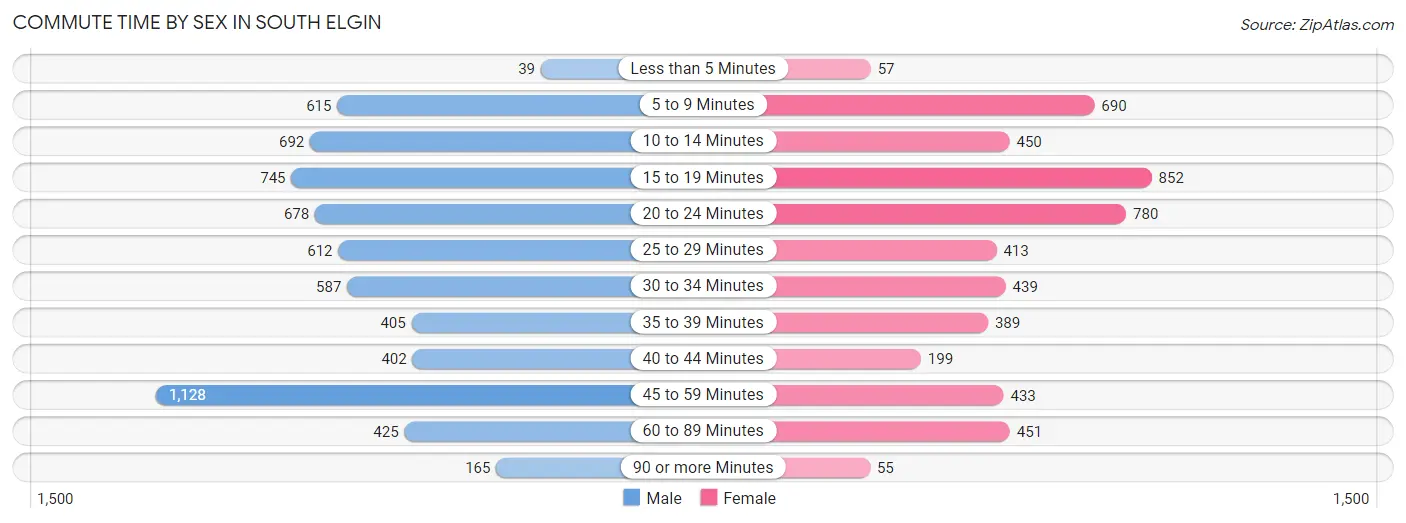
| Commute Time | Male | Female |
| Less than 5 Minutes | 39 (0.6%) | 57 (1.1%) |
| 5 to 9 Minutes | 615 (9.5%) | 690 (13.3%) |
| 10 to 14 Minutes | 692 (10.7%) | 450 (8.6%) |
| 15 to 19 Minutes | 745 (11.5%) | 852 (16.4%) |
| 20 to 24 Minutes | 678 (10.4%) | 780 (15.0%) |
| 25 to 29 Minutes | 612 (9.4%) | 413 (7.9%) |
| 30 to 34 Minutes | 587 (9.0%) | 439 (8.4%) |
| 35 to 39 Minutes | 405 (6.2%) | 389 (7.5%) |
| 40 to 44 Minutes | 402 (6.2%) | 199 (3.8%) |
| 45 to 59 Minutes | 1,128 (17.4%) | 433 (8.3%) |
| 60 to 89 Minutes | 425 (6.6%) | 451 (8.7%) |
| 90 or more Minutes | 165 (2.5%) | 55 (1.1%) |
Time of Departure to Work by Sex in South Elgin
The most frequent times of departure to work in South Elgin are 6:00 AM to 6:29 AM (893, 13.8%) for males and 7:00 AM to 7:29 AM (930, 17.9%) for females.
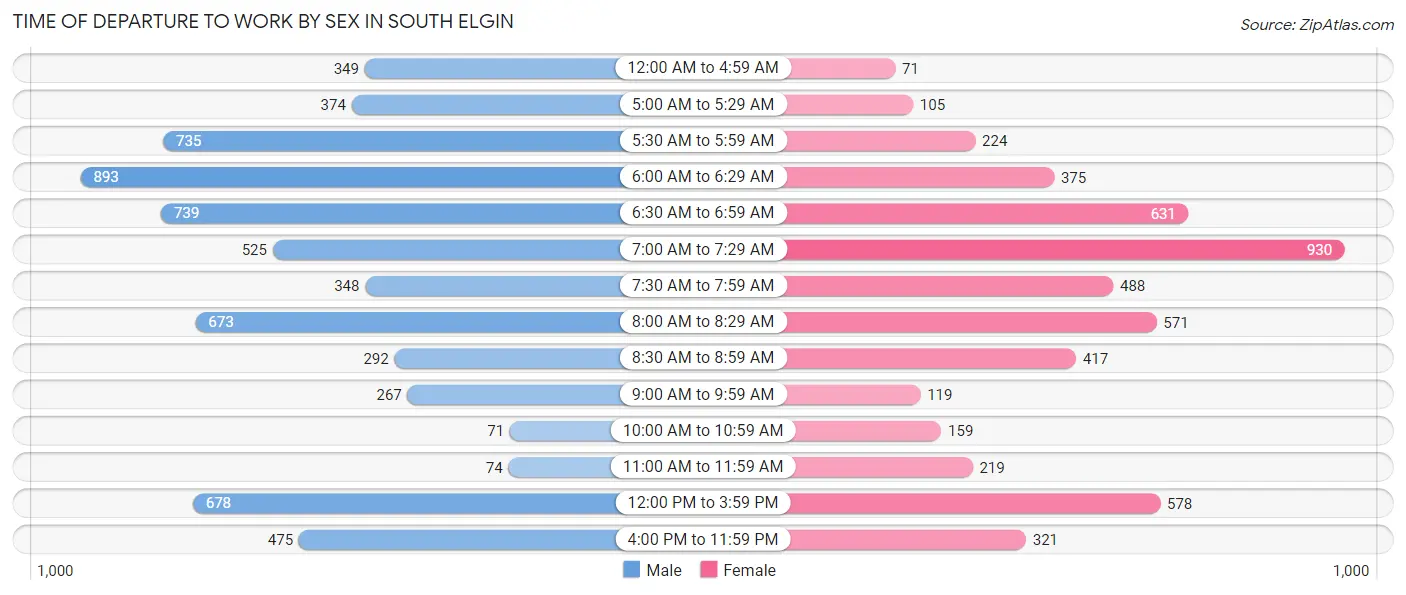
| Time of Departure | Male | Female |
| 12:00 AM to 4:59 AM | 349 (5.4%) | 71 (1.4%) |
| 5:00 AM to 5:29 AM | 374 (5.8%) | 105 (2.0%) |
| 5:30 AM to 5:59 AM | 735 (11.3%) | 224 (4.3%) |
| 6:00 AM to 6:29 AM | 893 (13.8%) | 375 (7.2%) |
| 6:30 AM to 6:59 AM | 739 (11.4%) | 631 (12.1%) |
| 7:00 AM to 7:29 AM | 525 (8.1%) | 930 (17.9%) |
| 7:30 AM to 7:59 AM | 348 (5.4%) | 488 (9.4%) |
| 8:00 AM to 8:29 AM | 673 (10.4%) | 571 (11.0%) |
| 8:30 AM to 8:59 AM | 292 (4.5%) | 417 (8.0%) |
| 9:00 AM to 9:59 AM | 267 (4.1%) | 119 (2.3%) |
| 10:00 AM to 10:59 AM | 71 (1.1%) | 159 (3.0%) |
| 11:00 AM to 11:59 AM | 74 (1.1%) | 219 (4.2%) |
| 12:00 PM to 3:59 PM | 678 (10.4%) | 578 (11.1%) |
| 4:00 PM to 11:59 PM | 475 (7.3%) | 321 (6.2%) |
| Total | 6,493 (100.0%) | 5,208 (100.0%) |
Housing Occupancy in South Elgin
Occupancy by Ownership in South Elgin
Of the total 8,225 dwellings in South Elgin, owner-occupied units account for 6,626 (80.6%), while renter-occupied units make up 1,599 (19.4%).
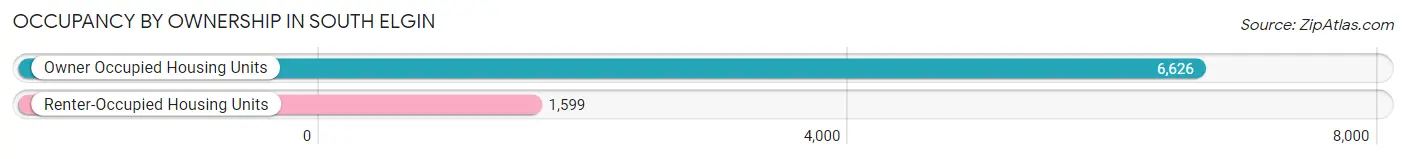
| Occupancy | # Housing Units | % Housing Units |
| Owner Occupied Housing Units | 6,626 | 80.6% |
| Renter-Occupied Housing Units | 1,599 | 19.4% |
| Total Occupied Housing Units | 8,225 | 100.0% |
Occupancy by Household Size in South Elgin
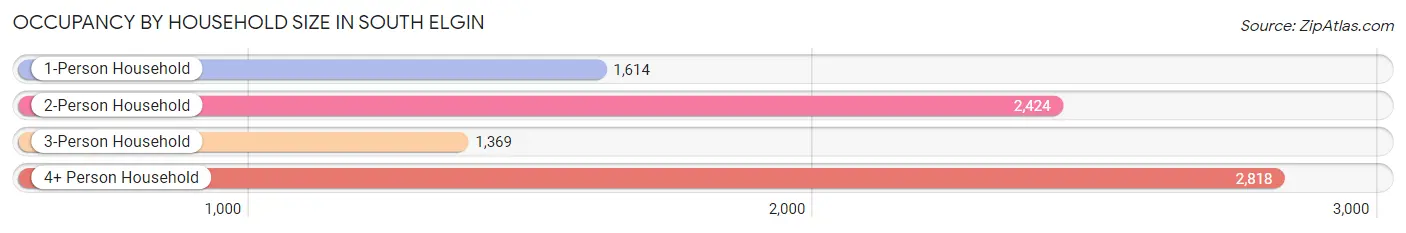
| Household Size | # Housing Units | % Housing Units |
| 1-Person Household | 1,614 | 19.6% |
| 2-Person Household | 2,424 | 29.5% |
| 3-Person Household | 1,369 | 16.6% |
| 4+ Person Household | 2,818 | 34.3% |
| Total Housing Units | 8,225 | 100.0% |
Occupancy by Ownership by Household Size in South Elgin
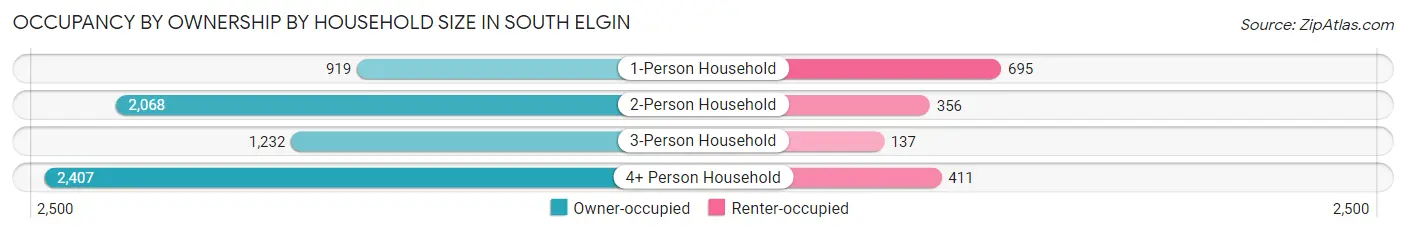
| Household Size | Owner-occupied | Renter-occupied |
| 1-Person Household | 919 (56.9%) | 695 (43.1%) |
| 2-Person Household | 2,068 (85.3%) | 356 (14.7%) |
| 3-Person Household | 1,232 (90.0%) | 137 (10.0%) |
| 4+ Person Household | 2,407 (85.4%) | 411 (14.6%) |
| Total Housing Units | 6,626 (80.6%) | 1,599 (19.4%) |
Occupancy by Educational Attainment in South Elgin
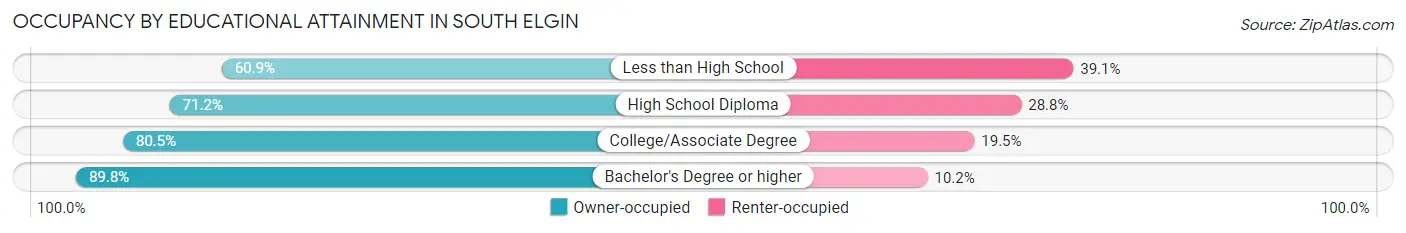
| Household Size | Owner-occupied | Renter-occupied |
| Less than High School | 410 (60.9%) | 263 (39.1%) |
| High School Diploma | 1,250 (71.2%) | 505 (28.8%) |
| College/Associate Degree | 2,084 (80.5%) | 504 (19.5%) |
| Bachelor's Degree or higher | 2,882 (89.8%) | 327 (10.2%) |
Occupancy by Age of Householder in South Elgin
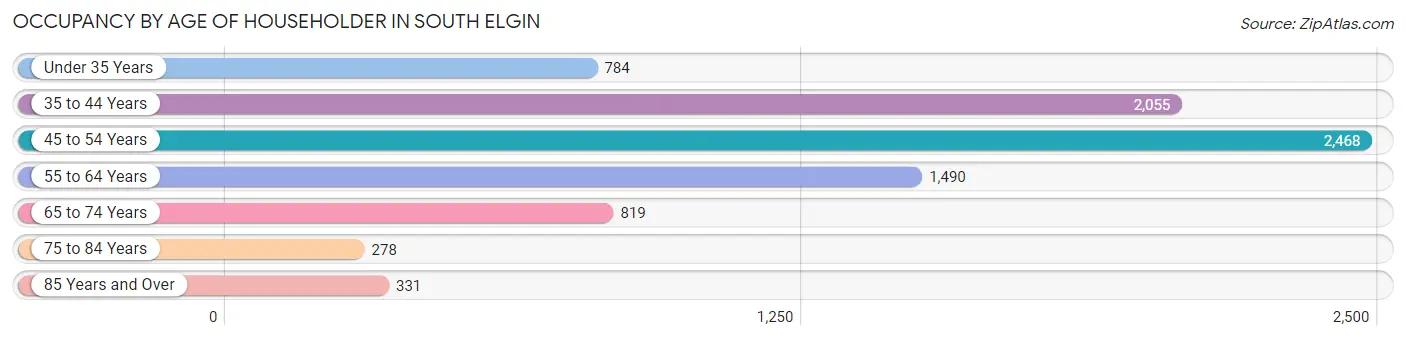
| Age Bracket | # Households | % Households |
| Under 35 Years | 784 | 9.5% |
| 35 to 44 Years | 2,055 | 25.0% |
| 45 to 54 Years | 2,468 | 30.0% |
| 55 to 64 Years | 1,490 | 18.1% |
| 65 to 74 Years | 819 | 10.0% |
| 75 to 84 Years | 278 | 3.4% |
| 85 Years and Over | 331 | 4.0% |
| Total | 8,225 | 100.0% |
Housing Finances in South Elgin
Median Income by Occupancy in South Elgin
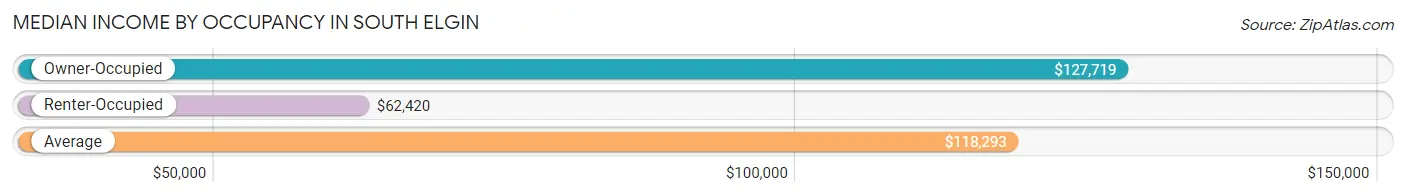
| Occupancy Type | # Households | Median Income |
| Owner-Occupied | 6,626 (80.6%) | $127,719 |
| Renter-Occupied | 1,599 (19.4%) | $62,420 |
| Average | 8,225 (100.0%) | $118,293 |
Occupancy by Householder Income Bracket in South Elgin
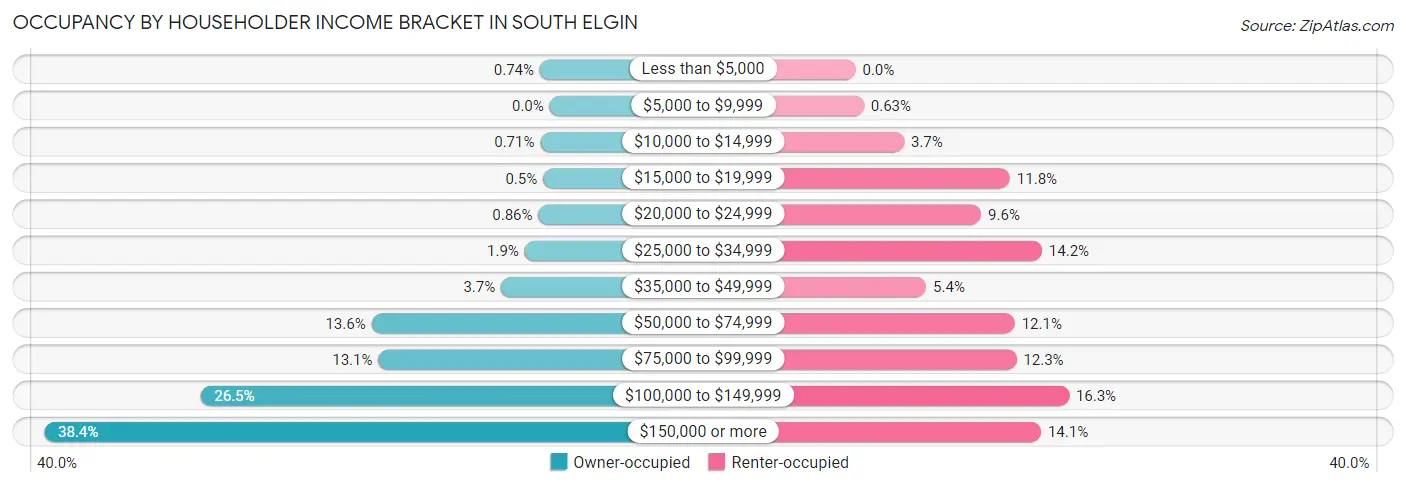
| Income Bracket | Owner-occupied | Renter-occupied |
| Less than $5,000 | 49 (0.7%) | 0 (0.0%) |
| $5,000 to $9,999 | 0 (0.0%) | 10 (0.6%) |
| $10,000 to $14,999 | 47 (0.7%) | 59 (3.7%) |
| $15,000 to $19,999 | 33 (0.5%) | 188 (11.8%) |
| $20,000 to $24,999 | 57 (0.9%) | 153 (9.6%) |
| $25,000 to $34,999 | 126 (1.9%) | 227 (14.2%) |
| $35,000 to $49,999 | 245 (3.7%) | 86 (5.4%) |
| $50,000 to $74,999 | 899 (13.6%) | 194 (12.1%) |
| $75,000 to $99,999 | 865 (13.1%) | 196 (12.3%) |
| $100,000 to $149,999 | 1,758 (26.5%) | 260 (16.3%) |
| $150,000 or more | 2,547 (38.4%) | 226 (14.1%) |
| Total | 6,626 (100.0%) | 1,599 (100.0%) |
Monthly Housing Cost Tiers in South Elgin
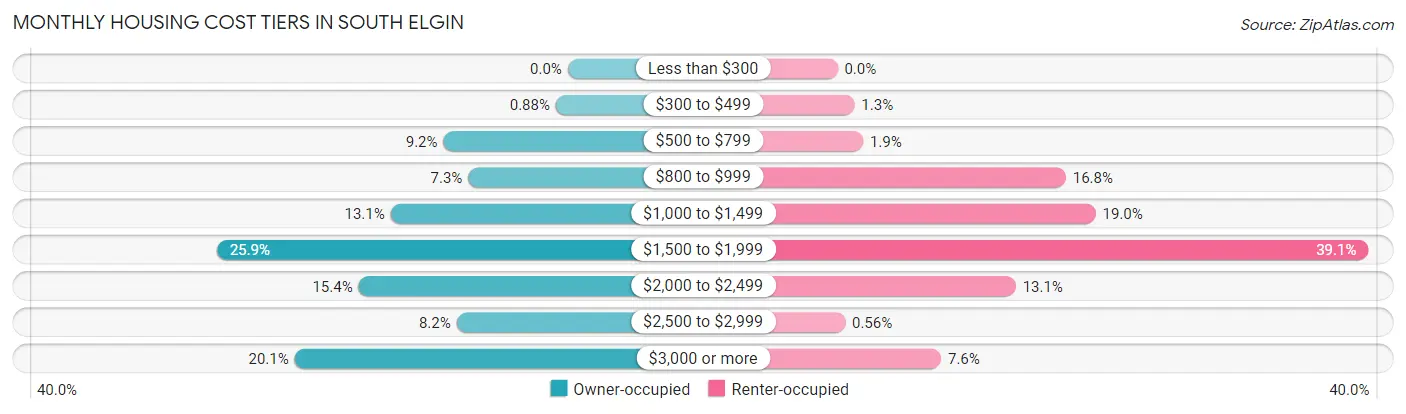
| Monthly Cost | Owner-occupied | Renter-occupied |
| Less than $300 | 0 (0.0%) | 0 (0.0%) |
| $300 to $499 | 58 (0.9%) | 20 (1.3%) |
| $500 to $799 | 607 (9.2%) | 30 (1.9%) |
| $800 to $999 | 486 (7.3%) | 269 (16.8%) |
| $1,000 to $1,499 | 865 (13.1%) | 304 (19.0%) |
| $1,500 to $1,999 | 1,713 (25.9%) | 625 (39.1%) |
| $2,000 to $2,499 | 1,021 (15.4%) | 210 (13.1%) |
| $2,500 to $2,999 | 543 (8.2%) | 9 (0.6%) |
| $3,000 or more | 1,333 (20.1%) | 122 (7.6%) |
| Total | 6,626 (100.0%) | 1,599 (100.0%) |
Physical Housing Characteristics in South Elgin
Housing Structures in South Elgin
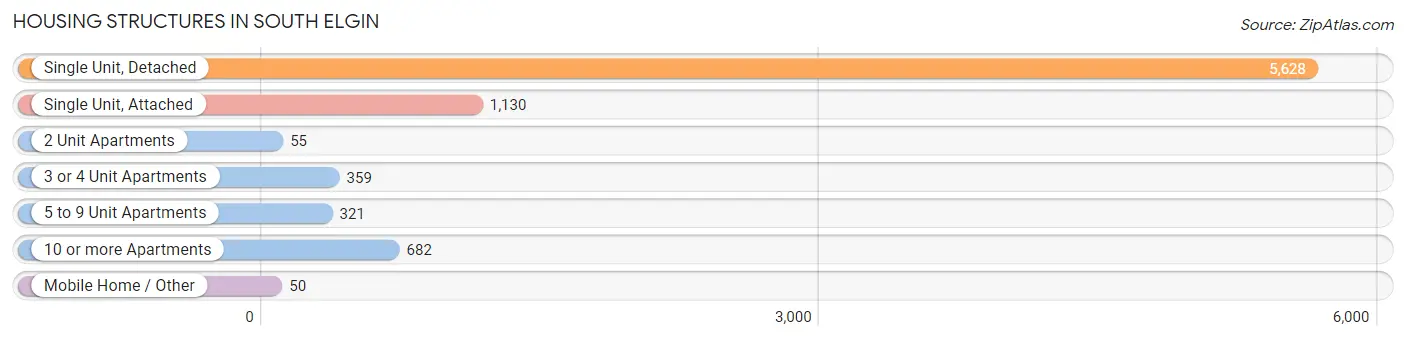
| Structure Type | # Housing Units | % Housing Units |
| Single Unit, Detached | 5,628 | 68.4% |
| Single Unit, Attached | 1,130 | 13.7% |
| 2 Unit Apartments | 55 | 0.7% |
| 3 or 4 Unit Apartments | 359 | 4.4% |
| 5 to 9 Unit Apartments | 321 | 3.9% |
| 10 or more Apartments | 682 | 8.3% |
| Mobile Home / Other | 50 | 0.6% |
| Total | 8,225 | 100.0% |
Housing Structures by Occupancy in South Elgin
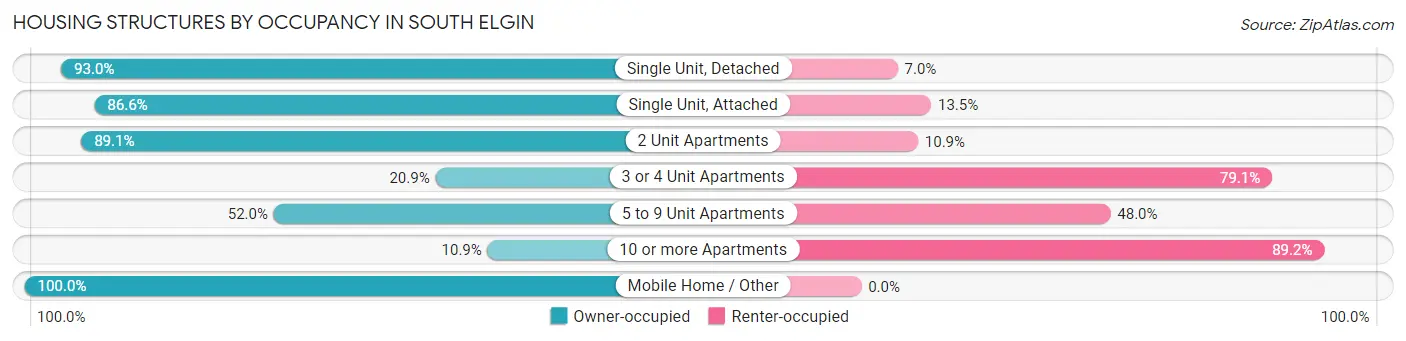
| Structure Type | Owner-occupied | Renter-occupied |
| Single Unit, Detached | 5,233 (93.0%) | 395 (7.0%) |
| Single Unit, Attached | 978 (86.6%) | 152 (13.5%) |
| 2 Unit Apartments | 49 (89.1%) | 6 (10.9%) |
| 3 or 4 Unit Apartments | 75 (20.9%) | 284 (79.1%) |
| 5 to 9 Unit Apartments | 167 (52.0%) | 154 (48.0%) |
| 10 or more Apartments | 74 (10.8%) | 608 (89.1%) |
| Mobile Home / Other | 50 (100.0%) | 0 (0.0%) |
| Total | 6,626 (80.6%) | 1,599 (19.4%) |
Housing Structures by Number of Rooms in South Elgin
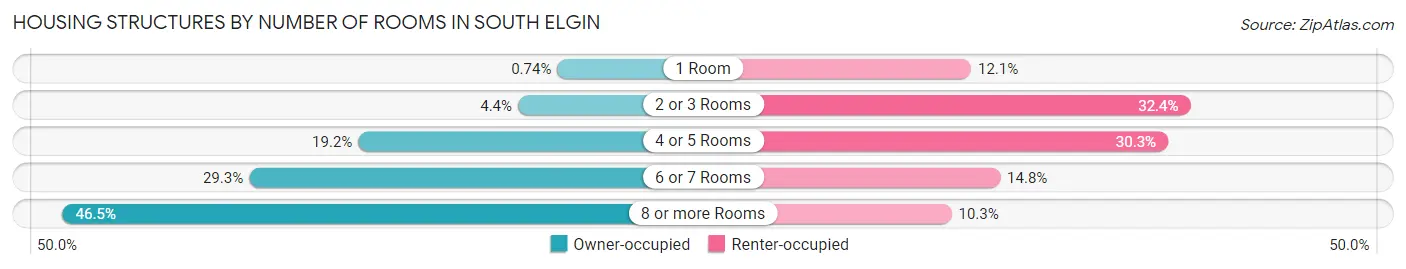
| Number of Rooms | Owner-occupied | Renter-occupied |
| 1 Room | 49 (0.7%) | 194 (12.1%) |
| 2 or 3 Rooms | 290 (4.4%) | 518 (32.4%) |
| 4 or 5 Rooms | 1,269 (19.2%) | 485 (30.3%) |
| 6 or 7 Rooms | 1,938 (29.2%) | 237 (14.8%) |
| 8 or more Rooms | 3,080 (46.5%) | 165 (10.3%) |
| Total | 6,626 (100.0%) | 1,599 (100.0%) |
Housing Structure by Heating Type in South Elgin
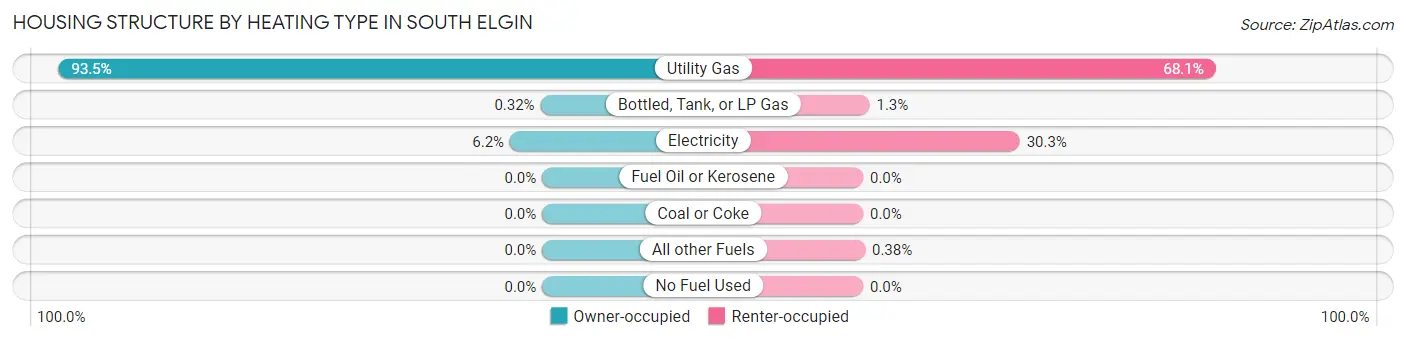
| Heating Type | Owner-occupied | Renter-occupied |
| Utility Gas | 6,193 (93.5%) | 1,089 (68.1%) |
| Bottled, Tank, or LP Gas | 21 (0.3%) | 20 (1.3%) |
| Electricity | 412 (6.2%) | 484 (30.3%) |
| Fuel Oil or Kerosene | 0 (0.0%) | 0 (0.0%) |
| Coal or Coke | 0 (0.0%) | 0 (0.0%) |
| All other Fuels | 0 (0.0%) | 6 (0.4%) |
| No Fuel Used | 0 (0.0%) | 0 (0.0%) |
| Total | 6,626 (100.0%) | 1,599 (100.0%) |
Household Vehicle Usage in South Elgin
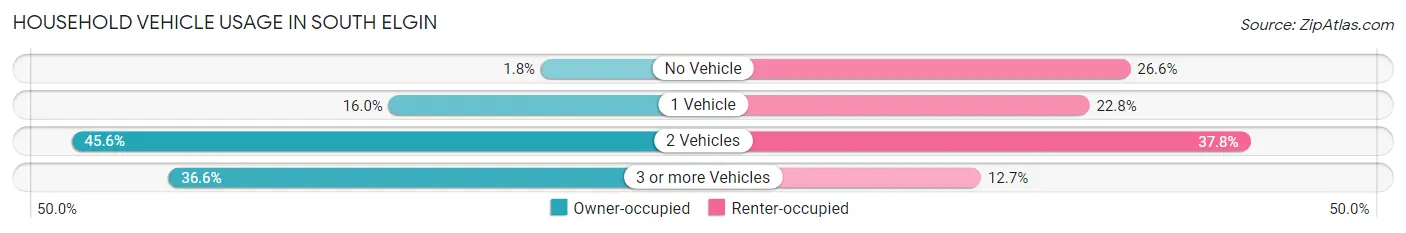
| Vehicles per Household | Owner-occupied | Renter-occupied |
| No Vehicle | 119 (1.8%) | 426 (26.6%) |
| 1 Vehicle | 1,061 (16.0%) | 365 (22.8%) |
| 2 Vehicles | 3,022 (45.6%) | 605 (37.8%) |
| 3 or more Vehicles | 2,424 (36.6%) | 203 (12.7%) |
| Total | 6,626 (100.0%) | 1,599 (100.0%) |
Real Estate & Mortgages in South Elgin
Real Estate and Mortgage Overview in South Elgin
| Characteristic | Without Mortgage | With Mortgage |
| Housing Units | 1,303 | 5,323 |
| Median Property Value | $251,700 | $294,200 |
| Median Household Income | $109,856 | $2,213 |
| Monthly Housing Costs | $811 | $1,333 |
| Real Estate Taxes | $5,436 | $127 |
Property Value by Mortgage Status in South Elgin
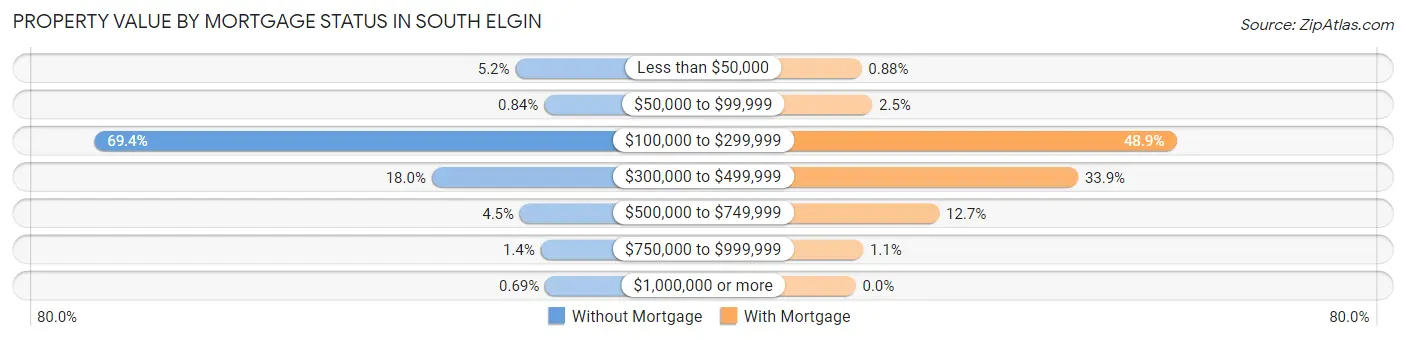
| Property Value | Without Mortgage | With Mortgage |
| Less than $50,000 | 68 (5.2%) | 47 (0.9%) |
| $50,000 to $99,999 | 11 (0.8%) | 134 (2.5%) |
| $100,000 to $299,999 | 904 (69.4%) | 2,601 (48.9%) |
| $300,000 to $499,999 | 234 (18.0%) | 1,804 (33.9%) |
| $500,000 to $749,999 | 59 (4.5%) | 677 (12.7%) |
| $750,000 to $999,999 | 18 (1.4%) | 60 (1.1%) |
| $1,000,000 or more | 9 (0.7%) | 0 (0.0%) |
| Total | 1,303 (100.0%) | 5,323 (100.0%) |
Household Income by Mortgage Status in South Elgin
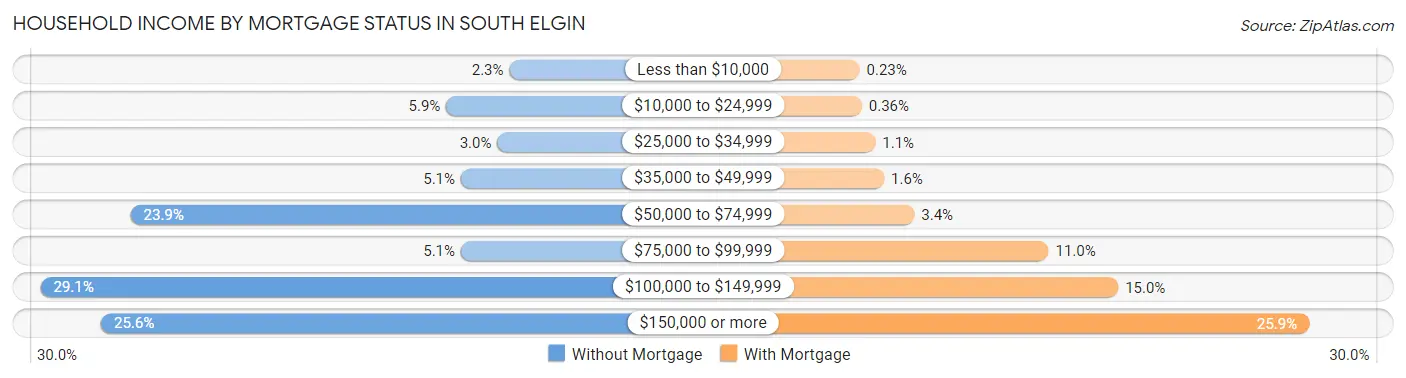
| Household Income | Without Mortgage | With Mortgage |
| Less than $10,000 | 30 (2.3%) | 12 (0.2%) |
| $10,000 to $24,999 | 77 (5.9%) | 19 (0.4%) |
| $25,000 to $34,999 | 39 (3.0%) | 60 (1.1%) |
| $35,000 to $49,999 | 66 (5.1%) | 87 (1.6%) |
| $50,000 to $74,999 | 312 (23.9%) | 179 (3.4%) |
| $75,000 to $99,999 | 66 (5.1%) | 587 (11.0%) |
| $100,000 to $149,999 | 379 (29.1%) | 799 (15.0%) |
| $150,000 or more | 334 (25.6%) | 1,379 (25.9%) |
| Total | 1,303 (100.0%) | 5,323 (100.0%) |
Property Value to Household Income Ratio in South Elgin
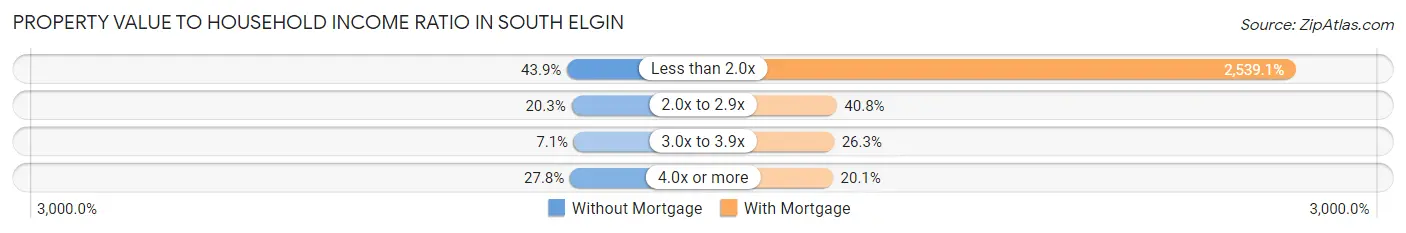
| Value-to-Income Ratio | Without Mortgage | With Mortgage |
| Less than 2.0x | 572 (43.9%) | 135,156 (2,539.1%) |
| 2.0x to 2.9x | 265 (20.3%) | 2,170 (40.8%) |
| 3.0x to 3.9x | 93 (7.1%) | 1,399 (26.3%) |
| 4.0x or more | 362 (27.8%) | 1,070 (20.1%) |
| Total | 1,303 (100.0%) | 5,323 (100.0%) |
Real Estate Taxes by Mortgage Status in South Elgin
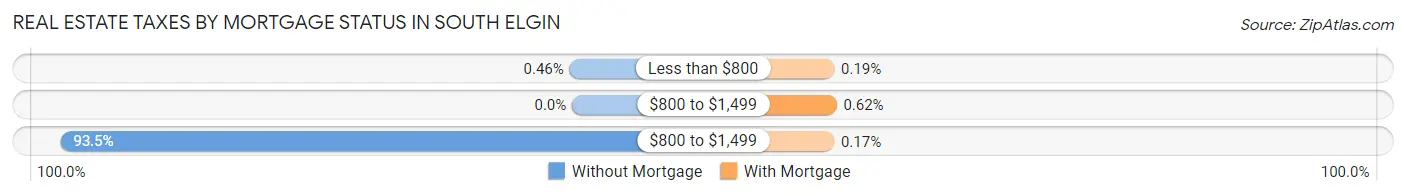
| Property Taxes | Without Mortgage | With Mortgage |
| Less than $800 | 6 (0.5%) | 10 (0.2%) |
| $800 to $1,499 | 0 (0.0%) | 33 (0.6%) |
| $800 to $1,499 | 1,218 (93.5%) | 9 (0.2%) |
| Total | 1,303 (100.0%) | 5,323 (100.0%) |
Health & Disability in South Elgin
Health Insurance Coverage by Age in South Elgin
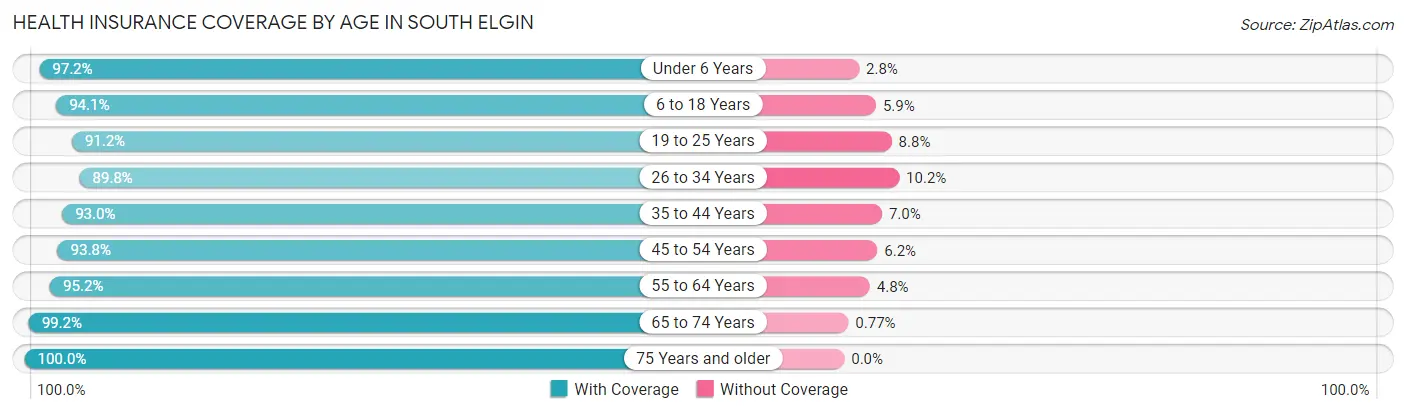
| Age Bracket | With Coverage | Without Coverage |
| Under 6 Years | 1,443 (97.2%) | 41 (2.8%) |
| 6 to 18 Years | 4,429 (94.1%) | 278 (5.9%) |
| 19 to 25 Years | 1,766 (91.2%) | 171 (8.8%) |
| 26 to 34 Years | 1,737 (89.8%) | 198 (10.2%) |
| 35 to 44 Years | 3,721 (93.0%) | 281 (7.0%) |
| 45 to 54 Years | 4,035 (93.8%) | 265 (6.2%) |
| 55 to 64 Years | 2,614 (95.2%) | 131 (4.8%) |
| 65 to 74 Years | 1,556 (99.2%) | 12 (0.8%) |
| 75 Years and older | 903 (100.0%) | 0 (0.0%) |
| Total | 22,204 (94.2%) | 1,377 (5.8%) |
Health Insurance Coverage by Citizenship Status in South Elgin
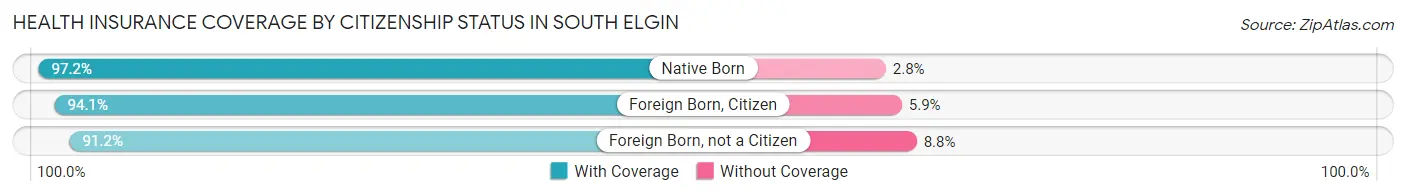
| Citizenship Status | With Coverage | Without Coverage |
| Native Born | 1,443 (97.2%) | 41 (2.8%) |
| Foreign Born, Citizen | 4,429 (94.1%) | 278 (5.9%) |
| Foreign Born, not a Citizen | 1,766 (91.2%) | 171 (8.8%) |
Health Insurance Coverage by Household Income in South Elgin
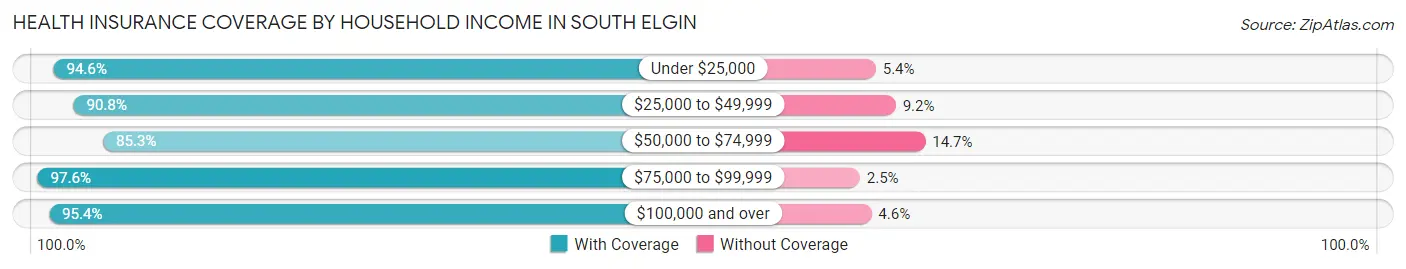
| Household Income | With Coverage | Without Coverage |
| Under $25,000 | 731 (94.6%) | 42 (5.4%) |
| $25,000 to $49,999 | 1,417 (90.8%) | 143 (9.2%) |
| $50,000 to $74,999 | 2,377 (85.3%) | 410 (14.7%) |
| $75,000 to $99,999 | 3,139 (97.6%) | 79 (2.5%) |
| $100,000 and over | 14,536 (95.4%) | 702 (4.6%) |
Public vs Private Health Insurance Coverage by Age in South Elgin
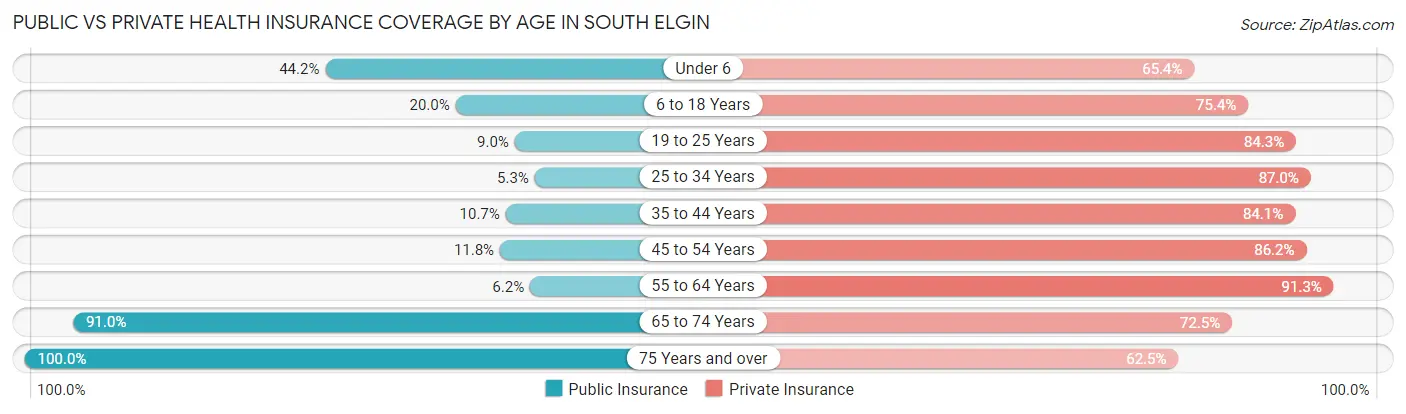
| Age Bracket | Public Insurance | Private Insurance |
| Under 6 | 656 (44.2%) | 971 (65.4%) |
| 6 to 18 Years | 942 (20.0%) | 3,550 (75.4%) |
| 19 to 25 Years | 175 (9.0%) | 1,633 (84.3%) |
| 25 to 34 Years | 103 (5.3%) | 1,684 (87.0%) |
| 35 to 44 Years | 429 (10.7%) | 3,367 (84.1%) |
| 45 to 54 Years | 506 (11.8%) | 3,707 (86.2%) |
| 55 to 64 Years | 170 (6.2%) | 2,506 (91.3%) |
| 65 to 74 Years | 1,427 (91.0%) | 1,136 (72.5%) |
| 75 Years and over | 903 (100.0%) | 564 (62.5%) |
| Total | 5,311 (22.5%) | 19,118 (81.1%) |
Disability Status by Sex by Age in South Elgin
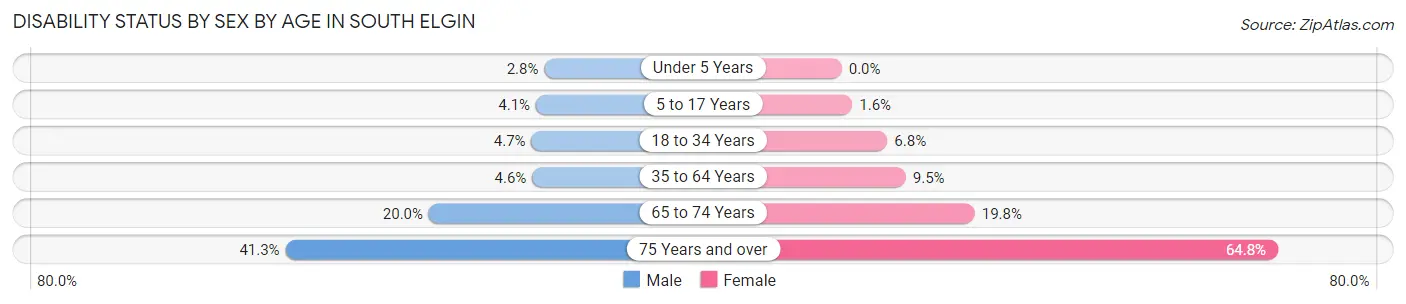
| Age Bracket | Male | Female |
| Under 5 Years | 17 (2.8%) | 0 (0.0%) |
| 5 to 17 Years | 110 (4.1%) | 32 (1.6%) |
| 18 to 34 Years | 112 (4.7%) | 127 (6.8%) |
| 35 to 64 Years | 258 (4.6%) | 521 (9.5%) |
| 65 to 74 Years | 118 (20.0%) | 193 (19.8%) |
| 75 Years and over | 163 (41.3%) | 329 (64.8%) |
Disability Class by Sex by Age in South Elgin
Disability Class: Hearing Difficulty
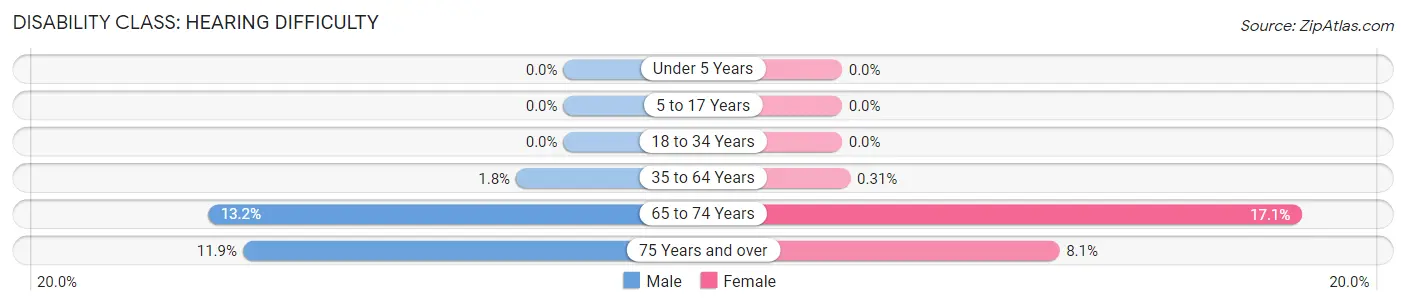
| Age Bracket | Male | Female |
| Under 5 Years | 0 (0.0%) | 0 (0.0%) |
| 5 to 17 Years | 0 (0.0%) | 0 (0.0%) |
| 18 to 34 Years | 0 (0.0%) | 0 (0.0%) |
| 35 to 64 Years | 98 (1.8%) | 17 (0.3%) |
| 65 to 74 Years | 78 (13.2%) | 167 (17.1%) |
| 75 Years and over | 47 (11.9%) | 41 (8.1%) |
Disability Class: Vision Difficulty
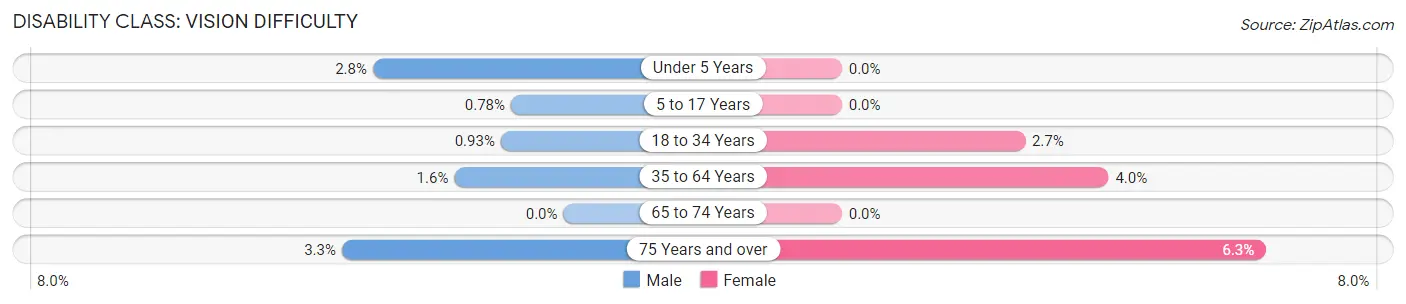
| Age Bracket | Male | Female |
| Under 5 Years | 17 (2.8%) | 0 (0.0%) |
| 5 to 17 Years | 21 (0.8%) | 0 (0.0%) |
| 18 to 34 Years | 22 (0.9%) | 51 (2.7%) |
| 35 to 64 Years | 90 (1.6%) | 217 (4.0%) |
| 65 to 74 Years | 0 (0.0%) | 0 (0.0%) |
| 75 Years and over | 13 (3.3%) | 32 (6.3%) |
Disability Class: Cognitive Difficulty
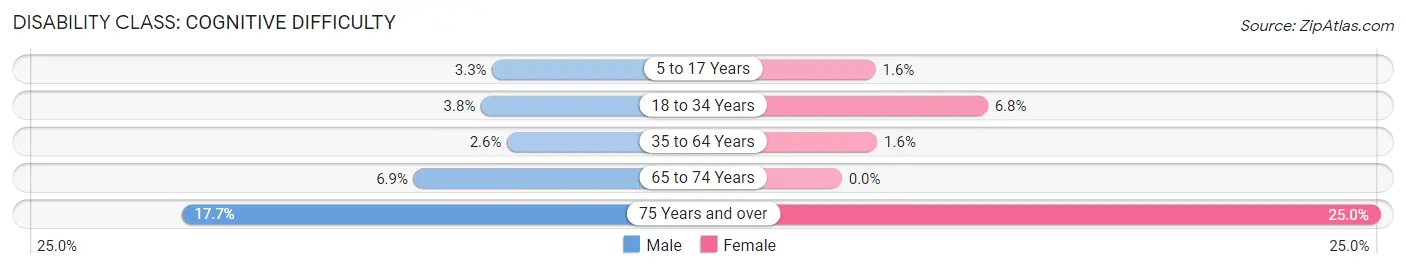
| Age Bracket | Male | Female |
| 5 to 17 Years | 89 (3.3%) | 32 (1.6%) |
| 18 to 34 Years | 90 (3.8%) | 127 (6.8%) |
| 35 to 64 Years | 145 (2.6%) | 90 (1.6%) |
| 65 to 74 Years | 41 (6.9%) | 0 (0.0%) |
| 75 Years and over | 70 (17.7%) | 127 (25.0%) |
Disability Class: Ambulatory Difficulty
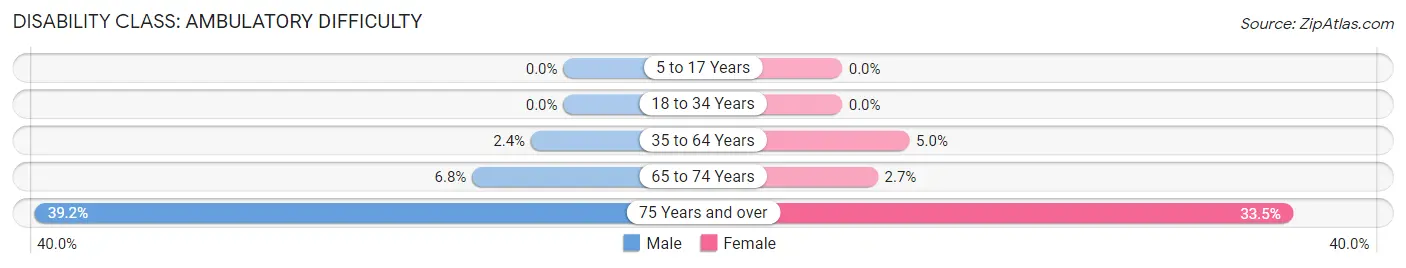
| Age Bracket | Male | Female |
| 5 to 17 Years | 0 (0.0%) | 0 (0.0%) |
| 18 to 34 Years | 0 (0.0%) | 0 (0.0%) |
| 35 to 64 Years | 134 (2.4%) | 274 (5.0%) |
| 65 to 74 Years | 40 (6.8%) | 26 (2.7%) |
| 75 Years and over | 155 (39.2%) | 170 (33.5%) |
Disability Class: Self-Care Difficulty
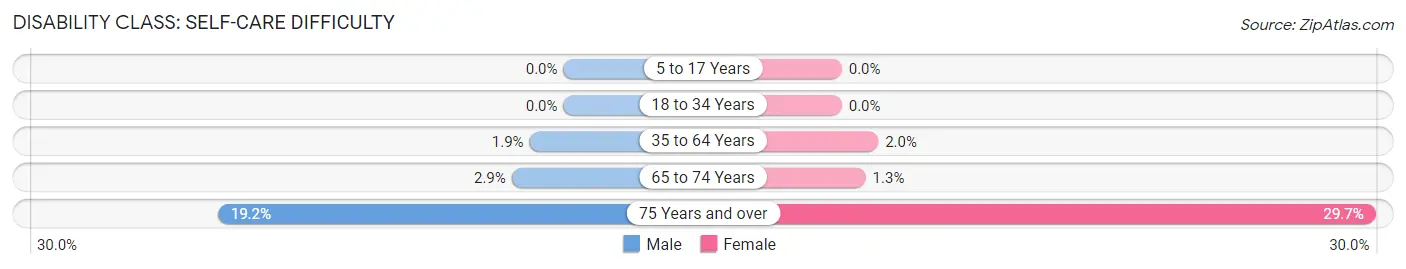
| Age Bracket | Male | Female |
| 5 to 17 Years | 0 (0.0%) | 0 (0.0%) |
| 18 to 34 Years | 0 (0.0%) | 0 (0.0%) |
| 35 to 64 Years | 105 (1.9%) | 111 (2.0%) |
| 65 to 74 Years | 17 (2.9%) | 13 (1.3%) |
| 75 Years and over | 76 (19.2%) | 151 (29.7%) |
Technology Access in South Elgin
Computing Device Access in South Elgin
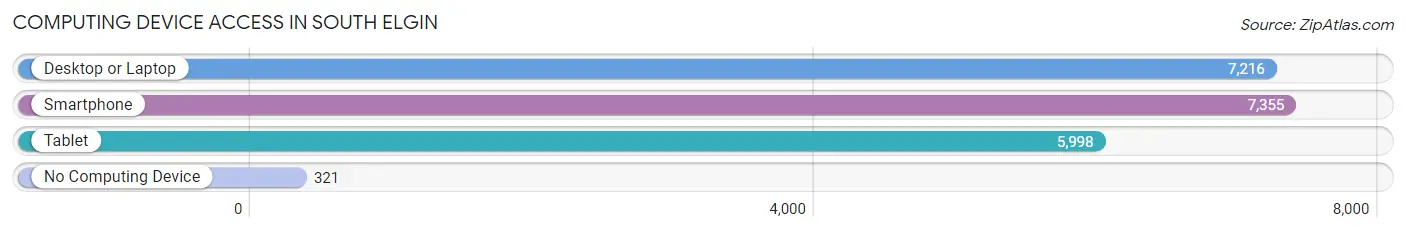
| Device Type | # Households | % Households |
| Desktop or Laptop | 7,216 | 87.7% |
| Smartphone | 7,355 | 89.4% |
| Tablet | 5,998 | 72.9% |
| No Computing Device | 321 | 3.9% |
| Total | 8,225 | 100.0% |
Internet Access in South Elgin
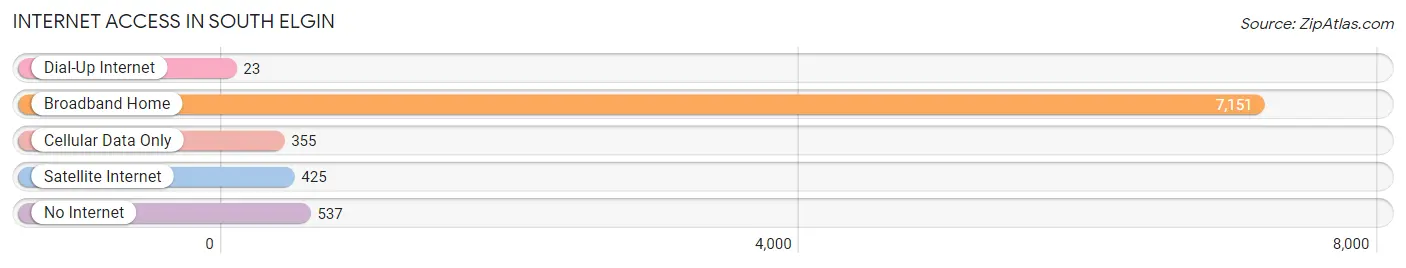
| Internet Type | # Households | % Households |
| Dial-Up Internet | 23 | 0.3% |
| Broadband Home | 7,151 | 86.9% |
| Cellular Data Only | 355 | 4.3% |
| Satellite Internet | 425 | 5.2% |
| No Internet | 537 | 6.5% |
| Total | 8,225 | 100.0% |
South Elgin Summary
History
South Elgin is a village located in Kane County, Illinois, United States. It is a suburb of Chicago, located approximately 40 miles northwest of the city. The village was incorporated in 1891 and has a population of approximately 22,000 people.
The area that is now South Elgin was originally inhabited by the Potawatomi Native American tribe. The first settlers arrived in the area in the early 1800s, and the village was officially incorporated in 1891. The village was named after Elgin, Illinois, which is located about 10 miles to the east.
The village grew slowly in the late 19th and early 20th centuries, but experienced a period of rapid growth in the 1950s and 1960s. This growth was due to the expansion of the Chicago metropolitan area and the development of the Fox River Valley.
Geography
South Elgin is located in Kane County, Illinois, approximately 40 miles northwest of Chicago. The village is situated on the Fox River, which flows through the village and is a major source of recreation for the area. The village is bordered by Elgin to the east, St. Charles to the north, and Bartlett to the south.
The village has a total area of 8.3 square miles, of which 8.2 square miles is land and 0.1 square miles is water. The village is located at an elevation of 690 feet above sea level.
Economy
South Elgin has a diverse economy, with a mix of manufacturing, retail, and service industries. The village is home to several large employers, including the Elgin National Watch Company, the Elgin Sweeper Company, and the Elgin Community College.
The village also has a thriving retail sector, with several shopping centers and malls located in the area. The village is also home to several restaurants, bars, and entertainment venues.
Demographics
As of the 2010 census, South Elgin had a population of 22,295. The racial makeup of the village was 79.2% White, 8.3% African American, 0.3% Native American, 5.7% Asian, and 5.5% from other races. Hispanic or Latino of any race were 13.2% of the population.
The median household income in South Elgin was $71,945, and the median family income was $83,945. The per capita income for the village was $30,945. About 5.2% of families and 7.2% of the population were below the poverty line.
Common Questions
What is Per Capita Income in South Elgin?
Per Capita income in South Elgin is $49,615.
What is the Median Family Income in South Elgin?
Median Family Income in South Elgin is $129,616.
What is the Median Household income in South Elgin?
Median Household Income in South Elgin is $118,293.
What is Income or Wage Gap in South Elgin?
Income or Wage Gap in South Elgin is 34.5%.
Women in South Elgin earn 65.5 cents for every dollar earned by a man.
What is Inequality or Gini Index in South Elgin?
Inequality or Gini Index in South Elgin is 0.40.
What is the Total Population of South Elgin?
Total Population of South Elgin is 23,841.
What is the Total Male Population of South Elgin?
Total Male Population of South Elgin is 12,338.
What is the Total Female Population of South Elgin?
Total Female Population of South Elgin is 11,503.
What is the Ratio of Males per 100 Females in South Elgin?
There are 107.26 Males per 100 Females in South Elgin.
What is the Ratio of Females per 100 Males in South Elgin?
There are 93.23 Females per 100 Males in South Elgin.
What is the Median Population Age in South Elgin?
Median Population Age in South Elgin is 38.6 Years.
What is the Average Family Size in South Elgin
Average Family Size in South Elgin is 3.3 People.
What is the Average Household Size in South Elgin
Average Household Size in South Elgin is 2.9 People.
How Large is the Labor Force in South Elgin?
There are 13,989 People in the Labor Forcein in South Elgin.
What is the Percentage of People in the Labor Force in South Elgin?
73.3% of People are in the Labor Force in South Elgin.
What is the Unemployment Rate in South Elgin?
Unemployment Rate in South Elgin is 3.4%.