Torrington, CT Map & Demographics
Torrington Map
Torrington Overview
$34,516
PER CAPITA INCOME
$81,696
AVG FAMILY INCOME
$66,616
AVG HOUSEHOLD INCOME
17.1%
WAGE / INCOME GAP [ % ]
82.9¢/ $1
WAGE / INCOME GAP [ $ ]
0.42
INEQUALITY / GINI INDEX
35,510
TOTAL POPULATION
17,355
MALE POPULATION
18,155
FEMALE POPULATION
95.59
MALES / 100 FEMALES
104.61
FEMALES / 100 MALES
40.8
MEDIAN AGE
3.0
AVG FAMILY SIZE
2.4
AVG HOUSEHOLD SIZE
19,452
LABOR FORCE [ PEOPLE ]
65.9%
PERCENT IN LABOR FORCE
5.8%
UNEMPLOYMENT RATE
Torrington Zip Codes
Torrington Area Codes
Income in Torrington
Income Overview in Torrington
Per Capita Income in Torrington is $34,516, while median incomes of families and households are $81,696 and $66,616 respectively.
| Characteristic | Number | Measure |
| Per Capita Income | 35,510 | $34,516 |
| Median Family Income | 8,880 | $81,696 |
| Mean Family Income | 8,880 | $97,564 |
| Median Household Income | 14,645 | $66,616 |
| Mean Household Income | 14,645 | $82,562 |
| Income Deficit | 8,880 | $0 |
| Wage / Income Gap (%) | 35,510 | 17.13% |
| Wage / Income Gap ($) | 35,510 | 82.87¢ per $1 |
| Gini / Inequality Index | 35,510 | 0.42 |
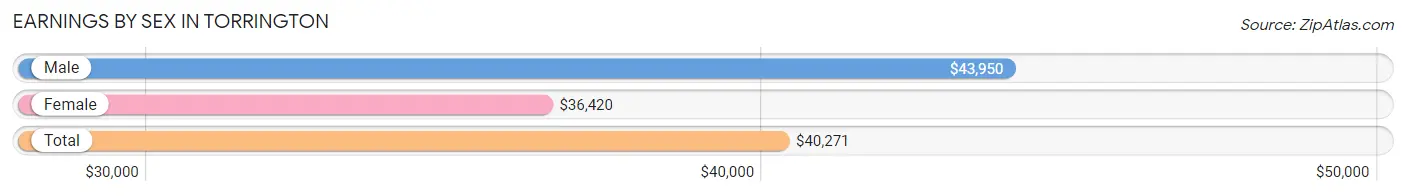
Earnings by Sex in Torrington
Average Earnings in Torrington are $40,271, $43,950 for men and $36,420 for women, a difference of 17.1%.
| Sex | Number | Average Earnings |
| Male | 10,074 (50.6%) | $43,950 |
| Female | 9,849 (49.4%) | $36,420 |
| Total | 19,923 (100.0%) | $40,271 |
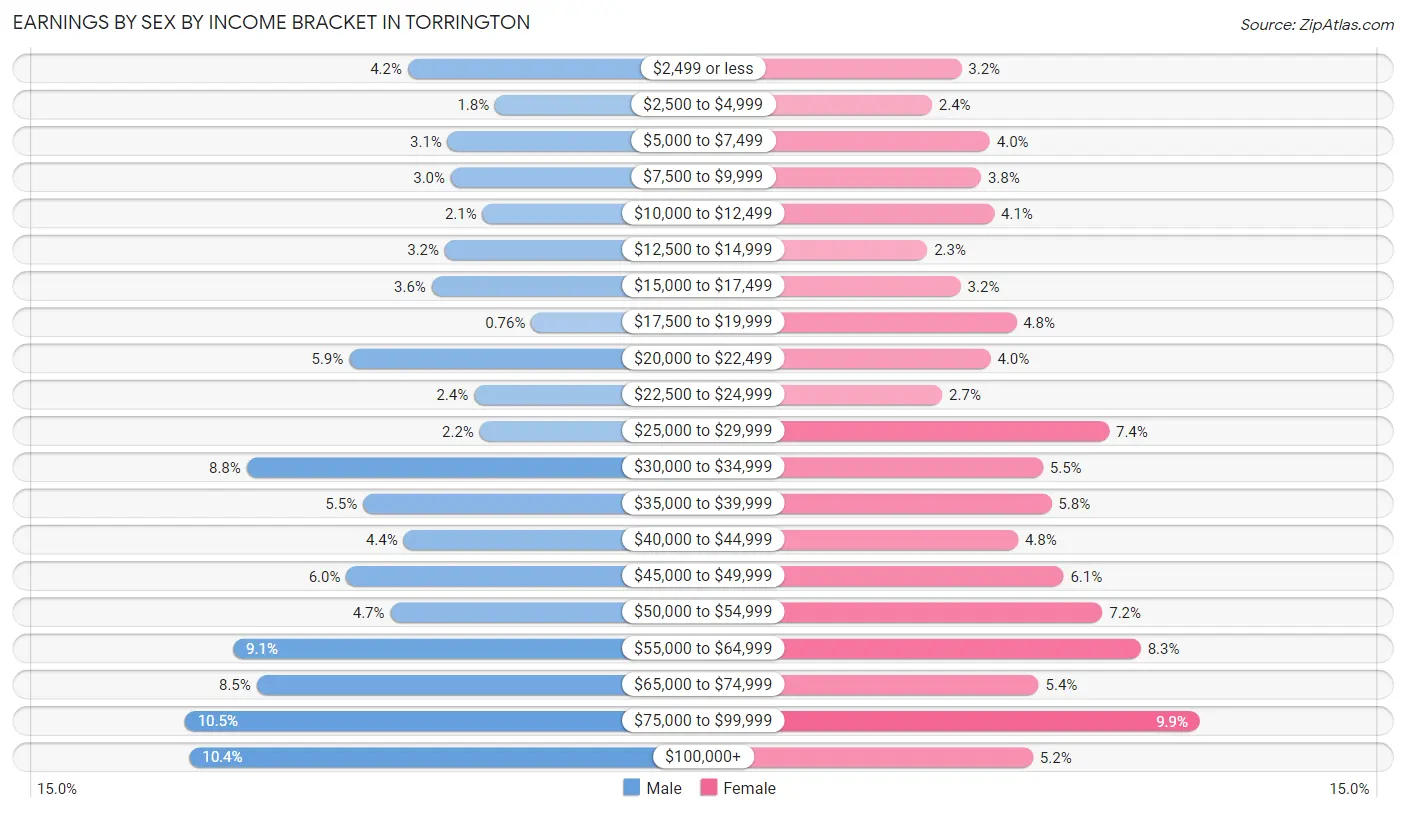
Earnings by Sex by Income Bracket in Torrington
The most common earnings brackets in Torrington are $75,000 to $99,999 for men (1,058 | 10.5%) and $75,000 to $99,999 for women (977 | 9.9%).
| Income | Male | Female |
| $2,499 or less | 426 (4.2%) | 317 (3.2%) |
| $2,500 to $4,999 | 179 (1.8%) | 235 (2.4%) |
| $5,000 to $7,499 | 313 (3.1%) | 396 (4.0%) |
| $7,500 to $9,999 | 304 (3.0%) | 371 (3.8%) |
| $10,000 to $12,499 | 215 (2.1%) | 408 (4.1%) |
| $12,500 to $14,999 | 321 (3.2%) | 223 (2.3%) |
| $15,000 to $17,499 | 359 (3.6%) | 315 (3.2%) |
| $17,500 to $19,999 | 77 (0.8%) | 469 (4.8%) |
| $20,000 to $22,499 | 592 (5.9%) | 398 (4.0%) |
| $22,500 to $24,999 | 239 (2.4%) | 264 (2.7%) |
| $25,000 to $29,999 | 223 (2.2%) | 726 (7.4%) |
| $30,000 to $34,999 | 882 (8.8%) | 543 (5.5%) |
| $35,000 to $39,999 | 553 (5.5%) | 566 (5.8%) |
| $40,000 to $44,999 | 438 (4.3%) | 474 (4.8%) |
| $45,000 to $49,999 | 600 (6.0%) | 600 (6.1%) |
| $50,000 to $54,999 | 475 (4.7%) | 707 (7.2%) |
| $55,000 to $64,999 | 921 (9.1%) | 814 (8.3%) |
| $65,000 to $74,999 | 854 (8.5%) | 531 (5.4%) |
| $75,000 to $99,999 | 1,058 (10.5%) | 977 (9.9%) |
| $100,000+ | 1,045 (10.4%) | 515 (5.2%) |
| Total | 10,074 (100.0%) | 9,849 (100.0%) |
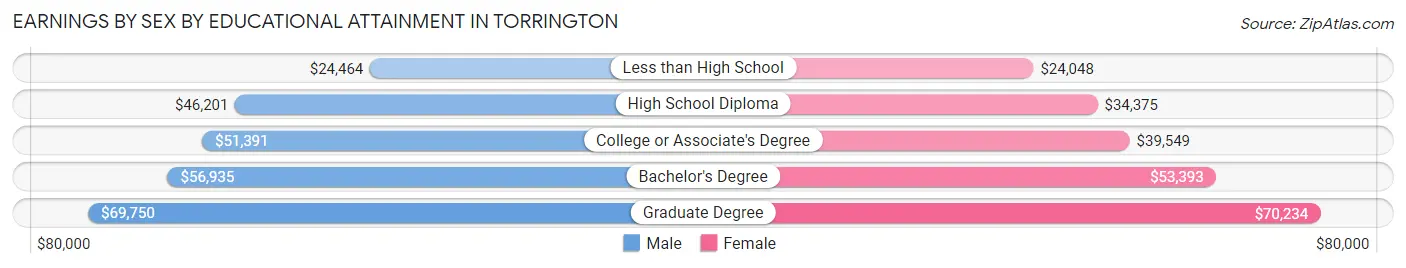
Earnings by Sex by Educational Attainment in Torrington
Average earnings in Torrington are $49,383 for men and $43,374 for women, a difference of 12.2%. Men with an educational attainment of graduate degree enjoy the highest average annual earnings of $69,750, while those with less than high school education earn the least with $24,464. Women with an educational attainment of graduate degree earn the most with the average annual earnings of $70,234, while those with less than high school education have the smallest earnings of $24,048.
| Educational Attainment | Male Income | Female Income |
| Less than High School | $24,464 | $24,048 |
| High School Diploma | $46,201 | $34,375 |
| College or Associate's Degree | $51,391 | $39,549 |
| Bachelor's Degree | $56,935 | $53,393 |
| Graduate Degree | $69,750 | $70,234 |
| Total | $49,383 | $43,374 |
Family Income in Torrington
Family Income Brackets in Torrington
According to the Torrington family income data, there are 1,767 families falling into the $100,000 to $149,999 income range, which is the most common income bracket and makes up 19.9% of all families. Conversely, the $10,000 to $14,999 income bracket is the least frequent group with only 213 families (2.4%) belonging to this category.
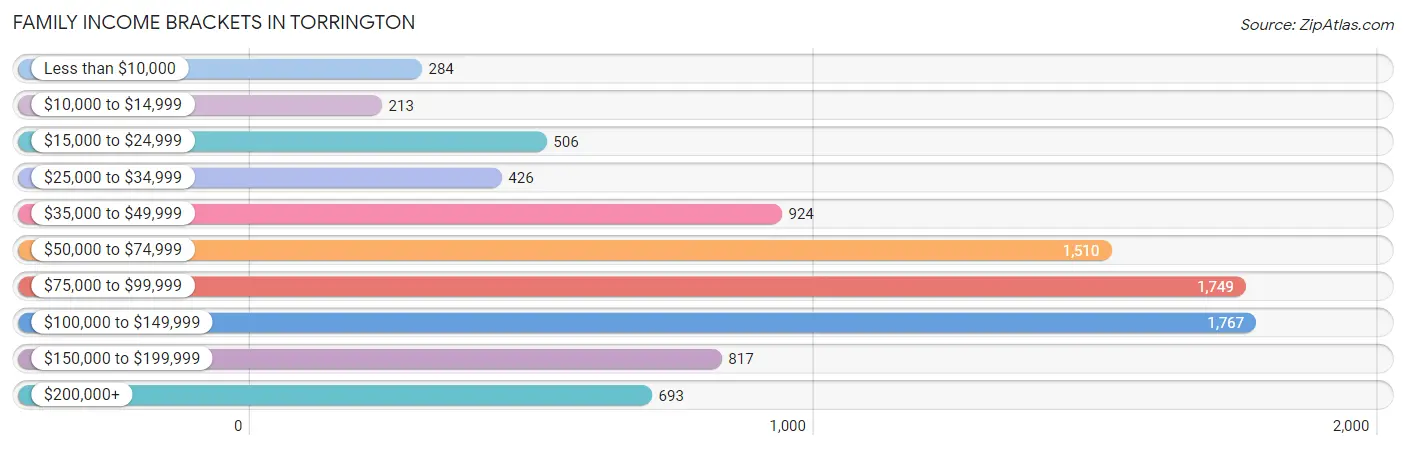
| Income Bracket | # Families | % Families |
| Less than $10,000 | 284 | 3.2% |
| $10,000 to $14,999 | 213 | 2.4% |
| $15,000 to $24,999 | 506 | 5.7% |
| $25,000 to $34,999 | 426 | 4.8% |
| $35,000 to $49,999 | 924 | 10.4% |
| $50,000 to $74,999 | 1,510 | 17.0% |
| $75,000 to $99,999 | 1,749 | 19.7% |
| $100,000 to $149,999 | 1,767 | 19.9% |
| $150,000 to $199,999 | 817 | 9.2% |
| $200,000+ | 693 | 7.8% |
Family Income by Famaliy Size in Torrington
4-person families (1,434 | 16.2%) account for the highest median family income in Torrington with $97,179 per family, while 2-person families (4,208 | 47.4%) have the highest median income of $39,680 per family member.
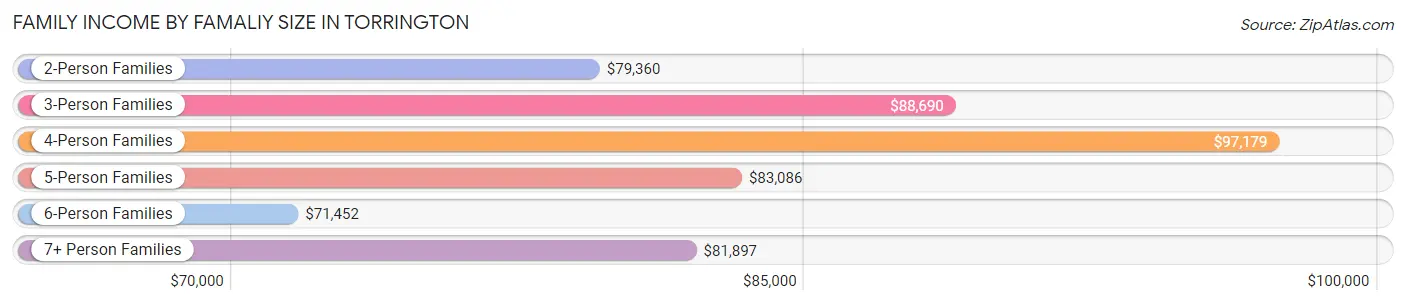
| Income Bracket | # Families | Median Income |
| 2-Person Families | 4,208 (47.4%) | $79,360 |
| 3-Person Families | 2,250 (25.3%) | $88,690 |
| 4-Person Families | 1,434 (16.2%) | $97,179 |
| 5-Person Families | 719 (8.1%) | $83,086 |
| 6-Person Families | 184 (2.1%) | $71,452 |
| 7+ Person Families | 85 (1.0%) | $81,897 |
| Total | 8,880 (100.0%) | $81,696 |
Family Income by Number of Earners in Torrington
The median family income in Torrington is $81,696, with families comprising 3+ earners (1,110) having the highest median family income of $173,750, while families with 1 earner (2,651) have the lowest median family income of $46,169, accounting for 12.5% and 29.8% of families, respectively.
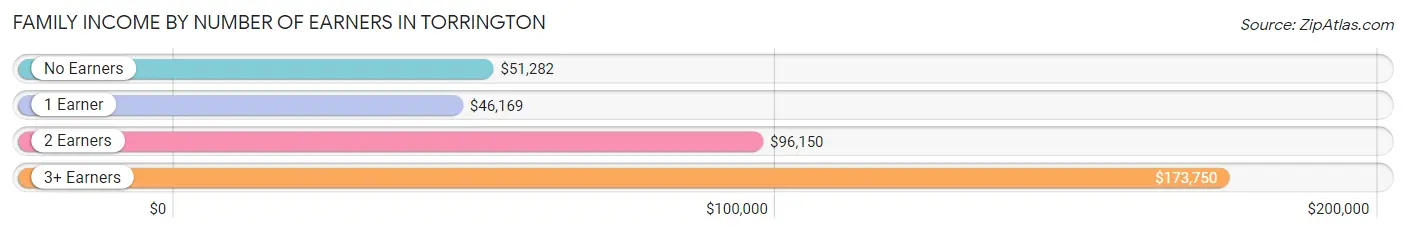
| Number of Earners | # Families | Median Income |
| No Earners | 1,246 (14.0%) | $51,282 |
| 1 Earner | 2,651 (29.8%) | $46,169 |
| 2 Earners | 3,873 (43.6%) | $96,150 |
| 3+ Earners | 1,110 (12.5%) | $173,750 |
| Total | 8,880 (100.0%) | $81,696 |
Household Income in Torrington
Household Income Brackets in Torrington
With 2,534 households falling in the category, the $75,000 to $99,999 income range is the most frequent in Torrington, accounting for 17.3% of all households. In contrast, only 615 households (4.2%) fall into the less than $10,000 income bracket, making it the least populous group.
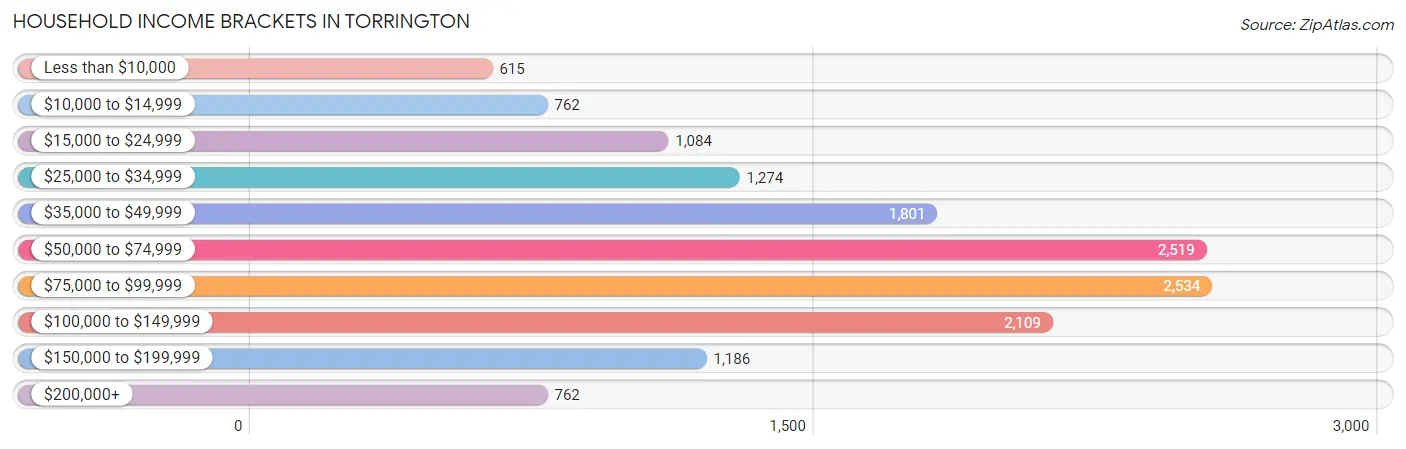
| Income Bracket | # Households | % Households |
| Less than $10,000 | 615 | 4.2% |
| $10,000 to $14,999 | 762 | 5.2% |
| $15,000 to $24,999 | 1,084 | 7.4% |
| $25,000 to $34,999 | 1,274 | 8.7% |
| $35,000 to $49,999 | 1,801 | 12.3% |
| $50,000 to $74,999 | 2,519 | 17.2% |
| $75,000 to $99,999 | 2,534 | 17.3% |
| $100,000 to $149,999 | 2,109 | 14.4% |
| $150,000 to $199,999 | 1,186 | 8.1% |
| $200,000+ | 762 | 5.2% |
Household Income by Householder Age in Torrington
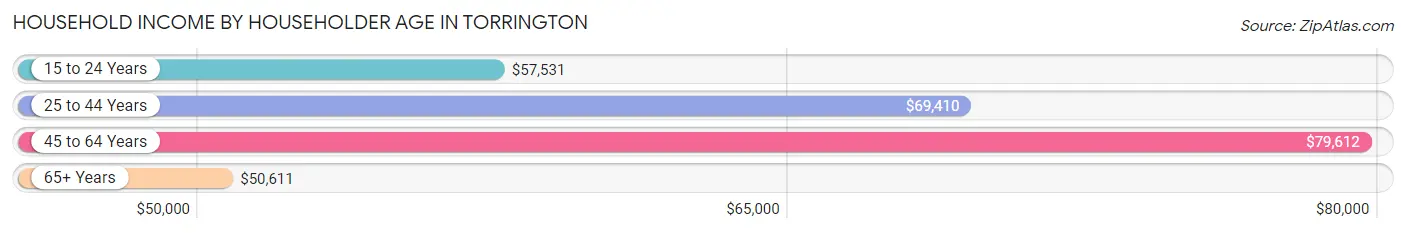
The median household income in Torrington is $66,616, with the highest median household income of $79,612 found in the 45 to 64 years age bracket for the primary householder. A total of 6,156 households (42.0%) fall into this category. Meanwhile, the 65+ years age bracket for the primary householder has the lowest median household income of $50,611, with 3,792 households (25.9%) in this group.
| Income Bracket | # Households | Median Income |
| 15 to 24 Years | 459 (3.1%) | $57,531 |
| 25 to 44 Years | 4,238 (28.9%) | $69,410 |
| 45 to 64 Years | 6,156 (42.0%) | $79,612 |
| 65+ Years | 3,792 (25.9%) | $50,611 |
| Total | 14,645 (100.0%) | $66,616 |
Poverty in Torrington
Income Below Poverty by Sex and Age in Torrington
With 13.9% poverty level for males and 15.3% for females among the residents of Torrington, 6 to 11 year old males and under 5 year old females are the most vulnerable to poverty, with 352 males (27.1%) and 233 females (31.0%) in their respective age groups living below the poverty level.
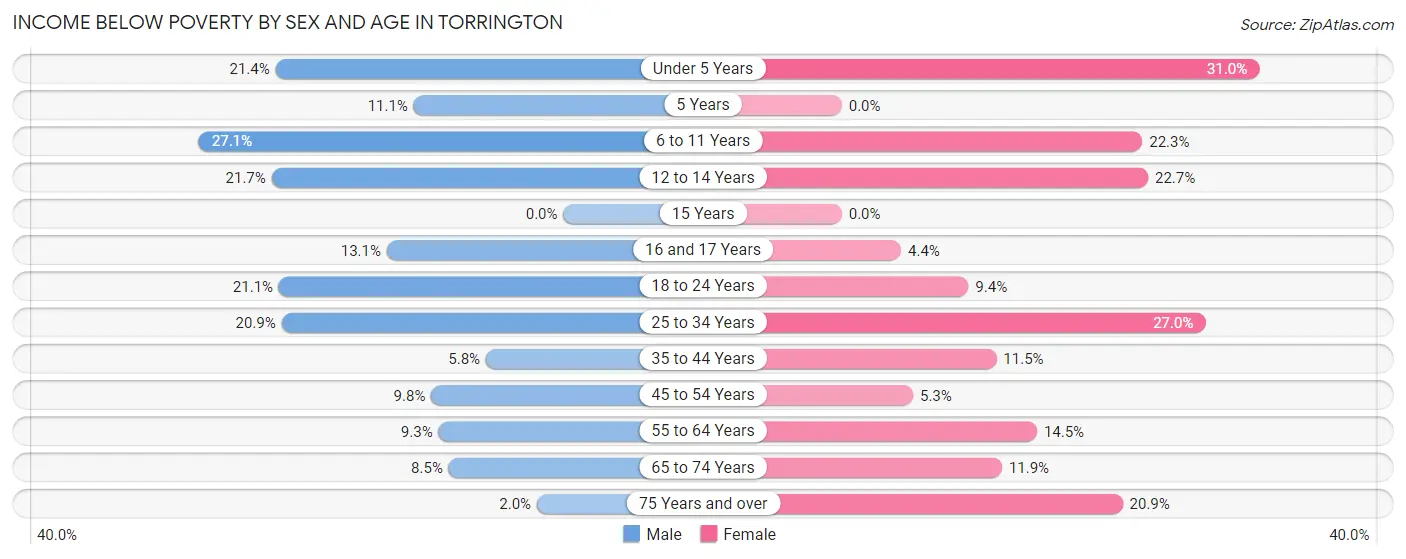
| Age Bracket | Male | Female |
| Under 5 Years | 227 (21.4%) | 233 (31.0%) |
| 5 Years | 23 (11.1%) | 0 (0.0%) |
| 6 to 11 Years | 352 (27.1%) | 205 (22.3%) |
| 12 to 14 Years | 120 (21.7%) | 78 (22.7%) |
| 15 Years | 0 (0.0%) | 0 (0.0%) |
| 16 and 17 Years | 59 (13.1%) | 14 (4.4%) |
| 18 to 24 Years | 329 (21.1%) | 156 (9.4%) |
| 25 to 34 Years | 529 (20.9%) | 781 (27.0%) |
| 35 to 44 Years | 109 (5.8%) | 215 (11.5%) |
| 45 to 54 Years | 256 (9.8%) | 135 (5.3%) |
| 55 to 64 Years | 214 (9.3%) | 417 (14.5%) |
| 65 to 74 Years | 133 (8.5%) | 199 (11.9%) |
| 75 Years and over | 18 (2.0%) | 274 (20.8%) |
| Total | 2,369 (13.9%) | 2,707 (15.3%) |
Income Above Poverty by Sex and Age in Torrington
According to the poverty statistics in Torrington, males aged 15 years and females aged 5 years are the age groups that are most secure financially, with 100.0% of males and 100.0% of females in these age groups living above the poverty line.
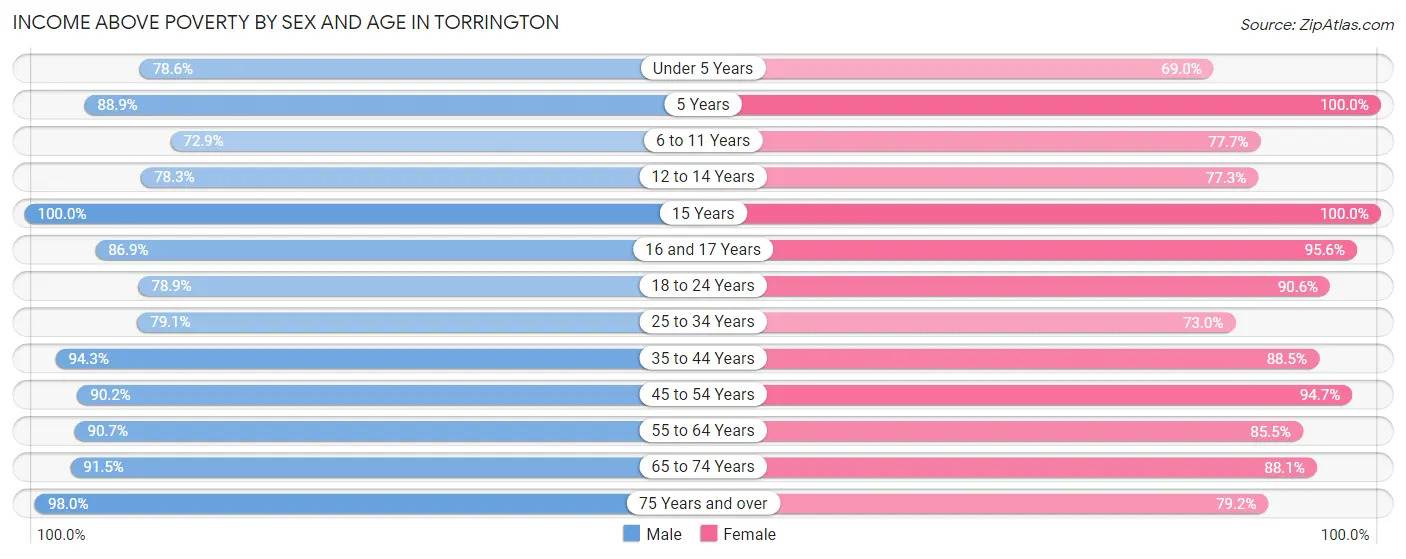
| Age Bracket | Male | Female |
| Under 5 Years | 835 (78.6%) | 519 (69.0%) |
| 5 Years | 184 (88.9%) | 145 (100.0%) |
| 6 to 11 Years | 949 (72.9%) | 714 (77.7%) |
| 12 to 14 Years | 434 (78.3%) | 265 (77.3%) |
| 15 Years | 130 (100.0%) | 343 (100.0%) |
| 16 and 17 Years | 391 (86.9%) | 304 (95.6%) |
| 18 to 24 Years | 1,229 (78.9%) | 1,503 (90.6%) |
| 25 to 34 Years | 2,000 (79.1%) | 2,114 (73.0%) |
| 35 to 44 Years | 1,786 (94.3%) | 1,658 (88.5%) |
| 45 to 54 Years | 2,354 (90.2%) | 2,418 (94.7%) |
| 55 to 64 Years | 2,094 (90.7%) | 2,460 (85.5%) |
| 65 to 74 Years | 1,430 (91.5%) | 1,474 (88.1%) |
| 75 Years and over | 902 (98.0%) | 1,040 (79.1%) |
| Total | 14,718 (86.1%) | 14,957 (84.7%) |
Income Below Poverty Among Married-Couple Families in Torrington
The poverty statistics for married-couple families in Torrington show that 1.2% or 69 of the total 5,754 families live below the poverty line. Families with 3 or 4 children have the highest poverty rate of 7.6%, comprising of 36 families. On the other hand, families with no children have the lowest poverty rate of 0.4%, which includes 15 families.
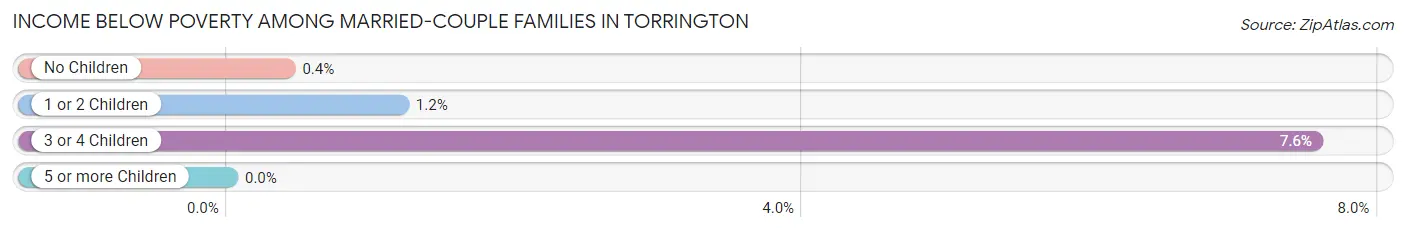
| Children | Above Poverty | Below Poverty |
| No Children | 3,756 (99.6%) | 15 (0.4%) |
| 1 or 2 Children | 1,489 (98.8%) | 18 (1.2%) |
| 3 or 4 Children | 440 (92.4%) | 36 (7.6%) |
| 5 or more Children | 0 (0.0%) | 0 (0.0%) |
| Total | 5,685 (98.8%) | 69 (1.2%) |
Income Below Poverty Among Single-Parent Households in Torrington
According to the poverty data in Torrington, 9.6% or 75 single-father households and 33.2% or 779 single-mother households are living below the poverty line. Among single-father households, those with 3 or 4 children have the highest poverty rate, with 44 households (74.6%) experiencing poverty. Likewise, among single-mother households, those with 1 or 2 children have the highest poverty rate, with 540 households (54.2%) falling below the poverty line.
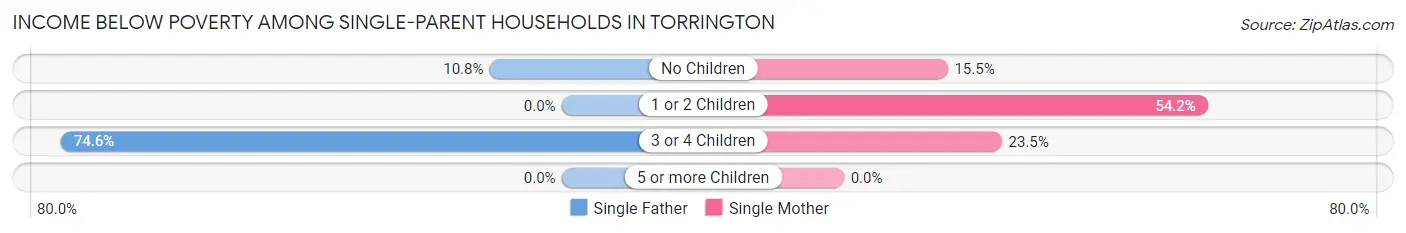
| Children | Single Father | Single Mother |
| No Children | 31 (10.8%) | 151 (15.5%) |
| 1 or 2 Children | 0 (0.0%) | 540 (54.2%) |
| 3 or 4 Children | 44 (74.6%) | 88 (23.5%) |
| 5 or more Children | 0 (0.0%) | 0 (0.0%) |
| Total | 75 (9.6%) | 779 (33.2%) |
Income Below Poverty Among Married-Couple vs Single-Parent Households in Torrington
The poverty data for Torrington shows that 69 of the married-couple family households (1.2%) and 854 of the single-parent households (27.3%) are living below the poverty level. Within the married-couple family households, those with 3 or 4 children have the highest poverty rate, with 36 households (7.6%) falling below the poverty line. Among the single-parent households, those with 1 or 2 children have the highest poverty rate, with 540 household (37.8%) living below poverty.
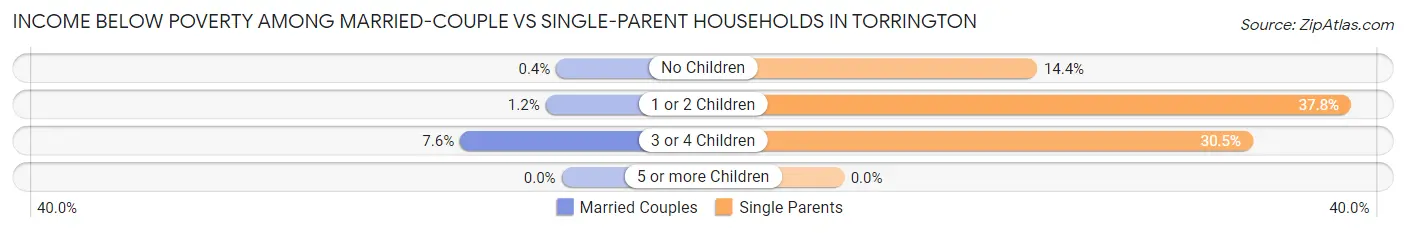
| Children | Married-Couple Families | Single-Parent Households |
| No Children | 15 (0.4%) | 182 (14.4%) |
| 1 or 2 Children | 18 (1.2%) | 540 (37.8%) |
| 3 or 4 Children | 36 (7.6%) | 132 (30.5%) |
| 5 or more Children | 0 (0.0%) | 0 (0.0%) |
| Total | 69 (1.2%) | 854 (27.3%) |
Race in Torrington
The most populous races in Torrington are White / Caucasian (25,744 | 72.5%), Hispanic or Latino (6,219 | 17.5%), and Black / African American (3,697 | 10.4%).
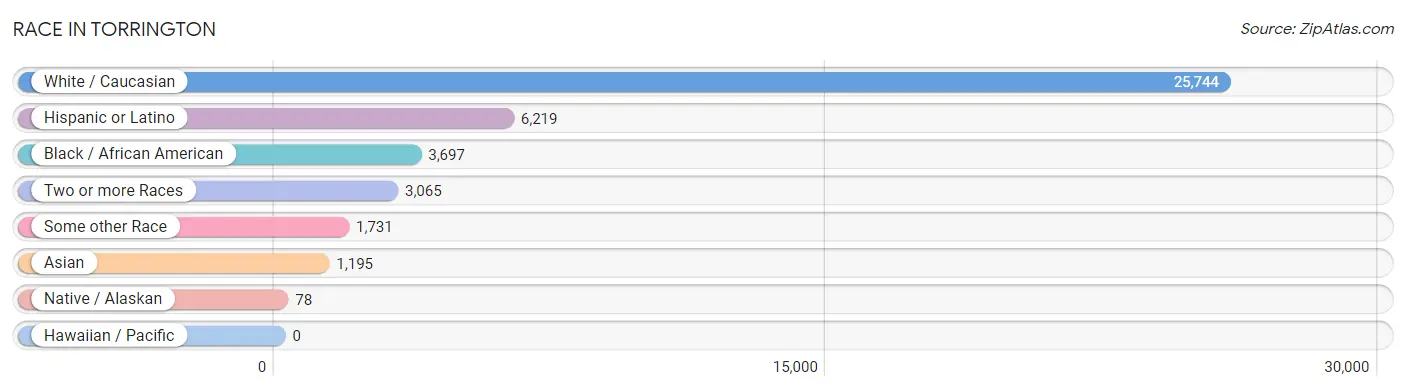
| Race | # Population | % Population |
| Asian | 1,195 | 3.4% |
| Black / African American | 3,697 | 10.4% |
| Hawaiian / Pacific | 0 | 0.0% |
| Hispanic or Latino | 6,219 | 17.5% |
| Native / Alaskan | 78 | 0.2% |
| White / Caucasian | 25,744 | 72.5% |
| Two or more Races | 3,065 | 8.6% |
| Some other Race | 1,731 | 4.9% |
| Total | 35,510 | 100.0% |
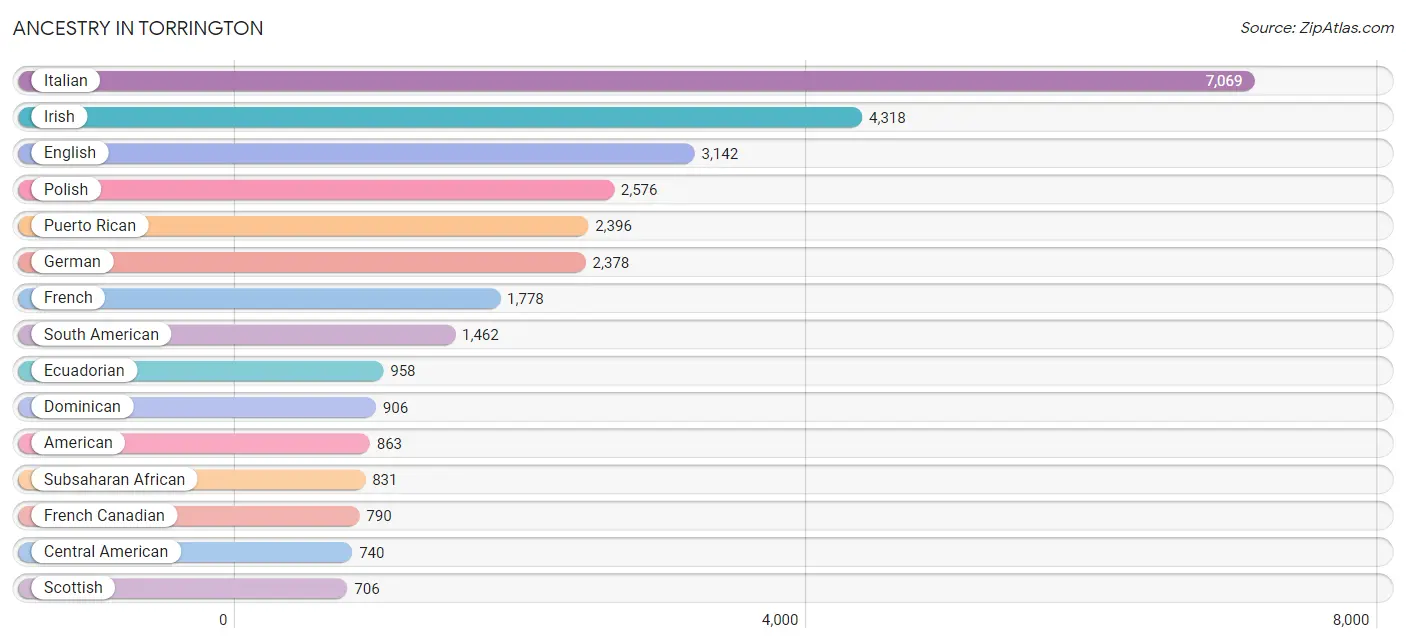
Ancestry in Torrington
The most populous ancestries reported in Torrington are Italian (7,069 | 19.9%), Irish (4,318 | 12.2%), English (3,142 | 8.8%), Polish (2,576 | 7.2%), and Puerto Rican (2,396 | 6.8%), together accounting for 54.9% of all Torrington residents.
| Ancestry | # Population | % Population |
| African | 596 | 1.7% |
| Albanian | 36 | 0.1% |
| American | 863 | 2.4% |
| Arab | 164 | 0.5% |
| Argentinean | 42 | 0.1% |
| Armenian | 7 | 0.0% |
| Austrian | 46 | 0.1% |
| Bhutanese | 142 | 0.4% |
| Blackfeet | 97 | 0.3% |
| Bolivian | 13 | 0.0% |
| Brazilian | 8 | 0.0% |
| British | 156 | 0.4% |
| Burmese | 438 | 1.2% |
| Canadian | 91 | 0.3% |
| Cape Verdean | 35 | 0.1% |
| Central American | 740 | 2.1% |
| Central American Indian | 36 | 0.1% |
| Cherokee | 87 | 0.3% |
| Chilean | 46 | 0.1% |
| Colombian | 199 | 0.6% |
| Costa Rican | 56 | 0.2% |
| Creek | 17 | 0.1% |
| Cuban | 107 | 0.3% |
| Czech | 229 | 0.6% |
| Czechoslovakian | 53 | 0.2% |
| Danish | 47 | 0.1% |
| Dominican | 906 | 2.5% |
| Dutch | 64 | 0.2% |
| Eastern European | 164 | 0.5% |
| Ecuadorian | 958 | 2.7% |
| Egyptian | 6 | 0.0% |
| English | 3,142 | 8.8% |
| Estonian | 16 | 0.1% |
| European | 457 | 1.3% |
| Finnish | 33 | 0.1% |
| French | 1,778 | 5.0% |
| French American Indian | 32 | 0.1% |
| French Canadian | 790 | 2.2% |
| German | 2,378 | 6.7% |
| Ghanaian | 86 | 0.2% |
| Greek | 91 | 0.3% |
| Guatemalan | 649 | 1.8% |
| Hungarian | 381 | 1.1% |
| Indian (Asian) | 104 | 0.3% |
| Indonesian | 40 | 0.1% |
| Irish | 4,318 | 12.2% |
| Iroquois | 12 | 0.0% |
| Italian | 7,069 | 19.9% |
| Jamaican | 362 | 1.0% |
| Japanese | 65 | 0.2% |
| Korean | 199 | 0.6% |
| Laotian | 88 | 0.3% |
| Latvian | 9 | 0.0% |
| Lebanese | 138 | 0.4% |
| Liberian | 79 | 0.2% |
| Lithuanian | 302 | 0.9% |
| Macedonian | 16 | 0.1% |
| Malaysian | 225 | 0.6% |
| Mexican | 260 | 0.7% |
| Mexican American Indian | 31 | 0.1% |
| Native Hawaiian | 68 | 0.2% |
| Nigerian | 120 | 0.3% |
| Northern European | 57 | 0.2% |
| Norwegian | 172 | 0.5% |
| Peruvian | 165 | 0.5% |
| Polish | 2,576 | 7.2% |
| Portuguese | 108 | 0.3% |
| Puerto Rican | 2,396 | 6.8% |
| Romanian | 63 | 0.2% |
| Russian | 286 | 0.8% |
| Salvadoran | 35 | 0.1% |
| Scotch-Irish | 52 | 0.2% |
| Scottish | 706 | 2.0% |
| Serbian | 24 | 0.1% |
| Slavic | 85 | 0.2% |
| Slovak | 434 | 1.2% |
| Slovene | 12 | 0.0% |
| Somali | 1 | 0.0% |
| South American | 1,462 | 4.1% |
| Soviet Union | 28 | 0.1% |
| Spaniard | 53 | 0.2% |
| Spanish | 83 | 0.2% |
| Sri Lankan | 71 | 0.2% |
| Subsaharan African | 831 | 2.3% |
| Swedish | 701 | 2.0% |
| Swiss | 125 | 0.4% |
| Syrian | 43 | 0.1% |
| Thai | 33 | 0.1% |
| Ukrainian | 75 | 0.2% |
| Uruguayan | 28 | 0.1% |
| Venezuelan | 11 | 0.0% |
| Welsh | 50 | 0.1% |
| Yugoslavian | 106 | 0.3% | View All 93 Rows |
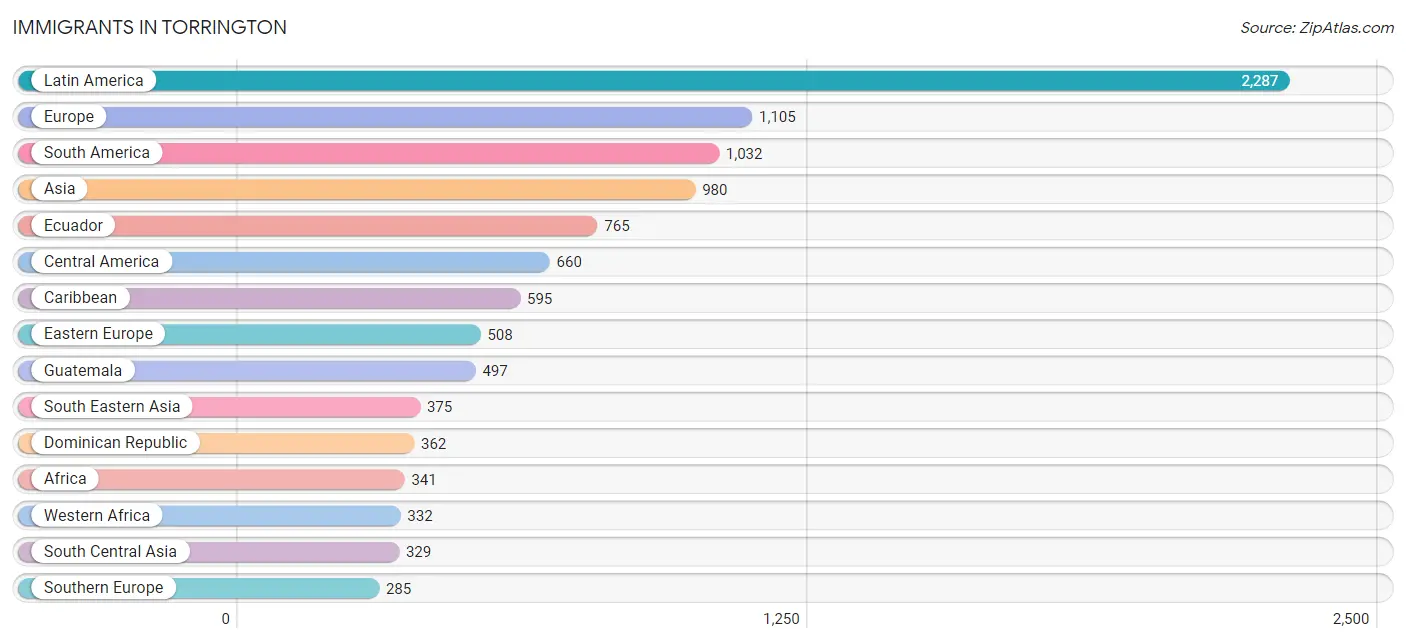
Immigrants in Torrington
The most numerous immigrant groups reported in Torrington came from Latin America (2,287 | 6.4%), Europe (1,105 | 3.1%), South America (1,032 | 2.9%), Asia (980 | 2.8%), and Ecuador (765 | 2.1%), together accounting for 17.4% of all Torrington residents.
| Immigration Origin | # Population | % Population |
| Africa | 341 | 1.0% |
| Albania | 19 | 0.1% |
| Asia | 980 | 2.8% |
| Bangladesh | 159 | 0.4% |
| Bolivia | 13 | 0.0% |
| Bosnia and Herzegovina | 59 | 0.2% |
| Brazil | 10 | 0.0% |
| Cambodia | 28 | 0.1% |
| Canada | 68 | 0.2% |
| Caribbean | 595 | 1.7% |
| Central America | 660 | 1.9% |
| China | 64 | 0.2% |
| Colombia | 167 | 0.5% |
| Costa Rica | 53 | 0.2% |
| Czechoslovakia | 16 | 0.1% |
| Dominican Republic | 362 | 1.0% |
| Eastern Asia | 269 | 0.8% |
| Eastern Europe | 508 | 1.4% |
| Ecuador | 765 | 2.1% |
| England | 57 | 0.2% |
| Europe | 1,105 | 3.1% |
| France | 43 | 0.1% |
| Germany | 25 | 0.1% |
| Ghana | 37 | 0.1% |
| Guatemala | 497 | 1.4% |
| Hungary | 28 | 0.1% |
| India | 66 | 0.2% |
| Indonesia | 61 | 0.2% |
| Ireland | 24 | 0.1% |
| Italy | 276 | 0.8% |
| Jamaica | 233 | 0.7% |
| Japan | 21 | 0.1% |
| Korea | 184 | 0.5% |
| Laos | 133 | 0.4% |
| Latin America | 2,287 | 6.4% |
| Latvia | 9 | 0.0% |
| Lebanon | 7 | 0.0% |
| Liberia | 49 | 0.1% |
| Mexico | 110 | 0.3% |
| North Macedonia | 16 | 0.1% |
| Northern Europe | 244 | 0.7% |
| Pakistan | 104 | 0.3% |
| Peru | 66 | 0.2% |
| Philippines | 143 | 0.4% |
| Poland | 222 | 0.6% |
| Portugal | 9 | 0.0% |
| Russia | 92 | 0.3% |
| Scotland | 23 | 0.1% |
| Sierra Leone | 66 | 0.2% |
| South America | 1,032 | 2.9% |
| South Central Asia | 329 | 0.9% |
| South Eastern Asia | 375 | 1.1% |
| Southern Europe | 285 | 0.8% |
| Sweden | 136 | 0.4% |
| Taiwan | 15 | 0.0% |
| Ukraine | 47 | 0.1% |
| Venezuela | 11 | 0.0% |
| Vietnam | 10 | 0.0% |
| Western Africa | 332 | 0.9% |
| Western Asia | 7 | 0.0% |
| Western Europe | 68 | 0.2% | View All 61 Rows |
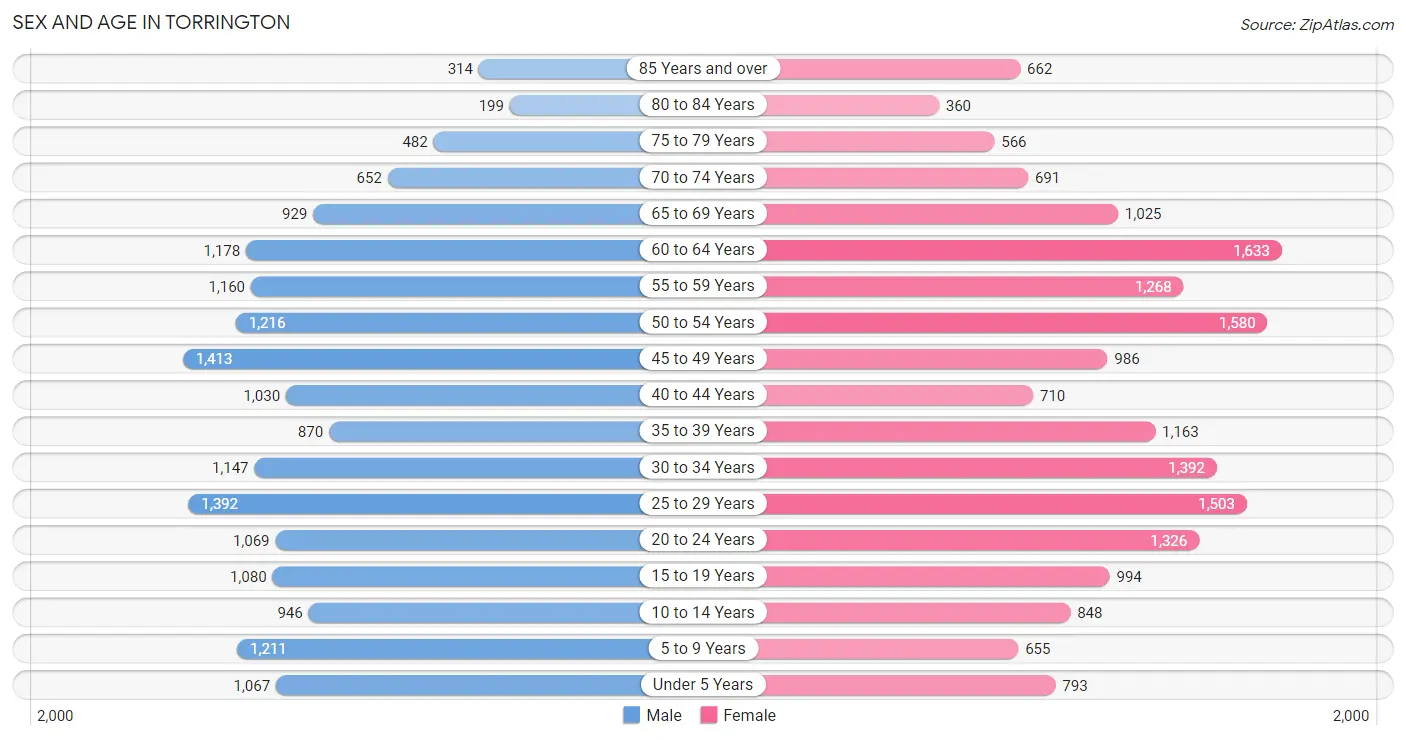
Sex and Age in Torrington
Sex and Age in Torrington
The most populous age groups in Torrington are 45 to 49 Years (1,413 | 8.1%) for men and 60 to 64 Years (1,633 | 9.0%) for women.
| Age Bracket | Male | Female |
| Under 5 Years | 1,067 (6.1%) | 793 (4.4%) |
| 5 to 9 Years | 1,211 (7.0%) | 655 (3.6%) |
| 10 to 14 Years | 946 (5.4%) | 848 (4.7%) |
| 15 to 19 Years | 1,080 (6.2%) | 994 (5.5%) |
| 20 to 24 Years | 1,069 (6.2%) | 1,326 (7.3%) |
| 25 to 29 Years | 1,392 (8.0%) | 1,503 (8.3%) |
| 30 to 34 Years | 1,147 (6.6%) | 1,392 (7.7%) |
| 35 to 39 Years | 870 (5.0%) | 1,163 (6.4%) |
| 40 to 44 Years | 1,030 (5.9%) | 710 (3.9%) |
| 45 to 49 Years | 1,413 (8.1%) | 986 (5.4%) |
| 50 to 54 Years | 1,216 (7.0%) | 1,580 (8.7%) |
| 55 to 59 Years | 1,160 (6.7%) | 1,268 (7.0%) |
| 60 to 64 Years | 1,178 (6.8%) | 1,633 (9.0%) |
| 65 to 69 Years | 929 (5.3%) | 1,025 (5.7%) |
| 70 to 74 Years | 652 (3.8%) | 691 (3.8%) |
| 75 to 79 Years | 482 (2.8%) | 566 (3.1%) |
| 80 to 84 Years | 199 (1.1%) | 360 (2.0%) |
| 85 Years and over | 314 (1.8%) | 662 (3.6%) |
| Total | 17,355 (100.0%) | 18,155 (100.0%) |
Families and Households in Torrington
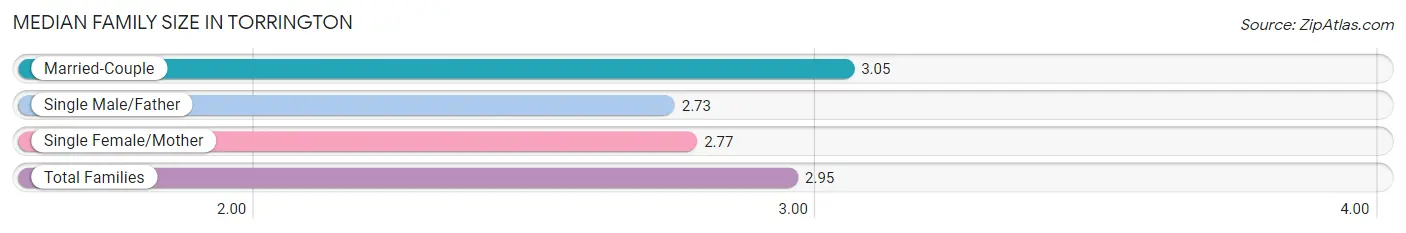
Median Family Size in Torrington
The median family size in Torrington is 2.95 persons per family, with married-couple families (5,754 | 64.8%) accounting for the largest median family size of 3.05 persons per family. On the other hand, single male/father families (780 | 8.8%) represent the smallest median family size with 2.73 persons per family.
| Family Type | # Families | Family Size |
| Married-Couple | 5,754 (64.8%) | 3.05 |
| Single Male/Father | 780 (8.8%) | 2.73 |
| Single Female/Mother | 2,346 (26.4%) | 2.77 |
| Total Families | 8,880 (100.0%) | 2.95 |
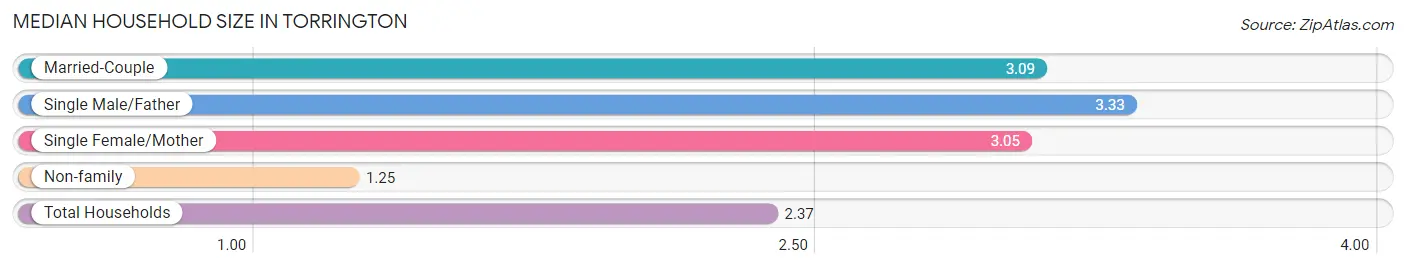
Median Household Size in Torrington
The median household size in Torrington is 2.37 persons per household, with single male/father households (780 | 5.3%) accounting for the largest median household size of 3.33 persons per household. non-family households (5,765 | 39.4%) represent the smallest median household size with 1.25 persons per household.
| Household Type | # Households | Household Size |
| Married-Couple | 5,754 (39.3%) | 3.09 |
| Single Male/Father | 780 (5.3%) | 3.33 |
| Single Female/Mother | 2,346 (16.0%) | 3.05 |
| Non-family | 5,765 (39.4%) | 1.25 |
| Total Households | 14,645 (100.0%) | 2.37 |
Household Size by Marriage Status in Torrington
Out of a total of 14,645 households in Torrington, 8,880 (60.6%) are family households, while 5,765 (39.4%) are nonfamily households. The most numerous type of family households are 2-person households, comprising 3,846, and the most common type of nonfamily households are 1-person households, comprising 4,444.
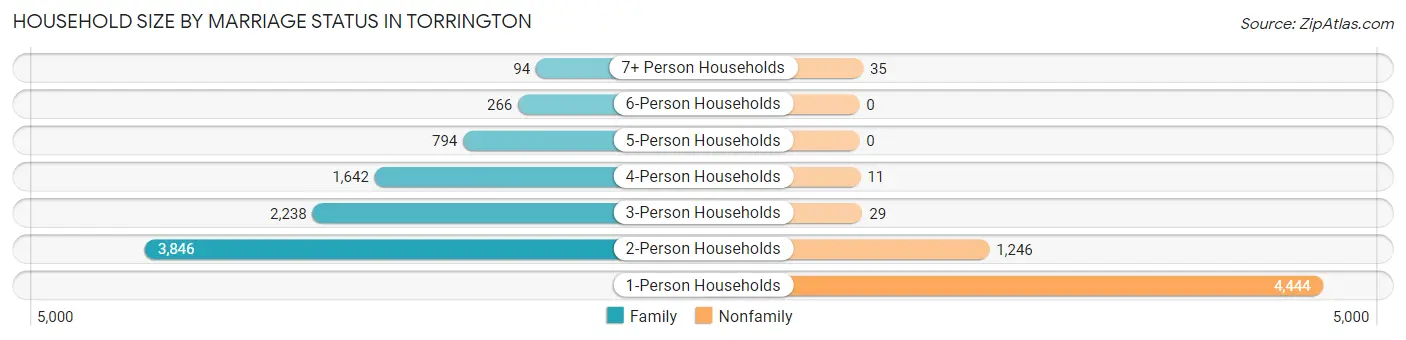
| Household Size | Family Households | Nonfamily Households |
| 1-Person Households | - | 4,444 (30.3%) |
| 2-Person Households | 3,846 (26.3%) | 1,246 (8.5%) |
| 3-Person Households | 2,238 (15.3%) | 29 (0.2%) |
| 4-Person Households | 1,642 (11.2%) | 11 (0.1%) |
| 5-Person Households | 794 (5.4%) | 0 (0.0%) |
| 6-Person Households | 266 (1.8%) | 0 (0.0%) |
| 7+ Person Households | 94 (0.6%) | 35 (0.2%) |
| Total | 8,880 (60.6%) | 5,765 (39.4%) |
Female Fertility in Torrington
Fertility by Age in Torrington
Average fertility rate in Torrington is 35.0 births per 1,000 women. Women in the age bracket of 20 to 34 years have the highest fertility rate with 49.0 births per 1,000 women. Women in the age bracket of 20 to 34 years acount for 71.5% of all women with births.
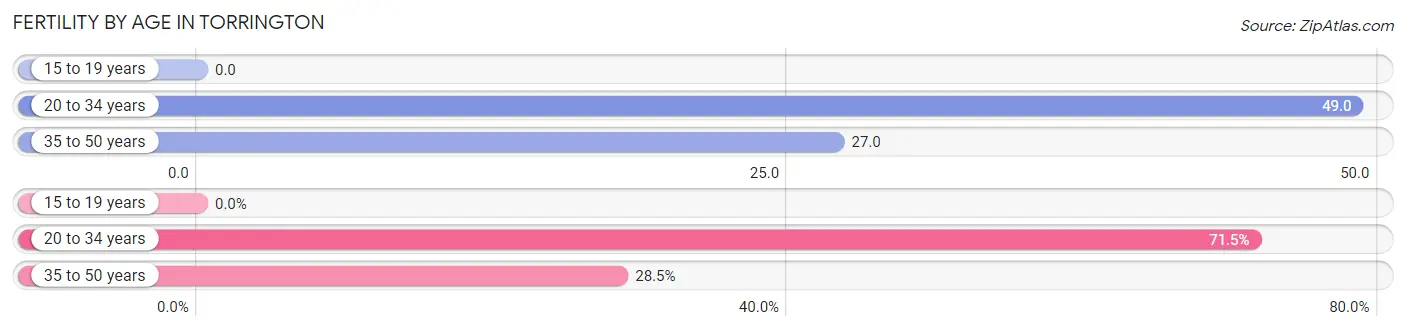
| Age Bracket | Women with Births | Births / 1,000 Women |
| 15 to 19 years | 0 (0.0%) | 0.0 |
| 20 to 34 years | 208 (71.5%) | 49.0 |
| 35 to 50 years | 83 (28.5%) | 27.0 |
| Total | 291 (100.0%) | 35.0 |
Fertility by Age by Marriage Status in Torrington
46.4% of women with births (291) in Torrington are married. The highest percentage of unmarried women with births falls into 20 to 34 years age bracket with 56.2% of them unmarried at the time of birth, while the lowest percentage of unmarried women with births belong to 35 to 50 years age bracket with 47.0% of them unmarried.
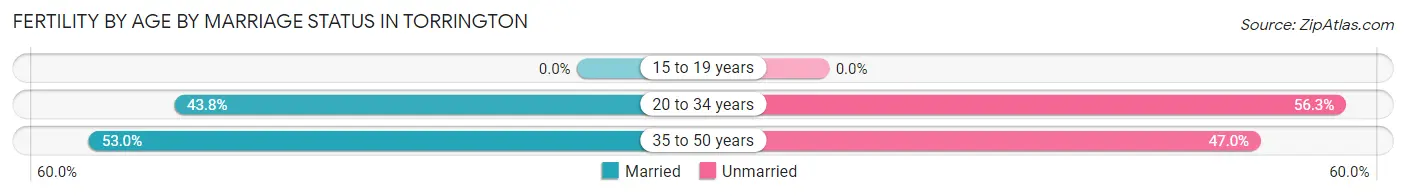
| Age Bracket | Married | Unmarried |
| 15 to 19 years | 0 (0.0%) | 0 (0.0%) |
| 20 to 34 years | 91 (43.8%) | 117 (56.2%) |
| 35 to 50 years | 44 (53.0%) | 39 (47.0%) |
| Total | 135 (46.4%) | 156 (53.6%) |
Fertility by Education in Torrington
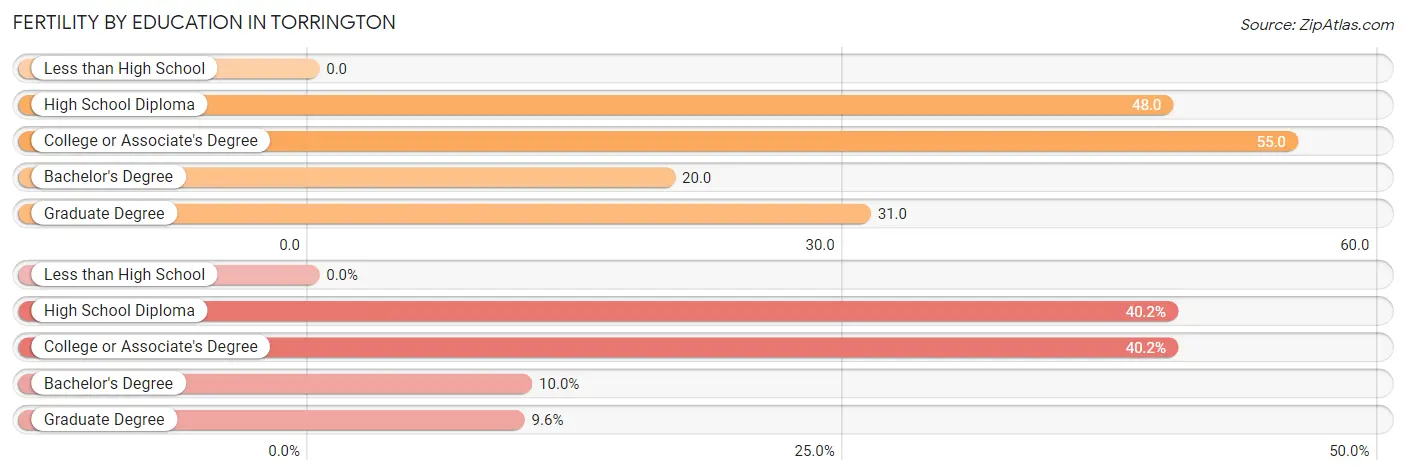
| Educational Attainment | Women with Births | Births / 1,000 Women |
| Less than High School | 0 (0.0%) | 0.0 |
| High School Diploma | 117 (40.2%) | 48.0 |
| College or Associate's Degree | 117 (40.2%) | 55.0 |
| Bachelor's Degree | 29 (10.0%) | 20.0 |
| Graduate Degree | 28 (9.6%) | 31.0 |
| Total | 291 (100.0%) | 35.0 |
Fertility by Education by Marriage Status in Torrington
53.6% of women with births in Torrington are unmarried. Women with the educational attainment of bachelor's degree are most likely to be married with 100.0% of them married at childbirth, while women with the educational attainment of high school diploma are least likely to be married with 100.0% of them unmarried at childbirth.
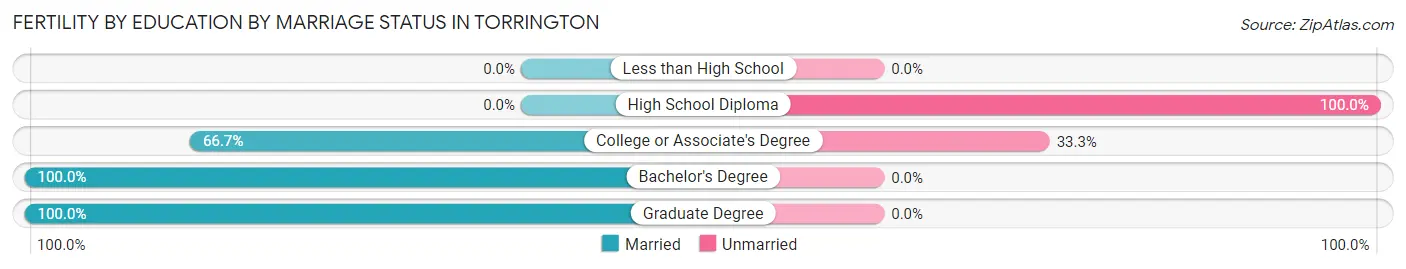
| Educational Attainment | Married | Unmarried |
| Less than High School | 0 (0.0%) | 0 (0.0%) |
| High School Diploma | 0 (0.0%) | 117 (100.0%) |
| College or Associate's Degree | 78 (66.7%) | 39 (33.3%) |
| Bachelor's Degree | 29 (100.0%) | 0 (0.0%) |
| Graduate Degree | 28 (100.0%) | 0 (0.0%) |
| Total | 135 (46.4%) | 156 (53.6%) |
Employment Characteristics in Torrington
Employment by Class of Employer in Torrington
Among the 17,910 employed individuals in Torrington, private company employees (12,764 | 71.3%), not-for-profit organizations (1,916 | 10.7%), and local government employees (1,202 | 6.7%) make up the most common classes of employment.

| Employer Class | # Employees | % Employees |
| Private Company Employees | 12,764 | 71.3% |
| Self-Employed (Incorporated) | 376 | 2.1% |
| Self-Employed (Not Incorporated) | 846 | 4.7% |
| Not-for-profit Organizations | 1,916 | 10.7% |
| Local Government Employees | 1,202 | 6.7% |
| State Government Employees | 504 | 2.8% |
| Federal Government Employees | 274 | 1.5% |
| Unpaid Family Workers | 28 | 0.2% |
| Total | 17,910 | 100.0% |
Employment Status by Age in Torrington
According to the labor force statistics for Torrington, out of the total population over 16 years of age (29,517), 65.9% or 19,452 individuals are in the labor force, with 5.8% or 1,128 of them unemployed. The age group with the highest labor force participation rate is 35 to 44 years, with 88.9% or 3,354 individuals in the labor force. Within the labor force, the 16 to 19 years age range has the highest percentage of unemployed individuals, with 12.6% or 101 of them being unemployed.
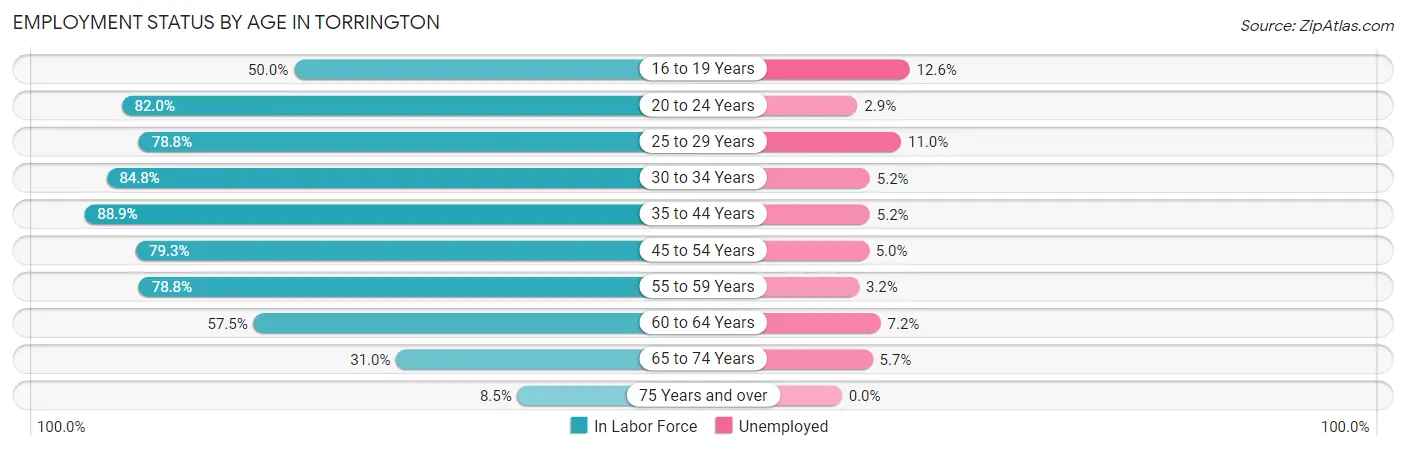
| Age Bracket | In Labor Force | Unemployed |
| 16 to 19 Years | 800 (50.0%) | 101 (12.6%) |
| 20 to 24 Years | 1,964 (82.0%) | 57 (2.9%) |
| 25 to 29 Years | 2,281 (78.8%) | 251 (11.0%) |
| 30 to 34 Years | 2,153 (84.8%) | 112 (5.2%) |
| 35 to 44 Years | 3,354 (88.9%) | 174 (5.2%) |
| 45 to 54 Years | 4,120 (79.3%) | 206 (5.0%) |
| 55 to 59 Years | 1,913 (78.8%) | 61 (3.2%) |
| 60 to 64 Years | 1,616 (57.5%) | 116 (7.2%) |
| 65 to 74 Years | 1,022 (31.0%) | 58 (5.7%) |
| 75 Years and over | 220 (8.5%) | 0 (0.0%) |
| Total | 19,452 (65.9%) | 1,128 (5.8%) |
Employment Status by Educational Attainment in Torrington
According to labor force statistics for Torrington, 78.6% of individuals (15,438) out of the total population between 25 and 64 years of age (19,641) are in the labor force, with 6.0% or 926 of them being unemployed. The group with the highest labor force participation rate are those with the educational attainment of bachelor's degree or higher, with 86.6% or 4,408 individuals in the labor force. Within the labor force, individuals with less than high school education have the highest percentage of unemployment, with 11.3% or 159 of them being unemployed.
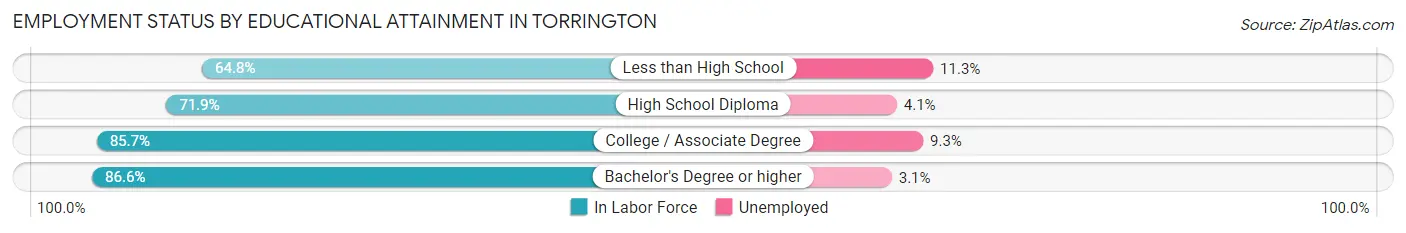
| Educational Attainment | In Labor Force | Unemployed |
| Less than High School | 1,408 (64.8%) | 246 (11.3%) |
| High School Diploma | 5,137 (71.9%) | 293 (4.1%) |
| College / Associate Degree | 4,486 (85.7%) | 487 (9.3%) |
| Bachelor's Degree or higher | 4,408 (86.6%) | 158 (3.1%) |
| Total | 15,438 (78.6%) | 1,178 (6.0%) |
Employment Occupations by Sex in Torrington
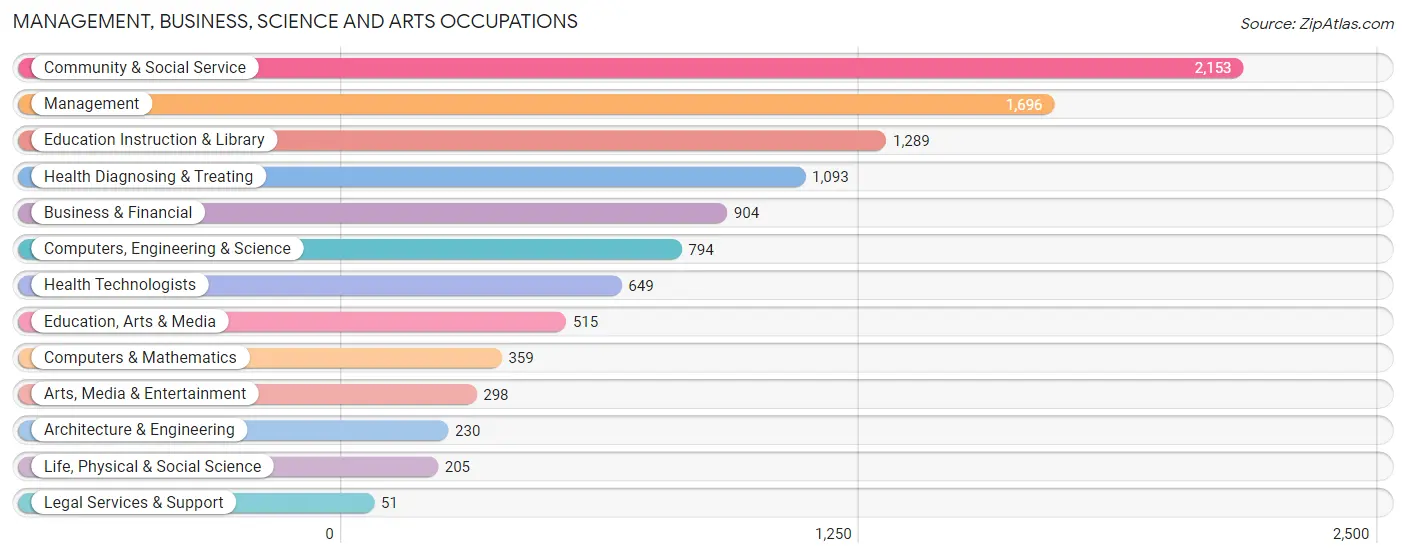
Management, Business, Science and Arts Occupations
The most common Management, Business, Science and Arts occupations in Torrington are Community & Social Service (2,153 | 11.8%), Management (1,696 | 9.3%), Education Instruction & Library (1,289 | 7.0%), Health Diagnosing & Treating (1,093 | 6.0%), and Business & Financial (904 | 4.9%).
Management, Business, Science and Arts Occupations by Sex
Within the Management, Business, Science and Arts occupations in Torrington, the most male-oriented occupations are Computers & Mathematics (94.4%), Architecture & Engineering (86.5%), and Computers, Engineering & Science (74.9%), while the most female-oriented occupations are Legal Services & Support (100.0%), Health Technologists (91.2%), and Health Diagnosing & Treating (90.5%).
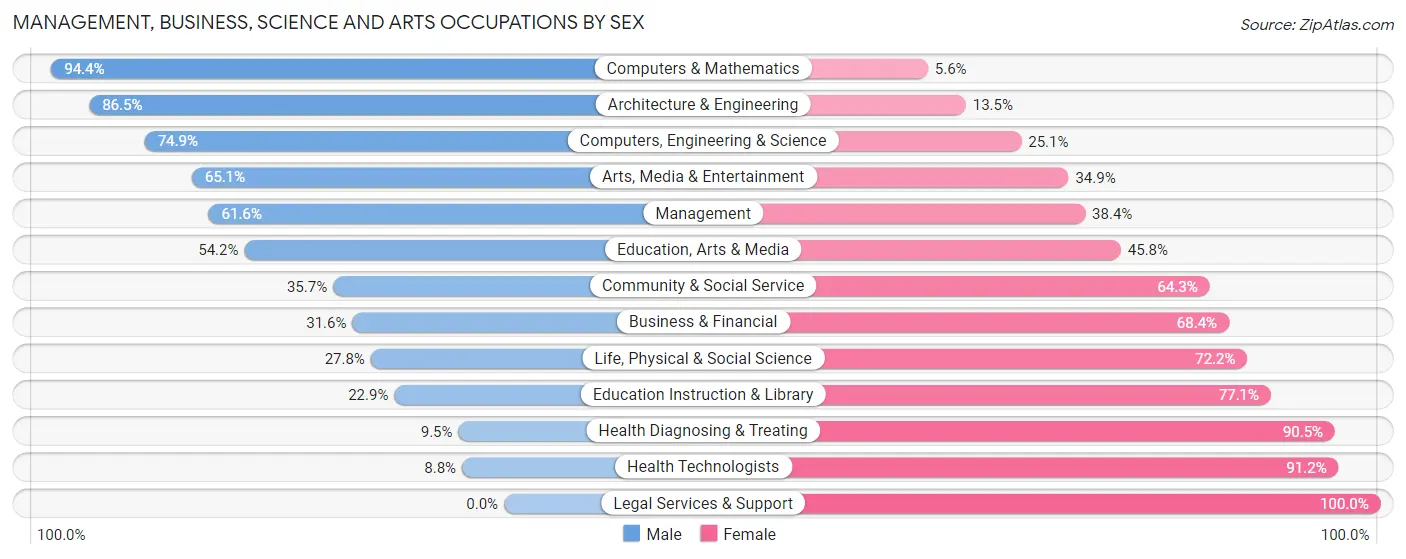
| Occupation | Male | Female |
| Management | 1,045 (61.6%) | 651 (38.4%) |
| Business & Financial | 286 (31.6%) | 618 (68.4%) |
| Computers, Engineering & Science | 595 (74.9%) | 199 (25.1%) |
| Computers & Mathematics | 339 (94.4%) | 20 (5.6%) |
| Architecture & Engineering | 199 (86.5%) | 31 (13.5%) |
| Life, Physical & Social Science | 57 (27.8%) | 148 (72.2%) |
| Community & Social Service | 768 (35.7%) | 1,385 (64.3%) |
| Education, Arts & Media | 279 (54.2%) | 236 (45.8%) |
| Legal Services & Support | 0 (0.0%) | 51 (100.0%) |
| Education Instruction & Library | 295 (22.9%) | 994 (77.1%) |
| Arts, Media & Entertainment | 194 (65.1%) | 104 (34.9%) |
| Health Diagnosing & Treating | 104 (9.5%) | 989 (90.5%) |
| Health Technologists | 57 (8.8%) | 592 (91.2%) |
| Total (Category) | 2,798 (42.1%) | 3,842 (57.9%) |
| Total (Overall) | 9,440 (51.6%) | 8,870 (48.4%) |
Services Occupations
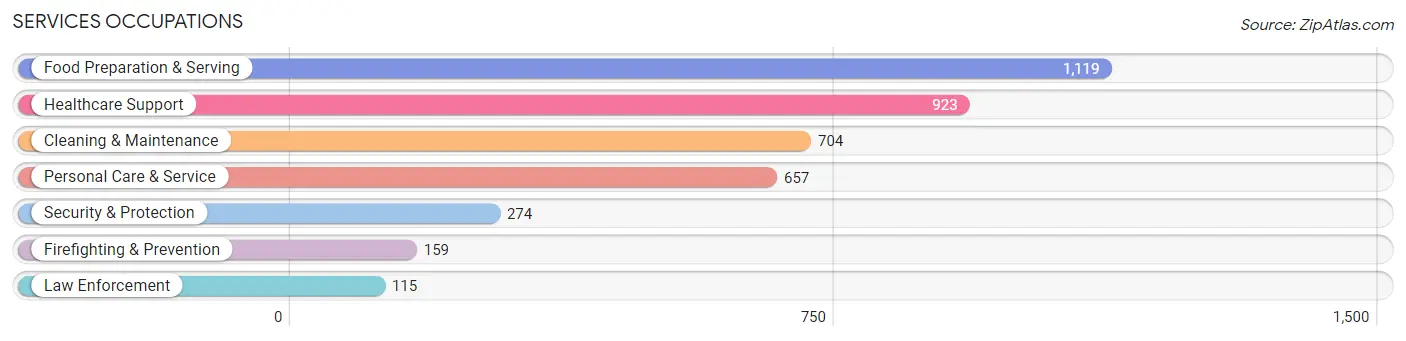
The most common Services occupations in Torrington are Food Preparation & Serving (1,119 | 6.1%), Healthcare Support (923 | 5.0%), Cleaning & Maintenance (704 | 3.8%), Personal Care & Service (657 | 3.6%), and Security & Protection (274 | 1.5%).
Services Occupations by Sex
Within the Services occupations in Torrington, the most male-oriented occupations are Law Enforcement (100.0%), Security & Protection (92.7%), and Firefighting & Prevention (87.4%), while the most female-oriented occupations are Personal Care & Service (85.8%), Healthcare Support (85.6%), and Food Preparation & Serving (61.1%).
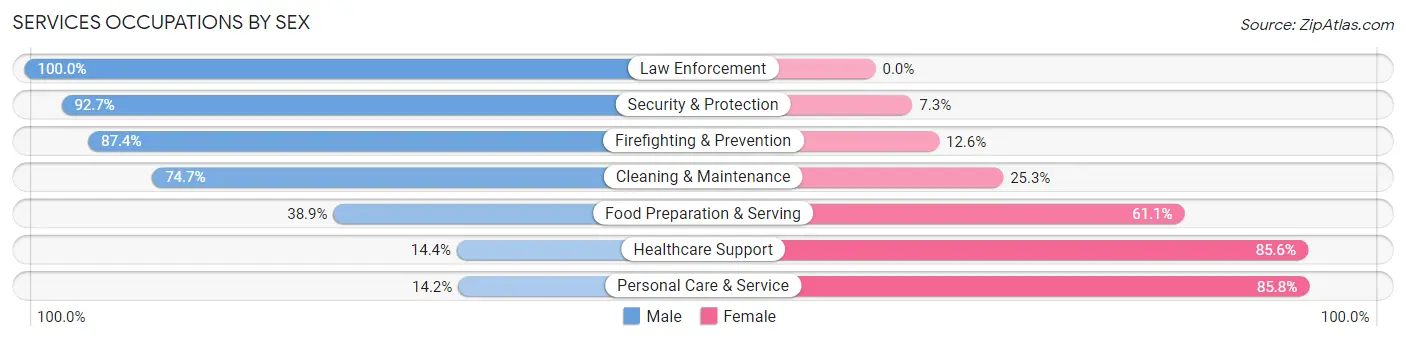
| Occupation | Male | Female |
| Healthcare Support | 133 (14.4%) | 790 (85.6%) |
| Security & Protection | 254 (92.7%) | 20 (7.3%) |
| Firefighting & Prevention | 139 (87.4%) | 20 (12.6%) |
| Law Enforcement | 115 (100.0%) | 0 (0.0%) |
| Food Preparation & Serving | 435 (38.9%) | 684 (61.1%) |
| Cleaning & Maintenance | 526 (74.7%) | 178 (25.3%) |
| Personal Care & Service | 93 (14.2%) | 564 (85.8%) |
| Total (Category) | 1,441 (39.2%) | 2,236 (60.8%) |
| Total (Overall) | 9,440 (51.6%) | 8,870 (48.4%) |
Sales and Office Occupations
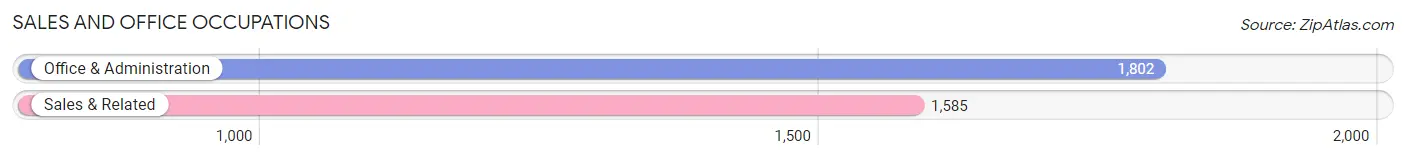
The most common Sales and Office occupations in Torrington are Office & Administration (1,802 | 9.8%), and Sales & Related (1,585 | 8.7%).
Sales and Office Occupations by Sex
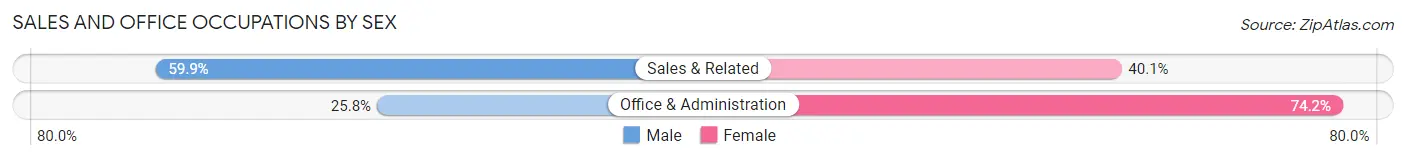
| Occupation | Male | Female |
| Sales & Related | 949 (59.9%) | 636 (40.1%) |
| Office & Administration | 465 (25.8%) | 1,337 (74.2%) |
| Total (Category) | 1,414 (41.7%) | 1,973 (58.3%) |
| Total (Overall) | 9,440 (51.6%) | 8,870 (48.4%) |
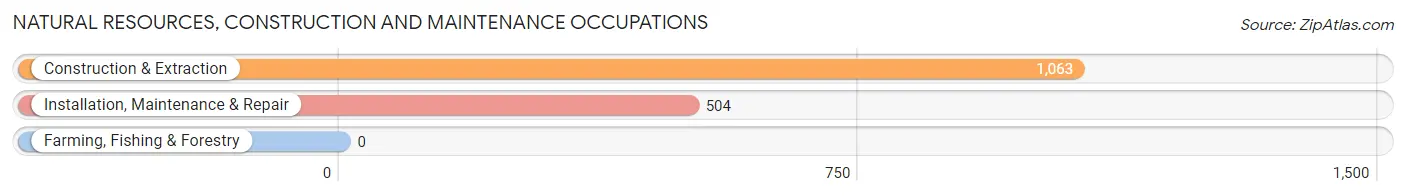
Natural Resources, Construction and Maintenance Occupations
The most common Natural Resources, Construction and Maintenance occupations in Torrington are Construction & Extraction (1,063 | 5.8%), and Installation, Maintenance & Repair (504 | 2.8%).
Natural Resources, Construction and Maintenance Occupations by Sex
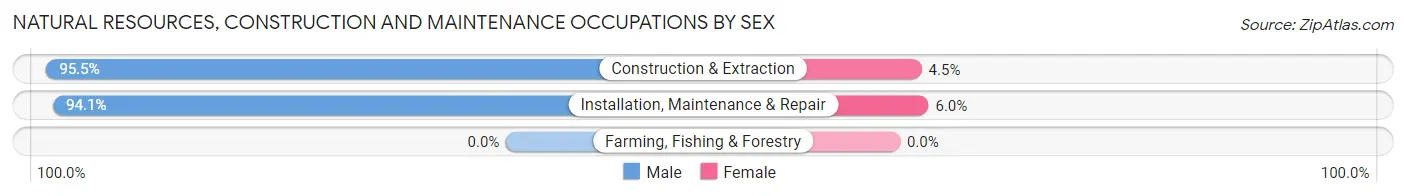
| Occupation | Male | Female |
| Farming, Fishing & Forestry | 0 (0.0%) | 0 (0.0%) |
| Construction & Extraction | 1,015 (95.5%) | 48 (4.5%) |
| Installation, Maintenance & Repair | 474 (94.1%) | 30 (5.9%) |
| Total (Category) | 1,489 (95.0%) | 78 (5.0%) |
| Total (Overall) | 9,440 (51.6%) | 8,870 (48.4%) |
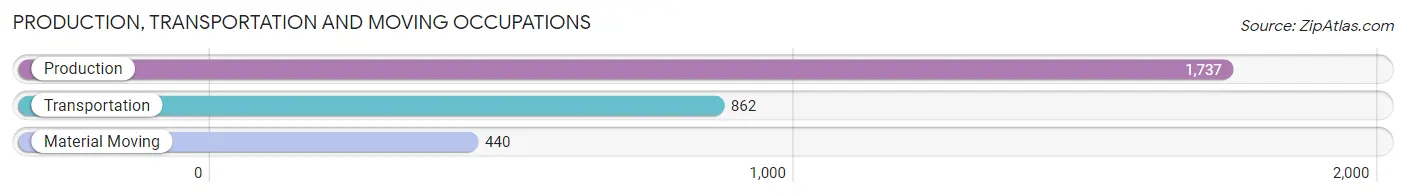
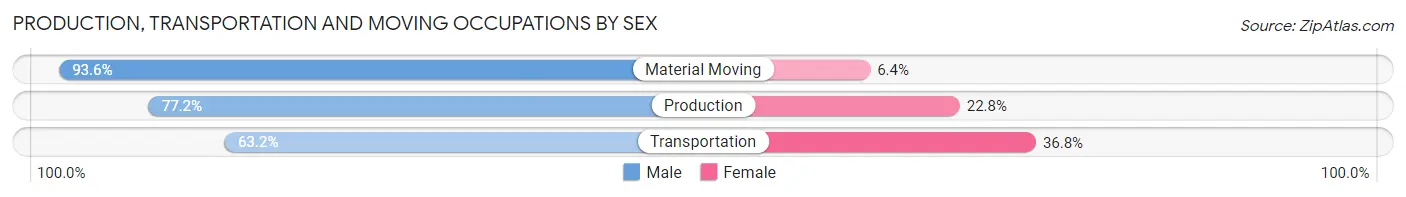
Production, Transportation and Moving Occupations
The most common Production, Transportation and Moving occupations in Torrington are Production (1,737 | 9.5%), Transportation (862 | 4.7%), and Material Moving (440 | 2.4%).
Production, Transportation and Moving Occupations by Sex
| Occupation | Male | Female |
| Production | 1,341 (77.2%) | 396 (22.8%) |
| Transportation | 545 (63.2%) | 317 (36.8%) |
| Material Moving | 412 (93.6%) | 28 (6.4%) |
| Total (Category) | 2,298 (75.6%) | 741 (24.4%) |
| Total (Overall) | 9,440 (51.6%) | 8,870 (48.4%) |
Employment Industries by Sex in Torrington
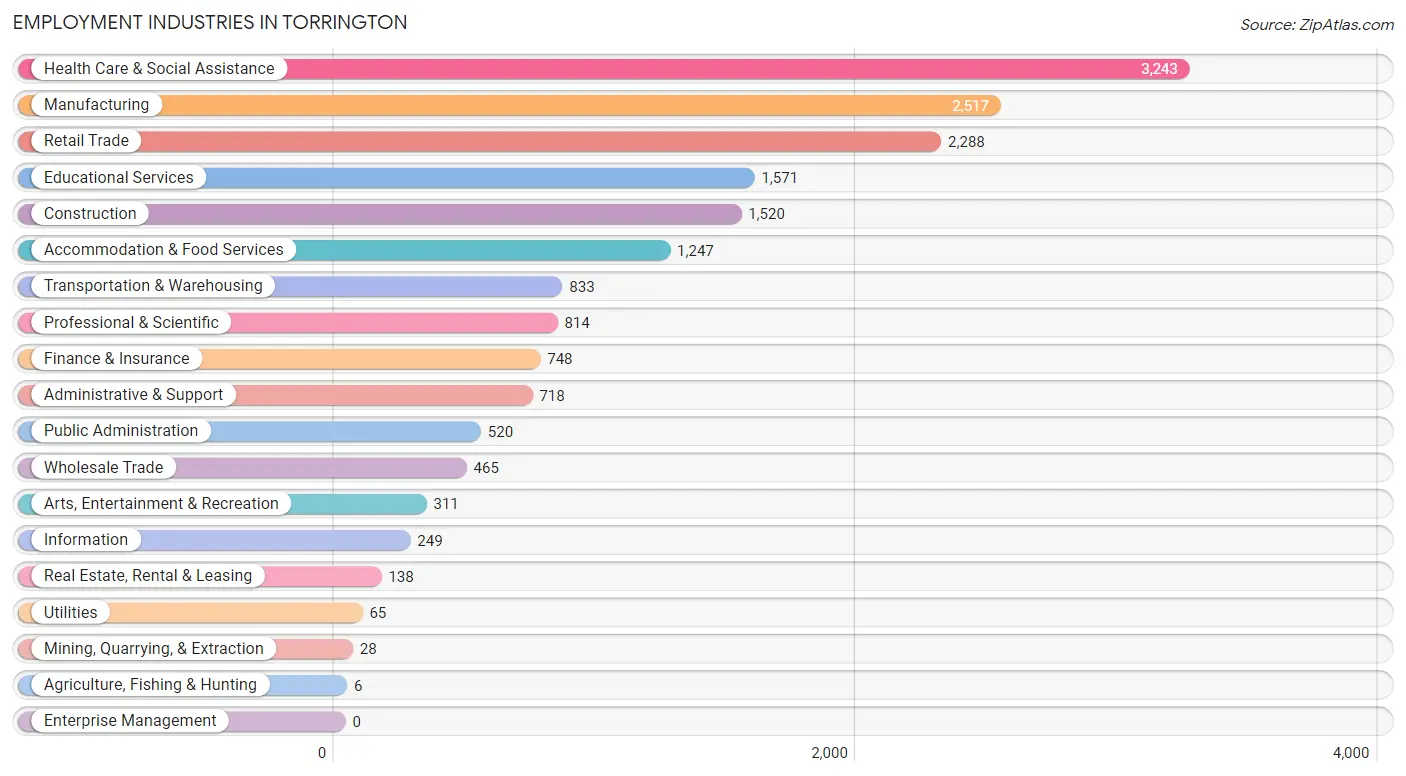
Employment Industries in Torrington
The major employment industries in Torrington include Health Care & Social Assistance (3,243 | 17.7%), Manufacturing (2,517 | 13.8%), Retail Trade (2,288 | 12.5%), Educational Services (1,571 | 8.6%), and Construction (1,520 | 8.3%).
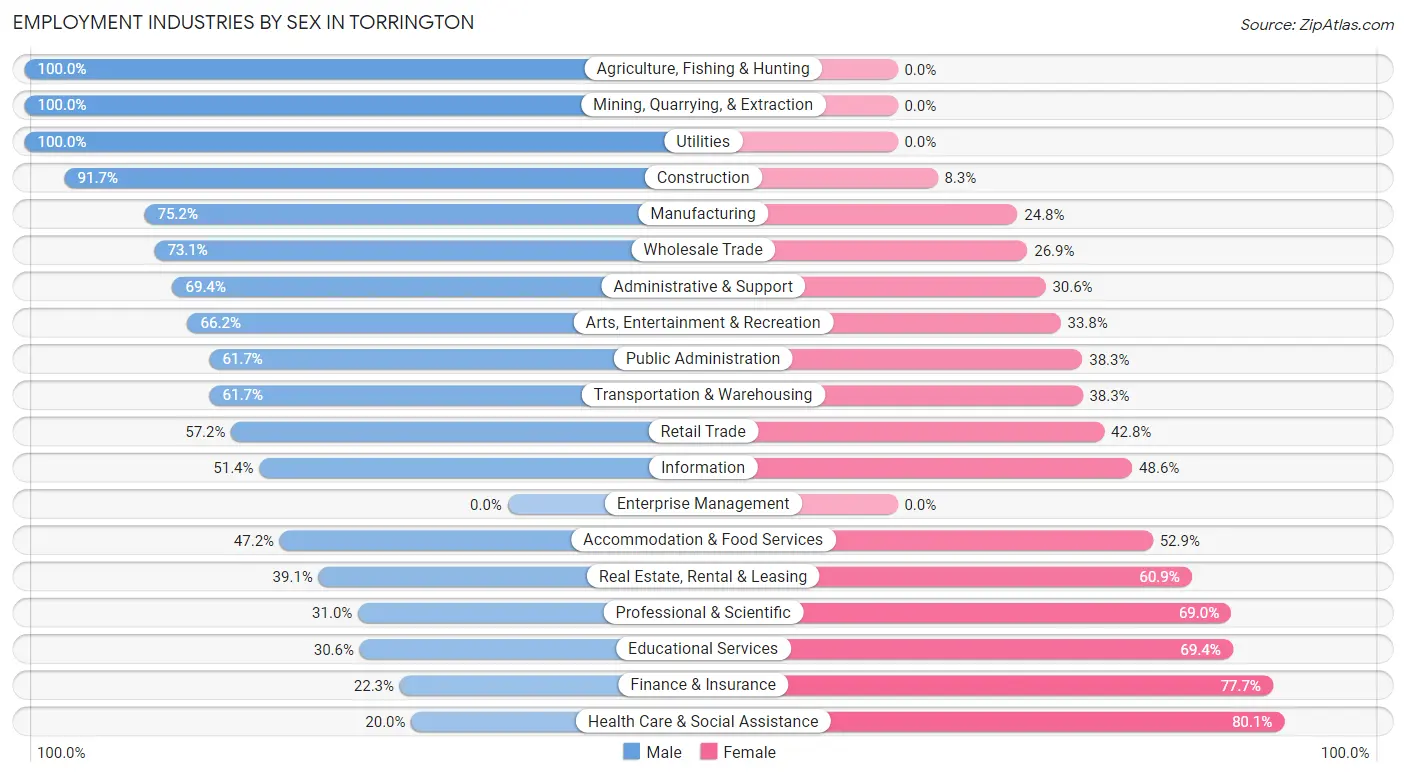
Employment Industries by Sex in Torrington
The Torrington industries that see more men than women are Agriculture, Fishing & Hunting (100.0%), Mining, Quarrying, & Extraction (100.0%), and Utilities (100.0%), whereas the industries that tend to have a higher number of women are Health Care & Social Assistance (80.0%), Finance & Insurance (77.7%), and Educational Services (69.4%).
| Industry | Male | Female |
| Agriculture, Fishing & Hunting | 6 (100.0%) | 0 (0.0%) |
| Mining, Quarrying, & Extraction | 28 (100.0%) | 0 (0.0%) |
| Construction | 1,394 (91.7%) | 126 (8.3%) |
| Manufacturing | 1,892 (75.2%) | 625 (24.8%) |
| Wholesale Trade | 340 (73.1%) | 125 (26.9%) |
| Retail Trade | 1,309 (57.2%) | 979 (42.8%) |
| Transportation & Warehousing | 514 (61.7%) | 319 (38.3%) |
| Utilities | 65 (100.0%) | 0 (0.0%) |
| Information | 128 (51.4%) | 121 (48.6%) |
| Finance & Insurance | 167 (22.3%) | 581 (77.7%) |
| Real Estate, Rental & Leasing | 54 (39.1%) | 84 (60.9%) |
| Professional & Scientific | 252 (31.0%) | 562 (69.0%) |
| Enterprise Management | 0 (0.0%) | 0 (0.0%) |
| Administrative & Support | 498 (69.4%) | 220 (30.6%) |
| Educational Services | 481 (30.6%) | 1,090 (69.4%) |
| Health Care & Social Assistance | 647 (20.0%) | 2,596 (80.0%) |
| Arts, Entertainment & Recreation | 206 (66.2%) | 105 (33.8%) |
| Accommodation & Food Services | 588 (47.1%) | 659 (52.8%) |
| Public Administration | 321 (61.7%) | 199 (38.3%) |
| Total | 9,440 (51.6%) | 8,870 (48.4%) |
Education in Torrington
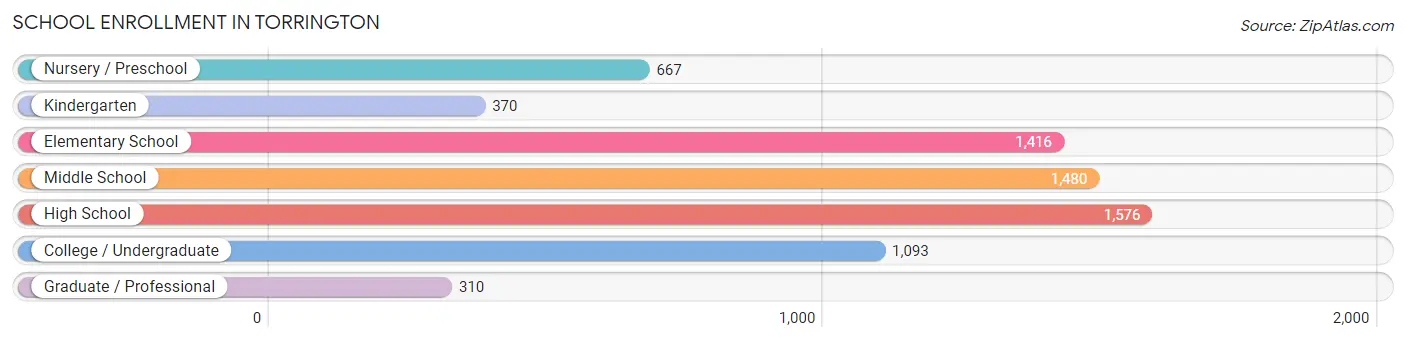
School Enrollment in Torrington
The most common levels of schooling among the 6,912 students in Torrington are high school (1,576 | 22.8%), middle school (1,480 | 21.4%), and elementary school (1,416 | 20.5%).
| School Level | # Students | % Students |
| Nursery / Preschool | 667 | 9.7% |
| Kindergarten | 370 | 5.3% |
| Elementary School | 1,416 | 20.5% |
| Middle School | 1,480 | 21.4% |
| High School | 1,576 | 22.8% |
| College / Undergraduate | 1,093 | 15.8% |
| Graduate / Professional | 310 | 4.5% |
| Total | 6,912 | 100.0% |
School Enrollment by Age by Funding Source in Torrington
Out of a total of 6,912 students who are enrolled in schools in Torrington, 926 (13.4%) attend a private institution, while the remaining 5,986 (86.6%) are enrolled in public schools. The age group of 25 to 34 year olds has the highest likelihood of being enrolled in private schools, with 80 (28.1% in the age bracket) enrolled. Conversely, the age group of 10 to 14 year olds has the lowest likelihood of being enrolled in a private school, with 1,630 (96.1% in the age bracket) attending a public institution.
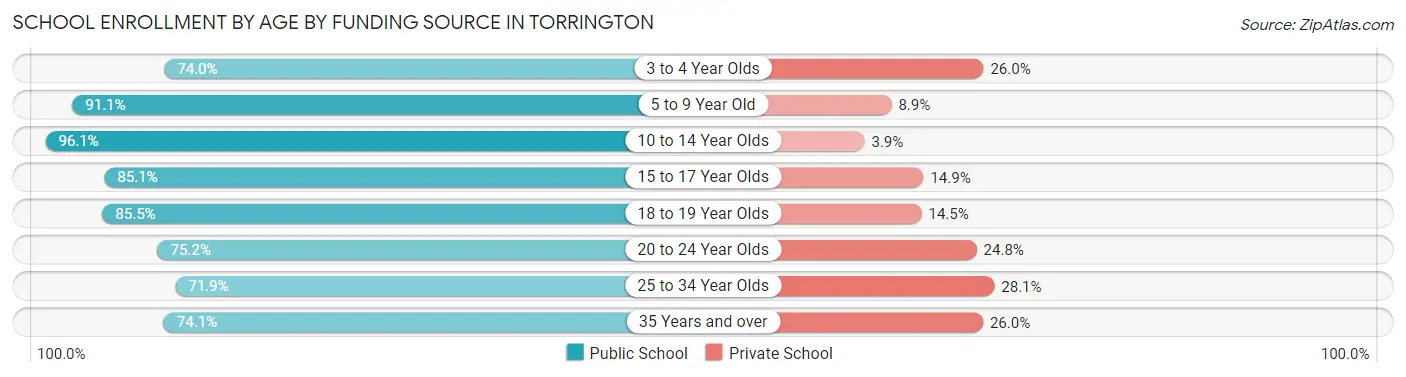
| Age Bracket | Public School | Private School |
| 3 to 4 Year Olds | 392 (74.0%) | 138 (26.0%) |
| 5 to 9 Year Old | 1,637 (91.1%) | 160 (8.9%) |
| 10 to 14 Year Olds | 1,630 (96.1%) | 66 (3.9%) |
| 15 to 17 Year Olds | 1,013 (85.1%) | 177 (14.9%) |
| 18 to 19 Year Olds | 401 (85.5%) | 68 (14.5%) |
| 20 to 24 Year Olds | 334 (75.2%) | 110 (24.8%) |
| 25 to 34 Year Olds | 205 (71.9%) | 80 (28.1%) |
| 35 Years and over | 371 (74.1%) | 130 (26.0%) |
| Total | 5,986 (86.6%) | 926 (13.4%) |
Educational Attainment by Field of Study in Torrington
Education (966 | 14.5%), business (908 | 13.6%), science & technology (816 | 12.2%), social sciences (721 | 10.8%), and arts & humanities (554 | 8.3%) are the most common fields of study among 6,673 individuals in Torrington who have obtained a bachelor's degree or higher.
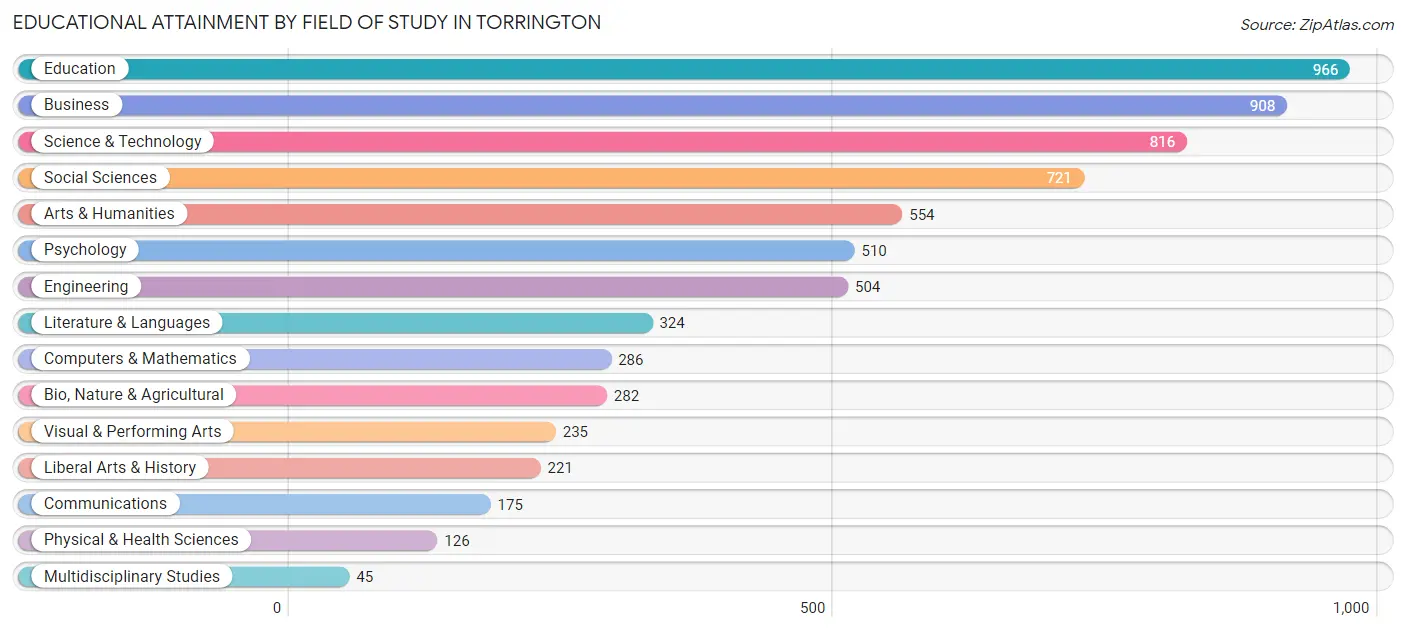
| Field of Study | # Graduates | % Graduates |
| Computers & Mathematics | 286 | 4.3% |
| Bio, Nature & Agricultural | 282 | 4.2% |
| Physical & Health Sciences | 126 | 1.9% |
| Psychology | 510 | 7.6% |
| Social Sciences | 721 | 10.8% |
| Engineering | 504 | 7.5% |
| Multidisciplinary Studies | 45 | 0.7% |
| Science & Technology | 816 | 12.2% |
| Business | 908 | 13.6% |
| Education | 966 | 14.5% |
| Literature & Languages | 324 | 4.9% |
| Liberal Arts & History | 221 | 3.3% |
| Visual & Performing Arts | 235 | 3.5% |
| Communications | 175 | 2.6% |
| Arts & Humanities | 554 | 8.3% |
| Total | 6,673 | 100.0% |
Transportation & Commute in Torrington
Vehicle Availability by Sex in Torrington
The most prevalent vehicle ownership categories in Torrington are males with 2 vehicles (4,257, accounting for 46.4%) and females with 2 vehicles (3,503, making up 48.8%).
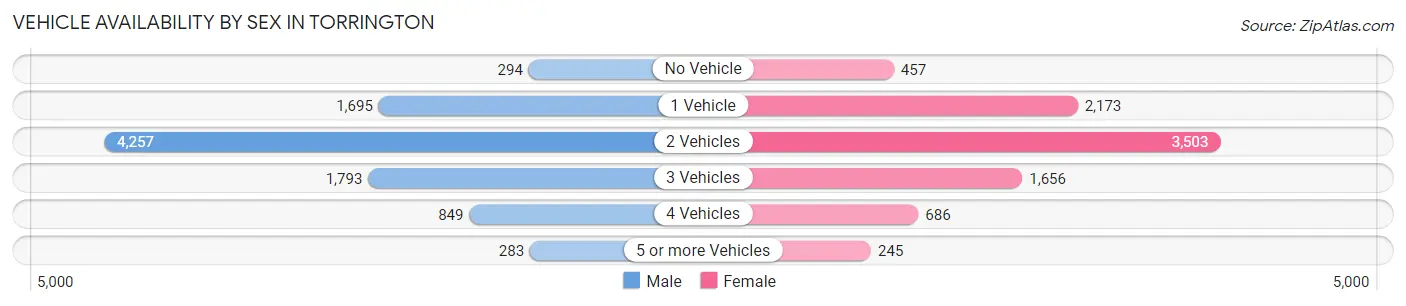
| Vehicles Available | Male | Female |
| No Vehicle | 294 (3.2%) | 457 (5.2%) |
| 1 Vehicle | 1,695 (18.5%) | 2,173 (24.9%) |
| 2 Vehicles | 4,257 (46.4%) | 3,503 (40.2%) |
| 3 Vehicles | 1,793 (19.6%) | 1,656 (19.0%) |
| 4 Vehicles | 849 (9.3%) | 686 (7.9%) |
| 5 or more Vehicles | 283 (3.1%) | 245 (2.8%) |
| Total | 9,171 (100.0%) | 8,720 (100.0%) |
Commute Time in Torrington
The most frequently occuring commute durations in Torrington are 10 to 14 minutes (2,692 commuters, 16.0%), 5 to 9 minutes (2,256 commuters, 13.4%), and 45 to 59 minutes (2,196 commuters, 13.1%).
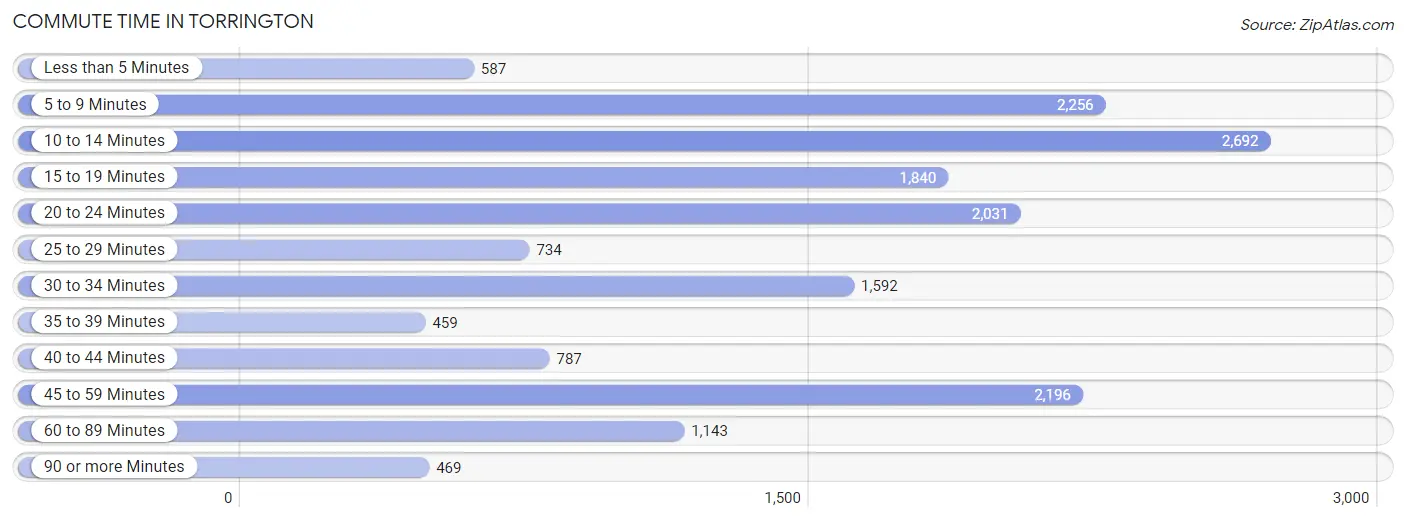
| Commute Time | # Commuters | % Commuters |
| Less than 5 Minutes | 587 | 3.5% |
| 5 to 9 Minutes | 2,256 | 13.4% |
| 10 to 14 Minutes | 2,692 | 16.0% |
| 15 to 19 Minutes | 1,840 | 11.0% |
| 20 to 24 Minutes | 2,031 | 12.1% |
| 25 to 29 Minutes | 734 | 4.4% |
| 30 to 34 Minutes | 1,592 | 9.5% |
| 35 to 39 Minutes | 459 | 2.7% |
| 40 to 44 Minutes | 787 | 4.7% |
| 45 to 59 Minutes | 2,196 | 13.1% |
| 60 to 89 Minutes | 1,143 | 6.8% |
| 90 or more Minutes | 469 | 2.8% |
Commute Time by Sex in Torrington
The most common commute times in Torrington are 20 to 24 minutes (1,404 commuters, 16.2%) for males and 10 to 14 minutes (1,652 commuters, 20.4%) for females.
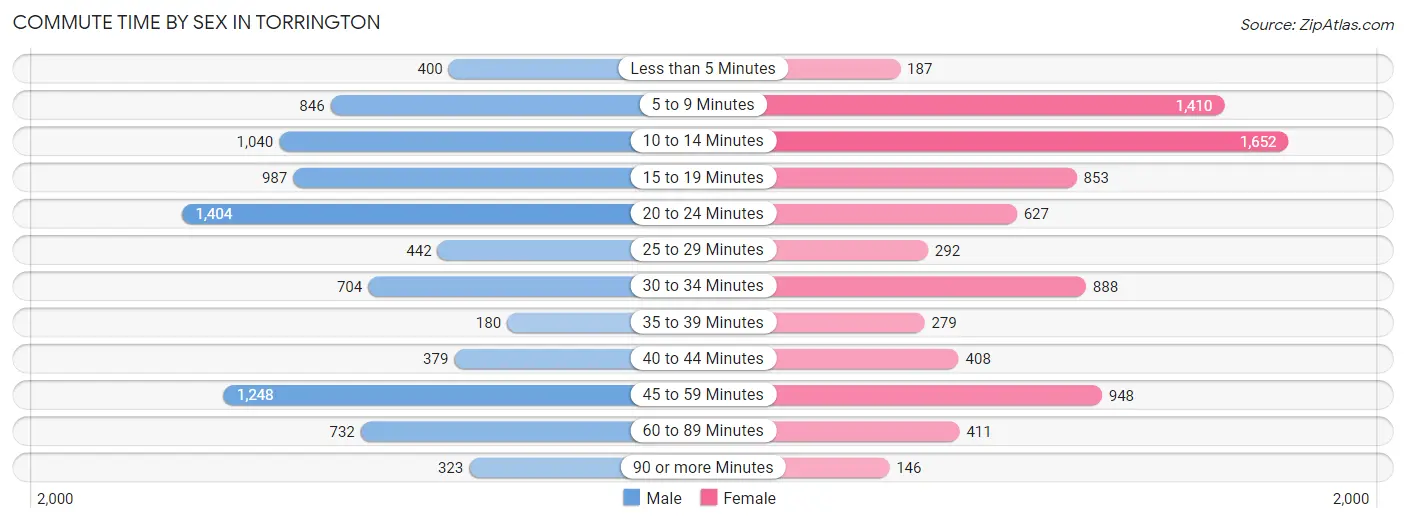
| Commute Time | Male | Female |
| Less than 5 Minutes | 400 (4.6%) | 187 (2.3%) |
| 5 to 9 Minutes | 846 (9.7%) | 1,410 (17.4%) |
| 10 to 14 Minutes | 1,040 (12.0%) | 1,652 (20.4%) |
| 15 to 19 Minutes | 987 (11.4%) | 853 (10.5%) |
| 20 to 24 Minutes | 1,404 (16.2%) | 627 (7.7%) |
| 25 to 29 Minutes | 442 (5.1%) | 292 (3.6%) |
| 30 to 34 Minutes | 704 (8.1%) | 888 (11.0%) |
| 35 to 39 Minutes | 180 (2.1%) | 279 (3.4%) |
| 40 to 44 Minutes | 379 (4.4%) | 408 (5.0%) |
| 45 to 59 Minutes | 1,248 (14.4%) | 948 (11.7%) |
| 60 to 89 Minutes | 732 (8.4%) | 411 (5.1%) |
| 90 or more Minutes | 323 (3.7%) | 146 (1.8%) |
Time of Departure to Work by Sex in Torrington
The most frequent times of departure to work in Torrington are 6:00 AM to 6:29 AM (1,067, 12.3%) for males and 7:30 AM to 7:59 AM (1,542, 19.0%) for females.
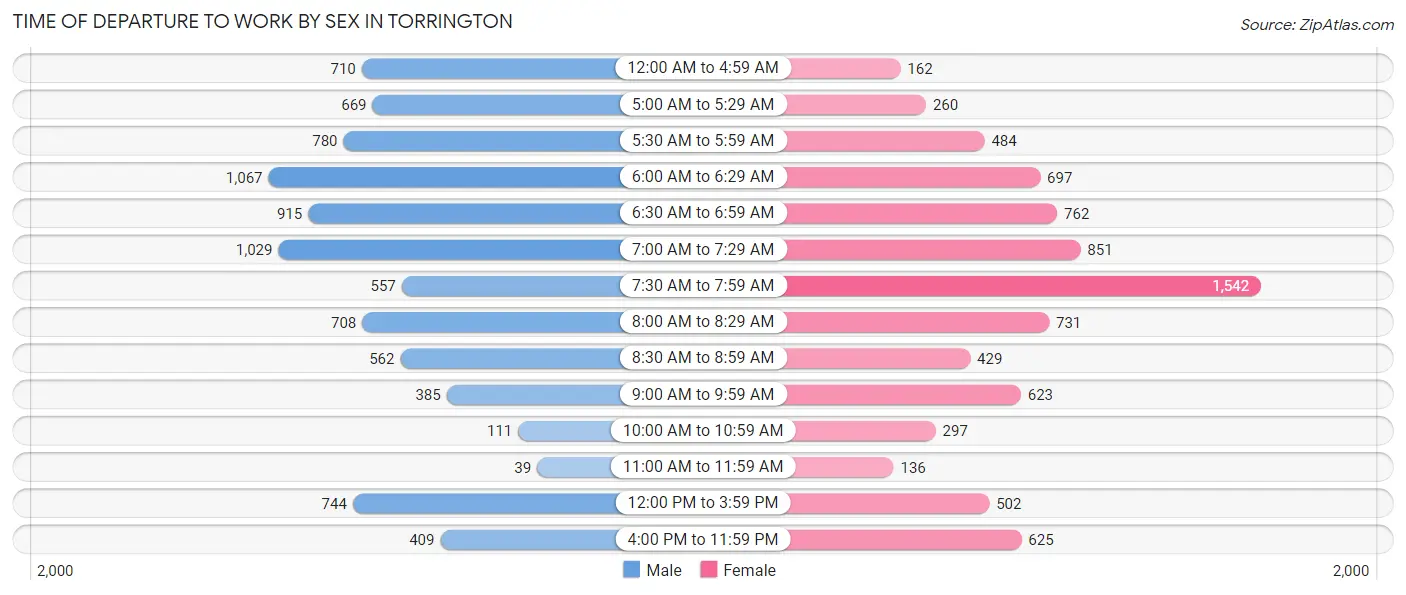
| Time of Departure | Male | Female |
| 12:00 AM to 4:59 AM | 710 (8.2%) | 162 (2.0%) |
| 5:00 AM to 5:29 AM | 669 (7.7%) | 260 (3.2%) |
| 5:30 AM to 5:59 AM | 780 (9.0%) | 484 (6.0%) |
| 6:00 AM to 6:29 AM | 1,067 (12.3%) | 697 (8.6%) |
| 6:30 AM to 6:59 AM | 915 (10.5%) | 762 (9.4%) |
| 7:00 AM to 7:29 AM | 1,029 (11.8%) | 851 (10.5%) |
| 7:30 AM to 7:59 AM | 557 (6.4%) | 1,542 (19.0%) |
| 8:00 AM to 8:29 AM | 708 (8.2%) | 731 (9.0%) |
| 8:30 AM to 8:59 AM | 562 (6.5%) | 429 (5.3%) |
| 9:00 AM to 9:59 AM | 385 (4.4%) | 623 (7.7%) |
| 10:00 AM to 10:59 AM | 111 (1.3%) | 297 (3.7%) |
| 11:00 AM to 11:59 AM | 39 (0.4%) | 136 (1.7%) |
| 12:00 PM to 3:59 PM | 744 (8.6%) | 502 (6.2%) |
| 4:00 PM to 11:59 PM | 409 (4.7%) | 625 (7.7%) |
| Total | 8,685 (100.0%) | 8,101 (100.0%) |
Housing Occupancy in Torrington
Occupancy by Ownership in Torrington
Of the total 14,645 dwellings in Torrington, owner-occupied units account for 9,373 (64.0%), while renter-occupied units make up 5,272 (36.0%).
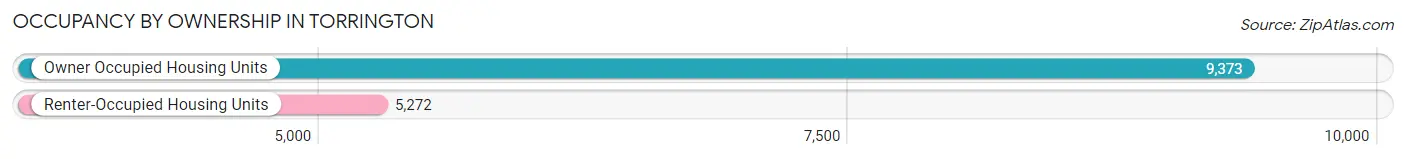
| Occupancy | # Housing Units | % Housing Units |
| Owner Occupied Housing Units | 9,373 | 64.0% |
| Renter-Occupied Housing Units | 5,272 | 36.0% |
| Total Occupied Housing Units | 14,645 | 100.0% |
Occupancy by Household Size in Torrington
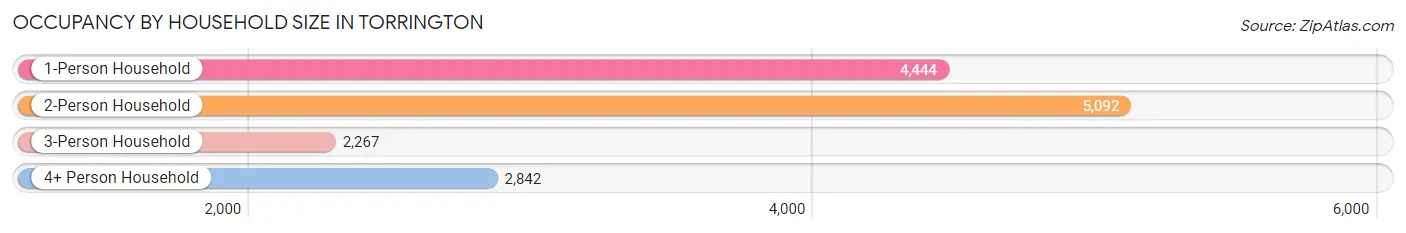
| Household Size | # Housing Units | % Housing Units |
| 1-Person Household | 4,444 | 30.3% |
| 2-Person Household | 5,092 | 34.8% |
| 3-Person Household | 2,267 | 15.5% |
| 4+ Person Household | 2,842 | 19.4% |
| Total Housing Units | 14,645 | 100.0% |
Occupancy by Ownership by Household Size in Torrington
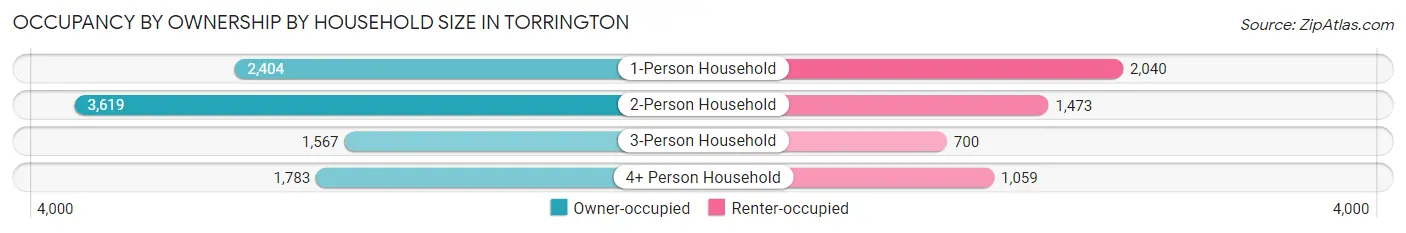
| Household Size | Owner-occupied | Renter-occupied |
| 1-Person Household | 2,404 (54.1%) | 2,040 (45.9%) |
| 2-Person Household | 3,619 (71.1%) | 1,473 (28.9%) |
| 3-Person Household | 1,567 (69.1%) | 700 (30.9%) |
| 4+ Person Household | 1,783 (62.7%) | 1,059 (37.3%) |
| Total Housing Units | 9,373 (64.0%) | 5,272 (36.0%) |
Occupancy by Educational Attainment in Torrington
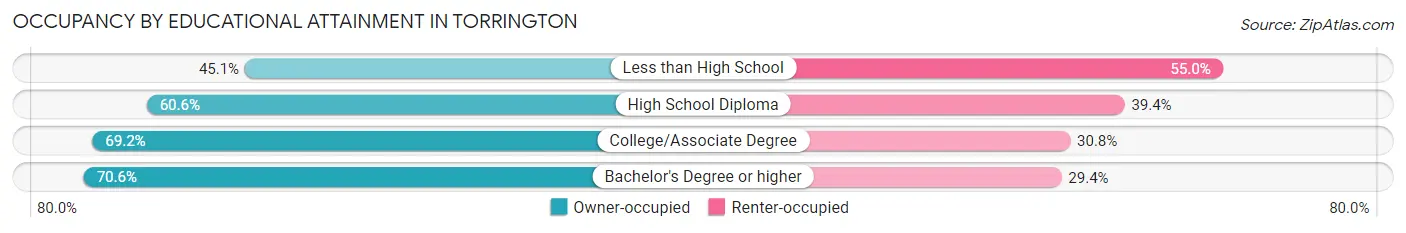
| Household Size | Owner-occupied | Renter-occupied |
| Less than High School | 687 (45.1%) | 838 (54.9%) |
| High School Diploma | 3,185 (60.6%) | 2,069 (39.4%) |
| College/Associate Degree | 2,710 (69.2%) | 1,204 (30.8%) |
| Bachelor's Degree or higher | 2,791 (70.6%) | 1,161 (29.4%) |
Occupancy by Age of Householder in Torrington
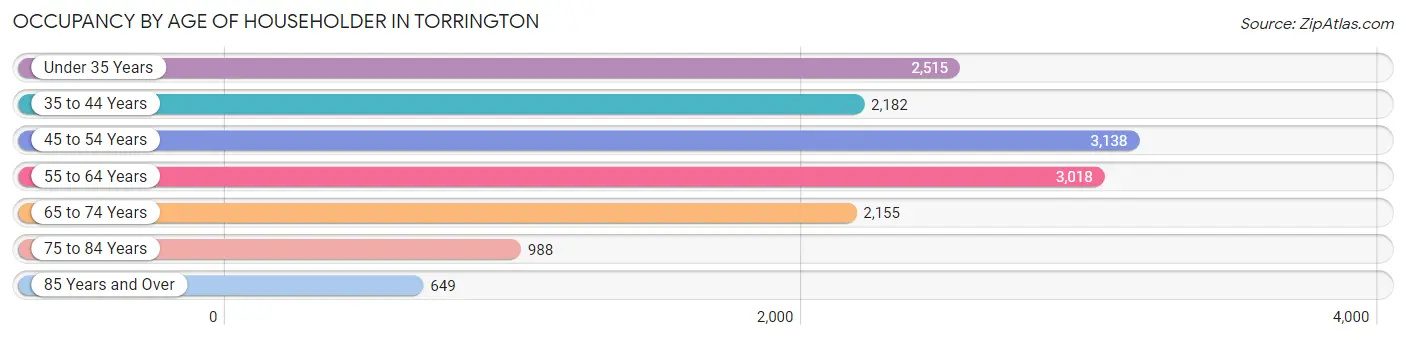
| Age Bracket | # Households | % Households |
| Under 35 Years | 2,515 | 17.2% |
| 35 to 44 Years | 2,182 | 14.9% |
| 45 to 54 Years | 3,138 | 21.4% |
| 55 to 64 Years | 3,018 | 20.6% |
| 65 to 74 Years | 2,155 | 14.7% |
| 75 to 84 Years | 988 | 6.8% |
| 85 Years and Over | 649 | 4.4% |
| Total | 14,645 | 100.0% |
Housing Finances in Torrington
Median Income by Occupancy in Torrington
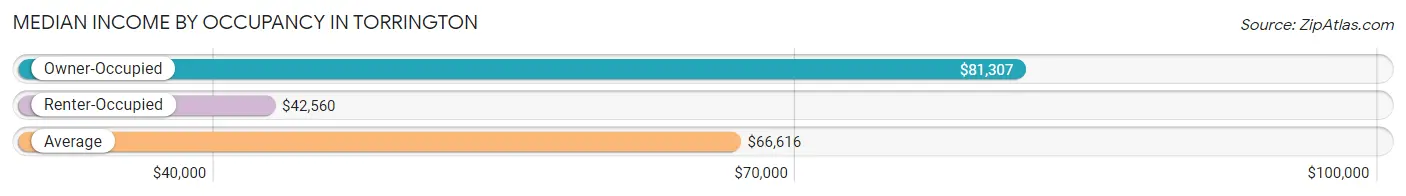
| Occupancy Type | # Households | Median Income |
| Owner-Occupied | 9,373 (64.0%) | $81,307 |
| Renter-Occupied | 5,272 (36.0%) | $42,560 |
| Average | 14,645 (100.0%) | $66,616 |
Occupancy by Householder Income Bracket in Torrington
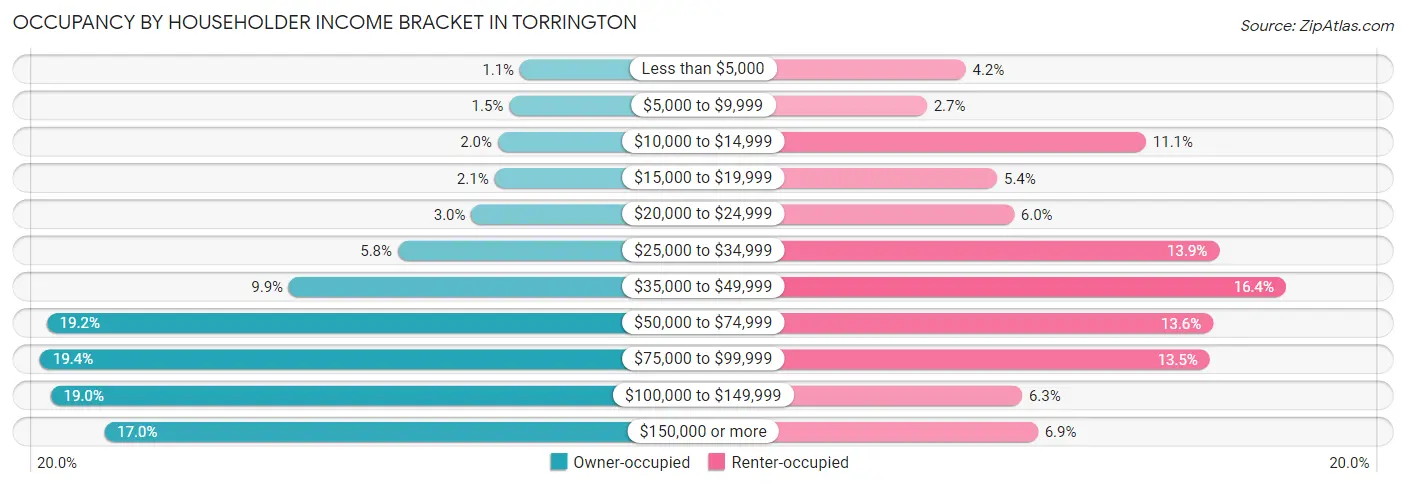
| Income Bracket | Owner-occupied | Renter-occupied |
| Less than $5,000 | 106 (1.1%) | 221 (4.2%) |
| $5,000 to $9,999 | 144 (1.5%) | 143 (2.7%) |
| $10,000 to $14,999 | 185 (2.0%) | 583 (11.1%) |
| $15,000 to $19,999 | 197 (2.1%) | 284 (5.4%) |
| $20,000 to $24,999 | 279 (3.0%) | 318 (6.0%) |
| $25,000 to $34,999 | 542 (5.8%) | 730 (13.9%) |
| $35,000 to $49,999 | 931 (9.9%) | 864 (16.4%) |
| $50,000 to $74,999 | 1,796 (19.2%) | 718 (13.6%) |
| $75,000 to $99,999 | 1,820 (19.4%) | 711 (13.5%) |
| $100,000 to $149,999 | 1,782 (19.0%) | 334 (6.3%) |
| $150,000 or more | 1,591 (17.0%) | 366 (6.9%) |
| Total | 9,373 (100.0%) | 5,272 (100.0%) |
Monthly Housing Cost Tiers in Torrington
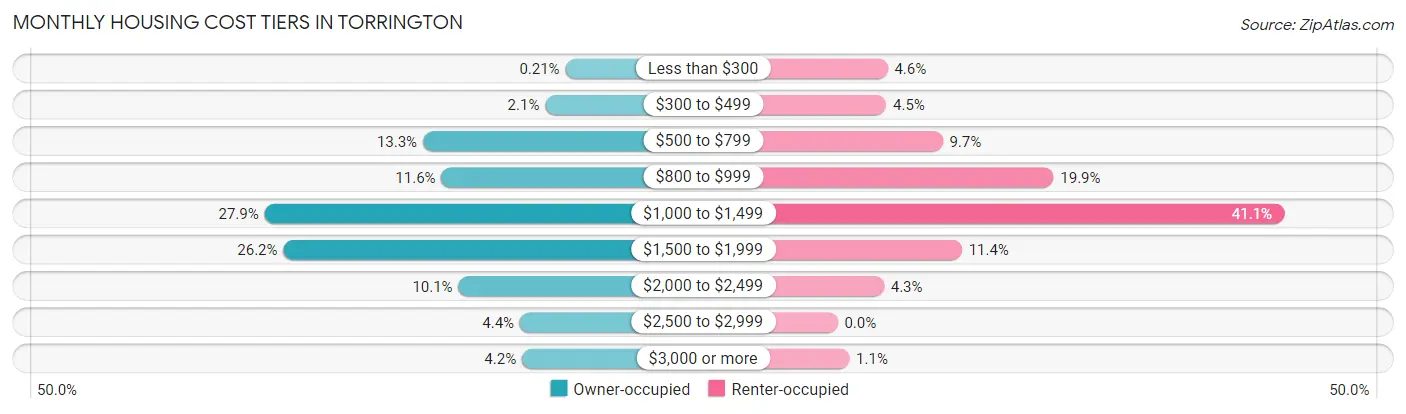
| Monthly Cost | Owner-occupied | Renter-occupied |
| Less than $300 | 20 (0.2%) | 243 (4.6%) |
| $300 to $499 | 194 (2.1%) | 236 (4.5%) |
| $500 to $799 | 1,249 (13.3%) | 510 (9.7%) |
| $800 to $999 | 1,090 (11.6%) | 1,048 (19.9%) |
| $1,000 to $1,499 | 2,616 (27.9%) | 2,167 (41.1%) |
| $1,500 to $1,999 | 2,454 (26.2%) | 603 (11.4%) |
| $2,000 to $2,499 | 943 (10.1%) | 225 (4.3%) |
| $2,500 to $2,999 | 412 (4.4%) | 0 (0.0%) |
| $3,000 or more | 395 (4.2%) | 57 (1.1%) |
| Total | 9,373 (100.0%) | 5,272 (100.0%) |
Physical Housing Characteristics in Torrington
Housing Structures in Torrington
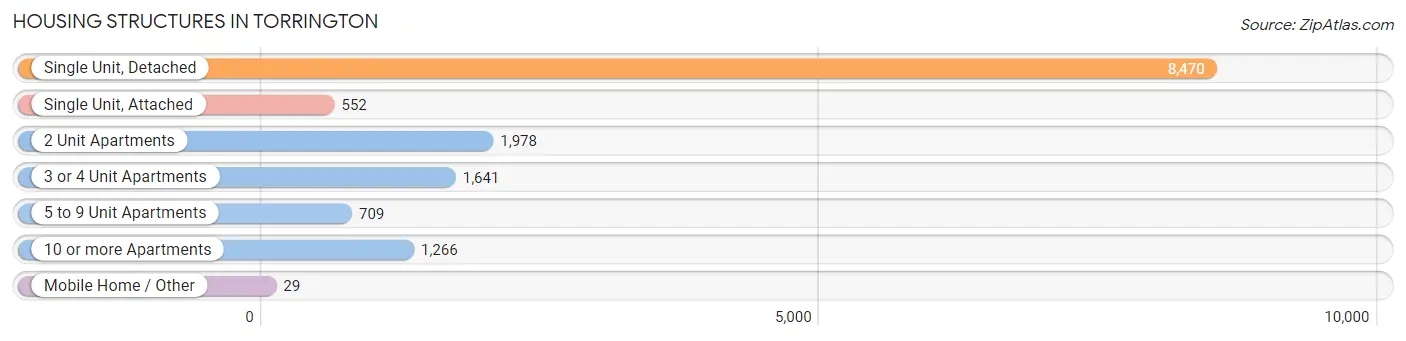
| Structure Type | # Housing Units | % Housing Units |
| Single Unit, Detached | 8,470 | 57.8% |
| Single Unit, Attached | 552 | 3.8% |
| 2 Unit Apartments | 1,978 | 13.5% |
| 3 or 4 Unit Apartments | 1,641 | 11.2% |
| 5 to 9 Unit Apartments | 709 | 4.8% |
| 10 or more Apartments | 1,266 | 8.6% |
| Mobile Home / Other | 29 | 0.2% |
| Total | 14,645 | 100.0% |
Housing Structures by Occupancy in Torrington
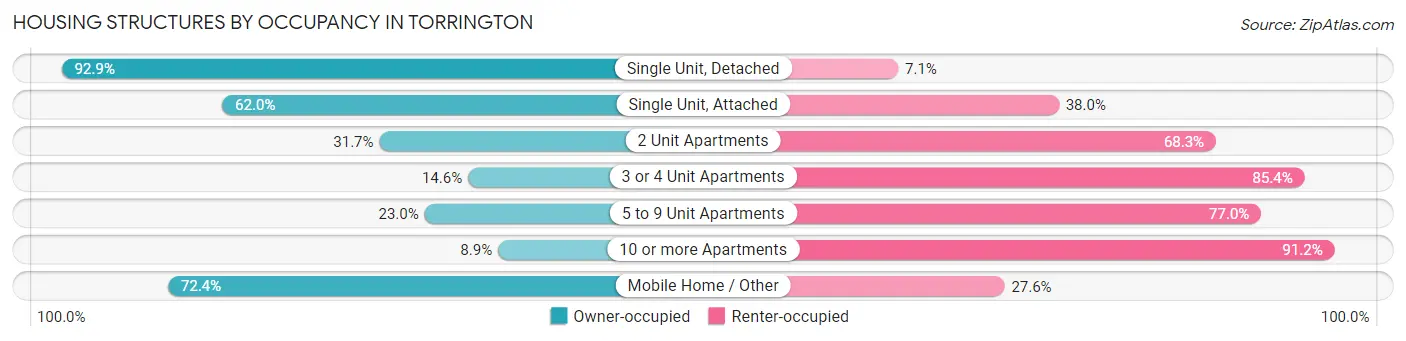
| Structure Type | Owner-occupied | Renter-occupied |
| Single Unit, Detached | 7,868 (92.9%) | 602 (7.1%) |
| Single Unit, Attached | 342 (62.0%) | 210 (38.0%) |
| 2 Unit Apartments | 627 (31.7%) | 1,351 (68.3%) |
| 3 or 4 Unit Apartments | 240 (14.6%) | 1,401 (85.4%) |
| 5 to 9 Unit Apartments | 163 (23.0%) | 546 (77.0%) |
| 10 or more Apartments | 112 (8.8%) | 1,154 (91.1%) |
| Mobile Home / Other | 21 (72.4%) | 8 (27.6%) |
| Total | 9,373 (64.0%) | 5,272 (36.0%) |
Housing Structures by Number of Rooms in Torrington
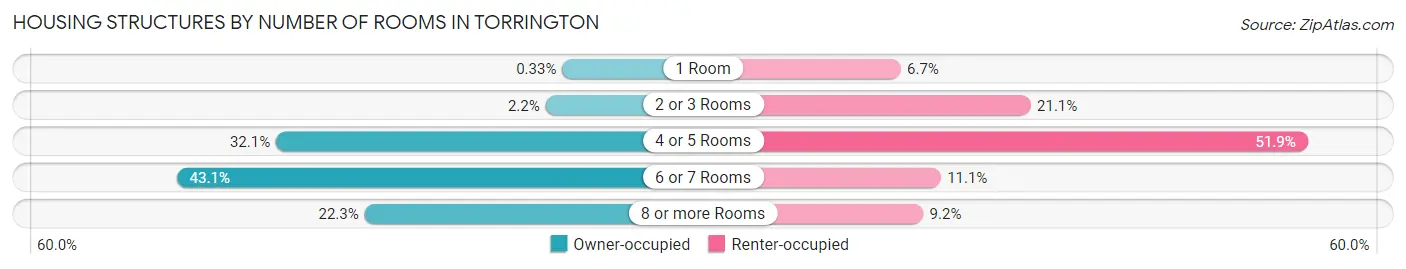
| Number of Rooms | Owner-occupied | Renter-occupied |
| 1 Room | 31 (0.3%) | 352 (6.7%) |
| 2 or 3 Rooms | 204 (2.2%) | 1,113 (21.1%) |
| 4 or 5 Rooms | 3,009 (32.1%) | 2,736 (51.9%) |
| 6 or 7 Rooms | 4,042 (43.1%) | 587 (11.1%) |
| 8 or more Rooms | 2,087 (22.3%) | 484 (9.2%) |
| Total | 9,373 (100.0%) | 5,272 (100.0%) |
Housing Structure by Heating Type in Torrington
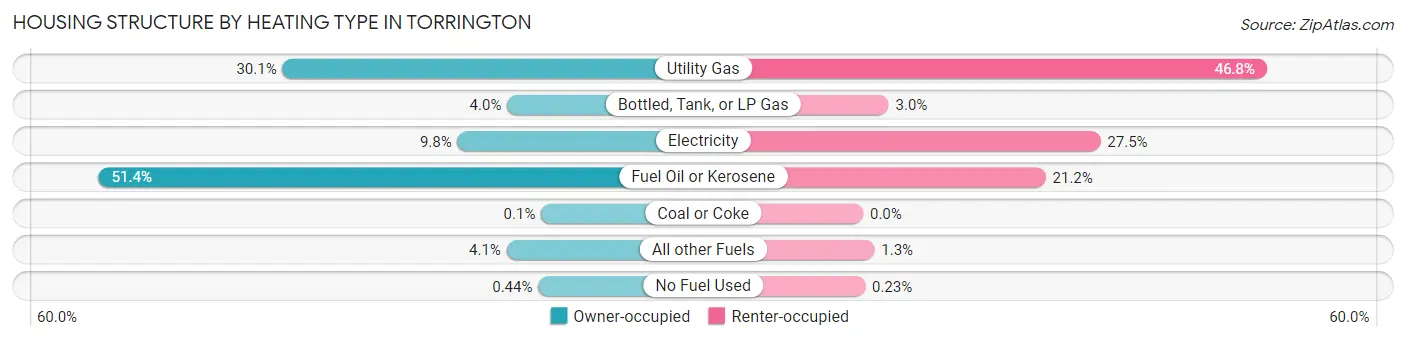
| Heating Type | Owner-occupied | Renter-occupied |
| Utility Gas | 2,821 (30.1%) | 2,468 (46.8%) |
| Bottled, Tank, or LP Gas | 379 (4.0%) | 156 (3.0%) |
| Electricity | 919 (9.8%) | 1,451 (27.5%) |
| Fuel Oil or Kerosene | 4,819 (51.4%) | 1,116 (21.2%) |
| Coal or Coke | 9 (0.1%) | 0 (0.0%) |
| All other Fuels | 385 (4.1%) | 69 (1.3%) |
| No Fuel Used | 41 (0.4%) | 12 (0.2%) |
| Total | 9,373 (100.0%) | 5,272 (100.0%) |
Household Vehicle Usage in Torrington
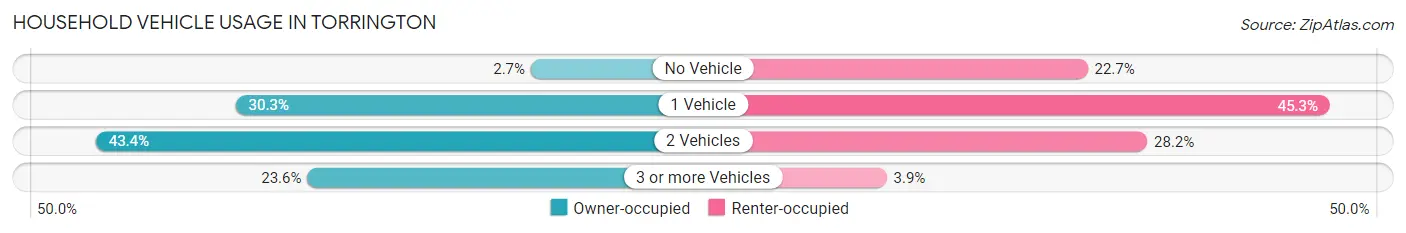
| Vehicles per Household | Owner-occupied | Renter-occupied |
| No Vehicle | 257 (2.7%) | 1,194 (22.7%) |
| 1 Vehicle | 2,840 (30.3%) | 2,386 (45.3%) |
| 2 Vehicles | 4,063 (43.3%) | 1,487 (28.2%) |
| 3 or more Vehicles | 2,213 (23.6%) | 205 (3.9%) |
| Total | 9,373 (100.0%) | 5,272 (100.0%) |
Real Estate & Mortgages in Torrington
Real Estate and Mortgage Overview in Torrington
| Characteristic | Without Mortgage | With Mortgage |
| Housing Units | 3,323 | 6,050 |
| Median Property Value | $177,900 | $182,400 |
| Median Household Income | $70,195 | $1,046 |
| Monthly Housing Costs | $876 | $387 |
| Real Estate Taxes | $5,113 | $41 |
Property Value by Mortgage Status in Torrington
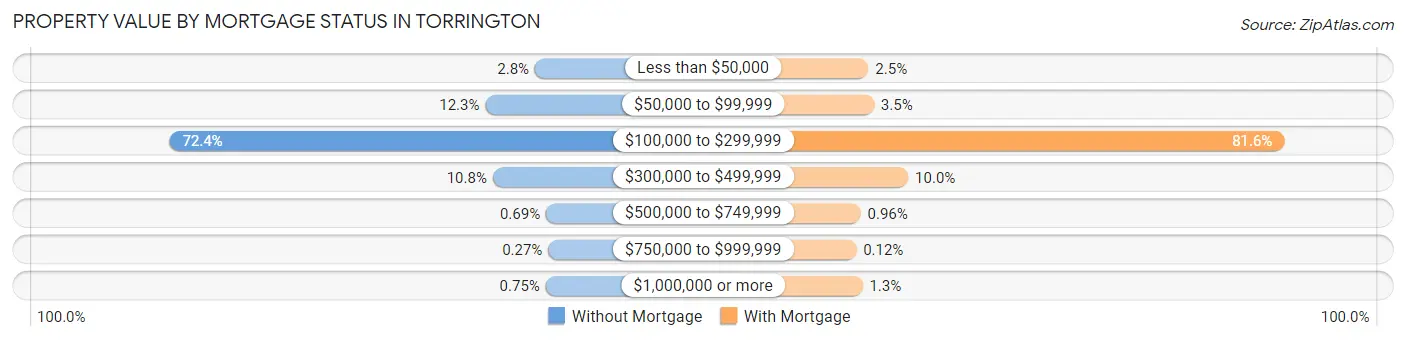
| Property Value | Without Mortgage | With Mortgage |
| Less than $50,000 | 93 (2.8%) | 148 (2.5%) |
| $50,000 to $99,999 | 407 (12.2%) | 212 (3.5%) |
| $100,000 to $299,999 | 2,406 (72.4%) | 4,939 (81.6%) |
| $300,000 to $499,999 | 360 (10.8%) | 606 (10.0%) |
| $500,000 to $749,999 | 23 (0.7%) | 58 (1.0%) |
| $750,000 to $999,999 | 9 (0.3%) | 7 (0.1%) |
| $1,000,000 or more | 25 (0.7%) | 80 (1.3%) |
| Total | 3,323 (100.0%) | 6,050 (100.0%) |
Household Income by Mortgage Status in Torrington
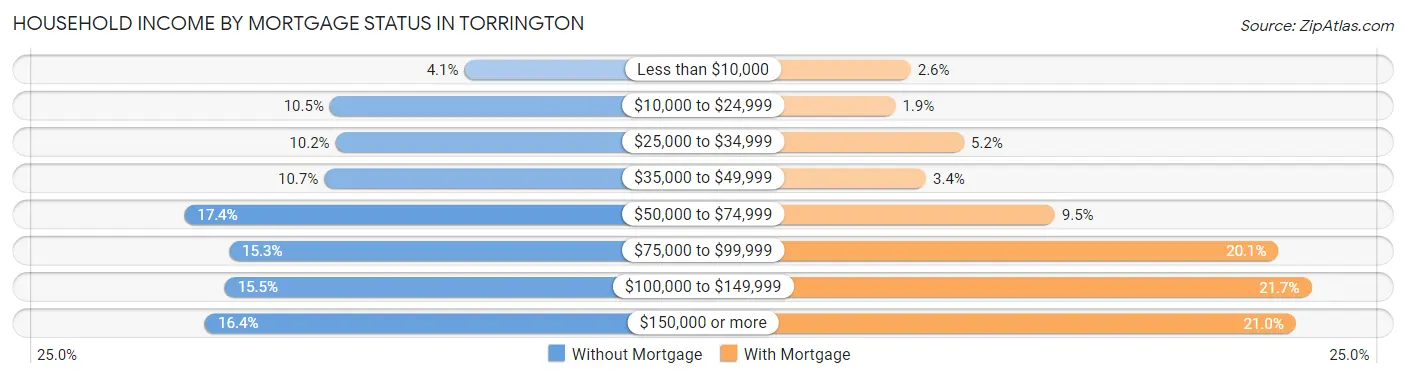
| Household Income | Without Mortgage | With Mortgage |
| Less than $10,000 | 135 (4.1%) | 159 (2.6%) |
| $10,000 to $24,999 | 348 (10.5%) | 115 (1.9%) |
| $25,000 to $34,999 | 339 (10.2%) | 313 (5.2%) |
| $35,000 to $49,999 | 357 (10.7%) | 203 (3.4%) |
| $50,000 to $74,999 | 578 (17.4%) | 574 (9.5%) |
| $75,000 to $99,999 | 507 (15.3%) | 1,218 (20.1%) |
| $100,000 to $149,999 | 514 (15.5%) | 1,313 (21.7%) |
| $150,000 or more | 545 (16.4%) | 1,268 (21.0%) |
| Total | 3,323 (100.0%) | 6,050 (100.0%) |
Property Value to Household Income Ratio in Torrington
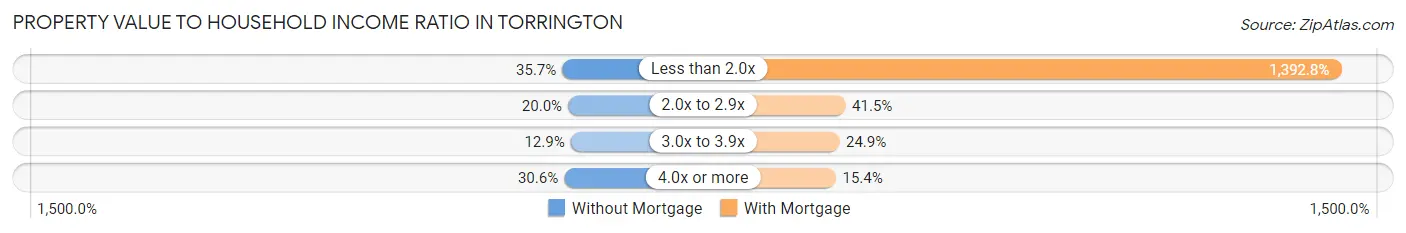
| Value-to-Income Ratio | Without Mortgage | With Mortgage |
| Less than 2.0x | 1,185 (35.7%) | 84,263 (1,392.8%) |
| 2.0x to 2.9x | 663 (20.0%) | 2,508 (41.4%) |
| 3.0x to 3.9x | 428 (12.9%) | 1,506 (24.9%) |
| 4.0x or more | 1,017 (30.6%) | 930 (15.4%) |
| Total | 3,323 (100.0%) | 6,050 (100.0%) |
Real Estate Taxes by Mortgage Status in Torrington
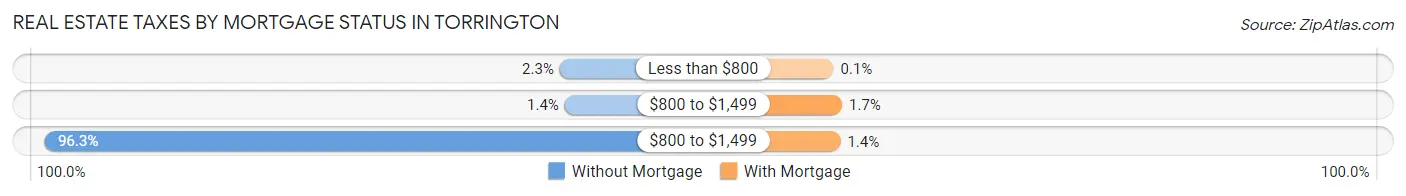
| Property Taxes | Without Mortgage | With Mortgage |
| Less than $800 | 75 (2.3%) | 6 (0.1%) |
| $800 to $1,499 | 45 (1.3%) | 100 (1.7%) |
| $800 to $1,499 | 3,199 (96.3%) | 82 (1.4%) |
| Total | 3,323 (100.0%) | 6,050 (100.0%) |
Health & Disability in Torrington
Health Insurance Coverage by Age in Torrington
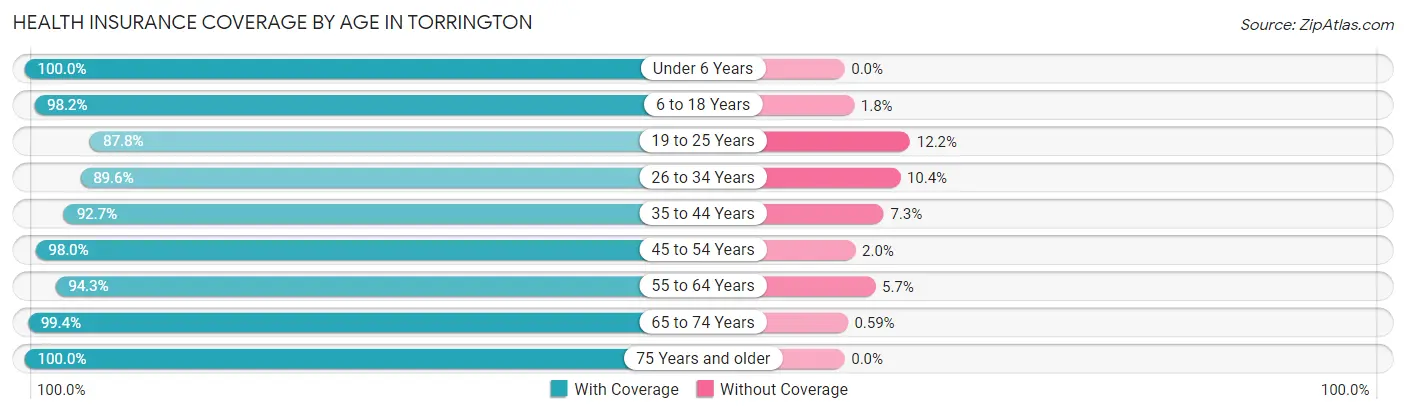
| Age Bracket | With Coverage | Without Coverage |
| Under 6 Years | 2,212 (100.0%) | 0 (0.0%) |
| 6 to 18 Years | 4,851 (98.2%) | 88 (1.8%) |
| 19 to 25 Years | 2,850 (87.8%) | 397 (12.2%) |
| 26 to 34 Years | 4,480 (89.6%) | 519 (10.4%) |
| 35 to 44 Years | 3,493 (92.7%) | 275 (7.3%) |
| 45 to 54 Years | 5,059 (98.0%) | 104 (2.0%) |
| 55 to 64 Years | 4,888 (94.3%) | 297 (5.7%) |
| 65 to 74 Years | 3,217 (99.4%) | 19 (0.6%) |
| 75 Years and older | 2,234 (100.0%) | 0 (0.0%) |
| Total | 33,284 (95.1%) | 1,699 (4.9%) |
Health Insurance Coverage by Citizenship Status in Torrington
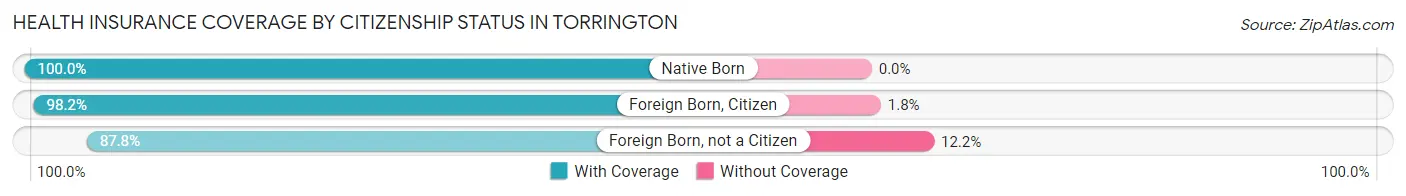
| Citizenship Status | With Coverage | Without Coverage |
| Native Born | 2,212 (100.0%) | 0 (0.0%) |
| Foreign Born, Citizen | 4,851 (98.2%) | 88 (1.8%) |
| Foreign Born, not a Citizen | 2,850 (87.8%) | 397 (12.2%) |
Health Insurance Coverage by Household Income in Torrington
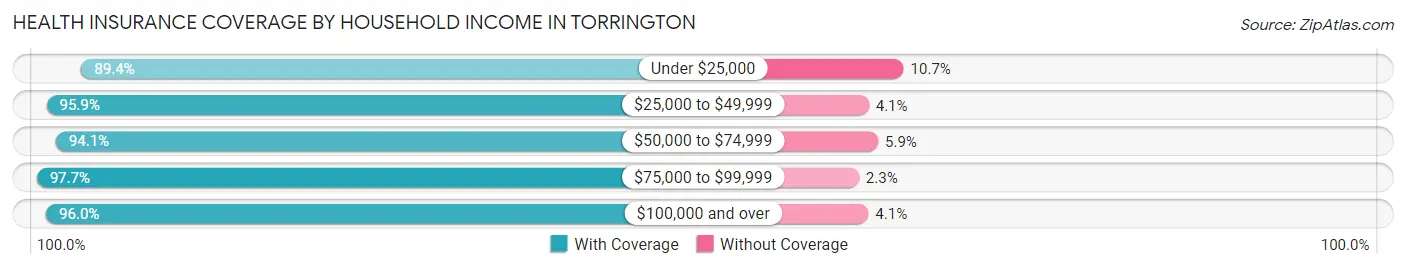
| Household Income | With Coverage | Without Coverage |
| Under $25,000 | 4,101 (89.3%) | 489 (10.6%) |
| $25,000 to $49,999 | 5,753 (95.9%) | 247 (4.1%) |
| $50,000 to $74,999 | 5,064 (94.1%) | 316 (5.9%) |
| $75,000 to $99,999 | 6,209 (97.7%) | 144 (2.3%) |
| $100,000 and over | 11,914 (96.0%) | 503 (4.1%) |
Public vs Private Health Insurance Coverage by Age in Torrington
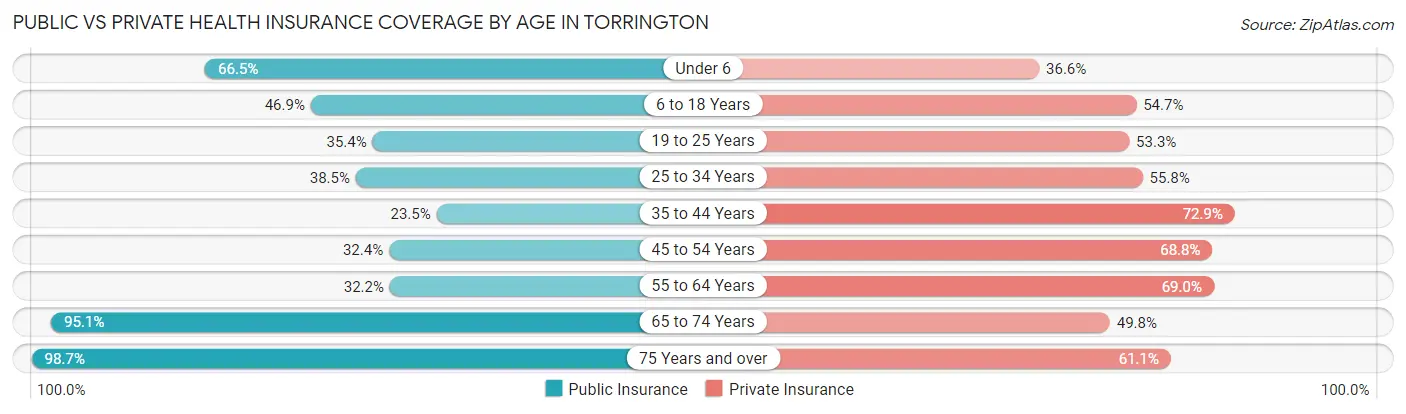
| Age Bracket | Public Insurance | Private Insurance |
| Under 6 | 1,471 (66.5%) | 810 (36.6%) |
| 6 to 18 Years | 2,316 (46.9%) | 2,699 (54.6%) |
| 19 to 25 Years | 1,150 (35.4%) | 1,732 (53.3%) |
| 25 to 34 Years | 1,926 (38.5%) | 2,791 (55.8%) |
| 35 to 44 Years | 887 (23.5%) | 2,748 (72.9%) |
| 45 to 54 Years | 1,671 (32.4%) | 3,550 (68.8%) |
| 55 to 64 Years | 1,670 (32.2%) | 3,579 (69.0%) |
| 65 to 74 Years | 3,077 (95.1%) | 1,610 (49.7%) |
| 75 Years and over | 2,205 (98.7%) | 1,364 (61.1%) |
| Total | 16,373 (46.8%) | 20,883 (59.7%) |
Disability Status by Sex by Age in Torrington
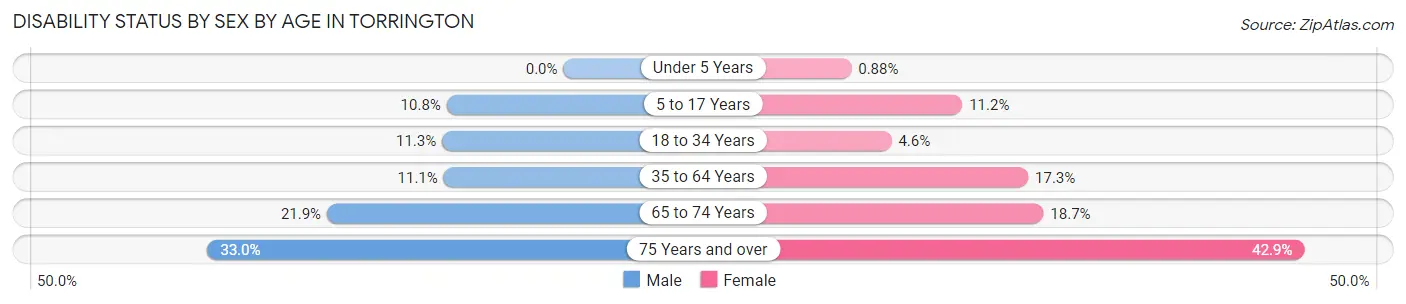
| Age Bracket | Male | Female |
| Under 5 Years | 0 (0.0%) | 7 (0.9%) |
| 5 to 17 Years | 296 (10.8%) | 242 (11.2%) |
| 18 to 34 Years | 460 (11.3%) | 210 (4.6%) |
| 35 to 64 Years | 757 (11.1%) | 1,263 (17.3%) |
| 65 to 74 Years | 343 (21.9%) | 313 (18.7%) |
| 75 Years and over | 304 (33.0%) | 564 (42.9%) |
Disability Class by Sex by Age in Torrington
Disability Class: Hearing Difficulty
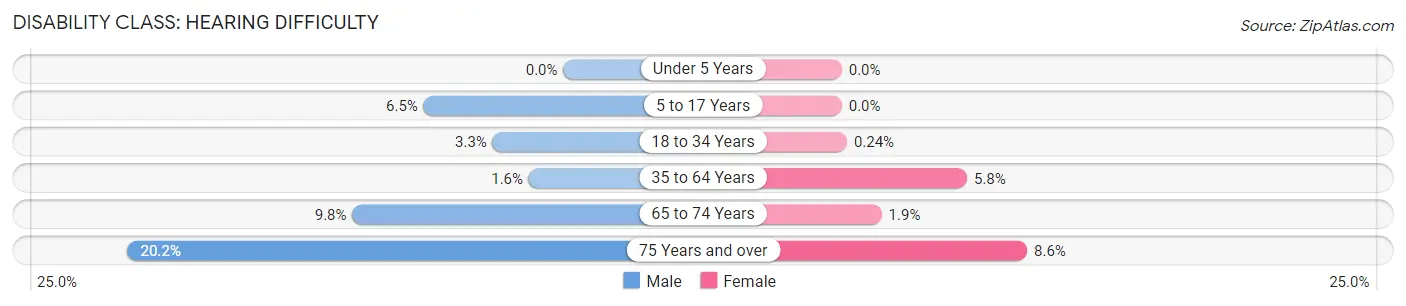
| Age Bracket | Male | Female |
| Under 5 Years | 0 (0.0%) | 0 (0.0%) |
| 5 to 17 Years | 177 (6.5%) | 0 (0.0%) |
| 18 to 34 Years | 134 (3.3%) | 11 (0.2%) |
| 35 to 64 Years | 109 (1.6%) | 424 (5.8%) |
| 65 to 74 Years | 153 (9.8%) | 31 (1.8%) |
| 75 Years and over | 186 (20.2%) | 113 (8.6%) |
Disability Class: Vision Difficulty
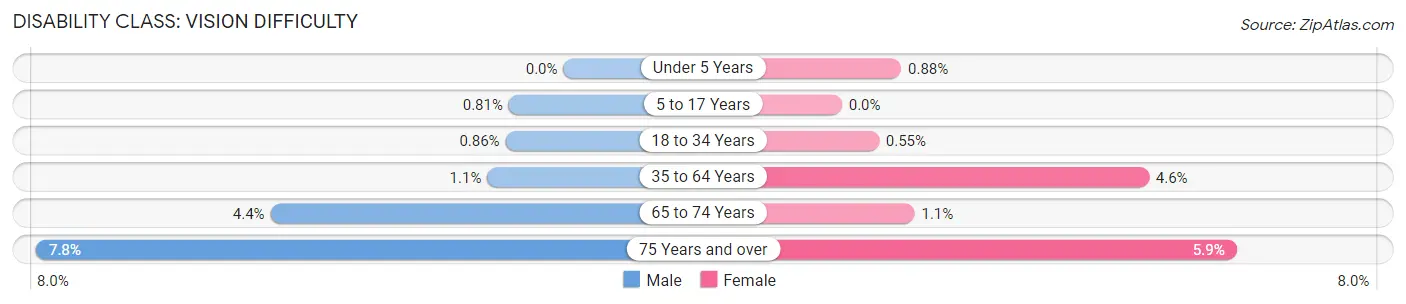
| Age Bracket | Male | Female |
| Under 5 Years | 0 (0.0%) | 7 (0.9%) |
| 5 to 17 Years | 22 (0.8%) | 0 (0.0%) |
| 18 to 34 Years | 35 (0.9%) | 25 (0.5%) |
| 35 to 64 Years | 77 (1.1%) | 333 (4.6%) |
| 65 to 74 Years | 68 (4.3%) | 18 (1.1%) |
| 75 Years and over | 72 (7.8%) | 77 (5.9%) |
Disability Class: Cognitive Difficulty
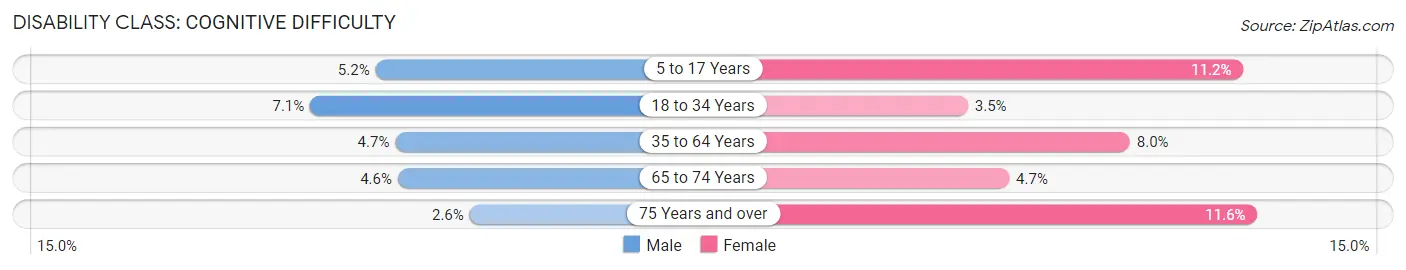
| Age Bracket | Male | Female |
| 5 to 17 Years | 143 (5.2%) | 242 (11.2%) |
| 18 to 34 Years | 288 (7.0%) | 160 (3.5%) |
| 35 to 64 Years | 319 (4.7%) | 586 (8.0%) |
| 65 to 74 Years | 72 (4.6%) | 78 (4.7%) |
| 75 Years and over | 24 (2.6%) | 152 (11.6%) |
Disability Class: Ambulatory Difficulty
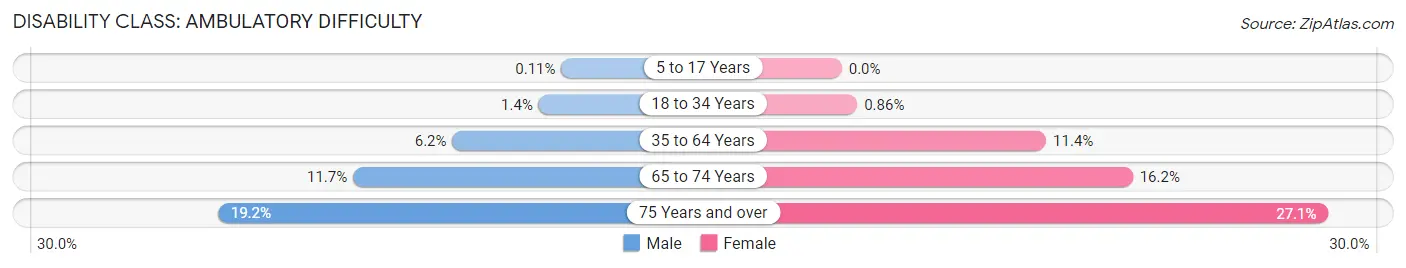
| Age Bracket | Male | Female |
| 5 to 17 Years | 3 (0.1%) | 0 (0.0%) |
| 18 to 34 Years | 56 (1.4%) | 39 (0.9%) |
| 35 to 64 Years | 421 (6.2%) | 831 (11.4%) |
| 65 to 74 Years | 183 (11.7%) | 271 (16.2%) |
| 75 Years and over | 177 (19.2%) | 356 (27.1%) |
Disability Class: Self-Care Difficulty
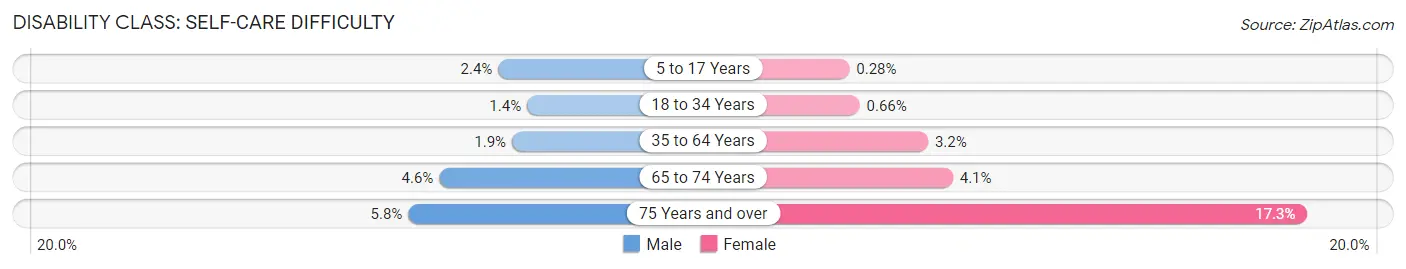
| Age Bracket | Male | Female |
| 5 to 17 Years | 66 (2.4%) | 6 (0.3%) |
| 18 to 34 Years | 55 (1.3%) | 30 (0.7%) |
| 35 to 64 Years | 130 (1.9%) | 234 (3.2%) |
| 65 to 74 Years | 72 (4.6%) | 69 (4.1%) |
| 75 Years and over | 53 (5.8%) | 227 (17.3%) |
Technology Access in Torrington
Computing Device Access in Torrington
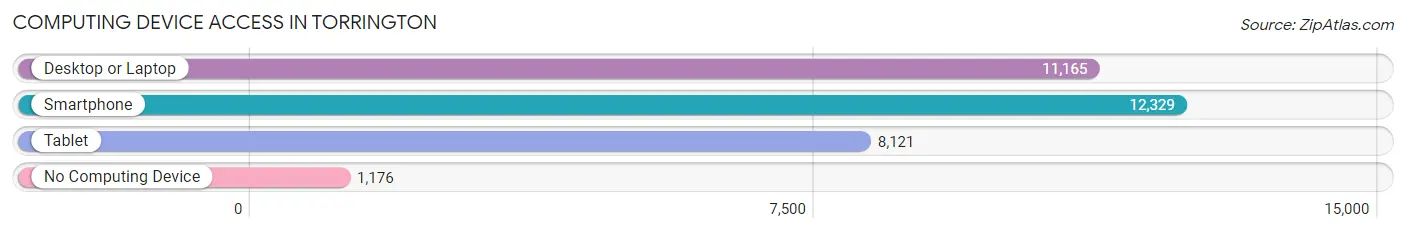
| Device Type | # Households | % Households |
| Desktop or Laptop | 11,165 | 76.2% |
| Smartphone | 12,329 | 84.2% |
| Tablet | 8,121 | 55.4% |
| No Computing Device | 1,176 | 8.0% |
| Total | 14,645 | 100.0% |
Internet Access in Torrington
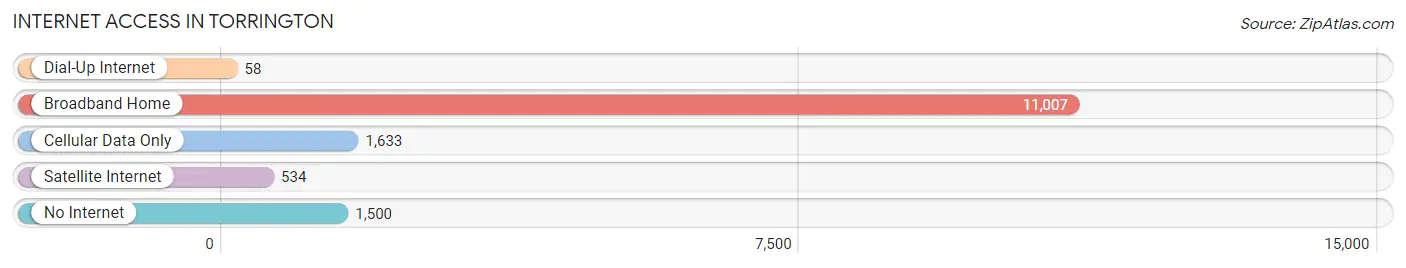
| Internet Type | # Households | % Households |
| Dial-Up Internet | 58 | 0.4% |
| Broadband Home | 11,007 | 75.2% |
| Cellular Data Only | 1,633 | 11.2% |
| Satellite Internet | 534 | 3.6% |
| No Internet | 1,500 | 10.2% |
| Total | 14,645 | 100.0% |
Torrington Summary
Torrington, Connecticut is a city located in Litchfield County in the northwest corner of the state. It is the largest city in the county and the largest in the Litchfield Hills region. The city is situated in the foothills of the Berkshire Mountains and is bordered by the Naugatuck River to the east and the Housatonic River to the west. The city has a population of 36,383 as of the 2020 census, making it the largest city in Litchfield County.
History
The area that is now Torrington was originally inhabited by the Mahican Native American tribe. The first European settlers arrived in the area in 1737, and the town was officially incorporated in 1740. The town was named after Great Torrington in Devon, England.
The town grew rapidly in the 19th century, becoming an important industrial center. The first railroad in the state was built in Torrington in 1849, and the city became a major hub for the production of brass and copper products. The city was also home to several factories that produced textiles, paper, and other goods.
Geography
Torrington is located in the northwest corner of Connecticut, in Litchfield County. It is bordered by the towns of Harwinton to the north, Litchfield to the east, Goshen to the south, and Winchester to the west. The city is situated in the foothills of the Berkshire Mountains and is bordered by the Naugatuck River to the east and the Housatonic River to the west.
The city has a total area of 16.3 square miles, of which 16.2 square miles is land and 0.1 square miles is water. The terrain is mostly hilly, with elevations ranging from 500 to 1,000 feet above sea level.
Economy
Torrington is a major industrial center in the state of Connecticut. The city is home to several factories that produce brass and copper products, textiles, paper, and other goods. The city is also home to several large employers, including Torrington Company, a manufacturer of bearings and power transmission products, and Torrington Savings Bank, a financial institution.
The city is also home to several retail stores, restaurants, and other businesses. The city is served by the Torrington Municipal Airport, which provides general aviation services.
Demographics
As of the 2020 census, Torrington had a population of 36,383. The racial makeup of the city was 87.3% White, 5.2% Black or African American, 0.3% Native American, 2.2% Asian, 0.1% Pacific Islander, 2.7% from other races, and 2.4% from two or more races. Hispanic or Latino of any race were 8.3% of the population.
The median household income in Torrington was $50,945 in 2019, and the median family income was $60,945. The per capita income in the city was $25,945. About 11.3% of the population was below the poverty line.
Torrington is served by the Torrington Public Schools system, which includes five elementary schools, two middle schools, and one high school. The city is also home to several private schools, including the Torrington Academy of Arts and Sciences and the Torrington Montessori School.
Common Questions
What is Per Capita Income in Torrington?
Per Capita income in Torrington is $34,516.
What is the Median Family Income in Torrington?
Median Family Income in Torrington is $81,696.
What is the Median Household income in Torrington?
Median Household Income in Torrington is $66,616.
What is Income or Wage Gap in Torrington?
Income or Wage Gap in Torrington is 17.1%.
Women in Torrington earn 82.9 cents for every dollar earned by a man.
What is Inequality or Gini Index in Torrington?
Inequality or Gini Index in Torrington is 0.42.
What is the Total Population of Torrington?
Total Population of Torrington is 35,510.
What is the Total Male Population of Torrington?
Total Male Population of Torrington is 17,355.
What is the Total Female Population of Torrington?
Total Female Population of Torrington is 18,155.
What is the Ratio of Males per 100 Females in Torrington?
There are 95.59 Males per 100 Females in Torrington.
What is the Ratio of Females per 100 Males in Torrington?
There are 104.61 Females per 100 Males in Torrington.
What is the Median Population Age in Torrington?
Median Population Age in Torrington is 40.8 Years.
What is the Average Family Size in Torrington
Average Family Size in Torrington is 3.0 People.
What is the Average Household Size in Torrington
Average Household Size in Torrington is 2.4 People.
How Large is the Labor Force in Torrington?
There are 19,452 People in the Labor Forcein in Torrington.
What is the Percentage of People in the Labor Force in Torrington?
65.9% of People are in the Labor Force in Torrington.
What is the Unemployment Rate in Torrington?
Unemployment Rate in Torrington is 5.8%.