Helotes, TX Map & Demographics
Helotes Map
Helotes Overview
$49,942
PER CAPITA INCOME
$124,348
AVG FAMILY INCOME
$124,367
AVG HOUSEHOLD INCOME
44.9%
WAGE / INCOME GAP [ % ]
55.1¢/ $1
WAGE / INCOME GAP [ $ ]
0.39
INEQUALITY / GINI INDEX
9,140
TOTAL POPULATION
4,501
MALE POPULATION
4,639
FEMALE POPULATION
97.03
MALES / 100 FEMALES
103.07
FEMALES / 100 MALES
44.6
MEDIAN AGE
3.4
AVG FAMILY SIZE
3.2
AVG HOUSEHOLD SIZE
4,620
LABOR FORCE [ PEOPLE ]
60.9%
PERCENT IN LABOR FORCE
7.3%
UNEMPLOYMENT RATE
Helotes Zip Codes
Income in Helotes
Income Overview in Helotes
Per Capita Income in Helotes is $49,942, while median incomes of families and households are $124,348 and $124,367 respectively.
| Characteristic | Number | Measure |
| Per Capita Income | 9,140 | $49,942 |
| Median Family Income | 2,358 | $124,348 |
| Mean Family Income | 2,358 | $159,435 |
| Median Household Income | 2,876 | $124,367 |
| Mean Household Income | 2,876 | $154,826 |
| Income Deficit | 2,358 | $0 |
| Wage / Income Gap (%) | 9,140 | 44.94% |
| Wage / Income Gap ($) | 9,140 | 55.06¢ per $1 |
| Gini / Inequality Index | 9,140 | 0.39 |
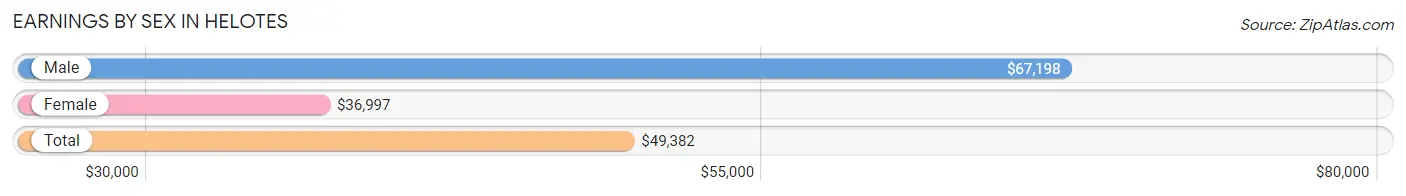
Earnings by Sex in Helotes
Average Earnings in Helotes are $49,382, $67,198 for men and $36,997 for women, a difference of 44.9%.
| Sex | Number | Average Earnings |
| Male | 2,724 (55.9%) | $67,198 |
| Female | 2,150 (44.1%) | $36,997 |
| Total | 4,874 (100.0%) | $49,382 |
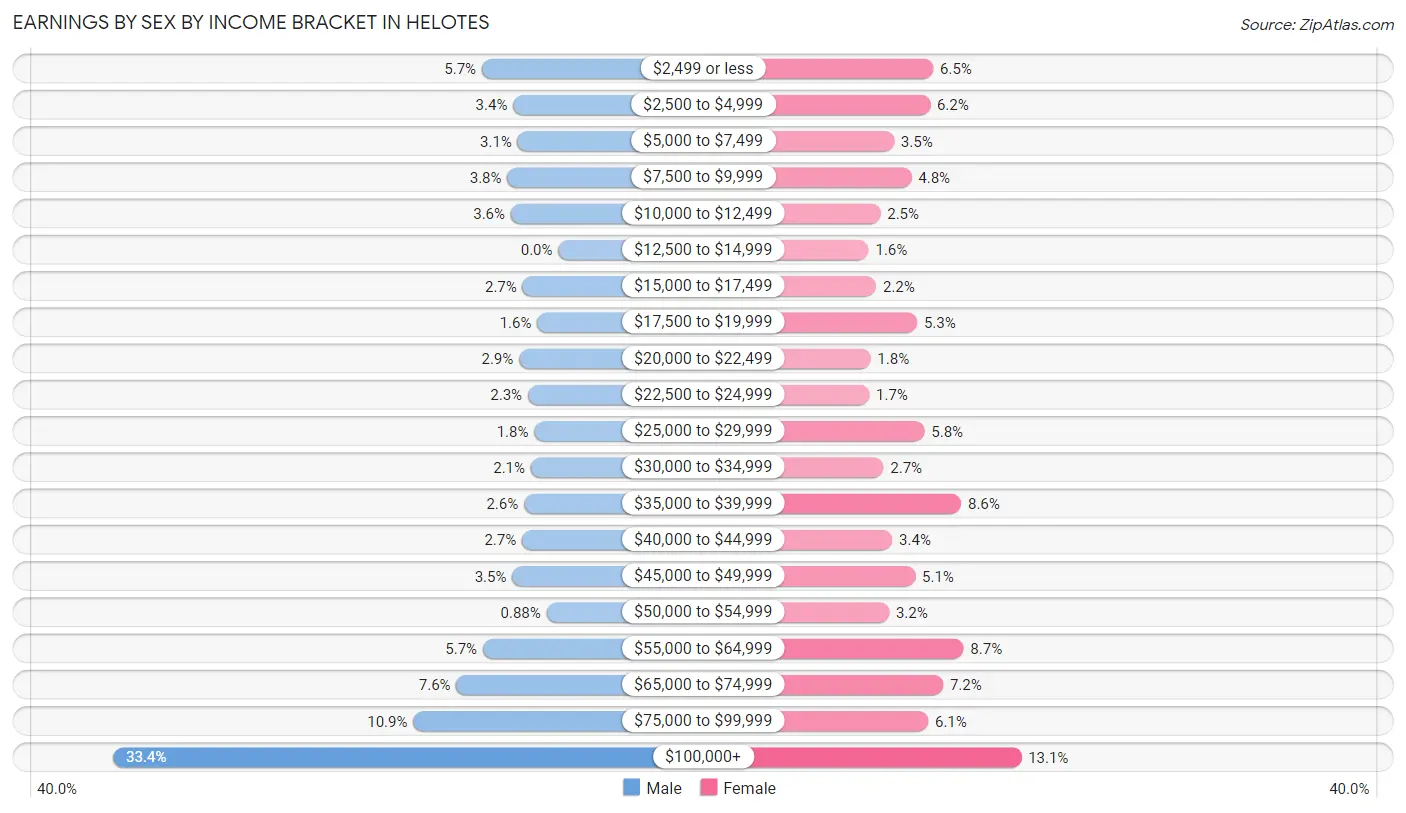
Earnings by Sex by Income Bracket in Helotes
The most common earnings brackets in Helotes are $100,000+ for men (909 | 33.4%) and $100,000+ for women (281 | 13.1%).
| Income | Male | Female |
| $2,499 or less | 156 (5.7%) | 139 (6.5%) |
| $2,500 to $4,999 | 92 (3.4%) | 134 (6.2%) |
| $5,000 to $7,499 | 83 (3.0%) | 76 (3.5%) |
| $7,500 to $9,999 | 104 (3.8%) | 104 (4.8%) |
| $10,000 to $12,499 | 97 (3.6%) | 54 (2.5%) |
| $12,500 to $14,999 | 0 (0.0%) | 35 (1.6%) |
| $15,000 to $17,499 | 73 (2.7%) | 47 (2.2%) |
| $17,500 to $19,999 | 43 (1.6%) | 113 (5.3%) |
| $20,000 to $22,499 | 80 (2.9%) | 38 (1.8%) |
| $22,500 to $24,999 | 62 (2.3%) | 36 (1.7%) |
| $25,000 to $29,999 | 49 (1.8%) | 125 (5.8%) |
| $30,000 to $34,999 | 56 (2.1%) | 59 (2.7%) |
| $35,000 to $39,999 | 70 (2.6%) | 184 (8.6%) |
| $40,000 to $44,999 | 74 (2.7%) | 73 (3.4%) |
| $45,000 to $49,999 | 94 (3.5%) | 110 (5.1%) |
| $50,000 to $54,999 | 24 (0.9%) | 68 (3.2%) |
| $55,000 to $64,999 | 154 (5.7%) | 188 (8.7%) |
| $65,000 to $74,999 | 208 (7.6%) | 155 (7.2%) |
| $75,000 to $99,999 | 296 (10.9%) | 131 (6.1%) |
| $100,000+ | 909 (33.4%) | 281 (13.1%) |
| Total | 2,724 (100.0%) | 2,150 (100.0%) |
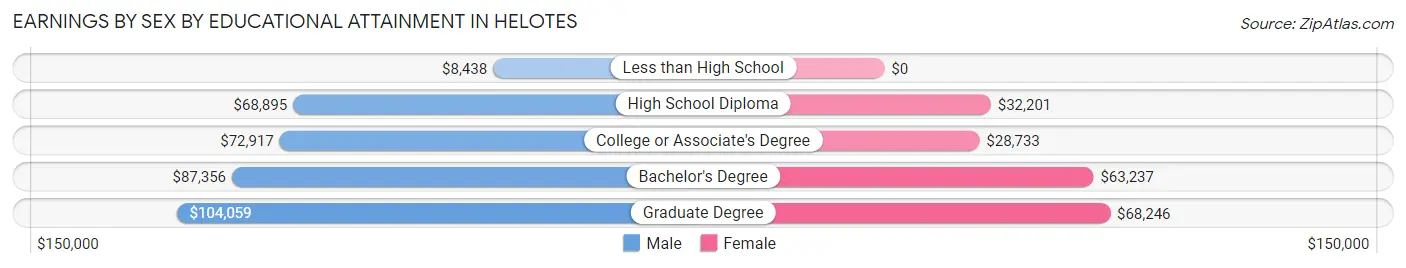
Earnings by Sex by Educational Attainment in Helotes
Average earnings in Helotes are $77,742 for men and $47,808 for women, a difference of 38.5%. Men with an educational attainment of graduate degree enjoy the highest average annual earnings of $104,059, while those with less than high school education earn the least with $8,438. Women with an educational attainment of graduate degree earn the most with the average annual earnings of $68,246, while those with college or associate's degree education have the smallest earnings of $28,733.
| Educational Attainment | Male Income | Female Income |
| Less than High School | $8,438 | $0 |
| High School Diploma | $68,895 | $32,201 |
| College or Associate's Degree | $72,917 | $28,733 |
| Bachelor's Degree | $87,356 | $63,237 |
| Graduate Degree | $104,059 | $68,246 |
| Total | $77,742 | $47,808 |
Family Income in Helotes
Family Income Brackets in Helotes
According to the Helotes family income data, there are 679 families falling into the $100,000 to $149,999 income range, which is the most common income bracket and makes up 28.8% of all families. Conversely, the $15,000 to $24,999 income bracket is the least frequent group with only 7 families (0.3%) belonging to this category.
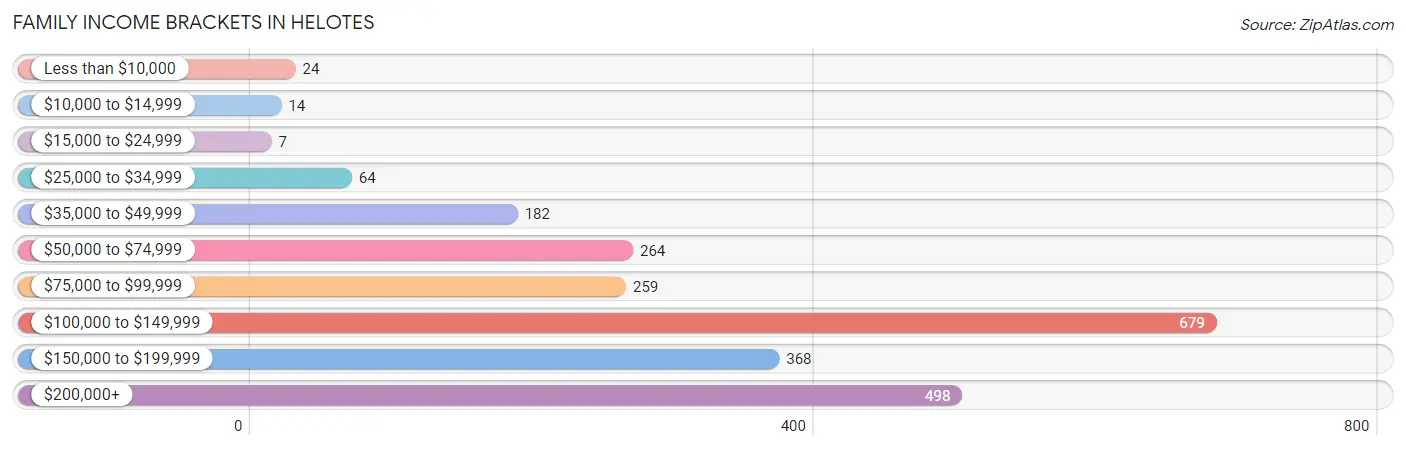
| Income Bracket | # Families | % Families |
| Less than $10,000 | 24 | 1.0% |
| $10,000 to $14,999 | 14 | 0.6% |
| $15,000 to $24,999 | 7 | 0.3% |
| $25,000 to $34,999 | 64 | 2.7% |
| $35,000 to $49,999 | 182 | 7.7% |
| $50,000 to $74,999 | 264 | 11.2% |
| $75,000 to $99,999 | 259 | 11.0% |
| $100,000 to $149,999 | 679 | 28.8% |
| $150,000 to $199,999 | 368 | 15.6% |
| $200,000+ | 498 | 21.1% |
Family Income by Famaliy Size in Helotes
6-person families (74 | 3.1%) account for the highest median family income in Helotes with $250,001 per family, while 2-person families (990 | 42.0%) have the highest median income of $55,556 per family member.
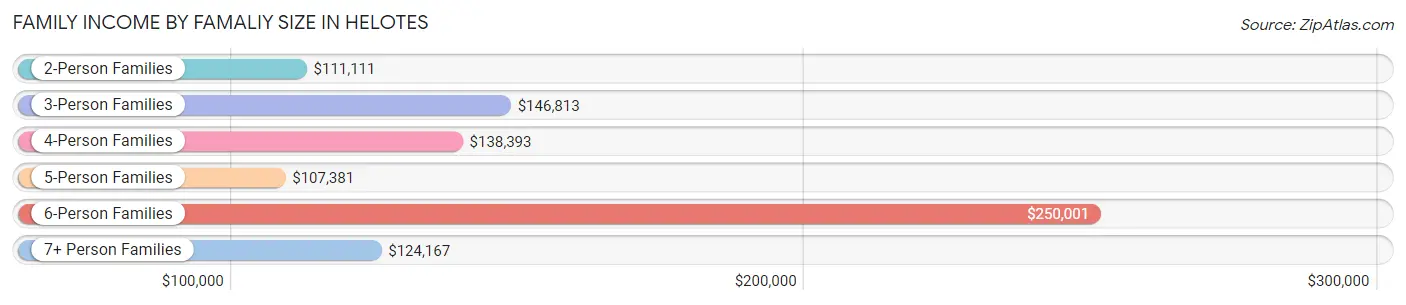
| Income Bracket | # Families | Median Income |
| 2-Person Families | 990 (42.0%) | $111,111 |
| 3-Person Families | 537 (22.8%) | $146,813 |
| 4-Person Families | 433 (18.4%) | $138,393 |
| 5-Person Families | 242 (10.3%) | $107,381 |
| 6-Person Families | 74 (3.1%) | $250,001 |
| 7+ Person Families | 82 (3.5%) | $124,167 |
| Total | 2,358 (100.0%) | $124,348 |
Family Income by Number of Earners in Helotes
The median family income in Helotes is $124,348, with families comprising 2 earners (868) having the highest median family income of $153,942, while families with no earners (462) have the lowest median family income of $70,508, accounting for 36.8% and 19.6% of families, respectively.
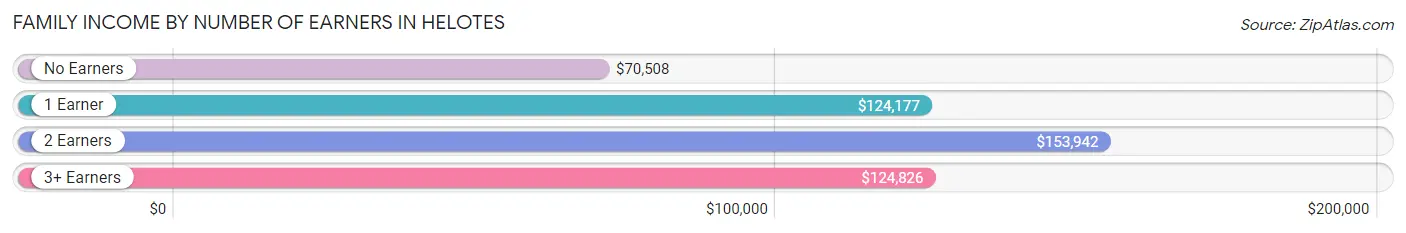
| Number of Earners | # Families | Median Income |
| No Earners | 462 (19.6%) | $70,508 |
| 1 Earner | 541 (22.9%) | $124,177 |
| 2 Earners | 868 (36.8%) | $153,942 |
| 3+ Earners | 487 (20.6%) | $124,826 |
| Total | 2,358 (100.0%) | $124,348 |
Household Income in Helotes
Household Income Brackets in Helotes
With 751 households falling in the category, the $100,000 to $149,999 income range is the most frequent in Helotes, accounting for 26.1% of all households. In contrast, only 14 households (0.5%) fall into the $10,000 to $14,999 income bracket, making it the least populous group.
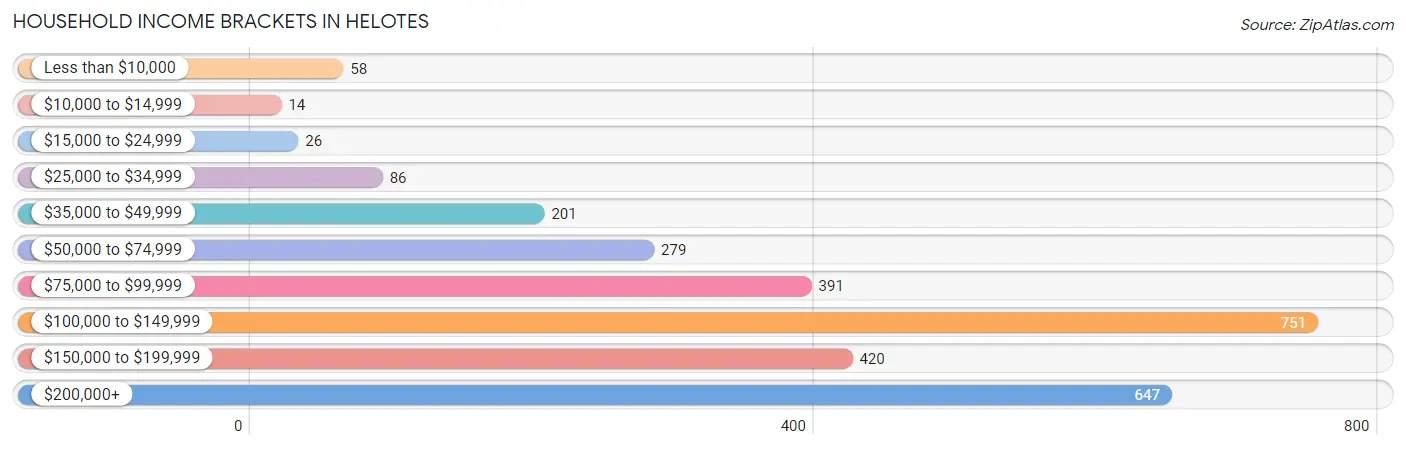
| Income Bracket | # Households | % Households |
| Less than $10,000 | 58 | 2.0% |
| $10,000 to $14,999 | 14 | 0.5% |
| $15,000 to $24,999 | 26 | 0.9% |
| $25,000 to $34,999 | 86 | 3.0% |
| $35,000 to $49,999 | 201 | 7.0% |
| $50,000 to $74,999 | 279 | 9.7% |
| $75,000 to $99,999 | 391 | 13.6% |
| $100,000 to $149,999 | 751 | 26.1% |
| $150,000 to $199,999 | 420 | 14.6% |
| $200,000+ | 647 | 22.5% |
Household Income by Householder Age in Helotes
The median household income in Helotes is $124,367, with the highest median household income of $147,813 found in the 45 to 64 years age bracket for the primary householder. A total of 1,327 households (46.1%) fall into this category.
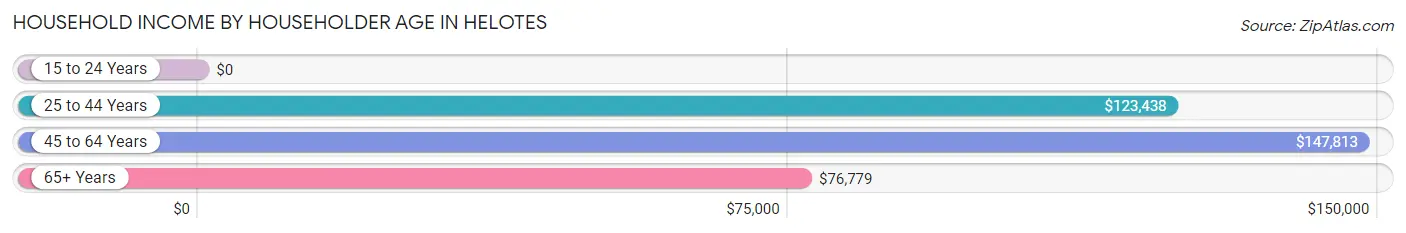
| Income Bracket | # Households | Median Income |
| 15 to 24 Years | 0 (0.0%) | $0 |
| 25 to 44 Years | 718 (25.0%) | $123,438 |
| 45 to 64 Years | 1,327 (46.1%) | $147,813 |
| 65+ Years | 831 (28.9%) | $76,779 |
| Total | 2,876 (100.0%) | $124,367 |
Poverty in Helotes
Income Below Poverty by Sex and Age in Helotes
With 2.8% poverty level for males and 3.2% for females among the residents of Helotes, under 5 year old males and 75 year old and over females are the most vulnerable to poverty, with 7 males (13.5%) and 60 females (15.8%) in their respective age groups living below the poverty level.
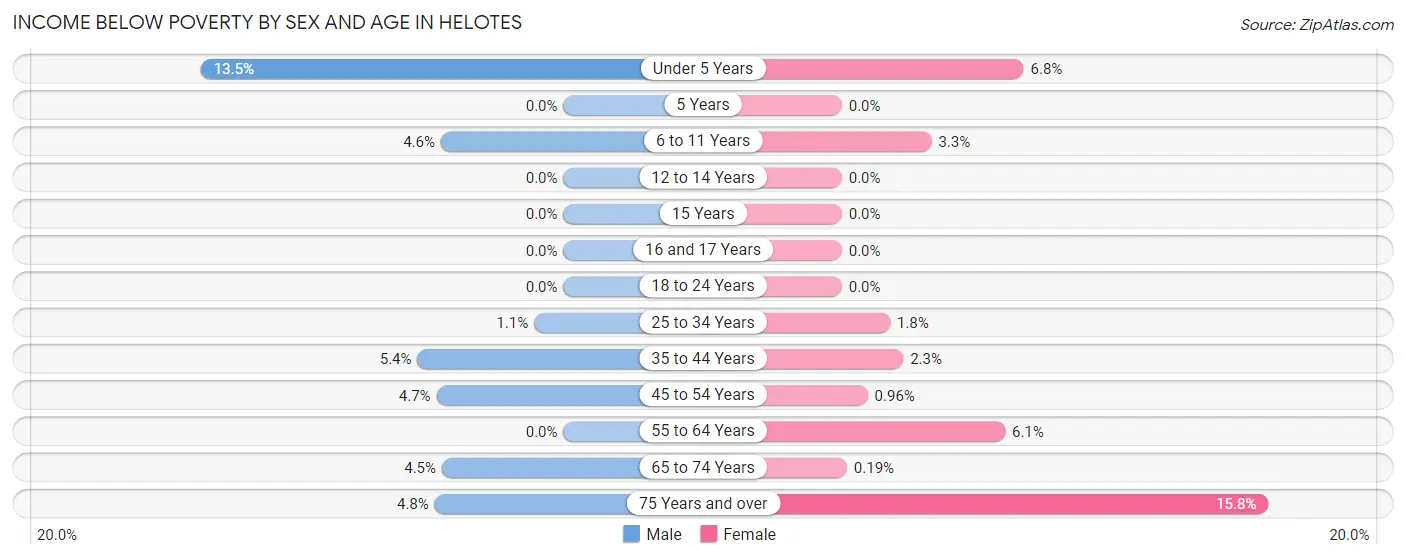
| Age Bracket | Male | Female |
| Under 5 Years | 7 (13.5%) | 11 (6.8%) |
| 5 Years | 0 (0.0%) | 0 (0.0%) |
| 6 to 11 Years | 20 (4.5%) | 7 (3.3%) |
| 12 to 14 Years | 0 (0.0%) | 0 (0.0%) |
| 15 Years | 0 (0.0%) | 0 (0.0%) |
| 16 and 17 Years | 0 (0.0%) | 0 (0.0%) |
| 18 to 24 Years | 0 (0.0%) | 0 (0.0%) |
| 25 to 34 Years | 7 (1.1%) | 7 (1.8%) |
| 35 to 44 Years | 16 (5.4%) | 11 (2.3%) |
| 45 to 54 Years | 37 (4.7%) | 8 (1.0%) |
| 55 to 64 Years | 0 (0.0%) | 40 (6.1%) |
| 65 to 74 Years | 23 (4.5%) | 1 (0.2%) |
| 75 Years and over | 14 (4.8%) | 60 (15.8%) |
| Total | 124 (2.8%) | 145 (3.2%) |
Income Above Poverty by Sex and Age in Helotes
According to the poverty statistics in Helotes, males aged 5 years and females aged 5 years are the age groups that are most secure financially, with 100.0% of males and 100.0% of females in these age groups living above the poverty line.
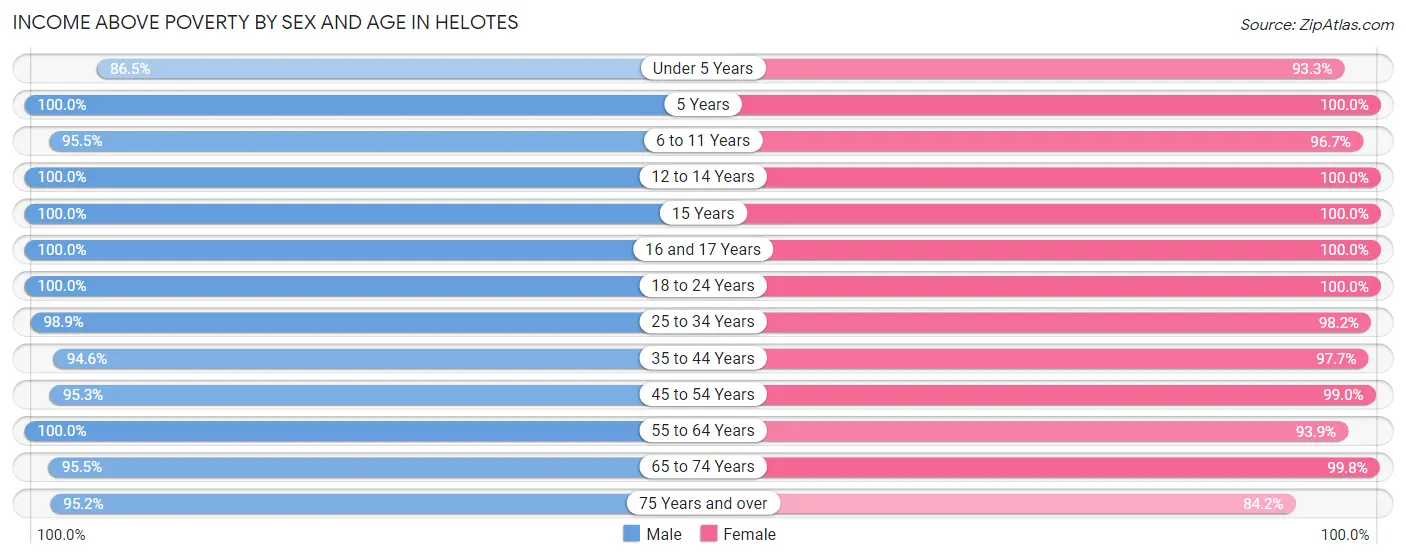
| Age Bracket | Male | Female |
| Under 5 Years | 45 (86.5%) | 152 (93.2%) |
| 5 Years | 46 (100.0%) | 34 (100.0%) |
| 6 to 11 Years | 420 (95.5%) | 203 (96.7%) |
| 12 to 14 Years | 139 (100.0%) | 241 (100.0%) |
| 15 Years | 99 (100.0%) | 55 (100.0%) |
| 16 and 17 Years | 124 (100.0%) | 227 (100.0%) |
| 18 to 24 Years | 565 (100.0%) | 380 (100.0%) |
| 25 to 34 Years | 636 (98.9%) | 383 (98.2%) |
| 35 to 44 Years | 279 (94.6%) | 471 (97.7%) |
| 45 to 54 Years | 748 (95.3%) | 823 (99.0%) |
| 55 to 64 Years | 510 (100.0%) | 620 (93.9%) |
| 65 to 74 Years | 487 (95.5%) | 512 (99.8%) |
| 75 Years and over | 279 (95.2%) | 319 (84.2%) |
| Total | 4,377 (97.3%) | 4,420 (96.8%) |
Income Below Poverty Among Married-Couple Families in Helotes
The poverty statistics for married-couple families in Helotes show that 2.2% or 44 of the total 1,985 families live below the poverty line. Families with 1 or 2 children have the highest poverty rate of 2.6%, comprising of 17 families. On the other hand, families with 3 or 4 children have the lowest poverty rate of 0.0%, which includes 0 families.
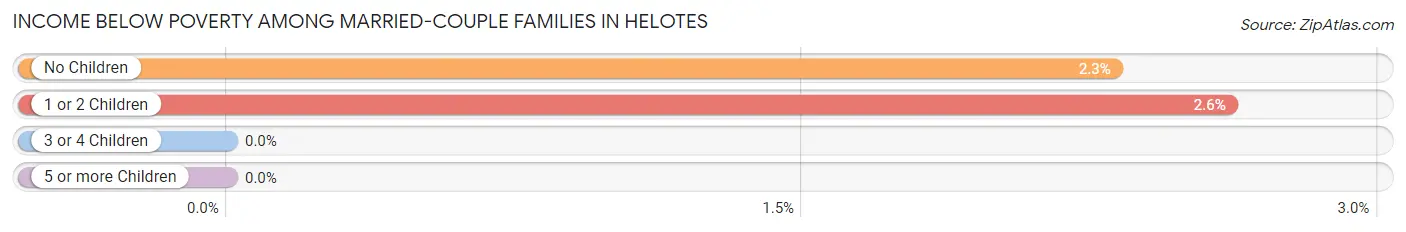
| Children | Above Poverty | Below Poverty |
| No Children | 1,141 (97.7%) | 27 (2.3%) |
| 1 or 2 Children | 635 (97.4%) | 17 (2.6%) |
| 3 or 4 Children | 165 (100.0%) | 0 (0.0%) |
| 5 or more Children | 0 (0.0%) | 0 (0.0%) |
| Total | 1,941 (97.8%) | 44 (2.2%) |
Income Below Poverty Among Single-Parent Households in Helotes
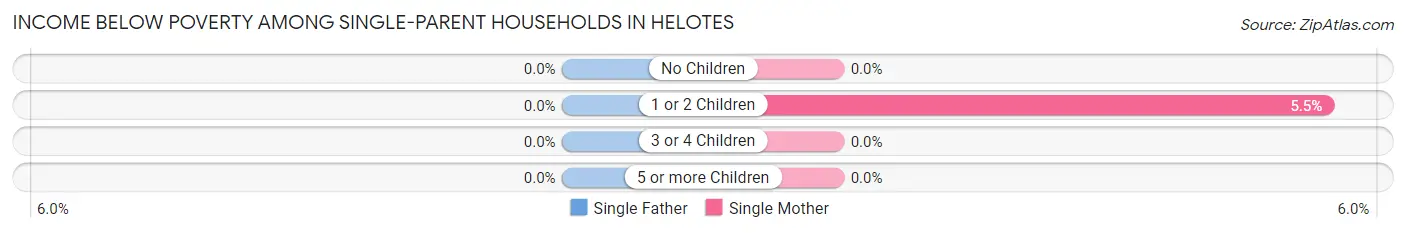
| Children | Single Father | Single Mother |
| No Children | 0 (0.0%) | 0 (0.0%) |
| 1 or 2 Children | 0 (0.0%) | 8 (5.5%) |
| 3 or 4 Children | 0 (0.0%) | 0 (0.0%) |
| 5 or more Children | 0 (0.0%) | 0 (0.0%) |
| Total | 0 (0.0%) | 8 (2.6%) |
Income Below Poverty Among Married-Couple vs Single-Parent Households in Helotes
The poverty data for Helotes shows that 44 of the married-couple family households (2.2%) and 8 of the single-parent households (2.1%) are living below the poverty level. Within the married-couple family households, those with 1 or 2 children have the highest poverty rate, with 17 households (2.6%) falling below the poverty line. Among the single-parent households, those with 1 or 2 children have the highest poverty rate, with 8 household (5.5%) living below poverty.
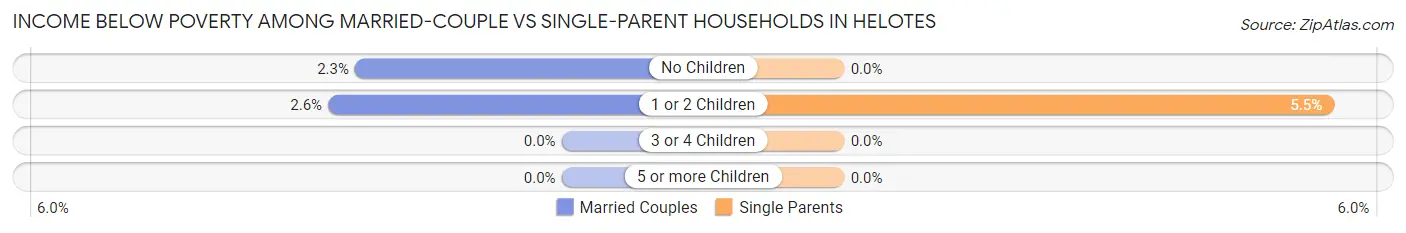
| Children | Married-Couple Families | Single-Parent Households |
| No Children | 27 (2.3%) | 0 (0.0%) |
| 1 or 2 Children | 17 (2.6%) | 8 (5.5%) |
| 3 or 4 Children | 0 (0.0%) | 0 (0.0%) |
| 5 or more Children | 0 (0.0%) | 0 (0.0%) |
| Total | 44 (2.2%) | 8 (2.1%) |
Race in Helotes
The most populous races in Helotes are White / Caucasian (6,491 | 71.0%), Hispanic or Latino (4,728 | 51.7%), and Two or more Races (1,494 | 16.4%).
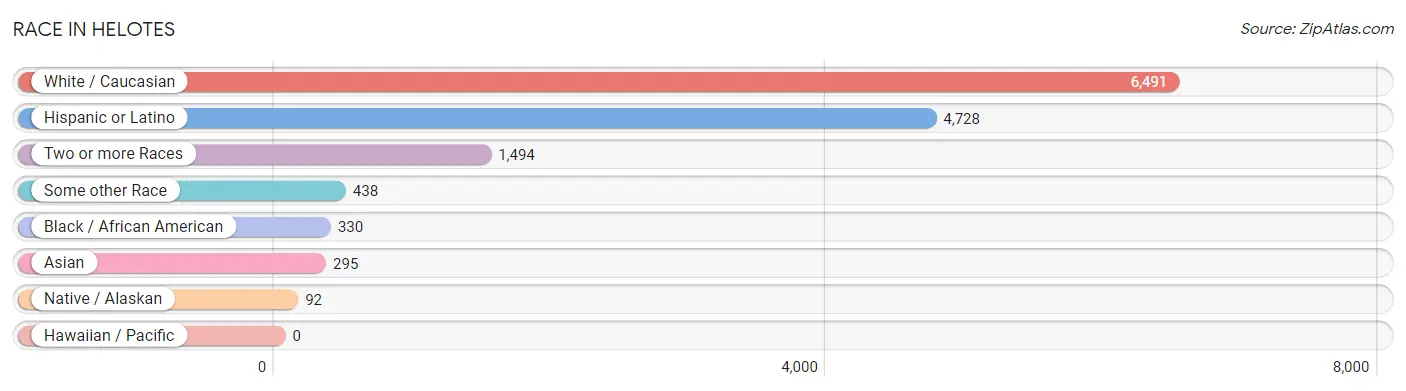
| Race | # Population | % Population |
| Asian | 295 | 3.2% |
| Black / African American | 330 | 3.6% |
| Hawaiian / Pacific | 0 | 0.0% |
| Hispanic or Latino | 4,728 | 51.7% |
| Native / Alaskan | 92 | 1.0% |
| White / Caucasian | 6,491 | 71.0% |
| Two or more Races | 1,494 | 16.4% |
| Some other Race | 438 | 4.8% |
| Total | 9,140 | 100.0% |
Ancestry in Helotes
The most populous ancestries reported in Helotes are Mexican (3,884 | 42.5%), German (1,267 | 13.9%), English (703 | 7.7%), Irish (584 | 6.4%), and French (439 | 4.8%), together accounting for 75.2% of all Helotes residents.
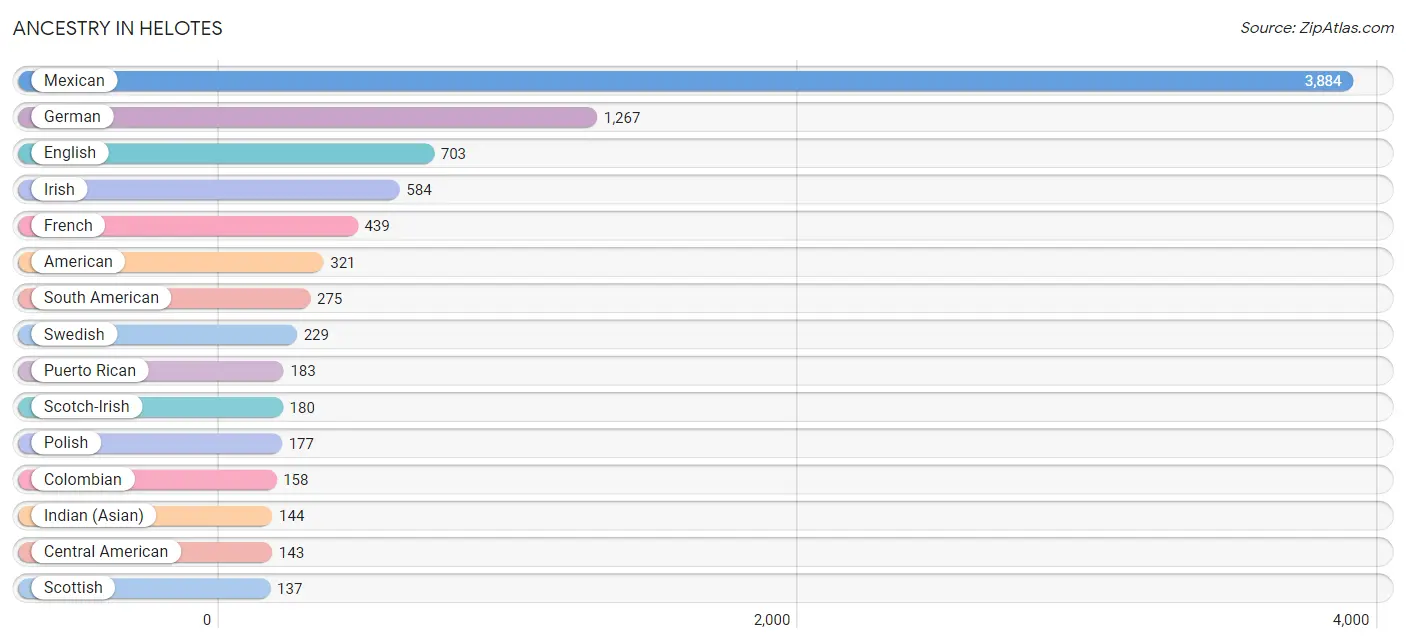
| Ancestry | # Population | % Population |
| Alsatian | 48 | 0.5% |
| American | 321 | 3.5% |
| Apache | 23 | 0.3% |
| Arab | 47 | 0.5% |
| Austrian | 29 | 0.3% |
| Belgian | 33 | 0.4% |
| Burmese | 21 | 0.2% |
| Canadian | 72 | 0.8% |
| Central American | 143 | 1.6% |
| Central American Indian | 62 | 0.7% |
| Cherokee | 37 | 0.4% |
| Chilean | 21 | 0.2% |
| Colombian | 158 | 1.7% |
| Czech | 55 | 0.6% |
| Danish | 19 | 0.2% |
| Dutch | 17 | 0.2% |
| English | 703 | 7.7% |
| European | 70 | 0.8% |
| Filipino | 22 | 0.2% |
| French | 439 | 4.8% |
| French Canadian | 15 | 0.2% |
| German | 1,267 | 13.9% |
| Guatemalan | 14 | 0.2% |
| Hopi | 7 | 0.1% |
| Hungarian | 41 | 0.4% |
| Indian (Asian) | 144 | 1.6% |
| Iranian | 41 | 0.4% |
| Irish | 584 | 6.4% |
| Italian | 125 | 1.4% |
| Korean | 55 | 0.6% |
| Lebanese | 5 | 0.1% |
| Mexican | 3,884 | 42.5% |
| Navajo | 7 | 0.1% |
| Norwegian | 26 | 0.3% |
| Palestinian | 23 | 0.3% |
| Polish | 177 | 1.9% |
| Puerto Rican | 183 | 2.0% |
| Romanian | 12 | 0.1% |
| Salvadoran | 129 | 1.4% |
| Scandinavian | 12 | 0.1% |
| Scotch-Irish | 180 | 2.0% |
| Scottish | 137 | 1.5% |
| South American | 275 | 3.0% |
| Spaniard | 23 | 0.3% |
| Spanish | 40 | 0.4% |
| Swedish | 229 | 2.5% |
| Thai | 84 | 0.9% |
| Venezuelan | 96 | 1.1% |
| Welsh | 104 | 1.1% | View All 49 Rows |
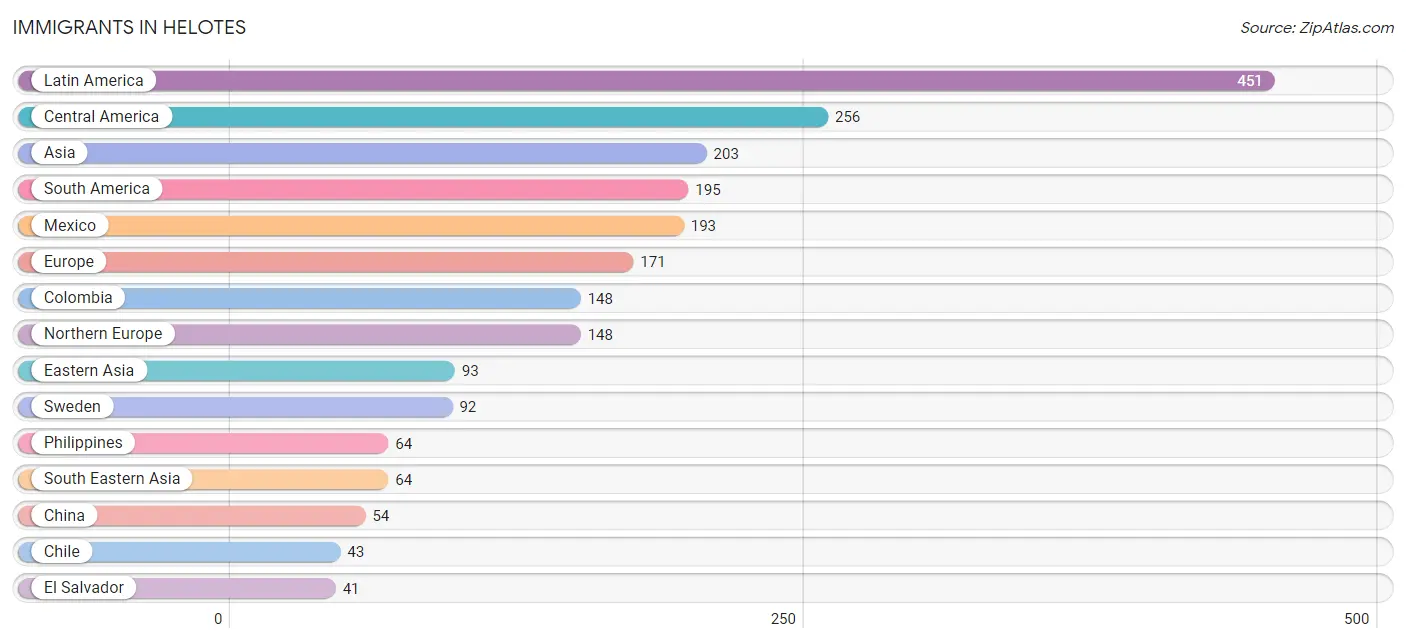
Immigrants in Helotes
The most numerous immigrant groups reported in Helotes came from Latin America (451 | 4.9%), Central America (256 | 2.8%), Asia (203 | 2.2%), South America (195 | 2.1%), and Mexico (193 | 2.1%), together accounting for 14.2% of all Helotes residents.
| Immigration Origin | # Population | % Population |
| Asia | 203 | 2.2% |
| Canada | 15 | 0.2% |
| Central America | 256 | 2.8% |
| Chile | 43 | 0.5% |
| China | 54 | 0.6% |
| Colombia | 148 | 1.6% |
| Eastern Asia | 93 | 1.0% |
| El Salvador | 41 | 0.4% |
| England | 31 | 0.3% |
| Europe | 171 | 1.9% |
| Germany | 10 | 0.1% |
| Guatemala | 7 | 0.1% |
| Honduras | 15 | 0.2% |
| Hong Kong | 14 | 0.2% |
| Ireland | 13 | 0.1% |
| Italy | 6 | 0.1% |
| Japan | 18 | 0.2% |
| Korea | 21 | 0.2% |
| Latin America | 451 | 4.9% |
| Mexico | 193 | 2.1% |
| Netherlands | 7 | 0.1% |
| Northern Europe | 148 | 1.6% |
| Pakistan | 14 | 0.2% |
| Philippines | 64 | 0.7% |
| South America | 195 | 2.1% |
| South Central Asia | 27 | 0.3% |
| South Eastern Asia | 64 | 0.7% |
| Southern Europe | 6 | 0.1% |
| Sweden | 92 | 1.0% |
| Syria | 19 | 0.2% |
| Taiwan | 15 | 0.2% |
| Venezuela | 4 | 0.0% |
| Western Asia | 19 | 0.2% |
| Western Europe | 17 | 0.2% | View All 34 Rows |
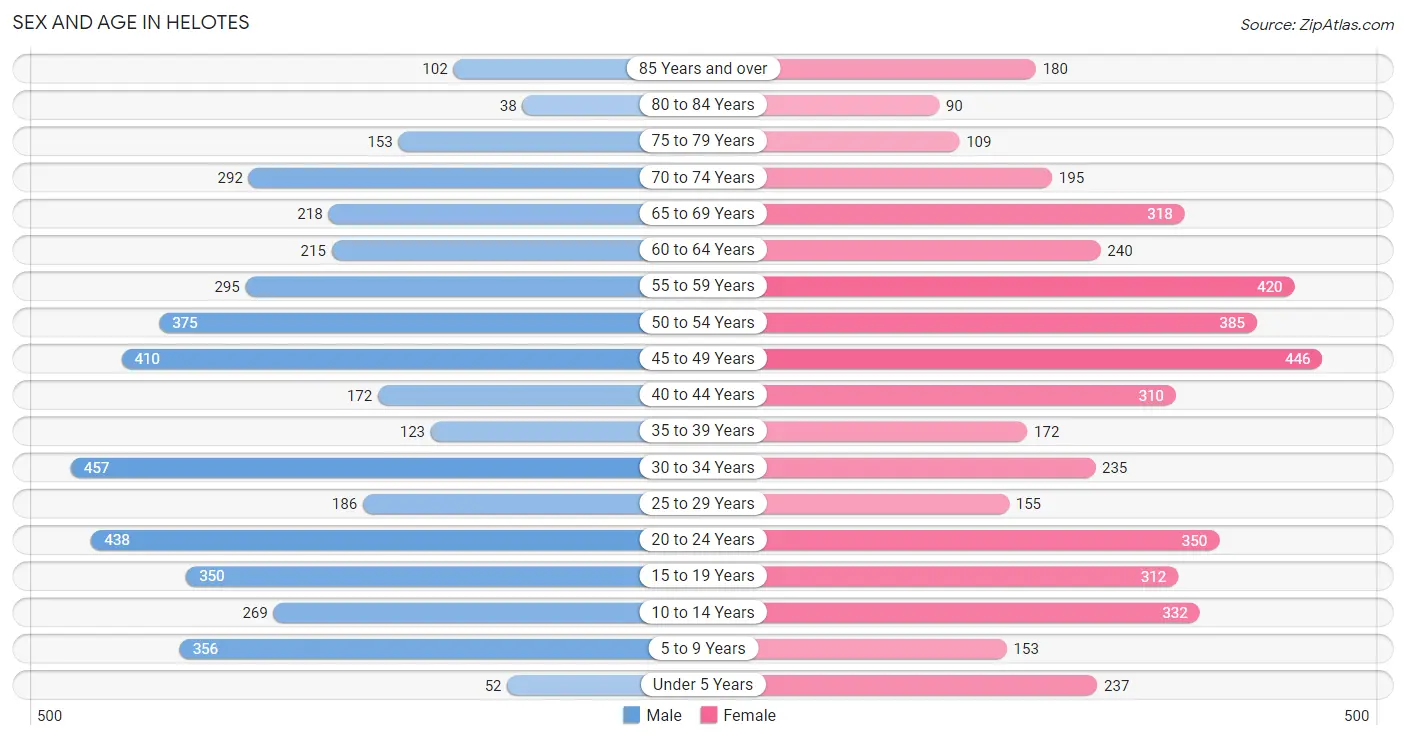
Sex and Age in Helotes
Sex and Age in Helotes
The most populous age groups in Helotes are 30 to 34 Years (457 | 10.2%) for men and 45 to 49 Years (446 | 9.6%) for women.
| Age Bracket | Male | Female |
| Under 5 Years | 52 (1.2%) | 237 (5.1%) |
| 5 to 9 Years | 356 (7.9%) | 153 (3.3%) |
| 10 to 14 Years | 269 (6.0%) | 332 (7.2%) |
| 15 to 19 Years | 350 (7.8%) | 312 (6.7%) |
| 20 to 24 Years | 438 (9.7%) | 350 (7.5%) |
| 25 to 29 Years | 186 (4.1%) | 155 (3.3%) |
| 30 to 34 Years | 457 (10.2%) | 235 (5.1%) |
| 35 to 39 Years | 123 (2.7%) | 172 (3.7%) |
| 40 to 44 Years | 172 (3.8%) | 310 (6.7%) |
| 45 to 49 Years | 410 (9.1%) | 446 (9.6%) |
| 50 to 54 Years | 375 (8.3%) | 385 (8.3%) |
| 55 to 59 Years | 295 (6.6%) | 420 (9.0%) |
| 60 to 64 Years | 215 (4.8%) | 240 (5.2%) |
| 65 to 69 Years | 218 (4.8%) | 318 (6.9%) |
| 70 to 74 Years | 292 (6.5%) | 195 (4.2%) |
| 75 to 79 Years | 153 (3.4%) | 109 (2.4%) |
| 80 to 84 Years | 38 (0.8%) | 90 (1.9%) |
| 85 Years and over | 102 (2.3%) | 180 (3.9%) |
| Total | 4,501 (100.0%) | 4,639 (100.0%) |
Families and Households in Helotes
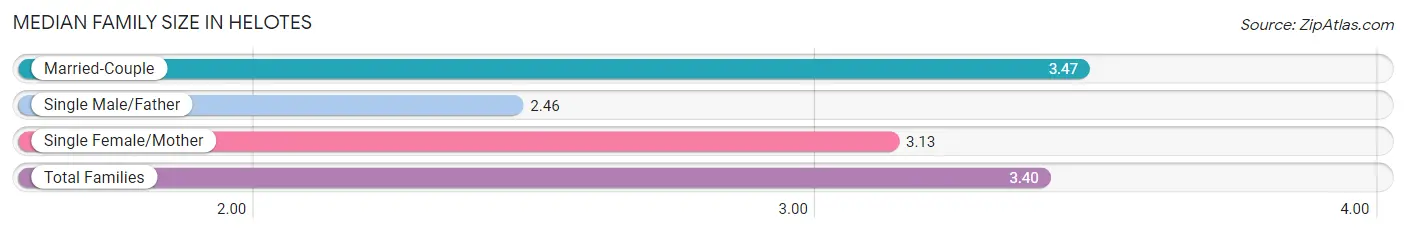
Median Family Size in Helotes
The median family size in Helotes is 3.40 persons per family, with married-couple families (1,985 | 84.2%) accounting for the largest median family size of 3.47 persons per family. On the other hand, single male/father families (67 | 2.8%) represent the smallest median family size with 2.46 persons per family.
| Family Type | # Families | Family Size |
| Married-Couple | 1,985 (84.2%) | 3.47 |
| Single Male/Father | 67 (2.8%) | 2.46 |
| Single Female/Mother | 306 (13.0%) | 3.13 |
| Total Families | 2,358 (100.0%) | 3.40 |
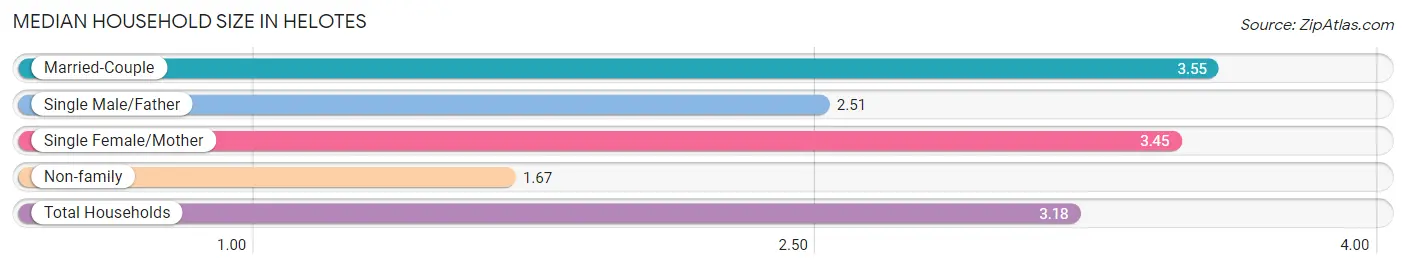
Median Household Size in Helotes
The median household size in Helotes is 3.18 persons per household, with married-couple households (1,985 | 69.0%) accounting for the largest median household size of 3.55 persons per household. non-family households (518 | 18.0%) represent the smallest median household size with 1.67 persons per household.
| Household Type | # Households | Household Size |
| Married-Couple | 1,985 (69.0%) | 3.55 |
| Single Male/Father | 67 (2.3%) | 2.51 |
| Single Female/Mother | 306 (10.6%) | 3.45 |
| Non-family | 518 (18.0%) | 1.67 |
| Total Households | 2,876 (100.0%) | 3.18 |
Household Size by Marriage Status in Helotes
Out of a total of 2,876 households in Helotes, 2,358 (82.0%) are family households, while 518 (18.0%) are nonfamily households. The most numerous type of family households are 2-person households, comprising 934, and the most common type of nonfamily households are 1-person households, comprising 296.
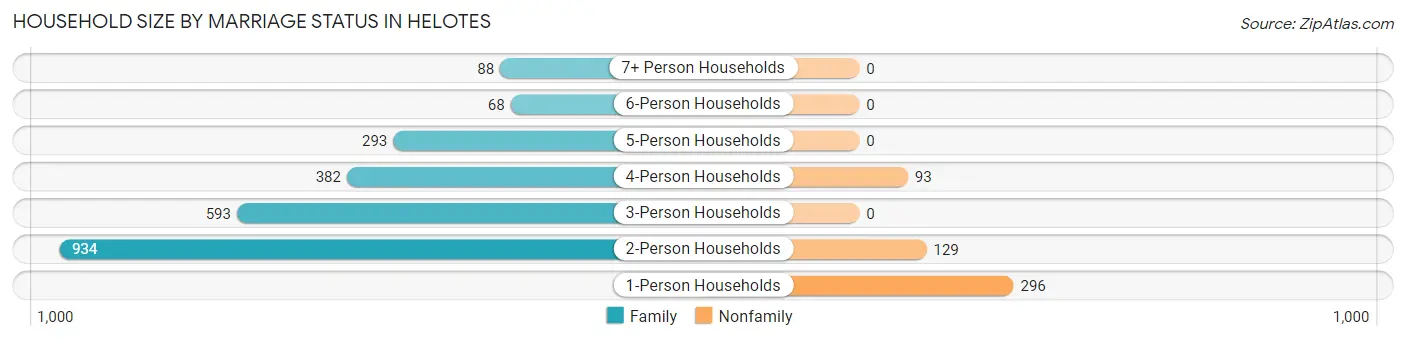
| Household Size | Family Households | Nonfamily Households |
| 1-Person Households | - | 296 (10.3%) |
| 2-Person Households | 934 (32.5%) | 129 (4.5%) |
| 3-Person Households | 593 (20.6%) | 0 (0.0%) |
| 4-Person Households | 382 (13.3%) | 93 (3.2%) |
| 5-Person Households | 293 (10.2%) | 0 (0.0%) |
| 6-Person Households | 68 (2.4%) | 0 (0.0%) |
| 7+ Person Households | 88 (3.1%) | 0 (0.0%) |
| Total | 2,358 (82.0%) | 518 (18.0%) |
Female Fertility in Helotes
Fertility by Age in Helotes
Average fertility rate in Helotes is 18.0 births per 1,000 women. Women in the age bracket of 20 to 34 years have the highest fertility rate with 27.0 births per 1,000 women. Women in the age bracket of 20 to 34 years acount for 52.6% of all women with births.
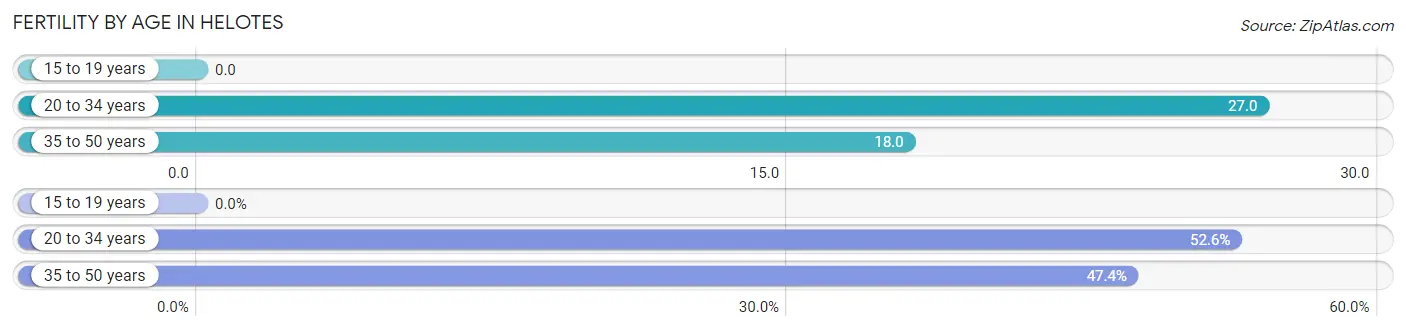
| Age Bracket | Women with Births | Births / 1,000 Women |
| 15 to 19 years | 0 (0.0%) | 0.0 |
| 20 to 34 years | 20 (52.6%) | 27.0 |
| 35 to 50 years | 18 (47.4%) | 18.0 |
| Total | 38 (100.0%) | 18.0 |
Fertility by Age by Marriage Status in Helotes
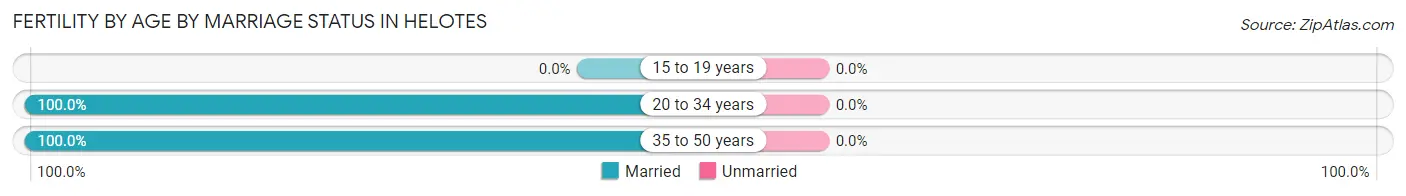
| Age Bracket | Married | Unmarried |
| 15 to 19 years | 0 (0.0%) | 0 (0.0%) |
| 20 to 34 years | 20 (100.0%) | 0 (0.0%) |
| 35 to 50 years | 18 (100.0%) | 0 (0.0%) |
| Total | 38 (100.0%) | 0 (0.0%) |
Fertility by Education in Helotes
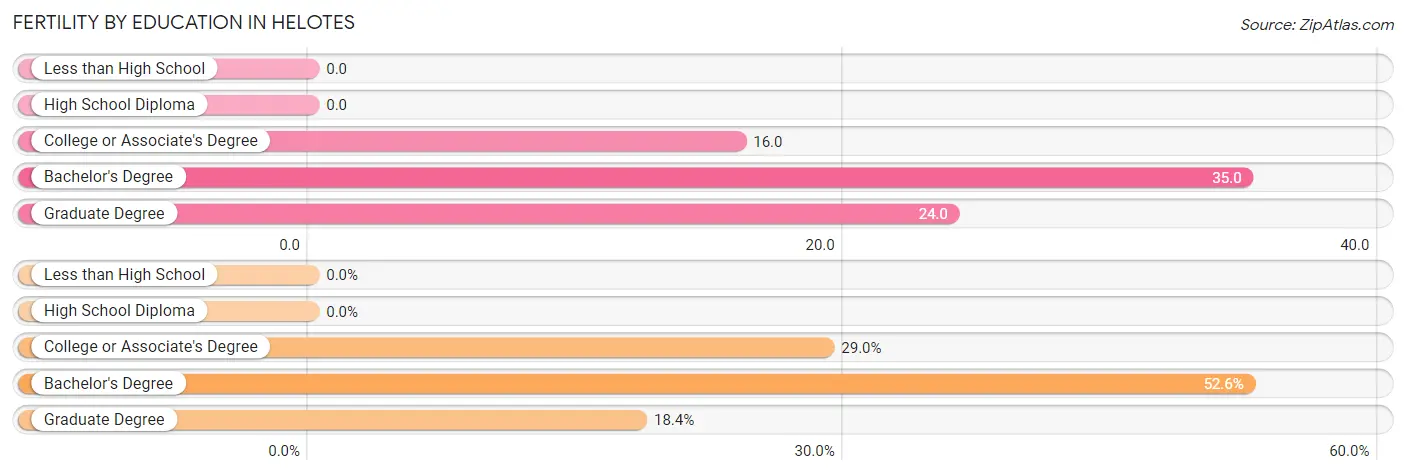
| Educational Attainment | Women with Births | Births / 1,000 Women |
| Less than High School | 0 (0.0%) | 0.0 |
| High School Diploma | 0 (0.0%) | 0.0 |
| College or Associate's Degree | 11 (28.9%) | 16.0 |
| Bachelor's Degree | 20 (52.6%) | 35.0 |
| Graduate Degree | 7 (18.4%) | 24.0 |
| Total | 38 (100.0%) | 18.0 |
Fertility by Education by Marriage Status in Helotes
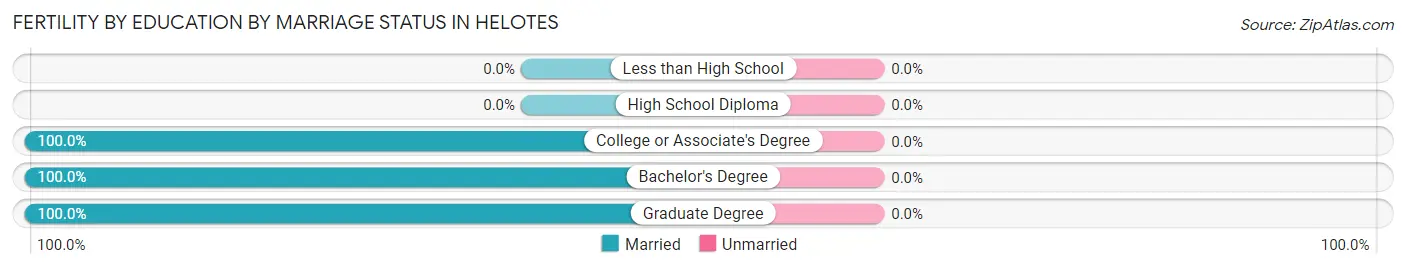
| Educational Attainment | Married | Unmarried |
| Less than High School | 0 (0.0%) | 0 (0.0%) |
| High School Diploma | 0 (0.0%) | 0 (0.0%) |
| College or Associate's Degree | 11 (100.0%) | 0 (0.0%) |
| Bachelor's Degree | 20 (100.0%) | 0 (0.0%) |
| Graduate Degree | 7 (100.0%) | 0 (0.0%) |
| Total | 38 (100.0%) | 0 (0.0%) |
Employment Characteristics in Helotes
Employment by Class of Employer in Helotes
Among the 4,274 employed individuals in Helotes, private company employees (2,659 | 62.2%), local government employees (417 | 9.8%), and self-employed (not incorporated) (321 | 7.5%) make up the most common classes of employment.
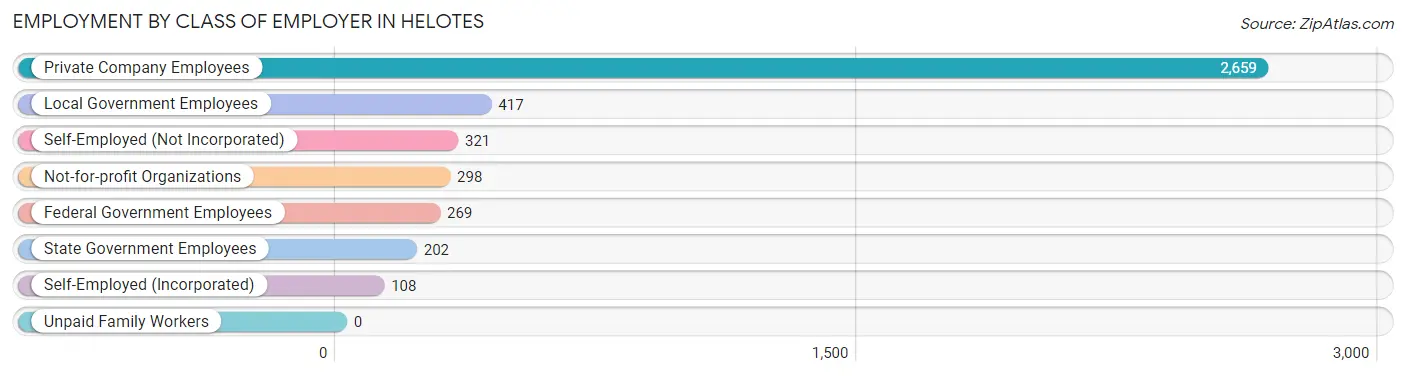
| Employer Class | # Employees | % Employees |
| Private Company Employees | 2,659 | 62.2% |
| Self-Employed (Incorporated) | 108 | 2.5% |
| Self-Employed (Not Incorporated) | 321 | 7.5% |
| Not-for-profit Organizations | 298 | 7.0% |
| Local Government Employees | 417 | 9.8% |
| State Government Employees | 202 | 4.7% |
| Federal Government Employees | 269 | 6.3% |
| Unpaid Family Workers | 0 | 0.0% |
| Total | 4,274 | 100.0% |
Employment Status by Age in Helotes
According to the labor force statistics for Helotes, out of the total population over 16 years of age (7,587), 60.9% or 4,620 individuals are in the labor force, with 7.3% or 337 of them unemployed. The age group with the highest labor force participation rate is 30 to 34 years, with 91.9% or 636 individuals in the labor force. Within the labor force, the 20 to 24 years age range has the highest percentage of unemployed individuals, with 28.7% or 172 of them being unemployed.
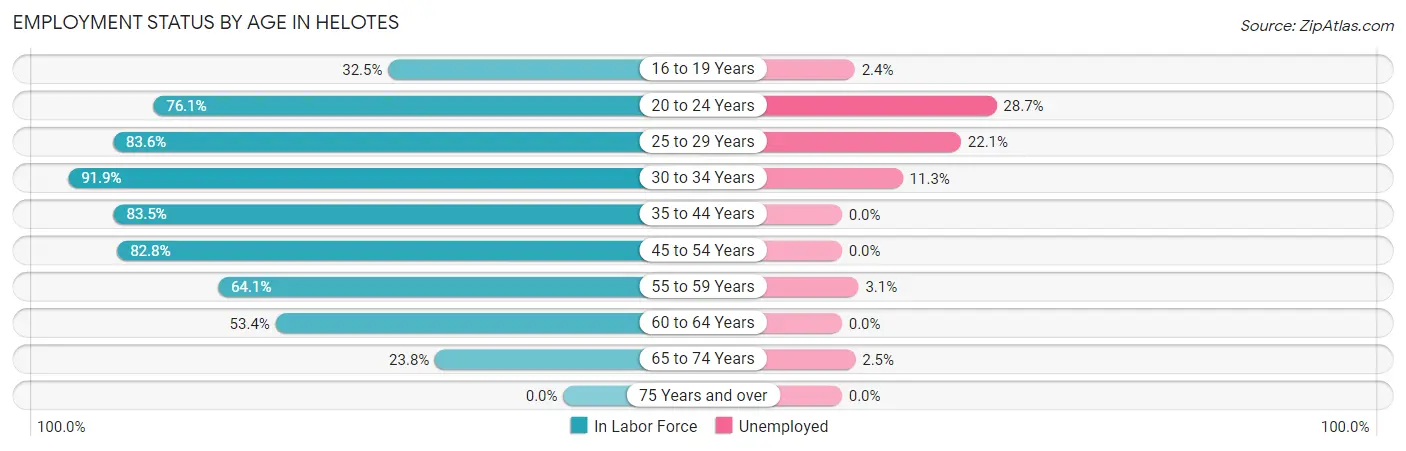
| Age Bracket | In Labor Force | Unemployed |
| 16 to 19 Years | 165 (32.5%) | 4 (2.4%) |
| 20 to 24 Years | 600 (76.1%) | 172 (28.7%) |
| 25 to 29 Years | 285 (83.6%) | 63 (22.1%) |
| 30 to 34 Years | 636 (91.9%) | 72 (11.3%) |
| 35 to 44 Years | 649 (83.5%) | 0 (0.0%) |
| 45 to 54 Years | 1,338 (82.8%) | 0 (0.0%) |
| 55 to 59 Years | 458 (64.1%) | 14 (3.1%) |
| 60 to 64 Years | 243 (53.4%) | 0 (0.0%) |
| 65 to 74 Years | 243 (23.8%) | 6 (2.5%) |
| 75 Years and over | 0 (0.0%) | 0 (0.0%) |
| Total | 4,620 (60.9%) | 337 (7.3%) |
Employment Status by Educational Attainment in Helotes
According to labor force statistics for Helotes, 78.5% of individuals (3,608) out of the total population between 25 and 64 years of age (4,596) are in the labor force, with 4.2% or 152 of them being unemployed. The group with the highest labor force participation rate are those with the educational attainment of high school diploma, with 83.5% or 464 individuals in the labor force. Within the labor force, individuals with college / associate degree education have the highest percentage of unemployment, with 12.7% or 145 of them being unemployed.
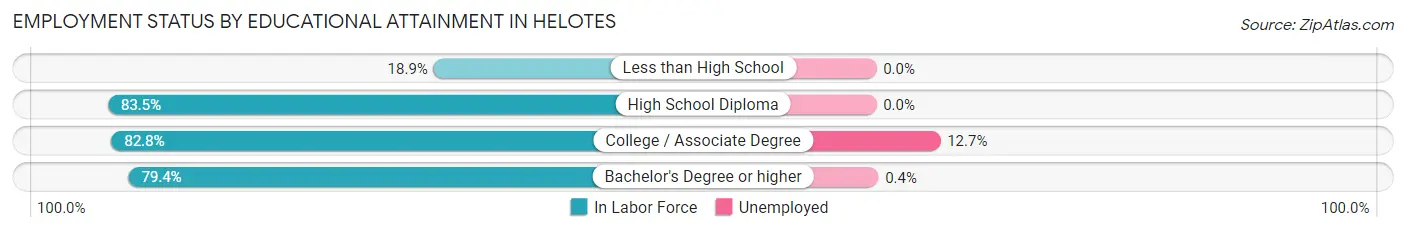
| Educational Attainment | In Labor Force | Unemployed |
| Less than High School | 34 (18.9%) | 0 (0.0%) |
| High School Diploma | 464 (83.5%) | 0 (0.0%) |
| College / Associate Degree | 1,141 (82.8%) | 175 (12.7%) |
| Bachelor's Degree or higher | 1,971 (79.4%) | 10 (0.4%) |
| Total | 3,608 (78.5%) | 193 (4.2%) |
Employment Occupations by Sex in Helotes
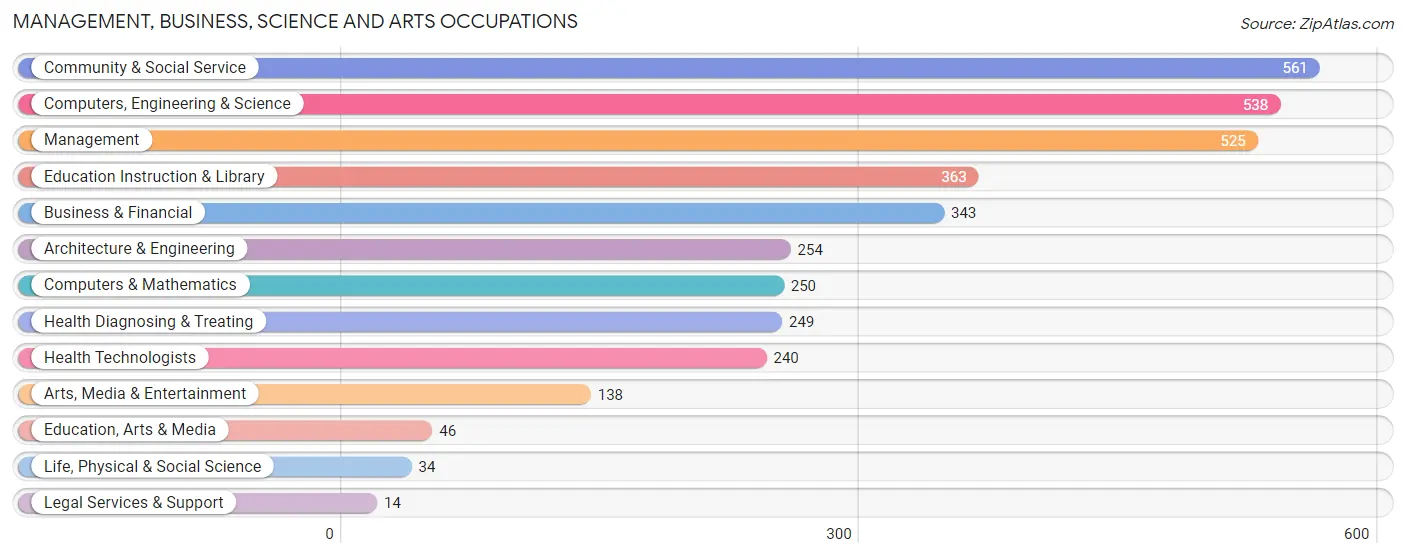
Management, Business, Science and Arts Occupations
The most common Management, Business, Science and Arts occupations in Helotes are Community & Social Service (561 | 13.3%), Computers, Engineering & Science (538 | 12.7%), Management (525 | 12.4%), Education Instruction & Library (363 | 8.6%), and Business & Financial (343 | 8.1%).
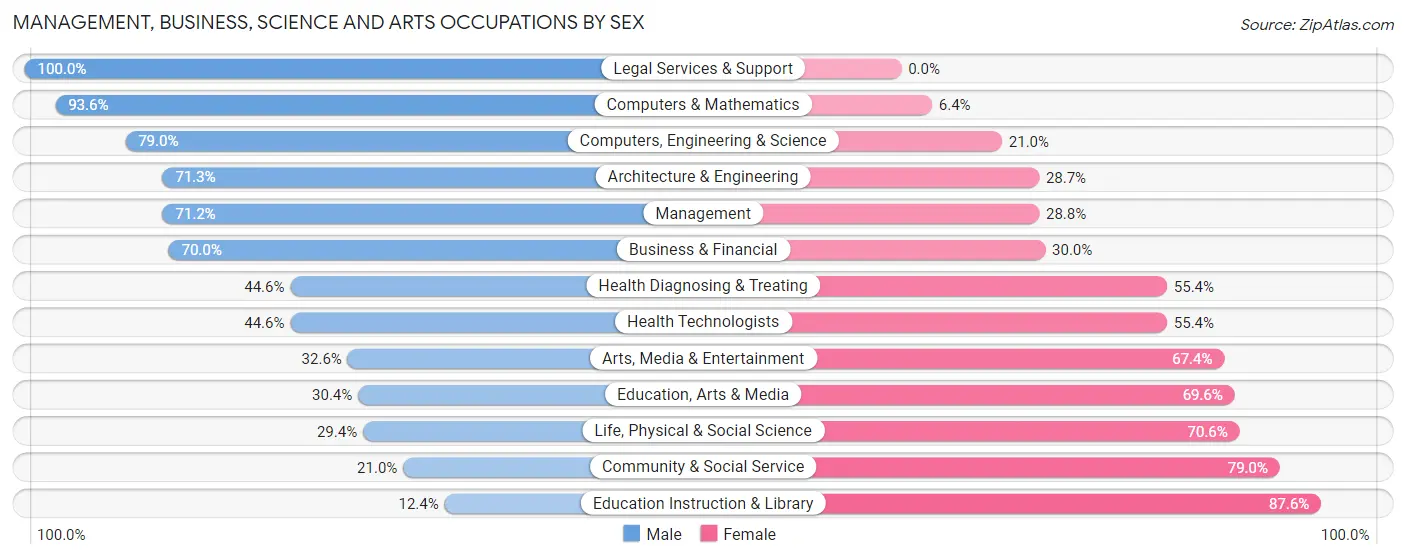
Management, Business, Science and Arts Occupations by Sex
Within the Management, Business, Science and Arts occupations in Helotes, the most male-oriented occupations are Legal Services & Support (100.0%), Computers & Mathematics (93.6%), and Computers, Engineering & Science (79.0%), while the most female-oriented occupations are Education Instruction & Library (87.6%), Community & Social Service (79.0%), and Life, Physical & Social Science (70.6%).
| Occupation | Male | Female |
| Management | 374 (71.2%) | 151 (28.8%) |
| Business & Financial | 240 (70.0%) | 103 (30.0%) |
| Computers, Engineering & Science | 425 (79.0%) | 113 (21.0%) |
| Computers & Mathematics | 234 (93.6%) | 16 (6.4%) |
| Architecture & Engineering | 181 (71.3%) | 73 (28.7%) |
| Life, Physical & Social Science | 10 (29.4%) | 24 (70.6%) |
| Community & Social Service | 118 (21.0%) | 443 (79.0%) |
| Education, Arts & Media | 14 (30.4%) | 32 (69.6%) |
| Legal Services & Support | 14 (100.0%) | 0 (0.0%) |
| Education Instruction & Library | 45 (12.4%) | 318 (87.6%) |
| Arts, Media & Entertainment | 45 (32.6%) | 93 (67.4%) |
| Health Diagnosing & Treating | 111 (44.6%) | 138 (55.4%) |
| Health Technologists | 107 (44.6%) | 133 (55.4%) |
| Total (Category) | 1,268 (57.2%) | 948 (42.8%) |
| Total (Overall) | 2,339 (55.3%) | 1,891 (44.7%) |
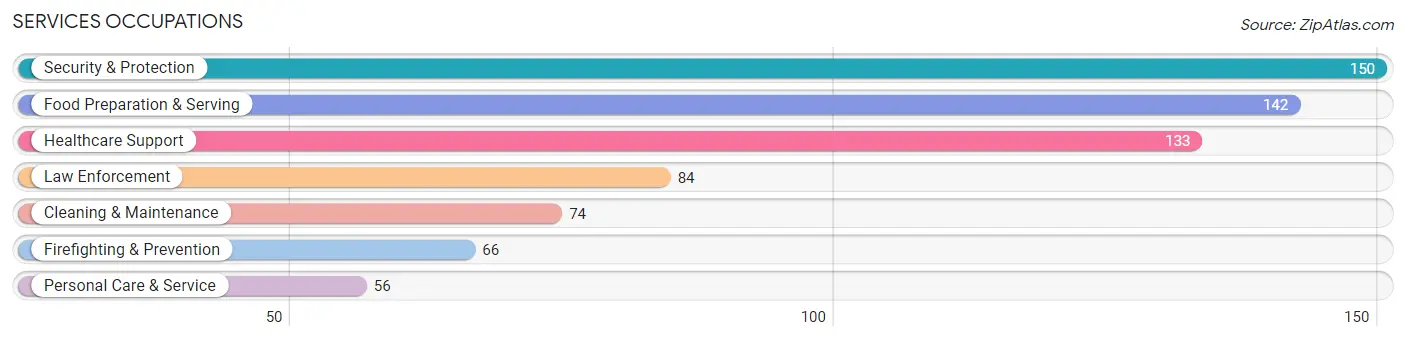
Services Occupations
The most common Services occupations in Helotes are Security & Protection (150 | 3.5%), Food Preparation & Serving (142 | 3.4%), Healthcare Support (133 | 3.1%), Law Enforcement (84 | 2.0%), and Cleaning & Maintenance (74 | 1.8%).
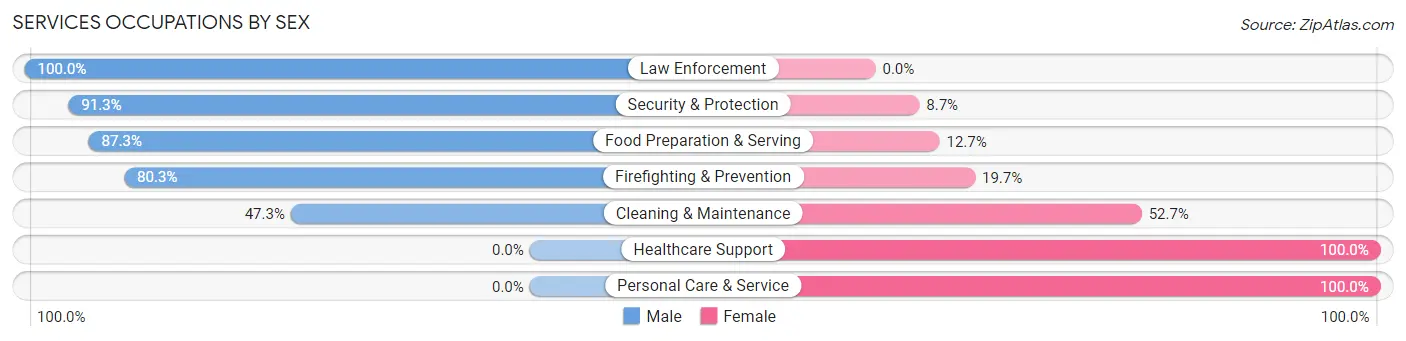
Services Occupations by Sex
Within the Services occupations in Helotes, the most male-oriented occupations are Law Enforcement (100.0%), Security & Protection (91.3%), and Food Preparation & Serving (87.3%), while the most female-oriented occupations are Healthcare Support (100.0%), Personal Care & Service (100.0%), and Cleaning & Maintenance (52.7%).
| Occupation | Male | Female |
| Healthcare Support | 0 (0.0%) | 133 (100.0%) |
| Security & Protection | 137 (91.3%) | 13 (8.7%) |
| Firefighting & Prevention | 53 (80.3%) | 13 (19.7%) |
| Law Enforcement | 84 (100.0%) | 0 (0.0%) |
| Food Preparation & Serving | 124 (87.3%) | 18 (12.7%) |
| Cleaning & Maintenance | 35 (47.3%) | 39 (52.7%) |
| Personal Care & Service | 0 (0.0%) | 56 (100.0%) |
| Total (Category) | 296 (53.3%) | 259 (46.7%) |
| Total (Overall) | 2,339 (55.3%) | 1,891 (44.7%) |
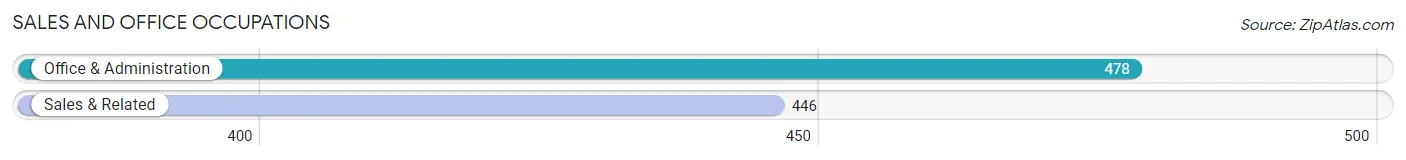
Sales and Office Occupations
The most common Sales and Office occupations in Helotes are Office & Administration (478 | 11.3%), and Sales & Related (446 | 10.5%).
Sales and Office Occupations by Sex
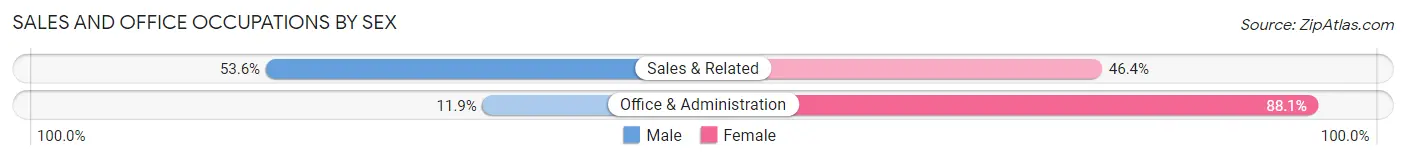
| Occupation | Male | Female |
| Sales & Related | 239 (53.6%) | 207 (46.4%) |
| Office & Administration | 57 (11.9%) | 421 (88.1%) |
| Total (Category) | 296 (32.0%) | 628 (68.0%) |
| Total (Overall) | 2,339 (55.3%) | 1,891 (44.7%) |
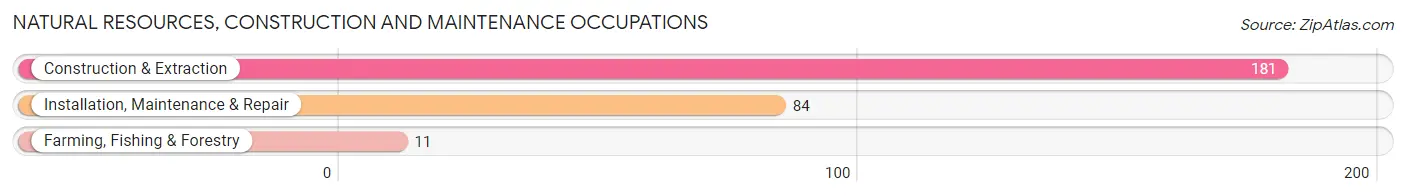
Natural Resources, Construction and Maintenance Occupations
The most common Natural Resources, Construction and Maintenance occupations in Helotes are Construction & Extraction (181 | 4.3%), Installation, Maintenance & Repair (84 | 2.0%), and Farming, Fishing & Forestry (11 | 0.3%).
Natural Resources, Construction and Maintenance Occupations by Sex
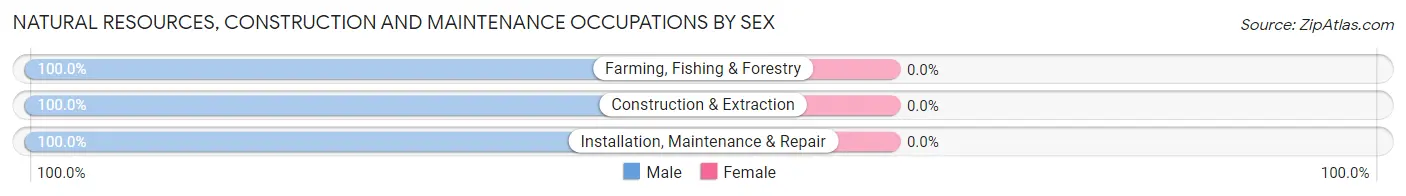
| Occupation | Male | Female |
| Farming, Fishing & Forestry | 11 (100.0%) | 0 (0.0%) |
| Construction & Extraction | 181 (100.0%) | 0 (0.0%) |
| Installation, Maintenance & Repair | 84 (100.0%) | 0 (0.0%) |
| Total (Category) | 276 (100.0%) | 0 (0.0%) |
| Total (Overall) | 2,339 (55.3%) | 1,891 (44.7%) |
Production, Transportation and Moving Occupations
The most common Production, Transportation and Moving occupations in Helotes are Production (140 | 3.3%), Material Moving (62 | 1.5%), and Transportation (57 | 1.3%).
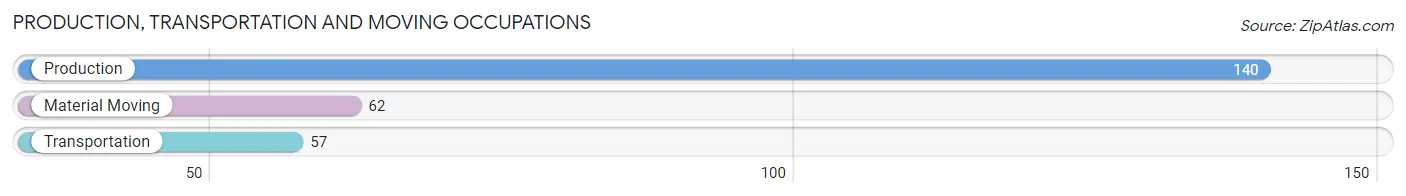
Production, Transportation and Moving Occupations by Sex
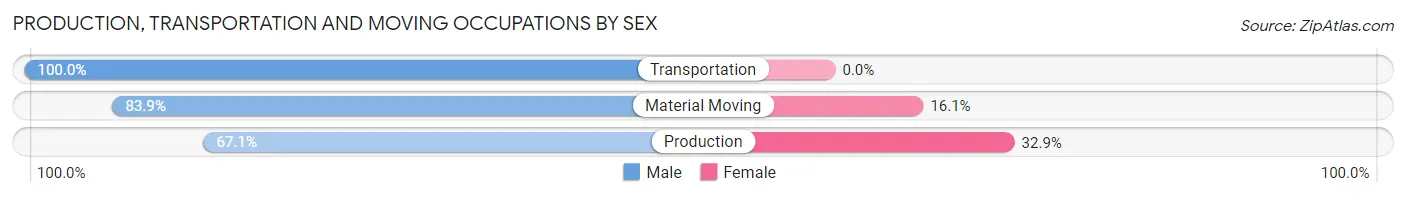
| Occupation | Male | Female |
| Production | 94 (67.1%) | 46 (32.9%) |
| Transportation | 57 (100.0%) | 0 (0.0%) |
| Material Moving | 52 (83.9%) | 10 (16.1%) |
| Total (Category) | 203 (78.4%) | 56 (21.6%) |
| Total (Overall) | 2,339 (55.3%) | 1,891 (44.7%) |
Employment Industries by Sex in Helotes
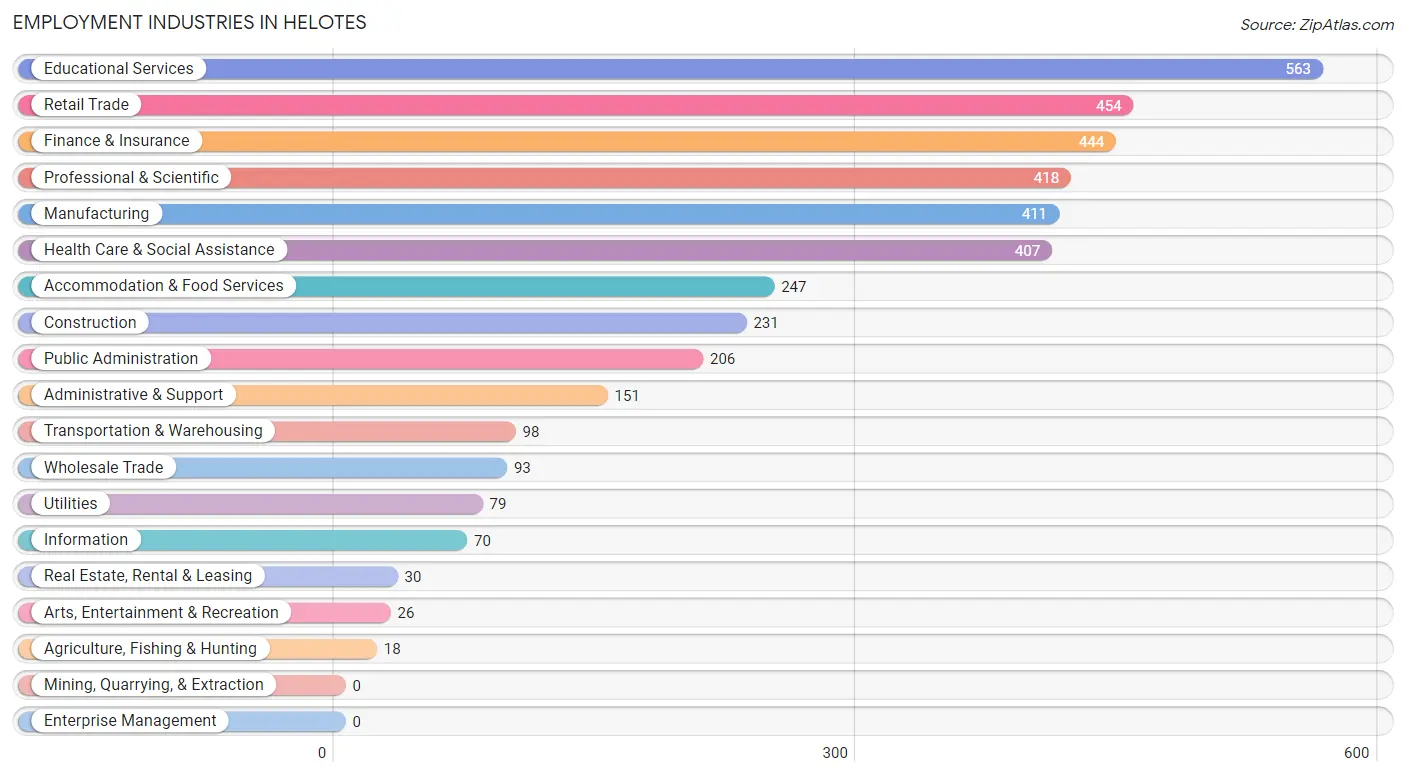
Employment Industries in Helotes
The major employment industries in Helotes include Educational Services (563 | 13.3%), Retail Trade (454 | 10.7%), Finance & Insurance (444 | 10.5%), Professional & Scientific (418 | 9.9%), and Manufacturing (411 | 9.7%).
Employment Industries by Sex in Helotes
The Helotes industries that see more men than women are Agriculture, Fishing & Hunting (100.0%), Real Estate, Rental & Leasing (100.0%), and Public Administration (90.8%), whereas the industries that tend to have a higher number of women are Educational Services (78.0%), Health Care & Social Assistance (73.2%), and Arts, Entertainment & Recreation (73.1%).
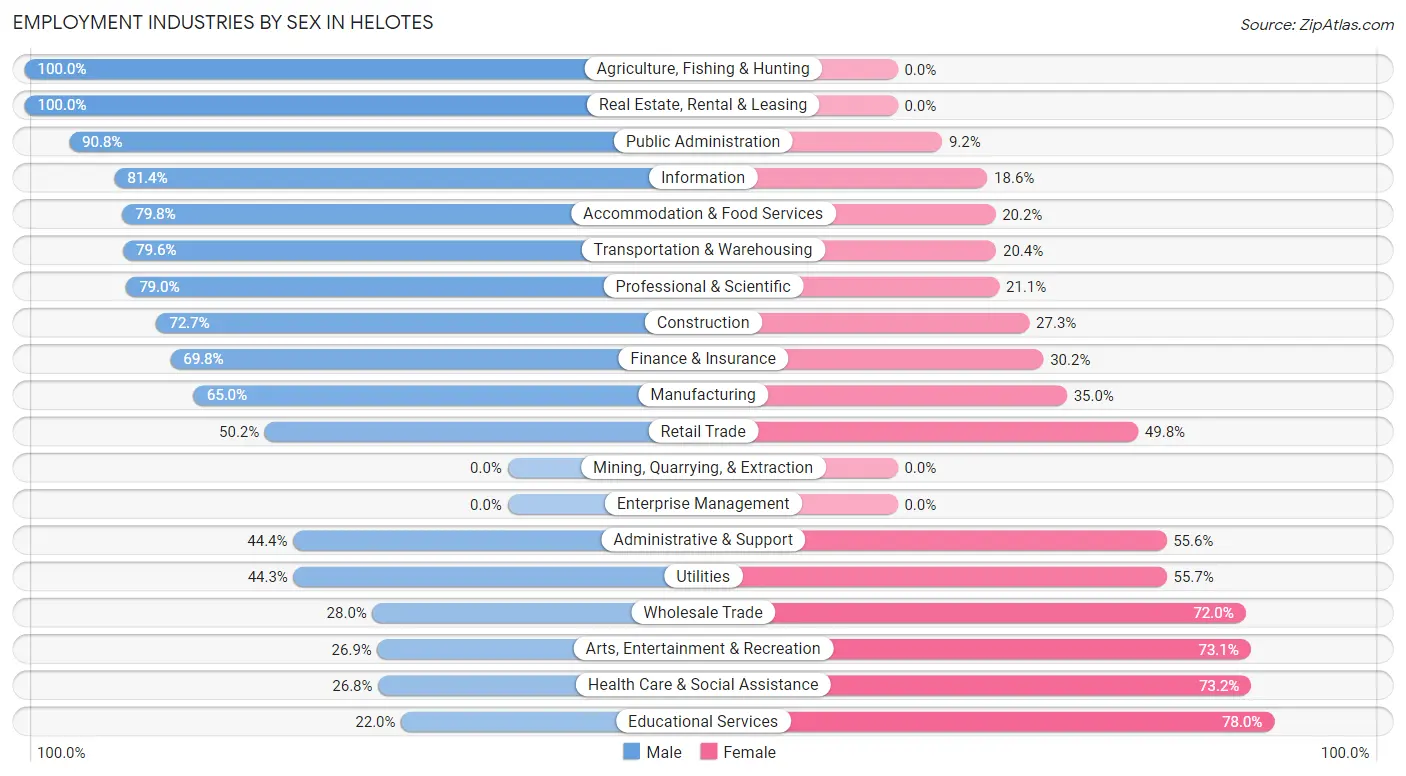
| Industry | Male | Female |
| Agriculture, Fishing & Hunting | 18 (100.0%) | 0 (0.0%) |
| Mining, Quarrying, & Extraction | 0 (0.0%) | 0 (0.0%) |
| Construction | 168 (72.7%) | 63 (27.3%) |
| Manufacturing | 267 (65.0%) | 144 (35.0%) |
| Wholesale Trade | 26 (28.0%) | 67 (72.0%) |
| Retail Trade | 228 (50.2%) | 226 (49.8%) |
| Transportation & Warehousing | 78 (79.6%) | 20 (20.4%) |
| Utilities | 35 (44.3%) | 44 (55.7%) |
| Information | 57 (81.4%) | 13 (18.6%) |
| Finance & Insurance | 310 (69.8%) | 134 (30.2%) |
| Real Estate, Rental & Leasing | 30 (100.0%) | 0 (0.0%) |
| Professional & Scientific | 330 (78.9%) | 88 (21.0%) |
| Enterprise Management | 0 (0.0%) | 0 (0.0%) |
| Administrative & Support | 67 (44.4%) | 84 (55.6%) |
| Educational Services | 124 (22.0%) | 439 (78.0%) |
| Health Care & Social Assistance | 109 (26.8%) | 298 (73.2%) |
| Arts, Entertainment & Recreation | 7 (26.9%) | 19 (73.1%) |
| Accommodation & Food Services | 197 (79.8%) | 50 (20.2%) |
| Public Administration | 187 (90.8%) | 19 (9.2%) |
| Total | 2,339 (55.3%) | 1,891 (44.7%) |
Education in Helotes
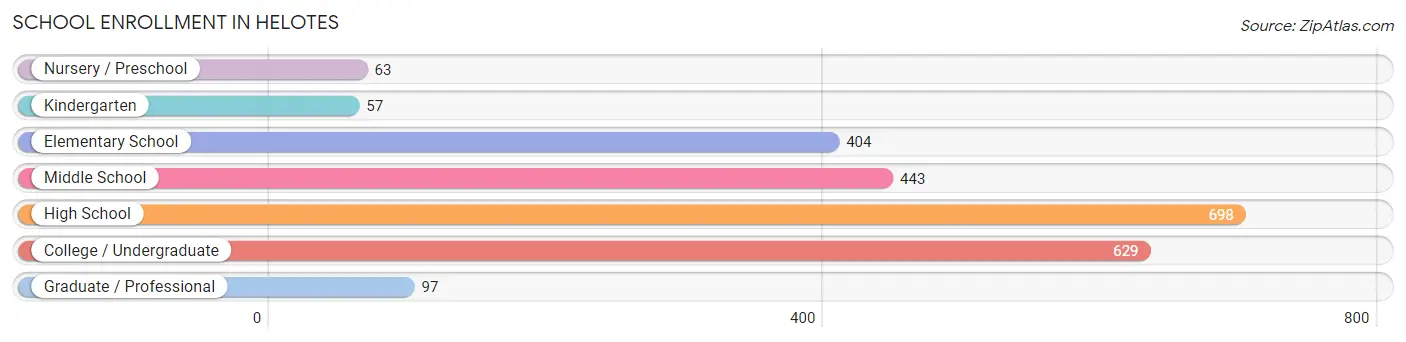
School Enrollment in Helotes
The most common levels of schooling among the 2,391 students in Helotes are high school (698 | 29.2%), college / undergraduate (629 | 26.3%), and middle school (443 | 18.5%).
| School Level | # Students | % Students |
| Nursery / Preschool | 63 | 2.6% |
| Kindergarten | 57 | 2.4% |
| Elementary School | 404 | 16.9% |
| Middle School | 443 | 18.5% |
| High School | 698 | 29.2% |
| College / Undergraduate | 629 | 26.3% |
| Graduate / Professional | 97 | 4.1% |
| Total | 2,391 | 100.0% |
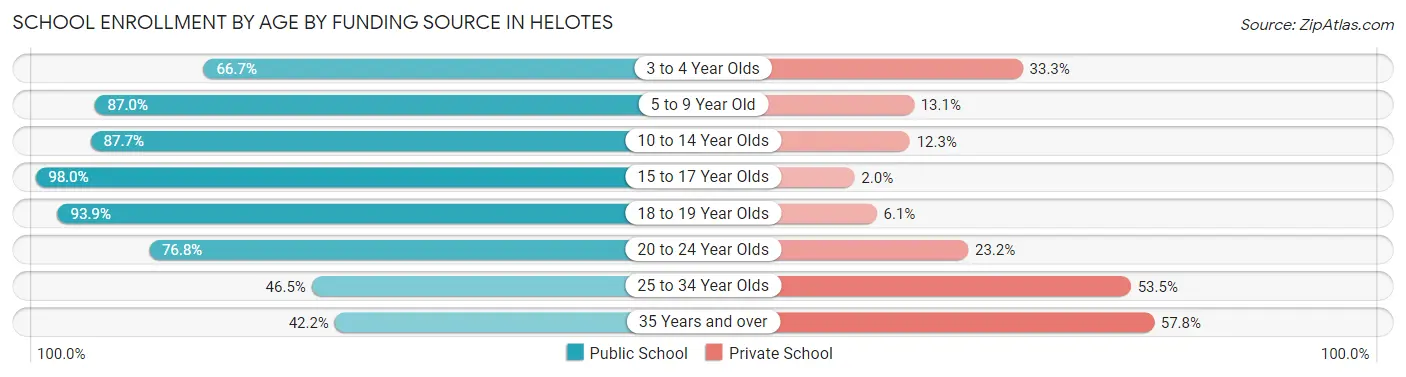
School Enrollment by Age by Funding Source in Helotes
Out of a total of 2,391 students who are enrolled in schools in Helotes, 392 (16.4%) attend a private institution, while the remaining 1,999 (83.6%) are enrolled in public schools. The age group of 35 years and over has the highest likelihood of being enrolled in private schools, with 67 (57.8% in the age bracket) enrolled. Conversely, the age group of 15 to 17 year olds has the lowest likelihood of being enrolled in a private school, with 491 (98.0% in the age bracket) attending a public institution.
| Age Bracket | Public School | Private School |
| 3 to 4 Year Olds | 18 (66.7%) | 9 (33.3%) |
| 5 to 9 Year Old | 393 (87.0%) | 59 (13.1%) |
| 10 to 14 Year Olds | 527 (87.7%) | 74 (12.3%) |
| 15 to 17 Year Olds | 491 (98.0%) | 10 (2.0%) |
| 18 to 19 Year Olds | 107 (93.9%) | 7 (6.1%) |
| 20 to 24 Year Olds | 368 (76.8%) | 111 (23.2%) |
| 25 to 34 Year Olds | 47 (46.5%) | 54 (53.5%) |
| 35 Years and over | 49 (42.2%) | 67 (57.8%) |
| Total | 1,999 (83.6%) | 392 (16.4%) |
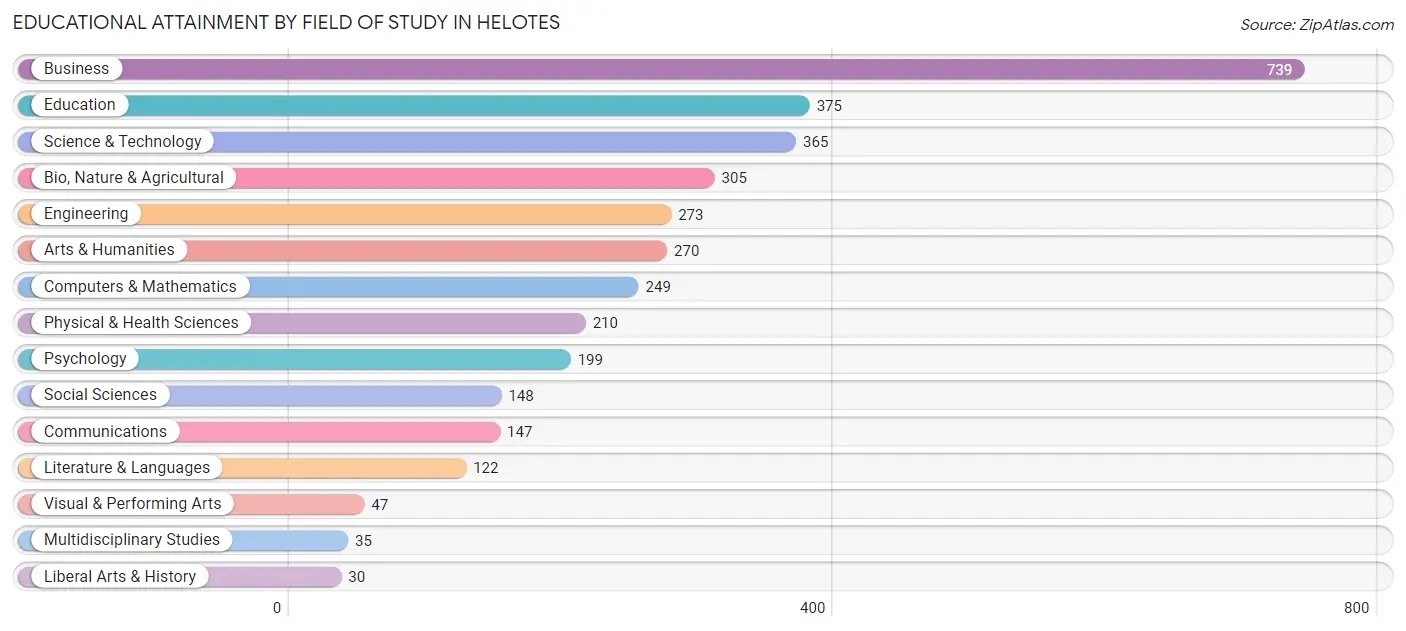
Educational Attainment by Field of Study in Helotes
Business (739 | 21.0%), education (375 | 10.7%), science & technology (365 | 10.4%), bio, nature & agricultural (305 | 8.7%), and engineering (273 | 7.8%) are the most common fields of study among 3,514 individuals in Helotes who have obtained a bachelor's degree or higher.
| Field of Study | # Graduates | % Graduates |
| Computers & Mathematics | 249 | 7.1% |
| Bio, Nature & Agricultural | 305 | 8.7% |
| Physical & Health Sciences | 210 | 6.0% |
| Psychology | 199 | 5.7% |
| Social Sciences | 148 | 4.2% |
| Engineering | 273 | 7.8% |
| Multidisciplinary Studies | 35 | 1.0% |
| Science & Technology | 365 | 10.4% |
| Business | 739 | 21.0% |
| Education | 375 | 10.7% |
| Literature & Languages | 122 | 3.5% |
| Liberal Arts & History | 30 | 0.9% |
| Visual & Performing Arts | 47 | 1.3% |
| Communications | 147 | 4.2% |
| Arts & Humanities | 270 | 7.7% |
| Total | 3,514 | 100.0% |
Transportation & Commute in Helotes
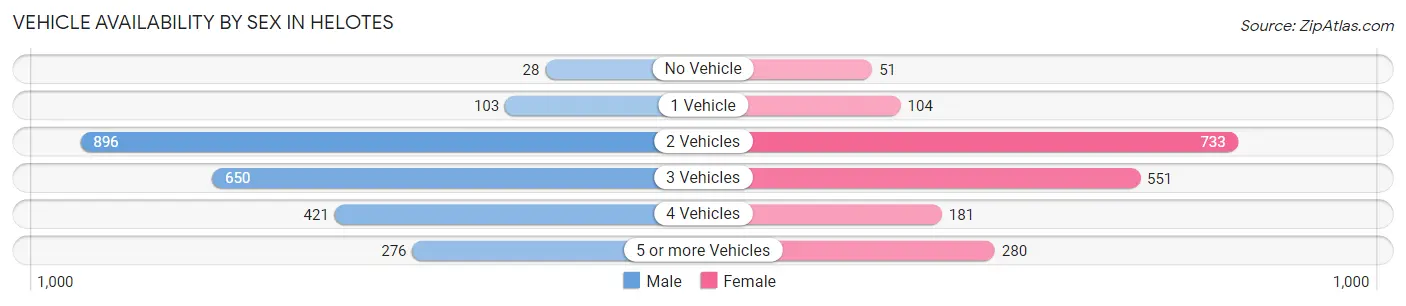
Vehicle Availability by Sex in Helotes
The most prevalent vehicle ownership categories in Helotes are males with 2 vehicles (896, accounting for 37.7%) and females with 2 vehicles (733, making up 47.2%).
| Vehicles Available | Male | Female |
| No Vehicle | 28 (1.2%) | 51 (2.7%) |
| 1 Vehicle | 103 (4.3%) | 104 (5.5%) |
| 2 Vehicles | 896 (37.7%) | 733 (38.6%) |
| 3 Vehicles | 650 (27.4%) | 551 (29.0%) |
| 4 Vehicles | 421 (17.7%) | 181 (9.5%) |
| 5 or more Vehicles | 276 (11.6%) | 280 (14.7%) |
| Total | 2,374 (100.0%) | 1,900 (100.0%) |
Commute Time in Helotes
The most frequently occuring commute durations in Helotes are 30 to 34 minutes (630 commuters, 18.6%), 15 to 19 minutes (523 commuters, 15.5%), and 20 to 24 minutes (514 commuters, 15.2%).
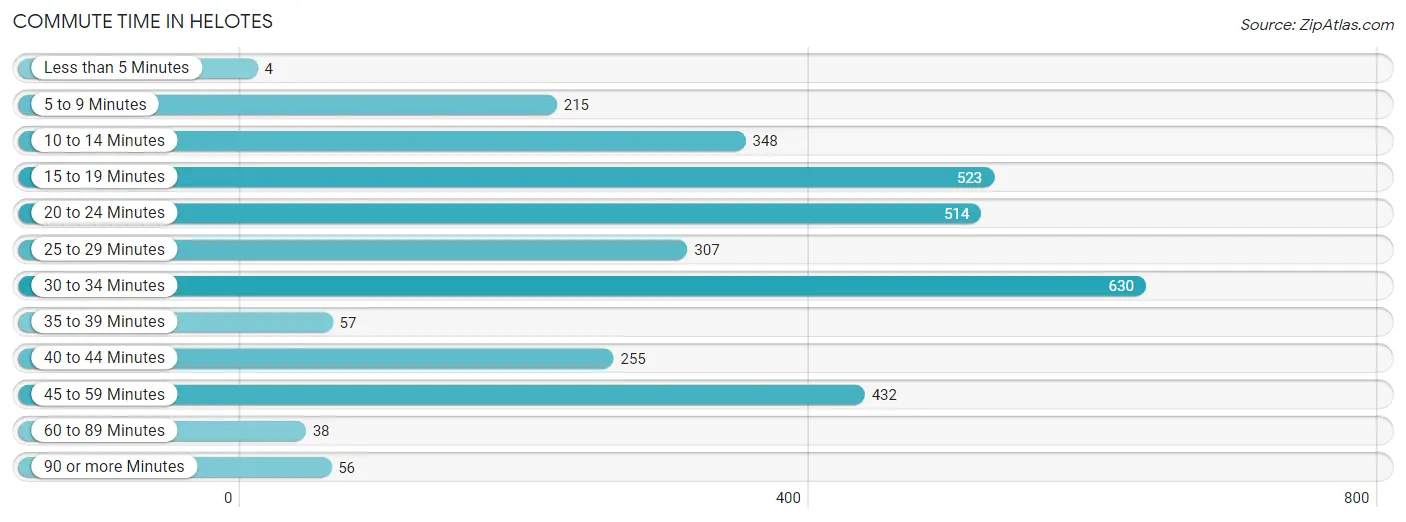
| Commute Time | # Commuters | % Commuters |
| Less than 5 Minutes | 4 | 0.1% |
| 5 to 9 Minutes | 215 | 6.4% |
| 10 to 14 Minutes | 348 | 10.3% |
| 15 to 19 Minutes | 523 | 15.5% |
| 20 to 24 Minutes | 514 | 15.2% |
| 25 to 29 Minutes | 307 | 9.1% |
| 30 to 34 Minutes | 630 | 18.6% |
| 35 to 39 Minutes | 57 | 1.7% |
| 40 to 44 Minutes | 255 | 7.5% |
| 45 to 59 Minutes | 432 | 12.8% |
| 60 to 89 Minutes | 38 | 1.1% |
| 90 or more Minutes | 56 | 1.7% |
Commute Time by Sex in Helotes
The most common commute times in Helotes are 20 to 24 minutes (293 commuters, 16.0%) for males and 30 to 34 minutes (380 commuters, 24.6%) for females.
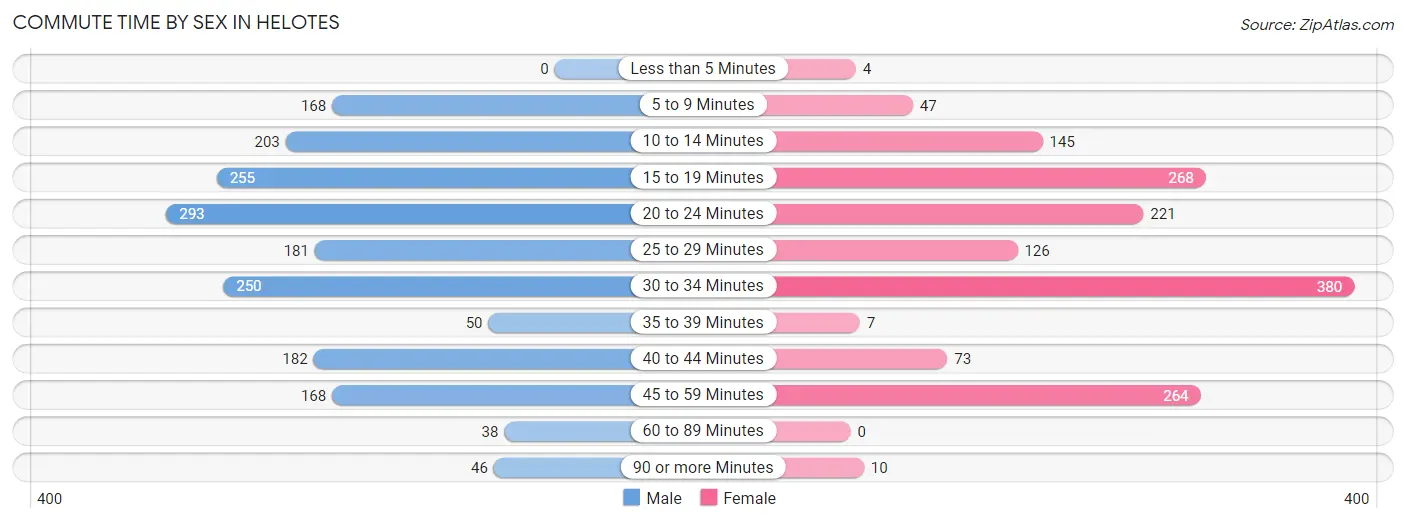
| Commute Time | Male | Female |
| Less than 5 Minutes | 0 (0.0%) | 4 (0.3%) |
| 5 to 9 Minutes | 168 (9.2%) | 47 (3.0%) |
| 10 to 14 Minutes | 203 (11.1%) | 145 (9.4%) |
| 15 to 19 Minutes | 255 (13.9%) | 268 (17.3%) |
| 20 to 24 Minutes | 293 (16.0%) | 221 (14.3%) |
| 25 to 29 Minutes | 181 (9.9%) | 126 (8.2%) |
| 30 to 34 Minutes | 250 (13.6%) | 380 (24.6%) |
| 35 to 39 Minutes | 50 (2.7%) | 7 (0.4%) |
| 40 to 44 Minutes | 182 (9.9%) | 73 (4.7%) |
| 45 to 59 Minutes | 168 (9.2%) | 264 (17.1%) |
| 60 to 89 Minutes | 38 (2.1%) | 0 (0.0%) |
| 90 or more Minutes | 46 (2.5%) | 10 (0.6%) |
Time of Departure to Work by Sex in Helotes
The most frequent times of departure to work in Helotes are 6:30 AM to 6:59 AM (304, 16.6%) for males and 12:00 PM to 3:59 PM (333, 21.5%) for females.
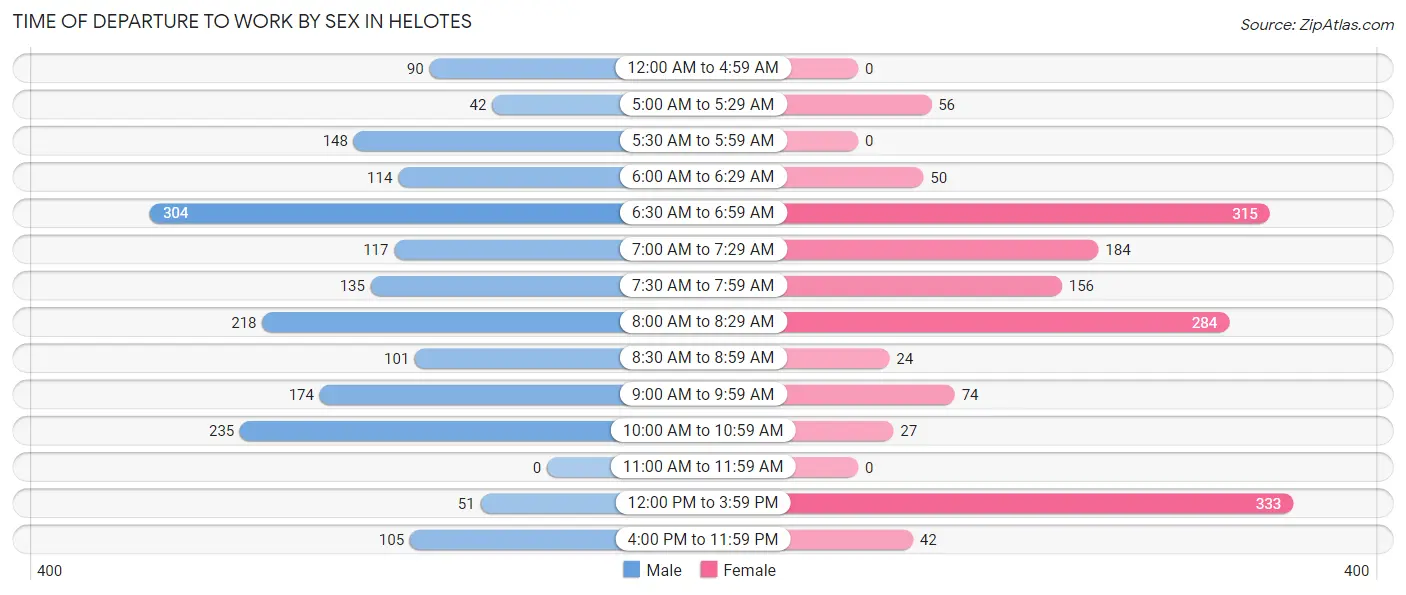
| Time of Departure | Male | Female |
| 12:00 AM to 4:59 AM | 90 (4.9%) | 0 (0.0%) |
| 5:00 AM to 5:29 AM | 42 (2.3%) | 56 (3.6%) |
| 5:30 AM to 5:59 AM | 148 (8.1%) | 0 (0.0%) |
| 6:00 AM to 6:29 AM | 114 (6.2%) | 50 (3.2%) |
| 6:30 AM to 6:59 AM | 304 (16.6%) | 315 (20.4%) |
| 7:00 AM to 7:29 AM | 117 (6.4%) | 184 (11.9%) |
| 7:30 AM to 7:59 AM | 135 (7.4%) | 156 (10.1%) |
| 8:00 AM to 8:29 AM | 218 (11.9%) | 284 (18.4%) |
| 8:30 AM to 8:59 AM | 101 (5.5%) | 24 (1.5%) |
| 9:00 AM to 9:59 AM | 174 (9.5%) | 74 (4.8%) |
| 10:00 AM to 10:59 AM | 235 (12.8%) | 27 (1.8%) |
| 11:00 AM to 11:59 AM | 0 (0.0%) | 0 (0.0%) |
| 12:00 PM to 3:59 PM | 51 (2.8%) | 333 (21.5%) |
| 4:00 PM to 11:59 PM | 105 (5.7%) | 42 (2.7%) |
| Total | 1,834 (100.0%) | 1,545 (100.0%) |
Housing Occupancy in Helotes
Occupancy by Ownership in Helotes
Of the total 2,876 dwellings in Helotes, owner-occupied units account for 2,715 (94.4%), while renter-occupied units make up 161 (5.6%).
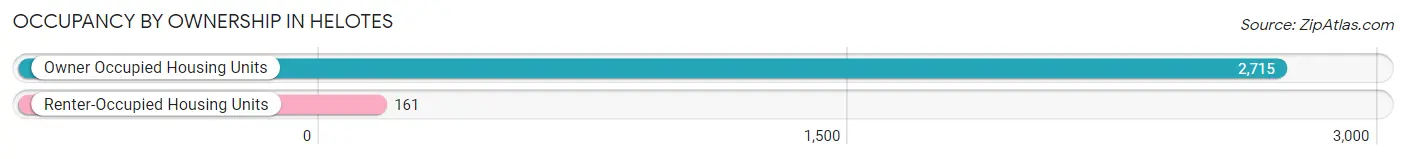
| Occupancy | # Housing Units | % Housing Units |
| Owner Occupied Housing Units | 2,715 | 94.4% |
| Renter-Occupied Housing Units | 161 | 5.6% |
| Total Occupied Housing Units | 2,876 | 100.0% |
Occupancy by Household Size in Helotes
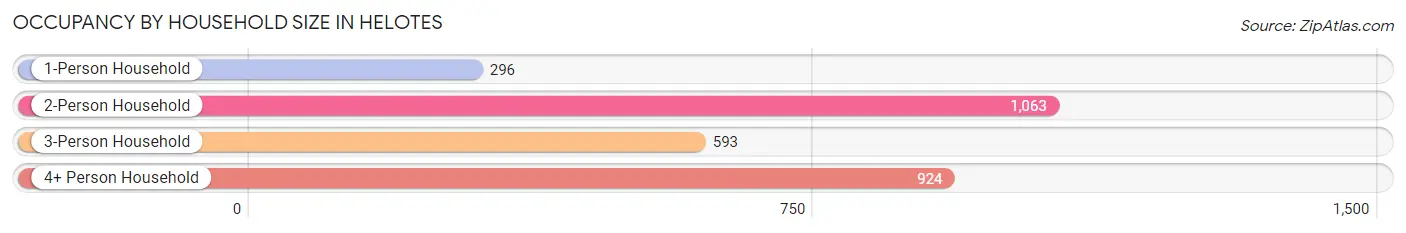
| Household Size | # Housing Units | % Housing Units |
| 1-Person Household | 296 | 10.3% |
| 2-Person Household | 1,063 | 37.0% |
| 3-Person Household | 593 | 20.6% |
| 4+ Person Household | 924 | 32.1% |
| Total Housing Units | 2,876 | 100.0% |
Occupancy by Ownership by Household Size in Helotes
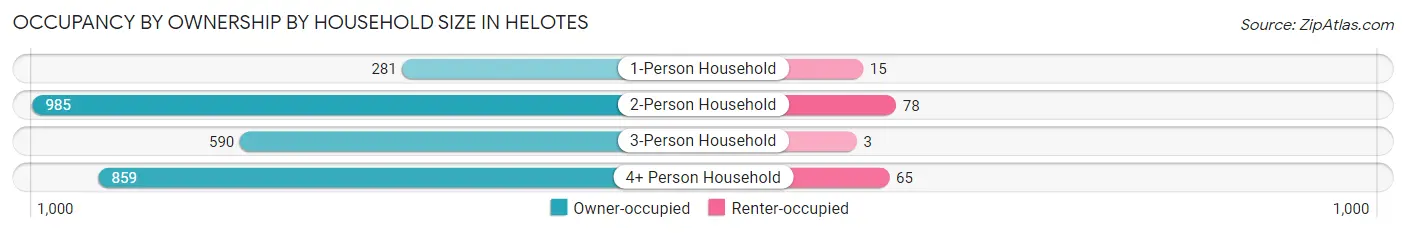
| Household Size | Owner-occupied | Renter-occupied |
| 1-Person Household | 281 (94.9%) | 15 (5.1%) |
| 2-Person Household | 985 (92.7%) | 78 (7.3%) |
| 3-Person Household | 590 (99.5%) | 3 (0.5%) |
| 4+ Person Household | 859 (93.0%) | 65 (7.0%) |
| Total Housing Units | 2,715 (94.4%) | 161 (5.6%) |
Occupancy by Educational Attainment in Helotes
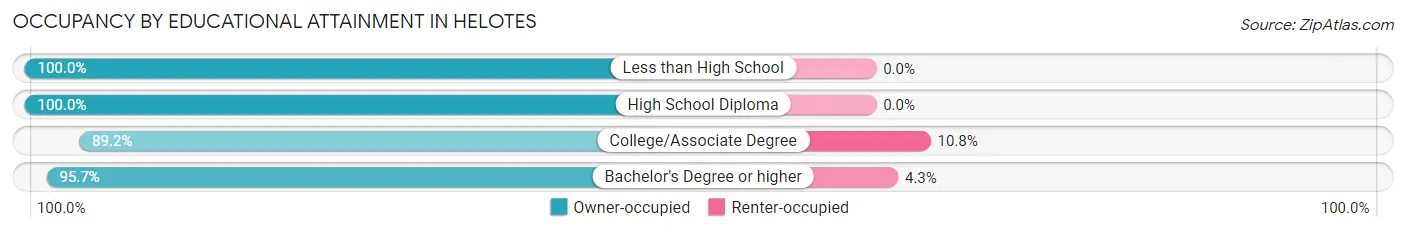
| Household Size | Owner-occupied | Renter-occupied |
| Less than High School | 20 (100.0%) | 0 (0.0%) |
| High School Diploma | 263 (100.0%) | 0 (0.0%) |
| College/Associate Degree | 669 (89.2%) | 81 (10.8%) |
| Bachelor's Degree or higher | 1,763 (95.7%) | 80 (4.3%) |
Occupancy by Age of Householder in Helotes
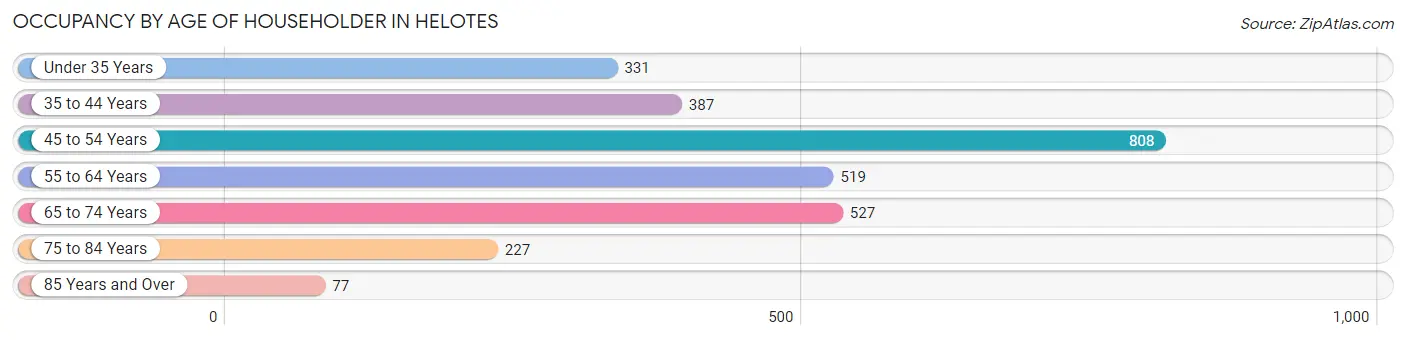
| Age Bracket | # Households | % Households |
| Under 35 Years | 331 | 11.5% |
| 35 to 44 Years | 387 | 13.5% |
| 45 to 54 Years | 808 | 28.1% |
| 55 to 64 Years | 519 | 18.0% |
| 65 to 74 Years | 527 | 18.3% |
| 75 to 84 Years | 227 | 7.9% |
| 85 Years and Over | 77 | 2.7% |
| Total | 2,876 | 100.0% |
Housing Finances in Helotes
Median Income by Occupancy in Helotes
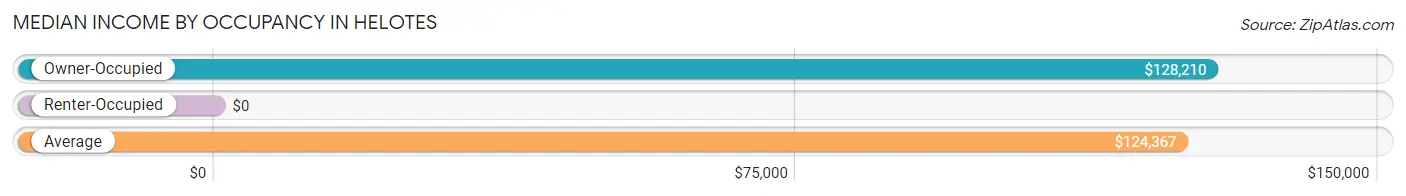
| Occupancy Type | # Households | Median Income |
| Owner-Occupied | 2,715 (94.4%) | $128,210 |
| Renter-Occupied | 161 (5.6%) | $0 |
| Average | 2,876 (100.0%) | $124,367 |
Occupancy by Householder Income Bracket in Helotes
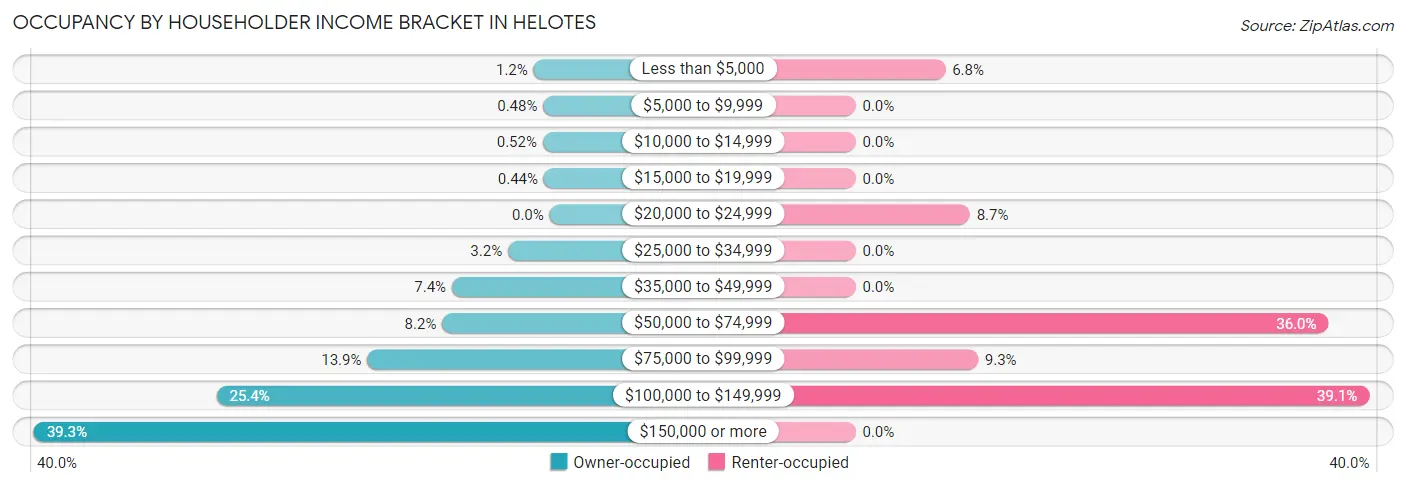
| Income Bracket | Owner-occupied | Renter-occupied |
| Less than $5,000 | 33 (1.2%) | 11 (6.8%) |
| $5,000 to $9,999 | 13 (0.5%) | 0 (0.0%) |
| $10,000 to $14,999 | 14 (0.5%) | 0 (0.0%) |
| $15,000 to $19,999 | 12 (0.4%) | 0 (0.0%) |
| $20,000 to $24,999 | 0 (0.0%) | 14 (8.7%) |
| $25,000 to $34,999 | 86 (3.2%) | 0 (0.0%) |
| $35,000 to $49,999 | 202 (7.4%) | 0 (0.0%) |
| $50,000 to $74,999 | 222 (8.2%) | 58 (36.0%) |
| $75,000 to $99,999 | 377 (13.9%) | 15 (9.3%) |
| $100,000 to $149,999 | 689 (25.4%) | 63 (39.1%) |
| $150,000 or more | 1,067 (39.3%) | 0 (0.0%) |
| Total | 2,715 (100.0%) | 161 (100.0%) |
Monthly Housing Cost Tiers in Helotes
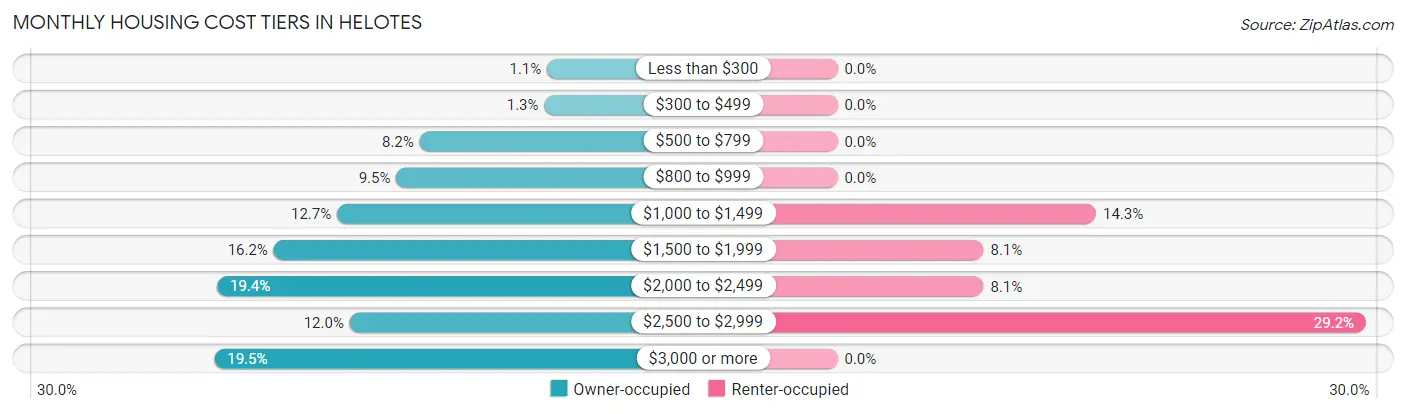
| Monthly Cost | Owner-occupied | Renter-occupied |
| Less than $300 | 31 (1.1%) | 0 (0.0%) |
| $300 to $499 | 35 (1.3%) | 0 (0.0%) |
| $500 to $799 | 222 (8.2%) | 0 (0.0%) |
| $800 to $999 | 257 (9.5%) | 0 (0.0%) |
| $1,000 to $1,499 | 346 (12.7%) | 23 (14.3%) |
| $1,500 to $1,999 | 441 (16.2%) | 13 (8.1%) |
| $2,000 to $2,499 | 526 (19.4%) | 13 (8.1%) |
| $2,500 to $2,999 | 327 (12.0%) | 47 (29.2%) |
| $3,000 or more | 530 (19.5%) | 0 (0.0%) |
| Total | 2,715 (100.0%) | 161 (100.0%) |
Physical Housing Characteristics in Helotes
Housing Structures in Helotes
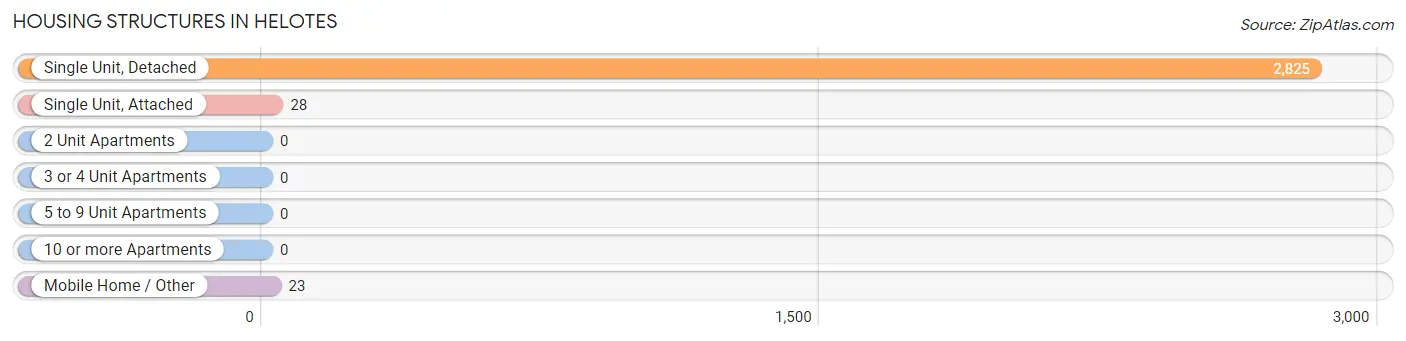
| Structure Type | # Housing Units | % Housing Units |
| Single Unit, Detached | 2,825 | 98.2% |
| Single Unit, Attached | 28 | 1.0% |
| 2 Unit Apartments | 0 | 0.0% |
| 3 or 4 Unit Apartments | 0 | 0.0% |
| 5 to 9 Unit Apartments | 0 | 0.0% |
| 10 or more Apartments | 0 | 0.0% |
| Mobile Home / Other | 23 | 0.8% |
| Total | 2,876 | 100.0% |
Housing Structures by Occupancy in Helotes
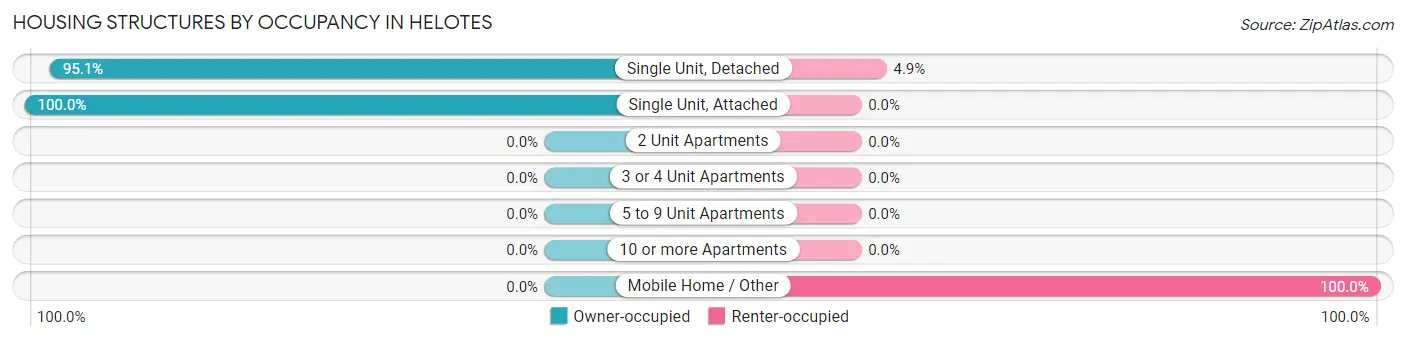
| Structure Type | Owner-occupied | Renter-occupied |
| Single Unit, Detached | 2,687 (95.1%) | 138 (4.9%) |
| Single Unit, Attached | 28 (100.0%) | 0 (0.0%) |
| 2 Unit Apartments | 0 (0.0%) | 0 (0.0%) |
| 3 or 4 Unit Apartments | 0 (0.0%) | 0 (0.0%) |
| 5 to 9 Unit Apartments | 0 (0.0%) | 0 (0.0%) |
| 10 or more Apartments | 0 (0.0%) | 0 (0.0%) |
| Mobile Home / Other | 0 (0.0%) | 23 (100.0%) |
| Total | 2,715 (94.4%) | 161 (5.6%) |
Housing Structures by Number of Rooms in Helotes
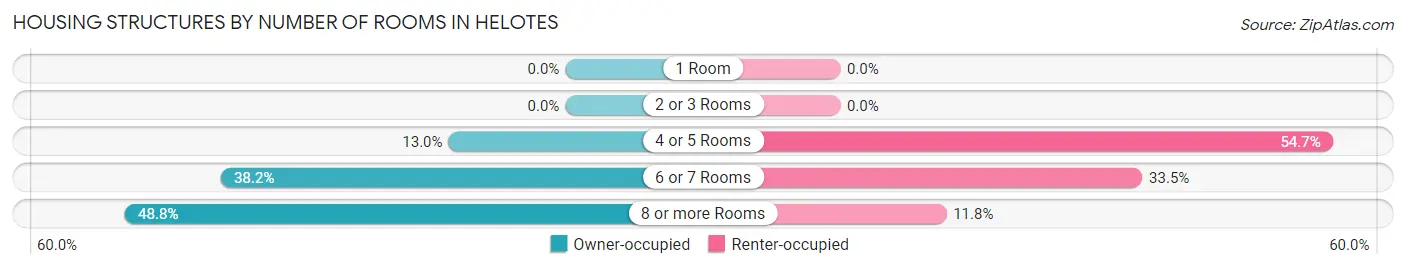
| Number of Rooms | Owner-occupied | Renter-occupied |
| 1 Room | 0 (0.0%) | 0 (0.0%) |
| 2 or 3 Rooms | 0 (0.0%) | 0 (0.0%) |
| 4 or 5 Rooms | 352 (13.0%) | 88 (54.7%) |
| 6 or 7 Rooms | 1,037 (38.2%) | 54 (33.5%) |
| 8 or more Rooms | 1,326 (48.8%) | 19 (11.8%) |
| Total | 2,715 (100.0%) | 161 (100.0%) |
Housing Structure by Heating Type in Helotes
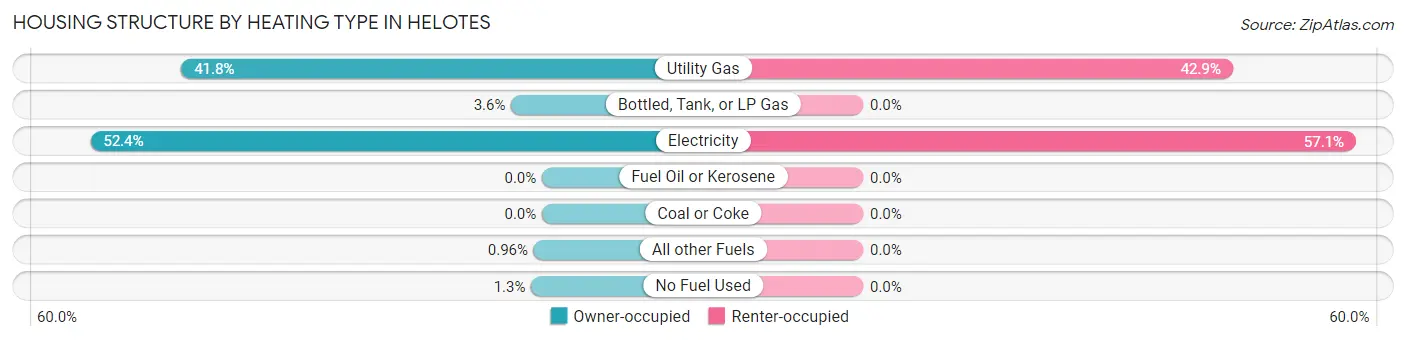
| Heating Type | Owner-occupied | Renter-occupied |
| Utility Gas | 1,136 (41.8%) | 69 (42.9%) |
| Bottled, Tank, or LP Gas | 97 (3.6%) | 0 (0.0%) |
| Electricity | 1,422 (52.4%) | 92 (57.1%) |
| Fuel Oil or Kerosene | 0 (0.0%) | 0 (0.0%) |
| Coal or Coke | 0 (0.0%) | 0 (0.0%) |
| All other Fuels | 26 (1.0%) | 0 (0.0%) |
| No Fuel Used | 34 (1.3%) | 0 (0.0%) |
| Total | 2,715 (100.0%) | 161 (100.0%) |
Household Vehicle Usage in Helotes
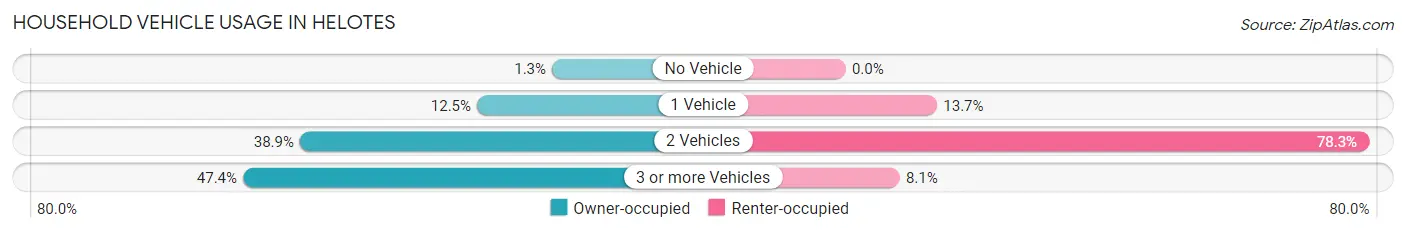
| Vehicles per Household | Owner-occupied | Renter-occupied |
| No Vehicle | 34 (1.3%) | 0 (0.0%) |
| 1 Vehicle | 338 (12.4%) | 22 (13.7%) |
| 2 Vehicles | 1,056 (38.9%) | 126 (78.3%) |
| 3 or more Vehicles | 1,287 (47.4%) | 13 (8.1%) |
| Total | 2,715 (100.0%) | 161 (100.0%) |
Real Estate & Mortgages in Helotes
Real Estate and Mortgage Overview in Helotes
| Characteristic | Without Mortgage | With Mortgage |
| Housing Units | 782 | 1,933 |
| Median Property Value | $360,100 | $357,400 |
| Median Household Income | $89,758 | $861 |
| Monthly Housing Costs | $879 | $530 |
| Real Estate Taxes | $6,600 | $65 |
Property Value by Mortgage Status in Helotes
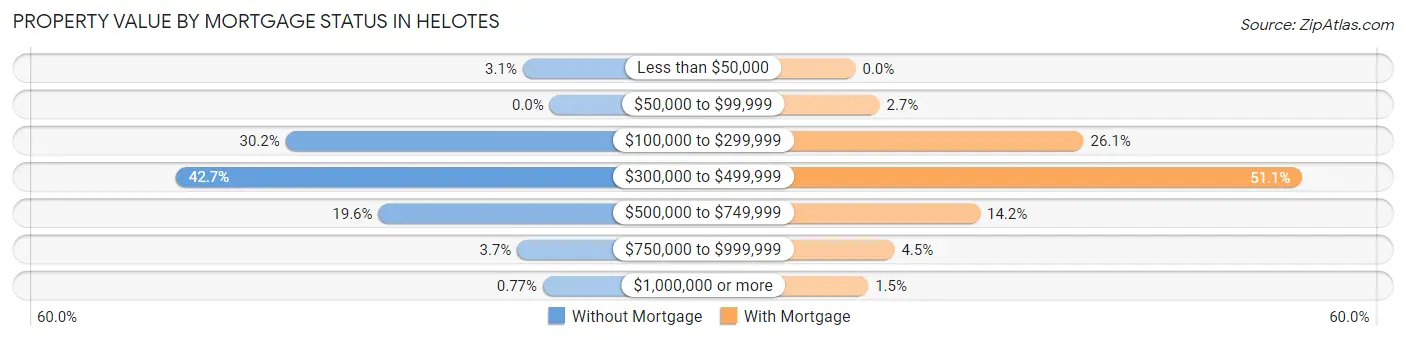
| Property Value | Without Mortgage | With Mortgage |
| Less than $50,000 | 24 (3.1%) | 0 (0.0%) |
| $50,000 to $99,999 | 0 (0.0%) | 53 (2.7%) |
| $100,000 to $299,999 | 236 (30.2%) | 504 (26.1%) |
| $300,000 to $499,999 | 334 (42.7%) | 987 (51.1%) |
| $500,000 to $749,999 | 153 (19.6%) | 275 (14.2%) |
| $750,000 to $999,999 | 29 (3.7%) | 86 (4.4%) |
| $1,000,000 or more | 6 (0.8%) | 28 (1.5%) |
| Total | 782 (100.0%) | 1,933 (100.0%) |
Household Income by Mortgage Status in Helotes
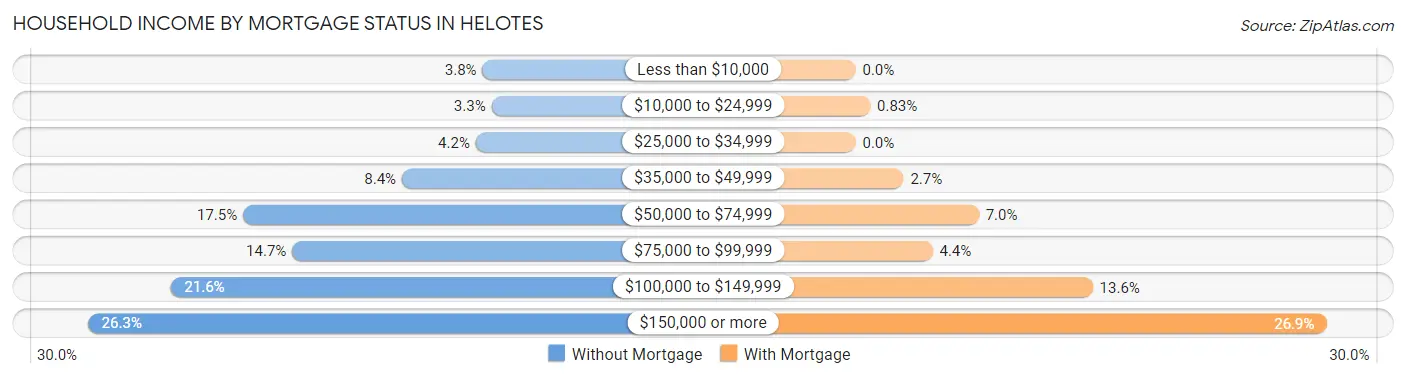
| Household Income | Without Mortgage | With Mortgage |
| Less than $10,000 | 30 (3.8%) | 0 (0.0%) |
| $10,000 to $24,999 | 26 (3.3%) | 16 (0.8%) |
| $25,000 to $34,999 | 33 (4.2%) | 0 (0.0%) |
| $35,000 to $49,999 | 66 (8.4%) | 53 (2.7%) |
| $50,000 to $74,999 | 137 (17.5%) | 136 (7.0%) |
| $75,000 to $99,999 | 115 (14.7%) | 85 (4.4%) |
| $100,000 to $149,999 | 169 (21.6%) | 262 (13.6%) |
| $150,000 or more | 206 (26.3%) | 520 (26.9%) |
| Total | 782 (100.0%) | 1,933 (100.0%) |
Property Value to Household Income Ratio in Helotes
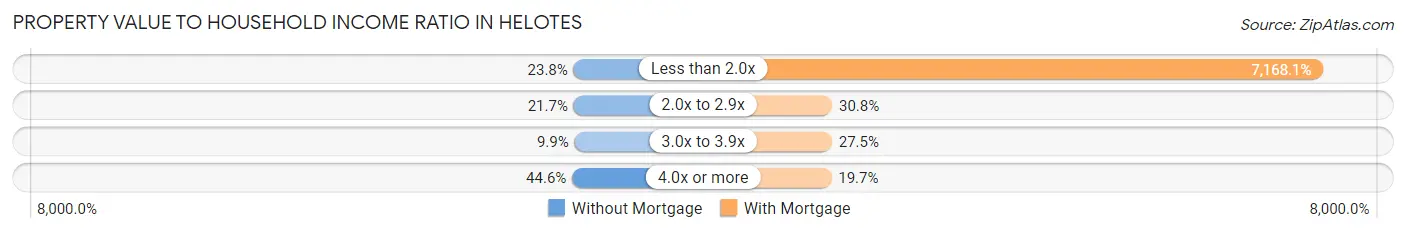
| Value-to-Income Ratio | Without Mortgage | With Mortgage |
| Less than 2.0x | 186 (23.8%) | 138,560 (7,168.1%) |
| 2.0x to 2.9x | 170 (21.7%) | 596 (30.8%) |
| 3.0x to 3.9x | 77 (9.9%) | 532 (27.5%) |
| 4.0x or more | 349 (44.6%) | 381 (19.7%) |
| Total | 782 (100.0%) | 1,933 (100.0%) |
Real Estate Taxes by Mortgage Status in Helotes
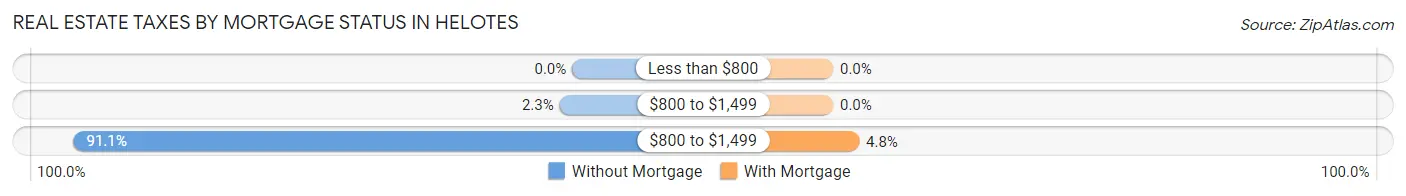
| Property Taxes | Without Mortgage | With Mortgage |
| Less than $800 | 0 (0.0%) | 0 (0.0%) |
| $800 to $1,499 | 18 (2.3%) | 0 (0.0%) |
| $800 to $1,499 | 712 (91.0%) | 92 (4.8%) |
| Total | 782 (100.0%) | 1,933 (100.0%) |
Health & Disability in Helotes
Health Insurance Coverage by Age in Helotes
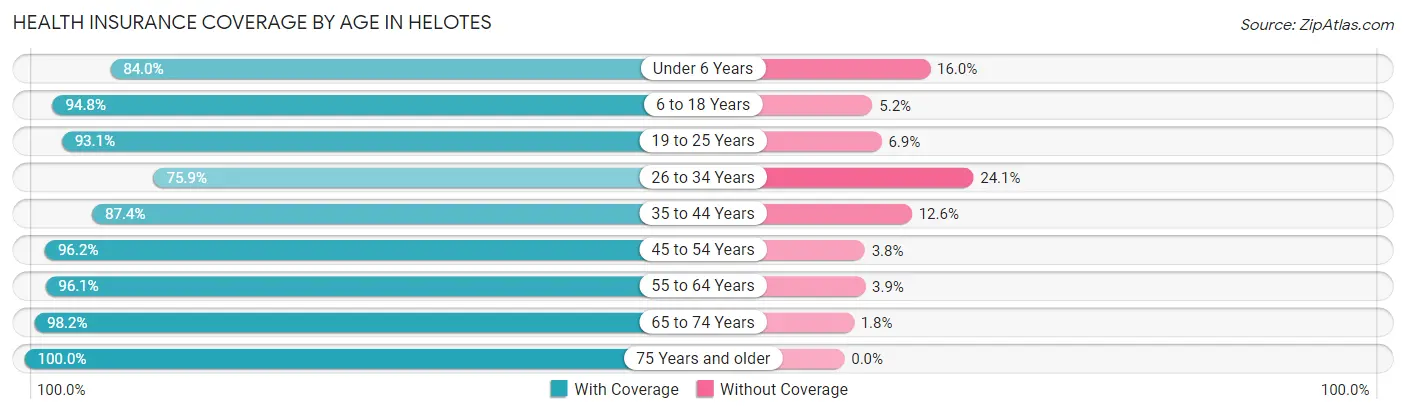
| Age Bracket | With Coverage | Without Coverage |
| Under 6 Years | 310 (84.0%) | 59 (16.0%) |
| 6 to 18 Years | 1,540 (94.8%) | 85 (5.2%) |
| 19 to 25 Years | 887 (93.1%) | 66 (6.9%) |
| 26 to 34 Years | 710 (75.9%) | 225 (24.1%) |
| 35 to 44 Years | 653 (87.4%) | 94 (12.6%) |
| 45 to 54 Years | 1,538 (96.2%) | 61 (3.8%) |
| 55 to 64 Years | 1,116 (96.1%) | 45 (3.9%) |
| 65 to 74 Years | 1,005 (98.2%) | 18 (1.8%) |
| 75 Years and older | 672 (100.0%) | 0 (0.0%) |
| Total | 8,431 (92.8%) | 653 (7.2%) |
Health Insurance Coverage by Citizenship Status in Helotes
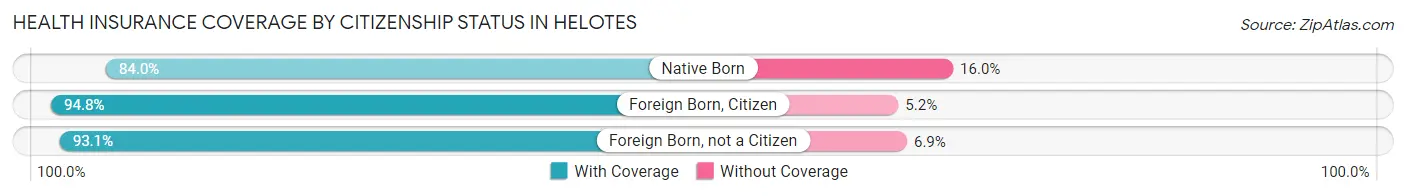
| Citizenship Status | With Coverage | Without Coverage |
| Native Born | 310 (84.0%) | 59 (16.0%) |
| Foreign Born, Citizen | 1,540 (94.8%) | 85 (5.2%) |
| Foreign Born, not a Citizen | 887 (93.1%) | 66 (6.9%) |
Health Insurance Coverage by Household Income in Helotes
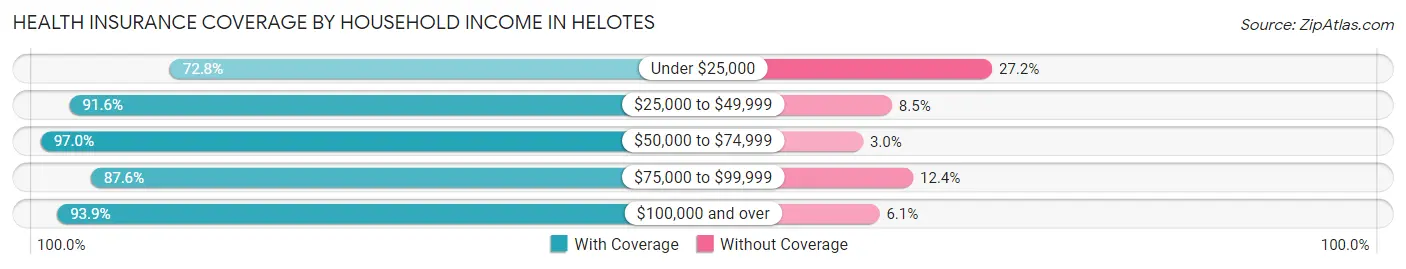
| Household Income | With Coverage | Without Coverage |
| Under $25,000 | 115 (72.8%) | 43 (27.2%) |
| $25,000 to $49,999 | 683 (91.5%) | 63 (8.5%) |
| $50,000 to $74,999 | 576 (97.0%) | 18 (3.0%) |
| $75,000 to $99,999 | 903 (87.6%) | 128 (12.4%) |
| $100,000 and over | 6,154 (93.9%) | 401 (6.1%) |
Public vs Private Health Insurance Coverage by Age in Helotes
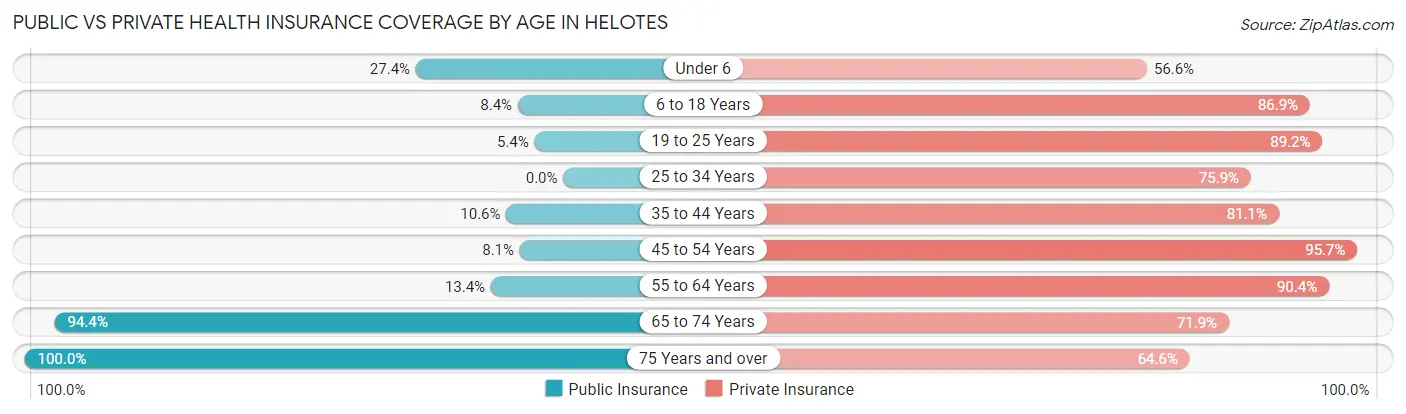
| Age Bracket | Public Insurance | Private Insurance |
| Under 6 | 101 (27.4%) | 209 (56.6%) |
| 6 to 18 Years | 137 (8.4%) | 1,412 (86.9%) |
| 19 to 25 Years | 51 (5.3%) | 850 (89.2%) |
| 25 to 34 Years | 0 (0.0%) | 710 (75.9%) |
| 35 to 44 Years | 79 (10.6%) | 606 (81.1%) |
| 45 to 54 Years | 129 (8.1%) | 1,530 (95.7%) |
| 55 to 64 Years | 156 (13.4%) | 1,050 (90.4%) |
| 65 to 74 Years | 966 (94.4%) | 735 (71.9%) |
| 75 Years and over | 672 (100.0%) | 434 (64.6%) |
| Total | 2,291 (25.2%) | 7,536 (83.0%) |
Disability Status by Sex by Age in Helotes
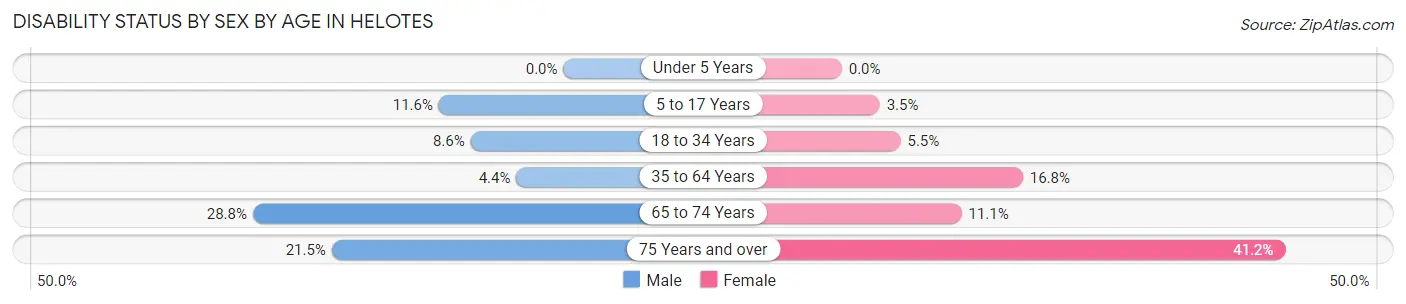
| Age Bracket | Male | Female |
| Under 5 Years | 0 (0.0%) | 0 (0.0%) |
| 5 to 17 Years | 98 (11.6%) | 27 (3.5%) |
| 18 to 34 Years | 104 (8.6%) | 42 (5.4%) |
| 35 to 64 Years | 68 (4.4%) | 328 (16.8%) |
| 65 to 74 Years | 147 (28.8%) | 57 (11.1%) |
| 75 Years and over | 63 (21.5%) | 156 (41.2%) |
Disability Class by Sex by Age in Helotes
Disability Class: Hearing Difficulty
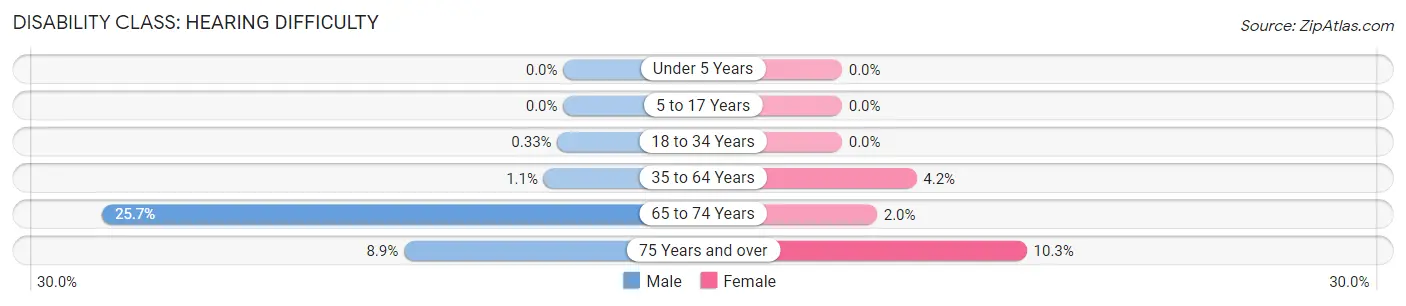
| Age Bracket | Male | Female |
| Under 5 Years | 0 (0.0%) | 0 (0.0%) |
| 5 to 17 Years | 0 (0.0%) | 0 (0.0%) |
| 18 to 34 Years | 4 (0.3%) | 0 (0.0%) |
| 35 to 64 Years | 17 (1.1%) | 81 (4.2%) |
| 65 to 74 Years | 131 (25.7%) | 10 (1.9%) |
| 75 Years and over | 26 (8.9%) | 39 (10.3%) |
Disability Class: Vision Difficulty
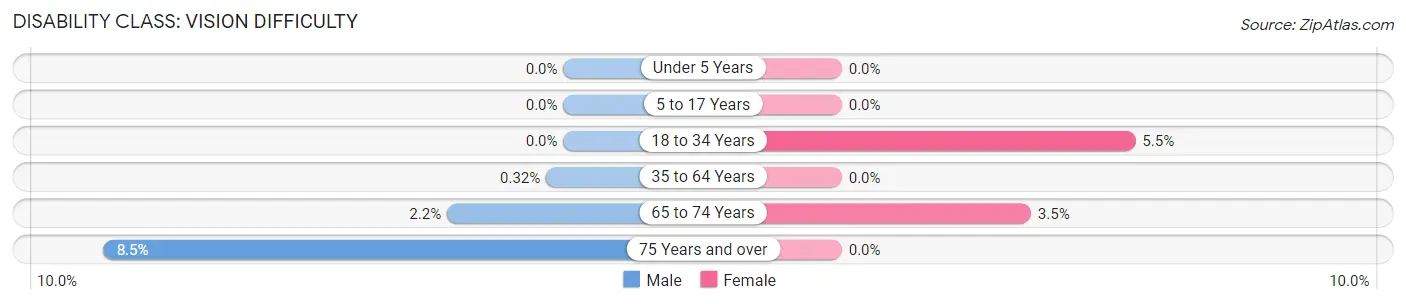
| Age Bracket | Male | Female |
| Under 5 Years | 0 (0.0%) | 0 (0.0%) |
| 5 to 17 Years | 0 (0.0%) | 0 (0.0%) |
| 18 to 34 Years | 0 (0.0%) | 42 (5.4%) |
| 35 to 64 Years | 5 (0.3%) | 0 (0.0%) |
| 65 to 74 Years | 11 (2.2%) | 18 (3.5%) |
| 75 Years and over | 25 (8.5%) | 0 (0.0%) |
Disability Class: Cognitive Difficulty
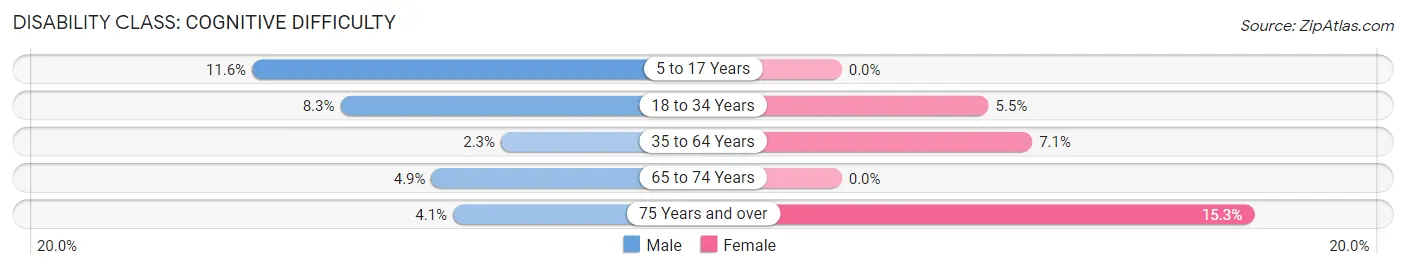
| Age Bracket | Male | Female |
| 5 to 17 Years | 98 (11.6%) | 0 (0.0%) |
| 18 to 34 Years | 100 (8.3%) | 42 (5.4%) |
| 35 to 64 Years | 36 (2.3%) | 138 (7.1%) |
| 65 to 74 Years | 25 (4.9%) | 0 (0.0%) |
| 75 Years and over | 12 (4.1%) | 58 (15.3%) |
Disability Class: Ambulatory Difficulty
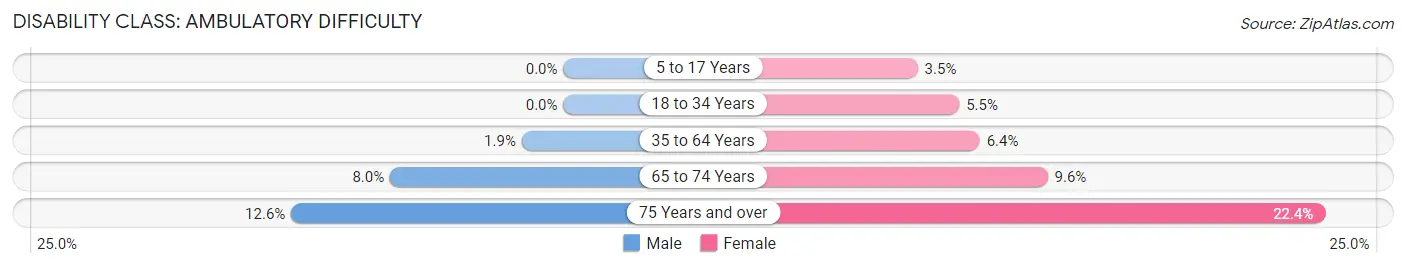
| Age Bracket | Male | Female |
| 5 to 17 Years | 0 (0.0%) | 27 (3.5%) |
| 18 to 34 Years | 0 (0.0%) | 42 (5.4%) |
| 35 to 64 Years | 30 (1.9%) | 125 (6.4%) |
| 65 to 74 Years | 41 (8.0%) | 49 (9.6%) |
| 75 Years and over | 37 (12.6%) | 85 (22.4%) |
Disability Class: Self-Care Difficulty
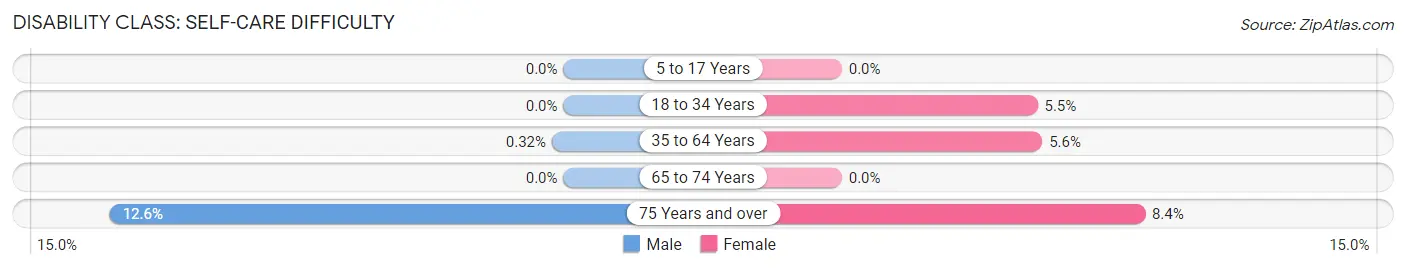
| Age Bracket | Male | Female |
| 5 to 17 Years | 0 (0.0%) | 0 (0.0%) |
| 18 to 34 Years | 0 (0.0%) | 42 (5.4%) |
| 35 to 64 Years | 5 (0.3%) | 109 (5.6%) |
| 65 to 74 Years | 0 (0.0%) | 0 (0.0%) |
| 75 Years and over | 37 (12.6%) | 32 (8.4%) |
Technology Access in Helotes
Computing Device Access in Helotes
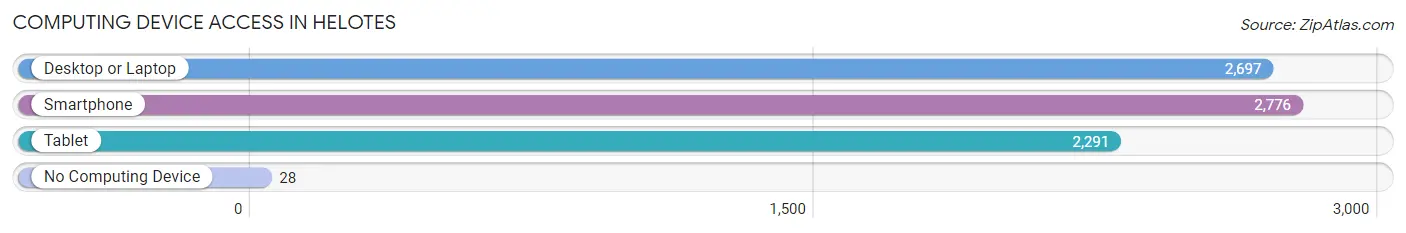
| Device Type | # Households | % Households |
| Desktop or Laptop | 2,697 | 93.8% |
| Smartphone | 2,776 | 96.5% |
| Tablet | 2,291 | 79.7% |
| No Computing Device | 28 | 1.0% |
| Total | 2,876 | 100.0% |
Internet Access in Helotes
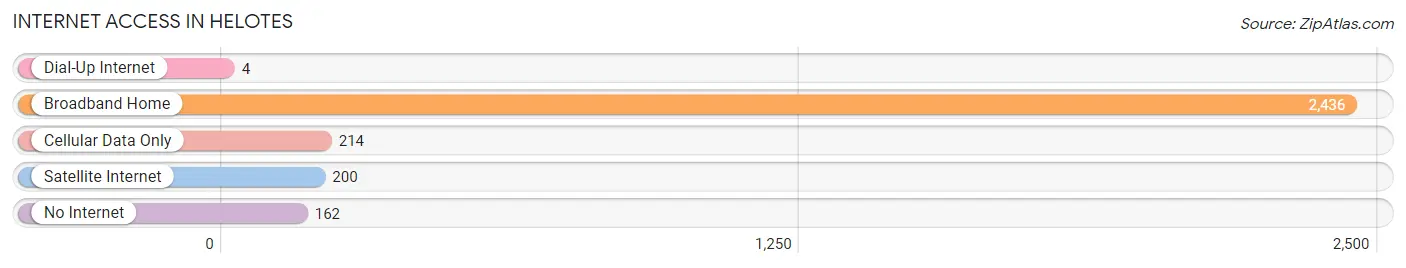
| Internet Type | # Households | % Households |
| Dial-Up Internet | 4 | 0.1% |
| Broadband Home | 2,436 | 84.7% |
| Cellular Data Only | 214 | 7.4% |
| Satellite Internet | 200 | 7.0% |
| No Internet | 162 | 5.6% |
| Total | 2,876 | 100.0% |
Helotes Summary
Helotes, Texas is a small city located in Bexar County, Texas, United States. It is situated about 16 miles northwest of downtown San Antonio and is part of the San Antonio Metropolitan Statistical Area. The city has a population of approximately 8,000 people and is known for its rural atmosphere and small-town charm.
History
The area that is now Helotes was originally inhabited by the Coahuiltecan Indians. The first European settlers arrived in the area in the early 1800s, and the town was officially established in 1837. The town was named after the Helotes Creek, which was named after the Coahuiltecan Indians who lived in the area.
The town grew slowly over the years, and by the late 1800s, it had become a popular stop for travelers on the San Antonio-El Paso stagecoach line. The town was also home to a number of businesses, including a general store, a blacksmith shop, and a saloon.
In the early 1900s, the town began to experience a period of growth and development. The Helotes Independent School District was established in 1909, and the town was incorporated in 1948.
Geography
Helotes is located in Bexar County, Texas, approximately 16 miles northwest of downtown San Antonio. The city covers an area of 4.3 square miles and has an elevation of 830 feet. The city is situated in the Hill Country region of Texas and is surrounded by rolling hills and lush vegetation.
The climate in Helotes is classified as humid subtropical, with hot summers and mild winters. The average annual temperature is 68 degrees Fahrenheit, and the average annual precipitation is 33 inches.
Economy
The economy of Helotes is largely based on tourism and retail. The city is home to a number of small businesses, including restaurants, shops, and galleries. The city is also home to a number of corporate offices, including a branch of the USAA insurance company.
The city is also home to a number of festivals and events, including the Helotes Cornyval, which is held every year in October. The event features carnival rides, live music, and food vendors.
Demographics
As of the 2010 census, the population of Helotes was 8,092. The racial makeup of the city was 79.3% White, 0.7% African American, 0.3% Native American, 0.7% Asian, 0.1% Pacific Islander, 16.2% from other races, and 2.9% from two or more races. Hispanic or Latino of any race were 44.3% of the population.
The median household income in Helotes was $60,945, and the median family income was $68,958. The per capita income was $27,945. About 8.3% of families and 10.2% of the population were below the poverty line.
Conclusion
Helotes, Texas is a small city located in Bexar County, Texas, United States. It is situated about 16 miles northwest of downtown San Antonio and is part of the San Antonio Metropolitan Statistical Area. The city has a population of approximately 8,000 people and is known for its rural atmosphere and small-town charm. The economy of Helotes is largely based on tourism and retail, and the city is home to a number of festivals and events. The population of Helotes is largely White and Hispanic or Latino, and the median household income is $60,945.
Common Questions
What is Per Capita Income in Helotes?
Per Capita income in Helotes is $49,942.
What is the Median Family Income in Helotes?
Median Family Income in Helotes is $124,348.
What is the Median Household income in Helotes?
Median Household Income in Helotes is $124,367.
What is Income or Wage Gap in Helotes?
Income or Wage Gap in Helotes is 44.9%.
Women in Helotes earn 55.1 cents for every dollar earned by a man.
What is Inequality or Gini Index in Helotes?
Inequality or Gini Index in Helotes is 0.39.
What is the Total Population of Helotes?
Total Population of Helotes is 9,140.
What is the Total Male Population of Helotes?
Total Male Population of Helotes is 4,501.
What is the Total Female Population of Helotes?
Total Female Population of Helotes is 4,639.
What is the Ratio of Males per 100 Females in Helotes?
There are 97.03 Males per 100 Females in Helotes.
What is the Ratio of Females per 100 Males in Helotes?
There are 103.07 Females per 100 Males in Helotes.
What is the Median Population Age in Helotes?
Median Population Age in Helotes is 44.6 Years.
What is the Average Family Size in Helotes
Average Family Size in Helotes is 3.4 People.
What is the Average Household Size in Helotes
Average Household Size in Helotes is 3.2 People.
How Large is the Labor Force in Helotes?
There are 4,620 People in the Labor Forcein in Helotes.
What is the Percentage of People in the Labor Force in Helotes?
60.9% of People are in the Labor Force in Helotes.
What is the Unemployment Rate in Helotes?
Unemployment Rate in Helotes is 7.3%.