Los Gatos, CA Map & Demographics
Los Gatos Map
Los Gatos Overview
$120,561
PER CAPITA INCOME
$240,688
AVG FAMILY INCOME
$198,117
AVG HOUSEHOLD INCOME
45.6%
WAGE / INCOME GAP [ % ]
54.4¢/ $1
WAGE / INCOME GAP [ $ ]
$15,614
FAMILY INCOME DEFICIT
0.52
INEQUALITY / GINI INDEX
33,093
TOTAL POPULATION
16,449
MALE POPULATION
16,644
FEMALE POPULATION
98.83
MALES / 100 FEMALES
101.19
FEMALES / 100 MALES
45.6
MEDIAN AGE
3.0
AVG FAMILY SIZE
2.5
AVG HOUSEHOLD SIZE
16,302
LABOR FORCE [ PEOPLE ]
61.3%
PERCENT IN LABOR FORCE
4.7%
UNEMPLOYMENT RATE
Income in Los Gatos
Income Overview in Los Gatos
Per Capita Income in Los Gatos is $120,561, while median incomes of families and households are $240,688 and $198,117 respectively.
| Characteristic | Number | Measure |
| Per Capita Income | 33,093 | $120,561 |
| Median Family Income | 9,055 | $240,688 |
| Mean Family Income | 9,055 | $364,527 |
| Median Household Income | 12,855 | $198,117 |
| Mean Household Income | 12,855 | $305,653 |
| Income Deficit | 9,055 | $15,614 |
| Wage / Income Gap (%) | 33,093 | 45.57% |
| Wage / Income Gap ($) | 33,093 | 54.43¢ per $1 |
| Gini / Inequality Index | 33,093 | 0.52 |
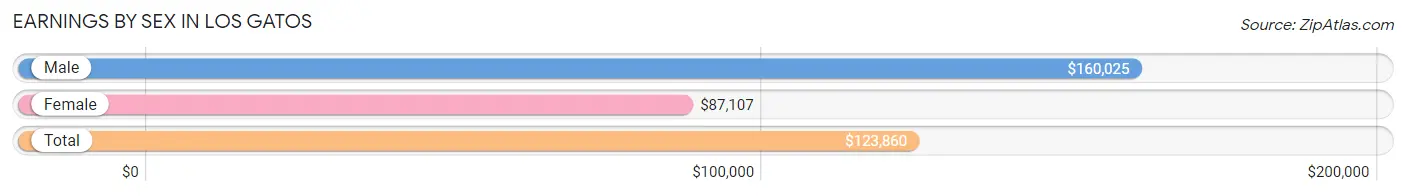
Earnings by Sex in Los Gatos
Average Earnings in Los Gatos are $123,860, $160,025 for men and $87,107 for women, a difference of 45.6%.
| Sex | Number | Average Earnings |
| Male | 9,563 (56.3%) | $160,025 |
| Female | 7,413 (43.7%) | $87,107 |
| Total | 16,976 (100.0%) | $123,860 |
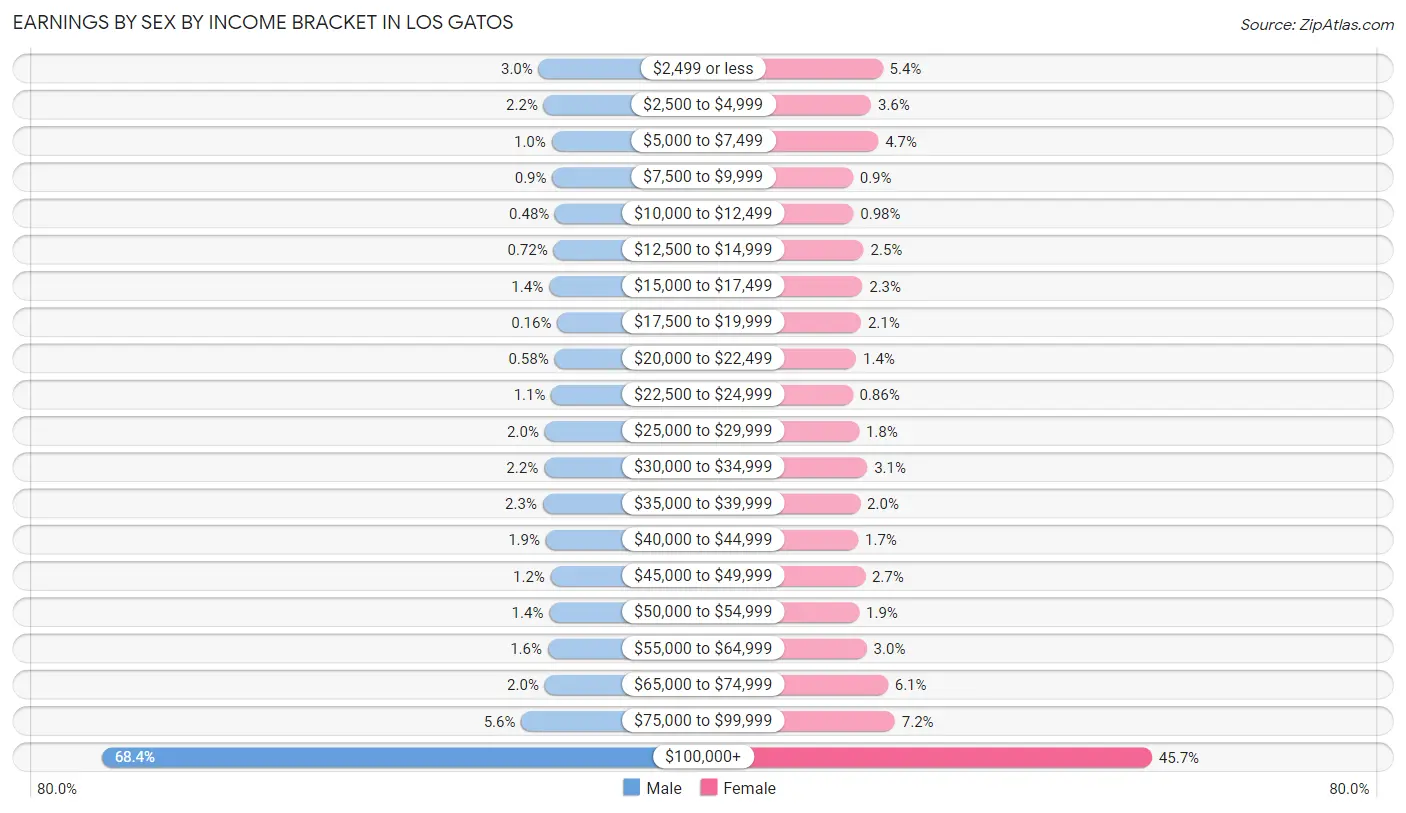
Earnings by Sex by Income Bracket in Los Gatos
The most common earnings brackets in Los Gatos are $100,000+ for men (6,545 | 68.4%) and $100,000+ for women (3,390 | 45.7%).
| Income | Male | Female |
| $2,499 or less | 283 (3.0%) | 398 (5.4%) |
| $2,500 to $4,999 | 209 (2.2%) | 269 (3.6%) |
| $5,000 to $7,499 | 97 (1.0%) | 349 (4.7%) |
| $7,500 to $9,999 | 86 (0.9%) | 67 (0.9%) |
| $10,000 to $12,499 | 46 (0.5%) | 73 (1.0%) |
| $12,500 to $14,999 | 69 (0.7%) | 187 (2.5%) |
| $15,000 to $17,499 | 134 (1.4%) | 172 (2.3%) |
| $17,500 to $19,999 | 15 (0.2%) | 157 (2.1%) |
| $20,000 to $22,499 | 55 (0.6%) | 103 (1.4%) |
| $22,500 to $24,999 | 101 (1.1%) | 64 (0.9%) |
| $25,000 to $29,999 | 195 (2.0%) | 135 (1.8%) |
| $30,000 to $34,999 | 206 (2.1%) | 227 (3.1%) |
| $35,000 to $39,999 | 224 (2.3%) | 148 (2.0%) |
| $40,000 to $44,999 | 180 (1.9%) | 125 (1.7%) |
| $45,000 to $49,999 | 110 (1.1%) | 202 (2.7%) |
| $50,000 to $54,999 | 131 (1.4%) | 137 (1.8%) |
| $55,000 to $64,999 | 151 (1.6%) | 221 (3.0%) |
| $65,000 to $74,999 | 195 (2.0%) | 455 (6.1%) |
| $75,000 to $99,999 | 531 (5.6%) | 534 (7.2%) |
| $100,000+ | 6,545 (68.4%) | 3,390 (45.7%) |
| Total | 9,563 (100.0%) | 7,413 (100.0%) |
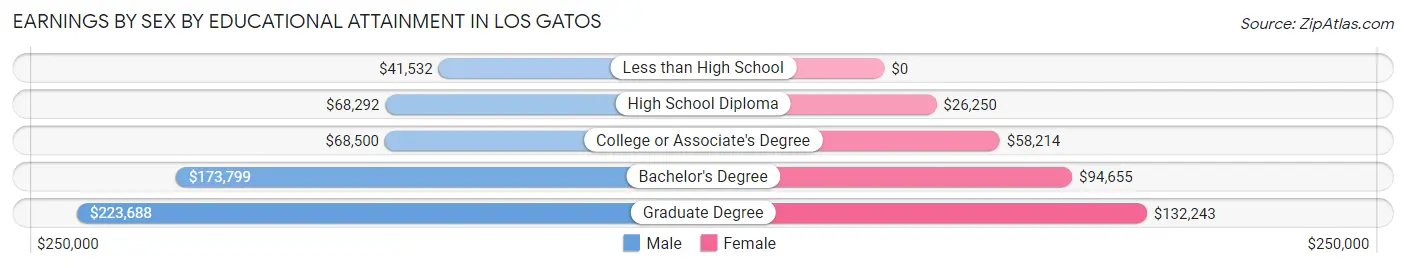
Earnings by Sex by Educational Attainment in Los Gatos
Average earnings in Los Gatos are $177,034 for men and $95,495 for women, a difference of 46.1%. Men with an educational attainment of graduate degree enjoy the highest average annual earnings of $223,688, while those with less than high school education earn the least with $41,532. Women with an educational attainment of graduate degree earn the most with the average annual earnings of $132,243, while those with high school diploma education have the smallest earnings of $26,250.
| Educational Attainment | Male Income | Female Income |
| Less than High School | $41,532 | $0 |
| High School Diploma | $68,292 | $26,250 |
| College or Associate's Degree | $68,500 | $58,214 |
| Bachelor's Degree | $173,799 | $94,655 |
| Graduate Degree | $223,688 | $132,243 |
| Total | $177,034 | $95,495 |
Family Income in Los Gatos
Family Income Brackets in Los Gatos
According to the Los Gatos family income data, there are 5,560 families falling into the $200,000+ income range, which is the most common income bracket and makes up 61.4% of all families. Conversely, the $10,000 to $14,999 income bracket is the least frequent group with only 18 families (0.2%) belonging to this category.
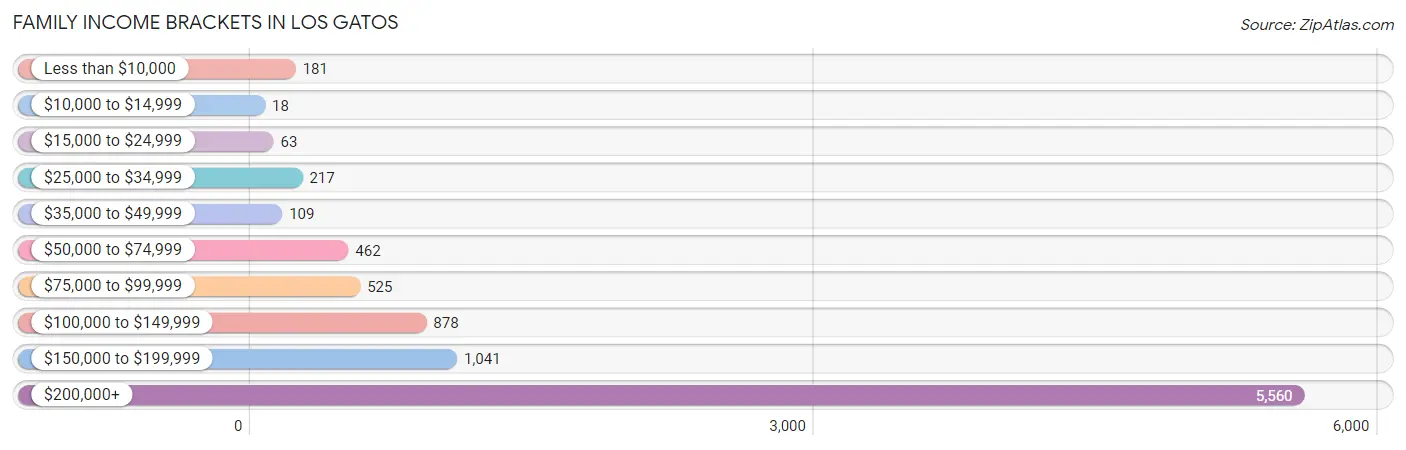
| Income Bracket | # Families | % Families |
| Less than $10,000 | 181 | 2.0% |
| $10,000 to $14,999 | 18 | 0.2% |
| $15,000 to $24,999 | 63 | 0.7% |
| $25,000 to $34,999 | 217 | 2.4% |
| $35,000 to $49,999 | 109 | 1.2% |
| $50,000 to $74,999 | 462 | 5.1% |
| $75,000 to $99,999 | 525 | 5.8% |
| $100,000 to $149,999 | 878 | 9.7% |
| $150,000 to $199,999 | 1,041 | 11.5% |
| $200,000+ | 5,560 | 61.4% |
Family Income by Famaliy Size in Los Gatos
4-person families (1,964 | 21.7%) account for the highest median family income in Los Gatos with $250,001 per family, while 2-person families (4,044 | 44.7%) have the highest median income of $97,590 per family member.
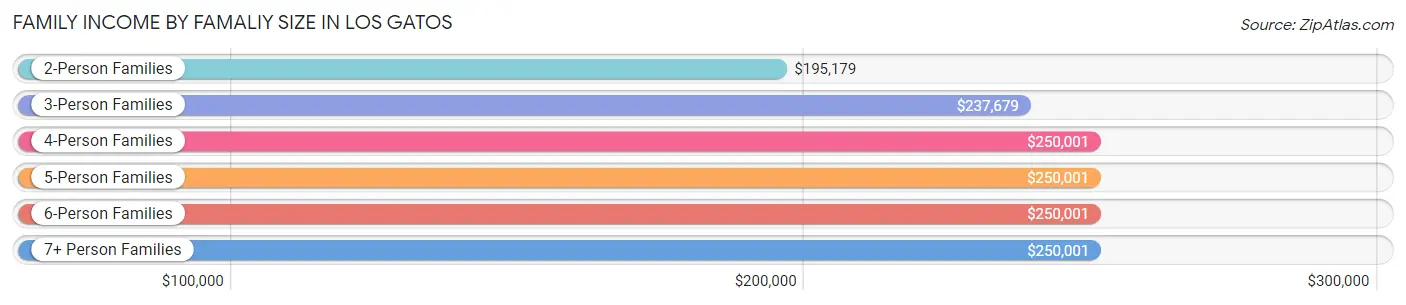
| Income Bracket | # Families | Median Income |
| 2-Person Families | 4,044 (44.7%) | $195,179 |
| 3-Person Families | 2,248 (24.8%) | $237,679 |
| 4-Person Families | 1,964 (21.7%) | $250,001 |
| 5-Person Families | 625 (6.9%) | $250,001 |
| 6-Person Families | 127 (1.4%) | $250,001 |
| 7+ Person Families | 47 (0.5%) | $250,001 |
| Total | 9,055 (100.0%) | $240,688 |
Family Income by Number of Earners in Los Gatos
The median family income in Los Gatos is $240,688, with families comprising 2 earners (4,125) having the highest median family income of $250,001, while families with no earners (1,238) have the lowest median family income of $77,917, accounting for 45.6% and 13.7% of families, respectively.
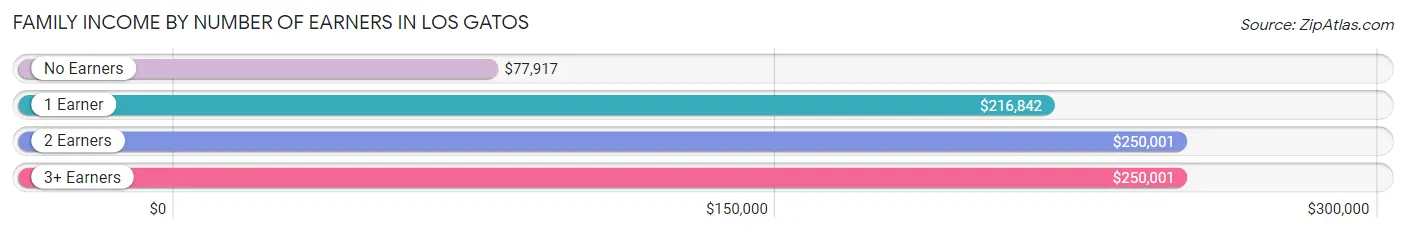
| Number of Earners | # Families | Median Income |
| No Earners | 1,238 (13.7%) | $77,917 |
| 1 Earner | 3,040 (33.6%) | $216,842 |
| 2 Earners | 4,125 (45.6%) | $250,001 |
| 3+ Earners | 652 (7.2%) | $250,001 |
| Total | 9,055 (100.0%) | $240,688 |
Household Income in Los Gatos
Household Income Brackets in Los Gatos
With 6,363 households falling in the category, the $200,000+ income range is the most frequent in Los Gatos, accounting for 49.5% of all households. In contrast, only 77 households (0.6%) fall into the $10,000 to $14,999 income bracket, making it the least populous group.
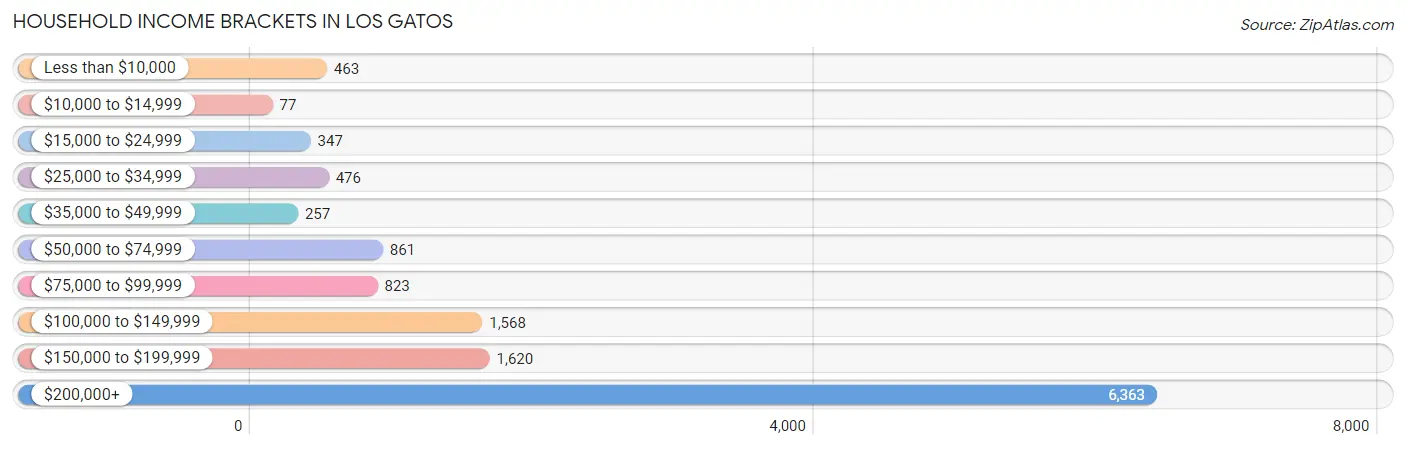
| Income Bracket | # Households | % Households |
| Less than $10,000 | 463 | 3.6% |
| $10,000 to $14,999 | 77 | 0.6% |
| $15,000 to $24,999 | 347 | 2.7% |
| $25,000 to $34,999 | 476 | 3.7% |
| $35,000 to $49,999 | 257 | 2.0% |
| $50,000 to $74,999 | 861 | 6.7% |
| $75,000 to $99,999 | 823 | 6.4% |
| $100,000 to $149,999 | 1,568 | 12.2% |
| $150,000 to $199,999 | 1,620 | 12.6% |
| $200,000+ | 6,363 | 49.5% |
Household Income by Householder Age in Los Gatos
The median household income in Los Gatos is $198,117, with the highest median household income of $250,001 found in the 45 to 64 years age bracket for the primary householder. A total of 5,597 households (43.5%) fall into this category. Meanwhile, the 15 to 24 years age bracket for the primary householder has the lowest median household income of $0, with 99 households (0.8%) in this group.
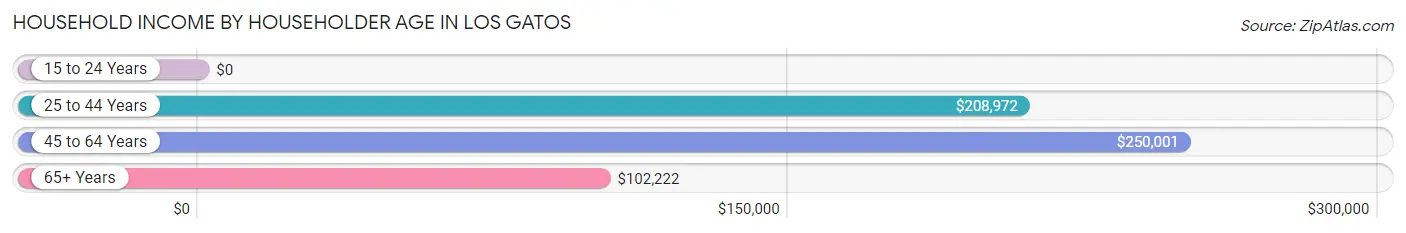
| Income Bracket | # Households | Median Income |
| 15 to 24 Years | 99 (0.8%) | $0 |
| 25 to 44 Years | 3,175 (24.7%) | $208,972 |
| 45 to 64 Years | 5,597 (43.5%) | $250,001 |
| 65+ Years | 3,984 (31.0%) | $102,222 |
| Total | 12,855 (100.0%) | $198,117 |
Poverty in Los Gatos
Income Below Poverty by Sex and Age in Los Gatos
With 2.9% poverty level for males and 4.9% for females among the residents of Los Gatos, 25 to 34 year old males and 18 to 24 year old females are the most vulnerable to poverty, with 66 males (5.4%) and 94 females (12.9%) in their respective age groups living below the poverty level.
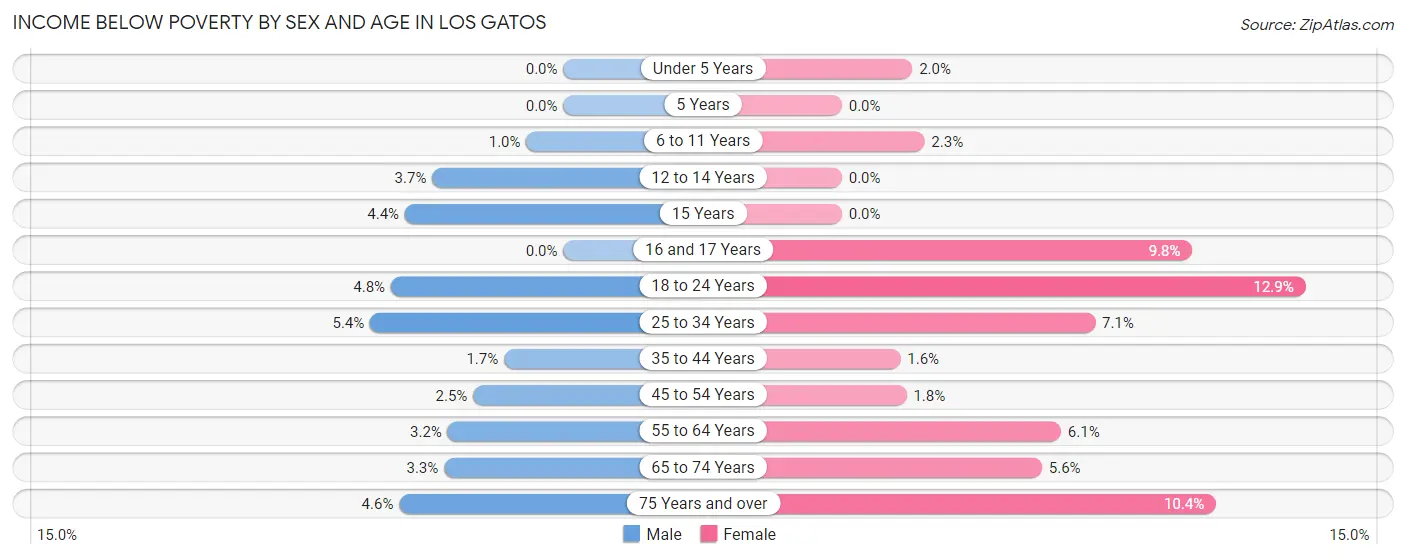
| Age Bracket | Male | Female |
| Under 5 Years | 0 (0.0%) | 15 (2.0%) |
| 5 Years | 0 (0.0%) | 0 (0.0%) |
| 6 to 11 Years | 16 (1.0%) | 26 (2.3%) |
| 12 to 14 Years | 33 (3.6%) | 0 (0.0%) |
| 15 Years | 9 (4.4%) | 0 (0.0%) |
| 16 and 17 Years | 0 (0.0%) | 52 (9.8%) |
| 18 to 24 Years | 49 (4.8%) | 94 (12.9%) |
| 25 to 34 Years | 66 (5.4%) | 100 (7.0%) |
| 35 to 44 Years | 35 (1.7%) | 34 (1.6%) |
| 45 to 54 Years | 64 (2.5%) | 52 (1.8%) |
| 55 to 64 Years | 80 (3.2%) | 137 (6.1%) |
| 65 to 74 Years | 53 (3.3%) | 82 (5.6%) |
| 75 Years and over | 58 (4.6%) | 217 (10.4%) |
| Total | 463 (2.9%) | 809 (4.9%) |
Income Above Poverty by Sex and Age in Los Gatos
According to the poverty statistics in Los Gatos, males aged under 5 years and females aged 5 years are the age groups that are most secure financially, with 100.0% of males and 100.0% of females in these age groups living above the poverty line.
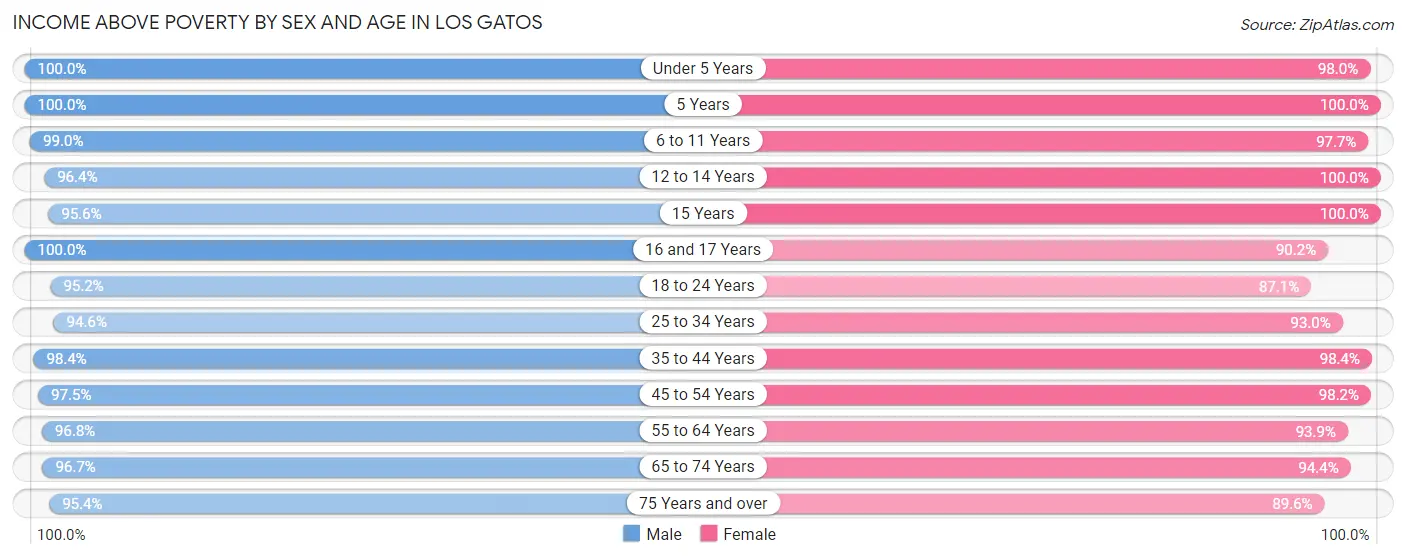
| Age Bracket | Male | Female |
| Under 5 Years | 512 (100.0%) | 752 (98.0%) |
| 5 Years | 266 (100.0%) | 158 (100.0%) |
| 6 to 11 Years | 1,539 (99.0%) | 1,106 (97.7%) |
| 12 to 14 Years | 871 (96.4%) | 701 (100.0%) |
| 15 Years | 195 (95.6%) | 251 (100.0%) |
| 16 and 17 Years | 528 (100.0%) | 481 (90.2%) |
| 18 to 24 Years | 971 (95.2%) | 634 (87.1%) |
| 25 to 34 Years | 1,161 (94.6%) | 1,318 (92.9%) |
| 35 to 44 Years | 2,086 (98.4%) | 2,051 (98.4%) |
| 45 to 54 Years | 2,485 (97.5%) | 2,839 (98.2%) |
| 55 to 64 Years | 2,404 (96.8%) | 2,109 (93.9%) |
| 65 to 74 Years | 1,544 (96.7%) | 1,389 (94.4%) |
| 75 Years and over | 1,212 (95.4%) | 1,865 (89.6%) |
| Total | 15,774 (97.2%) | 15,654 (95.1%) |
Income Below Poverty Among Married-Couple Families in Los Gatos
The poverty statistics for married-couple families in Los Gatos show that 2.0% or 154 of the total 7,857 families live below the poverty line. Families with no children have the highest poverty rate of 2.6%, comprising of 111 families. On the other hand, families with 3 or 4 children have the lowest poverty rate of 0.0%, which includes 0 families.
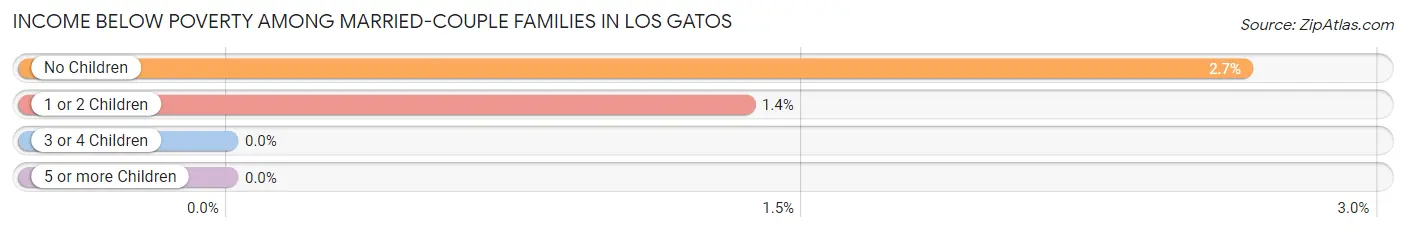
| Children | Above Poverty | Below Poverty |
| No Children | 4,080 (97.4%) | 111 (2.6%) |
| 1 or 2 Children | 3,136 (98.7%) | 43 (1.3%) |
| 3 or 4 Children | 474 (100.0%) | 0 (0.0%) |
| 5 or more Children | 13 (100.0%) | 0 (0.0%) |
| Total | 7,703 (98.0%) | 154 (2.0%) |
Income Below Poverty Among Single-Parent Households in Los Gatos
According to the poverty data in Los Gatos, 6.8% or 27 single-father households and 3.9% or 31 single-mother households are living below the poverty line. Among single-father households, those with no children have the highest poverty rate, with 11 households (9.9%) experiencing poverty. Likewise, among single-mother households, those with 1 or 2 children have the highest poverty rate, with 13 households (4.1%) falling below the poverty line.
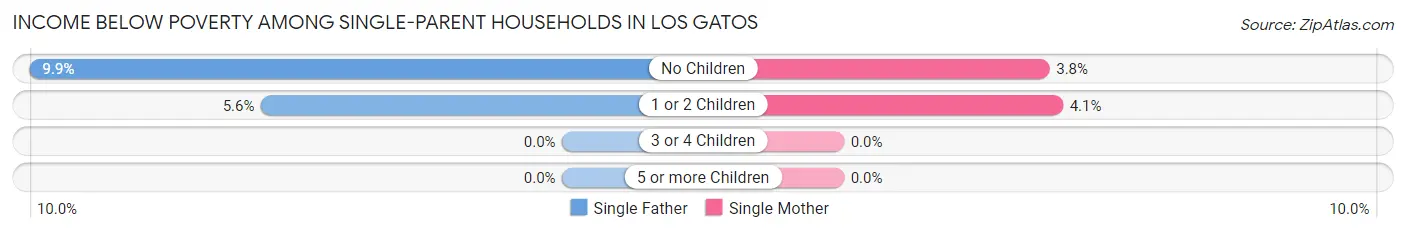
| Children | Single Father | Single Mother |
| No Children | 11 (9.9%) | 18 (3.8%) |
| 1 or 2 Children | 16 (5.6%) | 13 (4.1%) |
| 3 or 4 Children | 0 (0.0%) | 0 (0.0%) |
| 5 or more Children | 0 (0.0%) | 0 (0.0%) |
| Total | 27 (6.8%) | 31 (3.9%) |
Income Below Poverty Among Married-Couple vs Single-Parent Households in Los Gatos
The poverty data for Los Gatos shows that 154 of the married-couple family households (2.0%) and 58 of the single-parent households (4.8%) are living below the poverty level. Within the married-couple family households, those with no children have the highest poverty rate, with 111 households (2.6%) falling below the poverty line. Among the single-parent households, those with no children have the highest poverty rate, with 29 household (5.0%) living below poverty.
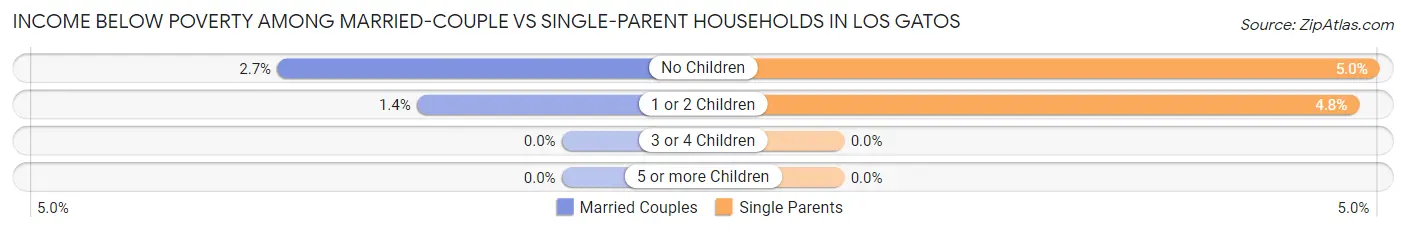
| Children | Married-Couple Families | Single-Parent Households |
| No Children | 111 (2.6%) | 29 (5.0%) |
| 1 or 2 Children | 43 (1.3%) | 29 (4.8%) |
| 3 or 4 Children | 0 (0.0%) | 0 (0.0%) |
| 5 or more Children | 0 (0.0%) | 0 (0.0%) |
| Total | 154 (2.0%) | 58 (4.8%) |
Race in Los Gatos
The most populous races in Los Gatos are White / Caucasian (23,742 | 71.7%), Asian (5,693 | 17.2%), and Hispanic or Latino (2,715 | 8.2%).
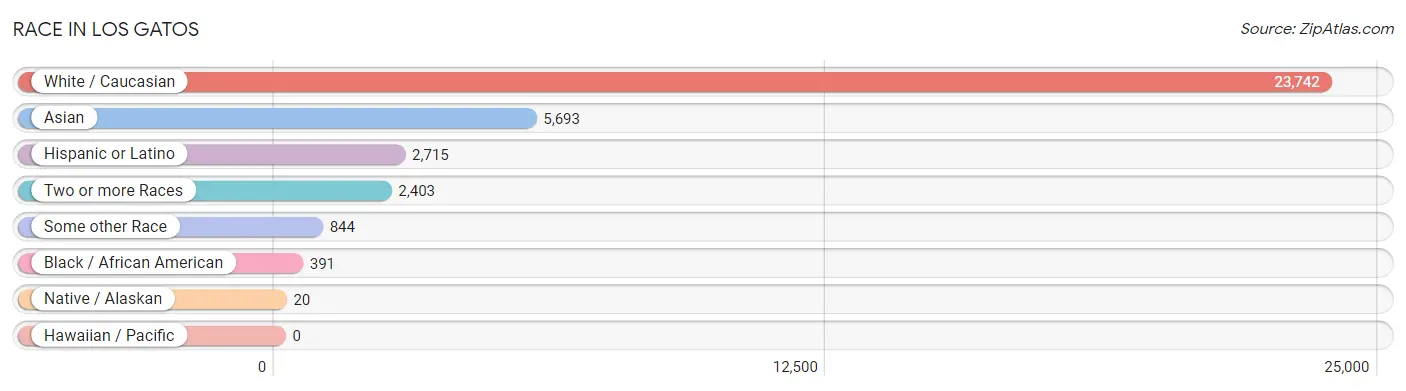
| Race | # Population | % Population |
| Asian | 5,693 | 17.2% |
| Black / African American | 391 | 1.2% |
| Hawaiian / Pacific | 0 | 0.0% |
| Hispanic or Latino | 2,715 | 8.2% |
| Native / Alaskan | 20 | 0.1% |
| White / Caucasian | 23,742 | 71.7% |
| Two or more Races | 2,403 | 7.3% |
| Some other Race | 844 | 2.5% |
| Total | 33,093 | 100.0% |
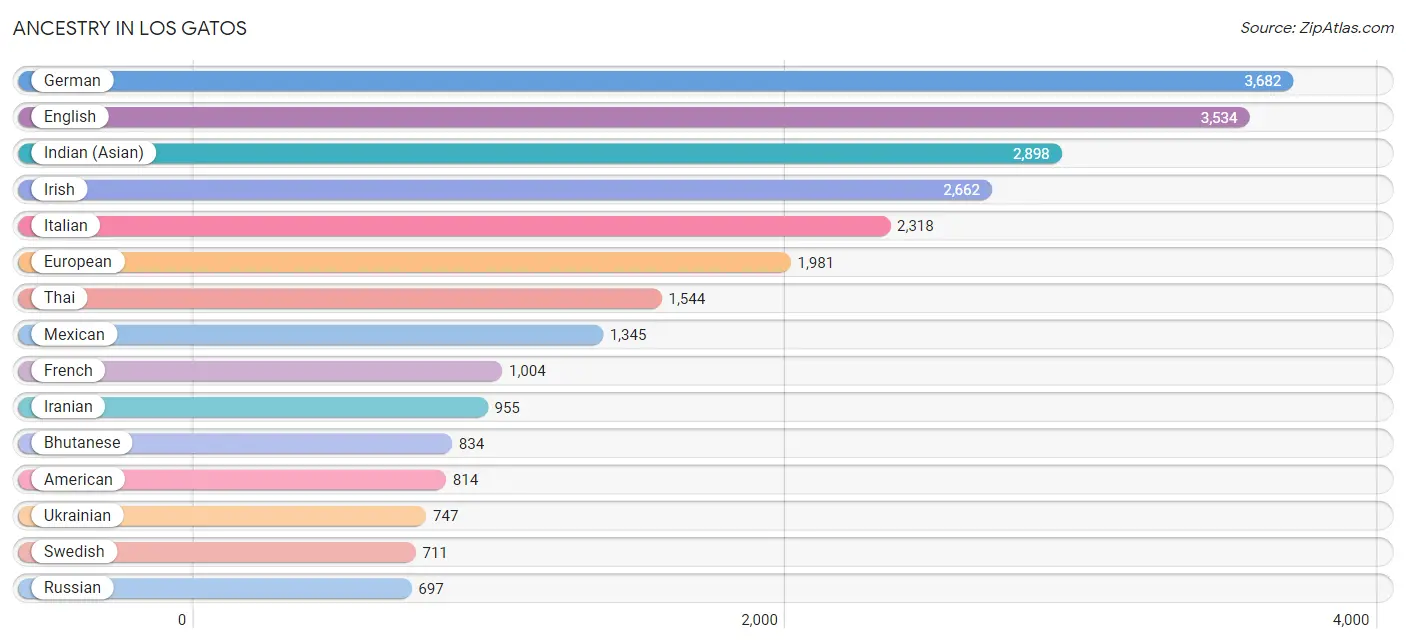
Ancestry in Los Gatos
The most populous ancestries reported in Los Gatos are German (3,682 | 11.1%), English (3,534 | 10.7%), Indian (Asian) (2,898 | 8.8%), Irish (2,662 | 8.0%), and Italian (2,318 | 7.0%), together accounting for 45.6% of all Los Gatos residents.
| Ancestry | # Population | % Population |
| Afghan | 14 | 0.0% |
| African | 76 | 0.2% |
| American | 814 | 2.5% |
| Apache | 8 | 0.0% |
| Arab | 427 | 1.3% |
| Argentinean | 70 | 0.2% |
| Armenian | 286 | 0.9% |
| Assyrian / Chaldean / Syriac | 19 | 0.1% |
| Australian | 115 | 0.4% |
| Austrian | 113 | 0.3% |
| Belgian | 54 | 0.2% |
| Bhutanese | 834 | 2.5% |
| Bolivian | 11 | 0.0% |
| Brazilian | 64 | 0.2% |
| British | 411 | 1.2% |
| Bulgarian | 162 | 0.5% |
| Burmese | 270 | 0.8% |
| Canadian | 100 | 0.3% |
| Celtic | 7 | 0.0% |
| Central American | 325 | 1.0% |
| Central American Indian | 44 | 0.1% |
| Cherokee | 3 | 0.0% |
| Chilean | 21 | 0.1% |
| Chippewa | 35 | 0.1% |
| Colombian | 74 | 0.2% |
| Comanche | 12 | 0.0% |
| Costa Rican | 50 | 0.2% |
| Croatian | 170 | 0.5% |
| Cuban | 46 | 0.1% |
| Czech | 190 | 0.6% |
| Czechoslovakian | 9 | 0.0% |
| Danish | 252 | 0.8% |
| Dutch | 318 | 1.0% |
| Eastern European | 298 | 0.9% |
| Ecuadorian | 26 | 0.1% |
| Egyptian | 7 | 0.0% |
| English | 3,534 | 10.7% |
| Ethiopian | 126 | 0.4% |
| European | 1,981 | 6.0% |
| Filipino | 129 | 0.4% |
| Finnish | 26 | 0.1% |
| French | 1,004 | 3.0% |
| French Canadian | 56 | 0.2% |
| German | 3,682 | 11.1% |
| Greek | 467 | 1.4% |
| Guatemalan | 105 | 0.3% |
| Hungarian | 298 | 0.9% |
| Indian (Asian) | 2,898 | 8.8% |
| Iranian | 955 | 2.9% |
| Iraqi | 12 | 0.0% |
| Irish | 2,662 | 8.0% |
| Israeli | 337 | 1.0% |
| Italian | 2,318 | 7.0% |
| Japanese | 69 | 0.2% |
| Jordanian | 21 | 0.1% |
| Korean | 478 | 1.4% |
| Lebanese | 72 | 0.2% |
| Lithuanian | 41 | 0.1% |
| Macedonian | 28 | 0.1% |
| Malaysian | 18 | 0.1% |
| Maltese | 18 | 0.1% |
| Mexican | 1,345 | 4.1% |
| Mexican American Indian | 21 | 0.1% |
| Moroccan | 218 | 0.7% |
| Nicaraguan | 31 | 0.1% |
| Northern European | 276 | 0.8% |
| Norwegian | 405 | 1.2% |
| Pakistani | 52 | 0.2% |
| Palestinian | 85 | 0.3% |
| Peruvian | 59 | 0.2% |
| Polish | 525 | 1.6% |
| Portuguese | 473 | 1.4% |
| Pueblo | 15 | 0.1% |
| Puerto Rican | 22 | 0.1% |
| Romanian | 71 | 0.2% |
| Russian | 697 | 2.1% |
| Salvadoran | 139 | 0.4% |
| Samoan | 8 | 0.0% |
| Scandinavian | 184 | 0.6% |
| Scotch-Irish | 205 | 0.6% |
| Scottish | 660 | 2.0% |
| Serbian | 21 | 0.1% |
| Slovak | 18 | 0.1% |
| Slovene | 30 | 0.1% |
| South African | 9 | 0.0% |
| South American | 289 | 0.9% |
| Spaniard | 212 | 0.6% |
| Spanish | 195 | 0.6% |
| Spanish American | 18 | 0.1% |
| Sri Lankan | 305 | 0.9% |
| Subsaharan African | 211 | 0.6% |
| Swedish | 711 | 2.1% |
| Swiss | 106 | 0.3% |
| Thai | 1,544 | 4.7% |
| Trinidadian and Tobagonian | 10 | 0.0% |
| Turkish | 330 | 1.0% |
| Ukrainian | 747 | 2.3% |
| Uruguayan | 13 | 0.0% |
| Venezuelan | 15 | 0.1% |
| Welsh | 232 | 0.7% |
| Yugoslavian | 97 | 0.3% | View All 101 Rows |
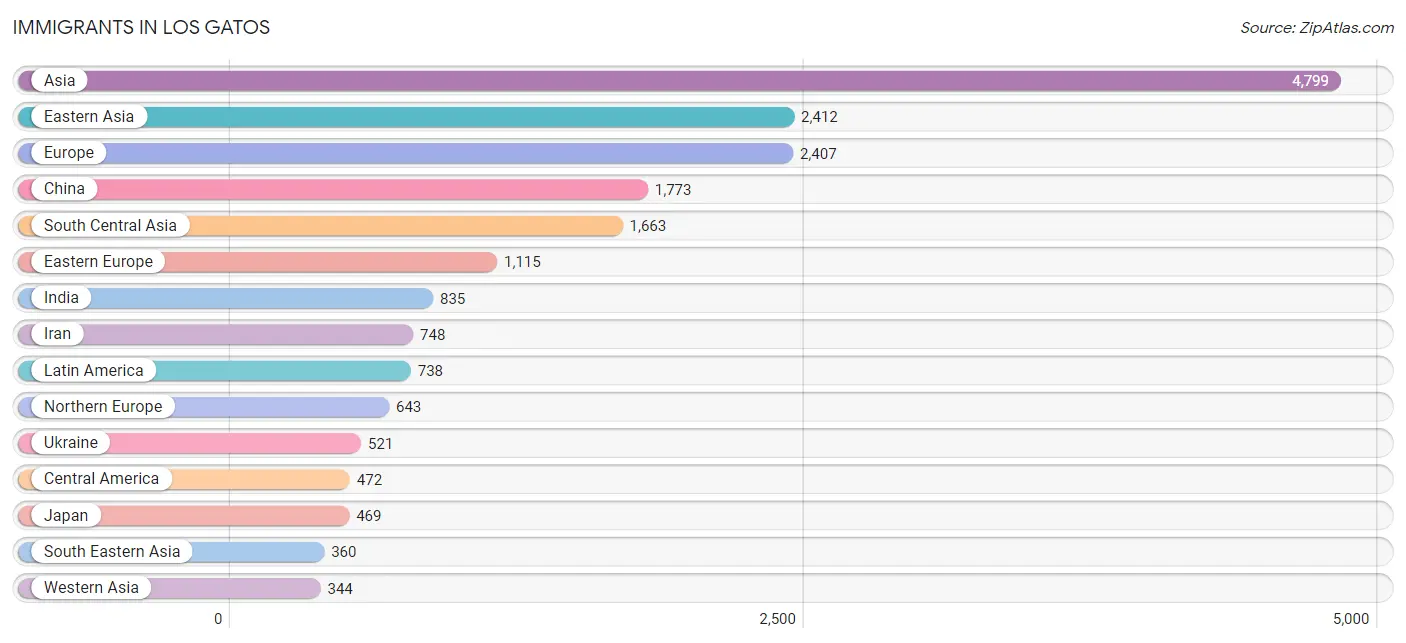
Immigrants in Los Gatos
The most numerous immigrant groups reported in Los Gatos came from Asia (4,799 | 14.5%), Eastern Asia (2,412 | 7.3%), Europe (2,407 | 7.3%), China (1,773 | 5.4%), and South Central Asia (1,663 | 5.0%), together accounting for 39.4% of all Los Gatos residents.
| Immigration Origin | # Population | % Population |
| Africa | 79 | 0.2% |
| Argentina | 43 | 0.1% |
| Armenia | 19 | 0.1% |
| Asia | 4,799 | 14.5% |
| Australia | 46 | 0.1% |
| Austria | 7 | 0.0% |
| Azores | 40 | 0.1% |
| Bangladesh | 9 | 0.0% |
| Barbados | 13 | 0.0% |
| Belarus | 12 | 0.0% |
| Belgium | 14 | 0.0% |
| Bosnia and Herzegovina | 60 | 0.2% |
| Brazil | 73 | 0.2% |
| Bulgaria | 54 | 0.2% |
| Canada | 248 | 0.7% |
| Caribbean | 13 | 0.0% |
| Central America | 472 | 1.4% |
| China | 1,773 | 5.4% |
| Colombia | 89 | 0.3% |
| Costa Rica | 22 | 0.1% |
| Denmark | 33 | 0.1% |
| Eastern Africa | 58 | 0.2% |
| Eastern Asia | 2,412 | 7.3% |
| Eastern Europe | 1,115 | 3.4% |
| Ecuador | 16 | 0.1% |
| El Salvador | 52 | 0.2% |
| England | 61 | 0.2% |
| Ethiopia | 58 | 0.2% |
| Europe | 2,407 | 7.3% |
| France | 70 | 0.2% |
| Germany | 169 | 0.5% |
| Ghana | 12 | 0.0% |
| Greece | 116 | 0.4% |
| Guatemala | 54 | 0.2% |
| Honduras | 23 | 0.1% |
| Hong Kong | 250 | 0.8% |
| Hungary | 70 | 0.2% |
| India | 835 | 2.5% |
| Indonesia | 7 | 0.0% |
| Iran | 748 | 2.3% |
| Iraq | 12 | 0.0% |
| Ireland | 110 | 0.3% |
| Israel | 63 | 0.2% |
| Italy | 82 | 0.3% |
| Japan | 469 | 1.4% |
| Jordan | 29 | 0.1% |
| Kazakhstan | 6 | 0.0% |
| Korea | 170 | 0.5% |
| Kuwait | 7 | 0.0% |
| Laos | 10 | 0.0% |
| Latin America | 738 | 2.2% |
| Lithuania | 25 | 0.1% |
| Malaysia | 26 | 0.1% |
| Mexico | 307 | 0.9% |
| Netherlands | 28 | 0.1% |
| Nicaragua | 14 | 0.0% |
| Northern Europe | 643 | 1.9% |
| Oceania | 46 | 0.1% |
| Pakistan | 56 | 0.2% |
| Peru | 17 | 0.1% |
| Philippines | 79 | 0.2% |
| Poland | 39 | 0.1% |
| Portugal | 51 | 0.2% |
| Romania | 45 | 0.1% |
| Russia | 255 | 0.8% |
| Saudi Arabia | 16 | 0.1% |
| Serbia | 18 | 0.1% |
| Singapore | 22 | 0.1% |
| South Africa | 9 | 0.0% |
| South America | 253 | 0.8% |
| South Central Asia | 1,663 | 5.0% |
| South Eastern Asia | 360 | 1.1% |
| Southern Europe | 298 | 0.9% |
| Spain | 49 | 0.2% |
| Sweden | 221 | 0.7% |
| Switzerland | 33 | 0.1% |
| Taiwan | 291 | 0.9% |
| Thailand | 7 | 0.0% |
| Turkey | 125 | 0.4% |
| Ukraine | 521 | 1.6% |
| Uzbekistan | 9 | 0.0% |
| Venezuela | 15 | 0.1% |
| Vietnam | 193 | 0.6% |
| Western Africa | 12 | 0.0% |
| Western Asia | 344 | 1.0% |
| Western Europe | 321 | 1.0% | View All 86 Rows |
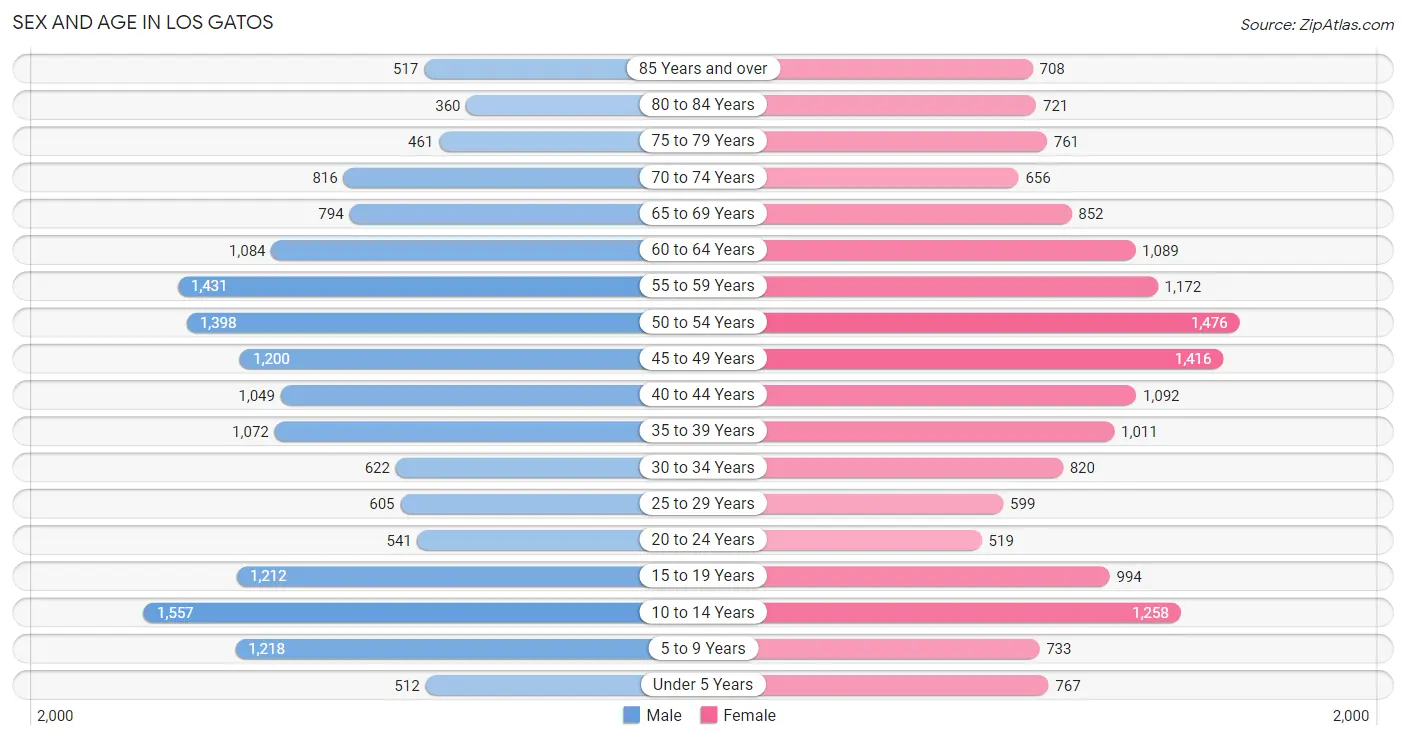
Sex and Age in Los Gatos
Sex and Age in Los Gatos
The most populous age groups in Los Gatos are 10 to 14 Years (1,557 | 9.5%) for men and 50 to 54 Years (1,476 | 8.9%) for women.
| Age Bracket | Male | Female |
| Under 5 Years | 512 (3.1%) | 767 (4.6%) |
| 5 to 9 Years | 1,218 (7.4%) | 733 (4.4%) |
| 10 to 14 Years | 1,557 (9.5%) | 1,258 (7.6%) |
| 15 to 19 Years | 1,212 (7.4%) | 994 (6.0%) |
| 20 to 24 Years | 541 (3.3%) | 519 (3.1%) |
| 25 to 29 Years | 605 (3.7%) | 599 (3.6%) |
| 30 to 34 Years | 622 (3.8%) | 820 (4.9%) |
| 35 to 39 Years | 1,072 (6.5%) | 1,011 (6.1%) |
| 40 to 44 Years | 1,049 (6.4%) | 1,092 (6.6%) |
| 45 to 49 Years | 1,200 (7.3%) | 1,416 (8.5%) |
| 50 to 54 Years | 1,398 (8.5%) | 1,476 (8.9%) |
| 55 to 59 Years | 1,431 (8.7%) | 1,172 (7.0%) |
| 60 to 64 Years | 1,084 (6.6%) | 1,089 (6.5%) |
| 65 to 69 Years | 794 (4.8%) | 852 (5.1%) |
| 70 to 74 Years | 816 (5.0%) | 656 (3.9%) |
| 75 to 79 Years | 461 (2.8%) | 761 (4.6%) |
| 80 to 84 Years | 360 (2.2%) | 721 (4.3%) |
| 85 Years and over | 517 (3.1%) | 708 (4.3%) |
| Total | 16,449 (100.0%) | 16,644 (100.0%) |
Families and Households in Los Gatos
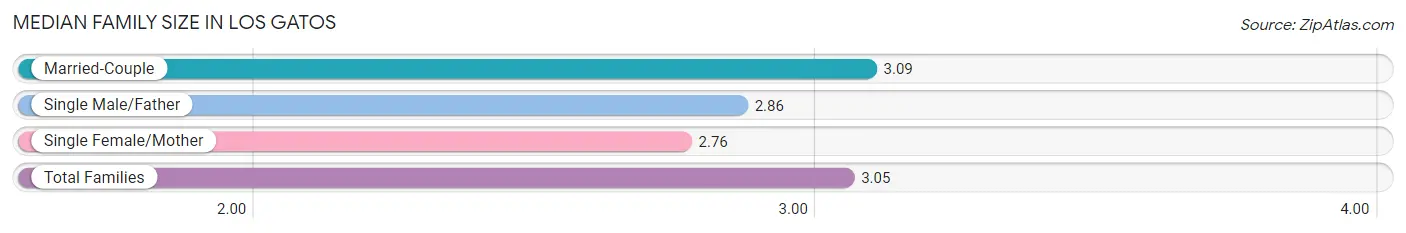
Median Family Size in Los Gatos
The median family size in Los Gatos is 3.05 persons per family, with married-couple families (7,857 | 86.8%) accounting for the largest median family size of 3.09 persons per family. On the other hand, single female/mother families (802 | 8.9%) represent the smallest median family size with 2.76 persons per family.
| Family Type | # Families | Family Size |
| Married-Couple | 7,857 (86.8%) | 3.09 |
| Single Male/Father | 396 (4.4%) | 2.86 |
| Single Female/Mother | 802 (8.9%) | 2.76 |
| Total Families | 9,055 (100.0%) | 3.05 |
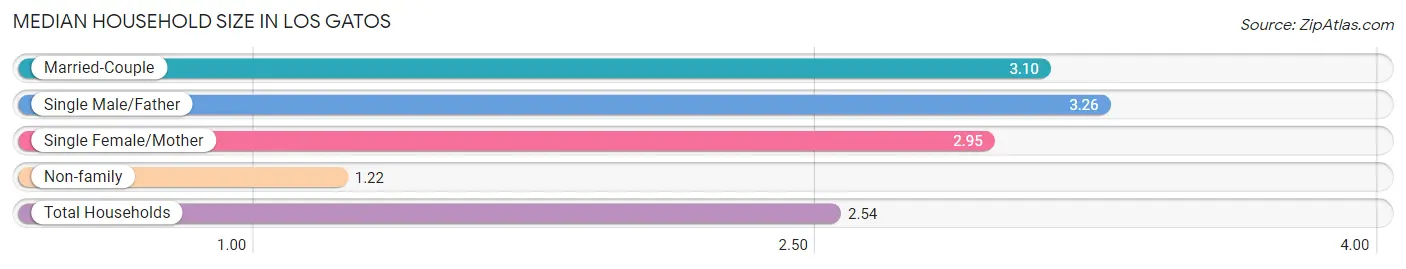
Median Household Size in Los Gatos
The median household size in Los Gatos is 2.54 persons per household, with single male/father households (396 | 3.1%) accounting for the largest median household size of 3.26 persons per household. non-family households (3,800 | 29.6%) represent the smallest median household size with 1.22 persons per household.
| Household Type | # Households | Household Size |
| Married-Couple | 7,857 (61.1%) | 3.10 |
| Single Male/Father | 396 (3.1%) | 3.26 |
| Single Female/Mother | 802 (6.2%) | 2.95 |
| Non-family | 3,800 (29.6%) | 1.22 |
| Total Households | 12,855 (100.0%) | 2.54 |
Household Size by Marriage Status in Los Gatos
Out of a total of 12,855 households in Los Gatos, 9,055 (70.4%) are family households, while 3,800 (29.6%) are nonfamily households. The most numerous type of family households are 2-person households, comprising 3,877, and the most common type of nonfamily households are 1-person households, comprising 3,186.
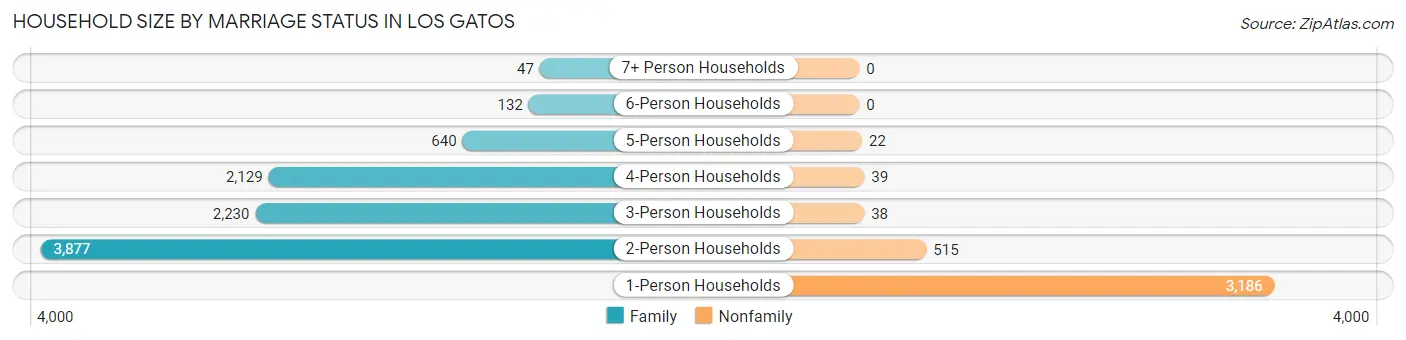
| Household Size | Family Households | Nonfamily Households |
| 1-Person Households | - | 3,186 (24.8%) |
| 2-Person Households | 3,877 (30.2%) | 515 (4.0%) |
| 3-Person Households | 2,230 (17.3%) | 38 (0.3%) |
| 4-Person Households | 2,129 (16.6%) | 39 (0.3%) |
| 5-Person Households | 640 (5.0%) | 22 (0.2%) |
| 6-Person Households | 132 (1.0%) | 0 (0.0%) |
| 7+ Person Households | 47 (0.4%) | 0 (0.0%) |
| Total | 9,055 (70.4%) | 3,800 (29.6%) |
Female Fertility in Los Gatos
Fertility by Age in Los Gatos
Average fertility rate in Los Gatos is 51.0 births per 1,000 women. Women in the age bracket of 20 to 34 years have the highest fertility rate with 101.0 births per 1,000 women. Women in the age bracket of 20 to 34 years acount for 56.2% of all women with births.
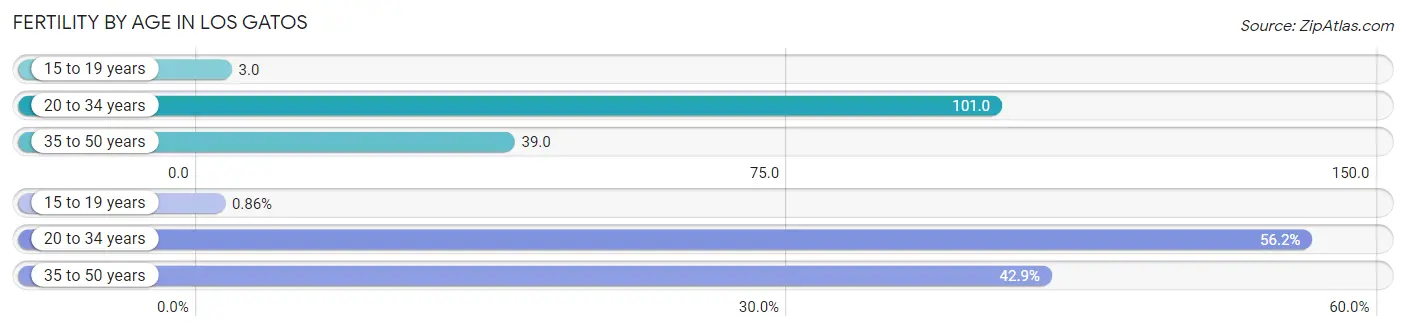
| Age Bracket | Women with Births | Births / 1,000 Women |
| 15 to 19 years | 3 (0.9%) | 3.0 |
| 20 to 34 years | 195 (56.2%) | 101.0 |
| 35 to 50 years | 149 (42.9%) | 39.0 |
| Total | 347 (100.0%) | 51.0 |
Fertility by Age by Marriage Status in Los Gatos
90.5% of women with births (347) in Los Gatos are married. The highest percentage of unmarried women with births falls into 15 to 19 years age bracket with 100.0% of them unmarried at the time of birth, while the lowest percentage of unmarried women with births belong to 35 to 50 years age bracket with 0.0% of them unmarried.
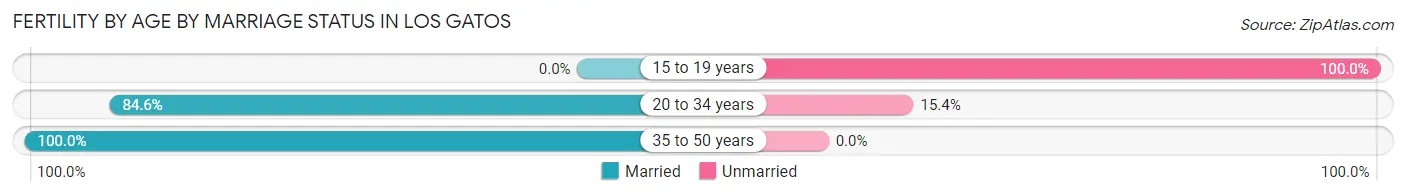
| Age Bracket | Married | Unmarried |
| 15 to 19 years | 0 (0.0%) | 3 (100.0%) |
| 20 to 34 years | 165 (84.6%) | 30 (15.4%) |
| 35 to 50 years | 149 (100.0%) | 0 (0.0%) |
| Total | 314 (90.5%) | 33 (9.5%) |
Fertility by Education in Los Gatos
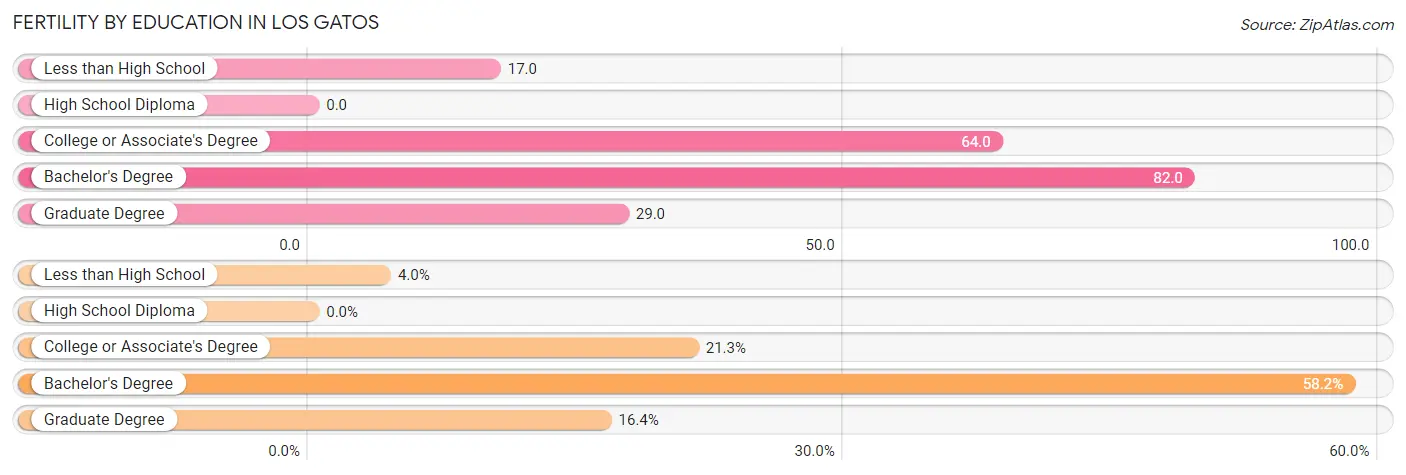
| Educational Attainment | Women with Births | Births / 1,000 Women |
| Less than High School | 14 (4.0%) | 17.0 |
| High School Diploma | 0 (0.0%) | 0.0 |
| College or Associate's Degree | 74 (21.3%) | 64.0 |
| Bachelor's Degree | 202 (58.2%) | 82.0 |
| Graduate Degree | 57 (16.4%) | 29.0 |
| Total | 347 (100.0%) | 51.0 |
Fertility by Education by Marriage Status in Los Gatos
9.5% of women with births in Los Gatos are unmarried. Women with the educational attainment of less than high school are most likely to be married with 100.0% of them married at childbirth, while women with the educational attainment of college or associate's degree are least likely to be married with 44.6% of them unmarried at childbirth.
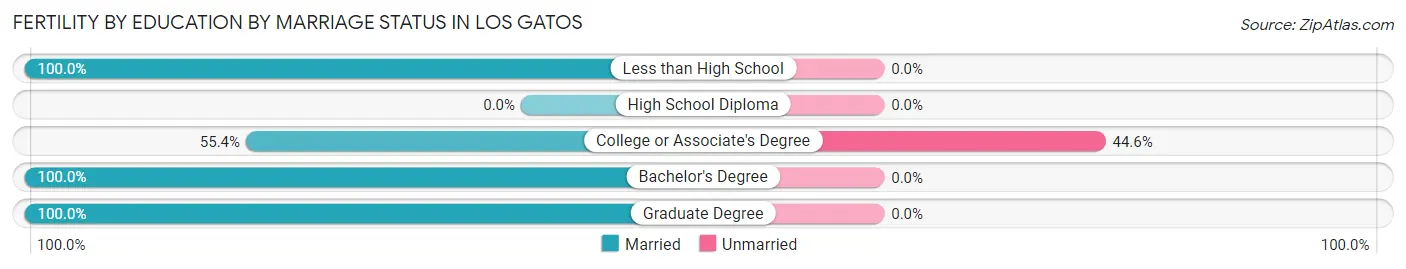
| Educational Attainment | Married | Unmarried |
| Less than High School | 14 (100.0%) | 0 (0.0%) |
| High School Diploma | 0 (0.0%) | 0 (0.0%) |
| College or Associate's Degree | 41 (55.4%) | 33 (44.6%) |
| Bachelor's Degree | 202 (100.0%) | 0 (0.0%) |
| Graduate Degree | 57 (100.0%) | 0 (0.0%) |
| Total | 314 (90.5%) | 33 (9.5%) |
Employment Characteristics in Los Gatos
Employment by Class of Employer in Los Gatos
Among the 15,197 employed individuals in Los Gatos, private company employees (11,060 | 72.8%), self-employed (not incorporated) (1,120 | 7.4%), and self-employed (incorporated) (1,064 | 7.0%) make up the most common classes of employment.
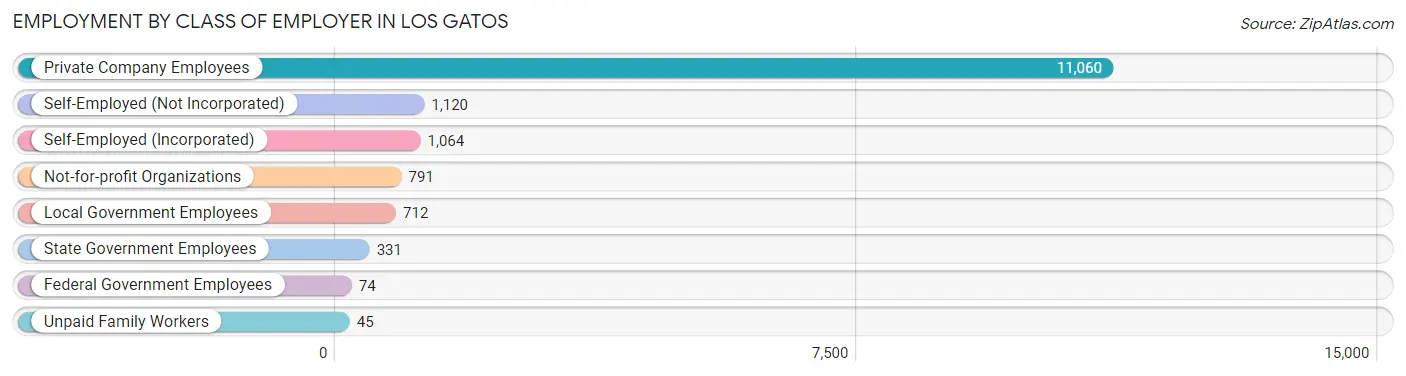
| Employer Class | # Employees | % Employees |
| Private Company Employees | 11,060 | 72.8% |
| Self-Employed (Incorporated) | 1,064 | 7.0% |
| Self-Employed (Not Incorporated) | 1,120 | 7.4% |
| Not-for-profit Organizations | 791 | 5.2% |
| Local Government Employees | 712 | 4.7% |
| State Government Employees | 331 | 2.2% |
| Federal Government Employees | 74 | 0.5% |
| Unpaid Family Workers | 45 | 0.3% |
| Total | 15,197 | 100.0% |
Employment Status by Age in Los Gatos
According to the labor force statistics for Los Gatos, out of the total population over 16 years of age (26,593), 61.3% or 16,302 individuals are in the labor force, with 4.7% or 766 of them unemployed. The age group with the highest labor force participation rate is 25 to 29 years, with 87.6% or 1,055 individuals in the labor force. Within the labor force, the 20 to 24 years age range has the highest percentage of unemployed individuals, with 22.3% or 154 of them being unemployed.
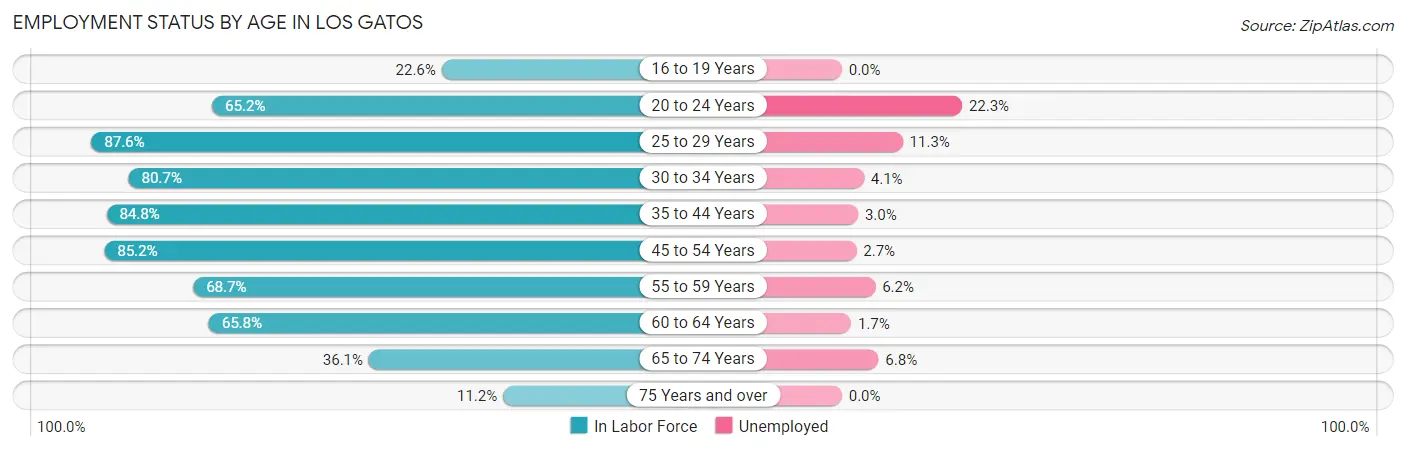
| Age Bracket | In Labor Force | Unemployed |
| 16 to 19 Years | 396 (22.6%) | 0 (0.0%) |
| 20 to 24 Years | 691 (65.2%) | 154 (22.3%) |
| 25 to 29 Years | 1,055 (87.6%) | 119 (11.3%) |
| 30 to 34 Years | 1,164 (80.7%) | 48 (4.1%) |
| 35 to 44 Years | 3,582 (84.8%) | 107 (3.0%) |
| 45 to 54 Years | 4,677 (85.2%) | 126 (2.7%) |
| 55 to 59 Years | 1,788 (68.7%) | 111 (6.2%) |
| 60 to 64 Years | 1,430 (65.8%) | 24 (1.7%) |
| 65 to 74 Years | 1,126 (36.1%) | 77 (6.8%) |
| 75 Years and over | 395 (11.2%) | 0 (0.0%) |
| Total | 16,302 (61.3%) | 766 (4.7%) |
Employment Status by Educational Attainment in Los Gatos
According to labor force statistics for Los Gatos, 79.9% of individuals (13,692) out of the total population between 25 and 64 years of age (17,136) are in the labor force, with 3.9% or 534 of them being unemployed. The group with the highest labor force participation rate are those with the educational attainment of bachelor's degree or higher, with 82.0% or 11,154 individuals in the labor force. Within the labor force, individuals with college / associate degree education have the highest percentage of unemployment, with 8.1% or 142 of them being unemployed.
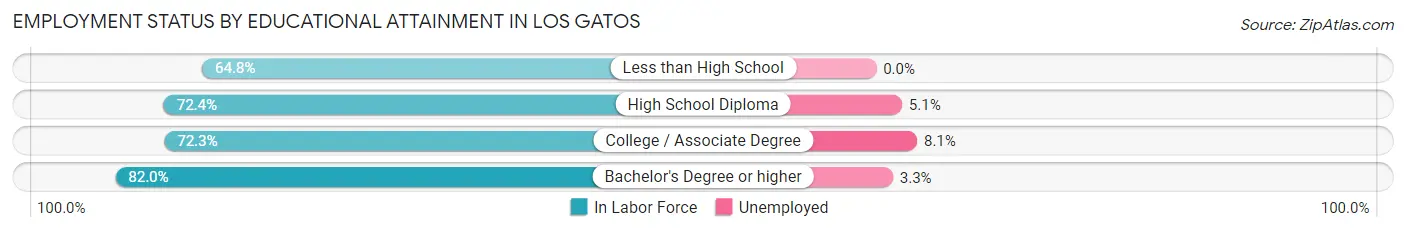
| Educational Attainment | In Labor Force | Unemployed |
| Less than High School | 175 (64.8%) | 0 (0.0%) |
| High School Diploma | 606 (72.4%) | 43 (5.1%) |
| College / Associate Degree | 1,754 (72.3%) | 197 (8.1%) |
| Bachelor's Degree or higher | 11,154 (82.0%) | 449 (3.3%) |
| Total | 13,692 (79.9%) | 668 (3.9%) |
Employment Occupations by Sex in Los Gatos
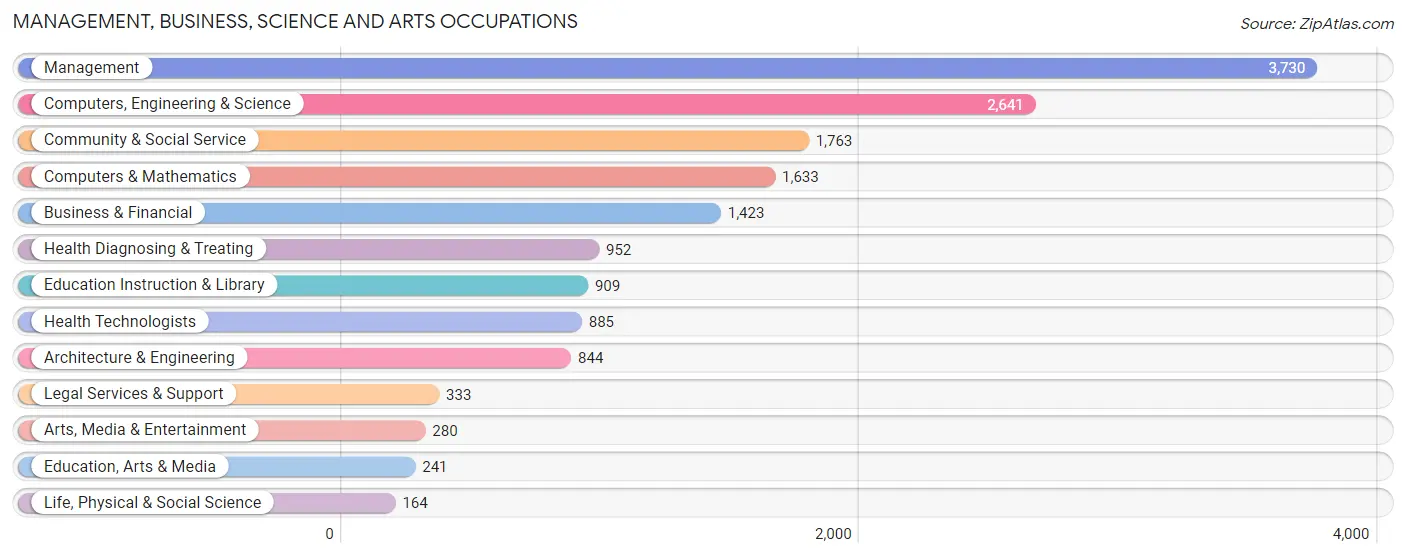
Management, Business, Science and Arts Occupations
The most common Management, Business, Science and Arts occupations in Los Gatos are Management (3,730 | 24.0%), Computers, Engineering & Science (2,641 | 17.0%), Community & Social Service (1,763 | 11.4%), Computers & Mathematics (1,633 | 10.5%), and Business & Financial (1,423 | 9.2%).
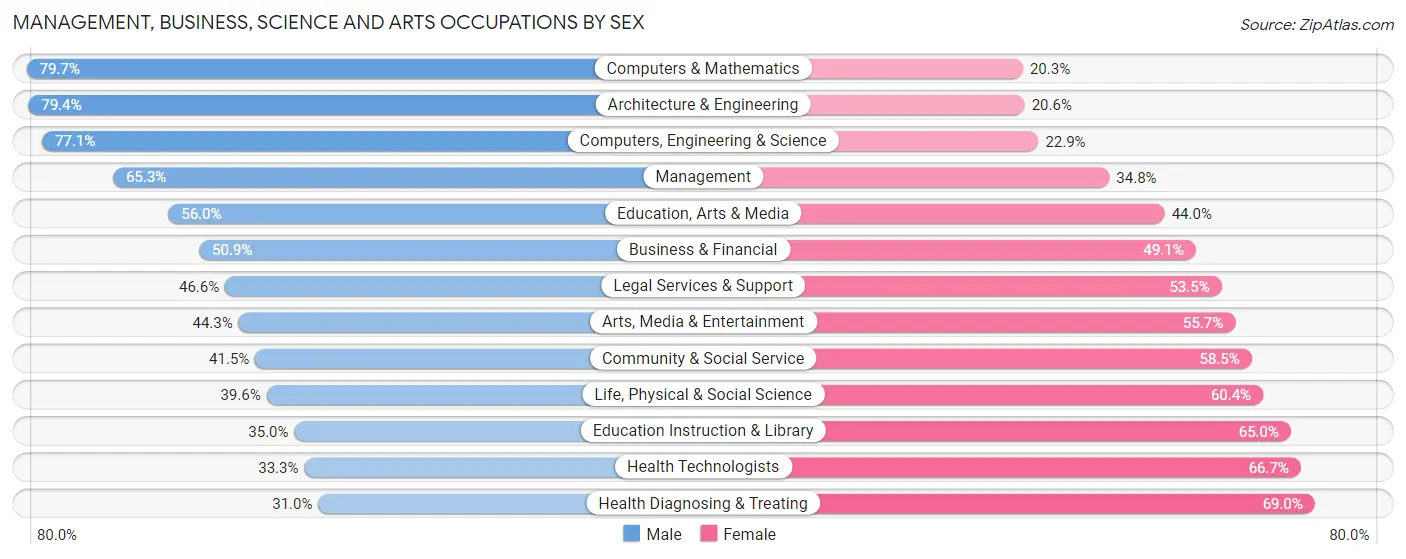
Management, Business, Science and Arts Occupations by Sex
Within the Management, Business, Science and Arts occupations in Los Gatos, the most male-oriented occupations are Computers & Mathematics (79.7%), Architecture & Engineering (79.4%), and Computers, Engineering & Science (77.1%), while the most female-oriented occupations are Health Diagnosing & Treating (69.0%), Health Technologists (66.7%), and Education Instruction & Library (65.0%).
| Occupation | Male | Female |
| Management | 2,434 (65.2%) | 1,296 (34.7%) |
| Business & Financial | 724 (50.9%) | 699 (49.1%) |
| Computers, Engineering & Science | 2,036 (77.1%) | 605 (22.9%) |
| Computers & Mathematics | 1,301 (79.7%) | 332 (20.3%) |
| Architecture & Engineering | 670 (79.4%) | 174 (20.6%) |
| Life, Physical & Social Science | 65 (39.6%) | 99 (60.4%) |
| Community & Social Service | 732 (41.5%) | 1,031 (58.5%) |
| Education, Arts & Media | 135 (56.0%) | 106 (44.0%) |
| Legal Services & Support | 155 (46.6%) | 178 (53.4%) |
| Education Instruction & Library | 318 (35.0%) | 591 (65.0%) |
| Arts, Media & Entertainment | 124 (44.3%) | 156 (55.7%) |
| Health Diagnosing & Treating | 295 (31.0%) | 657 (69.0%) |
| Health Technologists | 295 (33.3%) | 590 (66.7%) |
| Total (Category) | 6,221 (59.2%) | 4,288 (40.8%) |
| Total (Overall) | 8,852 (57.0%) | 6,683 (43.0%) |
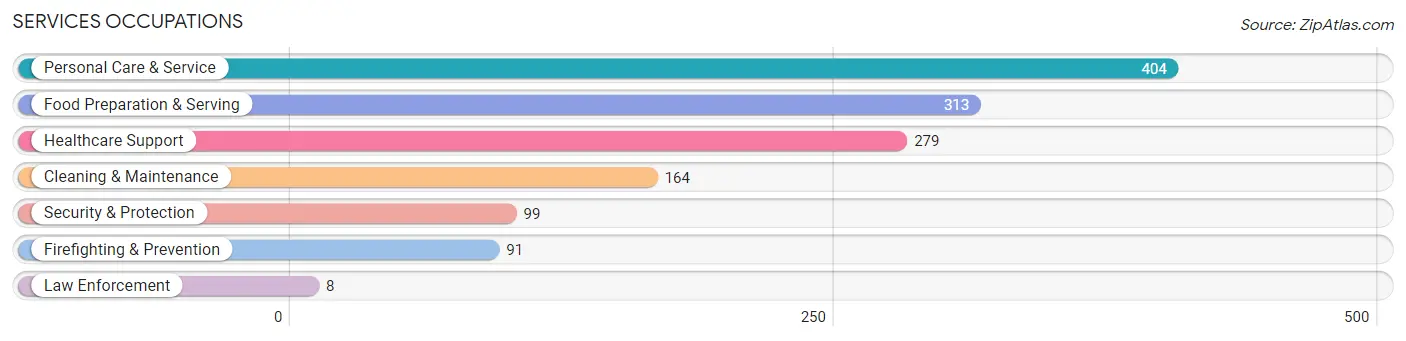
Services Occupations
The most common Services occupations in Los Gatos are Personal Care & Service (404 | 2.6%), Food Preparation & Serving (313 | 2.0%), Healthcare Support (279 | 1.8%), Cleaning & Maintenance (164 | 1.1%), and Security & Protection (99 | 0.6%).
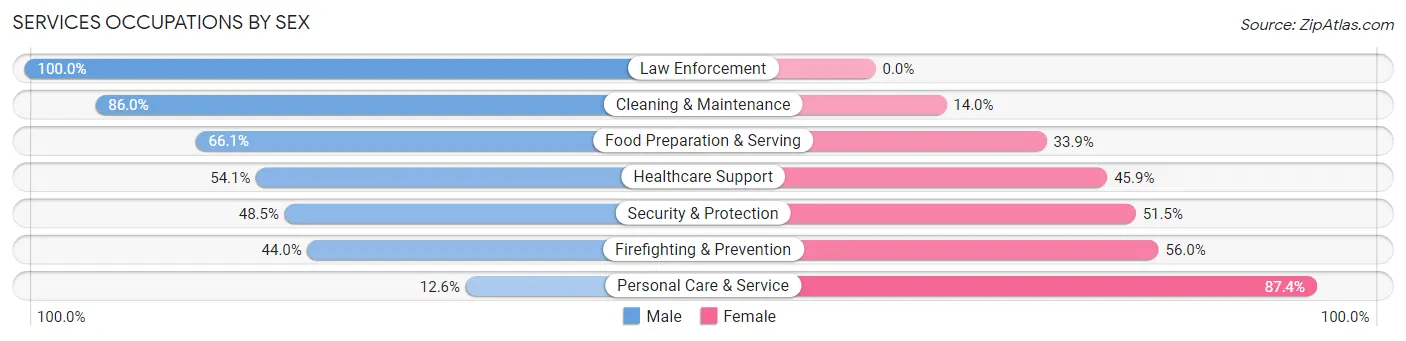
Services Occupations by Sex
Within the Services occupations in Los Gatos, the most male-oriented occupations are Law Enforcement (100.0%), Cleaning & Maintenance (86.0%), and Food Preparation & Serving (66.1%), while the most female-oriented occupations are Personal Care & Service (87.4%), Firefighting & Prevention (56.0%), and Security & Protection (51.5%).
| Occupation | Male | Female |
| Healthcare Support | 151 (54.1%) | 128 (45.9%) |
| Security & Protection | 48 (48.5%) | 51 (51.5%) |
| Firefighting & Prevention | 40 (44.0%) | 51 (56.0%) |
| Law Enforcement | 8 (100.0%) | 0 (0.0%) |
| Food Preparation & Serving | 207 (66.1%) | 106 (33.9%) |
| Cleaning & Maintenance | 141 (86.0%) | 23 (14.0%) |
| Personal Care & Service | 51 (12.6%) | 353 (87.4%) |
| Total (Category) | 598 (47.5%) | 661 (52.5%) |
| Total (Overall) | 8,852 (57.0%) | 6,683 (43.0%) |
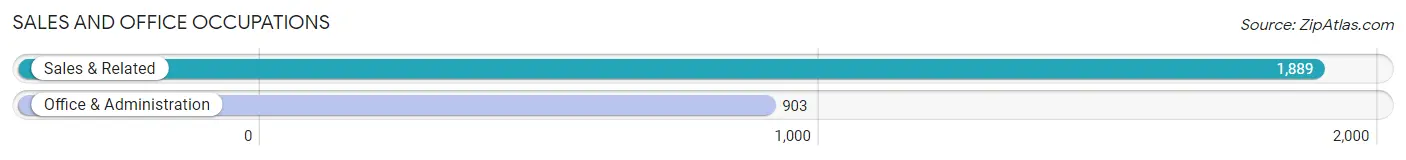
Sales and Office Occupations
The most common Sales and Office occupations in Los Gatos are Sales & Related (1,889 | 12.2%), and Office & Administration (903 | 5.8%).
Sales and Office Occupations by Sex
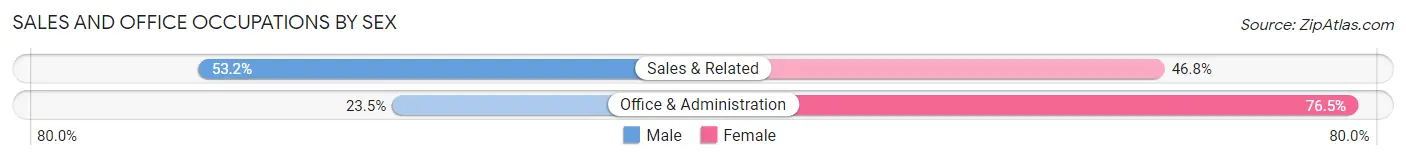
| Occupation | Male | Female |
| Sales & Related | 1,005 (53.2%) | 884 (46.8%) |
| Office & Administration | 212 (23.5%) | 691 (76.5%) |
| Total (Category) | 1,217 (43.6%) | 1,575 (56.4%) |
| Total (Overall) | 8,852 (57.0%) | 6,683 (43.0%) |
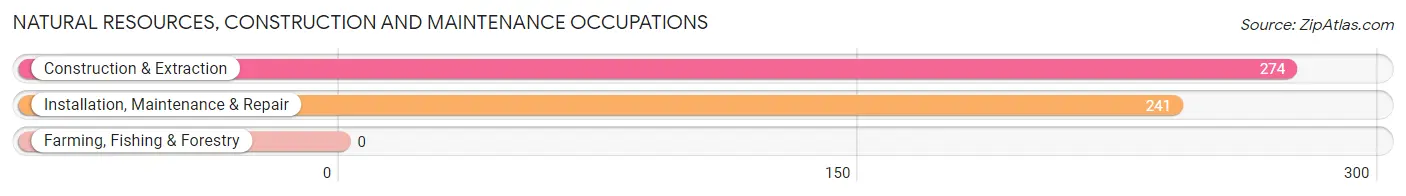
Natural Resources, Construction and Maintenance Occupations
The most common Natural Resources, Construction and Maintenance occupations in Los Gatos are Construction & Extraction (274 | 1.8%), and Installation, Maintenance & Repair (241 | 1.5%).
Natural Resources, Construction and Maintenance Occupations by Sex
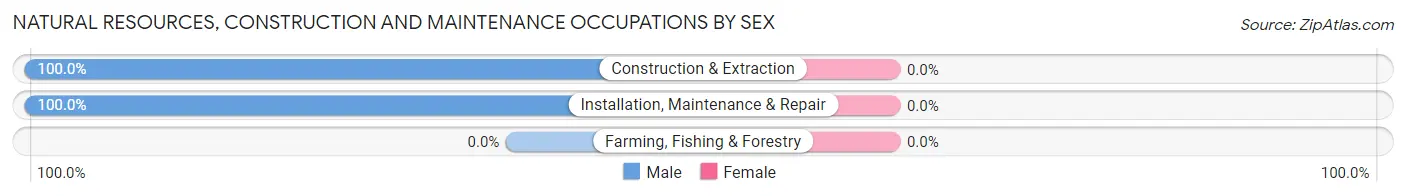
| Occupation | Male | Female |
| Farming, Fishing & Forestry | 0 (0.0%) | 0 (0.0%) |
| Construction & Extraction | 274 (100.0%) | 0 (0.0%) |
| Installation, Maintenance & Repair | 241 (100.0%) | 0 (0.0%) |
| Total (Category) | 515 (100.0%) | 0 (0.0%) |
| Total (Overall) | 8,852 (57.0%) | 6,683 (43.0%) |
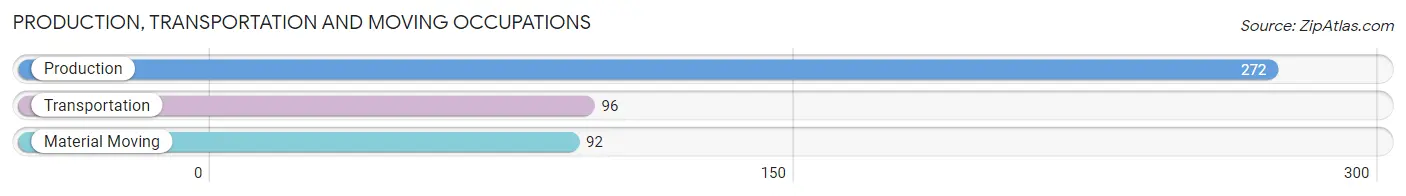
Production, Transportation and Moving Occupations
The most common Production, Transportation and Moving occupations in Los Gatos are Production (272 | 1.8%), Transportation (96 | 0.6%), and Material Moving (92 | 0.6%).
Production, Transportation and Moving Occupations by Sex
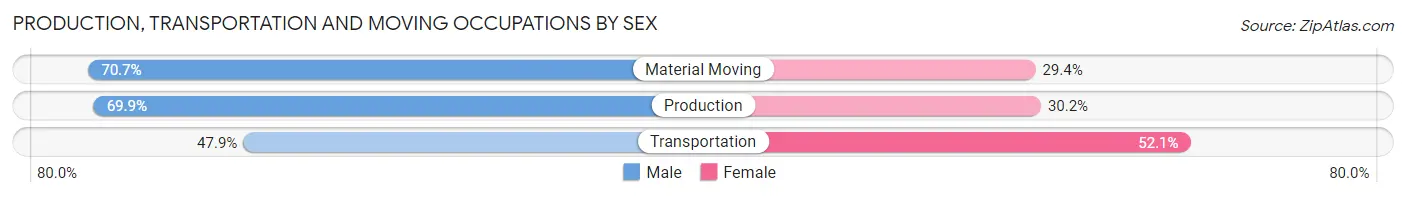
| Occupation | Male | Female |
| Production | 190 (69.9%) | 82 (30.1%) |
| Transportation | 46 (47.9%) | 50 (52.1%) |
| Material Moving | 65 (70.7%) | 27 (29.3%) |
| Total (Category) | 301 (65.4%) | 159 (34.6%) |
| Total (Overall) | 8,852 (57.0%) | 6,683 (43.0%) |
Employment Industries by Sex in Los Gatos
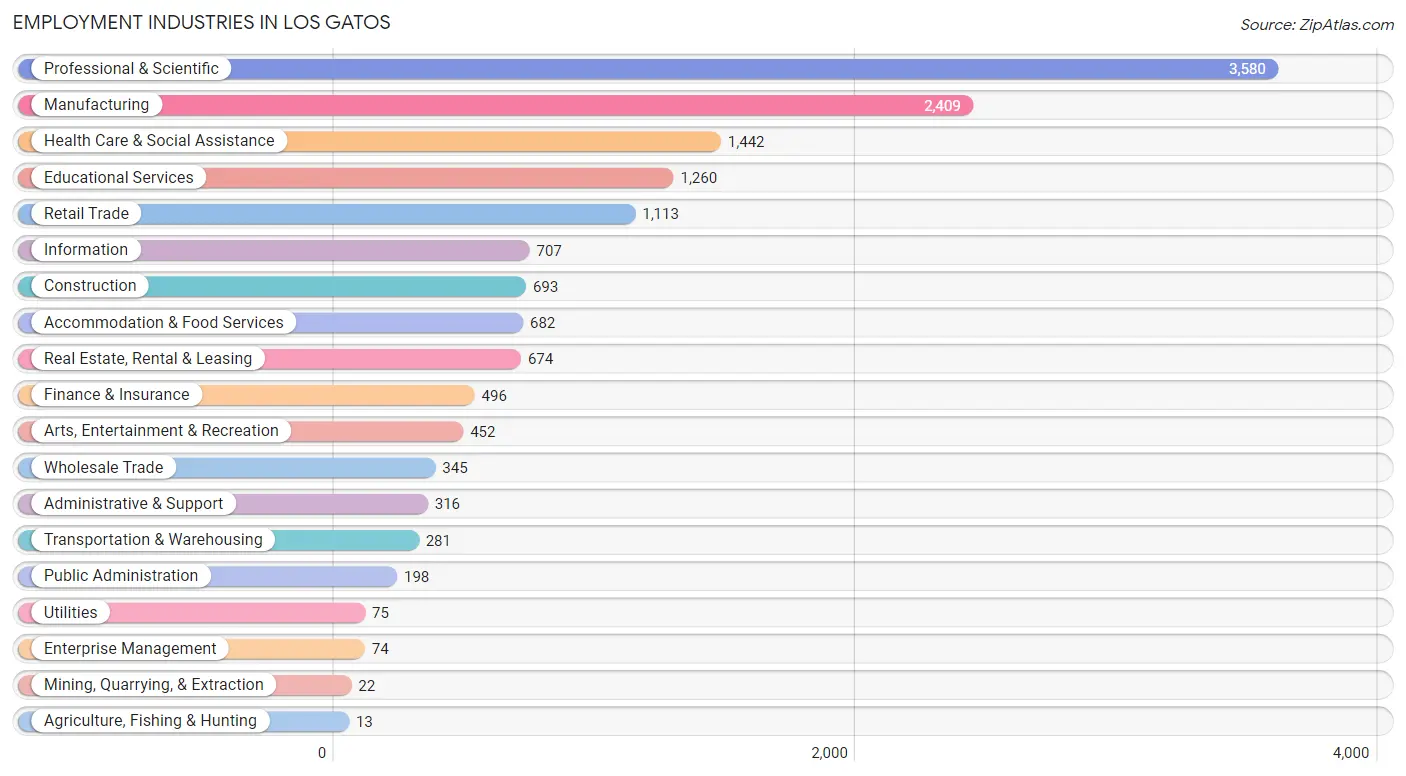
Employment Industries in Los Gatos
The major employment industries in Los Gatos include Professional & Scientific (3,580 | 23.0%), Manufacturing (2,409 | 15.5%), Health Care & Social Assistance (1,442 | 9.3%), Educational Services (1,260 | 8.1%), and Retail Trade (1,113 | 7.2%).
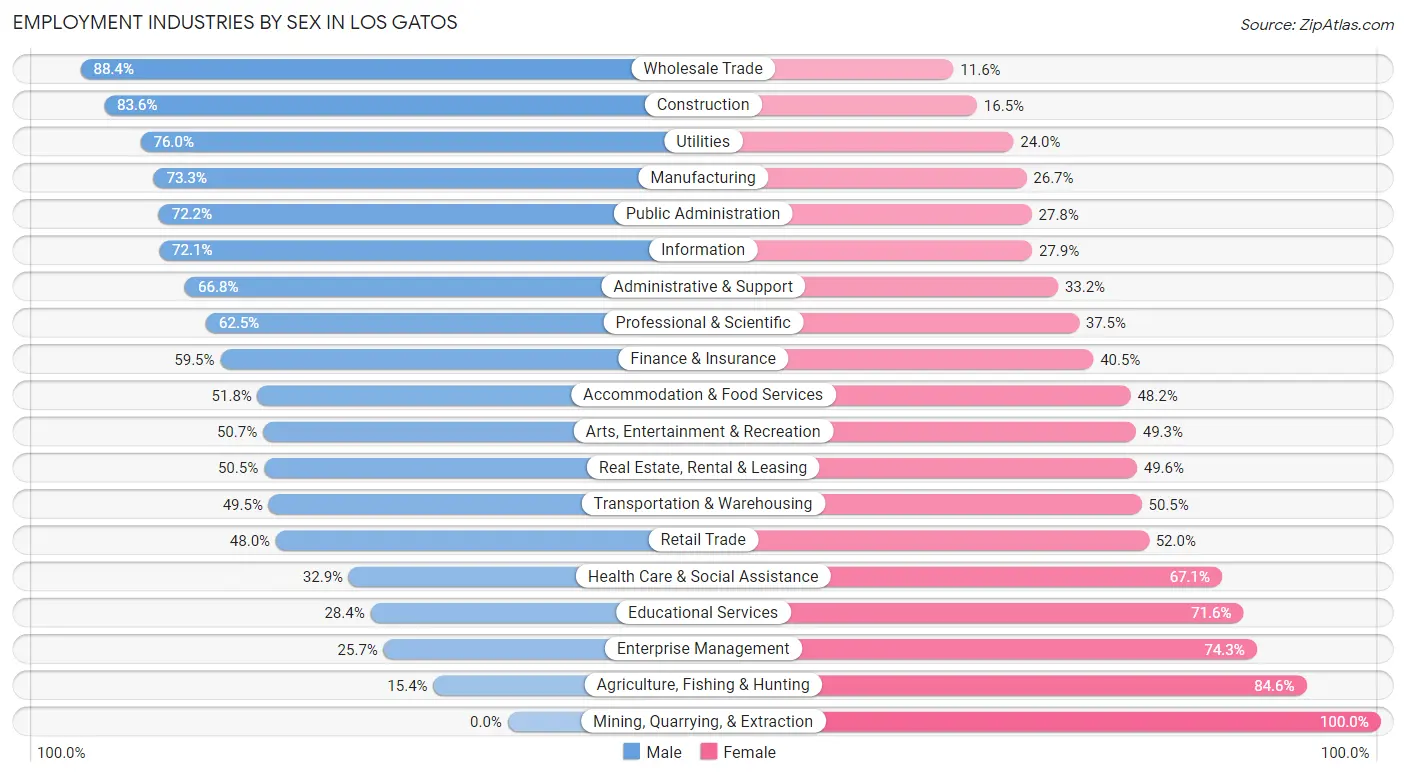
Employment Industries by Sex in Los Gatos
The Los Gatos industries that see more men than women are Wholesale Trade (88.4%), Construction (83.6%), and Utilities (76.0%), whereas the industries that tend to have a higher number of women are Mining, Quarrying, & Extraction (100.0%), Agriculture, Fishing & Hunting (84.6%), and Enterprise Management (74.3%).
| Industry | Male | Female |
| Agriculture, Fishing & Hunting | 2 (15.4%) | 11 (84.6%) |
| Mining, Quarrying, & Extraction | 0 (0.0%) | 22 (100.0%) |
| Construction | 579 (83.6%) | 114 (16.5%) |
| Manufacturing | 1,766 (73.3%) | 643 (26.7%) |
| Wholesale Trade | 305 (88.4%) | 40 (11.6%) |
| Retail Trade | 534 (48.0%) | 579 (52.0%) |
| Transportation & Warehousing | 139 (49.5%) | 142 (50.5%) |
| Utilities | 57 (76.0%) | 18 (24.0%) |
| Information | 510 (72.1%) | 197 (27.9%) |
| Finance & Insurance | 295 (59.5%) | 201 (40.5%) |
| Real Estate, Rental & Leasing | 340 (50.4%) | 334 (49.5%) |
| Professional & Scientific | 2,236 (62.5%) | 1,344 (37.5%) |
| Enterprise Management | 19 (25.7%) | 55 (74.3%) |
| Administrative & Support | 211 (66.8%) | 105 (33.2%) |
| Educational Services | 358 (28.4%) | 902 (71.6%) |
| Health Care & Social Assistance | 474 (32.9%) | 968 (67.1%) |
| Arts, Entertainment & Recreation | 229 (50.7%) | 223 (49.3%) |
| Accommodation & Food Services | 353 (51.8%) | 329 (48.2%) |
| Public Administration | 143 (72.2%) | 55 (27.8%) |
| Total | 8,852 (57.0%) | 6,683 (43.0%) |
Education in Los Gatos
School Enrollment in Los Gatos
The most common levels of schooling among the 8,576 students in Los Gatos are middle school (2,125 | 24.8%), high school (2,103 | 24.5%), and college / undergraduate (1,571 | 18.3%).
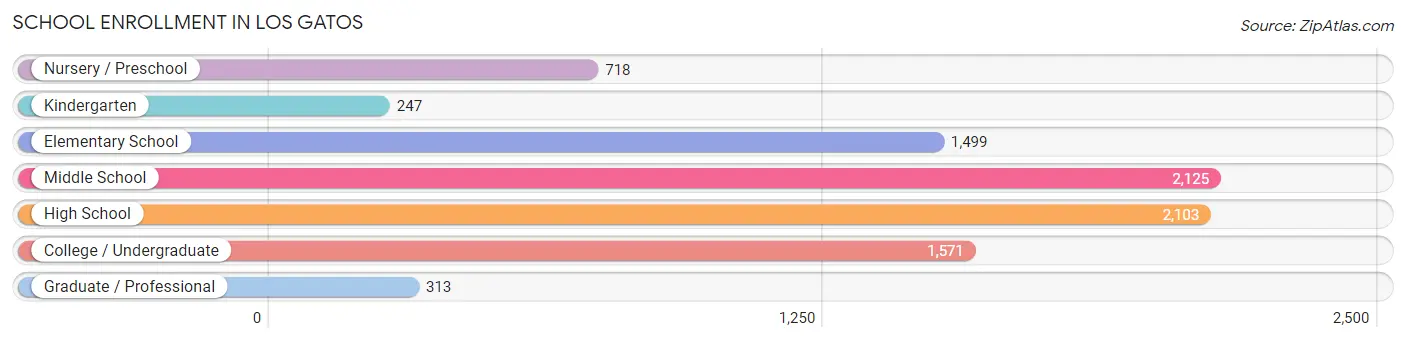
| School Level | # Students | % Students |
| Nursery / Preschool | 718 | 8.4% |
| Kindergarten | 247 | 2.9% |
| Elementary School | 1,499 | 17.5% |
| Middle School | 2,125 | 24.8% |
| High School | 2,103 | 24.5% |
| College / Undergraduate | 1,571 | 18.3% |
| Graduate / Professional | 313 | 3.6% |
| Total | 8,576 | 100.0% |
School Enrollment by Age by Funding Source in Los Gatos
Out of a total of 8,576 students who are enrolled in schools in Los Gatos, 2,213 (25.8%) attend a private institution, while the remaining 6,363 (74.2%) are enrolled in public schools. The age group of 3 to 4 year olds has the highest likelihood of being enrolled in private schools, with 456 (89.9% in the age bracket) enrolled. Conversely, the age group of 35 years and over has the lowest likelihood of being enrolled in a private school, with 458 (86.9% in the age bracket) attending a public institution.
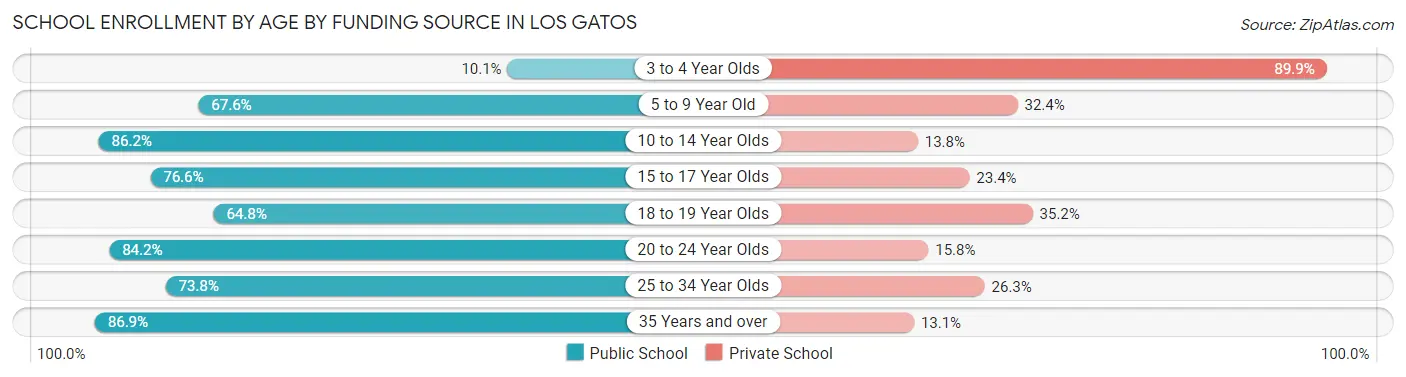
| Age Bracket | Public School | Private School |
| 3 to 4 Year Olds | 51 (10.1%) | 456 (89.9%) |
| 5 to 9 Year Old | 1,163 (67.6%) | 557 (32.4%) |
| 10 to 14 Year Olds | 2,374 (86.2%) | 380 (13.8%) |
| 15 to 17 Year Olds | 1,154 (76.6%) | 353 (23.4%) |
| 18 to 19 Year Olds | 385 (64.8%) | 209 (35.2%) |
| 20 to 24 Year Olds | 545 (84.2%) | 102 (15.8%) |
| 25 to 34 Year Olds | 236 (73.8%) | 84 (26.3%) |
| 35 Years and over | 458 (86.9%) | 69 (13.1%) |
| Total | 6,363 (74.2%) | 2,213 (25.8%) |
Educational Attainment by Field of Study in Los Gatos
Engineering (3,729 | 19.8%), business (3,221 | 17.1%), social sciences (2,041 | 10.9%), computers & mathematics (1,516 | 8.1%), and science & technology (1,203 | 6.4%) are the most common fields of study among 18,794 individuals in Los Gatos who have obtained a bachelor's degree or higher.
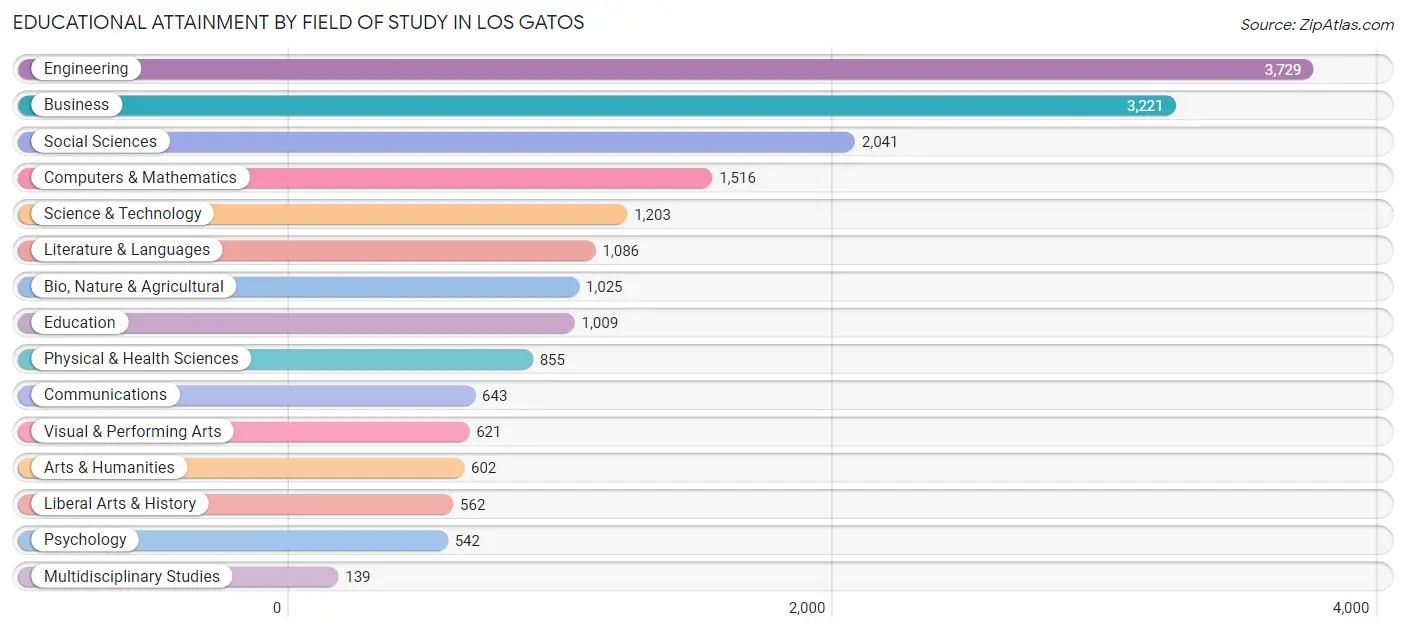
| Field of Study | # Graduates | % Graduates |
| Computers & Mathematics | 1,516 | 8.1% |
| Bio, Nature & Agricultural | 1,025 | 5.4% |
| Physical & Health Sciences | 855 | 4.5% |
| Psychology | 542 | 2.9% |
| Social Sciences | 2,041 | 10.9% |
| Engineering | 3,729 | 19.8% |
| Multidisciplinary Studies | 139 | 0.7% |
| Science & Technology | 1,203 | 6.4% |
| Business | 3,221 | 17.1% |
| Education | 1,009 | 5.4% |
| Literature & Languages | 1,086 | 5.8% |
| Liberal Arts & History | 562 | 3.0% |
| Visual & Performing Arts | 621 | 3.3% |
| Communications | 643 | 3.4% |
| Arts & Humanities | 602 | 3.2% |
| Total | 18,794 | 100.0% |
Transportation & Commute in Los Gatos
Vehicle Availability by Sex in Los Gatos
The most prevalent vehicle ownership categories in Los Gatos are males with 2 vehicles (4,312, accounting for 49.4%) and females with 2 vehicles (3,148, making up 67.0%).
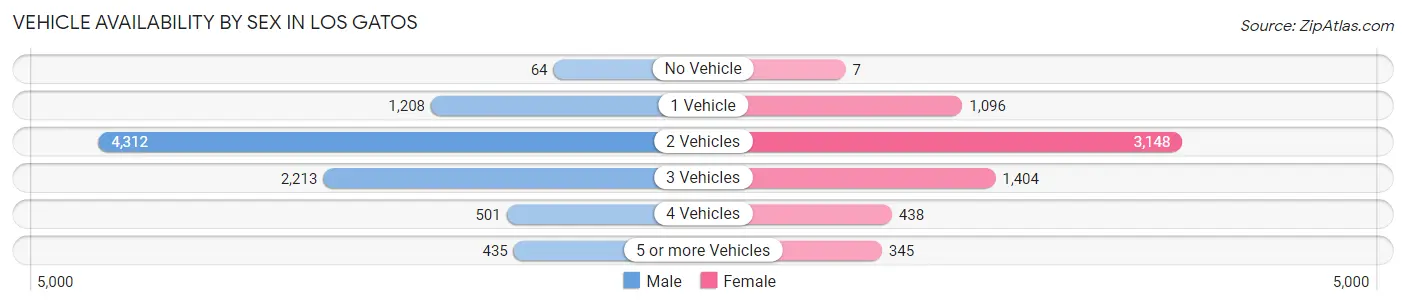
| Vehicles Available | Male | Female |
| No Vehicle | 64 (0.7%) | 7 (0.1%) |
| 1 Vehicle | 1,208 (13.8%) | 1,096 (17.0%) |
| 2 Vehicles | 4,312 (49.4%) | 3,148 (48.9%) |
| 3 Vehicles | 2,213 (25.3%) | 1,404 (21.8%) |
| 4 Vehicles | 501 (5.7%) | 438 (6.8%) |
| 5 or more Vehicles | 435 (5.0%) | 345 (5.4%) |
| Total | 8,733 (100.0%) | 6,438 (100.0%) |
Commute Time in Los Gatos
The most frequently occuring commute durations in Los Gatos are 30 to 34 minutes (1,945 commuters, 17.5%), 20 to 24 minutes (1,678 commuters, 15.1%), and 15 to 19 minutes (1,290 commuters, 11.6%).
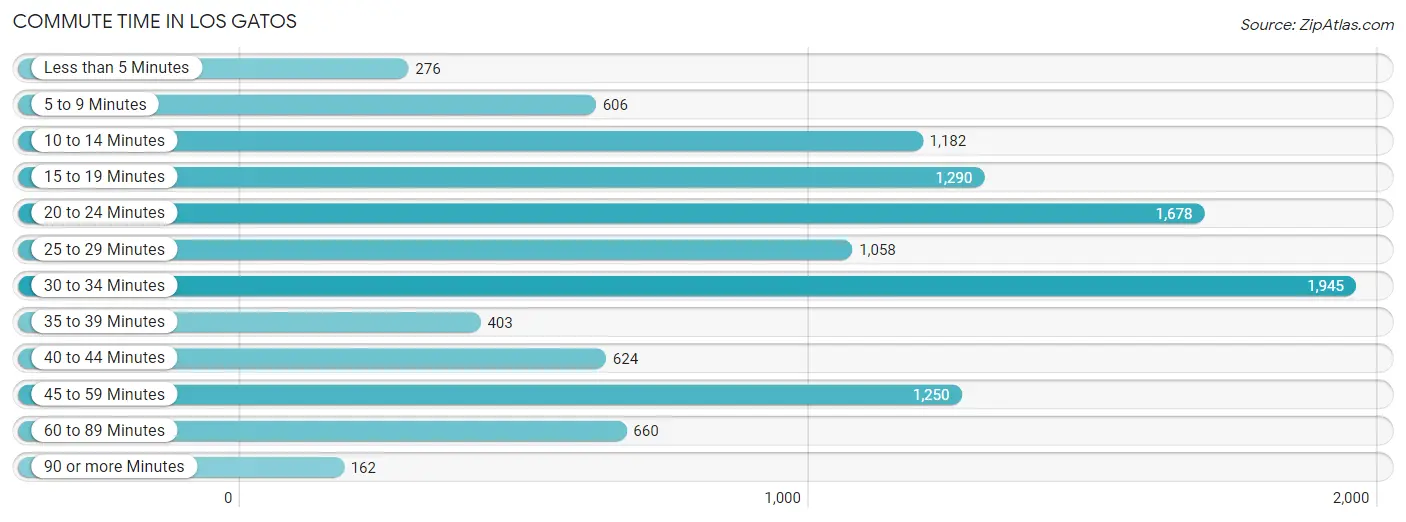
| Commute Time | # Commuters | % Commuters |
| Less than 5 Minutes | 276 | 2.5% |
| 5 to 9 Minutes | 606 | 5.4% |
| 10 to 14 Minutes | 1,182 | 10.6% |
| 15 to 19 Minutes | 1,290 | 11.6% |
| 20 to 24 Minutes | 1,678 | 15.1% |
| 25 to 29 Minutes | 1,058 | 9.5% |
| 30 to 34 Minutes | 1,945 | 17.5% |
| 35 to 39 Minutes | 403 | 3.6% |
| 40 to 44 Minutes | 624 | 5.6% |
| 45 to 59 Minutes | 1,250 | 11.2% |
| 60 to 89 Minutes | 660 | 5.9% |
| 90 or more Minutes | 162 | 1.5% |
Commute Time by Sex in Los Gatos
The most common commute times in Los Gatos are 30 to 34 minutes (1,279 commuters, 19.5%) for males and 10 to 14 minutes (734 commuters, 16.1%) for females.
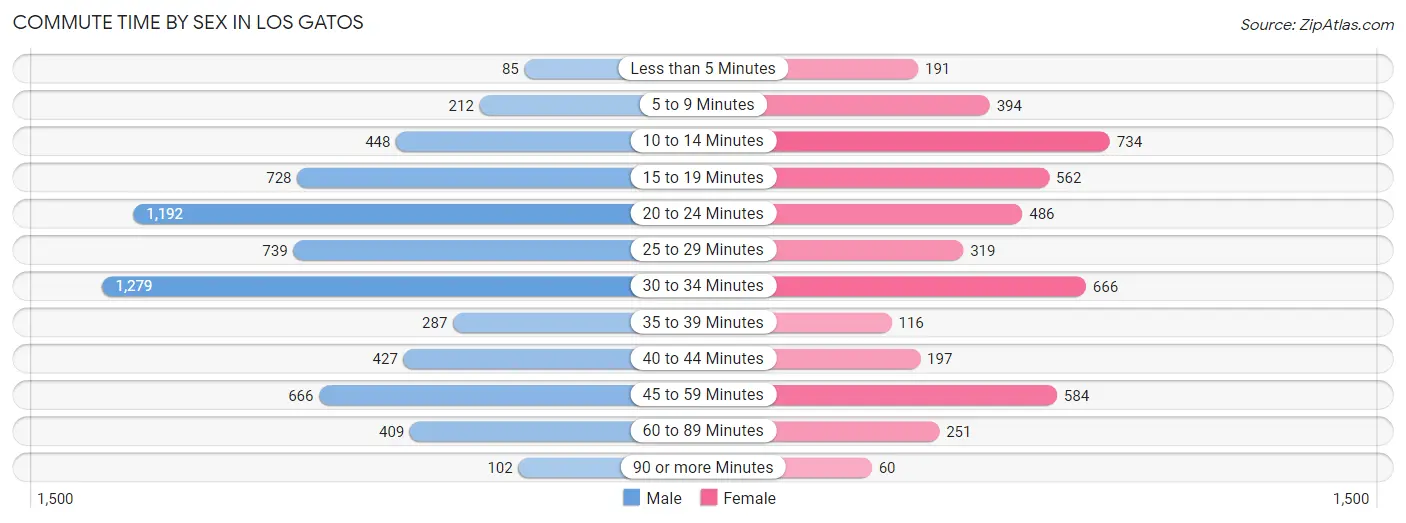
| Commute Time | Male | Female |
| Less than 5 Minutes | 85 (1.3%) | 191 (4.2%) |
| 5 to 9 Minutes | 212 (3.2%) | 394 (8.6%) |
| 10 to 14 Minutes | 448 (6.8%) | 734 (16.1%) |
| 15 to 19 Minutes | 728 (11.1%) | 562 (12.3%) |
| 20 to 24 Minutes | 1,192 (18.1%) | 486 (10.7%) |
| 25 to 29 Minutes | 739 (11.2%) | 319 (7.0%) |
| 30 to 34 Minutes | 1,279 (19.5%) | 666 (14.6%) |
| 35 to 39 Minutes | 287 (4.4%) | 116 (2.5%) |
| 40 to 44 Minutes | 427 (6.5%) | 197 (4.3%) |
| 45 to 59 Minutes | 666 (10.1%) | 584 (12.8%) |
| 60 to 89 Minutes | 409 (6.2%) | 251 (5.5%) |
| 90 or more Minutes | 102 (1.5%) | 60 (1.3%) |
Time of Departure to Work by Sex in Los Gatos
The most frequent times of departure to work in Los Gatos are 8:00 AM to 8:29 AM (1,400, 21.3%) for males and 8:00 AM to 8:29 AM (778, 17.1%) for females.
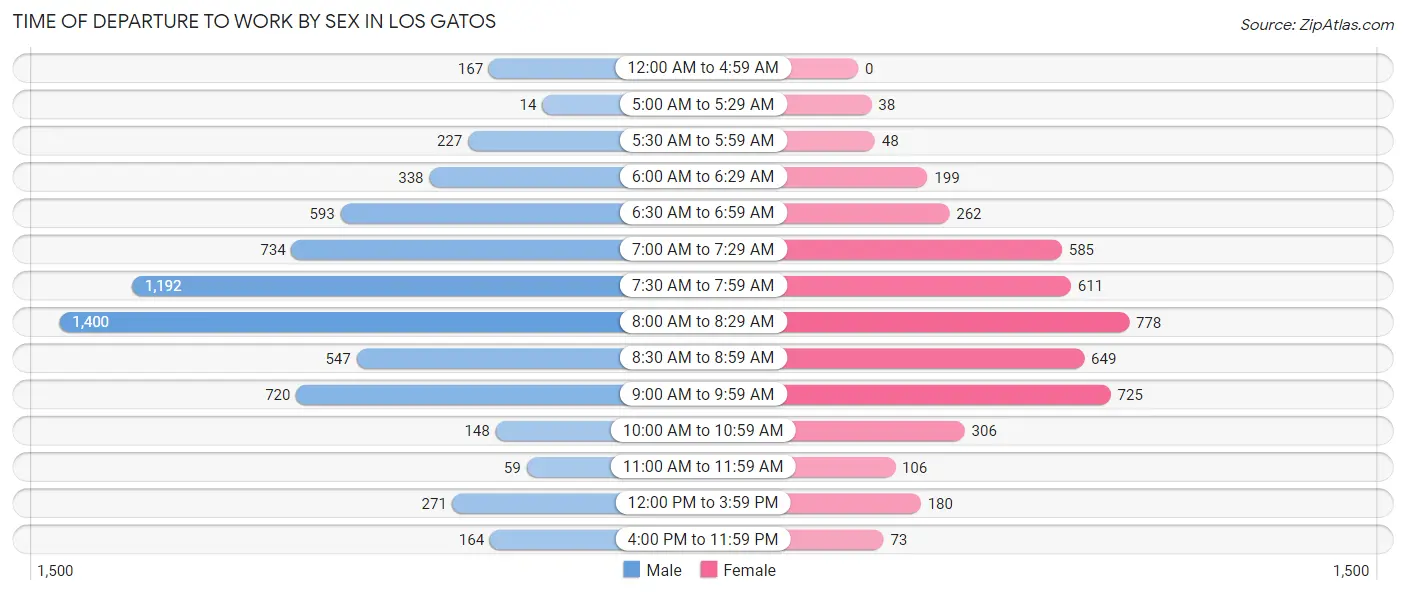
| Time of Departure | Male | Female |
| 12:00 AM to 4:59 AM | 167 (2.5%) | 0 (0.0%) |
| 5:00 AM to 5:29 AM | 14 (0.2%) | 38 (0.8%) |
| 5:30 AM to 5:59 AM | 227 (3.5%) | 48 (1.1%) |
| 6:00 AM to 6:29 AM | 338 (5.1%) | 199 (4.4%) |
| 6:30 AM to 6:59 AM | 593 (9.0%) | 262 (5.8%) |
| 7:00 AM to 7:29 AM | 734 (11.2%) | 585 (12.8%) |
| 7:30 AM to 7:59 AM | 1,192 (18.1%) | 611 (13.4%) |
| 8:00 AM to 8:29 AM | 1,400 (21.3%) | 778 (17.1%) |
| 8:30 AM to 8:59 AM | 547 (8.3%) | 649 (14.2%) |
| 9:00 AM to 9:59 AM | 720 (11.0%) | 725 (15.9%) |
| 10:00 AM to 10:59 AM | 148 (2.2%) | 306 (6.7%) |
| 11:00 AM to 11:59 AM | 59 (0.9%) | 106 (2.3%) |
| 12:00 PM to 3:59 PM | 271 (4.1%) | 180 (4.0%) |
| 4:00 PM to 11:59 PM | 164 (2.5%) | 73 (1.6%) |
| Total | 6,574 (100.0%) | 4,560 (100.0%) |
Housing Occupancy in Los Gatos
Occupancy by Ownership in Los Gatos
Of the total 12,855 dwellings in Los Gatos, owner-occupied units account for 8,261 (64.3%), while renter-occupied units make up 4,594 (35.7%).
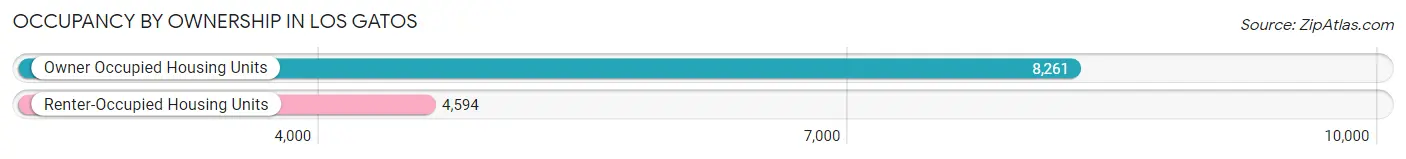
| Occupancy | # Housing Units | % Housing Units |
| Owner Occupied Housing Units | 8,261 | 64.3% |
| Renter-Occupied Housing Units | 4,594 | 35.7% |
| Total Occupied Housing Units | 12,855 | 100.0% |
Occupancy by Household Size in Los Gatos
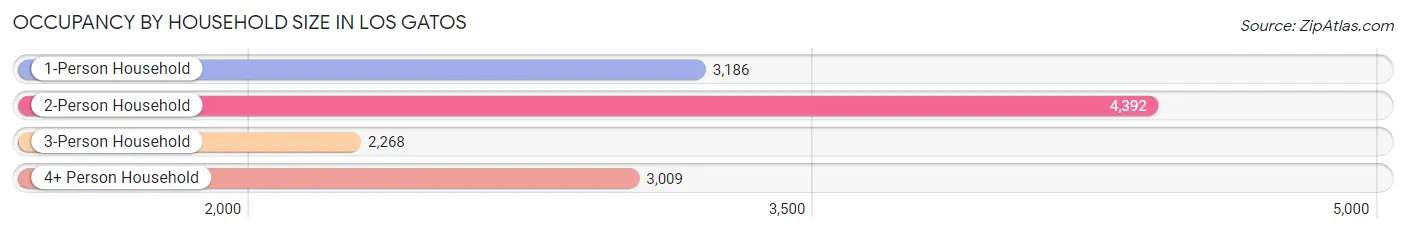
| Household Size | # Housing Units | % Housing Units |
| 1-Person Household | 3,186 | 24.8% |
| 2-Person Household | 4,392 | 34.2% |
| 3-Person Household | 2,268 | 17.6% |
| 4+ Person Household | 3,009 | 23.4% |
| Total Housing Units | 12,855 | 100.0% |
Occupancy by Ownership by Household Size in Los Gatos
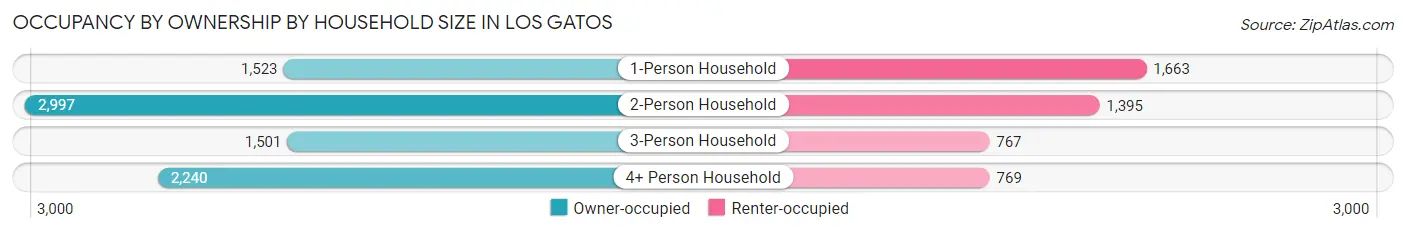
| Household Size | Owner-occupied | Renter-occupied |
| 1-Person Household | 1,523 (47.8%) | 1,663 (52.2%) |
| 2-Person Household | 2,997 (68.2%) | 1,395 (31.8%) |
| 3-Person Household | 1,501 (66.2%) | 767 (33.8%) |
| 4+ Person Household | 2,240 (74.4%) | 769 (25.6%) |
| Total Housing Units | 8,261 (64.3%) | 4,594 (35.7%) |
Occupancy by Educational Attainment in Los Gatos
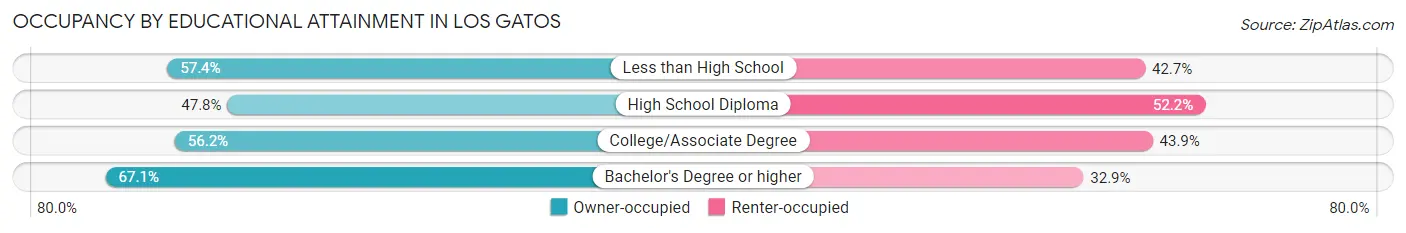
| Household Size | Owner-occupied | Renter-occupied |
| Less than High School | 78 (57.4%) | 58 (42.6%) |
| High School Diploma | 299 (47.8%) | 326 (52.2%) |
| College/Associate Degree | 1,205 (56.1%) | 941 (43.9%) |
| Bachelor's Degree or higher | 6,679 (67.1%) | 3,269 (32.9%) |
Occupancy by Age of Householder in Los Gatos
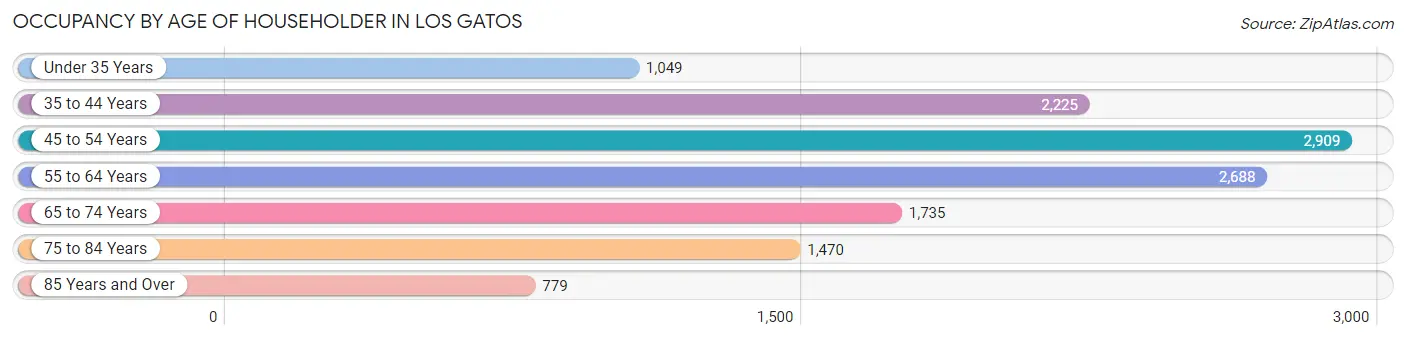
| Age Bracket | # Households | % Households |
| Under 35 Years | 1,049 | 8.2% |
| 35 to 44 Years | 2,225 | 17.3% |
| 45 to 54 Years | 2,909 | 22.6% |
| 55 to 64 Years | 2,688 | 20.9% |
| 65 to 74 Years | 1,735 | 13.5% |
| 75 to 84 Years | 1,470 | 11.4% |
| 85 Years and Over | 779 | 6.1% |
| Total | 12,855 | 100.0% |
Housing Finances in Los Gatos
Median Income by Occupancy in Los Gatos
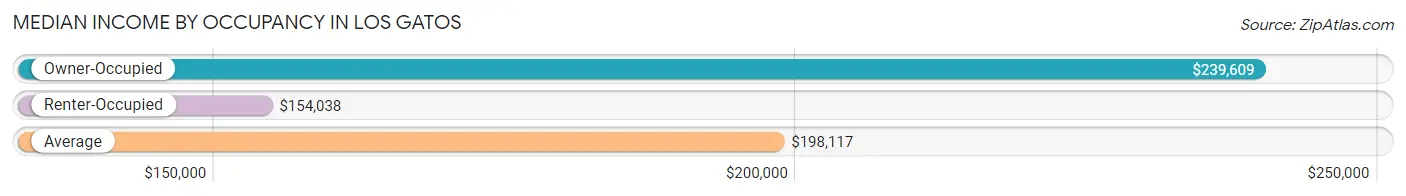
| Occupancy Type | # Households | Median Income |
| Owner-Occupied | 8,261 (64.3%) | $239,609 |
| Renter-Occupied | 4,594 (35.7%) | $154,038 |
| Average | 12,855 (100.0%) | $198,117 |
Occupancy by Householder Income Bracket in Los Gatos
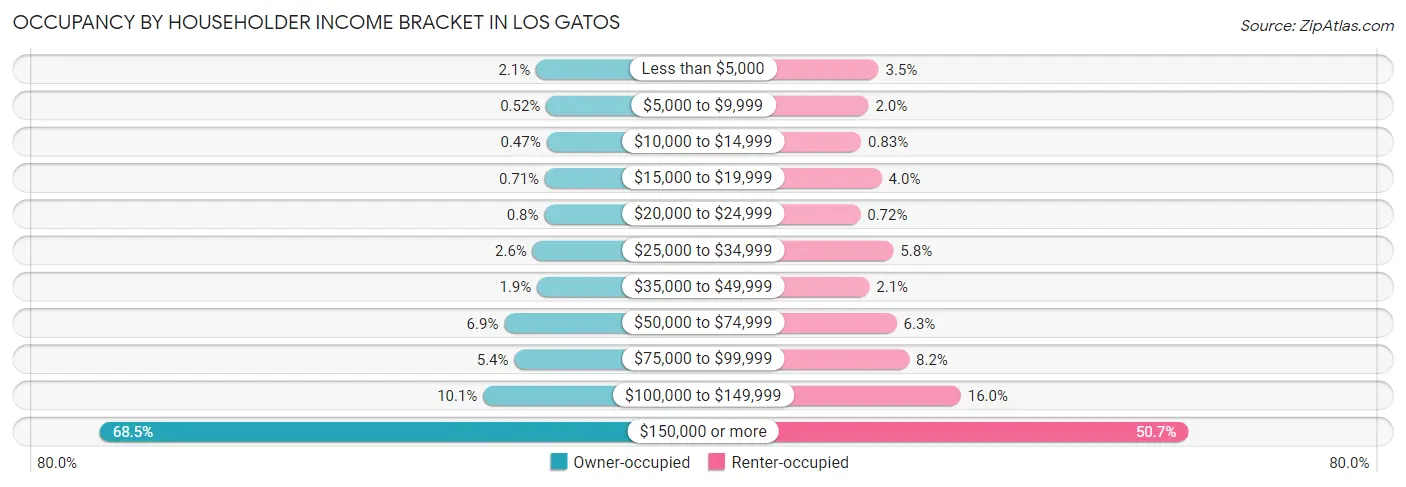
| Income Bracket | Owner-occupied | Renter-occupied |
| Less than $5,000 | 171 (2.1%) | 161 (3.5%) |
| $5,000 to $9,999 | 43 (0.5%) | 91 (2.0%) |
| $10,000 to $14,999 | 39 (0.5%) | 38 (0.8%) |
| $15,000 to $19,999 | 59 (0.7%) | 183 (4.0%) |
| $20,000 to $24,999 | 66 (0.8%) | 33 (0.7%) |
| $25,000 to $34,999 | 213 (2.6%) | 265 (5.8%) |
| $35,000 to $49,999 | 157 (1.9%) | 97 (2.1%) |
| $50,000 to $74,999 | 571 (6.9%) | 287 (6.2%) |
| $75,000 to $99,999 | 444 (5.4%) | 375 (8.2%) |
| $100,000 to $149,999 | 836 (10.1%) | 737 (16.0%) |
| $150,000 or more | 5,662 (68.5%) | 2,327 (50.6%) |
| Total | 8,261 (100.0%) | 4,594 (100.0%) |
Monthly Housing Cost Tiers in Los Gatos
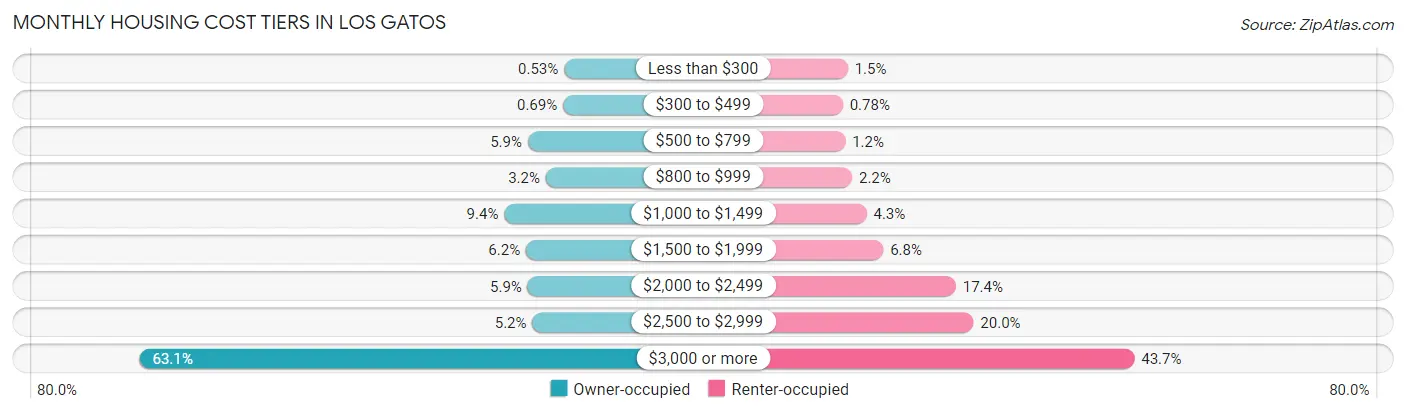
| Monthly Cost | Owner-occupied | Renter-occupied |
| Less than $300 | 44 (0.5%) | 70 (1.5%) |
| $300 to $499 | 57 (0.7%) | 36 (0.8%) |
| $500 to $799 | 486 (5.9%) | 53 (1.1%) |
| $800 to $999 | 267 (3.2%) | 99 (2.1%) |
| $1,000 to $1,499 | 772 (9.3%) | 197 (4.3%) |
| $1,500 to $1,999 | 508 (6.1%) | 310 (6.8%) |
| $2,000 to $2,499 | 487 (5.9%) | 801 (17.4%) |
| $2,500 to $2,999 | 430 (5.2%) | 920 (20.0%) |
| $3,000 or more | 5,210 (63.1%) | 2,009 (43.7%) |
| Total | 8,261 (100.0%) | 4,594 (100.0%) |
Physical Housing Characteristics in Los Gatos
Housing Structures in Los Gatos
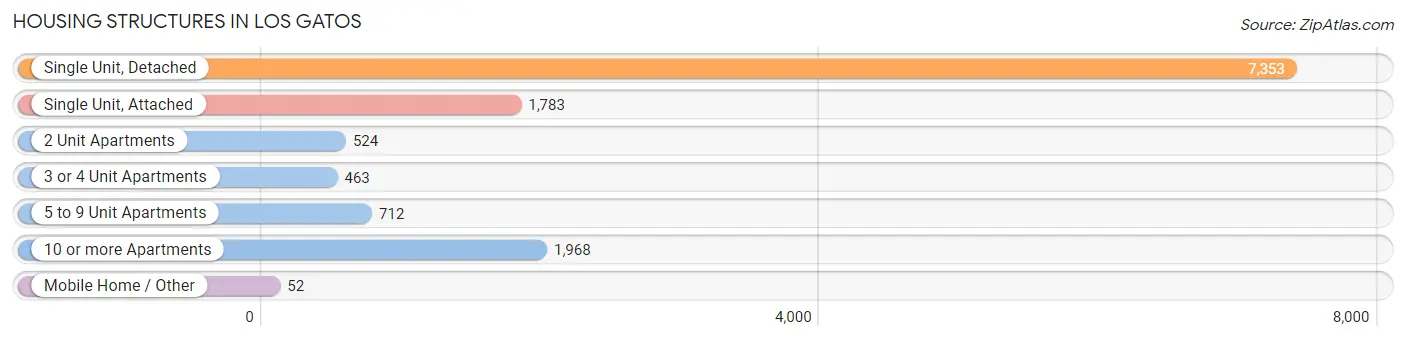
| Structure Type | # Housing Units | % Housing Units |
| Single Unit, Detached | 7,353 | 57.2% |
| Single Unit, Attached | 1,783 | 13.9% |
| 2 Unit Apartments | 524 | 4.1% |
| 3 or 4 Unit Apartments | 463 | 3.6% |
| 5 to 9 Unit Apartments | 712 | 5.5% |
| 10 or more Apartments | 1,968 | 15.3% |
| Mobile Home / Other | 52 | 0.4% |
| Total | 12,855 | 100.0% |
Housing Structures by Occupancy in Los Gatos
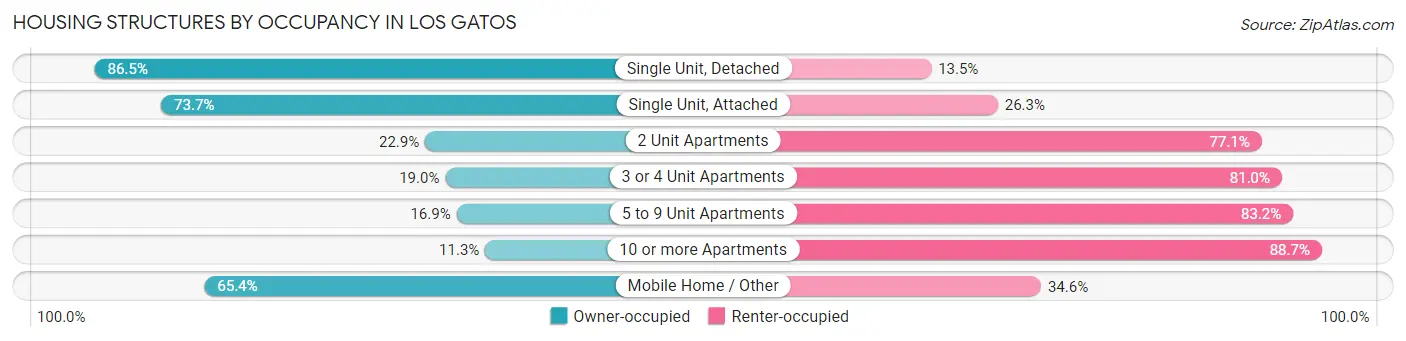
| Structure Type | Owner-occupied | Renter-occupied |
| Single Unit, Detached | 6,362 (86.5%) | 991 (13.5%) |
| Single Unit, Attached | 1,314 (73.7%) | 469 (26.3%) |
| 2 Unit Apartments | 120 (22.9%) | 404 (77.1%) |
| 3 or 4 Unit Apartments | 88 (19.0%) | 375 (81.0%) |
| 5 to 9 Unit Apartments | 120 (16.9%) | 592 (83.2%) |
| 10 or more Apartments | 223 (11.3%) | 1,745 (88.7%) |
| Mobile Home / Other | 34 (65.4%) | 18 (34.6%) |
| Total | 8,261 (64.3%) | 4,594 (35.7%) |
Housing Structures by Number of Rooms in Los Gatos
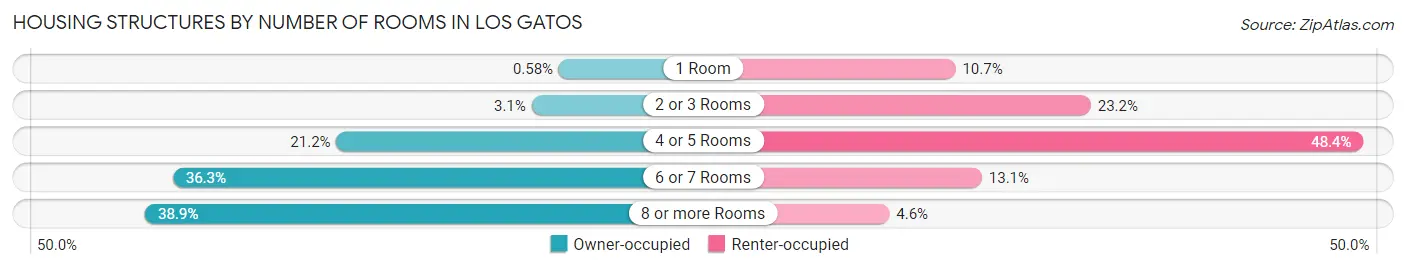
| Number of Rooms | Owner-occupied | Renter-occupied |
| 1 Room | 48 (0.6%) | 491 (10.7%) |
| 2 or 3 Rooms | 257 (3.1%) | 1,066 (23.2%) |
| 4 or 5 Rooms | 1,748 (21.2%) | 2,224 (48.4%) |
| 6 or 7 Rooms | 2,998 (36.3%) | 603 (13.1%) |
| 8 or more Rooms | 3,210 (38.9%) | 210 (4.6%) |
| Total | 8,261 (100.0%) | 4,594 (100.0%) |
Housing Structure by Heating Type in Los Gatos
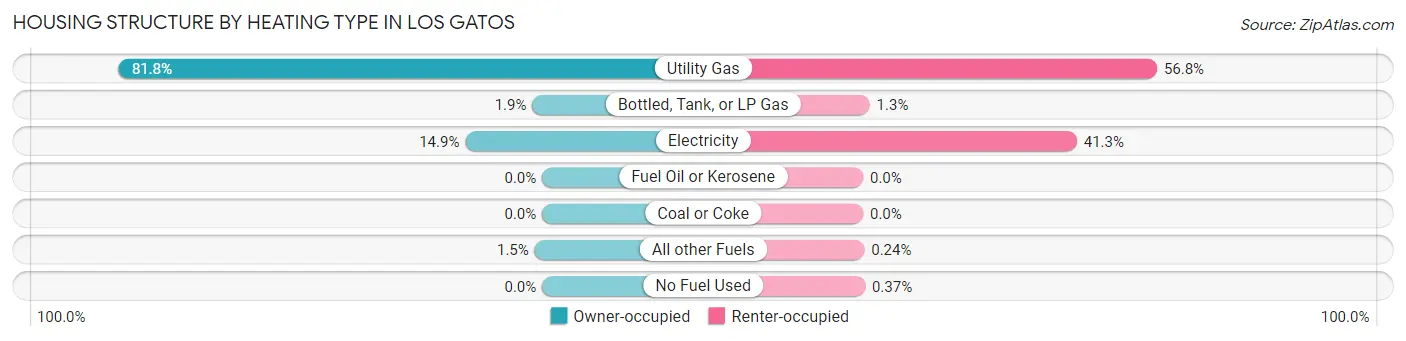
| Heating Type | Owner-occupied | Renter-occupied |
| Utility Gas | 6,757 (81.8%) | 2,609 (56.8%) |
| Bottled, Tank, or LP Gas | 157 (1.9%) | 59 (1.3%) |
| Electricity | 1,227 (14.8%) | 1,898 (41.3%) |
| Fuel Oil or Kerosene | 0 (0.0%) | 0 (0.0%) |
| Coal or Coke | 0 (0.0%) | 0 (0.0%) |
| All other Fuels | 120 (1.5%) | 11 (0.2%) |
| No Fuel Used | 0 (0.0%) | 17 (0.4%) |
| Total | 8,261 (100.0%) | 4,594 (100.0%) |
Household Vehicle Usage in Los Gatos
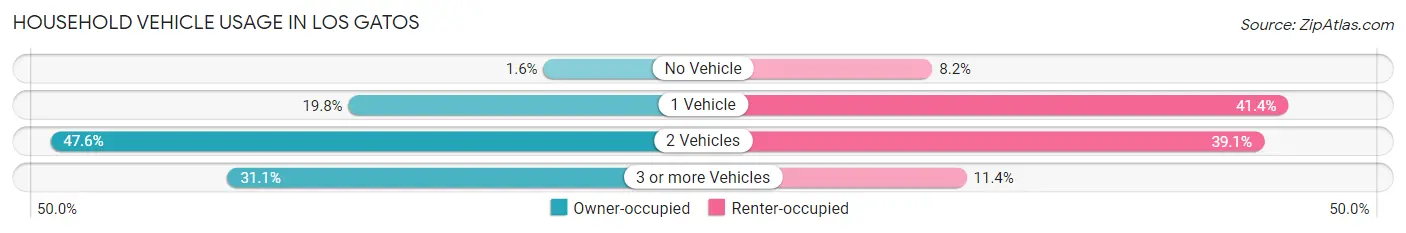
| Vehicles per Household | Owner-occupied | Renter-occupied |
| No Vehicle | 130 (1.6%) | 375 (8.2%) |
| 1 Vehicle | 1,633 (19.8%) | 1,901 (41.4%) |
| 2 Vehicles | 3,932 (47.6%) | 1,796 (39.1%) |
| 3 or more Vehicles | 2,566 (31.1%) | 522 (11.4%) |
| Total | 8,261 (100.0%) | 4,594 (100.0%) |
Real Estate & Mortgages in Los Gatos
Real Estate and Mortgage Overview in Los Gatos
| Characteristic | Without Mortgage | With Mortgage |
| Housing Units | 2,586 | 5,675 |
| Median Property Value | $2,000,001 | $2,000,001 |
| Median Household Income | $154,125 | $4,356 |
| Monthly Housing Costs | $1,396 | $4,855 |
| Real Estate Taxes | $7,437 | $50 |
Property Value by Mortgage Status in Los Gatos
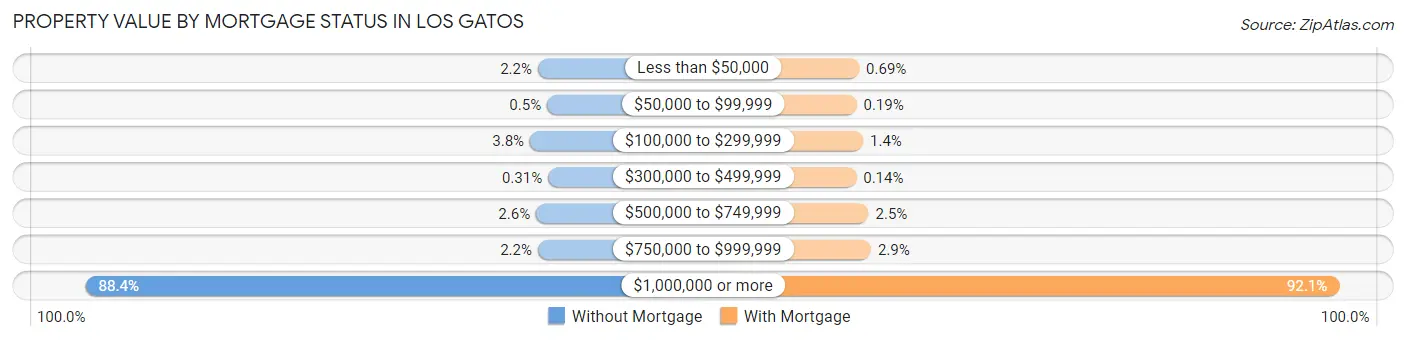
| Property Value | Without Mortgage | With Mortgage |
| Less than $50,000 | 58 (2.2%) | 39 (0.7%) |
| $50,000 to $99,999 | 13 (0.5%) | 11 (0.2%) |
| $100,000 to $299,999 | 97 (3.7%) | 82 (1.4%) |
| $300,000 to $499,999 | 8 (0.3%) | 8 (0.1%) |
| $500,000 to $749,999 | 67 (2.6%) | 141 (2.5%) |
| $750,000 to $999,999 | 58 (2.2%) | 167 (2.9%) |
| $1,000,000 or more | 2,285 (88.4%) | 5,227 (92.1%) |
| Total | 2,586 (100.0%) | 5,675 (100.0%) |
Household Income by Mortgage Status in Los Gatos
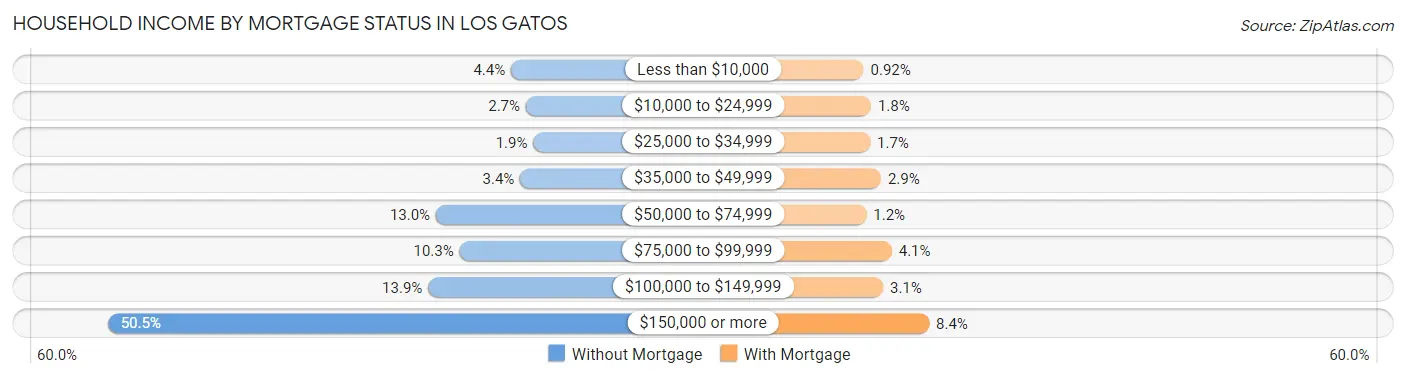
| Household Income | Without Mortgage | With Mortgage |
| Less than $10,000 | 114 (4.4%) | 52 (0.9%) |
| $10,000 to $24,999 | 70 (2.7%) | 100 (1.8%) |
| $25,000 to $34,999 | 48 (1.9%) | 94 (1.7%) |
| $35,000 to $49,999 | 87 (3.4%) | 165 (2.9%) |
| $50,000 to $74,999 | 336 (13.0%) | 70 (1.2%) |
| $75,000 to $99,999 | 266 (10.3%) | 235 (4.1%) |
| $100,000 to $149,999 | 359 (13.9%) | 178 (3.1%) |
| $150,000 or more | 1,306 (50.5%) | 477 (8.4%) |
| Total | 2,586 (100.0%) | 5,675 (100.0%) |
Property Value to Household Income Ratio in Los Gatos
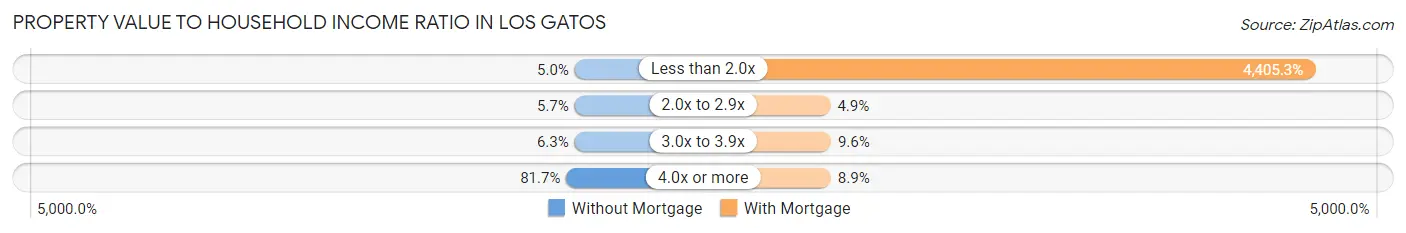
| Value-to-Income Ratio | Without Mortgage | With Mortgage |
| Less than 2.0x | 128 (5.0%) | 250,001 (4,405.3%) |
| 2.0x to 2.9x | 148 (5.7%) | 279 (4.9%) |
| 3.0x to 3.9x | 164 (6.3%) | 545 (9.6%) |
| 4.0x or more | 2,112 (81.7%) | 502 (8.8%) |
| Total | 2,586 (100.0%) | 5,675 (100.0%) |
Real Estate Taxes by Mortgage Status in Los Gatos

| Property Taxes | Without Mortgage | With Mortgage |
| Less than $800 | 44 (1.7%) | 79 (1.4%) |
| $800 to $1,499 | 55 (2.1%) | 46 (0.8%) |
| $800 to $1,499 | 2,419 (93.5%) | 18 (0.3%) |
| Total | 2,586 (100.0%) | 5,675 (100.0%) |
Health & Disability in Los Gatos
Health Insurance Coverage by Age in Los Gatos
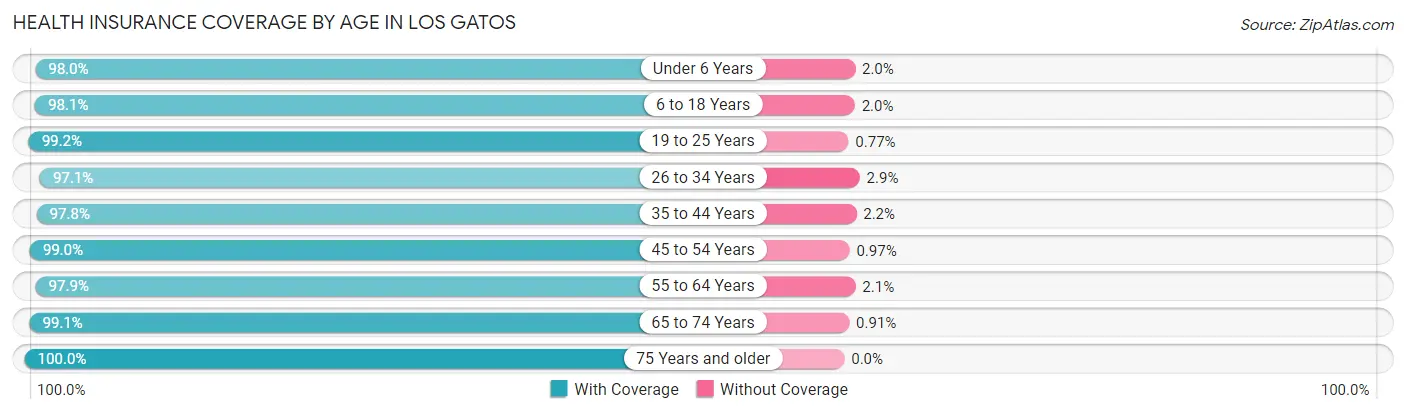
| Age Bracket | With Coverage | Without Coverage |
| Under 6 Years | 1,669 (98.0%) | 34 (2.0%) |
| 6 to 18 Years | 5,996 (98.1%) | 119 (1.9%) |
| 19 to 25 Years | 1,548 (99.2%) | 12 (0.8%) |
| 26 to 34 Years | 2,501 (97.1%) | 74 (2.9%) |
| 35 to 44 Years | 4,112 (97.8%) | 94 (2.2%) |
| 45 to 54 Years | 5,387 (99.0%) | 53 (1.0%) |
| 55 to 64 Years | 4,632 (97.9%) | 98 (2.1%) |
| 65 to 74 Years | 3,040 (99.1%) | 28 (0.9%) |
| 75 Years and older | 3,352 (100.0%) | 0 (0.0%) |
| Total | 32,237 (98.4%) | 512 (1.6%) |
Health Insurance Coverage by Citizenship Status in Los Gatos
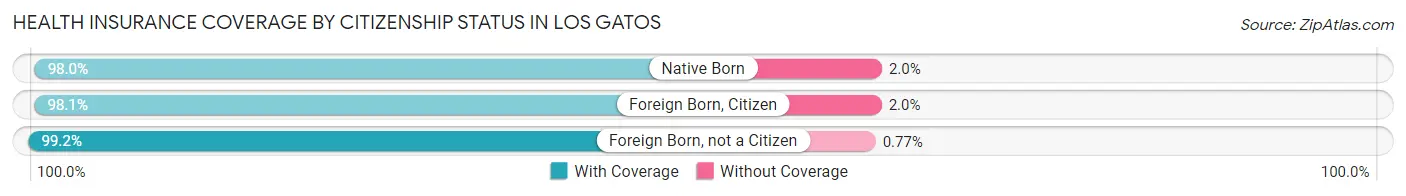
| Citizenship Status | With Coverage | Without Coverage |
| Native Born | 1,669 (98.0%) | 34 (2.0%) |
| Foreign Born, Citizen | 5,996 (98.1%) | 119 (1.9%) |
| Foreign Born, not a Citizen | 1,548 (99.2%) | 12 (0.8%) |
Health Insurance Coverage by Household Income in Los Gatos
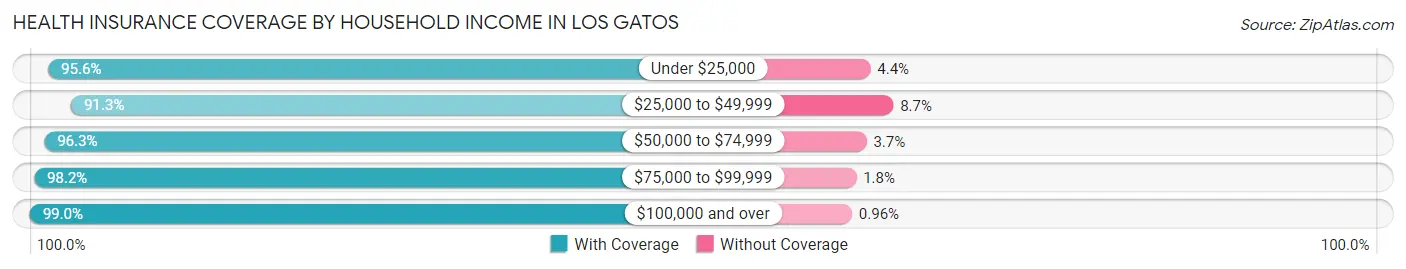
| Household Income | With Coverage | Without Coverage |
| Under $25,000 | 1,189 (95.6%) | 55 (4.4%) |
| $25,000 to $49,999 | 1,207 (91.3%) | 115 (8.7%) |
| $50,000 to $74,999 | 1,467 (96.3%) | 56 (3.7%) |
| $75,000 to $99,999 | 1,565 (98.2%) | 28 (1.8%) |
| $100,000 and over | 26,750 (99.0%) | 258 (1.0%) |
Public vs Private Health Insurance Coverage by Age in Los Gatos
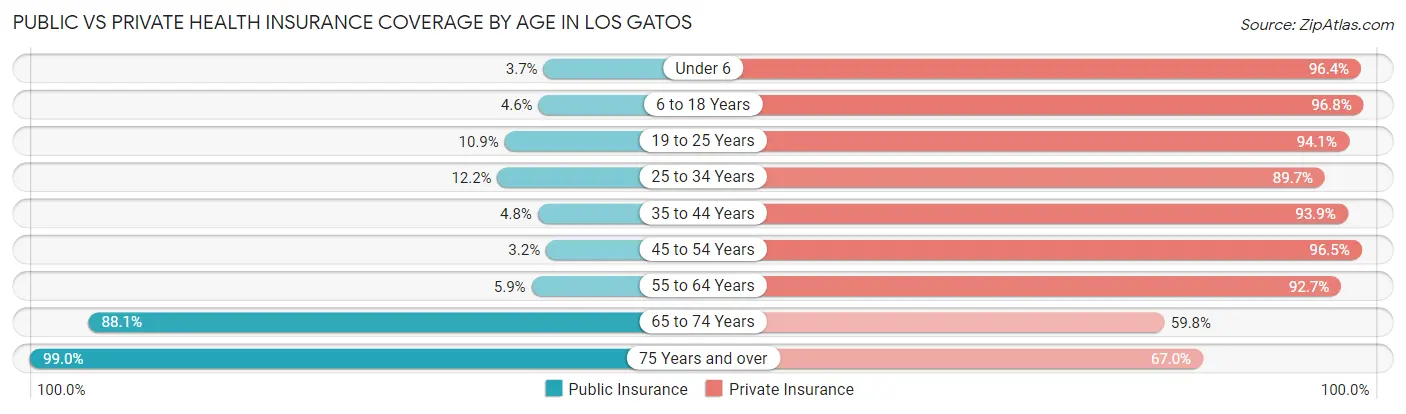
| Age Bracket | Public Insurance | Private Insurance |
| Under 6 | 63 (3.7%) | 1,641 (96.4%) |
| 6 to 18 Years | 283 (4.6%) | 5,921 (96.8%) |
| 19 to 25 Years | 170 (10.9%) | 1,468 (94.1%) |
| 25 to 34 Years | 315 (12.2%) | 2,309 (89.7%) |
| 35 to 44 Years | 200 (4.8%) | 3,948 (93.9%) |
| 45 to 54 Years | 175 (3.2%) | 5,248 (96.5%) |
| 55 to 64 Years | 280 (5.9%) | 4,384 (92.7%) |
| 65 to 74 Years | 2,703 (88.1%) | 1,834 (59.8%) |
| 75 Years and over | 3,317 (99.0%) | 2,247 (67.0%) |
| Total | 7,506 (22.9%) | 29,000 (88.5%) |
Disability Status by Sex by Age in Los Gatos
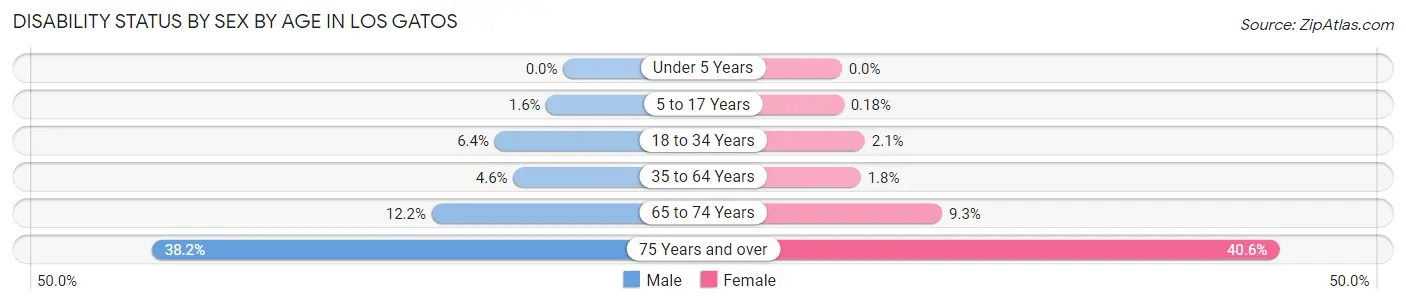
| Age Bracket | Male | Female |
| Under 5 Years | 0 (0.0%) | 0 (0.0%) |
| 5 to 17 Years | 55 (1.6%) | 5 (0.2%) |
| 18 to 34 Years | 143 (6.4%) | 46 (2.1%) |
| 35 to 64 Years | 331 (4.6%) | 127 (1.8%) |
| 65 to 74 Years | 195 (12.2%) | 137 (9.3%) |
| 75 Years and over | 485 (38.2%) | 845 (40.6%) |
Disability Class by Sex by Age in Los Gatos
Disability Class: Hearing Difficulty
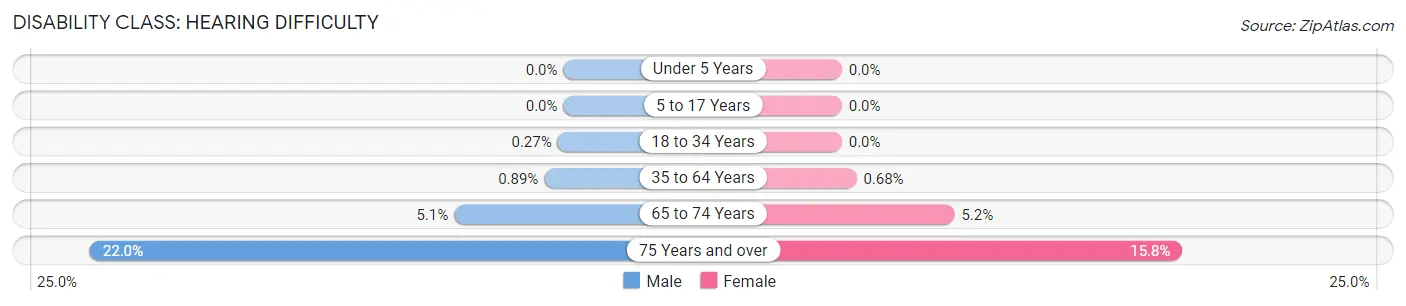
| Age Bracket | Male | Female |
| Under 5 Years | 0 (0.0%) | 0 (0.0%) |
| 5 to 17 Years | 0 (0.0%) | 0 (0.0%) |
| 18 to 34 Years | 6 (0.3%) | 0 (0.0%) |
| 35 to 64 Years | 64 (0.9%) | 49 (0.7%) |
| 65 to 74 Years | 81 (5.1%) | 77 (5.2%) |
| 75 Years and over | 279 (22.0%) | 329 (15.8%) |
Disability Class: Vision Difficulty
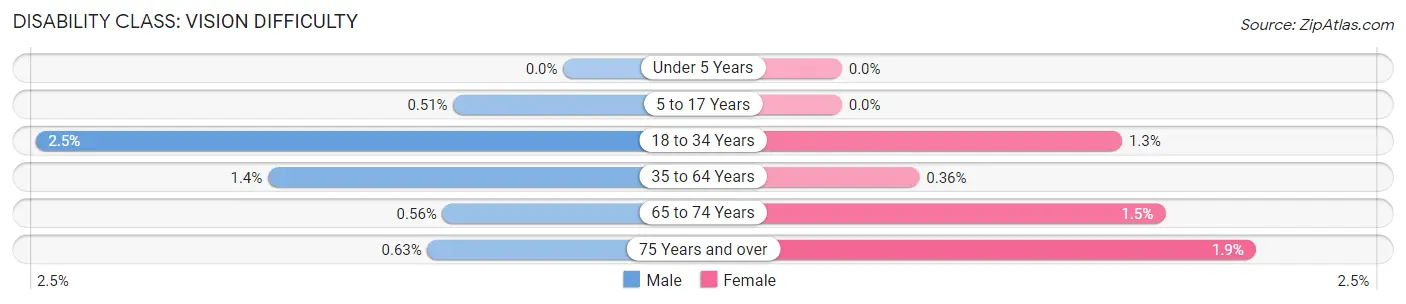
| Age Bracket | Male | Female |
| Under 5 Years | 0 (0.0%) | 0 (0.0%) |
| 5 to 17 Years | 18 (0.5%) | 0 (0.0%) |
| 18 to 34 Years | 55 (2.5%) | 28 (1.3%) |
| 35 to 64 Years | 98 (1.4%) | 26 (0.4%) |
| 65 to 74 Years | 9 (0.6%) | 22 (1.5%) |
| 75 Years and over | 8 (0.6%) | 40 (1.9%) |
Disability Class: Cognitive Difficulty
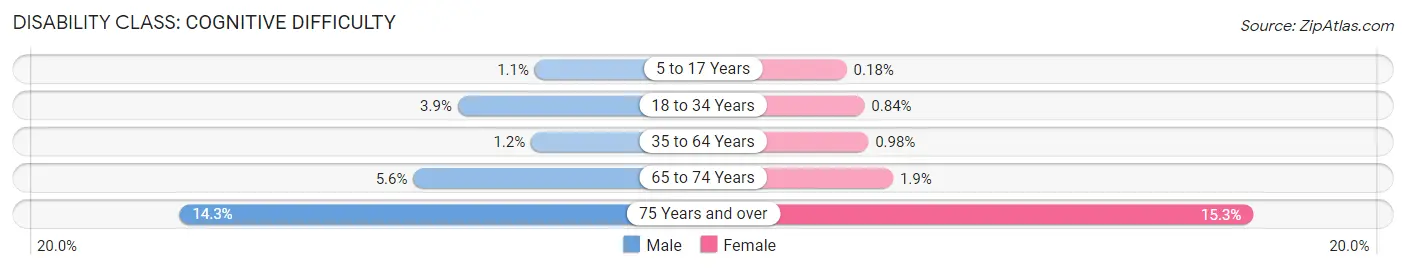
| Age Bracket | Male | Female |
| 5 to 17 Years | 37 (1.1%) | 5 (0.2%) |
| 18 to 34 Years | 88 (3.9%) | 18 (0.8%) |
| 35 to 64 Years | 86 (1.2%) | 71 (1.0%) |
| 65 to 74 Years | 89 (5.6%) | 28 (1.9%) |
| 75 Years and over | 181 (14.2%) | 318 (15.3%) |
Disability Class: Ambulatory Difficulty
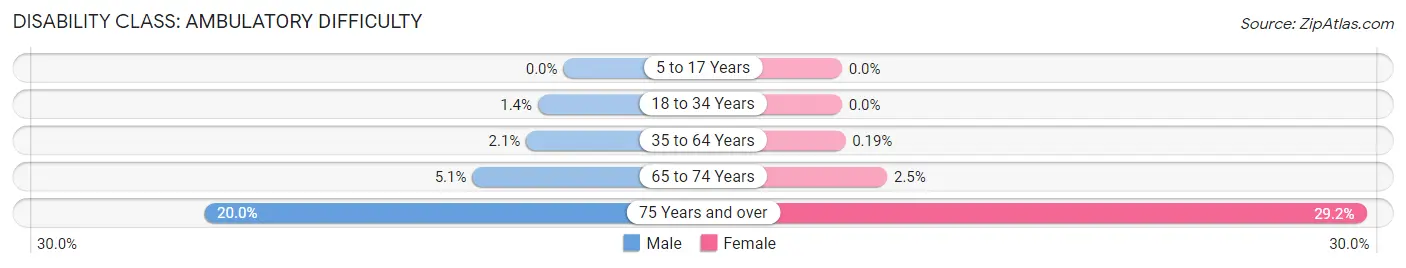
| Age Bracket | Male | Female |
| 5 to 17 Years | 0 (0.0%) | 0 (0.0%) |
| 18 to 34 Years | 32 (1.4%) | 0 (0.0%) |
| 35 to 64 Years | 148 (2.1%) | 14 (0.2%) |
| 65 to 74 Years | 81 (5.1%) | 37 (2.5%) |
| 75 Years and over | 254 (20.0%) | 608 (29.2%) |
Disability Class: Self-Care Difficulty
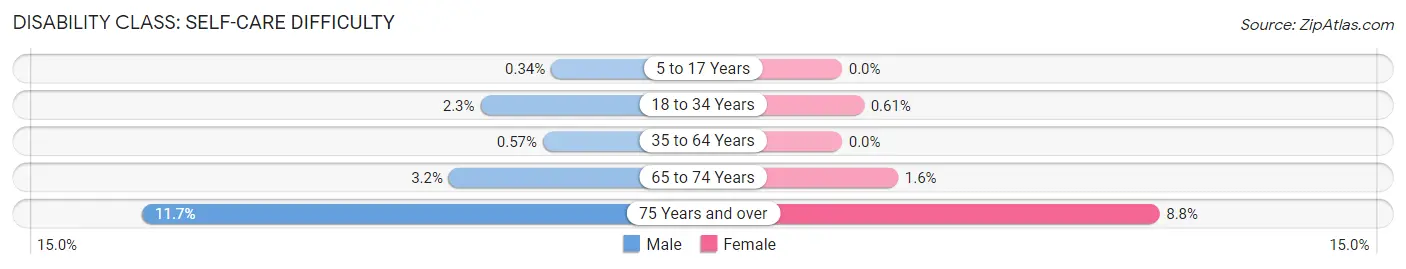
| Age Bracket | Male | Female |
| 5 to 17 Years | 12 (0.3%) | 0 (0.0%) |
| 18 to 34 Years | 52 (2.3%) | 13 (0.6%) |
| 35 to 64 Years | 41 (0.6%) | 0 (0.0%) |
| 65 to 74 Years | 51 (3.2%) | 23 (1.6%) |
| 75 Years and over | 149 (11.7%) | 184 (8.8%) |
Technology Access in Los Gatos
Computing Device Access in Los Gatos
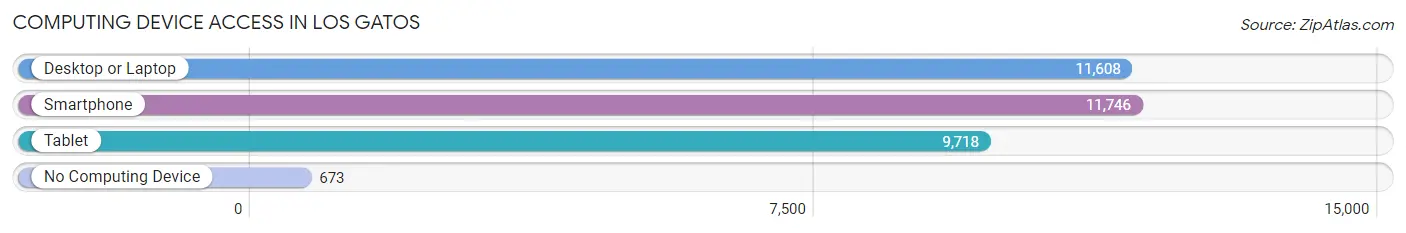
| Device Type | # Households | % Households |
| Desktop or Laptop | 11,608 | 90.3% |
| Smartphone | 11,746 | 91.4% |
| Tablet | 9,718 | 75.6% |
| No Computing Device | 673 | 5.2% |
| Total | 12,855 | 100.0% |
Internet Access in Los Gatos
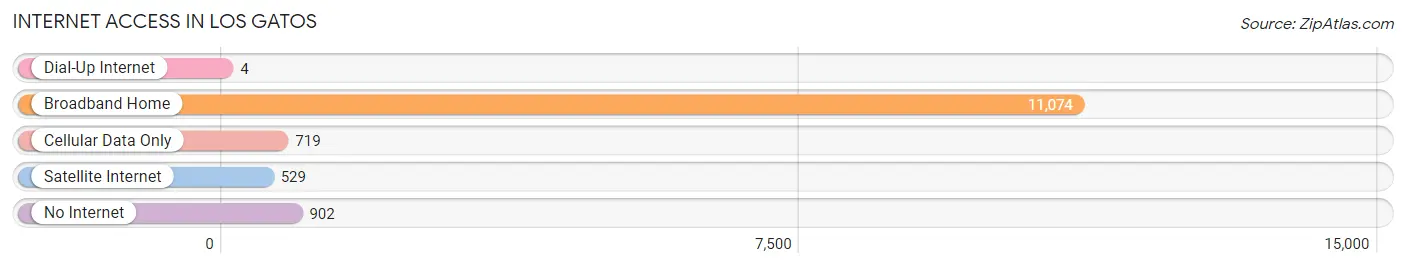
| Internet Type | # Households | % Households |
| Dial-Up Internet | 4 | 0.0% |
| Broadband Home | 11,074 | 86.2% |
| Cellular Data Only | 719 | 5.6% |
| Satellite Internet | 529 | 4.1% |
| No Internet | 902 | 7.0% |
| Total | 12,855 | 100.0% |
Los Gatos Summary
History
The history of Los Gatos, California dates back to the mid-1800s when the area was first settled by Spanish colonists. The town was originally known as La Rinconada de Los Gatos, which translates to “the corner of the cats” in English. The name was derived from the large number of mountain lions that roamed the area. The town was officially founded in 1887 and incorporated in 1887.
Los Gatos was a small agricultural community for much of its early history. The town was known for its orchards and vineyards, which produced a variety of fruits and vegetables. The town also had a thriving lumber industry, which provided wood for the construction of homes and other buildings.
In the early 1900s, Los Gatos began to experience a period of growth and development. The town was connected to the rest of the Bay Area by the Southern Pacific Railroad in 1906. This allowed for the transportation of goods and people to and from the town.
In the 1950s, Los Gatos began to experience a period of suburbanization. The town was transformed from a rural agricultural community to a suburban bedroom community. This period of growth was fueled by the influx of new residents from the Bay Area and other parts of California.
Geography
Los Gatos is located in Santa Clara County, California. The town is situated in the foothills of the Santa Cruz Mountains, approximately 25 miles south of San Francisco. The town is bordered by the cities of San Jose, Campbell, and Saratoga.
The town has a total area of 11.2 square miles, of which 11.1 square miles is land and 0.1 square miles is water. The town is located at an elevation of about 500 feet above sea level.
The climate in Los Gatos is mild and temperate. The average high temperature in the summer is around 80 degrees Fahrenheit, while the average low temperature in the winter is around 40 degrees Fahrenheit.
Economy
The economy of Los Gatos is largely driven by the technology industry. The town is home to several major technology companies, including Netflix, Roku, and Symantec. The town is also home to several venture capital firms, which provide funding for start-up companies.
The town is also home to several retail stores, restaurants, and other businesses. The downtown area is home to several boutiques, art galleries, and other specialty stores.
Demographics
As of the 2010 census, the population of Los Gatos was 30,391. The racial makeup of the town was 77.3% White, 1.2% African American, 0.3% Native American, 15.2% Asian, 0.1% Pacific Islander, 3.2% from other races, and 3.0% from two or more races. Hispanic or Latino of any race were 8.7% of the population.
The median income for a household in Los Gatos was $107,811, and the median income for a family was $127,811. The per capita income for the town was $50,811. About 4.2% of families and 6.3% of the population were below the poverty line, including 8.2% of those under age 18 and 3.2% of those age 65 or over.
Common Questions
What is Per Capita Income in Los Gatos?
Per Capita income in Los Gatos is $120,561.
What is the Median Family Income in Los Gatos?
Median Family Income in Los Gatos is $240,688.
What is the Median Household income in Los Gatos?
Median Household Income in Los Gatos is $198,117.
What is Income or Wage Gap in Los Gatos?
Income or Wage Gap in Los Gatos is 45.6%.
Women in Los Gatos earn 54.4 cents for every dollar earned by a man.
What is Family Income Deficit in Los Gatos?
Family Income Deficit in Los Gatos is $15,614.
Families that are below poverty line in Los Gatos earn $15,614 less on average than the poverty threshold level.
What is Inequality or Gini Index in Los Gatos?
Inequality or Gini Index in Los Gatos is 0.52.
What is the Total Population of Los Gatos?
Total Population of Los Gatos is 33,093.
What is the Total Male Population of Los Gatos?
Total Male Population of Los Gatos is 16,449.
What is the Total Female Population of Los Gatos?
Total Female Population of Los Gatos is 16,644.
What is the Ratio of Males per 100 Females in Los Gatos?
There are 98.83 Males per 100 Females in Los Gatos.
What is the Ratio of Females per 100 Males in Los Gatos?
There are 101.19 Females per 100 Males in Los Gatos.
What is the Median Population Age in Los Gatos?
Median Population Age in Los Gatos is 45.6 Years.
What is the Average Family Size in Los Gatos
Average Family Size in Los Gatos is 3.0 People.
What is the Average Household Size in Los Gatos
Average Household Size in Los Gatos is 2.5 People.
How Large is the Labor Force in Los Gatos?
There are 16,302 People in the Labor Forcein in Los Gatos.
What is the Percentage of People in the Labor Force in Los Gatos?
61.3% of People are in the Labor Force in Los Gatos.
What is the Unemployment Rate in Los Gatos?
Unemployment Rate in Los Gatos is 4.7%.