Grambling, LA Map & Demographics
Grambling Map
Grambling Overview
$14,729
PER CAPITA INCOME
$28,616
AVG FAMILY INCOME
$25,050
AVG HOUSEHOLD INCOME
21.3%
WAGE / INCOME GAP [ % ]
78.7¢/ $1
WAGE / INCOME GAP [ $ ]
0.49
INEQUALITY / GINI INDEX
5,315
TOTAL POPULATION
2,856
MALE POPULATION
2,459
FEMALE POPULATION
116.14
MALES / 100 FEMALES
86.10
FEMALES / 100 MALES
21.8
MEDIAN AGE
3.6
AVG FAMILY SIZE
2.6
AVG HOUSEHOLD SIZE
1,917
LABOR FORCE [ PEOPLE ]
44.0%
PERCENT IN LABOR FORCE
3.4%
UNEMPLOYMENT RATE
Grambling Zip Codes
Grambling Area Codes
Income in Grambling
Income Overview in Grambling
Per Capita Income in Grambling is $14,729, while median incomes of families and households are $28,616 and $25,050 respectively.
| Characteristic | Number | Measure |
| Per Capita Income | 5,315 | $14,729 |
| Median Family Income | 825 | $28,616 |
| Mean Family Income | 825 | $43,343 |
| Median Household Income | 1,637 | $25,050 |
| Mean Household Income | 1,637 | $41,301 |
| Income Deficit | 825 | $0 |
| Wage / Income Gap (%) | 5,315 | 21.31% |
| Wage / Income Gap ($) | 5,315 | 78.69¢ per $1 |
| Gini / Inequality Index | 5,315 | 0.49 |
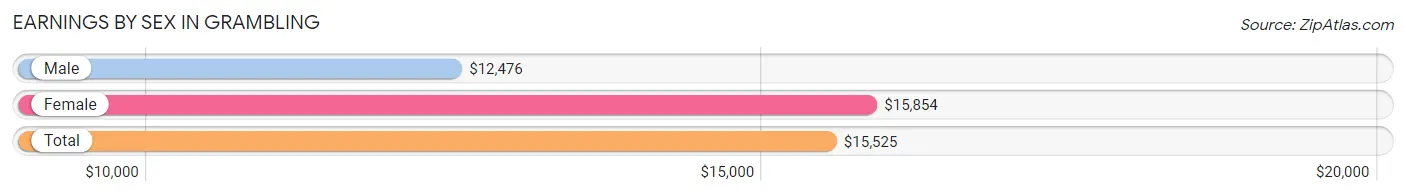
Earnings by Sex in Grambling
Average Earnings in Grambling are $15,525, $12,476 for men and $15,854 for women, a difference of 21.3%.
| Sex | Number | Average Earnings |
| Male | 1,082 (49.3%) | $12,476 |
| Female | 1,114 (50.7%) | $15,854 |
| Total | 2,196 (100.0%) | $15,525 |
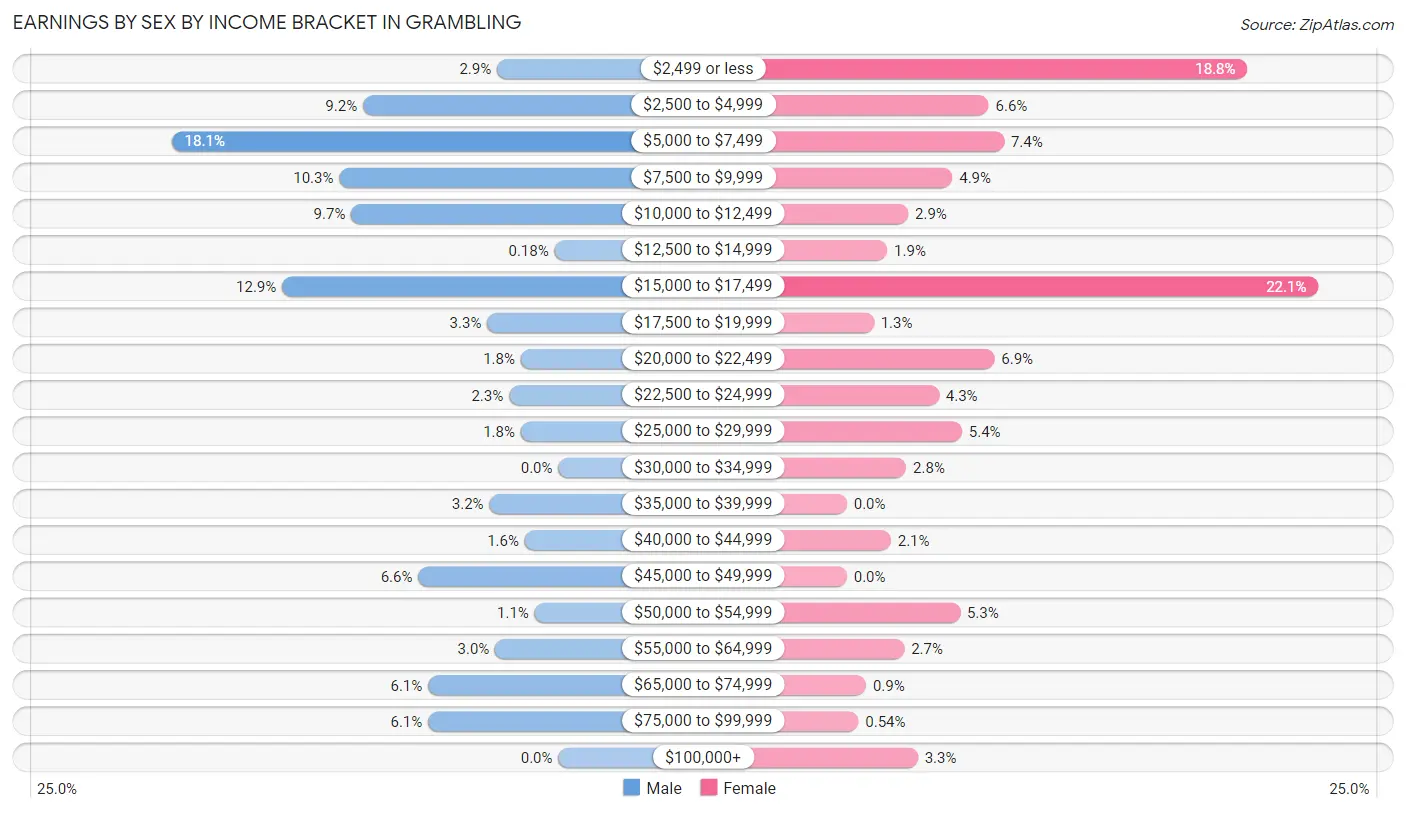
Earnings by Sex by Income Bracket in Grambling
The most common earnings brackets in Grambling are $5,000 to $7,499 for men (196 | 18.1%) and $15,000 to $17,499 for women (246 | 22.1%).
| Income | Male | Female |
| $2,499 or less | 31 (2.9%) | 209 (18.8%) |
| $2,500 to $4,999 | 99 (9.1%) | 74 (6.6%) |
| $5,000 to $7,499 | 196 (18.1%) | 82 (7.4%) |
| $7,500 to $9,999 | 111 (10.3%) | 55 (4.9%) |
| $10,000 to $12,499 | 105 (9.7%) | 32 (2.9%) |
| $12,500 to $14,999 | 2 (0.2%) | 21 (1.9%) |
| $15,000 to $17,499 | 140 (12.9%) | 246 (22.1%) |
| $17,500 to $19,999 | 36 (3.3%) | 14 (1.3%) |
| $20,000 to $22,499 | 19 (1.8%) | 77 (6.9%) |
| $22,500 to $24,999 | 25 (2.3%) | 48 (4.3%) |
| $25,000 to $29,999 | 19 (1.8%) | 60 (5.4%) |
| $30,000 to $34,999 | 0 (0.0%) | 31 (2.8%) |
| $35,000 to $39,999 | 35 (3.2%) | 0 (0.0%) |
| $40,000 to $44,999 | 17 (1.6%) | 23 (2.1%) |
| $45,000 to $49,999 | 71 (6.6%) | 0 (0.0%) |
| $50,000 to $54,999 | 12 (1.1%) | 59 (5.3%) |
| $55,000 to $64,999 | 32 (3.0%) | 30 (2.7%) |
| $65,000 to $74,999 | 66 (6.1%) | 10 (0.9%) |
| $75,000 to $99,999 | 66 (6.1%) | 6 (0.5%) |
| $100,000+ | 0 (0.0%) | 37 (3.3%) |
| Total | 1,082 (100.0%) | 1,114 (100.0%) |
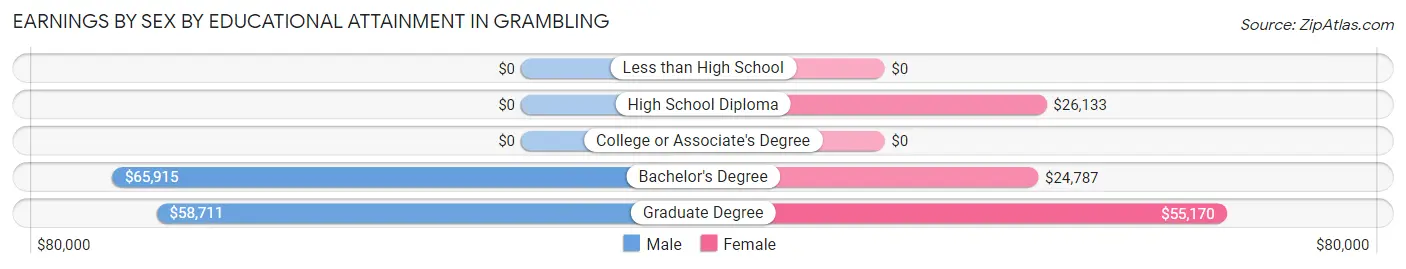
Earnings by Sex by Educational Attainment in Grambling
| Educational Attainment | Male Income | Female Income |
| Less than High School | - | - |
| High School Diploma | - | - |
| College or Associate's Degree | - | - |
| Bachelor's Degree | $65,915 | $24,787 |
| Graduate Degree | $58,711 | $55,170 |
| Total | - | - |
Family Income in Grambling
Family Income Brackets in Grambling
According to the Grambling family income data, there are 199 families falling into the less than $10,000 income range, which is the most common income bracket and makes up 24.1% of all families.
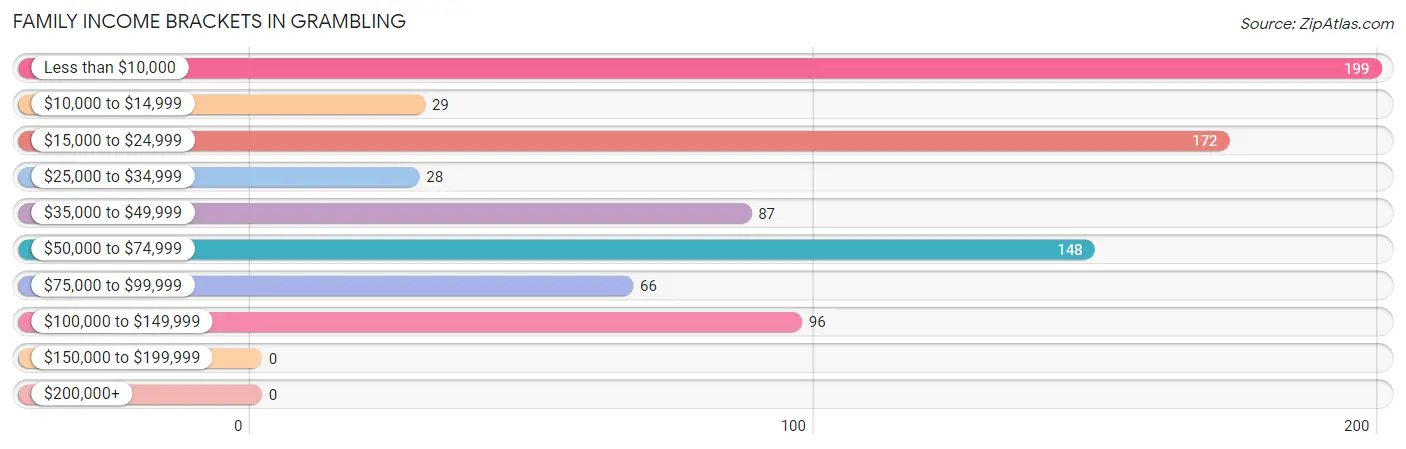
| Income Bracket | # Families | % Families |
| Less than $10,000 | 199 | 24.1% |
| $10,000 to $14,999 | 29 | 3.5% |
| $15,000 to $24,999 | 172 | 20.8% |
| $25,000 to $34,999 | 28 | 3.4% |
| $35,000 to $49,999 | 87 | 10.5% |
| $50,000 to $74,999 | 148 | 17.9% |
| $75,000 to $99,999 | 66 | 8.0% |
| $100,000 to $149,999 | 96 | 11.6% |
| $150,000 to $199,999 | 0 | 0.0% |
| $200,000+ | 0 | 0.0% |
Family Income by Famaliy Size in Grambling
5-person families (120 | 14.5%) account for the highest median family income in Grambling with $63,443 per family, while 5-person families (120 | 14.5%) have the highest median income of $12,689 per family member.
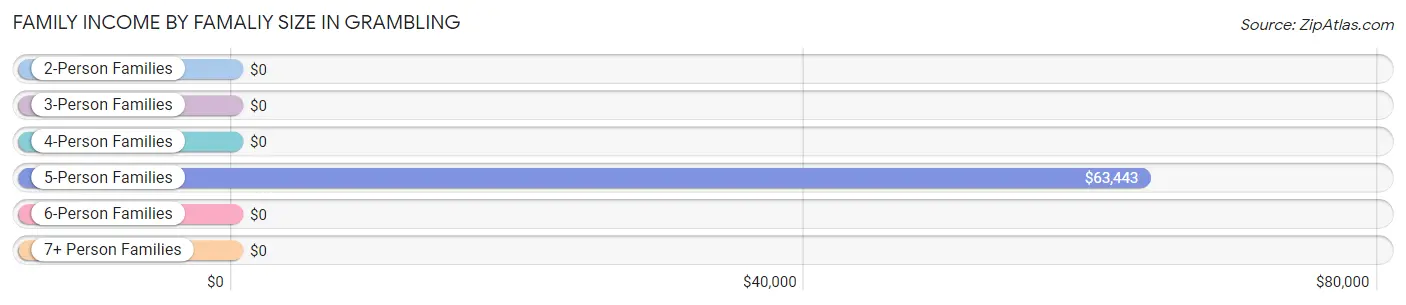
| Income Bracket | # Families | Median Income |
| 2-Person Families | 419 (50.8%) | $0 |
| 3-Person Families | 145 (17.6%) | $0 |
| 4-Person Families | 129 (15.6%) | $0 |
| 5-Person Families | 120 (14.5%) | $63,443 |
| 6-Person Families | 12 (1.5%) | $0 |
| 7+ Person Families | 0 (0.0%) | $0 |
| Total | 825 (100.0%) | $28,616 |
Family Income by Number of Earners in Grambling
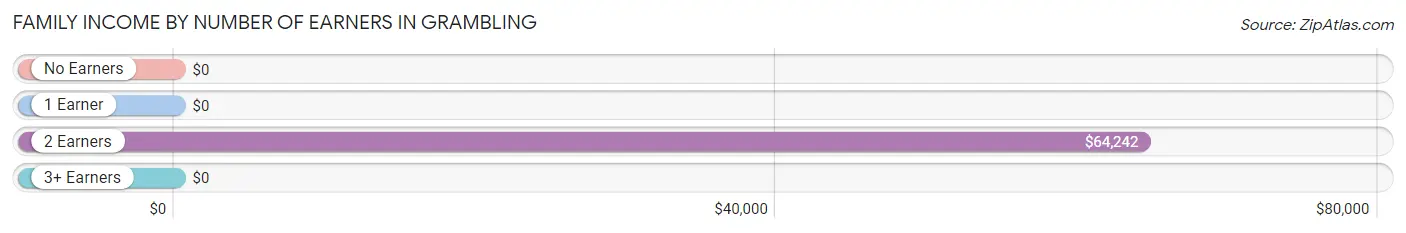
| Number of Earners | # Families | Median Income |
| No Earners | 286 (34.7%) | $0 |
| 1 Earner | 396 (48.0%) | $0 |
| 2 Earners | 143 (17.3%) | $64,242 |
| 3+ Earners | 0 (0.0%) | $0 |
| Total | 825 (100.0%) | $28,616 |
Household Income in Grambling
Household Income Brackets in Grambling
With 413 households falling in the category, the less than $10,000 income range is the most frequent in Grambling, accounting for 25.2% of all households.
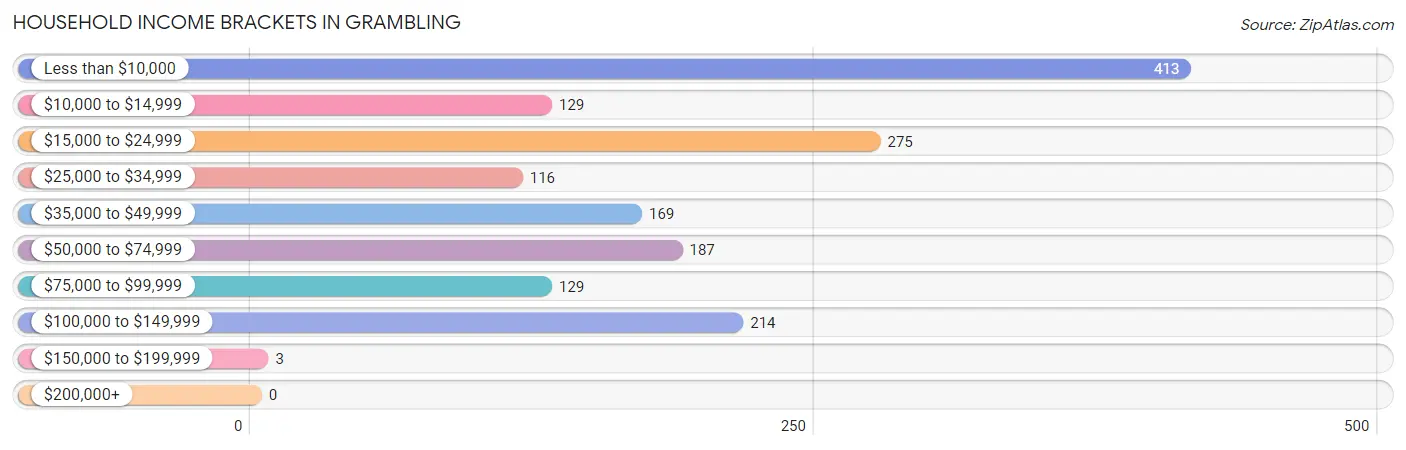
| Income Bracket | # Households | % Households |
| Less than $10,000 | 413 | 25.2% |
| $10,000 to $14,999 | 129 | 7.9% |
| $15,000 to $24,999 | 275 | 16.8% |
| $25,000 to $34,999 | 116 | 7.1% |
| $35,000 to $49,999 | 169 | 10.3% |
| $50,000 to $74,999 | 187 | 11.4% |
| $75,000 to $99,999 | 129 | 7.9% |
| $100,000 to $149,999 | 214 | 13.1% |
| $150,000 to $199,999 | 3 | 0.2% |
| $200,000+ | 0 | 0.0% |
Household Income by Householder Age in Grambling
The median household income in Grambling is $25,050, with the highest median household income of $55,238 found in the 65+ years age bracket for the primary householder. A total of 386 households (23.6%) fall into this category. Meanwhile, the 25 to 44 years age bracket for the primary householder has the lowest median household income of $0, with 664 households (40.6%) in this group.
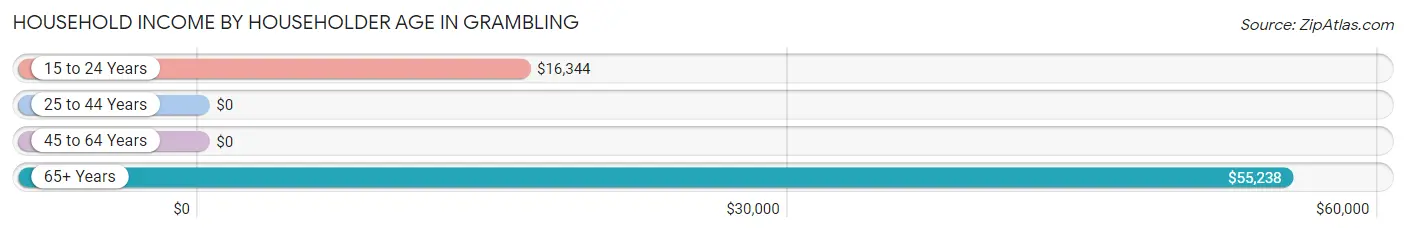
| Income Bracket | # Households | Median Income |
| 15 to 24 Years | 200 (12.2%) | $16,344 |
| 25 to 44 Years | 664 (40.6%) | $0 |
| 45 to 64 Years | 387 (23.6%) | $0 |
| 65+ Years | 386 (23.6%) | $55,238 |
| Total | 1,637 (100.0%) | $25,050 |
Poverty in Grambling
Income Below Poverty by Sex and Age in Grambling
With 52.4% poverty level for males and 45.3% for females among the residents of Grambling, under 5 year old males and 12 to 14 year old females are the most vulnerable to poverty, with 76 males (100.0%) and 57 females (100.0%) in their respective age groups living below the poverty level.
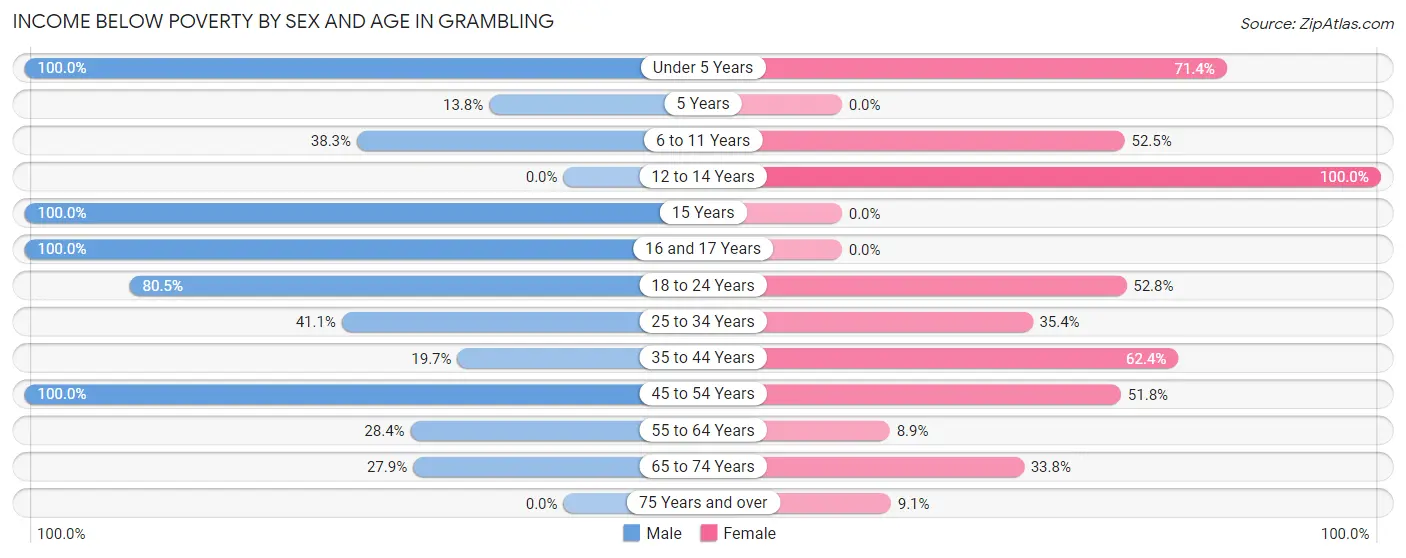
| Age Bracket | Male | Female |
| Under 5 Years | 76 (100.0%) | 35 (71.4%) |
| 5 Years | 8 (13.8%) | 0 (0.0%) |
| 6 to 11 Years | 161 (38.3%) | 74 (52.5%) |
| 12 to 14 Years | 0 (0.0%) | 57 (100.0%) |
| 15 Years | 127 (100.0%) | 0 (0.0%) |
| 16 and 17 Years | 79 (100.0%) | 0 (0.0%) |
| 18 to 24 Years | 487 (80.5%) | 226 (52.8%) |
| 25 to 34 Years | 137 (41.1%) | 86 (35.4%) |
| 35 to 44 Years | 36 (19.7%) | 231 (62.4%) |
| 45 to 54 Years | 78 (100.0%) | 43 (51.8%) |
| 55 to 64 Years | 67 (28.4%) | 12 (8.9%) |
| 65 to 74 Years | 12 (27.9%) | 52 (33.8%) |
| 75 Years and over | 0 (0.0%) | 14 (9.1%) |
| Total | 1,268 (52.4%) | 830 (45.3%) |
Income Above Poverty by Sex and Age in Grambling
According to the poverty statistics in Grambling, males aged 12 to 14 years and females aged 16 and 17 years are the age groups that are most secure financially, with 100.0% of males and 100.0% of females in these age groups living above the poverty line.
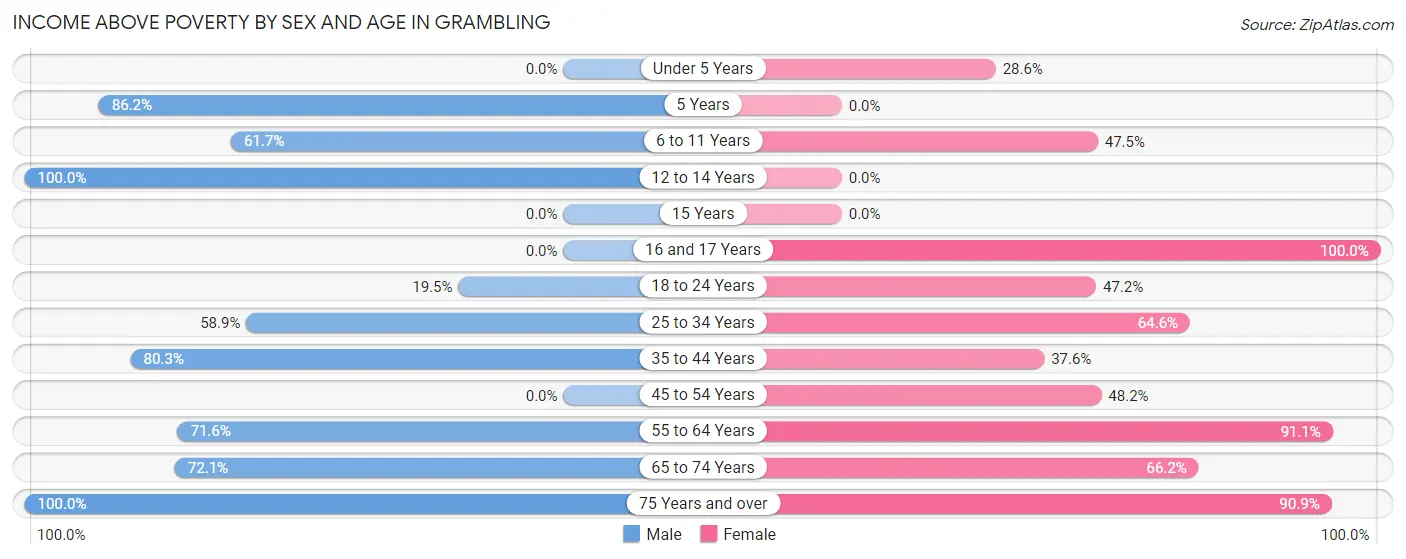
| Age Bracket | Male | Female |
| Under 5 Years | 0 (0.0%) | 14 (28.6%) |
| 5 Years | 50 (86.2%) | 0 (0.0%) |
| 6 to 11 Years | 259 (61.7%) | 67 (47.5%) |
| 12 to 14 Years | 11 (100.0%) | 0 (0.0%) |
| 15 Years | 0 (0.0%) | 0 (0.0%) |
| 16 and 17 Years | 0 (0.0%) | 19 (100.0%) |
| 18 to 24 Years | 118 (19.5%) | 202 (47.2%) |
| 25 to 34 Years | 196 (58.9%) | 157 (64.6%) |
| 35 to 44 Years | 147 (80.3%) | 139 (37.6%) |
| 45 to 54 Years | 0 (0.0%) | 40 (48.2%) |
| 55 to 64 Years | 169 (71.6%) | 123 (91.1%) |
| 65 to 74 Years | 31 (72.1%) | 102 (66.2%) |
| 75 Years and over | 170 (100.0%) | 140 (90.9%) |
| Total | 1,151 (47.6%) | 1,003 (54.7%) |
Income Below Poverty Among Married-Couple Families in Grambling
The poverty statistics for married-couple families in Grambling show that 16.8% or 59 of the total 351 families live below the poverty line. Families with 1 or 2 children have the highest poverty rate of 35.3%, comprising of 36 families. On the other hand, families with no children have the lowest poverty rate of 0.0%, which includes 0 families.
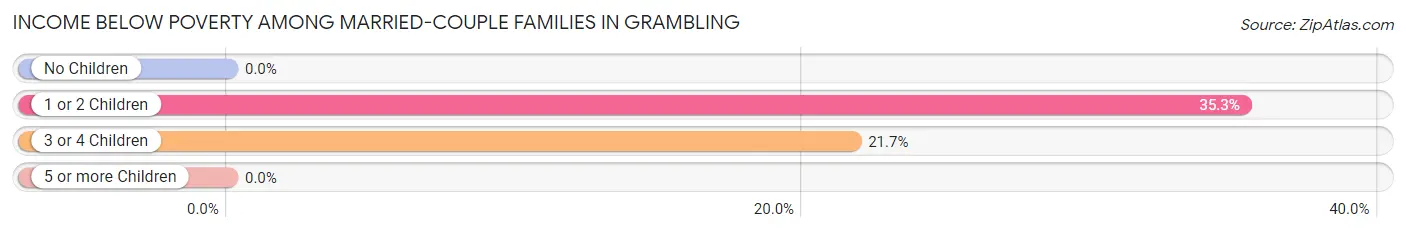
| Children | Above Poverty | Below Poverty |
| No Children | 143 (100.0%) | 0 (0.0%) |
| 1 or 2 Children | 66 (64.7%) | 36 (35.3%) |
| 3 or 4 Children | 83 (78.3%) | 23 (21.7%) |
| 5 or more Children | 0 (0.0%) | 0 (0.0%) |
| Total | 292 (83.2%) | 59 (16.8%) |
Income Below Poverty Among Single-Parent Households in Grambling
According to the poverty data in Grambling, 87.7% or 135 single-father households and 64.4% or 206 single-mother households are living below the poverty line. Among single-father households, those with no children have the highest poverty rate, with 29 households (100.0%) experiencing poverty. Likewise, among single-mother households, those with 1 or 2 children have the highest poverty rate, with 121 households (81.2%) falling below the poverty line.
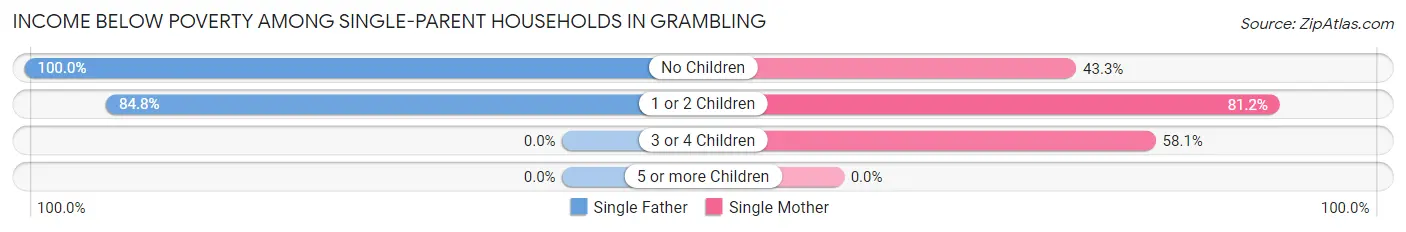
| Children | Single Father | Single Mother |
| No Children | 29 (100.0%) | 42 (43.3%) |
| 1 or 2 Children | 106 (84.8%) | 121 (81.2%) |
| 3 or 4 Children | 0 (0.0%) | 43 (58.1%) |
| 5 or more Children | 0 (0.0%) | 0 (0.0%) |
| Total | 135 (87.7%) | 206 (64.4%) |
Income Below Poverty Among Married-Couple vs Single-Parent Households in Grambling
The poverty data for Grambling shows that 59 of the married-couple family households (16.8%) and 341 of the single-parent households (71.9%) are living below the poverty level. Within the married-couple family households, those with 1 or 2 children have the highest poverty rate, with 36 households (35.3%) falling below the poverty line. Among the single-parent households, those with 1 or 2 children have the highest poverty rate, with 227 household (82.9%) living below poverty.
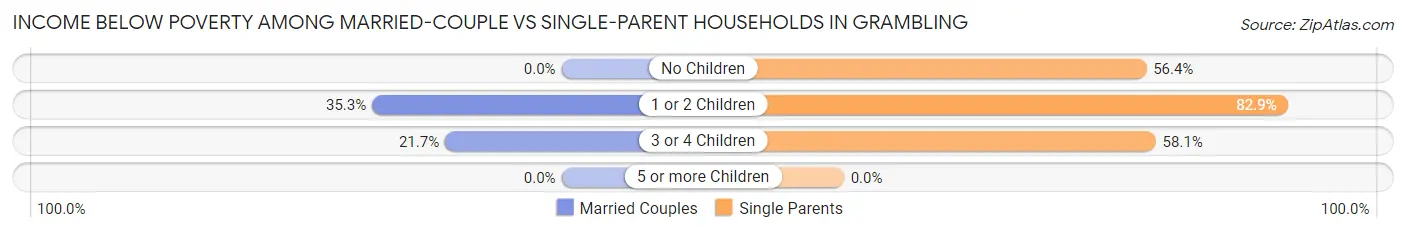
| Children | Married-Couple Families | Single-Parent Households |
| No Children | 0 (0.0%) | 71 (56.4%) |
| 1 or 2 Children | 36 (35.3%) | 227 (82.9%) |
| 3 or 4 Children | 23 (21.7%) | 43 (58.1%) |
| 5 or more Children | 0 (0.0%) | 0 (0.0%) |
| Total | 59 (16.8%) | 341 (71.9%) |
Race in Grambling
The most populous races in Grambling are Black / African American (4,475 | 84.2%), White / Caucasian (458 | 8.6%), and Two or more Races (342 | 6.4%).
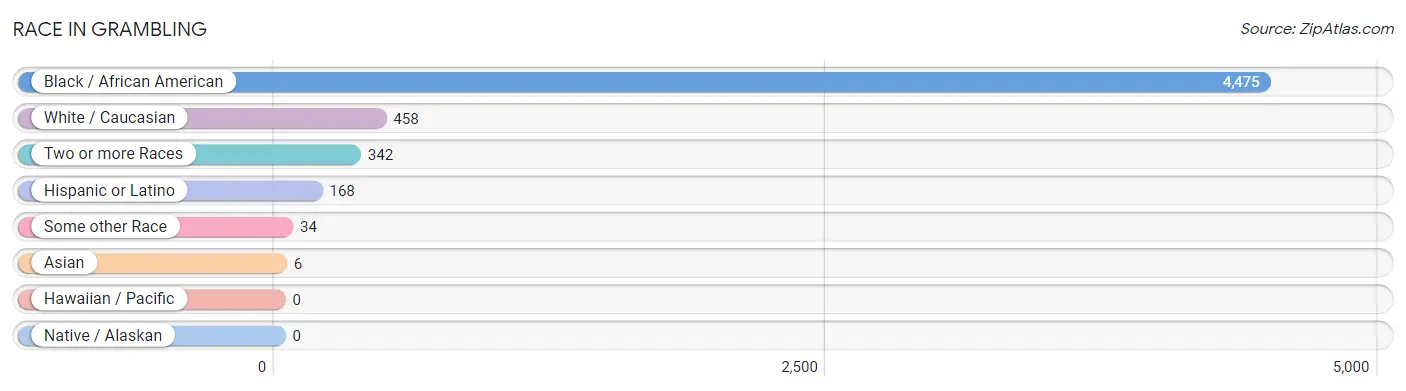
| Race | # Population | % Population |
| Asian | 6 | 0.1% |
| Black / African American | 4,475 | 84.2% |
| Hawaiian / Pacific | 0 | 0.0% |
| Hispanic or Latino | 168 | 3.2% |
| Native / Alaskan | 0 | 0.0% |
| White / Caucasian | 458 | 8.6% |
| Two or more Races | 342 | 6.4% |
| Some other Race | 34 | 0.6% |
| Total | 5,315 | 100.0% |
Ancestry in Grambling
The most populous ancestries reported in Grambling are American (428 | 8.1%), Burmese (150 | 2.8%), Mexican (150 | 2.8%), Irish (92 | 1.7%), and German (88 | 1.7%), together accounting for 17.1% of all Grambling residents.
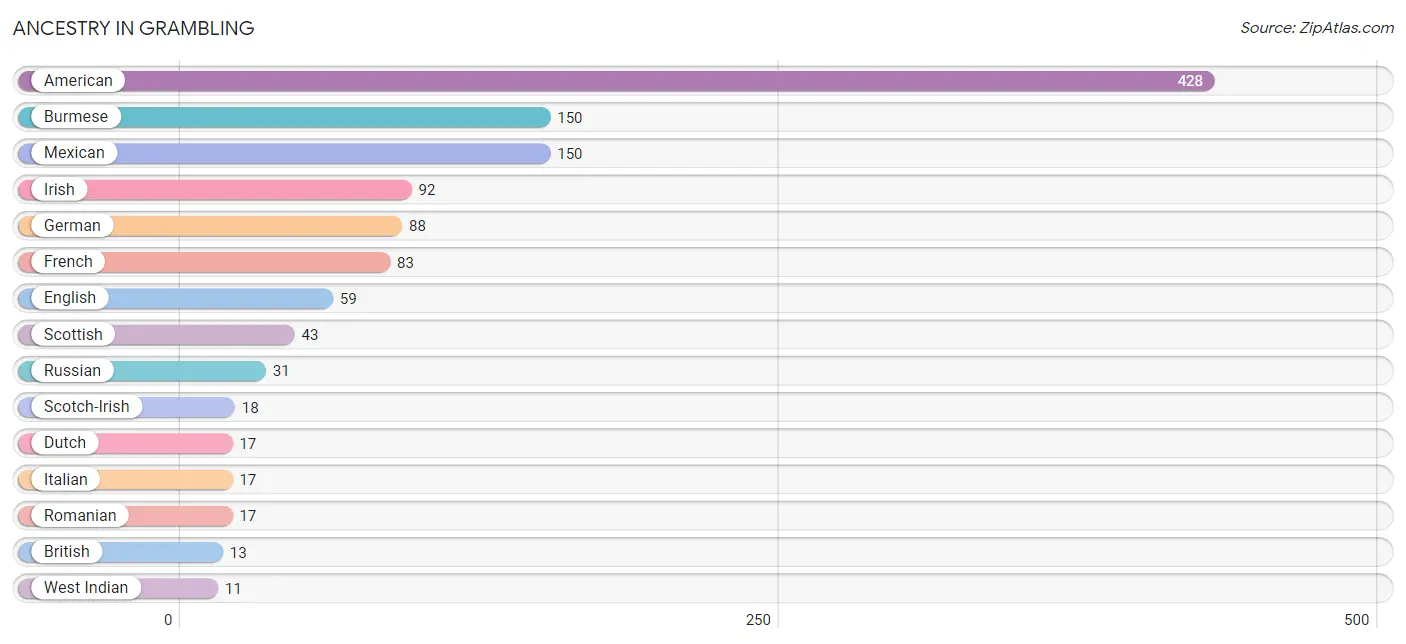
| Ancestry | # Population | % Population |
| African | 2 | 0.0% |
| American | 428 | 8.1% |
| Australian | 2 | 0.0% |
| Bhutanese | 6 | 0.1% |
| British | 13 | 0.2% |
| Burmese | 150 | 2.8% |
| Central American | 8 | 0.2% |
| Colombian | 5 | 0.1% |
| Dutch | 17 | 0.3% |
| English | 59 | 1.1% |
| French | 83 | 1.6% |
| German | 88 | 1.7% |
| Guatemalan | 8 | 0.2% |
| Irish | 92 | 1.7% |
| Italian | 17 | 0.3% |
| Mexican | 150 | 2.8% |
| Puerto Rican | 5 | 0.1% |
| Romanian | 17 | 0.3% |
| Russian | 31 | 0.6% |
| Scotch-Irish | 18 | 0.3% |
| Scottish | 43 | 0.8% |
| South American | 5 | 0.1% |
| Subsaharan African | 5 | 0.1% |
| West Indian | 11 | 0.2% | View All 24 Rows |
Immigrants in Grambling
The most numerous immigrant groups reported in Grambling came from Latin America (221 | 4.2%), Caribbean (215 | 4.1%), Dominica (206 | 3.9%), Eastern Europe (46 | 0.9%), and Europe (46 | 0.9%), together accounting for 13.8% of all Grambling residents.
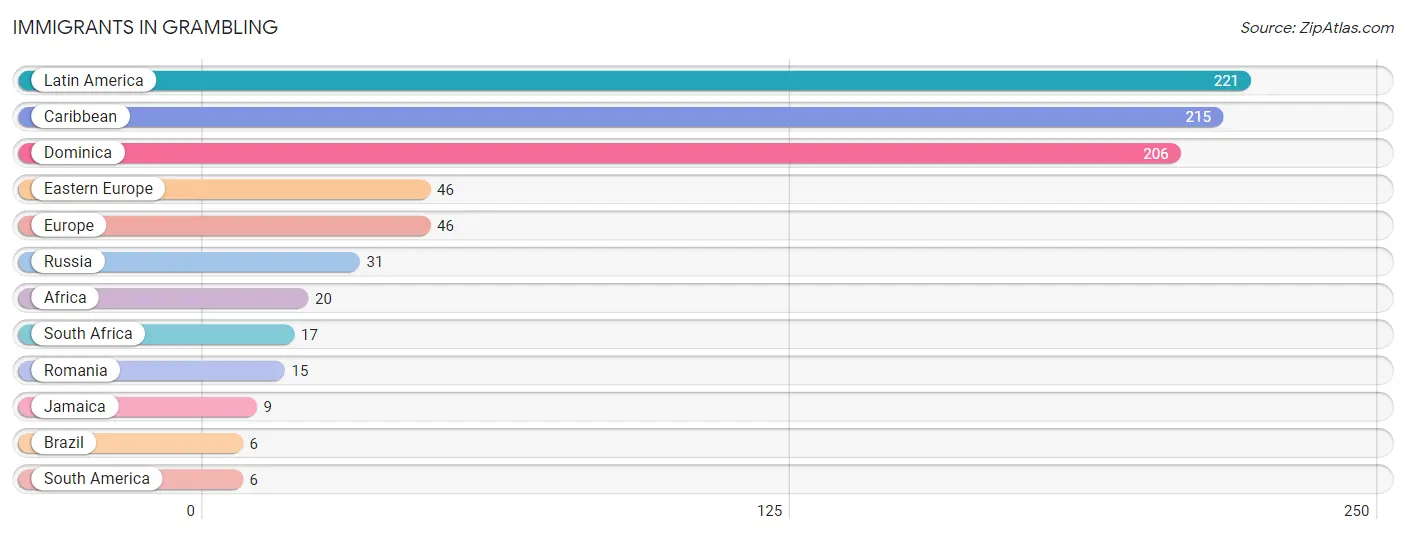
| Immigration Origin | # Population | % Population |
| Africa | 20 | 0.4% |
| Brazil | 6 | 0.1% |
| Caribbean | 215 | 4.1% |
| Dominica | 206 | 3.9% |
| Eastern Europe | 46 | 0.9% |
| Europe | 46 | 0.9% |
| Jamaica | 9 | 0.2% |
| Latin America | 221 | 4.2% |
| Romania | 15 | 0.3% |
| Russia | 31 | 0.6% |
| South Africa | 17 | 0.3% |
| South America | 6 | 0.1% | View All 12 Rows |
Sex and Age in Grambling
Sex and Age in Grambling
The most populous age groups in Grambling are 20 to 24 Years (635 | 22.2%) for men and 20 to 24 Years (758 | 30.8%) for women.
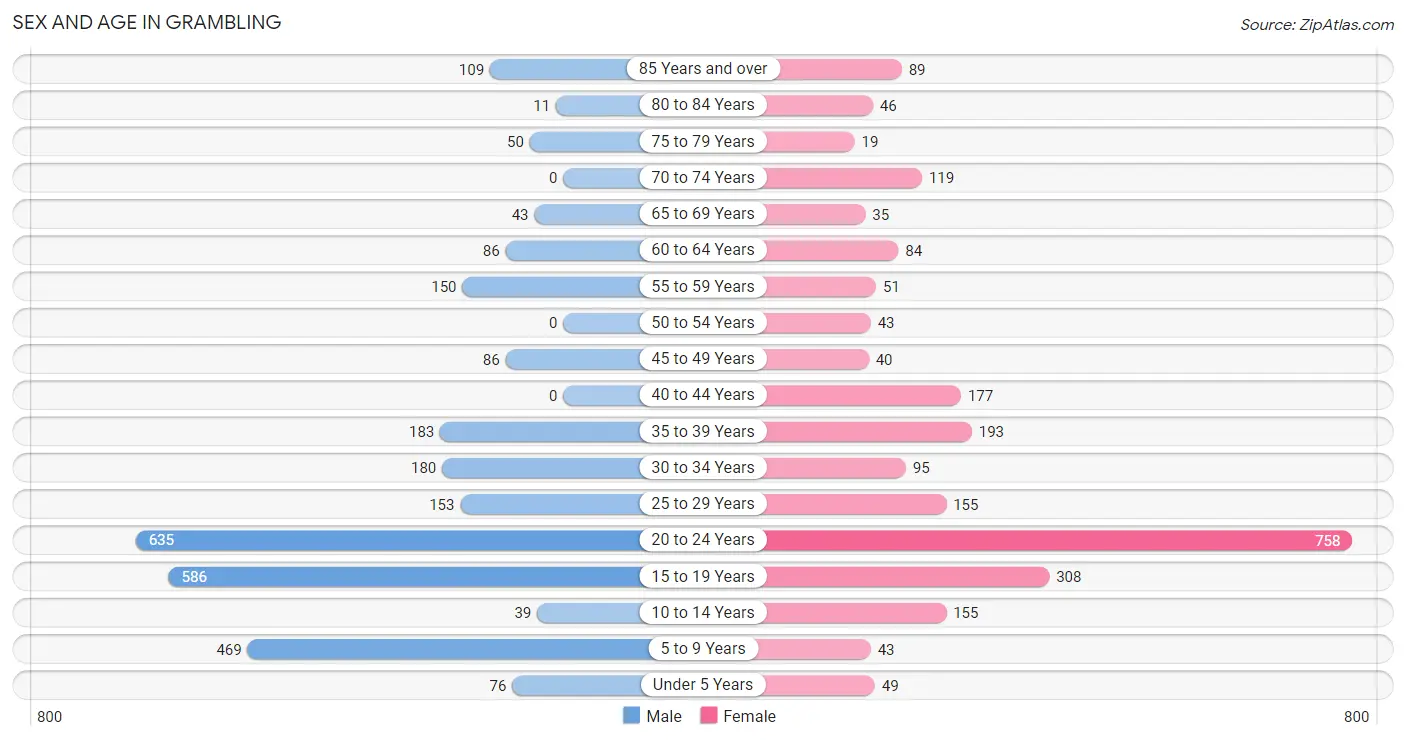
| Age Bracket | Male | Female |
| Under 5 Years | 76 (2.7%) | 49 (2.0%) |
| 5 to 9 Years | 469 (16.4%) | 43 (1.8%) |
| 10 to 14 Years | 39 (1.4%) | 155 (6.3%) |
| 15 to 19 Years | 586 (20.5%) | 308 (12.5%) |
| 20 to 24 Years | 635 (22.2%) | 758 (30.8%) |
| 25 to 29 Years | 153 (5.4%) | 155 (6.3%) |
| 30 to 34 Years | 180 (6.3%) | 95 (3.9%) |
| 35 to 39 Years | 183 (6.4%) | 193 (7.9%) |
| 40 to 44 Years | 0 (0.0%) | 177 (7.2%) |
| 45 to 49 Years | 86 (3.0%) | 40 (1.6%) |
| 50 to 54 Years | 0 (0.0%) | 43 (1.8%) |
| 55 to 59 Years | 150 (5.2%) | 51 (2.1%) |
| 60 to 64 Years | 86 (3.0%) | 84 (3.4%) |
| 65 to 69 Years | 43 (1.5%) | 35 (1.4%) |
| 70 to 74 Years | 0 (0.0%) | 119 (4.8%) |
| 75 to 79 Years | 50 (1.8%) | 19 (0.8%) |
| 80 to 84 Years | 11 (0.4%) | 46 (1.9%) |
| 85 Years and over | 109 (3.8%) | 89 (3.6%) |
| Total | 2,856 (100.0%) | 2,459 (100.0%) |
Families and Households in Grambling
Median Family Size in Grambling
The median family size in Grambling is 3.64 persons per family, with single female/mother families (320 | 38.8%) accounting for the largest median family size of 4.38 persons per family. On the other hand, single male/father families (154 | 18.7%) represent the smallest median family size with 1.60 persons per family.
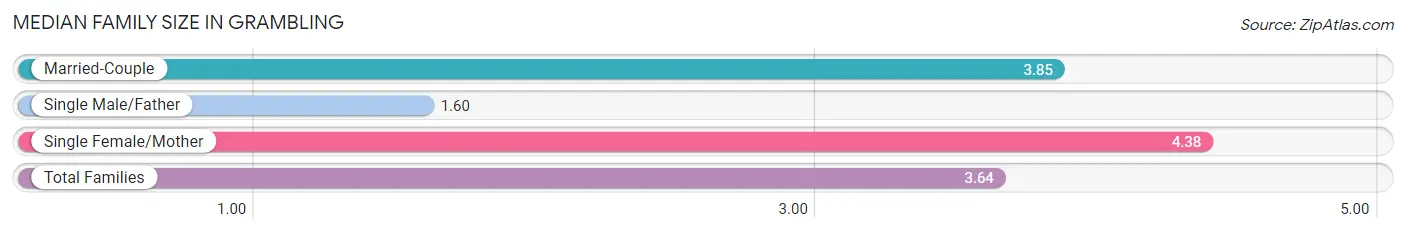
| Family Type | # Families | Family Size |
| Married-Couple | 351 (42.5%) | 3.85 |
| Single Male/Father | 154 (18.7%) | 1.60 |
| Single Female/Mother | 320 (38.8%) | 4.38 |
| Total Families | 825 (100.0%) | 3.64 |
Median Household Size in Grambling
The median household size in Grambling is 2.61 persons per household, with single female/mother households (320 | 19.6%) accounting for the largest median household size of 5.1 persons per household. non-family households (812 | 49.6%) represent the smallest median household size with 1.22 persons per household.
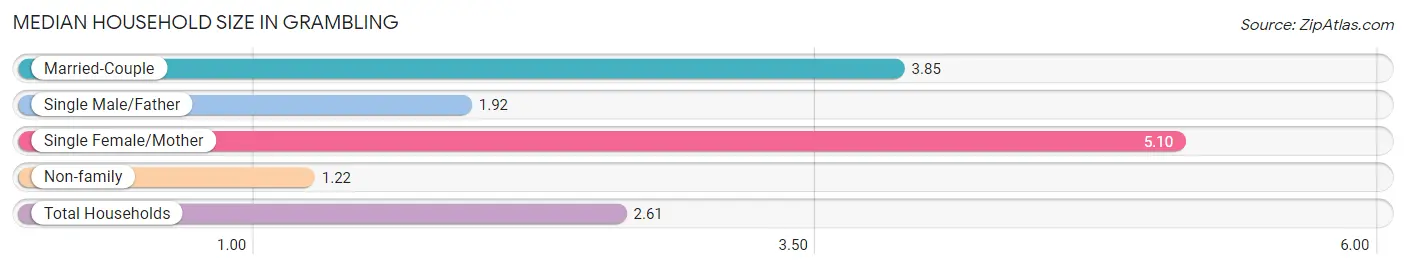
| Household Type | # Households | Household Size |
| Married-Couple | 351 (21.4%) | 3.85 |
| Single Male/Father | 154 (9.4%) | 1.92 |
| Single Female/Mother | 320 (19.6%) | 5.10 |
| Non-family | 812 (49.6%) | 1.22 |
| Total Households | 1,637 (100.0%) | 2.61 |
Household Size by Marriage Status in Grambling
Out of a total of 1,637 households in Grambling, 825 (50.4%) are family households, while 812 (49.6%) are nonfamily households. The most numerous type of family households are 2-person households, comprising 374, and the most common type of nonfamily households are 1-person households, comprising 665.
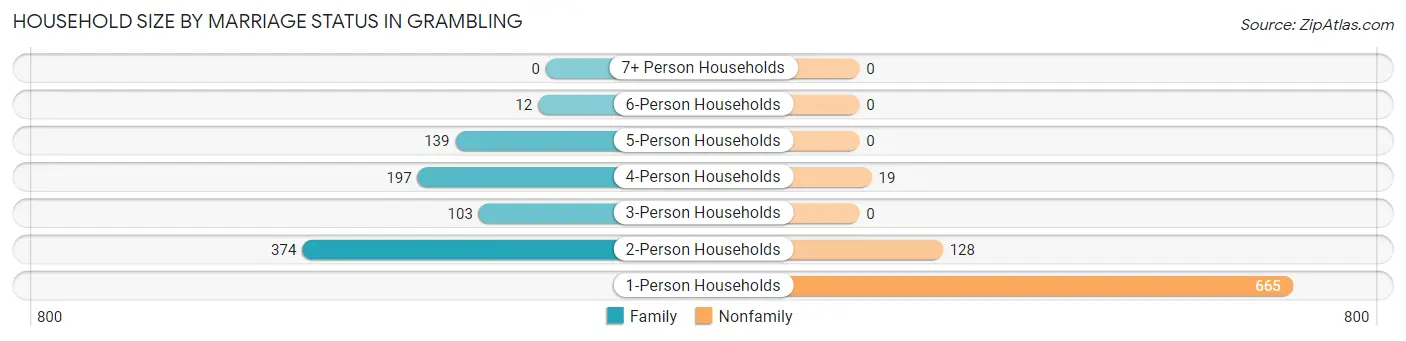
| Household Size | Family Households | Nonfamily Households |
| 1-Person Households | - | 665 (40.6%) |
| 2-Person Households | 374 (22.9%) | 128 (7.8%) |
| 3-Person Households | 103 (6.3%) | 0 (0.0%) |
| 4-Person Households | 197 (12.0%) | 19 (1.2%) |
| 5-Person Households | 139 (8.5%) | 0 (0.0%) |
| 6-Person Households | 12 (0.7%) | 0 (0.0%) |
| 7+ Person Households | 0 (0.0%) | 0 (0.0%) |
| Total | 825 (50.4%) | 812 (49.6%) |
Female Fertility in Grambling
Fertility by Age in Grambling
| Age Bracket | Women with Births | Births / 1,000 Women |
| 15 to 19 years | 0 (0.0%) | 0.0 |
| 20 to 34 years | 0 (0.0%) | 0.0 |
| 35 to 50 years | 0 (0.0%) | 0.0 |
| Total | 0 (0.0%) | 0.0 |
Fertility by Age by Marriage Status in Grambling
| Age Bracket | Married | Unmarried |
| 15 to 19 years | 0 (0.0%) | 0 (0.0%) |
| 20 to 34 years | 0 (0.0%) | 0 (0.0%) |
| 35 to 50 years | 0 (0.0%) | 0 (0.0%) |
| Total | 0 (0.0%) | 0 (0.0%) |
Fertility by Education in Grambling
| Educational Attainment | Women with Births | Births / 1,000 Women |
| Less than High School | 0 (0.0%) | 0.0 |
| High School Diploma | 0 (0.0%) | 0.0 |
| College or Associate's Degree | 0 (0.0%) | 0.0 |
| Bachelor's Degree | 0 (0.0%) | 0.0 |
| Graduate Degree | 0 (0.0%) | 0.0 |
| Total | 0 (0.0%) | 0.0 |
Fertility by Education by Marriage Status in Grambling
| Educational Attainment | Married | Unmarried |
| Less than High School | 0 (0.0%) | 0 (0.0%) |
| High School Diploma | 0 (0.0%) | 0 (0.0%) |
| College or Associate's Degree | 0 (0.0%) | 0 (0.0%) |
| Bachelor's Degree | 0 (0.0%) | 0 (0.0%) |
| Graduate Degree | 0 (0.0%) | 0 (0.0%) |
| Total | 0 (0.0%) | 0 (0.0%) |
Employment Characteristics in Grambling
Employment by Class of Employer in Grambling
Among the 1,806 employed individuals in Grambling, private company employees (855 | 47.3%), state government employees (653 | 36.2%), and not-for-profit organizations (149 | 8.3%) make up the most common classes of employment.
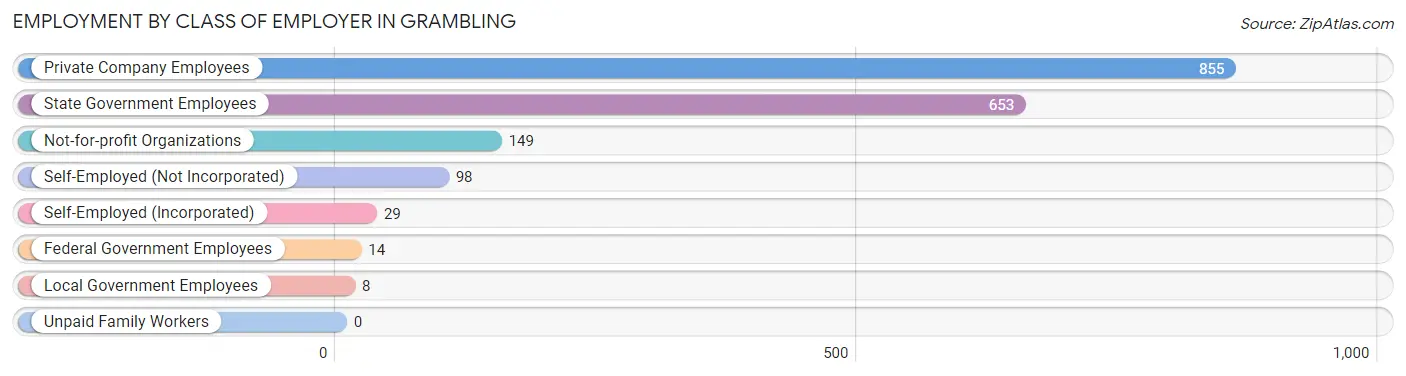
| Employer Class | # Employees | % Employees |
| Private Company Employees | 855 | 47.3% |
| Self-Employed (Incorporated) | 29 | 1.6% |
| Self-Employed (Not Incorporated) | 98 | 5.4% |
| Not-for-profit Organizations | 149 | 8.3% |
| Local Government Employees | 8 | 0.4% |
| State Government Employees | 653 | 36.2% |
| Federal Government Employees | 14 | 0.8% |
| Unpaid Family Workers | 0 | 0.0% |
| Total | 1,806 | 100.0% |
Employment Status by Age in Grambling
According to the labor force statistics for Grambling, out of the total population over 16 years of age (4,357), 44.0% or 1,917 individuals are in the labor force, with 3.4% or 65 of them unemployed. The age group with the highest labor force participation rate is 30 to 34 years, with 89.5% or 246 individuals in the labor force. Within the labor force, the 30 to 34 years age range has the highest percentage of unemployed individuals, with 24.8% or 61 of them being unemployed.
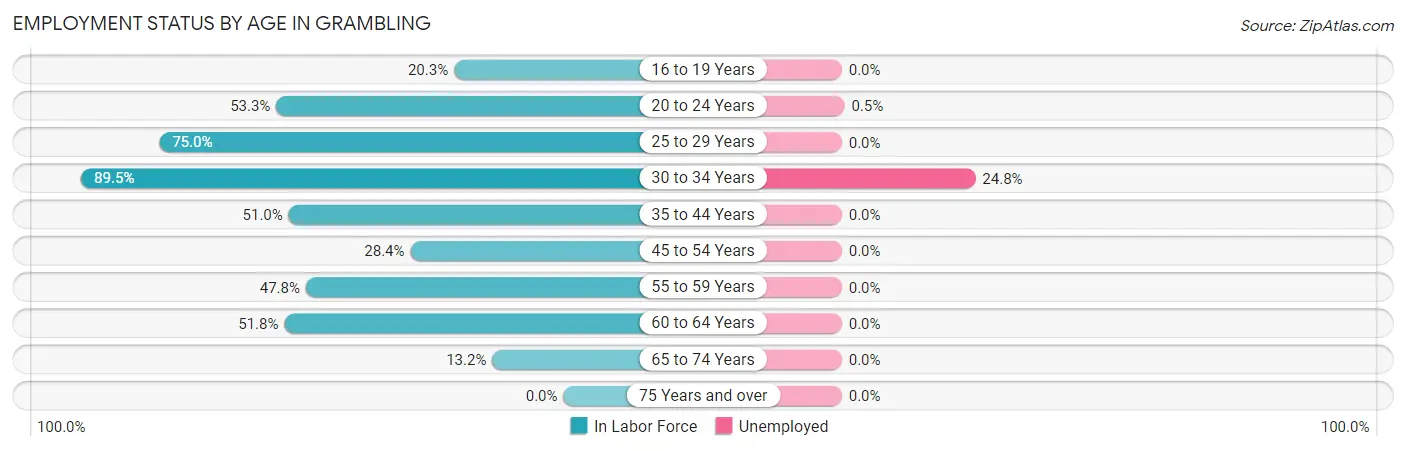
| Age Bracket | In Labor Force | Unemployed |
| 16 to 19 Years | 156 (20.3%) | 0 (0.0%) |
| 20 to 24 Years | 742 (53.3%) | 4 (0.5%) |
| 25 to 29 Years | 231 (75.0%) | 0 (0.0%) |
| 30 to 34 Years | 246 (89.5%) | 61 (24.8%) |
| 35 to 44 Years | 282 (51.0%) | 0 (0.0%) |
| 45 to 54 Years | 48 (28.4%) | 0 (0.0%) |
| 55 to 59 Years | 96 (47.8%) | 0 (0.0%) |
| 60 to 64 Years | 88 (51.8%) | 0 (0.0%) |
| 65 to 74 Years | 26 (13.2%) | 0 (0.0%) |
| 75 Years and over | 0 (0.0%) | 0 (0.0%) |
| Total | 1,917 (44.0%) | 65 (3.4%) |
Employment Status by Educational Attainment in Grambling
According to labor force statistics for Grambling, 59.1% of individuals (991) out of the total population between 25 and 64 years of age (1,676) are in the labor force, with 6.2% or 61 of them being unemployed. The group with the highest labor force participation rate are those with the educational attainment of bachelor's degree or higher, with 77.0% or 459 individuals in the labor force. Within the labor force, individuals with bachelor's degree or higher education have the highest percentage of unemployment, with 13.3% or 61 of them being unemployed.
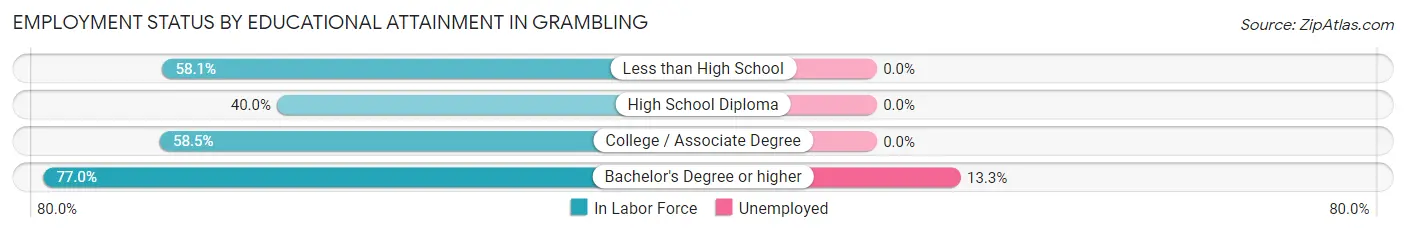
| Educational Attainment | In Labor Force | Unemployed |
| Less than High School | 125 (58.1%) | 0 (0.0%) |
| High School Diploma | 215 (40.0%) | 0 (0.0%) |
| College / Associate Degree | 192 (58.5%) | 0 (0.0%) |
| Bachelor's Degree or higher | 459 (77.0%) | 79 (13.3%) |
| Total | 991 (59.1%) | 104 (6.2%) |
Employment Occupations by Sex in Grambling
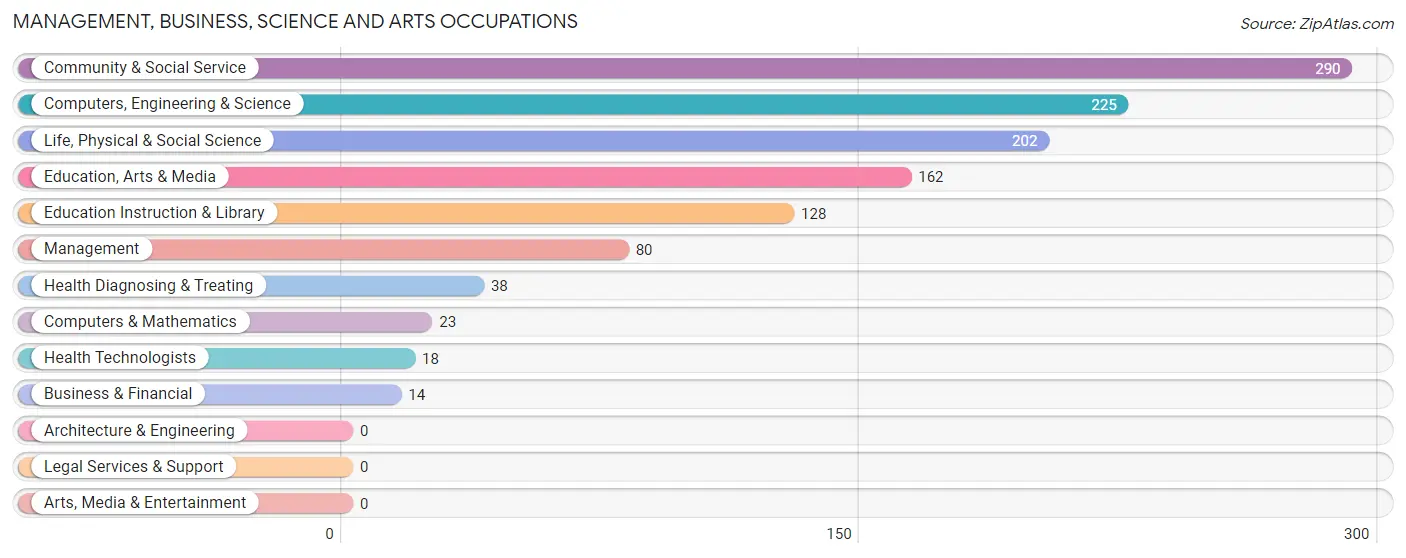
Management, Business, Science and Arts Occupations
The most common Management, Business, Science and Arts occupations in Grambling are Community & Social Service (290 | 15.7%), Computers, Engineering & Science (225 | 12.2%), Life, Physical & Social Science (202 | 10.9%), Education, Arts & Media (162 | 8.8%), and Education Instruction & Library (128 | 6.9%).
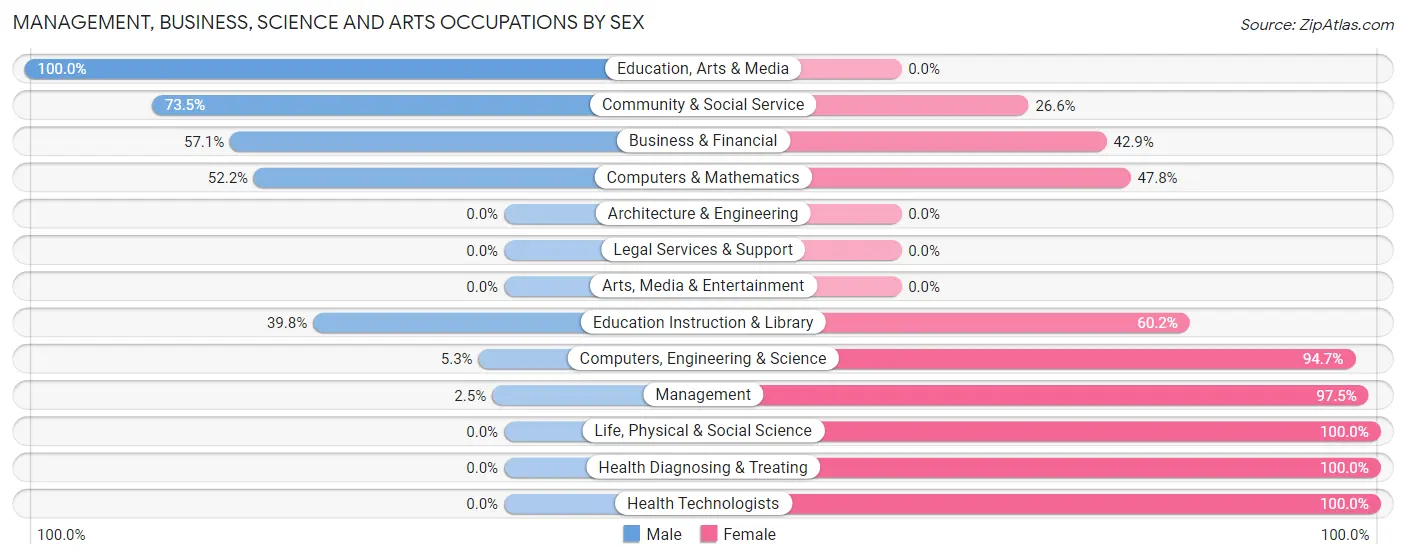
Management, Business, Science and Arts Occupations by Sex
Within the Management, Business, Science and Arts occupations in Grambling, the most male-oriented occupations are Education, Arts & Media (100.0%), Community & Social Service (73.5%), and Business & Financial (57.1%), while the most female-oriented occupations are Life, Physical & Social Science (100.0%), Health Diagnosing & Treating (100.0%), and Health Technologists (100.0%).
| Occupation | Male | Female |
| Management | 2 (2.5%) | 78 (97.5%) |
| Business & Financial | 8 (57.1%) | 6 (42.9%) |
| Computers, Engineering & Science | 12 (5.3%) | 213 (94.7%) |
| Computers & Mathematics | 12 (52.2%) | 11 (47.8%) |
| Architecture & Engineering | 0 (0.0%) | 0 (0.0%) |
| Life, Physical & Social Science | 0 (0.0%) | 202 (100.0%) |
| Community & Social Service | 213 (73.5%) | 77 (26.6%) |
| Education, Arts & Media | 162 (100.0%) | 0 (0.0%) |
| Legal Services & Support | 0 (0.0%) | 0 (0.0%) |
| Education Instruction & Library | 51 (39.8%) | 77 (60.2%) |
| Arts, Media & Entertainment | 0 (0.0%) | 0 (0.0%) |
| Health Diagnosing & Treating | 0 (0.0%) | 38 (100.0%) |
| Health Technologists | 0 (0.0%) | 18 (100.0%) |
| Total (Category) | 235 (36.3%) | 412 (63.7%) |
| Total (Overall) | 868 (46.9%) | 982 (53.1%) |
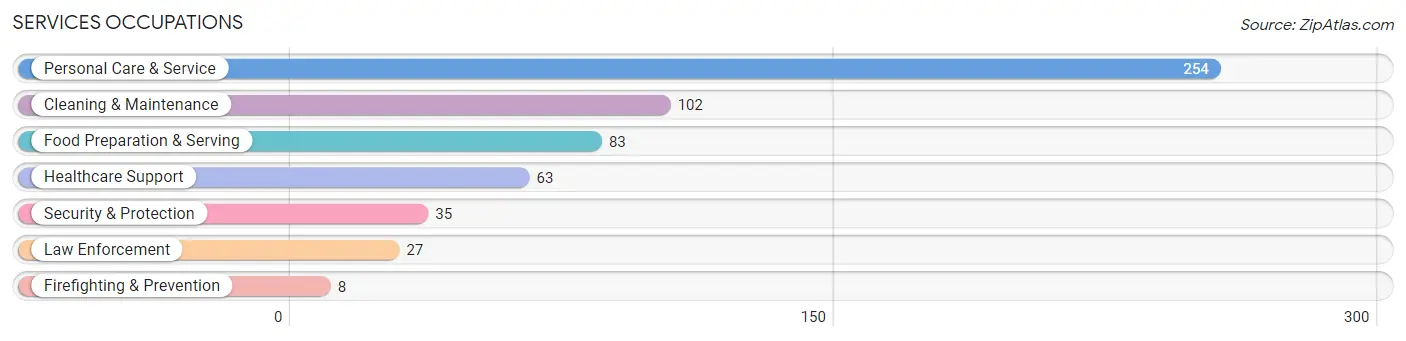
Services Occupations
The most common Services occupations in Grambling are Personal Care & Service (254 | 13.7%), Cleaning & Maintenance (102 | 5.5%), Food Preparation & Serving (83 | 4.5%), Healthcare Support (63 | 3.4%), and Security & Protection (35 | 1.9%).
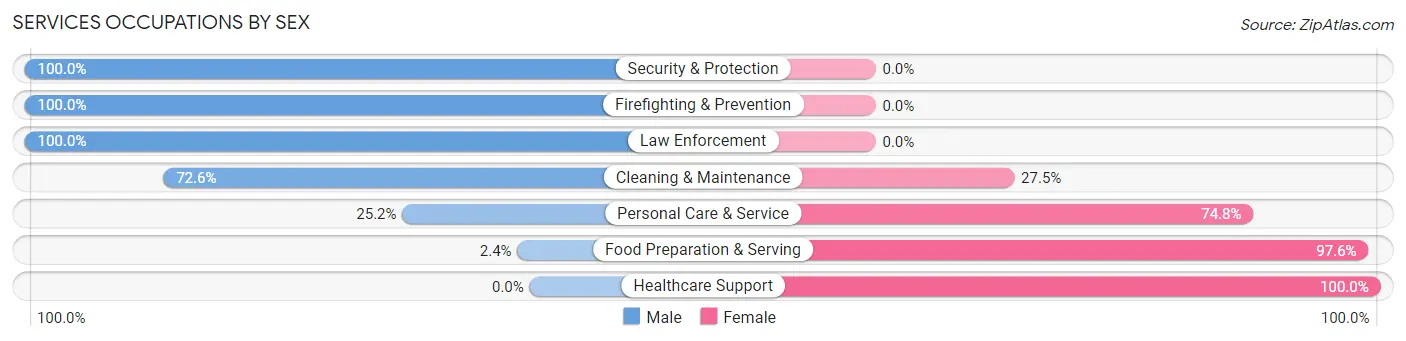
Services Occupations by Sex
Within the Services occupations in Grambling, the most male-oriented occupations are Security & Protection (100.0%), Firefighting & Prevention (100.0%), and Law Enforcement (100.0%), while the most female-oriented occupations are Healthcare Support (100.0%), Food Preparation & Serving (97.6%), and Personal Care & Service (74.8%).
| Occupation | Male | Female |
| Healthcare Support | 0 (0.0%) | 63 (100.0%) |
| Security & Protection | 35 (100.0%) | 0 (0.0%) |
| Firefighting & Prevention | 8 (100.0%) | 0 (0.0%) |
| Law Enforcement | 27 (100.0%) | 0 (0.0%) |
| Food Preparation & Serving | 2 (2.4%) | 81 (97.6%) |
| Cleaning & Maintenance | 74 (72.6%) | 28 (27.5%) |
| Personal Care & Service | 64 (25.2%) | 190 (74.8%) |
| Total (Category) | 175 (32.6%) | 362 (67.4%) |
| Total (Overall) | 868 (46.9%) | 982 (53.1%) |
Sales and Office Occupations
The most common Sales and Office occupations in Grambling are Office & Administration (248 | 13.4%), and Sales & Related (143 | 7.7%).

Sales and Office Occupations by Sex
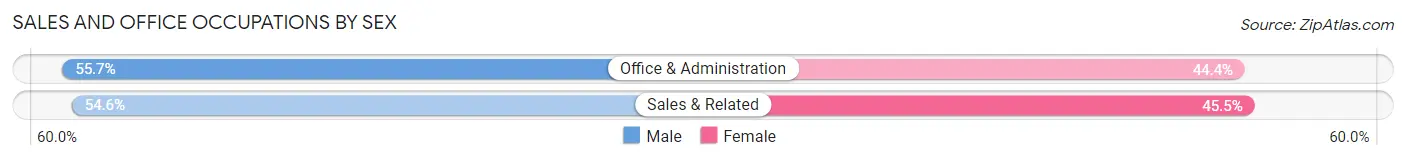
| Occupation | Male | Female |
| Sales & Related | 78 (54.5%) | 65 (45.5%) |
| Office & Administration | 138 (55.6%) | 110 (44.4%) |
| Total (Category) | 216 (55.2%) | 175 (44.8%) |
| Total (Overall) | 868 (46.9%) | 982 (53.1%) |
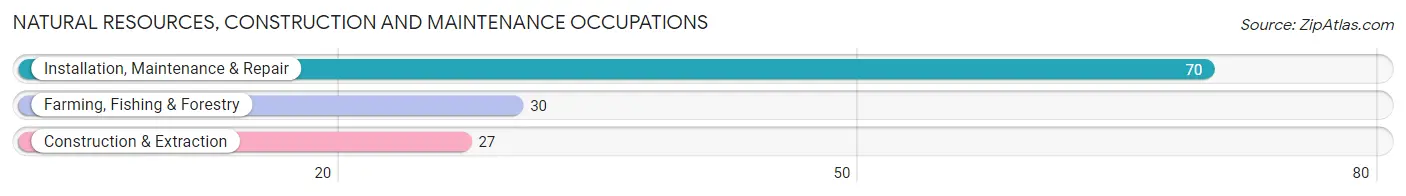
Natural Resources, Construction and Maintenance Occupations
The most common Natural Resources, Construction and Maintenance occupations in Grambling are Installation, Maintenance & Repair (70 | 3.8%), Farming, Fishing & Forestry (30 | 1.6%), and Construction & Extraction (27 | 1.5%).
Natural Resources, Construction and Maintenance Occupations by Sex
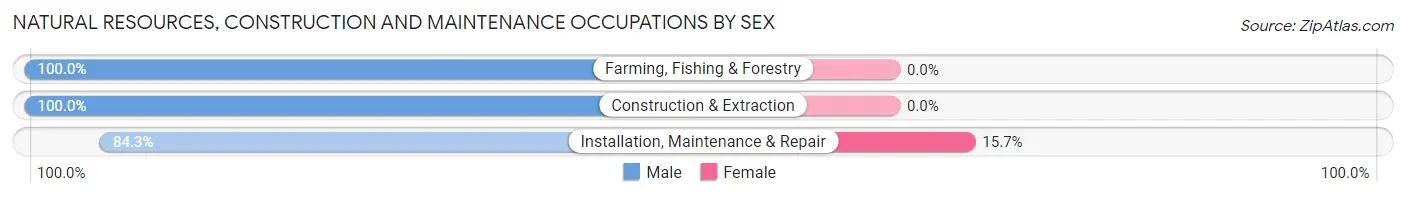
| Occupation | Male | Female |
| Farming, Fishing & Forestry | 30 (100.0%) | 0 (0.0%) |
| Construction & Extraction | 27 (100.0%) | 0 (0.0%) |
| Installation, Maintenance & Repair | 59 (84.3%) | 11 (15.7%) |
| Total (Category) | 116 (91.3%) | 11 (8.7%) |
| Total (Overall) | 868 (46.9%) | 982 (53.1%) |
Production, Transportation and Moving Occupations
The most common Production, Transportation and Moving occupations in Grambling are Production (89 | 4.8%), Material Moving (48 | 2.6%), and Transportation (11 | 0.6%).
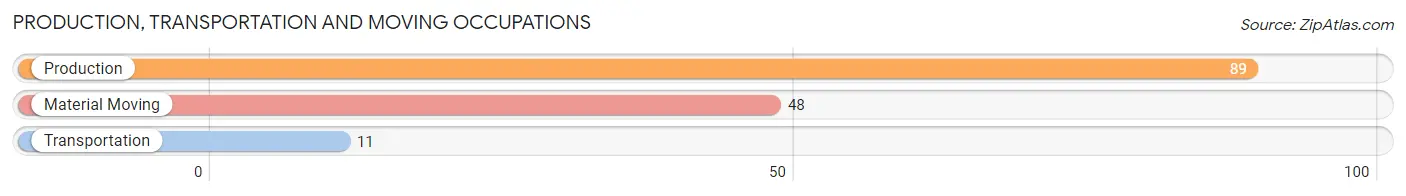
Production, Transportation and Moving Occupations by Sex
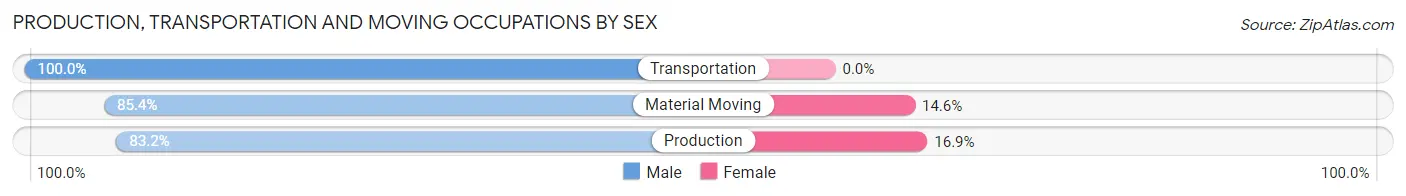
| Occupation | Male | Female |
| Production | 74 (83.2%) | 15 (16.9%) |
| Transportation | 11 (100.0%) | 0 (0.0%) |
| Material Moving | 41 (85.4%) | 7 (14.6%) |
| Total (Category) | 126 (85.1%) | 22 (14.9%) |
| Total (Overall) | 868 (46.9%) | 982 (53.1%) |
Employment Industries by Sex in Grambling
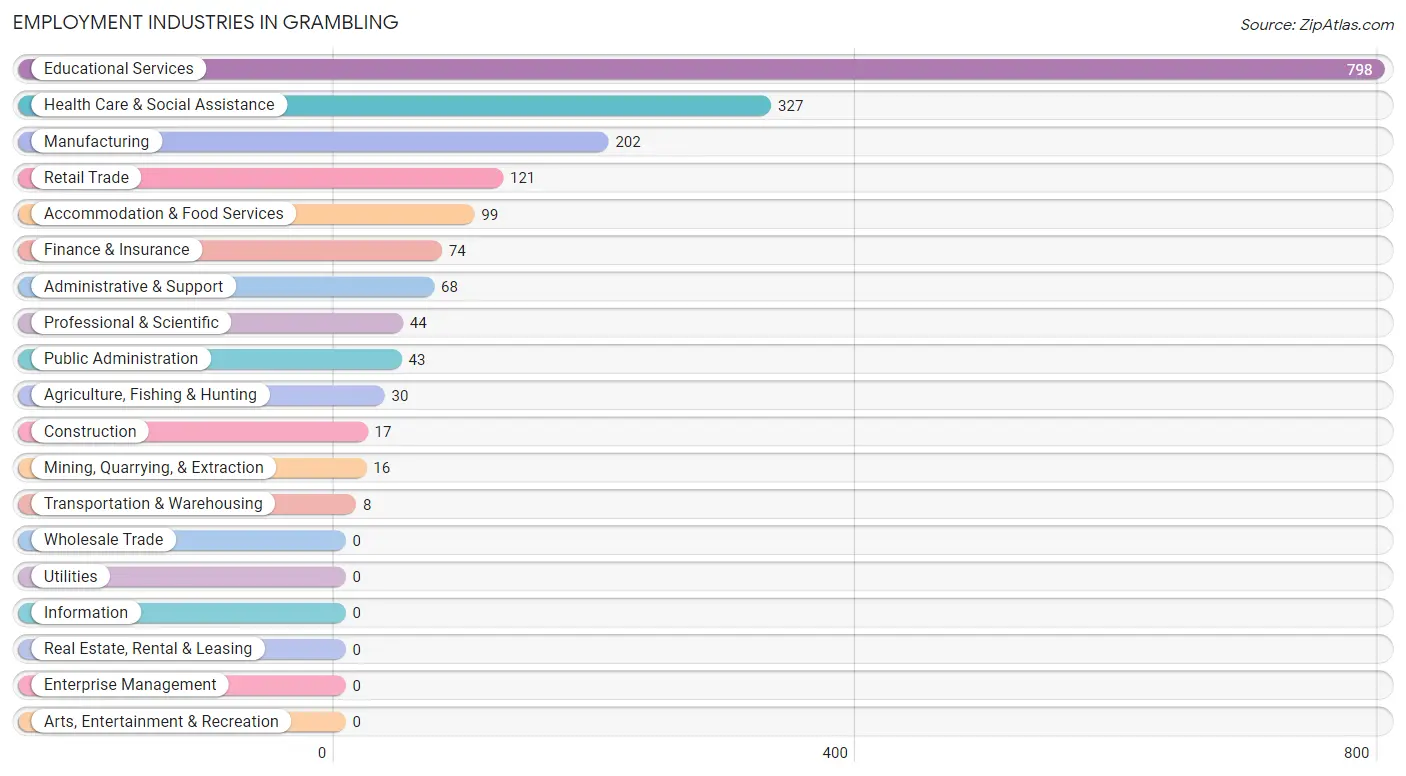
Employment Industries in Grambling
The major employment industries in Grambling include Educational Services (798 | 43.1%), Health Care & Social Assistance (327 | 17.7%), Manufacturing (202 | 10.9%), Retail Trade (121 | 6.5%), and Accommodation & Food Services (99 | 5.3%).
Employment Industries by Sex in Grambling
The Grambling industries that see more men than women are Agriculture, Fishing & Hunting (100.0%), Construction (100.0%), and Transportation & Warehousing (100.0%), whereas the industries that tend to have a higher number of women are Accommodation & Food Services (98.0%), Educational Services (77.8%), and Health Care & Social Assistance (50.5%).
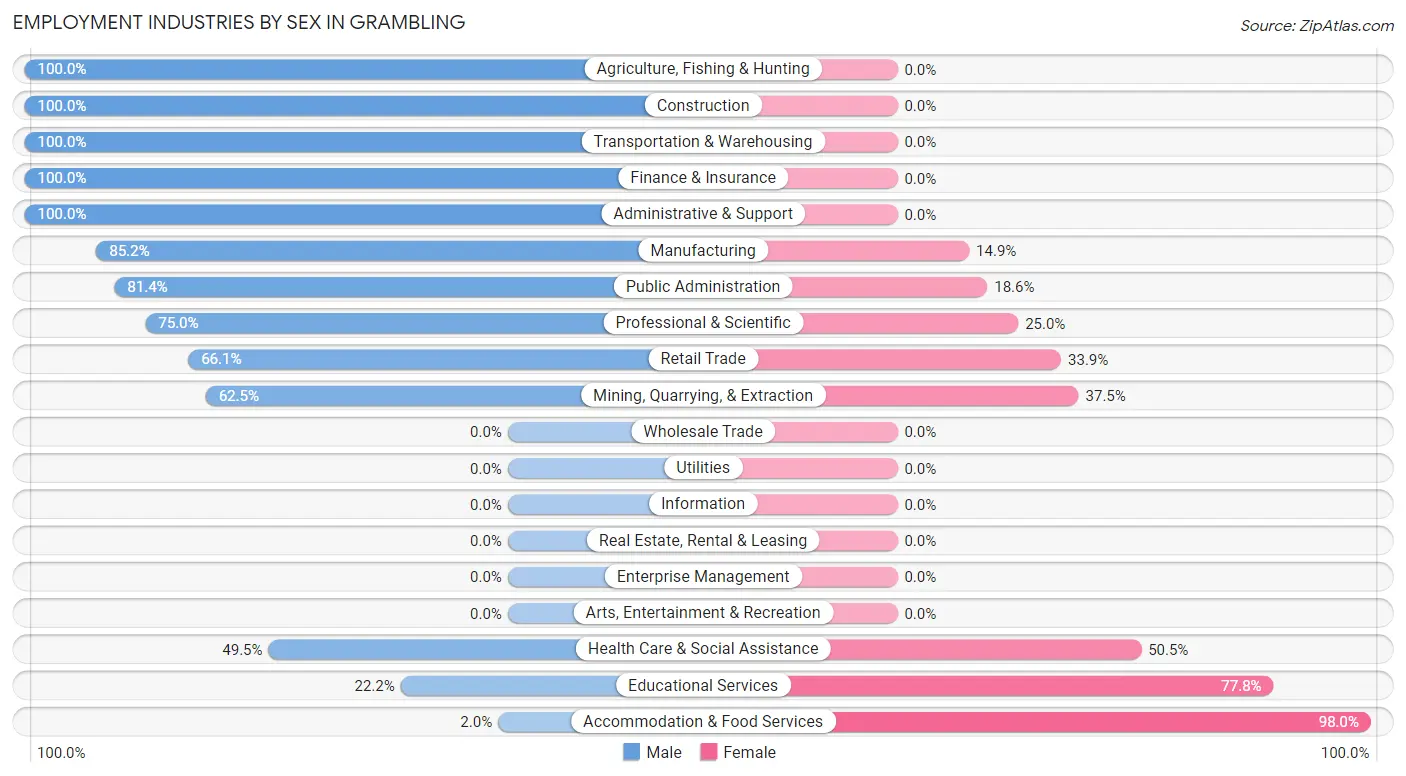
| Industry | Male | Female |
| Agriculture, Fishing & Hunting | 30 (100.0%) | 0 (0.0%) |
| Mining, Quarrying, & Extraction | 10 (62.5%) | 6 (37.5%) |
| Construction | 17 (100.0%) | 0 (0.0%) |
| Manufacturing | 172 (85.2%) | 30 (14.8%) |
| Wholesale Trade | 0 (0.0%) | 0 (0.0%) |
| Retail Trade | 80 (66.1%) | 41 (33.9%) |
| Transportation & Warehousing | 8 (100.0%) | 0 (0.0%) |
| Utilities | 0 (0.0%) | 0 (0.0%) |
| Information | 0 (0.0%) | 0 (0.0%) |
| Finance & Insurance | 74 (100.0%) | 0 (0.0%) |
| Real Estate, Rental & Leasing | 0 (0.0%) | 0 (0.0%) |
| Professional & Scientific | 33 (75.0%) | 11 (25.0%) |
| Enterprise Management | 0 (0.0%) | 0 (0.0%) |
| Administrative & Support | 68 (100.0%) | 0 (0.0%) |
| Educational Services | 177 (22.2%) | 621 (77.8%) |
| Health Care & Social Assistance | 162 (49.5%) | 165 (50.5%) |
| Arts, Entertainment & Recreation | 0 (0.0%) | 0 (0.0%) |
| Accommodation & Food Services | 2 (2.0%) | 97 (98.0%) |
| Public Administration | 35 (81.4%) | 8 (18.6%) |
| Total | 868 (46.9%) | 982 (53.1%) |
Education in Grambling
School Enrollment in Grambling
The most common levels of schooling among the 2,879 students in Grambling are college / undergraduate (1,404 | 48.8%), elementary school (473 | 16.4%), and graduate / professional (390 | 13.6%).
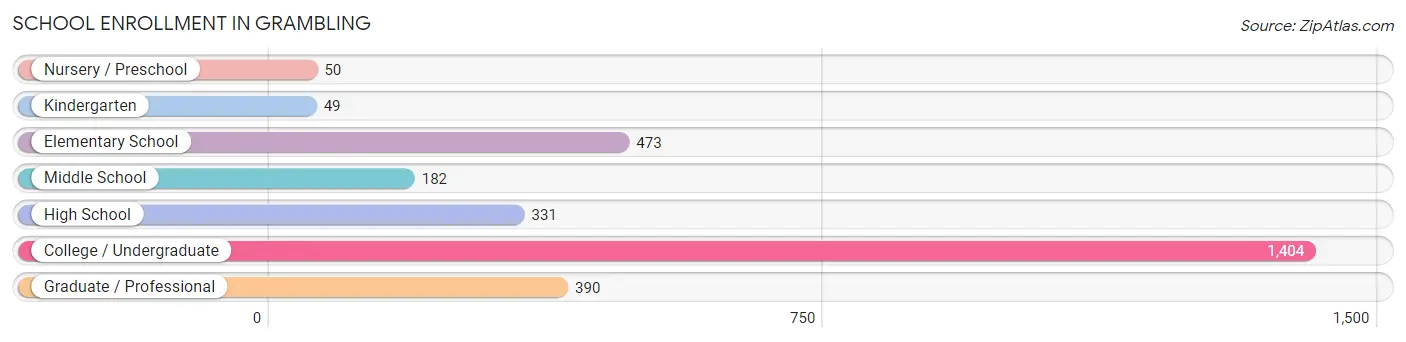
| School Level | # Students | % Students |
| Nursery / Preschool | 50 | 1.7% |
| Kindergarten | 49 | 1.7% |
| Elementary School | 473 | 16.4% |
| Middle School | 182 | 6.3% |
| High School | 331 | 11.5% |
| College / Undergraduate | 1,404 | 48.8% |
| Graduate / Professional | 390 | 13.6% |
| Total | 2,879 | 100.0% |
School Enrollment by Age by Funding Source in Grambling
Out of a total of 2,879 students who are enrolled in schools in Grambling, 233 (8.1%) attend a private institution, while the remaining 2,646 (91.9%) are enrolled in public schools. The age group of 20 to 24 year olds has the highest likelihood of being enrolled in private schools, with 207 (20.8% in the age bracket) enrolled. Conversely, the age group of 3 to 4 year olds has the lowest likelihood of being enrolled in a private school, with 41 (100.0% in the age bracket) attending a public institution.
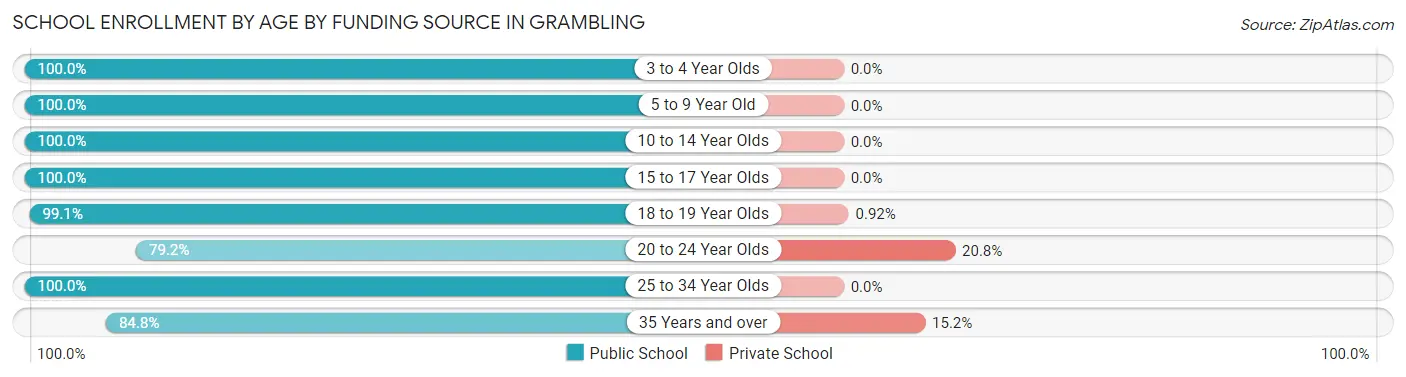
| Age Bracket | Public School | Private School |
| 3 to 4 Year Olds | 41 (100.0%) | 0 (0.0%) |
| 5 to 9 Year Old | 512 (100.0%) | 0 (0.0%) |
| 10 to 14 Year Olds | 194 (100.0%) | 0 (0.0%) |
| 15 to 17 Year Olds | 225 (100.0%) | 0 (0.0%) |
| 18 to 19 Year Olds | 538 (99.1%) | 5 (0.9%) |
| 20 to 24 Year Olds | 790 (79.2%) | 207 (20.8%) |
| 25 to 34 Year Olds | 222 (100.0%) | 0 (0.0%) |
| 35 Years and over | 123 (84.8%) | 22 (15.2%) |
| Total | 2,646 (91.9%) | 233 (8.1%) |
Educational Attainment by Field of Study in Grambling
Arts & humanities (294 | 31.5%), education (253 | 27.1%), business (137 | 14.7%), bio, nature & agricultural (70 | 7.5%), and liberal arts & history (61 | 6.5%) are the most common fields of study among 934 individuals in Grambling who have obtained a bachelor's degree or higher.
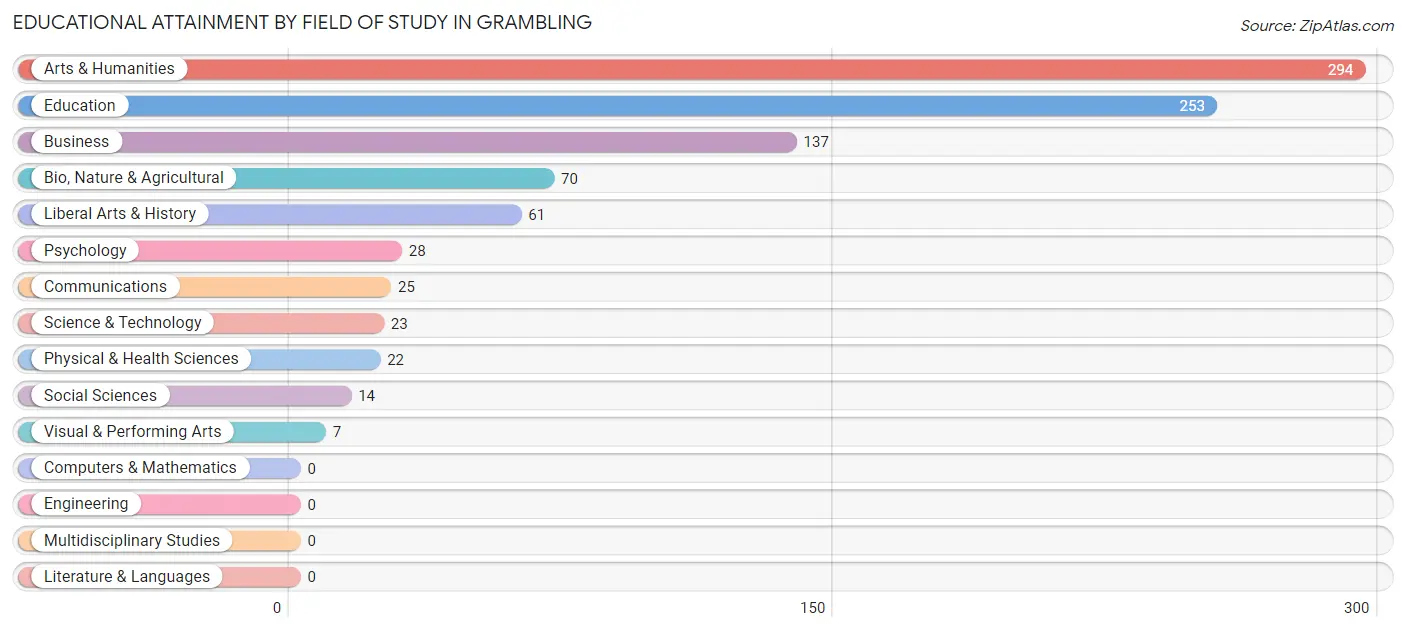
| Field of Study | # Graduates | % Graduates |
| Computers & Mathematics | 0 | 0.0% |
| Bio, Nature & Agricultural | 70 | 7.5% |
| Physical & Health Sciences | 22 | 2.4% |
| Psychology | 28 | 3.0% |
| Social Sciences | 14 | 1.5% |
| Engineering | 0 | 0.0% |
| Multidisciplinary Studies | 0 | 0.0% |
| Science & Technology | 23 | 2.5% |
| Business | 137 | 14.7% |
| Education | 253 | 27.1% |
| Literature & Languages | 0 | 0.0% |
| Liberal Arts & History | 61 | 6.5% |
| Visual & Performing Arts | 7 | 0.7% |
| Communications | 25 | 2.7% |
| Arts & Humanities | 294 | 31.5% |
| Total | 934 | 100.0% |
Transportation & Commute in Grambling
Vehicle Availability by Sex in Grambling
The most prevalent vehicle ownership categories in Grambling are males with 2 vehicles (452, accounting for 60.8%) and females with 2 vehicles (154, making up 77.9%).
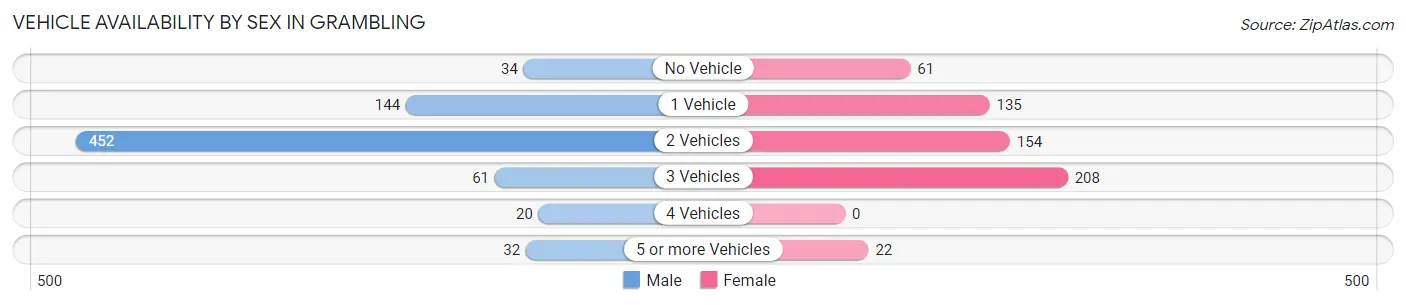
| Vehicles Available | Male | Female |
| No Vehicle | 34 (4.6%) | 61 (10.5%) |
| 1 Vehicle | 144 (19.4%) | 135 (23.3%) |
| 2 Vehicles | 452 (60.8%) | 154 (26.6%) |
| 3 Vehicles | 61 (8.2%) | 208 (35.9%) |
| 4 Vehicles | 20 (2.7%) | 0 (0.0%) |
| 5 or more Vehicles | 32 (4.3%) | 22 (3.8%) |
| Total | 743 (100.0%) | 580 (100.0%) |
Commute Time in Grambling
The most frequently occuring commute durations in Grambling are 15 to 19 minutes (560 commuters, 39.2%), 10 to 14 minutes (240 commuters, 16.8%), and 20 to 24 minutes (199 commuters, 13.9%).
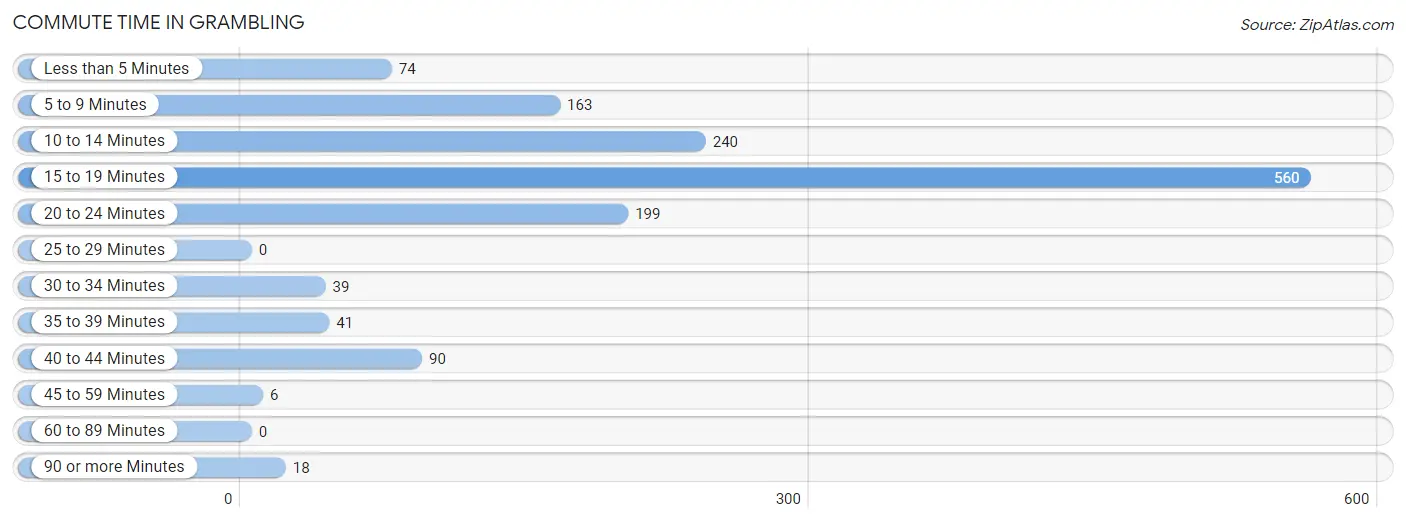
| Commute Time | # Commuters | % Commuters |
| Less than 5 Minutes | 74 | 5.2% |
| 5 to 9 Minutes | 163 | 11.4% |
| 10 to 14 Minutes | 240 | 16.8% |
| 15 to 19 Minutes | 560 | 39.2% |
| 20 to 24 Minutes | 199 | 13.9% |
| 25 to 29 Minutes | 0 | 0.0% |
| 30 to 34 Minutes | 39 | 2.7% |
| 35 to 39 Minutes | 41 | 2.9% |
| 40 to 44 Minutes | 90 | 6.3% |
| 45 to 59 Minutes | 6 | 0.4% |
| 60 to 89 Minutes | 0 | 0.0% |
| 90 or more Minutes | 18 | 1.3% |
Commute Time by Sex in Grambling
The most common commute times in Grambling are 15 to 19 minutes (284 commuters, 38.6%) for males and 15 to 19 minutes (276 commuters, 39.8%) for females.
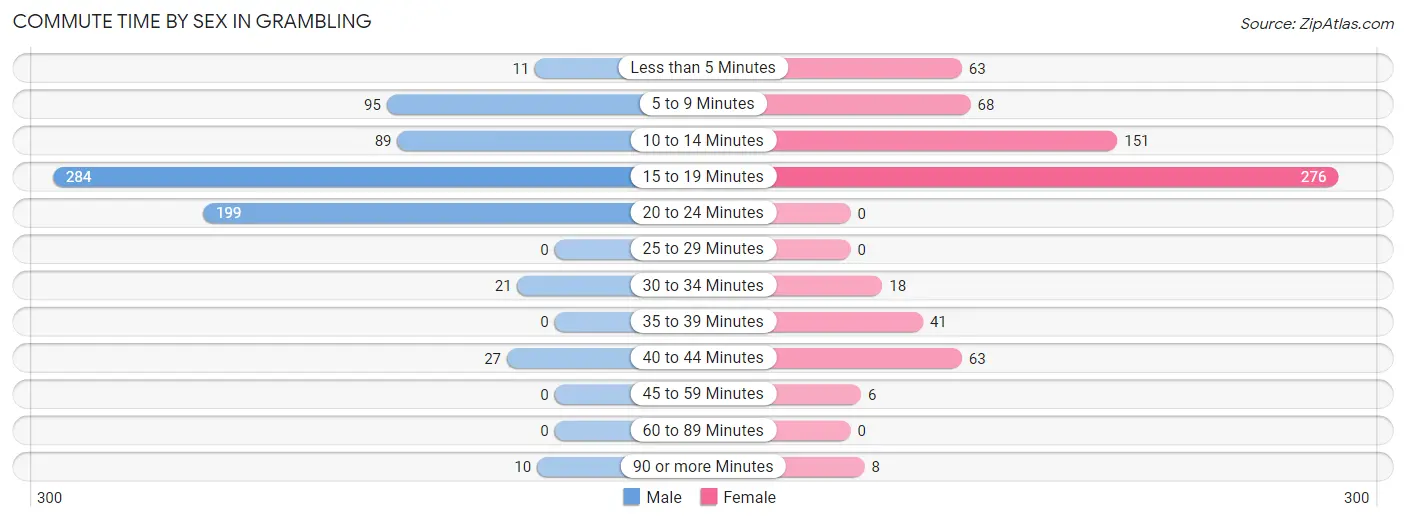
| Commute Time | Male | Female |
| Less than 5 Minutes | 11 (1.5%) | 63 (9.1%) |
| 5 to 9 Minutes | 95 (12.9%) | 68 (9.8%) |
| 10 to 14 Minutes | 89 (12.1%) | 151 (21.8%) |
| 15 to 19 Minutes | 284 (38.6%) | 276 (39.8%) |
| 20 to 24 Minutes | 199 (27.0%) | 0 (0.0%) |
| 25 to 29 Minutes | 0 (0.0%) | 0 (0.0%) |
| 30 to 34 Minutes | 21 (2.9%) | 18 (2.6%) |
| 35 to 39 Minutes | 0 (0.0%) | 41 (5.9%) |
| 40 to 44 Minutes | 27 (3.7%) | 63 (9.1%) |
| 45 to 59 Minutes | 0 (0.0%) | 6 (0.9%) |
| 60 to 89 Minutes | 0 (0.0%) | 0 (0.0%) |
| 90 or more Minutes | 10 (1.4%) | 8 (1.1%) |
Time of Departure to Work by Sex in Grambling
The most frequent times of departure to work in Grambling are 7:00 AM to 7:29 AM (135, 18.3%) for males and 7:30 AM to 7:59 AM (323, 46.5%) for females.
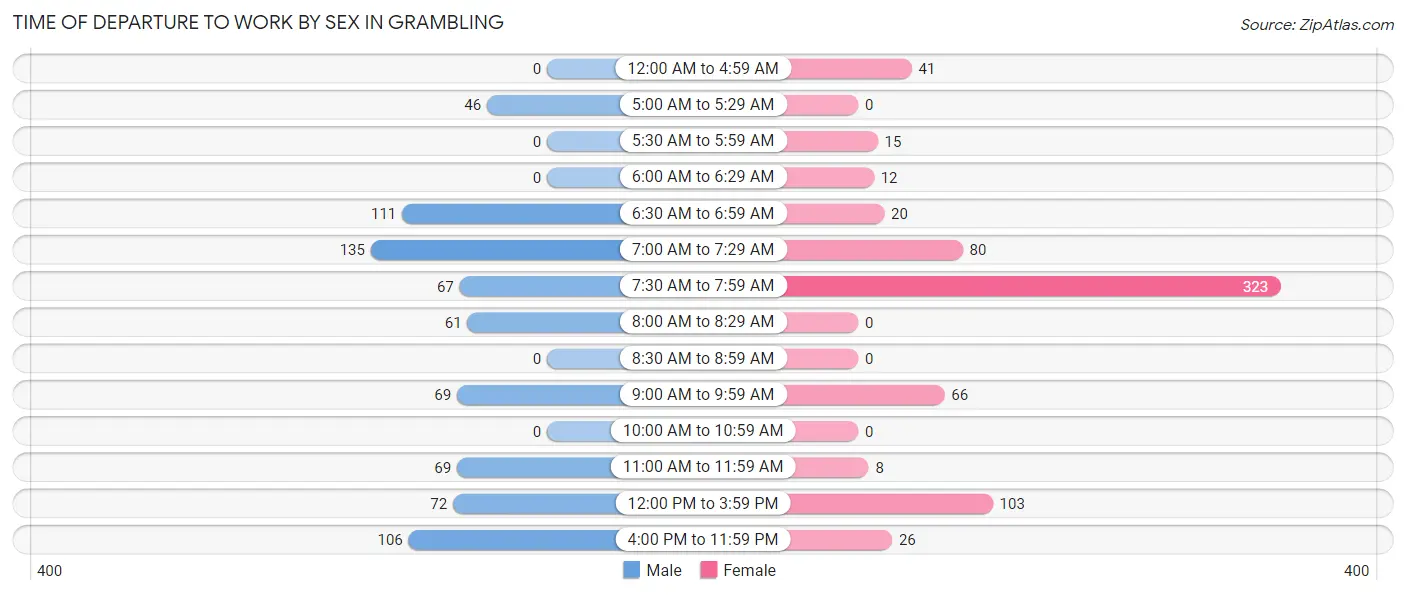
| Time of Departure | Male | Female |
| 12:00 AM to 4:59 AM | 0 (0.0%) | 41 (5.9%) |
| 5:00 AM to 5:29 AM | 46 (6.2%) | 0 (0.0%) |
| 5:30 AM to 5:59 AM | 0 (0.0%) | 15 (2.2%) |
| 6:00 AM to 6:29 AM | 0 (0.0%) | 12 (1.7%) |
| 6:30 AM to 6:59 AM | 111 (15.1%) | 20 (2.9%) |
| 7:00 AM to 7:29 AM | 135 (18.3%) | 80 (11.5%) |
| 7:30 AM to 7:59 AM | 67 (9.1%) | 323 (46.5%) |
| 8:00 AM to 8:29 AM | 61 (8.3%) | 0 (0.0%) |
| 8:30 AM to 8:59 AM | 0 (0.0%) | 0 (0.0%) |
| 9:00 AM to 9:59 AM | 69 (9.4%) | 66 (9.5%) |
| 10:00 AM to 10:59 AM | 0 (0.0%) | 0 (0.0%) |
| 11:00 AM to 11:59 AM | 69 (9.4%) | 8 (1.1%) |
| 12:00 PM to 3:59 PM | 72 (9.8%) | 103 (14.8%) |
| 4:00 PM to 11:59 PM | 106 (14.4%) | 26 (3.7%) |
| Total | 736 (100.0%) | 694 (100.0%) |
Housing Occupancy in Grambling
Occupancy by Ownership in Grambling
Of the total 1,637 dwellings in Grambling, owner-occupied units account for 606 (37.0%), while renter-occupied units make up 1,031 (63.0%).
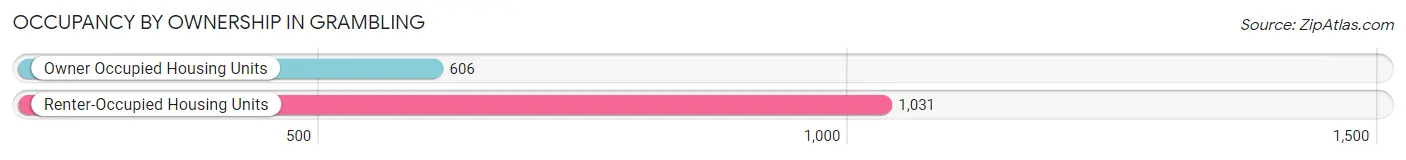
| Occupancy | # Housing Units | % Housing Units |
| Owner Occupied Housing Units | 606 | 37.0% |
| Renter-Occupied Housing Units | 1,031 | 63.0% |
| Total Occupied Housing Units | 1,637 | 100.0% |
Occupancy by Household Size in Grambling
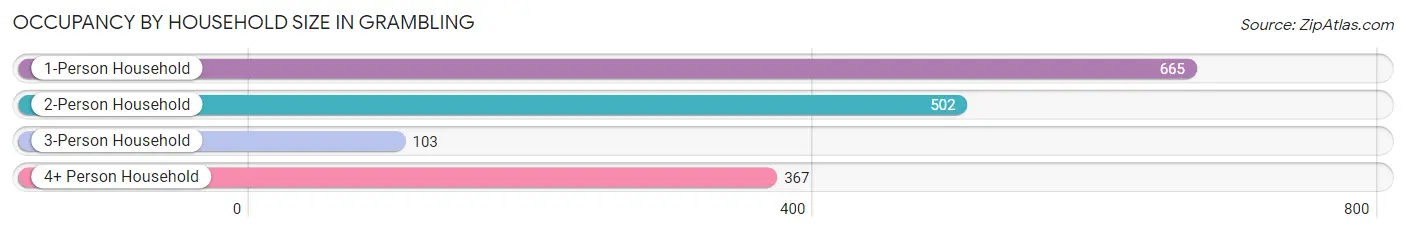
| Household Size | # Housing Units | % Housing Units |
| 1-Person Household | 665 | 40.6% |
| 2-Person Household | 502 | 30.7% |
| 3-Person Household | 103 | 6.3% |
| 4+ Person Household | 367 | 22.4% |
| Total Housing Units | 1,637 | 100.0% |
Occupancy by Ownership by Household Size in Grambling
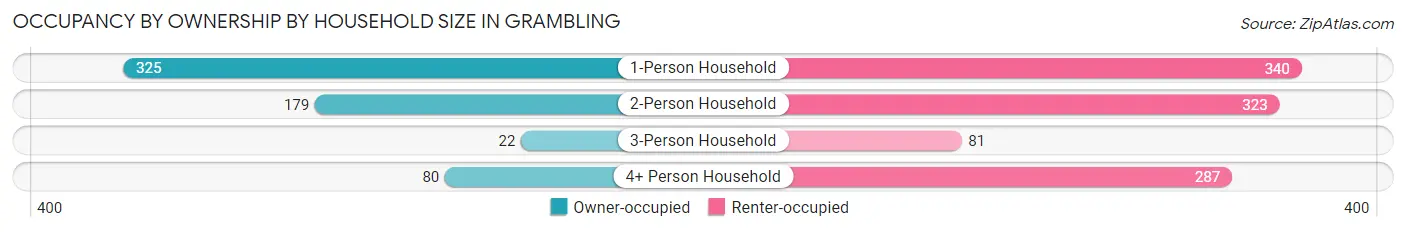
| Household Size | Owner-occupied | Renter-occupied |
| 1-Person Household | 325 (48.9%) | 340 (51.1%) |
| 2-Person Household | 179 (35.7%) | 323 (64.3%) |
| 3-Person Household | 22 (21.4%) | 81 (78.6%) |
| 4+ Person Household | 80 (21.8%) | 287 (78.2%) |
| Total Housing Units | 606 (37.0%) | 1,031 (63.0%) |
Occupancy by Educational Attainment in Grambling
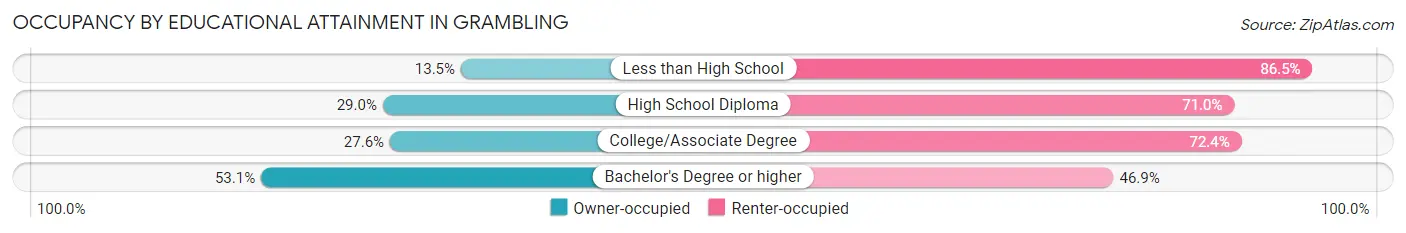
| Household Size | Owner-occupied | Renter-occupied |
| Less than High School | 20 (13.5%) | 128 (86.5%) |
| High School Diploma | 163 (29.0%) | 399 (71.0%) |
| College/Associate Degree | 75 (27.6%) | 197 (72.4%) |
| Bachelor's Degree or higher | 348 (53.1%) | 307 (46.9%) |
Occupancy by Age of Householder in Grambling
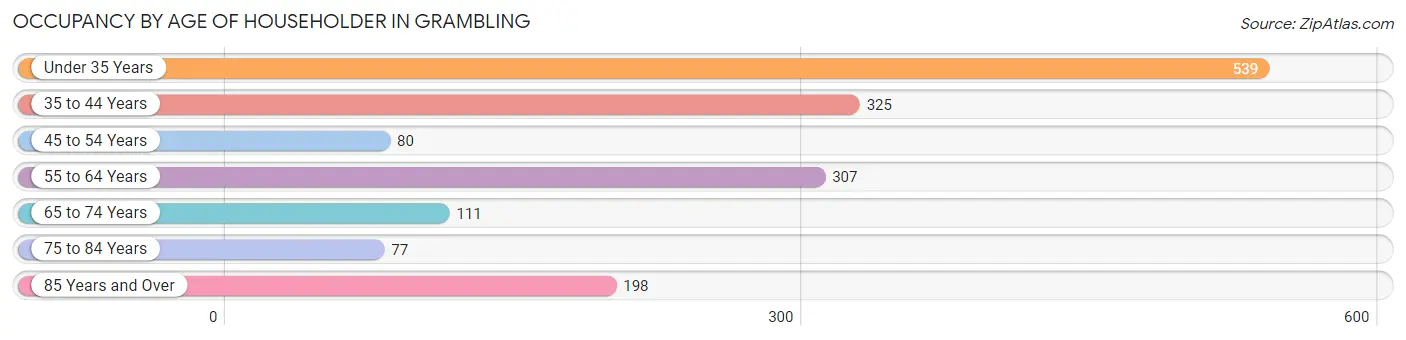
| Age Bracket | # Households | % Households |
| Under 35 Years | 539 | 32.9% |
| 35 to 44 Years | 325 | 19.9% |
| 45 to 54 Years | 80 | 4.9% |
| 55 to 64 Years | 307 | 18.8% |
| 65 to 74 Years | 111 | 6.8% |
| 75 to 84 Years | 77 | 4.7% |
| 85 Years and Over | 198 | 12.1% |
| Total | 1,637 | 100.0% |
Housing Finances in Grambling
Median Income by Occupancy in Grambling
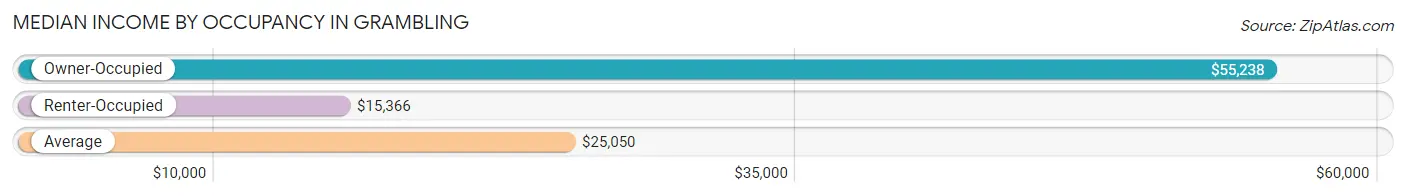
| Occupancy Type | # Households | Median Income |
| Owner-Occupied | 606 (37.0%) | $55,238 |
| Renter-Occupied | 1,031 (63.0%) | $15,366 |
| Average | 1,637 (100.0%) | $25,050 |
Occupancy by Householder Income Bracket in Grambling
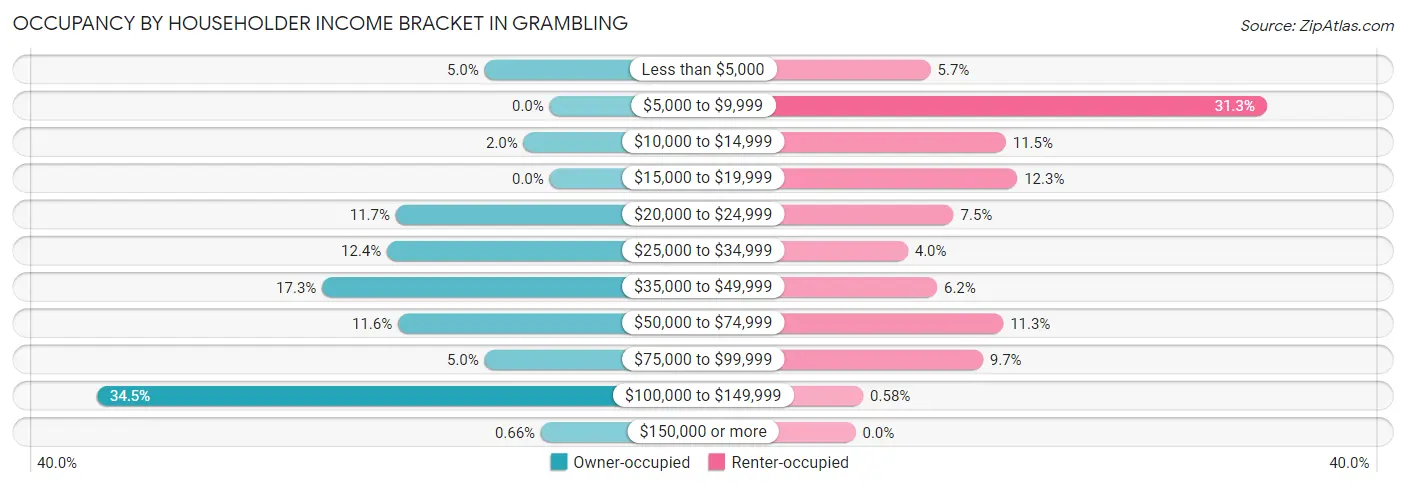
| Income Bracket | Owner-occupied | Renter-occupied |
| Less than $5,000 | 30 (5.0%) | 59 (5.7%) |
| $5,000 to $9,999 | 0 (0.0%) | 323 (31.3%) |
| $10,000 to $14,999 | 12 (2.0%) | 118 (11.5%) |
| $15,000 to $19,999 | 0 (0.0%) | 127 (12.3%) |
| $20,000 to $24,999 | 71 (11.7%) | 77 (7.5%) |
| $25,000 to $34,999 | 75 (12.4%) | 41 (4.0%) |
| $35,000 to $49,999 | 105 (17.3%) | 64 (6.2%) |
| $50,000 to $74,999 | 70 (11.6%) | 116 (11.3%) |
| $75,000 to $99,999 | 30 (5.0%) | 100 (9.7%) |
| $100,000 to $149,999 | 209 (34.5%) | 6 (0.6%) |
| $150,000 or more | 4 (0.7%) | 0 (0.0%) |
| Total | 606 (100.0%) | 1,031 (100.0%) |
Monthly Housing Cost Tiers in Grambling
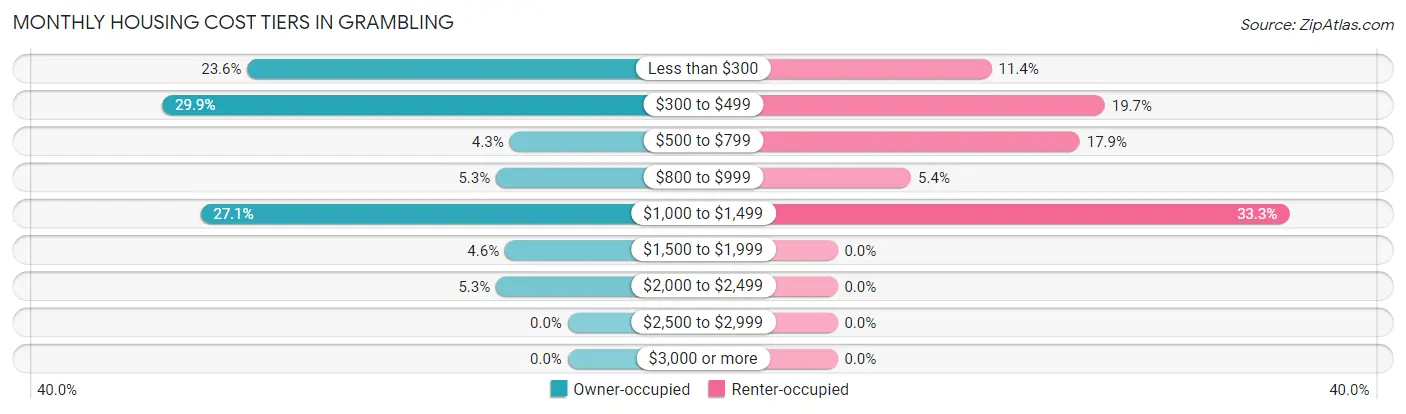
| Monthly Cost | Owner-occupied | Renter-occupied |
| Less than $300 | 143 (23.6%) | 117 (11.4%) |
| $300 to $499 | 181 (29.9%) | 203 (19.7%) |
| $500 to $799 | 26 (4.3%) | 184 (17.8%) |
| $800 to $999 | 32 (5.3%) | 56 (5.4%) |
| $1,000 to $1,499 | 164 (27.1%) | 343 (33.3%) |
| $1,500 to $1,999 | 28 (4.6%) | 0 (0.0%) |
| $2,000 to $2,499 | 32 (5.3%) | 0 (0.0%) |
| $2,500 to $2,999 | 0 (0.0%) | 0 (0.0%) |
| $3,000 or more | 0 (0.0%) | 0 (0.0%) |
| Total | 606 (100.0%) | 1,031 (100.0%) |
Physical Housing Characteristics in Grambling
Housing Structures in Grambling
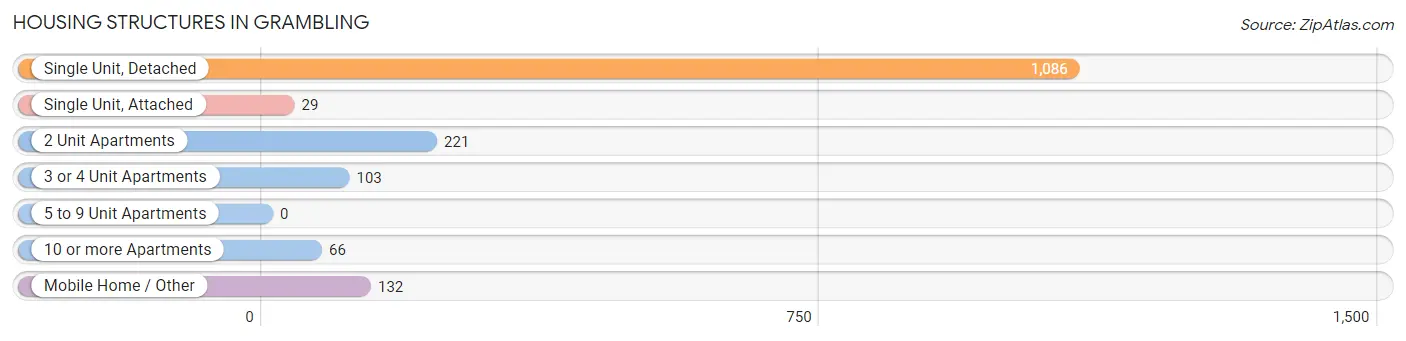
| Structure Type | # Housing Units | % Housing Units |
| Single Unit, Detached | 1,086 | 66.3% |
| Single Unit, Attached | 29 | 1.8% |
| 2 Unit Apartments | 221 | 13.5% |
| 3 or 4 Unit Apartments | 103 | 6.3% |
| 5 to 9 Unit Apartments | 0 | 0.0% |
| 10 or more Apartments | 66 | 4.0% |
| Mobile Home / Other | 132 | 8.1% |
| Total | 1,637 | 100.0% |
Housing Structures by Occupancy in Grambling
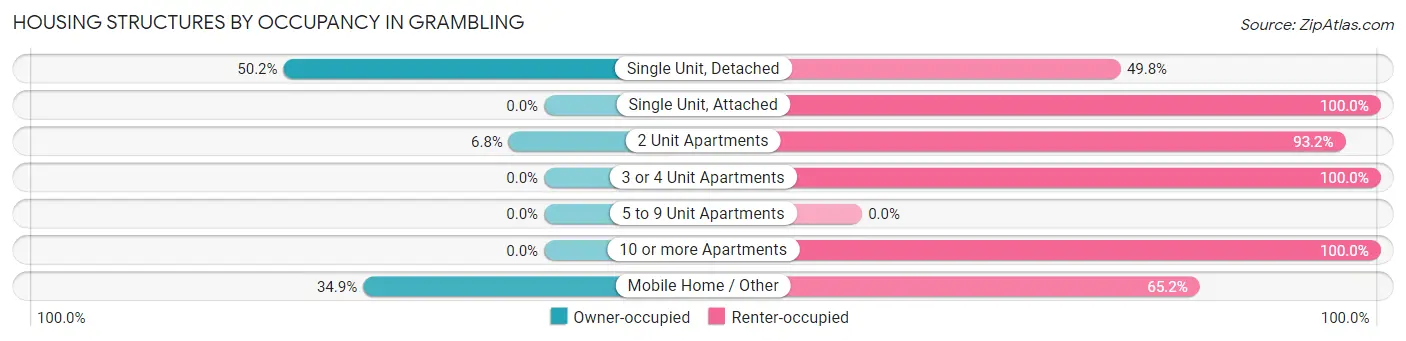
| Structure Type | Owner-occupied | Renter-occupied |
| Single Unit, Detached | 545 (50.2%) | 541 (49.8%) |
| Single Unit, Attached | 0 (0.0%) | 29 (100.0%) |
| 2 Unit Apartments | 15 (6.8%) | 206 (93.2%) |
| 3 or 4 Unit Apartments | 0 (0.0%) | 103 (100.0%) |
| 5 to 9 Unit Apartments | 0 (0.0%) | 0 (0.0%) |
| 10 or more Apartments | 0 (0.0%) | 66 (100.0%) |
| Mobile Home / Other | 46 (34.8%) | 86 (65.1%) |
| Total | 606 (37.0%) | 1,031 (63.0%) |
Housing Structures by Number of Rooms in Grambling
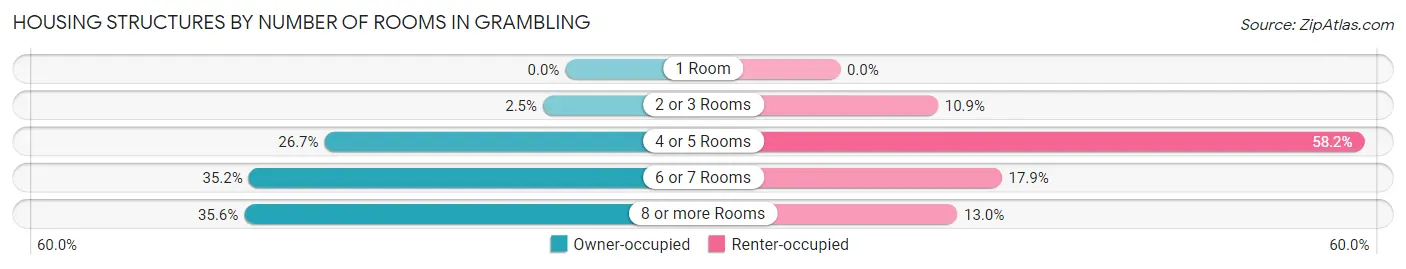
| Number of Rooms | Owner-occupied | Renter-occupied |
| 1 Room | 0 (0.0%) | 0 (0.0%) |
| 2 or 3 Rooms | 15 (2.5%) | 112 (10.9%) |
| 4 or 5 Rooms | 162 (26.7%) | 600 (58.2%) |
| 6 or 7 Rooms | 213 (35.1%) | 185 (17.9%) |
| 8 or more Rooms | 216 (35.6%) | 134 (13.0%) |
| Total | 606 (100.0%) | 1,031 (100.0%) |
Housing Structure by Heating Type in Grambling
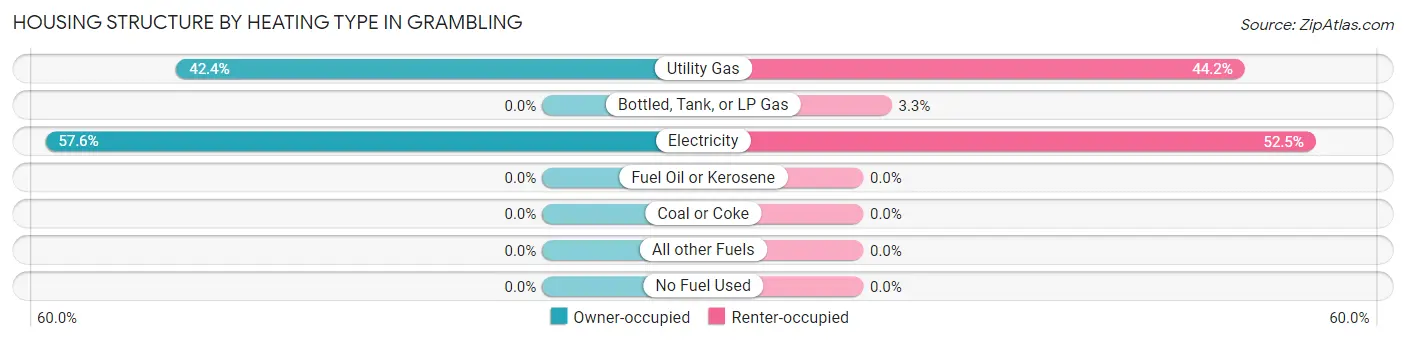
| Heating Type | Owner-occupied | Renter-occupied |
| Utility Gas | 257 (42.4%) | 456 (44.2%) |
| Bottled, Tank, or LP Gas | 0 (0.0%) | 34 (3.3%) |
| Electricity | 349 (57.6%) | 541 (52.5%) |
| Fuel Oil or Kerosene | 0 (0.0%) | 0 (0.0%) |
| Coal or Coke | 0 (0.0%) | 0 (0.0%) |
| All other Fuels | 0 (0.0%) | 0 (0.0%) |
| No Fuel Used | 0 (0.0%) | 0 (0.0%) |
| Total | 606 (100.0%) | 1,031 (100.0%) |
Household Vehicle Usage in Grambling
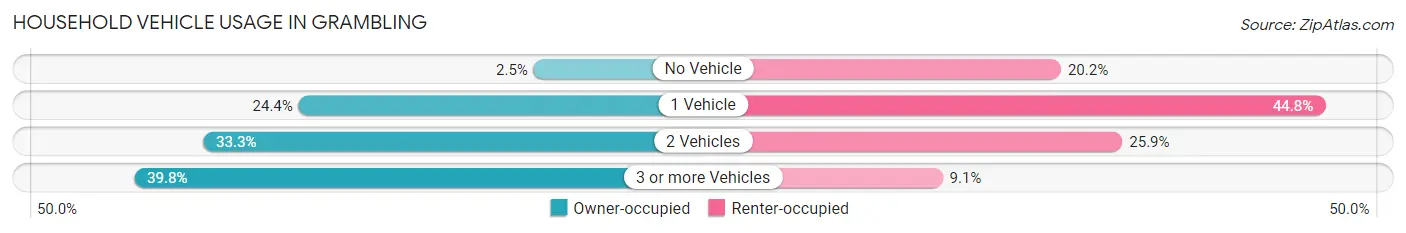
| Vehicles per Household | Owner-occupied | Renter-occupied |
| No Vehicle | 15 (2.5%) | 208 (20.2%) |
| 1 Vehicle | 148 (24.4%) | 462 (44.8%) |
| 2 Vehicles | 202 (33.3%) | 267 (25.9%) |
| 3 or more Vehicles | 241 (39.8%) | 94 (9.1%) |
| Total | 606 (100.0%) | 1,031 (100.0%) |
Real Estate & Mortgages in Grambling
Real Estate and Mortgage Overview in Grambling
| Characteristic | Without Mortgage | With Mortgage |
| Housing Units | 350 | 256 |
| Median Property Value | $139,200 | $183,300 |
| Median Household Income | - | - |
| Monthly Housing Costs | $313 | $0 |
| Real Estate Taxes | $316 | $39 |
Property Value by Mortgage Status in Grambling
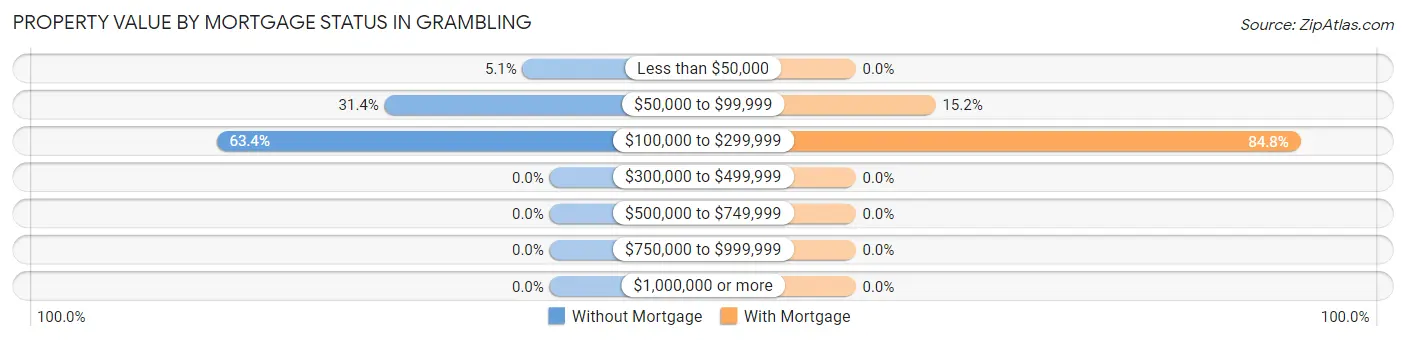
| Property Value | Without Mortgage | With Mortgage |
| Less than $50,000 | 18 (5.1%) | 0 (0.0%) |
| $50,000 to $99,999 | 110 (31.4%) | 39 (15.2%) |
| $100,000 to $299,999 | 222 (63.4%) | 217 (84.8%) |
| $300,000 to $499,999 | 0 (0.0%) | 0 (0.0%) |
| $500,000 to $749,999 | 0 (0.0%) | 0 (0.0%) |
| $750,000 to $999,999 | 0 (0.0%) | 0 (0.0%) |
| $1,000,000 or more | 0 (0.0%) | 0 (0.0%) |
| Total | 350 (100.0%) | 256 (100.0%) |
Household Income by Mortgage Status in Grambling
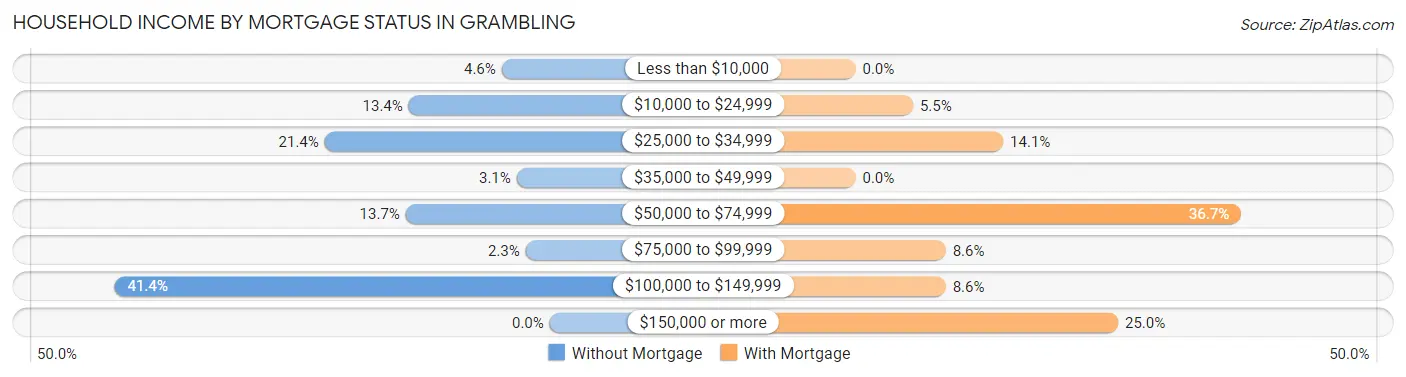
| Household Income | Without Mortgage | With Mortgage |
| Less than $10,000 | 16 (4.6%) | 0 (0.0%) |
| $10,000 to $24,999 | 47 (13.4%) | 14 (5.5%) |
| $25,000 to $34,999 | 75 (21.4%) | 36 (14.1%) |
| $35,000 to $49,999 | 11 (3.1%) | 0 (0.0%) |
| $50,000 to $74,999 | 48 (13.7%) | 94 (36.7%) |
| $75,000 to $99,999 | 8 (2.3%) | 22 (8.6%) |
| $100,000 to $149,999 | 145 (41.4%) | 22 (8.6%) |
| $150,000 or more | 0 (0.0%) | 64 (25.0%) |
| Total | 350 (100.0%) | 256 (100.0%) |
Property Value to Household Income Ratio in Grambling
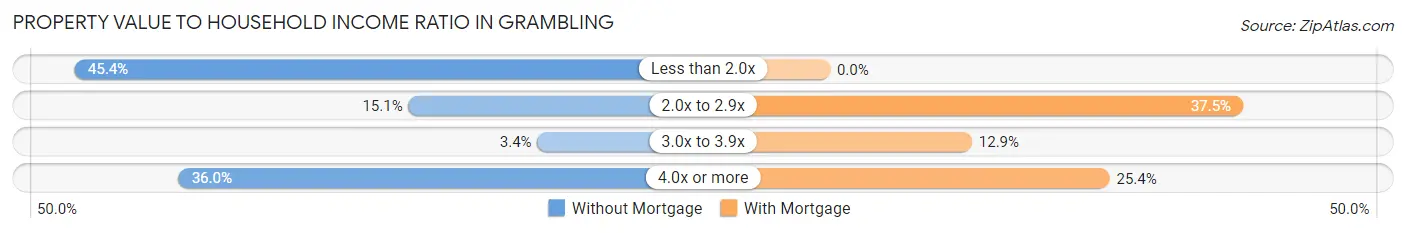
| Value-to-Income Ratio | Without Mortgage | With Mortgage |
| Less than 2.0x | 159 (45.4%) | 0 (0.0%) |
| 2.0x to 2.9x | 53 (15.1%) | 96 (37.5%) |
| 3.0x to 3.9x | 12 (3.4%) | 33 (12.9%) |
| 4.0x or more | 126 (36.0%) | 65 (25.4%) |
| Total | 350 (100.0%) | 256 (100.0%) |
Real Estate Taxes by Mortgage Status in Grambling
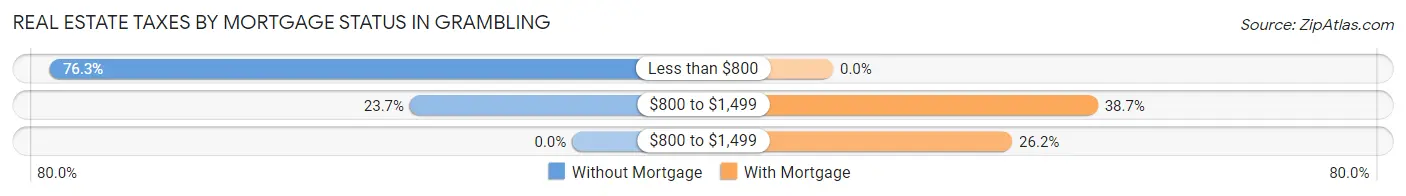
| Property Taxes | Without Mortgage | With Mortgage |
| Less than $800 | 267 (76.3%) | 0 (0.0%) |
| $800 to $1,499 | 83 (23.7%) | 99 (38.7%) |
| $800 to $1,499 | 0 (0.0%) | 67 (26.2%) |
| Total | 350 (100.0%) | 256 (100.0%) |
Health & Disability in Grambling
Health Insurance Coverage by Age in Grambling
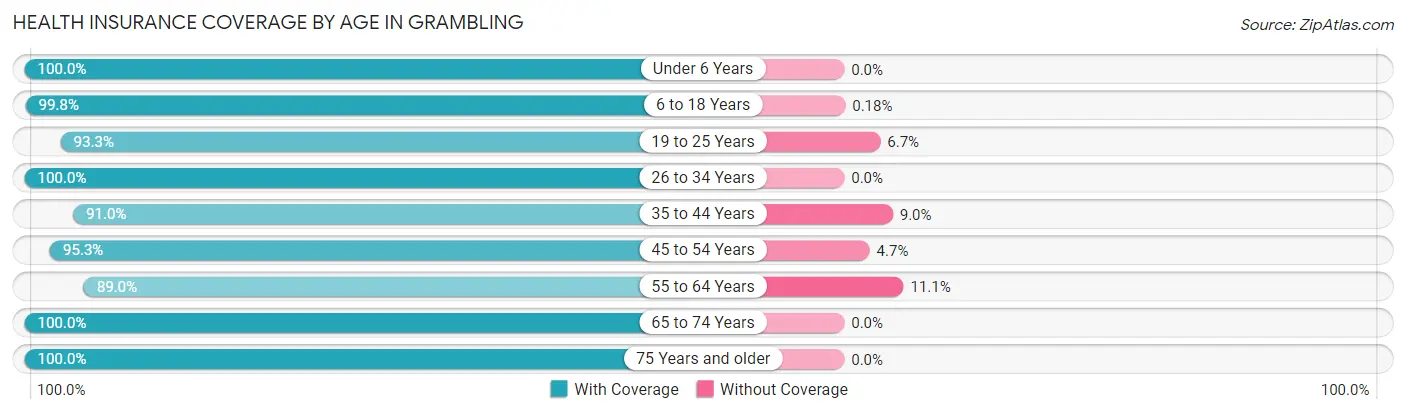
| Age Bracket | With Coverage | Without Coverage |
| Under 6 Years | 183 (100.0%) | 0 (0.0%) |
| 6 to 18 Years | 1,100 (99.8%) | 2 (0.2%) |
| 19 to 25 Years | 1,819 (93.3%) | 131 (6.7%) |
| 26 to 34 Years | 466 (100.0%) | 0 (0.0%) |
| 35 to 44 Years | 503 (91.0%) | 50 (9.0%) |
| 45 to 54 Years | 161 (95.3%) | 8 (4.7%) |
| 55 to 64 Years | 330 (88.9%) | 41 (11.1%) |
| 65 to 74 Years | 197 (100.0%) | 0 (0.0%) |
| 75 Years and older | 324 (100.0%) | 0 (0.0%) |
| Total | 5,083 (95.6%) | 232 (4.4%) |
Health Insurance Coverage by Citizenship Status in Grambling
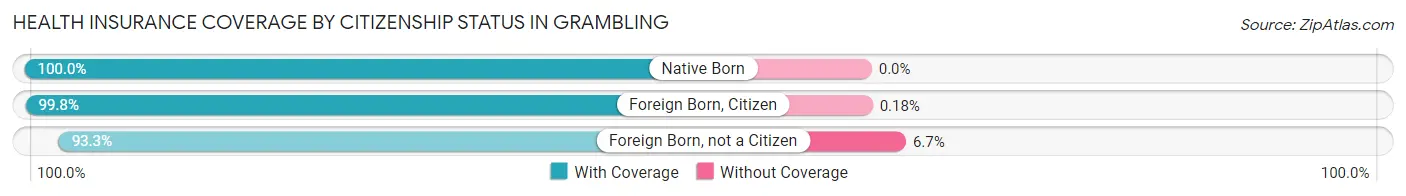
| Citizenship Status | With Coverage | Without Coverage |
| Native Born | 183 (100.0%) | 0 (0.0%) |
| Foreign Born, Citizen | 1,100 (99.8%) | 2 (0.2%) |
| Foreign Born, not a Citizen | 1,819 (93.3%) | 131 (6.7%) |
Health Insurance Coverage by Household Income in Grambling
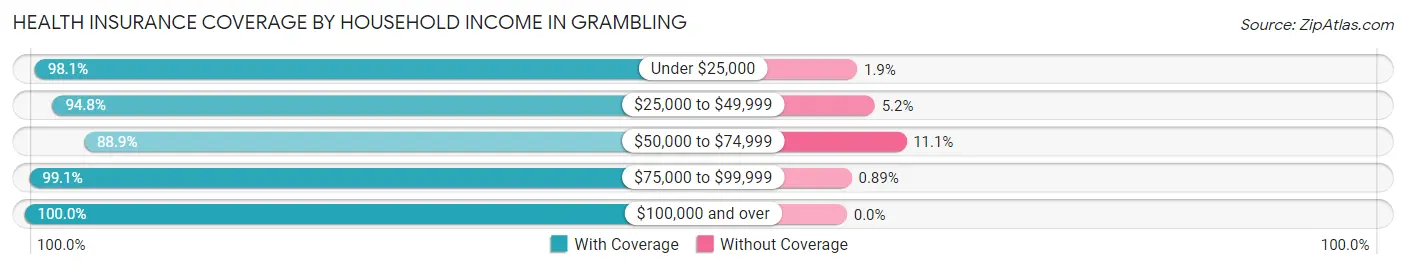
| Household Income | With Coverage | Without Coverage |
| Under $25,000 | 1,938 (98.1%) | 38 (1.9%) |
| $25,000 to $49,999 | 507 (94.8%) | 28 (5.2%) |
| $50,000 to $74,999 | 910 (88.9%) | 114 (11.1%) |
| $75,000 to $99,999 | 335 (99.1%) | 3 (0.9%) |
| $100,000 and over | 398 (100.0%) | 0 (0.0%) |
Public vs Private Health Insurance Coverage by Age in Grambling
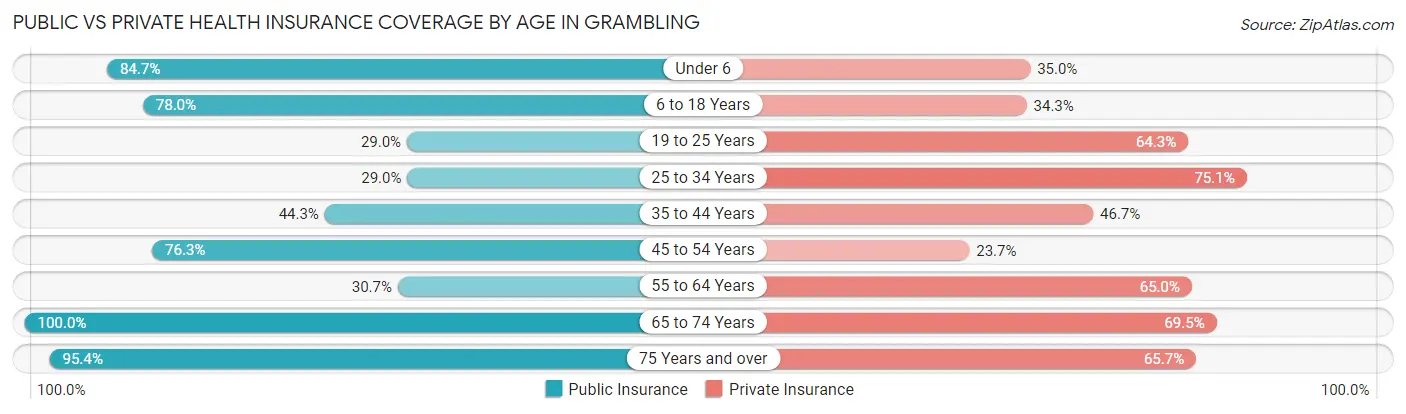
| Age Bracket | Public Insurance | Private Insurance |
| Under 6 | 155 (84.7%) | 64 (35.0%) |
| 6 to 18 Years | 860 (78.0%) | 378 (34.3%) |
| 19 to 25 Years | 566 (29.0%) | 1,253 (64.3%) |
| 25 to 34 Years | 135 (29.0%) | 350 (75.1%) |
| 35 to 44 Years | 245 (44.3%) | 258 (46.7%) |
| 45 to 54 Years | 129 (76.3%) | 40 (23.7%) |
| 55 to 64 Years | 114 (30.7%) | 241 (65.0%) |
| 65 to 74 Years | 197 (100.0%) | 137 (69.5%) |
| 75 Years and over | 309 (95.4%) | 213 (65.7%) |
| Total | 2,710 (51.0%) | 2,934 (55.2%) |
Disability Status by Sex by Age in Grambling
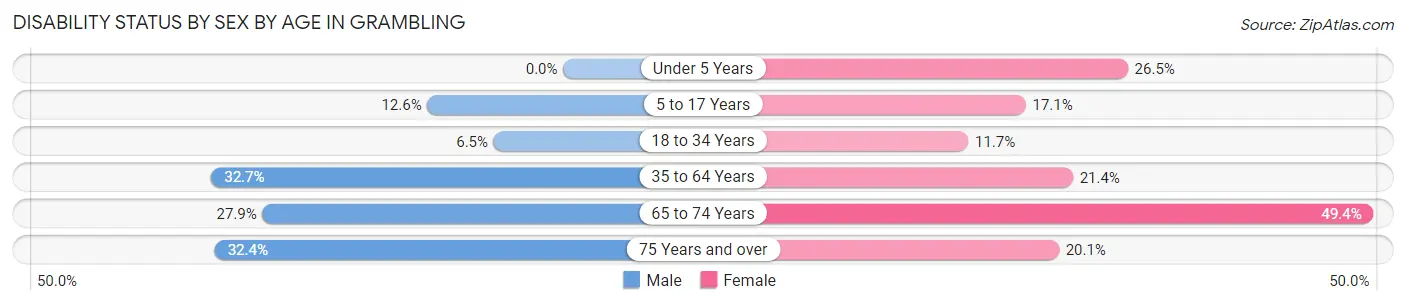
| Age Bracket | Male | Female |
| Under 5 Years | 0 (0.0%) | 13 (26.5%) |
| 5 to 17 Years | 90 (12.6%) | 37 (17.1%) |
| 18 to 34 Years | 87 (6.5%) | 152 (11.7%) |
| 35 to 64 Years | 165 (32.7%) | 126 (21.4%) |
| 65 to 74 Years | 12 (27.9%) | 76 (49.3%) |
| 75 Years and over | 55 (32.4%) | 31 (20.1%) |
Disability Class by Sex by Age in Grambling
Disability Class: Hearing Difficulty
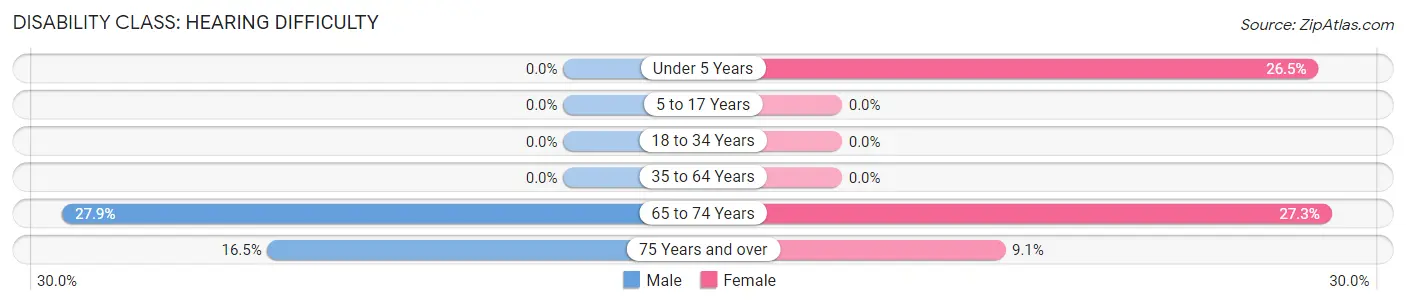
| Age Bracket | Male | Female |
| Under 5 Years | 0 (0.0%) | 13 (26.5%) |
| 5 to 17 Years | 0 (0.0%) | 0 (0.0%) |
| 18 to 34 Years | 0 (0.0%) | 0 (0.0%) |
| 35 to 64 Years | 0 (0.0%) | 0 (0.0%) |
| 65 to 74 Years | 12 (27.9%) | 42 (27.3%) |
| 75 Years and over | 28 (16.5%) | 14 (9.1%) |
Disability Class: Vision Difficulty
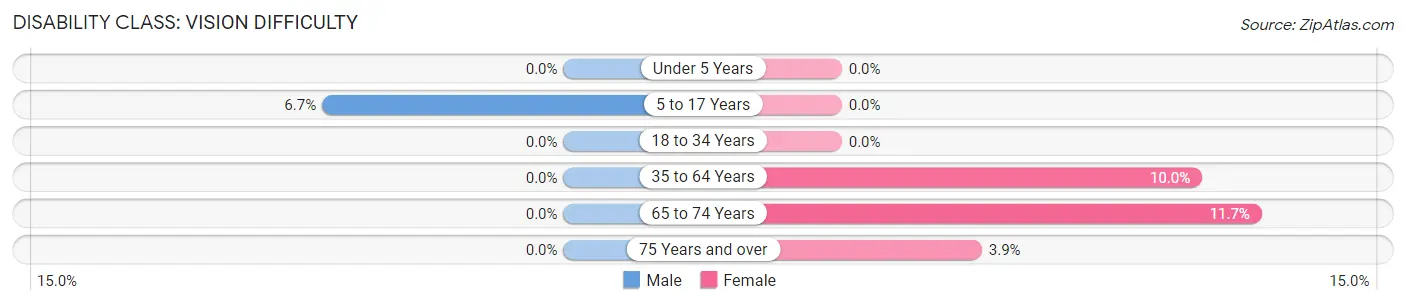
| Age Bracket | Male | Female |
| Under 5 Years | 0 (0.0%) | 0 (0.0%) |
| 5 to 17 Years | 48 (6.7%) | 0 (0.0%) |
| 18 to 34 Years | 0 (0.0%) | 0 (0.0%) |
| 35 to 64 Years | 0 (0.0%) | 59 (10.0%) |
| 65 to 74 Years | 0 (0.0%) | 18 (11.7%) |
| 75 Years and over | 0 (0.0%) | 6 (3.9%) |
Disability Class: Cognitive Difficulty
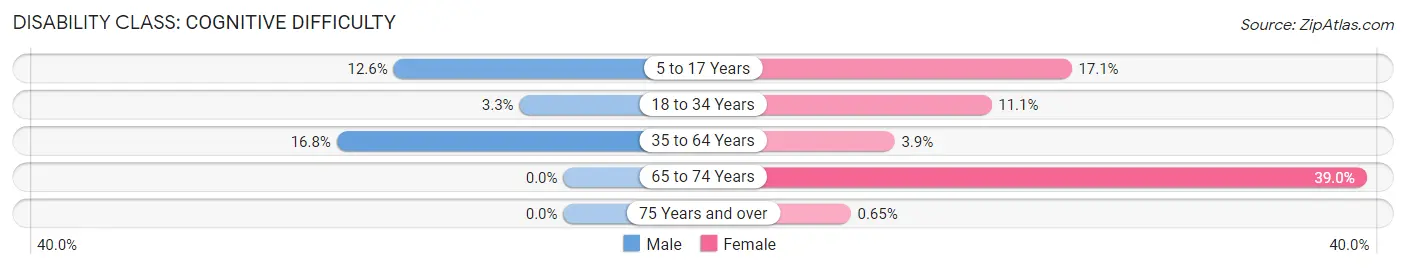
| Age Bracket | Male | Female |
| 5 to 17 Years | 90 (12.6%) | 37 (17.1%) |
| 18 to 34 Years | 44 (3.3%) | 144 (11.1%) |
| 35 to 64 Years | 85 (16.8%) | 23 (3.9%) |
| 65 to 74 Years | 0 (0.0%) | 60 (39.0%) |
| 75 Years and over | 0 (0.0%) | 1 (0.6%) |
Disability Class: Ambulatory Difficulty
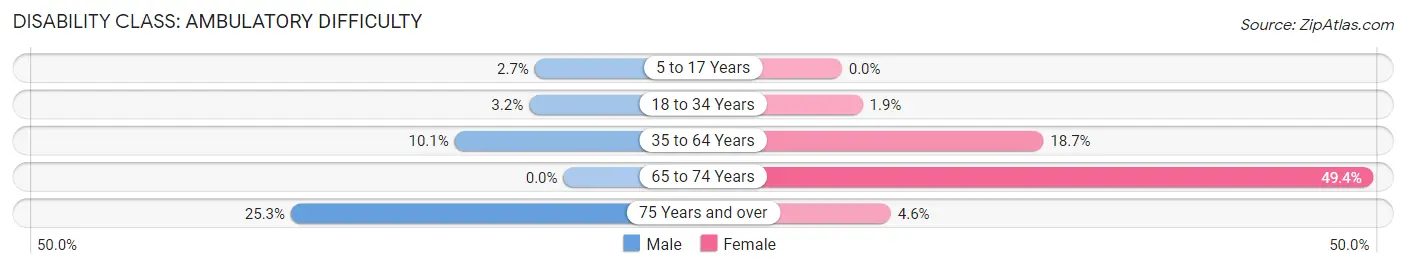
| Age Bracket | Male | Female |
| 5 to 17 Years | 19 (2.7%) | 0 (0.0%) |
| 18 to 34 Years | 43 (3.2%) | 25 (1.9%) |
| 35 to 64 Years | 51 (10.1%) | 110 (18.7%) |
| 65 to 74 Years | 0 (0.0%) | 76 (49.3%) |
| 75 Years and over | 43 (25.3%) | 7 (4.5%) |
Disability Class: Self-Care Difficulty
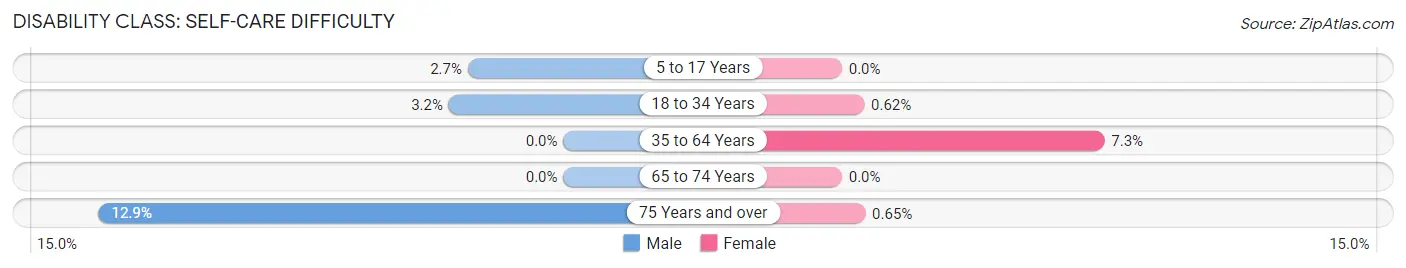
| Age Bracket | Male | Female |
| 5 to 17 Years | 19 (2.7%) | 0 (0.0%) |
| 18 to 34 Years | 43 (3.2%) | 8 (0.6%) |
| 35 to 64 Years | 0 (0.0%) | 43 (7.3%) |
| 65 to 74 Years | 0 (0.0%) | 0 (0.0%) |
| 75 Years and over | 22 (12.9%) | 1 (0.6%) |
Technology Access in Grambling
Computing Device Access in Grambling
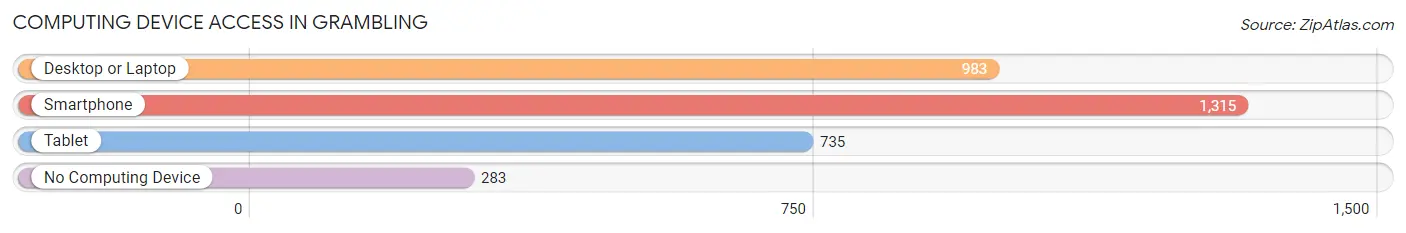
| Device Type | # Households | % Households |
| Desktop or Laptop | 983 | 60.1% |
| Smartphone | 1,315 | 80.3% |
| Tablet | 735 | 44.9% |
| No Computing Device | 283 | 17.3% |
| Total | 1,637 | 100.0% |
Internet Access in Grambling
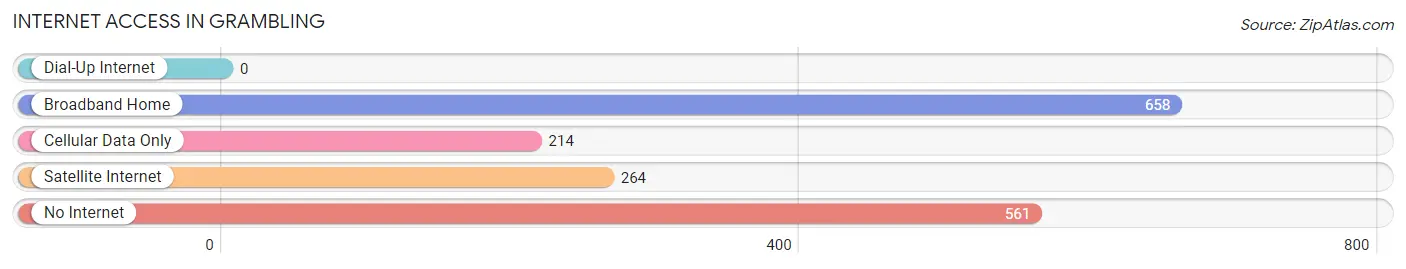
| Internet Type | # Households | % Households |
| Dial-Up Internet | 0 | 0.0% |
| Broadband Home | 658 | 40.2% |
| Cellular Data Only | 214 | 13.1% |
| Satellite Internet | 264 | 16.1% |
| No Internet | 561 | 34.3% |
| Total | 1,637 | 100.0% |
Grambling Summary
Grambling, Louisiana is a small town located in Lincoln Parish in the northern part of the state. It is situated about 20 miles east of Ruston and about 30 miles west of Monroe. The town was founded in 1882 by former slaves and is named after a local creek. It is home to Grambling State University, a historically black college, and is known for its strong ties to African American culture and history.
Geography
Grambling is located in the northern part of Louisiana, in Lincoln Parish. It is situated about 20 miles east of Ruston and about 30 miles west of Monroe. The town is located in a rural area, with the nearest major city being Shreveport, which is about an hour away. The terrain is mostly flat, with some rolling hills in the area. The climate is humid subtropical, with hot summers and mild winters.
Economy
Grambling’s economy is largely based on agriculture and education. The town is home to Grambling State University, a historically black college, which is the largest employer in the area. Other major employers include the local school district, the Lincoln Parish Sheriff’s Office, and the Lincoln Parish Hospital. The town also has a few small businesses, including restaurants, convenience stores, and a few retail stores.
Demographics
As of the 2010 census, the population of Grambling was 2,945. The racial makeup of the town was 79.3% African American, 19.2% White, 0.3% Native American, 0.2% Asian, and 0.9% from other races. The median household income was $25,972, and the median family income was $31,250. The per capita income was $14,945.
History
Grambling was founded in 1882 by former slaves. The town was named after a local creek, and the name is derived from the Choctaw word “grambling”, which means “to dig”. The town was originally a farming community, and the main crops were cotton and corn. In 1901, the town was incorporated, and in 1925, the first school was built.
In the early 20th century, Grambling became a center of African American culture and education. In 1901, the first African American church was established in the town. In 1925, the first African American school was built, and in 1941, the first African American college, Grambling State University, was founded. The university has since become a major source of pride for the town, and it is known for its strong ties to African American culture and history.
Conclusion
Grambling, Louisiana is a small town located in Lincoln Parish in the northern part of the state. It is home to Grambling State University, a historically black college, and is known for its strong ties to African American culture and history. The town’s economy is largely based on agriculture and education, and the major employers are the university, the local school district, the Lincoln Parish Sheriff’s Office, and the Lincoln Parish Hospital. As of the 2010 census, the population of Grambling was 2,945, and the racial makeup of the town was 79.3% African American, 19.2% White, 0.3% Native American, 0.2% Asian, and 0.9% from other races. Grambling has a rich history, and it is a source of pride for the town and its residents.
Common Questions
What is Per Capita Income in Grambling?
Per Capita income in Grambling is $14,729.
What is the Median Family Income in Grambling?
Median Family Income in Grambling is $28,616.
What is the Median Household income in Grambling?
Median Household Income in Grambling is $25,050.
What is Income or Wage Gap in Grambling?
Income or Wage Gap in Grambling is 21.3%.
Women in Grambling earn 78.7 cents for every dollar earned by a man.
What is Inequality or Gini Index in Grambling?
Inequality or Gini Index in Grambling is 0.49.
What is the Total Population of Grambling?
Total Population of Grambling is 5,315.
What is the Total Male Population of Grambling?
Total Male Population of Grambling is 2,856.
What is the Total Female Population of Grambling?
Total Female Population of Grambling is 2,459.
What is the Ratio of Males per 100 Females in Grambling?
There are 116.14 Males per 100 Females in Grambling.
What is the Ratio of Females per 100 Males in Grambling?
There are 86.10 Females per 100 Males in Grambling.
What is the Median Population Age in Grambling?
Median Population Age in Grambling is 21.8 Years.
What is the Average Family Size in Grambling
Average Family Size in Grambling is 3.6 People.
What is the Average Household Size in Grambling
Average Household Size in Grambling is 2.6 People.
How Large is the Labor Force in Grambling?
There are 1,917 People in the Labor Forcein in Grambling.
What is the Percentage of People in the Labor Force in Grambling?
44.0% of People are in the Labor Force in Grambling.
What is the Unemployment Rate in Grambling?
Unemployment Rate in Grambling is 3.4%.