Fort Myers, FL Map & Demographics
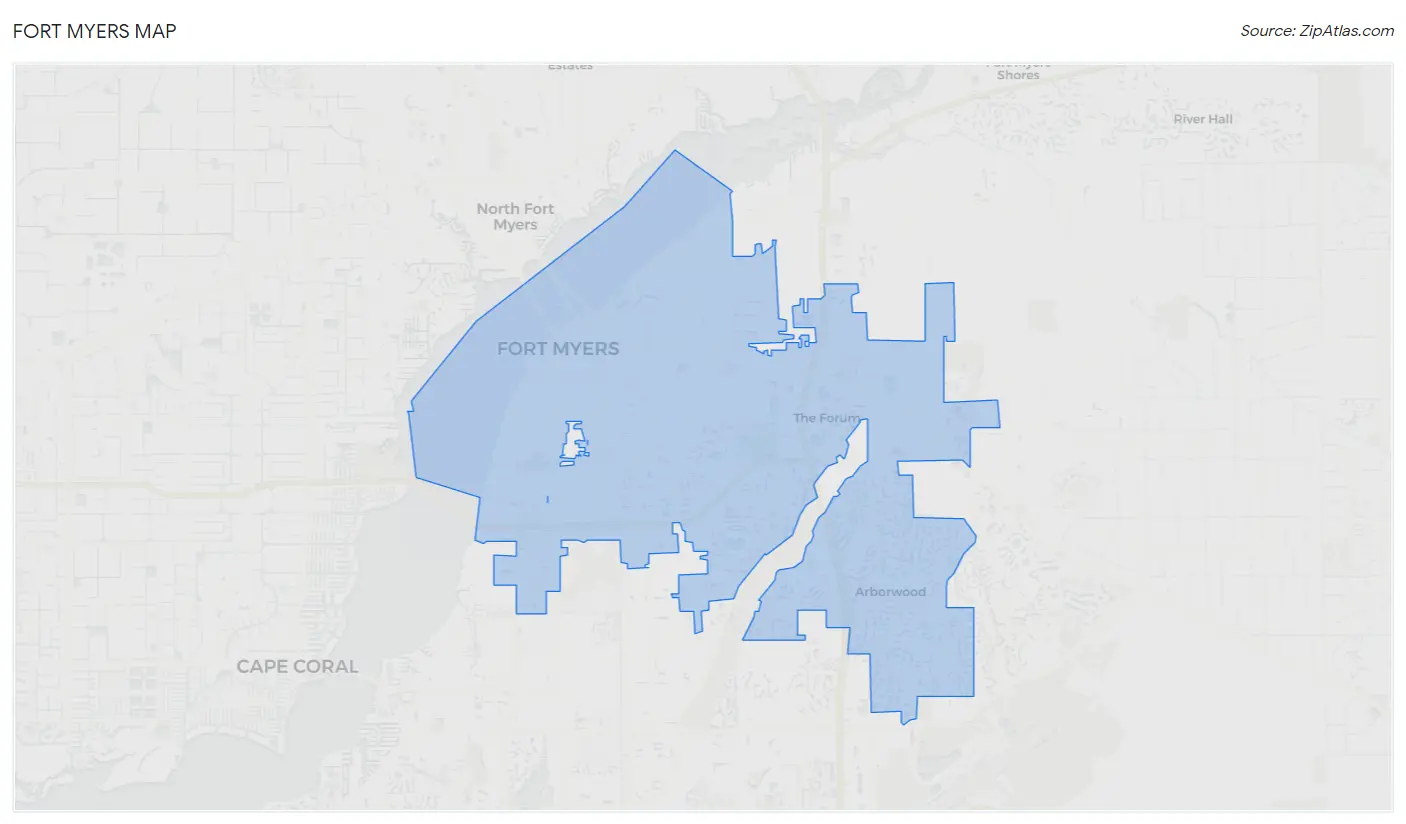
Fort Myers Map
Fort Myers Overview
$38,217
PER CAPITA INCOME
$72,489
AVG FAMILY INCOME
$57,403
AVG HOUSEHOLD INCOME
20.6%
WAGE / INCOME GAP [ % ]
79.4¢/ $1
WAGE / INCOME GAP [ $ ]
$9,581
FAMILY INCOME DEFICIT
0.52
INEQUALITY / GINI INDEX
88,699
TOTAL POPULATION
43,765
MALE POPULATION
44,934
FEMALE POPULATION
97.40
MALES / 100 FEMALES
102.67
FEMALES / 100 MALES
40.6
MEDIAN AGE
3.1
AVG FAMILY SIZE
2.4
AVG HOUSEHOLD SIZE
39,783
LABOR FORCE [ PEOPLE ]
55.1%
PERCENT IN LABOR FORCE
4.1%
UNEMPLOYMENT RATE
Fort Myers Area Codes
Income in Fort Myers
Income Overview in Fort Myers
Per Capita Income in Fort Myers is $38,217, while median incomes of families and households are $72,489 and $57,403 respectively.
| Characteristic | Number | Measure |
| Per Capita Income | 88,699 | $38,217 |
| Median Family Income | 20,819 | $72,489 |
| Mean Family Income | 20,819 | $111,577 |
| Median Household Income | 35,426 | $57,403 |
| Mean Household Income | 35,426 | $90,362 |
| Income Deficit | 20,819 | $9,581 |
| Wage / Income Gap (%) | 88,699 | 20.59% |
| Wage / Income Gap ($) | 88,699 | 79.41¢ per $1 |
| Gini / Inequality Index | 88,699 | 0.52 |
Earnings by Sex in Fort Myers
Average Earnings in Fort Myers are $34,846, $39,679 for men and $31,510 for women, a difference of 20.6%.
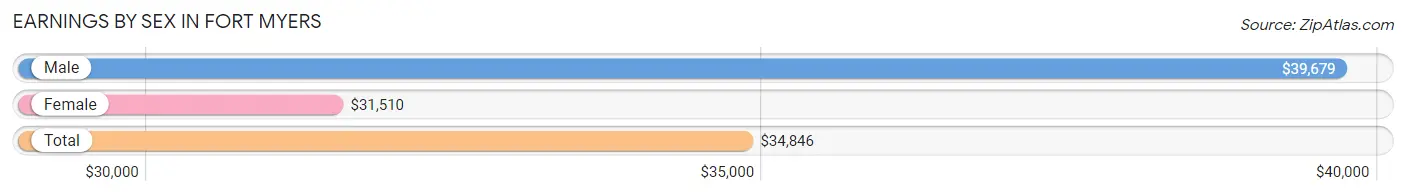
| Sex | Number | Average Earnings |
| Male | 22,193 (53.3%) | $39,679 |
| Female | 19,436 (46.7%) | $31,510 |
| Total | 41,629 (100.0%) | $34,846 |
Earnings by Sex by Income Bracket in Fort Myers
The most common earnings brackets in Fort Myers are $100,000+ for men (2,701 | 12.2%) and $25,000 to $29,999 for women (2,256 | 11.6%).
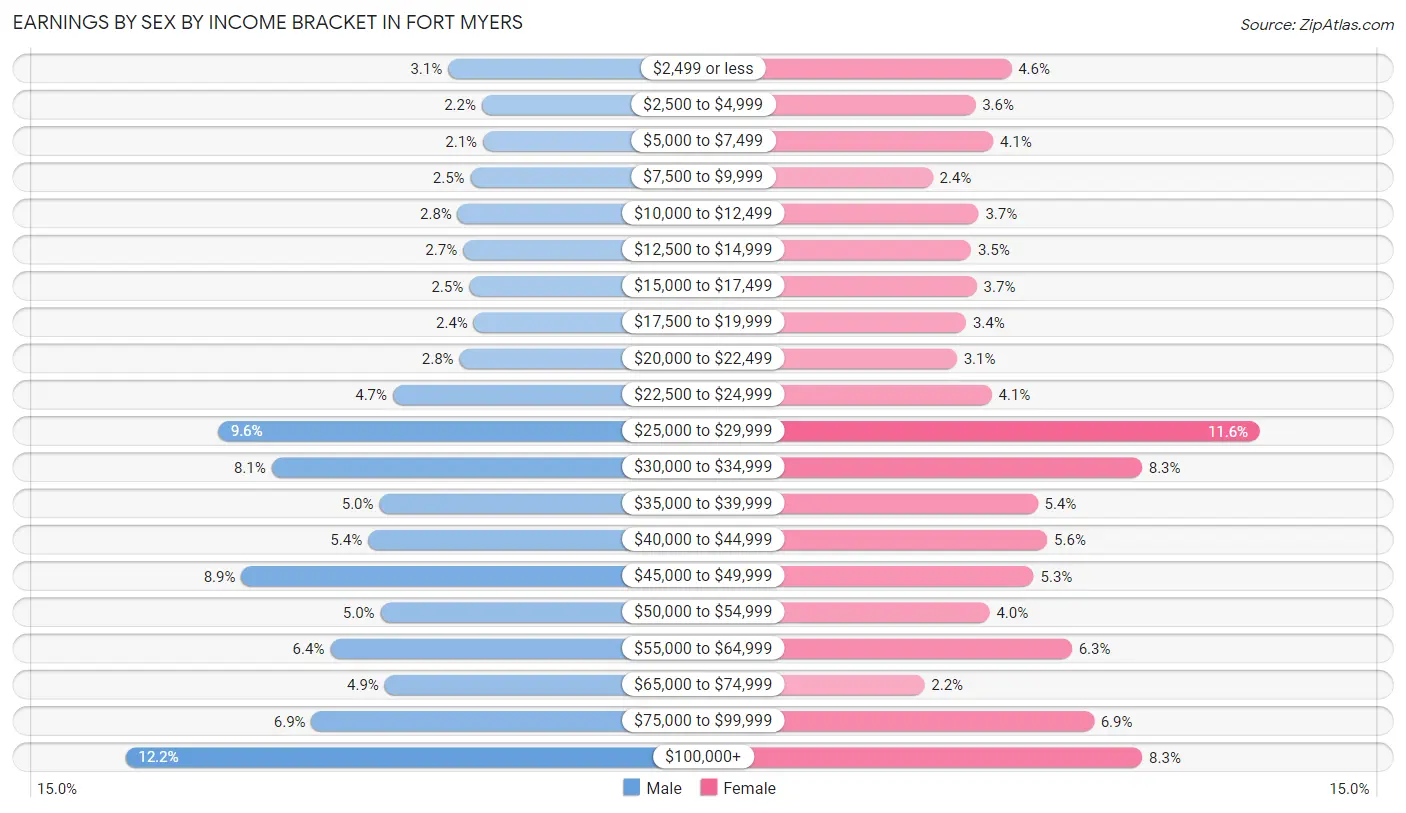
| Income | Male | Female |
| $2,499 or less | 689 (3.1%) | 897 (4.6%) |
| $2,500 to $4,999 | 478 (2.1%) | 701 (3.6%) |
| $5,000 to $7,499 | 470 (2.1%) | 799 (4.1%) |
| $7,500 to $9,999 | 548 (2.5%) | 468 (2.4%) |
| $10,000 to $12,499 | 627 (2.8%) | 720 (3.7%) |
| $12,500 to $14,999 | 595 (2.7%) | 679 (3.5%) |
| $15,000 to $17,499 | 558 (2.5%) | 710 (3.6%) |
| $17,500 to $19,999 | 528 (2.4%) | 652 (3.4%) |
| $20,000 to $22,499 | 617 (2.8%) | 601 (3.1%) |
| $22,500 to $24,999 | 1,033 (4.6%) | 791 (4.1%) |
| $25,000 to $29,999 | 2,123 (9.6%) | 2,256 (11.6%) |
| $30,000 to $34,999 | 1,788 (8.1%) | 1,612 (8.3%) |
| $35,000 to $39,999 | 1,117 (5.0%) | 1,041 (5.4%) |
| $40,000 to $44,999 | 1,187 (5.3%) | 1,095 (5.6%) |
| $45,000 to $49,999 | 1,978 (8.9%) | 1,020 (5.2%) |
| $50,000 to $54,999 | 1,109 (5.0%) | 779 (4.0%) |
| $55,000 to $64,999 | 1,422 (6.4%) | 1,229 (6.3%) |
| $65,000 to $74,999 | 1,084 (4.9%) | 424 (2.2%) |
| $75,000 to $99,999 | 1,541 (6.9%) | 1,348 (6.9%) |
| $100,000+ | 2,701 (12.2%) | 1,614 (8.3%) |
| Total | 22,193 (100.0%) | 19,436 (100.0%) |
Earnings by Sex by Educational Attainment in Fort Myers
Average earnings in Fort Myers are $42,669 for men and $34,738 for women, a difference of 18.6%. Men with an educational attainment of graduate degree enjoy the highest average annual earnings of $76,205, while those with less than high school education earn the least with $29,504. Women with an educational attainment of graduate degree earn the most with the average annual earnings of $66,182, while those with less than high school education have the smallest earnings of $24,889.
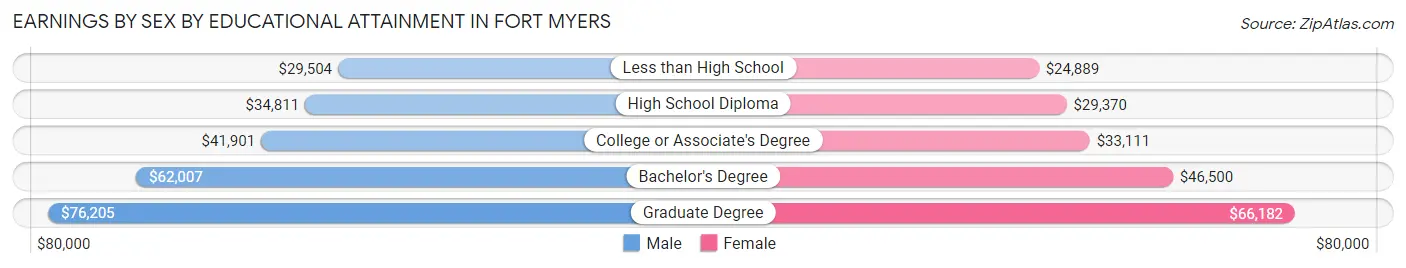
| Educational Attainment | Male Income | Female Income |
| Less than High School | $29,504 | $24,889 |
| High School Diploma | $34,811 | $29,370 |
| College or Associate's Degree | $41,901 | $33,111 |
| Bachelor's Degree | $62,007 | $46,500 |
| Graduate Degree | $76,205 | $66,182 |
| Total | $42,669 | $34,738 |
Family Income in Fort Myers
Family Income Brackets in Fort Myers
According to the Fort Myers family income data, there are 3,747 families falling into the $50,000 to $74,999 income range, which is the most common income bracket and makes up 18.0% of all families. Conversely, the $10,000 to $14,999 income bracket is the least frequent group with only 396 families (1.9%) belonging to this category.
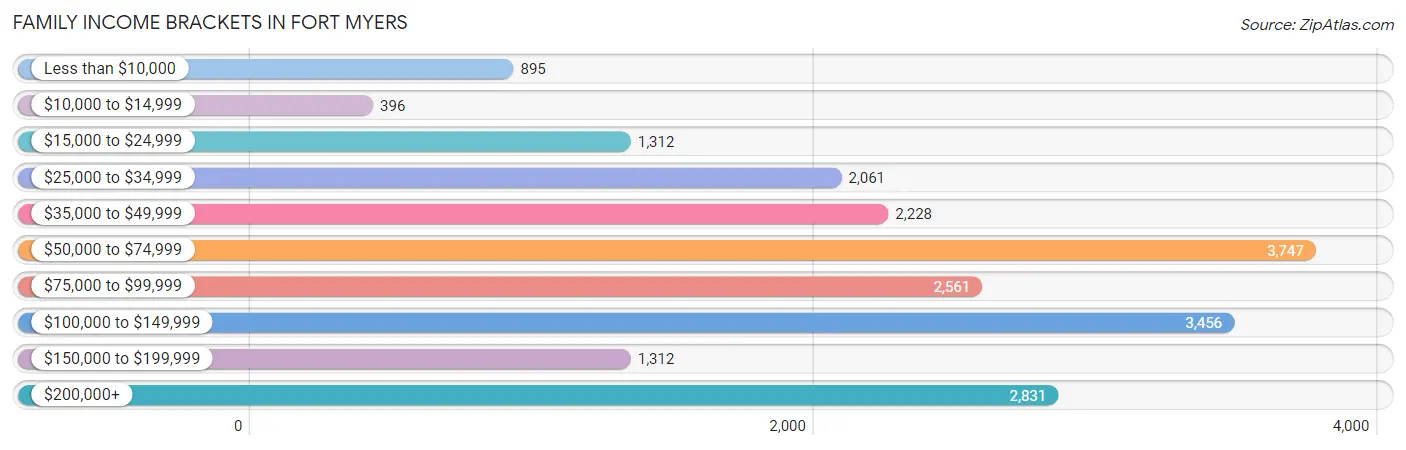
| Income Bracket | # Families | % Families |
| Less than $10,000 | 895 | 4.3% |
| $10,000 to $14,999 | 396 | 1.9% |
| $15,000 to $24,999 | 1,312 | 6.3% |
| $25,000 to $34,999 | 2,061 | 9.9% |
| $35,000 to $49,999 | 2,228 | 10.7% |
| $50,000 to $74,999 | 3,747 | 18.0% |
| $75,000 to $99,999 | 2,561 | 12.3% |
| $100,000 to $149,999 | 3,456 | 16.6% |
| $150,000 to $199,999 | 1,312 | 6.3% |
| $200,000+ | 2,831 | 13.6% |
Family Income by Famaliy Size in Fort Myers
7+ person families (316 | 1.5%) account for the highest median family income in Fort Myers with $104,737 per family, while 2-person families (11,989 | 57.6%) have the highest median income of $37,371 per family member.
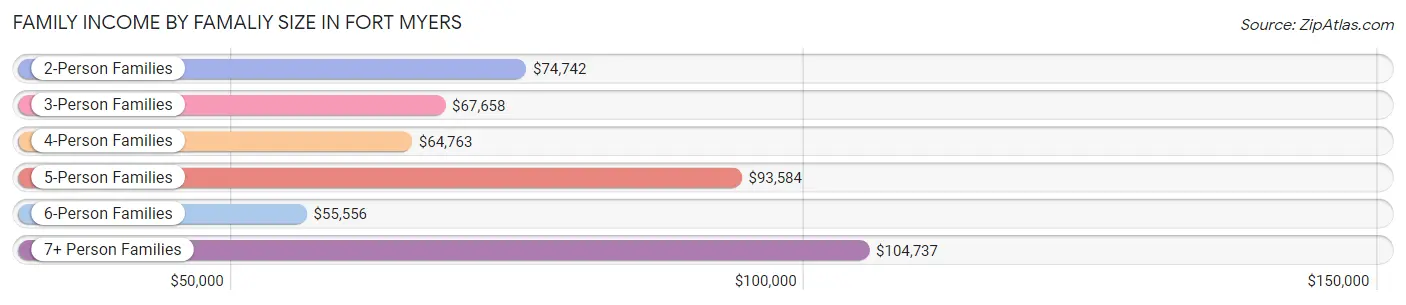
| Income Bracket | # Families | Median Income |
| 2-Person Families | 11,989 (57.6%) | $74,742 |
| 3-Person Families | 3,968 (19.1%) | $67,658 |
| 4-Person Families | 3,002 (14.4%) | $64,763 |
| 5-Person Families | 1,292 (6.2%) | $93,584 |
| 6-Person Families | 252 (1.2%) | $55,556 |
| 7+ Person Families | 316 (1.5%) | $104,737 |
| Total | 20,819 (100.0%) | $72,489 |
Family Income by Number of Earners in Fort Myers
The median family income in Fort Myers is $72,489, with families comprising 3+ earners (1,292) having the highest median family income of $110,284, while families with 1 earner (7,443) have the lowest median family income of $52,832, accounting for 6.2% and 35.7% of families, respectively.
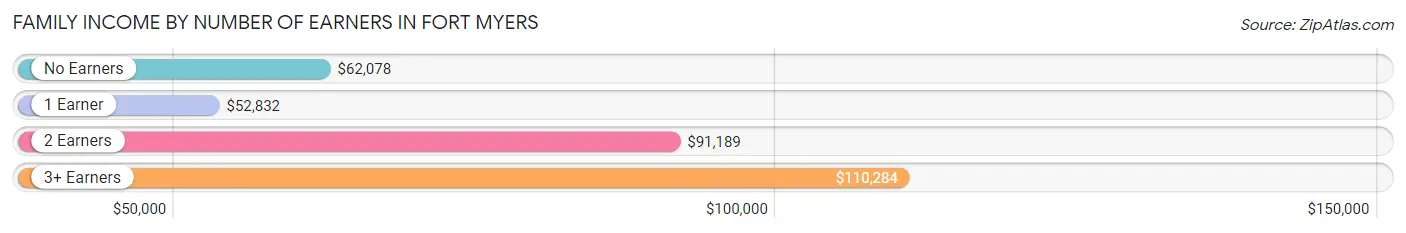
| Number of Earners | # Families | Median Income |
| No Earners | 5,167 (24.8%) | $62,078 |
| 1 Earner | 7,443 (35.7%) | $52,832 |
| 2 Earners | 6,917 (33.2%) | $91,189 |
| 3+ Earners | 1,292 (6.2%) | $110,284 |
| Total | 20,819 (100.0%) | $72,489 |
Household Income in Fort Myers
Household Income Brackets in Fort Myers
With 5,987 households falling in the category, the $50,000 to $74,999 income range is the most frequent in Fort Myers, accounting for 16.9% of all households. In contrast, only 1,346 households (3.8%) fall into the $10,000 to $14,999 income bracket, making it the least populous group.
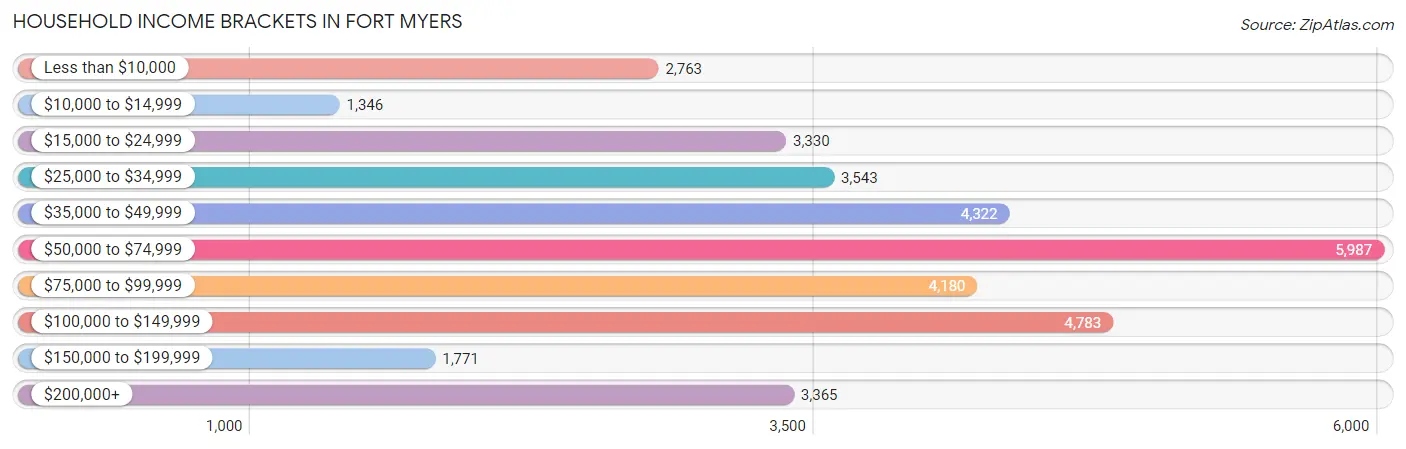
| Income Bracket | # Households | % Households |
| Less than $10,000 | 2,763 | 7.8% |
| $10,000 to $14,999 | 1,346 | 3.8% |
| $15,000 to $24,999 | 3,330 | 9.4% |
| $25,000 to $34,999 | 3,543 | 10.0% |
| $35,000 to $49,999 | 4,322 | 12.2% |
| $50,000 to $74,999 | 5,987 | 16.9% |
| $75,000 to $99,999 | 4,180 | 11.8% |
| $100,000 to $149,999 | 4,783 | 13.5% |
| $150,000 to $199,999 | 1,771 | 5.0% |
| $200,000+ | 3,365 | 9.5% |
Household Income by Householder Age in Fort Myers
The median household income in Fort Myers is $57,403, with the highest median household income of $65,602 found in the 45 to 64 years age bracket for the primary householder. A total of 10,605 households (29.9%) fall into this category. Meanwhile, the 15 to 24 years age bracket for the primary householder has the lowest median household income of $42,266, with 1,255 households (3.5%) in this group.
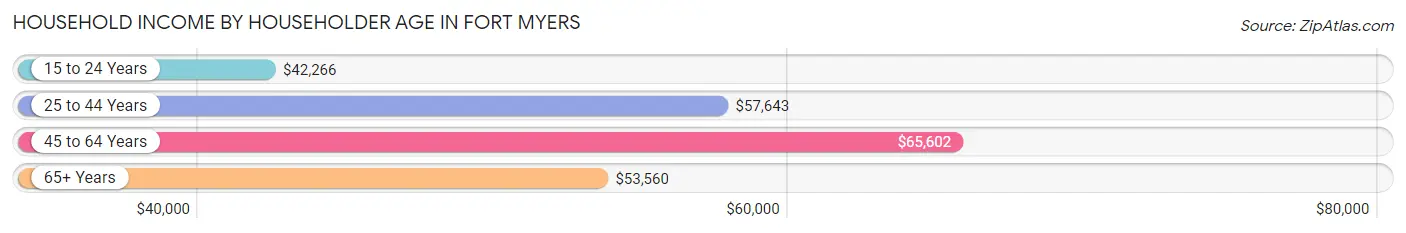
| Income Bracket | # Households | Median Income |
| 15 to 24 Years | 1,255 (3.5%) | $42,266 |
| 25 to 44 Years | 12,127 (34.2%) | $57,643 |
| 45 to 64 Years | 10,605 (29.9%) | $65,602 |
| 65+ Years | 11,439 (32.3%) | $53,560 |
| Total | 35,426 (100.0%) | $57,403 |
Poverty in Fort Myers
Income Below Poverty by Sex and Age in Fort Myers
With 14.7% poverty level for males and 17.4% for females among the residents of Fort Myers, 5 year old males and 5 year old females are the most vulnerable to poverty, with 159 males (26.9%) and 196 females (51.7%) in their respective age groups living below the poverty level.
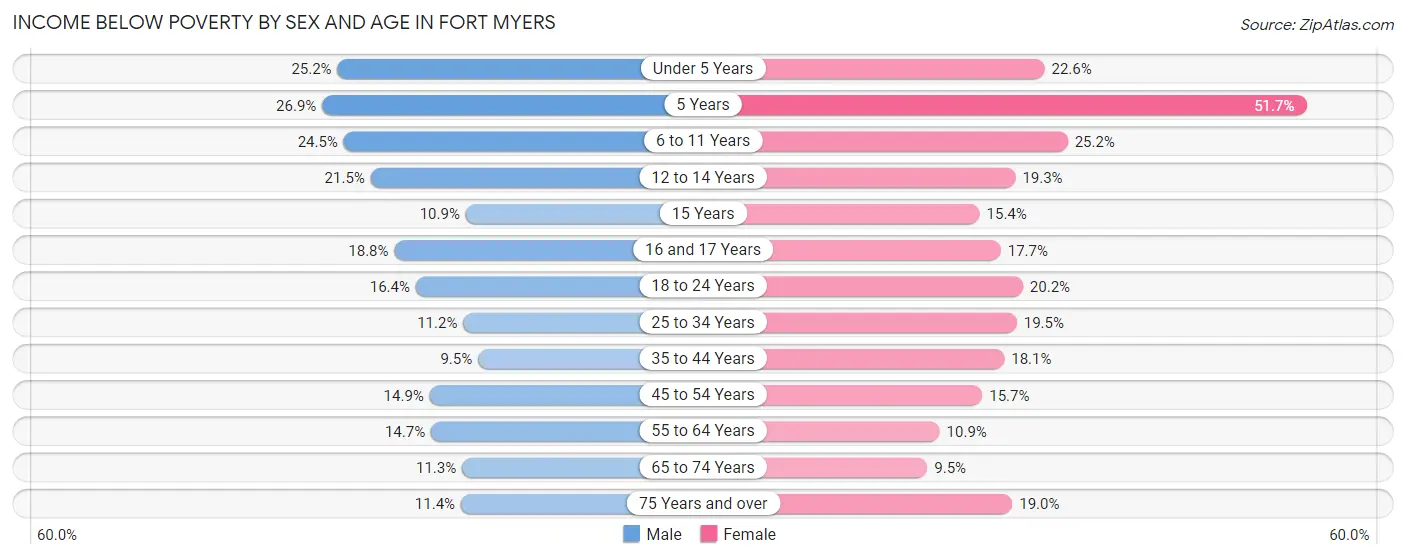
| Age Bracket | Male | Female |
| Under 5 Years | 800 (25.2%) | 538 (22.6%) |
| 5 Years | 159 (26.9%) | 196 (51.7%) |
| 6 to 11 Years | 543 (24.5%) | 720 (25.2%) |
| 12 to 14 Years | 408 (21.5%) | 320 (19.3%) |
| 15 Years | 75 (10.9%) | 68 (15.3%) |
| 16 and 17 Years | 159 (18.8%) | 124 (17.7%) |
| 18 to 24 Years | 461 (16.4%) | 760 (20.2%) |
| 25 to 34 Years | 650 (11.2%) | 1,081 (19.5%) |
| 35 to 44 Years | 582 (9.5%) | 1,112 (18.1%) |
| 45 to 54 Years | 674 (14.9%) | 743 (15.7%) |
| 55 to 64 Years | 683 (14.7%) | 525 (10.9%) |
| 65 to 74 Years | 571 (11.3%) | 558 (9.5%) |
| 75 Years and over | 372 (11.4%) | 935 (19.0%) |
| Total | 6,137 (14.7%) | 7,680 (17.4%) |
Income Above Poverty by Sex and Age in Fort Myers
According to the poverty statistics in Fort Myers, males aged 35 to 44 years and females aged 65 to 74 years are the age groups that are most secure financially, with 90.5% of males and 90.5% of females in these age groups living above the poverty line.
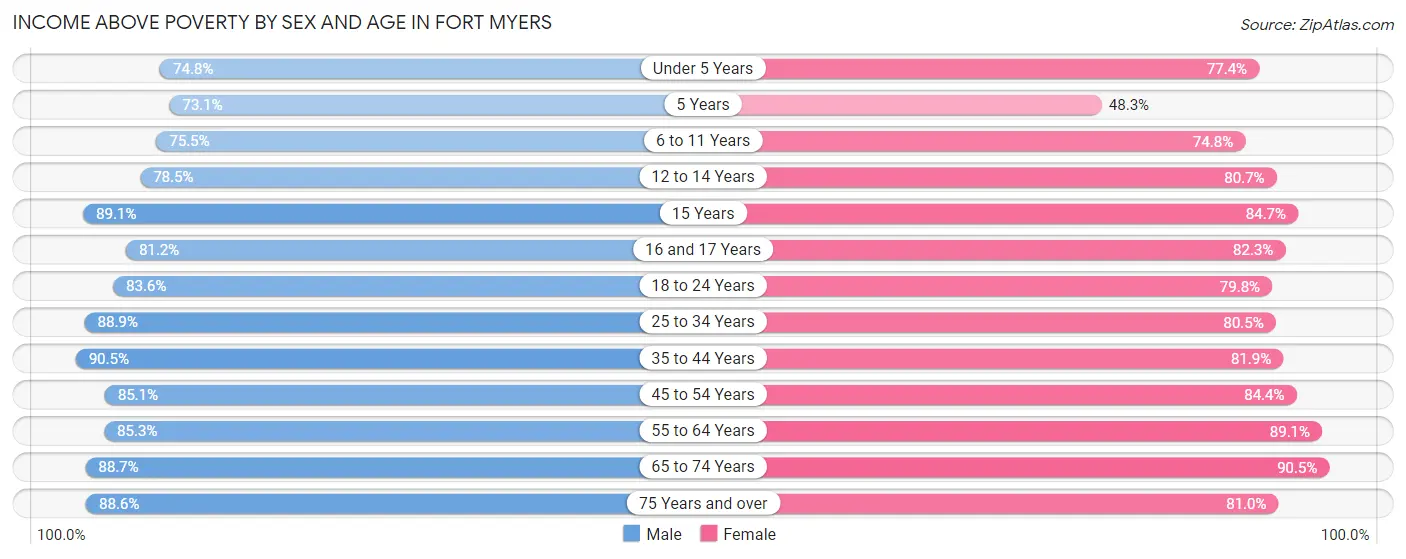
| Age Bracket | Male | Female |
| Under 5 Years | 2,380 (74.8%) | 1,845 (77.4%) |
| 5 Years | 433 (73.1%) | 183 (48.3%) |
| 6 to 11 Years | 1,677 (75.5%) | 2,142 (74.8%) |
| 12 to 14 Years | 1,493 (78.5%) | 1,335 (80.7%) |
| 15 Years | 615 (89.1%) | 375 (84.7%) |
| 16 and 17 Years | 686 (81.2%) | 576 (82.3%) |
| 18 to 24 Years | 2,345 (83.6%) | 3,008 (79.8%) |
| 25 to 34 Years | 5,180 (88.8%) | 4,466 (80.5%) |
| 35 to 44 Years | 5,543 (90.5%) | 5,032 (81.9%) |
| 45 to 54 Years | 3,853 (85.1%) | 4,005 (84.4%) |
| 55 to 64 Years | 3,950 (85.3%) | 4,290 (89.1%) |
| 65 to 74 Years | 4,492 (88.7%) | 5,298 (90.5%) |
| 75 Years and over | 2,887 (88.6%) | 3,988 (81.0%) |
| Total | 35,534 (85.3%) | 36,543 (82.6%) |
Income Below Poverty Among Married-Couple Families in Fort Myers
The poverty statistics for married-couple families in Fort Myers show that 7.7% or 1,100 of the total 14,354 families live below the poverty line. Families with 3 or 4 children have the highest poverty rate of 23.5%, comprising of 185 families. On the other hand, families with 5 or more children have the lowest poverty rate of 0.0%, which includes 0 families.
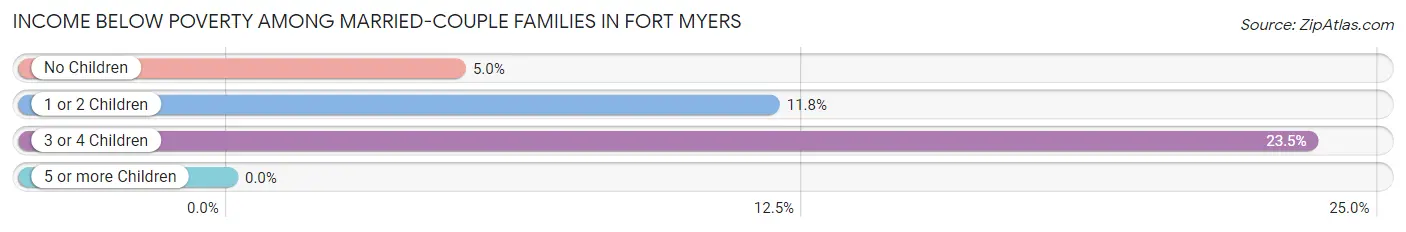
| Children | Above Poverty | Below Poverty |
| No Children | 9,348 (95.0%) | 488 (5.0%) |
| 1 or 2 Children | 3,194 (88.2%) | 427 (11.8%) |
| 3 or 4 Children | 602 (76.5%) | 185 (23.5%) |
| 5 or more Children | 110 (100.0%) | 0 (0.0%) |
| Total | 13,254 (92.3%) | 1,100 (7.7%) |
Income Below Poverty Among Single-Parent Households in Fort Myers
According to the poverty data in Fort Myers, 11.2% or 193 single-father households and 25.5% or 1,208 single-mother households are living below the poverty line. Among single-father households, those with 3 or 4 children have the highest poverty rate, with 16 households (15.7%) experiencing poverty. Likewise, among single-mother households, those with 5 or more children have the highest poverty rate, with 17 households (51.5%) falling below the poverty line.
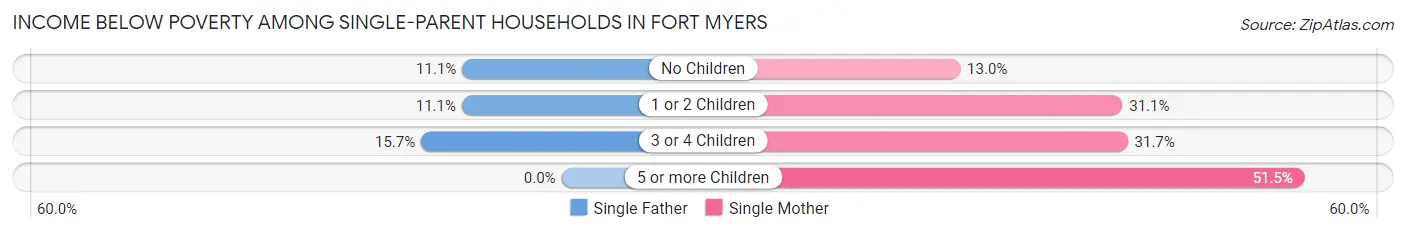
| Children | Single Father | Single Mother |
| No Children | 94 (11.1%) | 201 (13.0%) |
| 1 or 2 Children | 83 (11.1%) | 786 (31.1%) |
| 3 or 4 Children | 16 (15.7%) | 204 (31.7%) |
| 5 or more Children | 0 (0.0%) | 17 (51.5%) |
| Total | 193 (11.2%) | 1,208 (25.5%) |
Income Below Poverty Among Married-Couple vs Single-Parent Households in Fort Myers
The poverty data for Fort Myers shows that 1,100 of the married-couple family households (7.7%) and 1,401 of the single-parent households (21.7%) are living below the poverty level. Within the married-couple family households, those with 3 or 4 children have the highest poverty rate, with 185 households (23.5%) falling below the poverty line. Among the single-parent households, those with 3 or 4 children have the highest poverty rate, with 220 household (29.5%) living below poverty.
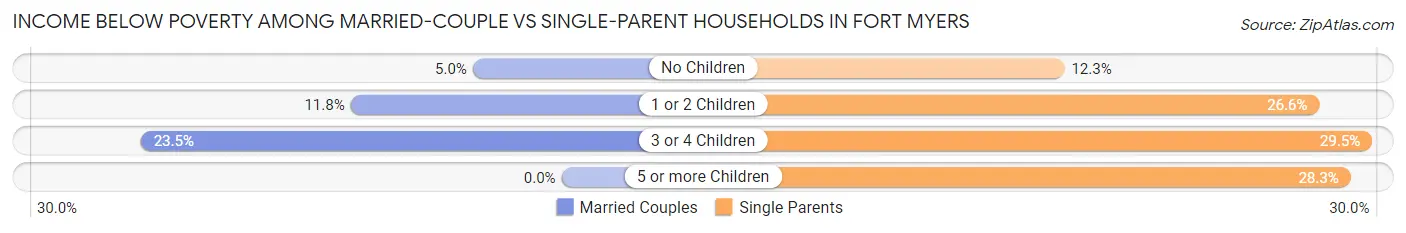
| Children | Married-Couple Families | Single-Parent Households |
| No Children | 488 (5.0%) | 295 (12.3%) |
| 1 or 2 Children | 427 (11.8%) | 869 (26.6%) |
| 3 or 4 Children | 185 (23.5%) | 220 (29.5%) |
| 5 or more Children | 0 (0.0%) | 17 (28.3%) |
| Total | 1,100 (7.7%) | 1,401 (21.7%) |
Race in Fort Myers
The most populous races in Fort Myers are White / Caucasian (49,555 | 55.9%), Hispanic or Latino (21,015 | 23.7%), and Black / African American (19,724 | 22.2%).
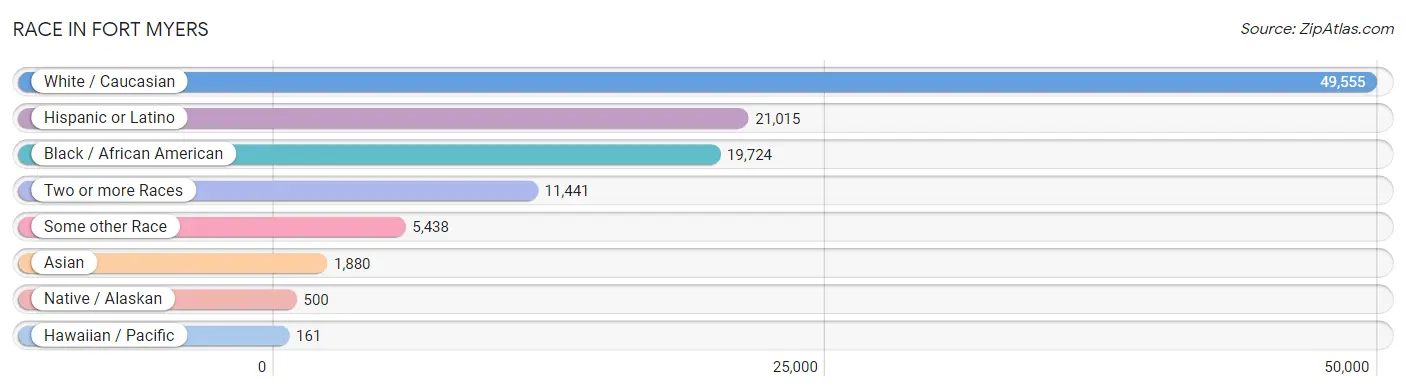
| Race | # Population | % Population |
| Asian | 1,880 | 2.1% |
| Black / African American | 19,724 | 22.2% |
| Hawaiian / Pacific | 161 | 0.2% |
| Hispanic or Latino | 21,015 | 23.7% |
| Native / Alaskan | 500 | 0.6% |
| White / Caucasian | 49,555 | 55.9% |
| Two or more Races | 11,441 | 12.9% |
| Some other Race | 5,438 | 6.1% |
| Total | 88,699 | 100.0% |
Ancestry in Fort Myers
The most populous ancestries reported in Fort Myers are American (11,132 | 12.6%), German (8,533 | 9.6%), Irish (7,083 | 8.0%), English (6,075 | 6.9%), and Italian (5,166 | 5.8%), together accounting for 42.8% of all Fort Myers residents.
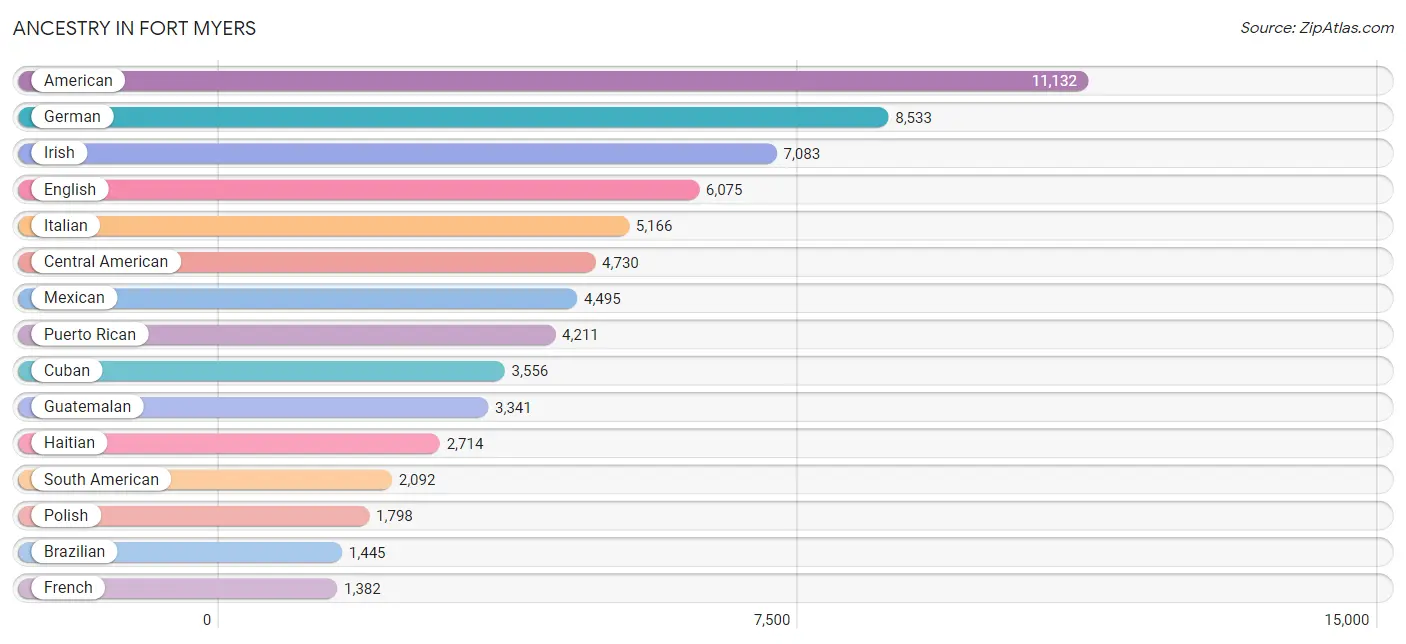
| Ancestry | # Population | % Population |
| Afghan | 30 | 0.0% |
| African | 506 | 0.6% |
| Albanian | 39 | 0.0% |
| American | 11,132 | 12.6% |
| Apache | 5 | 0.0% |
| Arab | 335 | 0.4% |
| Argentinean | 107 | 0.1% |
| Australian | 23 | 0.0% |
| Austrian | 255 | 0.3% |
| Bahamian | 55 | 0.1% |
| Belgian | 39 | 0.0% |
| Belizean | 7 | 0.0% |
| Bhutanese | 149 | 0.2% |
| Bolivian | 206 | 0.2% |
| Brazilian | 1,445 | 1.6% |
| British | 390 | 0.4% |
| British West Indian | 91 | 0.1% |
| Bulgarian | 7 | 0.0% |
| Burmese | 66 | 0.1% |
| Canadian | 351 | 0.4% |
| Celtic | 4 | 0.0% |
| Central American | 4,730 | 5.3% |
| Central American Indian | 516 | 0.6% |
| Cherokee | 100 | 0.1% |
| Chilean | 163 | 0.2% |
| Choctaw | 18 | 0.0% |
| Colombian | 668 | 0.7% |
| Croatian | 88 | 0.1% |
| Cuban | 3,556 | 4.0% |
| Czech | 380 | 0.4% |
| Czechoslovakian | 198 | 0.2% |
| Danish | 189 | 0.2% |
| Dominican | 1,097 | 1.2% |
| Dutch | 516 | 0.6% |
| Eastern European | 201 | 0.2% |
| Ecuadorian | 216 | 0.2% |
| Egyptian | 40 | 0.1% |
| English | 6,075 | 6.9% |
| European | 831 | 0.9% |
| Finnish | 87 | 0.1% |
| French | 1,382 | 1.6% |
| French Canadian | 516 | 0.6% |
| German | 8,533 | 9.6% |
| Ghanaian | 133 | 0.2% |
| Greek | 226 | 0.3% |
| Guatemalan | 3,341 | 3.8% |
| Guyanese | 65 | 0.1% |
| Haitian | 2,714 | 3.1% |
| Honduran | 651 | 0.7% |
| Hungarian | 338 | 0.4% |
| Icelander | 4 | 0.0% |
| Indian (Asian) | 450 | 0.5% |
| Indonesian | 62 | 0.1% |
| Iranian | 8 | 0.0% |
| Irish | 7,083 | 8.0% |
| Iroquois | 11 | 0.0% |
| Israeli | 61 | 0.1% |
| Italian | 5,166 | 5.8% |
| Jamaican | 639 | 0.7% |
| Kenyan | 28 | 0.0% |
| Korean | 307 | 0.4% |
| Laotian | 9 | 0.0% |
| Lebanese | 102 | 0.1% |
| Liberian | 12 | 0.0% |
| Lithuanian | 250 | 0.3% |
| Macedonian | 19 | 0.0% |
| Malaysian | 222 | 0.3% |
| Maltese | 20 | 0.0% |
| Mexican | 4,495 | 5.1% |
| Mexican American Indian | 136 | 0.2% |
| Mongolian | 7 | 0.0% |
| Moroccan | 65 | 0.1% |
| Native Hawaiian | 66 | 0.1% |
| Nicaraguan | 469 | 0.5% |
| Nigerian | 129 | 0.2% |
| Northern European | 130 | 0.2% |
| Norwegian | 555 | 0.6% |
| Pakistani | 17 | 0.0% |
| Palestinian | 25 | 0.0% |
| Panamanian | 204 | 0.2% |
| Pennsylvania German | 10 | 0.0% |
| Peruvian | 350 | 0.4% |
| Polish | 1,798 | 2.0% |
| Portuguese | 388 | 0.4% |
| Puerto Rican | 4,211 | 4.8% |
| Romanian | 242 | 0.3% |
| Russian | 558 | 0.6% |
| Salvadoran | 65 | 0.1% |
| Samoan | 57 | 0.1% |
| Scandinavian | 84 | 0.1% |
| Scotch-Irish | 587 | 0.7% |
| Scottish | 951 | 1.1% |
| Serbian | 102 | 0.1% |
| Sioux | 4 | 0.0% |
| Slavic | 103 | 0.1% |
| Slovak | 93 | 0.1% |
| Slovene | 10 | 0.0% |
| South African | 82 | 0.1% |
| South American | 2,092 | 2.4% |
| South American Indian | 8 | 0.0% |
| Spaniard | 179 | 0.2% |
| Spanish | 155 | 0.2% |
| Spanish American Indian | 31 | 0.0% |
| Sri Lankan | 352 | 0.4% |
| Subsaharan African | 958 | 1.1% |
| Swedish | 683 | 0.8% |
| Swiss | 199 | 0.2% |
| Syrian | 94 | 0.1% |
| Thai | 602 | 0.7% |
| Trinidadian and Tobagonian | 191 | 0.2% |
| Turkish | 18 | 0.0% |
| U.S. Virgin Islander | 133 | 0.2% |
| Ukrainian | 193 | 0.2% |
| Uruguayan | 4 | 0.0% |
| Venezuelan | 367 | 0.4% |
| Vietnamese | 51 | 0.1% |
| Welsh | 360 | 0.4% |
| West Indian | 24 | 0.0% |
| Yaqui | 49 | 0.1% |
| Yugoslavian | 117 | 0.1% |
| Zimbabwean | 61 | 0.1% | View All 121 Rows |
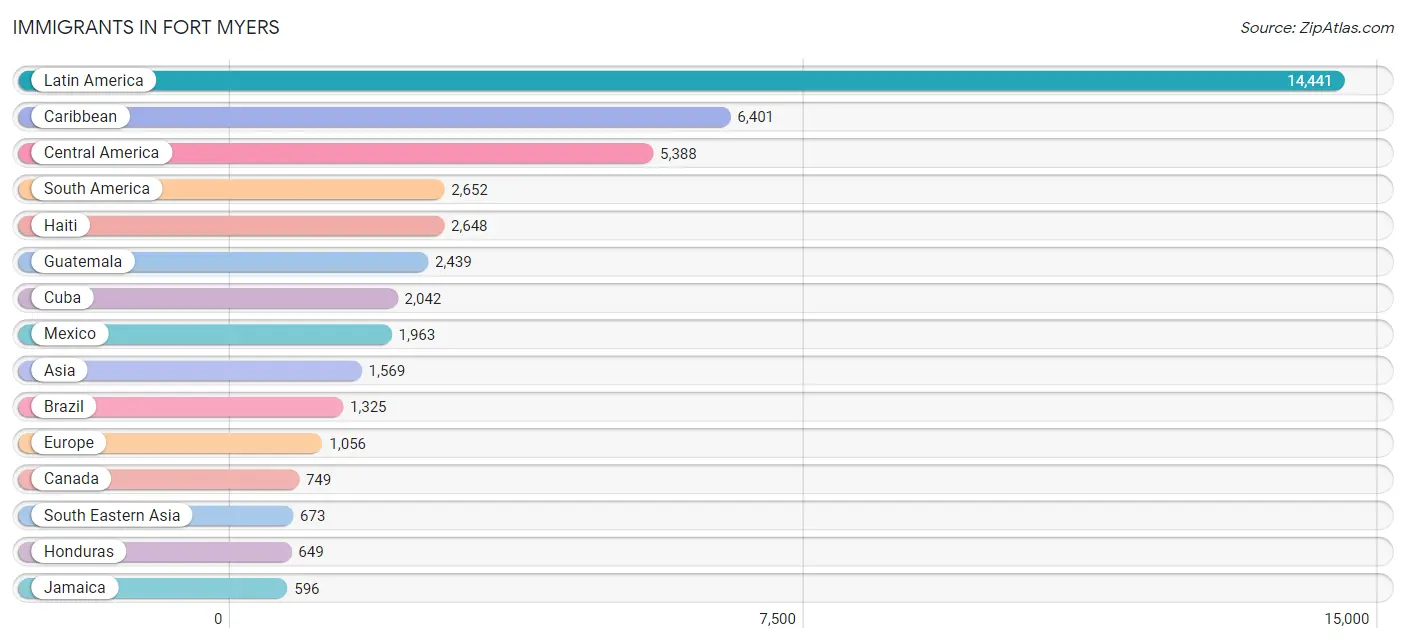
Immigrants in Fort Myers
The most numerous immigrant groups reported in Fort Myers came from Latin America (14,441 | 16.3%), Caribbean (6,401 | 7.2%), Central America (5,388 | 6.1%), South America (2,652 | 3.0%), and Haiti (2,648 | 3.0%), together accounting for 35.5% of all Fort Myers residents.
| Immigration Origin | # Population | % Population |
| Africa | 157 | 0.2% |
| Argentina | 35 | 0.0% |
| Asia | 1,569 | 1.8% |
| Austria | 14 | 0.0% |
| Bahamas | 166 | 0.2% |
| Bangladesh | 42 | 0.1% |
| Barbados | 21 | 0.0% |
| Belize | 7 | 0.0% |
| Bolivia | 144 | 0.2% |
| Bosnia and Herzegovina | 6 | 0.0% |
| Brazil | 1,325 | 1.5% |
| Cambodia | 8 | 0.0% |
| Canada | 749 | 0.8% |
| Caribbean | 6,401 | 7.2% |
| Central America | 5,388 | 6.1% |
| Chile | 143 | 0.2% |
| China | 293 | 0.3% |
| Colombia | 427 | 0.5% |
| Cuba | 2,042 | 2.3% |
| Czechoslovakia | 33 | 0.0% |
| Denmark | 19 | 0.0% |
| Dominica | 112 | 0.1% |
| Dominican Republic | 583 | 0.7% |
| Eastern Africa | 47 | 0.1% |
| Eastern Asia | 343 | 0.4% |
| Eastern Europe | 287 | 0.3% |
| Ecuador | 127 | 0.1% |
| Egypt | 11 | 0.0% |
| El Salvador | 31 | 0.0% |
| England | 86 | 0.1% |
| Europe | 1,056 | 1.2% |
| Fiji | 32 | 0.0% |
| Germany | 317 | 0.4% |
| Ghana | 7 | 0.0% |
| Guatemala | 2,439 | 2.8% |
| Guyana | 48 | 0.1% |
| Haiti | 2,648 | 3.0% |
| Honduras | 649 | 0.7% |
| India | 160 | 0.2% |
| Iran | 8 | 0.0% |
| Iraq | 20 | 0.0% |
| Ireland | 10 | 0.0% |
| Israel | 84 | 0.1% |
| Italy | 80 | 0.1% |
| Jamaica | 596 | 0.7% |
| Jordan | 8 | 0.0% |
| Kenya | 28 | 0.0% |
| Korea | 50 | 0.1% |
| Laos | 97 | 0.1% |
| Latin America | 14,441 | 16.3% |
| Lebanon | 31 | 0.0% |
| Liberia | 12 | 0.0% |
| Lithuania | 7 | 0.0% |
| Malaysia | 4 | 0.0% |
| Mexico | 1,963 | 2.2% |
| Morocco | 23 | 0.0% |
| Netherlands | 24 | 0.0% |
| Nicaragua | 261 | 0.3% |
| Northern Africa | 34 | 0.0% |
| Northern Europe | 263 | 0.3% |
| Oceania | 80 | 0.1% |
| Pakistan | 86 | 0.1% |
| Panama | 38 | 0.0% |
| Peru | 84 | 0.1% |
| Philippines | 231 | 0.3% |
| Poland | 46 | 0.1% |
| Portugal | 30 | 0.0% |
| Romania | 103 | 0.1% |
| Russia | 38 | 0.0% |
| Singapore | 6 | 0.0% |
| South Africa | 57 | 0.1% |
| South America | 2,652 | 3.0% |
| South Central Asia | 372 | 0.4% |
| South Eastern Asia | 673 | 0.8% |
| Southern Europe | 131 | 0.2% |
| Spain | 21 | 0.0% |
| Sri Lanka | 76 | 0.1% |
| St. Vincent and the Grenadines | 31 | 0.0% |
| Sweden | 11 | 0.0% |
| Switzerland | 20 | 0.0% |
| Syria | 20 | 0.0% |
| Thailand | 9 | 0.0% |
| Trinidad and Tobago | 103 | 0.1% |
| Ukraine | 7 | 0.0% |
| Uruguay | 4 | 0.0% |
| Venezuela | 315 | 0.4% |
| Vietnam | 249 | 0.3% |
| West Indies | 10 | 0.0% |
| Western Africa | 19 | 0.0% |
| Western Asia | 163 | 0.2% |
| Western Europe | 375 | 0.4% |
| Zimbabwe | 19 | 0.0% | View All 92 Rows |
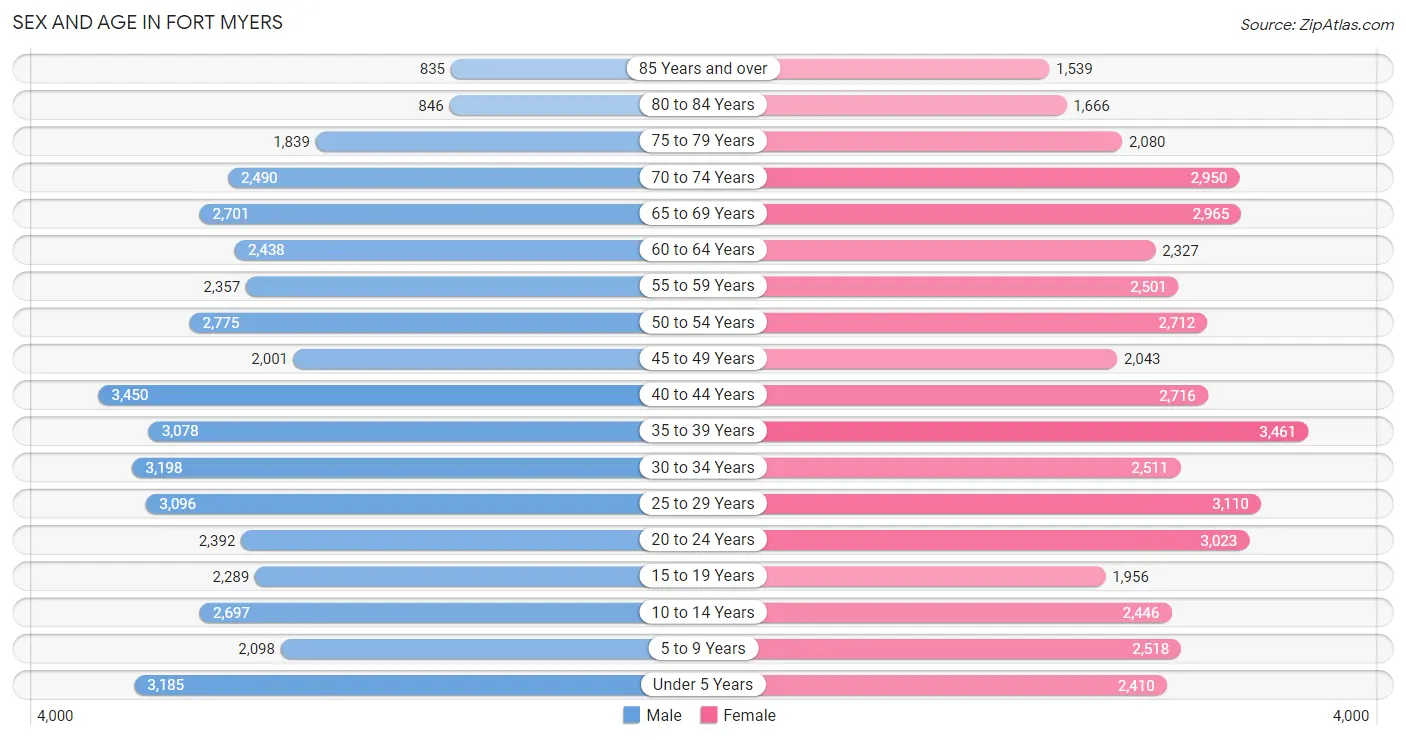
Sex and Age in Fort Myers
Sex and Age in Fort Myers
The most populous age groups in Fort Myers are 40 to 44 Years (3,450 | 7.9%) for men and 35 to 39 Years (3,461 | 7.7%) for women.
| Age Bracket | Male | Female |
| Under 5 Years | 3,185 (7.3%) | 2,410 (5.4%) |
| 5 to 9 Years | 2,098 (4.8%) | 2,518 (5.6%) |
| 10 to 14 Years | 2,697 (6.2%) | 2,446 (5.4%) |
| 15 to 19 Years | 2,289 (5.2%) | 1,956 (4.3%) |
| 20 to 24 Years | 2,392 (5.5%) | 3,023 (6.7%) |
| 25 to 29 Years | 3,096 (7.1%) | 3,110 (6.9%) |
| 30 to 34 Years | 3,198 (7.3%) | 2,511 (5.6%) |
| 35 to 39 Years | 3,078 (7.0%) | 3,461 (7.7%) |
| 40 to 44 Years | 3,450 (7.9%) | 2,716 (6.0%) |
| 45 to 49 Years | 2,001 (4.6%) | 2,043 (4.5%) |
| 50 to 54 Years | 2,775 (6.3%) | 2,712 (6.0%) |
| 55 to 59 Years | 2,357 (5.4%) | 2,501 (5.6%) |
| 60 to 64 Years | 2,438 (5.6%) | 2,327 (5.2%) |
| 65 to 69 Years | 2,701 (6.2%) | 2,965 (6.6%) |
| 70 to 74 Years | 2,490 (5.7%) | 2,950 (6.6%) |
| 75 to 79 Years | 1,839 (4.2%) | 2,080 (4.6%) |
| 80 to 84 Years | 846 (1.9%) | 1,666 (3.7%) |
| 85 Years and over | 835 (1.9%) | 1,539 (3.4%) |
| Total | 43,765 (100.0%) | 44,934 (100.0%) |
Families and Households in Fort Myers
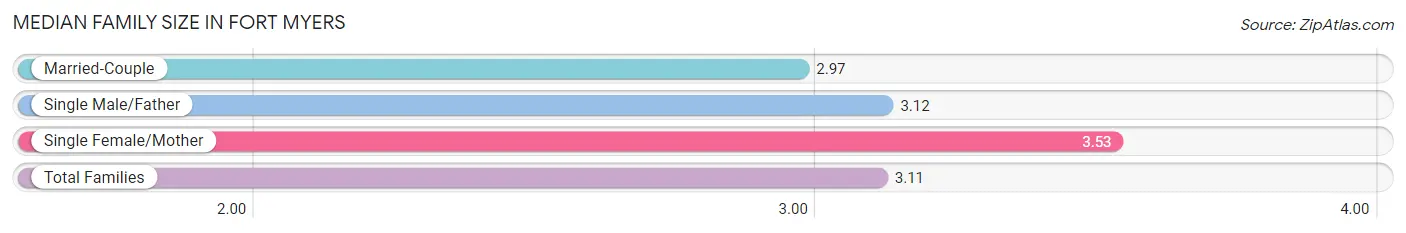
Median Family Size in Fort Myers
The median family size in Fort Myers is 3.11 persons per family, with single female/mother families (4,744 | 22.8%) accounting for the largest median family size of 3.53 persons per family. On the other hand, married-couple families (14,354 | 69.0%) represent the smallest median family size with 2.97 persons per family.
| Family Type | # Families | Family Size |
| Married-Couple | 14,354 (69.0%) | 2.97 |
| Single Male/Father | 1,721 (8.3%) | 3.12 |
| Single Female/Mother | 4,744 (22.8%) | 3.53 |
| Total Families | 20,819 (100.0%) | 3.11 |
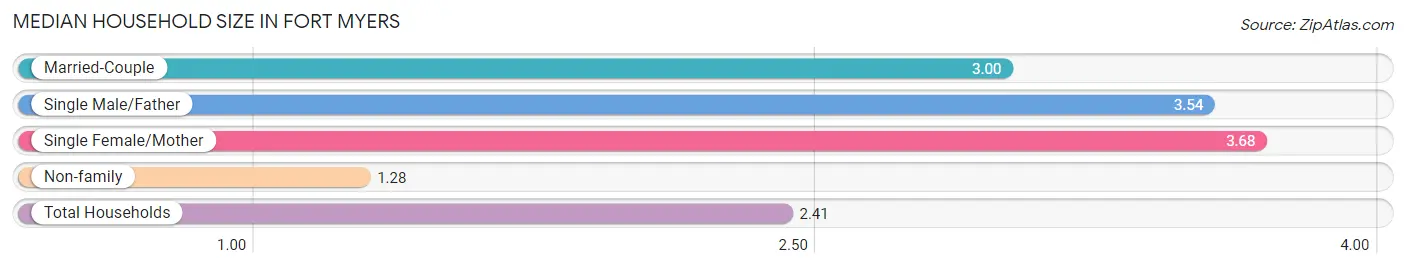
Median Household Size in Fort Myers
The median household size in Fort Myers is 2.41 persons per household, with single female/mother households (4,744 | 13.4%) accounting for the largest median household size of 3.68 persons per household. non-family households (14,607 | 41.2%) represent the smallest median household size with 1.28 persons per household.
| Household Type | # Households | Household Size |
| Married-Couple | 14,354 (40.5%) | 3.00 |
| Single Male/Father | 1,721 (4.9%) | 3.54 |
| Single Female/Mother | 4,744 (13.4%) | 3.68 |
| Non-family | 14,607 (41.2%) | 1.28 |
| Total Households | 35,426 (100.0%) | 2.41 |
Household Size by Marriage Status in Fort Myers
Out of a total of 35,426 households in Fort Myers, 20,819 (58.8%) are family households, while 14,607 (41.2%) are nonfamily households. The most numerous type of family households are 2-person households, comprising 11,368, and the most common type of nonfamily households are 1-person households, comprising 11,872.
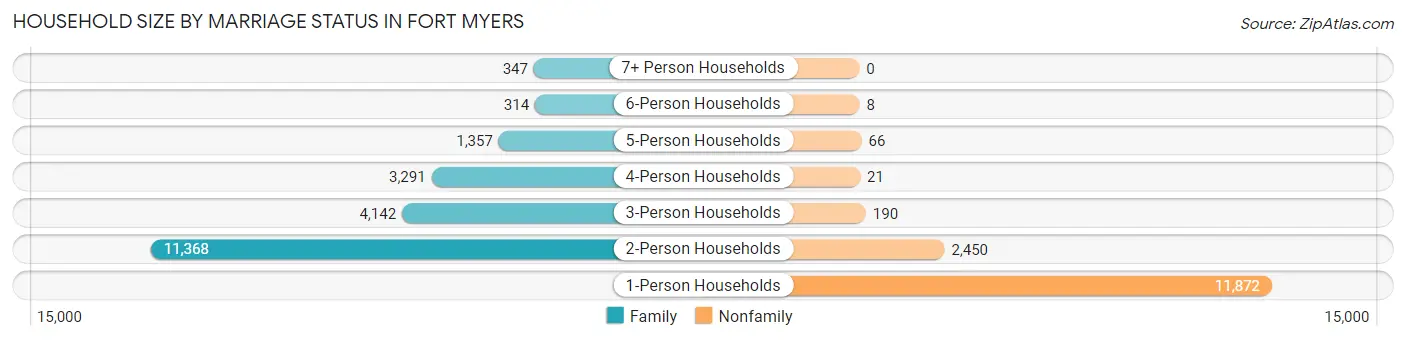
| Household Size | Family Households | Nonfamily Households |
| 1-Person Households | - | 11,872 (33.5%) |
| 2-Person Households | 11,368 (32.1%) | 2,450 (6.9%) |
| 3-Person Households | 4,142 (11.7%) | 190 (0.5%) |
| 4-Person Households | 3,291 (9.3%) | 21 (0.1%) |
| 5-Person Households | 1,357 (3.8%) | 66 (0.2%) |
| 6-Person Households | 314 (0.9%) | 8 (0.0%) |
| 7+ Person Households | 347 (1.0%) | 0 (0.0%) |
| Total | 20,819 (58.8%) | 14,607 (41.2%) |
Female Fertility in Fort Myers
Fertility by Age in Fort Myers
Average fertility rate in Fort Myers is 64.0 births per 1,000 women. Women in the age bracket of 20 to 34 years have the highest fertility rate with 121.0 births per 1,000 women. Women in the age bracket of 20 to 34 years acount for 84.5% of all women with births.
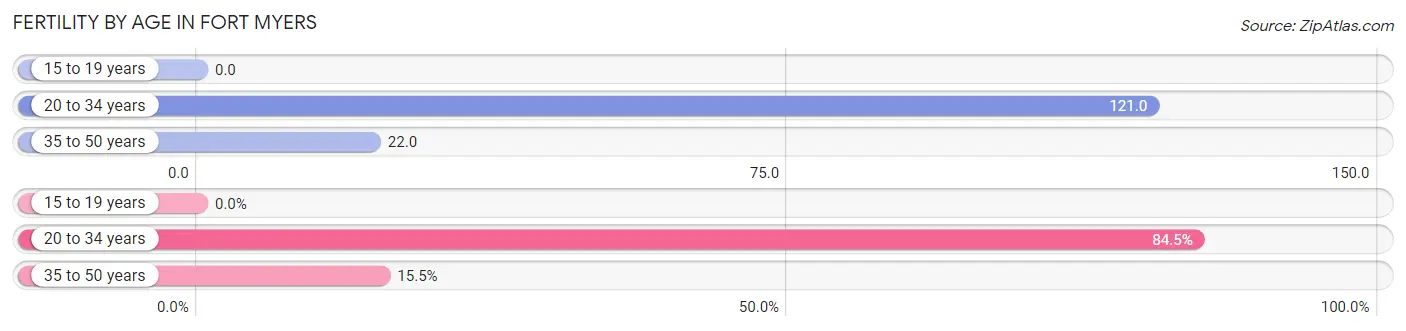
| Age Bracket | Women with Births | Births / 1,000 Women |
| 15 to 19 years | 0 (0.0%) | 0.0 |
| 20 to 34 years | 1,044 (84.5%) | 121.0 |
| 35 to 50 years | 191 (15.5%) | 22.0 |
| Total | 1,235 (100.0%) | 64.0 |
Fertility by Age by Marriage Status in Fort Myers
44.1% of women with births (1,235) in Fort Myers are married. The highest percentage of unmarried women with births falls into 35 to 50 years age bracket with 58.1% of them unmarried at the time of birth, while the lowest percentage of unmarried women with births belong to 20 to 34 years age bracket with 55.5% of them unmarried.
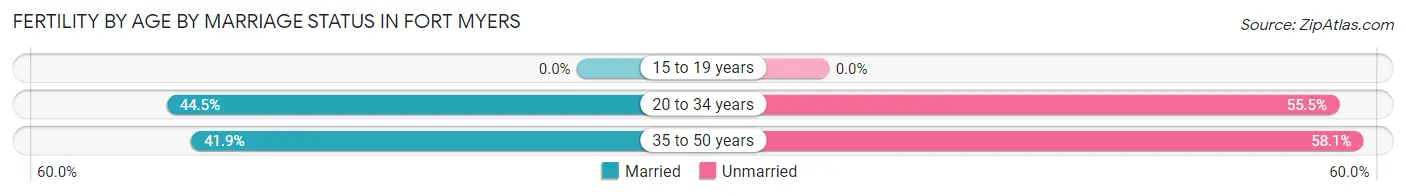
| Age Bracket | Married | Unmarried |
| 15 to 19 years | 0 (0.0%) | 0 (0.0%) |
| 20 to 34 years | 465 (44.5%) | 579 (55.5%) |
| 35 to 50 years | 80 (41.9%) | 111 (58.1%) |
| Total | 545 (44.1%) | 690 (55.9%) |
Fertility by Education in Fort Myers
Average fertility rate in Fort Myers is 64.0 births per 1,000 women. Women with the education attainment of high school diploma have the highest fertility rate of 107.0 births per 1,000 women, while women with the education attainment of graduate degree have the lowest fertility at 11.0 births per 1,000 women. Women with the education attainment of high school diploma represent 43.8% of all women with births.
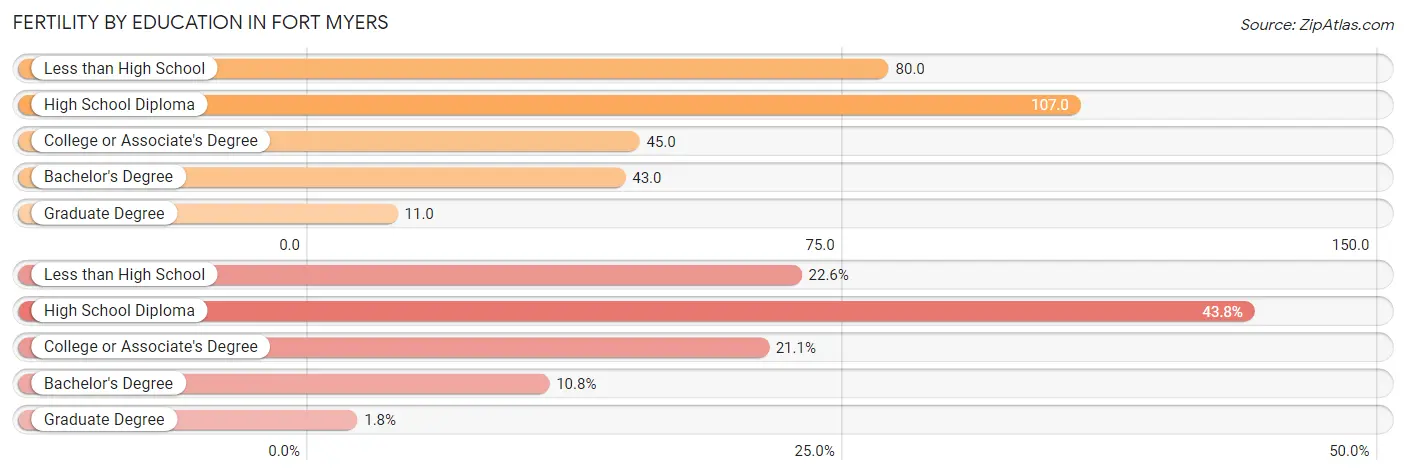
| Educational Attainment | Women with Births | Births / 1,000 Women |
| Less than High School | 279 (22.6%) | 80.0 |
| High School Diploma | 541 (43.8%) | 107.0 |
| College or Associate's Degree | 260 (21.0%) | 45.0 |
| Bachelor's Degree | 133 (10.8%) | 43.0 |
| Graduate Degree | 22 (1.8%) | 11.0 |
| Total | 1,235 (100.0%) | 64.0 |
Fertility by Education by Marriage Status in Fort Myers
55.9% of women with births in Fort Myers are unmarried. Women with the educational attainment of bachelor's degree are most likely to be married with 74.4% of them married at childbirth, while women with the educational attainment of college or associate's degree are least likely to be married with 65.0% of them unmarried at childbirth.
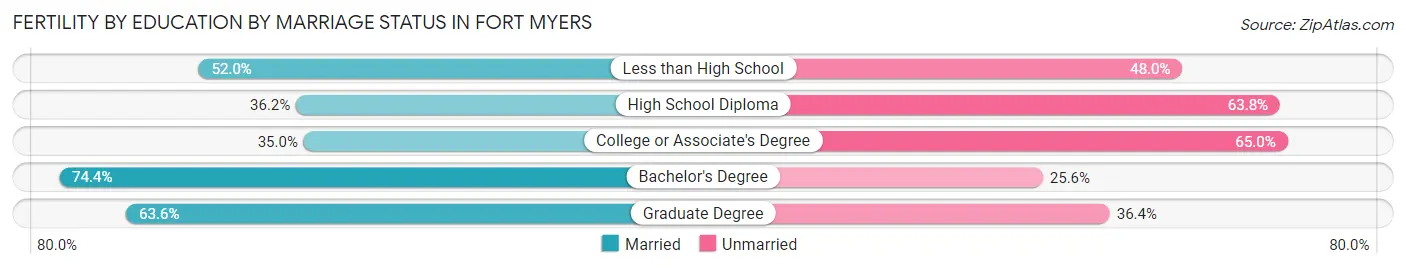
| Educational Attainment | Married | Unmarried |
| Less than High School | 145 (52.0%) | 134 (48.0%) |
| High School Diploma | 196 (36.2%) | 345 (63.8%) |
| College or Associate's Degree | 91 (35.0%) | 169 (65.0%) |
| Bachelor's Degree | 99 (74.4%) | 34 (25.6%) |
| Graduate Degree | 14 (63.6%) | 8 (36.4%) |
| Total | 545 (44.1%) | 690 (55.9%) |
Employment Characteristics in Fort Myers
Employment by Class of Employer in Fort Myers
Among the 37,373 employed individuals in Fort Myers, private company employees (27,530 | 73.7%), local government employees (2,474 | 6.6%), and not-for-profit organizations (2,305 | 6.2%) make up the most common classes of employment.
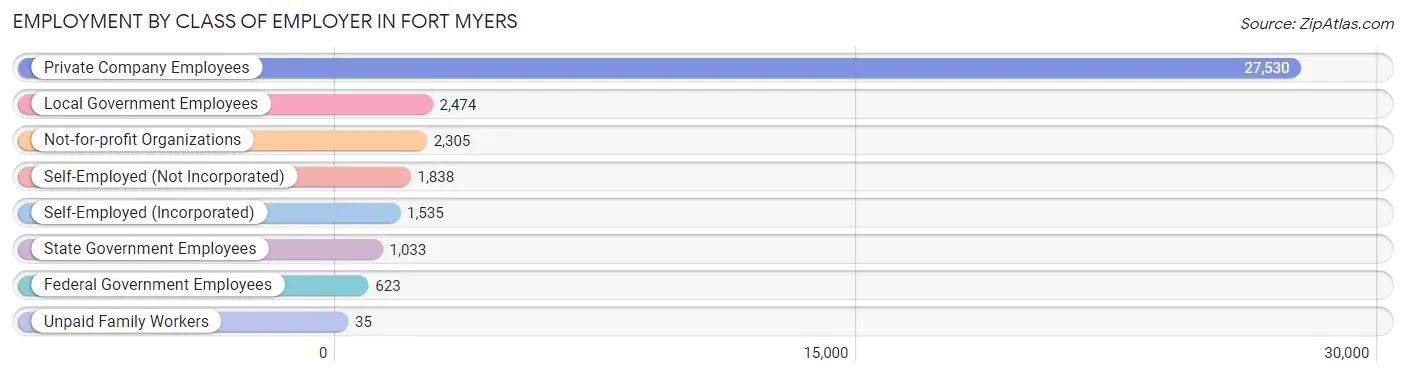
| Employer Class | # Employees | % Employees |
| Private Company Employees | 27,530 | 73.7% |
| Self-Employed (Incorporated) | 1,535 | 4.1% |
| Self-Employed (Not Incorporated) | 1,838 | 4.9% |
| Not-for-profit Organizations | 2,305 | 6.2% |
| Local Government Employees | 2,474 | 6.6% |
| State Government Employees | 1,033 | 2.8% |
| Federal Government Employees | 623 | 1.7% |
| Unpaid Family Workers | 35 | 0.1% |
| Total | 37,373 | 100.0% |
Employment Status by Age in Fort Myers
According to the labor force statistics for Fort Myers, out of the total population over 16 years of age (72,202), 55.1% or 39,783 individuals are in the labor force, with 4.1% or 1,631 of them unemployed. The age group with the highest labor force participation rate is 20 to 24 years, with 81.9% or 4,435 individuals in the labor force. Within the labor force, the 75 years and over age range has the highest percentage of unemployed individuals, with 9.9% or 41 of them being unemployed.
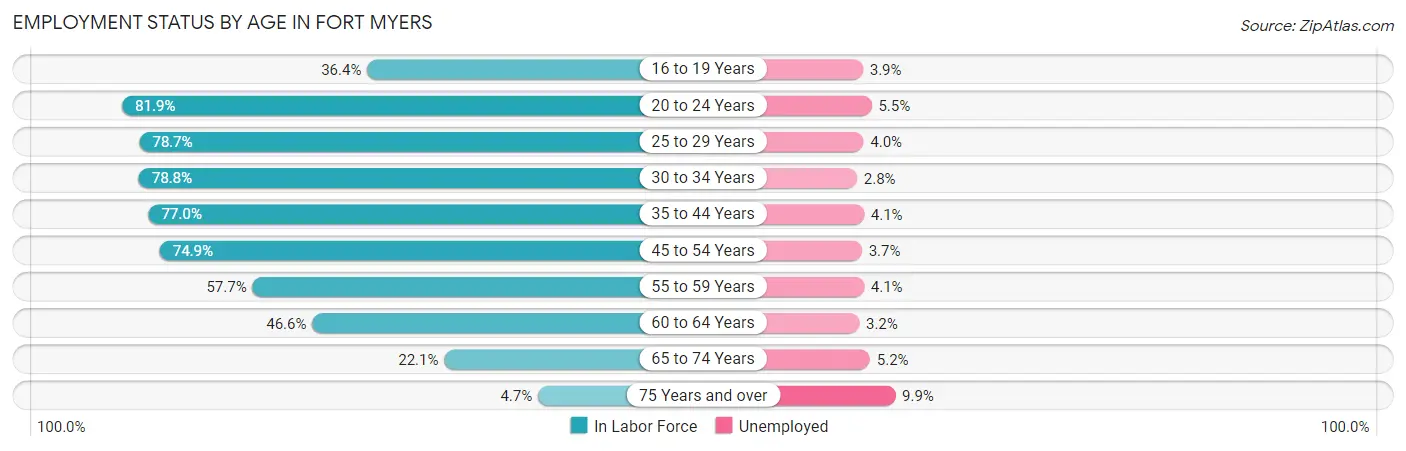
| Age Bracket | In Labor Force | Unemployed |
| 16 to 19 Years | 1,129 (36.4%) | 44 (3.9%) |
| 20 to 24 Years | 4,435 (81.9%) | 244 (5.5%) |
| 25 to 29 Years | 4,884 (78.7%) | 195 (4.0%) |
| 30 to 34 Years | 4,499 (78.8%) | 126 (2.8%) |
| 35 to 44 Years | 9,783 (77.0%) | 401 (4.1%) |
| 45 to 54 Years | 7,139 (74.9%) | 264 (3.7%) |
| 55 to 59 Years | 2,803 (57.7%) | 115 (4.1%) |
| 60 to 64 Years | 2,220 (46.6%) | 71 (3.2%) |
| 65 to 74 Years | 2,454 (22.1%) | 128 (5.2%) |
| 75 Years and over | 414 (4.7%) | 41 (9.9%) |
| Total | 39,783 (55.1%) | 1,631 (4.1%) |
Employment Status by Educational Attainment in Fort Myers
According to labor force statistics for Fort Myers, 71.6% of individuals (31,342) out of the total population between 25 and 64 years of age (43,774) are in the labor force, with 3.8% or 1,191 of them being unemployed. The group with the highest labor force participation rate are those with the educational attainment of bachelor's degree or higher, with 82.0% or 10,376 individuals in the labor force. Within the labor force, individuals with college / associate degree education have the highest percentage of unemployment, with 4.9% or 420 of them being unemployed.
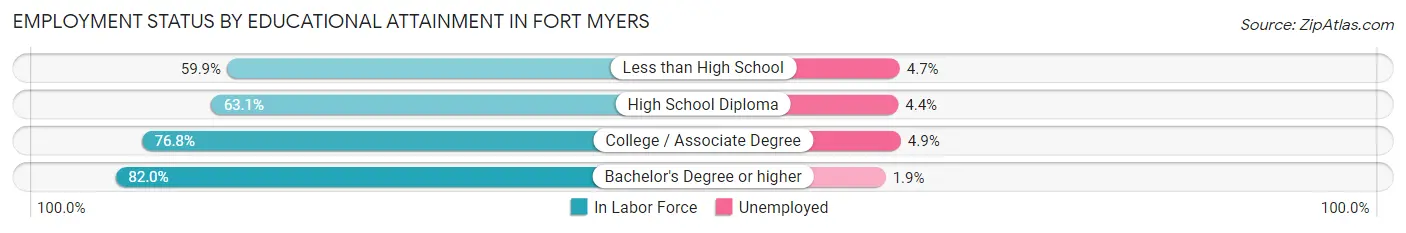
| Educational Attainment | In Labor Force | Unemployed |
| Less than High School | 4,027 (59.9%) | 316 (4.7%) |
| High School Diploma | 8,350 (63.1%) | 582 (4.4%) |
| College / Associate Degree | 8,574 (76.8%) | 547 (4.9%) |
| Bachelor's Degree or higher | 10,376 (82.0%) | 240 (1.9%) |
| Total | 31,342 (71.6%) | 1,663 (3.8%) |
Employment Occupations by Sex in Fort Myers
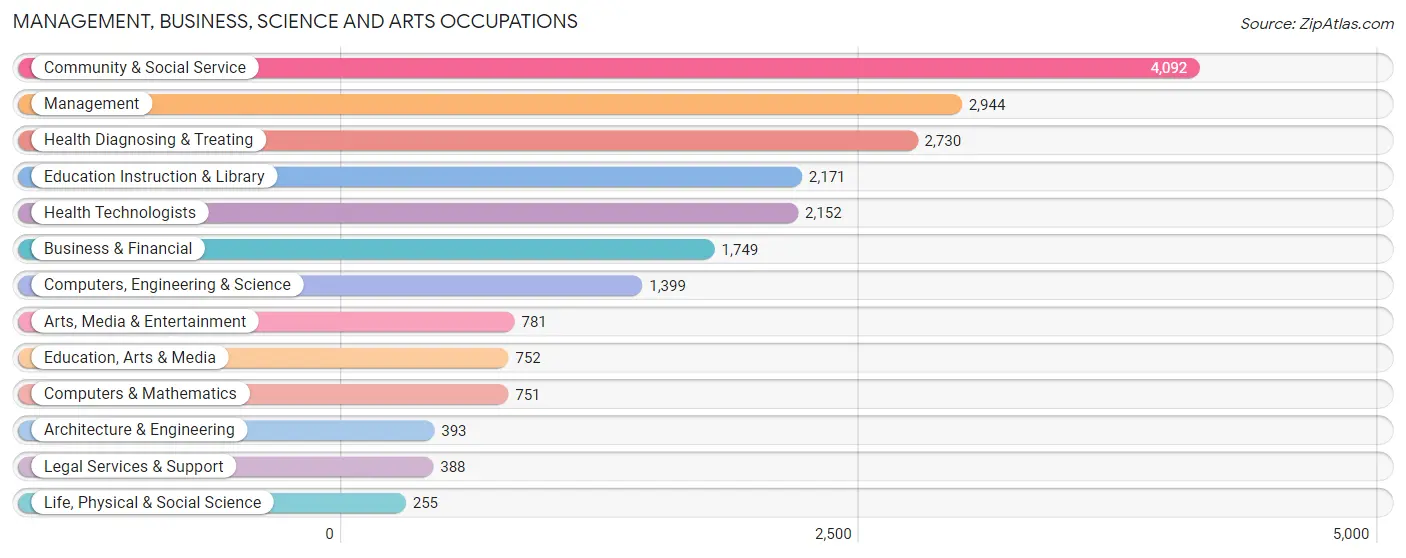
Management, Business, Science and Arts Occupations
The most common Management, Business, Science and Arts occupations in Fort Myers are Community & Social Service (4,092 | 10.7%), Management (2,944 | 7.7%), Health Diagnosing & Treating (2,730 | 7.2%), Education Instruction & Library (2,171 | 5.7%), and Health Technologists (2,152 | 5.6%).
Management, Business, Science and Arts Occupations by Sex
Within the Management, Business, Science and Arts occupations in Fort Myers, the most male-oriented occupations are Architecture & Engineering (89.6%), Computers & Mathematics (81.8%), and Computers, Engineering & Science (78.6%), while the most female-oriented occupations are Health Diagnosing & Treating (75.7%), Health Technologists (74.9%), and Education, Arts & Media (69.2%).
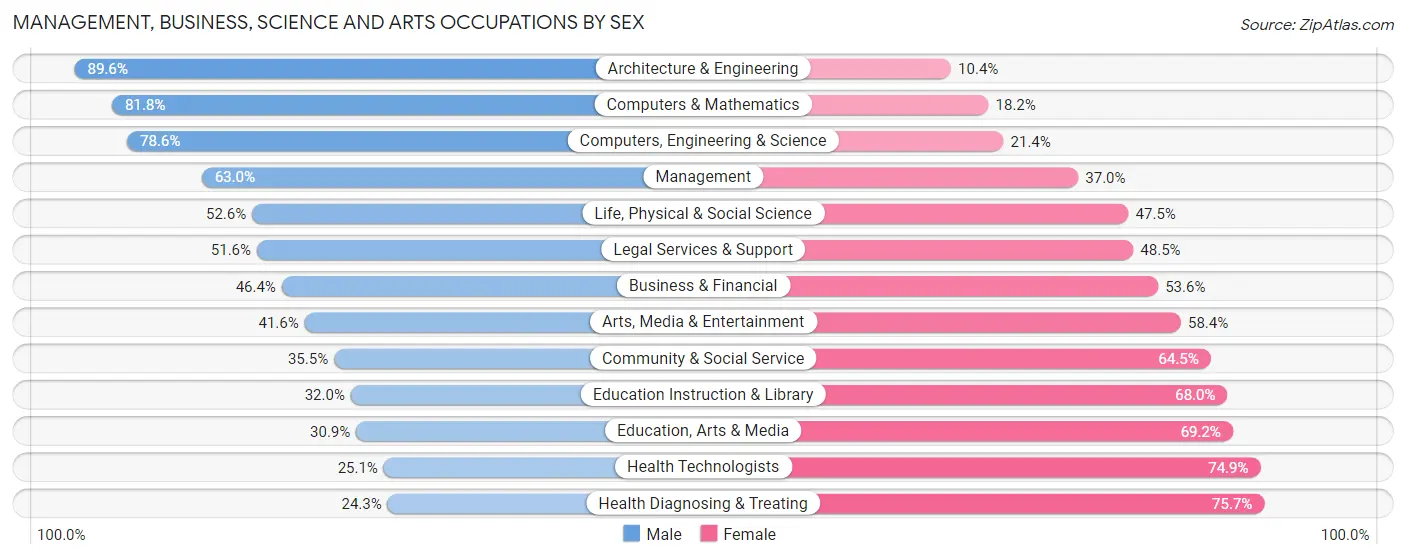
| Occupation | Male | Female |
| Management | 1,856 (63.0%) | 1,088 (37.0%) |
| Business & Financial | 811 (46.4%) | 938 (53.6%) |
| Computers, Engineering & Science | 1,100 (78.6%) | 299 (21.4%) |
| Computers & Mathematics | 614 (81.8%) | 137 (18.2%) |
| Architecture & Engineering | 352 (89.6%) | 41 (10.4%) |
| Life, Physical & Social Science | 134 (52.5%) | 121 (47.4%) |
| Community & Social Service | 1,451 (35.5%) | 2,641 (64.5%) |
| Education, Arts & Media | 232 (30.8%) | 520 (69.2%) |
| Legal Services & Support | 200 (51.5%) | 188 (48.4%) |
| Education Instruction & Library | 694 (32.0%) | 1,477 (68.0%) |
| Arts, Media & Entertainment | 325 (41.6%) | 456 (58.4%) |
| Health Diagnosing & Treating | 663 (24.3%) | 2,067 (75.7%) |
| Health Technologists | 540 (25.1%) | 1,612 (74.9%) |
| Total (Category) | 5,881 (45.5%) | 7,033 (54.5%) |
| Total (Overall) | 20,379 (53.4%) | 17,755 (46.6%) |
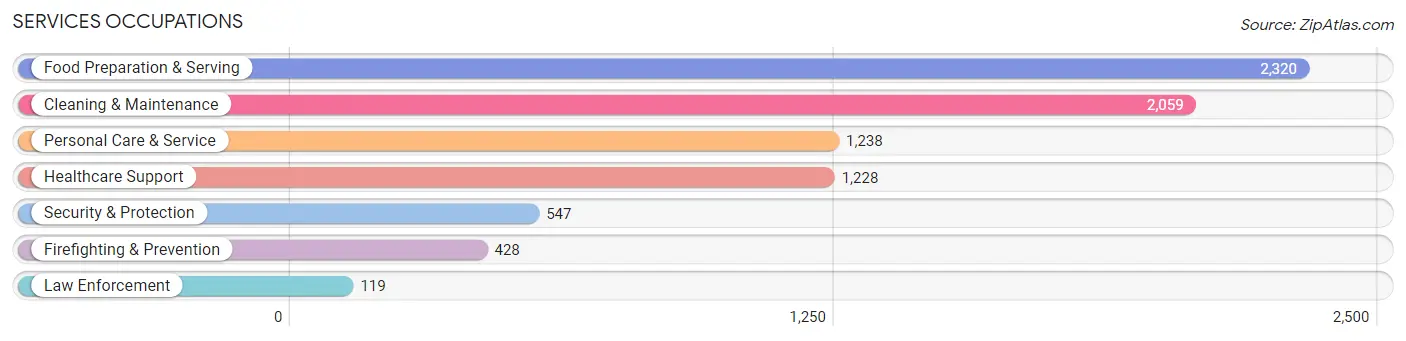
Services Occupations
The most common Services occupations in Fort Myers are Food Preparation & Serving (2,320 | 6.1%), Cleaning & Maintenance (2,059 | 5.4%), Personal Care & Service (1,238 | 3.3%), Healthcare Support (1,228 | 3.2%), and Security & Protection (547 | 1.4%).
Services Occupations by Sex
Within the Services occupations in Fort Myers, the most male-oriented occupations are Law Enforcement (82.4%), Cleaning & Maintenance (72.3%), and Security & Protection (52.1%), while the most female-oriented occupations are Healthcare Support (93.3%), Personal Care & Service (71.9%), and Food Preparation & Serving (65.2%).
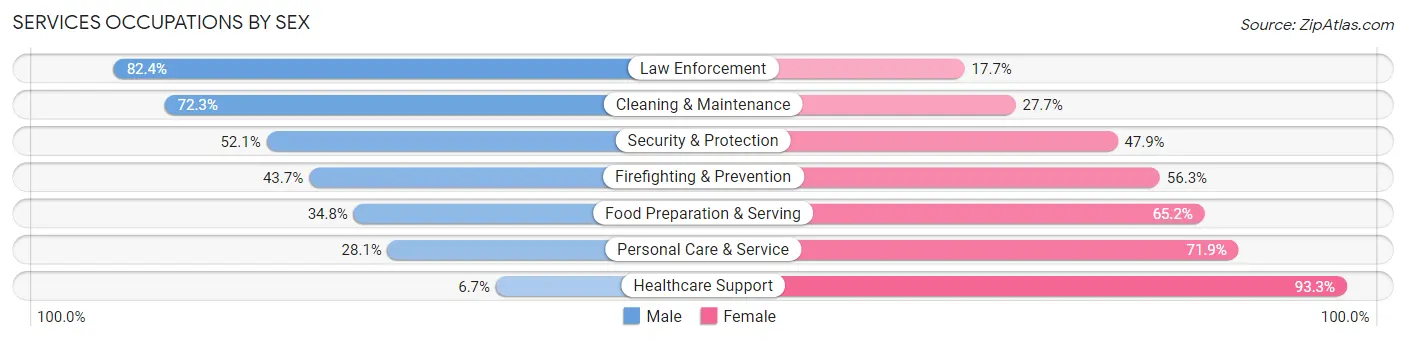
| Occupation | Male | Female |
| Healthcare Support | 82 (6.7%) | 1,146 (93.3%) |
| Security & Protection | 285 (52.1%) | 262 (47.9%) |
| Firefighting & Prevention | 187 (43.7%) | 241 (56.3%) |
| Law Enforcement | 98 (82.4%) | 21 (17.6%) |
| Food Preparation & Serving | 808 (34.8%) | 1,512 (65.2%) |
| Cleaning & Maintenance | 1,488 (72.3%) | 571 (27.7%) |
| Personal Care & Service | 348 (28.1%) | 890 (71.9%) |
| Total (Category) | 3,011 (40.7%) | 4,381 (59.3%) |
| Total (Overall) | 20,379 (53.4%) | 17,755 (46.6%) |
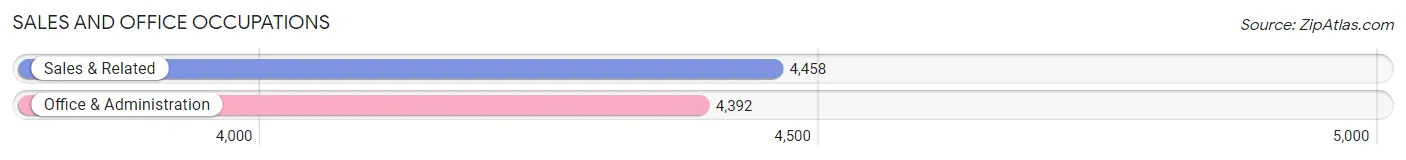
Sales and Office Occupations
The most common Sales and Office occupations in Fort Myers are Sales & Related (4,458 | 11.7%), and Office & Administration (4,392 | 11.5%).
Sales and Office Occupations by Sex
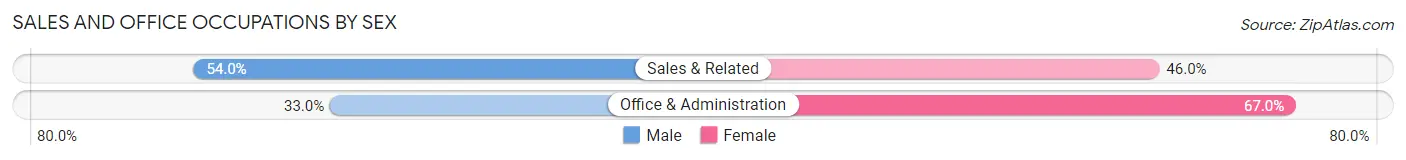
| Occupation | Male | Female |
| Sales & Related | 2,408 (54.0%) | 2,050 (46.0%) |
| Office & Administration | 1,450 (33.0%) | 2,942 (67.0%) |
| Total (Category) | 3,858 (43.6%) | 4,992 (56.4%) |
| Total (Overall) | 20,379 (53.4%) | 17,755 (46.6%) |
Natural Resources, Construction and Maintenance Occupations
The most common Natural Resources, Construction and Maintenance occupations in Fort Myers are Construction & Extraction (3,454 | 9.1%), Installation, Maintenance & Repair (1,041 | 2.7%), and Farming, Fishing & Forestry (162 | 0.4%).
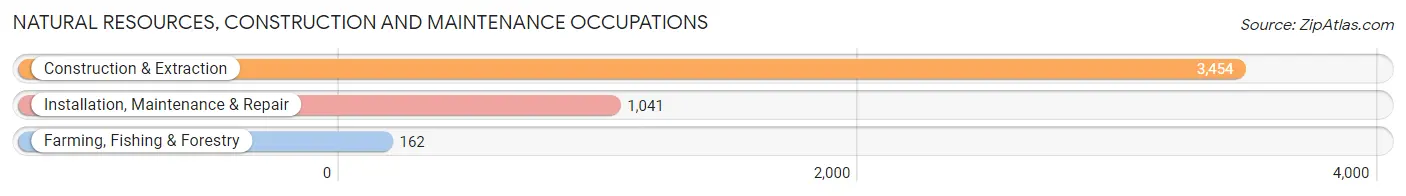
Natural Resources, Construction and Maintenance Occupations by Sex
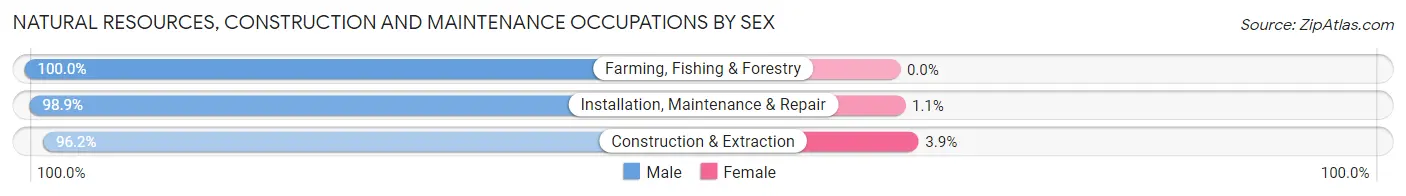
| Occupation | Male | Female |
| Farming, Fishing & Forestry | 162 (100.0%) | 0 (0.0%) |
| Construction & Extraction | 3,321 (96.2%) | 133 (3.8%) |
| Installation, Maintenance & Repair | 1,030 (98.9%) | 11 (1.1%) |
| Total (Category) | 4,513 (96.9%) | 144 (3.1%) |
| Total (Overall) | 20,379 (53.4%) | 17,755 (46.6%) |
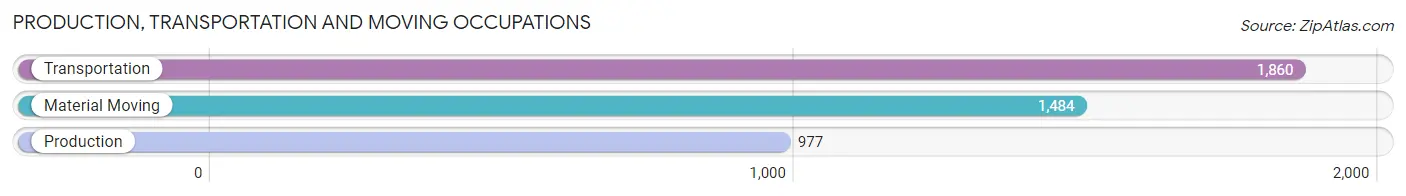
Production, Transportation and Moving Occupations
The most common Production, Transportation and Moving occupations in Fort Myers are Transportation (1,860 | 4.9%), Material Moving (1,484 | 3.9%), and Production (977 | 2.6%).
Production, Transportation and Moving Occupations by Sex

| Occupation | Male | Female |
| Production | 581 (59.5%) | 396 (40.5%) |
| Transportation | 1,407 (75.6%) | 453 (24.3%) |
| Material Moving | 1,128 (76.0%) | 356 (24.0%) |
| Total (Category) | 3,116 (72.1%) | 1,205 (27.9%) |
| Total (Overall) | 20,379 (53.4%) | 17,755 (46.6%) |
Employment Industries by Sex in Fort Myers
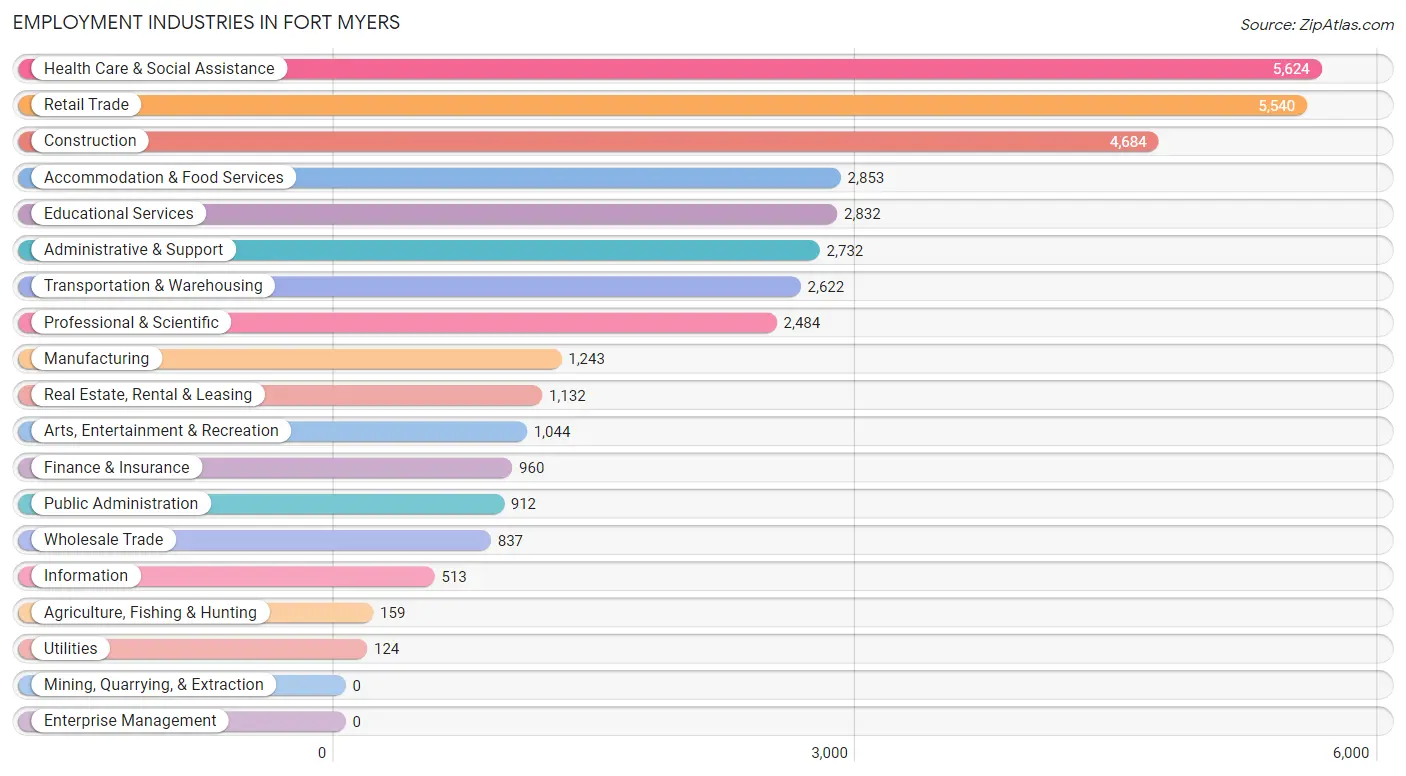
Employment Industries in Fort Myers
The major employment industries in Fort Myers include Health Care & Social Assistance (5,624 | 14.7%), Retail Trade (5,540 | 14.5%), Construction (4,684 | 12.3%), Accommodation & Food Services (2,853 | 7.5%), and Educational Services (2,832 | 7.4%).
Employment Industries by Sex in Fort Myers
The Fort Myers industries that see more men than women are Utilities (100.0%), Agriculture, Fishing & Hunting (91.8%), and Construction (90.5%), whereas the industries that tend to have a higher number of women are Health Care & Social Assistance (78.0%), Educational Services (64.5%), and Accommodation & Food Services (54.1%).
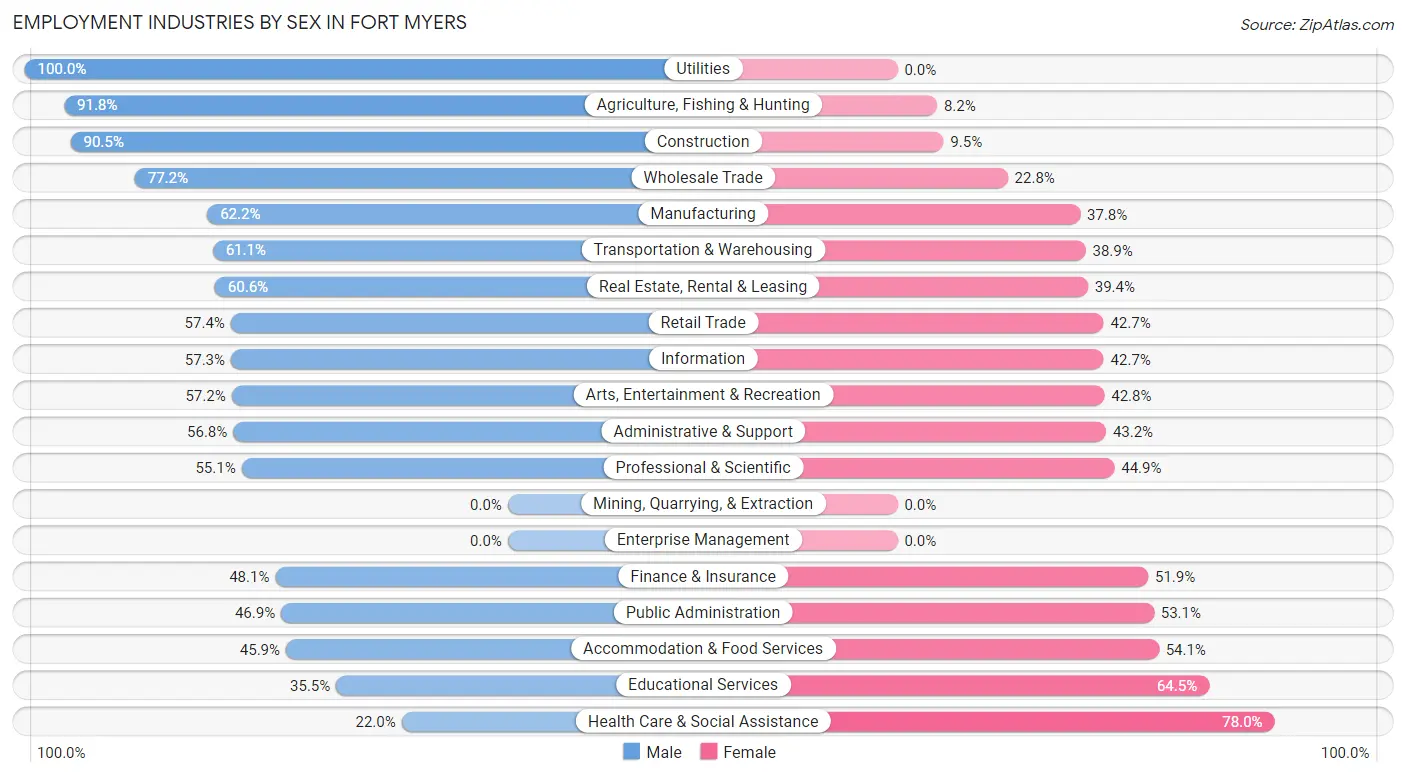
| Industry | Male | Female |
| Agriculture, Fishing & Hunting | 146 (91.8%) | 13 (8.2%) |
| Mining, Quarrying, & Extraction | 0 (0.0%) | 0 (0.0%) |
| Construction | 4,238 (90.5%) | 446 (9.5%) |
| Manufacturing | 773 (62.2%) | 470 (37.8%) |
| Wholesale Trade | 646 (77.2%) | 191 (22.8%) |
| Retail Trade | 3,177 (57.4%) | 2,363 (42.6%) |
| Transportation & Warehousing | 1,601 (61.1%) | 1,021 (38.9%) |
| Utilities | 124 (100.0%) | 0 (0.0%) |
| Information | 294 (57.3%) | 219 (42.7%) |
| Finance & Insurance | 462 (48.1%) | 498 (51.9%) |
| Real Estate, Rental & Leasing | 686 (60.6%) | 446 (39.4%) |
| Professional & Scientific | 1,369 (55.1%) | 1,115 (44.9%) |
| Enterprise Management | 0 (0.0%) | 0 (0.0%) |
| Administrative & Support | 1,553 (56.8%) | 1,179 (43.2%) |
| Educational Services | 1,006 (35.5%) | 1,826 (64.5%) |
| Health Care & Social Assistance | 1,236 (22.0%) | 4,388 (78.0%) |
| Arts, Entertainment & Recreation | 597 (57.2%) | 447 (42.8%) |
| Accommodation & Food Services | 1,310 (45.9%) | 1,543 (54.1%) |
| Public Administration | 428 (46.9%) | 484 (53.1%) |
| Total | 20,379 (53.4%) | 17,755 (46.6%) |
Education in Fort Myers
School Enrollment in Fort Myers
The most common levels of schooling among the 17,513 students in Fort Myers are middle school (4,029 | 23.0%), high school (3,742 | 21.4%), and elementary school (3,531 | 20.2%).
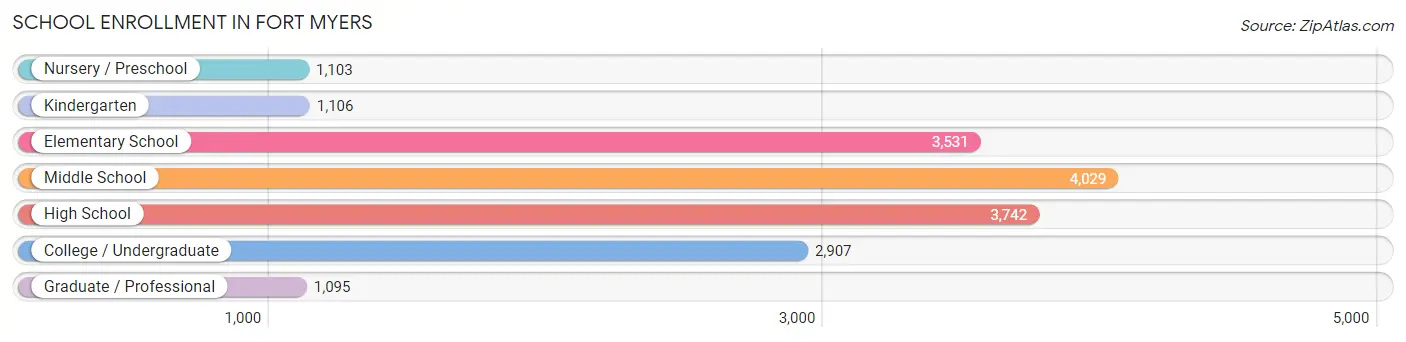
| School Level | # Students | % Students |
| Nursery / Preschool | 1,103 | 6.3% |
| Kindergarten | 1,106 | 6.3% |
| Elementary School | 3,531 | 20.2% |
| Middle School | 4,029 | 23.0% |
| High School | 3,742 | 21.4% |
| College / Undergraduate | 2,907 | 16.6% |
| Graduate / Professional | 1,095 | 6.2% |
| Total | 17,513 | 100.0% |
School Enrollment by Age by Funding Source in Fort Myers
Out of a total of 17,513 students who are enrolled in schools in Fort Myers, 3,170 (18.1%) attend a private institution, while the remaining 14,343 (81.9%) are enrolled in public schools. The age group of 3 to 4 year olds has the highest likelihood of being enrolled in private schools, with 348 (34.0% in the age bracket) enrolled. Conversely, the age group of 5 to 9 year old has the lowest likelihood of being enrolled in a private school, with 3,651 (87.3% in the age bracket) attending a public institution.
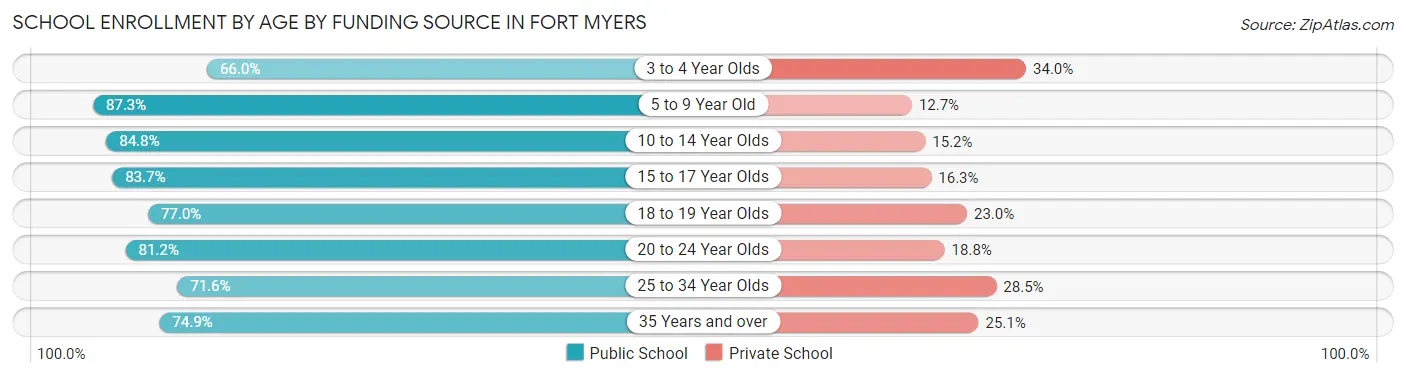
| Age Bracket | Public School | Private School |
| 3 to 4 Year Olds | 676 (66.0%) | 348 (34.0%) |
| 5 to 9 Year Old | 3,651 (87.3%) | 532 (12.7%) |
| 10 to 14 Year Olds | 4,240 (84.8%) | 761 (15.2%) |
| 15 to 17 Year Olds | 2,095 (83.7%) | 409 (16.3%) |
| 18 to 19 Year Olds | 761 (77.0%) | 227 (23.0%) |
| 20 to 24 Year Olds | 1,325 (81.2%) | 307 (18.8%) |
| 25 to 34 Year Olds | 820 (71.6%) | 326 (28.4%) |
| 35 Years and over | 775 (74.9%) | 260 (25.1%) |
| Total | 14,343 (81.9%) | 3,170 (18.1%) |
Educational Attainment by Field of Study in Fort Myers
Business (4,681 | 21.9%), education (2,842 | 13.3%), science & technology (2,429 | 11.4%), social sciences (1,597 | 7.5%), and psychology (1,520 | 7.1%) are the most common fields of study among 21,390 individuals in Fort Myers who have obtained a bachelor's degree or higher.
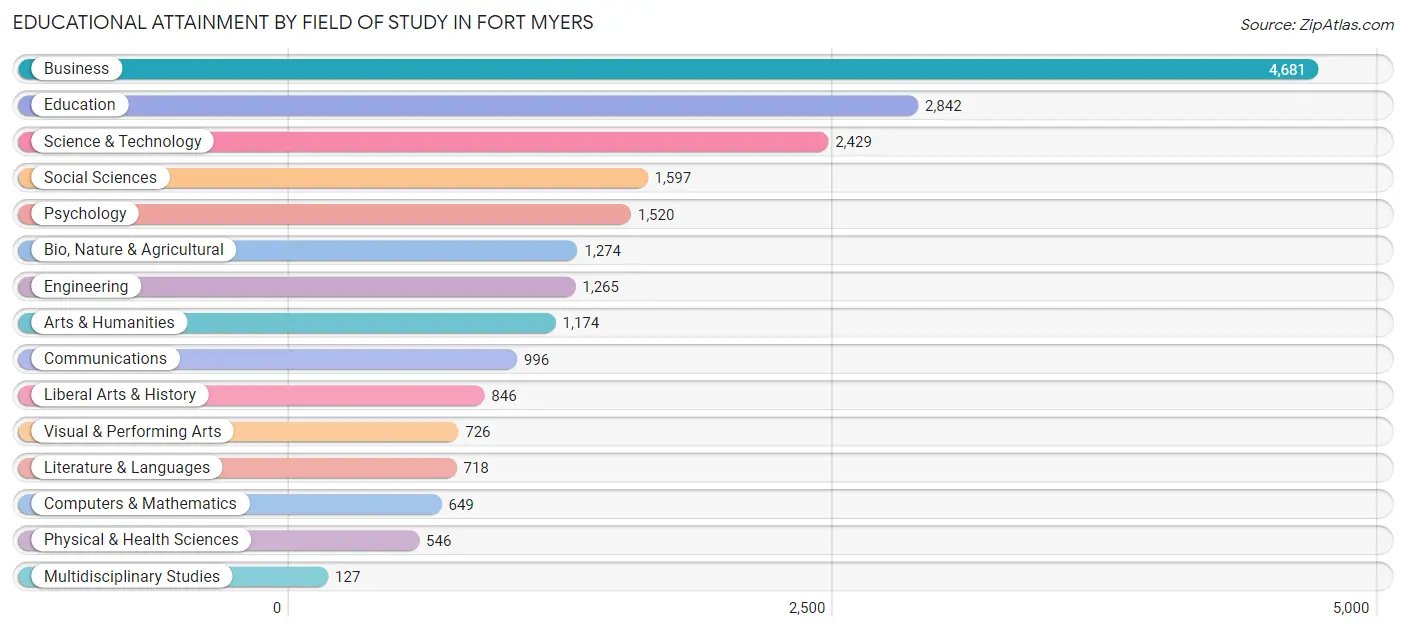
| Field of Study | # Graduates | % Graduates |
| Computers & Mathematics | 649 | 3.0% |
| Bio, Nature & Agricultural | 1,274 | 6.0% |
| Physical & Health Sciences | 546 | 2.5% |
| Psychology | 1,520 | 7.1% |
| Social Sciences | 1,597 | 7.5% |
| Engineering | 1,265 | 5.9% |
| Multidisciplinary Studies | 127 | 0.6% |
| Science & Technology | 2,429 | 11.4% |
| Business | 4,681 | 21.9% |
| Education | 2,842 | 13.3% |
| Literature & Languages | 718 | 3.4% |
| Liberal Arts & History | 846 | 4.0% |
| Visual & Performing Arts | 726 | 3.4% |
| Communications | 996 | 4.7% |
| Arts & Humanities | 1,174 | 5.5% |
| Total | 21,390 | 100.0% |
Transportation & Commute in Fort Myers
Vehicle Availability by Sex in Fort Myers
The most prevalent vehicle ownership categories in Fort Myers are males with 2 vehicles (8,533, accounting for 43.0%) and females with 2 vehicles (7,686, making up 49.3%).
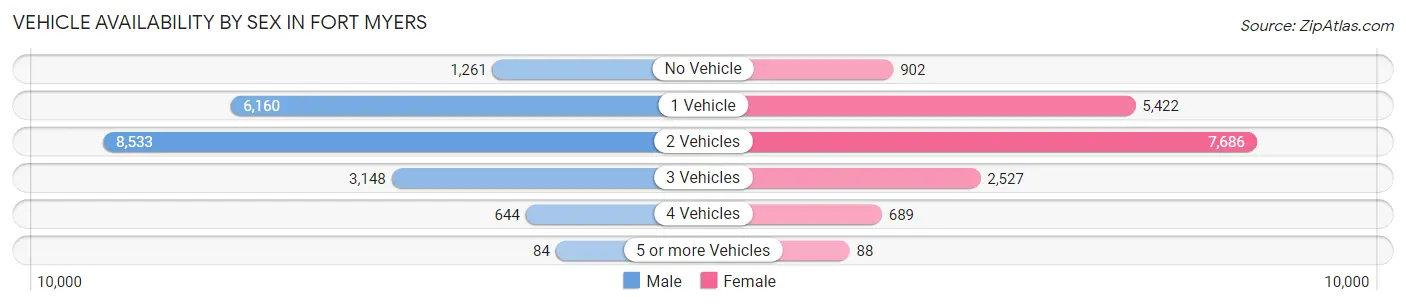
| Vehicles Available | Male | Female |
| No Vehicle | 1,261 (6.4%) | 902 (5.2%) |
| 1 Vehicle | 6,160 (31.1%) | 5,422 (31.3%) |
| 2 Vehicles | 8,533 (43.0%) | 7,686 (44.4%) |
| 3 Vehicles | 3,148 (15.9%) | 2,527 (14.6%) |
| 4 Vehicles | 644 (3.3%) | 689 (4.0%) |
| 5 or more Vehicles | 84 (0.4%) | 88 (0.5%) |
| Total | 19,830 (100.0%) | 17,314 (100.0%) |
Commute Time in Fort Myers
The most frequently occuring commute durations in Fort Myers are 20 to 24 minutes (6,286 commuters, 18.6%), 15 to 19 minutes (5,617 commuters, 16.6%), and 30 to 34 minutes (5,349 commuters, 15.8%).
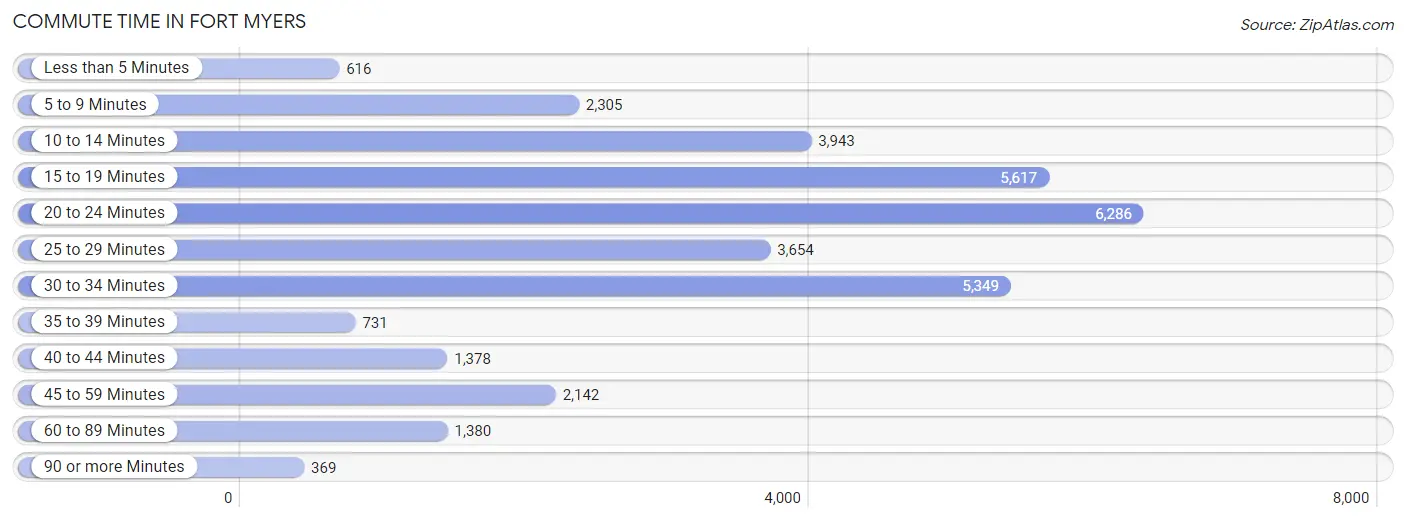
| Commute Time | # Commuters | % Commuters |
| Less than 5 Minutes | 616 | 1.8% |
| 5 to 9 Minutes | 2,305 | 6.8% |
| 10 to 14 Minutes | 3,943 | 11.7% |
| 15 to 19 Minutes | 5,617 | 16.6% |
| 20 to 24 Minutes | 6,286 | 18.6% |
| 25 to 29 Minutes | 3,654 | 10.8% |
| 30 to 34 Minutes | 5,349 | 15.8% |
| 35 to 39 Minutes | 731 | 2.2% |
| 40 to 44 Minutes | 1,378 | 4.1% |
| 45 to 59 Minutes | 2,142 | 6.3% |
| 60 to 89 Minutes | 1,380 | 4.1% |
| 90 or more Minutes | 369 | 1.1% |
Commute Time by Sex in Fort Myers
The most common commute times in Fort Myers are 20 to 24 minutes (3,279 commuters, 18.0%) for males and 20 to 24 minutes (3,007 commuters, 19.3%) for females.
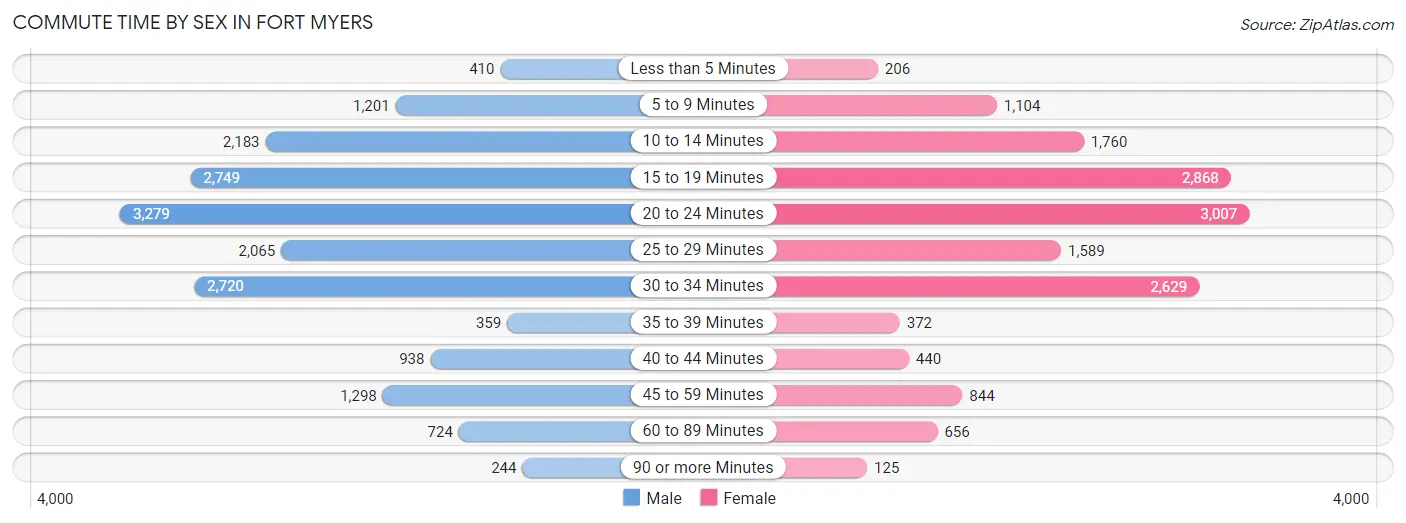
| Commute Time | Male | Female |
| Less than 5 Minutes | 410 (2.3%) | 206 (1.3%) |
| 5 to 9 Minutes | 1,201 (6.6%) | 1,104 (7.1%) |
| 10 to 14 Minutes | 2,183 (12.0%) | 1,760 (11.3%) |
| 15 to 19 Minutes | 2,749 (15.1%) | 2,868 (18.4%) |
| 20 to 24 Minutes | 3,279 (18.0%) | 3,007 (19.3%) |
| 25 to 29 Minutes | 2,065 (11.4%) | 1,589 (10.2%) |
| 30 to 34 Minutes | 2,720 (15.0%) | 2,629 (16.9%) |
| 35 to 39 Minutes | 359 (2.0%) | 372 (2.4%) |
| 40 to 44 Minutes | 938 (5.2%) | 440 (2.8%) |
| 45 to 59 Minutes | 1,298 (7.1%) | 844 (5.4%) |
| 60 to 89 Minutes | 724 (4.0%) | 656 (4.2%) |
| 90 or more Minutes | 244 (1.3%) | 125 (0.8%) |
Time of Departure to Work by Sex in Fort Myers
The most frequent times of departure to work in Fort Myers are 6:00 AM to 6:29 AM (2,598, 14.3%) for males and 8:00 AM to 8:29 AM (2,256, 14.5%) for females.
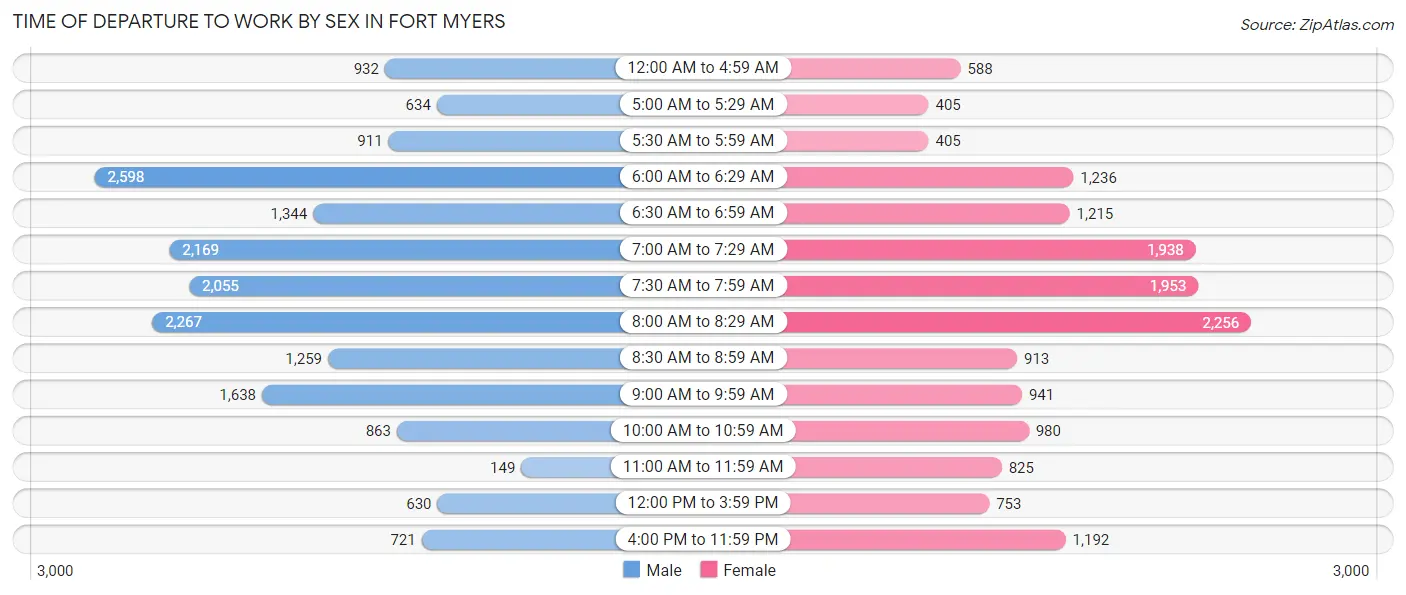
| Time of Departure | Male | Female |
| 12:00 AM to 4:59 AM | 932 (5.1%) | 588 (3.8%) |
| 5:00 AM to 5:29 AM | 634 (3.5%) | 405 (2.6%) |
| 5:30 AM to 5:59 AM | 911 (5.0%) | 405 (2.6%) |
| 6:00 AM to 6:29 AM | 2,598 (14.3%) | 1,236 (7.9%) |
| 6:30 AM to 6:59 AM | 1,344 (7.4%) | 1,215 (7.8%) |
| 7:00 AM to 7:29 AM | 2,169 (11.9%) | 1,938 (12.4%) |
| 7:30 AM to 7:59 AM | 2,055 (11.3%) | 1,953 (12.5%) |
| 8:00 AM to 8:29 AM | 2,267 (12.5%) | 2,256 (14.5%) |
| 8:30 AM to 8:59 AM | 1,259 (6.9%) | 913 (5.9%) |
| 9:00 AM to 9:59 AM | 1,638 (9.0%) | 941 (6.0%) |
| 10:00 AM to 10:59 AM | 863 (4.8%) | 980 (6.3%) |
| 11:00 AM to 11:59 AM | 149 (0.8%) | 825 (5.3%) |
| 12:00 PM to 3:59 PM | 630 (3.5%) | 753 (4.8%) |
| 4:00 PM to 11:59 PM | 721 (4.0%) | 1,192 (7.6%) |
| Total | 18,170 (100.0%) | 15,600 (100.0%) |
Housing Occupancy in Fort Myers
Occupancy by Ownership in Fort Myers
Of the total 35,426 dwellings in Fort Myers, owner-occupied units account for 17,232 (48.6%), while renter-occupied units make up 18,194 (51.4%).
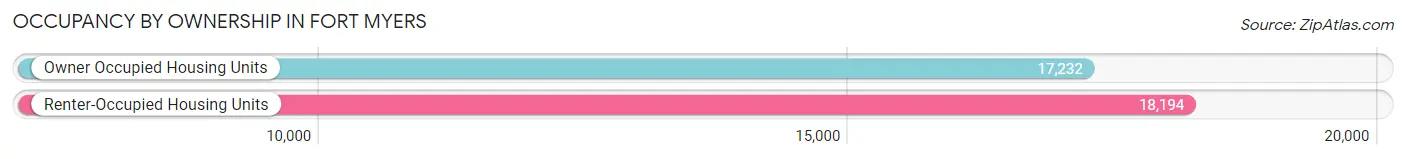
| Occupancy | # Housing Units | % Housing Units |
| Owner Occupied Housing Units | 17,232 | 48.6% |
| Renter-Occupied Housing Units | 18,194 | 51.4% |
| Total Occupied Housing Units | 35,426 | 100.0% |
Occupancy by Household Size in Fort Myers
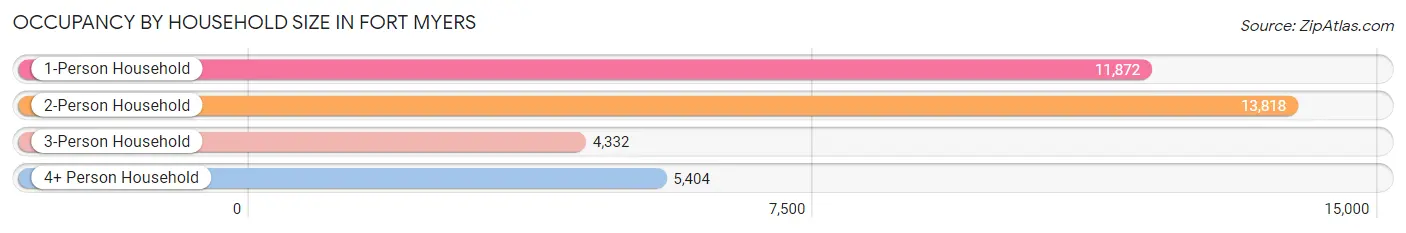
| Household Size | # Housing Units | % Housing Units |
| 1-Person Household | 11,872 | 33.5% |
| 2-Person Household | 13,818 | 39.0% |
| 3-Person Household | 4,332 | 12.2% |
| 4+ Person Household | 5,404 | 15.2% |
| Total Housing Units | 35,426 | 100.0% |
Occupancy by Ownership by Household Size in Fort Myers
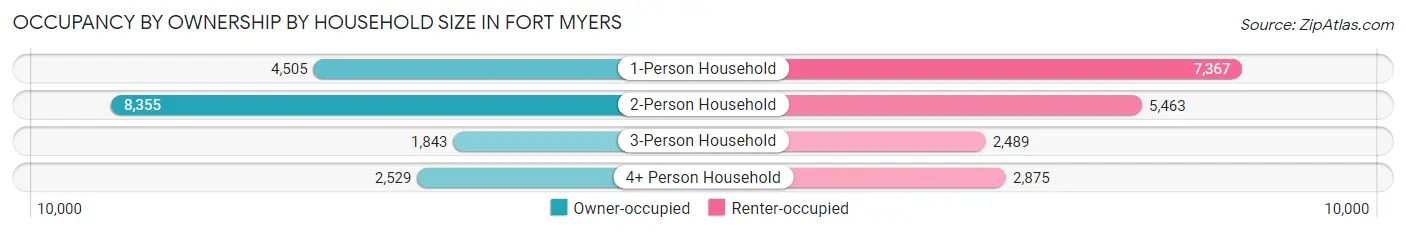
| Household Size | Owner-occupied | Renter-occupied |
| 1-Person Household | 4,505 (38.0%) | 7,367 (62.1%) |
| 2-Person Household | 8,355 (60.5%) | 5,463 (39.5%) |
| 3-Person Household | 1,843 (42.5%) | 2,489 (57.5%) |
| 4+ Person Household | 2,529 (46.8%) | 2,875 (53.2%) |
| Total Housing Units | 17,232 (48.6%) | 18,194 (51.4%) |
Occupancy by Educational Attainment in Fort Myers
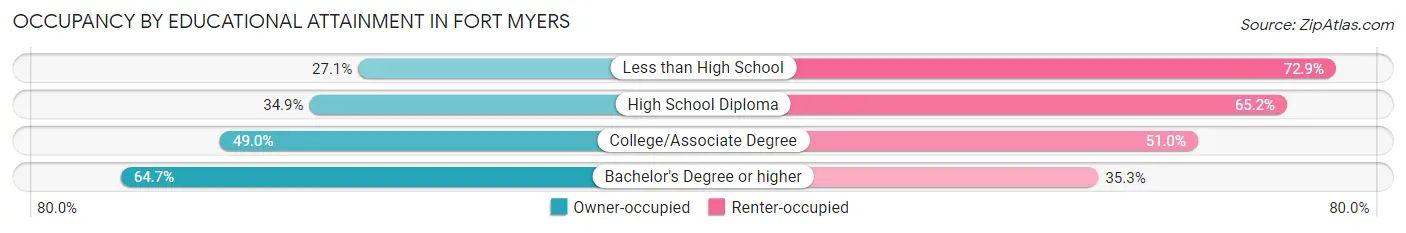
| Household Size | Owner-occupied | Renter-occupied |
| Less than High School | 1,165 (27.1%) | 3,134 (72.9%) |
| High School Diploma | 2,964 (34.8%) | 5,542 (65.1%) |
| College/Associate Degree | 4,795 (49.0%) | 4,993 (51.0%) |
| Bachelor's Degree or higher | 8,308 (64.7%) | 4,525 (35.3%) |
Occupancy by Age of Householder in Fort Myers
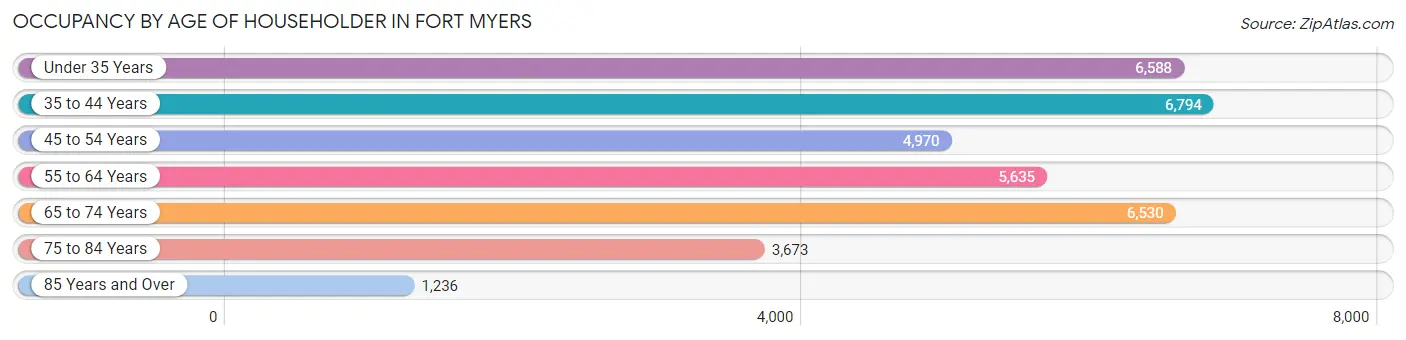
| Age Bracket | # Households | % Households |
| Under 35 Years | 6,588 | 18.6% |
| 35 to 44 Years | 6,794 | 19.2% |
| 45 to 54 Years | 4,970 | 14.0% |
| 55 to 64 Years | 5,635 | 15.9% |
| 65 to 74 Years | 6,530 | 18.4% |
| 75 to 84 Years | 3,673 | 10.4% |
| 85 Years and Over | 1,236 | 3.5% |
| Total | 35,426 | 100.0% |
Housing Finances in Fort Myers
Median Income by Occupancy in Fort Myers
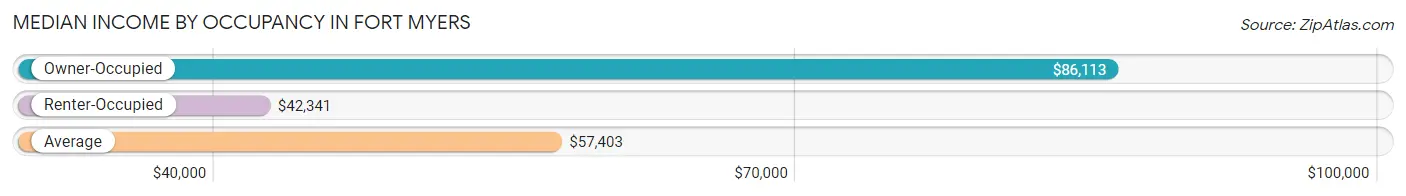
| Occupancy Type | # Households | Median Income |
| Owner-Occupied | 17,232 (48.6%) | $86,113 |
| Renter-Occupied | 18,194 (51.4%) | $42,341 |
| Average | 35,426 (100.0%) | $57,403 |
Occupancy by Householder Income Bracket in Fort Myers
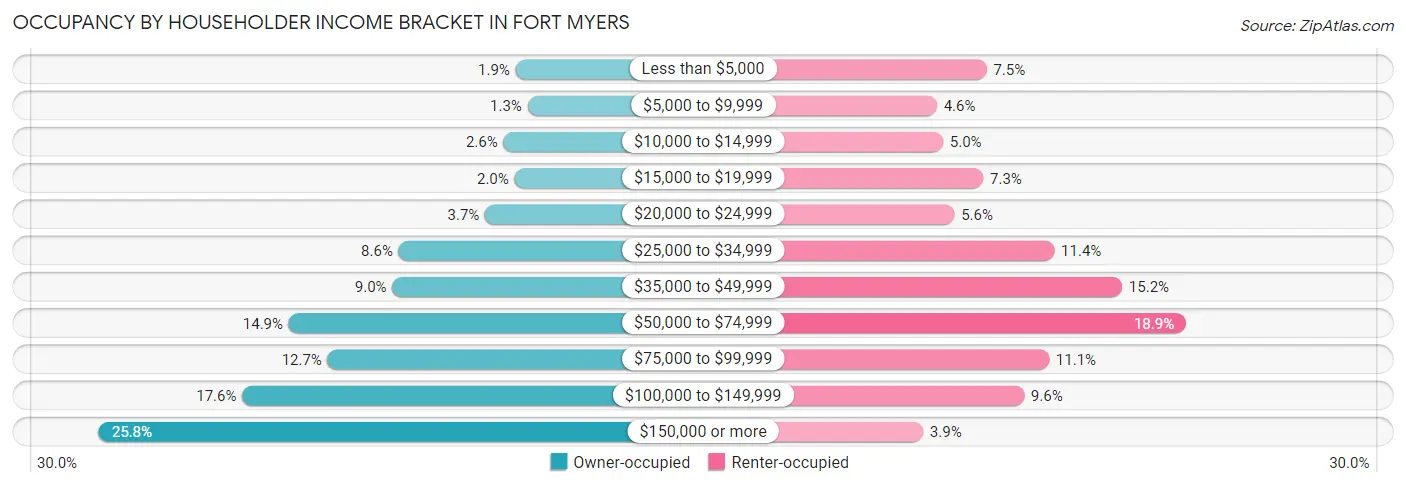
| Income Bracket | Owner-occupied | Renter-occupied |
| Less than $5,000 | 334 (1.9%) | 1,361 (7.5%) |
| $5,000 to $9,999 | 216 (1.3%) | 845 (4.6%) |
| $10,000 to $14,999 | 453 (2.6%) | 907 (5.0%) |
| $15,000 to $19,999 | 344 (2.0%) | 1,326 (7.3%) |
| $20,000 to $24,999 | 634 (3.7%) | 1,026 (5.6%) |
| $25,000 to $34,999 | 1,485 (8.6%) | 2,065 (11.4%) |
| $35,000 to $49,999 | 1,548 (9.0%) | 2,769 (15.2%) |
| $50,000 to $74,999 | 2,568 (14.9%) | 3,435 (18.9%) |
| $75,000 to $99,999 | 2,185 (12.7%) | 2,010 (11.1%) |
| $100,000 to $149,999 | 3,026 (17.6%) | 1,750 (9.6%) |
| $150,000 or more | 4,439 (25.8%) | 700 (3.8%) |
| Total | 17,232 (100.0%) | 18,194 (100.0%) |
Monthly Housing Cost Tiers in Fort Myers
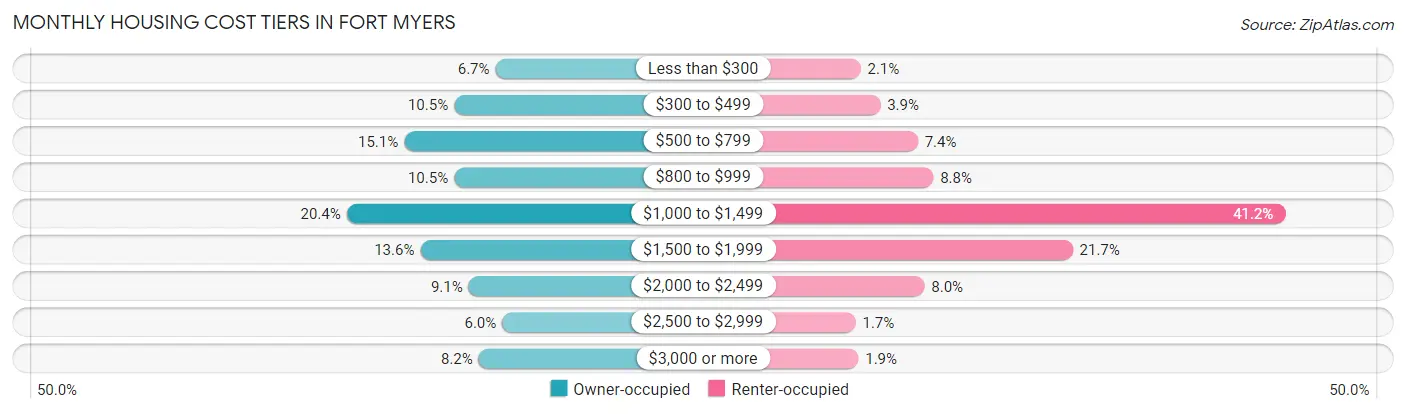
| Monthly Cost | Owner-occupied | Renter-occupied |
| Less than $300 | 1,148 (6.7%) | 387 (2.1%) |
| $300 to $499 | 1,805 (10.5%) | 717 (3.9%) |
| $500 to $799 | 2,597 (15.1%) | 1,344 (7.4%) |
| $800 to $999 | 1,805 (10.5%) | 1,605 (8.8%) |
| $1,000 to $1,499 | 3,508 (20.4%) | 7,499 (41.2%) |
| $1,500 to $1,999 | 2,340 (13.6%) | 3,939 (21.6%) |
| $2,000 to $2,499 | 1,573 (9.1%) | 1,455 (8.0%) |
| $2,500 to $2,999 | 1,041 (6.0%) | 303 (1.7%) |
| $3,000 or more | 1,415 (8.2%) | 350 (1.9%) |
| Total | 17,232 (100.0%) | 18,194 (100.0%) |
Physical Housing Characteristics in Fort Myers
Housing Structures in Fort Myers
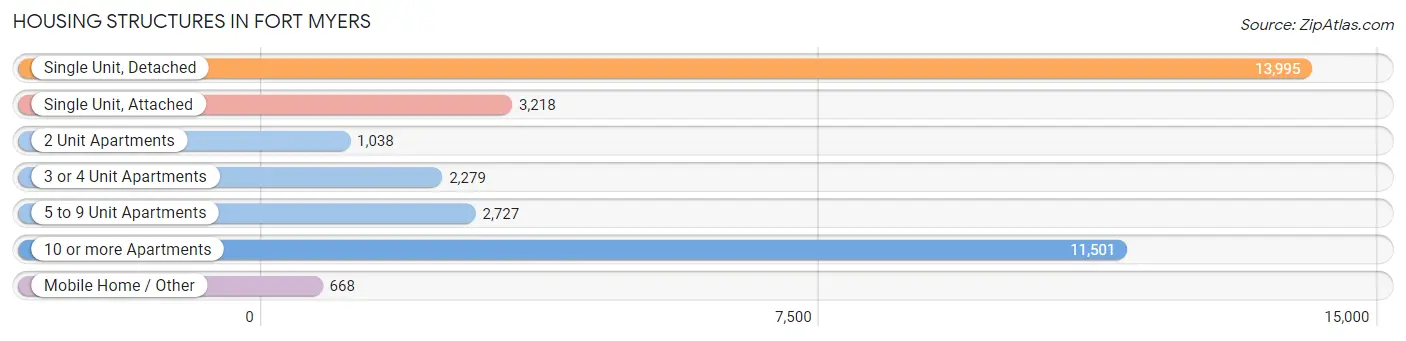
| Structure Type | # Housing Units | % Housing Units |
| Single Unit, Detached | 13,995 | 39.5% |
| Single Unit, Attached | 3,218 | 9.1% |
| 2 Unit Apartments | 1,038 | 2.9% |
| 3 or 4 Unit Apartments | 2,279 | 6.4% |
| 5 to 9 Unit Apartments | 2,727 | 7.7% |
| 10 or more Apartments | 11,501 | 32.5% |
| Mobile Home / Other | 668 | 1.9% |
| Total | 35,426 | 100.0% |
Housing Structures by Occupancy in Fort Myers
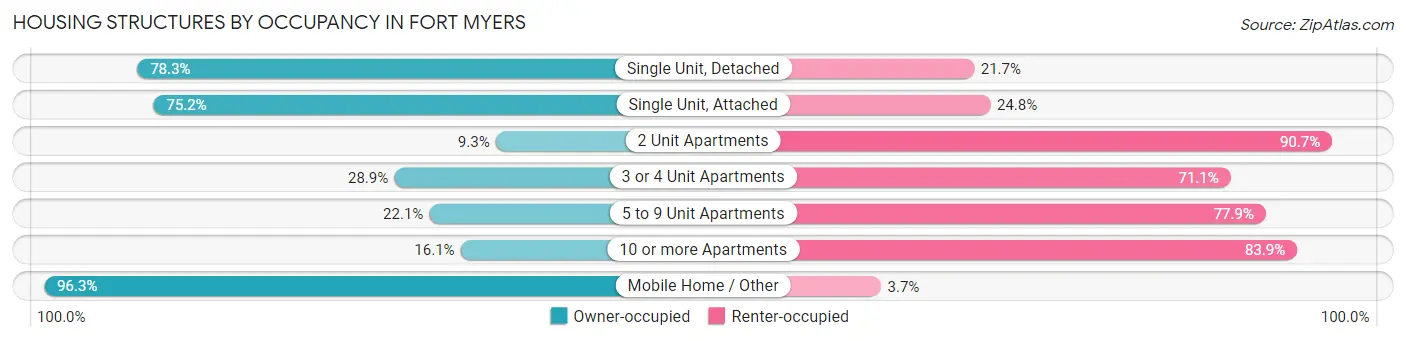
| Structure Type | Owner-occupied | Renter-occupied |
| Single Unit, Detached | 10,960 (78.3%) | 3,035 (21.7%) |
| Single Unit, Attached | 2,420 (75.2%) | 798 (24.8%) |
| 2 Unit Apartments | 97 (9.3%) | 941 (90.7%) |
| 3 or 4 Unit Apartments | 658 (28.9%) | 1,621 (71.1%) |
| 5 to 9 Unit Apartments | 603 (22.1%) | 2,124 (77.9%) |
| 10 or more Apartments | 1,851 (16.1%) | 9,650 (83.9%) |
| Mobile Home / Other | 643 (96.3%) | 25 (3.7%) |
| Total | 17,232 (48.6%) | 18,194 (51.4%) |
Housing Structures by Number of Rooms in Fort Myers
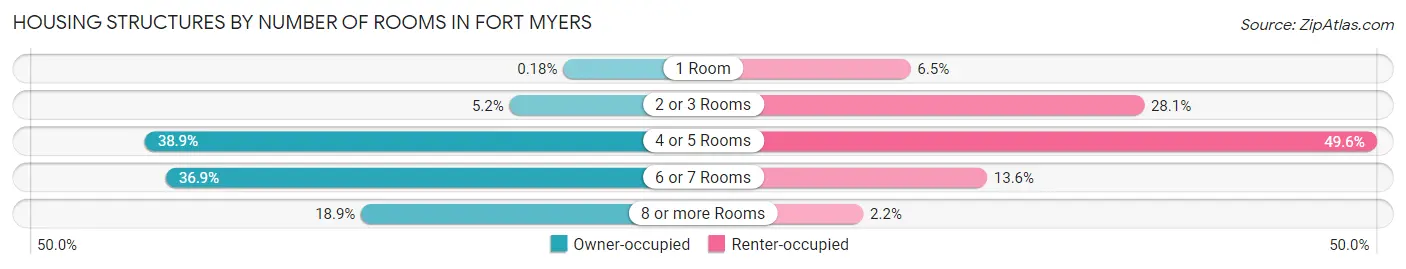
| Number of Rooms | Owner-occupied | Renter-occupied |
| 1 Room | 31 (0.2%) | 1,187 (6.5%) |
| 2 or 3 Rooms | 887 (5.1%) | 5,116 (28.1%) |
| 4 or 5 Rooms | 6,700 (38.9%) | 9,028 (49.6%) |
| 6 or 7 Rooms | 6,363 (36.9%) | 2,472 (13.6%) |
| 8 or more Rooms | 3,251 (18.9%) | 391 (2.1%) |
| Total | 17,232 (100.0%) | 18,194 (100.0%) |
Housing Structure by Heating Type in Fort Myers
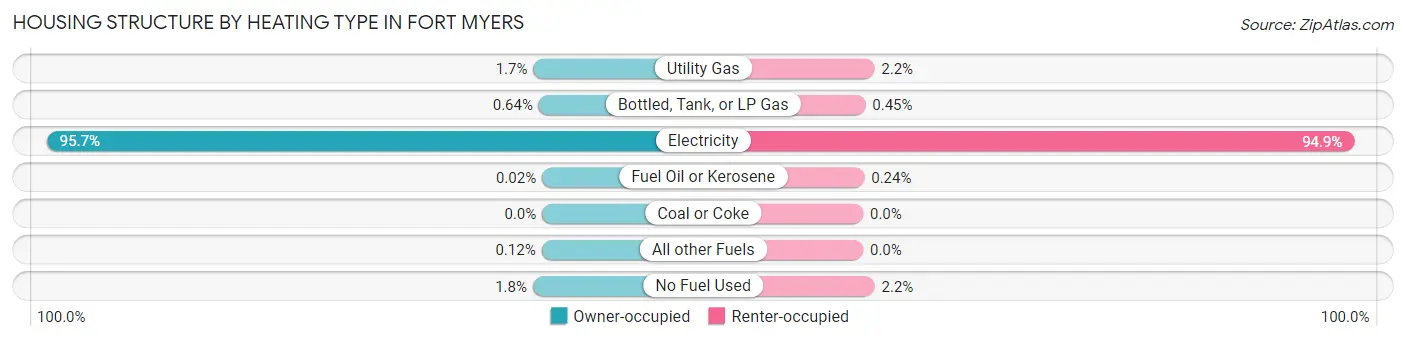
| Heating Type | Owner-occupied | Renter-occupied |
| Utility Gas | 293 (1.7%) | 396 (2.2%) |
| Bottled, Tank, or LP Gas | 110 (0.6%) | 81 (0.4%) |
| Electricity | 16,497 (95.7%) | 17,267 (94.9%) |
| Fuel Oil or Kerosene | 3 (0.0%) | 44 (0.2%) |
| Coal or Coke | 0 (0.0%) | 0 (0.0%) |
| All other Fuels | 21 (0.1%) | 0 (0.0%) |
| No Fuel Used | 308 (1.8%) | 406 (2.2%) |
| Total | 17,232 (100.0%) | 18,194 (100.0%) |
Household Vehicle Usage in Fort Myers
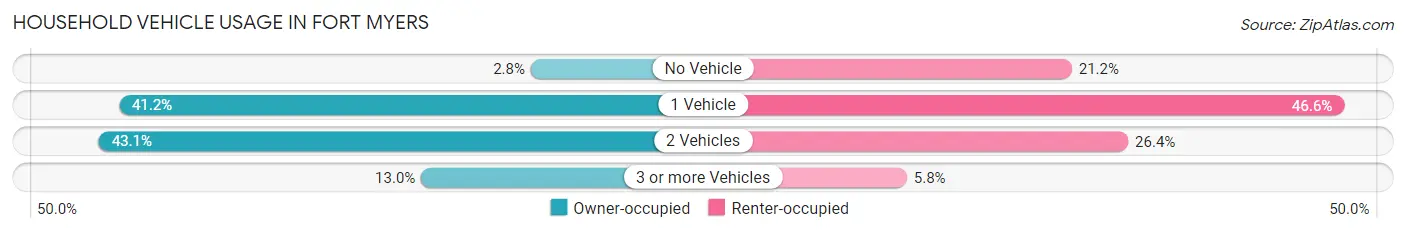
| Vehicles per Household | Owner-occupied | Renter-occupied |
| No Vehicle | 474 (2.8%) | 3,854 (21.2%) |
| 1 Vehicle | 7,097 (41.2%) | 8,478 (46.6%) |
| 2 Vehicles | 7,424 (43.1%) | 4,811 (26.4%) |
| 3 or more Vehicles | 2,237 (13.0%) | 1,051 (5.8%) |
| Total | 17,232 (100.0%) | 18,194 (100.0%) |
Real Estate & Mortgages in Fort Myers
Real Estate and Mortgage Overview in Fort Myers
| Characteristic | Without Mortgage | With Mortgage |
| Housing Units | 9,062 | 8,170 |
| Median Property Value | $288,200 | $342,700 |
| Median Household Income | $71,235 | $2,734 |
| Monthly Housing Costs | $716 | $1,381 |
| Real Estate Taxes | $3,138 | $161 |
Property Value by Mortgage Status in Fort Myers
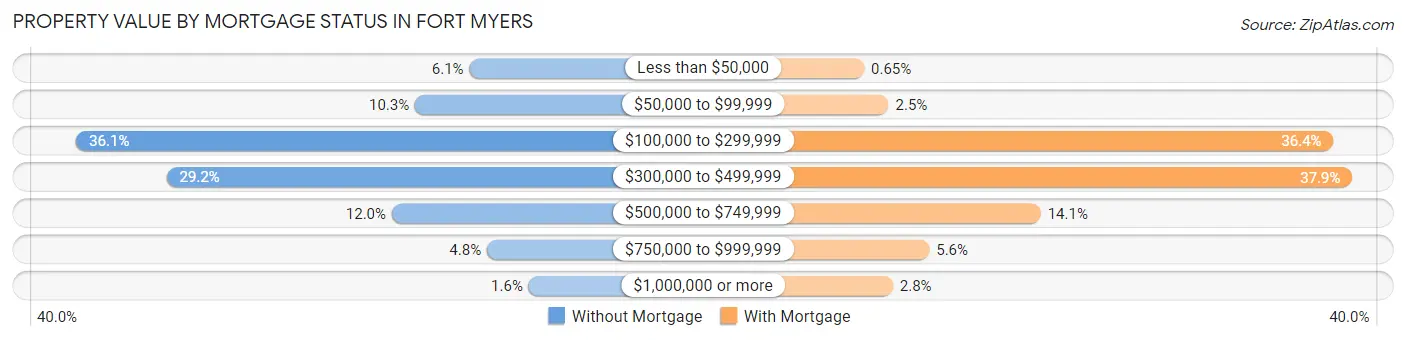
| Property Value | Without Mortgage | With Mortgage |
| Less than $50,000 | 554 (6.1%) | 53 (0.6%) |
| $50,000 to $99,999 | 929 (10.2%) | 206 (2.5%) |
| $100,000 to $299,999 | 3,269 (36.1%) | 2,975 (36.4%) |
| $300,000 to $499,999 | 2,645 (29.2%) | 3,092 (37.9%) |
| $500,000 to $749,999 | 1,089 (12.0%) | 1,153 (14.1%) |
| $750,000 to $999,999 | 432 (4.8%) | 459 (5.6%) |
| $1,000,000 or more | 144 (1.6%) | 232 (2.8%) |
| Total | 9,062 (100.0%) | 8,170 (100.0%) |
Household Income by Mortgage Status in Fort Myers
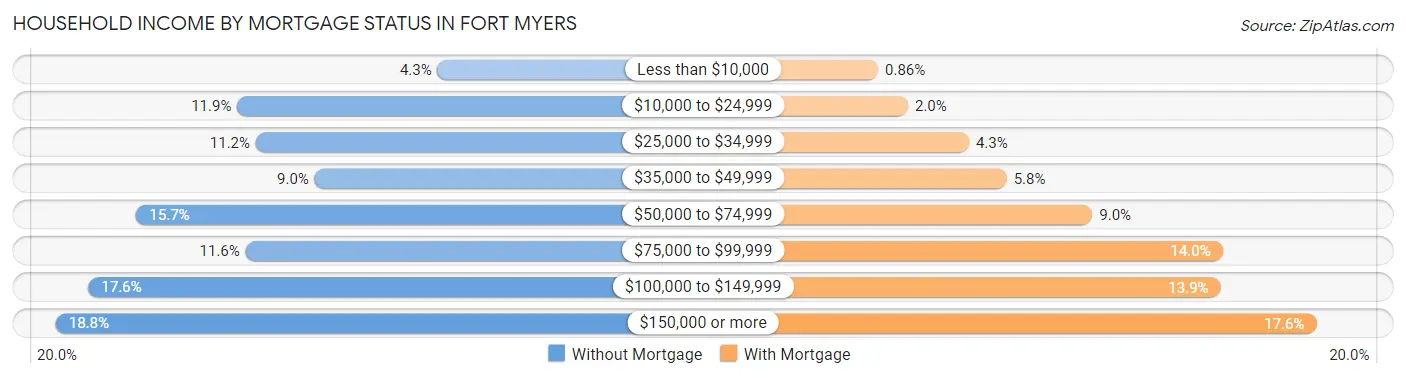
| Household Income | Without Mortgage | With Mortgage |
| Less than $10,000 | 387 (4.3%) | 70 (0.9%) |
| $10,000 to $24,999 | 1,078 (11.9%) | 163 (2.0%) |
| $25,000 to $34,999 | 1,014 (11.2%) | 353 (4.3%) |
| $35,000 to $49,999 | 811 (8.9%) | 471 (5.8%) |
| $50,000 to $74,999 | 1,426 (15.7%) | 737 (9.0%) |
| $75,000 to $99,999 | 1,049 (11.6%) | 1,142 (14.0%) |
| $100,000 to $149,999 | 1,592 (17.6%) | 1,136 (13.9%) |
| $150,000 or more | 1,705 (18.8%) | 1,434 (17.5%) |
| Total | 9,062 (100.0%) | 8,170 (100.0%) |
Property Value to Household Income Ratio in Fort Myers
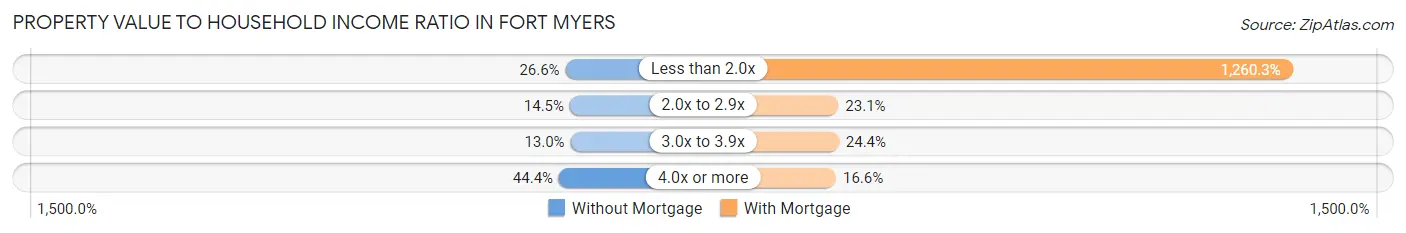
| Value-to-Income Ratio | Without Mortgage | With Mortgage |
| Less than 2.0x | 2,412 (26.6%) | 102,966 (1,260.3%) |
| 2.0x to 2.9x | 1,318 (14.5%) | 1,883 (23.1%) |
| 3.0x to 3.9x | 1,179 (13.0%) | 1,990 (24.4%) |
| 4.0x or more | 4,023 (44.4%) | 1,357 (16.6%) |
| Total | 9,062 (100.0%) | 8,170 (100.0%) |
Real Estate Taxes by Mortgage Status in Fort Myers
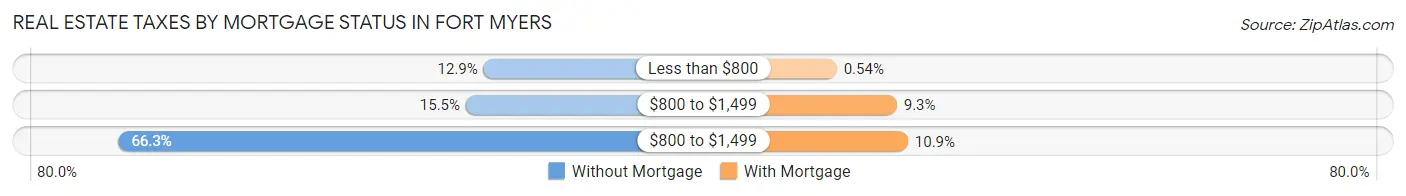
| Property Taxes | Without Mortgage | With Mortgage |
| Less than $800 | 1,172 (12.9%) | 44 (0.5%) |
| $800 to $1,499 | 1,406 (15.5%) | 761 (9.3%) |
| $800 to $1,499 | 6,006 (66.3%) | 893 (10.9%) |
| Total | 9,062 (100.0%) | 8,170 (100.0%) |
Health & Disability in Fort Myers
Health Insurance Coverage by Age in Fort Myers
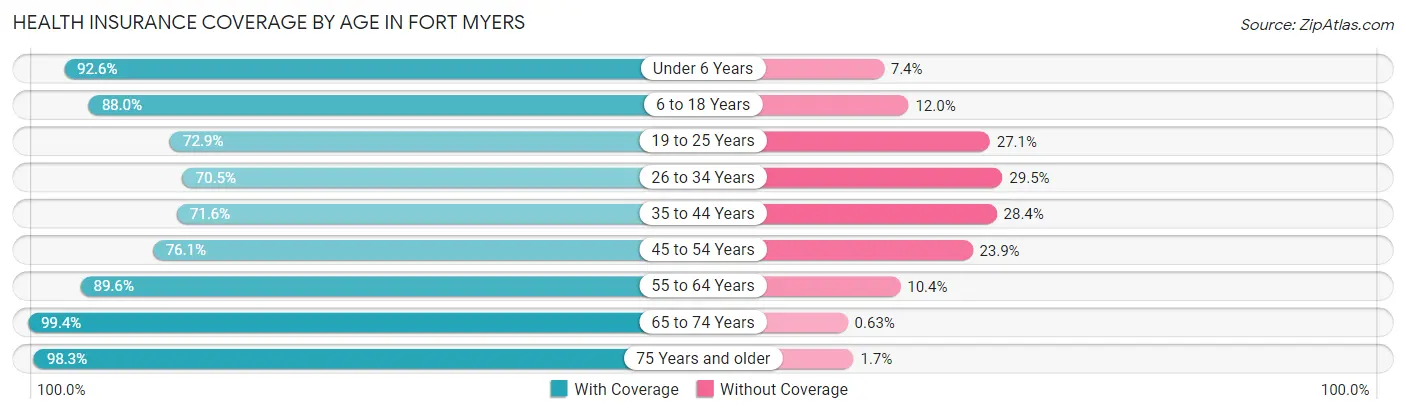
| Age Bracket | With Coverage | Without Coverage |
| Under 6 Years | 6,082 (92.6%) | 483 (7.4%) |
| 6 to 18 Years | 10,664 (88.0%) | 1,450 (12.0%) |
| 19 to 25 Years | 5,111 (72.9%) | 1,904 (27.1%) |
| 26 to 34 Years | 7,340 (70.5%) | 3,069 (29.5%) |
| 35 to 44 Years | 8,785 (71.6%) | 3,484 (28.4%) |
| 45 to 54 Years | 7,058 (76.1%) | 2,217 (23.9%) |
| 55 to 64 Years | 8,462 (89.6%) | 986 (10.4%) |
| 65 to 74 Years | 10,850 (99.4%) | 69 (0.6%) |
| 75 Years and older | 8,041 (98.3%) | 141 (1.7%) |
| Total | 72,393 (84.0%) | 13,803 (16.0%) |
Health Insurance Coverage by Citizenship Status in Fort Myers
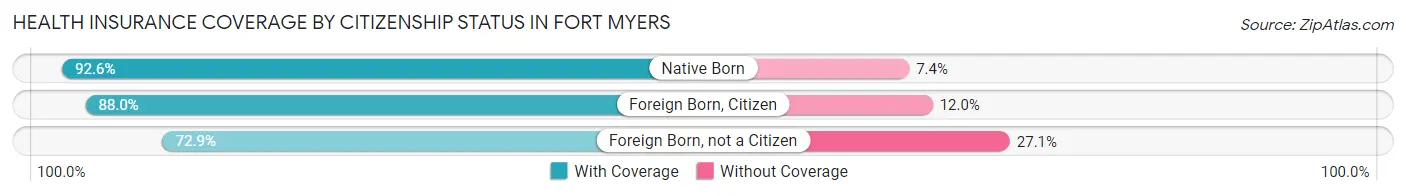
| Citizenship Status | With Coverage | Without Coverage |
| Native Born | 6,082 (92.6%) | 483 (7.4%) |
| Foreign Born, Citizen | 10,664 (88.0%) | 1,450 (12.0%) |
| Foreign Born, not a Citizen | 5,111 (72.9%) | 1,904 (27.1%) |
Health Insurance Coverage by Household Income in Fort Myers
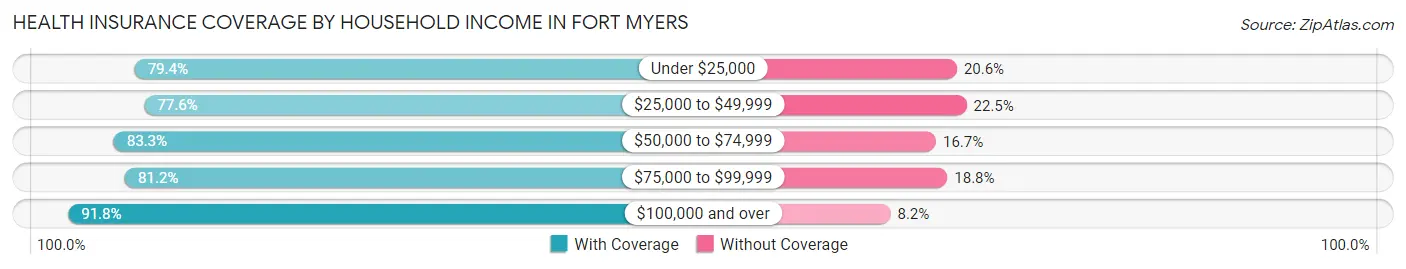
| Household Income | With Coverage | Without Coverage |
| Under $25,000 | 9,960 (79.4%) | 2,591 (20.6%) |
| $25,000 to $49,999 | 13,422 (77.5%) | 3,885 (22.5%) |
| $50,000 to $74,999 | 12,356 (83.3%) | 2,481 (16.7%) |
| $75,000 to $99,999 | 9,958 (81.2%) | 2,312 (18.8%) |
| $100,000 and over | 25,951 (91.8%) | 2,315 (8.2%) |
Public vs Private Health Insurance Coverage by Age in Fort Myers
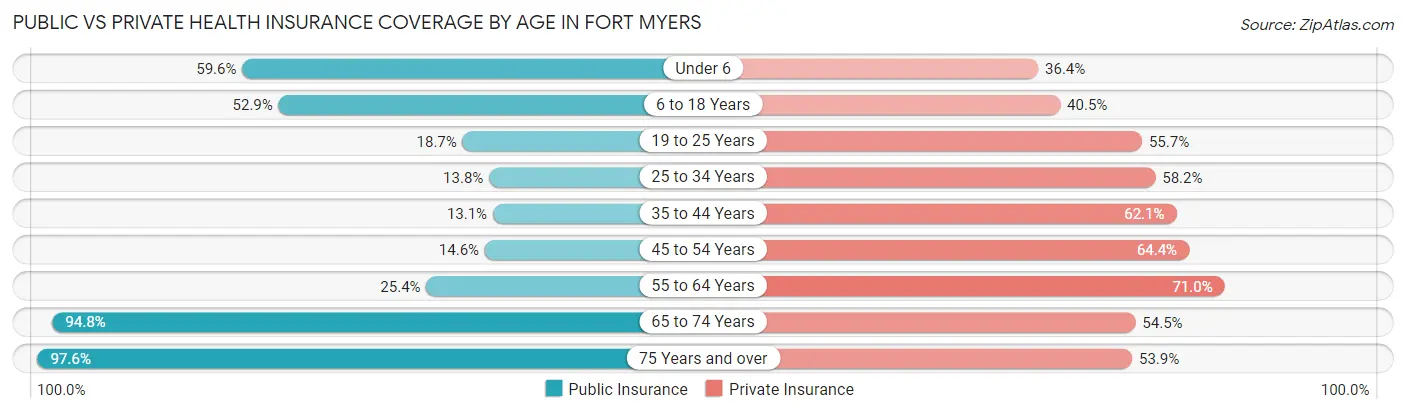
| Age Bracket | Public Insurance | Private Insurance |
| Under 6 | 3,912 (59.6%) | 2,392 (36.4%) |
| 6 to 18 Years | 6,405 (52.9%) | 4,910 (40.5%) |
| 19 to 25 Years | 1,312 (18.7%) | 3,909 (55.7%) |
| 25 to 34 Years | 1,433 (13.8%) | 6,057 (58.2%) |
| 35 to 44 Years | 1,603 (13.1%) | 7,617 (62.1%) |
| 45 to 54 Years | 1,350 (14.6%) | 5,976 (64.4%) |
| 55 to 64 Years | 2,402 (25.4%) | 6,711 (71.0%) |
| 65 to 74 Years | 10,355 (94.8%) | 5,951 (54.5%) |
| 75 Years and over | 7,986 (97.6%) | 4,408 (53.9%) |
| Total | 36,758 (42.6%) | 47,931 (55.6%) |
Disability Status by Sex by Age in Fort Myers
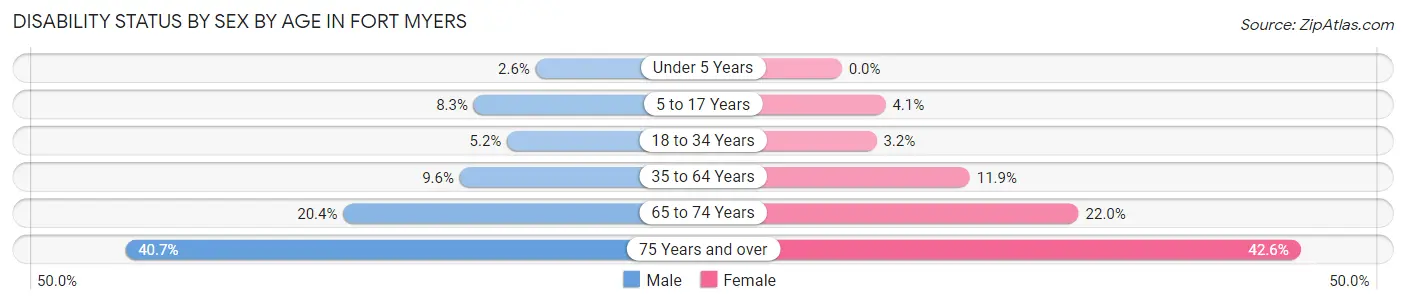
| Age Bracket | Male | Female |
| Under 5 Years | 82 (2.6%) | 0 (0.0%) |
| 5 to 17 Years | 526 (8.3%) | 247 (4.1%) |
| 18 to 34 Years | 454 (5.2%) | 302 (3.2%) |
| 35 to 64 Years | 1,469 (9.6%) | 1,866 (11.9%) |
| 65 to 74 Years | 1,034 (20.4%) | 1,287 (22.0%) |
| 75 Years and over | 1,325 (40.7%) | 2,096 (42.6%) |
Disability Class by Sex by Age in Fort Myers
Disability Class: Hearing Difficulty
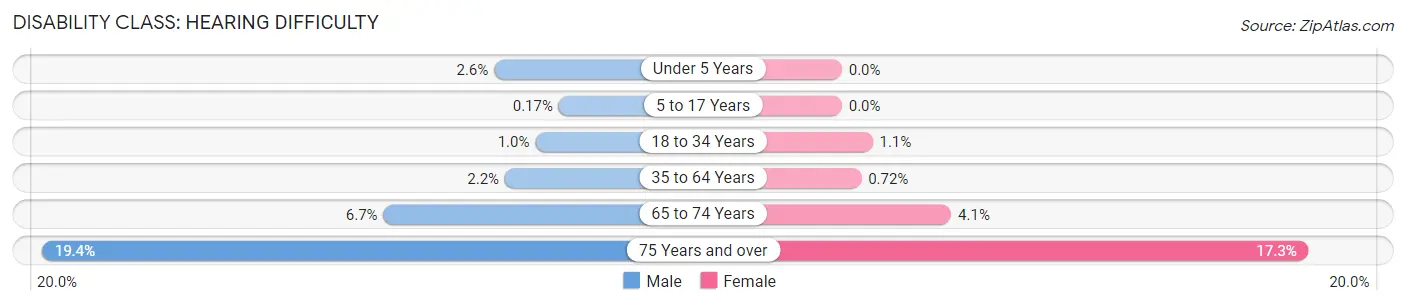
| Age Bracket | Male | Female |
| Under 5 Years | 82 (2.6%) | 0 (0.0%) |
| 5 to 17 Years | 11 (0.2%) | 0 (0.0%) |
| 18 to 34 Years | 91 (1.0%) | 107 (1.1%) |
| 35 to 64 Years | 331 (2.2%) | 113 (0.7%) |
| 65 to 74 Years | 338 (6.7%) | 238 (4.1%) |
| 75 Years and over | 631 (19.4%) | 853 (17.3%) |
Disability Class: Vision Difficulty
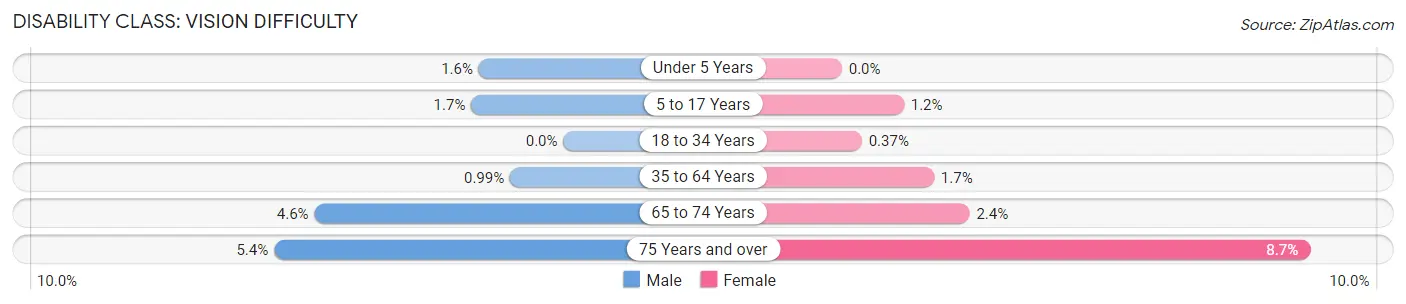
| Age Bracket | Male | Female |
| Under 5 Years | 50 (1.6%) | 0 (0.0%) |
| 5 to 17 Years | 108 (1.7%) | 70 (1.1%) |
| 18 to 34 Years | 0 (0.0%) | 35 (0.4%) |
| 35 to 64 Years | 151 (1.0%) | 269 (1.7%) |
| 65 to 74 Years | 234 (4.6%) | 139 (2.4%) |
| 75 Years and over | 175 (5.4%) | 428 (8.7%) |
Disability Class: Cognitive Difficulty
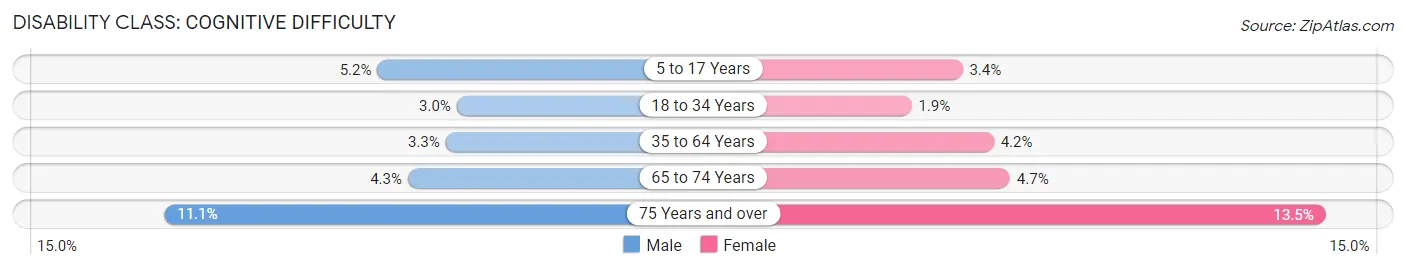
| Age Bracket | Male | Female |
| 5 to 17 Years | 328 (5.2%) | 205 (3.4%) |
| 18 to 34 Years | 259 (3.0%) | 182 (1.9%) |
| 35 to 64 Years | 502 (3.3%) | 664 (4.2%) |
| 65 to 74 Years | 219 (4.3%) | 274 (4.7%) |
| 75 Years and over | 362 (11.1%) | 663 (13.5%) |
Disability Class: Ambulatory Difficulty
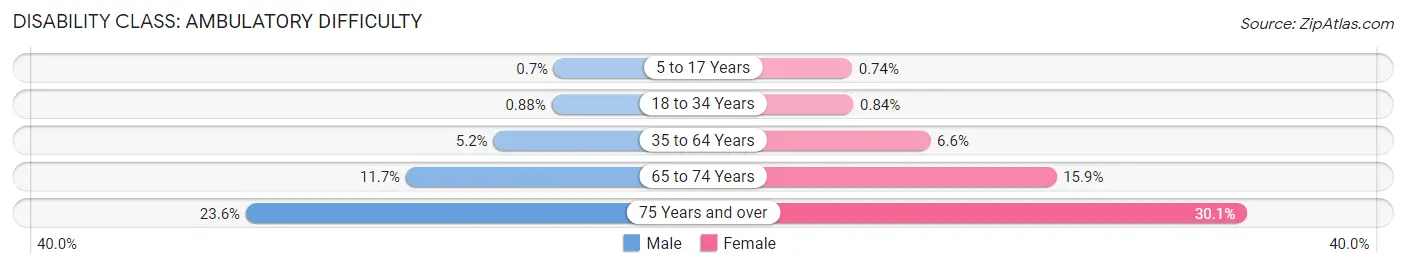
| Age Bracket | Male | Female |
| 5 to 17 Years | 44 (0.7%) | 45 (0.7%) |
| 18 to 34 Years | 77 (0.9%) | 79 (0.8%) |
| 35 to 64 Years | 793 (5.2%) | 1,031 (6.6%) |
| 65 to 74 Years | 592 (11.7%) | 932 (15.9%) |
| 75 Years and over | 768 (23.6%) | 1,481 (30.1%) |
Disability Class: Self-Care Difficulty
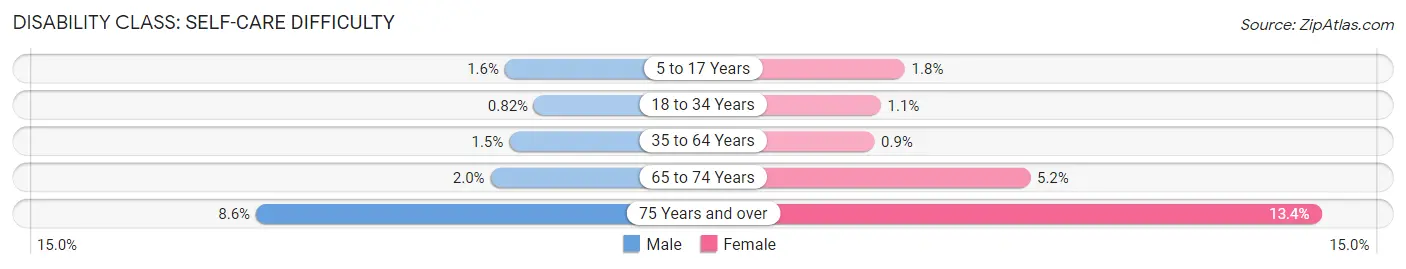
| Age Bracket | Male | Female |
| 5 to 17 Years | 103 (1.6%) | 107 (1.8%) |
| 18 to 34 Years | 71 (0.8%) | 101 (1.1%) |
| 35 to 64 Years | 231 (1.5%) | 141 (0.9%) |
| 65 to 74 Years | 103 (2.0%) | 307 (5.2%) |
| 75 Years and over | 279 (8.6%) | 657 (13.4%) |
Technology Access in Fort Myers
Computing Device Access in Fort Myers
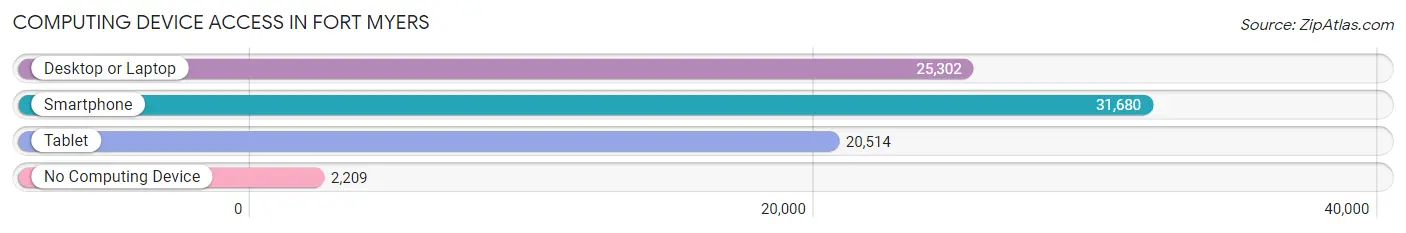
| Device Type | # Households | % Households |
| Desktop or Laptop | 25,302 | 71.4% |
| Smartphone | 31,680 | 89.4% |
| Tablet | 20,514 | 57.9% |
| No Computing Device | 2,209 | 6.2% |
| Total | 35,426 | 100.0% |
Internet Access in Fort Myers
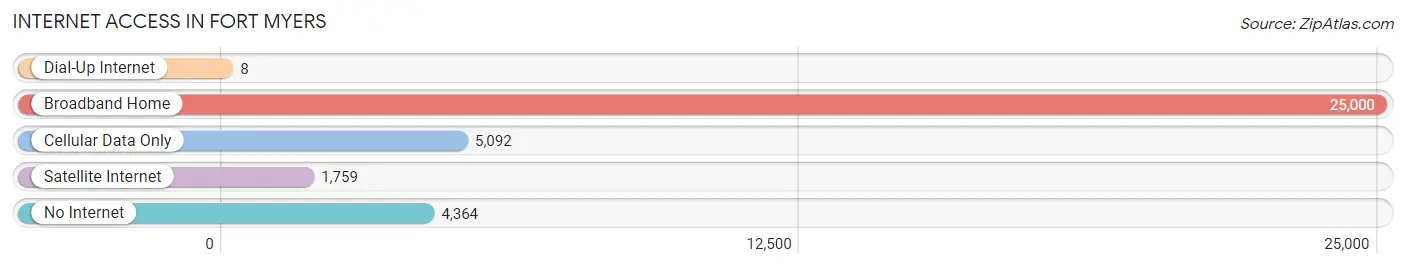
| Internet Type | # Households | % Households |
| Dial-Up Internet | 8 | 0.0% |
| Broadband Home | 25,000 | 70.6% |
| Cellular Data Only | 5,092 | 14.4% |
| Satellite Internet | 1,759 | 5.0% |
| No Internet | 4,364 | 12.3% |
| Total | 35,426 | 100.0% |
Fort Myers Summary
Fort Myers, Florida is a city located in Lee County, Florida, United States. It is the county seat of Lee County and is the largest city in the county. The city is located on the Caloosahatchee River and is the gateway to the Southwest Florida region. The city is known for its beaches, fishing, and outdoor activities.
History
The area that is now Fort Myers was first inhabited by the Calusa Indians. The Calusa were a powerful tribe that lived in the area for centuries before the arrival of the Europeans. The first Europeans to explore the area were the Spanish, who arrived in the late 1500s. The Spanish established a mission in the area in 1566, but it was abandoned in 1569.
In the early 1800s, the area was settled by the Seminole Indians. The Seminoles were a tribe of Native Americans who had been forced out of their homelands in Georgia and Alabama. The Seminoles established a village in the area, which they called “Caloosahatchee”.
In 1821, the United States acquired Florida from Spain. The area was then opened up to settlement by non-Indians. In 1836, the U.S. Army established a fort in the area, which was named Fort Myers after Colonel Abraham Myers. The fort was used to protect settlers from the Seminoles.
In 1885, Fort Myers was incorporated as a city. The city grew rapidly in the late 1800s and early 1900s, due to the arrival of the railroad and the development of the area’s agricultural industry. The city was also a popular tourist destination, due to its beaches and fishing.
In the mid-1900s, the city experienced a period of decline, as the agricultural industry declined and the population decreased. However, in the late 1900s, the city experienced a resurgence, as new businesses and industries moved into the area.
Geography
Fort Myers is located in the southwestern part of Florida, on the Caloosahatchee River. The city is located about 90 miles south of Tampa and about 120 miles north of Miami. The city covers an area of about 40 square miles and has a population of about 77,000 people.
The city is located in a flat, low-lying area, with an elevation of about 10 feet above sea level. The city is surrounded by wetlands, which are home to a variety of wildlife. The city is also located near several lakes, including Lake Okeechobee and Lake Trafford.
Economy
The economy of Fort Myers is largely based on tourism, agriculture, and manufacturing. The city is a popular tourist destination, due to its beaches, fishing, and outdoor activities. The city is also home to several large agricultural operations, including citrus and vegetable farms.
The city is also home to several large manufacturing companies, including Chico’s, Gartner, and Lee County Electric Cooperative. The city is also home to several large healthcare companies, including Lee Memorial Health System and Lee Physician Group.
Demographics
As of the 2010 census, the population of Fort Myers was 77,146. The population is made up of a variety of ethnic and racial groups, including White (63.2%), African American (19.2%), Hispanic or Latino (14.3%), and Asian (2.3%). The median household income in the city is $41,945, and the median home value is $153,000.
Common Questions
What is Per Capita Income in Fort Myers?
Per Capita income in Fort Myers is $38,217.
What is the Median Family Income in Fort Myers?
Median Family Income in Fort Myers is $72,489.
What is the Median Household income in Fort Myers?
Median Household Income in Fort Myers is $57,403.
What is Income or Wage Gap in Fort Myers?
Income or Wage Gap in Fort Myers is 20.6%.
Women in Fort Myers earn 79.4 cents for every dollar earned by a man.
What is Family Income Deficit in Fort Myers?
Family Income Deficit in Fort Myers is $9,581.
Families that are below poverty line in Fort Myers earn $9,581 less on average than the poverty threshold level.
What is Inequality or Gini Index in Fort Myers?
Inequality or Gini Index in Fort Myers is 0.52.
What is the Total Population of Fort Myers?
Total Population of Fort Myers is 88,699.
What is the Total Male Population of Fort Myers?
Total Male Population of Fort Myers is 43,765.
What is the Total Female Population of Fort Myers?
Total Female Population of Fort Myers is 44,934.
What is the Ratio of Males per 100 Females in Fort Myers?
There are 97.40 Males per 100 Females in Fort Myers.
What is the Ratio of Females per 100 Males in Fort Myers?
There are 102.67 Females per 100 Males in Fort Myers.
What is the Median Population Age in Fort Myers?
Median Population Age in Fort Myers is 40.6 Years.
What is the Average Family Size in Fort Myers
Average Family Size in Fort Myers is 3.1 People.
What is the Average Household Size in Fort Myers
Average Household Size in Fort Myers is 2.4 People.
How Large is the Labor Force in Fort Myers?
There are 39,783 People in the Labor Forcein in Fort Myers.
What is the Percentage of People in the Labor Force in Fort Myers?
55.1% of People are in the Labor Force in Fort Myers.
What is the Unemployment Rate in Fort Myers?
Unemployment Rate in Fort Myers is 4.1%.