Hempstead, NY Map & Demographics
Hempstead Map
Hempstead Overview
$31,370
PER CAPITA INCOME
$88,080
AVG FAMILY INCOME
$80,350
AVG HOUSEHOLD INCOME
8.9%
WAGE / INCOME GAP [ % ]
91.1¢/ $1
WAGE / INCOME GAP [ $ ]
$10,030
FAMILY INCOME DEFICIT
0.47
INEQUALITY / GINI INDEX
58,557
TOTAL POPULATION
28,400
MALE POPULATION
30,157
FEMALE POPULATION
94.17
MALES / 100 FEMALES
106.19
FEMALES / 100 MALES
35.6
MEDIAN AGE
3.9
AVG FAMILY SIZE
3.4
AVG HOUSEHOLD SIZE
31,064
LABOR FORCE [ PEOPLE ]
67.8%
PERCENT IN LABOR FORCE
8.4%
UNEMPLOYMENT RATE
Income in Hempstead
Income Overview in Hempstead
Per Capita Income in Hempstead is $31,370, while median incomes of families and households are $88,080 and $80,350 respectively.
| Characteristic | Number | Measure |
| Per Capita Income | 58,557 | $31,370 |
| Median Family Income | 12,565 | $88,080 |
| Mean Family Income | 12,565 | $103,455 |
| Median Household Income | 17,030 | $80,350 |
| Mean Household Income | 17,030 | $105,962 |
| Income Deficit | 12,565 | $10,030 |
| Wage / Income Gap (%) | 58,557 | 8.95% |
| Wage / Income Gap ($) | 58,557 | 91.05¢ per $1 |
| Gini / Inequality Index | 58,557 | 0.47 |
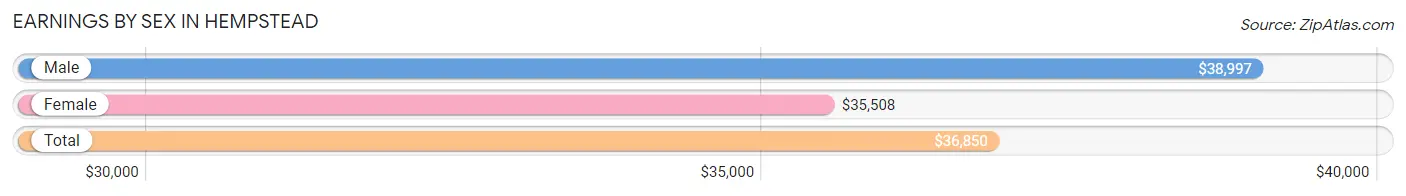
Earnings by Sex in Hempstead
Average Earnings in Hempstead are $36,850, $38,997 for men and $35,508 for women, a difference of 8.9%.
| Sex | Number | Average Earnings |
| Male | 16,159 (51.4%) | $38,997 |
| Female | 15,296 (48.6%) | $35,508 |
| Total | 31,455 (100.0%) | $36,850 |
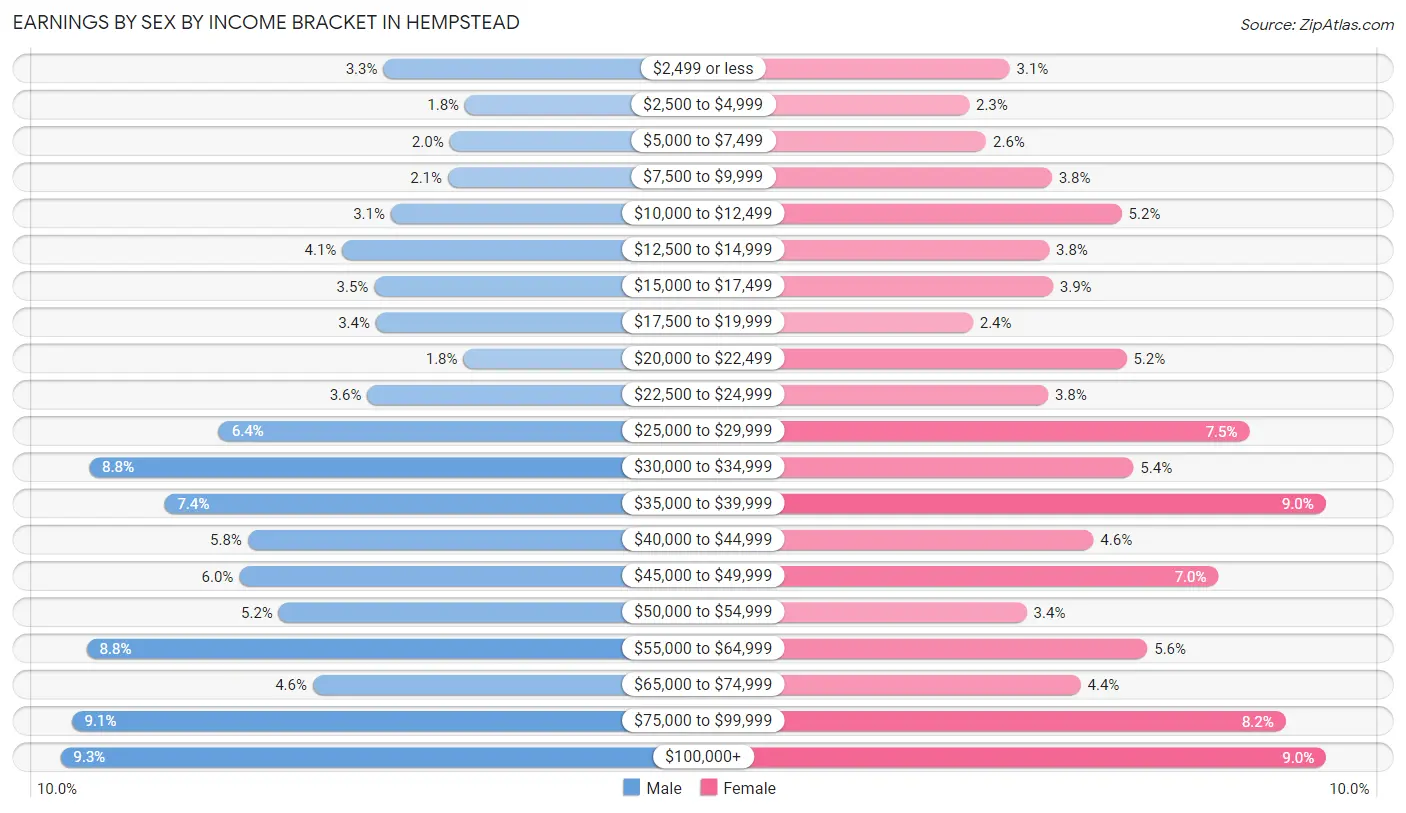
Earnings by Sex by Income Bracket in Hempstead
The most common earnings brackets in Hempstead are $100,000+ for men (1,507 | 9.3%) and $100,000+ for women (1,373 | 9.0%).
| Income | Male | Female |
| $2,499 or less | 530 (3.3%) | 466 (3.0%) |
| $2,500 to $4,999 | 283 (1.8%) | 350 (2.3%) |
| $5,000 to $7,499 | 329 (2.0%) | 399 (2.6%) |
| $7,500 to $9,999 | 335 (2.1%) | 587 (3.8%) |
| $10,000 to $12,499 | 507 (3.1%) | 788 (5.1%) |
| $12,500 to $14,999 | 654 (4.1%) | 579 (3.8%) |
| $15,000 to $17,499 | 558 (3.5%) | 590 (3.9%) |
| $17,500 to $19,999 | 552 (3.4%) | 361 (2.4%) |
| $20,000 to $22,499 | 287 (1.8%) | 802 (5.2%) |
| $22,500 to $24,999 | 578 (3.6%) | 577 (3.8%) |
| $25,000 to $29,999 | 1,028 (6.4%) | 1,154 (7.5%) |
| $30,000 to $34,999 | 1,420 (8.8%) | 822 (5.4%) |
| $35,000 to $39,999 | 1,193 (7.4%) | 1,372 (9.0%) |
| $40,000 to $44,999 | 941 (5.8%) | 707 (4.6%) |
| $45,000 to $49,999 | 966 (6.0%) | 1,064 (7.0%) |
| $50,000 to $54,999 | 846 (5.2%) | 516 (3.4%) |
| $55,000 to $64,999 | 1,428 (8.8%) | 861 (5.6%) |
| $65,000 to $74,999 | 744 (4.6%) | 670 (4.4%) |
| $75,000 to $99,999 | 1,473 (9.1%) | 1,258 (8.2%) |
| $100,000+ | 1,507 (9.3%) | 1,373 (9.0%) |
| Total | 16,159 (100.0%) | 15,296 (100.0%) |
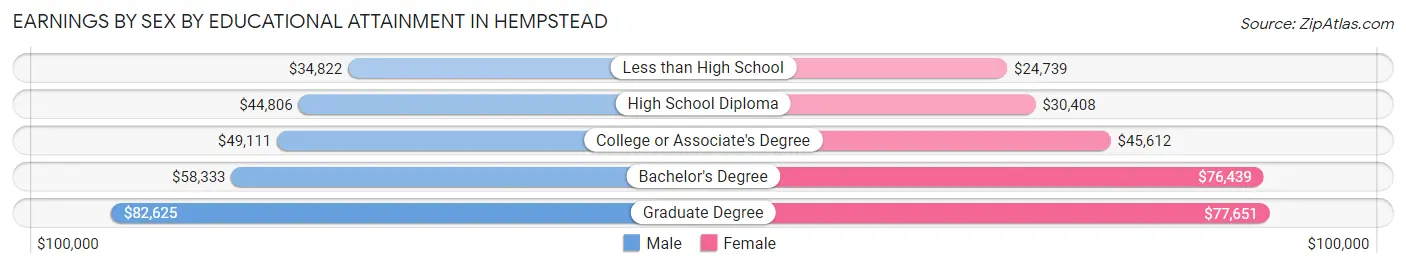
Earnings by Sex by Educational Attainment in Hempstead
Average earnings in Hempstead are $43,208 for men and $39,250 for women, a difference of 9.2%. Men with an educational attainment of graduate degree enjoy the highest average annual earnings of $82,625, while those with less than high school education earn the least with $34,822. Women with an educational attainment of graduate degree earn the most with the average annual earnings of $77,651, while those with less than high school education have the smallest earnings of $24,739.
| Educational Attainment | Male Income | Female Income |
| Less than High School | $34,822 | $24,739 |
| High School Diploma | $44,806 | $30,408 |
| College or Associate's Degree | $49,111 | $45,612 |
| Bachelor's Degree | $58,333 | $76,439 |
| Graduate Degree | $82,625 | $77,651 |
| Total | $43,208 | $39,250 |
Family Income in Hempstead
Family Income Brackets in Hempstead
According to the Hempstead family income data, there are 2,588 families falling into the $100,000 to $149,999 income range, which is the most common income bracket and makes up 20.6% of all families. Conversely, the $10,000 to $14,999 income bracket is the least frequent group with only 302 families (2.4%) belonging to this category.
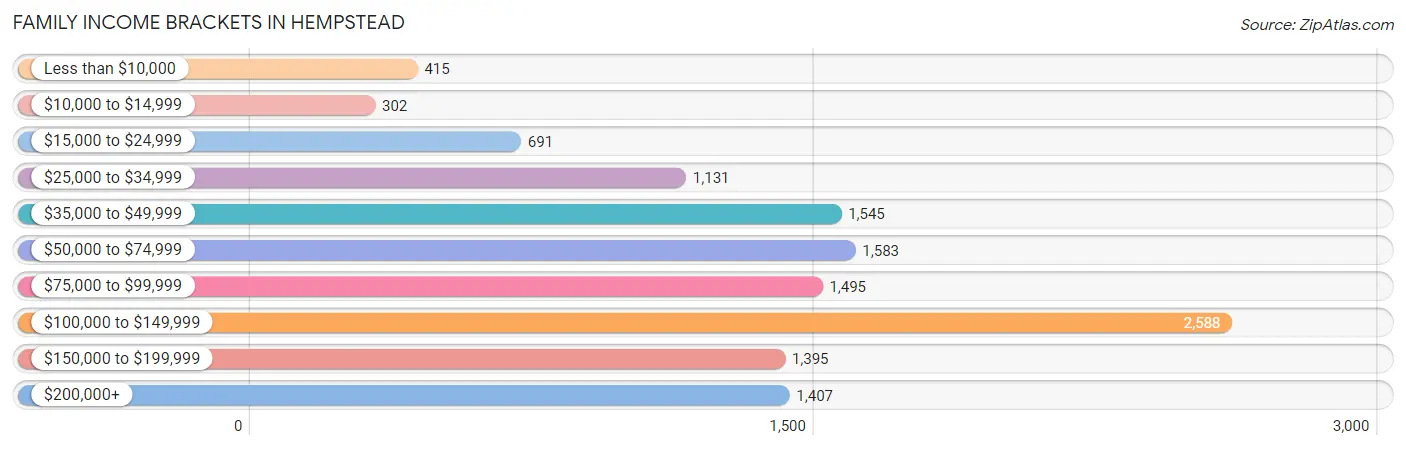
| Income Bracket | # Families | % Families |
| Less than $10,000 | 415 | 3.3% |
| $10,000 to $14,999 | 302 | 2.4% |
| $15,000 to $24,999 | 691 | 5.5% |
| $25,000 to $34,999 | 1,131 | 9.0% |
| $35,000 to $49,999 | 1,545 | 12.3% |
| $50,000 to $74,999 | 1,583 | 12.6% |
| $75,000 to $99,999 | 1,495 | 11.9% |
| $100,000 to $149,999 | 2,588 | 20.6% |
| $150,000 to $199,999 | 1,395 | 11.1% |
| $200,000+ | 1,407 | 11.2% |
Family Income by Famaliy Size in Hempstead
6-person families (875 | 7.0%) account for the highest median family income in Hempstead with $132,321 per family, while 3-person families (3,024 | 24.1%) have the highest median income of $30,858 per family member.
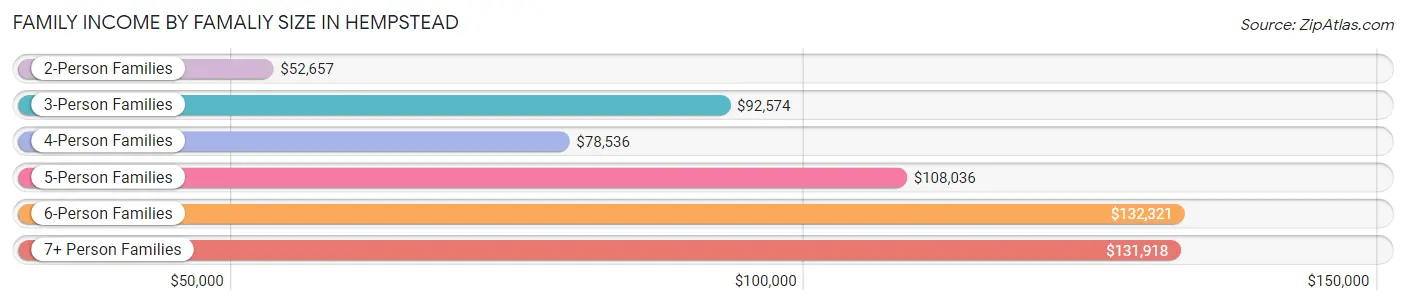
| Income Bracket | # Families | Median Income |
| 2-Person Families | 3,369 (26.8%) | $52,657 |
| 3-Person Families | 3,024 (24.1%) | $92,574 |
| 4-Person Families | 3,092 (24.6%) | $78,536 |
| 5-Person Families | 1,238 (9.9%) | $108,036 |
| 6-Person Families | 875 (7.0%) | $132,321 |
| 7+ Person Families | 967 (7.7%) | $131,918 |
| Total | 12,565 (100.0%) | $88,080 |
Family Income by Number of Earners in Hempstead
The median family income in Hempstead is $88,080, with families comprising 3+ earners (3,101) having the highest median family income of $137,318, while families with no earners (1,084) have the lowest median family income of $19,944, accounting for 24.7% and 8.6% of families, respectively.
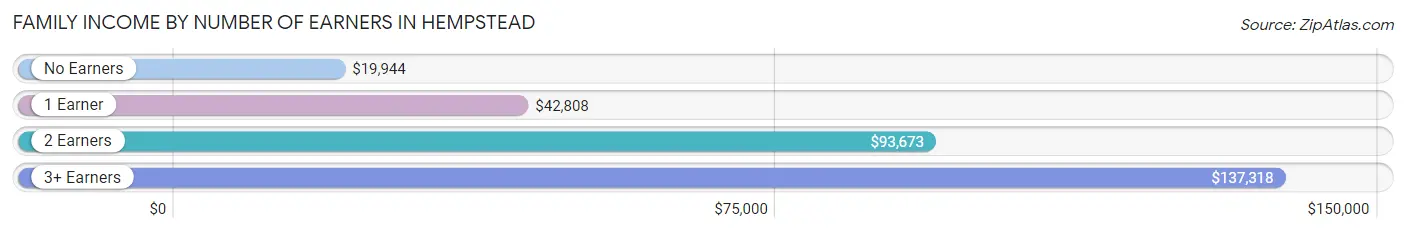
| Number of Earners | # Families | Median Income |
| No Earners | 1,084 (8.6%) | $19,944 |
| 1 Earner | 3,888 (30.9%) | $42,808 |
| 2 Earners | 4,492 (35.7%) | $93,673 |
| 3+ Earners | 3,101 (24.7%) | $137,318 |
| Total | 12,565 (100.0%) | $88,080 |
Household Income in Hempstead
Household Income Brackets in Hempstead
With 3,134 households falling in the category, the $100,000 to $149,999 income range is the most frequent in Hempstead, accounting for 18.4% of all households. In contrast, only 766 households (4.5%) fall into the less than $10,000 income bracket, making it the least populous group.
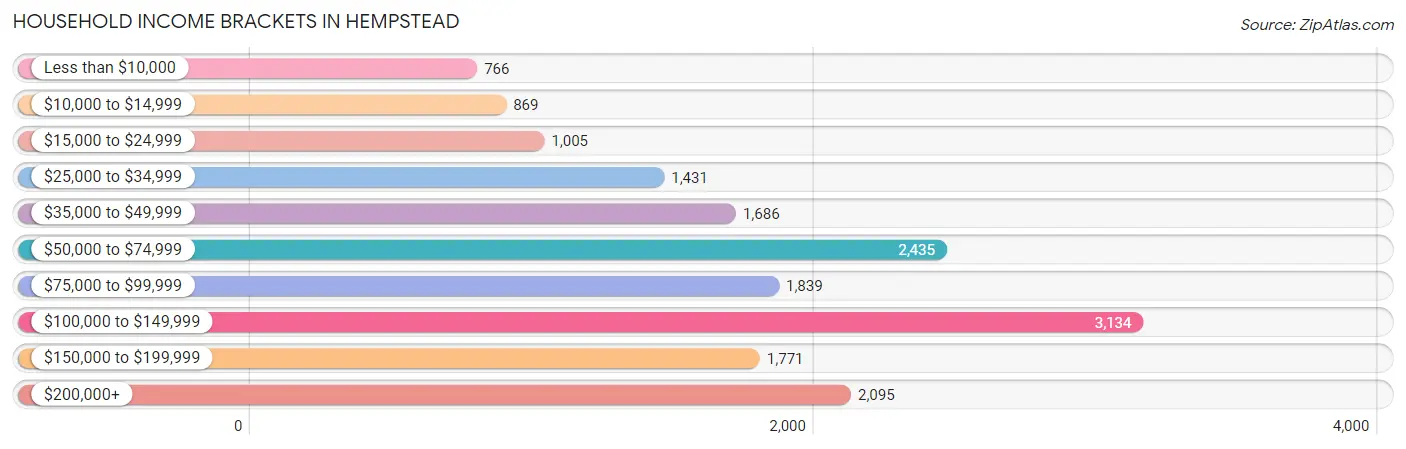
| Income Bracket | # Households | % Households |
| Less than $10,000 | 766 | 4.5% |
| $10,000 to $14,999 | 869 | 5.1% |
| $15,000 to $24,999 | 1,005 | 5.9% |
| $25,000 to $34,999 | 1,431 | 8.4% |
| $35,000 to $49,999 | 1,686 | 9.9% |
| $50,000 to $74,999 | 2,435 | 14.3% |
| $75,000 to $99,999 | 1,839 | 10.8% |
| $100,000 to $149,999 | 3,134 | 18.4% |
| $150,000 to $199,999 | 1,771 | 10.4% |
| $200,000+ | 2,095 | 12.3% |
Household Income by Householder Age in Hempstead
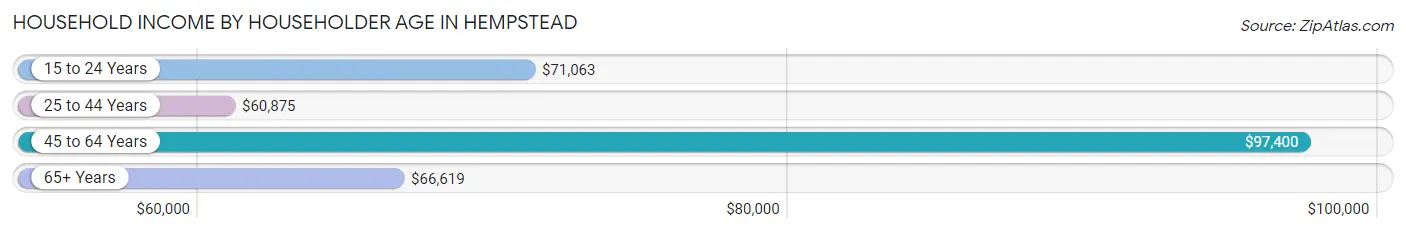
The median household income in Hempstead is $80,350, with the highest median household income of $97,400 found in the 45 to 64 years age bracket for the primary householder. A total of 7,404 households (43.5%) fall into this category. Meanwhile, the 25 to 44 years age bracket for the primary householder has the lowest median household income of $60,875, with 5,466 households (32.1%) in this group.
| Income Bracket | # Households | Median Income |
| 15 to 24 Years | 487 (2.9%) | $71,063 |
| 25 to 44 Years | 5,466 (32.1%) | $60,875 |
| 45 to 64 Years | 7,404 (43.5%) | $97,400 |
| 65+ Years | 3,673 (21.6%) | $66,619 |
| Total | 17,030 (100.0%) | $80,350 |
Poverty in Hempstead
Income Below Poverty by Sex and Age in Hempstead
With 14.2% poverty level for males and 17.6% for females among the residents of Hempstead, 5 year old males and under 5 year old females are the most vulnerable to poverty, with 91 males (39.9%) and 599 females (34.5%) in their respective age groups living below the poverty level.
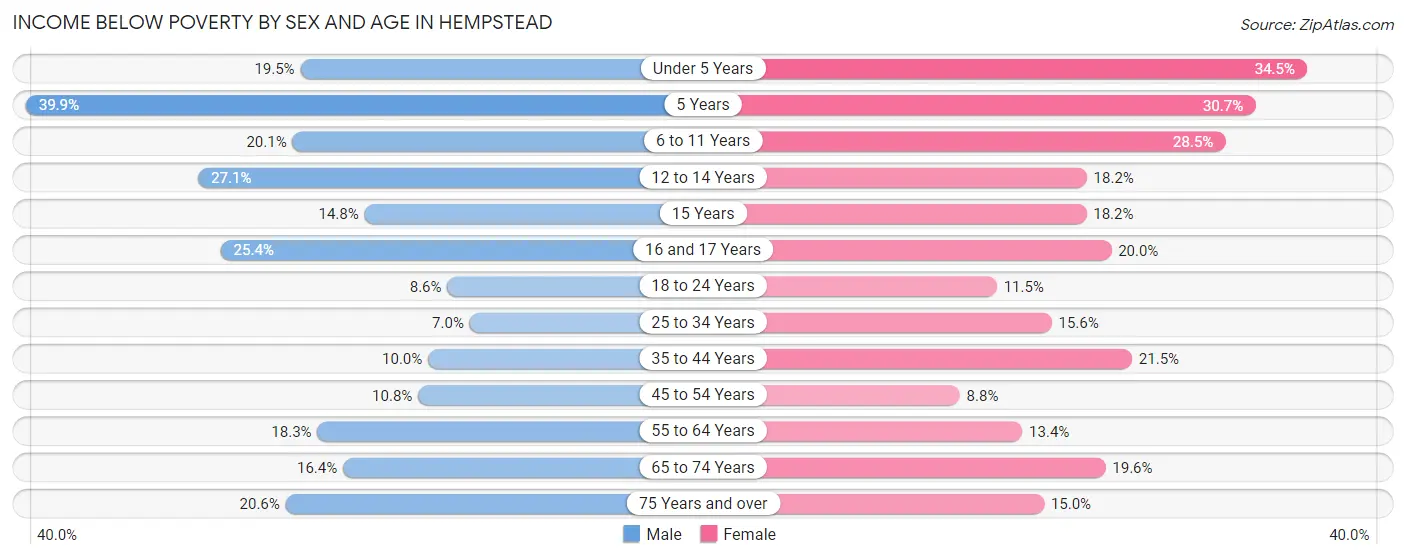
| Age Bracket | Male | Female |
| Under 5 Years | 395 (19.5%) | 599 (34.5%) |
| 5 Years | 91 (39.9%) | 139 (30.7%) |
| 6 to 11 Years | 493 (20.1%) | 606 (28.5%) |
| 12 to 14 Years | 347 (27.1%) | 214 (18.2%) |
| 15 Years | 102 (14.8%) | 57 (18.1%) |
| 16 and 17 Years | 158 (25.4%) | 69 (20.0%) |
| 18 to 24 Years | 252 (8.6%) | 380 (11.5%) |
| 25 to 34 Years | 275 (7.0%) | 749 (15.6%) |
| 35 to 44 Years | 425 (10.0%) | 901 (21.5%) |
| 45 to 54 Years | 424 (10.8%) | 332 (8.7%) |
| 55 to 64 Years | 595 (18.3%) | 440 (13.4%) |
| 65 to 74 Years | 249 (16.4%) | 471 (19.6%) |
| 75 Years and over | 194 (20.6%) | 254 (15.0%) |
| Total | 4,000 (14.2%) | 5,211 (17.6%) |
Income Above Poverty by Sex and Age in Hempstead
According to the poverty statistics in Hempstead, males aged 25 to 34 years and females aged 45 to 54 years are the age groups that are most secure financially, with 93.0% of males and 91.2% of females in these age groups living above the poverty line.
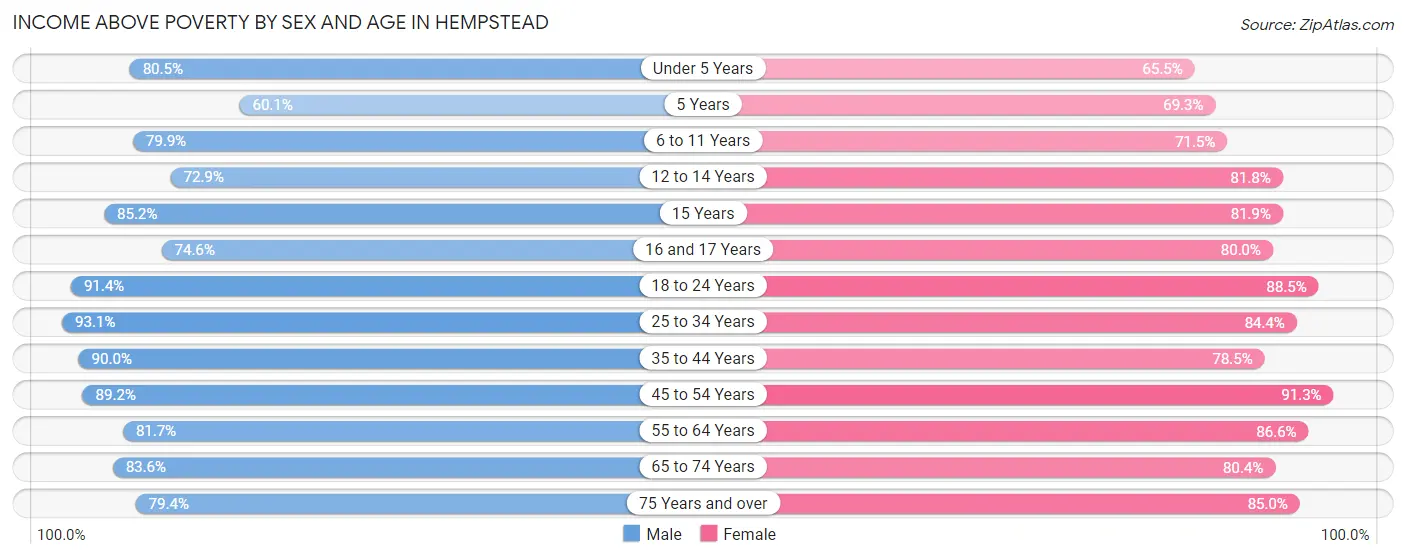
| Age Bracket | Male | Female |
| Under 5 Years | 1,629 (80.5%) | 1,136 (65.5%) |
| 5 Years | 137 (60.1%) | 314 (69.3%) |
| 6 to 11 Years | 1,958 (79.9%) | 1,523 (71.5%) |
| 12 to 14 Years | 933 (72.9%) | 963 (81.8%) |
| 15 Years | 589 (85.2%) | 257 (81.9%) |
| 16 and 17 Years | 463 (74.6%) | 276 (80.0%) |
| 18 to 24 Years | 2,675 (91.4%) | 2,923 (88.5%) |
| 25 to 34 Years | 3,679 (93.0%) | 4,061 (84.4%) |
| 35 to 44 Years | 3,809 (90.0%) | 3,281 (78.5%) |
| 45 to 54 Years | 3,508 (89.2%) | 3,464 (91.2%) |
| 55 to 64 Years | 2,663 (81.7%) | 2,847 (86.6%) |
| 65 to 74 Years | 1,273 (83.6%) | 1,936 (80.4%) |
| 75 Years and over | 747 (79.4%) | 1,438 (85.0%) |
| Total | 24,063 (85.8%) | 24,419 (82.4%) |
Income Below Poverty Among Married-Couple Families in Hempstead
The poverty statistics for married-couple families in Hempstead show that 7.7% or 416 of the total 5,384 families live below the poverty line. Families with 5 or more children have the highest poverty rate of 100.0%, comprising of 25 families. On the other hand, families with no children have the lowest poverty rate of 5.9%, which includes 137 families.
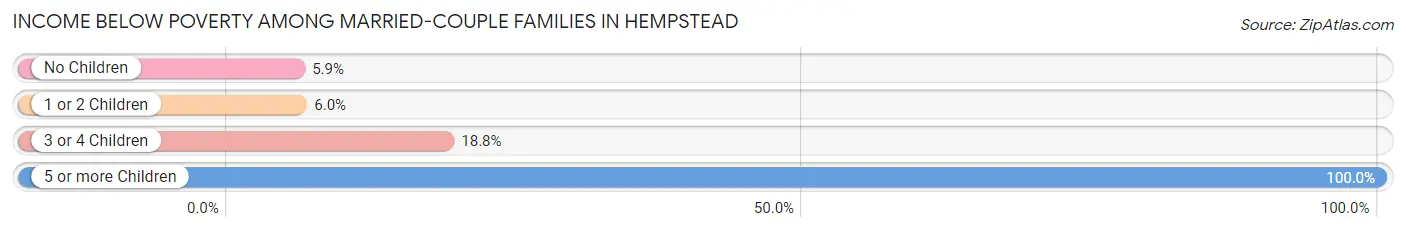
| Children | Above Poverty | Below Poverty |
| No Children | 2,203 (94.2%) | 137 (5.9%) |
| 1 or 2 Children | 2,308 (94.0%) | 148 (6.0%) |
| 3 or 4 Children | 457 (81.2%) | 106 (18.8%) |
| 5 or more Children | 0 (0.0%) | 25 (100.0%) |
| Total | 4,968 (92.3%) | 416 (7.7%) |
Income Below Poverty Among Single-Parent Households in Hempstead
According to the poverty data in Hempstead, 13.3% or 207 single-father households and 20.0% or 1,123 single-mother households are living below the poverty line. Among single-father households, those with 3 or 4 children have the highest poverty rate, with 102 households (89.5%) experiencing poverty. Likewise, among single-mother households, those with 3 or 4 children have the highest poverty rate, with 360 households (51.6%) falling below the poverty line.
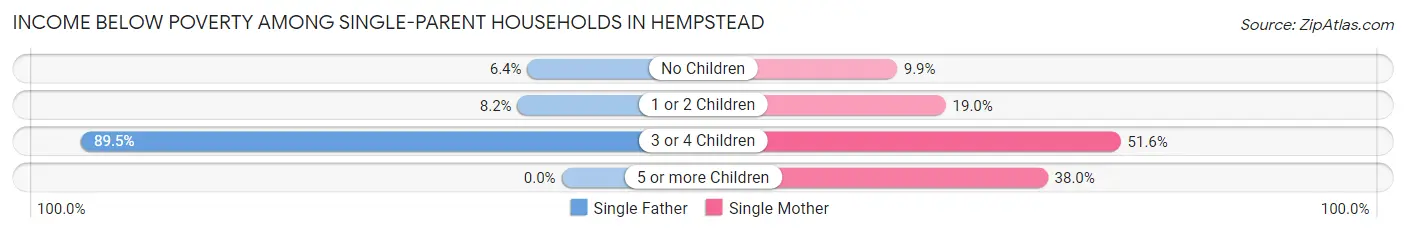
| Children | Single Father | Single Mother |
| No Children | 45 (6.4%) | 225 (9.9%) |
| 1 or 2 Children | 60 (8.2%) | 470 (19.0%) |
| 3 or 4 Children | 102 (89.5%) | 360 (51.6%) |
| 5 or more Children | 0 (0.0%) | 68 (38.0%) |
| Total | 207 (13.3%) | 1,123 (20.0%) |
Income Below Poverty Among Married-Couple vs Single-Parent Households in Hempstead
The poverty data for Hempstead shows that 416 of the married-couple family households (7.7%) and 1,330 of the single-parent households (18.5%) are living below the poverty level. Within the married-couple family households, those with 5 or more children have the highest poverty rate, with 25 households (100.0%) falling below the poverty line. Among the single-parent households, those with 3 or 4 children have the highest poverty rate, with 462 household (56.9%) living below poverty.
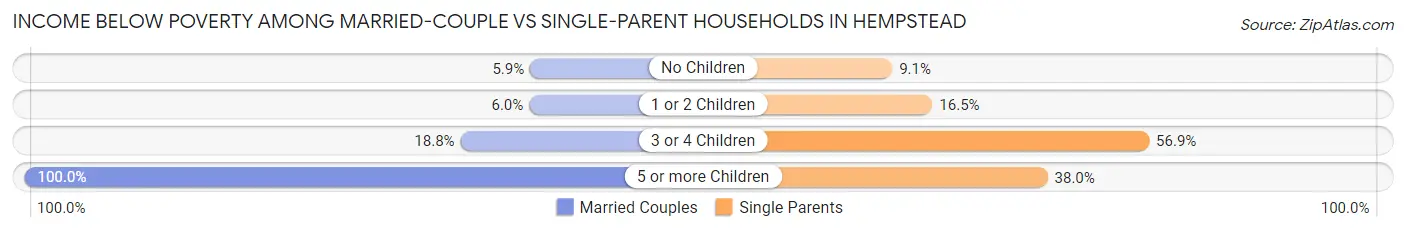
| Children | Married-Couple Families | Single-Parent Households |
| No Children | 137 (5.9%) | 270 (9.0%) |
| 1 or 2 Children | 148 (6.0%) | 530 (16.5%) |
| 3 or 4 Children | 106 (18.8%) | 462 (56.9%) |
| 5 or more Children | 25 (100.0%) | 68 (38.0%) |
| Total | 416 (7.7%) | 1,330 (18.5%) |
Race in Hempstead
The most populous races in Hempstead are Black / African American (27,488 | 46.9%), Hispanic or Latino (26,556 | 45.4%), and Some other Race (17,217 | 29.4%).
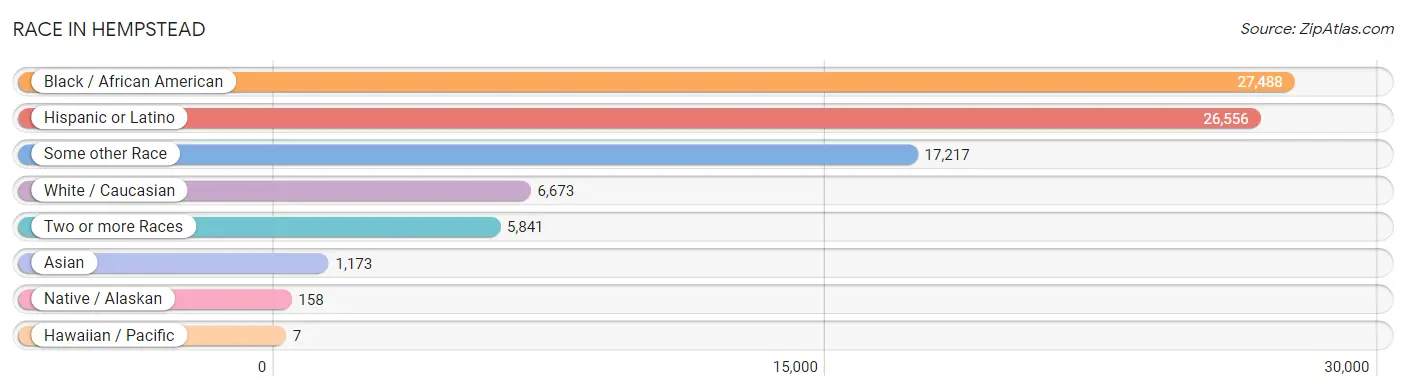
| Race | # Population | % Population |
| Asian | 1,173 | 2.0% |
| Black / African American | 27,488 | 46.9% |
| Hawaiian / Pacific | 7 | 0.0% |
| Hispanic or Latino | 26,556 | 45.4% |
| Native / Alaskan | 158 | 0.3% |
| White / Caucasian | 6,673 | 11.4% |
| Two or more Races | 5,841 | 10.0% |
| Some other Race | 17,217 | 29.4% |
| Total | 58,557 | 100.0% |
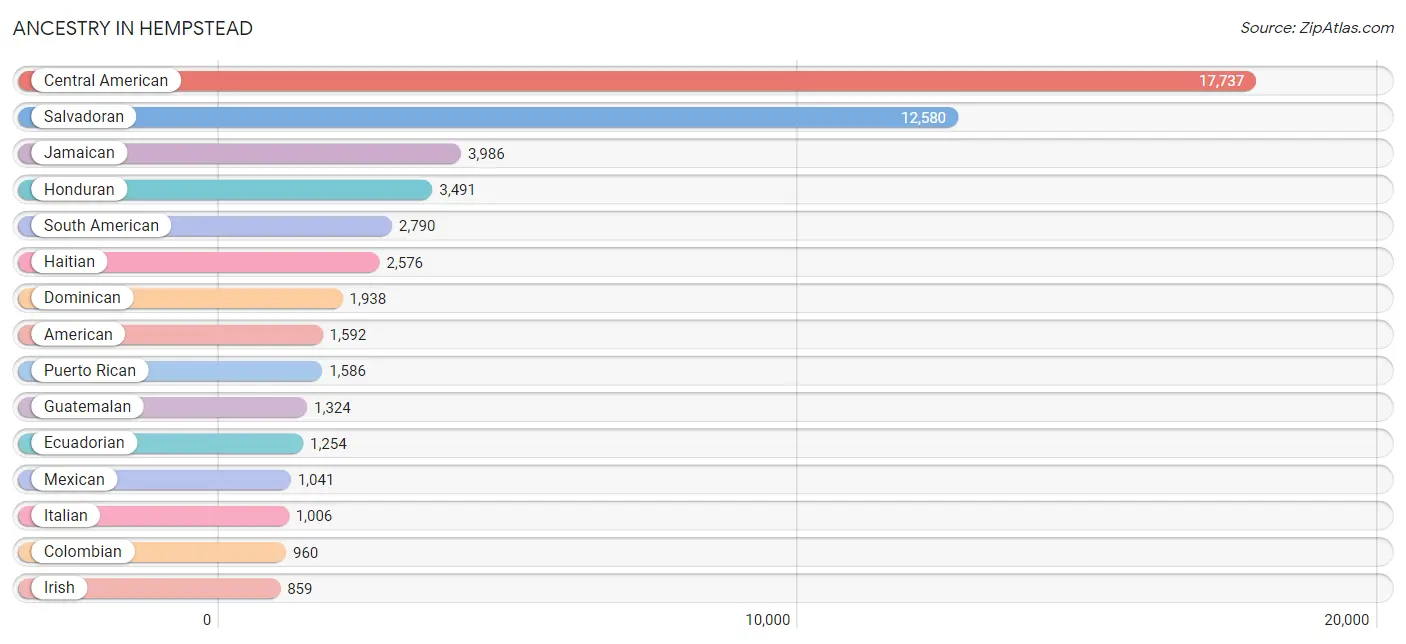
Ancestry in Hempstead
The most populous ancestries reported in Hempstead are Central American (17,737 | 30.3%), Salvadoran (12,580 | 21.5%), Jamaican (3,986 | 6.8%), Honduran (3,491 | 6.0%), and South American (2,790 | 4.8%), together accounting for 69.3% of all Hempstead residents.
| Ancestry | # Population | % Population |
| African | 354 | 0.6% |
| American | 1,592 | 2.7% |
| Argentinean | 55 | 0.1% |
| Armenian | 7 | 0.0% |
| Austrian | 18 | 0.0% |
| Barbadian | 332 | 0.6% |
| Belgian | 11 | 0.0% |
| Bhutanese | 40 | 0.1% |
| Blackfeet | 32 | 0.1% |
| Bolivian | 43 | 0.1% |
| Brazilian | 51 | 0.1% |
| British | 16 | 0.0% |
| British West Indian | 104 | 0.2% |
| Burmese | 35 | 0.1% |
| Canadian | 9 | 0.0% |
| Central American | 17,737 | 30.3% |
| Central American Indian | 258 | 0.4% |
| Cherokee | 71 | 0.1% |
| Colombian | 960 | 1.6% |
| Costa Rican | 104 | 0.2% |
| Croatian | 28 | 0.1% |
| Cuban | 162 | 0.3% |
| Danish | 12 | 0.0% |
| Dominican | 1,938 | 3.3% |
| Dutch | 43 | 0.1% |
| Ecuadorian | 1,254 | 2.1% |
| English | 104 | 0.2% |
| European | 21 | 0.0% |
| Filipino | 21 | 0.0% |
| Finnish | 11 | 0.0% |
| French | 22 | 0.0% |
| French Canadian | 38 | 0.1% |
| German | 515 | 0.9% |
| Ghanaian | 32 | 0.1% |
| Greek | 54 | 0.1% |
| Guatemalan | 1,324 | 2.3% |
| Guyanese | 622 | 1.1% |
| Haitian | 2,576 | 4.4% |
| Honduran | 3,491 | 6.0% |
| Hungarian | 14 | 0.0% |
| Indian (Asian) | 52 | 0.1% |
| Inupiat | 19 | 0.0% |
| Irish | 859 | 1.5% |
| Israeli | 19 | 0.0% |
| Italian | 1,006 | 1.7% |
| Jamaican | 3,986 | 6.8% |
| Kenyan | 11 | 0.0% |
| Korean | 119 | 0.2% |
| Liberian | 37 | 0.1% |
| Lithuanian | 29 | 0.1% |
| Maltese | 10 | 0.0% |
| Mexican | 1,041 | 1.8% |
| Mexican American Indian | 16 | 0.0% |
| Nicaraguan | 60 | 0.1% |
| Nigerian | 105 | 0.2% |
| Norwegian | 33 | 0.1% |
| Pakistani | 7 | 0.0% |
| Panamanian | 178 | 0.3% |
| Peruvian | 271 | 0.5% |
| Polish | 377 | 0.6% |
| Portuguese | 138 | 0.2% |
| Puerto Rican | 1,586 | 2.7% |
| Romanian | 50 | 0.1% |
| Russian | 16 | 0.0% |
| Salvadoran | 12,580 | 21.5% |
| Samoan | 18 | 0.0% |
| Scottish | 62 | 0.1% |
| Sierra Leonean | 102 | 0.2% |
| South American | 2,790 | 4.8% |
| South American Indian | 8 | 0.0% |
| Spaniard | 90 | 0.2% |
| Spanish | 253 | 0.4% |
| Sri Lankan | 6 | 0.0% |
| Subsaharan African | 647 | 1.1% |
| Swedish | 13 | 0.0% |
| Thai | 591 | 1.0% |
| Trinidadian and Tobagonian | 344 | 0.6% |
| Ukrainian | 6 | 0.0% |
| Venezuelan | 207 | 0.4% |
| Vietnamese | 145 | 0.3% |
| Welsh | 20 | 0.0% |
| West Indian | 362 | 0.6% | View All 82 Rows |
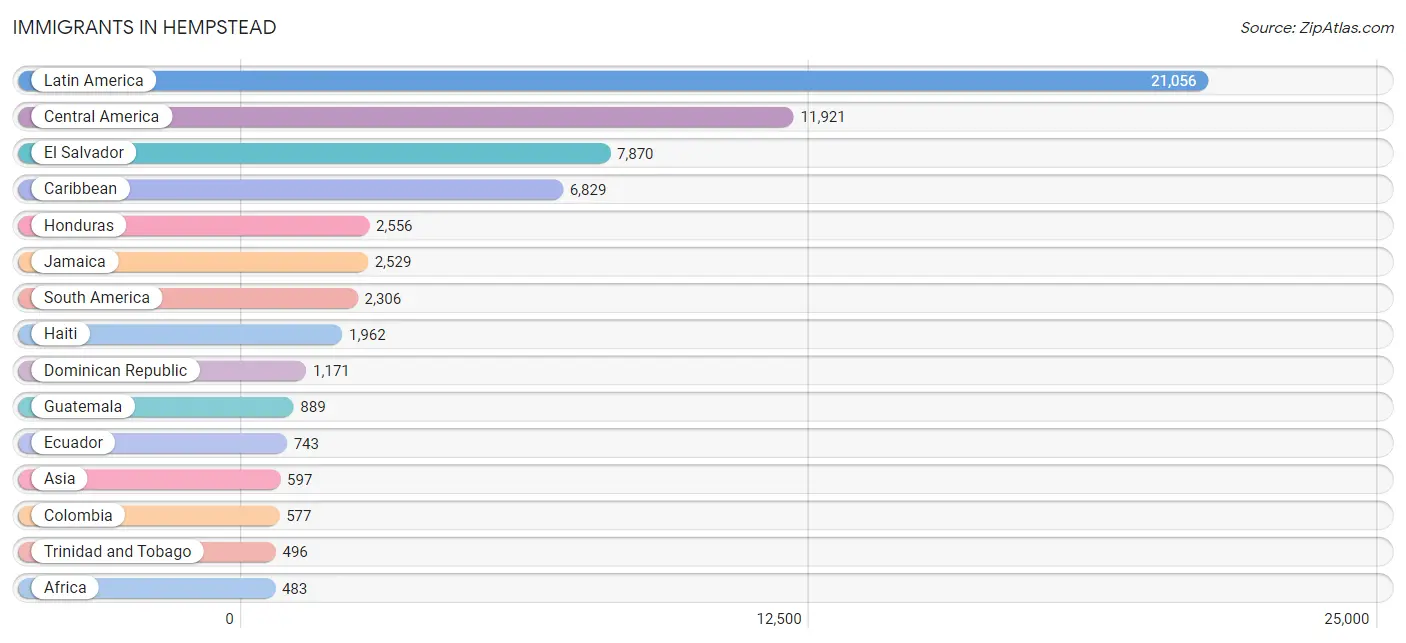
Immigrants in Hempstead
The most numerous immigrant groups reported in Hempstead came from Latin America (21,056 | 36.0%), Central America (11,921 | 20.4%), El Salvador (7,870 | 13.4%), Caribbean (6,829 | 11.7%), and Honduras (2,556 | 4.4%), together accounting for 85.8% of all Hempstead residents.
| Immigration Origin | # Population | % Population |
| Africa | 483 | 0.8% |
| Argentina | 55 | 0.1% |
| Asia | 597 | 1.0% |
| Bangladesh | 156 | 0.3% |
| Barbados | 277 | 0.5% |
| Belarus | 16 | 0.0% |
| Belgium | 11 | 0.0% |
| Belize | 7 | 0.0% |
| Bolivia | 30 | 0.1% |
| Brazil | 28 | 0.1% |
| Canada | 57 | 0.1% |
| Caribbean | 6,829 | 11.7% |
| Central America | 11,921 | 20.4% |
| China | 53 | 0.1% |
| Colombia | 577 | 1.0% |
| Costa Rica | 107 | 0.2% |
| Dominica | 170 | 0.3% |
| Dominican Republic | 1,171 | 2.0% |
| Eastern Asia | 81 | 0.1% |
| Eastern Europe | 148 | 0.3% |
| Ecuador | 743 | 1.3% |
| El Salvador | 7,870 | 13.4% |
| England | 19 | 0.0% |
| Europe | 307 | 0.5% |
| Germany | 9 | 0.0% |
| Ghana | 46 | 0.1% |
| Greece | 35 | 0.1% |
| Grenada | 26 | 0.0% |
| Guatemala | 889 | 1.5% |
| Guyana | 363 | 0.6% |
| Haiti | 1,962 | 3.4% |
| Honduras | 2,556 | 4.4% |
| Iran | 7 | 0.0% |
| Ireland | 23 | 0.0% |
| Israel | 65 | 0.1% |
| Italy | 29 | 0.1% |
| Jamaica | 2,529 | 4.3% |
| Japan | 22 | 0.0% |
| Korea | 6 | 0.0% |
| Latin America | 21,056 | 36.0% |
| Liberia | 37 | 0.1% |
| Mexico | 406 | 0.7% |
| Moldova | 11 | 0.0% |
| Nicaragua | 8 | 0.0% |
| Nigeria | 101 | 0.2% |
| Northern Europe | 58 | 0.1% |
| Oceania | 7 | 0.0% |
| Pakistan | 185 | 0.3% |
| Panama | 78 | 0.1% |
| Peru | 201 | 0.3% |
| Philippines | 96 | 0.2% |
| Poland | 110 | 0.2% |
| Romania | 11 | 0.0% |
| Scotland | 3 | 0.0% |
| Sierra Leone | 191 | 0.3% |
| South America | 2,306 | 3.9% |
| South Central Asia | 348 | 0.6% |
| South Eastern Asia | 103 | 0.2% |
| Southern Europe | 81 | 0.1% |
| Spain | 17 | 0.0% |
| St. Vincent and the Grenadines | 22 | 0.0% |
| Taiwan | 21 | 0.0% |
| Thailand | 7 | 0.0% |
| Trinidad and Tobago | 496 | 0.9% |
| Venezuela | 309 | 0.5% |
| West Indies | 37 | 0.1% |
| Western Africa | 375 | 0.6% |
| Western Asia | 65 | 0.1% |
| Western Europe | 20 | 0.0% | View All 69 Rows |
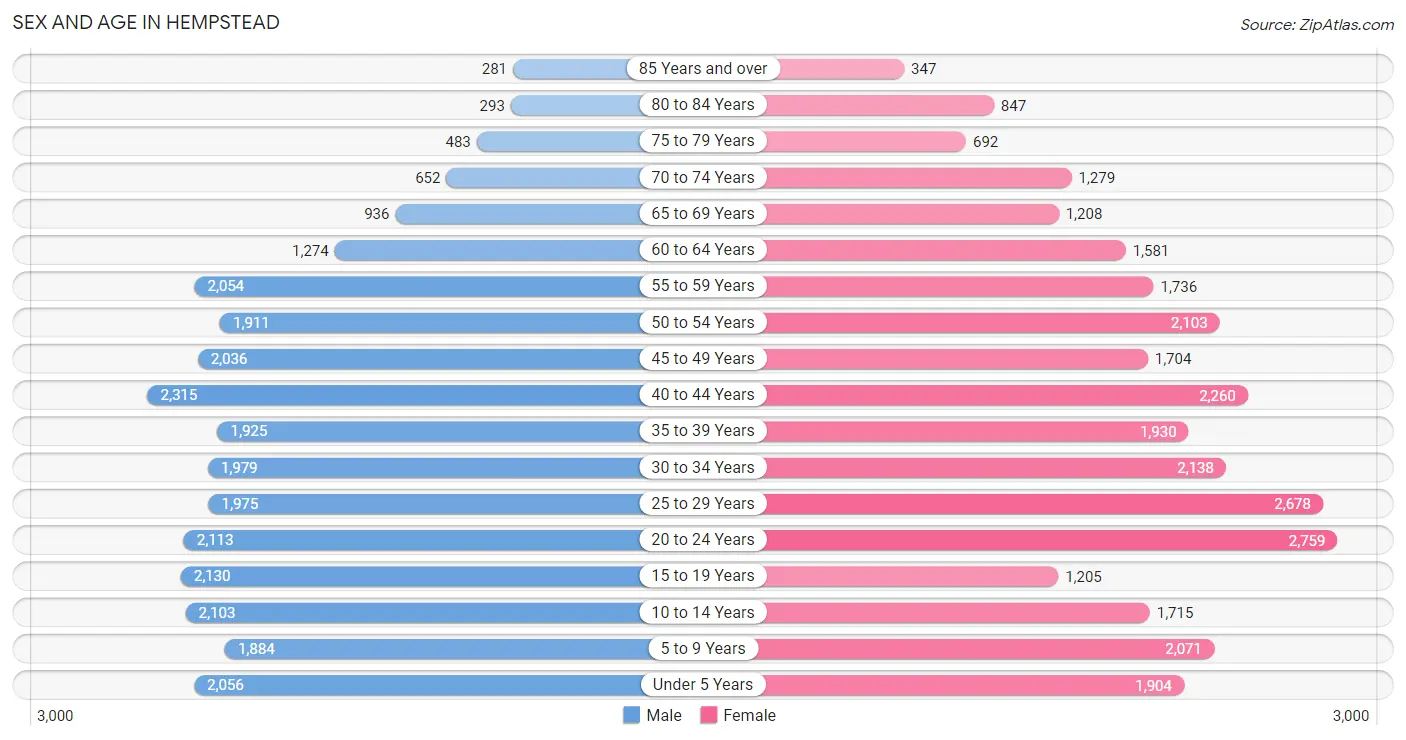
Sex and Age in Hempstead
Sex and Age in Hempstead
The most populous age groups in Hempstead are 40 to 44 Years (2,315 | 8.2%) for men and 20 to 24 Years (2,759 | 9.1%) for women.
| Age Bracket | Male | Female |
| Under 5 Years | 2,056 (7.2%) | 1,904 (6.3%) |
| 5 to 9 Years | 1,884 (6.6%) | 2,071 (6.9%) |
| 10 to 14 Years | 2,103 (7.4%) | 1,715 (5.7%) |
| 15 to 19 Years | 2,130 (7.5%) | 1,205 (4.0%) |
| 20 to 24 Years | 2,113 (7.4%) | 2,759 (9.1%) |
| 25 to 29 Years | 1,975 (7.0%) | 2,678 (8.9%) |
| 30 to 34 Years | 1,979 (7.0%) | 2,138 (7.1%) |
| 35 to 39 Years | 1,925 (6.8%) | 1,930 (6.4%) |
| 40 to 44 Years | 2,315 (8.2%) | 2,260 (7.5%) |
| 45 to 49 Years | 2,036 (7.2%) | 1,704 (5.7%) |
| 50 to 54 Years | 1,911 (6.7%) | 2,103 (7.0%) |
| 55 to 59 Years | 2,054 (7.2%) | 1,736 (5.8%) |
| 60 to 64 Years | 1,274 (4.5%) | 1,581 (5.2%) |
| 65 to 69 Years | 936 (3.3%) | 1,208 (4.0%) |
| 70 to 74 Years | 652 (2.3%) | 1,279 (4.2%) |
| 75 to 79 Years | 483 (1.7%) | 692 (2.3%) |
| 80 to 84 Years | 293 (1.0%) | 847 (2.8%) |
| 85 Years and over | 281 (1.0%) | 347 (1.1%) |
| Total | 28,400 (100.0%) | 30,157 (100.0%) |
Families and Households in Hempstead
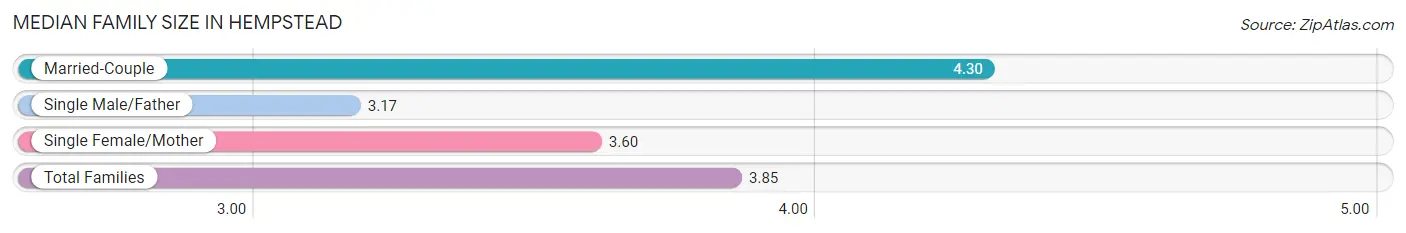
Median Family Size in Hempstead
The median family size in Hempstead is 3.85 persons per family, with married-couple families (5,384 | 42.8%) accounting for the largest median family size of 4.3 persons per family. On the other hand, single male/father families (1,554 | 12.4%) represent the smallest median family size with 3.17 persons per family.
| Family Type | # Families | Family Size |
| Married-Couple | 5,384 (42.8%) | 4.30 |
| Single Male/Father | 1,554 (12.4%) | 3.17 |
| Single Female/Mother | 5,627 (44.8%) | 3.60 |
| Total Families | 12,565 (100.0%) | 3.85 |
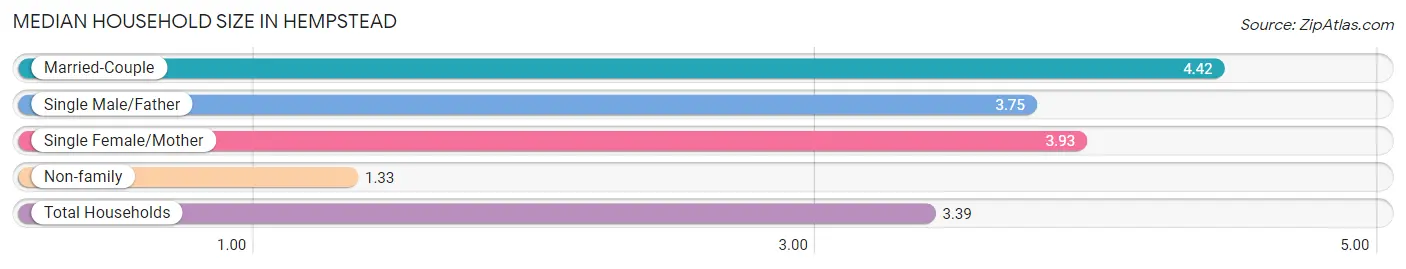
Median Household Size in Hempstead
The median household size in Hempstead is 3.39 persons per household, with married-couple households (5,384 | 31.6%) accounting for the largest median household size of 4.42 persons per household. non-family households (4,465 | 26.2%) represent the smallest median household size with 1.33 persons per household.
| Household Type | # Households | Household Size |
| Married-Couple | 5,384 (31.6%) | 4.42 |
| Single Male/Father | 1,554 (9.1%) | 3.75 |
| Single Female/Mother | 5,627 (33.0%) | 3.93 |
| Non-family | 4,465 (26.2%) | 1.33 |
| Total Households | 17,030 (100.0%) | 3.39 |
Household Size by Marriage Status in Hempstead
Out of a total of 17,030 households in Hempstead, 12,565 (73.8%) are family households, while 4,465 (26.2%) are nonfamily households. The most numerous type of family households are 4-person households, comprising 2,965, and the most common type of nonfamily households are 1-person households, comprising 3,725.
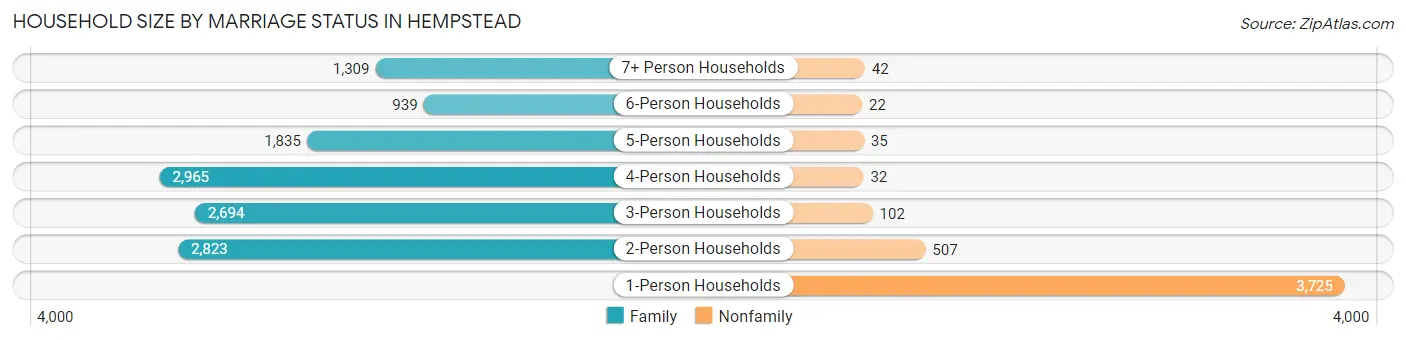
| Household Size | Family Households | Nonfamily Households |
| 1-Person Households | - | 3,725 (21.9%) |
| 2-Person Households | 2,823 (16.6%) | 507 (3.0%) |
| 3-Person Households | 2,694 (15.8%) | 102 (0.6%) |
| 4-Person Households | 2,965 (17.4%) | 32 (0.2%) |
| 5-Person Households | 1,835 (10.8%) | 35 (0.2%) |
| 6-Person Households | 939 (5.5%) | 22 (0.1%) |
| 7+ Person Households | 1,309 (7.7%) | 42 (0.3%) |
| Total | 12,565 (73.8%) | 4,465 (26.2%) |
Female Fertility in Hempstead
Fertility by Age in Hempstead
Average fertility rate in Hempstead is 38.0 births per 1,000 women. Women in the age bracket of 20 to 34 years have the highest fertility rate with 57.0 births per 1,000 women. Women in the age bracket of 20 to 34 years acount for 73.3% of all women with births.
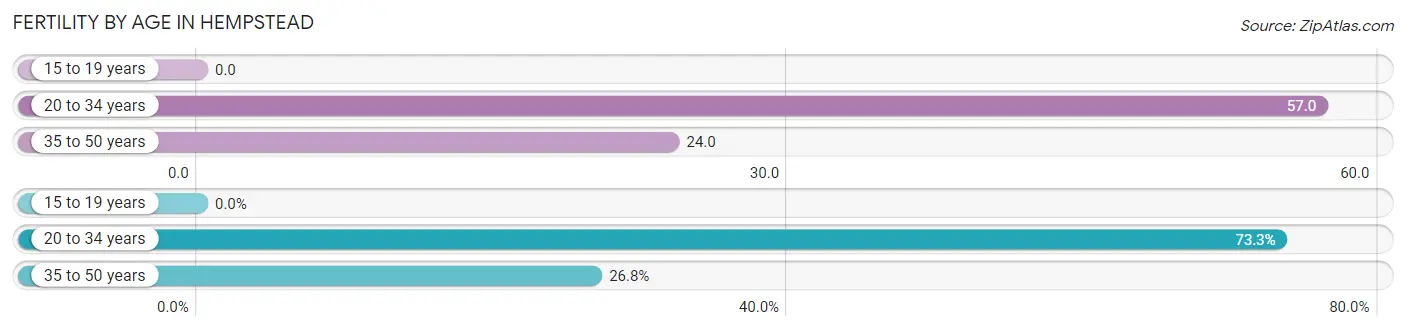
| Age Bracket | Women with Births | Births / 1,000 Women |
| 15 to 19 years | 0 (0.0%) | 0.0 |
| 20 to 34 years | 430 (73.3%) | 57.0 |
| 35 to 50 years | 157 (26.8%) | 24.0 |
| Total | 587 (100.0%) | 38.0 |
Fertility by Age by Marriage Status in Hempstead
42.9% of women with births (587) in Hempstead are married. The highest percentage of unmarried women with births falls into 20 to 34 years age bracket with 68.8% of them unmarried at the time of birth, while the lowest percentage of unmarried women with births belong to 35 to 50 years age bracket with 24.8% of them unmarried.
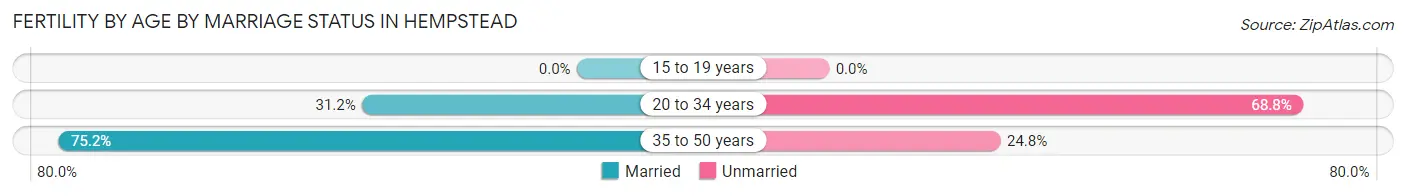
| Age Bracket | Married | Unmarried |
| 15 to 19 years | 0 (0.0%) | 0 (0.0%) |
| 20 to 34 years | 134 (31.2%) | 296 (68.8%) |
| 35 to 50 years | 118 (75.2%) | 39 (24.8%) |
| Total | 252 (42.9%) | 335 (57.1%) |
Fertility by Education in Hempstead
Average fertility rate in Hempstead is 38.0 births per 1,000 women. Women with the education attainment of high school diploma have the highest fertility rate of 50.0 births per 1,000 women, while women with the education attainment of bachelor's degree have the lowest fertility at 5.0 births per 1,000 women. Women with the education attainment of high school diploma represent 36.3% of all women with births.
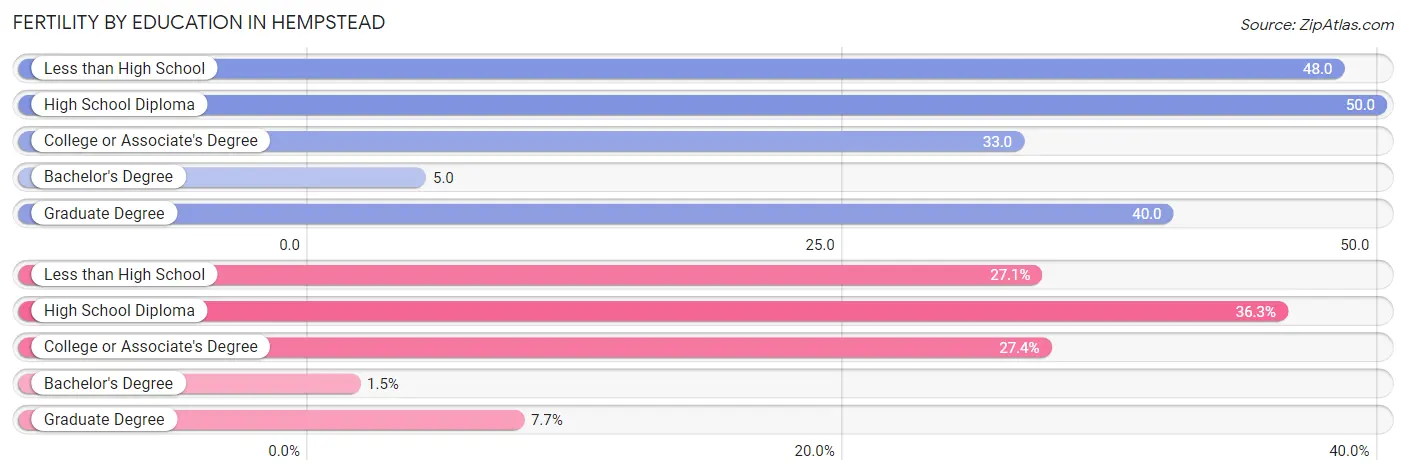
| Educational Attainment | Women with Births | Births / 1,000 Women |
| Less than High School | 159 (27.1%) | 48.0 |
| High School Diploma | 213 (36.3%) | 50.0 |
| College or Associate's Degree | 161 (27.4%) | 33.0 |
| Bachelor's Degree | 9 (1.5%) | 5.0 |
| Graduate Degree | 45 (7.7%) | 40.0 |
| Total | 587 (100.0%) | 38.0 |
Fertility by Education by Marriage Status in Hempstead
57.1% of women with births in Hempstead are unmarried. Women with the educational attainment of bachelor's degree are most likely to be married with 100.0% of them married at childbirth, while women with the educational attainment of high school diploma are least likely to be married with 92.5% of them unmarried at childbirth.
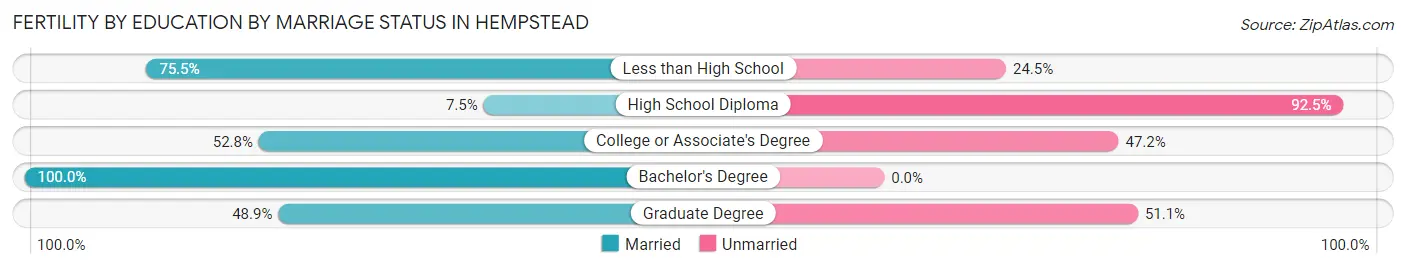
| Educational Attainment | Married | Unmarried |
| Less than High School | 120 (75.5%) | 39 (24.5%) |
| High School Diploma | 16 (7.5%) | 197 (92.5%) |
| College or Associate's Degree | 85 (52.8%) | 76 (47.2%) |
| Bachelor's Degree | 9 (100.0%) | 0 (0.0%) |
| Graduate Degree | 22 (48.9%) | 23 (51.1%) |
| Total | 252 (42.9%) | 335 (57.1%) |
Employment Characteristics in Hempstead
Employment by Class of Employer in Hempstead
Among the 27,882 employed individuals in Hempstead, private company employees (19,487 | 69.9%), not-for-profit organizations (2,428 | 8.7%), and local government employees (2,383 | 8.6%) make up the most common classes of employment.
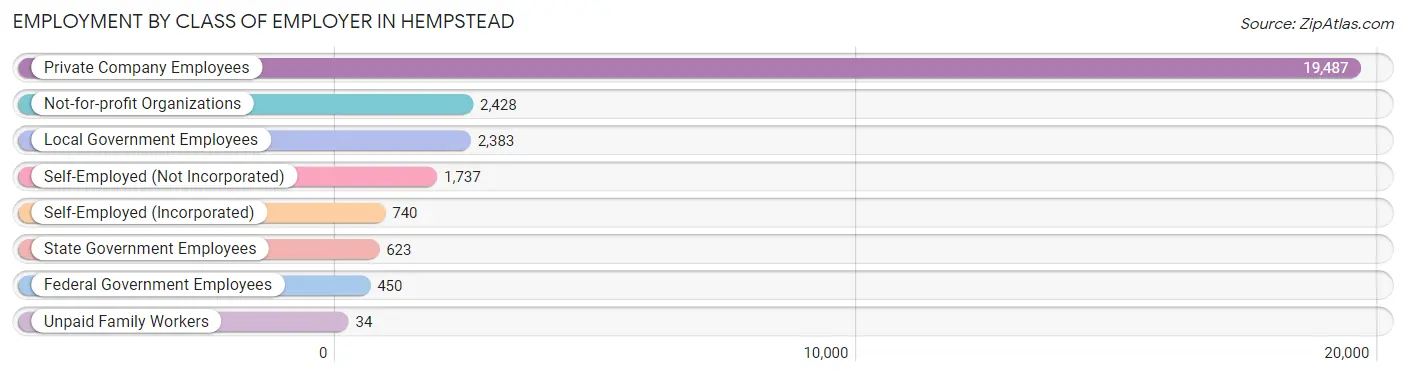
| Employer Class | # Employees | % Employees |
| Private Company Employees | 19,487 | 69.9% |
| Self-Employed (Incorporated) | 740 | 2.6% |
| Self-Employed (Not Incorporated) | 1,737 | 6.2% |
| Not-for-profit Organizations | 2,428 | 8.7% |
| Local Government Employees | 2,383 | 8.6% |
| State Government Employees | 623 | 2.2% |
| Federal Government Employees | 450 | 1.6% |
| Unpaid Family Workers | 34 | 0.1% |
| Total | 27,882 | 100.0% |
Employment Status by Age in Hempstead
According to the labor force statistics for Hempstead, out of the total population over 16 years of age (45,817), 67.8% or 31,064 individuals are in the labor force, with 8.4% or 2,609 of them unemployed. The age group with the highest labor force participation rate is 25 to 29 years, with 84.8% or 3,946 individuals in the labor force. Within the labor force, the 20 to 24 years age range has the highest percentage of unemployed individuals, with 19.7% or 799 of them being unemployed.
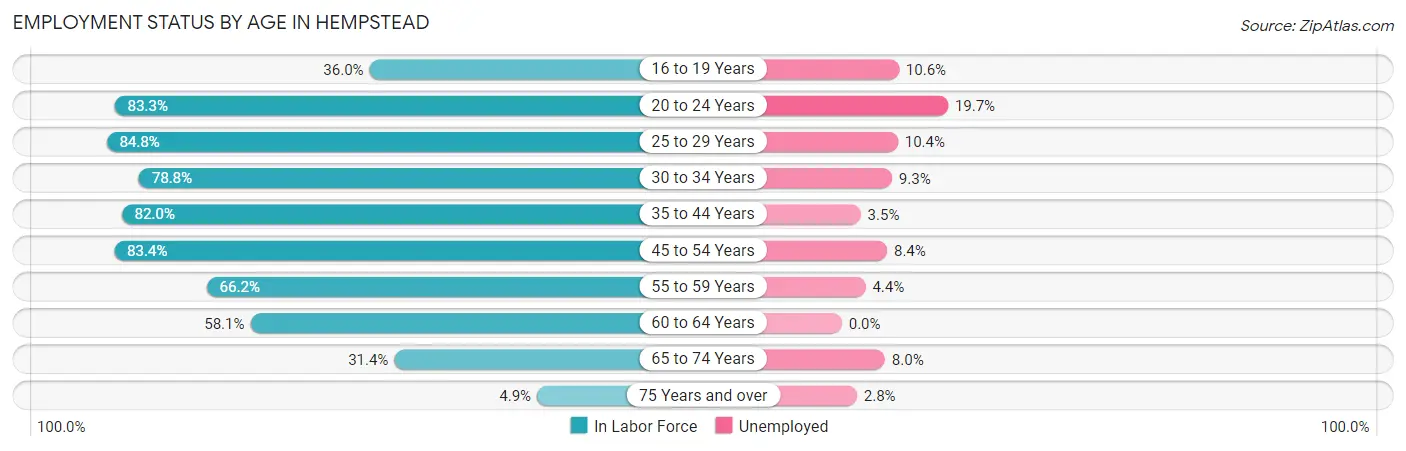
| Age Bracket | In Labor Force | Unemployed |
| 16 to 19 Years | 838 (36.0%) | 89 (10.6%) |
| 20 to 24 Years | 4,058 (83.3%) | 799 (19.7%) |
| 25 to 29 Years | 3,946 (84.8%) | 410 (10.4%) |
| 30 to 34 Years | 3,244 (78.8%) | 302 (9.3%) |
| 35 to 44 Years | 6,913 (82.0%) | 242 (3.5%) |
| 45 to 54 Years | 6,467 (83.4%) | 543 (8.4%) |
| 55 to 59 Years | 2,509 (66.2%) | 110 (4.4%) |
| 60 to 64 Years | 1,659 (58.1%) | 0 (0.0%) |
| 65 to 74 Years | 1,280 (31.4%) | 102 (8.0%) |
| 75 Years and over | 144 (4.9%) | 4 (2.8%) |
| Total | 31,064 (67.8%) | 2,609 (8.4%) |
Employment Status by Educational Attainment in Hempstead
According to labor force statistics for Hempstead, 78.3% of individuals (24,742) out of the total population between 25 and 64 years of age (31,599) are in the labor force, with 6.5% or 1,608 of them being unemployed. The group with the highest labor force participation rate are those with the educational attainment of bachelor's degree or higher, with 86.5% or 4,828 individuals in the labor force. Within the labor force, individuals with high school diploma education have the highest percentage of unemployment, with 8.4% or 665 of them being unemployed.
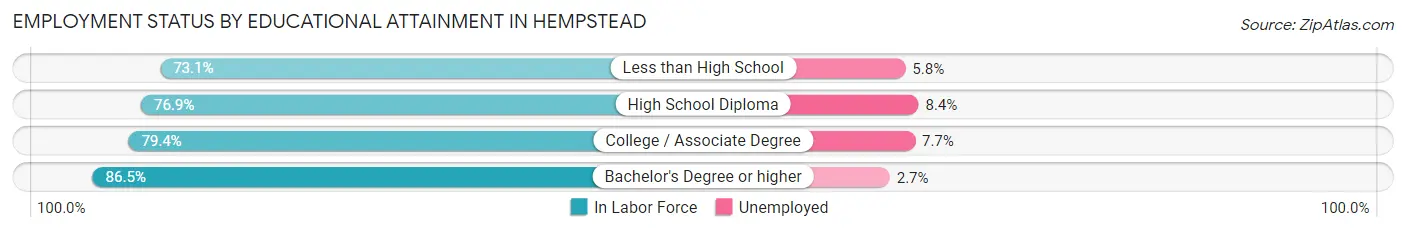
| Educational Attainment | In Labor Force | Unemployed |
| Less than High School | 5,599 (73.1%) | 444 (5.8%) |
| High School Diploma | 7,918 (76.9%) | 865 (8.4%) |
| College / Associate Degree | 6,400 (79.4%) | 621 (7.7%) |
| Bachelor's Degree or higher | 4,828 (86.5%) | 151 (2.7%) |
| Total | 24,742 (78.3%) | 2,054 (6.5%) |
Employment Occupations by Sex in Hempstead
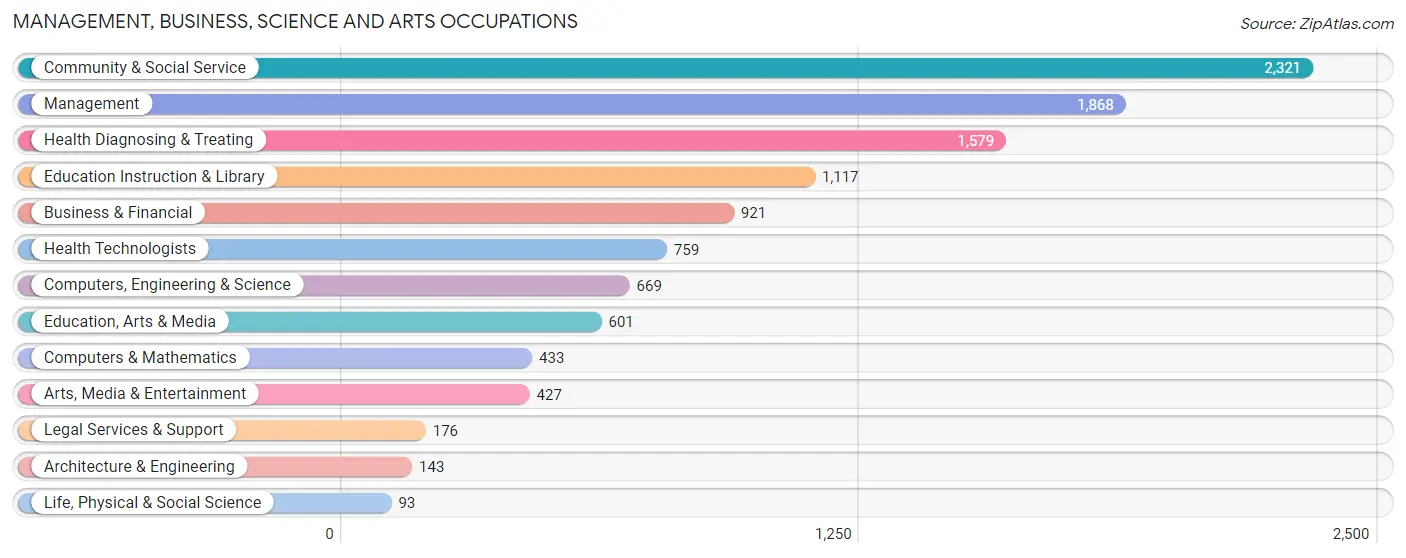
Management, Business, Science and Arts Occupations
The most common Management, Business, Science and Arts occupations in Hempstead are Community & Social Service (2,321 | 8.2%), Management (1,868 | 6.6%), Health Diagnosing & Treating (1,579 | 5.6%), Education Instruction & Library (1,117 | 3.9%), and Business & Financial (921 | 3.2%).
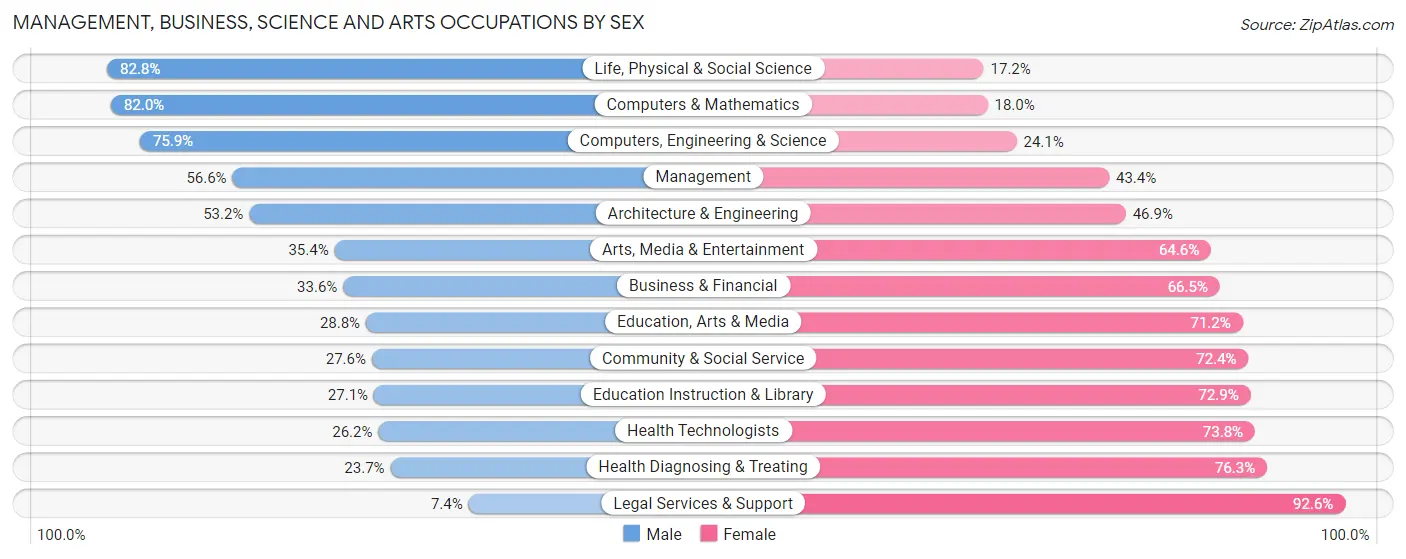
Management, Business, Science and Arts Occupations by Sex
Within the Management, Business, Science and Arts occupations in Hempstead, the most male-oriented occupations are Life, Physical & Social Science (82.8%), Computers & Mathematics (82.0%), and Computers, Engineering & Science (75.9%), while the most female-oriented occupations are Legal Services & Support (92.6%), Health Diagnosing & Treating (76.3%), and Health Technologists (73.8%).
| Occupation | Male | Female |
| Management | 1,058 (56.6%) | 810 (43.4%) |
| Business & Financial | 309 (33.6%) | 612 (66.4%) |
| Computers, Engineering & Science | 508 (75.9%) | 161 (24.1%) |
| Computers & Mathematics | 355 (82.0%) | 78 (18.0%) |
| Architecture & Engineering | 76 (53.1%) | 67 (46.9%) |
| Life, Physical & Social Science | 77 (82.8%) | 16 (17.2%) |
| Community & Social Service | 640 (27.6%) | 1,681 (72.4%) |
| Education, Arts & Media | 173 (28.8%) | 428 (71.2%) |
| Legal Services & Support | 13 (7.4%) | 163 (92.6%) |
| Education Instruction & Library | 303 (27.1%) | 814 (72.9%) |
| Arts, Media & Entertainment | 151 (35.4%) | 276 (64.6%) |
| Health Diagnosing & Treating | 374 (23.7%) | 1,205 (76.3%) |
| Health Technologists | 199 (26.2%) | 560 (73.8%) |
| Total (Category) | 2,889 (39.3%) | 4,469 (60.7%) |
| Total (Overall) | 14,682 (51.7%) | 13,716 (48.3%) |
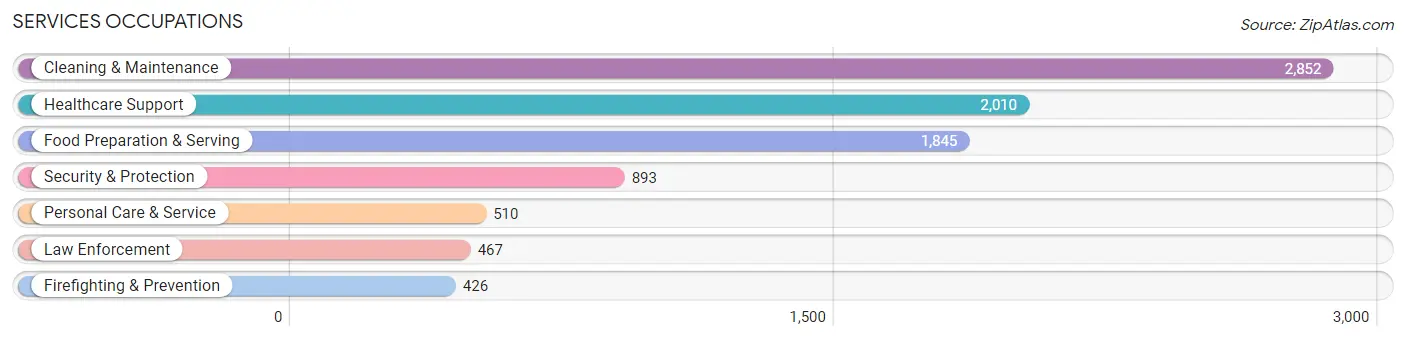
Services Occupations
The most common Services occupations in Hempstead are Cleaning & Maintenance (2,852 | 10.0%), Healthcare Support (2,010 | 7.1%), Food Preparation & Serving (1,845 | 6.5%), Security & Protection (893 | 3.1%), and Personal Care & Service (510 | 1.8%).
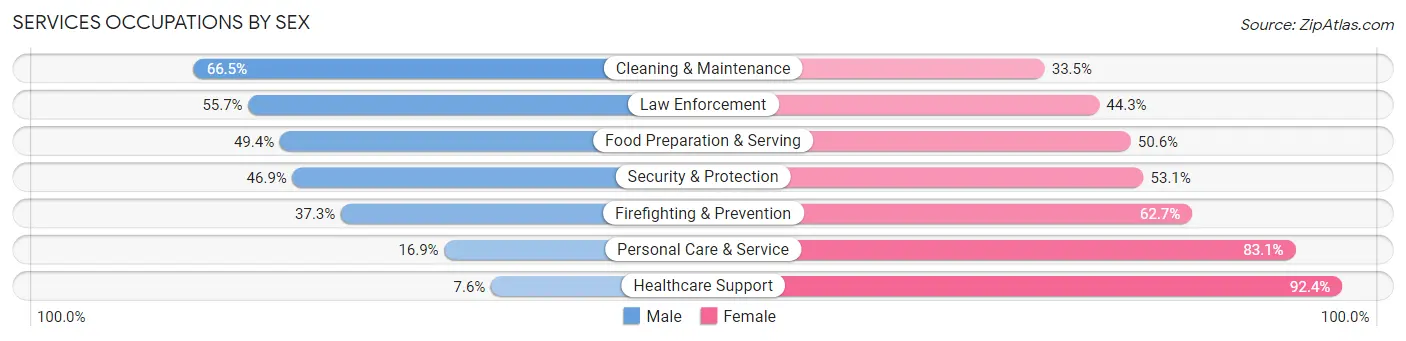
Services Occupations by Sex
Within the Services occupations in Hempstead, the most male-oriented occupations are Cleaning & Maintenance (66.5%), Law Enforcement (55.7%), and Food Preparation & Serving (49.4%), while the most female-oriented occupations are Healthcare Support (92.4%), Personal Care & Service (83.1%), and Firefighting & Prevention (62.7%).
| Occupation | Male | Female |
| Healthcare Support | 153 (7.6%) | 1,857 (92.4%) |
| Security & Protection | 419 (46.9%) | 474 (53.1%) |
| Firefighting & Prevention | 159 (37.3%) | 267 (62.7%) |
| Law Enforcement | 260 (55.7%) | 207 (44.3%) |
| Food Preparation & Serving | 912 (49.4%) | 933 (50.6%) |
| Cleaning & Maintenance | 1,896 (66.5%) | 956 (33.5%) |
| Personal Care & Service | 86 (16.9%) | 424 (83.1%) |
| Total (Category) | 3,466 (42.7%) | 4,644 (57.3%) |
| Total (Overall) | 14,682 (51.7%) | 13,716 (48.3%) |
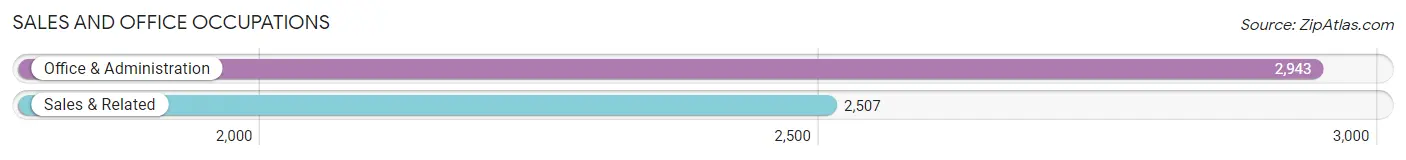
Sales and Office Occupations
The most common Sales and Office occupations in Hempstead are Office & Administration (2,943 | 10.4%), and Sales & Related (2,507 | 8.8%).
Sales and Office Occupations by Sex
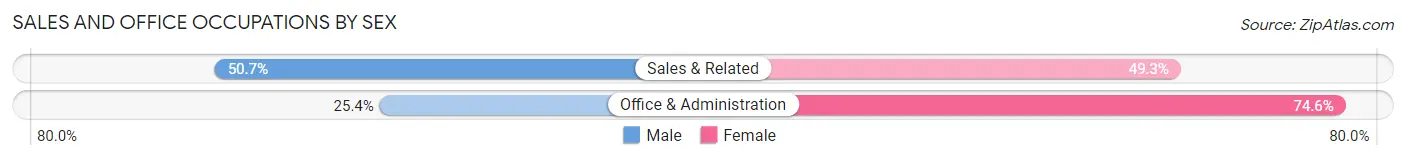
| Occupation | Male | Female |
| Sales & Related | 1,272 (50.7%) | 1,235 (49.3%) |
| Office & Administration | 747 (25.4%) | 2,196 (74.6%) |
| Total (Category) | 2,019 (37.0%) | 3,431 (62.9%) |
| Total (Overall) | 14,682 (51.7%) | 13,716 (48.3%) |
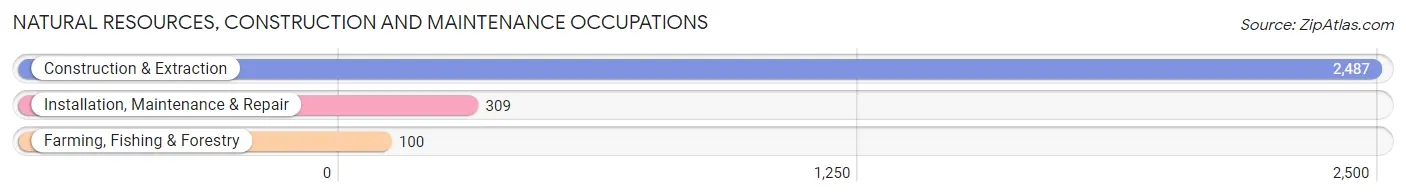
Natural Resources, Construction and Maintenance Occupations
The most common Natural Resources, Construction and Maintenance occupations in Hempstead are Construction & Extraction (2,487 | 8.8%), Installation, Maintenance & Repair (309 | 1.1%), and Farming, Fishing & Forestry (100 | 0.4%).
Natural Resources, Construction and Maintenance Occupations by Sex
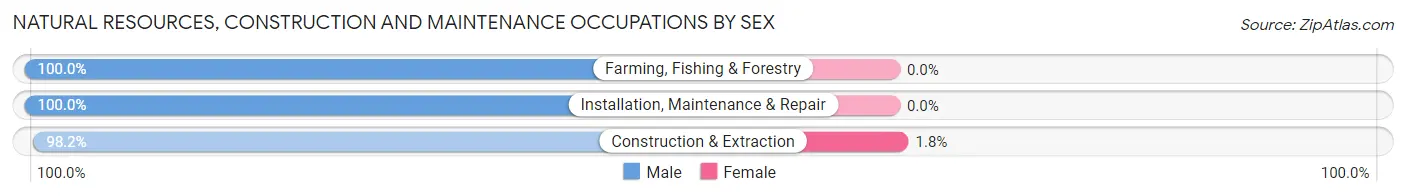
| Occupation | Male | Female |
| Farming, Fishing & Forestry | 100 (100.0%) | 0 (0.0%) |
| Construction & Extraction | 2,442 (98.2%) | 45 (1.8%) |
| Installation, Maintenance & Repair | 309 (100.0%) | 0 (0.0%) |
| Total (Category) | 2,851 (98.5%) | 45 (1.5%) |
| Total (Overall) | 14,682 (51.7%) | 13,716 (48.3%) |
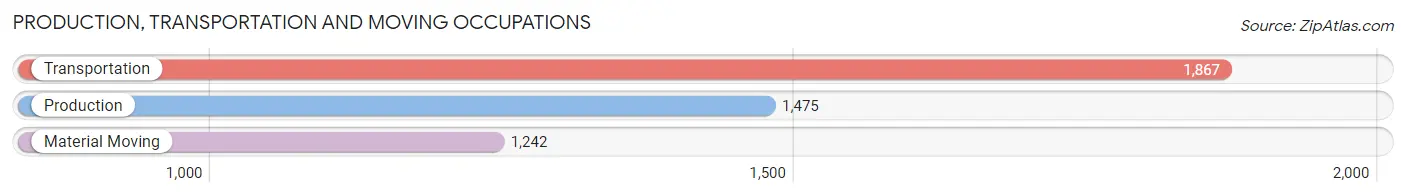
Production, Transportation and Moving Occupations
The most common Production, Transportation and Moving occupations in Hempstead are Transportation (1,867 | 6.6%), Production (1,475 | 5.2%), and Material Moving (1,242 | 4.4%).
Production, Transportation and Moving Occupations by Sex
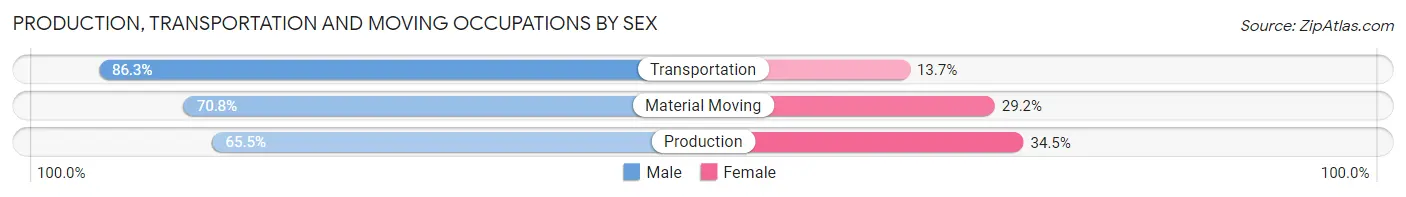
| Occupation | Male | Female |
| Production | 966 (65.5%) | 509 (34.5%) |
| Transportation | 1,612 (86.3%) | 255 (13.7%) |
| Material Moving | 879 (70.8%) | 363 (29.2%) |
| Total (Category) | 3,457 (75.4%) | 1,127 (24.6%) |
| Total (Overall) | 14,682 (51.7%) | 13,716 (48.3%) |
Employment Industries by Sex in Hempstead
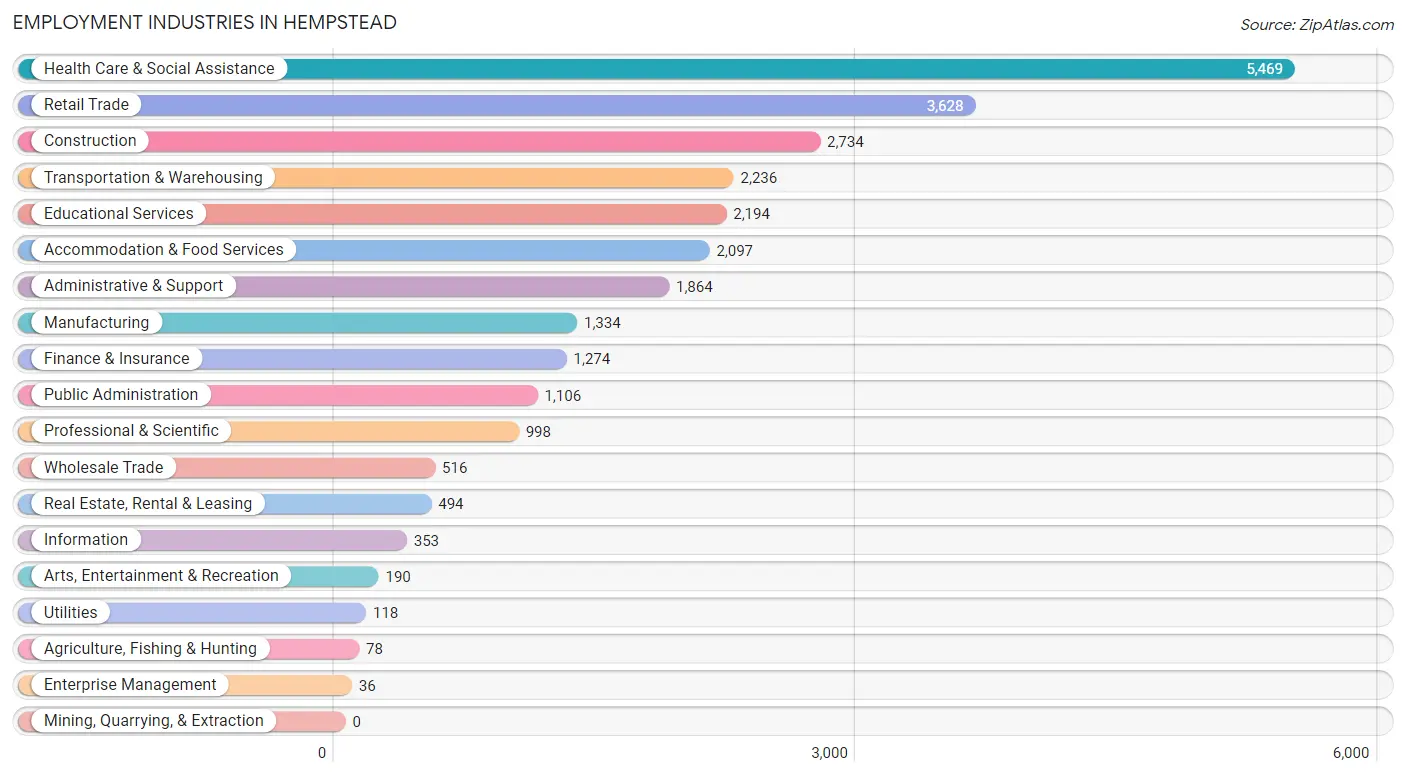
Employment Industries in Hempstead
The major employment industries in Hempstead include Health Care & Social Assistance (5,469 | 19.3%), Retail Trade (3,628 | 12.8%), Construction (2,734 | 9.6%), Transportation & Warehousing (2,236 | 7.9%), and Educational Services (2,194 | 7.7%).
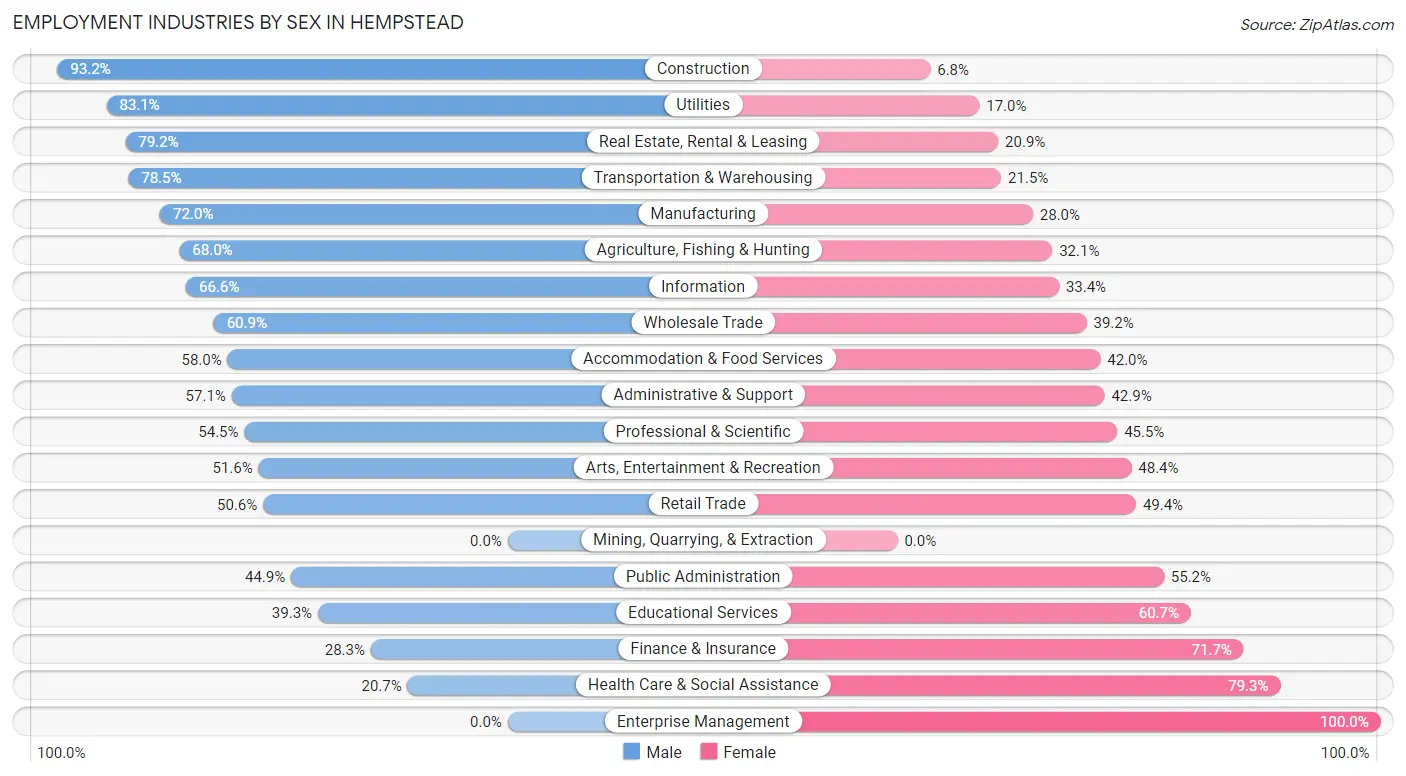
Employment Industries by Sex in Hempstead
The Hempstead industries that see more men than women are Construction (93.2%), Utilities (83.1%), and Real Estate, Rental & Leasing (79.1%), whereas the industries that tend to have a higher number of women are Enterprise Management (100.0%), Health Care & Social Assistance (79.3%), and Finance & Insurance (71.7%).
| Industry | Male | Female |
| Agriculture, Fishing & Hunting | 53 (67.9%) | 25 (32.1%) |
| Mining, Quarrying, & Extraction | 0 (0.0%) | 0 (0.0%) |
| Construction | 2,548 (93.2%) | 186 (6.8%) |
| Manufacturing | 960 (72.0%) | 374 (28.0%) |
| Wholesale Trade | 314 (60.9%) | 202 (39.2%) |
| Retail Trade | 1,837 (50.6%) | 1,791 (49.4%) |
| Transportation & Warehousing | 1,756 (78.5%) | 480 (21.5%) |
| Utilities | 98 (83.1%) | 20 (17.0%) |
| Information | 235 (66.6%) | 118 (33.4%) |
| Finance & Insurance | 361 (28.3%) | 913 (71.7%) |
| Real Estate, Rental & Leasing | 391 (79.1%) | 103 (20.8%) |
| Professional & Scientific | 544 (54.5%) | 454 (45.5%) |
| Enterprise Management | 0 (0.0%) | 36 (100.0%) |
| Administrative & Support | 1,065 (57.1%) | 799 (42.9%) |
| Educational Services | 862 (39.3%) | 1,332 (60.7%) |
| Health Care & Social Assistance | 1,134 (20.7%) | 4,335 (79.3%) |
| Arts, Entertainment & Recreation | 98 (51.6%) | 92 (48.4%) |
| Accommodation & Food Services | 1,216 (58.0%) | 881 (42.0%) |
| Public Administration | 496 (44.9%) | 610 (55.1%) |
| Total | 14,682 (51.7%) | 13,716 (48.3%) |
Education in Hempstead
School Enrollment in Hempstead
The most common levels of schooling among the 14,163 students in Hempstead are elementary school (3,304 | 23.3%), college / undergraduate (3,253 | 23.0%), and high school (2,878 | 20.3%).
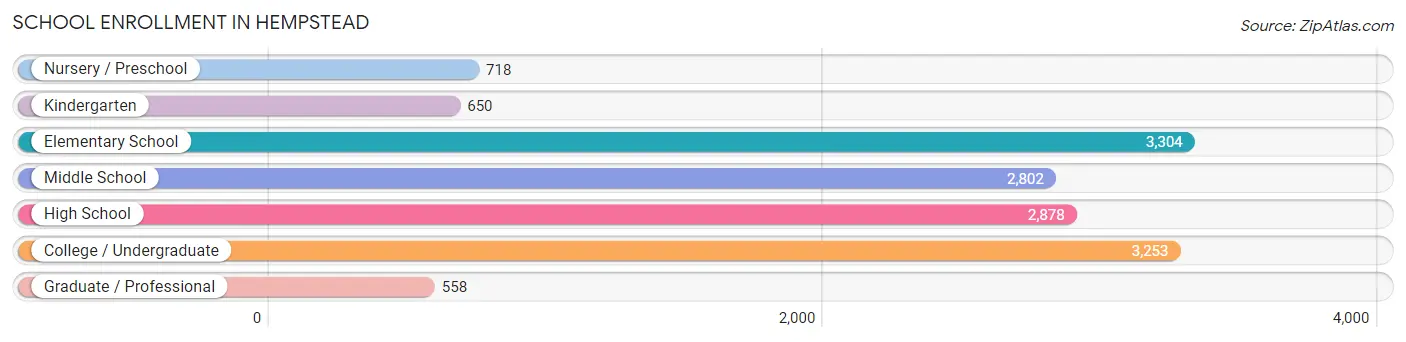
| School Level | # Students | % Students |
| Nursery / Preschool | 718 | 5.1% |
| Kindergarten | 650 | 4.6% |
| Elementary School | 3,304 | 23.3% |
| Middle School | 2,802 | 19.8% |
| High School | 2,878 | 20.3% |
| College / Undergraduate | 3,253 | 23.0% |
| Graduate / Professional | 558 | 3.9% |
| Total | 14,163 | 100.0% |
School Enrollment by Age by Funding Source in Hempstead
Out of a total of 14,163 students who are enrolled in schools in Hempstead, 2,124 (15.0%) attend a private institution, while the remaining 12,039 (85.0%) are enrolled in public schools. The age group of 35 years and over has the highest likelihood of being enrolled in private schools, with 298 (41.1% in the age bracket) enrolled. Conversely, the age group of 5 to 9 year old has the lowest likelihood of being enrolled in a private school, with 3,474 (93.4% in the age bracket) attending a public institution.
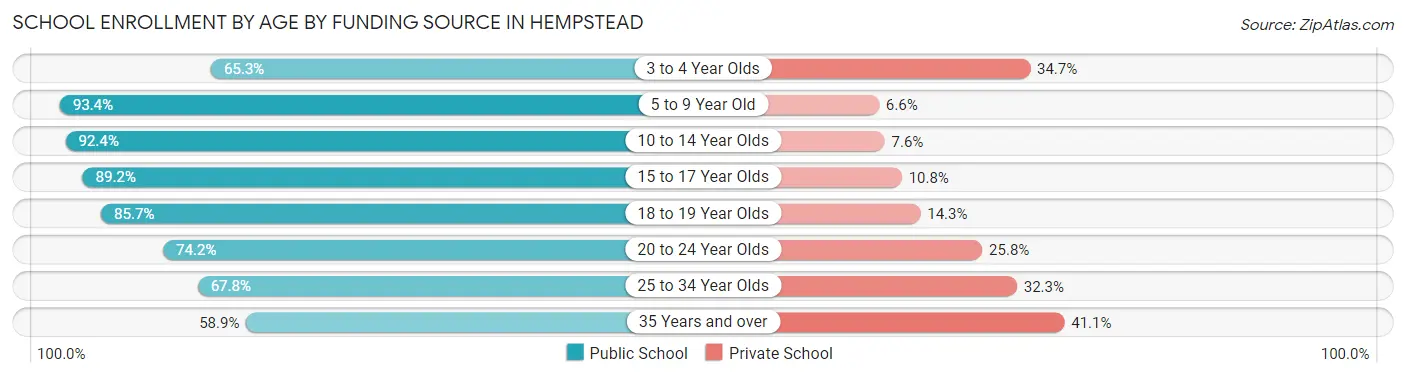
| Age Bracket | Public School | Private School |
| 3 to 4 Year Olds | 487 (65.3%) | 259 (34.7%) |
| 5 to 9 Year Old | 3,474 (93.4%) | 244 (6.6%) |
| 10 to 14 Year Olds | 3,406 (92.4%) | 281 (7.6%) |
| 15 to 17 Year Olds | 1,650 (89.2%) | 200 (10.8%) |
| 18 to 19 Year Olds | 703 (85.7%) | 117 (14.3%) |
| 20 to 24 Year Olds | 1,392 (74.2%) | 484 (25.8%) |
| 25 to 34 Year Olds | 502 (67.7%) | 239 (32.3%) |
| 35 Years and over | 427 (58.9%) | 298 (41.1%) |
| Total | 12,039 (85.0%) | 2,124 (15.0%) |
Educational Attainment by Field of Study in Hempstead
Business (1,916 | 27.1%), science & technology (1,071 | 15.1%), education (537 | 7.6%), social sciences (512 | 7.2%), and arts & humanities (486 | 6.9%) are the most common fields of study among 7,073 individuals in Hempstead who have obtained a bachelor's degree or higher.
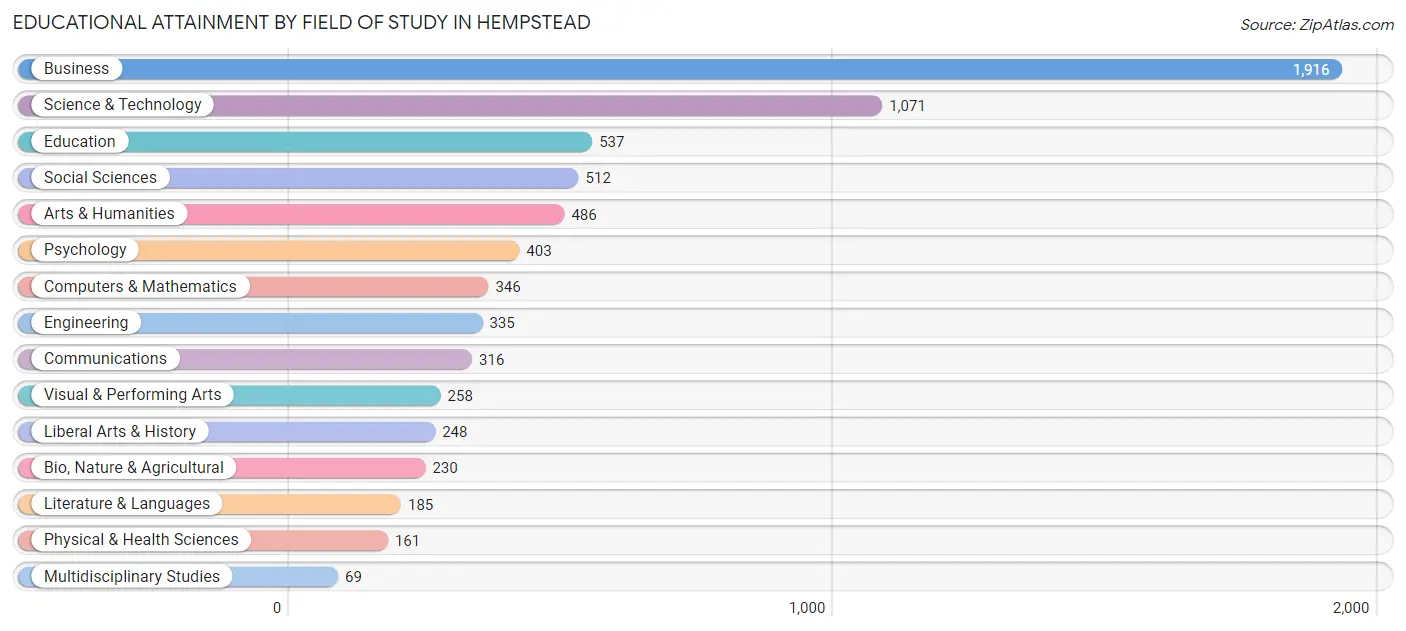
| Field of Study | # Graduates | % Graduates |
| Computers & Mathematics | 346 | 4.9% |
| Bio, Nature & Agricultural | 230 | 3.3% |
| Physical & Health Sciences | 161 | 2.3% |
| Psychology | 403 | 5.7% |
| Social Sciences | 512 | 7.2% |
| Engineering | 335 | 4.7% |
| Multidisciplinary Studies | 69 | 1.0% |
| Science & Technology | 1,071 | 15.1% |
| Business | 1,916 | 27.1% |
| Education | 537 | 7.6% |
| Literature & Languages | 185 | 2.6% |
| Liberal Arts & History | 248 | 3.5% |
| Visual & Performing Arts | 258 | 3.6% |
| Communications | 316 | 4.5% |
| Arts & Humanities | 486 | 6.9% |
| Total | 7,073 | 100.0% |
Transportation & Commute in Hempstead
Vehicle Availability by Sex in Hempstead
The most prevalent vehicle ownership categories in Hempstead are males with 2 vehicles (4,394, accounting for 30.6%) and females with 2 vehicles (4,354, making up 32.6%).
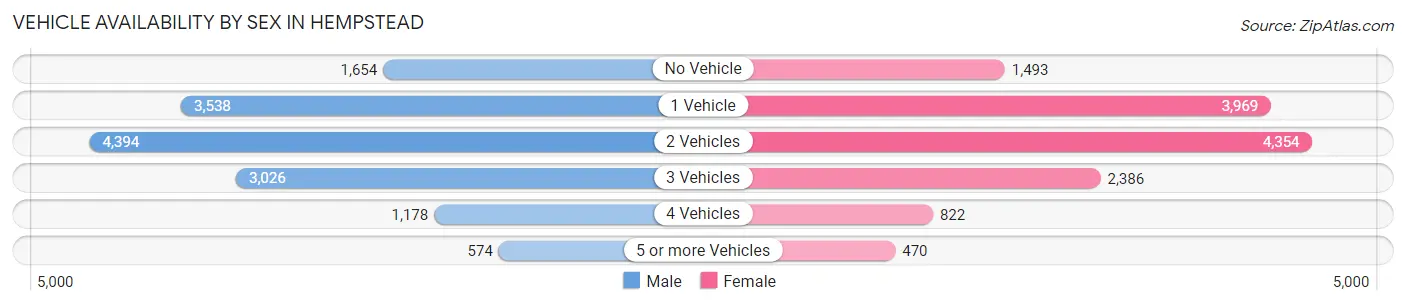
| Vehicles Available | Male | Female |
| No Vehicle | 1,654 (11.5%) | 1,493 (11.1%) |
| 1 Vehicle | 3,538 (24.6%) | 3,969 (29.4%) |
| 2 Vehicles | 4,394 (30.6%) | 4,354 (32.3%) |
| 3 Vehicles | 3,026 (21.1%) | 2,386 (17.7%) |
| 4 Vehicles | 1,178 (8.2%) | 822 (6.1%) |
| 5 or more Vehicles | 574 (4.0%) | 470 (3.5%) |
| Total | 14,364 (100.0%) | 13,494 (100.0%) |
Commute Time in Hempstead
The most frequently occuring commute durations in Hempstead are 30 to 34 minutes (6,252 commuters, 23.9%), 20 to 24 minutes (3,675 commuters, 14.0%), and 15 to 19 minutes (3,637 commuters, 13.9%).
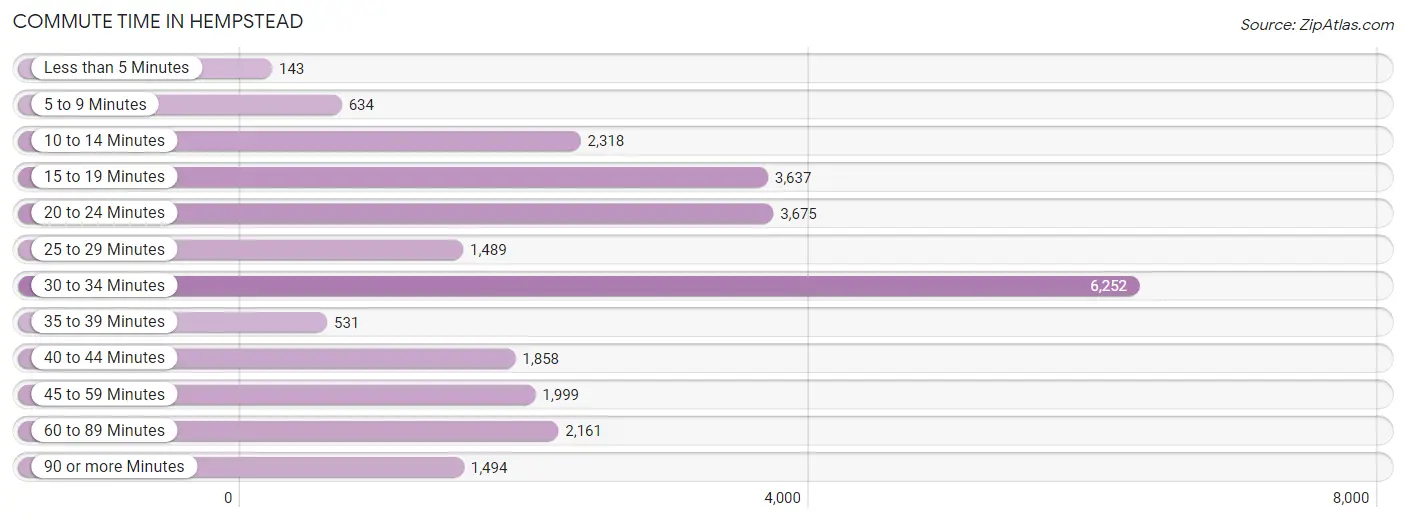
| Commute Time | # Commuters | % Commuters |
| Less than 5 Minutes | 143 | 0.5% |
| 5 to 9 Minutes | 634 | 2.4% |
| 10 to 14 Minutes | 2,318 | 8.8% |
| 15 to 19 Minutes | 3,637 | 13.9% |
| 20 to 24 Minutes | 3,675 | 14.0% |
| 25 to 29 Minutes | 1,489 | 5.7% |
| 30 to 34 Minutes | 6,252 | 23.9% |
| 35 to 39 Minutes | 531 | 2.0% |
| 40 to 44 Minutes | 1,858 | 7.1% |
| 45 to 59 Minutes | 1,999 | 7.6% |
| 60 to 89 Minutes | 2,161 | 8.3% |
| 90 or more Minutes | 1,494 | 5.7% |
Commute Time by Sex in Hempstead
The most common commute times in Hempstead are 30 to 34 minutes (3,324 commuters, 24.3%) for males and 30 to 34 minutes (2,928 commuters, 23.4%) for females.
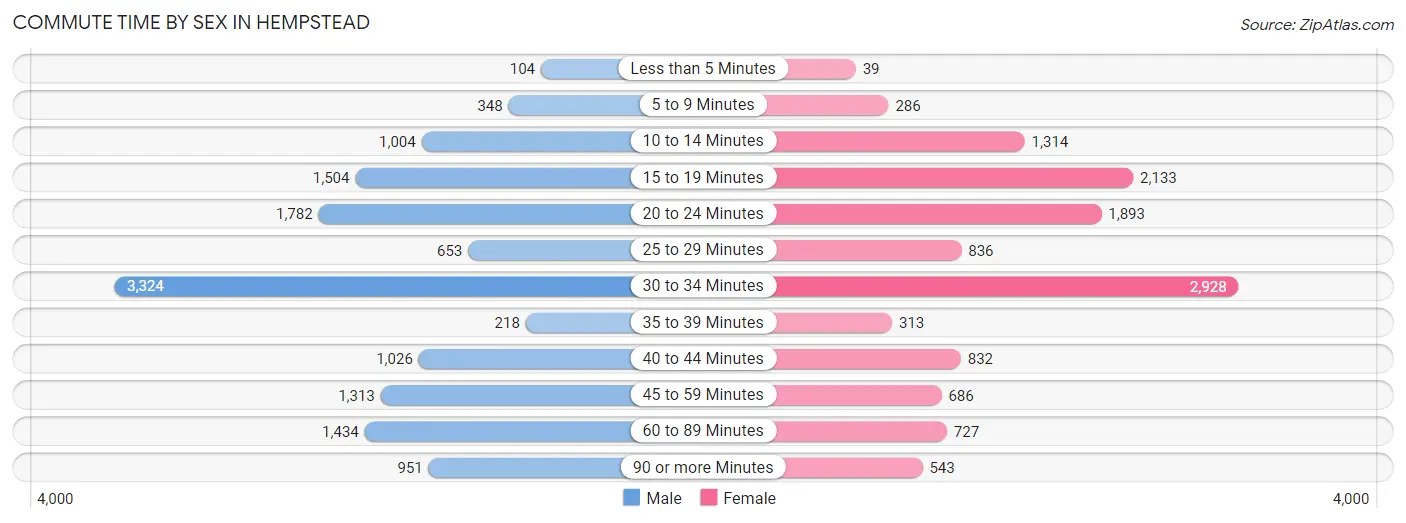
| Commute Time | Male | Female |
| Less than 5 Minutes | 104 (0.8%) | 39 (0.3%) |
| 5 to 9 Minutes | 348 (2.5%) | 286 (2.3%) |
| 10 to 14 Minutes | 1,004 (7.3%) | 1,314 (10.5%) |
| 15 to 19 Minutes | 1,504 (11.0%) | 2,133 (17.0%) |
| 20 to 24 Minutes | 1,782 (13.0%) | 1,893 (15.1%) |
| 25 to 29 Minutes | 653 (4.8%) | 836 (6.7%) |
| 30 to 34 Minutes | 3,324 (24.3%) | 2,928 (23.4%) |
| 35 to 39 Minutes | 218 (1.6%) | 313 (2.5%) |
| 40 to 44 Minutes | 1,026 (7.5%) | 832 (6.6%) |
| 45 to 59 Minutes | 1,313 (9.6%) | 686 (5.5%) |
| 60 to 89 Minutes | 1,434 (10.5%) | 727 (5.8%) |
| 90 or more Minutes | 951 (7.0%) | 543 (4.3%) |
Time of Departure to Work by Sex in Hempstead
The most frequent times of departure to work in Hempstead are 7:00 AM to 7:29 AM (3,542, 25.9%) for males and 8:00 AM to 8:29 AM (2,765, 22.1%) for females.
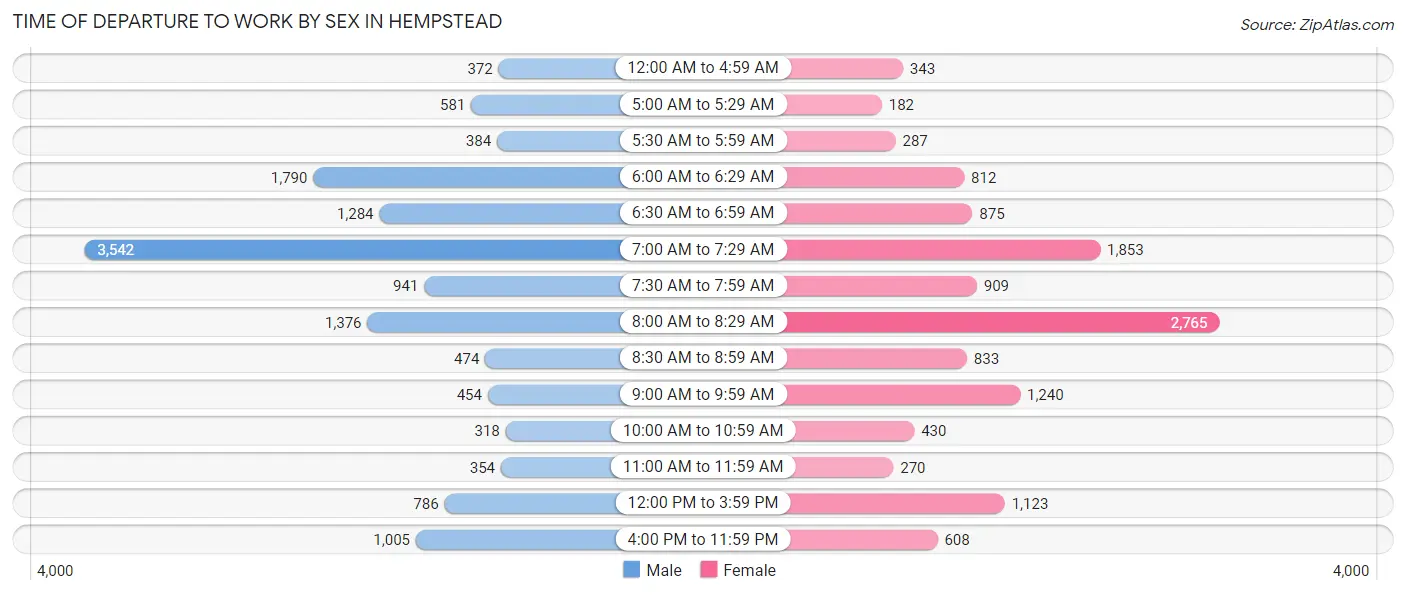
| Time of Departure | Male | Female |
| 12:00 AM to 4:59 AM | 372 (2.7%) | 343 (2.7%) |
| 5:00 AM to 5:29 AM | 581 (4.3%) | 182 (1.5%) |
| 5:30 AM to 5:59 AM | 384 (2.8%) | 287 (2.3%) |
| 6:00 AM to 6:29 AM | 1,790 (13.1%) | 812 (6.5%) |
| 6:30 AM to 6:59 AM | 1,284 (9.4%) | 875 (7.0%) |
| 7:00 AM to 7:29 AM | 3,542 (25.9%) | 1,853 (14.8%) |
| 7:30 AM to 7:59 AM | 941 (6.9%) | 909 (7.2%) |
| 8:00 AM to 8:29 AM | 1,376 (10.1%) | 2,765 (22.1%) |
| 8:30 AM to 8:59 AM | 474 (3.5%) | 833 (6.7%) |
| 9:00 AM to 9:59 AM | 454 (3.3%) | 1,240 (9.9%) |
| 10:00 AM to 10:59 AM | 318 (2.3%) | 430 (3.4%) |
| 11:00 AM to 11:59 AM | 354 (2.6%) | 270 (2.1%) |
| 12:00 PM to 3:59 PM | 786 (5.8%) | 1,123 (9.0%) |
| 4:00 PM to 11:59 PM | 1,005 (7.4%) | 608 (4.9%) |
| Total | 13,661 (100.0%) | 12,530 (100.0%) |
Housing Occupancy in Hempstead
Occupancy by Ownership in Hempstead
Of the total 17,030 dwellings in Hempstead, owner-occupied units account for 7,528 (44.2%), while renter-occupied units make up 9,502 (55.8%).
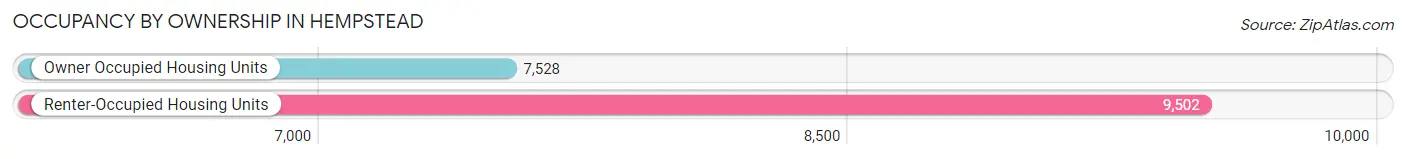
| Occupancy | # Housing Units | % Housing Units |
| Owner Occupied Housing Units | 7,528 | 44.2% |
| Renter-Occupied Housing Units | 9,502 | 55.8% |
| Total Occupied Housing Units | 17,030 | 100.0% |
Occupancy by Household Size in Hempstead
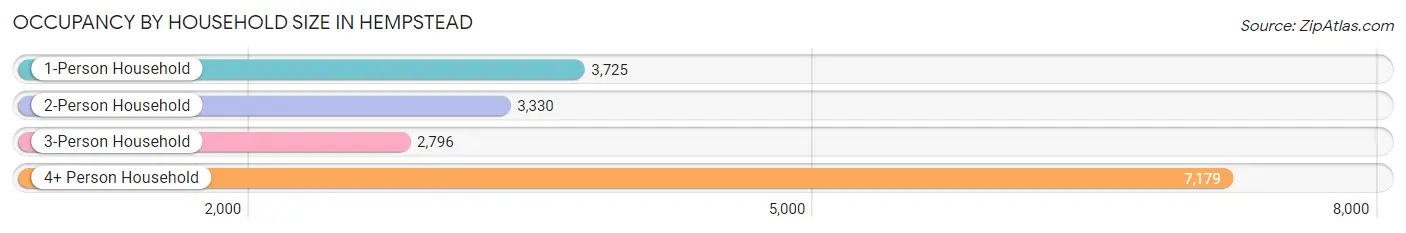
| Household Size | # Housing Units | % Housing Units |
| 1-Person Household | 3,725 | 21.9% |
| 2-Person Household | 3,330 | 19.6% |
| 3-Person Household | 2,796 | 16.4% |
| 4+ Person Household | 7,179 | 42.2% |
| Total Housing Units | 17,030 | 100.0% |
Occupancy by Ownership by Household Size in Hempstead
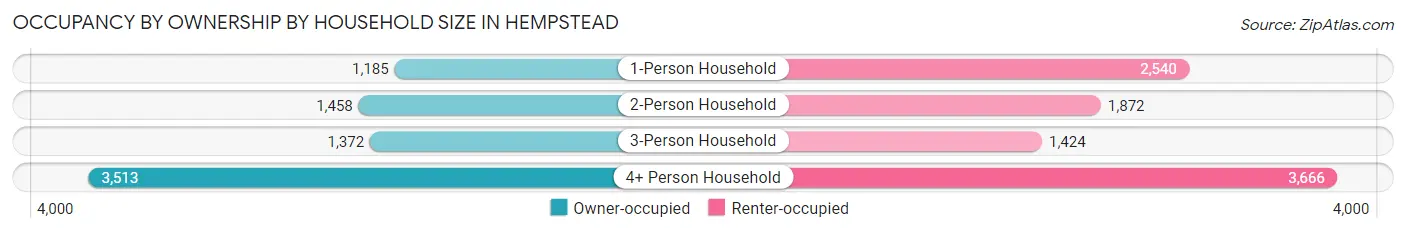
| Household Size | Owner-occupied | Renter-occupied |
| 1-Person Household | 1,185 (31.8%) | 2,540 (68.2%) |
| 2-Person Household | 1,458 (43.8%) | 1,872 (56.2%) |
| 3-Person Household | 1,372 (49.1%) | 1,424 (50.9%) |
| 4+ Person Household | 3,513 (48.9%) | 3,666 (51.1%) |
| Total Housing Units | 7,528 (44.2%) | 9,502 (55.8%) |
Occupancy by Educational Attainment in Hempstead
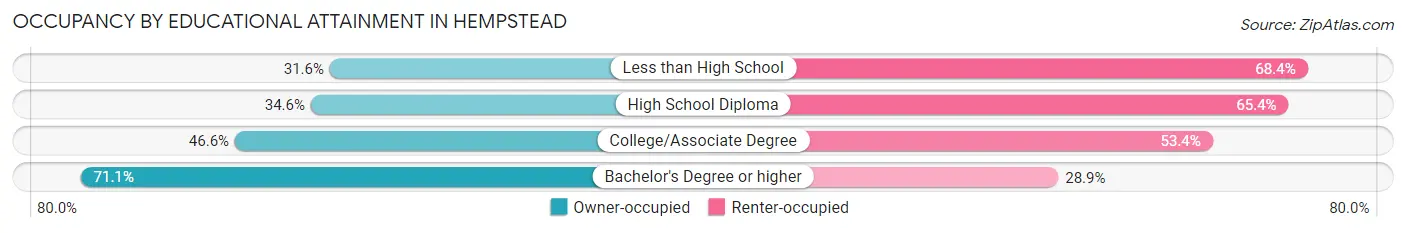
| Household Size | Owner-occupied | Renter-occupied |
| Less than High School | 1,212 (31.6%) | 2,625 (68.4%) |
| High School Diploma | 1,793 (34.6%) | 3,387 (65.4%) |
| College/Associate Degree | 2,239 (46.6%) | 2,562 (53.4%) |
| Bachelor's Degree or higher | 2,284 (71.1%) | 928 (28.9%) |
Occupancy by Age of Householder in Hempstead
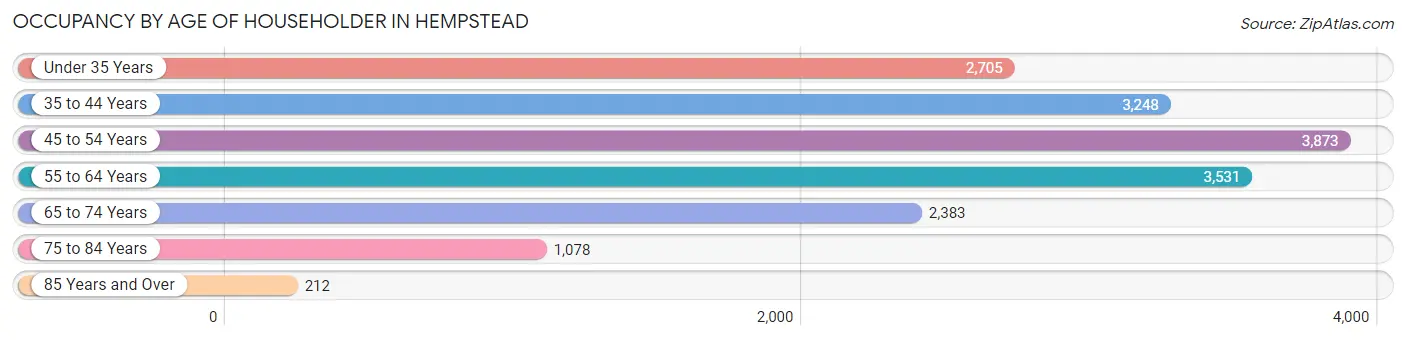
| Age Bracket | # Households | % Households |
| Under 35 Years | 2,705 | 15.9% |
| 35 to 44 Years | 3,248 | 19.1% |
| 45 to 54 Years | 3,873 | 22.7% |
| 55 to 64 Years | 3,531 | 20.7% |
| 65 to 74 Years | 2,383 | 14.0% |
| 75 to 84 Years | 1,078 | 6.3% |
| 85 Years and Over | 212 | 1.2% |
| Total | 17,030 | 100.0% |
Housing Finances in Hempstead
Median Income by Occupancy in Hempstead
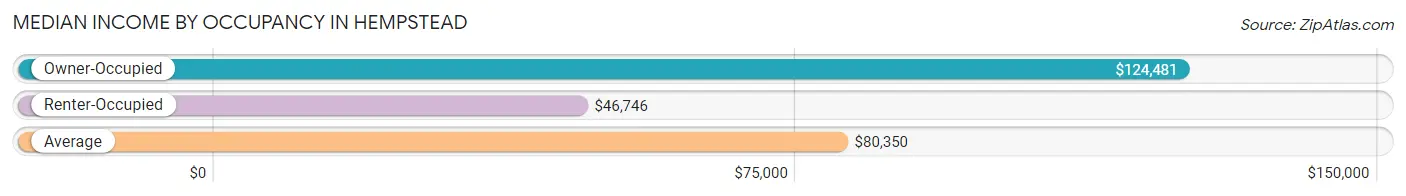
| Occupancy Type | # Households | Median Income |
| Owner-Occupied | 7,528 (44.2%) | $124,481 |
| Renter-Occupied | 9,502 (55.8%) | $46,746 |
| Average | 17,030 (100.0%) | $80,350 |
Occupancy by Householder Income Bracket in Hempstead
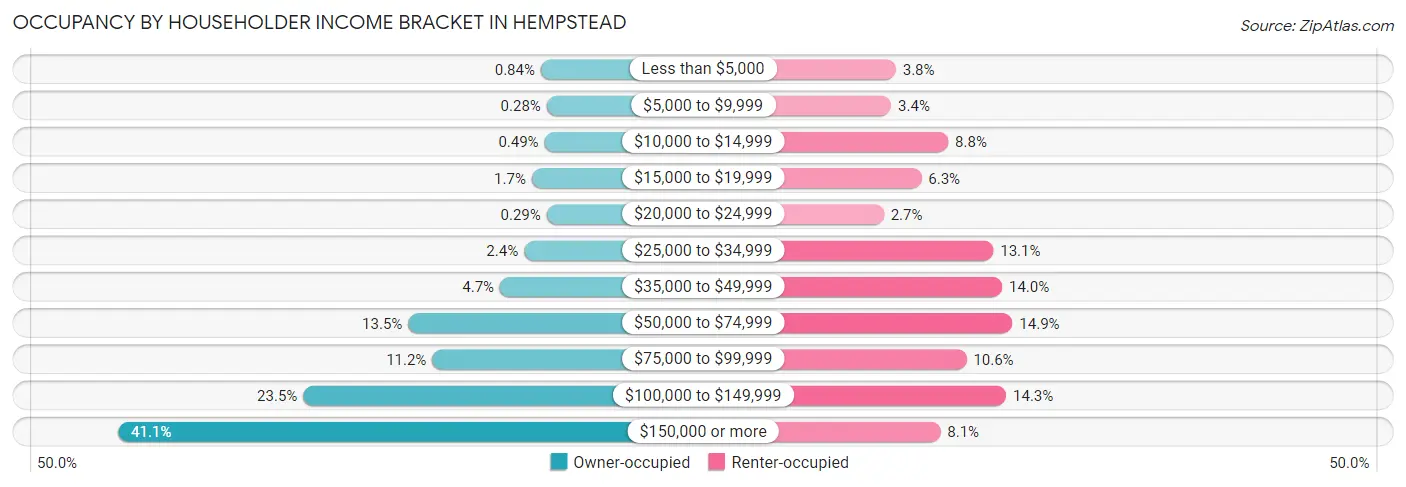
| Income Bracket | Owner-occupied | Renter-occupied |
| Less than $5,000 | 63 (0.8%) | 364 (3.8%) |
| $5,000 to $9,999 | 21 (0.3%) | 322 (3.4%) |
| $10,000 to $14,999 | 37 (0.5%) | 838 (8.8%) |
| $15,000 to $19,999 | 128 (1.7%) | 596 (6.3%) |
| $20,000 to $24,999 | 22 (0.3%) | 255 (2.7%) |
| $25,000 to $34,999 | 184 (2.4%) | 1,247 (13.1%) |
| $35,000 to $49,999 | 356 (4.7%) | 1,326 (14.0%) |
| $50,000 to $74,999 | 1,014 (13.5%) | 1,420 (14.9%) |
| $75,000 to $99,999 | 842 (11.2%) | 1,003 (10.6%) |
| $100,000 to $149,999 | 1,767 (23.5%) | 1,363 (14.3%) |
| $150,000 or more | 3,094 (41.1%) | 768 (8.1%) |
| Total | 7,528 (100.0%) | 9,502 (100.0%) |
Monthly Housing Cost Tiers in Hempstead
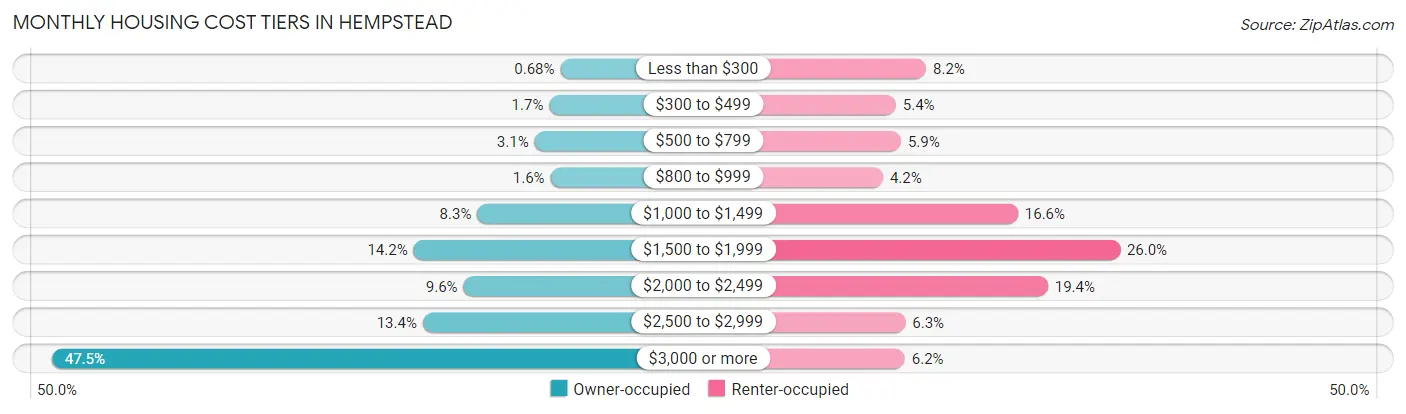
| Monthly Cost | Owner-occupied | Renter-occupied |
| Less than $300 | 51 (0.7%) | 775 (8.2%) |
| $300 to $499 | 128 (1.7%) | 511 (5.4%) |
| $500 to $799 | 230 (3.1%) | 556 (5.9%) |
| $800 to $999 | 120 (1.6%) | 398 (4.2%) |
| $1,000 to $1,499 | 627 (8.3%) | 1,578 (16.6%) |
| $1,500 to $1,999 | 1,069 (14.2%) | 2,471 (26.0%) |
| $2,000 to $2,499 | 723 (9.6%) | 1,841 (19.4%) |
| $2,500 to $2,999 | 1,005 (13.4%) | 594 (6.2%) |
| $3,000 or more | 3,575 (47.5%) | 590 (6.2%) |
| Total | 7,528 (100.0%) | 9,502 (100.0%) |
Physical Housing Characteristics in Hempstead
Housing Structures in Hempstead
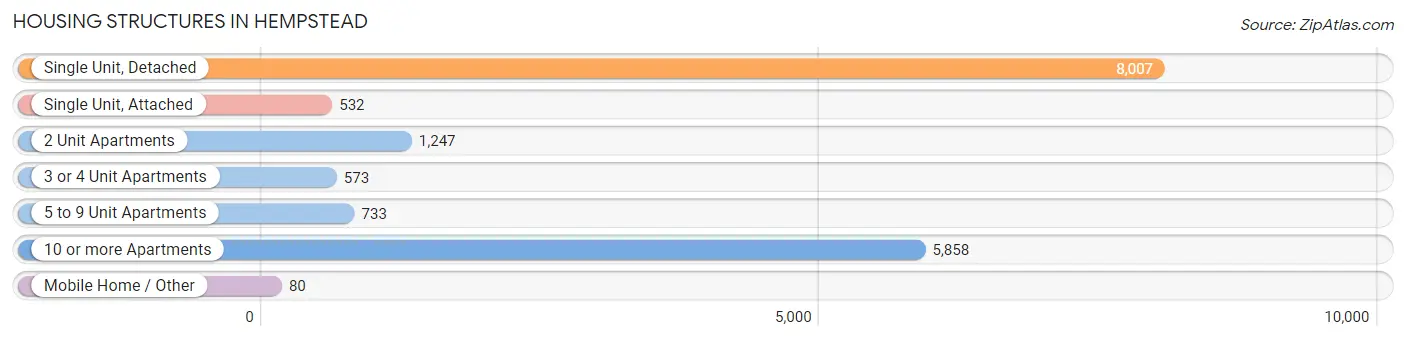
| Structure Type | # Housing Units | % Housing Units |
| Single Unit, Detached | 8,007 | 47.0% |
| Single Unit, Attached | 532 | 3.1% |
| 2 Unit Apartments | 1,247 | 7.3% |
| 3 or 4 Unit Apartments | 573 | 3.4% |
| 5 to 9 Unit Apartments | 733 | 4.3% |
| 10 or more Apartments | 5,858 | 34.4% |
| Mobile Home / Other | 80 | 0.5% |
| Total | 17,030 | 100.0% |
Housing Structures by Occupancy in Hempstead
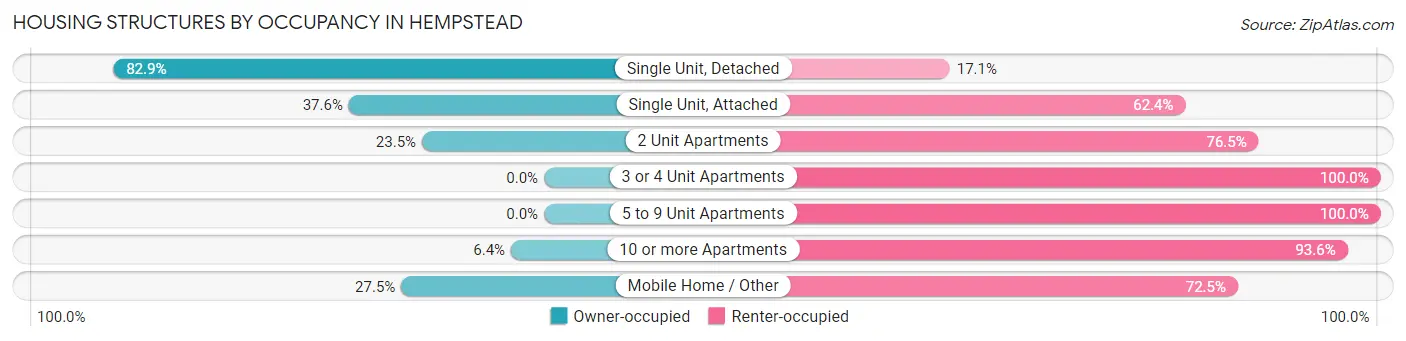
| Structure Type | Owner-occupied | Renter-occupied |
| Single Unit, Detached | 6,640 (82.9%) | 1,367 (17.1%) |
| Single Unit, Attached | 200 (37.6%) | 332 (62.4%) |
| 2 Unit Apartments | 293 (23.5%) | 954 (76.5%) |
| 3 or 4 Unit Apartments | 0 (0.0%) | 573 (100.0%) |
| 5 to 9 Unit Apartments | 0 (0.0%) | 733 (100.0%) |
| 10 or more Apartments | 373 (6.4%) | 5,485 (93.6%) |
| Mobile Home / Other | 22 (27.5%) | 58 (72.5%) |
| Total | 7,528 (44.2%) | 9,502 (55.8%) |
Housing Structures by Number of Rooms in Hempstead
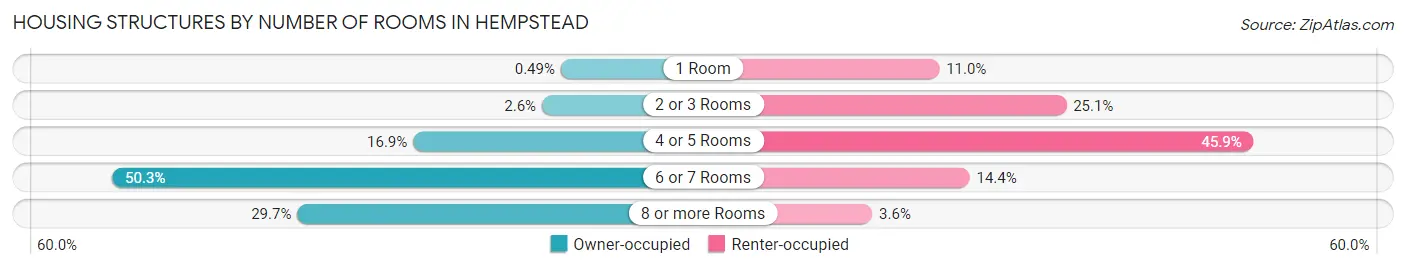
| Number of Rooms | Owner-occupied | Renter-occupied |
| 1 Room | 37 (0.5%) | 1,047 (11.0%) |
| 2 or 3 Rooms | 195 (2.6%) | 2,386 (25.1%) |
| 4 or 5 Rooms | 1,271 (16.9%) | 4,362 (45.9%) |
| 6 or 7 Rooms | 3,786 (50.3%) | 1,367 (14.4%) |
| 8 or more Rooms | 2,239 (29.7%) | 340 (3.6%) |
| Total | 7,528 (100.0%) | 9,502 (100.0%) |
Housing Structure by Heating Type in Hempstead
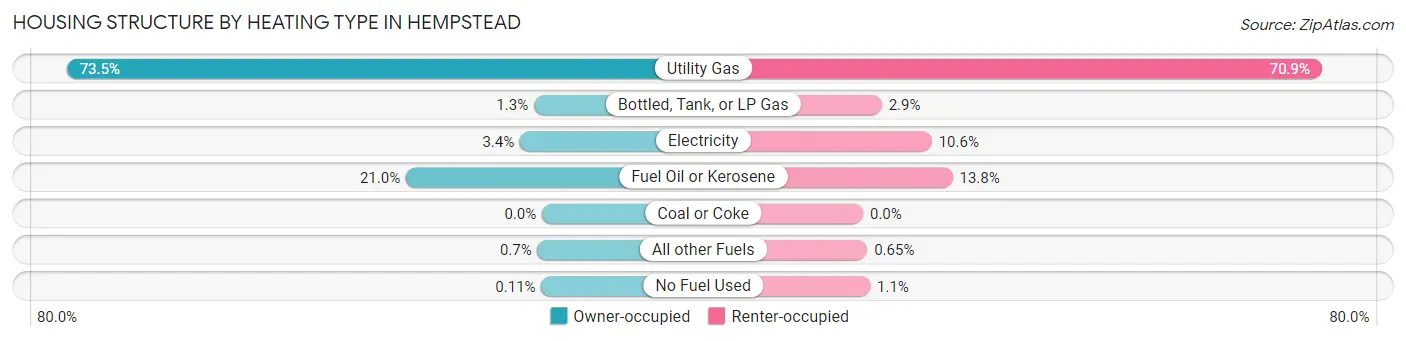
| Heating Type | Owner-occupied | Renter-occupied |
| Utility Gas | 5,532 (73.5%) | 6,738 (70.9%) |
| Bottled, Tank, or LP Gas | 94 (1.3%) | 275 (2.9%) |
| Electricity | 257 (3.4%) | 1,009 (10.6%) |
| Fuel Oil or Kerosene | 1,584 (21.0%) | 1,314 (13.8%) |
| Coal or Coke | 0 (0.0%) | 0 (0.0%) |
| All other Fuels | 53 (0.7%) | 62 (0.6%) |
| No Fuel Used | 8 (0.1%) | 104 (1.1%) |
| Total | 7,528 (100.0%) | 9,502 (100.0%) |
Household Vehicle Usage in Hempstead
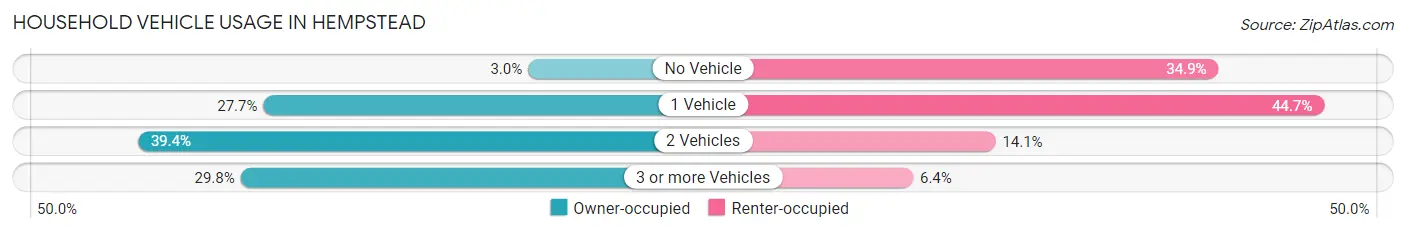
| Vehicles per Household | Owner-occupied | Renter-occupied |
| No Vehicle | 226 (3.0%) | 3,312 (34.9%) |
| 1 Vehicle | 2,087 (27.7%) | 4,251 (44.7%) |
| 2 Vehicles | 2,969 (39.4%) | 1,335 (14.1%) |
| 3 or more Vehicles | 2,246 (29.8%) | 604 (6.4%) |
| Total | 7,528 (100.0%) | 9,502 (100.0%) |
Real Estate & Mortgages in Hempstead
Real Estate and Mortgage Overview in Hempstead
| Characteristic | Without Mortgage | With Mortgage |
| Housing Units | 1,817 | 5,711 |
| Median Property Value | $400,900 | $426,100 |
| Median Household Income | $94,904 | $2,453 |
| Monthly Housing Costs | $1,501 | $3,550 |
| Real Estate Taxes | $10,001 | $246 |
Property Value by Mortgage Status in Hempstead
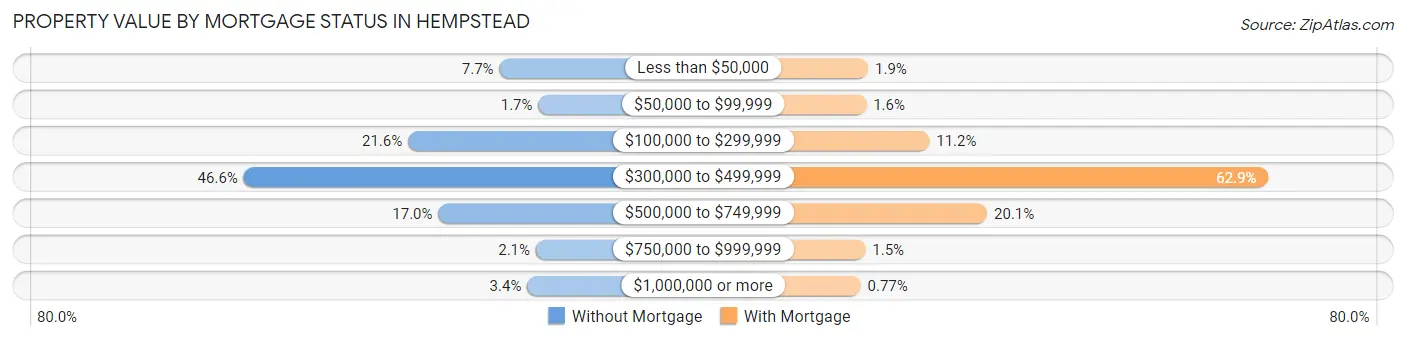
| Property Value | Without Mortgage | With Mortgage |
| Less than $50,000 | 139 (7.6%) | 109 (1.9%) |
| $50,000 to $99,999 | 31 (1.7%) | 93 (1.6%) |
| $100,000 to $299,999 | 392 (21.6%) | 642 (11.2%) |
| $300,000 to $499,999 | 847 (46.6%) | 3,593 (62.9%) |
| $500,000 to $749,999 | 308 (17.0%) | 1,145 (20.1%) |
| $750,000 to $999,999 | 38 (2.1%) | 85 (1.5%) |
| $1,000,000 or more | 62 (3.4%) | 44 (0.8%) |
| Total | 1,817 (100.0%) | 5,711 (100.0%) |
Household Income by Mortgage Status in Hempstead
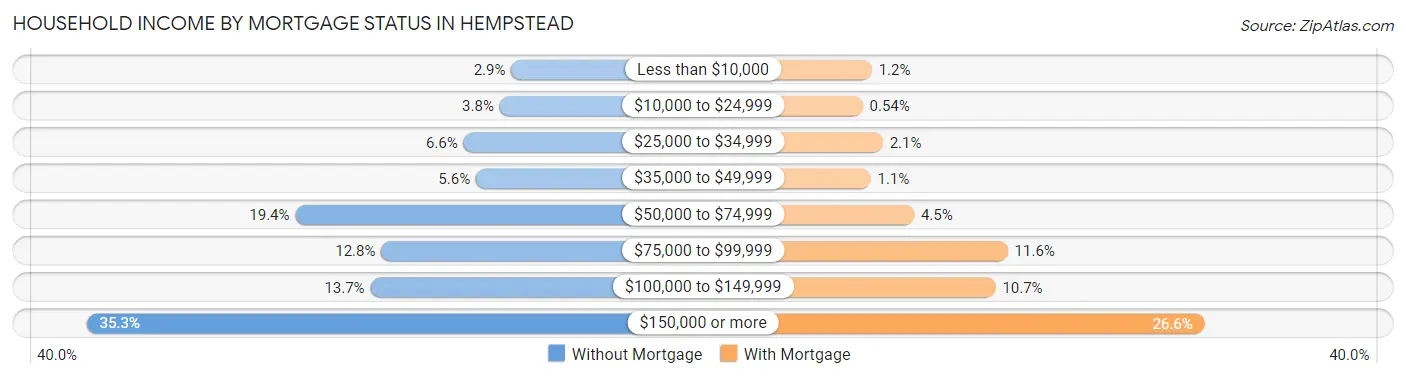
| Household Income | Without Mortgage | With Mortgage |
| Less than $10,000 | 53 (2.9%) | 70 (1.2%) |
| $10,000 to $24,999 | 69 (3.8%) | 31 (0.5%) |
| $25,000 to $34,999 | 119 (6.6%) | 118 (2.1%) |
| $35,000 to $49,999 | 102 (5.6%) | 65 (1.1%) |
| $50,000 to $74,999 | 352 (19.4%) | 254 (4.4%) |
| $75,000 to $99,999 | 233 (12.8%) | 662 (11.6%) |
| $100,000 to $149,999 | 248 (13.7%) | 609 (10.7%) |
| $150,000 or more | 641 (35.3%) | 1,519 (26.6%) |
| Total | 1,817 (100.0%) | 5,711 (100.0%) |
Property Value to Household Income Ratio in Hempstead
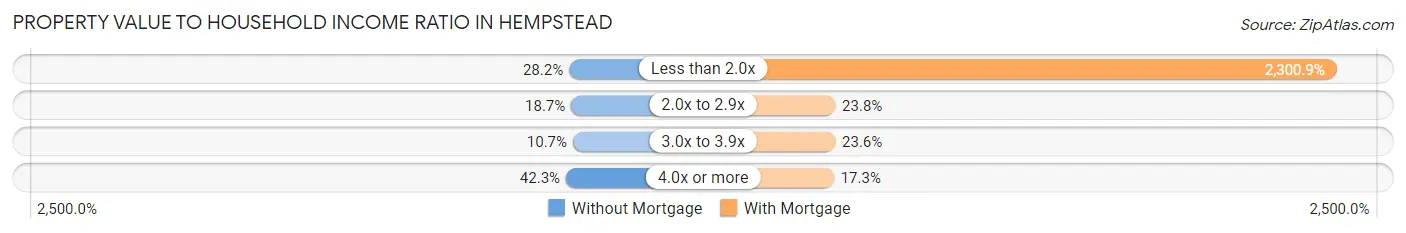
| Value-to-Income Ratio | Without Mortgage | With Mortgage |
| Less than 2.0x | 513 (28.2%) | 131,404 (2,300.9%) |
| 2.0x to 2.9x | 340 (18.7%) | 1,361 (23.8%) |
| 3.0x to 3.9x | 195 (10.7%) | 1,345 (23.5%) |
| 4.0x or more | 769 (42.3%) | 985 (17.2%) |
| Total | 1,817 (100.0%) | 5,711 (100.0%) |
Real Estate Taxes by Mortgage Status in Hempstead
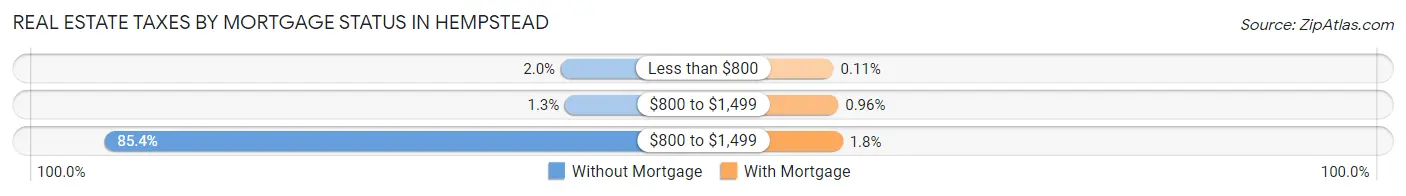
| Property Taxes | Without Mortgage | With Mortgage |
| Less than $800 | 37 (2.0%) | 6 (0.1%) |
| $800 to $1,499 | 23 (1.3%) | 55 (1.0%) |
| $800 to $1,499 | 1,552 (85.4%) | 101 (1.8%) |
| Total | 1,817 (100.0%) | 5,711 (100.0%) |
Health & Disability in Hempstead
Health Insurance Coverage by Age in Hempstead
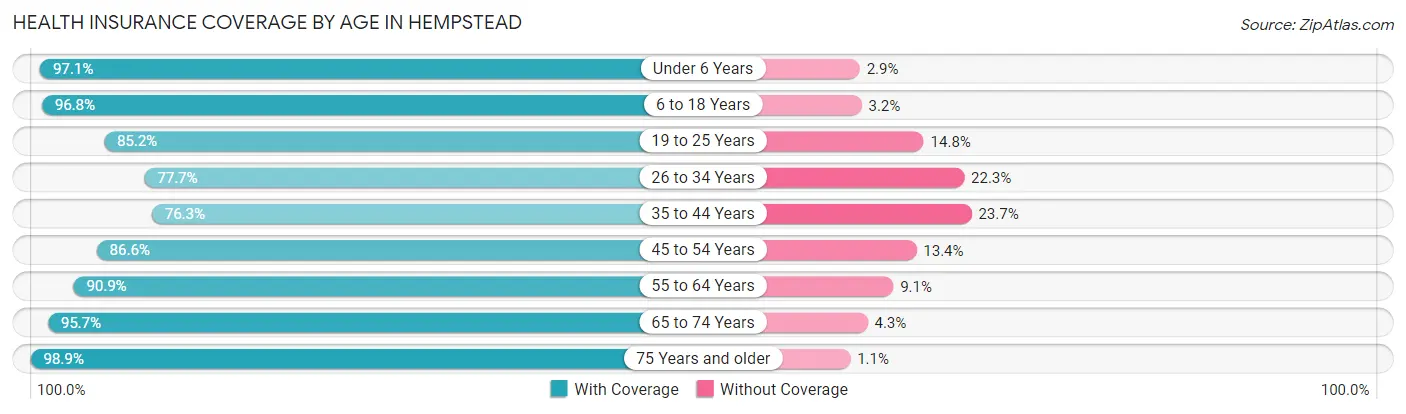
| Age Bracket | With Coverage | Without Coverage |
| Under 6 Years | 4,519 (97.1%) | 134 (2.9%) |
| 6 to 18 Years | 9,255 (96.8%) | 307 (3.2%) |
| 19 to 25 Years | 5,660 (85.2%) | 983 (14.8%) |
| 26 to 34 Years | 6,082 (77.7%) | 1,750 (22.3%) |
| 35 to 44 Years | 6,383 (76.3%) | 1,985 (23.7%) |
| 45 to 54 Years | 6,689 (86.6%) | 1,039 (13.4%) |
| 55 to 64 Years | 5,948 (90.9%) | 597 (9.1%) |
| 65 to 74 Years | 3,759 (95.7%) | 170 (4.3%) |
| 75 Years and older | 2,604 (98.9%) | 29 (1.1%) |
| Total | 50,899 (87.9%) | 6,994 (12.1%) |
Health Insurance Coverage by Citizenship Status in Hempstead
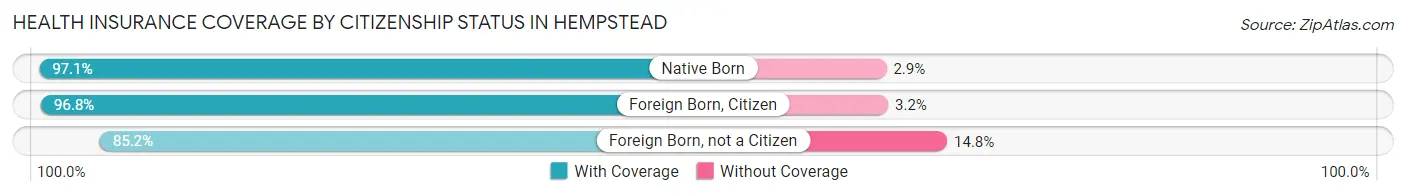
| Citizenship Status | With Coverage | Without Coverage |
| Native Born | 4,519 (97.1%) | 134 (2.9%) |
| Foreign Born, Citizen | 9,255 (96.8%) | 307 (3.2%) |
| Foreign Born, not a Citizen | 5,660 (85.2%) | 983 (14.8%) |
Health Insurance Coverage by Household Income in Hempstead
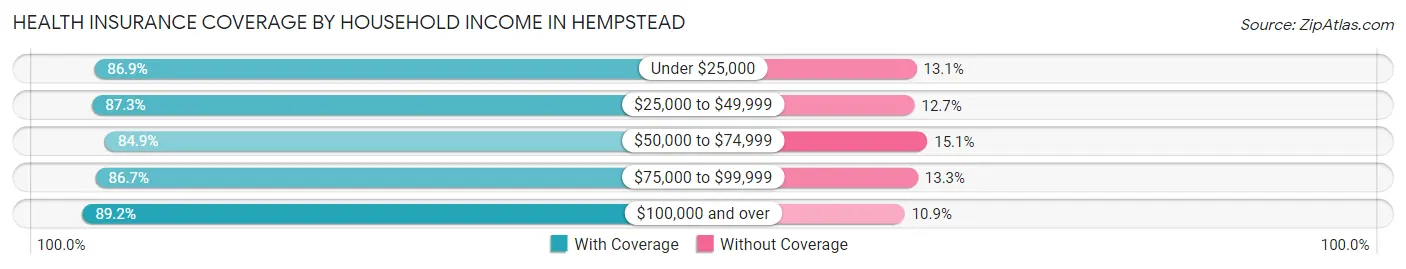
| Household Income | With Coverage | Without Coverage |
| Under $25,000 | 4,684 (86.9%) | 704 (13.1%) |
| $25,000 to $49,999 | 8,189 (87.3%) | 1,191 (12.7%) |
| $50,000 to $74,999 | 5,624 (84.9%) | 999 (15.1%) |
| $75,000 to $99,999 | 5,443 (86.7%) | 836 (13.3%) |
| $100,000 and over | 26,681 (89.1%) | 3,248 (10.8%) |
Public vs Private Health Insurance Coverage by Age in Hempstead
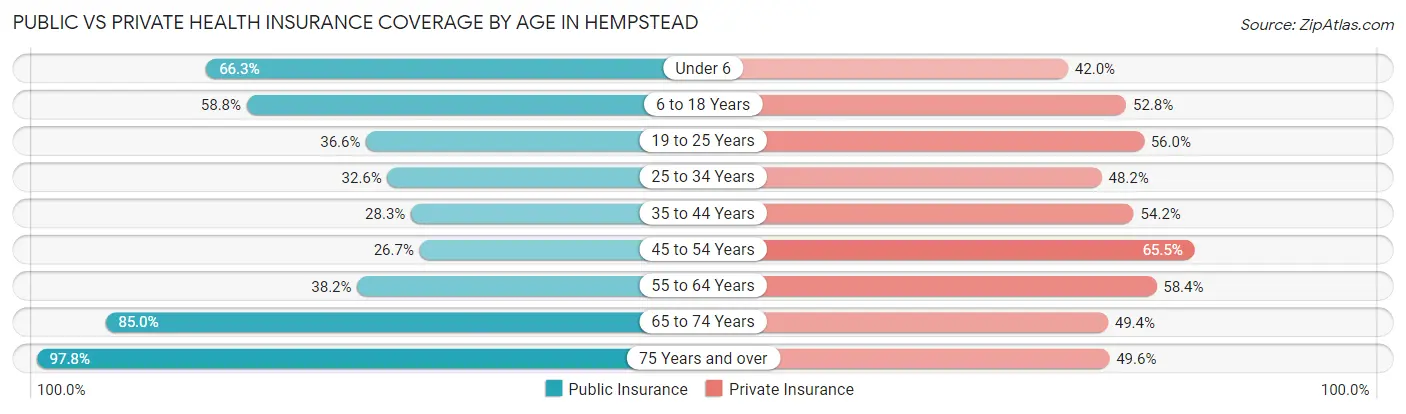
| Age Bracket | Public Insurance | Private Insurance |
| Under 6 | 3,084 (66.3%) | 1,953 (42.0%) |
| 6 to 18 Years | 5,618 (58.8%) | 5,045 (52.8%) |
| 19 to 25 Years | 2,430 (36.6%) | 3,723 (56.0%) |
| 25 to 34 Years | 2,555 (32.6%) | 3,776 (48.2%) |
| 35 to 44 Years | 2,364 (28.2%) | 4,533 (54.2%) |
| 45 to 54 Years | 2,060 (26.7%) | 5,062 (65.5%) |
| 55 to 64 Years | 2,502 (38.2%) | 3,821 (58.4%) |
| 65 to 74 Years | 3,340 (85.0%) | 1,940 (49.4%) |
| 75 Years and over | 2,574 (97.8%) | 1,307 (49.6%) |
| Total | 26,527 (45.8%) | 31,160 (53.8%) |
Disability Status by Sex by Age in Hempstead
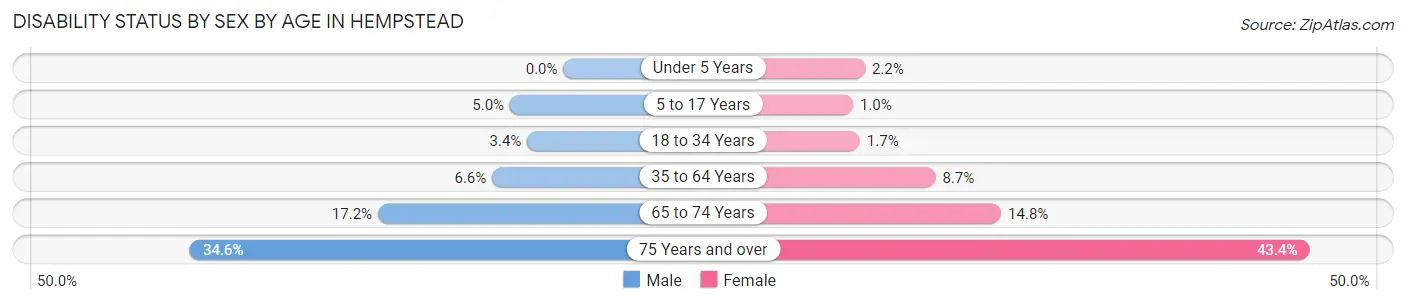
| Age Bracket | Male | Female |
| Under 5 Years | 0 (0.0%) | 41 (2.1%) |
| 5 to 17 Years | 263 (5.0%) | 46 (1.0%) |
| 18 to 34 Years | 231 (3.4%) | 136 (1.7%) |
| 35 to 64 Years | 754 (6.6%) | 977 (8.7%) |
| 65 to 74 Years | 262 (17.2%) | 356 (14.8%) |
| 75 Years and over | 326 (34.6%) | 734 (43.4%) |
Disability Class by Sex by Age in Hempstead
Disability Class: Hearing Difficulty
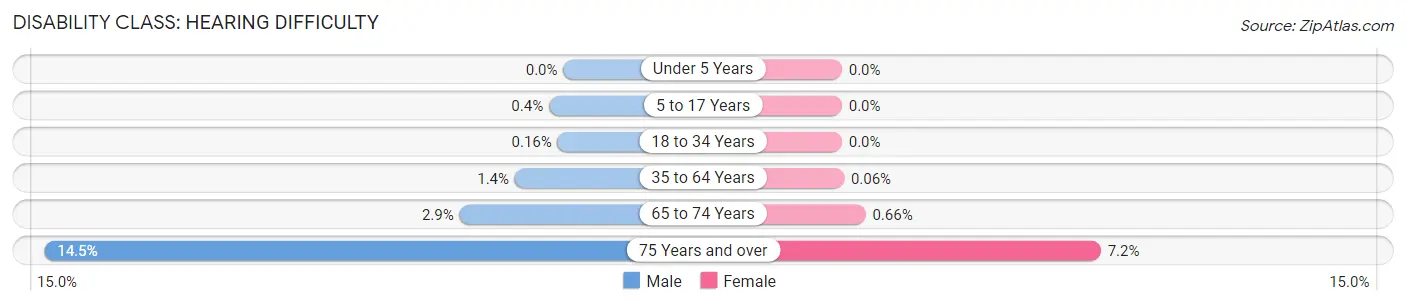
| Age Bracket | Male | Female |
| Under 5 Years | 0 (0.0%) | 0 (0.0%) |
| 5 to 17 Years | 21 (0.4%) | 0 (0.0%) |
| 18 to 34 Years | 11 (0.2%) | 0 (0.0%) |
| 35 to 64 Years | 154 (1.3%) | 7 (0.1%) |
| 65 to 74 Years | 44 (2.9%) | 16 (0.7%) |
| 75 Years and over | 136 (14.4%) | 122 (7.2%) |
Disability Class: Vision Difficulty
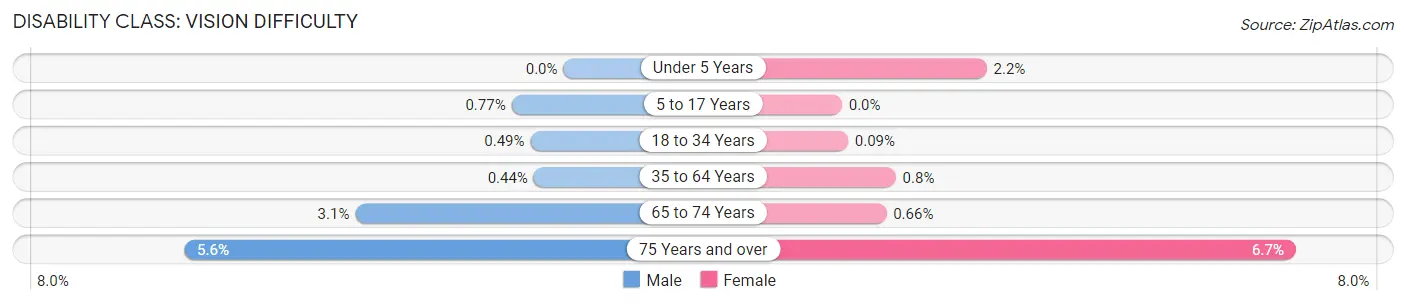
| Age Bracket | Male | Female |
| Under 5 Years | 0 (0.0%) | 41 (2.1%) |
| 5 to 17 Years | 41 (0.8%) | 0 (0.0%) |
| 18 to 34 Years | 34 (0.5%) | 7 (0.1%) |
| 35 to 64 Years | 50 (0.4%) | 90 (0.8%) |
| 65 to 74 Years | 47 (3.1%) | 16 (0.7%) |
| 75 Years and over | 53 (5.6%) | 114 (6.7%) |
Disability Class: Cognitive Difficulty
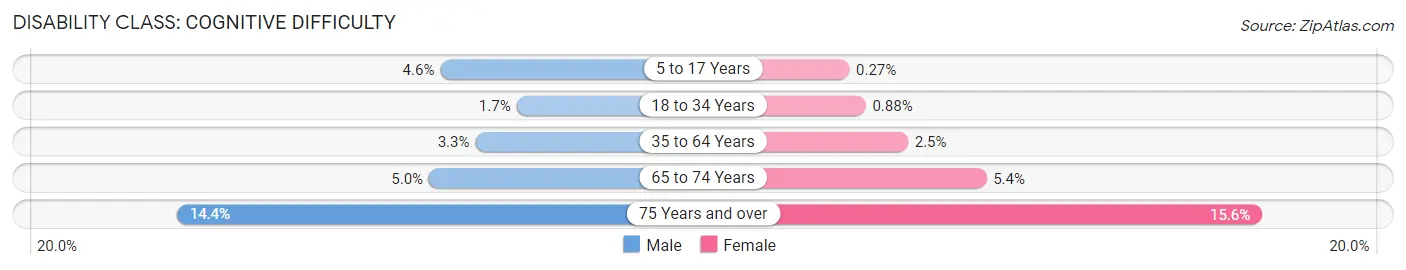
| Age Bracket | Male | Female |
| 5 to 17 Years | 242 (4.6%) | 12 (0.3%) |
| 18 to 34 Years | 120 (1.7%) | 71 (0.9%) |
| 35 to 64 Years | 373 (3.3%) | 275 (2.5%) |
| 65 to 74 Years | 76 (5.0%) | 129 (5.4%) |
| 75 Years and over | 135 (14.3%) | 264 (15.6%) |
Disability Class: Ambulatory Difficulty
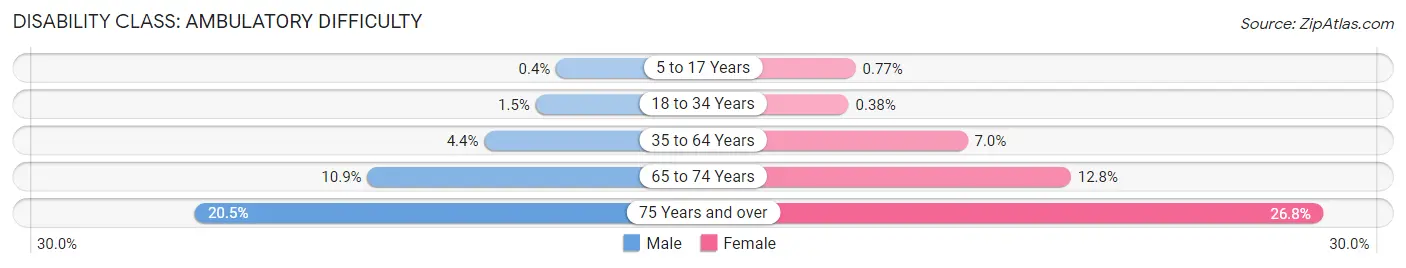
| Age Bracket | Male | Female |
| 5 to 17 Years | 21 (0.4%) | 34 (0.8%) |
| 18 to 34 Years | 106 (1.5%) | 31 (0.4%) |
| 35 to 64 Years | 501 (4.4%) | 787 (7.0%) |
| 65 to 74 Years | 166 (10.9%) | 307 (12.8%) |
| 75 Years and over | 193 (20.5%) | 453 (26.8%) |
Disability Class: Self-Care Difficulty
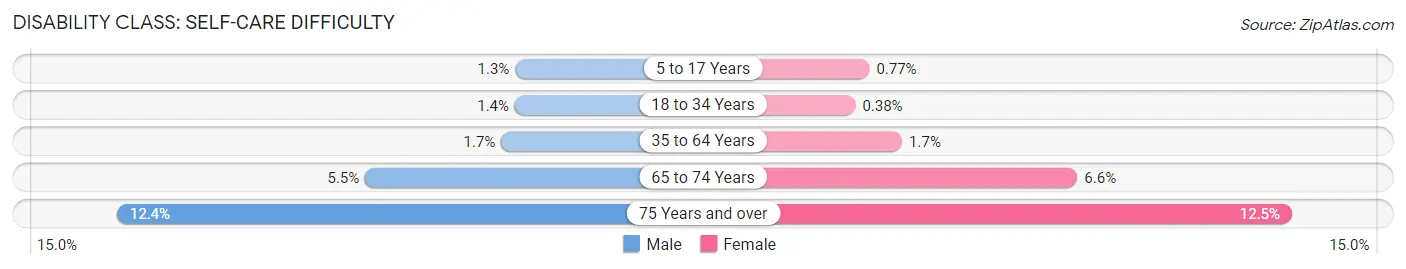
| Age Bracket | Male | Female |
| 5 to 17 Years | 71 (1.3%) | 34 (0.8%) |
| 18 to 34 Years | 93 (1.3%) | 31 (0.4%) |
| 35 to 64 Years | 197 (1.7%) | 189 (1.7%) |
| 65 to 74 Years | 84 (5.5%) | 158 (6.6%) |
| 75 Years and over | 117 (12.4%) | 212 (12.5%) |
Technology Access in Hempstead
Computing Device Access in Hempstead
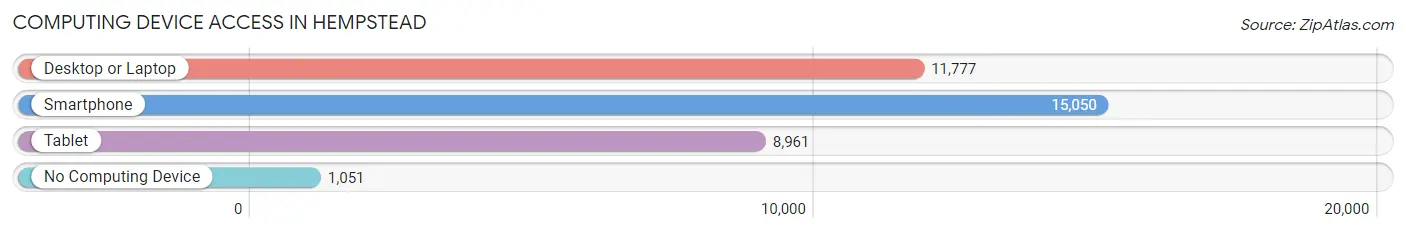
| Device Type | # Households | % Households |
| Desktop or Laptop | 11,777 | 69.2% |
| Smartphone | 15,050 | 88.4% |
| Tablet | 8,961 | 52.6% |
| No Computing Device | 1,051 | 6.2% |
| Total | 17,030 | 100.0% |
Internet Access in Hempstead
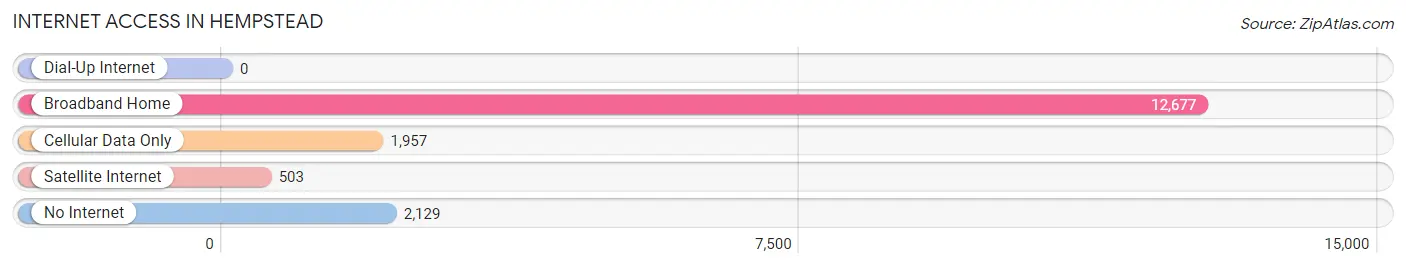
| Internet Type | # Households | % Households |
| Dial-Up Internet | 0 | 0.0% |
| Broadband Home | 12,677 | 74.4% |
| Cellular Data Only | 1,957 | 11.5% |
| Satellite Internet | 503 | 2.9% |
| No Internet | 2,129 | 12.5% |
| Total | 17,030 | 100.0% |
Hempstead Summary
Hempstead is a town located in Nassau County, New York, United States. It is the most populous town in the state of New York, with a population of 759,757 as of the 2010 census. The town is located on the south shore of Long Island, approximately 25 miles east of Manhattan.
History
Hempstead was first settled in 1644 by English colonists, who named it after the town of Hemel Hempstead in Hertfordshire, England. The town was originally part of Queens County, but was transferred to Nassau County in 1899.
The town was the site of the Battle of Hempstead Plains during the American Revolutionary War. The town was also the site of the first public school in the United States, established in 1653.
Geography
Hempstead is located at 40°42′N 73°41′W (40.7, -73.7). According to the United States Census Bureau, the town has a total area of 54.2 square miles (140.3 km2), of which 53.9 square miles (139.6 km2) is land and 0.3 square miles (0.7 km2) (0.54%) is water.
The town is bordered by the towns of Oyster Bay to the east, North Hempstead to the north, and the borough of Queens to the west. The southern border of the town is the Atlantic Ocean.
Economy
Hempstead is home to a variety of businesses and industries. The town is home to the corporate headquarters of several large companies, including Cablevision, Northwell Health, and the New York Islanders. The town is also home to a number of shopping centers, including the Roosevelt Field Mall, the Green Acres Mall, and the Broadway Mall.
The town is also home to a number of educational institutions, including Hofstra University, Nassau Community College, and Adelphi University.
Demographics
As of the 2010 census, there were 759,757 people, 256,845 households, and 186,845 families residing in the town. The population density was 14,093.3 people per square mile (5,441.2/km2). There were 266,945 housing units at an average density of 4,945.3 per square mile (1,906.2/km2). The racial makeup of the town was 57.2% White, 22.3% African American, 0.3% Native American, 8.2% Asian, 0.1% Pacific Islander, 8.7% from other races, and 3.4% from two or more races. Hispanic or Latino of any race were 20.9% of the population.
The median income for a household in the town was $76,824, and the median income for a family was $90,824. Males had a median income of $60,824 versus $41,824 for females. The per capita income for the town was $30,824. About 5.2% of families and 7.3% of the population were below the poverty line, including 9.2% of those under age 18 and 6.2% of those age 65 or over.
Common Questions
What is Per Capita Income in Hempstead?
Per Capita income in Hempstead is $31,370.
What is the Median Family Income in Hempstead?
Median Family Income in Hempstead is $88,080.
What is the Median Household income in Hempstead?
Median Household Income in Hempstead is $80,350.
What is Income or Wage Gap in Hempstead?
Income or Wage Gap in Hempstead is 8.9%.
Women in Hempstead earn 91.1 cents for every dollar earned by a man.
What is Family Income Deficit in Hempstead?
Family Income Deficit in Hempstead is $10,030.
Families that are below poverty line in Hempstead earn $10,030 less on average than the poverty threshold level.
What is Inequality or Gini Index in Hempstead?
Inequality or Gini Index in Hempstead is 0.47.
What is the Total Population of Hempstead?
Total Population of Hempstead is 58,557.
What is the Total Male Population of Hempstead?
Total Male Population of Hempstead is 28,400.
What is the Total Female Population of Hempstead?
Total Female Population of Hempstead is 30,157.
What is the Ratio of Males per 100 Females in Hempstead?
There are 94.17 Males per 100 Females in Hempstead.
What is the Ratio of Females per 100 Males in Hempstead?
There are 106.19 Females per 100 Males in Hempstead.
What is the Median Population Age in Hempstead?
Median Population Age in Hempstead is 35.6 Years.
What is the Average Family Size in Hempstead
Average Family Size in Hempstead is 3.9 People.
What is the Average Household Size in Hempstead
Average Household Size in Hempstead is 3.4 People.
How Large is the Labor Force in Hempstead?
There are 31,064 People in the Labor Forcein in Hempstead.
What is the Percentage of People in the Labor Force in Hempstead?
67.8% of People are in the Labor Force in Hempstead.
What is the Unemployment Rate in Hempstead?
Unemployment Rate in Hempstead is 8.4%.