Meriden, CT Map & Demographics
Meriden Map
Meriden Overview
$35,859
PER CAPITA INCOME
$83,457
AVG FAMILY INCOME
$63,671
AVG HOUSEHOLD INCOME
16.7%
WAGE / INCOME GAP [ % ]
83.3¢/ $1
WAGE / INCOME GAP [ $ ]
$11,343
FAMILY INCOME DEFICIT
0.44
INEQUALITY / GINI INDEX
60,556
TOTAL POPULATION
29,336
MALE POPULATION
31,220
FEMALE POPULATION
93.97
MALES / 100 FEMALES
106.42
FEMALES / 100 MALES
40.2
MEDIAN AGE
3.1
AVG FAMILY SIZE
2.4
AVG HOUSEHOLD SIZE
30,951
LABOR FORCE [ PEOPLE ]
63.8%
PERCENT IN LABOR FORCE
8.4%
UNEMPLOYMENT RATE
Meriden Area Codes
Income in Meriden
Income Overview in Meriden
Per Capita Income in Meriden is $35,859, while median incomes of families and households are $83,457 and $63,671 respectively.
| Characteristic | Number | Measure |
| Per Capita Income | 60,556 | $35,859 |
| Median Family Income | 15,177 | $83,457 |
| Mean Family Income | 15,177 | $101,567 |
| Median Household Income | 25,018 | $63,671 |
| Mean Household Income | 25,018 | $84,046 |
| Income Deficit | 15,177 | $11,343 |
| Wage / Income Gap (%) | 60,556 | 16.69% |
| Wage / Income Gap ($) | 60,556 | 83.31¢ per $1 |
| Gini / Inequality Index | 60,556 | 0.44 |
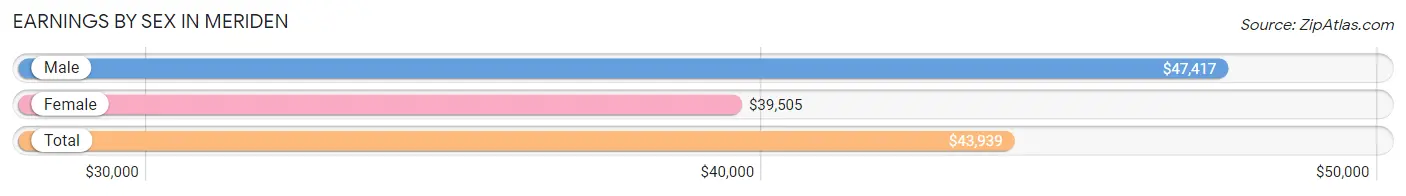
Earnings by Sex in Meriden
Average Earnings in Meriden are $43,939, $47,417 for men and $39,505 for women, a difference of 16.7%.
| Sex | Number | Average Earnings |
| Male | 15,517 (50.1%) | $47,417 |
| Female | 15,476 (49.9%) | $39,505 |
| Total | 30,993 (100.0%) | $43,939 |
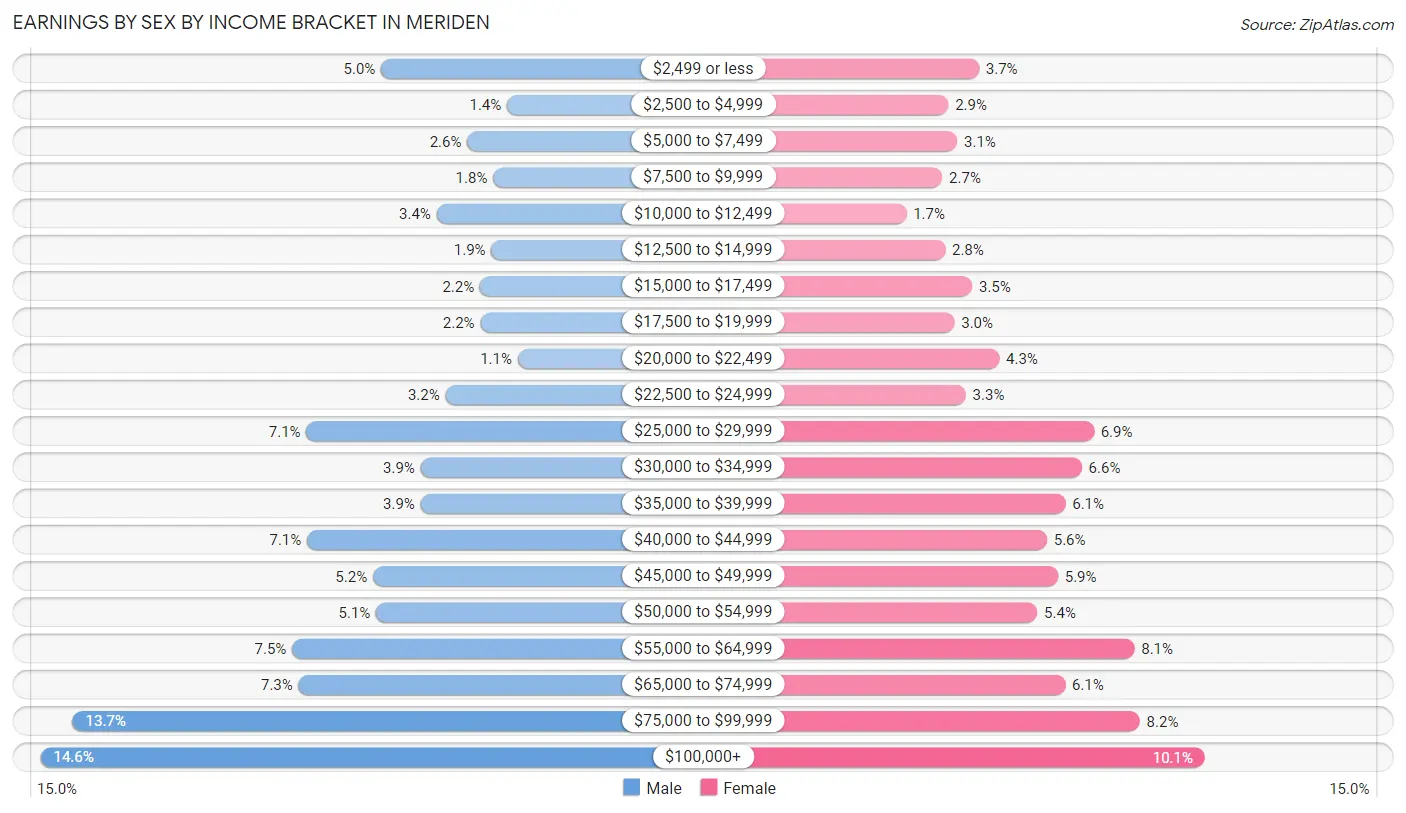
Earnings by Sex by Income Bracket in Meriden
The most common earnings brackets in Meriden are $100,000+ for men (2,257 | 14.5%) and $100,000+ for women (1,557 | 10.1%).
| Income | Male | Female |
| $2,499 or less | 773 (5.0%) | 574 (3.7%) |
| $2,500 to $4,999 | 223 (1.4%) | 441 (2.9%) |
| $5,000 to $7,499 | 397 (2.6%) | 479 (3.1%) |
| $7,500 to $9,999 | 284 (1.8%) | 414 (2.7%) |
| $10,000 to $12,499 | 531 (3.4%) | 259 (1.7%) |
| $12,500 to $14,999 | 291 (1.9%) | 427 (2.8%) |
| $15,000 to $17,499 | 341 (2.2%) | 544 (3.5%) |
| $17,500 to $19,999 | 340 (2.2%) | 468 (3.0%) |
| $20,000 to $22,499 | 177 (1.1%) | 663 (4.3%) |
| $22,500 to $24,999 | 492 (3.2%) | 517 (3.3%) |
| $25,000 to $29,999 | 1,099 (7.1%) | 1,074 (6.9%) |
| $30,000 to $34,999 | 601 (3.9%) | 1,022 (6.6%) |
| $35,000 to $39,999 | 601 (3.9%) | 950 (6.1%) |
| $40,000 to $44,999 | 1,096 (7.1%) | 870 (5.6%) |
| $45,000 to $49,999 | 808 (5.2%) | 917 (5.9%) |
| $50,000 to $54,999 | 794 (5.1%) | 828 (5.3%) |
| $55,000 to $64,999 | 1,161 (7.5%) | 1,250 (8.1%) |
| $65,000 to $74,999 | 1,133 (7.3%) | 948 (6.1%) |
| $75,000 to $99,999 | 2,118 (13.7%) | 1,274 (8.2%) |
| $100,000+ | 2,257 (14.5%) | 1,557 (10.1%) |
| Total | 15,517 (100.0%) | 15,476 (100.0%) |
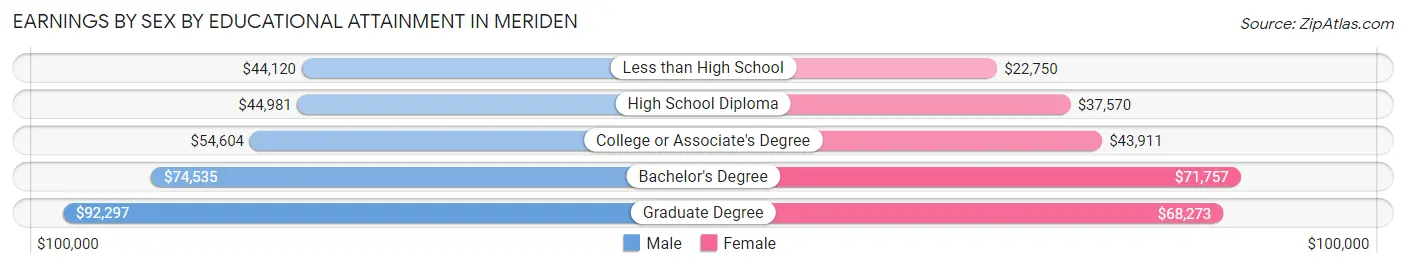
Earnings by Sex by Educational Attainment in Meriden
Average earnings in Meriden are $54,259 for men and $43,942 for women, a difference of 19.0%. Men with an educational attainment of graduate degree enjoy the highest average annual earnings of $92,297, while those with less than high school education earn the least with $44,120. Women with an educational attainment of bachelor's degree earn the most with the average annual earnings of $71,757, while those with less than high school education have the smallest earnings of $22,750.
| Educational Attainment | Male Income | Female Income |
| Less than High School | $44,120 | $22,750 |
| High School Diploma | $44,981 | $37,570 |
| College or Associate's Degree | $54,604 | $43,911 |
| Bachelor's Degree | $74,535 | $71,757 |
| Graduate Degree | $92,297 | $68,273 |
| Total | $54,259 | $43,942 |
Family Income in Meriden
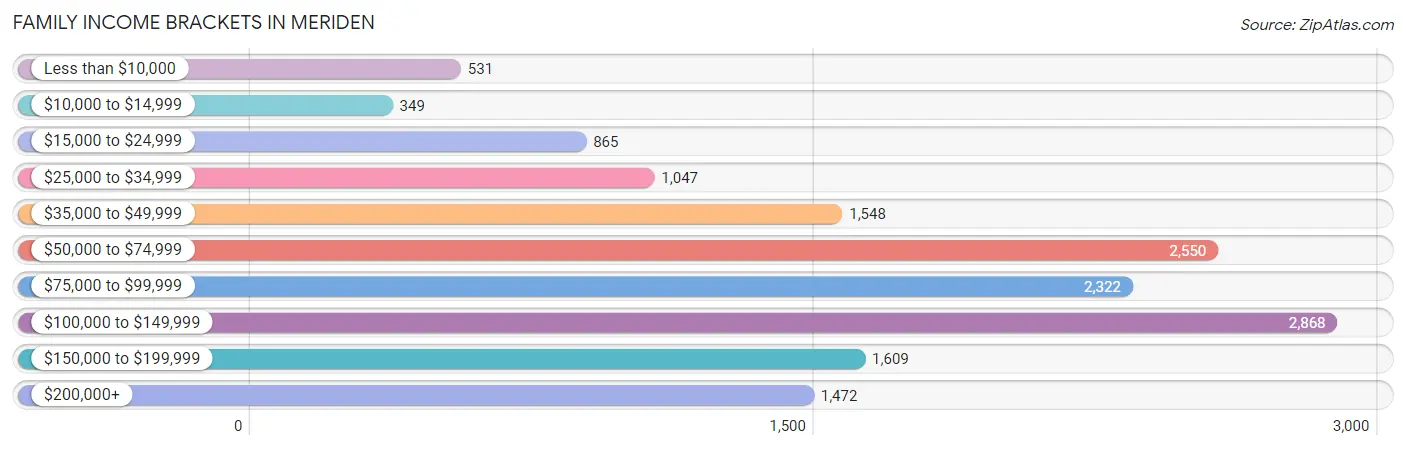
Family Income Brackets in Meriden
According to the Meriden family income data, there are 2,868 families falling into the $100,000 to $149,999 income range, which is the most common income bracket and makes up 18.9% of all families. Conversely, the $10,000 to $14,999 income bracket is the least frequent group with only 349 families (2.3%) belonging to this category.
| Income Bracket | # Families | % Families |
| Less than $10,000 | 531 | 3.5% |
| $10,000 to $14,999 | 349 | 2.3% |
| $15,000 to $24,999 | 865 | 5.7% |
| $25,000 to $34,999 | 1,047 | 6.9% |
| $35,000 to $49,999 | 1,548 | 10.2% |
| $50,000 to $74,999 | 2,550 | 16.8% |
| $75,000 to $99,999 | 2,322 | 15.3% |
| $100,000 to $149,999 | 2,868 | 18.9% |
| $150,000 to $199,999 | 1,609 | 10.6% |
| $200,000+ | 1,472 | 9.7% |
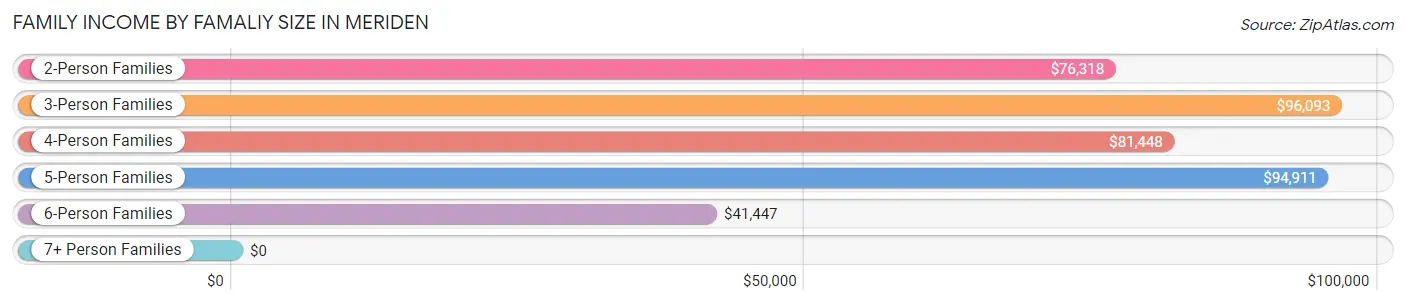
Family Income by Famaliy Size in Meriden
3-person families (3,694 | 24.3%) account for the highest median family income in Meriden with $96,093 per family, while 2-person families (7,574 | 49.9%) have the highest median income of $38,159 per family member.
| Income Bracket | # Families | Median Income |
| 2-Person Families | 7,574 (49.9%) | $76,318 |
| 3-Person Families | 3,694 (24.3%) | $96,093 |
| 4-Person Families | 2,197 (14.5%) | $81,448 |
| 5-Person Families | 1,314 (8.7%) | $94,911 |
| 6-Person Families | 176 (1.2%) | $41,447 |
| 7+ Person Families | 222 (1.5%) | $0 |
| Total | 15,177 (100.0%) | $83,457 |
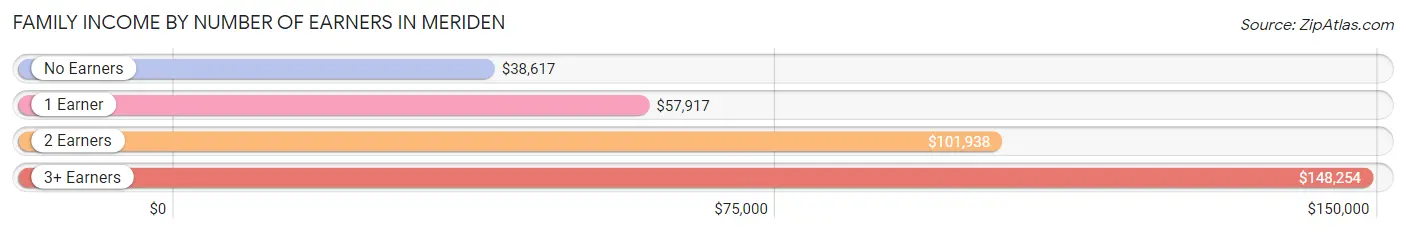
Family Income by Number of Earners in Meriden
The median family income in Meriden is $83,457, with families comprising 3+ earners (1,553) having the highest median family income of $148,254, while families with no earners (2,233) have the lowest median family income of $38,617, accounting for 10.2% and 14.7% of families, respectively.
| Number of Earners | # Families | Median Income |
| No Earners | 2,233 (14.7%) | $38,617 |
| 1 Earner | 4,952 (32.6%) | $57,917 |
| 2 Earners | 6,439 (42.4%) | $101,938 |
| 3+ Earners | 1,553 (10.2%) | $148,254 |
| Total | 15,177 (100.0%) | $83,457 |
Household Income in Meriden
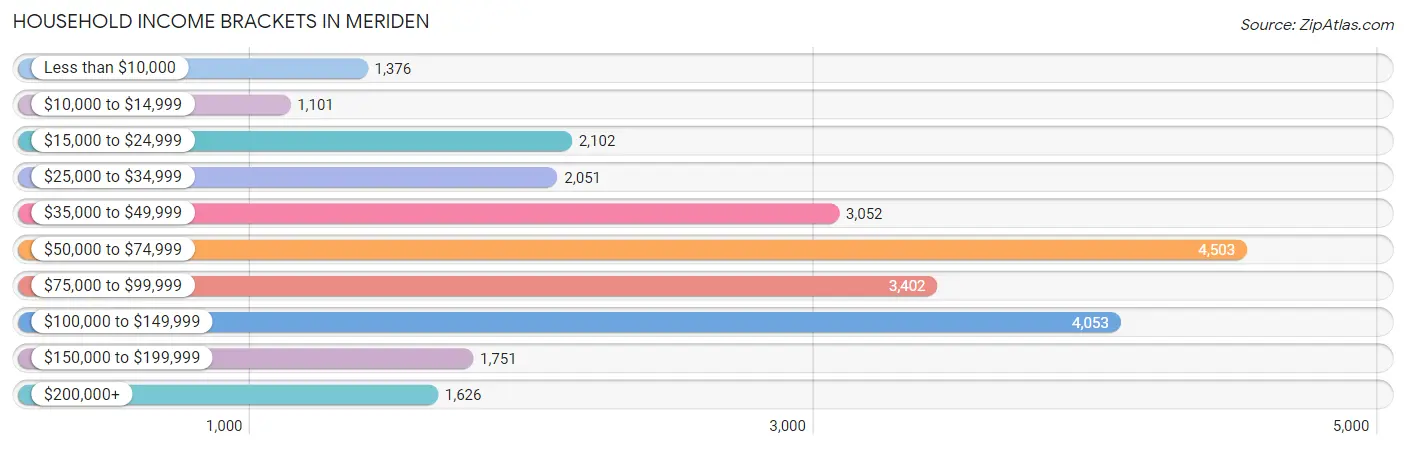
Household Income Brackets in Meriden
With 4,503 households falling in the category, the $50,000 to $74,999 income range is the most frequent in Meriden, accounting for 18.0% of all households. In contrast, only 1,101 households (4.4%) fall into the $10,000 to $14,999 income bracket, making it the least populous group.
| Income Bracket | # Households | % Households |
| Less than $10,000 | 1,376 | 5.5% |
| $10,000 to $14,999 | 1,101 | 4.4% |
| $15,000 to $24,999 | 2,102 | 8.4% |
| $25,000 to $34,999 | 2,051 | 8.2% |
| $35,000 to $49,999 | 3,052 | 12.2% |
| $50,000 to $74,999 | 4,503 | 18.0% |
| $75,000 to $99,999 | 3,402 | 13.6% |
| $100,000 to $149,999 | 4,053 | 16.2% |
| $150,000 to $199,999 | 1,751 | 7.0% |
| $200,000+ | 1,626 | 6.5% |
Household Income by Householder Age in Meriden
The median household income in Meriden is $63,671, with the highest median household income of $91,069 found in the 45 to 64 years age bracket for the primary householder. A total of 10,332 households (41.3%) fall into this category. Meanwhile, the 65+ years age bracket for the primary householder has the lowest median household income of $47,532, with 6,272 households (25.1%) in this group.
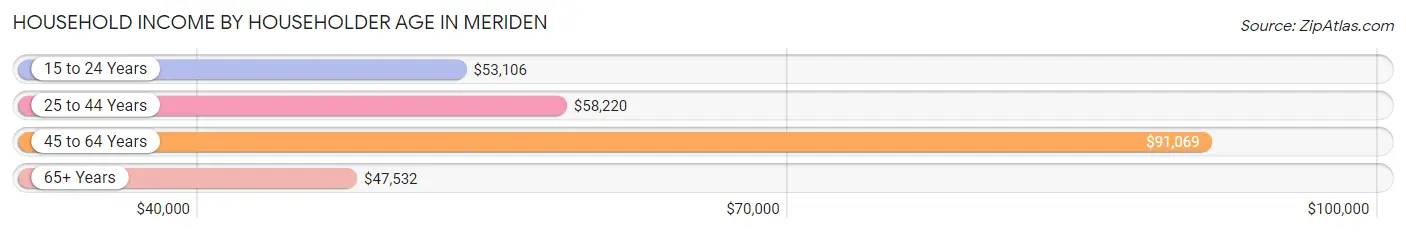
| Income Bracket | # Households | Median Income |
| 15 to 24 Years | 974 (3.9%) | $53,106 |
| 25 to 44 Years | 7,440 (29.7%) | $58,220 |
| 45 to 64 Years | 10,332 (41.3%) | $91,069 |
| 65+ Years | 6,272 (25.1%) | $47,532 |
| Total | 25,018 (100.0%) | $63,671 |
Poverty in Meriden
Income Below Poverty by Sex and Age in Meriden
With 14.5% poverty level for males and 16.8% for females among the residents of Meriden, 12 to 14 year old males and 16 and 17 year old females are the most vulnerable to poverty, with 324 males (29.9%) and 216 females (40.7%) in their respective age groups living below the poverty level.
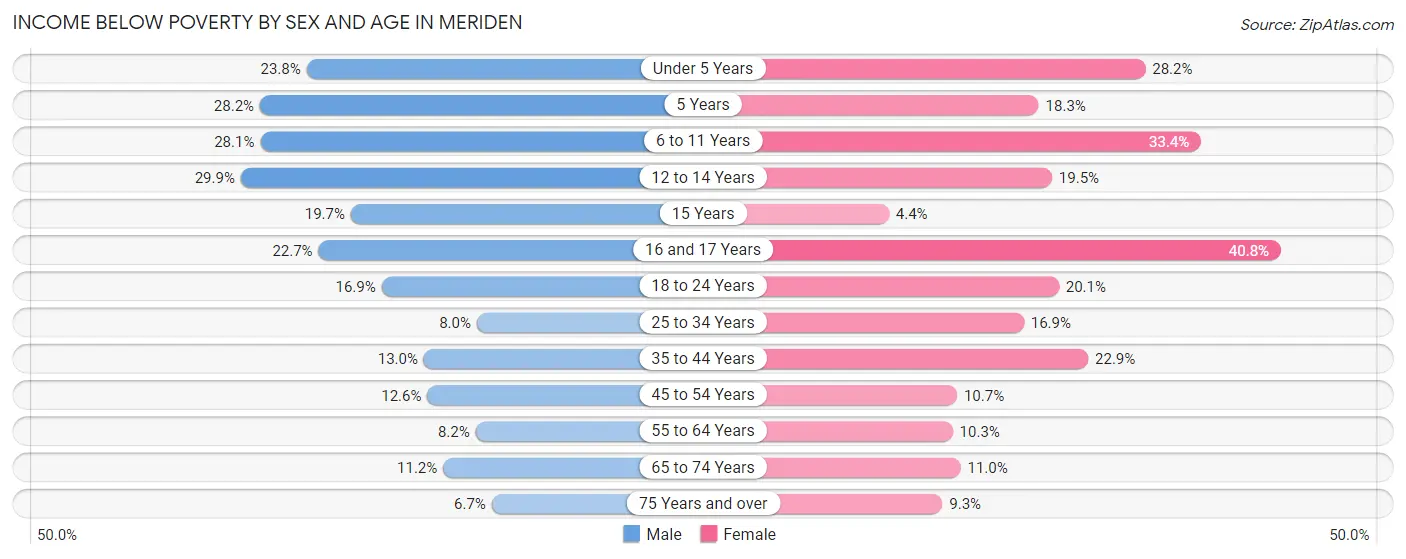
| Age Bracket | Male | Female |
| Under 5 Years | 518 (23.8%) | 440 (28.2%) |
| 5 Years | 136 (28.2%) | 112 (18.3%) |
| 6 to 11 Years | 623 (28.1%) | 673 (33.4%) |
| 12 to 14 Years | 324 (29.9%) | 188 (19.5%) |
| 15 Years | 59 (19.7%) | 25 (4.4%) |
| 16 and 17 Years | 115 (22.7%) | 216 (40.7%) |
| 18 to 24 Years | 469 (16.9%) | 467 (20.1%) |
| 25 to 34 Years | 323 (8.0%) | 694 (16.9%) |
| 35 to 44 Years | 501 (13.0%) | 878 (22.9%) |
| 45 to 54 Years | 414 (12.6%) | 420 (10.7%) |
| 55 to 64 Years | 385 (8.2%) | 512 (10.3%) |
| 65 to 74 Years | 242 (11.2%) | 318 (11.0%) |
| 75 Years and over | 92 (6.7%) | 237 (9.3%) |
| Total | 4,201 (14.5%) | 5,180 (16.8%) |
Income Above Poverty by Sex and Age in Meriden
According to the poverty statistics in Meriden, males aged 75 years and over and females aged 15 years are the age groups that are most secure financially, with 93.3% of males and 95.6% of females in these age groups living above the poverty line.
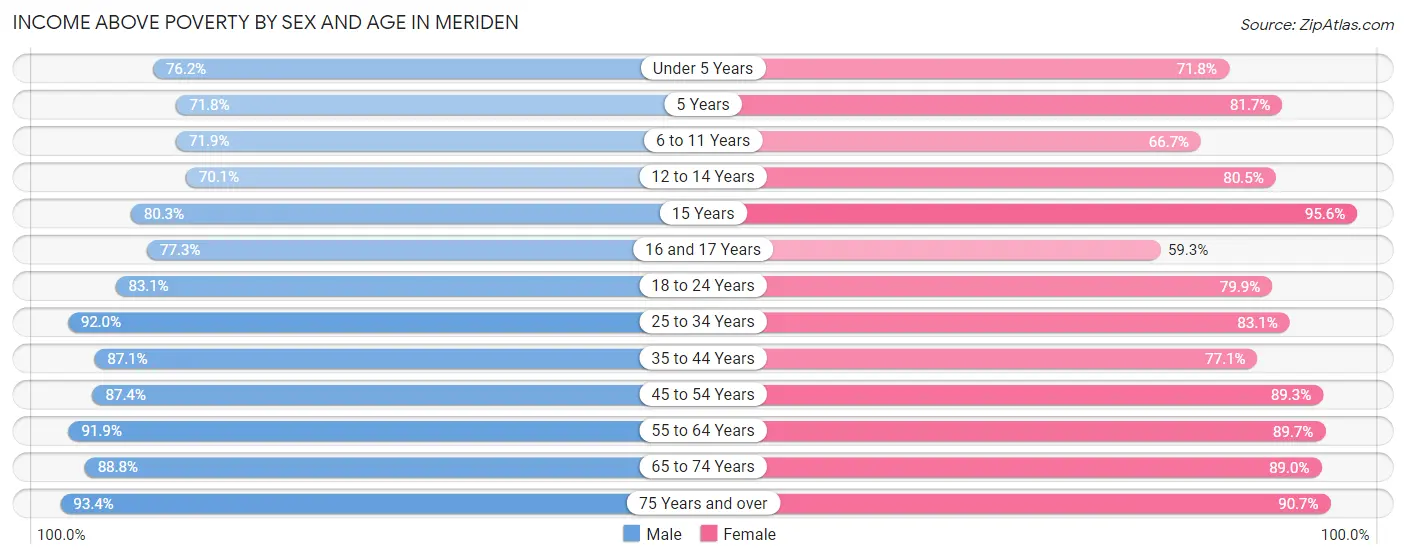
| Age Bracket | Male | Female |
| Under 5 Years | 1,656 (76.2%) | 1,122 (71.8%) |
| 5 Years | 347 (71.8%) | 501 (81.7%) |
| 6 to 11 Years | 1,592 (71.9%) | 1,345 (66.6%) |
| 12 to 14 Years | 758 (70.1%) | 776 (80.5%) |
| 15 Years | 240 (80.3%) | 547 (95.6%) |
| 16 and 17 Years | 391 (77.3%) | 314 (59.3%) |
| 18 to 24 Years | 2,311 (83.1%) | 1,852 (79.9%) |
| 25 to 34 Years | 3,697 (92.0%) | 3,414 (83.1%) |
| 35 to 44 Years | 3,367 (87.1%) | 2,963 (77.1%) |
| 45 to 54 Years | 2,865 (87.4%) | 3,510 (89.3%) |
| 55 to 64 Years | 4,337 (91.8%) | 4,465 (89.7%) |
| 65 to 74 Years | 1,927 (88.8%) | 2,567 (89.0%) |
| 75 Years and over | 1,292 (93.3%) | 2,302 (90.7%) |
| Total | 24,780 (85.5%) | 25,678 (83.2%) |
Income Below Poverty Among Married-Couple Families in Meriden
The poverty statistics for married-couple families in Meriden show that 6.1% or 530 of the total 8,727 families live below the poverty line. Families with 3 or 4 children have the highest poverty rate of 19.7%, comprising of 94 families. On the other hand, families with 5 or more children have the lowest poverty rate of 0.0%, which includes 0 families.
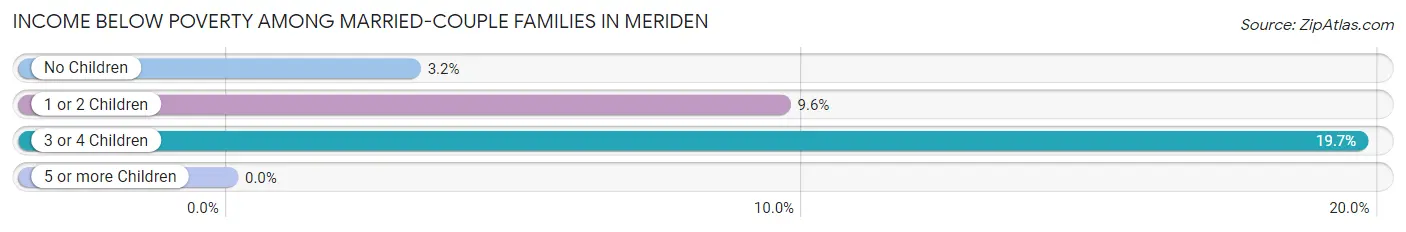
| Children | Above Poverty | Below Poverty |
| No Children | 5,324 (96.8%) | 175 (3.2%) |
| 1 or 2 Children | 2,452 (90.4%) | 261 (9.6%) |
| 3 or 4 Children | 384 (80.3%) | 94 (19.7%) |
| 5 or more Children | 37 (100.0%) | 0 (0.0%) |
| Total | 8,197 (93.9%) | 530 (6.1%) |
Income Below Poverty Among Single-Parent Households in Meriden
According to the poverty data in Meriden, 12.6% or 239 single-father households and 20.4% or 929 single-mother households are living below the poverty line. Among single-father households, those with 5 or more children have the highest poverty rate, with 8 households (100.0%) experiencing poverty. Likewise, among single-mother households, those with 5 or more children have the highest poverty rate, with 38 households (73.1%) falling below the poverty line.
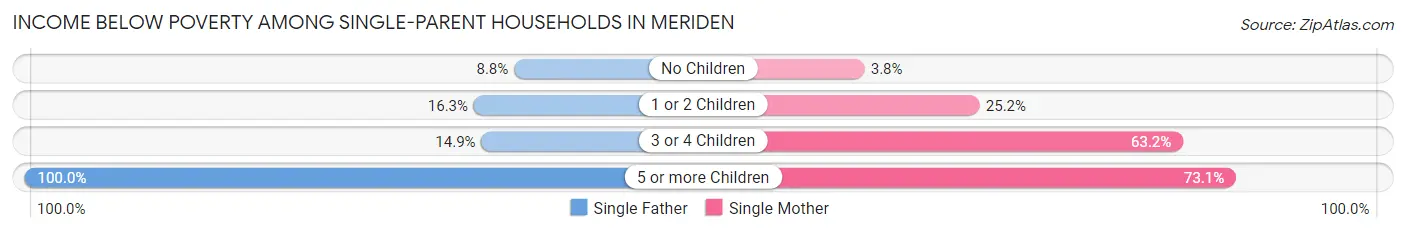
| Children | Single Father | Single Mother |
| No Children | 89 (8.8%) | 76 (3.7%) |
| 1 or 2 Children | 125 (16.3%) | 497 (25.2%) |
| 3 or 4 Children | 17 (14.9%) | 318 (63.2%) |
| 5 or more Children | 8 (100.0%) | 38 (73.1%) |
| Total | 239 (12.6%) | 929 (20.4%) |
Income Below Poverty Among Married-Couple vs Single-Parent Households in Meriden
The poverty data for Meriden shows that 530 of the married-couple family households (6.1%) and 1,168 of the single-parent households (18.1%) are living below the poverty level. Within the married-couple family households, those with 3 or 4 children have the highest poverty rate, with 94 households (19.7%) falling below the poverty line. Among the single-parent households, those with 5 or more children have the highest poverty rate, with 46 household (76.7%) living below poverty.
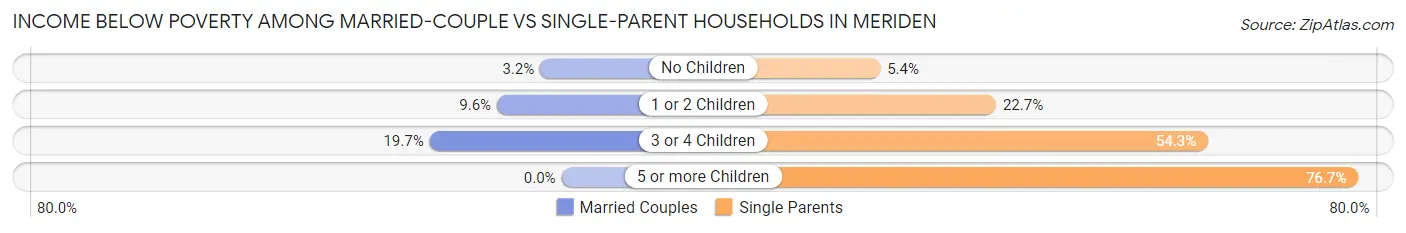
| Children | Married-Couple Families | Single-Parent Households |
| No Children | 175 (3.2%) | 165 (5.4%) |
| 1 or 2 Children | 261 (9.6%) | 622 (22.7%) |
| 3 or 4 Children | 94 (19.7%) | 335 (54.3%) |
| 5 or more Children | 0 (0.0%) | 46 (76.7%) |
| Total | 530 (6.1%) | 1,168 (18.1%) |
Race in Meriden
The most populous races in Meriden are White / Caucasian (39,926 | 65.9%), Hispanic or Latino (22,447 | 37.1%), and Two or more Races (9,125 | 15.1%).
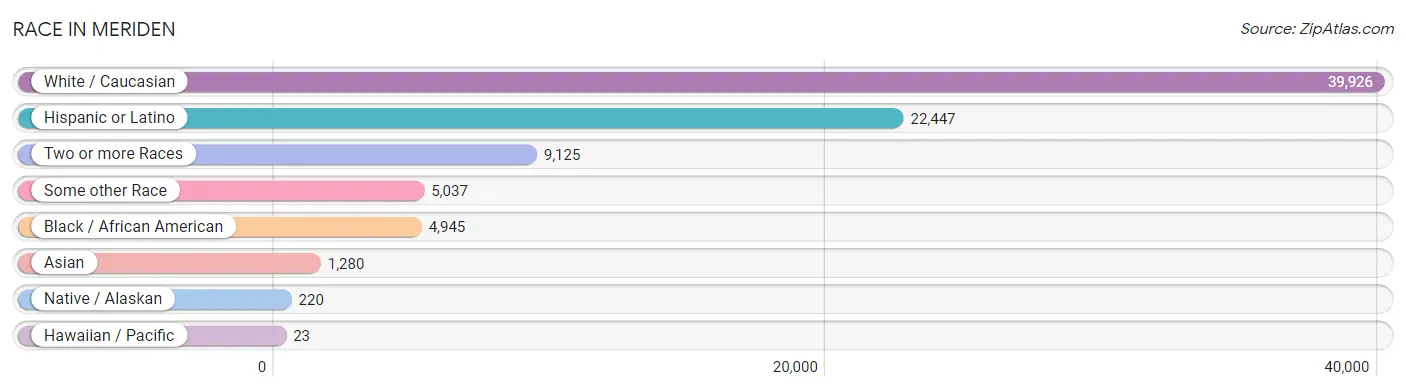
| Race | # Population | % Population |
| Asian | 1,280 | 2.1% |
| Black / African American | 4,945 | 8.2% |
| Hawaiian / Pacific | 23 | 0.0% |
| Hispanic or Latino | 22,447 | 37.1% |
| Native / Alaskan | 220 | 0.4% |
| White / Caucasian | 39,926 | 65.9% |
| Two or more Races | 9,125 | 15.1% |
| Some other Race | 5,037 | 8.3% |
| Total | 60,556 | 100.0% |
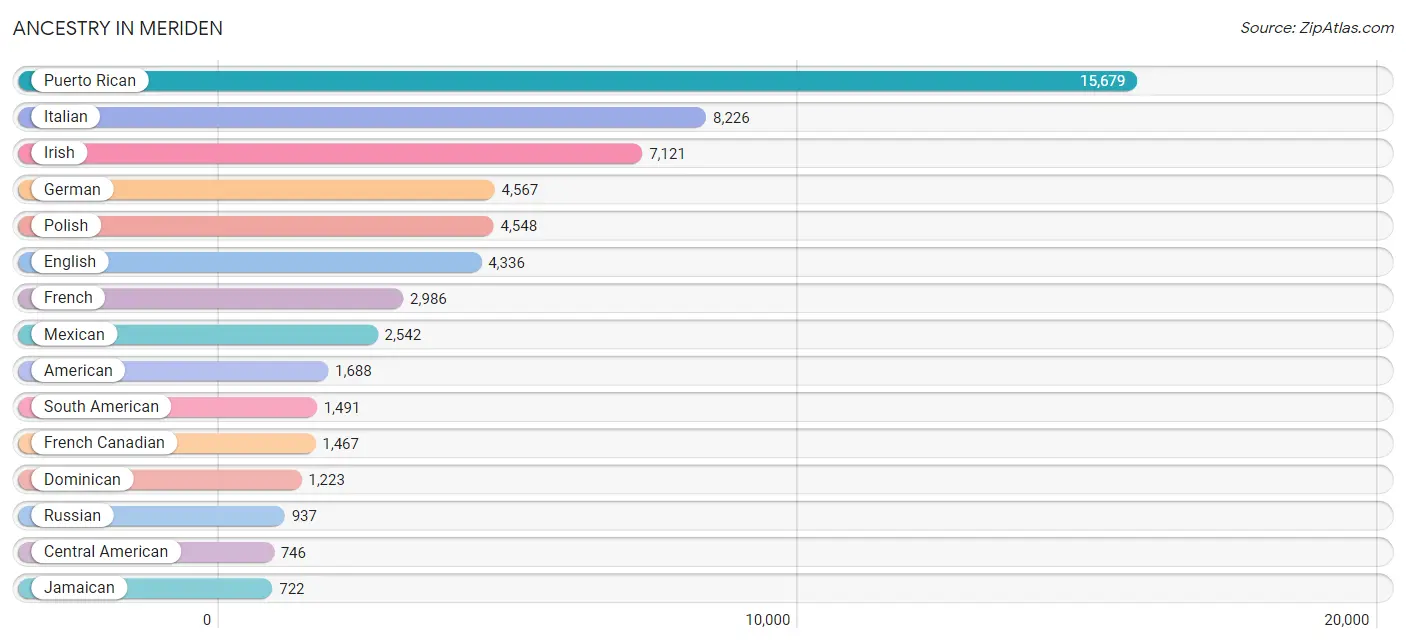
Ancestry in Meriden
The most populous ancestries reported in Meriden are Puerto Rican (15,679 | 25.9%), Italian (8,226 | 13.6%), Irish (7,121 | 11.8%), German (4,567 | 7.5%), and Polish (4,548 | 7.5%), together accounting for 66.3% of all Meriden residents.
| Ancestry | # Population | % Population |
| African | 45 | 0.1% |
| American | 1,688 | 2.8% |
| Arab | 381 | 0.6% |
| Argentinean | 76 | 0.1% |
| Armenian | 27 | 0.0% |
| Austrian | 57 | 0.1% |
| Bahamian | 85 | 0.1% |
| Belgian | 37 | 0.1% |
| Bhutanese | 35 | 0.1% |
| Blackfeet | 6 | 0.0% |
| Bolivian | 2 | 0.0% |
| British | 104 | 0.2% |
| Burmese | 322 | 0.5% |
| Canadian | 155 | 0.3% |
| Cape Verdean | 6 | 0.0% |
| Central American | 746 | 1.2% |
| Central American Indian | 182 | 0.3% |
| Cherokee | 162 | 0.3% |
| Chilean | 97 | 0.2% |
| Choctaw | 10 | 0.0% |
| Colombian | 352 | 0.6% |
| Comanche | 15 | 0.0% |
| Costa Rican | 7 | 0.0% |
| Cree | 33 | 0.1% |
| Croatian | 22 | 0.0% |
| Cuban | 456 | 0.7% |
| Czech | 2 | 0.0% |
| Czechoslovakian | 20 | 0.0% |
| Danish | 40 | 0.1% |
| Dominican | 1,223 | 2.0% |
| Dutch | 163 | 0.3% |
| Eastern European | 81 | 0.1% |
| Ecuadorian | 594 | 1.0% |
| English | 4,336 | 7.2% |
| European | 205 | 0.3% |
| Filipino | 8 | 0.0% |
| Finnish | 12 | 0.0% |
| French | 2,986 | 4.9% |
| French American Indian | 83 | 0.1% |
| French Canadian | 1,467 | 2.4% |
| German | 4,567 | 7.5% |
| Ghanaian | 8 | 0.0% |
| Greek | 414 | 0.7% |
| Guatemalan | 532 | 0.9% |
| Guyanese | 37 | 0.1% |
| Haitian | 84 | 0.1% |
| Honduran | 119 | 0.2% |
| Hungarian | 269 | 0.4% |
| Indian (Asian) | 394 | 0.6% |
| Iranian | 3 | 0.0% |
| Irish | 7,121 | 11.8% |
| Iroquois | 19 | 0.0% |
| Italian | 8,226 | 13.6% |
| Jamaican | 722 | 1.2% |
| Korean | 289 | 0.5% |
| Latvian | 67 | 0.1% |
| Lebanese | 38 | 0.1% |
| Lithuanian | 215 | 0.4% |
| Macedonian | 39 | 0.1% |
| Malaysian | 108 | 0.2% |
| Mexican | 2,542 | 4.2% |
| Moroccan | 109 | 0.2% |
| Native Hawaiian | 10 | 0.0% |
| Nicaraguan | 82 | 0.1% |
| Nigerian | 55 | 0.1% |
| Northern European | 27 | 0.0% |
| Norwegian | 161 | 0.3% |
| Pakistani | 13 | 0.0% |
| Pennsylvania German | 22 | 0.0% |
| Peruvian | 244 | 0.4% |
| Polish | 4,548 | 7.5% |
| Portuguese | 269 | 0.4% |
| Puerto Rican | 15,679 | 25.9% |
| Romanian | 26 | 0.0% |
| Russian | 937 | 1.5% |
| Salvadoran | 6 | 0.0% |
| Samoan | 5 | 0.0% |
| Scandinavian | 29 | 0.1% |
| Scotch-Irish | 72 | 0.1% |
| Scottish | 478 | 0.8% |
| Slavic | 53 | 0.1% |
| Slovak | 113 | 0.2% |
| South African | 47 | 0.1% |
| South American | 1,491 | 2.5% |
| South American Indian | 13 | 0.0% |
| Spaniard | 108 | 0.2% |
| Spanish | 63 | 0.1% |
| Spanish American Indian | 18 | 0.0% |
| Sri Lankan | 97 | 0.2% |
| Subsaharan African | 163 | 0.3% |
| Sudanese | 2 | 0.0% |
| Swedish | 714 | 1.2% |
| Swiss | 38 | 0.1% |
| Syrian | 68 | 0.1% |
| Thai | 351 | 0.6% |
| Turkish | 234 | 0.4% |
| Ugandan | 10 | 0.0% |
| Ukrainian | 180 | 0.3% |
| Uruguayan | 66 | 0.1% |
| Venezuelan | 60 | 0.1% |
| Vietnamese | 10 | 0.0% |
| Welsh | 61 | 0.1% |
| West Indian | 29 | 0.1% |
| Yugoslavian | 16 | 0.0% | View All 104 Rows |
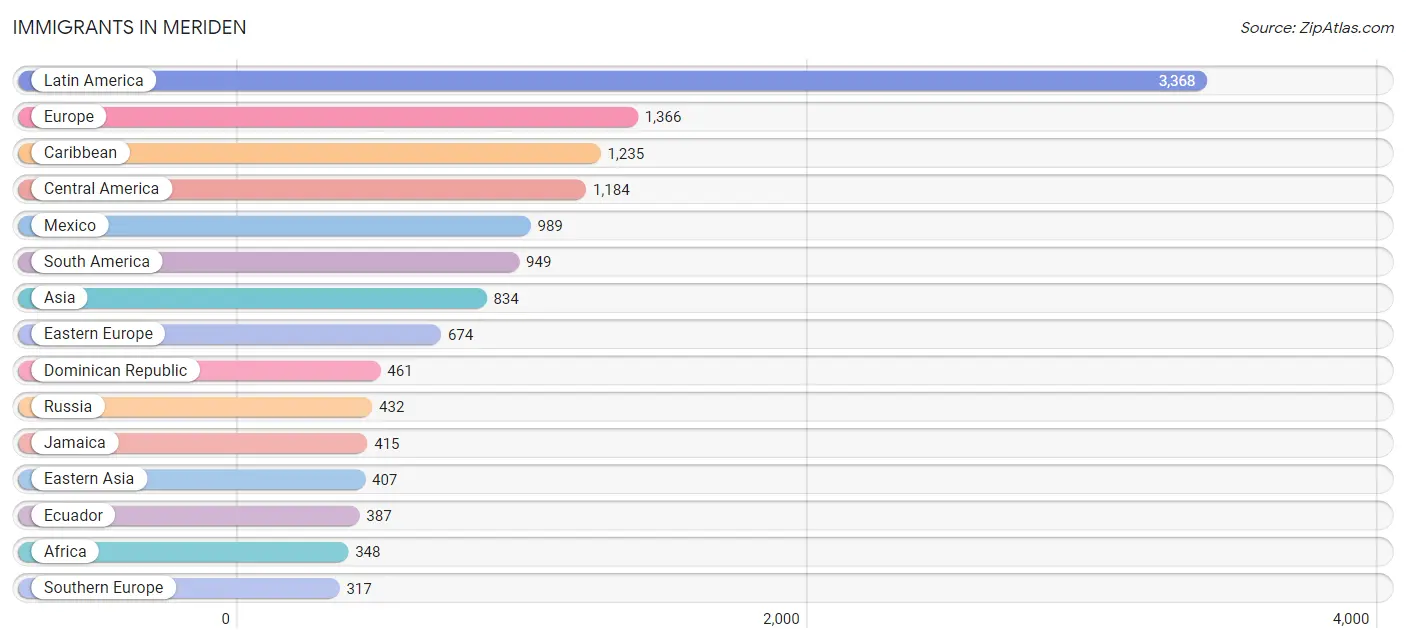
Immigrants in Meriden
The most numerous immigrant groups reported in Meriden came from Latin America (3,368 | 5.6%), Europe (1,366 | 2.3%), Caribbean (1,235 | 2.0%), Central America (1,184 | 2.0%), and Mexico (989 | 1.6%), together accounting for 13.5% of all Meriden residents.
| Immigration Origin | # Population | % Population |
| Africa | 348 | 0.6% |
| Argentina | 91 | 0.2% |
| Asia | 834 | 1.4% |
| Australia | 25 | 0.0% |
| Austria | 17 | 0.0% |
| Bahamas | 39 | 0.1% |
| Bangladesh | 10 | 0.0% |
| Belarus | 10 | 0.0% |
| Brazil | 10 | 0.0% |
| Canada | 223 | 0.4% |
| Caribbean | 1,235 | 2.0% |
| Central America | 1,184 | 2.0% |
| Chile | 26 | 0.0% |
| China | 271 | 0.4% |
| Colombia | 311 | 0.5% |
| Costa Rica | 18 | 0.0% |
| Croatia | 22 | 0.0% |
| Cuba | 97 | 0.2% |
| Czechoslovakia | 8 | 0.0% |
| Dominica | 67 | 0.1% |
| Dominican Republic | 461 | 0.8% |
| Eastern Africa | 37 | 0.1% |
| Eastern Asia | 407 | 0.7% |
| Eastern Europe | 674 | 1.1% |
| Ecuador | 387 | 0.6% |
| Egypt | 69 | 0.1% |
| El Salvador | 17 | 0.0% |
| England | 25 | 0.0% |
| Europe | 1,366 | 2.3% |
| France | 25 | 0.0% |
| Germany | 165 | 0.3% |
| Ghana | 8 | 0.0% |
| Greece | 117 | 0.2% |
| Guatemala | 83 | 0.1% |
| Haiti | 5 | 0.0% |
| Honduras | 24 | 0.0% |
| Hong Kong | 7 | 0.0% |
| India | 178 | 0.3% |
| Iran | 3 | 0.0% |
| Ireland | 14 | 0.0% |
| Italy | 190 | 0.3% |
| Jamaica | 415 | 0.7% |
| Japan | 20 | 0.0% |
| Jordan | 35 | 0.1% |
| Korea | 116 | 0.2% |
| Kuwait | 2 | 0.0% |
| Laos | 70 | 0.1% |
| Latin America | 3,368 | 5.6% |
| Mexico | 989 | 1.6% |
| Morocco | 130 | 0.2% |
| Nicaragua | 53 | 0.1% |
| Nigeria | 48 | 0.1% |
| Northern Africa | 199 | 0.3% |
| Northern Europe | 168 | 0.3% |
| Norway | 24 | 0.0% |
| Oceania | 25 | 0.0% |
| Pakistan | 12 | 0.0% |
| Peru | 76 | 0.1% |
| Philippines | 40 | 0.1% |
| Poland | 196 | 0.3% |
| Portugal | 5 | 0.0% |
| Russia | 432 | 0.7% |
| Scotland | 59 | 0.1% |
| Serbia | 6 | 0.0% |
| South Africa | 52 | 0.1% |
| South America | 949 | 1.6% |
| South Central Asia | 241 | 0.4% |
| South Eastern Asia | 149 | 0.3% |
| Southern Europe | 317 | 0.5% |
| Spain | 5 | 0.0% |
| Sri Lanka | 17 | 0.0% |
| Taiwan | 10 | 0.0% |
| Trinidad and Tobago | 151 | 0.3% |
| Uganda | 10 | 0.0% |
| Uruguay | 38 | 0.1% |
| Venezuela | 10 | 0.0% |
| Vietnam | 39 | 0.1% |
| Western Africa | 60 | 0.1% |
| Western Asia | 37 | 0.1% |
| Western Europe | 207 | 0.3% | View All 80 Rows |
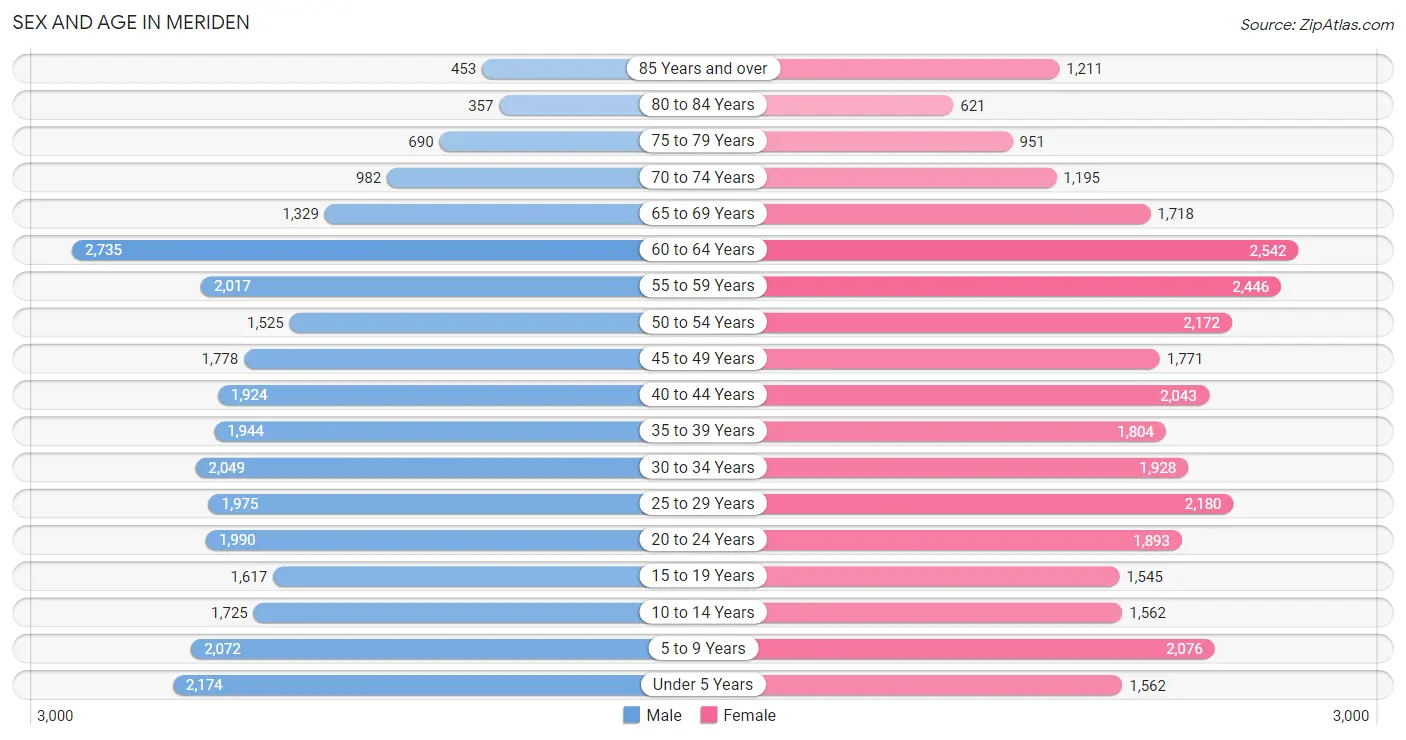
Sex and Age in Meriden
Sex and Age in Meriden
The most populous age groups in Meriden are 60 to 64 Years (2,735 | 9.3%) for men and 60 to 64 Years (2,542 | 8.1%) for women.
| Age Bracket | Male | Female |
| Under 5 Years | 2,174 (7.4%) | 1,562 (5.0%) |
| 5 to 9 Years | 2,072 (7.1%) | 2,076 (6.7%) |
| 10 to 14 Years | 1,725 (5.9%) | 1,562 (5.0%) |
| 15 to 19 Years | 1,617 (5.5%) | 1,545 (5.0%) |
| 20 to 24 Years | 1,990 (6.8%) | 1,893 (6.1%) |
| 25 to 29 Years | 1,975 (6.7%) | 2,180 (7.0%) |
| 30 to 34 Years | 2,049 (7.0%) | 1,928 (6.2%) |
| 35 to 39 Years | 1,944 (6.6%) | 1,804 (5.8%) |
| 40 to 44 Years | 1,924 (6.6%) | 2,043 (6.5%) |
| 45 to 49 Years | 1,778 (6.1%) | 1,771 (5.7%) |
| 50 to 54 Years | 1,525 (5.2%) | 2,172 (7.0%) |
| 55 to 59 Years | 2,017 (6.9%) | 2,446 (7.8%) |
| 60 to 64 Years | 2,735 (9.3%) | 2,542 (8.1%) |
| 65 to 69 Years | 1,329 (4.5%) | 1,718 (5.5%) |
| 70 to 74 Years | 982 (3.4%) | 1,195 (3.8%) |
| 75 to 79 Years | 690 (2.4%) | 951 (3.0%) |
| 80 to 84 Years | 357 (1.2%) | 621 (2.0%) |
| 85 Years and over | 453 (1.5%) | 1,211 (3.9%) |
| Total | 29,336 (100.0%) | 31,220 (100.0%) |
Families and Households in Meriden
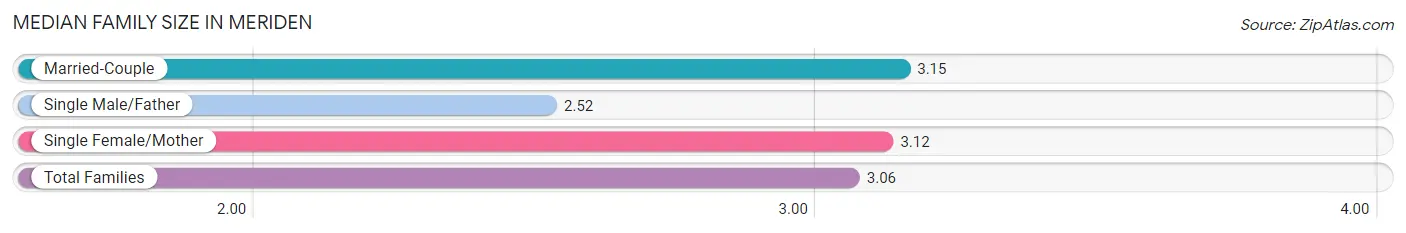
Median Family Size in Meriden
The median family size in Meriden is 3.06 persons per family, with married-couple families (8,727 | 57.5%) accounting for the largest median family size of 3.15 persons per family. On the other hand, single male/father families (1,897 | 12.5%) represent the smallest median family size with 2.52 persons per family.
| Family Type | # Families | Family Size |
| Married-Couple | 8,727 (57.5%) | 3.15 |
| Single Male/Father | 1,897 (12.5%) | 2.52 |
| Single Female/Mother | 4,553 (30.0%) | 3.12 |
| Total Families | 15,177 (100.0%) | 3.06 |
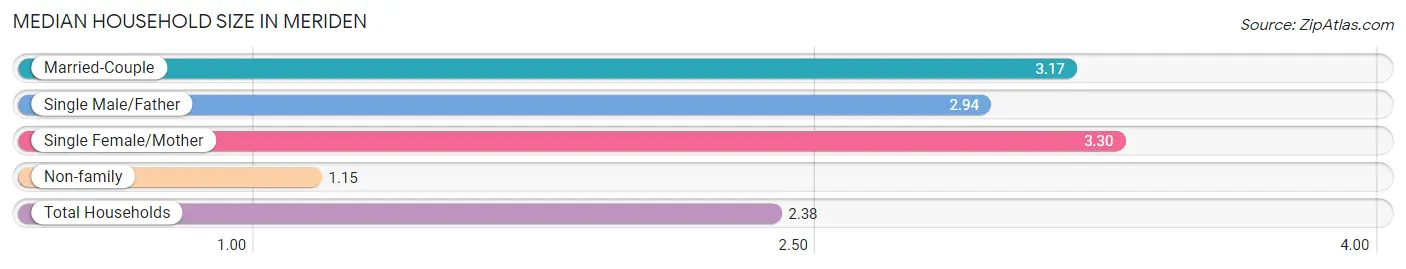
Median Household Size in Meriden
The median household size in Meriden is 2.38 persons per household, with single female/mother households (4,553 | 18.2%) accounting for the largest median household size of 3.3 persons per household. non-family households (9,841 | 39.3%) represent the smallest median household size with 1.15 persons per household.
| Household Type | # Households | Household Size |
| Married-Couple | 8,727 (34.9%) | 3.17 |
| Single Male/Father | 1,897 (7.6%) | 2.94 |
| Single Female/Mother | 4,553 (18.2%) | 3.30 |
| Non-family | 9,841 (39.3%) | 1.15 |
| Total Households | 25,018 (100.0%) | 2.38 |
Household Size by Marriage Status in Meriden
Out of a total of 25,018 households in Meriden, 15,177 (60.7%) are family households, while 9,841 (39.3%) are nonfamily households. The most numerous type of family households are 2-person households, comprising 6,832, and the most common type of nonfamily households are 1-person households, comprising 8,496.
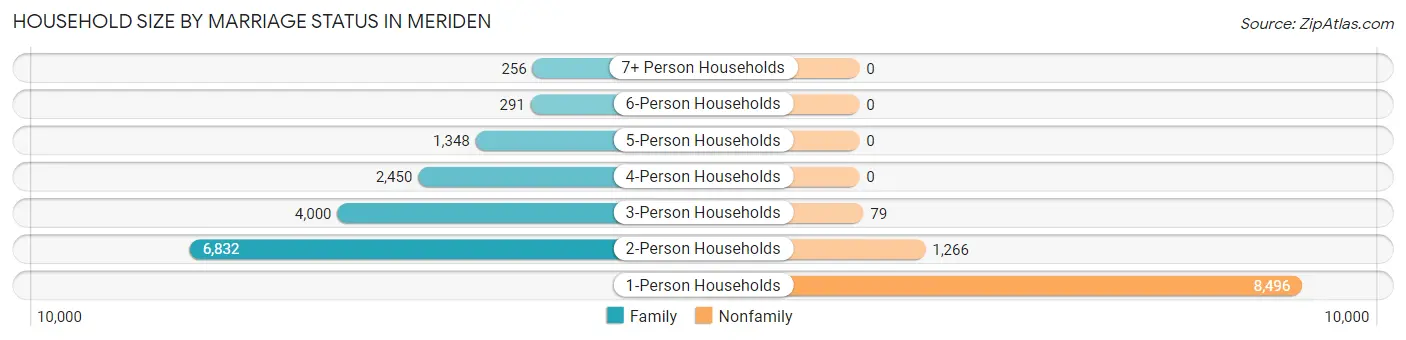
| Household Size | Family Households | Nonfamily Households |
| 1-Person Households | - | 8,496 (34.0%) |
| 2-Person Households | 6,832 (27.3%) | 1,266 (5.1%) |
| 3-Person Households | 4,000 (16.0%) | 79 (0.3%) |
| 4-Person Households | 2,450 (9.8%) | 0 (0.0%) |
| 5-Person Households | 1,348 (5.4%) | 0 (0.0%) |
| 6-Person Households | 291 (1.2%) | 0 (0.0%) |
| 7+ Person Households | 256 (1.0%) | 0 (0.0%) |
| Total | 15,177 (60.7%) | 9,841 (39.3%) |
Female Fertility in Meriden
Fertility by Age in Meriden
Average fertility rate in Meriden is 54.0 births per 1,000 women. Women in the age bracket of 20 to 34 years have the highest fertility rate with 94.0 births per 1,000 women. Women in the age bracket of 20 to 34 years acount for 77.2% of all women with births.
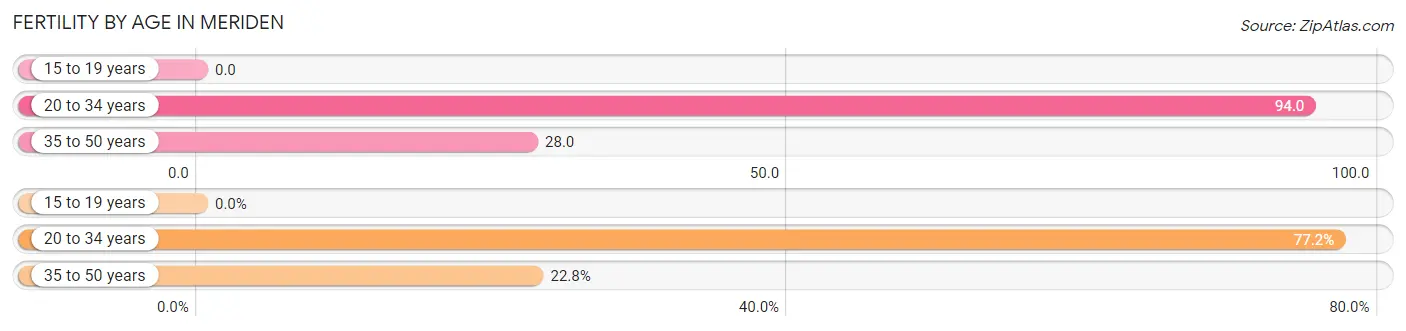
| Age Bracket | Women with Births | Births / 1,000 Women |
| 15 to 19 years | 0 (0.0%) | 0.0 |
| 20 to 34 years | 563 (77.2%) | 94.0 |
| 35 to 50 years | 166 (22.8%) | 28.0 |
| Total | 729 (100.0%) | 54.0 |
Fertility by Age by Marriage Status in Meriden
43.2% of women with births (729) in Meriden are married. The highest percentage of unmarried women with births falls into 35 to 50 years age bracket with 76.5% of them unmarried at the time of birth, while the lowest percentage of unmarried women with births belong to 20 to 34 years age bracket with 51.0% of them unmarried.
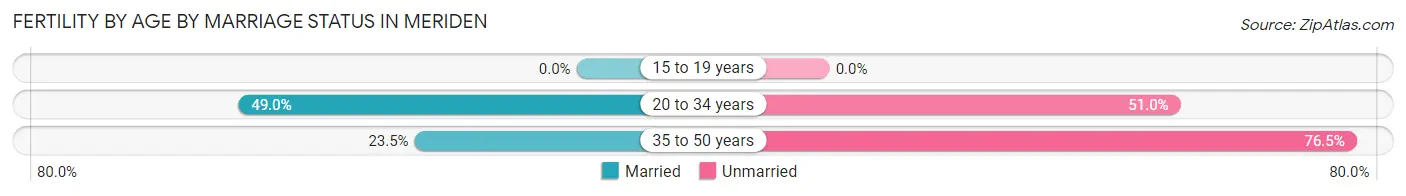
| Age Bracket | Married | Unmarried |
| 15 to 19 years | 0 (0.0%) | 0 (0.0%) |
| 20 to 34 years | 276 (49.0%) | 287 (51.0%) |
| 35 to 50 years | 39 (23.5%) | 127 (76.5%) |
| Total | 315 (43.2%) | 414 (56.8%) |
Fertility by Education in Meriden
Average fertility rate in Meriden is 54.0 births per 1,000 women. Women with the education attainment of less than high school have the highest fertility rate of 112.0 births per 1,000 women, while women with the education attainment of college or associate's degree have the lowest fertility at 27.0 births per 1,000 women. Women with the education attainment of less than high school represent 36.3% of all women with births.
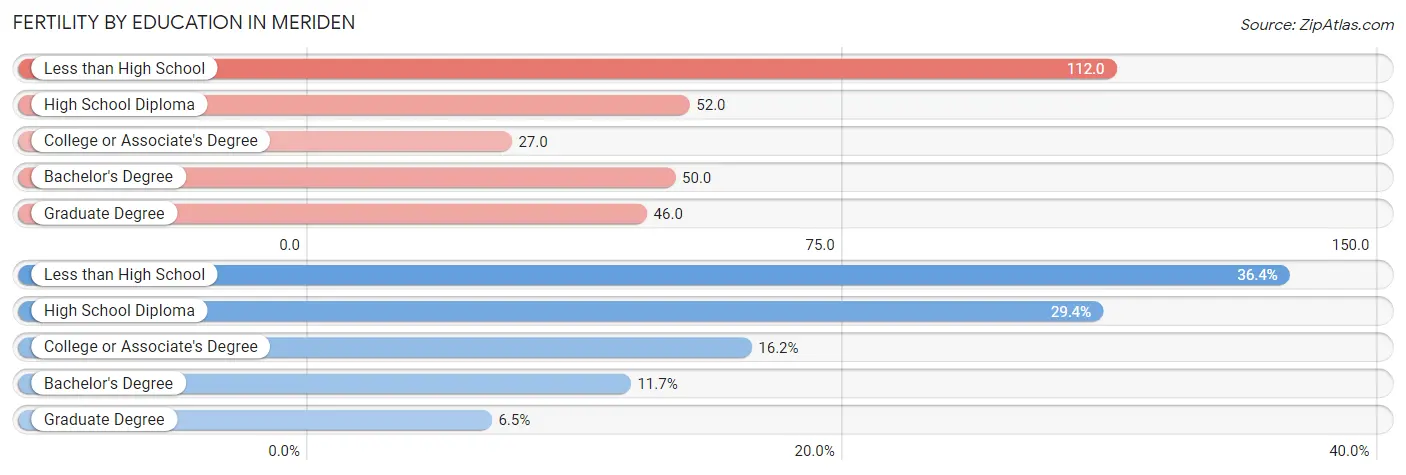
| Educational Attainment | Women with Births | Births / 1,000 Women |
| Less than High School | 265 (36.3%) | 112.0 |
| High School Diploma | 214 (29.4%) | 52.0 |
| College or Associate's Degree | 118 (16.2%) | 27.0 |
| Bachelor's Degree | 85 (11.7%) | 50.0 |
| Graduate Degree | 47 (6.5%) | 46.0 |
| Total | 729 (100.0%) | 54.0 |
Fertility by Education by Marriage Status in Meriden
56.8% of women with births in Meriden are unmarried. Women with the educational attainment of graduate degree are most likely to be married with 100.0% of them married at childbirth, while women with the educational attainment of bachelor's degree are least likely to be married with 80.0% of them unmarried at childbirth.
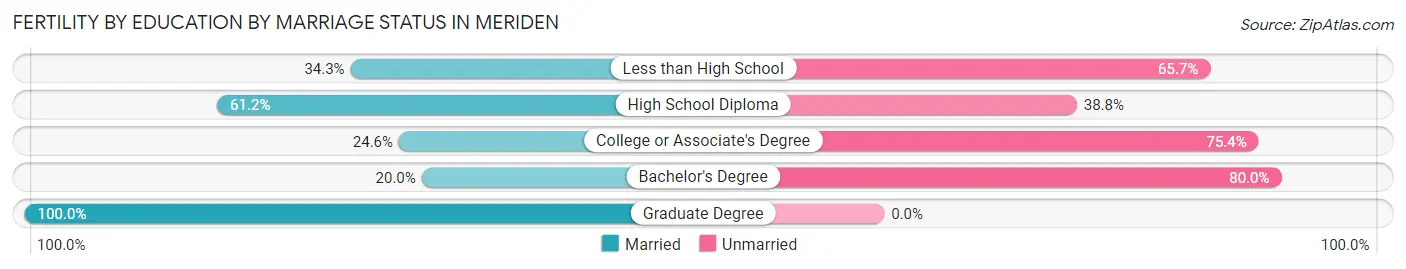
| Educational Attainment | Married | Unmarried |
| Less than High School | 91 (34.3%) | 174 (65.7%) |
| High School Diploma | 131 (61.2%) | 83 (38.8%) |
| College or Associate's Degree | 29 (24.6%) | 89 (75.4%) |
| Bachelor's Degree | 17 (20.0%) | 68 (80.0%) |
| Graduate Degree | 47 (100.0%) | 0 (0.0%) |
| Total | 315 (43.2%) | 414 (56.8%) |
Employment Characteristics in Meriden
Employment by Class of Employer in Meriden
Among the 27,688 employed individuals in Meriden, private company employees (19,583 | 70.7%), not-for-profit organizations (2,765 | 10.0%), and local government employees (1,886 | 6.8%) make up the most common classes of employment.
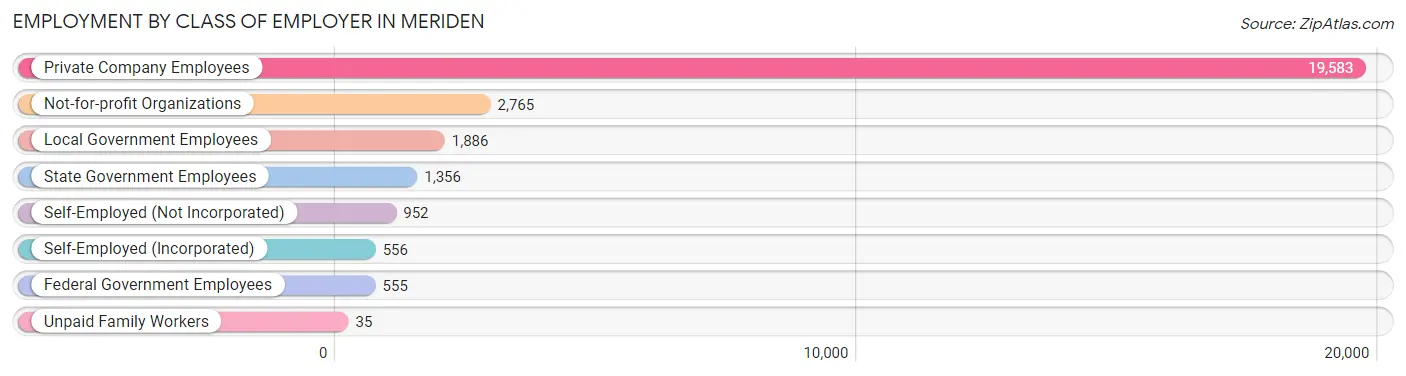
| Employer Class | # Employees | % Employees |
| Private Company Employees | 19,583 | 70.7% |
| Self-Employed (Incorporated) | 556 | 2.0% |
| Self-Employed (Not Incorporated) | 952 | 3.4% |
| Not-for-profit Organizations | 2,765 | 10.0% |
| Local Government Employees | 1,886 | 6.8% |
| State Government Employees | 1,356 | 4.9% |
| Federal Government Employees | 555 | 2.0% |
| Unpaid Family Workers | 35 | 0.1% |
| Total | 27,688 | 100.0% |
Employment Status by Age in Meriden
According to the labor force statistics for Meriden, out of the total population over 16 years of age (48,513), 63.8% or 30,951 individuals are in the labor force, with 8.4% or 2,600 of them unemployed. The age group with the highest labor force participation rate is 25 to 29 years, with 83.9% or 3,486 individuals in the labor force. Within the labor force, the 16 to 19 years age range has the highest percentage of unemployed individuals, with 36.2% or 364 of them being unemployed.
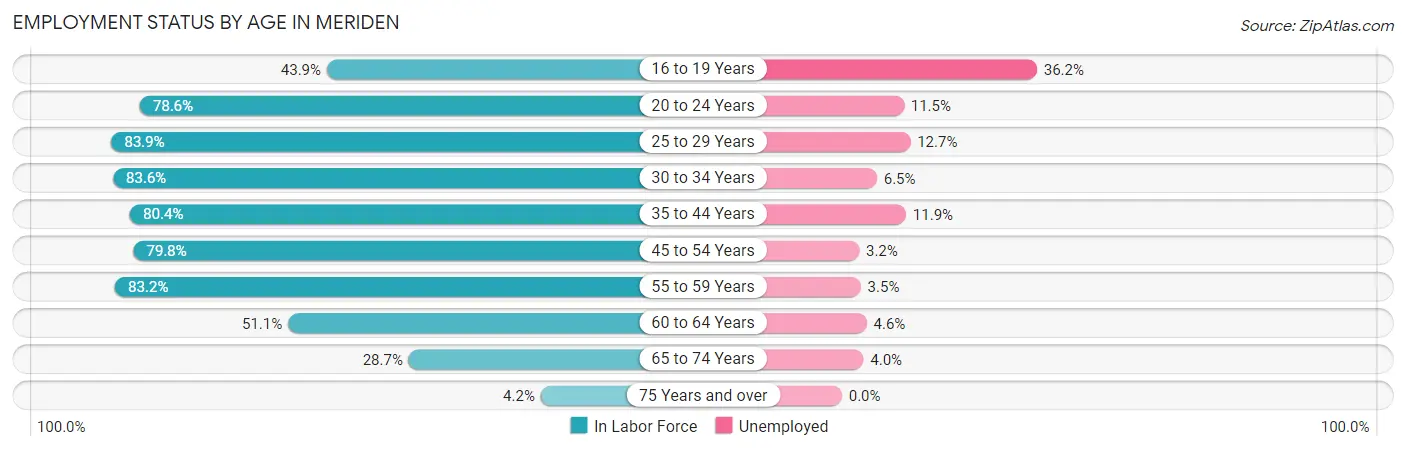
| Age Bracket | In Labor Force | Unemployed |
| 16 to 19 Years | 1,005 (43.9%) | 364 (36.2%) |
| 20 to 24 Years | 3,052 (78.6%) | 351 (11.5%) |
| 25 to 29 Years | 3,486 (83.9%) | 443 (12.7%) |
| 30 to 34 Years | 3,325 (83.6%) | 216 (6.5%) |
| 35 to 44 Years | 6,203 (80.4%) | 738 (11.9%) |
| 45 to 54 Years | 5,782 (79.8%) | 185 (3.2%) |
| 55 to 59 Years | 3,713 (83.2%) | 130 (3.5%) |
| 60 to 64 Years | 2,697 (51.1%) | 124 (4.6%) |
| 65 to 74 Years | 1,499 (28.7%) | 60 (4.0%) |
| 75 Years and over | 180 (4.2%) | 0 (0.0%) |
| Total | 30,951 (63.8%) | 2,600 (8.4%) |
Employment Status by Educational Attainment in Meriden
According to labor force statistics for Meriden, 76.8% of individuals (25,216) out of the total population between 25 and 64 years of age (32,833) are in the labor force, with 7.3% or 1,841 of them being unemployed. The group with the highest labor force participation rate are those with the educational attainment of bachelor's degree or higher, with 90.2% or 6,271 individuals in the labor force. Within the labor force, individuals with less than high school education have the highest percentage of unemployment, with 15.4% or 381 of them being unemployed.
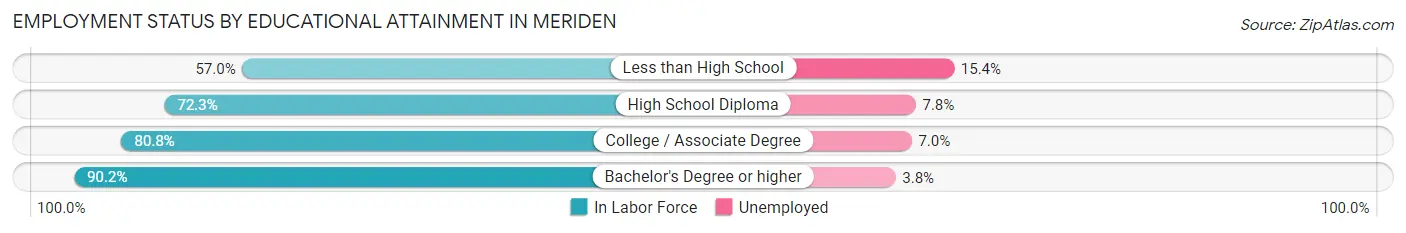
| Educational Attainment | In Labor Force | Unemployed |
| Less than High School | 2,472 (57.0%) | 668 (15.4%) |
| High School Diploma | 8,114 (72.3%) | 875 (7.8%) |
| College / Associate Degree | 8,340 (80.8%) | 723 (7.0%) |
| Bachelor's Degree or higher | 6,271 (90.2%) | 264 (3.8%) |
| Total | 25,216 (76.8%) | 2,397 (7.3%) |
Employment Occupations by Sex in Meriden
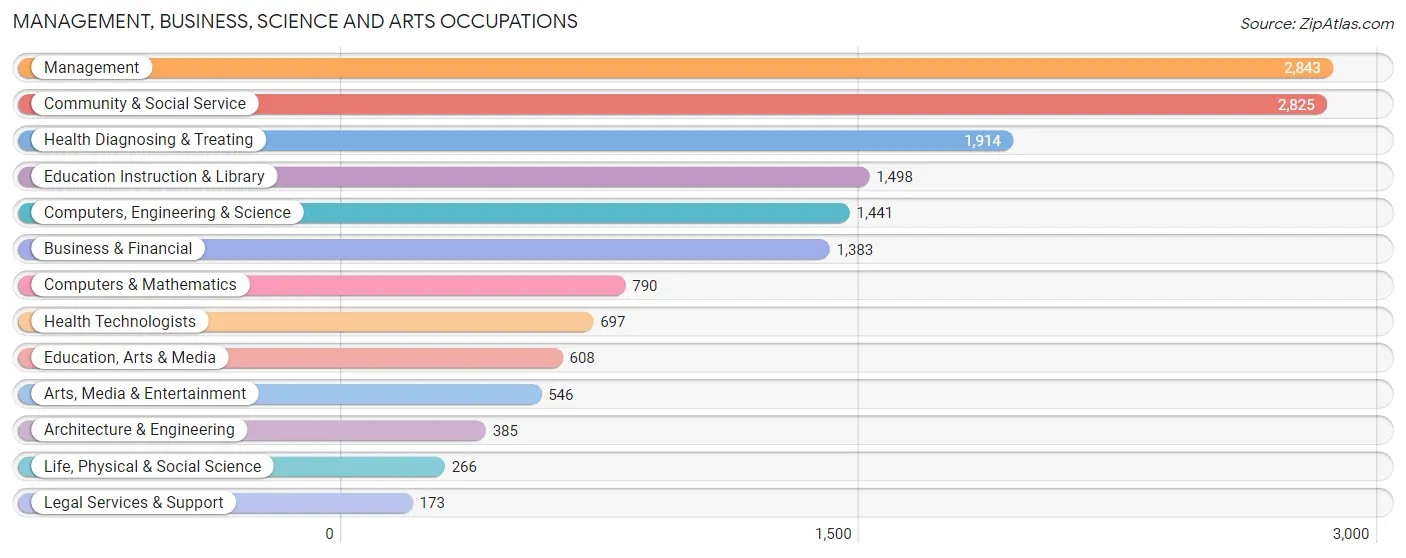
Management, Business, Science and Arts Occupations
The most common Management, Business, Science and Arts occupations in Meriden are Management (2,843 | 10.0%), Community & Social Service (2,825 | 10.0%), Health Diagnosing & Treating (1,914 | 6.8%), Education Instruction & Library (1,498 | 5.3%), and Computers, Engineering & Science (1,441 | 5.1%).
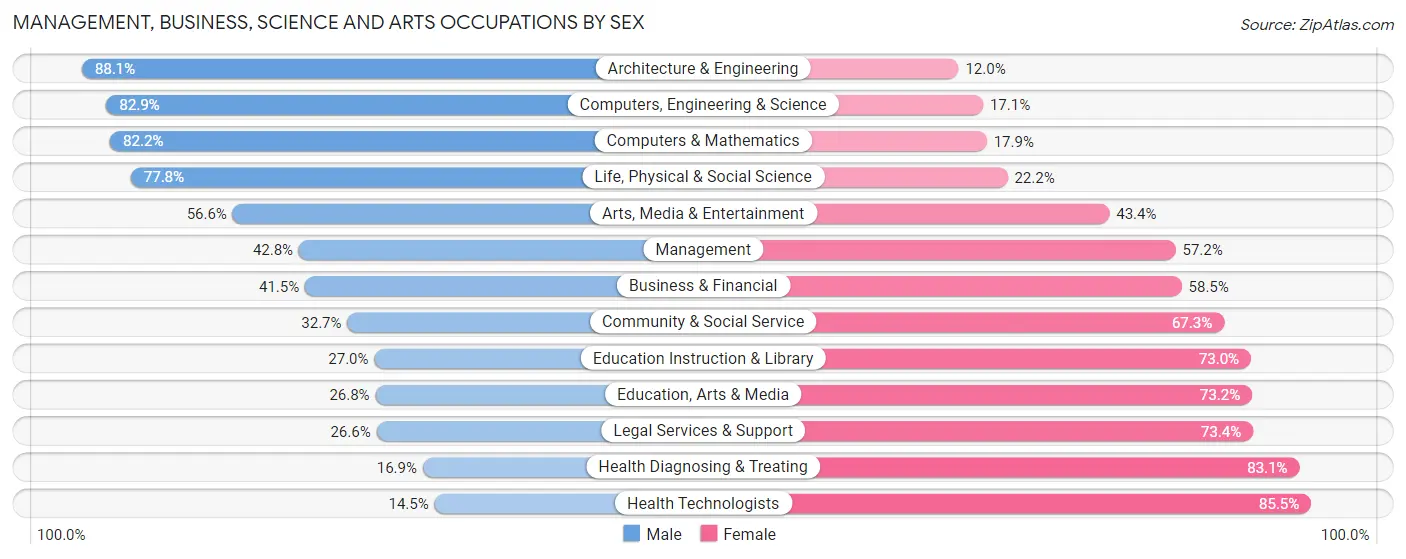
Management, Business, Science and Arts Occupations by Sex
Within the Management, Business, Science and Arts occupations in Meriden, the most male-oriented occupations are Architecture & Engineering (88.0%), Computers, Engineering & Science (82.9%), and Computers & Mathematics (82.2%), while the most female-oriented occupations are Health Technologists (85.5%), Health Diagnosing & Treating (83.1%), and Legal Services & Support (73.4%).
| Occupation | Male | Female |
| Management | 1,216 (42.8%) | 1,627 (57.2%) |
| Business & Financial | 574 (41.5%) | 809 (58.5%) |
| Computers, Engineering & Science | 1,195 (82.9%) | 246 (17.1%) |
| Computers & Mathematics | 649 (82.2%) | 141 (17.8%) |
| Architecture & Engineering | 339 (88.0%) | 46 (11.9%) |
| Life, Physical & Social Science | 207 (77.8%) | 59 (22.2%) |
| Community & Social Service | 923 (32.7%) | 1,902 (67.3%) |
| Education, Arts & Media | 163 (26.8%) | 445 (73.2%) |
| Legal Services & Support | 46 (26.6%) | 127 (73.4%) |
| Education Instruction & Library | 405 (27.0%) | 1,093 (73.0%) |
| Arts, Media & Entertainment | 309 (56.6%) | 237 (43.4%) |
| Health Diagnosing & Treating | 324 (16.9%) | 1,590 (83.1%) |
| Health Technologists | 101 (14.5%) | 596 (85.5%) |
| Total (Category) | 4,232 (40.7%) | 6,174 (59.3%) |
| Total (Overall) | 13,999 (49.4%) | 14,316 (50.6%) |
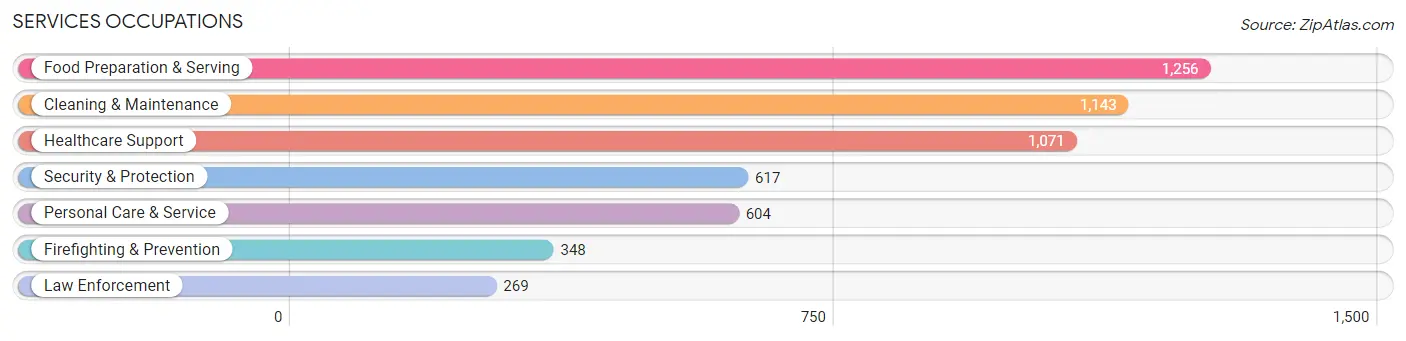
Services Occupations
The most common Services occupations in Meriden are Food Preparation & Serving (1,256 | 4.4%), Cleaning & Maintenance (1,143 | 4.0%), Healthcare Support (1,071 | 3.8%), Security & Protection (617 | 2.2%), and Personal Care & Service (604 | 2.1%).
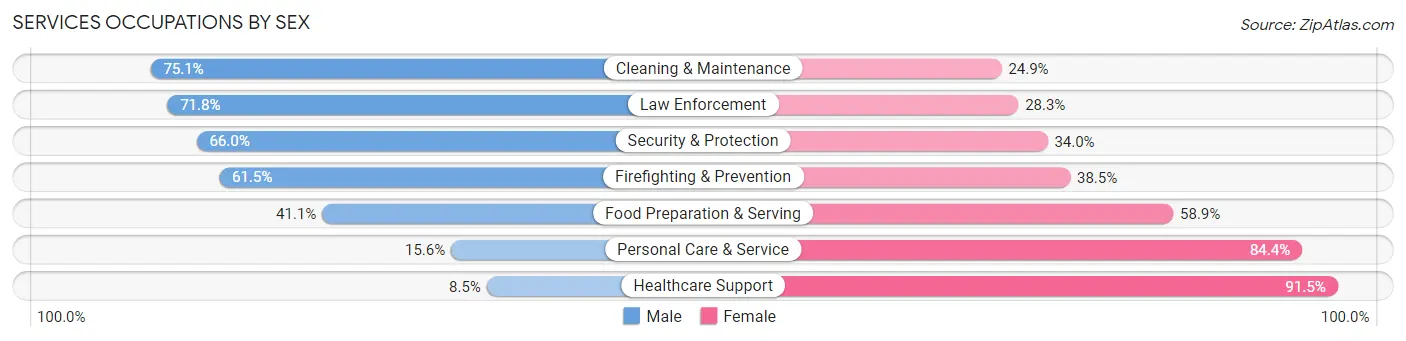
Services Occupations by Sex
Within the Services occupations in Meriden, the most male-oriented occupations are Cleaning & Maintenance (75.1%), Law Enforcement (71.8%), and Security & Protection (66.0%), while the most female-oriented occupations are Healthcare Support (91.5%), Personal Care & Service (84.4%), and Food Preparation & Serving (58.9%).
| Occupation | Male | Female |
| Healthcare Support | 91 (8.5%) | 980 (91.5%) |
| Security & Protection | 407 (66.0%) | 210 (34.0%) |
| Firefighting & Prevention | 214 (61.5%) | 134 (38.5%) |
| Law Enforcement | 193 (71.8%) | 76 (28.2%) |
| Food Preparation & Serving | 516 (41.1%) | 740 (58.9%) |
| Cleaning & Maintenance | 858 (75.1%) | 285 (24.9%) |
| Personal Care & Service | 94 (15.6%) | 510 (84.4%) |
| Total (Category) | 1,966 (41.9%) | 2,725 (58.1%) |
| Total (Overall) | 13,999 (49.4%) | 14,316 (50.6%) |
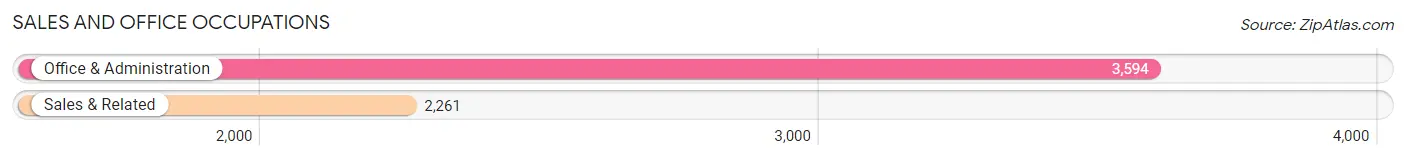
Sales and Office Occupations
The most common Sales and Office occupations in Meriden are Office & Administration (3,594 | 12.7%), and Sales & Related (2,261 | 8.0%).
Sales and Office Occupations by Sex
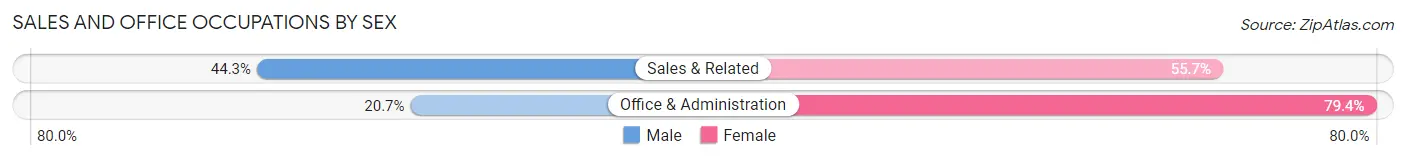
| Occupation | Male | Female |
| Sales & Related | 1,001 (44.3%) | 1,260 (55.7%) |
| Office & Administration | 742 (20.6%) | 2,852 (79.3%) |
| Total (Category) | 1,743 (29.8%) | 4,112 (70.2%) |
| Total (Overall) | 13,999 (49.4%) | 14,316 (50.6%) |
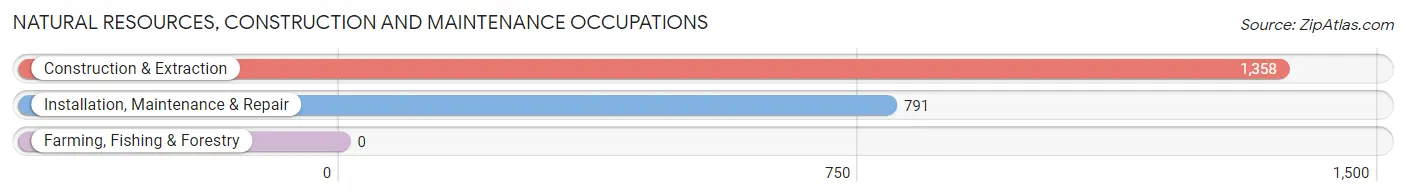
Natural Resources, Construction and Maintenance Occupations
The most common Natural Resources, Construction and Maintenance occupations in Meriden are Construction & Extraction (1,358 | 4.8%), and Installation, Maintenance & Repair (791 | 2.8%).
Natural Resources, Construction and Maintenance Occupations by Sex
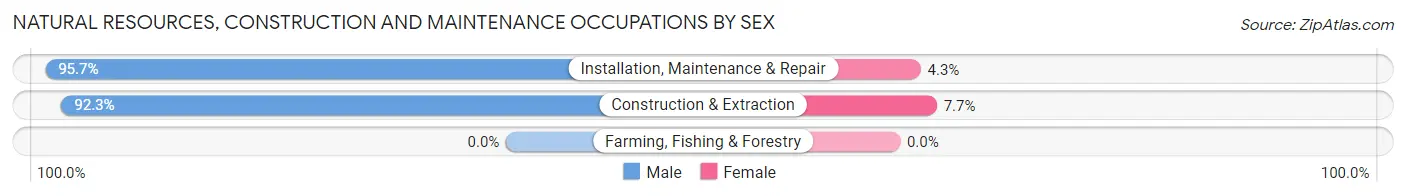
| Occupation | Male | Female |
| Farming, Fishing & Forestry | 0 (0.0%) | 0 (0.0%) |
| Construction & Extraction | 1,254 (92.3%) | 104 (7.7%) |
| Installation, Maintenance & Repair | 757 (95.7%) | 34 (4.3%) |
| Total (Category) | 2,011 (93.6%) | 138 (6.4%) |
| Total (Overall) | 13,999 (49.4%) | 14,316 (50.6%) |
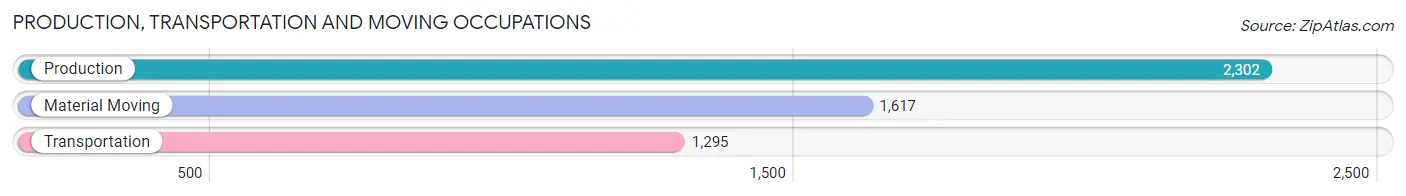
Production, Transportation and Moving Occupations
The most common Production, Transportation and Moving occupations in Meriden are Production (2,302 | 8.1%), Material Moving (1,617 | 5.7%), and Transportation (1,295 | 4.6%).
Production, Transportation and Moving Occupations by Sex
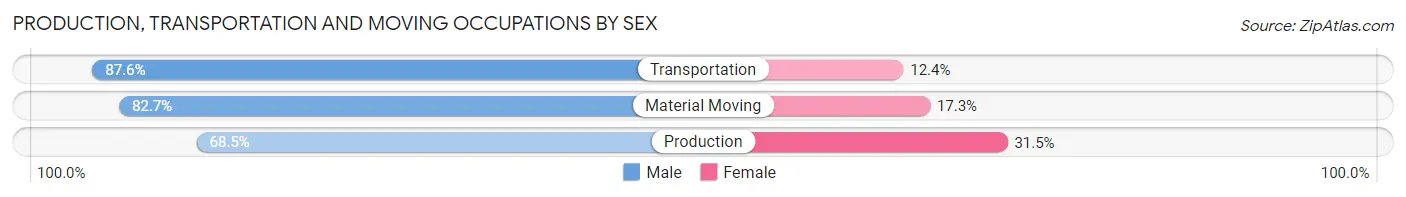
| Occupation | Male | Female |
| Production | 1,576 (68.5%) | 726 (31.5%) |
| Transportation | 1,134 (87.6%) | 161 (12.4%) |
| Material Moving | 1,337 (82.7%) | 280 (17.3%) |
| Total (Category) | 4,047 (77.6%) | 1,167 (22.4%) |
| Total (Overall) | 13,999 (49.4%) | 14,316 (50.6%) |
Employment Industries by Sex in Meriden
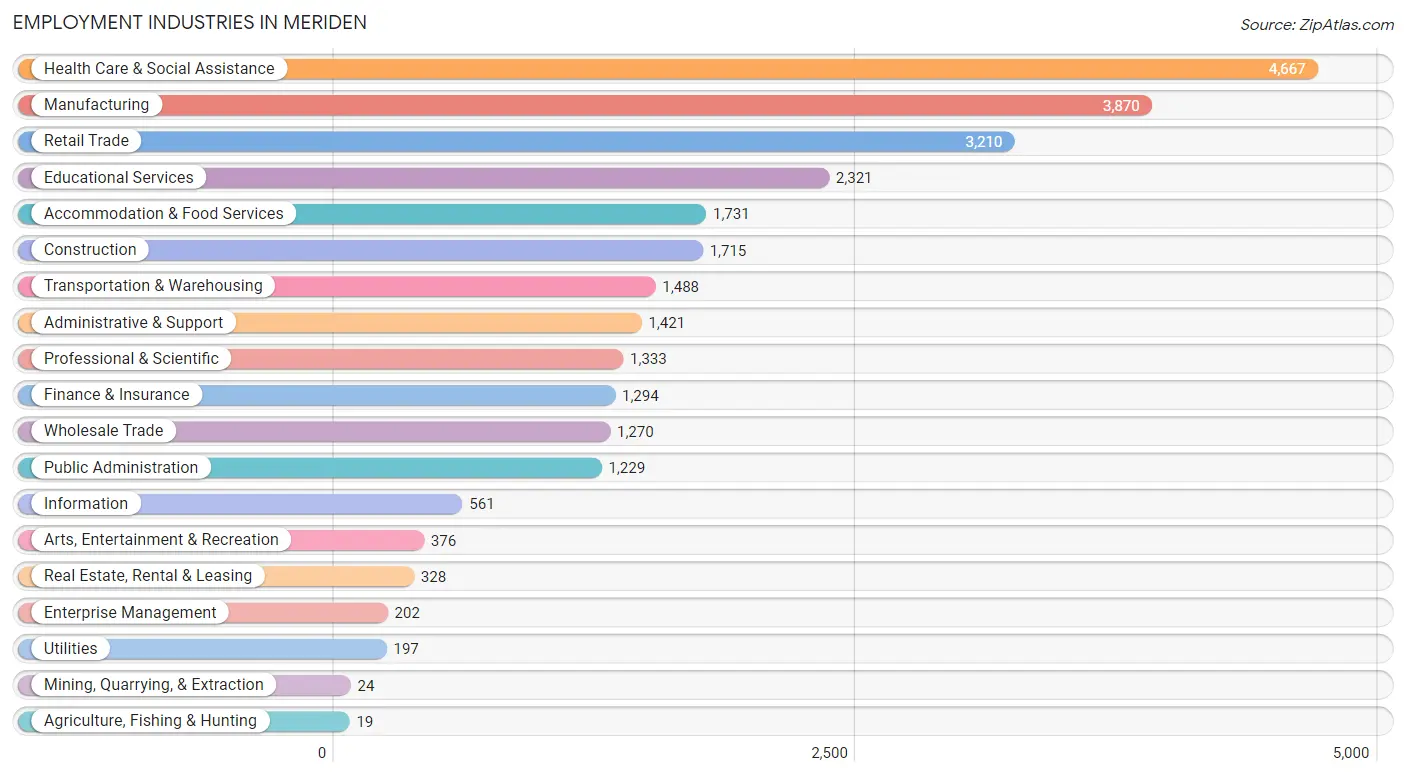
Employment Industries in Meriden
The major employment industries in Meriden include Health Care & Social Assistance (4,667 | 16.5%), Manufacturing (3,870 | 13.7%), Retail Trade (3,210 | 11.3%), Educational Services (2,321 | 8.2%), and Accommodation & Food Services (1,731 | 6.1%).
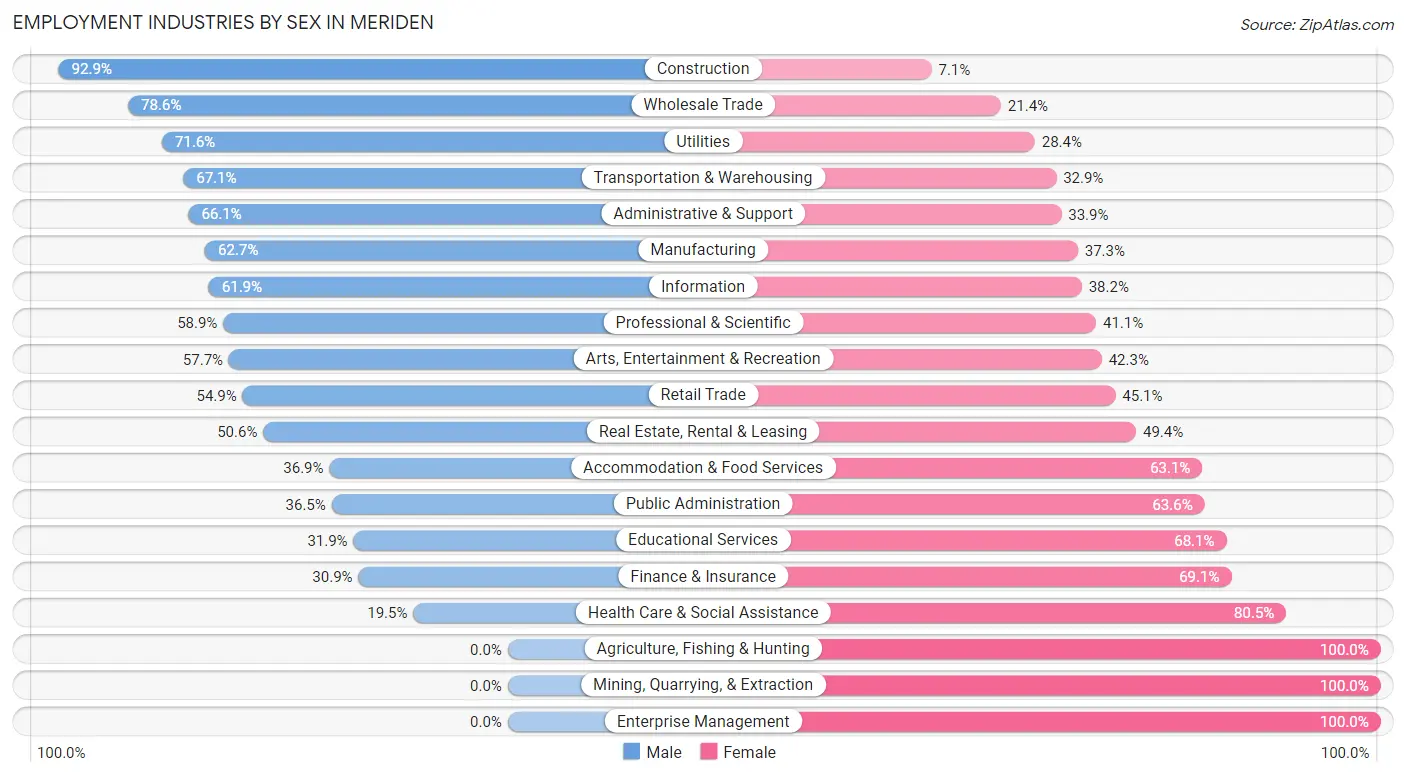
Employment Industries by Sex in Meriden
The Meriden industries that see more men than women are Construction (92.9%), Wholesale Trade (78.6%), and Utilities (71.6%), whereas the industries that tend to have a higher number of women are Agriculture, Fishing & Hunting (100.0%), Mining, Quarrying, & Extraction (100.0%), and Enterprise Management (100.0%).
| Industry | Male | Female |
| Agriculture, Fishing & Hunting | 0 (0.0%) | 19 (100.0%) |
| Mining, Quarrying, & Extraction | 0 (0.0%) | 24 (100.0%) |
| Construction | 1,594 (92.9%) | 121 (7.1%) |
| Manufacturing | 2,425 (62.7%) | 1,445 (37.3%) |
| Wholesale Trade | 998 (78.6%) | 272 (21.4%) |
| Retail Trade | 1,762 (54.9%) | 1,448 (45.1%) |
| Transportation & Warehousing | 999 (67.1%) | 489 (32.9%) |
| Utilities | 141 (71.6%) | 56 (28.4%) |
| Information | 347 (61.9%) | 214 (38.2%) |
| Finance & Insurance | 400 (30.9%) | 894 (69.1%) |
| Real Estate, Rental & Leasing | 166 (50.6%) | 162 (49.4%) |
| Professional & Scientific | 785 (58.9%) | 548 (41.1%) |
| Enterprise Management | 0 (0.0%) | 202 (100.0%) |
| Administrative & Support | 939 (66.1%) | 482 (33.9%) |
| Educational Services | 741 (31.9%) | 1,580 (68.1%) |
| Health Care & Social Assistance | 912 (19.5%) | 3,755 (80.5%) |
| Arts, Entertainment & Recreation | 217 (57.7%) | 159 (42.3%) |
| Accommodation & Food Services | 639 (36.9%) | 1,092 (63.1%) |
| Public Administration | 448 (36.4%) | 781 (63.5%) |
| Total | 13,999 (49.4%) | 14,316 (50.6%) |
Education in Meriden
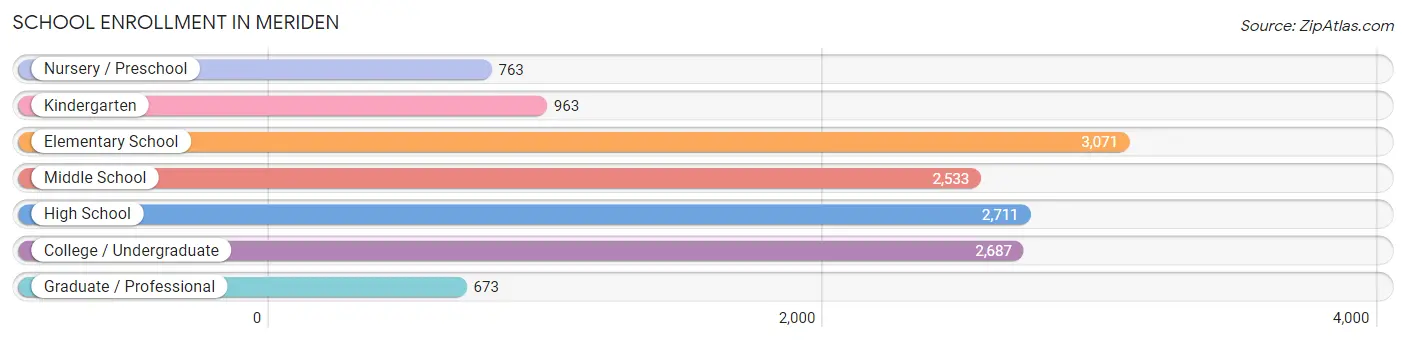
School Enrollment in Meriden
The most common levels of schooling among the 13,401 students in Meriden are elementary school (3,071 | 22.9%), high school (2,711 | 20.2%), and college / undergraduate (2,687 | 20.1%).
| School Level | # Students | % Students |
| Nursery / Preschool | 763 | 5.7% |
| Kindergarten | 963 | 7.2% |
| Elementary School | 3,071 | 22.9% |
| Middle School | 2,533 | 18.9% |
| High School | 2,711 | 20.2% |
| College / Undergraduate | 2,687 | 20.1% |
| Graduate / Professional | 673 | 5.0% |
| Total | 13,401 | 100.0% |
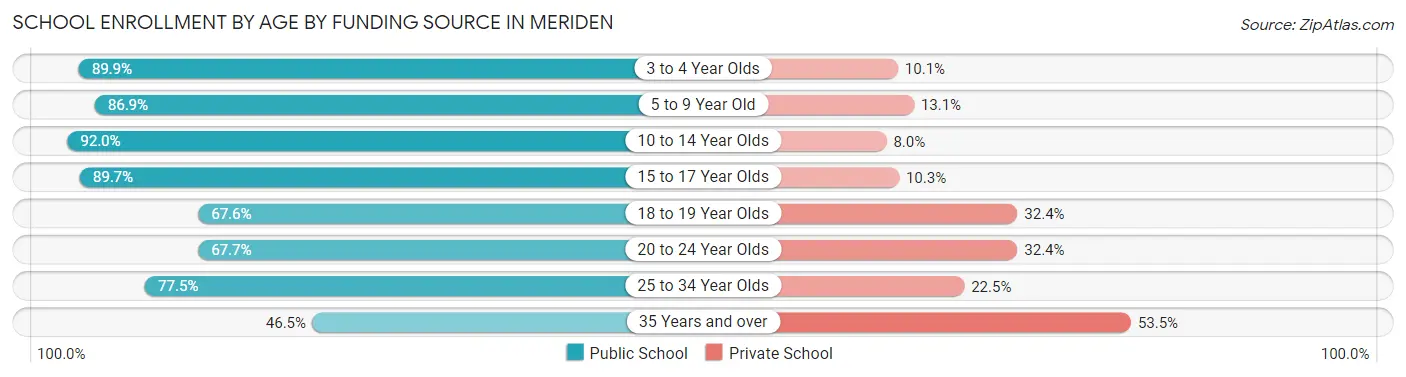
School Enrollment by Age by Funding Source in Meriden
Out of a total of 13,401 students who are enrolled in schools in Meriden, 2,359 (17.6%) attend a private institution, while the remaining 11,042 (82.4%) are enrolled in public schools. The age group of 35 years and over has the highest likelihood of being enrolled in private schools, with 503 (53.5% in the age bracket) enrolled. Conversely, the age group of 10 to 14 year olds has the lowest likelihood of being enrolled in a private school, with 2,967 (92.0% in the age bracket) attending a public institution.
| Age Bracket | Public School | Private School |
| 3 to 4 Year Olds | 552 (89.9%) | 62 (10.1%) |
| 5 to 9 Year Old | 3,480 (86.9%) | 524 (13.1%) |
| 10 to 14 Year Olds | 2,967 (92.0%) | 257 (8.0%) |
| 15 to 17 Year Olds | 1,680 (89.7%) | 193 (10.3%) |
| 18 to 19 Year Olds | 602 (67.6%) | 288 (32.4%) |
| 20 to 24 Year Olds | 822 (67.6%) | 393 (32.4%) |
| 25 to 34 Year Olds | 497 (77.5%) | 144 (22.5%) |
| 35 Years and over | 437 (46.5%) | 503 (53.5%) |
| Total | 11,042 (82.4%) | 2,359 (17.6%) |
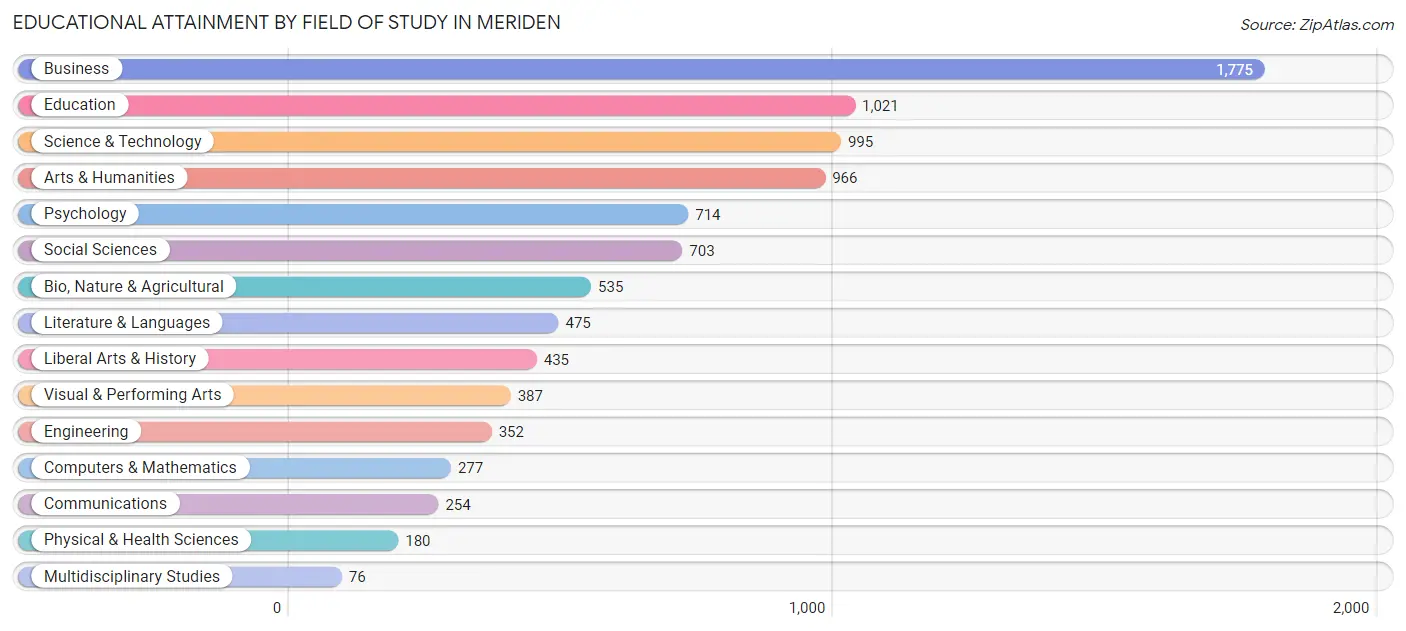
Educational Attainment by Field of Study in Meriden
Business (1,775 | 19.4%), education (1,021 | 11.2%), science & technology (995 | 10.9%), arts & humanities (966 | 10.6%), and psychology (714 | 7.8%) are the most common fields of study among 9,145 individuals in Meriden who have obtained a bachelor's degree or higher.
| Field of Study | # Graduates | % Graduates |
| Computers & Mathematics | 277 | 3.0% |
| Bio, Nature & Agricultural | 535 | 5.9% |
| Physical & Health Sciences | 180 | 2.0% |
| Psychology | 714 | 7.8% |
| Social Sciences | 703 | 7.7% |
| Engineering | 352 | 3.8% |
| Multidisciplinary Studies | 76 | 0.8% |
| Science & Technology | 995 | 10.9% |
| Business | 1,775 | 19.4% |
| Education | 1,021 | 11.2% |
| Literature & Languages | 475 | 5.2% |
| Liberal Arts & History | 435 | 4.8% |
| Visual & Performing Arts | 387 | 4.2% |
| Communications | 254 | 2.8% |
| Arts & Humanities | 966 | 10.6% |
| Total | 9,145 | 100.0% |
Transportation & Commute in Meriden
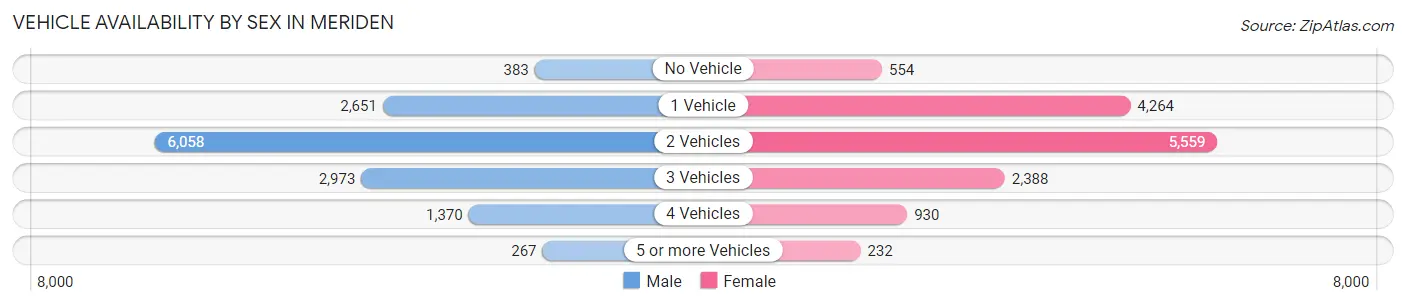
Vehicle Availability by Sex in Meriden
The most prevalent vehicle ownership categories in Meriden are males with 2 vehicles (6,058, accounting for 44.2%) and females with 2 vehicles (5,559, making up 43.5%).
| Vehicles Available | Male | Female |
| No Vehicle | 383 (2.8%) | 554 (4.0%) |
| 1 Vehicle | 2,651 (19.4%) | 4,264 (30.6%) |
| 2 Vehicles | 6,058 (44.2%) | 5,559 (39.9%) |
| 3 Vehicles | 2,973 (21.7%) | 2,388 (17.2%) |
| 4 Vehicles | 1,370 (10.0%) | 930 (6.7%) |
| 5 or more Vehicles | 267 (1.9%) | 232 (1.7%) |
| Total | 13,702 (100.0%) | 13,927 (100.0%) |
Commute Time in Meriden
The most frequently occuring commute durations in Meriden are 15 to 19 minutes (5,251 commuters, 20.3%), 10 to 14 minutes (4,030 commuters, 15.6%), and 20 to 24 minutes (3,521 commuters, 13.6%).
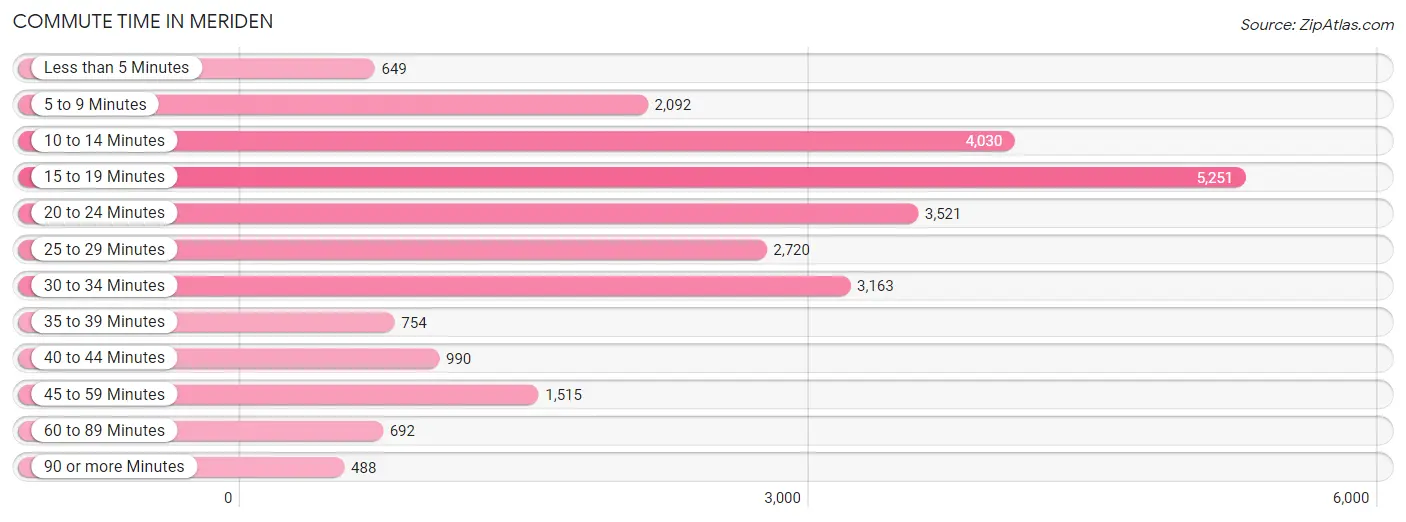
| Commute Time | # Commuters | % Commuters |
| Less than 5 Minutes | 649 | 2.5% |
| 5 to 9 Minutes | 2,092 | 8.1% |
| 10 to 14 Minutes | 4,030 | 15.6% |
| 15 to 19 Minutes | 5,251 | 20.3% |
| 20 to 24 Minutes | 3,521 | 13.6% |
| 25 to 29 Minutes | 2,720 | 10.5% |
| 30 to 34 Minutes | 3,163 | 12.2% |
| 35 to 39 Minutes | 754 | 2.9% |
| 40 to 44 Minutes | 990 | 3.8% |
| 45 to 59 Minutes | 1,515 | 5.9% |
| 60 to 89 Minutes | 692 | 2.7% |
| 90 or more Minutes | 488 | 1.9% |
Commute Time by Sex in Meriden
The most common commute times in Meriden are 15 to 19 minutes (2,657 commuters, 20.4%) for males and 15 to 19 minutes (2,594 commuters, 20.2%) for females.
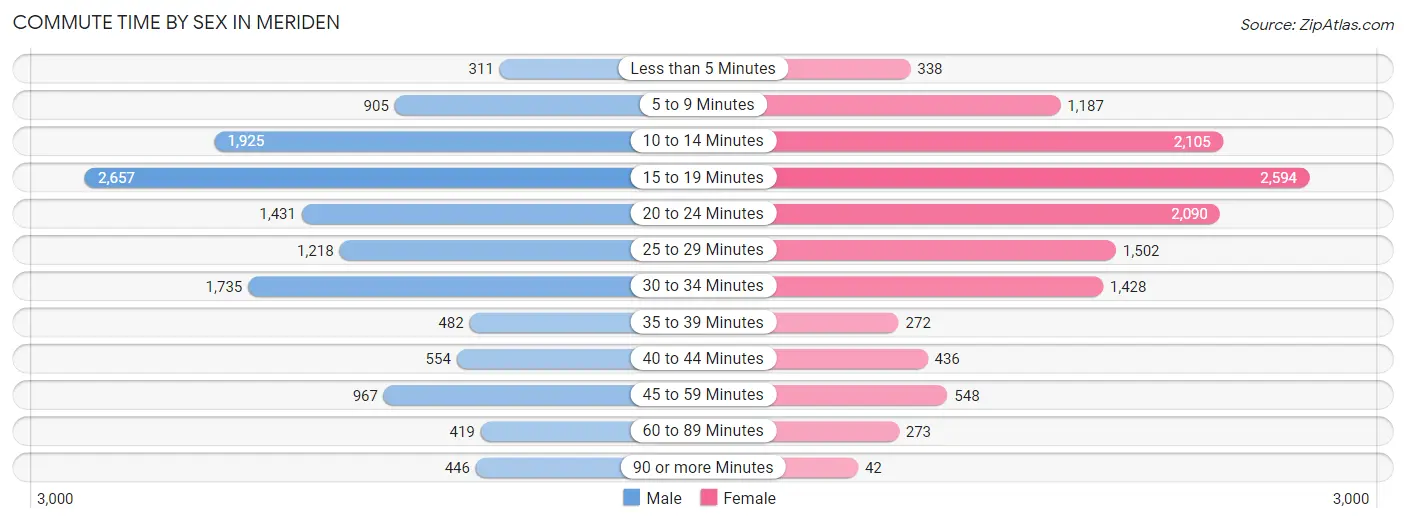
| Commute Time | Male | Female |
| Less than 5 Minutes | 311 (2.4%) | 338 (2.6%) |
| 5 to 9 Minutes | 905 (6.9%) | 1,187 (9.3%) |
| 10 to 14 Minutes | 1,925 (14.7%) | 2,105 (16.4%) |
| 15 to 19 Minutes | 2,657 (20.4%) | 2,594 (20.2%) |
| 20 to 24 Minutes | 1,431 (11.0%) | 2,090 (16.3%) |
| 25 to 29 Minutes | 1,218 (9.3%) | 1,502 (11.7%) |
| 30 to 34 Minutes | 1,735 (13.3%) | 1,428 (11.1%) |
| 35 to 39 Minutes | 482 (3.7%) | 272 (2.1%) |
| 40 to 44 Minutes | 554 (4.3%) | 436 (3.4%) |
| 45 to 59 Minutes | 967 (7.4%) | 548 (4.3%) |
| 60 to 89 Minutes | 419 (3.2%) | 273 (2.1%) |
| 90 or more Minutes | 446 (3.4%) | 42 (0.3%) |
Time of Departure to Work by Sex in Meriden
The most frequent times of departure to work in Meriden are 7:00 AM to 7:29 AM (2,194, 16.8%) for males and 7:30 AM to 7:59 AM (2,012, 15.7%) for females.
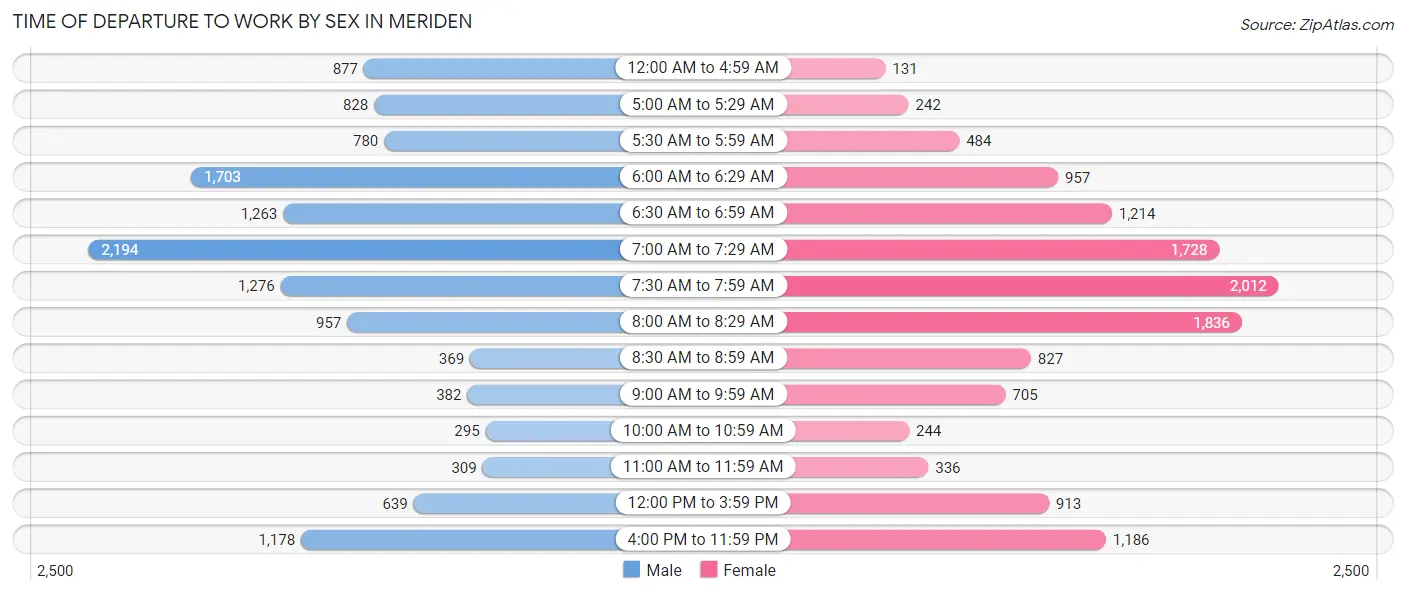
| Time of Departure | Male | Female |
| 12:00 AM to 4:59 AM | 877 (6.7%) | 131 (1.0%) |
| 5:00 AM to 5:29 AM | 828 (6.3%) | 242 (1.9%) |
| 5:30 AM to 5:59 AM | 780 (6.0%) | 484 (3.8%) |
| 6:00 AM to 6:29 AM | 1,703 (13.1%) | 957 (7.5%) |
| 6:30 AM to 6:59 AM | 1,263 (9.7%) | 1,214 (9.5%) |
| 7:00 AM to 7:29 AM | 2,194 (16.8%) | 1,728 (13.5%) |
| 7:30 AM to 7:59 AM | 1,276 (9.8%) | 2,012 (15.7%) |
| 8:00 AM to 8:29 AM | 957 (7.3%) | 1,836 (14.3%) |
| 8:30 AM to 8:59 AM | 369 (2.8%) | 827 (6.5%) |
| 9:00 AM to 9:59 AM | 382 (2.9%) | 705 (5.5%) |
| 10:00 AM to 10:59 AM | 295 (2.3%) | 244 (1.9%) |
| 11:00 AM to 11:59 AM | 309 (2.4%) | 336 (2.6%) |
| 12:00 PM to 3:59 PM | 639 (4.9%) | 913 (7.1%) |
| 4:00 PM to 11:59 PM | 1,178 (9.0%) | 1,186 (9.2%) |
| Total | 13,050 (100.0%) | 12,815 (100.0%) |
Housing Occupancy in Meriden
Occupancy by Ownership in Meriden
Of the total 25,018 dwellings in Meriden, owner-occupied units account for 14,878 (59.5%), while renter-occupied units make up 10,140 (40.5%).
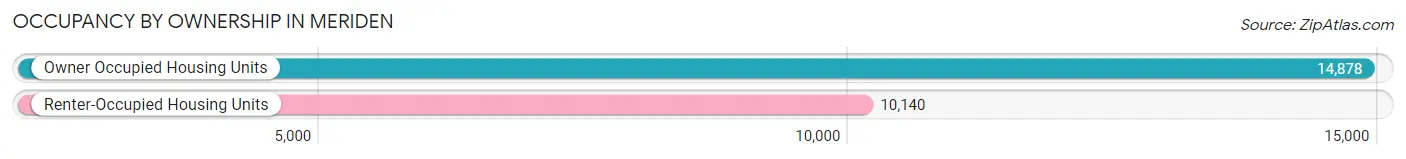
| Occupancy | # Housing Units | % Housing Units |
| Owner Occupied Housing Units | 14,878 | 59.5% |
| Renter-Occupied Housing Units | 10,140 | 40.5% |
| Total Occupied Housing Units | 25,018 | 100.0% |
Occupancy by Household Size in Meriden
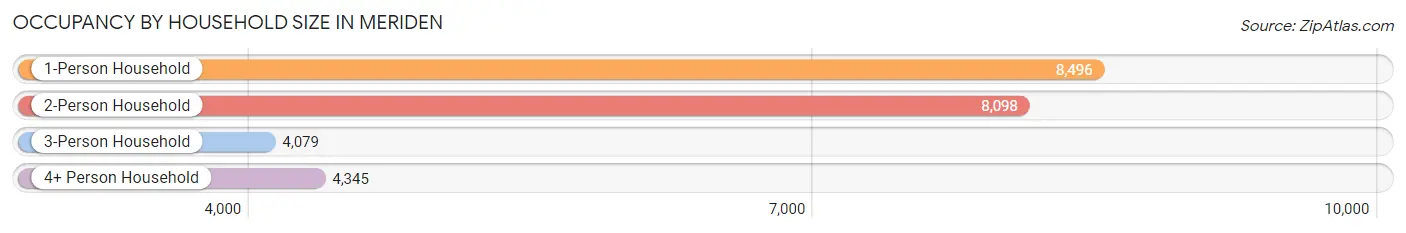
| Household Size | # Housing Units | % Housing Units |
| 1-Person Household | 8,496 | 34.0% |
| 2-Person Household | 8,098 | 32.4% |
| 3-Person Household | 4,079 | 16.3% |
| 4+ Person Household | 4,345 | 17.4% |
| Total Housing Units | 25,018 | 100.0% |
Occupancy by Ownership by Household Size in Meriden
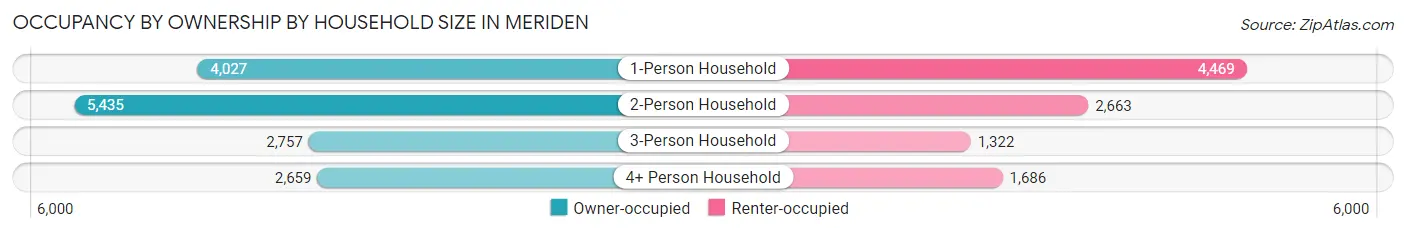
| Household Size | Owner-occupied | Renter-occupied |
| 1-Person Household | 4,027 (47.4%) | 4,469 (52.6%) |
| 2-Person Household | 5,435 (67.1%) | 2,663 (32.9%) |
| 3-Person Household | 2,757 (67.6%) | 1,322 (32.4%) |
| 4+ Person Household | 2,659 (61.2%) | 1,686 (38.8%) |
| Total Housing Units | 14,878 (59.5%) | 10,140 (40.5%) |
Occupancy by Educational Attainment in Meriden
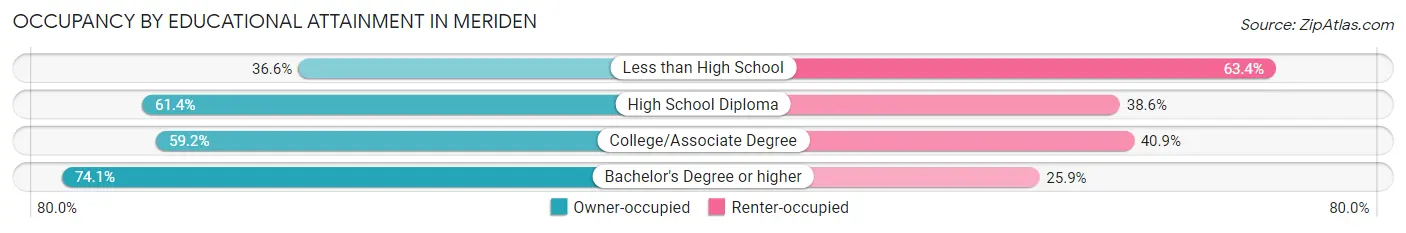
| Household Size | Owner-occupied | Renter-occupied |
| Less than High School | 1,383 (36.6%) | 2,393 (63.4%) |
| High School Diploma | 5,060 (61.4%) | 3,186 (38.6%) |
| College/Associate Degree | 4,731 (59.2%) | 3,267 (40.8%) |
| Bachelor's Degree or higher | 3,704 (74.1%) | 1,294 (25.9%) |
Occupancy by Age of Householder in Meriden
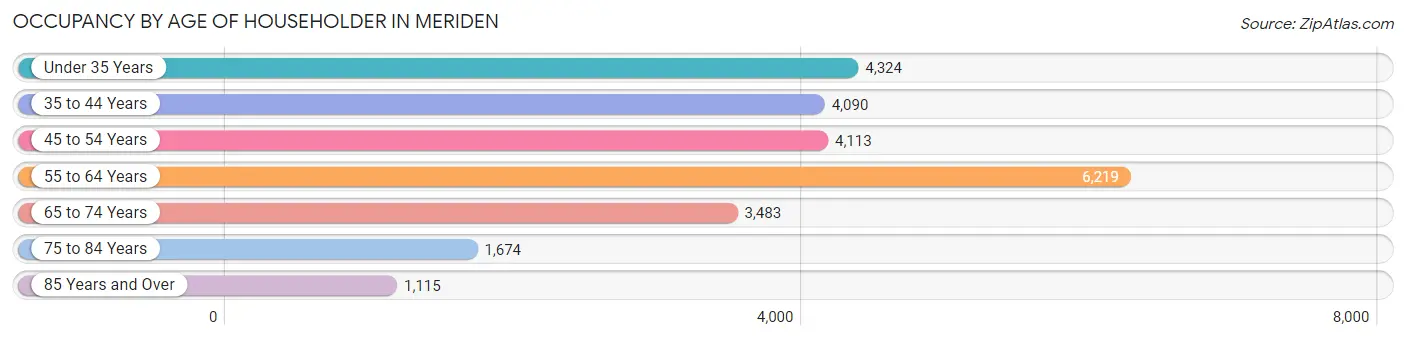
| Age Bracket | # Households | % Households |
| Under 35 Years | 4,324 | 17.3% |
| 35 to 44 Years | 4,090 | 16.4% |
| 45 to 54 Years | 4,113 | 16.4% |
| 55 to 64 Years | 6,219 | 24.9% |
| 65 to 74 Years | 3,483 | 13.9% |
| 75 to 84 Years | 1,674 | 6.7% |
| 85 Years and Over | 1,115 | 4.5% |
| Total | 25,018 | 100.0% |
Housing Finances in Meriden
Median Income by Occupancy in Meriden
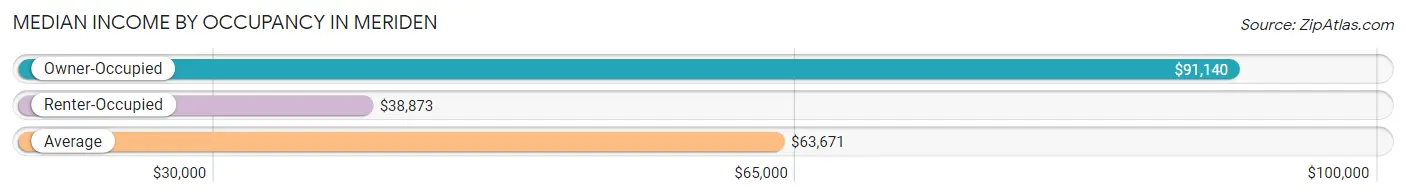
| Occupancy Type | # Households | Median Income |
| Owner-Occupied | 14,878 (59.5%) | $91,140 |
| Renter-Occupied | 10,140 (40.5%) | $38,873 |
| Average | 25,018 (100.0%) | $63,671 |
Occupancy by Householder Income Bracket in Meriden
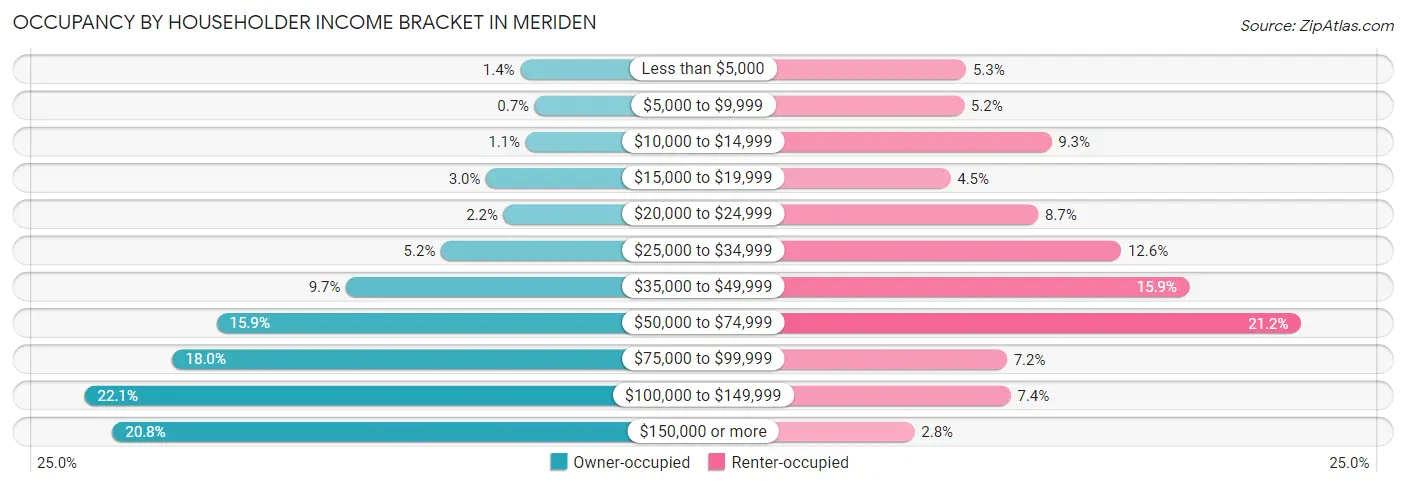
| Income Bracket | Owner-occupied | Renter-occupied |
| Less than $5,000 | 207 (1.4%) | 533 (5.3%) |
| $5,000 to $9,999 | 104 (0.7%) | 523 (5.2%) |
| $10,000 to $14,999 | 168 (1.1%) | 945 (9.3%) |
| $15,000 to $19,999 | 448 (3.0%) | 457 (4.5%) |
| $20,000 to $24,999 | 324 (2.2%) | 881 (8.7%) |
| $25,000 to $34,999 | 767 (5.2%) | 1,282 (12.6%) |
| $35,000 to $49,999 | 1,440 (9.7%) | 1,609 (15.9%) |
| $50,000 to $74,999 | 2,359 (15.9%) | 2,148 (21.2%) |
| $75,000 to $99,999 | 2,670 (17.9%) | 730 (7.2%) |
| $100,000 to $149,999 | 3,294 (22.1%) | 748 (7.4%) |
| $150,000 or more | 3,097 (20.8%) | 284 (2.8%) |
| Total | 14,878 (100.0%) | 10,140 (100.0%) |
Monthly Housing Cost Tiers in Meriden
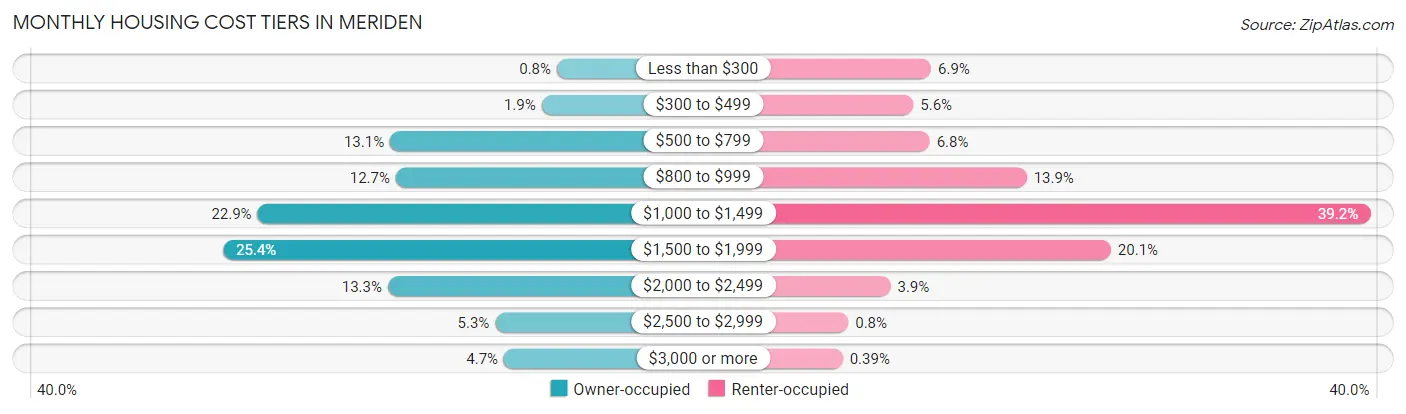
| Monthly Cost | Owner-occupied | Renter-occupied |
| Less than $300 | 119 (0.8%) | 700 (6.9%) |
| $300 to $499 | 287 (1.9%) | 567 (5.6%) |
| $500 to $799 | 1,947 (13.1%) | 690 (6.8%) |
| $800 to $999 | 1,884 (12.7%) | 1,414 (13.9%) |
| $1,000 to $1,499 | 3,399 (22.9%) | 3,977 (39.2%) |
| $1,500 to $1,999 | 3,777 (25.4%) | 2,042 (20.1%) |
| $2,000 to $2,499 | 1,971 (13.3%) | 396 (3.9%) |
| $2,500 to $2,999 | 794 (5.3%) | 81 (0.8%) |
| $3,000 or more | 700 (4.7%) | 40 (0.4%) |
| Total | 14,878 (100.0%) | 10,140 (100.0%) |
Physical Housing Characteristics in Meriden
Housing Structures in Meriden
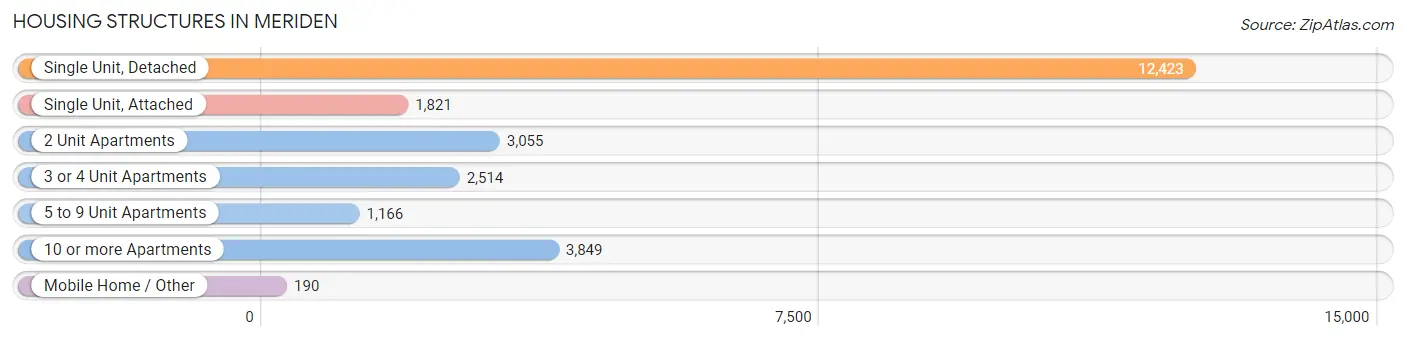
| Structure Type | # Housing Units | % Housing Units |
| Single Unit, Detached | 12,423 | 49.7% |
| Single Unit, Attached | 1,821 | 7.3% |
| 2 Unit Apartments | 3,055 | 12.2% |
| 3 or 4 Unit Apartments | 2,514 | 10.1% |
| 5 to 9 Unit Apartments | 1,166 | 4.7% |
| 10 or more Apartments | 3,849 | 15.4% |
| Mobile Home / Other | 190 | 0.8% |
| Total | 25,018 | 100.0% |
Housing Structures by Occupancy in Meriden
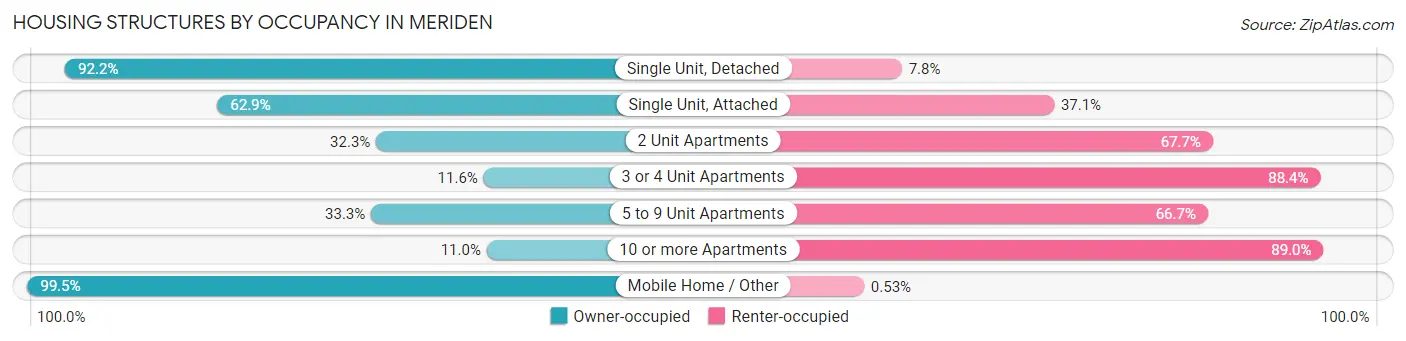
| Structure Type | Owner-occupied | Renter-occupied |
| Single Unit, Detached | 11,453 (92.2%) | 970 (7.8%) |
| Single Unit, Attached | 1,145 (62.9%) | 676 (37.1%) |
| 2 Unit Apartments | 987 (32.3%) | 2,068 (67.7%) |
| 3 or 4 Unit Apartments | 292 (11.6%) | 2,222 (88.4%) |
| 5 to 9 Unit Apartments | 388 (33.3%) | 778 (66.7%) |
| 10 or more Apartments | 424 (11.0%) | 3,425 (89.0%) |
| Mobile Home / Other | 189 (99.5%) | 1 (0.5%) |
| Total | 14,878 (59.5%) | 10,140 (40.5%) |
Housing Structures by Number of Rooms in Meriden
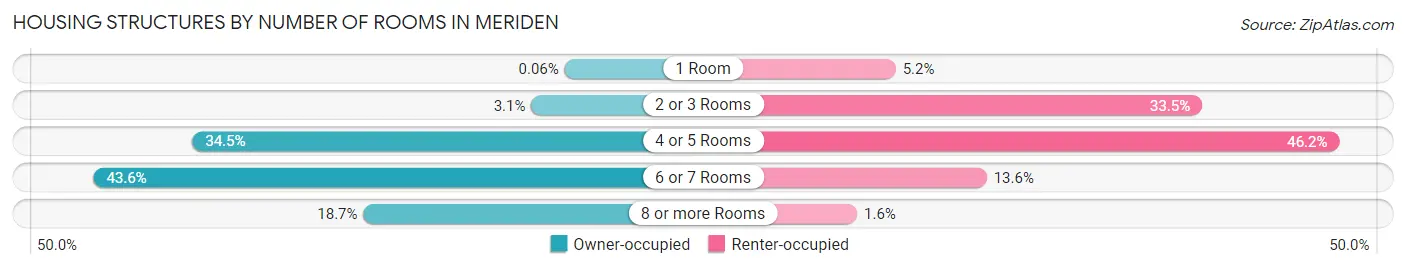
| Number of Rooms | Owner-occupied | Renter-occupied |
| 1 Room | 9 (0.1%) | 523 (5.2%) |
| 2 or 3 Rooms | 467 (3.1%) | 3,396 (33.5%) |
| 4 or 5 Rooms | 5,132 (34.5%) | 4,683 (46.2%) |
| 6 or 7 Rooms | 6,492 (43.6%) | 1,377 (13.6%) |
| 8 or more Rooms | 2,778 (18.7%) | 161 (1.6%) |
| Total | 14,878 (100.0%) | 10,140 (100.0%) |
Housing Structure by Heating Type in Meriden
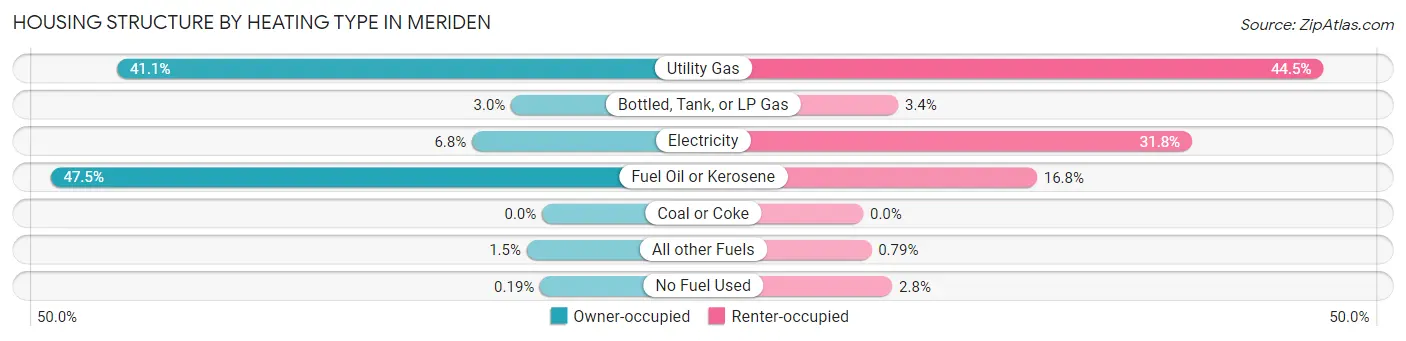
| Heating Type | Owner-occupied | Renter-occupied |
| Utility Gas | 6,111 (41.1%) | 4,508 (44.5%) |
| Bottled, Tank, or LP Gas | 445 (3.0%) | 343 (3.4%) |
| Electricity | 1,007 (6.8%) | 3,221 (31.8%) |
| Fuel Oil or Kerosene | 7,066 (47.5%) | 1,703 (16.8%) |
| Coal or Coke | 0 (0.0%) | 0 (0.0%) |
| All other Fuels | 220 (1.5%) | 80 (0.8%) |
| No Fuel Used | 29 (0.2%) | 285 (2.8%) |
| Total | 14,878 (100.0%) | 10,140 (100.0%) |
Household Vehicle Usage in Meriden
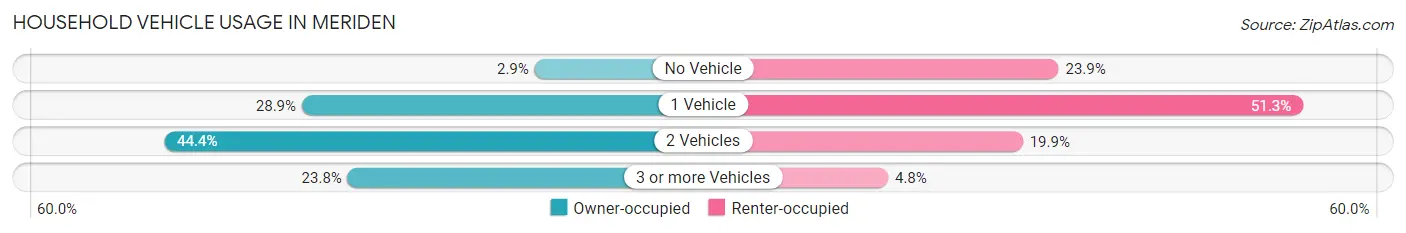
| Vehicles per Household | Owner-occupied | Renter-occupied |
| No Vehicle | 427 (2.9%) | 2,426 (23.9%) |
| 1 Vehicle | 4,305 (28.9%) | 5,204 (51.3%) |
| 2 Vehicles | 6,603 (44.4%) | 2,020 (19.9%) |
| 3 or more Vehicles | 3,543 (23.8%) | 490 (4.8%) |
| Total | 14,878 (100.0%) | 10,140 (100.0%) |
Real Estate & Mortgages in Meriden
Real Estate and Mortgage Overview in Meriden
| Characteristic | Without Mortgage | With Mortgage |
| Housing Units | 5,384 | 9,494 |
| Median Property Value | $202,600 | $198,000 |
| Median Household Income | $76,170 | $2,105 |
| Monthly Housing Costs | $878 | $695 |
| Real Estate Taxes | $4,734 | $116 |
Property Value by Mortgage Status in Meriden
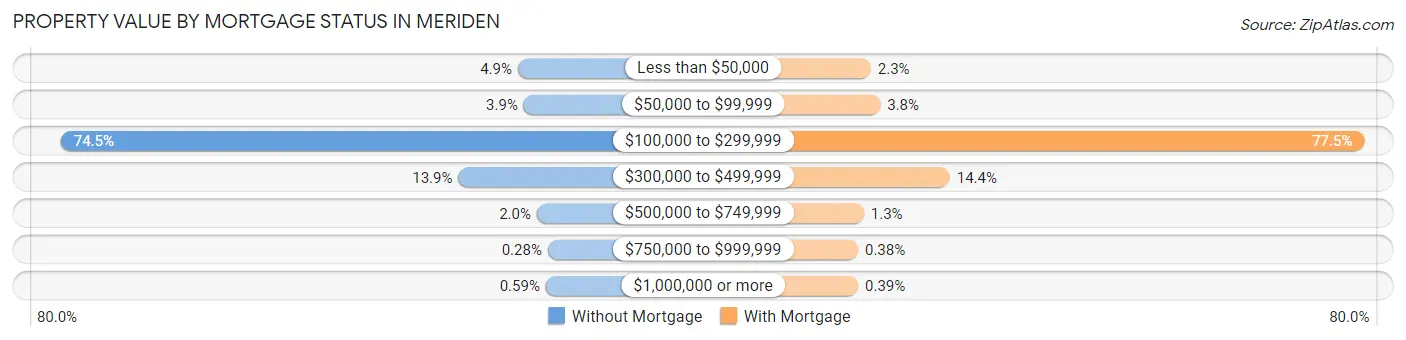
| Property Value | Without Mortgage | With Mortgage |
| Less than $50,000 | 261 (4.9%) | 221 (2.3%) |
| $50,000 to $99,999 | 212 (3.9%) | 358 (3.8%) |
| $100,000 to $299,999 | 4,010 (74.5%) | 7,359 (77.5%) |
| $300,000 to $499,999 | 749 (13.9%) | 1,363 (14.4%) |
| $500,000 to $749,999 | 105 (1.9%) | 120 (1.3%) |
| $750,000 to $999,999 | 15 (0.3%) | 36 (0.4%) |
| $1,000,000 or more | 32 (0.6%) | 37 (0.4%) |
| Total | 5,384 (100.0%) | 9,494 (100.0%) |
Household Income by Mortgage Status in Meriden
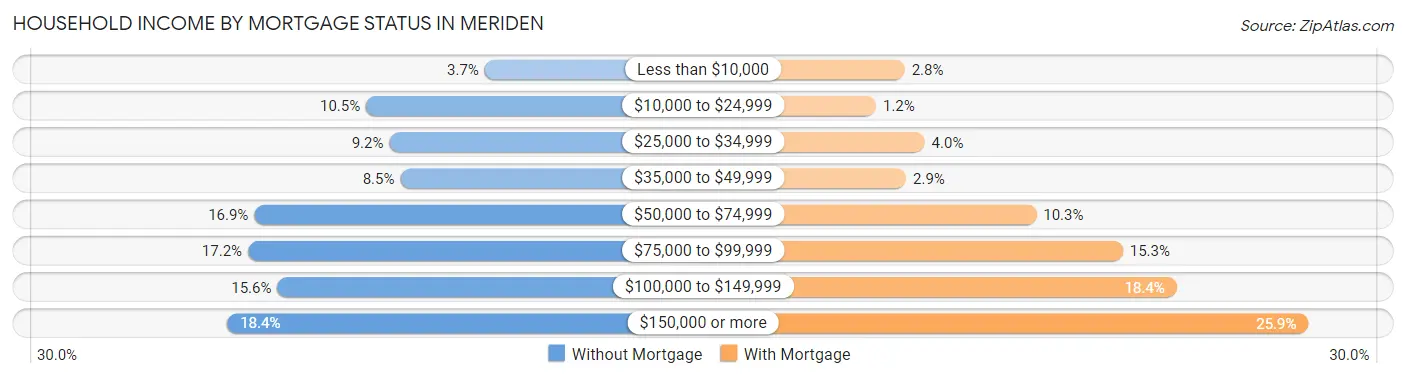
| Household Income | Without Mortgage | With Mortgage |
| Less than $10,000 | 200 (3.7%) | 267 (2.8%) |
| $10,000 to $24,999 | 565 (10.5%) | 111 (1.2%) |
| $25,000 to $34,999 | 493 (9.2%) | 375 (4.0%) |
| $35,000 to $49,999 | 459 (8.5%) | 274 (2.9%) |
| $50,000 to $74,999 | 909 (16.9%) | 981 (10.3%) |
| $75,000 to $99,999 | 928 (17.2%) | 1,450 (15.3%) |
| $100,000 to $149,999 | 838 (15.6%) | 1,742 (18.3%) |
| $150,000 or more | 992 (18.4%) | 2,456 (25.9%) |
| Total | 5,384 (100.0%) | 9,494 (100.0%) |
Property Value to Household Income Ratio in Meriden
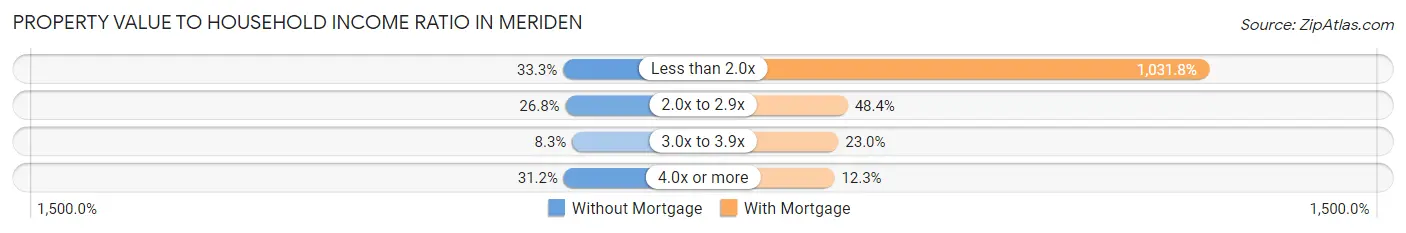
| Value-to-Income Ratio | Without Mortgage | With Mortgage |
| Less than 2.0x | 1,790 (33.3%) | 97,961 (1,031.8%) |
| 2.0x to 2.9x | 1,441 (26.8%) | 4,593 (48.4%) |
| 3.0x to 3.9x | 449 (8.3%) | 2,184 (23.0%) |
| 4.0x or more | 1,678 (31.2%) | 1,168 (12.3%) |
| Total | 5,384 (100.0%) | 9,494 (100.0%) |
Real Estate Taxes by Mortgage Status in Meriden
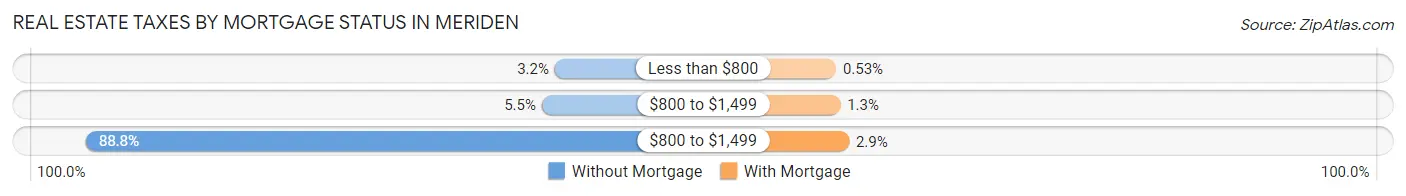
| Property Taxes | Without Mortgage | With Mortgage |
| Less than $800 | 170 (3.2%) | 50 (0.5%) |
| $800 to $1,499 | 298 (5.5%) | 124 (1.3%) |
| $800 to $1,499 | 4,782 (88.8%) | 276 (2.9%) |
| Total | 5,384 (100.0%) | 9,494 (100.0%) |
Health & Disability in Meriden
Health Insurance Coverage by Age in Meriden
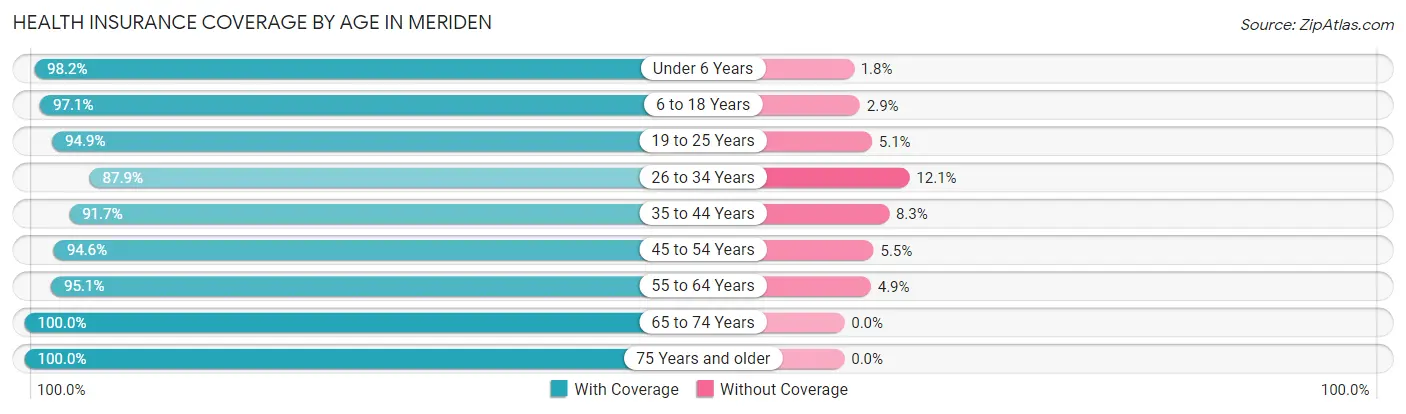
| Age Bracket | With Coverage | Without Coverage |
| Under 6 Years | 4,747 (98.2%) | 85 (1.8%) |
| 6 to 18 Years | 8,617 (97.1%) | 257 (2.9%) |
| 19 to 25 Years | 5,148 (94.9%) | 279 (5.1%) |
| 26 to 34 Years | 6,289 (87.9%) | 869 (12.1%) |
| 35 to 44 Years | 7,067 (91.7%) | 642 (8.3%) |
| 45 to 54 Years | 6,816 (94.6%) | 393 (5.4%) |
| 55 to 64 Years | 9,220 (95.1%) | 479 (4.9%) |
| 65 to 74 Years | 5,054 (100.0%) | 0 (0.0%) |
| 75 Years and older | 3,923 (100.0%) | 0 (0.0%) |
| Total | 56,881 (95.0%) | 3,004 (5.0%) |
Health Insurance Coverage by Citizenship Status in Meriden
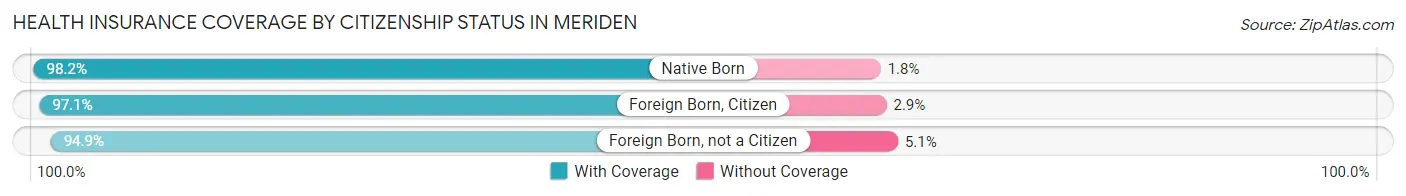
| Citizenship Status | With Coverage | Without Coverage |
| Native Born | 4,747 (98.2%) | 85 (1.8%) |
| Foreign Born, Citizen | 8,617 (97.1%) | 257 (2.9%) |
| Foreign Born, not a Citizen | 5,148 (94.9%) | 279 (5.1%) |
Health Insurance Coverage by Household Income in Meriden
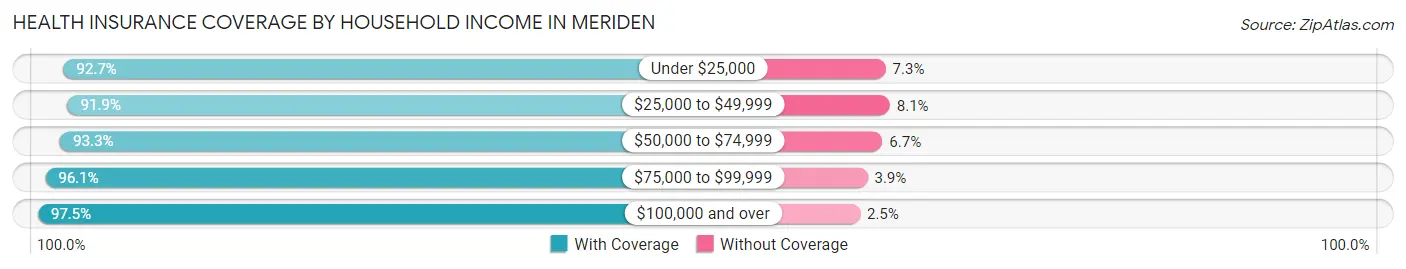
| Household Income | With Coverage | Without Coverage |
| Under $25,000 | 7,985 (92.7%) | 627 (7.3%) |
| $25,000 to $49,999 | 9,459 (91.9%) | 829 (8.1%) |
| $50,000 to $74,999 | 9,258 (93.3%) | 662 (6.7%) |
| $75,000 to $99,999 | 8,463 (96.1%) | 342 (3.9%) |
| $100,000 and over | 21,415 (97.5%) | 544 (2.5%) |
Public vs Private Health Insurance Coverage by Age in Meriden
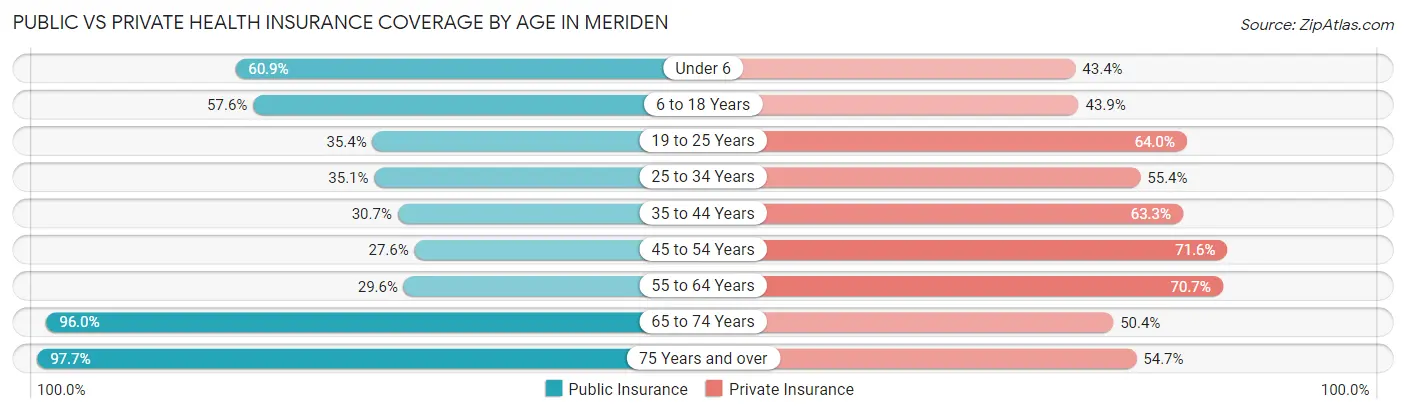
| Age Bracket | Public Insurance | Private Insurance |
| Under 6 | 2,942 (60.9%) | 2,095 (43.4%) |
| 6 to 18 Years | 5,110 (57.6%) | 3,899 (43.9%) |
| 19 to 25 Years | 1,922 (35.4%) | 3,475 (64.0%) |
| 25 to 34 Years | 2,511 (35.1%) | 3,967 (55.4%) |
| 35 to 44 Years | 2,370 (30.7%) | 4,878 (63.3%) |
| 45 to 54 Years | 1,991 (27.6%) | 5,159 (71.6%) |
| 55 to 64 Years | 2,873 (29.6%) | 6,855 (70.7%) |
| 65 to 74 Years | 4,850 (96.0%) | 2,546 (50.4%) |
| 75 Years and over | 3,831 (97.7%) | 2,145 (54.7%) |
| Total | 28,400 (47.4%) | 35,019 (58.5%) |
Disability Status by Sex by Age in Meriden
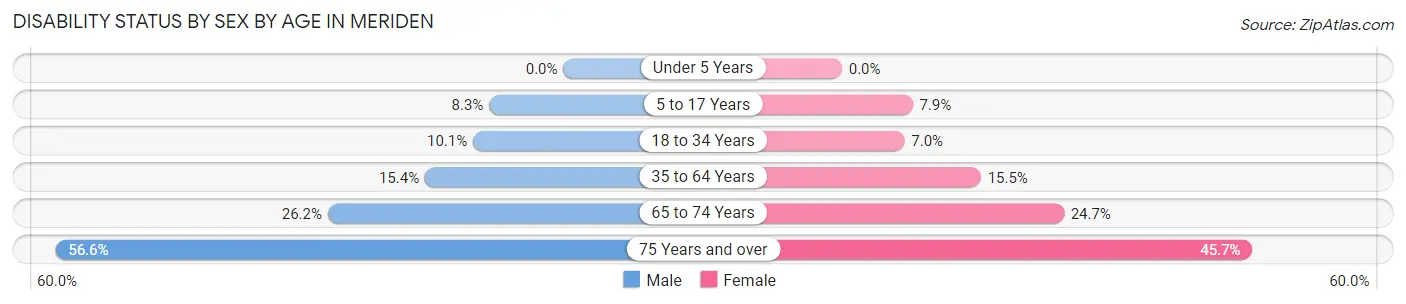
| Age Bracket | Male | Female |
| Under 5 Years | 0 (0.0%) | 0 (0.0%) |
| 5 to 17 Years | 380 (8.3%) | 373 (7.9%) |
| 18 to 34 Years | 683 (10.1%) | 448 (7.0%) |
| 35 to 64 Years | 1,829 (15.4%) | 1,972 (15.5%) |
| 65 to 74 Years | 569 (26.2%) | 713 (24.7%) |
| 75 Years and over | 783 (56.6%) | 1,161 (45.7%) |
Disability Class by Sex by Age in Meriden
Disability Class: Hearing Difficulty
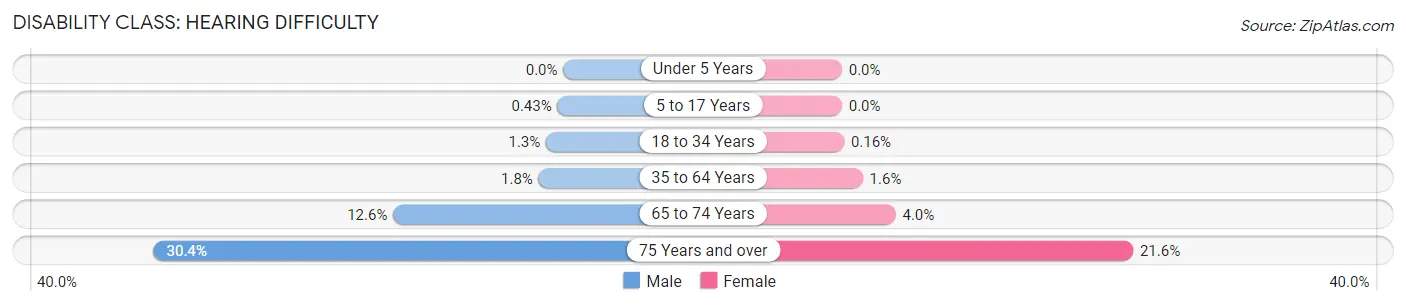
| Age Bracket | Male | Female |
| Under 5 Years | 0 (0.0%) | 0 (0.0%) |
| 5 to 17 Years | 20 (0.4%) | 0 (0.0%) |
| 18 to 34 Years | 87 (1.3%) | 10 (0.2%) |
| 35 to 64 Years | 217 (1.8%) | 197 (1.5%) |
| 65 to 74 Years | 274 (12.6%) | 115 (4.0%) |
| 75 Years and over | 421 (30.4%) | 549 (21.6%) |
Disability Class: Vision Difficulty
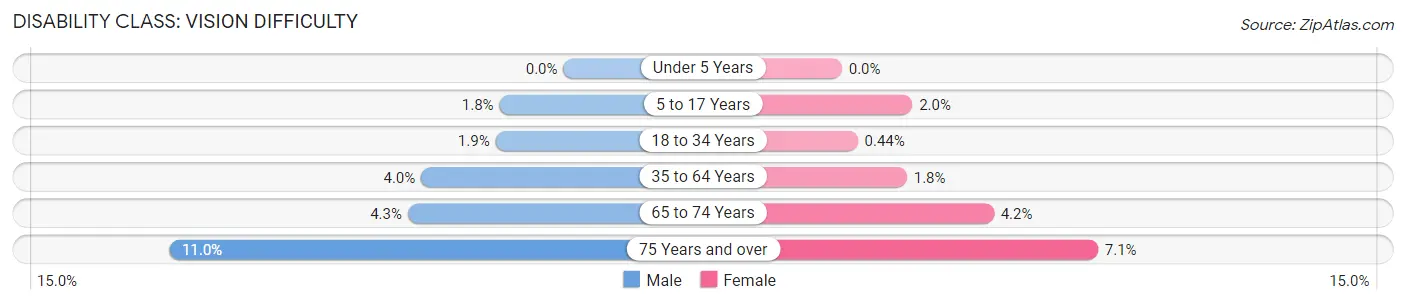
| Age Bracket | Male | Female |
| Under 5 Years | 0 (0.0%) | 0 (0.0%) |
| 5 to 17 Years | 82 (1.8%) | 93 (2.0%) |
| 18 to 34 Years | 128 (1.9%) | 28 (0.4%) |
| 35 to 64 Years | 470 (4.0%) | 231 (1.8%) |
| 65 to 74 Years | 94 (4.3%) | 122 (4.2%) |
| 75 Years and over | 152 (11.0%) | 181 (7.1%) |
Disability Class: Cognitive Difficulty
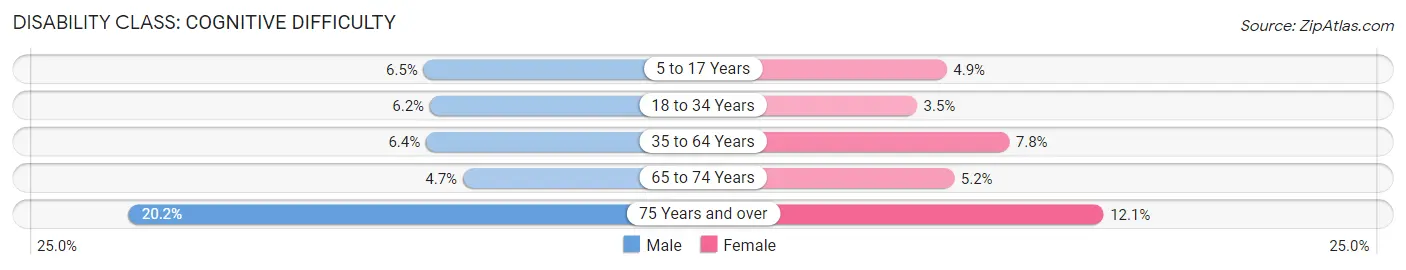
| Age Bracket | Male | Female |
| 5 to 17 Years | 298 (6.5%) | 230 (4.9%) |
| 18 to 34 Years | 420 (6.2%) | 223 (3.5%) |
| 35 to 64 Years | 756 (6.4%) | 988 (7.7%) |
| 65 to 74 Years | 101 (4.7%) | 150 (5.2%) |
| 75 Years and over | 279 (20.2%) | 308 (12.1%) |
Disability Class: Ambulatory Difficulty
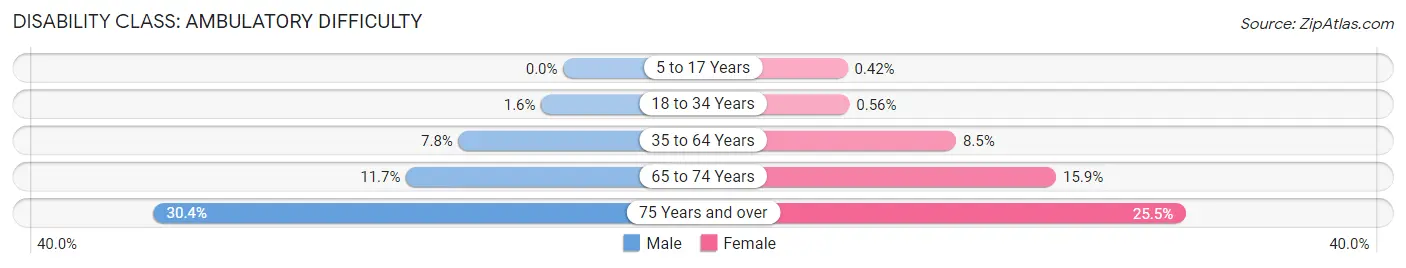
| Age Bracket | Male | Female |
| 5 to 17 Years | 0 (0.0%) | 20 (0.4%) |
| 18 to 34 Years | 111 (1.6%) | 36 (0.6%) |
| 35 to 64 Years | 922 (7.8%) | 1,081 (8.5%) |
| 65 to 74 Years | 253 (11.7%) | 459 (15.9%) |
| 75 Years and over | 421 (30.4%) | 647 (25.5%) |
Disability Class: Self-Care Difficulty
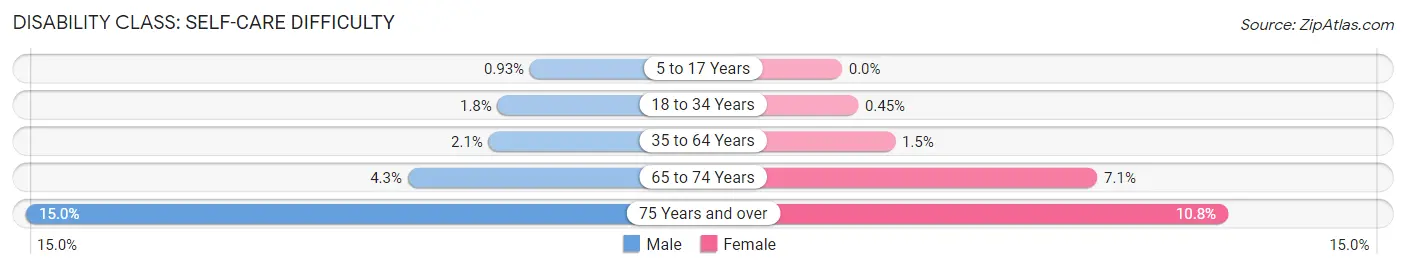
| Age Bracket | Male | Female |
| 5 to 17 Years | 43 (0.9%) | 0 (0.0%) |
| 18 to 34 Years | 124 (1.8%) | 29 (0.4%) |
| 35 to 64 Years | 247 (2.1%) | 189 (1.5%) |
| 65 to 74 Years | 94 (4.3%) | 205 (7.1%) |
| 75 Years and over | 207 (15.0%) | 273 (10.7%) |
Technology Access in Meriden
Computing Device Access in Meriden
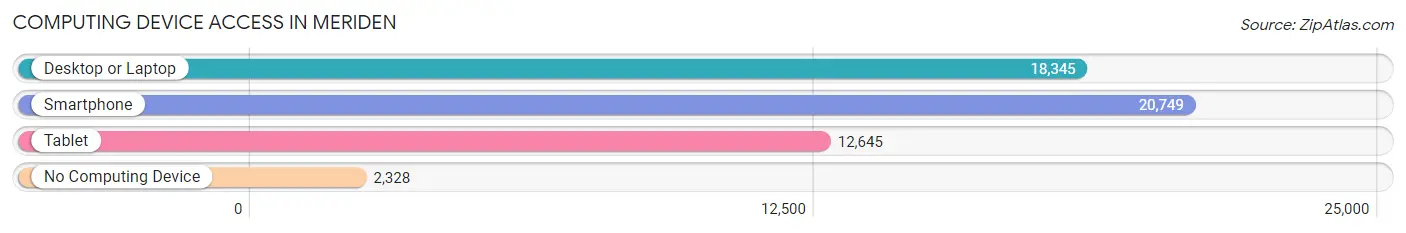
| Device Type | # Households | % Households |
| Desktop or Laptop | 18,345 | 73.3% |
| Smartphone | 20,749 | 82.9% |
| Tablet | 12,645 | 50.5% |
| No Computing Device | 2,328 | 9.3% |
| Total | 25,018 | 100.0% |
Internet Access in Meriden
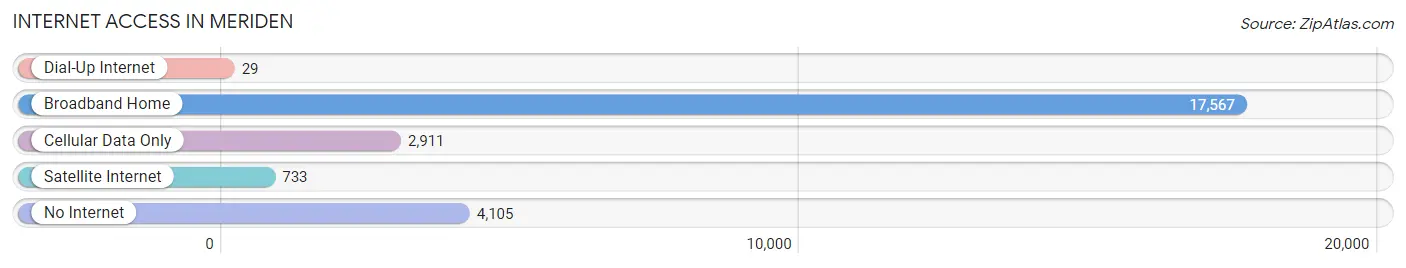
| Internet Type | # Households | % Households |
| Dial-Up Internet | 29 | 0.1% |
| Broadband Home | 17,567 | 70.2% |
| Cellular Data Only | 2,911 | 11.6% |
| Satellite Internet | 733 | 2.9% |
| No Internet | 4,105 | 16.4% |
| Total | 25,018 | 100.0% |
Meriden Summary
Meriden, Connecticut is a city located in New Haven County, Connecticut. It is situated in the center of the state, between Hartford and New Haven. The city has a population of approximately 60,000 people, making it the second largest city in the state.
History
Meriden was first settled in 1661 by settlers from Hartford and New Haven. The town was originally known as “Middle Plantation” and was part of the town of Wallingford. In 1767, the town was incorporated as the town of Meriden. The town was named after the Meriden River, which runs through the city.
In the 19th century, Meriden became an important industrial center. The city was home to several factories, including the Meriden Britannia Company, which produced silverware and other metal products. The city also had several mills, including the Meriden Manufacturing Company, which produced cotton goods.
In the 20th century, Meriden continued to be an important industrial center. The city was home to several factories, including the Meriden Cutlery Company, which produced knives and other cutlery. The city also had several mills, including the Meriden Woolen Company, which produced woolen goods.
Geography
Meriden is located in central Connecticut, between Hartford and New Haven. The city is situated on the Meriden River, which runs through the city. The city is located in the foothills of the Berkshires, and is surrounded by several small towns and villages.
The city has a total area of 24.2 square miles, of which 23.7 square miles is land and 0.5 square miles is water. The city is located at an elevation of approximately 500 feet above sea level.
Economy
Meriden’s economy is largely based on manufacturing and services. The city is home to several factories, including the Meriden Cutlery Company, which produces knives and other cutlery. The city also has several mills, including the Meriden Woolen Company, which produces woolen goods.
The city is also home to several large employers, including the Meriden-Wallingford Hospital, the Meriden Public Schools, and the Meriden YMCA. The city is also home to several retail stores, including the Meriden Mall and the Meriden Marketplace.
Demographics
As of the 2010 census, Meriden had a population of 60,868 people. The racial makeup of the city was 79.2% White, 8.3% African American, 0.3% Native American, 2.2% Asian, 0.1% Pacific Islander, 6.7% from other races, and 2.5% from two or more races. Hispanic or Latino of any race were 15.2% of the population.
The median income for a household in the city was $50,945, and the median income for a family was $60,945. The per capita income for the city was $25,945. About 11.2% of families and 13.7% of the population were below the poverty line, including 18.2% of those under age 18 and 8.2% of those age 65 or over.
Common Questions
What is Per Capita Income in Meriden?
Per Capita income in Meriden is $35,859.
What is the Median Family Income in Meriden?
Median Family Income in Meriden is $83,457.
What is the Median Household income in Meriden?
Median Household Income in Meriden is $63,671.
What is Income or Wage Gap in Meriden?
Income or Wage Gap in Meriden is 16.7%.
Women in Meriden earn 83.3 cents for every dollar earned by a man.
What is Family Income Deficit in Meriden?
Family Income Deficit in Meriden is $11,343.
Families that are below poverty line in Meriden earn $11,343 less on average than the poverty threshold level.
What is Inequality or Gini Index in Meriden?
Inequality or Gini Index in Meriden is 0.44.
What is the Total Population of Meriden?
Total Population of Meriden is 60,556.
What is the Total Male Population of Meriden?
Total Male Population of Meriden is 29,336.
What is the Total Female Population of Meriden?
Total Female Population of Meriden is 31,220.
What is the Ratio of Males per 100 Females in Meriden?
There are 93.97 Males per 100 Females in Meriden.
What is the Ratio of Females per 100 Males in Meriden?
There are 106.42 Females per 100 Males in Meriden.
What is the Median Population Age in Meriden?
Median Population Age in Meriden is 40.2 Years.
What is the Average Family Size in Meriden
Average Family Size in Meriden is 3.1 People.
What is the Average Household Size in Meriden
Average Household Size in Meriden is 2.4 People.
How Large is the Labor Force in Meriden?
There are 30,951 People in the Labor Forcein in Meriden.
What is the Percentage of People in the Labor Force in Meriden?
63.8% of People are in the Labor Force in Meriden.
What is the Unemployment Rate in Meriden?
Unemployment Rate in Meriden is 8.4%.