Evansville, IN Map & Demographics
Evansville Map
Evansville Overview
$29,393
PER CAPITA INCOME
$61,612
AVG FAMILY INCOME
$49,853
AVG HOUSEHOLD INCOME
26.6%
WAGE / INCOME GAP [ % ]
73.4¢/ $1
WAGE / INCOME GAP [ $ ]
$11,522
FAMILY INCOME DEFICIT
0.44
INEQUALITY / GINI INDEX
116,906
TOTAL POPULATION
57,290
MALE POPULATION
59,616
FEMALE POPULATION
96.10
MALES / 100 FEMALES
104.06
FEMALES / 100 MALES
38.1
MEDIAN AGE
2.9
AVG FAMILY SIZE
2.2
AVG HOUSEHOLD SIZE
60,508
LABOR FORCE [ PEOPLE ]
64.0%
PERCENT IN LABOR FORCE
5.7%
UNEMPLOYMENT RATE
Evansville Area Codes
Income in Evansville
Income Overview in Evansville
Per Capita Income in Evansville is $29,393, while median incomes of families and households are $61,612 and $49,853 respectively.
| Characteristic | Number | Measure |
| Per Capita Income | 116,906 | $29,393 |
| Median Family Income | 28,436 | $61,612 |
| Mean Family Income | 28,436 | $78,447 |
| Median Household Income | 52,070 | $49,853 |
| Mean Household Income | 52,070 | $64,906 |
| Income Deficit | 28,436 | $11,522 |
| Wage / Income Gap (%) | 116,906 | 26.65% |
| Wage / Income Gap ($) | 116,906 | 73.35¢ per $1 |
| Gini / Inequality Index | 116,906 | 0.44 |
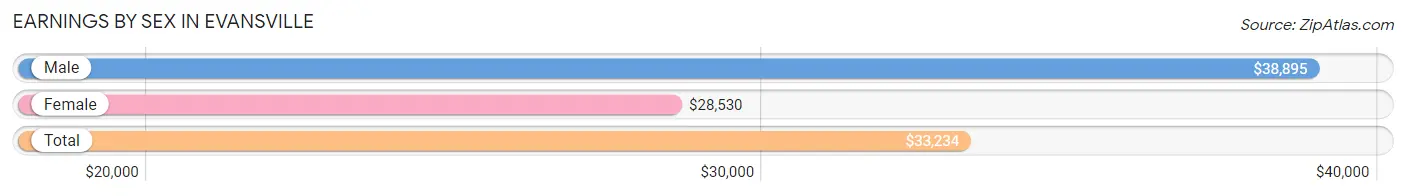
Earnings by Sex in Evansville
Average Earnings in Evansville are $33,234, $38,895 for men and $28,530 for women, a difference of 26.7%.
| Sex | Number | Average Earnings |
| Male | 31,820 (50.3%) | $38,895 |
| Female | 31,390 (49.7%) | $28,530 |
| Total | 63,210 (100.0%) | $33,234 |
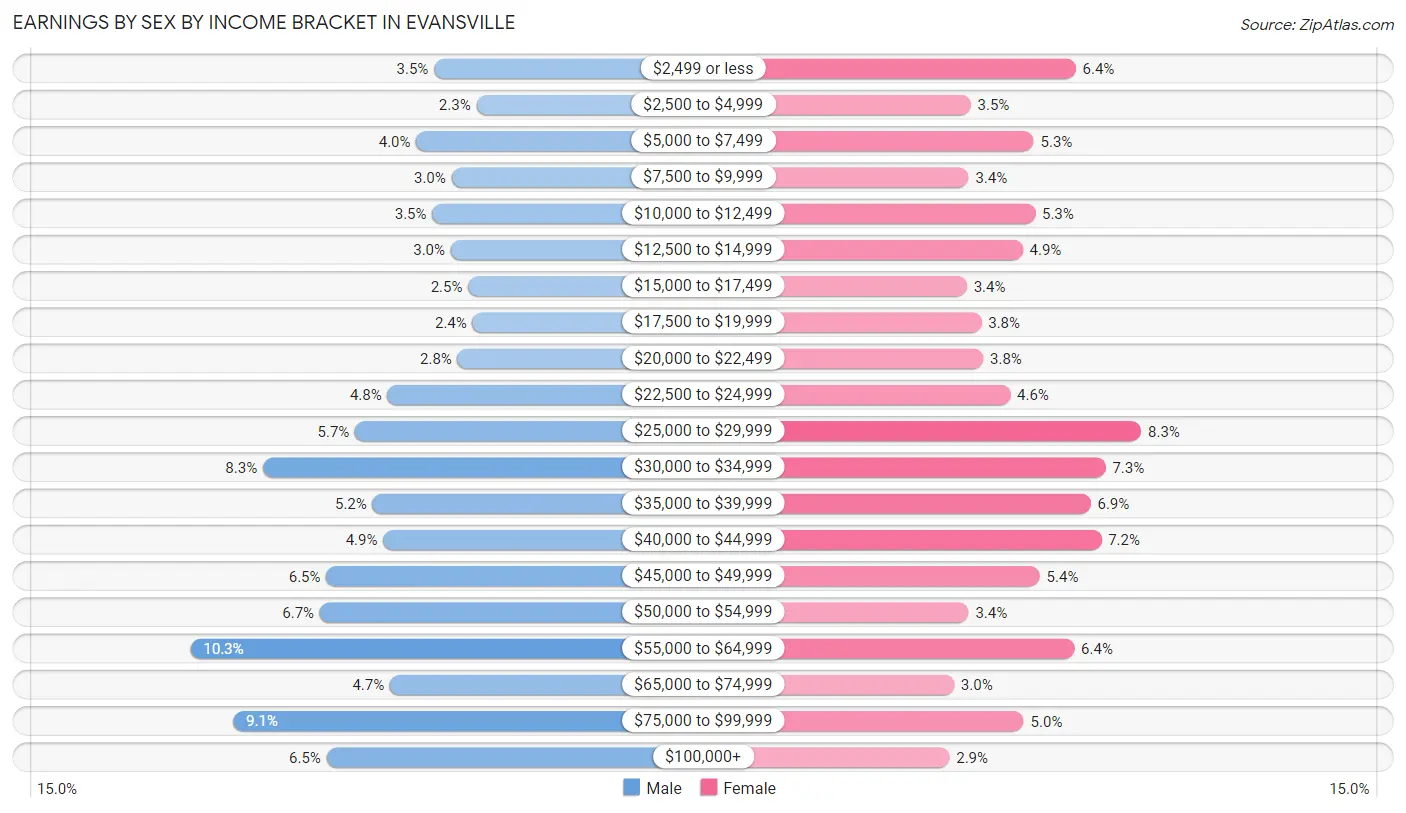
Earnings by Sex by Income Bracket in Evansville
The most common earnings brackets in Evansville are $55,000 to $64,999 for men (3,289 | 10.3%) and $25,000 to $29,999 for women (2,595 | 8.3%).
| Income | Male | Female |
| $2,499 or less | 1,109 (3.5%) | 2,019 (6.4%) |
| $2,500 to $4,999 | 731 (2.3%) | 1,092 (3.5%) |
| $5,000 to $7,499 | 1,269 (4.0%) | 1,648 (5.2%) |
| $7,500 to $9,999 | 955 (3.0%) | 1,073 (3.4%) |
| $10,000 to $12,499 | 1,125 (3.5%) | 1,659 (5.3%) |
| $12,500 to $14,999 | 962 (3.0%) | 1,550 (4.9%) |
| $15,000 to $17,499 | 806 (2.5%) | 1,059 (3.4%) |
| $17,500 to $19,999 | 768 (2.4%) | 1,186 (3.8%) |
| $20,000 to $22,499 | 902 (2.8%) | 1,203 (3.8%) |
| $22,500 to $24,999 | 1,528 (4.8%) | 1,441 (4.6%) |
| $25,000 to $29,999 | 1,817 (5.7%) | 2,595 (8.3%) |
| $30,000 to $34,999 | 2,641 (8.3%) | 2,281 (7.3%) |
| $35,000 to $39,999 | 1,660 (5.2%) | 2,151 (6.9%) |
| $40,000 to $44,999 | 1,566 (4.9%) | 2,244 (7.1%) |
| $45,000 to $49,999 | 2,076 (6.5%) | 1,700 (5.4%) |
| $50,000 to $54,999 | 2,132 (6.7%) | 1,073 (3.4%) |
| $55,000 to $64,999 | 3,289 (10.3%) | 2,007 (6.4%) |
| $65,000 to $74,999 | 1,505 (4.7%) | 945 (3.0%) |
| $75,000 to $99,999 | 2,908 (9.1%) | 1,559 (5.0%) |
| $100,000+ | 2,071 (6.5%) | 905 (2.9%) |
| Total | 31,820 (100.0%) | 31,390 (100.0%) |
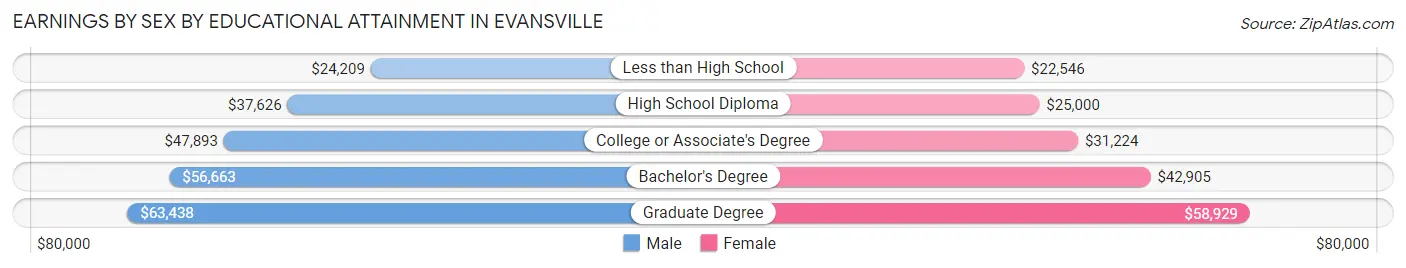
Earnings by Sex by Educational Attainment in Evansville
Average earnings in Evansville are $45,023 for men and $31,743 for women, a difference of 29.5%. Men with an educational attainment of graduate degree enjoy the highest average annual earnings of $63,438, while those with less than high school education earn the least with $24,209. Women with an educational attainment of graduate degree earn the most with the average annual earnings of $58,929, while those with less than high school education have the smallest earnings of $22,546.
| Educational Attainment | Male Income | Female Income |
| Less than High School | $24,209 | $22,546 |
| High School Diploma | $37,626 | $25,000 |
| College or Associate's Degree | $47,893 | $31,224 |
| Bachelor's Degree | $56,663 | $42,905 |
| Graduate Degree | $63,438 | $58,929 |
| Total | $45,023 | $31,743 |
Family Income in Evansville
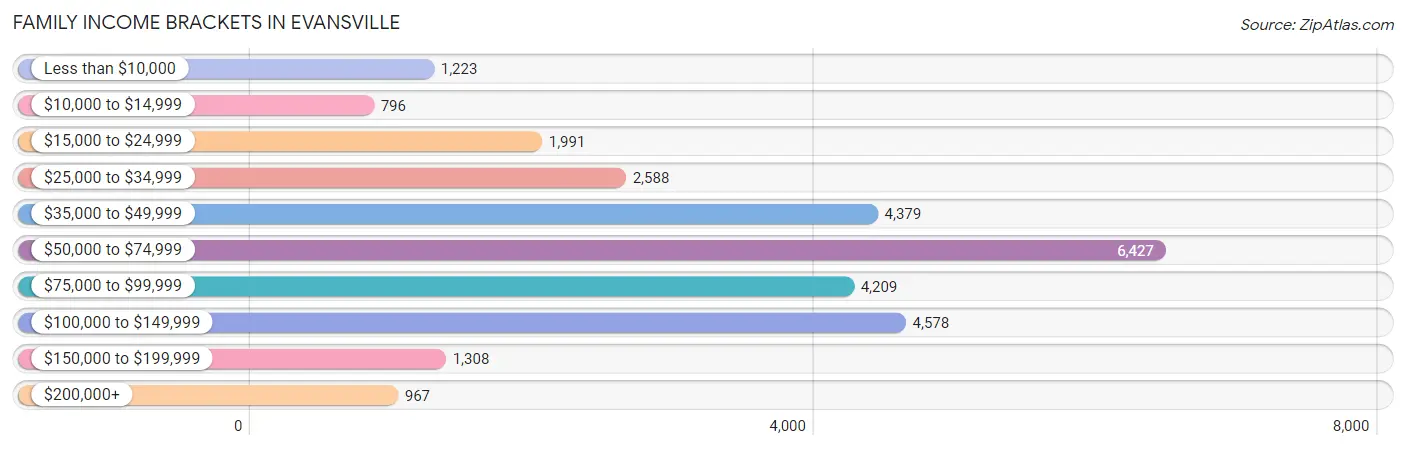
Family Income Brackets in Evansville
According to the Evansville family income data, there are 6,427 families falling into the $50,000 to $74,999 income range, which is the most common income bracket and makes up 22.6% of all families. Conversely, the $10,000 to $14,999 income bracket is the least frequent group with only 796 families (2.8%) belonging to this category.
| Income Bracket | # Families | % Families |
| Less than $10,000 | 1,223 | 4.3% |
| $10,000 to $14,999 | 796 | 2.8% |
| $15,000 to $24,999 | 1,991 | 7.0% |
| $25,000 to $34,999 | 2,588 | 9.1% |
| $35,000 to $49,999 | 4,379 | 15.4% |
| $50,000 to $74,999 | 6,427 | 22.6% |
| $75,000 to $99,999 | 4,209 | 14.8% |
| $100,000 to $149,999 | 4,578 | 16.1% |
| $150,000 to $199,999 | 1,308 | 4.6% |
| $200,000+ | 967 | 3.4% |
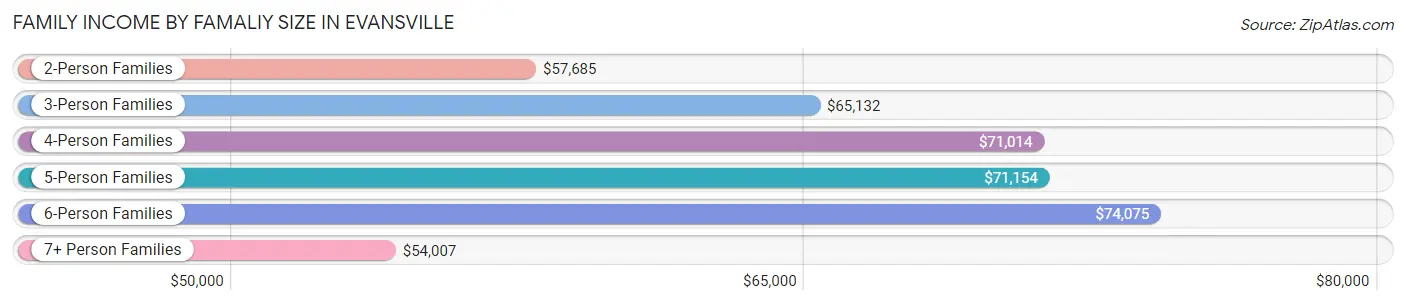
Family Income by Famaliy Size in Evansville
6-person families (711 | 2.5%) account for the highest median family income in Evansville with $74,075 per family, while 2-person families (14,778 | 52.0%) have the highest median income of $28,842 per family member.
| Income Bracket | # Families | Median Income |
| 2-Person Families | 14,778 (52.0%) | $57,685 |
| 3-Person Families | 6,628 (23.3%) | $65,132 |
| 4-Person Families | 4,322 (15.2%) | $71,014 |
| 5-Person Families | 1,678 (5.9%) | $71,154 |
| 6-Person Families | 711 (2.5%) | $74,075 |
| 7+ Person Families | 319 (1.1%) | $54,007 |
| Total | 28,436 (100.0%) | $61,612 |
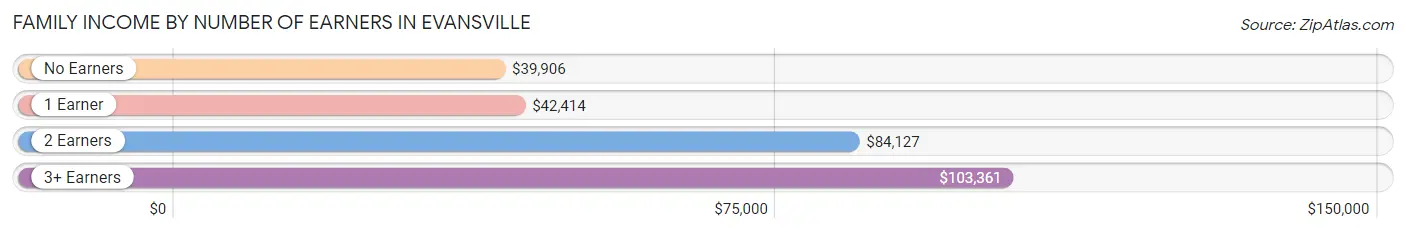
Family Income by Number of Earners in Evansville
The median family income in Evansville is $61,612, with families comprising 3+ earners (2,342) having the highest median family income of $103,361, while families with no earners (4,211) have the lowest median family income of $39,906, accounting for 8.2% and 14.8% of families, respectively.
| Number of Earners | # Families | Median Income |
| No Earners | 4,211 (14.8%) | $39,906 |
| 1 Earner | 10,202 (35.9%) | $42,414 |
| 2 Earners | 11,681 (41.1%) | $84,127 |
| 3+ Earners | 2,342 (8.2%) | $103,361 |
| Total | 28,436 (100.0%) | $61,612 |
Household Income in Evansville
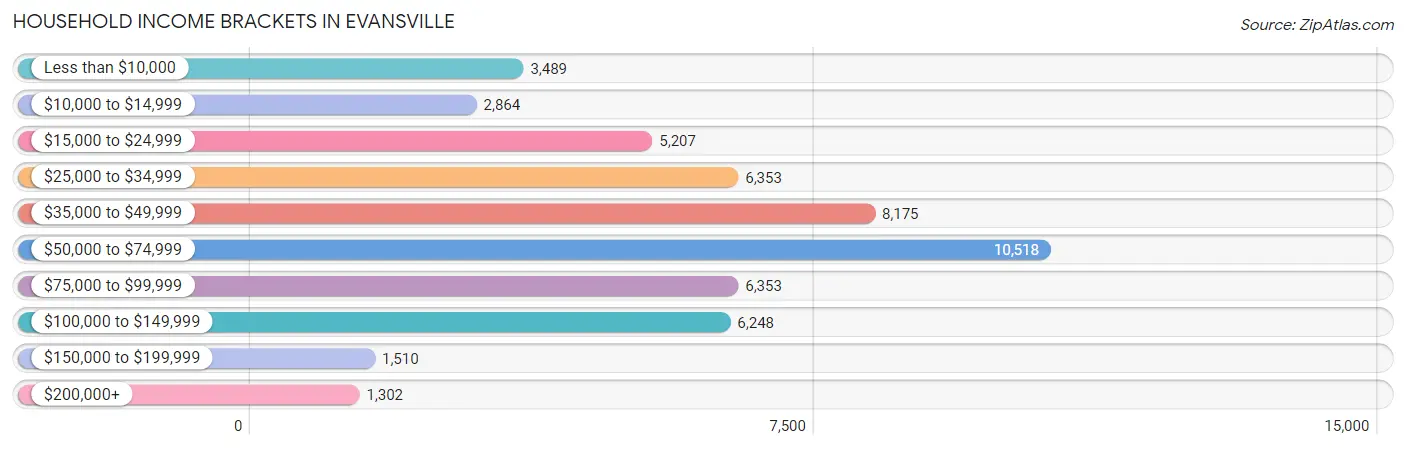
Household Income Brackets in Evansville
With 10,518 households falling in the category, the $50,000 to $74,999 income range is the most frequent in Evansville, accounting for 20.2% of all households. In contrast, only 1,302 households (2.5%) fall into the $200,000+ income bracket, making it the least populous group.
| Income Bracket | # Households | % Households |
| Less than $10,000 | 3,489 | 6.7% |
| $10,000 to $14,999 | 2,864 | 5.5% |
| $15,000 to $24,999 | 5,207 | 10.0% |
| $25,000 to $34,999 | 6,353 | 12.2% |
| $35,000 to $49,999 | 8,175 | 15.7% |
| $50,000 to $74,999 | 10,518 | 20.2% |
| $75,000 to $99,999 | 6,353 | 12.2% |
| $100,000 to $149,999 | 6,248 | 12.0% |
| $150,000 to $199,999 | 1,510 | 2.9% |
| $200,000+ | 1,302 | 2.5% |
Household Income by Householder Age in Evansville
The median household income in Evansville is $49,853, with the highest median household income of $58,219 found in the 25 to 44 years age bracket for the primary householder. A total of 18,055 households (34.7%) fall into this category. Meanwhile, the 15 to 24 years age bracket for the primary householder has the lowest median household income of $36,250, with 3,554 households (6.8%) in this group.
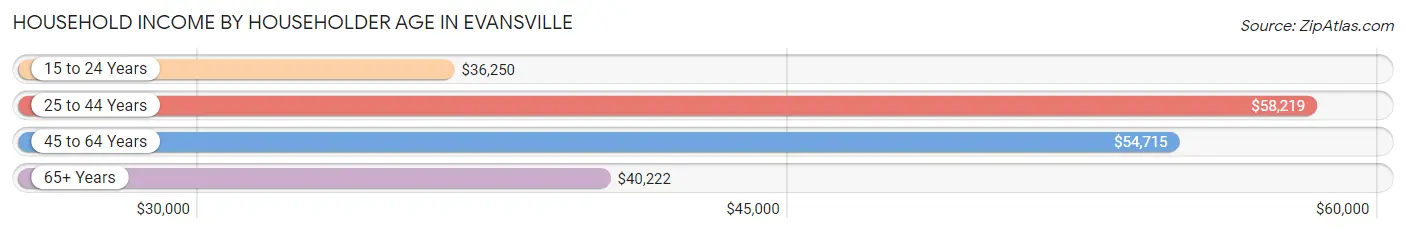
| Income Bracket | # Households | Median Income |
| 15 to 24 Years | 3,554 (6.8%) | $36,250 |
| 25 to 44 Years | 18,055 (34.7%) | $58,219 |
| 45 to 64 Years | 17,828 (34.2%) | $54,715 |
| 65+ Years | 12,633 (24.3%) | $40,222 |
| Total | 52,070 (100.0%) | $49,853 |
Poverty in Evansville
Income Below Poverty by Sex and Age in Evansville
With 16.1% poverty level for males and 21.0% for females among the residents of Evansville, 5 year old males and 15 year old females are the most vulnerable to poverty, with 146 males (28.3%) and 249 females (43.8%) in their respective age groups living below the poverty level.
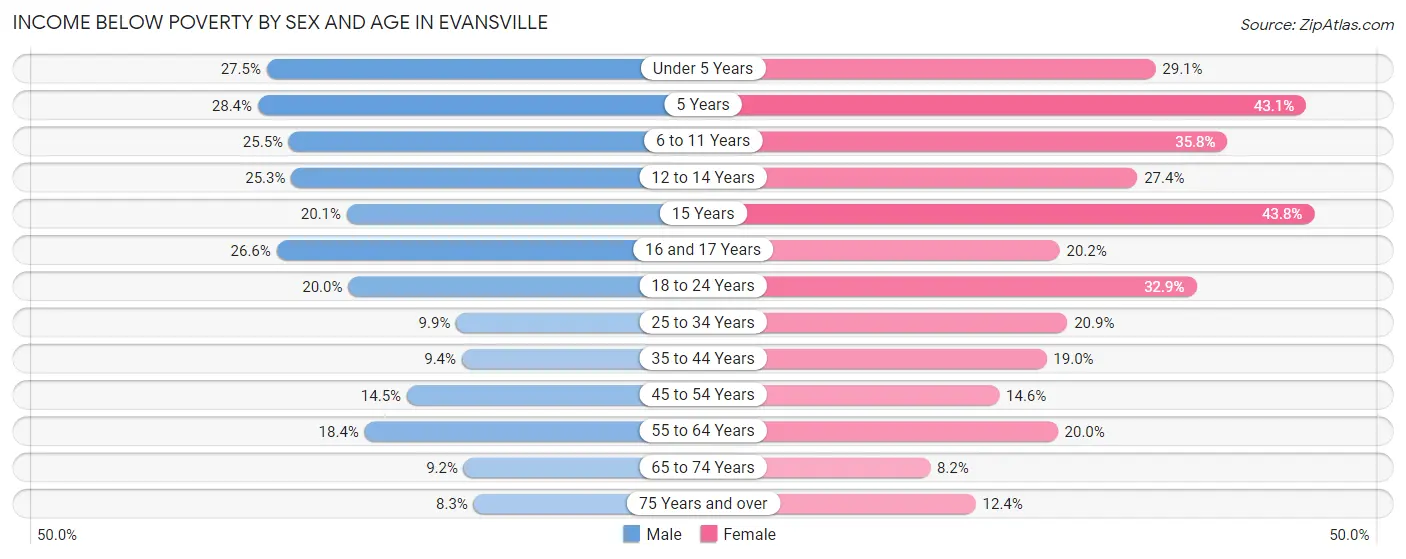
| Age Bracket | Male | Female |
| Under 5 Years | 1,029 (27.5%) | 982 (29.1%) |
| 5 Years | 146 (28.3%) | 249 (43.1%) |
| 6 to 11 Years | 1,074 (25.5%) | 1,314 (35.8%) |
| 12 to 14 Years | 575 (25.3%) | 613 (27.4%) |
| 15 Years | 139 (20.1%) | 249 (43.8%) |
| 16 and 17 Years | 338 (26.6%) | 209 (20.2%) |
| 18 to 24 Years | 1,060 (20.0%) | 1,581 (32.9%) |
| 25 to 34 Years | 856 (9.9%) | 1,888 (20.9%) |
| 35 to 44 Years | 664 (9.4%) | 1,351 (19.0%) |
| 45 to 54 Years | 961 (14.5%) | 978 (14.6%) |
| 55 to 64 Years | 1,379 (18.4%) | 1,606 (20.0%) |
| 65 to 74 Years | 481 (9.2%) | 468 (8.2%) |
| 75 Years and over | 209 (8.3%) | 588 (12.4%) |
| Total | 8,911 (16.1%) | 12,076 (21.0%) |
Income Above Poverty by Sex and Age in Evansville
According to the poverty statistics in Evansville, males aged 75 years and over and females aged 65 to 74 years are the age groups that are most secure financially, with 91.7% of males and 91.8% of females in these age groups living above the poverty line.
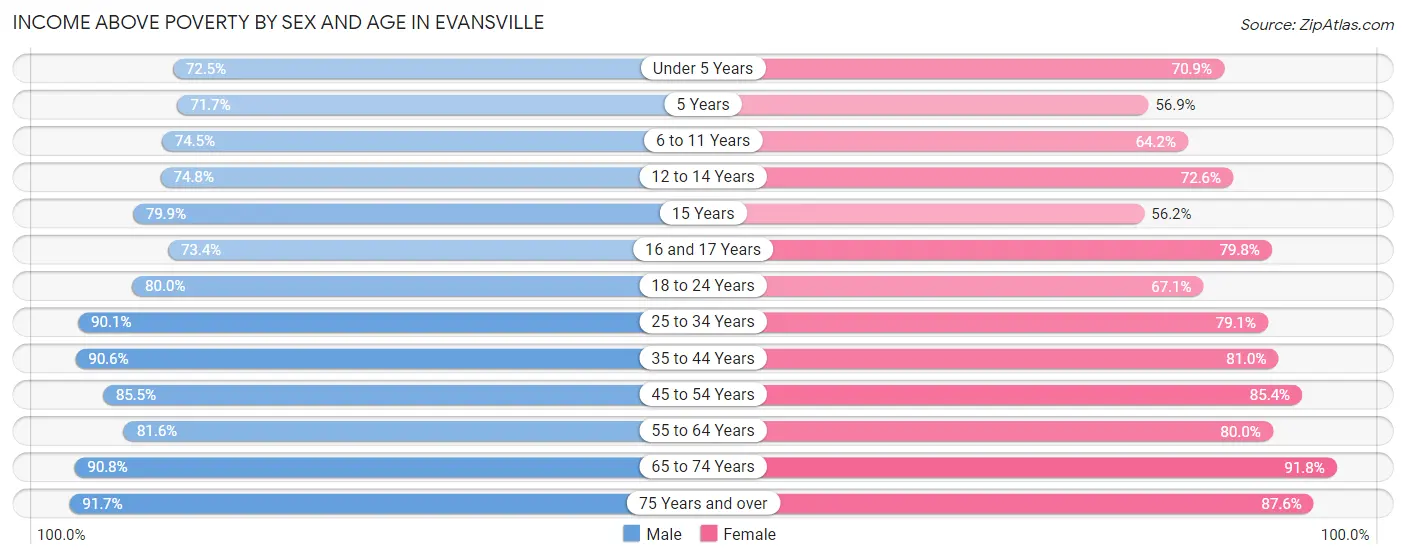
| Age Bracket | Male | Female |
| Under 5 Years | 2,709 (72.5%) | 2,393 (70.9%) |
| 5 Years | 369 (71.7%) | 329 (56.9%) |
| 6 to 11 Years | 3,142 (74.5%) | 2,358 (64.2%) |
| 12 to 14 Years | 1,702 (74.8%) | 1,623 (72.6%) |
| 15 Years | 553 (79.9%) | 319 (56.2%) |
| 16 and 17 Years | 932 (73.4%) | 825 (79.8%) |
| 18 to 24 Years | 4,250 (80.0%) | 3,226 (67.1%) |
| 25 to 34 Years | 7,753 (90.1%) | 7,137 (79.1%) |
| 35 to 44 Years | 6,383 (90.6%) | 5,764 (81.0%) |
| 45 to 54 Years | 5,659 (85.5%) | 5,722 (85.4%) |
| 55 to 64 Years | 6,101 (81.6%) | 6,412 (80.0%) |
| 65 to 74 Years | 4,727 (90.8%) | 5,254 (91.8%) |
| 75 Years and over | 2,302 (91.7%) | 4,147 (87.6%) |
| Total | 46,582 (83.9%) | 45,509 (79.0%) |
Income Below Poverty Among Married-Couple Families in Evansville
The poverty statistics for married-couple families in Evansville show that 4.3% or 747 of the total 17,580 families live below the poverty line. Families with 5 or more children have the highest poverty rate of 32.7%, comprising of 35 families. On the other hand, families with no children have the lowest poverty rate of 2.4%, which includes 274 families.
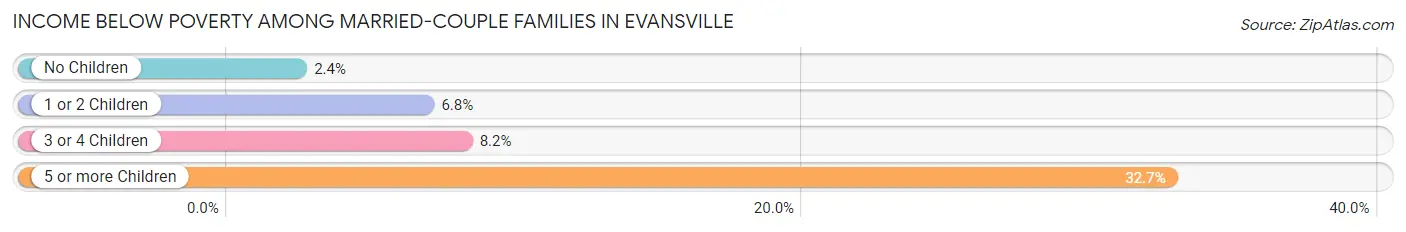
| Children | Above Poverty | Below Poverty |
| No Children | 11,081 (97.6%) | 274 (2.4%) |
| 1 or 2 Children | 4,332 (93.2%) | 318 (6.8%) |
| 3 or 4 Children | 1,348 (91.8%) | 120 (8.2%) |
| 5 or more Children | 72 (67.3%) | 35 (32.7%) |
| Total | 16,833 (95.8%) | 747 (4.3%) |
Income Below Poverty Among Single-Parent Households in Evansville
According to the poverty data in Evansville, 14.8% or 468 single-father households and 30.8% or 2,375 single-mother households are living below the poverty line. Among single-father households, those with 5 or more children have the highest poverty rate, with 32 households (78.0%) experiencing poverty. Likewise, among single-mother households, those with 5 or more children have the highest poverty rate, with 57 households (100.0%) falling below the poverty line.
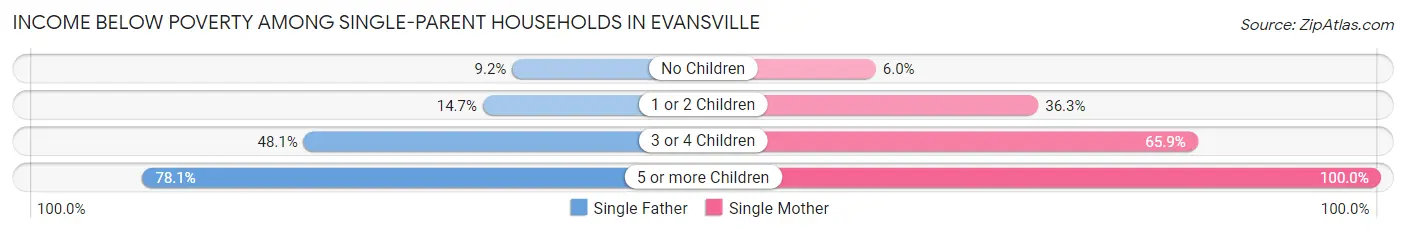
| Children | Single Father | Single Mother |
| No Children | 120 (9.2%) | 146 (6.0%) |
| 1 or 2 Children | 242 (14.7%) | 1,543 (36.2%) |
| 3 or 4 Children | 74 (48.0%) | 629 (65.9%) |
| 5 or more Children | 32 (78.0%) | 57 (100.0%) |
| Total | 468 (14.8%) | 2,375 (30.8%) |
Income Below Poverty Among Married-Couple vs Single-Parent Households in Evansville
The poverty data for Evansville shows that 747 of the married-couple family households (4.3%) and 2,843 of the single-parent households (26.2%) are living below the poverty level. Within the married-couple family households, those with 5 or more children have the highest poverty rate, with 35 households (32.7%) falling below the poverty line. Among the single-parent households, those with 5 or more children have the highest poverty rate, with 89 household (90.8%) living below poverty.
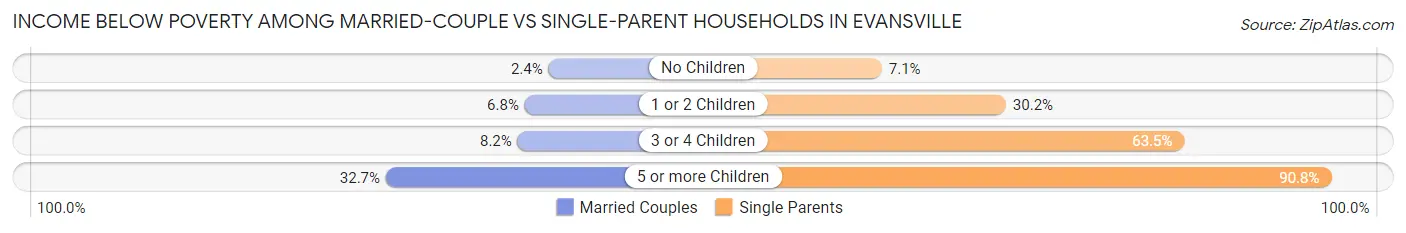
| Children | Married-Couple Families | Single-Parent Households |
| No Children | 274 (2.4%) | 266 (7.1%) |
| 1 or 2 Children | 318 (6.8%) | 1,785 (30.2%) |
| 3 or 4 Children | 120 (8.2%) | 703 (63.4%) |
| 5 or more Children | 35 (32.7%) | 89 (90.8%) |
| Total | 747 (4.3%) | 2,843 (26.2%) |
Race in Evansville
The most populous races in Evansville are White / Caucasian (91,615 | 78.4%), Black / African American (15,947 | 13.6%), and Two or more Races (5,624 | 4.8%).
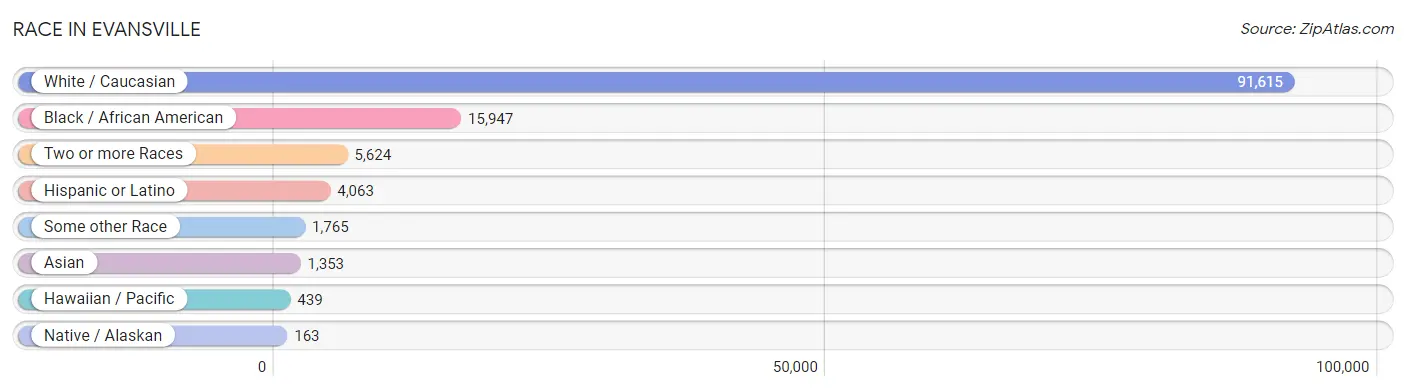
| Race | # Population | % Population |
| Asian | 1,353 | 1.2% |
| Black / African American | 15,947 | 13.6% |
| Hawaiian / Pacific | 439 | 0.4% |
| Hispanic or Latino | 4,063 | 3.5% |
| Native / Alaskan | 163 | 0.1% |
| White / Caucasian | 91,615 | 78.4% |
| Two or more Races | 5,624 | 4.8% |
| Some other Race | 1,765 | 1.5% |
| Total | 116,906 | 100.0% |
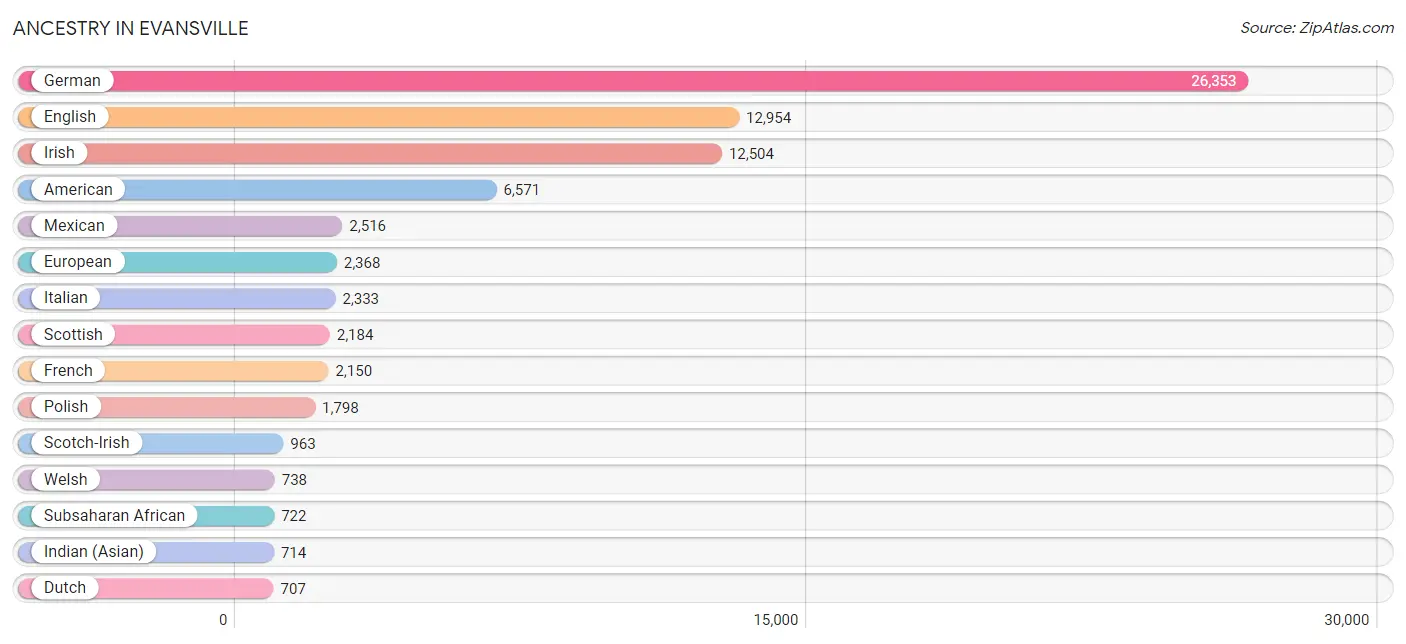
Ancestry in Evansville
The most populous ancestries reported in Evansville are German (26,353 | 22.5%), English (12,954 | 11.1%), Irish (12,504 | 10.7%), American (6,571 | 5.6%), and Mexican (2,516 | 2.1%), together accounting for 52.1% of all Evansville residents.
| Ancestry | # Population | % Population |
| African | 518 | 0.4% |
| Albanian | 5 | 0.0% |
| Alsatian | 6 | 0.0% |
| American | 6,571 | 5.6% |
| Apache | 24 | 0.0% |
| Arab | 153 | 0.1% |
| Armenian | 12 | 0.0% |
| Australian | 5 | 0.0% |
| Austrian | 123 | 0.1% |
| Bahamian | 11 | 0.0% |
| Belgian | 24 | 0.0% |
| Bhutanese | 217 | 0.2% |
| Blackfeet | 84 | 0.1% |
| Brazilian | 31 | 0.0% |
| British | 612 | 0.5% |
| Burmese | 301 | 0.3% |
| Canadian | 47 | 0.0% |
| Celtic | 8 | 0.0% |
| Central American | 662 | 0.6% |
| Central American Indian | 107 | 0.1% |
| Cherokee | 352 | 0.3% |
| Choctaw | 4 | 0.0% |
| Colombian | 31 | 0.0% |
| Comanche | 3 | 0.0% |
| Croatian | 18 | 0.0% |
| Cuban | 47 | 0.0% |
| Czech | 18 | 0.0% |
| Czechoslovakian | 8 | 0.0% |
| Danish | 84 | 0.1% |
| Dominican | 41 | 0.0% |
| Dutch | 707 | 0.6% |
| Dutch West Indian | 22 | 0.0% |
| Eastern European | 119 | 0.1% |
| Ecuadorian | 16 | 0.0% |
| English | 12,954 | 11.1% |
| Ethiopian | 2 | 0.0% |
| European | 2,368 | 2.0% |
| Fijian | 277 | 0.2% |
| Filipino | 51 | 0.0% |
| Finnish | 67 | 0.1% |
| French | 2,150 | 1.8% |
| French Canadian | 293 | 0.3% |
| German | 26,353 | 22.5% |
| German Russian | 32 | 0.0% |
| Ghanaian | 3 | 0.0% |
| Greek | 126 | 0.1% |
| Guamanian / Chamorro | 20 | 0.0% |
| Guatemalan | 138 | 0.1% |
| Guyanese | 34 | 0.0% |
| Haitian | 290 | 0.3% |
| Honduran | 177 | 0.2% |
| Hungarian | 188 | 0.2% |
| Indian (Asian) | 714 | 0.6% |
| Iranian | 87 | 0.1% |
| Irish | 12,504 | 10.7% |
| Israeli | 32 | 0.0% |
| Italian | 2,333 | 2.0% |
| Jamaican | 252 | 0.2% |
| Japanese | 50 | 0.0% |
| Jordanian | 4 | 0.0% |
| Kenyan | 26 | 0.0% |
| Korean | 257 | 0.2% |
| Lebanese | 13 | 0.0% |
| Liberian | 1 | 0.0% |
| Lithuanian | 5 | 0.0% |
| Lumbee | 8 | 0.0% |
| Mexican | 2,516 | 2.1% |
| Mexican American Indian | 118 | 0.1% |
| Native Hawaiian | 15 | 0.0% |
| Navajo | 9 | 0.0% |
| Nicaraguan | 36 | 0.0% |
| Nigerian | 31 | 0.0% |
| Northern European | 108 | 0.1% |
| Norwegian | 448 | 0.4% |
| Pakistani | 54 | 0.1% |
| Palestinian | 30 | 0.0% |
| Panamanian | 2 | 0.0% |
| Pennsylvania German | 8 | 0.0% |
| Peruvian | 20 | 0.0% |
| Polish | 1,798 | 1.5% |
| Portuguese | 14 | 0.0% |
| Potawatomi | 5 | 0.0% |
| Puerto Rican | 325 | 0.3% |
| Romanian | 36 | 0.0% |
| Russian | 246 | 0.2% |
| Salvadoran | 309 | 0.3% |
| Samoan | 93 | 0.1% |
| Scandinavian | 248 | 0.2% |
| Scotch-Irish | 963 | 0.8% |
| Scottish | 2,184 | 1.9% |
| Senegalese | 124 | 0.1% |
| Serbian | 32 | 0.0% |
| Sioux | 56 | 0.1% |
| Slavic | 1 | 0.0% |
| Slovak | 79 | 0.1% |
| South American | 197 | 0.2% |
| Spaniard | 78 | 0.1% |
| Spanish | 45 | 0.0% |
| Sri Lankan | 108 | 0.1% |
| Subsaharan African | 722 | 0.6% |
| Swedish | 386 | 0.3% |
| Swiss | 142 | 0.1% |
| Syrian | 51 | 0.0% |
| Thai | 348 | 0.3% |
| Trinidadian and Tobagonian | 45 | 0.0% |
| Turkish | 85 | 0.1% |
| Ukrainian | 78 | 0.1% |
| Venezuelan | 112 | 0.1% |
| Welsh | 738 | 0.6% |
| West Indian | 71 | 0.1% |
| Yugoslavian | 13 | 0.0% | View All 111 Rows |
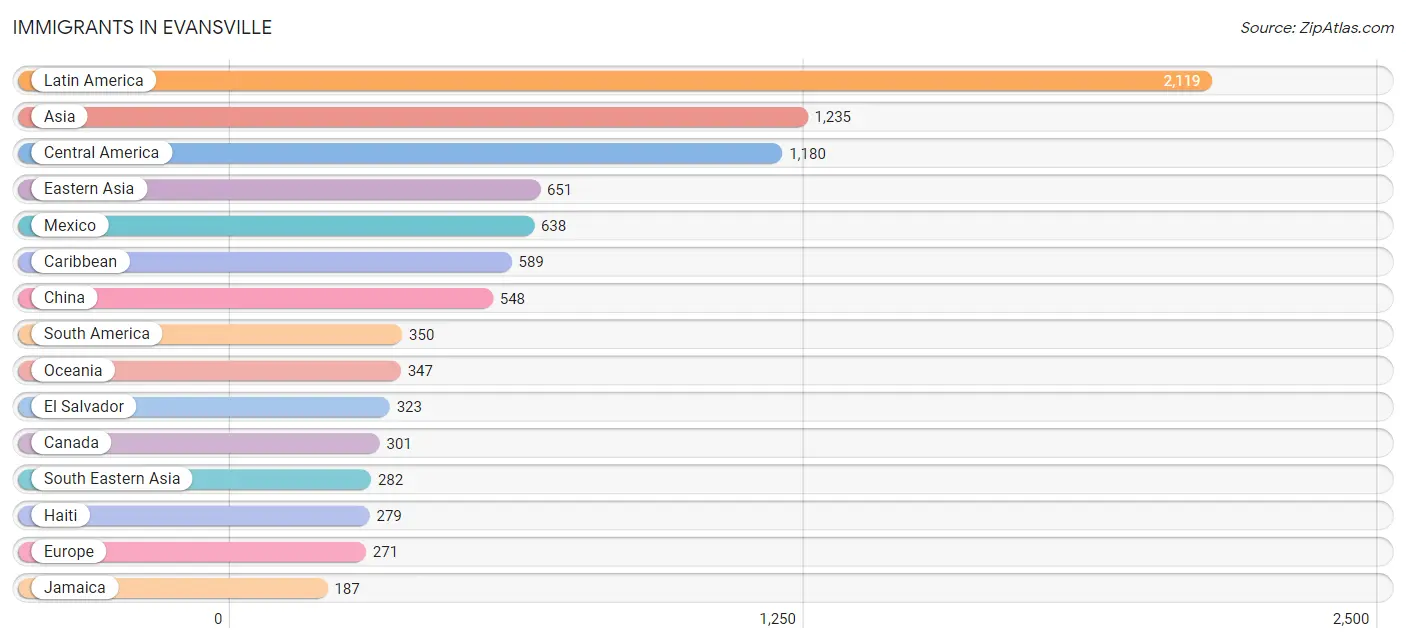
Immigrants in Evansville
The most numerous immigrant groups reported in Evansville came from Latin America (2,119 | 1.8%), Asia (1,235 | 1.1%), Central America (1,180 | 1.0%), Eastern Asia (651 | 0.6%), and Mexico (638 | 0.5%), together accounting for 5.0% of all Evansville residents.
| Immigration Origin | # Population | % Population |
| Afghanistan | 21 | 0.0% |
| Africa | 163 | 0.1% |
| Albania | 5 | 0.0% |
| Asia | 1,235 | 1.1% |
| Australia | 6 | 0.0% |
| Bangladesh | 2 | 0.0% |
| Belarus | 10 | 0.0% |
| Belize | 9 | 0.0% |
| Brazil | 38 | 0.0% |
| Cambodia | 16 | 0.0% |
| Canada | 301 | 0.3% |
| Caribbean | 589 | 0.5% |
| Central America | 1,180 | 1.0% |
| China | 548 | 0.5% |
| Colombia | 16 | 0.0% |
| Cuba | 47 | 0.0% |
| Denmark | 7 | 0.0% |
| Dominica | 62 | 0.1% |
| Dominican Republic | 14 | 0.0% |
| Eastern Africa | 28 | 0.0% |
| Eastern Asia | 651 | 0.6% |
| Eastern Europe | 164 | 0.1% |
| Ecuador | 16 | 0.0% |
| El Salvador | 323 | 0.3% |
| England | 27 | 0.0% |
| Ethiopia | 2 | 0.0% |
| Europe | 271 | 0.2% |
| France | 2 | 0.0% |
| Germany | 26 | 0.0% |
| Ghana | 7 | 0.0% |
| Guatemala | 127 | 0.1% |
| Guyana | 13 | 0.0% |
| Haiti | 279 | 0.2% |
| Honduras | 83 | 0.1% |
| Hong Kong | 54 | 0.1% |
| India | 126 | 0.1% |
| Iran | 7 | 0.0% |
| Ireland | 26 | 0.0% |
| Israel | 1 | 0.0% |
| Italy | 8 | 0.0% |
| Jamaica | 187 | 0.2% |
| Japan | 53 | 0.1% |
| Kenya | 26 | 0.0% |
| Korea | 50 | 0.0% |
| Latin America | 2,119 | 1.8% |
| Lebanon | 21 | 0.0% |
| Malaysia | 15 | 0.0% |
| Mexico | 638 | 0.5% |
| Morocco | 6 | 0.0% |
| Nigeria | 29 | 0.0% |
| Northern Africa | 6 | 0.0% |
| Northern Europe | 71 | 0.1% |
| Norway | 5 | 0.0% |
| Oceania | 347 | 0.3% |
| Pakistan | 17 | 0.0% |
| Peru | 152 | 0.1% |
| Philippines | 124 | 0.1% |
| Poland | 13 | 0.0% |
| Romania | 12 | 0.0% |
| Russia | 26 | 0.0% |
| Senegal | 76 | 0.1% |
| Serbia | 10 | 0.0% |
| South America | 350 | 0.3% |
| South Central Asia | 173 | 0.2% |
| South Eastern Asia | 282 | 0.2% |
| Southern Europe | 8 | 0.0% |
| Syria | 30 | 0.0% |
| Taiwan | 30 | 0.0% |
| Thailand | 54 | 0.1% |
| Turkey | 29 | 0.0% |
| Ukraine | 37 | 0.0% |
| Venezuela | 115 | 0.1% |
| Vietnam | 73 | 0.1% |
| Western Africa | 129 | 0.1% |
| Western Asia | 99 | 0.1% |
| Western Europe | 28 | 0.0% | View All 76 Rows |
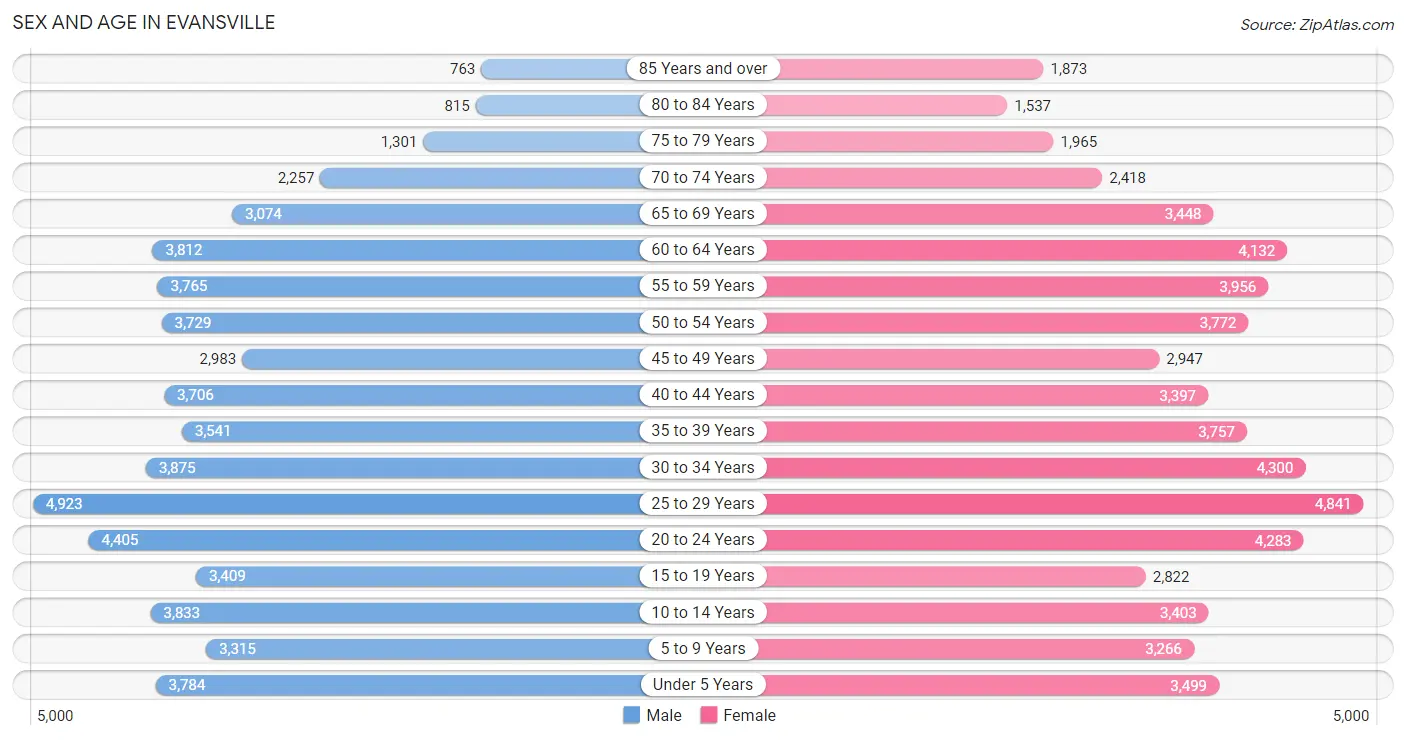
Sex and Age in Evansville
Sex and Age in Evansville
The most populous age groups in Evansville are 25 to 29 Years (4,923 | 8.6%) for men and 25 to 29 Years (4,841 | 8.1%) for women.
| Age Bracket | Male | Female |
| Under 5 Years | 3,784 (6.6%) | 3,499 (5.9%) |
| 5 to 9 Years | 3,315 (5.8%) | 3,266 (5.5%) |
| 10 to 14 Years | 3,833 (6.7%) | 3,403 (5.7%) |
| 15 to 19 Years | 3,409 (5.9%) | 2,822 (4.7%) |
| 20 to 24 Years | 4,405 (7.7%) | 4,283 (7.2%) |
| 25 to 29 Years | 4,923 (8.6%) | 4,841 (8.1%) |
| 30 to 34 Years | 3,875 (6.8%) | 4,300 (7.2%) |
| 35 to 39 Years | 3,541 (6.2%) | 3,757 (6.3%) |
| 40 to 44 Years | 3,706 (6.5%) | 3,397 (5.7%) |
| 45 to 49 Years | 2,983 (5.2%) | 2,947 (4.9%) |
| 50 to 54 Years | 3,729 (6.5%) | 3,772 (6.3%) |
| 55 to 59 Years | 3,765 (6.6%) | 3,956 (6.6%) |
| 60 to 64 Years | 3,812 (6.7%) | 4,132 (6.9%) |
| 65 to 69 Years | 3,074 (5.4%) | 3,448 (5.8%) |
| 70 to 74 Years | 2,257 (3.9%) | 2,418 (4.1%) |
| 75 to 79 Years | 1,301 (2.3%) | 1,965 (3.3%) |
| 80 to 84 Years | 815 (1.4%) | 1,537 (2.6%) |
| 85 Years and over | 763 (1.3%) | 1,873 (3.1%) |
| Total | 57,290 (100.0%) | 59,616 (100.0%) |
Families and Households in Evansville
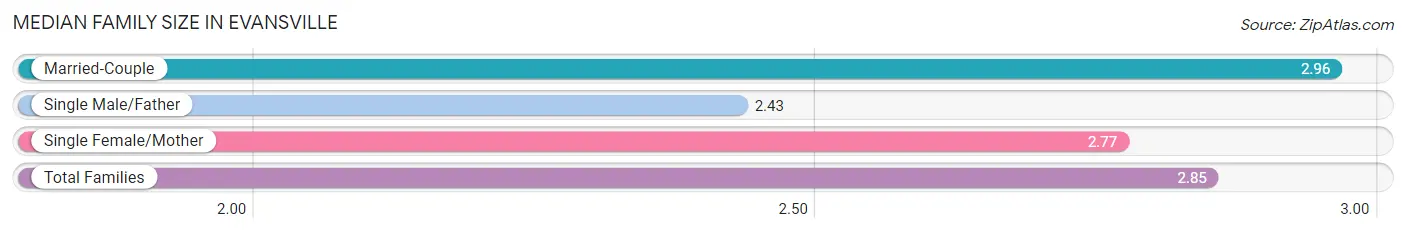
Median Family Size in Evansville
The median family size in Evansville is 2.85 persons per family, with married-couple families (17,580 | 61.8%) accounting for the largest median family size of 2.96 persons per family. On the other hand, single male/father families (3,153 | 11.1%) represent the smallest median family size with 2.43 persons per family.
| Family Type | # Families | Family Size |
| Married-Couple | 17,580 (61.8%) | 2.96 |
| Single Male/Father | 3,153 (11.1%) | 2.43 |
| Single Female/Mother | 7,703 (27.1%) | 2.77 |
| Total Families | 28,436 (100.0%) | 2.85 |
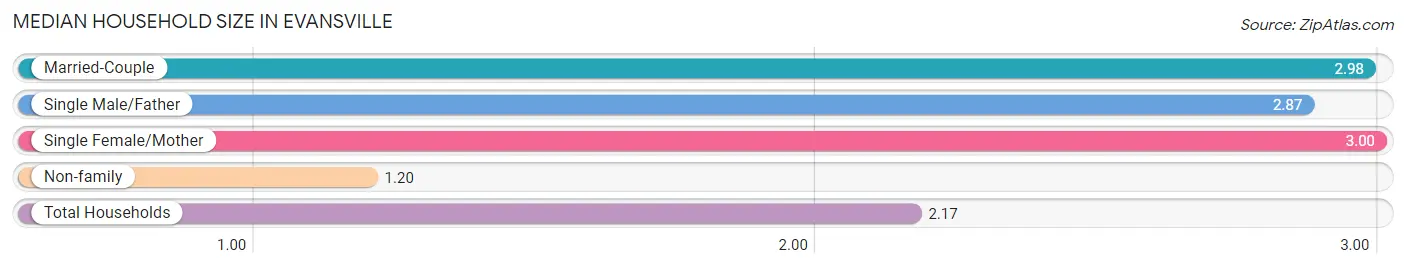
Median Household Size in Evansville
The median household size in Evansville is 2.17 persons per household, with single female/mother households (7,703 | 14.8%) accounting for the largest median household size of 3 persons per household. non-family households (23,634 | 45.4%) represent the smallest median household size with 1.20 persons per household.
| Household Type | # Households | Household Size |
| Married-Couple | 17,580 (33.8%) | 2.98 |
| Single Male/Father | 3,153 (6.1%) | 2.87 |
| Single Female/Mother | 7,703 (14.8%) | 3.00 |
| Non-family | 23,634 (45.4%) | 1.20 |
| Total Households | 52,070 (100.0%) | 2.17 |
Household Size by Marriage Status in Evansville
Out of a total of 52,070 households in Evansville, 28,436 (54.6%) are family households, while 23,634 (45.4%) are nonfamily households. The most numerous type of family households are 2-person households, comprising 12,972, and the most common type of nonfamily households are 1-person households, comprising 19,529.
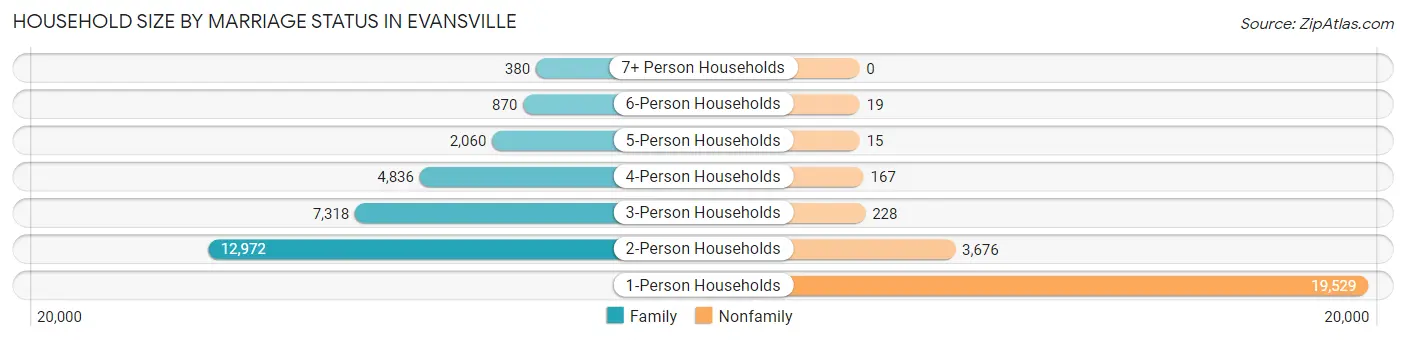
| Household Size | Family Households | Nonfamily Households |
| 1-Person Households | - | 19,529 (37.5%) |
| 2-Person Households | 12,972 (24.9%) | 3,676 (7.1%) |
| 3-Person Households | 7,318 (14.1%) | 228 (0.4%) |
| 4-Person Households | 4,836 (9.3%) | 167 (0.3%) |
| 5-Person Households | 2,060 (4.0%) | 15 (0.0%) |
| 6-Person Households | 870 (1.7%) | 19 (0.0%) |
| 7+ Person Households | 380 (0.7%) | 0 (0.0%) |
| Total | 28,436 (54.6%) | 23,634 (45.4%) |
Female Fertility in Evansville
Fertility by Age in Evansville
Average fertility rate in Evansville is 41.0 births per 1,000 women. Women in the age bracket of 20 to 34 years have the highest fertility rate with 56.0 births per 1,000 women. Women in the age bracket of 20 to 34 years acount for 67.9% of all women with births.
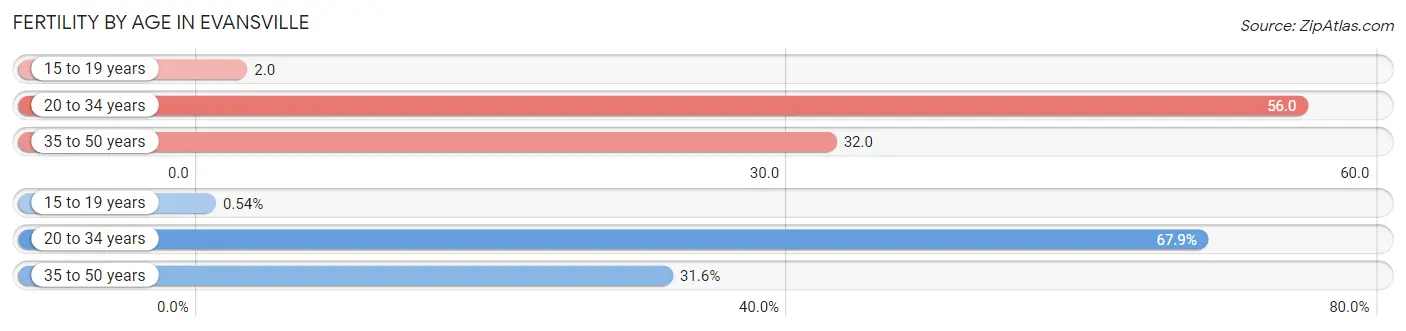
| Age Bracket | Women with Births | Births / 1,000 Women |
| 15 to 19 years | 6 (0.5%) | 2.0 |
| 20 to 34 years | 753 (67.9%) | 56.0 |
| 35 to 50 years | 350 (31.6%) | 32.0 |
| Total | 1,109 (100.0%) | 41.0 |
Fertility by Age by Marriage Status in Evansville
64.3% of women with births (1,109) in Evansville are married. The highest percentage of unmarried women with births falls into 15 to 19 years age bracket with 100.0% of them unmarried at the time of birth, while the lowest percentage of unmarried women with births belong to 35 to 50 years age bracket with 10.9% of them unmarried.
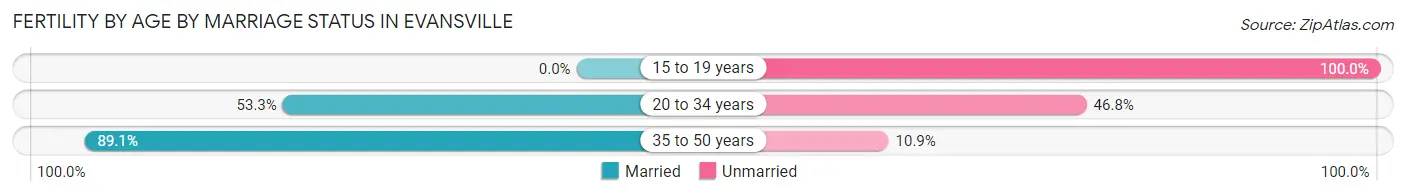
| Age Bracket | Married | Unmarried |
| 15 to 19 years | 0 (0.0%) | 6 (100.0%) |
| 20 to 34 years | 401 (53.2%) | 352 (46.8%) |
| 35 to 50 years | 312 (89.1%) | 38 (10.9%) |
| Total | 713 (64.3%) | 396 (35.7%) |
Fertility by Education in Evansville
Average fertility rate in Evansville is 41.0 births per 1,000 women. Women with the education attainment of bachelor's degree have the highest fertility rate of 52.0 births per 1,000 women, while women with the education attainment of less than high school have the lowest fertility at 10.0 births per 1,000 women. Women with the education attainment of college or associate's degree represent 36.6% of all women with births.
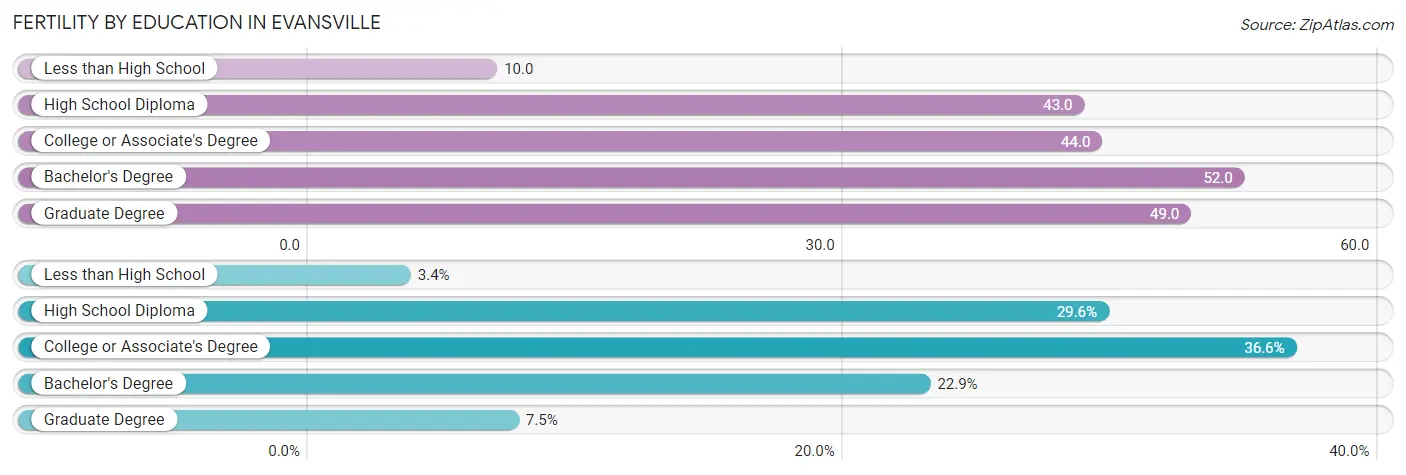
| Educational Attainment | Women with Births | Births / 1,000 Women |
| Less than High School | 38 (3.4%) | 10.0 |
| High School Diploma | 328 (29.6%) | 43.0 |
| College or Associate's Degree | 406 (36.6%) | 44.0 |
| Bachelor's Degree | 254 (22.9%) | 52.0 |
| Graduate Degree | 83 (7.5%) | 49.0 |
| Total | 1,109 (100.0%) | 41.0 |
Fertility by Education by Marriage Status in Evansville
35.7% of women with births in Evansville are unmarried. Women with the educational attainment of bachelor's degree are most likely to be married with 97.6% of them married at childbirth, while women with the educational attainment of high school diploma are least likely to be married with 61.3% of them unmarried at childbirth.
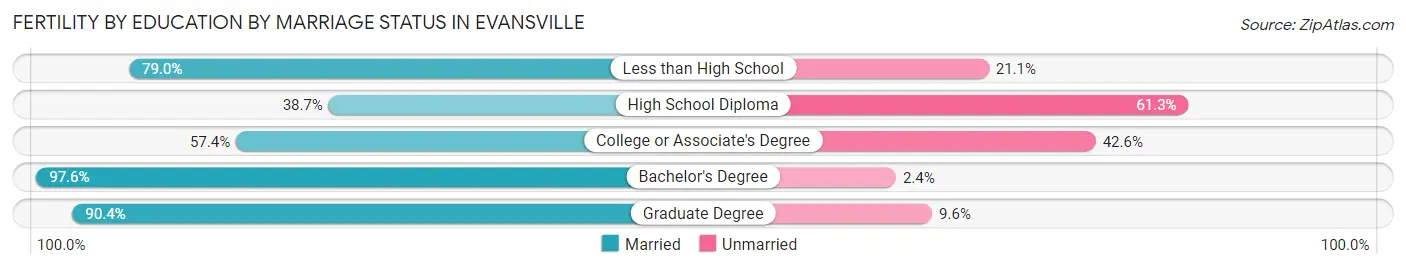
| Educational Attainment | Married | Unmarried |
| Less than High School | 30 (78.9%) | 8 (21.0%) |
| High School Diploma | 127 (38.7%) | 201 (61.3%) |
| College or Associate's Degree | 233 (57.4%) | 173 (42.6%) |
| Bachelor's Degree | 248 (97.6%) | 6 (2.4%) |
| Graduate Degree | 75 (90.4%) | 8 (9.6%) |
| Total | 713 (64.3%) | 396 (35.7%) |
Employment Characteristics in Evansville
Employment by Class of Employer in Evansville
Among the 56,235 employed individuals in Evansville, private company employees (42,013 | 74.7%), not-for-profit organizations (5,746 | 10.2%), and local government employees (2,981 | 5.3%) make up the most common classes of employment.
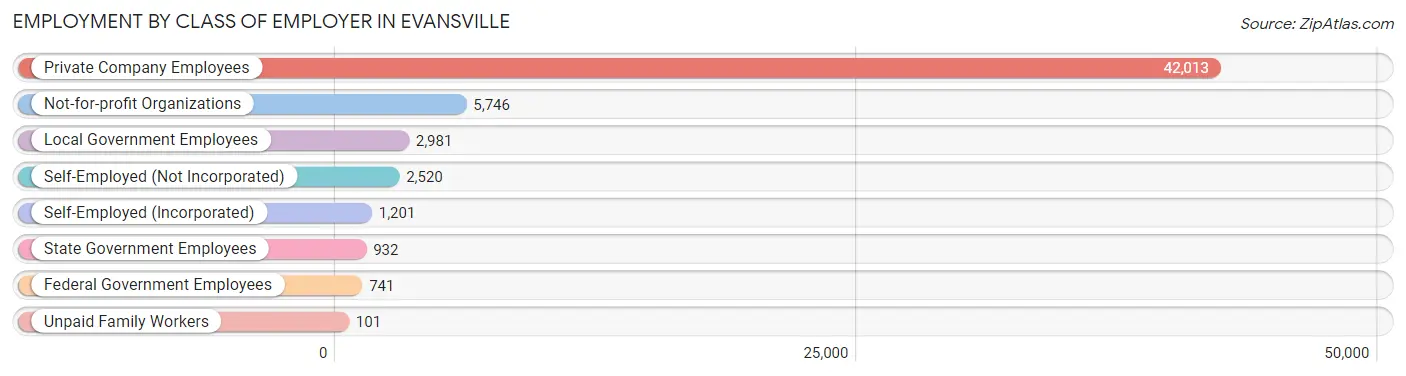
| Employer Class | # Employees | % Employees |
| Private Company Employees | 42,013 | 74.7% |
| Self-Employed (Incorporated) | 1,201 | 2.1% |
| Self-Employed (Not Incorporated) | 2,520 | 4.5% |
| Not-for-profit Organizations | 5,746 | 10.2% |
| Local Government Employees | 2,981 | 5.3% |
| State Government Employees | 932 | 1.7% |
| Federal Government Employees | 741 | 1.3% |
| Unpaid Family Workers | 101 | 0.2% |
| Total | 56,235 | 100.0% |
Employment Status by Age in Evansville
According to the labor force statistics for Evansville, out of the total population over 16 years of age (94,544), 64.0% or 60,508 individuals are in the labor force, with 5.7% or 3,449 of them unemployed. The age group with the highest labor force participation rate is 30 to 34 years, with 87.9% or 7,186 individuals in the labor force. Within the labor force, the 16 to 19 years age range has the highest percentage of unemployed individuals, with 8.9% or 222 of them being unemployed.
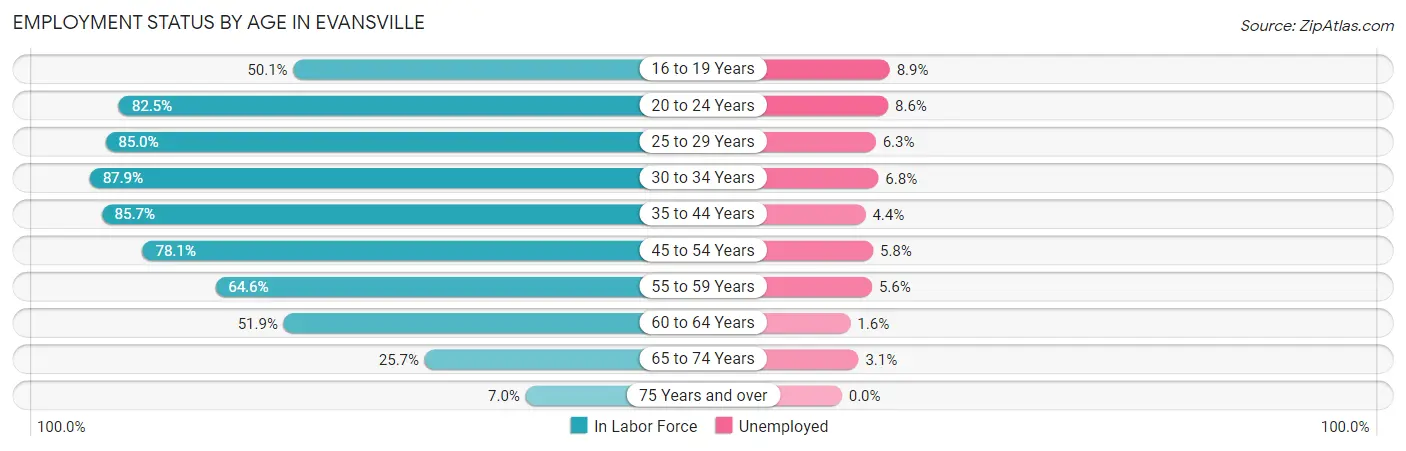
| Age Bracket | In Labor Force | Unemployed |
| 16 to 19 Years | 2,489 (50.1%) | 222 (8.9%) |
| 20 to 24 Years | 7,168 (82.5%) | 616 (8.6%) |
| 25 to 29 Years | 8,299 (85.0%) | 523 (6.3%) |
| 30 to 34 Years | 7,186 (87.9%) | 489 (6.8%) |
| 35 to 44 Years | 12,342 (85.7%) | 543 (4.4%) |
| 45 to 54 Years | 10,490 (78.1%) | 608 (5.8%) |
| 55 to 59 Years | 4,988 (64.6%) | 279 (5.6%) |
| 60 to 64 Years | 4,123 (51.9%) | 66 (1.6%) |
| 65 to 74 Years | 2,878 (25.7%) | 89 (3.1%) |
| 75 Years and over | 578 (7.0%) | 0 (0.0%) |
| Total | 60,508 (64.0%) | 3,449 (5.7%) |
Employment Status by Educational Attainment in Evansville
According to labor force statistics for Evansville, 77.2% of individuals (47,429) out of the total population between 25 and 64 years of age (61,436) are in the labor force, with 5.3% or 2,514 of them being unemployed. The group with the highest labor force participation rate are those with the educational attainment of bachelor's degree or higher, with 89.2% or 12,748 individuals in the labor force. Within the labor force, individuals with high school diploma education have the highest percentage of unemployment, with 9.6% or 1,387 of them being unemployed.
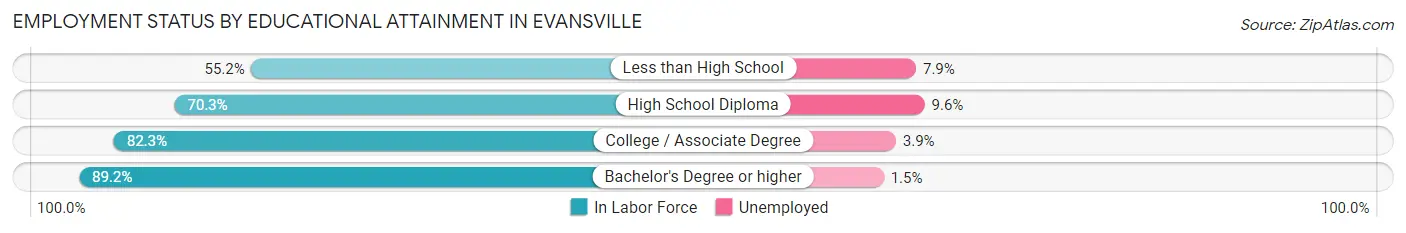
| Educational Attainment | In Labor Force | Unemployed |
| Less than High School | 3,348 (55.2%) | 479 (7.9%) |
| High School Diploma | 14,452 (70.3%) | 1,974 (9.6%) |
| College / Associate Degree | 16,890 (82.3%) | 800 (3.9%) |
| Bachelor's Degree or higher | 12,748 (89.2%) | 214 (1.5%) |
| Total | 47,429 (77.2%) | 3,256 (5.3%) |
Employment Occupations by Sex in Evansville
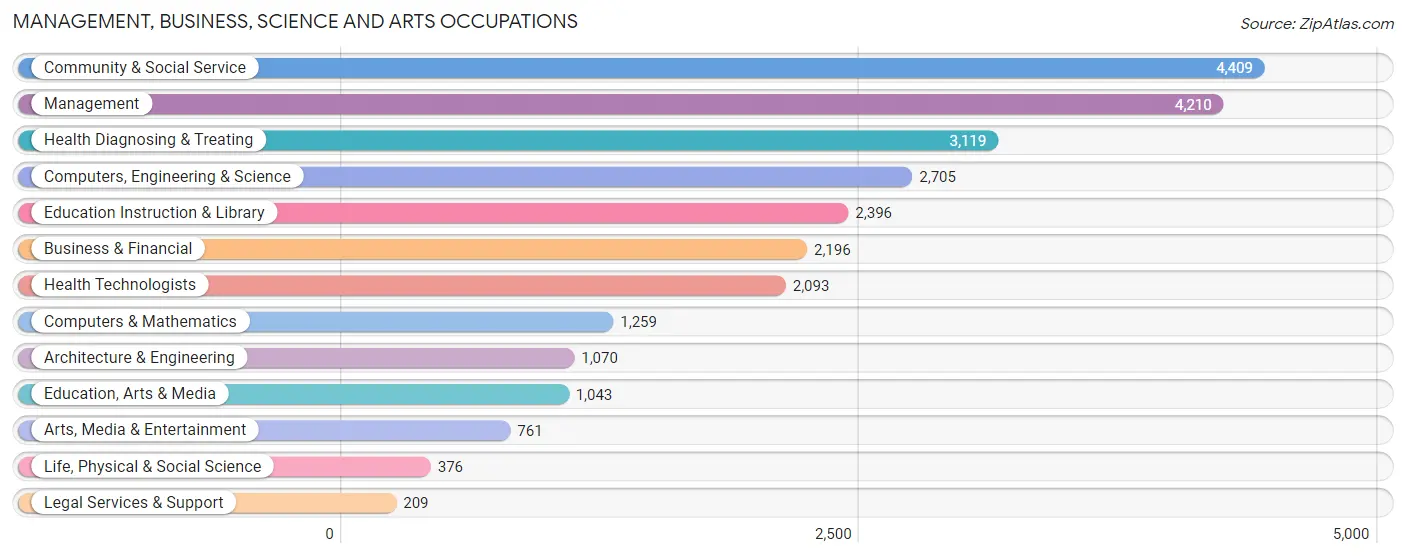
Management, Business, Science and Arts Occupations
The most common Management, Business, Science and Arts occupations in Evansville are Community & Social Service (4,409 | 7.7%), Management (4,210 | 7.4%), Health Diagnosing & Treating (3,119 | 5.5%), Computers, Engineering & Science (2,705 | 4.7%), and Education Instruction & Library (2,396 | 4.2%).
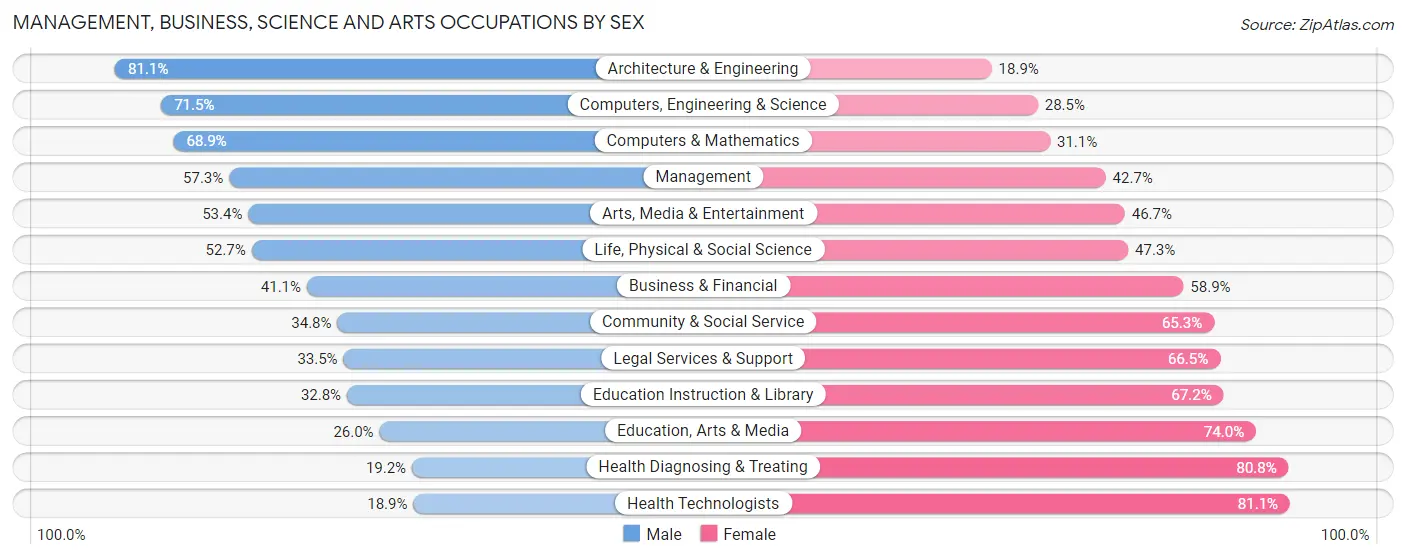
Management, Business, Science and Arts Occupations by Sex
Within the Management, Business, Science and Arts occupations in Evansville, the most male-oriented occupations are Architecture & Engineering (81.1%), Computers, Engineering & Science (71.5%), and Computers & Mathematics (68.9%), while the most female-oriented occupations are Health Technologists (81.1%), Health Diagnosing & Treating (80.8%), and Education, Arts & Media (74.0%).
| Occupation | Male | Female |
| Management | 2,414 (57.3%) | 1,796 (42.7%) |
| Business & Financial | 903 (41.1%) | 1,293 (58.9%) |
| Computers, Engineering & Science | 1,934 (71.5%) | 771 (28.5%) |
| Computers & Mathematics | 868 (68.9%) | 391 (31.1%) |
| Architecture & Engineering | 868 (81.1%) | 202 (18.9%) |
| Life, Physical & Social Science | 198 (52.7%) | 178 (47.3%) |
| Community & Social Service | 1,532 (34.7%) | 2,877 (65.2%) |
| Education, Arts & Media | 271 (26.0%) | 772 (74.0%) |
| Legal Services & Support | 70 (33.5%) | 139 (66.5%) |
| Education Instruction & Library | 785 (32.8%) | 1,611 (67.2%) |
| Arts, Media & Entertainment | 406 (53.3%) | 355 (46.7%) |
| Health Diagnosing & Treating | 599 (19.2%) | 2,520 (80.8%) |
| Health Technologists | 396 (18.9%) | 1,697 (81.1%) |
| Total (Category) | 7,382 (44.4%) | 9,257 (55.6%) |
| Total (Overall) | 28,817 (50.5%) | 28,278 (49.5%) |
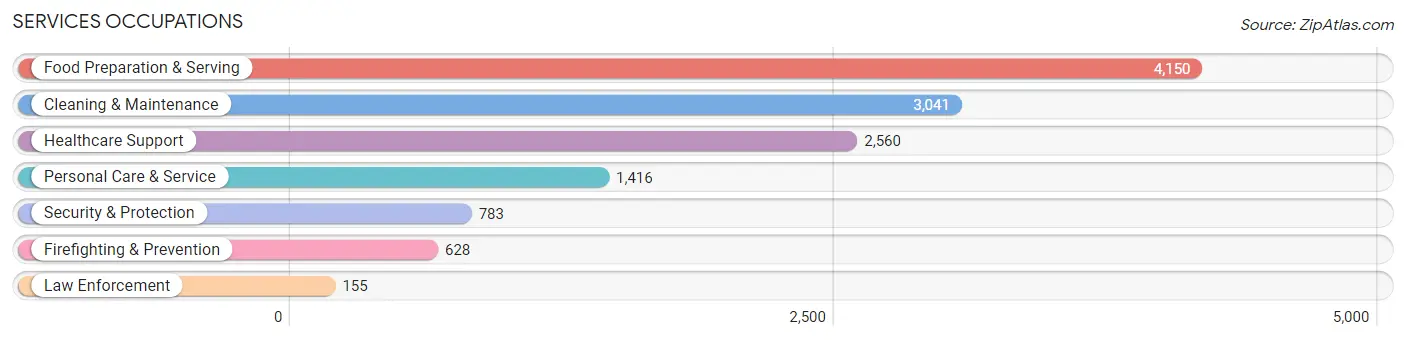
Services Occupations
The most common Services occupations in Evansville are Food Preparation & Serving (4,150 | 7.3%), Cleaning & Maintenance (3,041 | 5.3%), Healthcare Support (2,560 | 4.5%), Personal Care & Service (1,416 | 2.5%), and Security & Protection (783 | 1.4%).
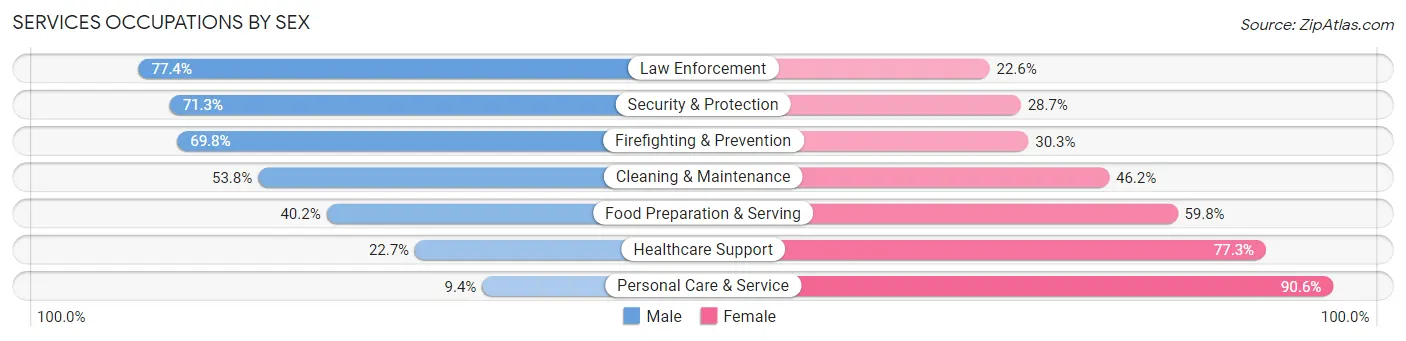
Services Occupations by Sex
Within the Services occupations in Evansville, the most male-oriented occupations are Law Enforcement (77.4%), Security & Protection (71.3%), and Firefighting & Prevention (69.8%), while the most female-oriented occupations are Personal Care & Service (90.6%), Healthcare Support (77.3%), and Food Preparation & Serving (59.8%).
| Occupation | Male | Female |
| Healthcare Support | 581 (22.7%) | 1,979 (77.3%) |
| Security & Protection | 558 (71.3%) | 225 (28.7%) |
| Firefighting & Prevention | 438 (69.8%) | 190 (30.2%) |
| Law Enforcement | 120 (77.4%) | 35 (22.6%) |
| Food Preparation & Serving | 1,669 (40.2%) | 2,481 (59.8%) |
| Cleaning & Maintenance | 1,635 (53.8%) | 1,406 (46.2%) |
| Personal Care & Service | 133 (9.4%) | 1,283 (90.6%) |
| Total (Category) | 4,576 (38.3%) | 7,374 (61.7%) |
| Total (Overall) | 28,817 (50.5%) | 28,278 (49.5%) |
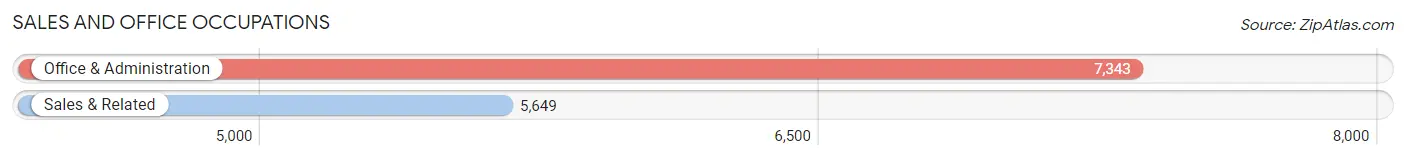
Sales and Office Occupations
The most common Sales and Office occupations in Evansville are Office & Administration (7,343 | 12.9%), and Sales & Related (5,649 | 9.9%).
Sales and Office Occupations by Sex
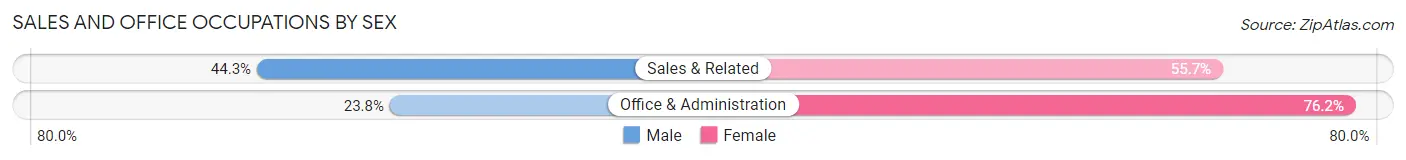
| Occupation | Male | Female |
| Sales & Related | 2,500 (44.3%) | 3,149 (55.7%) |
| Office & Administration | 1,749 (23.8%) | 5,594 (76.2%) |
| Total (Category) | 4,249 (32.7%) | 8,743 (67.3%) |
| Total (Overall) | 28,817 (50.5%) | 28,278 (49.5%) |
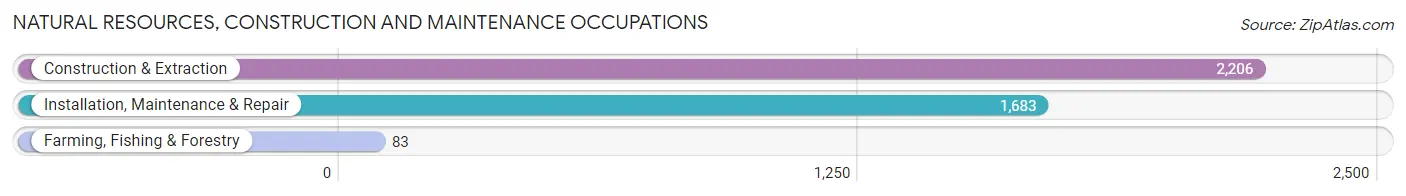
Natural Resources, Construction and Maintenance Occupations
The most common Natural Resources, Construction and Maintenance occupations in Evansville are Construction & Extraction (2,206 | 3.9%), Installation, Maintenance & Repair (1,683 | 2.9%), and Farming, Fishing & Forestry (83 | 0.2%).
Natural Resources, Construction and Maintenance Occupations by Sex
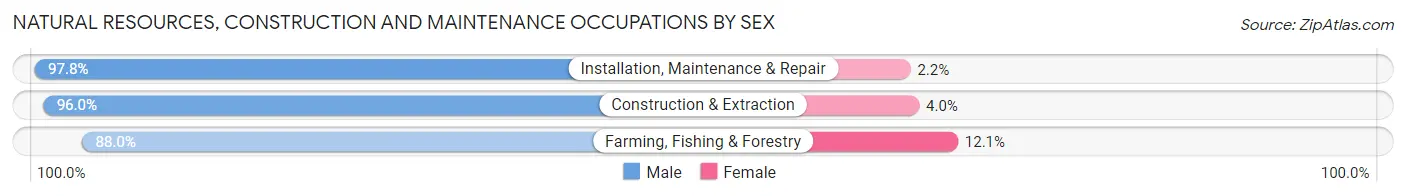
| Occupation | Male | Female |
| Farming, Fishing & Forestry | 73 (87.9%) | 10 (12.0%) |
| Construction & Extraction | 2,118 (96.0%) | 88 (4.0%) |
| Installation, Maintenance & Repair | 1,646 (97.8%) | 37 (2.2%) |
| Total (Category) | 3,837 (96.6%) | 135 (3.4%) |
| Total (Overall) | 28,817 (50.5%) | 28,278 (49.5%) |
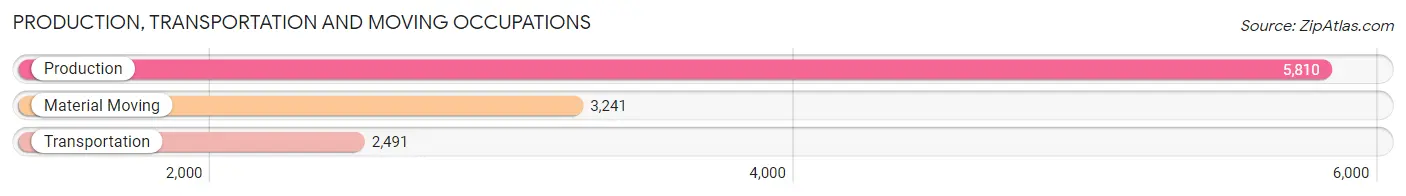
Production, Transportation and Moving Occupations
The most common Production, Transportation and Moving occupations in Evansville are Production (5,810 | 10.2%), Material Moving (3,241 | 5.7%), and Transportation (2,491 | 4.4%).
Production, Transportation and Moving Occupations by Sex
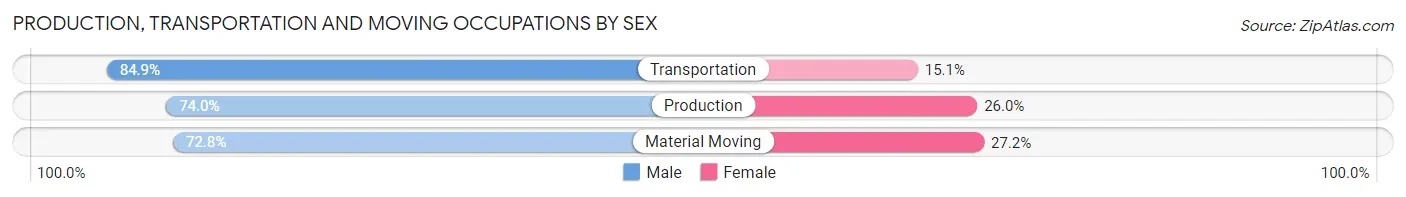
| Occupation | Male | Female |
| Production | 4,300 (74.0%) | 1,510 (26.0%) |
| Transportation | 2,115 (84.9%) | 376 (15.1%) |
| Material Moving | 2,358 (72.8%) | 883 (27.2%) |
| Total (Category) | 8,773 (76.0%) | 2,769 (24.0%) |
| Total (Overall) | 28,817 (50.5%) | 28,278 (49.5%) |
Employment Industries by Sex in Evansville
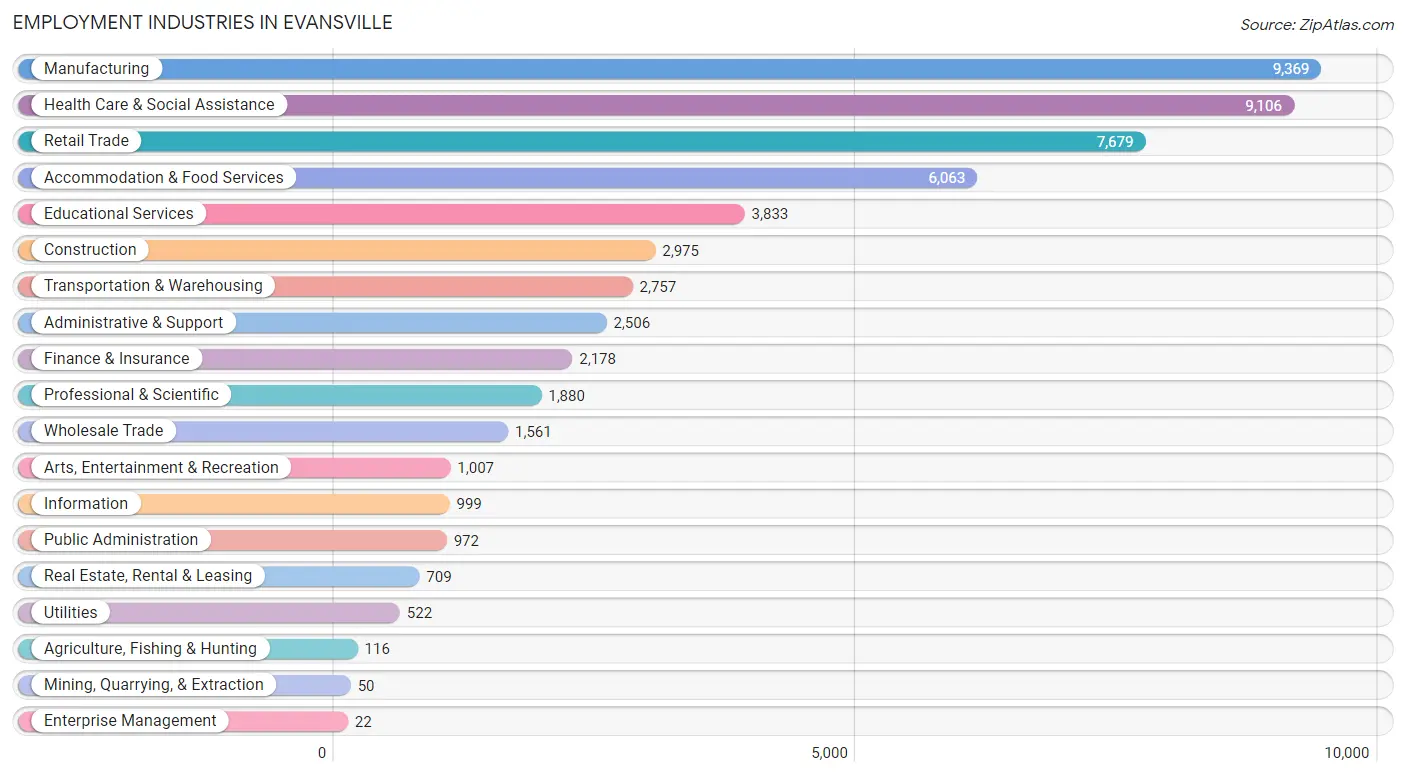
Employment Industries in Evansville
The major employment industries in Evansville include Manufacturing (9,369 | 16.4%), Health Care & Social Assistance (9,106 | 16.0%), Retail Trade (7,679 | 13.5%), Accommodation & Food Services (6,063 | 10.6%), and Educational Services (3,833 | 6.7%).
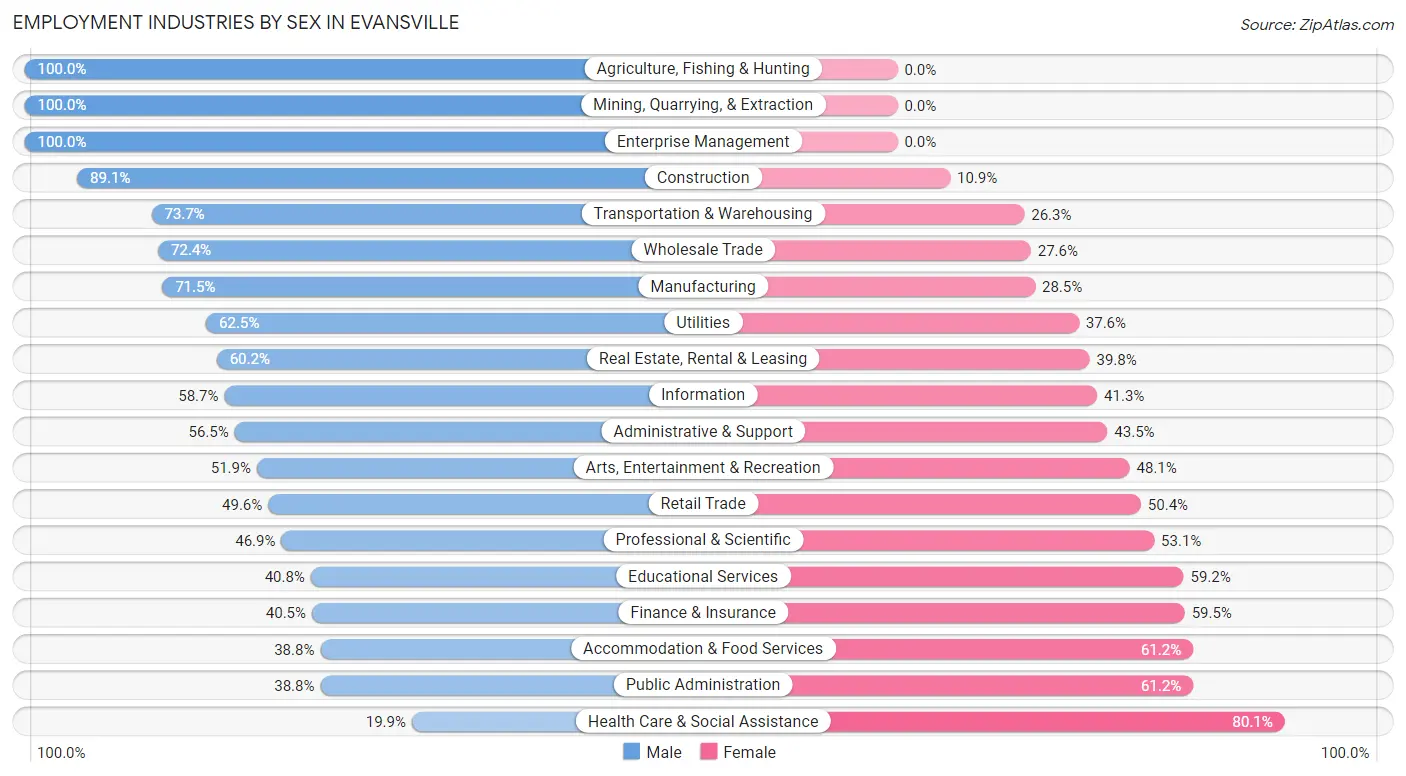
Employment Industries by Sex in Evansville
The Evansville industries that see more men than women are Agriculture, Fishing & Hunting (100.0%), Mining, Quarrying, & Extraction (100.0%), and Enterprise Management (100.0%), whereas the industries that tend to have a higher number of women are Health Care & Social Assistance (80.1%), Public Administration (61.2%), and Accommodation & Food Services (61.2%).
| Industry | Male | Female |
| Agriculture, Fishing & Hunting | 116 (100.0%) | 0 (0.0%) |
| Mining, Quarrying, & Extraction | 50 (100.0%) | 0 (0.0%) |
| Construction | 2,651 (89.1%) | 324 (10.9%) |
| Manufacturing | 6,700 (71.5%) | 2,669 (28.5%) |
| Wholesale Trade | 1,130 (72.4%) | 431 (27.6%) |
| Retail Trade | 3,809 (49.6%) | 3,870 (50.4%) |
| Transportation & Warehousing | 2,033 (73.7%) | 724 (26.3%) |
| Utilities | 326 (62.5%) | 196 (37.6%) |
| Information | 586 (58.7%) | 413 (41.3%) |
| Finance & Insurance | 883 (40.5%) | 1,295 (59.5%) |
| Real Estate, Rental & Leasing | 427 (60.2%) | 282 (39.8%) |
| Professional & Scientific | 881 (46.9%) | 999 (53.1%) |
| Enterprise Management | 22 (100.0%) | 0 (0.0%) |
| Administrative & Support | 1,417 (56.5%) | 1,089 (43.5%) |
| Educational Services | 1,563 (40.8%) | 2,270 (59.2%) |
| Health Care & Social Assistance | 1,808 (19.9%) | 7,298 (80.1%) |
| Arts, Entertainment & Recreation | 523 (51.9%) | 484 (48.1%) |
| Accommodation & Food Services | 2,353 (38.8%) | 3,710 (61.2%) |
| Public Administration | 377 (38.8%) | 595 (61.2%) |
| Total | 28,817 (50.5%) | 28,278 (49.5%) |
Education in Evansville
School Enrollment in Evansville
The most common levels of schooling among the 24,655 students in Evansville are middle school (5,860 | 23.8%), college / undergraduate (5,265 | 21.3%), and elementary school (5,078 | 20.6%).
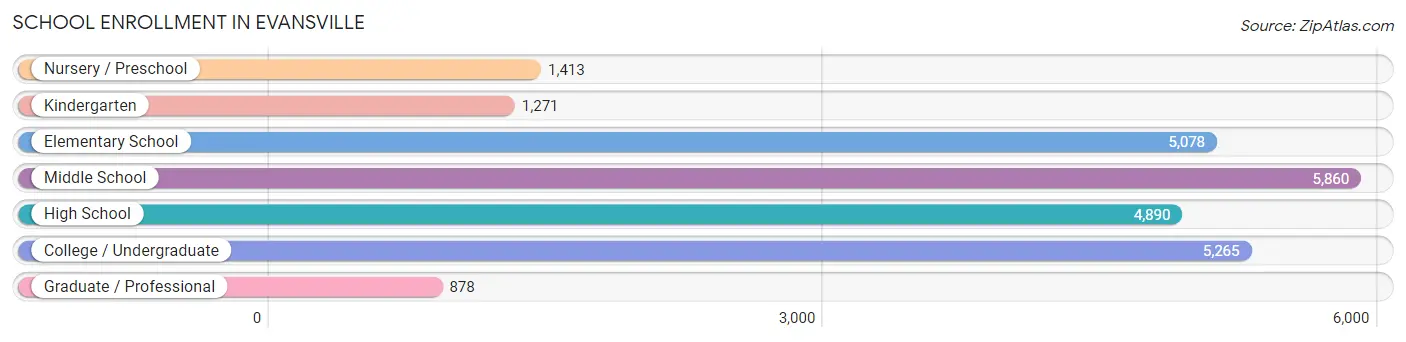
| School Level | # Students | % Students |
| Nursery / Preschool | 1,413 | 5.7% |
| Kindergarten | 1,271 | 5.2% |
| Elementary School | 5,078 | 20.6% |
| Middle School | 5,860 | 23.8% |
| High School | 4,890 | 19.8% |
| College / Undergraduate | 5,265 | 21.3% |
| Graduate / Professional | 878 | 3.6% |
| Total | 24,655 | 100.0% |
School Enrollment by Age by Funding Source in Evansville
Out of a total of 24,655 students who are enrolled in schools in Evansville, 5,079 (20.6%) attend a private institution, while the remaining 19,576 (79.4%) are enrolled in public schools. The age group of 3 to 4 year olds has the highest likelihood of being enrolled in private schools, with 459 (51.7% in the age bracket) enrolled. Conversely, the age group of 15 to 17 year olds has the lowest likelihood of being enrolled in a private school, with 2,938 (85.3% in the age bracket) attending a public institution.
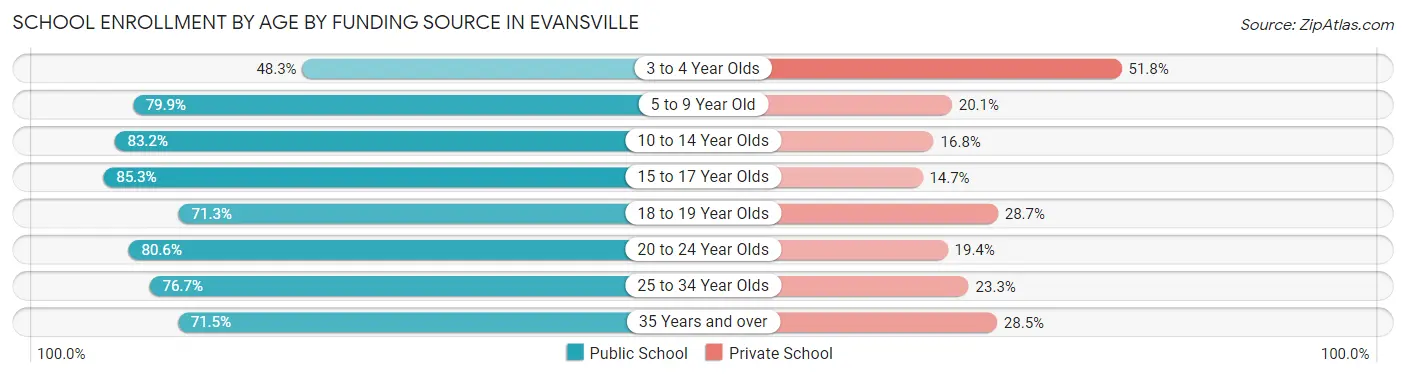
| Age Bracket | Public School | Private School |
| 3 to 4 Year Olds | 428 (48.2%) | 459 (51.7%) |
| 5 to 9 Year Old | 4,942 (79.9%) | 1,246 (20.1%) |
| 10 to 14 Year Olds | 5,938 (83.2%) | 1,196 (16.8%) |
| 15 to 17 Year Olds | 2,938 (85.3%) | 505 (14.7%) |
| 18 to 19 Year Olds | 1,312 (71.3%) | 528 (28.7%) |
| 20 to 24 Year Olds | 2,078 (80.6%) | 499 (19.4%) |
| 25 to 34 Year Olds | 1,226 (76.7%) | 372 (23.3%) |
| 35 Years and over | 706 (71.5%) | 282 (28.5%) |
| Total | 19,576 (79.4%) | 5,079 (20.6%) |
Educational Attainment by Field of Study in Evansville
Business (3,423 | 17.7%), education (2,998 | 15.5%), science & technology (2,388 | 12.3%), liberal arts & history (1,361 | 7.0%), and arts & humanities (1,211 | 6.3%) are the most common fields of study among 19,354 individuals in Evansville who have obtained a bachelor's degree or higher.
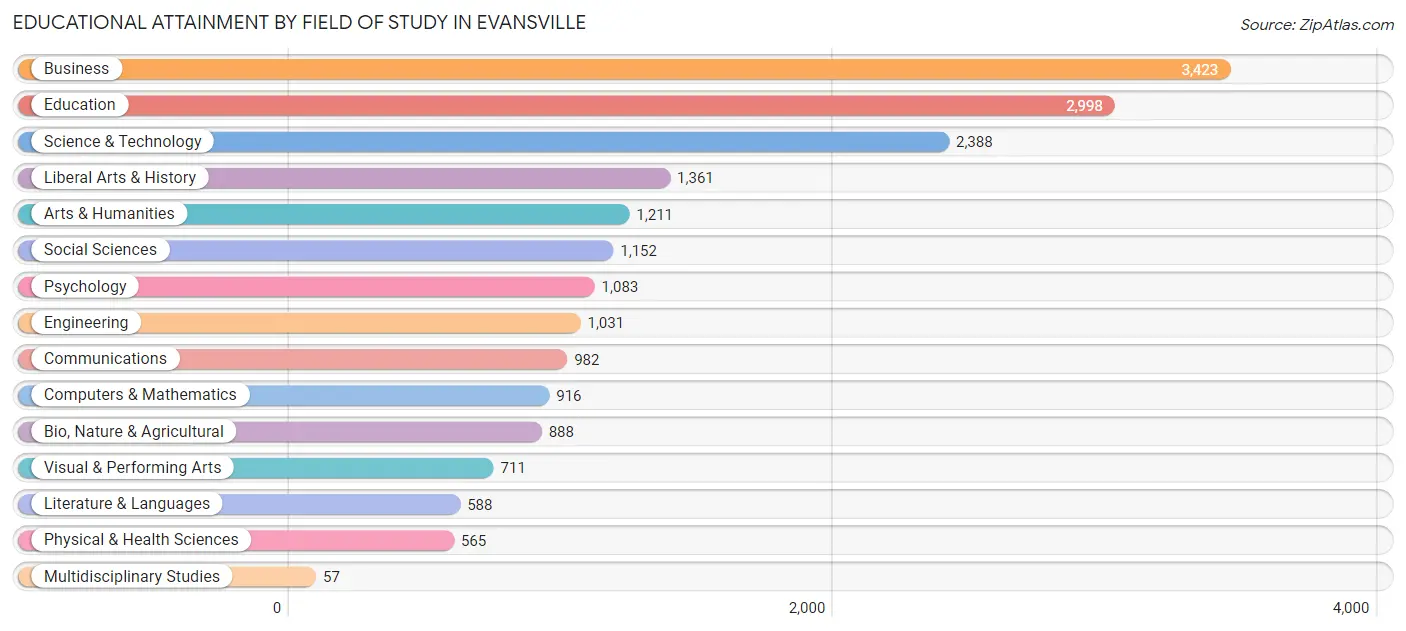
| Field of Study | # Graduates | % Graduates |
| Computers & Mathematics | 916 | 4.7% |
| Bio, Nature & Agricultural | 888 | 4.6% |
| Physical & Health Sciences | 565 | 2.9% |
| Psychology | 1,083 | 5.6% |
| Social Sciences | 1,152 | 5.9% |
| Engineering | 1,031 | 5.3% |
| Multidisciplinary Studies | 57 | 0.3% |
| Science & Technology | 2,388 | 12.3% |
| Business | 3,423 | 17.7% |
| Education | 2,998 | 15.5% |
| Literature & Languages | 588 | 3.0% |
| Liberal Arts & History | 1,361 | 7.0% |
| Visual & Performing Arts | 711 | 3.7% |
| Communications | 982 | 5.1% |
| Arts & Humanities | 1,211 | 6.3% |
| Total | 19,354 | 100.0% |
Transportation & Commute in Evansville
Vehicle Availability by Sex in Evansville
The most prevalent vehicle ownership categories in Evansville are males with 2 vehicles (11,877, accounting for 41.9%) and females with 2 vehicles (10,349, making up 43.4%).
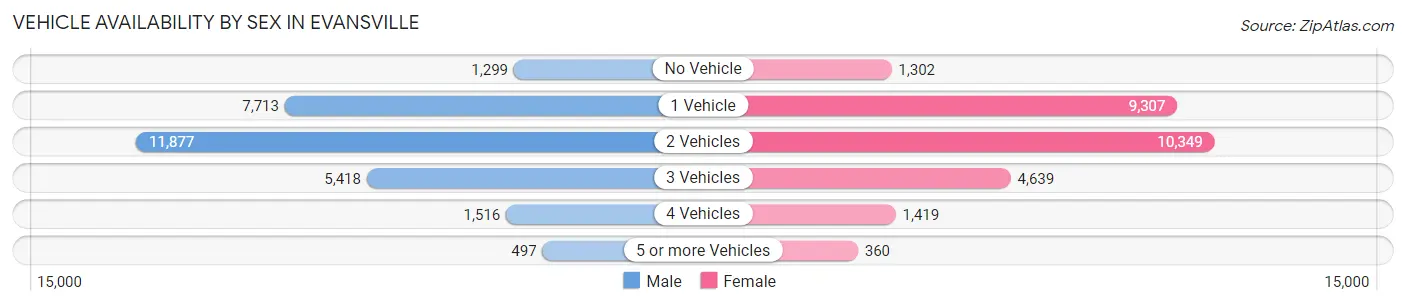
| Vehicles Available | Male | Female |
| No Vehicle | 1,299 (4.6%) | 1,302 (4.8%) |
| 1 Vehicle | 7,713 (27.2%) | 9,307 (34.0%) |
| 2 Vehicles | 11,877 (41.9%) | 10,349 (37.8%) |
| 3 Vehicles | 5,418 (19.1%) | 4,639 (17.0%) |
| 4 Vehicles | 1,516 (5.3%) | 1,419 (5.2%) |
| 5 or more Vehicles | 497 (1.8%) | 360 (1.3%) |
| Total | 28,320 (100.0%) | 27,376 (100.0%) |
Commute Time in Evansville
The most frequently occuring commute durations in Evansville are 10 to 14 minutes (12,949 commuters, 24.0%), 15 to 19 minutes (11,991 commuters, 22.3%), and 5 to 9 minutes (8,510 commuters, 15.8%).
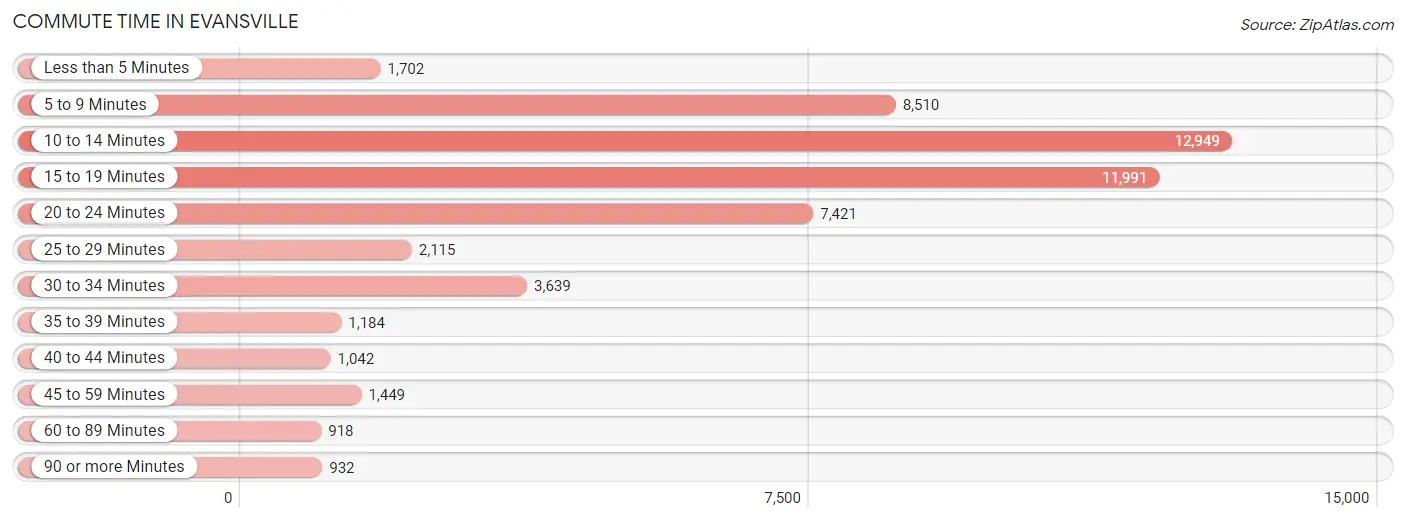
| Commute Time | # Commuters | % Commuters |
| Less than 5 Minutes | 1,702 | 3.2% |
| 5 to 9 Minutes | 8,510 | 15.8% |
| 10 to 14 Minutes | 12,949 | 24.0% |
| 15 to 19 Minutes | 11,991 | 22.3% |
| 20 to 24 Minutes | 7,421 | 13.8% |
| 25 to 29 Minutes | 2,115 | 3.9% |
| 30 to 34 Minutes | 3,639 | 6.8% |
| 35 to 39 Minutes | 1,184 | 2.2% |
| 40 to 44 Minutes | 1,042 | 1.9% |
| 45 to 59 Minutes | 1,449 | 2.7% |
| 60 to 89 Minutes | 918 | 1.7% |
| 90 or more Minutes | 932 | 1.7% |
Commute Time by Sex in Evansville
The most common commute times in Evansville are 10 to 14 minutes (5,743 commuters, 20.7%) for males and 10 to 14 minutes (7,206 commuters, 27.6%) for females.
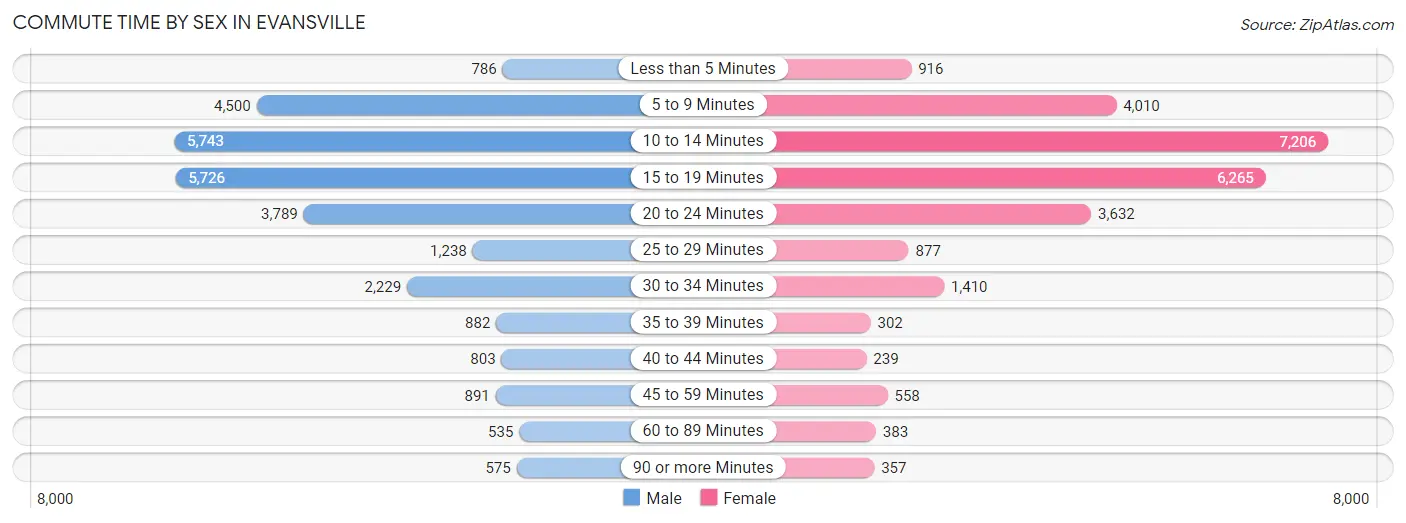
| Commute Time | Male | Female |
| Less than 5 Minutes | 786 (2.8%) | 916 (3.5%) |
| 5 to 9 Minutes | 4,500 (16.3%) | 4,010 (15.3%) |
| 10 to 14 Minutes | 5,743 (20.7%) | 7,206 (27.6%) |
| 15 to 19 Minutes | 5,726 (20.7%) | 6,265 (23.9%) |
| 20 to 24 Minutes | 3,789 (13.7%) | 3,632 (13.9%) |
| 25 to 29 Minutes | 1,238 (4.5%) | 877 (3.4%) |
| 30 to 34 Minutes | 2,229 (8.1%) | 1,410 (5.4%) |
| 35 to 39 Minutes | 882 (3.2%) | 302 (1.1%) |
| 40 to 44 Minutes | 803 (2.9%) | 239 (0.9%) |
| 45 to 59 Minutes | 891 (3.2%) | 558 (2.1%) |
| 60 to 89 Minutes | 535 (1.9%) | 383 (1.5%) |
| 90 or more Minutes | 575 (2.1%) | 357 (1.4%) |
Time of Departure to Work by Sex in Evansville
The most frequent times of departure to work in Evansville are 7:00 AM to 7:29 AM (3,443, 12.4%) for males and 7:00 AM to 7:29 AM (3,640, 13.9%) for females.
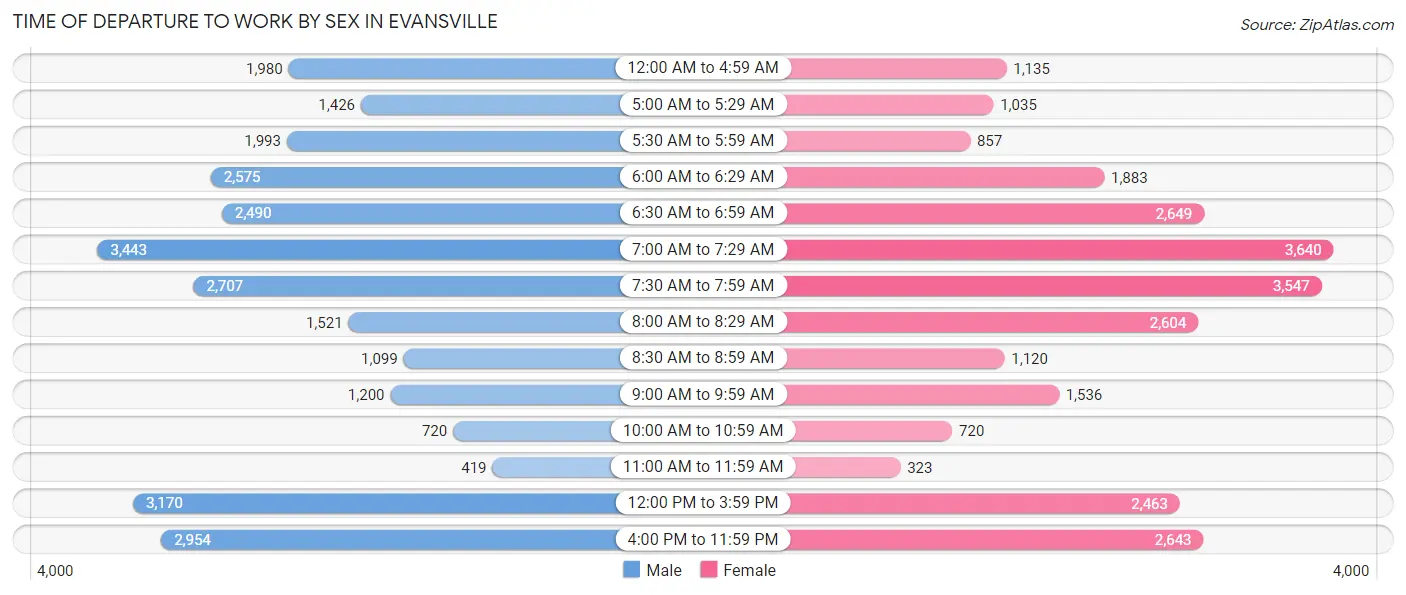
| Time of Departure | Male | Female |
| 12:00 AM to 4:59 AM | 1,980 (7.1%) | 1,135 (4.3%) |
| 5:00 AM to 5:29 AM | 1,426 (5.1%) | 1,035 (4.0%) |
| 5:30 AM to 5:59 AM | 1,993 (7.2%) | 857 (3.3%) |
| 6:00 AM to 6:29 AM | 2,575 (9.3%) | 1,883 (7.2%) |
| 6:30 AM to 6:59 AM | 2,490 (9.0%) | 2,649 (10.1%) |
| 7:00 AM to 7:29 AM | 3,443 (12.4%) | 3,640 (13.9%) |
| 7:30 AM to 7:59 AM | 2,707 (9.8%) | 3,547 (13.6%) |
| 8:00 AM to 8:29 AM | 1,521 (5.5%) | 2,604 (10.0%) |
| 8:30 AM to 8:59 AM | 1,099 (4.0%) | 1,120 (4.3%) |
| 9:00 AM to 9:59 AM | 1,200 (4.3%) | 1,536 (5.9%) |
| 10:00 AM to 10:59 AM | 720 (2.6%) | 720 (2.8%) |
| 11:00 AM to 11:59 AM | 419 (1.5%) | 323 (1.2%) |
| 12:00 PM to 3:59 PM | 3,170 (11.5%) | 2,463 (9.4%) |
| 4:00 PM to 11:59 PM | 2,954 (10.7%) | 2,643 (10.1%) |
| Total | 27,697 (100.0%) | 26,155 (100.0%) |
Housing Occupancy in Evansville
Occupancy by Ownership in Evansville
Of the total 52,070 dwellings in Evansville, owner-occupied units account for 28,241 (54.2%), while renter-occupied units make up 23,829 (45.8%).
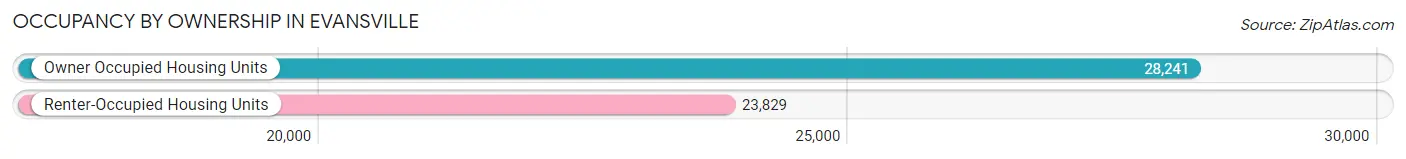
| Occupancy | # Housing Units | % Housing Units |
| Owner Occupied Housing Units | 28,241 | 54.2% |
| Renter-Occupied Housing Units | 23,829 | 45.8% |
| Total Occupied Housing Units | 52,070 | 100.0% |
Occupancy by Household Size in Evansville
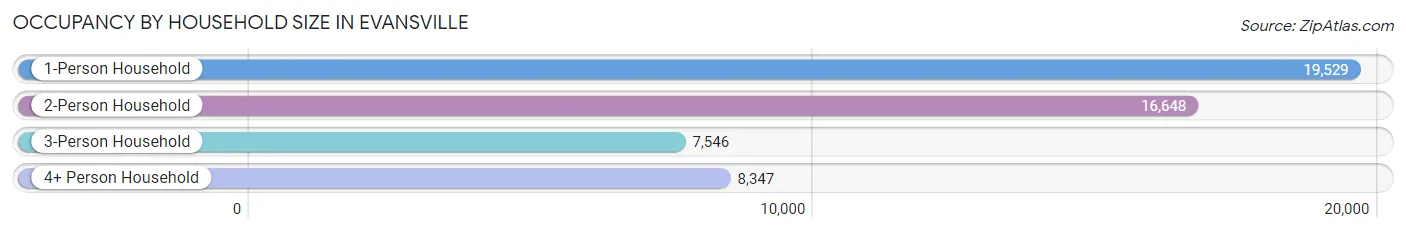
| Household Size | # Housing Units | % Housing Units |
| 1-Person Household | 19,529 | 37.5% |
| 2-Person Household | 16,648 | 32.0% |
| 3-Person Household | 7,546 | 14.5% |
| 4+ Person Household | 8,347 | 16.0% |
| Total Housing Units | 52,070 | 100.0% |
Occupancy by Ownership by Household Size in Evansville
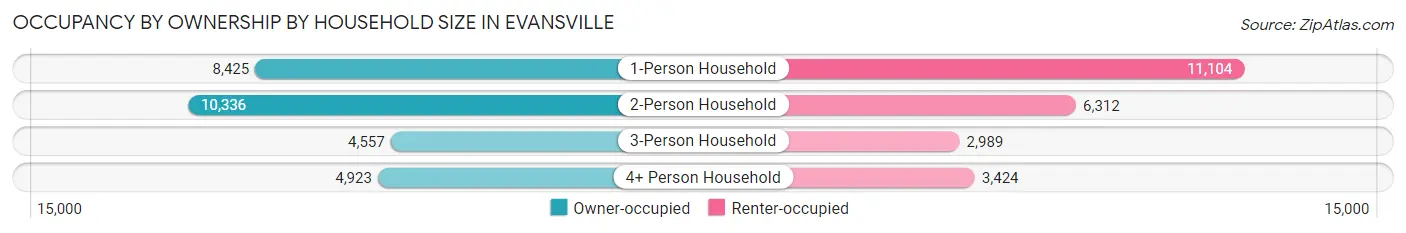
| Household Size | Owner-occupied | Renter-occupied |
| 1-Person Household | 8,425 (43.1%) | 11,104 (56.9%) |
| 2-Person Household | 10,336 (62.1%) | 6,312 (37.9%) |
| 3-Person Household | 4,557 (60.4%) | 2,989 (39.6%) |
| 4+ Person Household | 4,923 (59.0%) | 3,424 (41.0%) |
| Total Housing Units | 28,241 (54.2%) | 23,829 (45.8%) |
Occupancy by Educational Attainment in Evansville
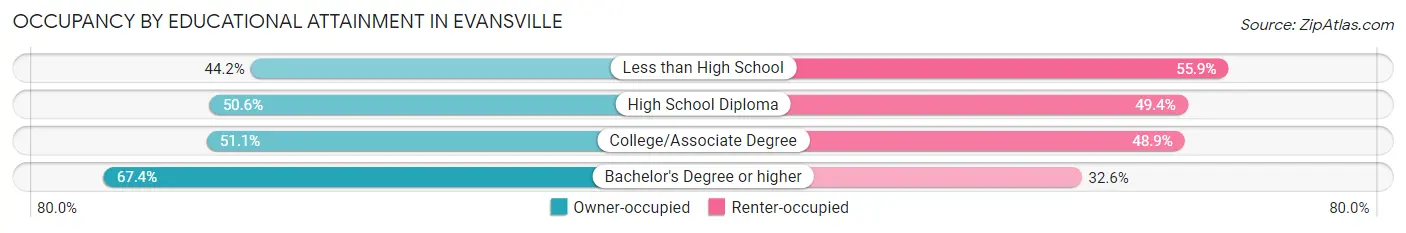
| Household Size | Owner-occupied | Renter-occupied |
| Less than High School | 2,178 (44.2%) | 2,755 (55.8%) |
| High School Diploma | 8,415 (50.6%) | 8,204 (49.4%) |
| College/Associate Degree | 9,151 (51.1%) | 8,764 (48.9%) |
| Bachelor's Degree or higher | 8,497 (67.4%) | 4,106 (32.6%) |
Occupancy by Age of Householder in Evansville
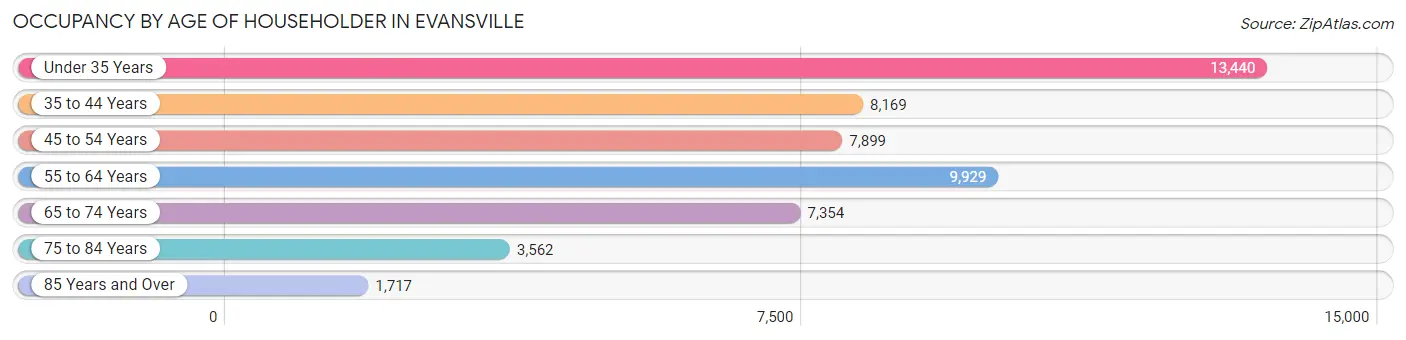
| Age Bracket | # Households | % Households |
| Under 35 Years | 13,440 | 25.8% |
| 35 to 44 Years | 8,169 | 15.7% |
| 45 to 54 Years | 7,899 | 15.2% |
| 55 to 64 Years | 9,929 | 19.1% |
| 65 to 74 Years | 7,354 | 14.1% |
| 75 to 84 Years | 3,562 | 6.8% |
| 85 Years and Over | 1,717 | 3.3% |
| Total | 52,070 | 100.0% |
Housing Finances in Evansville
Median Income by Occupancy in Evansville
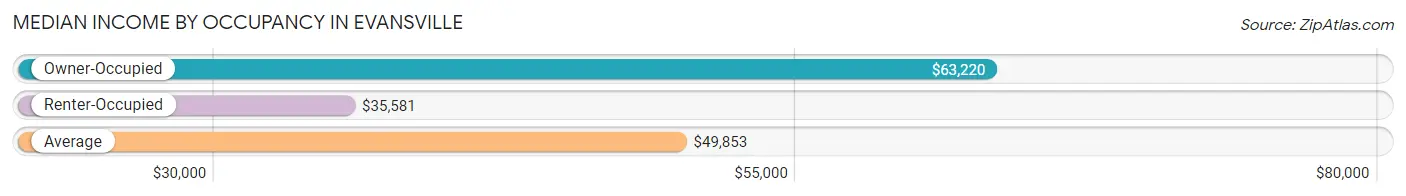
| Occupancy Type | # Households | Median Income |
| Owner-Occupied | 28,241 (54.2%) | $63,220 |
| Renter-Occupied | 23,829 (45.8%) | $35,581 |
| Average | 52,070 (100.0%) | $49,853 |
Occupancy by Householder Income Bracket in Evansville
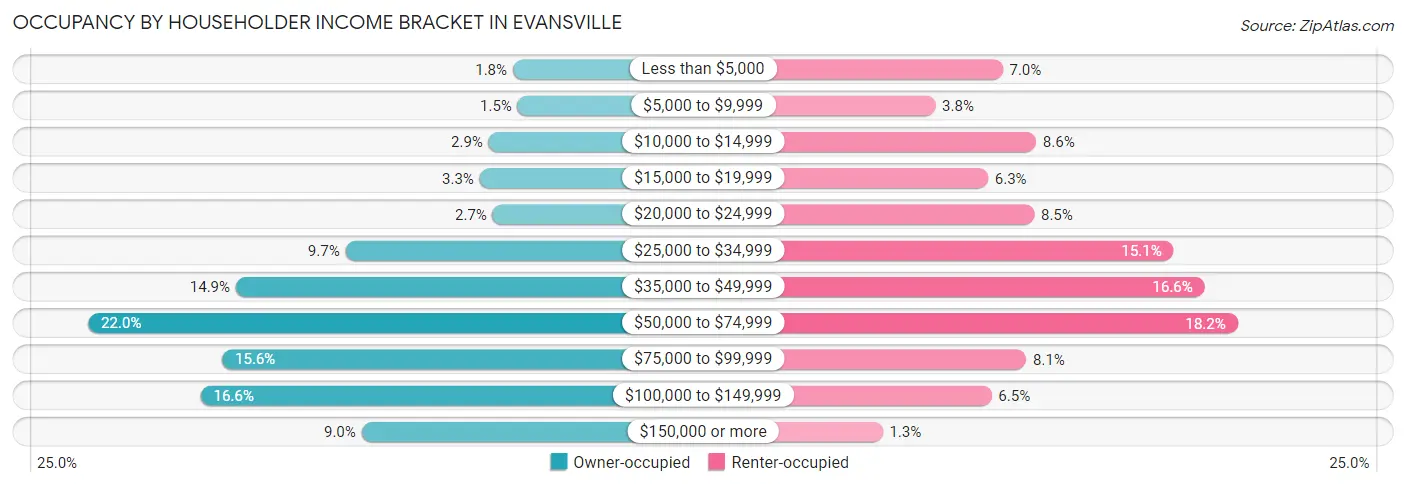
| Income Bracket | Owner-occupied | Renter-occupied |
| Less than $5,000 | 493 (1.8%) | 1,668 (7.0%) |
| $5,000 to $9,999 | 428 (1.5%) | 903 (3.8%) |
| $10,000 to $14,999 | 818 (2.9%) | 2,048 (8.6%) |
| $15,000 to $19,999 | 941 (3.3%) | 1,501 (6.3%) |
| $20,000 to $24,999 | 765 (2.7%) | 2,025 (8.5%) |
| $25,000 to $34,999 | 2,745 (9.7%) | 3,608 (15.1%) |
| $35,000 to $49,999 | 4,219 (14.9%) | 3,961 (16.6%) |
| $50,000 to $74,999 | 6,206 (22.0%) | 4,335 (18.2%) |
| $75,000 to $99,999 | 4,405 (15.6%) | 1,934 (8.1%) |
| $100,000 to $149,999 | 4,693 (16.6%) | 1,542 (6.5%) |
| $150,000 or more | 2,528 (8.9%) | 304 (1.3%) |
| Total | 28,241 (100.0%) | 23,829 (100.0%) |
Monthly Housing Cost Tiers in Evansville
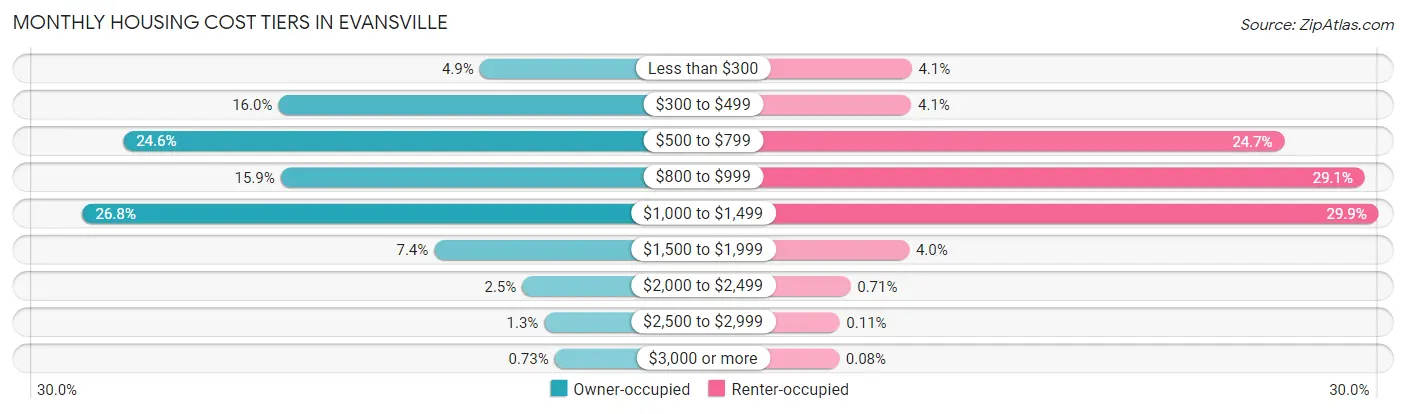
| Monthly Cost | Owner-occupied | Renter-occupied |
| Less than $300 | 1,376 (4.9%) | 975 (4.1%) |
| $300 to $499 | 4,515 (16.0%) | 971 (4.1%) |
| $500 to $799 | 6,933 (24.5%) | 5,884 (24.7%) |
| $800 to $999 | 4,479 (15.9%) | 6,941 (29.1%) |
| $1,000 to $1,499 | 7,570 (26.8%) | 7,122 (29.9%) |
| $1,500 to $1,999 | 2,084 (7.4%) | 941 (4.0%) |
| $2,000 to $2,499 | 711 (2.5%) | 170 (0.7%) |
| $2,500 to $2,999 | 368 (1.3%) | 26 (0.1%) |
| $3,000 or more | 205 (0.7%) | 19 (0.1%) |
| Total | 28,241 (100.0%) | 23,829 (100.0%) |
Physical Housing Characteristics in Evansville
Housing Structures in Evansville
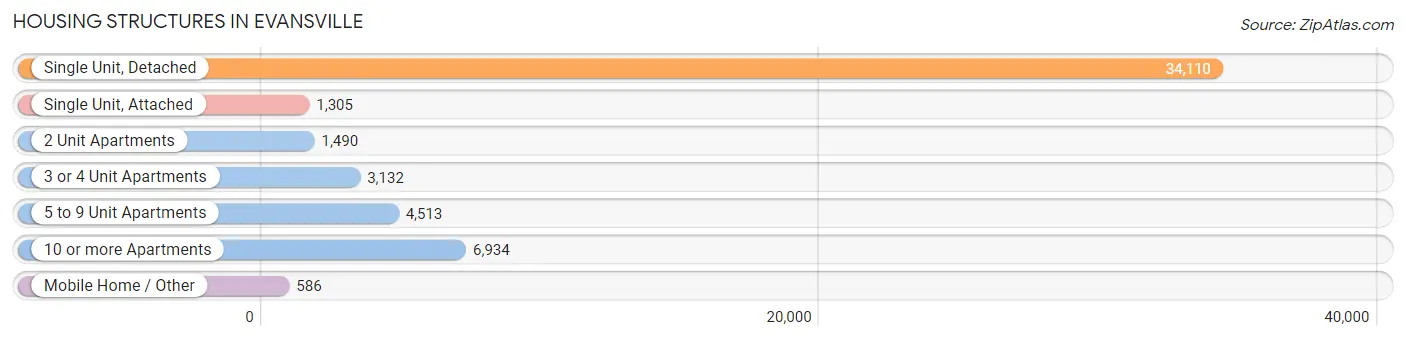
| Structure Type | # Housing Units | % Housing Units |
| Single Unit, Detached | 34,110 | 65.5% |
| Single Unit, Attached | 1,305 | 2.5% |
| 2 Unit Apartments | 1,490 | 2.9% |
| 3 or 4 Unit Apartments | 3,132 | 6.0% |
| 5 to 9 Unit Apartments | 4,513 | 8.7% |
| 10 or more Apartments | 6,934 | 13.3% |
| Mobile Home / Other | 586 | 1.1% |
| Total | 52,070 | 100.0% |
Housing Structures by Occupancy in Evansville
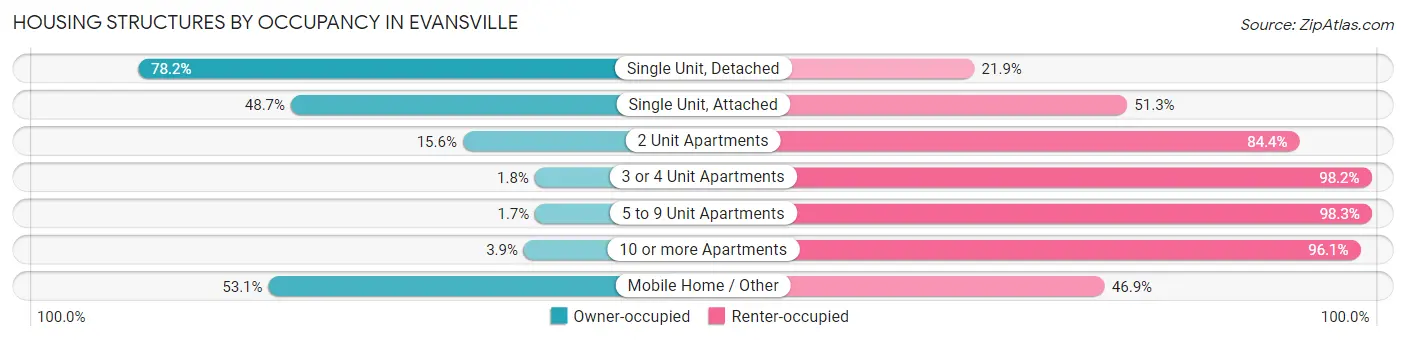
| Structure Type | Owner-occupied | Renter-occupied |
| Single Unit, Detached | 26,658 (78.1%) | 7,452 (21.8%) |
| Single Unit, Attached | 636 (48.7%) | 669 (51.3%) |
| 2 Unit Apartments | 233 (15.6%) | 1,257 (84.4%) |
| 3 or 4 Unit Apartments | 56 (1.8%) | 3,076 (98.2%) |
| 5 to 9 Unit Apartments | 77 (1.7%) | 4,436 (98.3%) |
| 10 or more Apartments | 270 (3.9%) | 6,664 (96.1%) |
| Mobile Home / Other | 311 (53.1%) | 275 (46.9%) |
| Total | 28,241 (54.2%) | 23,829 (45.8%) |
Housing Structures by Number of Rooms in Evansville
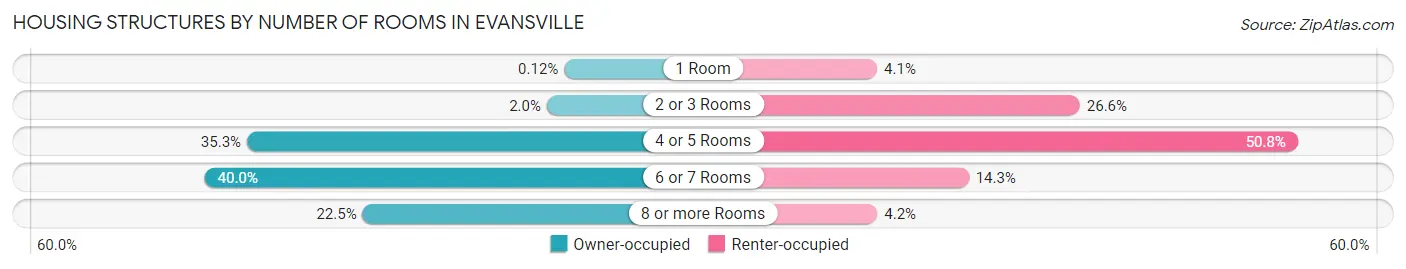
| Number of Rooms | Owner-occupied | Renter-occupied |
| 1 Room | 33 (0.1%) | 984 (4.1%) |
| 2 or 3 Rooms | 576 (2.0%) | 6,345 (26.6%) |
| 4 or 5 Rooms | 9,978 (35.3%) | 12,104 (50.8%) |
| 6 or 7 Rooms | 11,301 (40.0%) | 3,406 (14.3%) |
| 8 or more Rooms | 6,353 (22.5%) | 990 (4.2%) |
| Total | 28,241 (100.0%) | 23,829 (100.0%) |
Housing Structure by Heating Type in Evansville
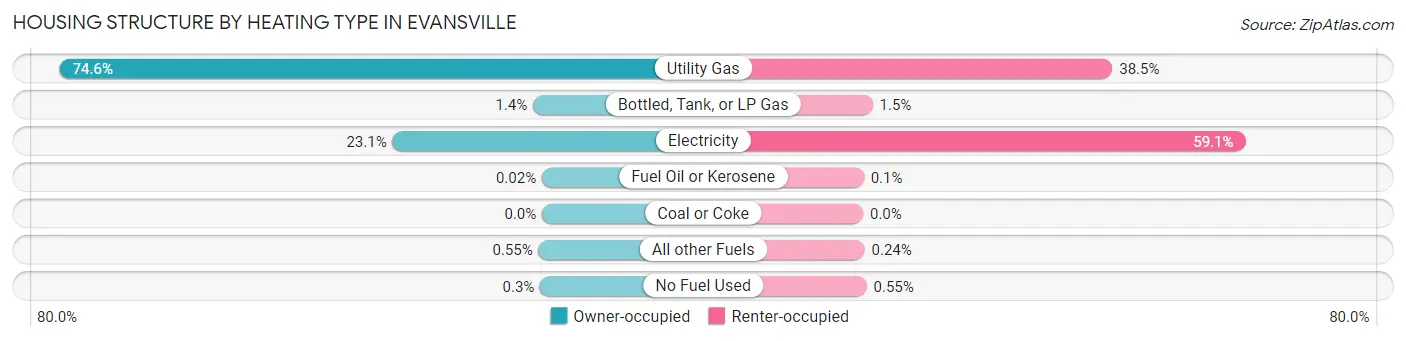
| Heating Type | Owner-occupied | Renter-occupied |
| Utility Gas | 21,067 (74.6%) | 9,182 (38.5%) |
| Bottled, Tank, or LP Gas | 392 (1.4%) | 352 (1.5%) |
| Electricity | 6,533 (23.1%) | 14,083 (59.1%) |
| Fuel Oil or Kerosene | 7 (0.0%) | 24 (0.1%) |
| Coal or Coke | 0 (0.0%) | 0 (0.0%) |
| All other Fuels | 156 (0.5%) | 56 (0.2%) |
| No Fuel Used | 86 (0.3%) | 132 (0.5%) |
| Total | 28,241 (100.0%) | 23,829 (100.0%) |
Household Vehicle Usage in Evansville
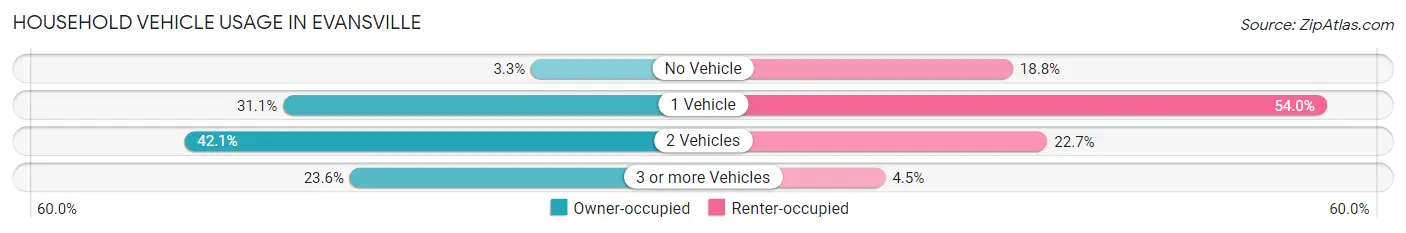
| Vehicles per Household | Owner-occupied | Renter-occupied |
| No Vehicle | 923 (3.3%) | 4,484 (18.8%) |
| 1 Vehicle | 8,769 (31.0%) | 12,859 (54.0%) |
| 2 Vehicles | 11,889 (42.1%) | 5,405 (22.7%) |
| 3 or more Vehicles | 6,660 (23.6%) | 1,081 (4.5%) |
| Total | 28,241 (100.0%) | 23,829 (100.0%) |
Real Estate & Mortgages in Evansville
Real Estate and Mortgage Overview in Evansville
| Characteristic | Without Mortgage | With Mortgage |
| Housing Units | 10,495 | 17,746 |
| Median Property Value | $110,600 | $126,700 |
| Median Household Income | $52,163 | $1,793 |
| Monthly Housing Costs | $487 | $185 |
| Real Estate Taxes | $988 | $1,005 |
Property Value by Mortgage Status in Evansville
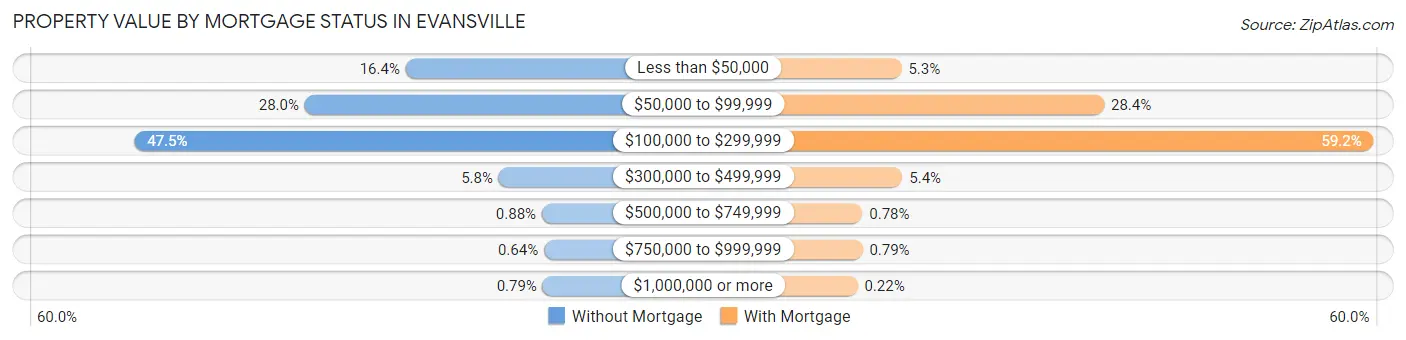
| Property Value | Without Mortgage | With Mortgage |
| Less than $50,000 | 1,725 (16.4%) | 932 (5.2%) |
| $50,000 to $99,999 | 2,936 (28.0%) | 5,040 (28.4%) |
| $100,000 to $299,999 | 4,982 (47.5%) | 10,506 (59.2%) |
| $300,000 to $499,999 | 610 (5.8%) | 950 (5.3%) |
| $500,000 to $749,999 | 92 (0.9%) | 139 (0.8%) |
| $750,000 to $999,999 | 67 (0.6%) | 140 (0.8%) |
| $1,000,000 or more | 83 (0.8%) | 39 (0.2%) |
| Total | 10,495 (100.0%) | 17,746 (100.0%) |
Household Income by Mortgage Status in Evansville
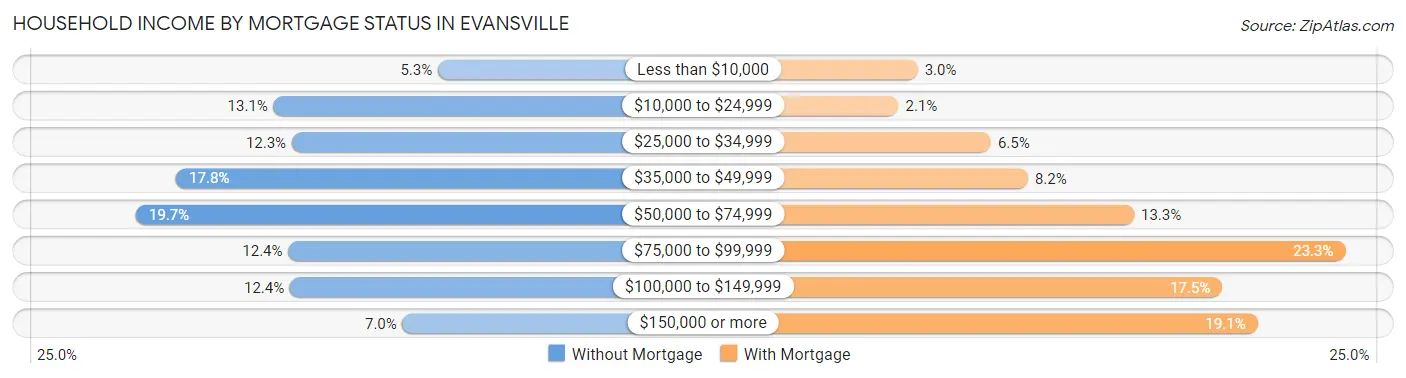
| Household Income | Without Mortgage | With Mortgage |
| Less than $10,000 | 557 (5.3%) | 525 (3.0%) |
| $10,000 to $24,999 | 1,379 (13.1%) | 364 (2.1%) |
| $25,000 to $34,999 | 1,288 (12.3%) | 1,145 (6.5%) |
| $35,000 to $49,999 | 1,866 (17.8%) | 1,457 (8.2%) |
| $50,000 to $74,999 | 2,067 (19.7%) | 2,353 (13.3%) |
| $75,000 to $99,999 | 1,306 (12.4%) | 4,139 (23.3%) |
| $100,000 to $149,999 | 1,297 (12.4%) | 3,099 (17.5%) |
| $150,000 or more | 735 (7.0%) | 3,396 (19.1%) |
| Total | 10,495 (100.0%) | 17,746 (100.0%) |
Property Value to Household Income Ratio in Evansville
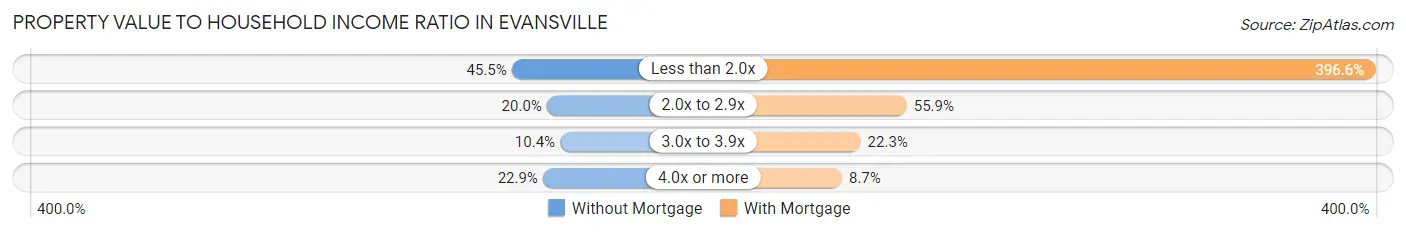
| Value-to-Income Ratio | Without Mortgage | With Mortgage |
| Less than 2.0x | 4,778 (45.5%) | 70,387 (396.6%) |
| 2.0x to 2.9x | 2,100 (20.0%) | 9,913 (55.9%) |
| 3.0x to 3.9x | 1,093 (10.4%) | 3,965 (22.3%) |
| 4.0x or more | 2,403 (22.9%) | 1,549 (8.7%) |
| Total | 10,495 (100.0%) | 17,746 (100.0%) |
Real Estate Taxes by Mortgage Status in Evansville
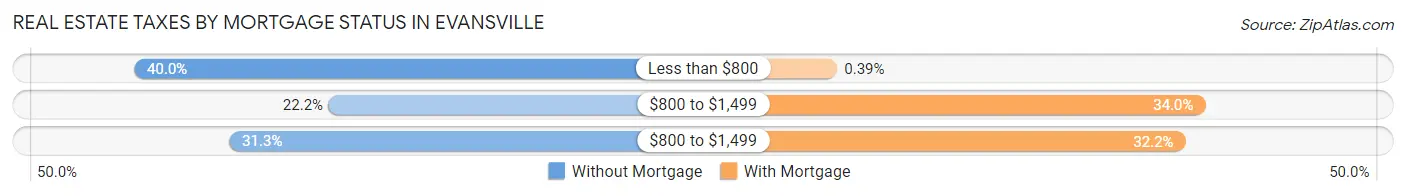
| Property Taxes | Without Mortgage | With Mortgage |
| Less than $800 | 4,199 (40.0%) | 69 (0.4%) |
| $800 to $1,499 | 2,331 (22.2%) | 6,033 (34.0%) |
| $800 to $1,499 | 3,288 (31.3%) | 5,711 (32.2%) |
| Total | 10,495 (100.0%) | 17,746 (100.0%) |
Health & Disability in Evansville
Health Insurance Coverage by Age in Evansville
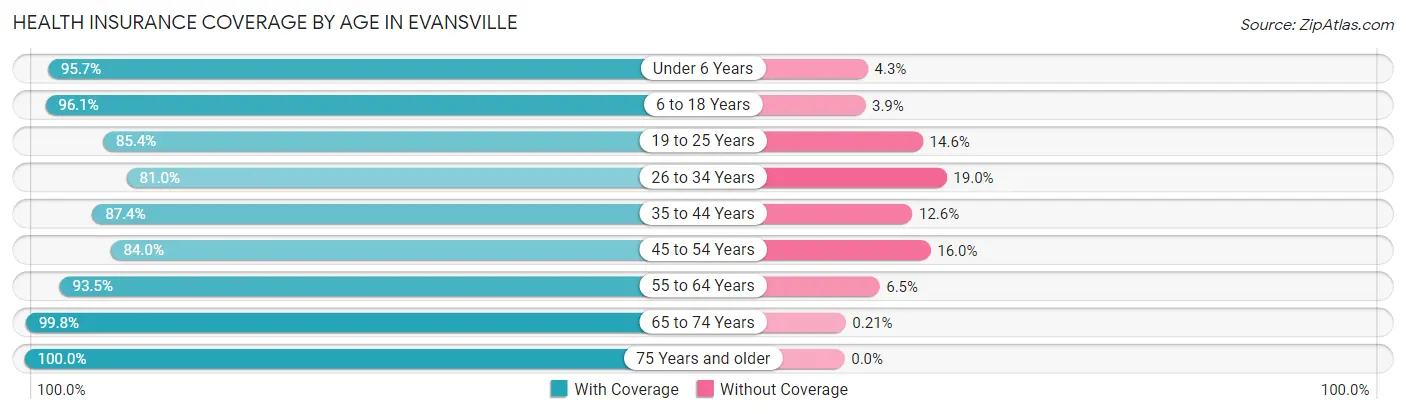
| Age Bracket | With Coverage | Without Coverage |
| Under 6 Years | 8,030 (95.7%) | 364 (4.3%) |
| 6 to 18 Years | 16,761 (96.1%) | 674 (3.9%) |
| 19 to 25 Years | 10,384 (85.4%) | 1,776 (14.6%) |
| 26 to 34 Years | 12,579 (81.0%) | 2,959 (19.0%) |
| 35 to 44 Years | 12,372 (87.4%) | 1,790 (12.6%) |
| 45 to 54 Years | 11,185 (84.0%) | 2,135 (16.0%) |
| 55 to 64 Years | 14,488 (93.5%) | 1,010 (6.5%) |
| 65 to 74 Years | 10,907 (99.8%) | 23 (0.2%) |
| 75 Years and older | 7,246 (100.0%) | 0 (0.0%) |
| Total | 103,952 (90.6%) | 10,731 (9.4%) |
Health Insurance Coverage by Citizenship Status in Evansville
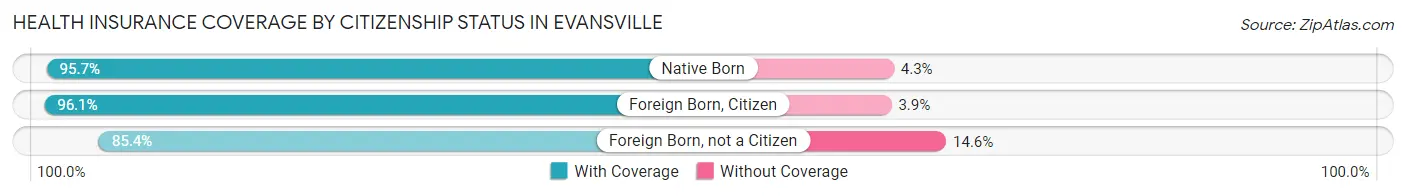
| Citizenship Status | With Coverage | Without Coverage |
| Native Born | 8,030 (95.7%) | 364 (4.3%) |
| Foreign Born, Citizen | 16,761 (96.1%) | 674 (3.9%) |
| Foreign Born, not a Citizen | 10,384 (85.4%) | 1,776 (14.6%) |
Health Insurance Coverage by Household Income in Evansville
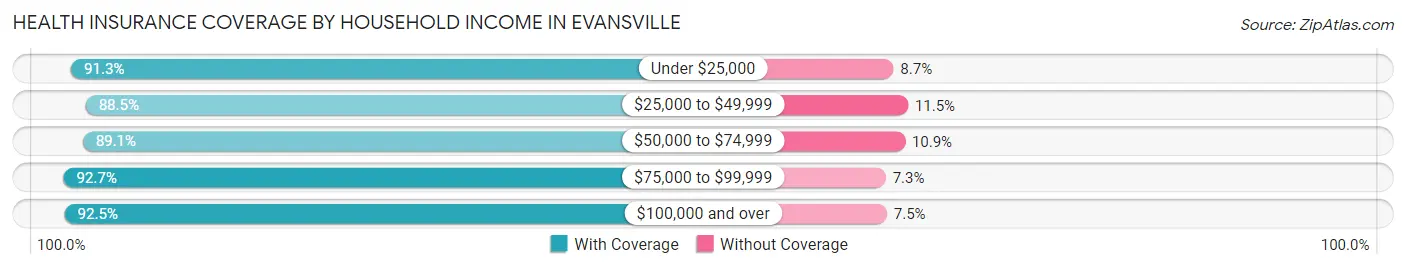
| Household Income | With Coverage | Without Coverage |
| Under $25,000 | 17,888 (91.3%) | 1,712 (8.7%) |
| $25,000 to $49,999 | 24,598 (88.5%) | 3,184 (11.5%) |
| $50,000 to $74,999 | 21,322 (89.1%) | 2,605 (10.9%) |
| $75,000 to $99,999 | 14,789 (92.7%) | 1,163 (7.3%) |
| $100,000 and over | 23,738 (92.5%) | 1,927 (7.5%) |
Public vs Private Health Insurance Coverage by Age in Evansville
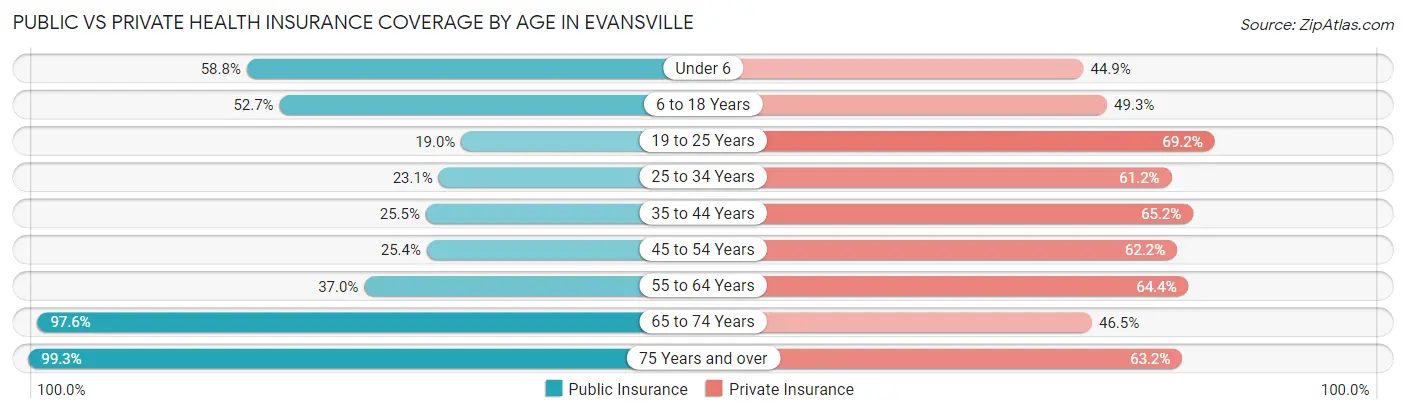
| Age Bracket | Public Insurance | Private Insurance |
| Under 6 | 4,933 (58.8%) | 3,766 (44.9%) |
| 6 to 18 Years | 9,188 (52.7%) | 8,588 (49.3%) |
| 19 to 25 Years | 2,306 (19.0%) | 8,413 (69.2%) |
| 25 to 34 Years | 3,596 (23.1%) | 9,505 (61.2%) |
| 35 to 44 Years | 3,615 (25.5%) | 9,236 (65.2%) |
| 45 to 54 Years | 3,376 (25.4%) | 8,289 (62.2%) |
| 55 to 64 Years | 5,729 (37.0%) | 9,973 (64.3%) |
| 65 to 74 Years | 10,669 (97.6%) | 5,077 (46.5%) |
| 75 Years and over | 7,195 (99.3%) | 4,579 (63.2%) |
| Total | 50,607 (44.1%) | 67,426 (58.8%) |
Disability Status by Sex by Age in Evansville
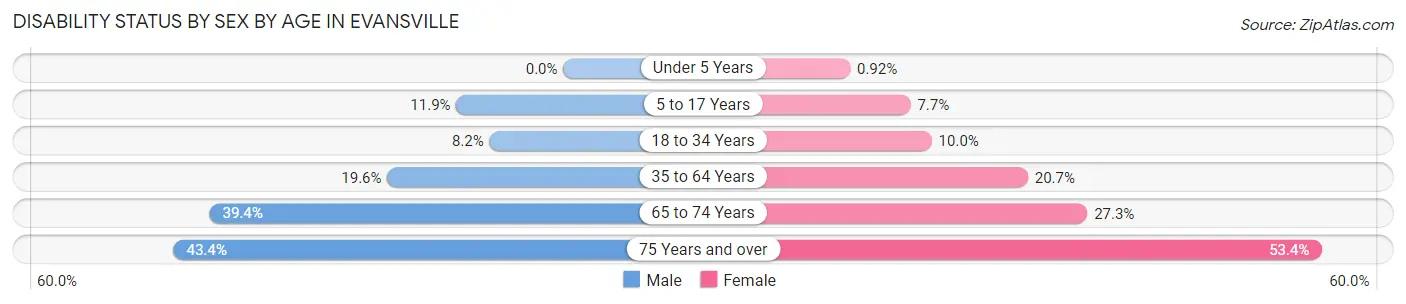
| Age Bracket | Male | Female |
| Under 5 Years | 0 (0.0%) | 32 (0.9%) |
| 5 to 17 Years | 1,085 (11.9%) | 632 (7.6%) |
| 18 to 34 Years | 1,180 (8.2%) | 1,453 (10.0%) |
| 35 to 64 Years | 4,145 (19.6%) | 4,521 (20.7%) |
| 65 to 74 Years | 2,052 (39.4%) | 1,564 (27.3%) |
| 75 Years and over | 1,090 (43.4%) | 2,528 (53.4%) |
Disability Class by Sex by Age in Evansville
Disability Class: Hearing Difficulty
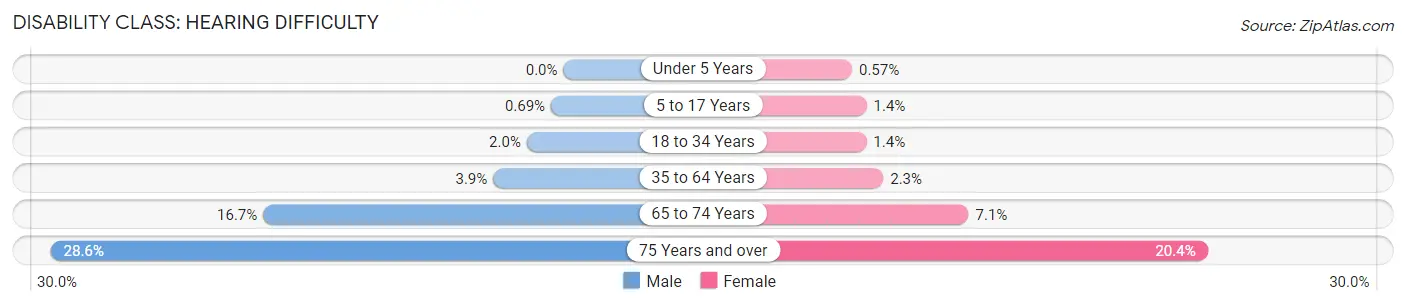
| Age Bracket | Male | Female |
| Under 5 Years | 0 (0.0%) | 20 (0.6%) |
| 5 to 17 Years | 63 (0.7%) | 114 (1.4%) |
| 18 to 34 Years | 293 (2.0%) | 199 (1.4%) |
| 35 to 64 Years | 827 (3.9%) | 505 (2.3%) |
| 65 to 74 Years | 871 (16.7%) | 404 (7.1%) |
| 75 Years and over | 717 (28.5%) | 964 (20.4%) |
Disability Class: Vision Difficulty
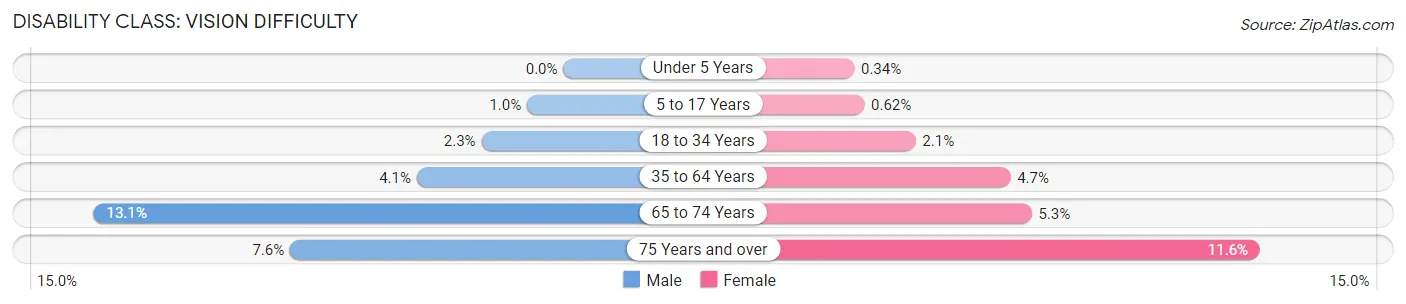
| Age Bracket | Male | Female |
| Under 5 Years | 0 (0.0%) | 12 (0.3%) |
| 5 to 17 Years | 92 (1.0%) | 51 (0.6%) |
| 18 to 34 Years | 328 (2.3%) | 297 (2.1%) |
| 35 to 64 Years | 862 (4.1%) | 1,024 (4.7%) |
| 65 to 74 Years | 681 (13.1%) | 302 (5.3%) |
| 75 Years and over | 191 (7.6%) | 551 (11.6%) |
Disability Class: Cognitive Difficulty
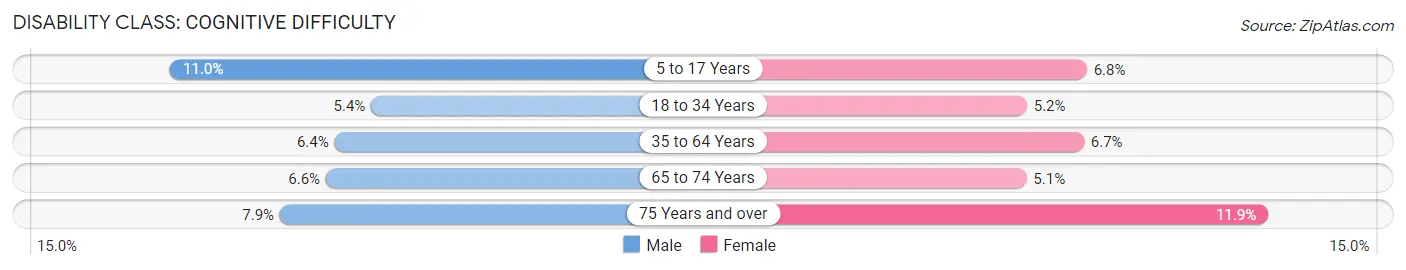
| Age Bracket | Male | Female |
| 5 to 17 Years | 998 (11.0%) | 564 (6.8%) |
| 18 to 34 Years | 768 (5.3%) | 748 (5.1%) |
| 35 to 64 Years | 1,347 (6.4%) | 1,471 (6.7%) |
| 65 to 74 Years | 344 (6.6%) | 294 (5.1%) |
| 75 Years and over | 198 (7.9%) | 562 (11.9%) |
Disability Class: Ambulatory Difficulty
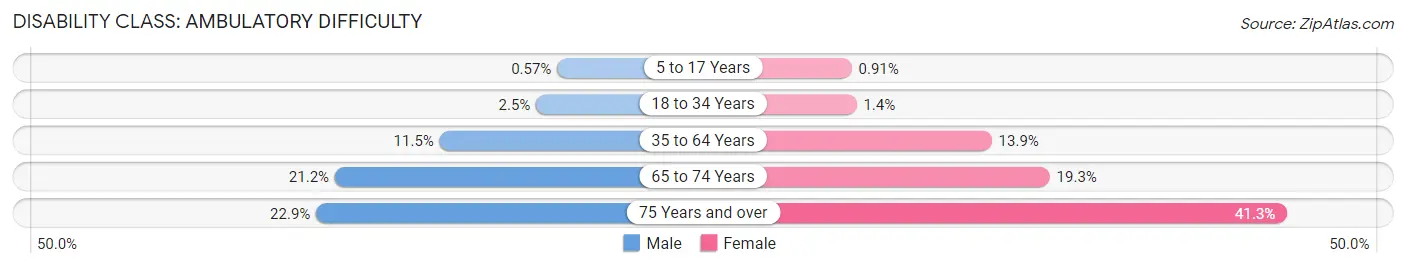
| Age Bracket | Male | Female |
| 5 to 17 Years | 52 (0.6%) | 75 (0.9%) |
| 18 to 34 Years | 362 (2.5%) | 197 (1.4%) |
| 35 to 64 Years | 2,427 (11.5%) | 3,036 (13.9%) |
| 65 to 74 Years | 1,104 (21.2%) | 1,104 (19.3%) |
| 75 Years and over | 576 (22.9%) | 1,957 (41.3%) |
Disability Class: Self-Care Difficulty
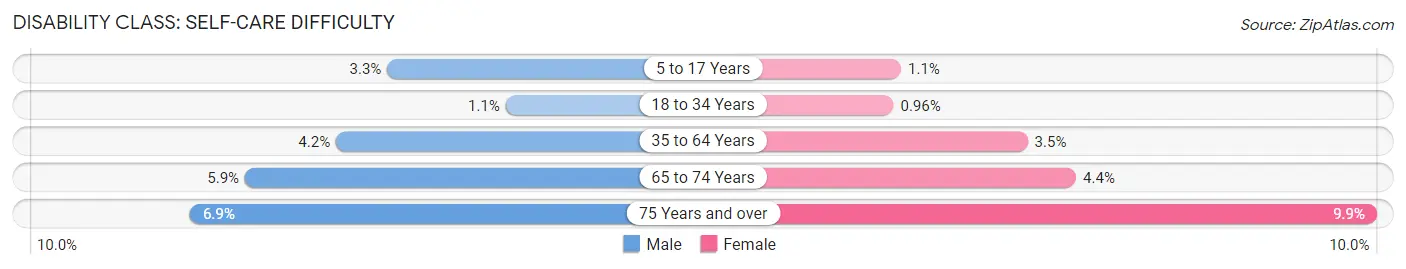
| Age Bracket | Male | Female |
| 5 to 17 Years | 298 (3.3%) | 91 (1.1%) |
| 18 to 34 Years | 153 (1.1%) | 139 (1.0%) |
| 35 to 64 Years | 893 (4.2%) | 753 (3.5%) |
| 65 to 74 Years | 308 (5.9%) | 249 (4.3%) |
| 75 Years and over | 174 (6.9%) | 470 (9.9%) |
Technology Access in Evansville
Computing Device Access in Evansville
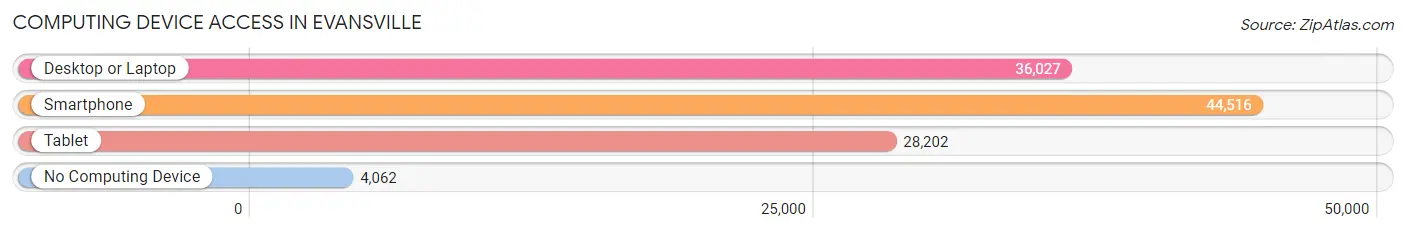
| Device Type | # Households | % Households |
| Desktop or Laptop | 36,027 | 69.2% |
| Smartphone | 44,516 | 85.5% |
| Tablet | 28,202 | 54.2% |
| No Computing Device | 4,062 | 7.8% |
| Total | 52,070 | 100.0% |
Internet Access in Evansville
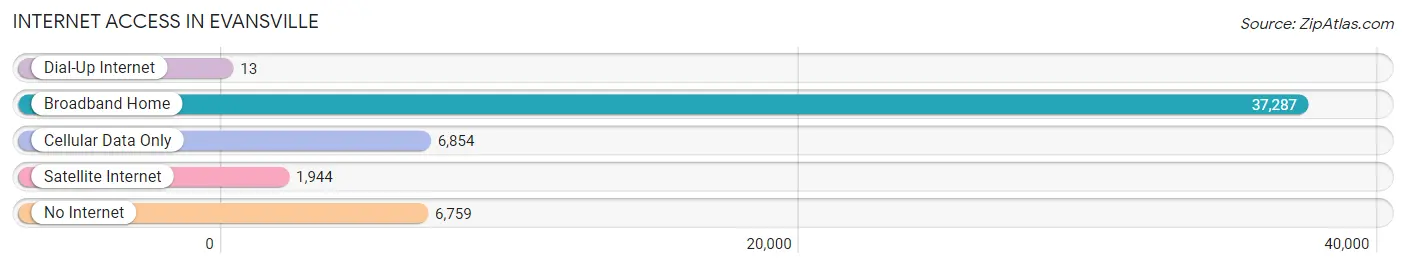
| Internet Type | # Households | % Households |
| Dial-Up Internet | 13 | 0.0% |
| Broadband Home | 37,287 | 71.6% |
| Cellular Data Only | 6,854 | 13.2% |
| Satellite Internet | 1,944 | 3.7% |
| No Internet | 6,759 | 13.0% |
| Total | 52,070 | 100.0% |
Evansville Summary
Evansville is a city located in the southwestern corner of the state of Indiana in the United States. It is the third-largest city in the state and the largest city in the Tri-State area, which includes parts of Illinois, Kentucky, and Indiana. The city is situated on an oxbow of the Ohio River and is the county seat of Vanderburgh County. The population of Evansville was 117,429 at the 2010 census, making it the state's largest city outside the Indianapolis metropolitan area.
Geography
Evansville is located in the southwestern corner of Indiana, at the confluence of the Ohio and Wabash Rivers. The city is situated on an oxbow of the Ohio River, which is the border between Indiana and Kentucky. The city is located within the Wabash Valley, a region of rolling hills and valleys that is part of the larger Midwest region. The city is located in the humid subtropical climate zone, with hot, humid summers and cold, wet winters.
Economy
Evansville is a major economic center in the region, with a diverse economy that includes manufacturing, healthcare, education, and tourism. The city is home to several major employers, including the University of Evansville, Deaconess Health System, Berry Plastics, and Toyota Motor Manufacturing. The city is also home to several major industries, including automotive, aerospace, and food processing.
Demographics
As of the 2010 census, the population of Evansville was 117,429, making it the state's largest city outside the Indianapolis metropolitan area. The racial makeup of the city was 79.2% White, 15.3% African American, 0.3% Native American, 1.2% Asian, 0.1% Pacific Islander, 1.7% from other races, and 2.4% from two or more races. Hispanic or Latino of any race were 4.2% of the population.
The median income for a household in the city was $37,945, and the median income for a family was $45,919. The per capita income for the city was $20,945. About 15.2% of families and 19.2% of the population were below the poverty line, including 28.2% of those under age 18 and 9.7% of those age 65 or over.
Conclusion
Evansville is a major economic center in the region, with a diverse economy that includes manufacturing, healthcare, education, and tourism. The city is home to several major employers, including the University of Evansville, Deaconess Health System, Berry Plastics, and Toyota Motor Manufacturing. The population of Evansville was 117,429 at the 2010 census, making it the state's largest city outside the Indianapolis metropolitan area. The racial makeup of the city was 79.2% White, 15.3% African American, 0.3% Native American, 1.2% Asian, 0.1% Pacific Islander, 1.7% from other races, and 2.4% from two or more races. The median income for a household in the city was $37,945, and the median income for a family was $45,919. Evansville is a vibrant city with a rich history, diverse economy, and diverse population.
Common Questions
What is Per Capita Income in Evansville?
Per Capita income in Evansville is $29,393.
What is the Median Family Income in Evansville?
Median Family Income in Evansville is $61,612.
What is the Median Household income in Evansville?
Median Household Income in Evansville is $49,853.
What is Income or Wage Gap in Evansville?
Income or Wage Gap in Evansville is 26.6%.
Women in Evansville earn 73.4 cents for every dollar earned by a man.
What is Family Income Deficit in Evansville?
Family Income Deficit in Evansville is $11,522.
Families that are below poverty line in Evansville earn $11,522 less on average than the poverty threshold level.
What is Inequality or Gini Index in Evansville?
Inequality or Gini Index in Evansville is 0.44.
What is the Total Population of Evansville?
Total Population of Evansville is 116,906.
What is the Total Male Population of Evansville?
Total Male Population of Evansville is 57,290.
What is the Total Female Population of Evansville?
Total Female Population of Evansville is 59,616.
What is the Ratio of Males per 100 Females in Evansville?
There are 96.10 Males per 100 Females in Evansville.
What is the Ratio of Females per 100 Males in Evansville?
There are 104.06 Females per 100 Males in Evansville.
What is the Median Population Age in Evansville?
Median Population Age in Evansville is 38.1 Years.
What is the Average Family Size in Evansville
Average Family Size in Evansville is 2.9 People.
What is the Average Household Size in Evansville
Average Household Size in Evansville is 2.2 People.
How Large is the Labor Force in Evansville?
There are 60,508 People in the Labor Forcein in Evansville.
What is the Percentage of People in the Labor Force in Evansville?
64.0% of People are in the Labor Force in Evansville.
What is the Unemployment Rate in Evansville?
Unemployment Rate in Evansville is 5.7%.