Walden, NY Map & Demographics
Walden Map
Walden Overview
$34,899
PER CAPITA INCOME
$103,672
AVG FAMILY INCOME
$76,724
AVG HOUSEHOLD INCOME
48.3%
WAGE / INCOME GAP [ % ]
51.7¢/ $1
WAGE / INCOME GAP [ $ ]
0.46
INEQUALITY / GINI INDEX
6,861
TOTAL POPULATION
3,342
MALE POPULATION
3,519
FEMALE POPULATION
94.97
MALES / 100 FEMALES
105.30
FEMALES / 100 MALES
39.0
MEDIAN AGE
3.3
AVG FAMILY SIZE
2.5
AVG HOUSEHOLD SIZE
3,270
LABOR FORCE [ PEOPLE ]
58.5%
PERCENT IN LABOR FORCE
5.8%
UNEMPLOYMENT RATE
Walden Zip Codes
Walden Area Codes
Income in Walden
Income Overview in Walden
Per Capita Income in Walden is $34,899, while median incomes of families and households are $103,672 and $76,724 respectively.
| Characteristic | Number | Measure |
| Per Capita Income | 6,861 | $34,899 |
| Median Family Income | 1,632 | $103,672 |
| Mean Family Income | 1,632 | $106,984 |
| Median Household Income | 2,734 | $76,724 |
| Mean Household Income | 2,734 | $85,463 |
| Income Deficit | 1,632 | $0 |
| Wage / Income Gap (%) | 6,861 | 48.32% |
| Wage / Income Gap ($) | 6,861 | 51.68¢ per $1 |
| Gini / Inequality Index | 6,861 | 0.46 |
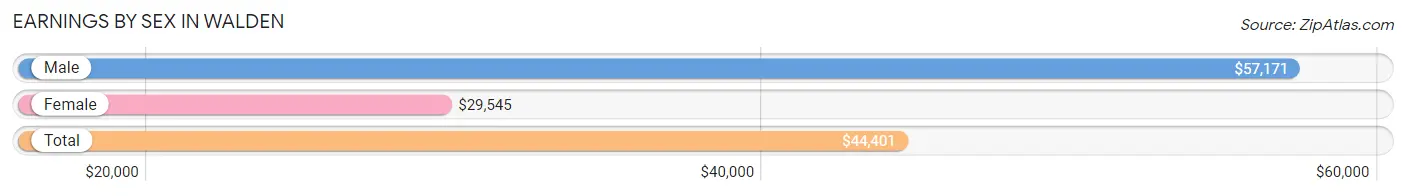
Earnings by Sex in Walden
Average Earnings in Walden are $44,401, $57,171 for men and $29,545 for women, a difference of 48.3%.
| Sex | Number | Average Earnings |
| Male | 1,865 (53.2%) | $57,171 |
| Female | 1,642 (46.8%) | $29,545 |
| Total | 3,507 (100.0%) | $44,401 |
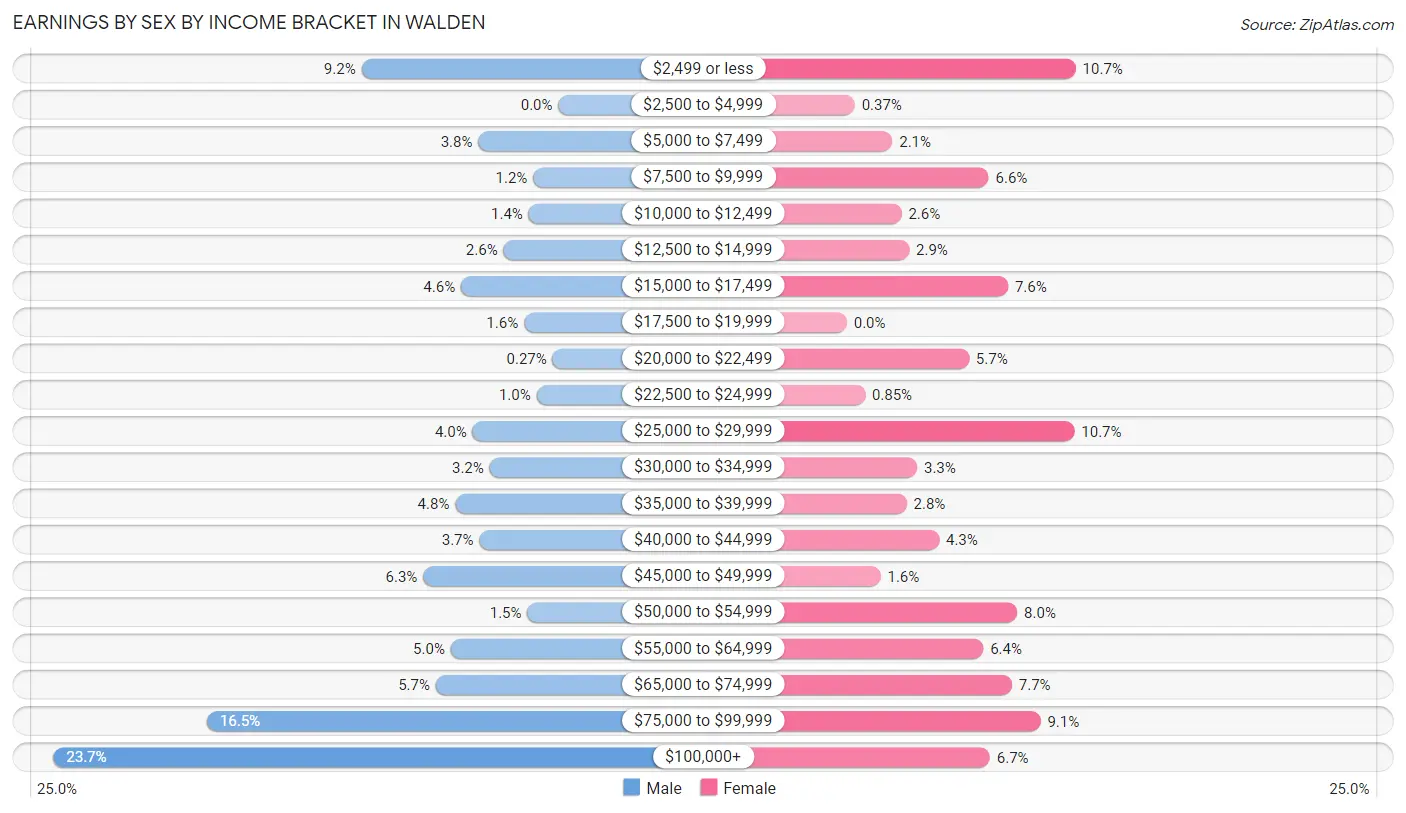
Earnings by Sex by Income Bracket in Walden
The most common earnings brackets in Walden are $100,000+ for men (441 | 23.6%) and $2,499 or less for women (176 | 10.7%).
| Income | Male | Female |
| $2,499 or less | 172 (9.2%) | 176 (10.7%) |
| $2,500 to $4,999 | 0 (0.0%) | 6 (0.4%) |
| $5,000 to $7,499 | 70 (3.7%) | 35 (2.1%) |
| $7,500 to $9,999 | 22 (1.2%) | 109 (6.6%) |
| $10,000 to $12,499 | 26 (1.4%) | 42 (2.6%) |
| $12,500 to $14,999 | 48 (2.6%) | 48 (2.9%) |
| $15,000 to $17,499 | 85 (4.6%) | 124 (7.5%) |
| $17,500 to $19,999 | 30 (1.6%) | 0 (0.0%) |
| $20,000 to $22,499 | 5 (0.3%) | 94 (5.7%) |
| $22,500 to $24,999 | 19 (1.0%) | 14 (0.9%) |
| $25,000 to $29,999 | 75 (4.0%) | 175 (10.7%) |
| $30,000 to $34,999 | 60 (3.2%) | 54 (3.3%) |
| $35,000 to $39,999 | 90 (4.8%) | 46 (2.8%) |
| $40,000 to $44,999 | 69 (3.7%) | 71 (4.3%) |
| $45,000 to $49,999 | 118 (6.3%) | 26 (1.6%) |
| $50,000 to $54,999 | 27 (1.5%) | 131 (8.0%) |
| $55,000 to $64,999 | 94 (5.0%) | 105 (6.4%) |
| $65,000 to $74,999 | 107 (5.7%) | 127 (7.7%) |
| $75,000 to $99,999 | 307 (16.5%) | 149 (9.1%) |
| $100,000+ | 441 (23.6%) | 110 (6.7%) |
| Total | 1,865 (100.0%) | 1,642 (100.0%) |
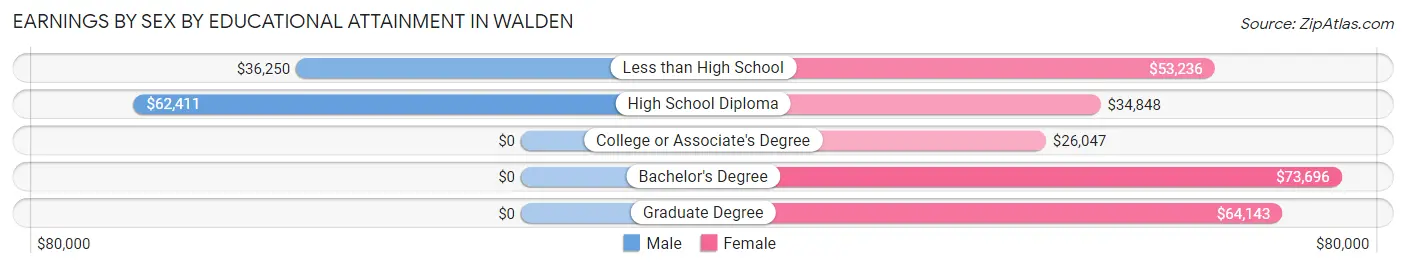
Earnings by Sex by Educational Attainment in Walden
Average earnings in Walden are $66,250 for men and $52,542 for women, a difference of 20.7%. Men with an educational attainment of high school diploma enjoy the highest average annual earnings of $62,411, while those with less than high school education earn the least with $36,250. Women with an educational attainment of bachelor's degree earn the most with the average annual earnings of $73,696, while those with college or associate's degree education have the smallest earnings of $26,047.
| Educational Attainment | Male Income | Female Income |
| Less than High School | $36,250 | $53,236 |
| High School Diploma | $62,411 | $34,848 |
| College or Associate's Degree | - | - |
| Bachelor's Degree | - | - |
| Graduate Degree | - | - |
| Total | $66,250 | $52,542 |
Family Income in Walden
Family Income Brackets in Walden
According to the Walden family income data, there are 436 families falling into the $100,000 to $149,999 income range, which is the most common income bracket and makes up 26.7% of all families. Conversely, the $10,000 to $14,999 income bracket is the least frequent group with only 10 families (0.6%) belonging to this category.
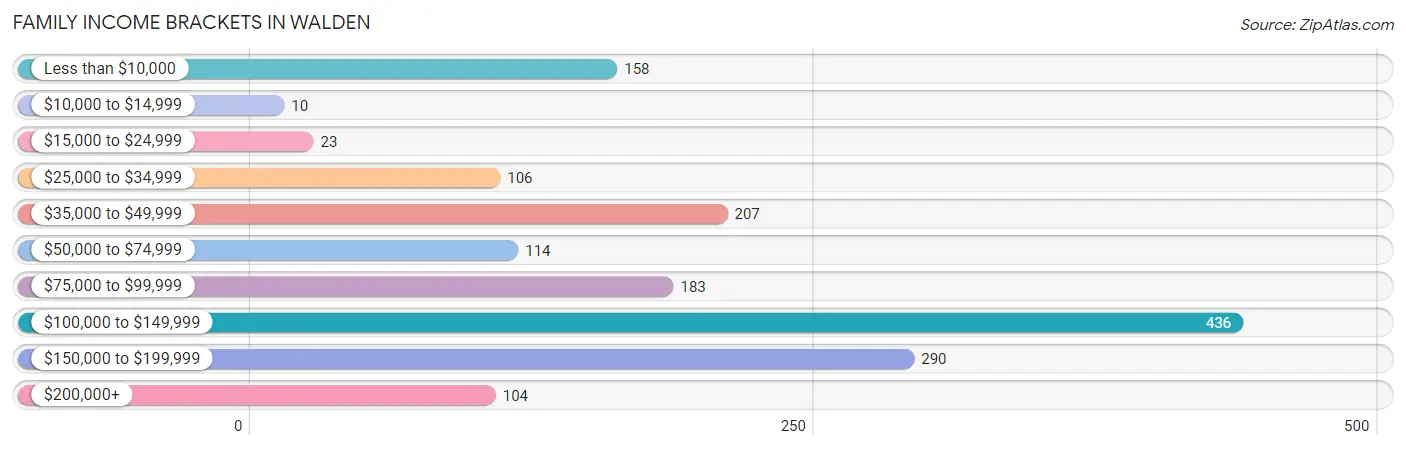
| Income Bracket | # Families | % Families |
| Less than $10,000 | 158 | 9.7% |
| $10,000 to $14,999 | 10 | 0.6% |
| $15,000 to $24,999 | 23 | 1.4% |
| $25,000 to $34,999 | 106 | 6.5% |
| $35,000 to $49,999 | 207 | 12.7% |
| $50,000 to $74,999 | 114 | 7.0% |
| $75,000 to $99,999 | 183 | 11.2% |
| $100,000 to $149,999 | 436 | 26.7% |
| $150,000 to $199,999 | 290 | 17.8% |
| $200,000+ | 104 | 6.4% |
Family Income by Famaliy Size in Walden
6-person families (25 | 1.5%) account for the highest median family income in Walden with $144,271 per family, while 2-person families (706 | 43.3%) have the highest median income of $43,526 per family member.
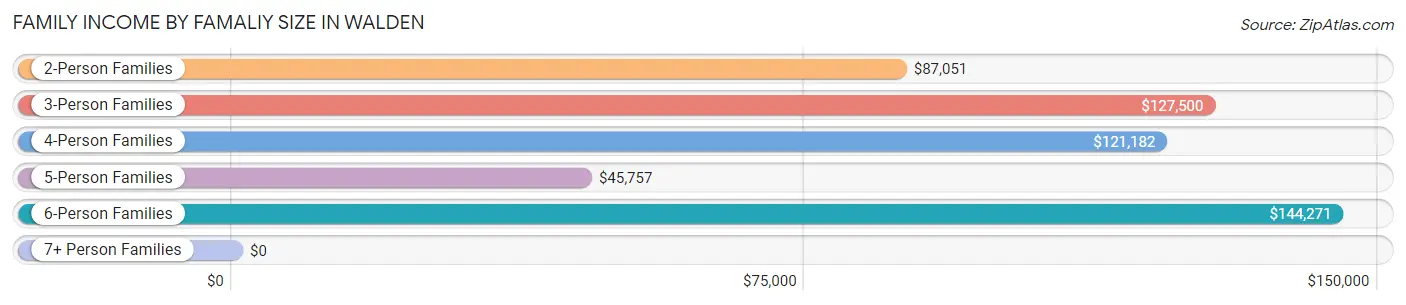
| Income Bracket | # Families | Median Income |
| 2-Person Families | 706 (43.3%) | $87,051 |
| 3-Person Families | 194 (11.9%) | $127,500 |
| 4-Person Families | 336 (20.6%) | $121,182 |
| 5-Person Families | 352 (21.6%) | $45,757 |
| 6-Person Families | 25 (1.5%) | $144,271 |
| 7+ Person Families | 19 (1.2%) | $0 |
| Total | 1,632 (100.0%) | $103,672 |
Family Income by Number of Earners in Walden
The median family income in Walden is $103,672, with families comprising 2 earners (741) having the highest median family income of $123,672, while families with no earners (217) have the lowest median family income of $26,283, accounting for 45.4% and 13.3% of families, respectively.
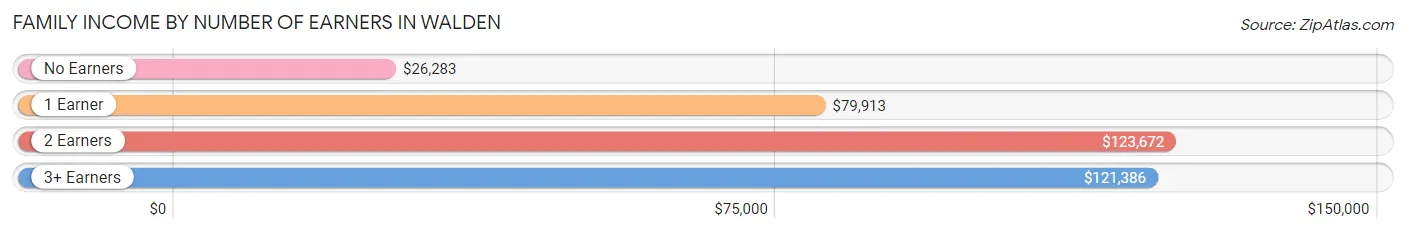
| Number of Earners | # Families | Median Income |
| No Earners | 217 (13.3%) | $26,283 |
| 1 Earner | 449 (27.5%) | $79,913 |
| 2 Earners | 741 (45.4%) | $123,672 |
| 3+ Earners | 225 (13.8%) | $121,386 |
| Total | 1,632 (100.0%) | $103,672 |
Household Income in Walden
Household Income Brackets in Walden
With 618 households falling in the category, the $100,000 to $149,999 income range is the most frequent in Walden, accounting for 22.6% of all households. In contrast, only 120 households (4.4%) fall into the $200,000+ income bracket, making it the least populous group.
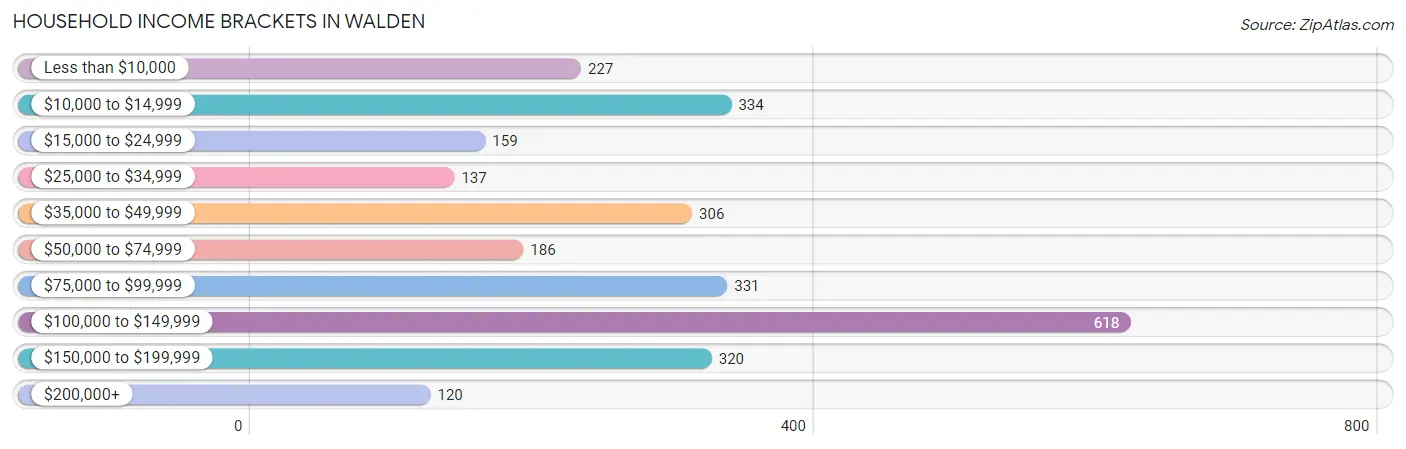
| Income Bracket | # Households | % Households |
| Less than $10,000 | 227 | 8.3% |
| $10,000 to $14,999 | 334 | 12.2% |
| $15,000 to $24,999 | 159 | 5.8% |
| $25,000 to $34,999 | 137 | 5.0% |
| $35,000 to $49,999 | 306 | 11.2% |
| $50,000 to $74,999 | 186 | 6.8% |
| $75,000 to $99,999 | 331 | 12.1% |
| $100,000 to $149,999 | 618 | 22.6% |
| $150,000 to $199,999 | 320 | 11.7% |
| $200,000+ | 120 | 4.4% |
Household Income by Householder Age in Walden
The median household income in Walden is $76,724, with the highest median household income of $120,432 found in the 25 to 44 years age bracket for the primary householder. A total of 919 households (33.6%) fall into this category. Meanwhile, the 65+ years age bracket for the primary householder has the lowest median household income of $0, with 627 households (22.9%) in this group.
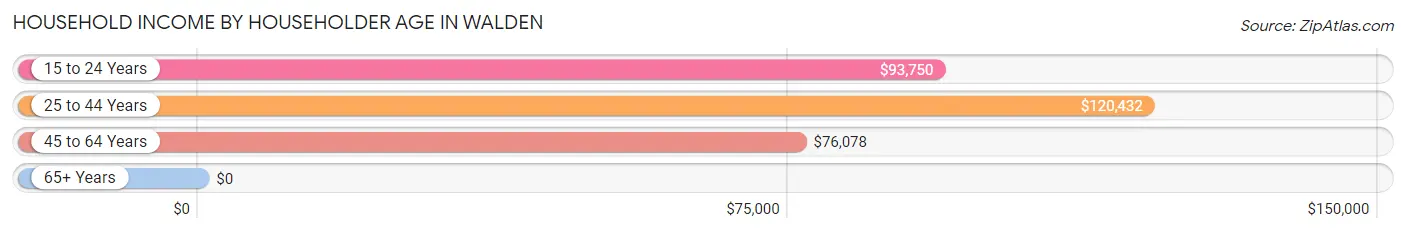
| Income Bracket | # Households | Median Income |
| 15 to 24 Years | 45 (1.7%) | $93,750 |
| 25 to 44 Years | 919 (33.6%) | $120,432 |
| 45 to 64 Years | 1,143 (41.8%) | $76,078 |
| 65+ Years | 627 (22.9%) | $0 |
| Total | 2,734 (100.0%) | $76,724 |
Poverty in Walden
Income Below Poverty by Sex and Age in Walden
With 15.8% poverty level for males and 19.4% for females among the residents of Walden, 55 to 64 year old males and 12 to 14 year old females are the most vulnerable to poverty, with 364 males (44.2%) and 73 females (59.8%) in their respective age groups living below the poverty level.
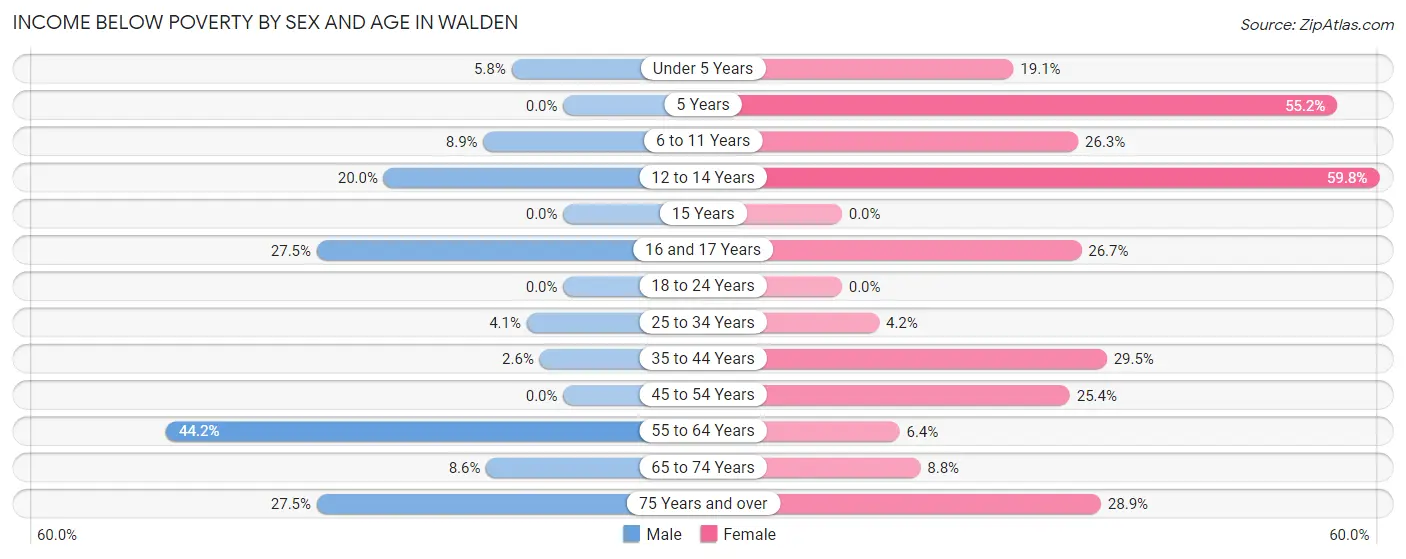
| Age Bracket | Male | Female |
| Under 5 Years | 9 (5.8%) | 43 (19.1%) |
| 5 Years | 0 (0.0%) | 32 (55.2%) |
| 6 to 11 Years | 17 (8.9%) | 75 (26.3%) |
| 12 to 14 Years | 30 (20.0%) | 73 (59.8%) |
| 15 Years | 0 (0.0%) | 0 (0.0%) |
| 16 and 17 Years | 42 (27.5%) | 36 (26.7%) |
| 18 to 24 Years | 0 (0.0%) | 0 (0.0%) |
| 25 to 34 Years | 15 (4.1%) | 14 (4.2%) |
| 35 to 44 Years | 13 (2.6%) | 149 (29.5%) |
| 45 to 54 Years | 0 (0.0%) | 115 (25.4%) |
| 55 to 64 Years | 364 (44.2%) | 24 (6.4%) |
| 65 to 74 Years | 23 (8.6%) | 7 (8.7%) |
| 75 Years and over | 14 (27.5%) | 114 (28.9%) |
| Total | 527 (15.8%) | 682 (19.4%) |
Income Above Poverty by Sex and Age in Walden
According to the poverty statistics in Walden, males aged 5 years and females aged 15 years are the age groups that are most secure financially, with 100.0% of males and 100.0% of females in these age groups living above the poverty line.
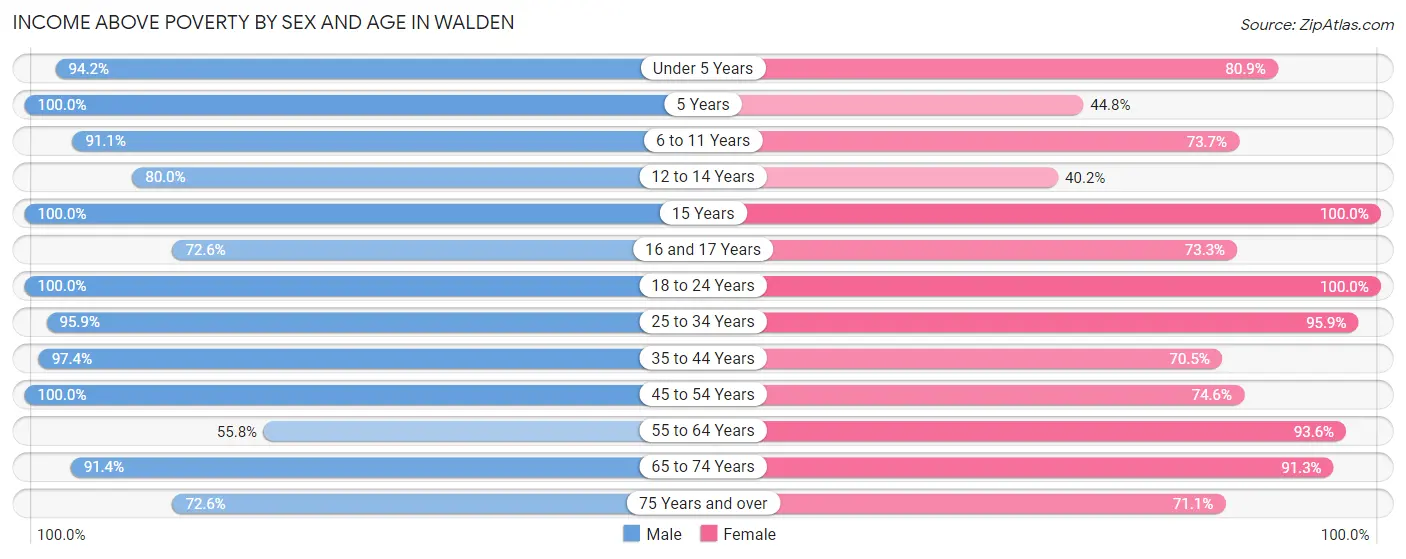
| Age Bracket | Male | Female |
| Under 5 Years | 147 (94.2%) | 182 (80.9%) |
| 5 Years | 7 (100.0%) | 26 (44.8%) |
| 6 to 11 Years | 174 (91.1%) | 210 (73.7%) |
| 12 to 14 Years | 120 (80.0%) | 49 (40.2%) |
| 15 Years | 50 (100.0%) | 27 (100.0%) |
| 16 and 17 Years | 111 (72.6%) | 99 (73.3%) |
| 18 to 24 Years | 333 (100.0%) | 524 (100.0%) |
| 25 to 34 Years | 354 (95.9%) | 323 (95.9%) |
| 35 to 44 Years | 482 (97.4%) | 356 (70.5%) |
| 45 to 54 Years | 296 (100.0%) | 338 (74.6%) |
| 55 to 64 Years | 459 (55.8%) | 349 (93.6%) |
| 65 to 74 Years | 245 (91.4%) | 73 (91.2%) |
| 75 Years and over | 37 (72.6%) | 281 (71.1%) |
| Total | 2,815 (84.2%) | 2,837 (80.6%) |
Income Below Poverty Among Married-Couple Families in Walden
The poverty statistics for married-couple families in Walden show that 10.3% or 124 of the total 1,199 families live below the poverty line. Families with 1 or 2 children have the highest poverty rate of 22.6%, comprising of 112 families. On the other hand, families with 3 or 4 children have the lowest poverty rate of 0.0%, which includes 0 families.
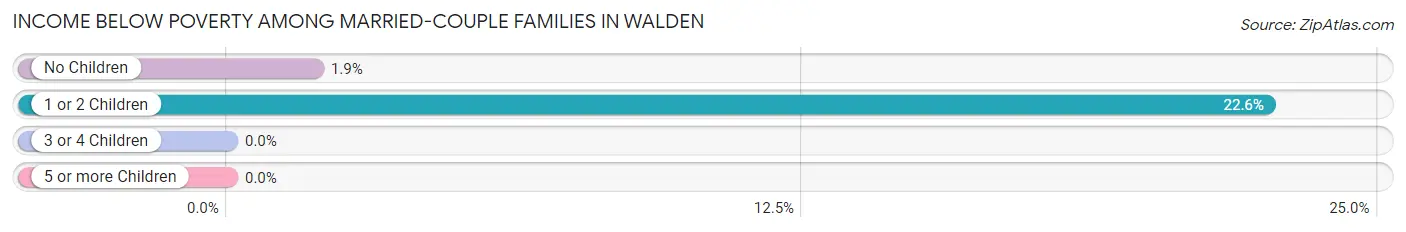
| Children | Above Poverty | Below Poverty |
| No Children | 630 (98.1%) | 12 (1.9%) |
| 1 or 2 Children | 384 (77.4%) | 112 (22.6%) |
| 3 or 4 Children | 48 (100.0%) | 0 (0.0%) |
| 5 or more Children | 13 (100.0%) | 0 (0.0%) |
| Total | 1,075 (89.7%) | 124 (10.3%) |
Income Below Poverty Among Single-Parent Households in Walden
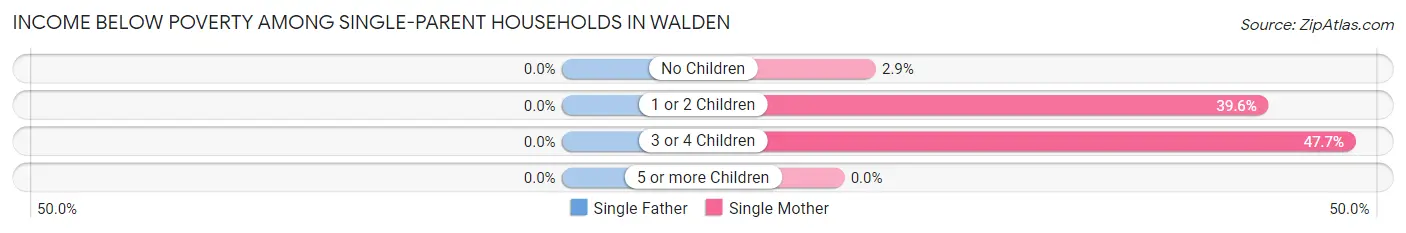
| Children | Single Father | Single Mother |
| No Children | 0 (0.0%) | 5 (2.9%) |
| 1 or 2 Children | 0 (0.0%) | 55 (39.6%) |
| 3 or 4 Children | 0 (0.0%) | 31 (47.7%) |
| 5 or more Children | 0 (0.0%) | 0 (0.0%) |
| Total | 0 (0.0%) | 91 (24.3%) |
Income Below Poverty Among Married-Couple vs Single-Parent Households in Walden
The poverty data for Walden shows that 124 of the married-couple family households (10.3%) and 91 of the single-parent households (21.0%) are living below the poverty level. Within the married-couple family households, those with 1 or 2 children have the highest poverty rate, with 112 households (22.6%) falling below the poverty line. Among the single-parent households, those with 3 or 4 children have the highest poverty rate, with 31 household (47.7%) living below poverty.
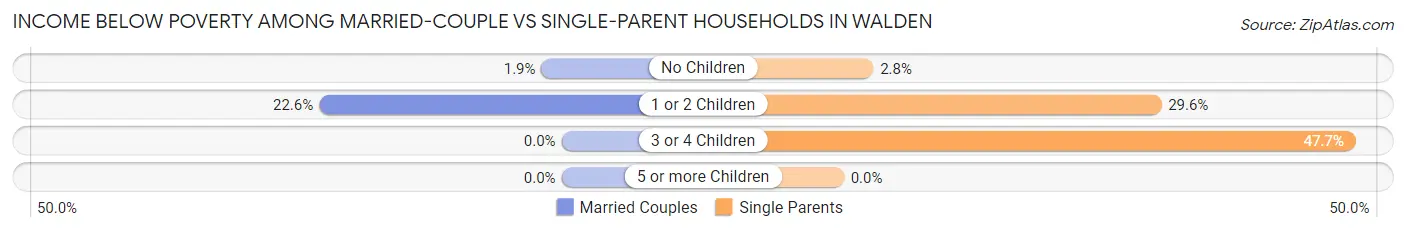
| Children | Married-Couple Families | Single-Parent Households |
| No Children | 12 (1.9%) | 5 (2.8%) |
| 1 or 2 Children | 112 (22.6%) | 55 (29.6%) |
| 3 or 4 Children | 0 (0.0%) | 31 (47.7%) |
| 5 or more Children | 0 (0.0%) | 0 (0.0%) |
| Total | 124 (10.3%) | 91 (21.0%) |
Race in Walden
The most populous races in Walden are White / Caucasian (3,891 | 56.7%), Hispanic or Latino (1,508 | 22.0%), and Two or more Races (1,407 | 20.5%).
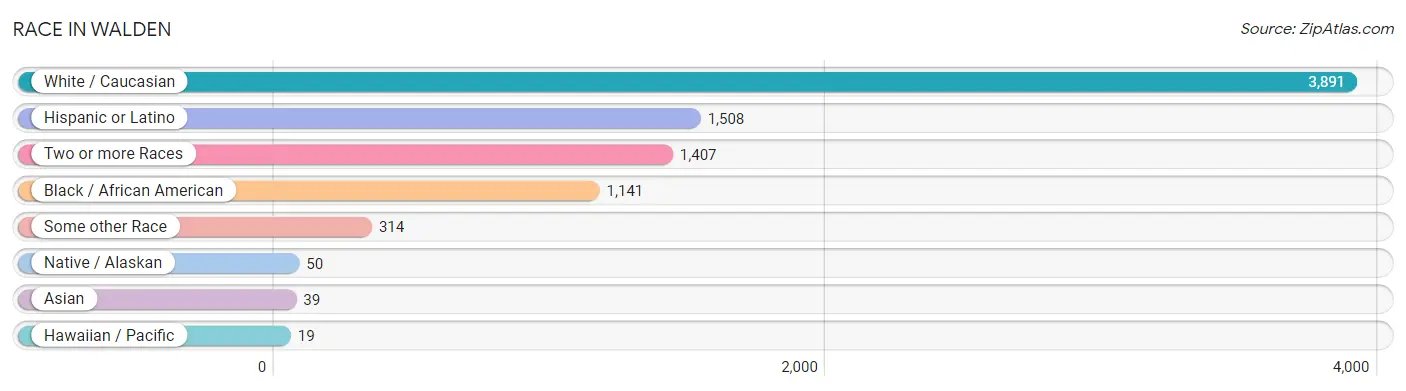
| Race | # Population | % Population |
| Asian | 39 | 0.6% |
| Black / African American | 1,141 | 16.6% |
| Hawaiian / Pacific | 19 | 0.3% |
| Hispanic or Latino | 1,508 | 22.0% |
| Native / Alaskan | 50 | 0.7% |
| White / Caucasian | 3,891 | 56.7% |
| Two or more Races | 1,407 | 20.5% |
| Some other Race | 314 | 4.6% |
| Total | 6,861 | 100.0% |
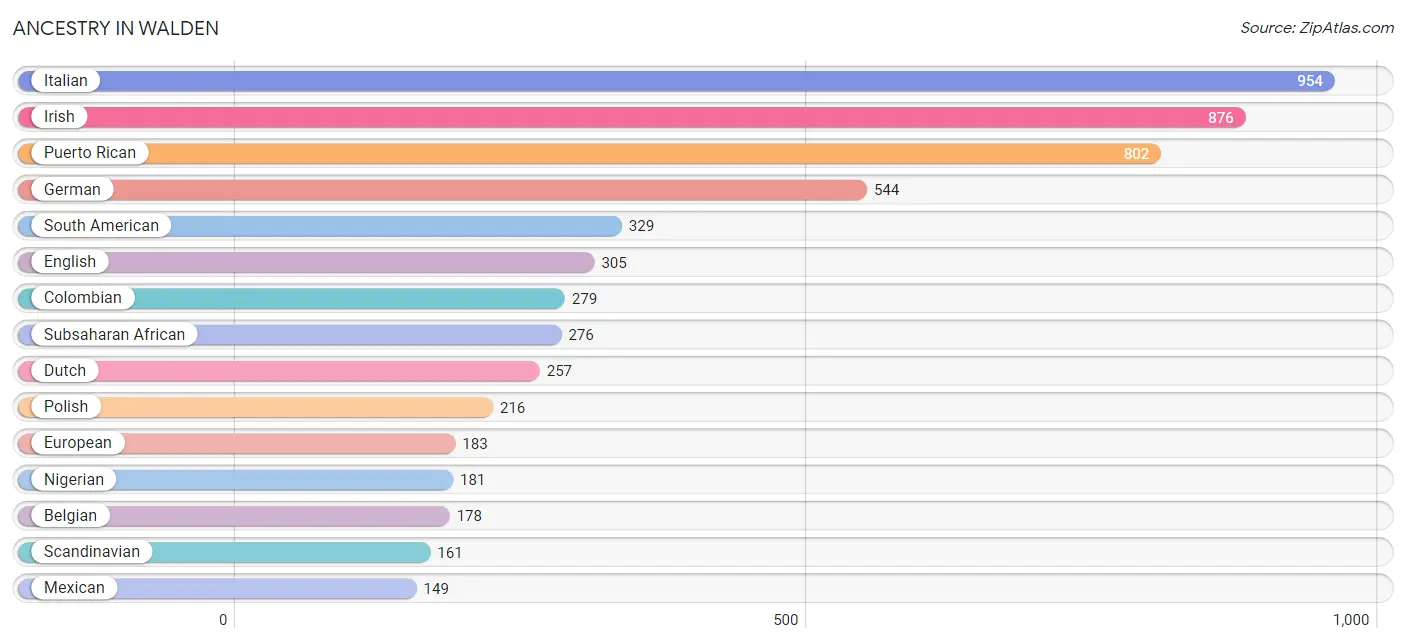
Ancestry in Walden
The most populous ancestries reported in Walden are Italian (954 | 13.9%), Irish (876 | 12.8%), Puerto Rican (802 | 11.7%), German (544 | 7.9%), and South American (329 | 4.8%), together accounting for 51.1% of all Walden residents.
| Ancestry | # Population | % Population |
| American | 140 | 2.0% |
| Arab | 22 | 0.3% |
| Austrian | 16 | 0.2% |
| Belgian | 178 | 2.6% |
| Blackfeet | 87 | 1.3% |
| Bolivian | 13 | 0.2% |
| British West Indian | 13 | 0.2% |
| Canadian | 11 | 0.2% |
| Colombian | 279 | 4.1% |
| Czech | 19 | 0.3% |
| Dominican | 69 | 1.0% |
| Dutch | 257 | 3.7% |
| Eastern European | 17 | 0.3% |
| English | 305 | 4.4% |
| European | 183 | 2.7% |
| French | 127 | 1.8% |
| French Canadian | 88 | 1.3% |
| German | 544 | 7.9% |
| Greek | 7 | 0.1% |
| Guyanese | 61 | 0.9% |
| Haitian | 30 | 0.4% |
| Hungarian | 49 | 0.7% |
| Indian (Asian) | 3 | 0.0% |
| Irish | 876 | 12.8% |
| Iroquois | 87 | 1.3% |
| Italian | 954 | 13.9% |
| Jamaican | 61 | 0.9% |
| Jordanian | 13 | 0.2% |
| Korean | 30 | 0.4% |
| Liberian | 95 | 1.4% |
| Mexican | 149 | 2.2% |
| Mexican American Indian | 50 | 0.7% |
| Nigerian | 181 | 2.6% |
| Northern European | 13 | 0.2% |
| Norwegian | 4 | 0.1% |
| Peruvian | 37 | 0.5% |
| Polish | 216 | 3.2% |
| Portuguese | 115 | 1.7% |
| Puerto Rican | 802 | 11.7% |
| Romanian | 68 | 1.0% |
| Russian | 57 | 0.8% |
| Scandinavian | 161 | 2.4% |
| Scotch-Irish | 17 | 0.3% |
| Scottish | 82 | 1.2% |
| Slavic | 17 | 0.3% |
| Slovak | 38 | 0.5% |
| South American | 329 | 4.8% |
| Spaniard | 49 | 0.7% |
| Spanish | 110 | 1.6% |
| Sri Lankan | 16 | 0.2% |
| Subsaharan African | 276 | 4.0% |
| Swedish | 8 | 0.1% |
| Thai | 18 | 0.3% |
| Trinidadian and Tobagonian | 35 | 0.5% |
| Welsh | 38 | 0.5% | View All 55 Rows |
Immigrants in Walden
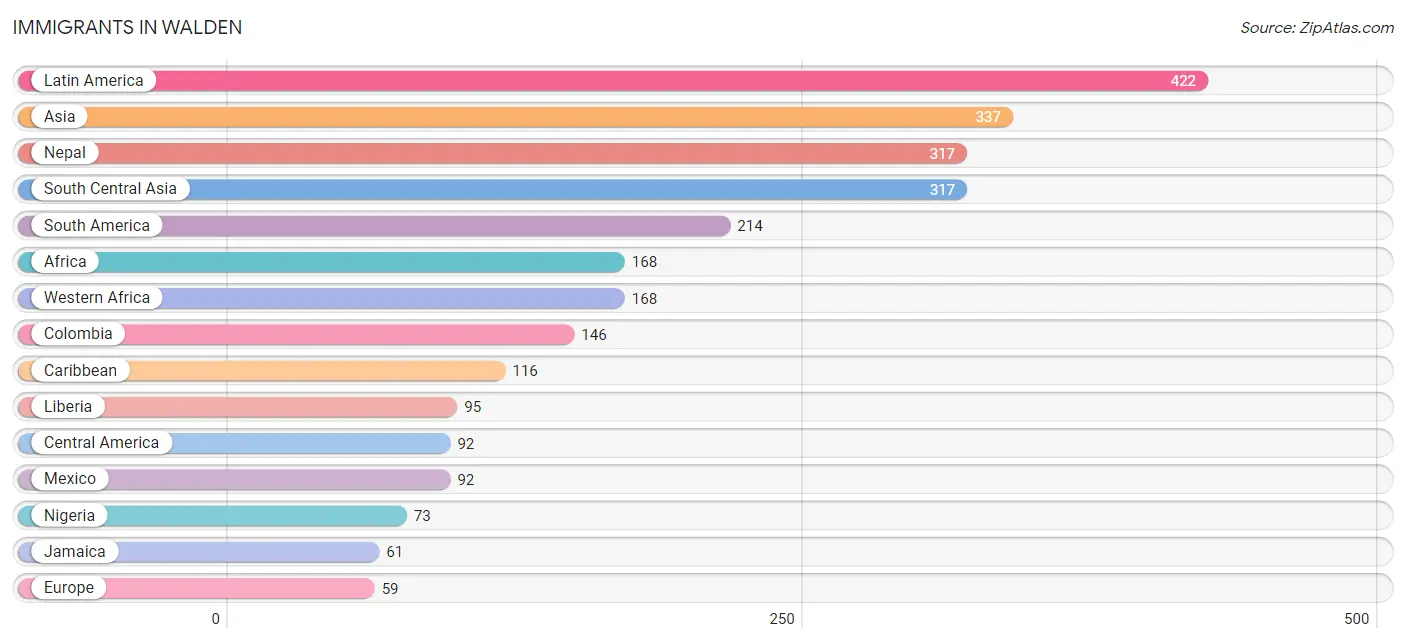
The most numerous immigrant groups reported in Walden came from Latin America (422 | 6.1%), Asia (337 | 4.9%), Nepal (317 | 4.6%), South Central Asia (317 | 4.6%), and South America (214 | 3.1%), together accounting for 23.4% of all Walden residents.
| Immigration Origin | # Population | % Population |
| Africa | 168 | 2.5% |
| Asia | 337 | 4.9% |
| Brazil | 6 | 0.1% |
| Canada | 11 | 0.2% |
| Caribbean | 116 | 1.7% |
| Central America | 92 | 1.3% |
| China | 16 | 0.2% |
| Colombia | 146 | 2.1% |
| Dominica | 55 | 0.8% |
| Eastern Asia | 16 | 0.2% |
| Ecuador | 13 | 0.2% |
| Europe | 59 | 0.9% |
| Germany | 9 | 0.1% |
| Guyana | 37 | 0.5% |
| Ireland | 30 | 0.4% |
| Jamaica | 61 | 0.9% |
| Latin America | 422 | 6.1% |
| Liberia | 95 | 1.4% |
| Mexico | 92 | 1.3% |
| Nepal | 317 | 4.6% |
| Netherlands | 6 | 0.1% |
| Nigeria | 73 | 1.1% |
| Northern Europe | 30 | 0.4% |
| Peru | 12 | 0.2% |
| Philippines | 4 | 0.1% |
| South America | 214 | 3.1% |
| South Central Asia | 317 | 4.6% |
| South Eastern Asia | 4 | 0.1% |
| Southern Europe | 14 | 0.2% |
| Spain | 14 | 0.2% |
| Western Africa | 168 | 2.5% |
| Western Europe | 15 | 0.2% | View All 32 Rows |
Sex and Age in Walden
Sex and Age in Walden
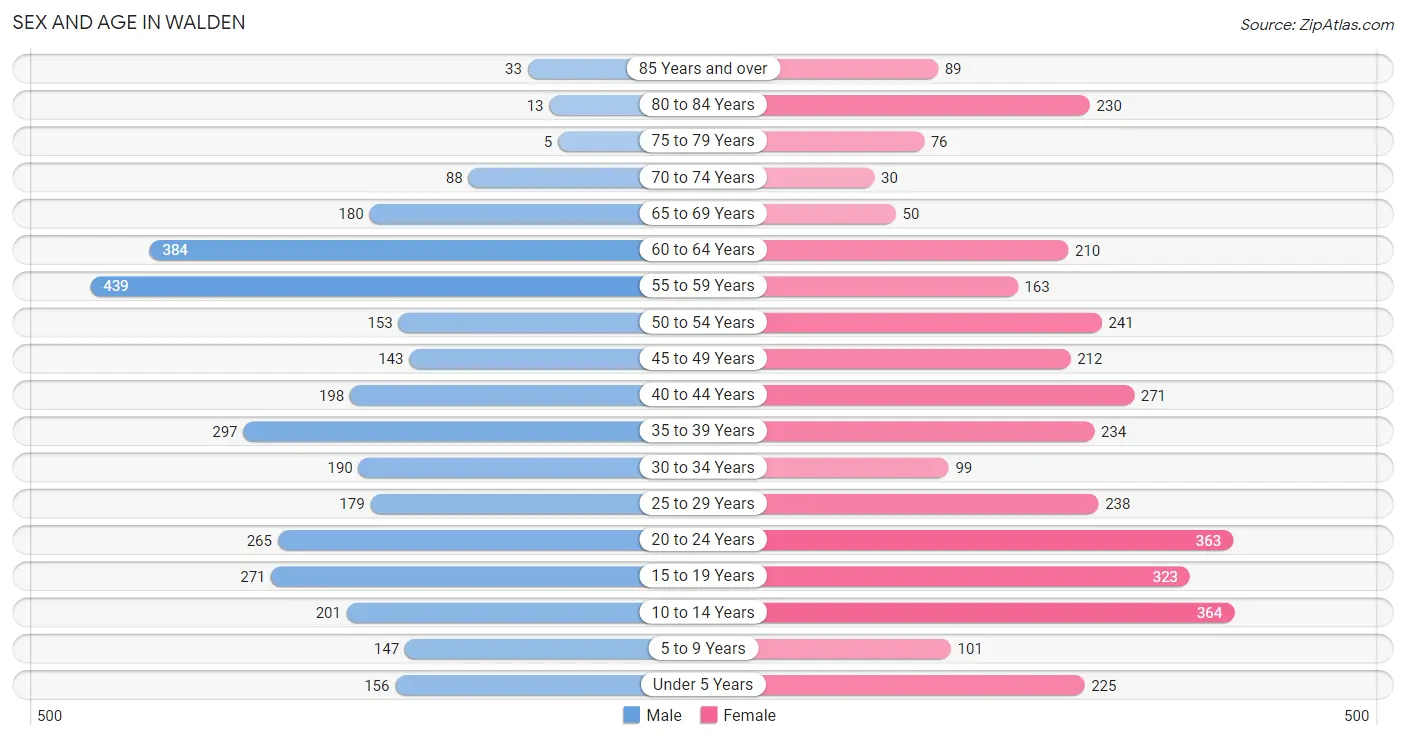
The most populous age groups in Walden are 55 to 59 Years (439 | 13.1%) for men and 10 to 14 Years (364 | 10.3%) for women.
| Age Bracket | Male | Female |
| Under 5 Years | 156 (4.7%) | 225 (6.4%) |
| 5 to 9 Years | 147 (4.4%) | 101 (2.9%) |
| 10 to 14 Years | 201 (6.0%) | 364 (10.3%) |
| 15 to 19 Years | 271 (8.1%) | 323 (9.2%) |
| 20 to 24 Years | 265 (7.9%) | 363 (10.3%) |
| 25 to 29 Years | 179 (5.4%) | 238 (6.8%) |
| 30 to 34 Years | 190 (5.7%) | 99 (2.8%) |
| 35 to 39 Years | 297 (8.9%) | 234 (6.7%) |
| 40 to 44 Years | 198 (5.9%) | 271 (7.7%) |
| 45 to 49 Years | 143 (4.3%) | 212 (6.0%) |
| 50 to 54 Years | 153 (4.6%) | 241 (6.9%) |
| 55 to 59 Years | 439 (13.1%) | 163 (4.6%) |
| 60 to 64 Years | 384 (11.5%) | 210 (6.0%) |
| 65 to 69 Years | 180 (5.4%) | 50 (1.4%) |
| 70 to 74 Years | 88 (2.6%) | 30 (0.9%) |
| 75 to 79 Years | 5 (0.2%) | 76 (2.2%) |
| 80 to 84 Years | 13 (0.4%) | 230 (6.5%) |
| 85 Years and over | 33 (1.0%) | 89 (2.5%) |
| Total | 3,342 (100.0%) | 3,519 (100.0%) |
Families and Households in Walden
Median Family Size in Walden
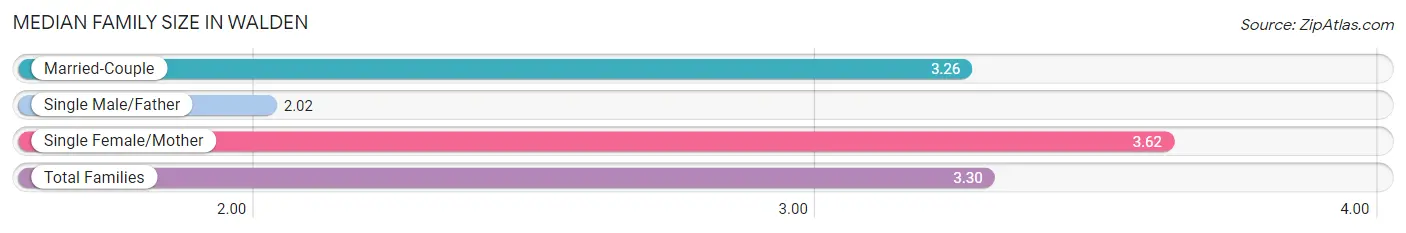
The median family size in Walden is 3.30 persons per family, with single female/mother families (375 | 23.0%) accounting for the largest median family size of 3.62 persons per family. On the other hand, single male/father families (58 | 3.5%) represent the smallest median family size with 2.02 persons per family.
| Family Type | # Families | Family Size |
| Married-Couple | 1,199 (73.5%) | 3.26 |
| Single Male/Father | 58 (3.5%) | 2.02 |
| Single Female/Mother | 375 (23.0%) | 3.62 |
| Total Families | 1,632 (100.0%) | 3.30 |
Median Household Size in Walden
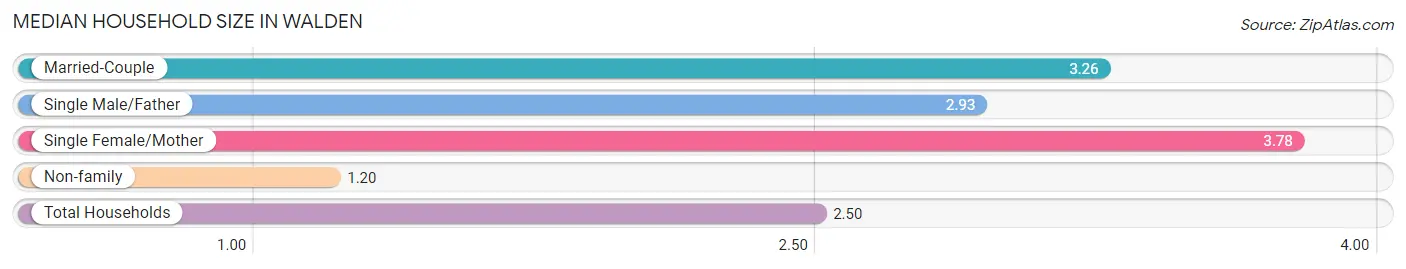
The median household size in Walden is 2.50 persons per household, with single female/mother households (375 | 13.7%) accounting for the largest median household size of 3.78 persons per household. non-family households (1,102 | 40.3%) represent the smallest median household size with 1.20 persons per household.
| Household Type | # Households | Household Size |
| Married-Couple | 1,199 (43.9%) | 3.26 |
| Single Male/Father | 58 (2.1%) | 2.93 |
| Single Female/Mother | 375 (13.7%) | 3.78 |
| Non-family | 1,102 (40.3%) | 1.20 |
| Total Households | 2,734 (100.0%) | 2.50 |
Household Size by Marriage Status in Walden
Out of a total of 2,734 households in Walden, 1,632 (59.7%) are family households, while 1,102 (40.3%) are nonfamily households. The most numerous type of family households are 2-person households, comprising 650, and the most common type of nonfamily households are 1-person households, comprising 929.
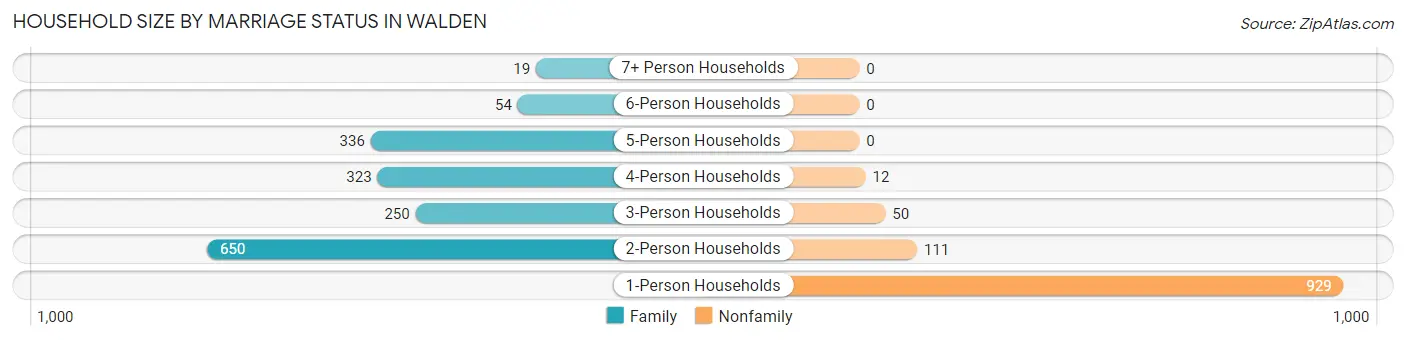
| Household Size | Family Households | Nonfamily Households |
| 1-Person Households | - | 929 (34.0%) |
| 2-Person Households | 650 (23.8%) | 111 (4.1%) |
| 3-Person Households | 250 (9.1%) | 50 (1.8%) |
| 4-Person Households | 323 (11.8%) | 12 (0.4%) |
| 5-Person Households | 336 (12.3%) | 0 (0.0%) |
| 6-Person Households | 54 (2.0%) | 0 (0.0%) |
| 7+ Person Households | 19 (0.7%) | 0 (0.0%) |
| Total | 1,632 (59.7%) | 1,102 (40.3%) |
Female Fertility in Walden
Fertility by Age in Walden
Average fertility rate in Walden is 13.0 births per 1,000 women. Women in the age bracket of 20 to 34 years have the highest fertility rate with 24.0 births per 1,000 women. Women in the age bracket of 20 to 34 years acount for 73.9% of all women with births.
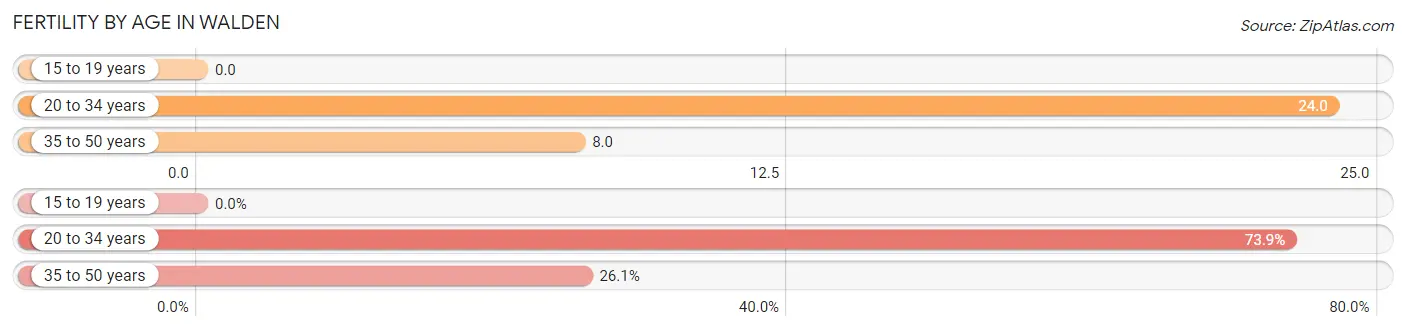
| Age Bracket | Women with Births | Births / 1,000 Women |
| 15 to 19 years | 0 (0.0%) | 0.0 |
| 20 to 34 years | 17 (73.9%) | 24.0 |
| 35 to 50 years | 6 (26.1%) | 8.0 |
| Total | 23 (100.0%) | 13.0 |
Fertility by Age by Marriage Status in Walden
43.5% of women with births (23) in Walden are married. The highest percentage of unmarried women with births falls into 35 to 50 years age bracket with 100.0% of them unmarried at the time of birth, while the lowest percentage of unmarried women with births belong to 20 to 34 years age bracket with 41.2% of them unmarried.
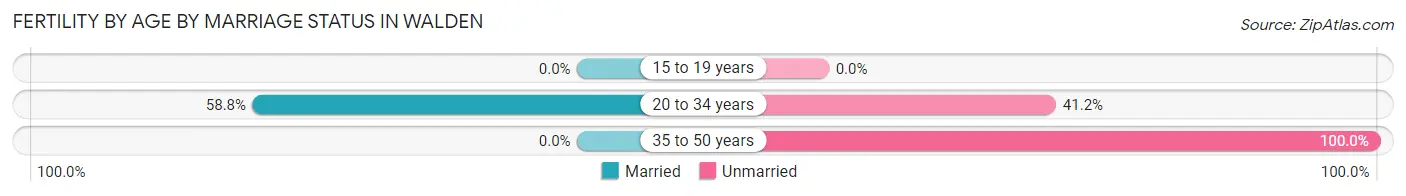
| Age Bracket | Married | Unmarried |
| 15 to 19 years | 0 (0.0%) | 0 (0.0%) |
| 20 to 34 years | 10 (58.8%) | 7 (41.2%) |
| 35 to 50 years | 0 (0.0%) | 6 (100.0%) |
| Total | 10 (43.5%) | 13 (56.5%) |
Fertility by Education in Walden
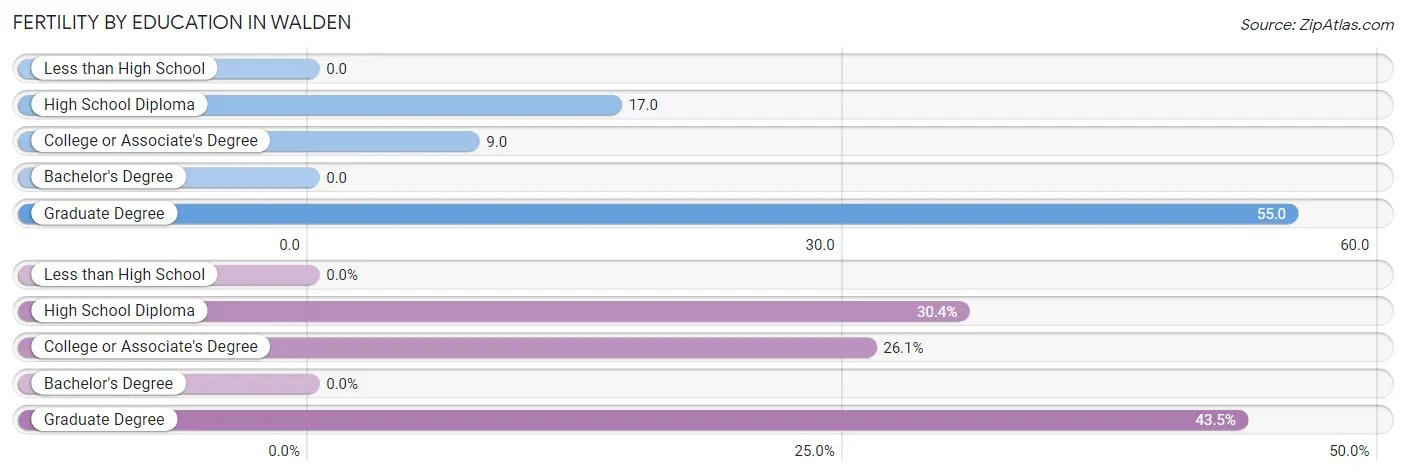
| Educational Attainment | Women with Births | Births / 1,000 Women |
| Less than High School | 0 (0.0%) | 0.0 |
| High School Diploma | 7 (30.4%) | 17.0 |
| College or Associate's Degree | 6 (26.1%) | 9.0 |
| Bachelor's Degree | 0 (0.0%) | 0.0 |
| Graduate Degree | 10 (43.5%) | 55.0 |
| Total | 23 (100.0%) | 13.0 |
Fertility by Education by Marriage Status in Walden
56.5% of women with births in Walden are unmarried. Women with the educational attainment of graduate degree are most likely to be married with 100.0% of them married at childbirth, while women with the educational attainment of high school diploma are least likely to be married with 100.0% of them unmarried at childbirth.
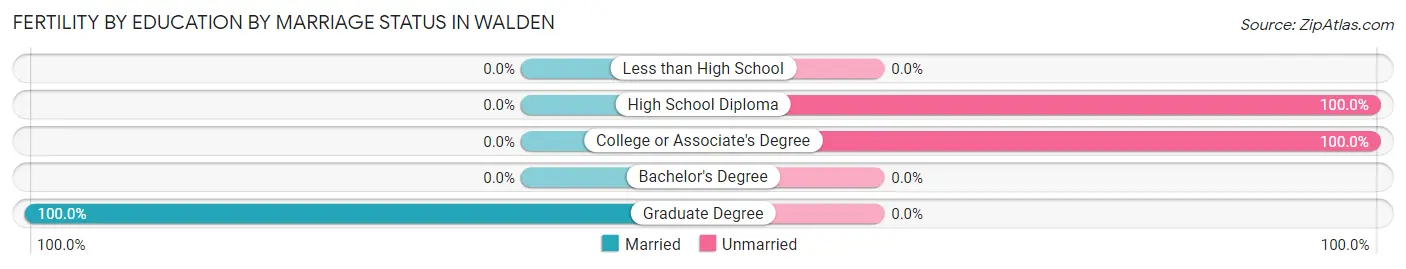
| Educational Attainment | Married | Unmarried |
| Less than High School | 0 (0.0%) | 0 (0.0%) |
| High School Diploma | 0 (0.0%) | 7 (100.0%) |
| College or Associate's Degree | 0 (0.0%) | 6 (100.0%) |
| Bachelor's Degree | 0 (0.0%) | 0 (0.0%) |
| Graduate Degree | 10 (100.0%) | 0 (0.0%) |
| Total | 10 (43.5%) | 13 (56.5%) |
Employment Characteristics in Walden
Employment by Class of Employer in Walden
Among the 3,039 employed individuals in Walden, private company employees (2,216 | 72.9%), local government employees (280 | 9.2%), and self-employed (not incorporated) (207 | 6.8%) make up the most common classes of employment.
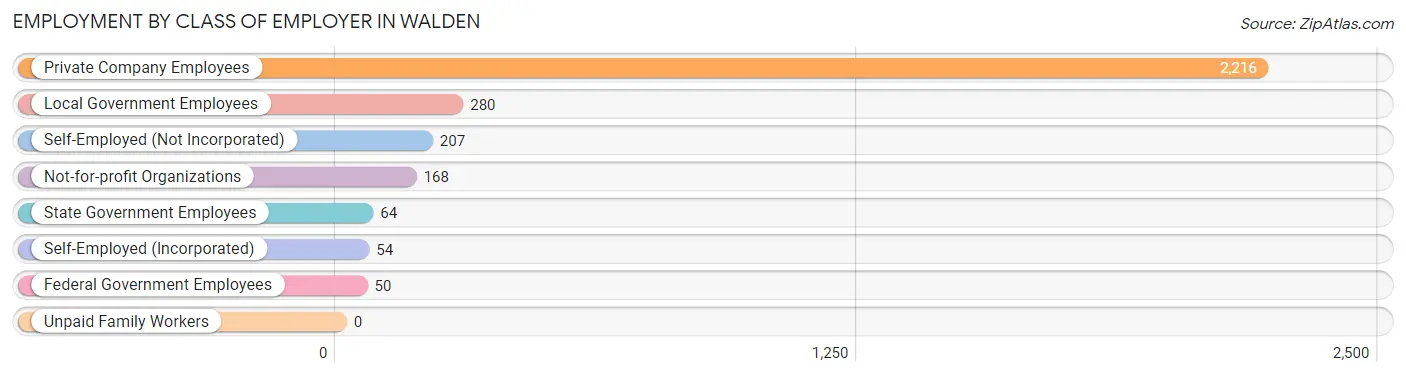
| Employer Class | # Employees | % Employees |
| Private Company Employees | 2,216 | 72.9% |
| Self-Employed (Incorporated) | 54 | 1.8% |
| Self-Employed (Not Incorporated) | 207 | 6.8% |
| Not-for-profit Organizations | 168 | 5.5% |
| Local Government Employees | 280 | 9.2% |
| State Government Employees | 64 | 2.1% |
| Federal Government Employees | 50 | 1.7% |
| Unpaid Family Workers | 0 | 0.0% |
| Total | 3,039 | 100.0% |
Employment Status by Age in Walden
According to the labor force statistics for Walden, out of the total population over 16 years of age (5,590), 58.5% or 3,270 individuals are in the labor force, with 5.8% or 190 of them unemployed. The age group with the highest labor force participation rate is 25 to 29 years, with 95.7% or 399 individuals in the labor force. Within the labor force, the 16 to 19 years age range has the highest percentage of unemployed individuals, with 35.9% or 70 of them being unemployed.
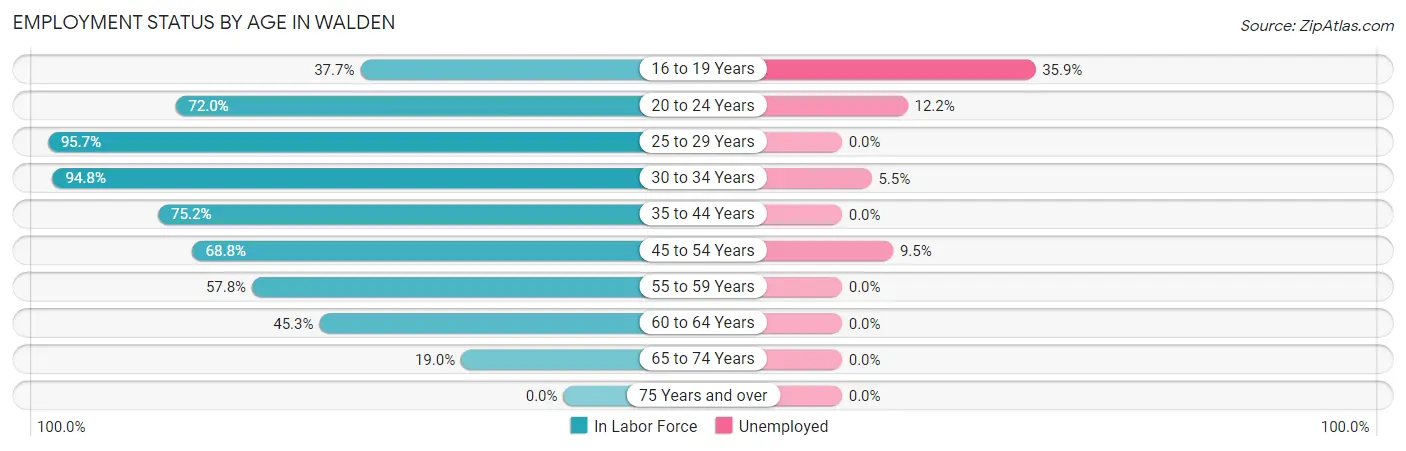
| Age Bracket | In Labor Force | Unemployed |
| 16 to 19 Years | 195 (37.7%) | 70 (35.9%) |
| 20 to 24 Years | 452 (72.0%) | 55 (12.2%) |
| 25 to 29 Years | 399 (95.7%) | 0 (0.0%) |
| 30 to 34 Years | 274 (94.8%) | 15 (5.5%) |
| 35 to 44 Years | 752 (75.2%) | 0 (0.0%) |
| 45 to 54 Years | 515 (68.8%) | 49 (9.5%) |
| 55 to 59 Years | 348 (57.8%) | 0 (0.0%) |
| 60 to 64 Years | 269 (45.3%) | 0 (0.0%) |
| 65 to 74 Years | 66 (19.0%) | 0 (0.0%) |
| 75 Years and over | 0 (0.0%) | 0 (0.0%) |
| Total | 3,270 (58.5%) | 190 (5.8%) |
Employment Status by Educational Attainment in Walden
According to labor force statistics for Walden, 70.0% of individuals (2,556) out of the total population between 25 and 64 years of age (3,651) are in the labor force, with 2.5% or 64 of them being unemployed. The group with the highest labor force participation rate are those with the educational attainment of less than high school, with 82.9% or 325 individuals in the labor force. Within the labor force, individuals with college / associate degree education have the highest percentage of unemployment, with 7.9% or 60 of them being unemployed.
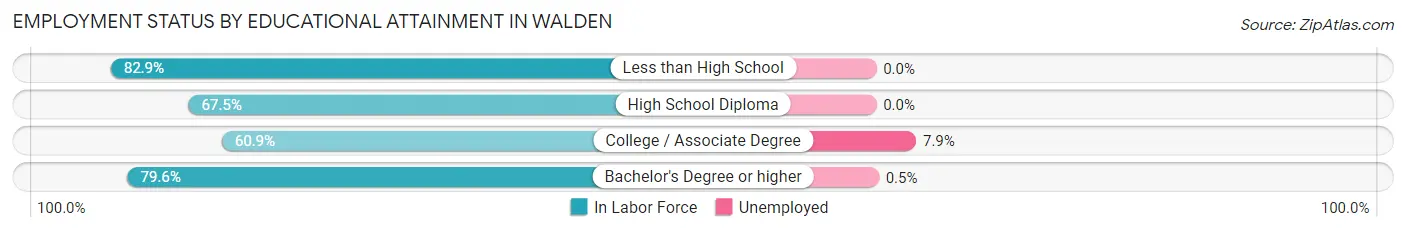
| Educational Attainment | In Labor Force | Unemployed |
| Less than High School | 325 (82.9%) | 0 (0.0%) |
| High School Diploma | 726 (67.5%) | 0 (0.0%) |
| College / Associate Degree | 758 (60.9%) | 98 (7.9%) |
| Bachelor's Degree or higher | 748 (79.6%) | 5 (0.5%) |
| Total | 2,556 (70.0%) | 91 (2.5%) |
Employment Occupations by Sex in Walden
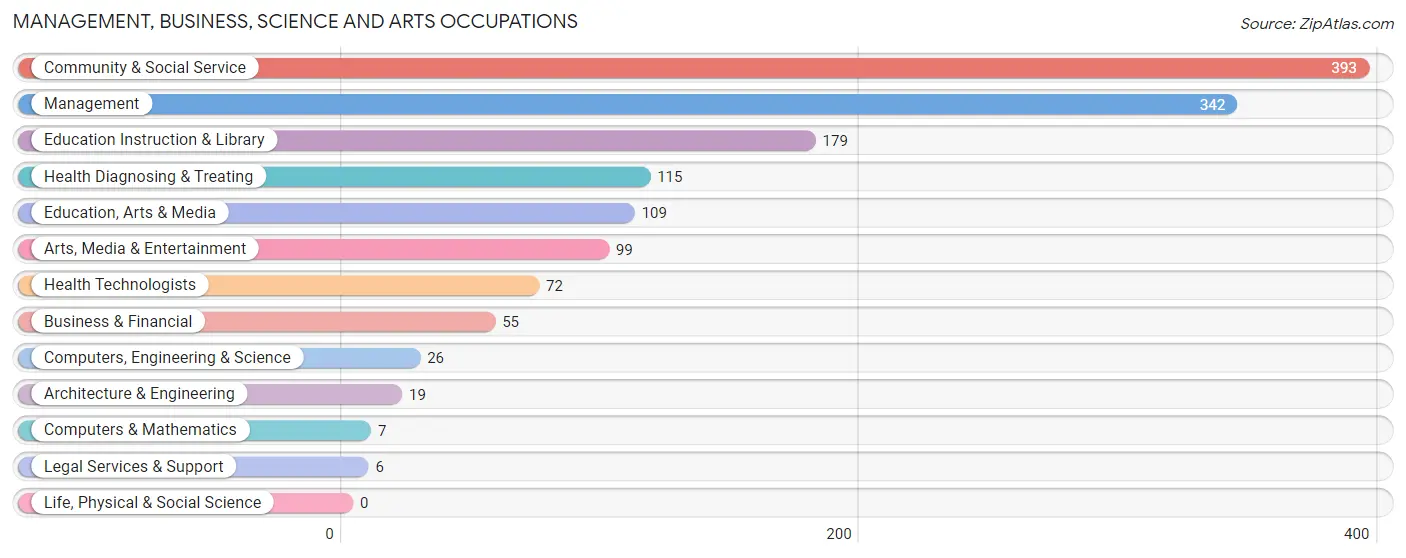
Management, Business, Science and Arts Occupations
The most common Management, Business, Science and Arts occupations in Walden are Community & Social Service (393 | 12.8%), Management (342 | 11.1%), Education Instruction & Library (179 | 5.8%), Health Diagnosing & Treating (115 | 3.7%), and Education, Arts & Media (109 | 3.5%).
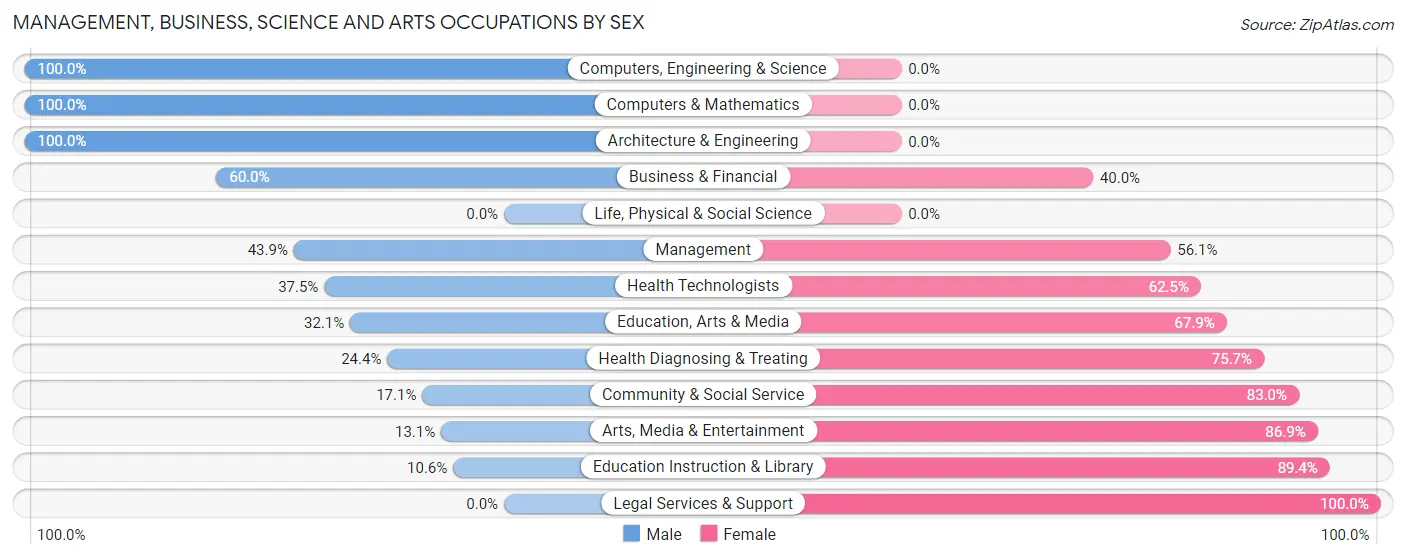
Management, Business, Science and Arts Occupations by Sex
Within the Management, Business, Science and Arts occupations in Walden, the most male-oriented occupations are Computers, Engineering & Science (100.0%), Computers & Mathematics (100.0%), and Architecture & Engineering (100.0%), while the most female-oriented occupations are Legal Services & Support (100.0%), Education Instruction & Library (89.4%), and Arts, Media & Entertainment (86.9%).
| Occupation | Male | Female |
| Management | 150 (43.9%) | 192 (56.1%) |
| Business & Financial | 33 (60.0%) | 22 (40.0%) |
| Computers, Engineering & Science | 26 (100.0%) | 0 (0.0%) |
| Computers & Mathematics | 7 (100.0%) | 0 (0.0%) |
| Architecture & Engineering | 19 (100.0%) | 0 (0.0%) |
| Life, Physical & Social Science | 0 (0.0%) | 0 (0.0%) |
| Community & Social Service | 67 (17.1%) | 326 (83.0%) |
| Education, Arts & Media | 35 (32.1%) | 74 (67.9%) |
| Legal Services & Support | 0 (0.0%) | 6 (100.0%) |
| Education Instruction & Library | 19 (10.6%) | 160 (89.4%) |
| Arts, Media & Entertainment | 13 (13.1%) | 86 (86.9%) |
| Health Diagnosing & Treating | 28 (24.3%) | 87 (75.6%) |
| Health Technologists | 27 (37.5%) | 45 (62.5%) |
| Total (Category) | 304 (32.7%) | 627 (67.3%) |
| Total (Overall) | 1,623 (52.7%) | 1,458 (47.3%) |
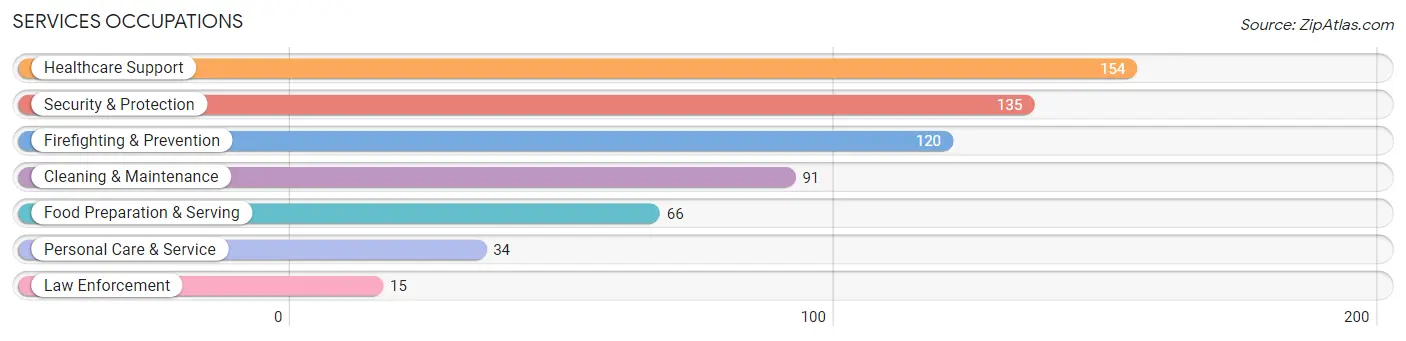
Services Occupations
The most common Services occupations in Walden are Healthcare Support (154 | 5.0%), Security & Protection (135 | 4.4%), Firefighting & Prevention (120 | 3.9%), Cleaning & Maintenance (91 | 2.9%), and Food Preparation & Serving (66 | 2.1%).
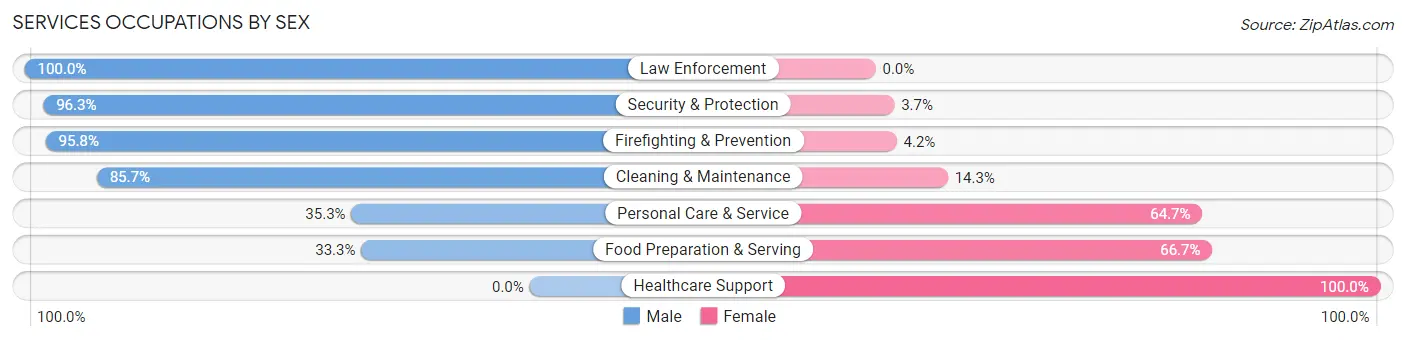
Services Occupations by Sex
Within the Services occupations in Walden, the most male-oriented occupations are Law Enforcement (100.0%), Security & Protection (96.3%), and Firefighting & Prevention (95.8%), while the most female-oriented occupations are Healthcare Support (100.0%), Food Preparation & Serving (66.7%), and Personal Care & Service (64.7%).
| Occupation | Male | Female |
| Healthcare Support | 0 (0.0%) | 154 (100.0%) |
| Security & Protection | 130 (96.3%) | 5 (3.7%) |
| Firefighting & Prevention | 115 (95.8%) | 5 (4.2%) |
| Law Enforcement | 15 (100.0%) | 0 (0.0%) |
| Food Preparation & Serving | 22 (33.3%) | 44 (66.7%) |
| Cleaning & Maintenance | 78 (85.7%) | 13 (14.3%) |
| Personal Care & Service | 12 (35.3%) | 22 (64.7%) |
| Total (Category) | 242 (50.4%) | 238 (49.6%) |
| Total (Overall) | 1,623 (52.7%) | 1,458 (47.3%) |
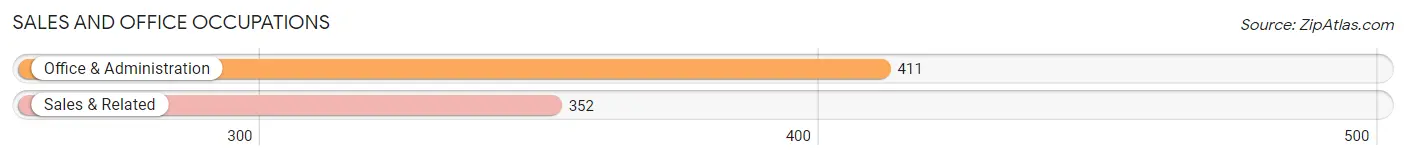
Sales and Office Occupations
The most common Sales and Office occupations in Walden are Office & Administration (411 | 13.3%), and Sales & Related (352 | 11.4%).
Sales and Office Occupations by Sex
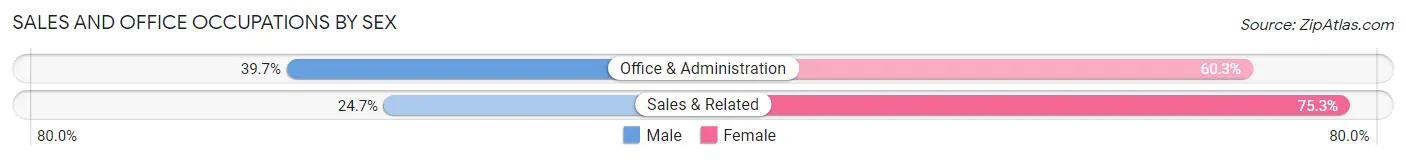
| Occupation | Male | Female |
| Sales & Related | 87 (24.7%) | 265 (75.3%) |
| Office & Administration | 163 (39.7%) | 248 (60.3%) |
| Total (Category) | 250 (32.8%) | 513 (67.2%) |
| Total (Overall) | 1,623 (52.7%) | 1,458 (47.3%) |
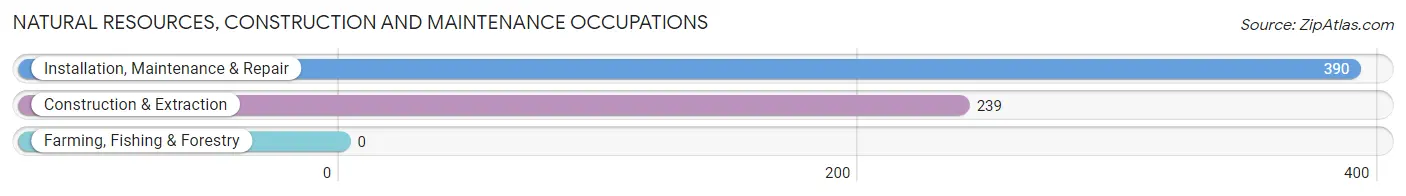
Natural Resources, Construction and Maintenance Occupations
The most common Natural Resources, Construction and Maintenance occupations in Walden are Installation, Maintenance & Repair (390 | 12.7%), and Construction & Extraction (239 | 7.8%).
Natural Resources, Construction and Maintenance Occupations by Sex
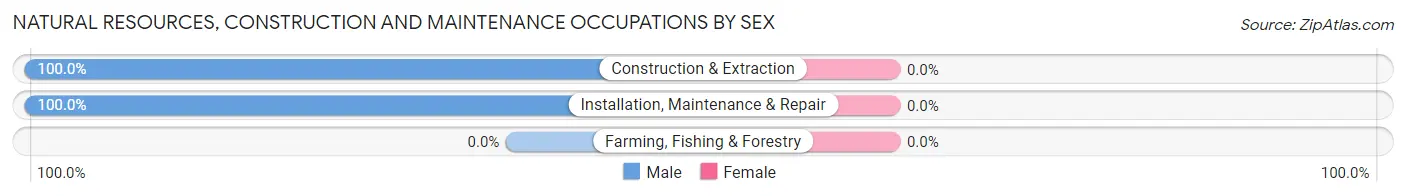
| Occupation | Male | Female |
| Farming, Fishing & Forestry | 0 (0.0%) | 0 (0.0%) |
| Construction & Extraction | 239 (100.0%) | 0 (0.0%) |
| Installation, Maintenance & Repair | 390 (100.0%) | 0 (0.0%) |
| Total (Category) | 629 (100.0%) | 0 (0.0%) |
| Total (Overall) | 1,623 (52.7%) | 1,458 (47.3%) |
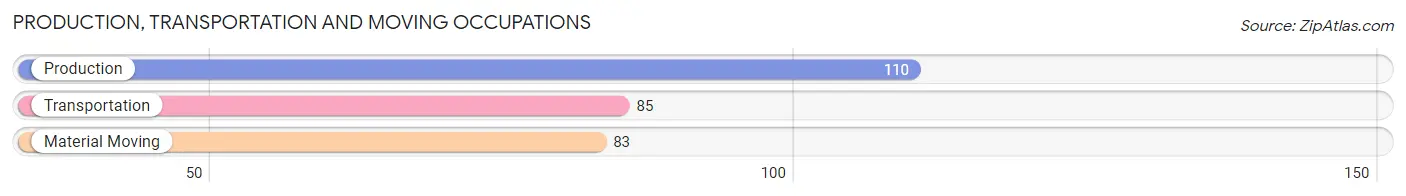
Production, Transportation and Moving Occupations
The most common Production, Transportation and Moving occupations in Walden are Production (110 | 3.6%), Transportation (85 | 2.8%), and Material Moving (83 | 2.7%).
Production, Transportation and Moving Occupations by Sex
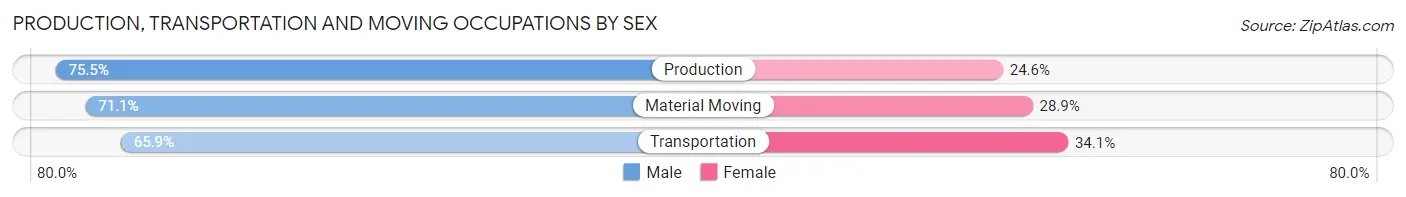
| Occupation | Male | Female |
| Production | 83 (75.4%) | 27 (24.5%) |
| Transportation | 56 (65.9%) | 29 (34.1%) |
| Material Moving | 59 (71.1%) | 24 (28.9%) |
| Total (Category) | 198 (71.2%) | 80 (28.8%) |
| Total (Overall) | 1,623 (52.7%) | 1,458 (47.3%) |
Employment Industries by Sex in Walden
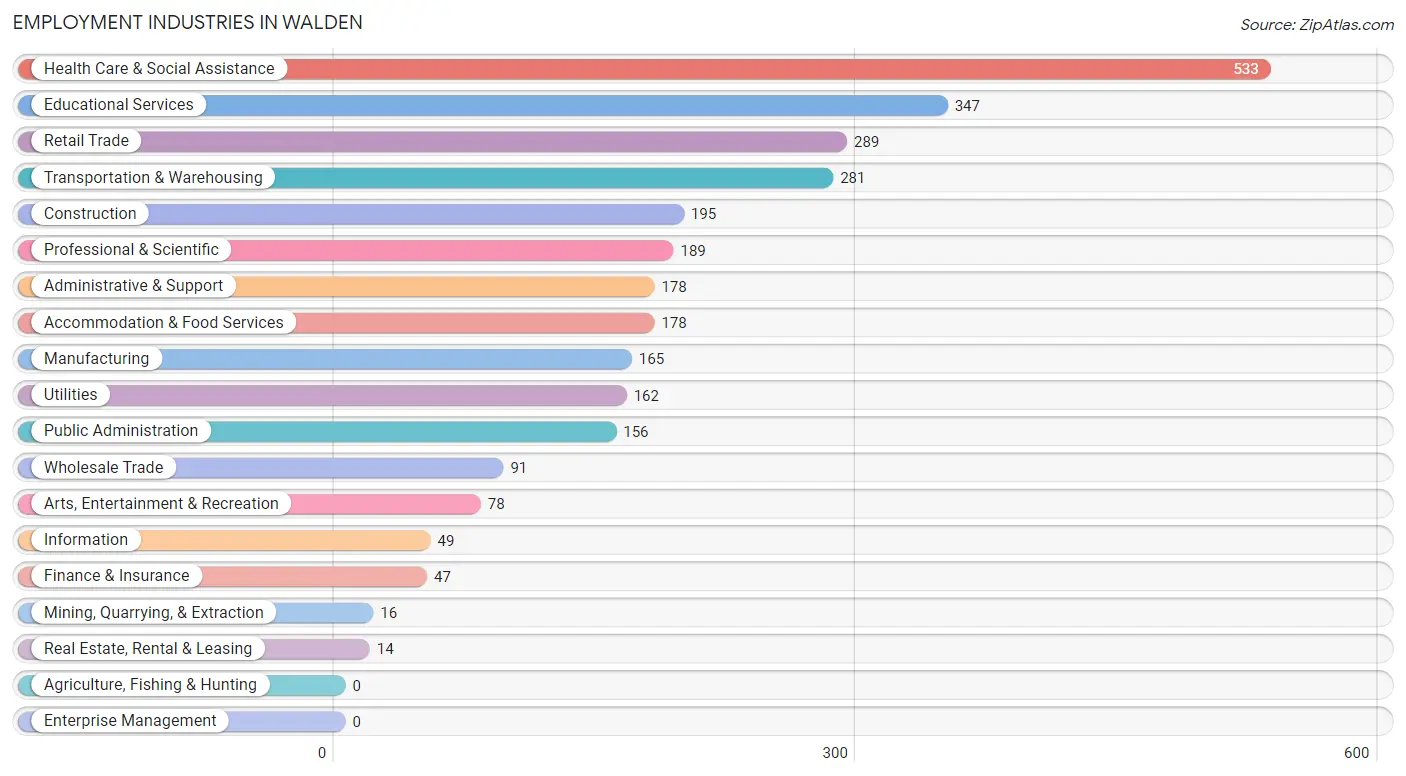
Employment Industries in Walden
The major employment industries in Walden include Health Care & Social Assistance (533 | 17.3%), Educational Services (347 | 11.3%), Retail Trade (289 | 9.4%), Transportation & Warehousing (281 | 9.1%), and Construction (195 | 6.3%).
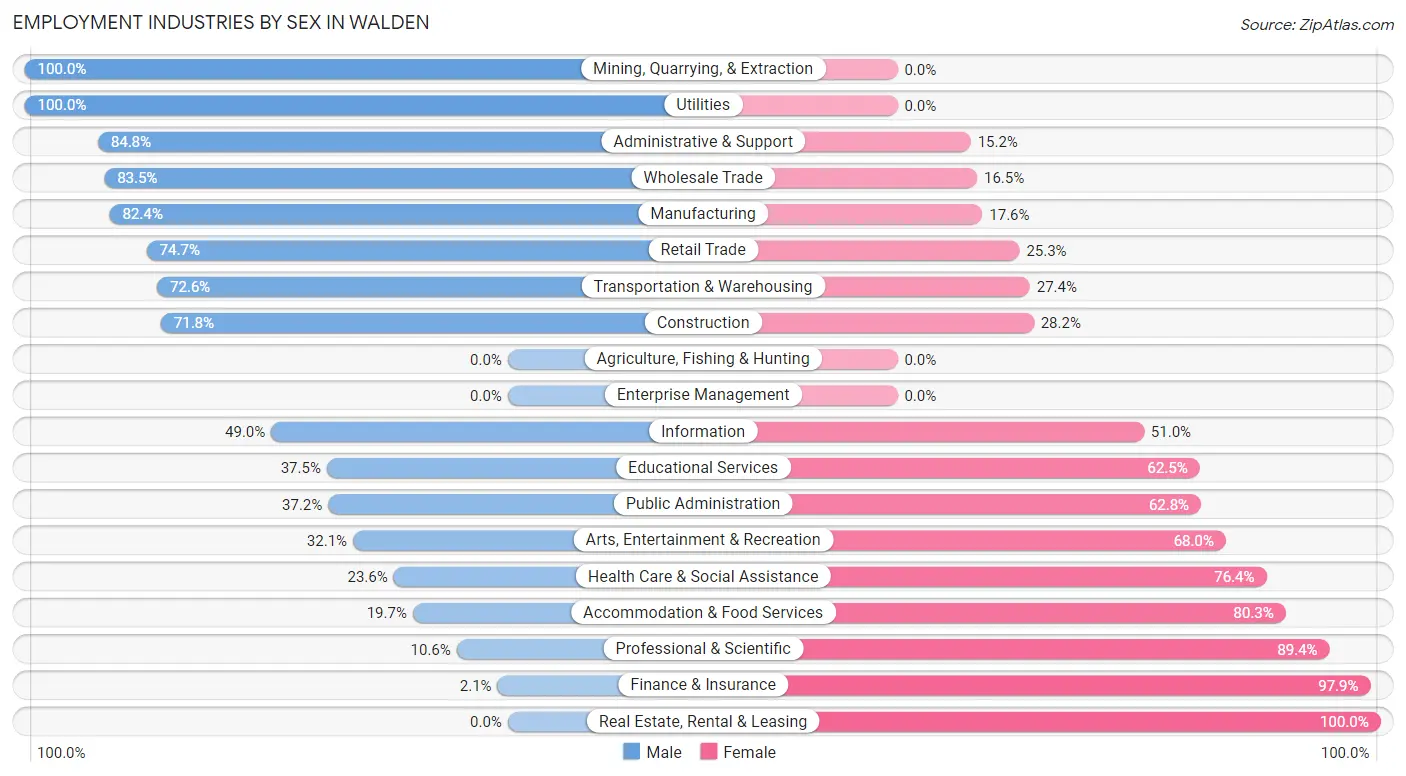
Employment Industries by Sex in Walden
The Walden industries that see more men than women are Mining, Quarrying, & Extraction (100.0%), Utilities (100.0%), and Administrative & Support (84.8%), whereas the industries that tend to have a higher number of women are Real Estate, Rental & Leasing (100.0%), Finance & Insurance (97.9%), and Professional & Scientific (89.4%).
| Industry | Male | Female |
| Agriculture, Fishing & Hunting | 0 (0.0%) | 0 (0.0%) |
| Mining, Quarrying, & Extraction | 16 (100.0%) | 0 (0.0%) |
| Construction | 140 (71.8%) | 55 (28.2%) |
| Manufacturing | 136 (82.4%) | 29 (17.6%) |
| Wholesale Trade | 76 (83.5%) | 15 (16.5%) |
| Retail Trade | 216 (74.7%) | 73 (25.3%) |
| Transportation & Warehousing | 204 (72.6%) | 77 (27.4%) |
| Utilities | 162 (100.0%) | 0 (0.0%) |
| Information | 24 (49.0%) | 25 (51.0%) |
| Finance & Insurance | 1 (2.1%) | 46 (97.9%) |
| Real Estate, Rental & Leasing | 0 (0.0%) | 14 (100.0%) |
| Professional & Scientific | 20 (10.6%) | 169 (89.4%) |
| Enterprise Management | 0 (0.0%) | 0 (0.0%) |
| Administrative & Support | 151 (84.8%) | 27 (15.2%) |
| Educational Services | 130 (37.5%) | 217 (62.5%) |
| Health Care & Social Assistance | 126 (23.6%) | 407 (76.4%) |
| Arts, Entertainment & Recreation | 25 (32.1%) | 53 (67.9%) |
| Accommodation & Food Services | 35 (19.7%) | 143 (80.3%) |
| Public Administration | 58 (37.2%) | 98 (62.8%) |
| Total | 1,623 (52.7%) | 1,458 (47.3%) |
Education in Walden
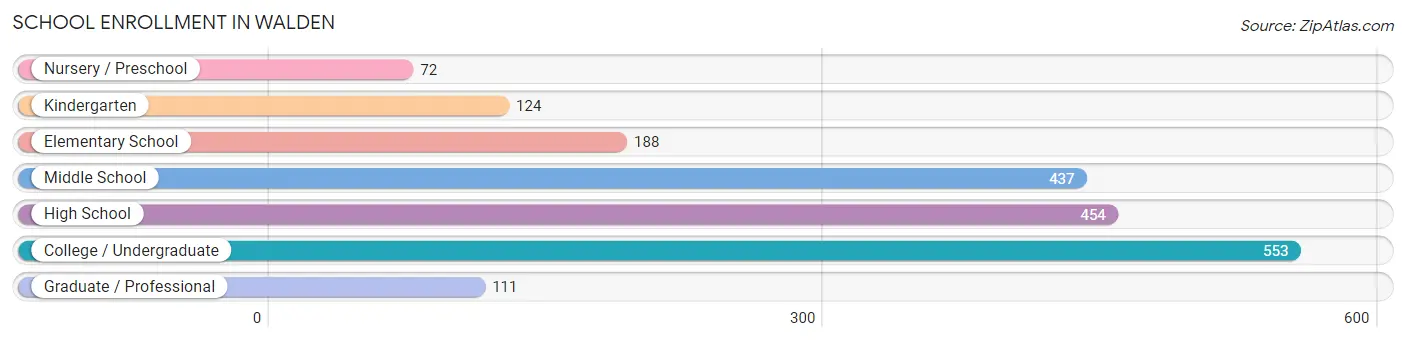
School Enrollment in Walden
The most common levels of schooling among the 1,939 students in Walden are college / undergraduate (553 | 28.5%), high school (454 | 23.4%), and middle school (437 | 22.5%).
| School Level | # Students | % Students |
| Nursery / Preschool | 72 | 3.7% |
| Kindergarten | 124 | 6.4% |
| Elementary School | 188 | 9.7% |
| Middle School | 437 | 22.5% |
| High School | 454 | 23.4% |
| College / Undergraduate | 553 | 28.5% |
| Graduate / Professional | 111 | 5.7% |
| Total | 1,939 | 100.0% |
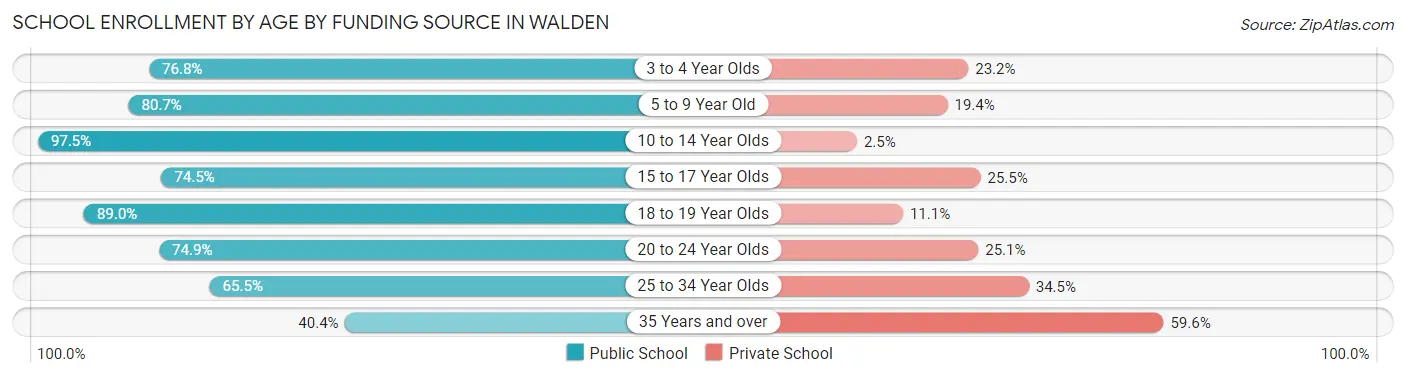
School Enrollment by Age by Funding Source in Walden
Out of a total of 1,939 students who are enrolled in schools in Walden, 372 (19.2%) attend a private institution, while the remaining 1,567 (80.8%) are enrolled in public schools. The age group of 35 years and over has the highest likelihood of being enrolled in private schools, with 84 (59.6% in the age bracket) enrolled. Conversely, the age group of 10 to 14 year olds has the lowest likelihood of being enrolled in a private school, with 551 (97.5% in the age bracket) attending a public institution.
| Age Bracket | Public School | Private School |
| 3 to 4 Year Olds | 43 (76.8%) | 13 (23.2%) |
| 5 to 9 Year Old | 200 (80.6%) | 48 (19.4%) |
| 10 to 14 Year Olds | 551 (97.5%) | 14 (2.5%) |
| 15 to 17 Year Olds | 266 (74.5%) | 91 (25.5%) |
| 18 to 19 Year Olds | 153 (88.9%) | 19 (11.1%) |
| 20 to 24 Year Olds | 278 (74.9%) | 93 (25.1%) |
| 25 to 34 Year Olds | 19 (65.5%) | 10 (34.5%) |
| 35 Years and over | 57 (40.4%) | 84 (59.6%) |
| Total | 1,567 (80.8%) | 372 (19.2%) |
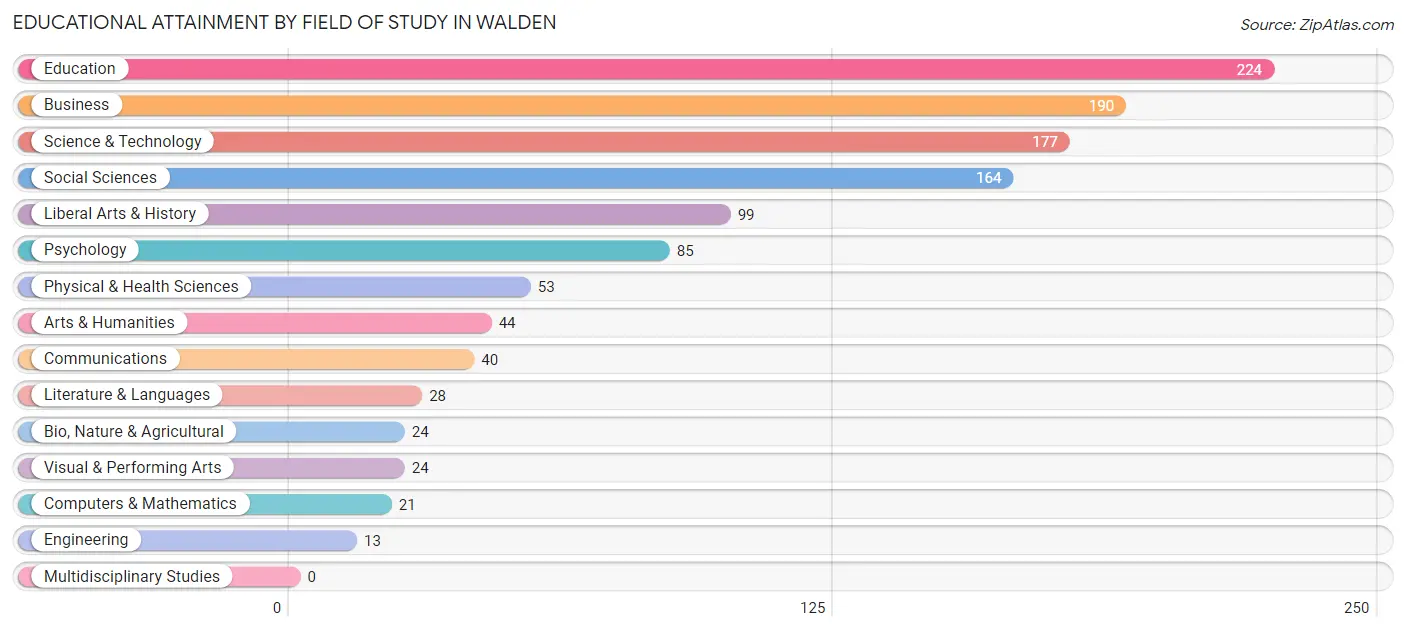
Educational Attainment by Field of Study in Walden
Education (224 | 18.9%), business (190 | 16.0%), science & technology (177 | 14.9%), social sciences (164 | 13.8%), and liberal arts & history (99 | 8.4%) are the most common fields of study among 1,186 individuals in Walden who have obtained a bachelor's degree or higher.
| Field of Study | # Graduates | % Graduates |
| Computers & Mathematics | 21 | 1.8% |
| Bio, Nature & Agricultural | 24 | 2.0% |
| Physical & Health Sciences | 53 | 4.5% |
| Psychology | 85 | 7.2% |
| Social Sciences | 164 | 13.8% |
| Engineering | 13 | 1.1% |
| Multidisciplinary Studies | 0 | 0.0% |
| Science & Technology | 177 | 14.9% |
| Business | 190 | 16.0% |
| Education | 224 | 18.9% |
| Literature & Languages | 28 | 2.4% |
| Liberal Arts & History | 99 | 8.4% |
| Visual & Performing Arts | 24 | 2.0% |
| Communications | 40 | 3.4% |
| Arts & Humanities | 44 | 3.7% |
| Total | 1,186 | 100.0% |
Transportation & Commute in Walden
Vehicle Availability by Sex in Walden
The most prevalent vehicle ownership categories in Walden are males with 2 vehicles (819, accounting for 50.6%) and females with 2 vehicles (540, making up 57.8%).
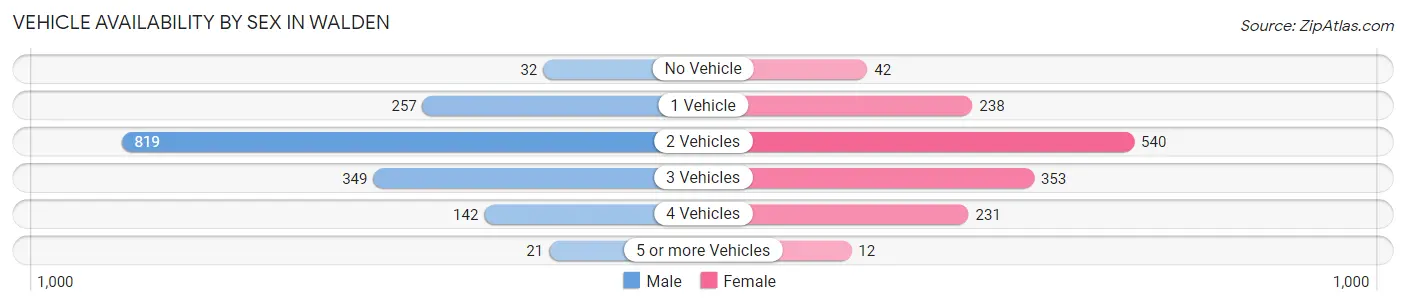
| Vehicles Available | Male | Female |
| No Vehicle | 32 (2.0%) | 42 (3.0%) |
| 1 Vehicle | 257 (15.9%) | 238 (16.8%) |
| 2 Vehicles | 819 (50.6%) | 540 (38.1%) |
| 3 Vehicles | 349 (21.5%) | 353 (24.9%) |
| 4 Vehicles | 142 (8.8%) | 231 (16.3%) |
| 5 or more Vehicles | 21 (1.3%) | 12 (0.9%) |
| Total | 1,620 (100.0%) | 1,416 (100.0%) |
Commute Time in Walden
The most frequently occuring commute durations in Walden are 15 to 19 minutes (506 commuters, 19.4%), 20 to 24 minutes (382 commuters, 14.6%), and 25 to 29 minutes (358 commuters, 13.7%).
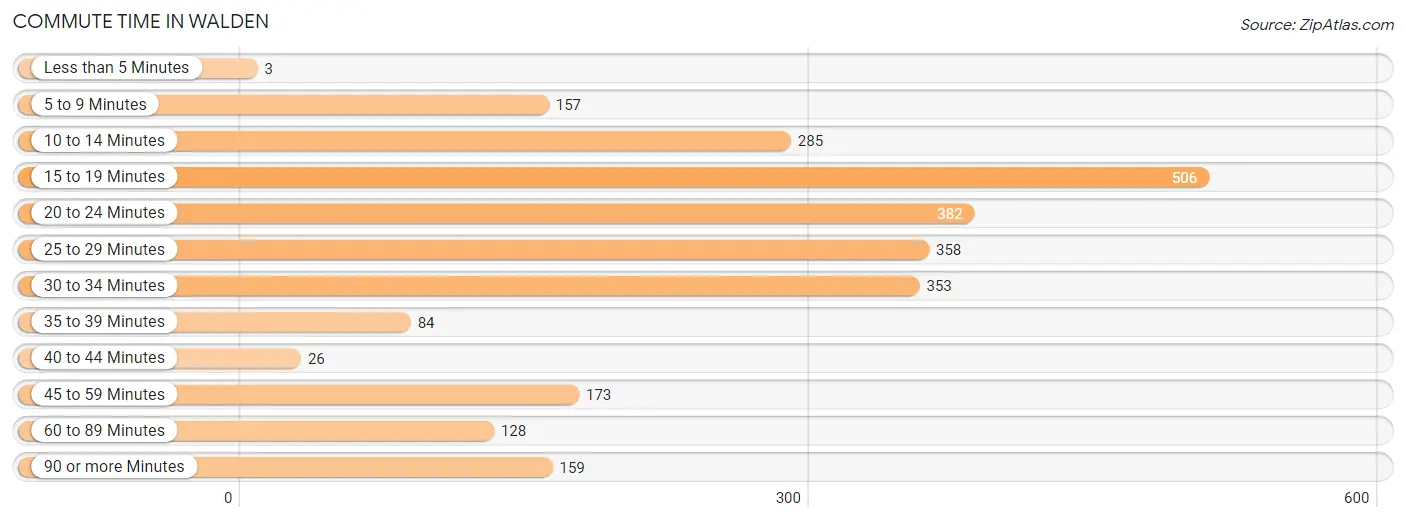
| Commute Time | # Commuters | % Commuters |
| Less than 5 Minutes | 3 | 0.1% |
| 5 to 9 Minutes | 157 | 6.0% |
| 10 to 14 Minutes | 285 | 10.9% |
| 15 to 19 Minutes | 506 | 19.4% |
| 20 to 24 Minutes | 382 | 14.6% |
| 25 to 29 Minutes | 358 | 13.7% |
| 30 to 34 Minutes | 353 | 13.5% |
| 35 to 39 Minutes | 84 | 3.2% |
| 40 to 44 Minutes | 26 | 1.0% |
| 45 to 59 Minutes | 173 | 6.6% |
| 60 to 89 Minutes | 128 | 4.9% |
| 90 or more Minutes | 159 | 6.1% |
Commute Time by Sex in Walden
The most common commute times in Walden are 25 to 29 minutes (246 commuters, 17.0%) for males and 15 to 19 minutes (278 commuters, 23.8%) for females.
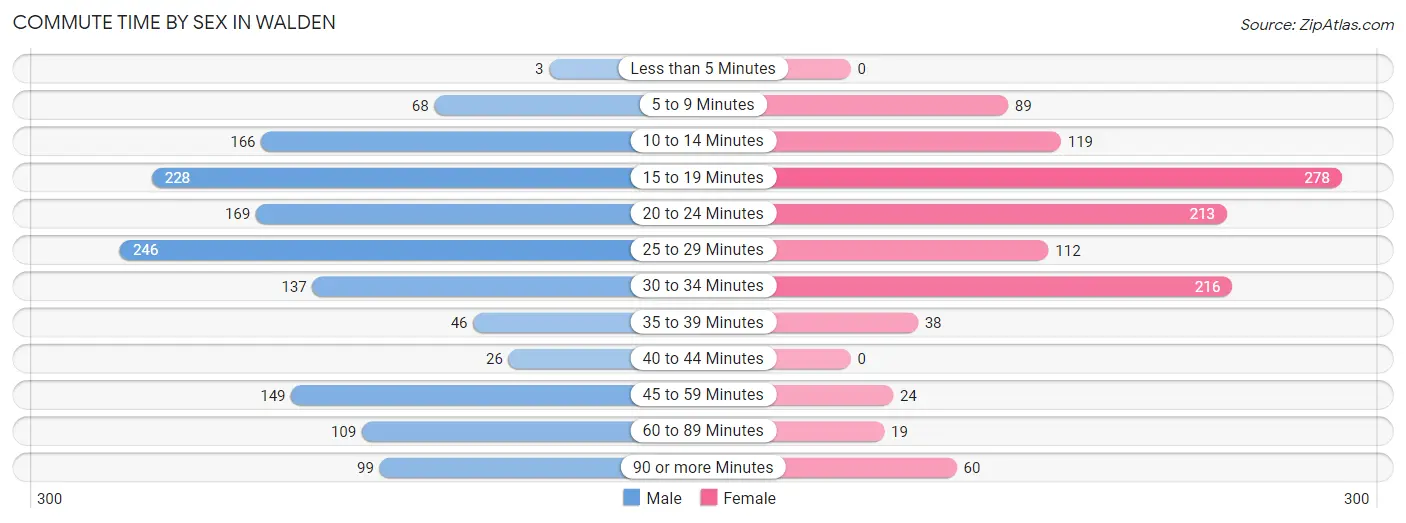
| Commute Time | Male | Female |
| Less than 5 Minutes | 3 (0.2%) | 0 (0.0%) |
| 5 to 9 Minutes | 68 (4.7%) | 89 (7.6%) |
| 10 to 14 Minutes | 166 (11.5%) | 119 (10.2%) |
| 15 to 19 Minutes | 228 (15.8%) | 278 (23.8%) |
| 20 to 24 Minutes | 169 (11.7%) | 213 (18.2%) |
| 25 to 29 Minutes | 246 (17.0%) | 112 (9.6%) |
| 30 to 34 Minutes | 137 (9.5%) | 216 (18.5%) |
| 35 to 39 Minutes | 46 (3.2%) | 38 (3.3%) |
| 40 to 44 Minutes | 26 (1.8%) | 0 (0.0%) |
| 45 to 59 Minutes | 149 (10.3%) | 24 (2.1%) |
| 60 to 89 Minutes | 109 (7.5%) | 19 (1.6%) |
| 90 or more Minutes | 99 (6.9%) | 60 (5.1%) |
Time of Departure to Work by Sex in Walden
The most frequent times of departure to work in Walden are 7:00 AM to 7:29 AM (325, 22.5%) for males and 7:00 AM to 7:29 AM (333, 28.5%) for females.
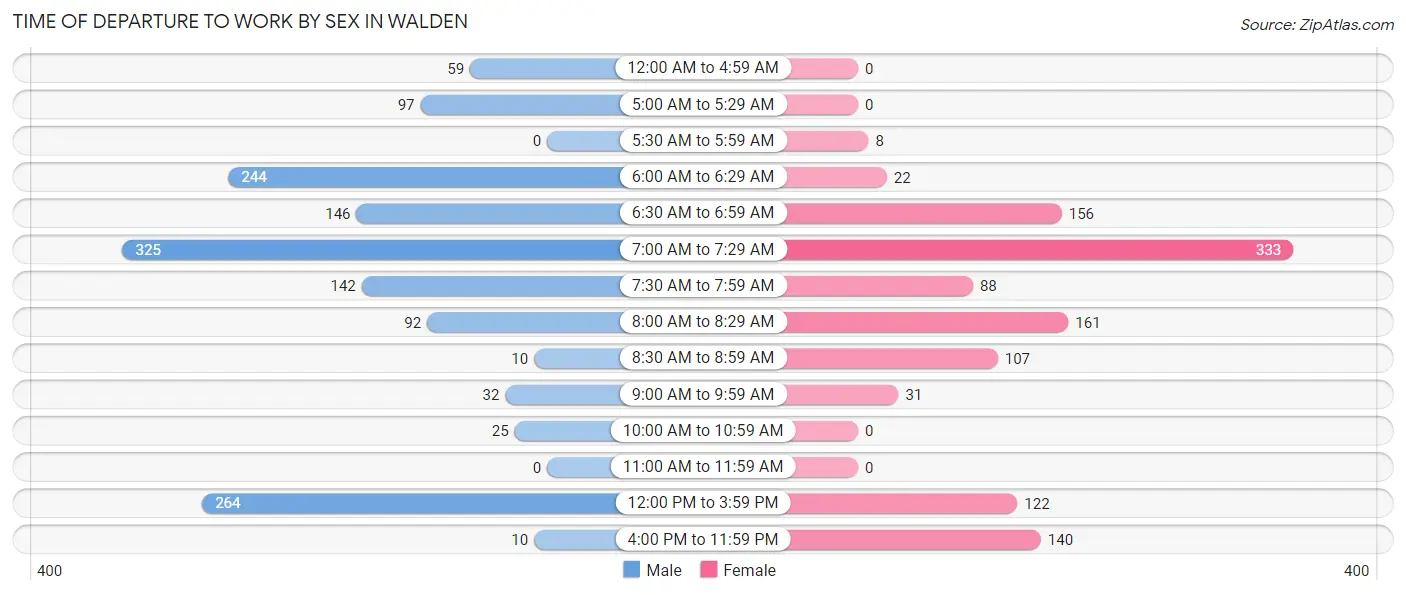
| Time of Departure | Male | Female |
| 12:00 AM to 4:59 AM | 59 (4.1%) | 0 (0.0%) |
| 5:00 AM to 5:29 AM | 97 (6.7%) | 0 (0.0%) |
| 5:30 AM to 5:59 AM | 0 (0.0%) | 8 (0.7%) |
| 6:00 AM to 6:29 AM | 244 (16.9%) | 22 (1.9%) |
| 6:30 AM to 6:59 AM | 146 (10.1%) | 156 (13.4%) |
| 7:00 AM to 7:29 AM | 325 (22.5%) | 333 (28.5%) |
| 7:30 AM to 7:59 AM | 142 (9.8%) | 88 (7.5%) |
| 8:00 AM to 8:29 AM | 92 (6.4%) | 161 (13.8%) |
| 8:30 AM to 8:59 AM | 10 (0.7%) | 107 (9.2%) |
| 9:00 AM to 9:59 AM | 32 (2.2%) | 31 (2.6%) |
| 10:00 AM to 10:59 AM | 25 (1.7%) | 0 (0.0%) |
| 11:00 AM to 11:59 AM | 0 (0.0%) | 0 (0.0%) |
| 12:00 PM to 3:59 PM | 264 (18.3%) | 122 (10.4%) |
| 4:00 PM to 11:59 PM | 10 (0.7%) | 140 (12.0%) |
| Total | 1,446 (100.0%) | 1,168 (100.0%) |
Housing Occupancy in Walden
Occupancy by Ownership in Walden
Of the total 2,734 dwellings in Walden, owner-occupied units account for 1,726 (63.1%), while renter-occupied units make up 1,008 (36.9%).
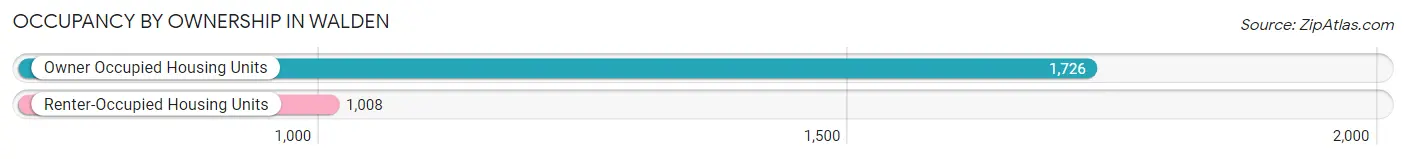
| Occupancy | # Housing Units | % Housing Units |
| Owner Occupied Housing Units | 1,726 | 63.1% |
| Renter-Occupied Housing Units | 1,008 | 36.9% |
| Total Occupied Housing Units | 2,734 | 100.0% |
Occupancy by Household Size in Walden
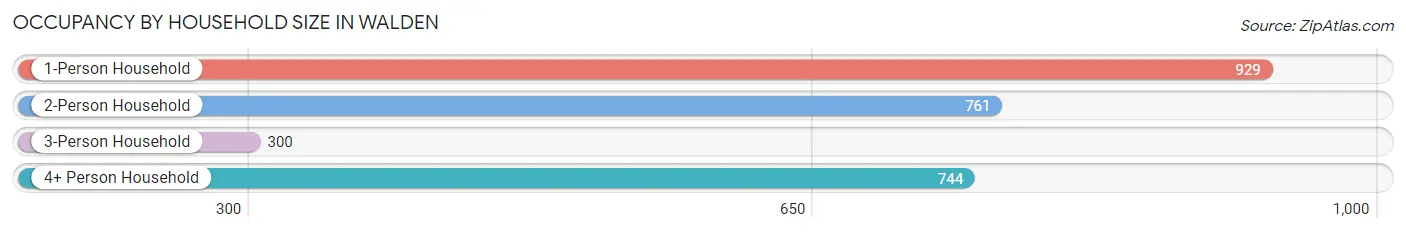
| Household Size | # Housing Units | % Housing Units |
| 1-Person Household | 929 | 34.0% |
| 2-Person Household | 761 | 27.8% |
| 3-Person Household | 300 | 11.0% |
| 4+ Person Household | 744 | 27.2% |
| Total Housing Units | 2,734 | 100.0% |
Occupancy by Ownership by Household Size in Walden
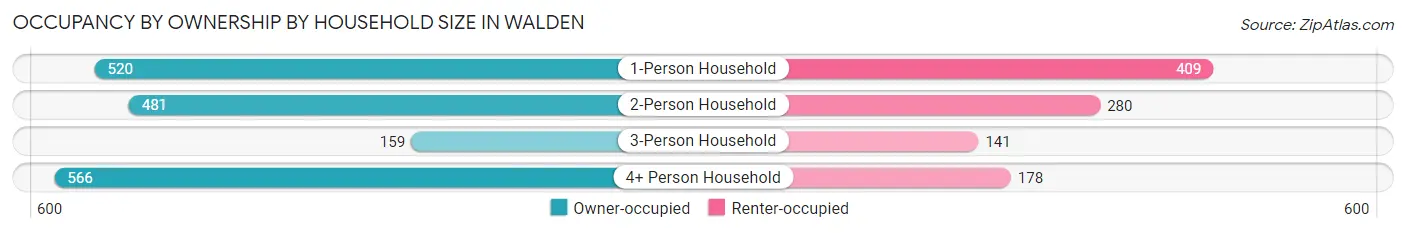
| Household Size | Owner-occupied | Renter-occupied |
| 1-Person Household | 520 (56.0%) | 409 (44.0%) |
| 2-Person Household | 481 (63.2%) | 280 (36.8%) |
| 3-Person Household | 159 (53.0%) | 141 (47.0%) |
| 4+ Person Household | 566 (76.1%) | 178 (23.9%) |
| Total Housing Units | 1,726 (63.1%) | 1,008 (36.9%) |
Occupancy by Educational Attainment in Walden
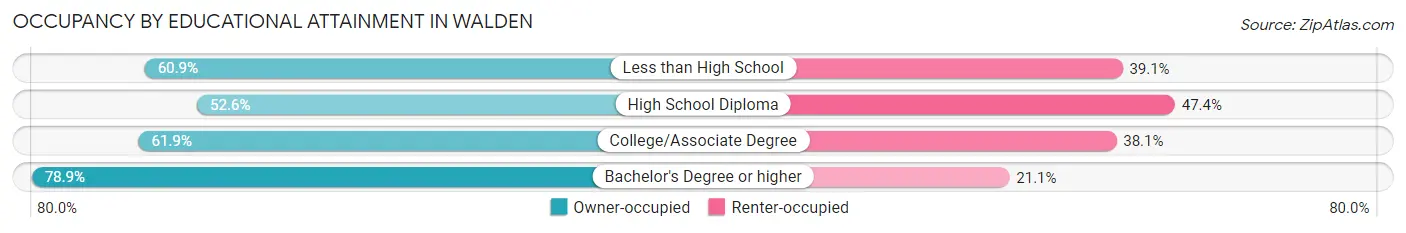
| Household Size | Owner-occupied | Renter-occupied |
| Less than High School | 181 (60.9%) | 116 (39.1%) |
| High School Diploma | 441 (52.6%) | 397 (47.4%) |
| College/Associate Degree | 574 (61.9%) | 353 (38.1%) |
| Bachelor's Degree or higher | 530 (78.9%) | 142 (21.1%) |
Occupancy by Age of Householder in Walden
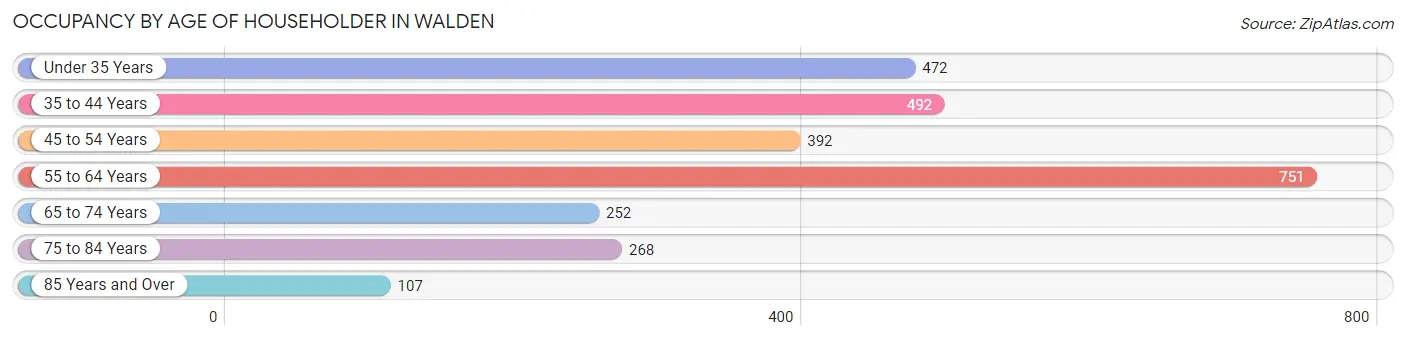
| Age Bracket | # Households | % Households |
| Under 35 Years | 472 | 17.3% |
| 35 to 44 Years | 492 | 18.0% |
| 45 to 54 Years | 392 | 14.3% |
| 55 to 64 Years | 751 | 27.5% |
| 65 to 74 Years | 252 | 9.2% |
| 75 to 84 Years | 268 | 9.8% |
| 85 Years and Over | 107 | 3.9% |
| Total | 2,734 | 100.0% |
Housing Finances in Walden
Median Income by Occupancy in Walden
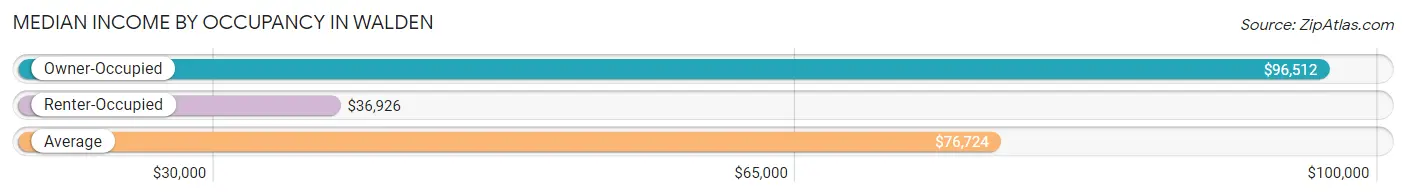
| Occupancy Type | # Households | Median Income |
| Owner-Occupied | 1,726 (63.1%) | $96,512 |
| Renter-Occupied | 1,008 (36.9%) | $36,926 |
| Average | 2,734 (100.0%) | $76,724 |
Occupancy by Householder Income Bracket in Walden
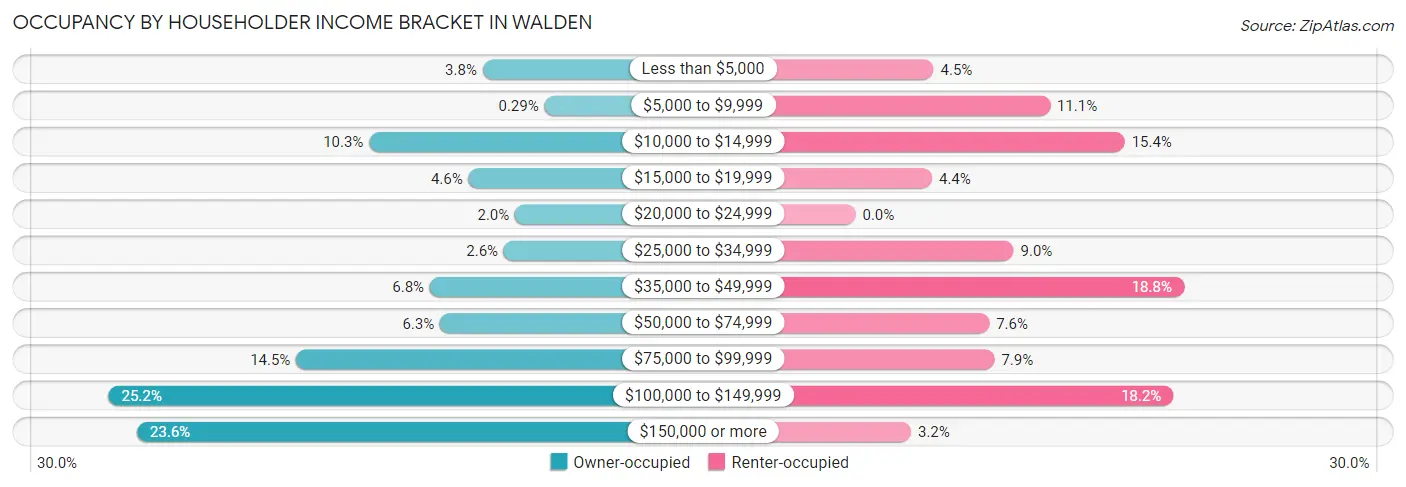
| Income Bracket | Owner-occupied | Renter-occupied |
| Less than $5,000 | 66 (3.8%) | 45 (4.5%) |
| $5,000 to $9,999 | 5 (0.3%) | 112 (11.1%) |
| $10,000 to $14,999 | 178 (10.3%) | 155 (15.4%) |
| $15,000 to $19,999 | 80 (4.6%) | 44 (4.4%) |
| $20,000 to $24,999 | 34 (2.0%) | 0 (0.0%) |
| $25,000 to $34,999 | 45 (2.6%) | 91 (9.0%) |
| $35,000 to $49,999 | 118 (6.8%) | 189 (18.8%) |
| $50,000 to $74,999 | 108 (6.3%) | 77 (7.6%) |
| $75,000 to $99,999 | 250 (14.5%) | 80 (7.9%) |
| $100,000 to $149,999 | 435 (25.2%) | 183 (18.1%) |
| $150,000 or more | 407 (23.6%) | 32 (3.2%) |
| Total | 1,726 (100.0%) | 1,008 (100.0%) |
Monthly Housing Cost Tiers in Walden
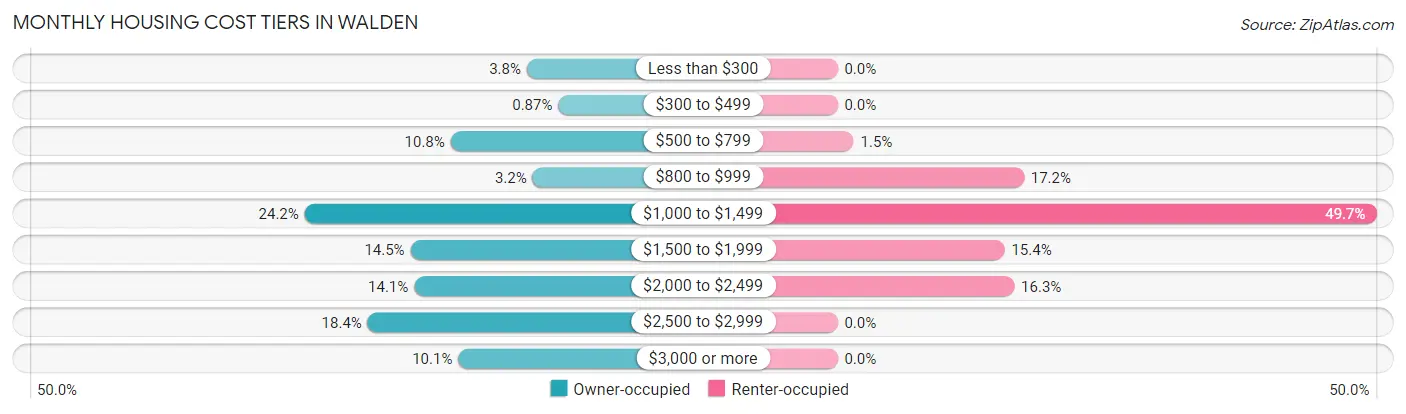
| Monthly Cost | Owner-occupied | Renter-occupied |
| Less than $300 | 65 (3.8%) | 0 (0.0%) |
| $300 to $499 | 15 (0.9%) | 0 (0.0%) |
| $500 to $799 | 186 (10.8%) | 15 (1.5%) |
| $800 to $999 | 56 (3.2%) | 173 (17.2%) |
| $1,000 to $1,499 | 418 (24.2%) | 501 (49.7%) |
| $1,500 to $1,999 | 250 (14.5%) | 155 (15.4%) |
| $2,000 to $2,499 | 244 (14.1%) | 164 (16.3%) |
| $2,500 to $2,999 | 318 (18.4%) | 0 (0.0%) |
| $3,000 or more | 174 (10.1%) | 0 (0.0%) |
| Total | 1,726 (100.0%) | 1,008 (100.0%) |
Physical Housing Characteristics in Walden
Housing Structures in Walden
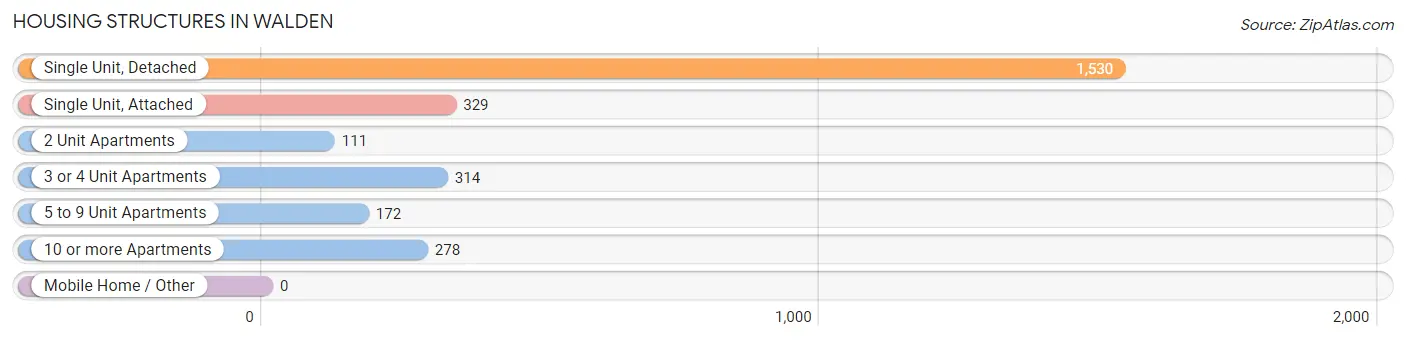
| Structure Type | # Housing Units | % Housing Units |
| Single Unit, Detached | 1,530 | 56.0% |
| Single Unit, Attached | 329 | 12.0% |
| 2 Unit Apartments | 111 | 4.1% |
| 3 or 4 Unit Apartments | 314 | 11.5% |
| 5 to 9 Unit Apartments | 172 | 6.3% |
| 10 or more Apartments | 278 | 10.2% |
| Mobile Home / Other | 0 | 0.0% |
| Total | 2,734 | 100.0% |
Housing Structures by Occupancy in Walden
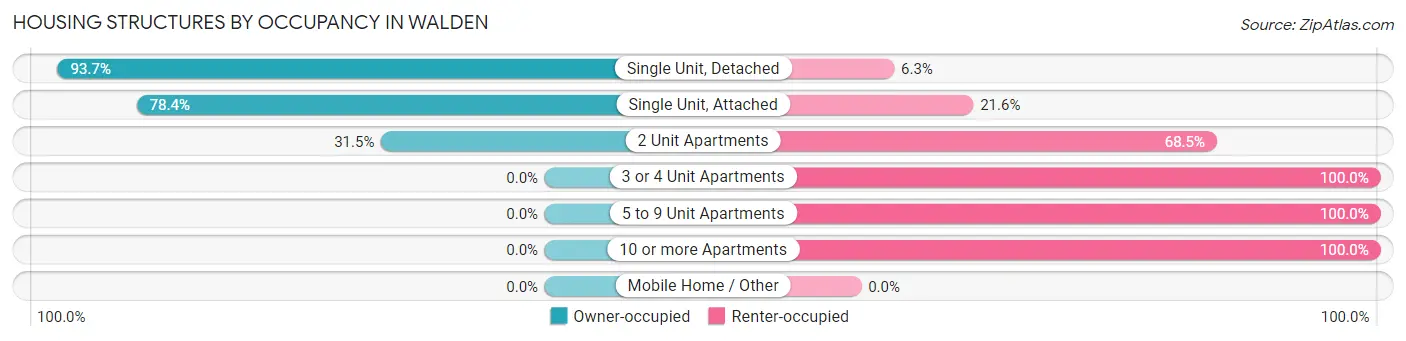
| Structure Type | Owner-occupied | Renter-occupied |
| Single Unit, Detached | 1,433 (93.7%) | 97 (6.3%) |
| Single Unit, Attached | 258 (78.4%) | 71 (21.6%) |
| 2 Unit Apartments | 35 (31.5%) | 76 (68.5%) |
| 3 or 4 Unit Apartments | 0 (0.0%) | 314 (100.0%) |
| 5 to 9 Unit Apartments | 0 (0.0%) | 172 (100.0%) |
| 10 or more Apartments | 0 (0.0%) | 278 (100.0%) |
| Mobile Home / Other | 0 (0.0%) | 0 (0.0%) |
| Total | 1,726 (63.1%) | 1,008 (36.9%) |
Housing Structures by Number of Rooms in Walden
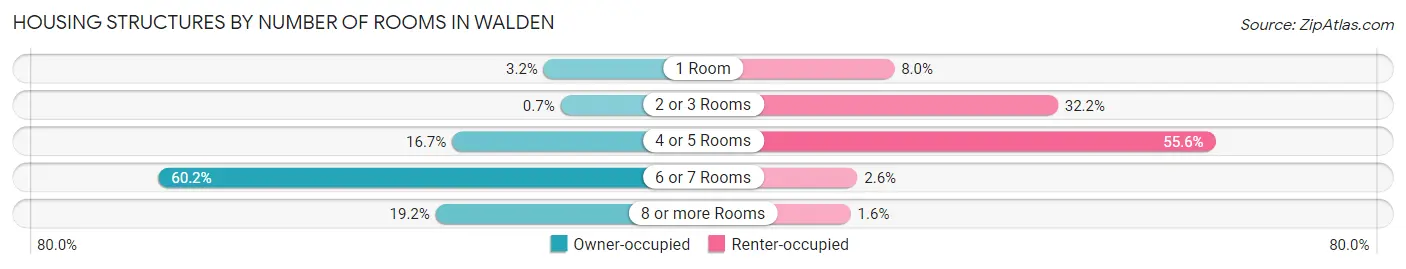
| Number of Rooms | Owner-occupied | Renter-occupied |
| 1 Room | 55 (3.2%) | 81 (8.0%) |
| 2 or 3 Rooms | 12 (0.7%) | 325 (32.2%) |
| 4 or 5 Rooms | 289 (16.7%) | 560 (55.6%) |
| 6 or 7 Rooms | 1,039 (60.2%) | 26 (2.6%) |
| 8 or more Rooms | 331 (19.2%) | 16 (1.6%) |
| Total | 1,726 (100.0%) | 1,008 (100.0%) |
Housing Structure by Heating Type in Walden
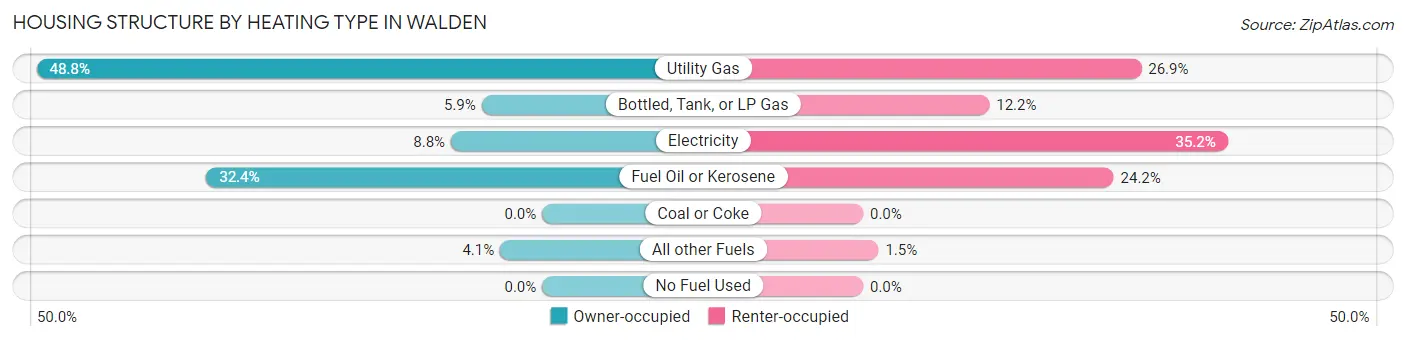
| Heating Type | Owner-occupied | Renter-occupied |
| Utility Gas | 843 (48.8%) | 271 (26.9%) |
| Bottled, Tank, or LP Gas | 101 (5.9%) | 123 (12.2%) |
| Electricity | 152 (8.8%) | 355 (35.2%) |
| Fuel Oil or Kerosene | 560 (32.4%) | 244 (24.2%) |
| Coal or Coke | 0 (0.0%) | 0 (0.0%) |
| All other Fuels | 70 (4.1%) | 15 (1.5%) |
| No Fuel Used | 0 (0.0%) | 0 (0.0%) |
| Total | 1,726 (100.0%) | 1,008 (100.0%) |
Household Vehicle Usage in Walden
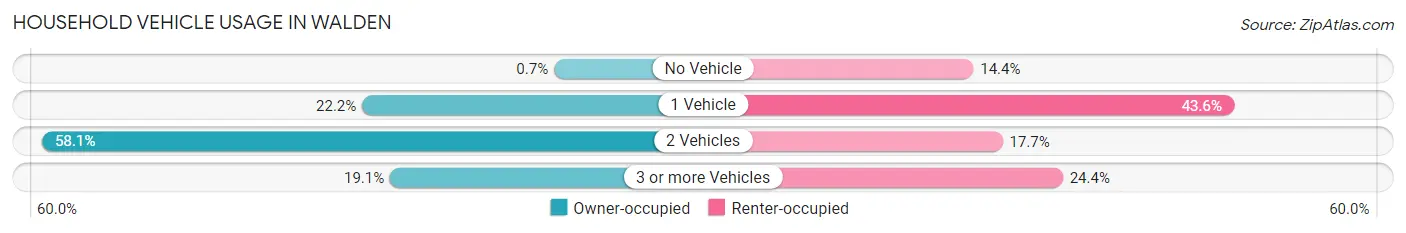
| Vehicles per Household | Owner-occupied | Renter-occupied |
| No Vehicle | 12 (0.7%) | 145 (14.4%) |
| 1 Vehicle | 383 (22.2%) | 439 (43.5%) |
| 2 Vehicles | 1,002 (58.1%) | 178 (17.7%) |
| 3 or more Vehicles | 329 (19.1%) | 246 (24.4%) |
| Total | 1,726 (100.0%) | 1,008 (100.0%) |
Real Estate & Mortgages in Walden
Real Estate and Mortgage Overview in Walden
| Characteristic | Without Mortgage | With Mortgage |
| Housing Units | 670 | 1,056 |
| Median Property Value | $280,100 | $322,100 |
| Median Household Income | - | - |
| Monthly Housing Costs | $1,053 | $174 |
| Real Estate Taxes | $9,157 | $0 |
Property Value by Mortgage Status in Walden
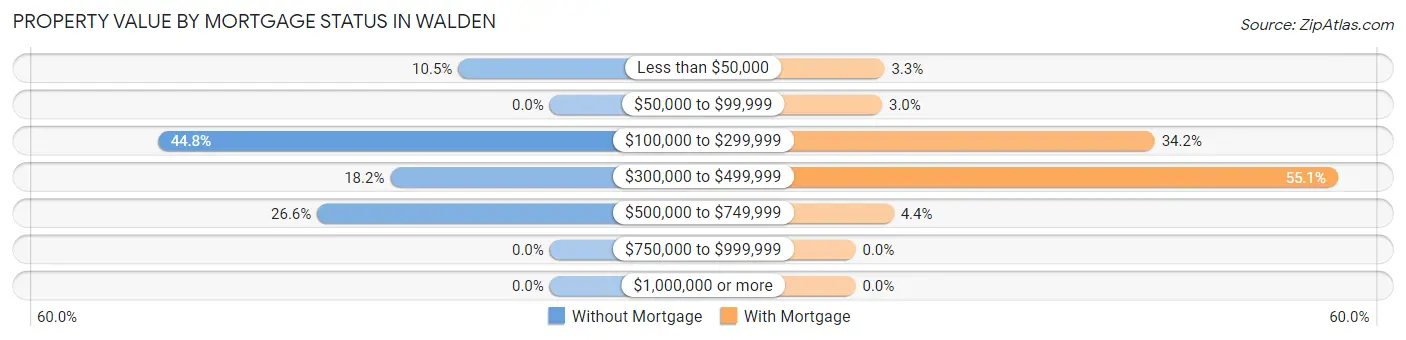
| Property Value | Without Mortgage | With Mortgage |
| Less than $50,000 | 70 (10.4%) | 35 (3.3%) |
| $50,000 to $99,999 | 0 (0.0%) | 32 (3.0%) |
| $100,000 to $299,999 | 300 (44.8%) | 361 (34.2%) |
| $300,000 to $499,999 | 122 (18.2%) | 582 (55.1%) |
| $500,000 to $749,999 | 178 (26.6%) | 46 (4.4%) |
| $750,000 to $999,999 | 0 (0.0%) | 0 (0.0%) |
| $1,000,000 or more | 0 (0.0%) | 0 (0.0%) |
| Total | 670 (100.0%) | 1,056 (100.0%) |
Household Income by Mortgage Status in Walden
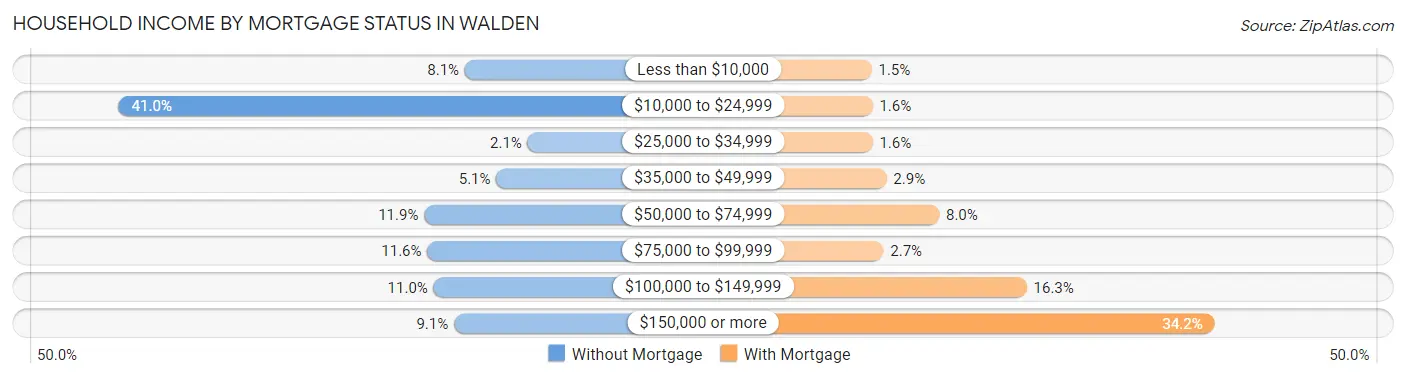
| Household Income | Without Mortgage | With Mortgage |
| Less than $10,000 | 54 (8.1%) | 16 (1.5%) |
| $10,000 to $24,999 | 275 (41.0%) | 17 (1.6%) |
| $25,000 to $34,999 | 14 (2.1%) | 17 (1.6%) |
| $35,000 to $49,999 | 34 (5.1%) | 31 (2.9%) |
| $50,000 to $74,999 | 80 (11.9%) | 84 (8.0%) |
| $75,000 to $99,999 | 78 (11.6%) | 28 (2.6%) |
| $100,000 to $149,999 | 74 (11.0%) | 172 (16.3%) |
| $150,000 or more | 61 (9.1%) | 361 (34.2%) |
| Total | 670 (100.0%) | 1,056 (100.0%) |
Property Value to Household Income Ratio in Walden
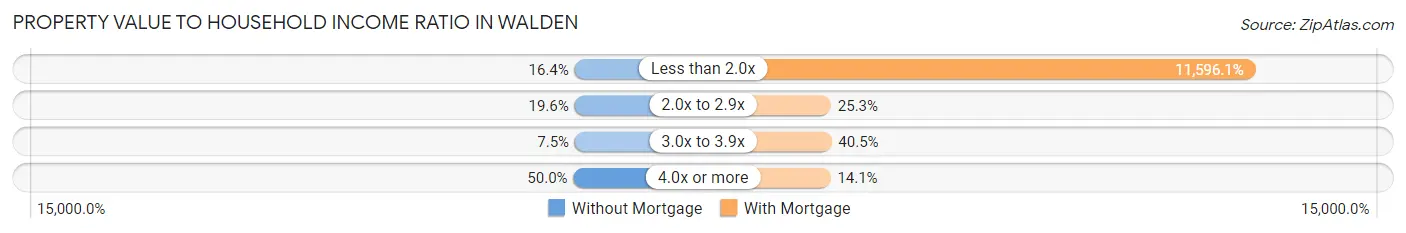
| Value-to-Income Ratio | Without Mortgage | With Mortgage |
| Less than 2.0x | 110 (16.4%) | 122,455 (11,596.1%) |
| 2.0x to 2.9x | 131 (19.6%) | 267 (25.3%) |
| 3.0x to 3.9x | 50 (7.5%) | 428 (40.5%) |
| 4.0x or more | 335 (50.0%) | 149 (14.1%) |
| Total | 670 (100.0%) | 1,056 (100.0%) |
Real Estate Taxes by Mortgage Status in Walden
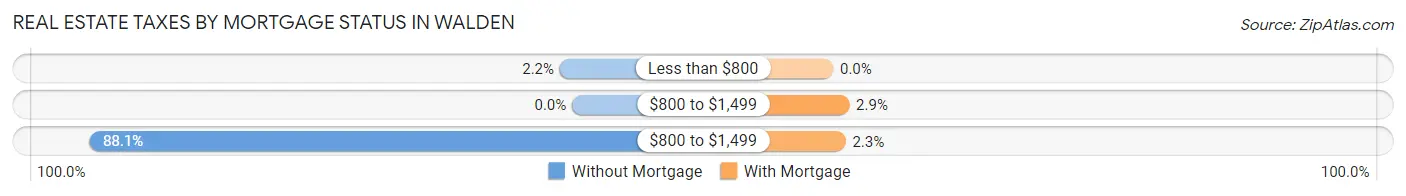
| Property Taxes | Without Mortgage | With Mortgage |
| Less than $800 | 15 (2.2%) | 0 (0.0%) |
| $800 to $1,499 | 0 (0.0%) | 31 (2.9%) |
| $800 to $1,499 | 590 (88.1%) | 24 (2.3%) |
| Total | 670 (100.0%) | 1,056 (100.0%) |
Health & Disability in Walden
Health Insurance Coverage by Age in Walden
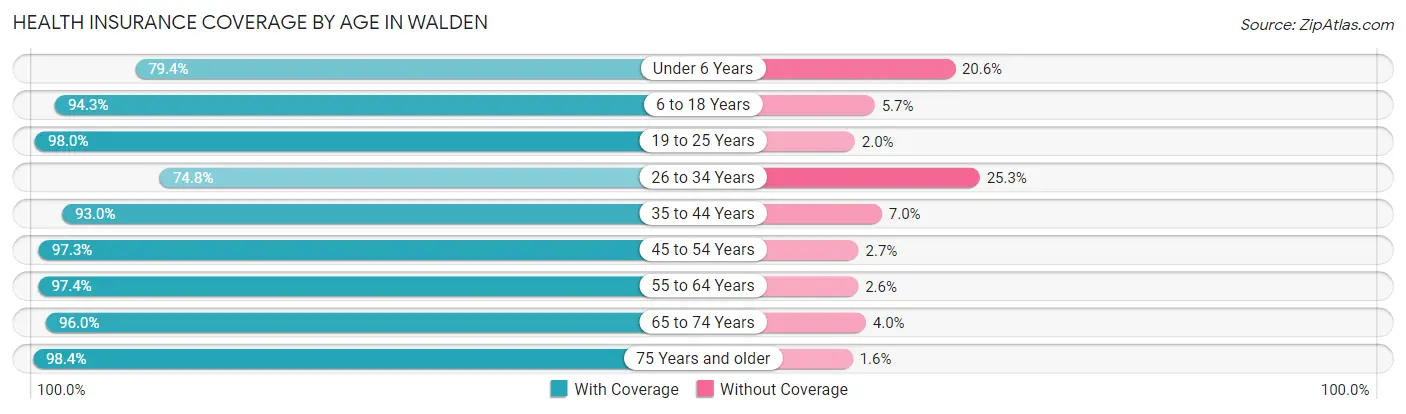
| Age Bracket | With Coverage | Without Coverage |
| Under 6 Years | 354 (79.4%) | 92 (20.6%) |
| 6 to 18 Years | 1,248 (94.3%) | 75 (5.7%) |
| 19 to 25 Years | 647 (98.0%) | 13 (2.0%) |
| 26 to 34 Years | 518 (74.8%) | 175 (25.3%) |
| 35 to 44 Years | 930 (93.0%) | 70 (7.0%) |
| 45 to 54 Years | 729 (97.3%) | 20 (2.7%) |
| 55 to 64 Years | 1,165 (97.4%) | 31 (2.6%) |
| 65 to 74 Years | 334 (96.0%) | 14 (4.0%) |
| 75 Years and older | 439 (98.4%) | 7 (1.6%) |
| Total | 6,364 (92.8%) | 497 (7.2%) |
Health Insurance Coverage by Citizenship Status in Walden
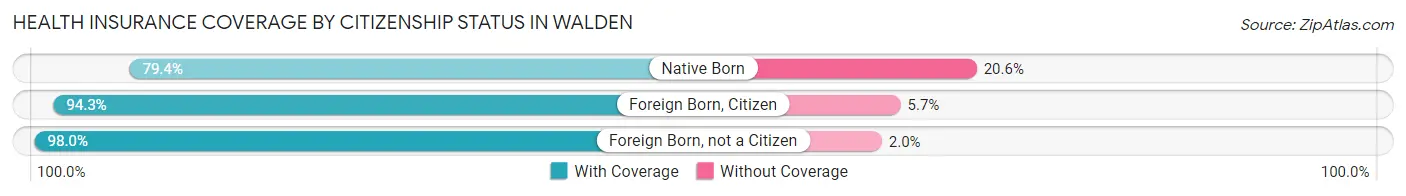
| Citizenship Status | With Coverage | Without Coverage |
| Native Born | 354 (79.4%) | 92 (20.6%) |
| Foreign Born, Citizen | 1,248 (94.3%) | 75 (5.7%) |
| Foreign Born, not a Citizen | 647 (98.0%) | 13 (2.0%) |
Health Insurance Coverage by Household Income in Walden
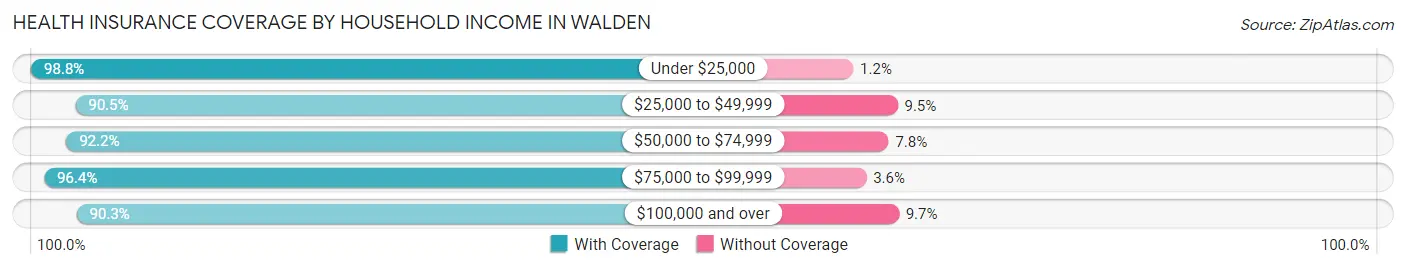
| Household Income | With Coverage | Without Coverage |
| Under $25,000 | 1,076 (98.8%) | 13 (1.2%) |
| $25,000 to $49,999 | 962 (90.5%) | 101 (9.5%) |
| $50,000 to $74,999 | 437 (92.2%) | 37 (7.8%) |
| $75,000 to $99,999 | 980 (96.4%) | 37 (3.6%) |
| $100,000 and over | 2,870 (90.3%) | 309 (9.7%) |
Public vs Private Health Insurance Coverage by Age in Walden
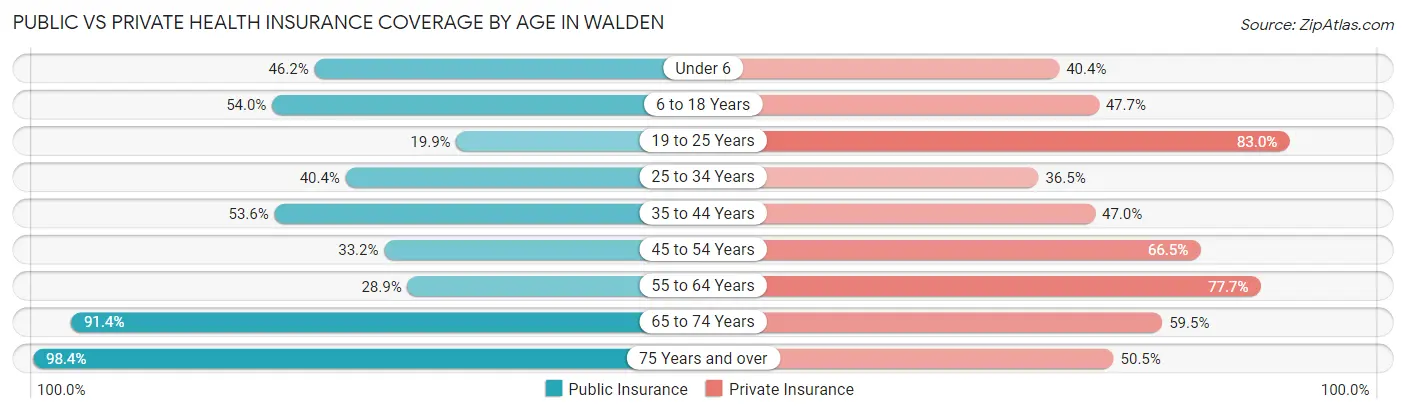
| Age Bracket | Public Insurance | Private Insurance |
| Under 6 | 206 (46.2%) | 180 (40.4%) |
| 6 to 18 Years | 715 (54.0%) | 631 (47.7%) |
| 19 to 25 Years | 131 (19.9%) | 548 (83.0%) |
| 25 to 34 Years | 280 (40.4%) | 253 (36.5%) |
| 35 to 44 Years | 536 (53.6%) | 470 (47.0%) |
| 45 to 54 Years | 249 (33.2%) | 498 (66.5%) |
| 55 to 64 Years | 346 (28.9%) | 929 (77.7%) |
| 65 to 74 Years | 318 (91.4%) | 207 (59.5%) |
| 75 Years and over | 439 (98.4%) | 225 (50.4%) |
| Total | 3,220 (46.9%) | 3,941 (57.4%) |
Disability Status by Sex by Age in Walden
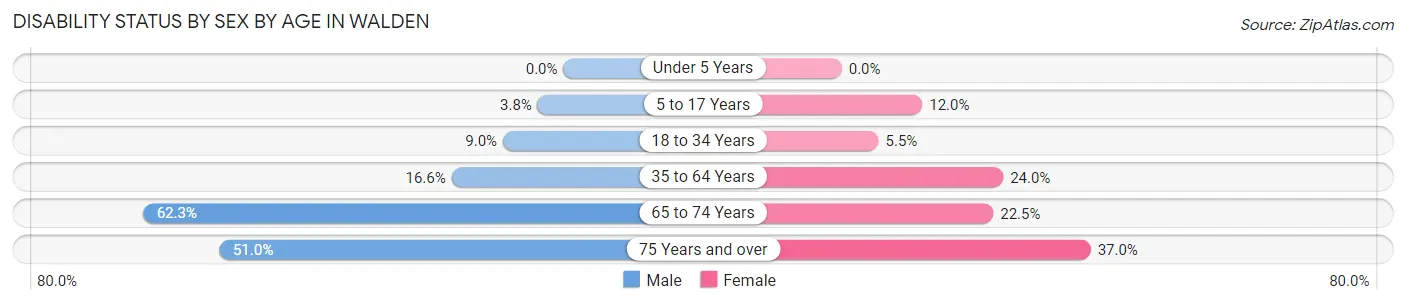
| Age Bracket | Male | Female |
| Under 5 Years | 0 (0.0%) | 0 (0.0%) |
| 5 to 17 Years | 21 (3.8%) | 75 (12.0%) |
| 18 to 34 Years | 63 (9.0%) | 47 (5.5%) |
| 35 to 64 Years | 268 (16.6%) | 319 (24.0%) |
| 65 to 74 Years | 167 (62.3%) | 18 (22.5%) |
| 75 Years and over | 26 (51.0%) | 146 (37.0%) |
Disability Class by Sex by Age in Walden
Disability Class: Hearing Difficulty
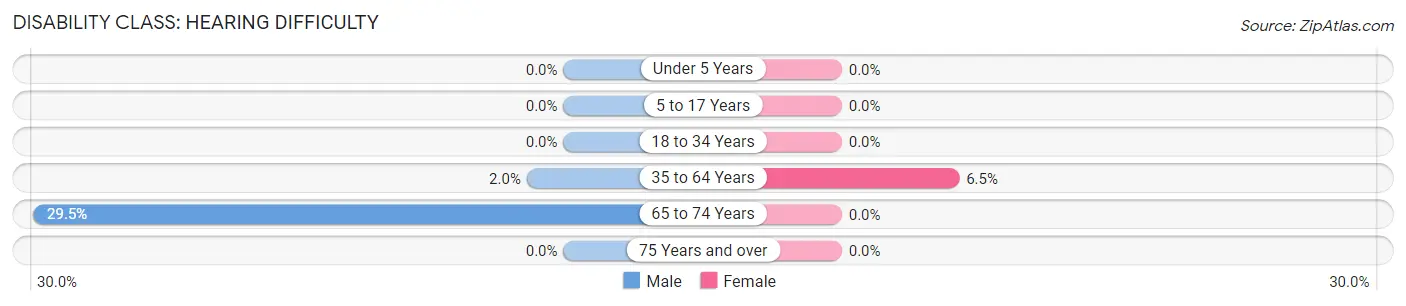
| Age Bracket | Male | Female |
| Under 5 Years | 0 (0.0%) | 0 (0.0%) |
| 5 to 17 Years | 0 (0.0%) | 0 (0.0%) |
| 18 to 34 Years | 0 (0.0%) | 0 (0.0%) |
| 35 to 64 Years | 33 (2.0%) | 87 (6.5%) |
| 65 to 74 Years | 79 (29.5%) | 0 (0.0%) |
| 75 Years and over | 0 (0.0%) | 0 (0.0%) |
Disability Class: Vision Difficulty
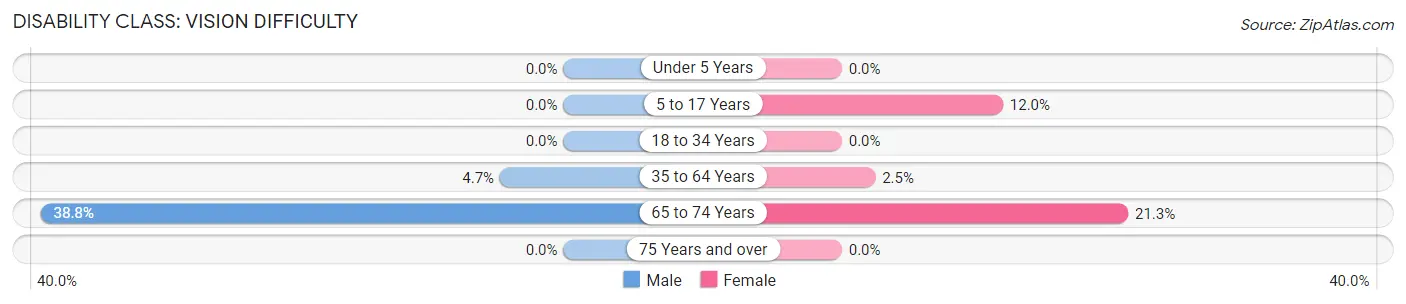
| Age Bracket | Male | Female |
| Under 5 Years | 0 (0.0%) | 0 (0.0%) |
| 5 to 17 Years | 0 (0.0%) | 75 (12.0%) |
| 18 to 34 Years | 0 (0.0%) | 0 (0.0%) |
| 35 to 64 Years | 76 (4.7%) | 33 (2.5%) |
| 65 to 74 Years | 104 (38.8%) | 17 (21.2%) |
| 75 Years and over | 0 (0.0%) | 0 (0.0%) |
Disability Class: Cognitive Difficulty
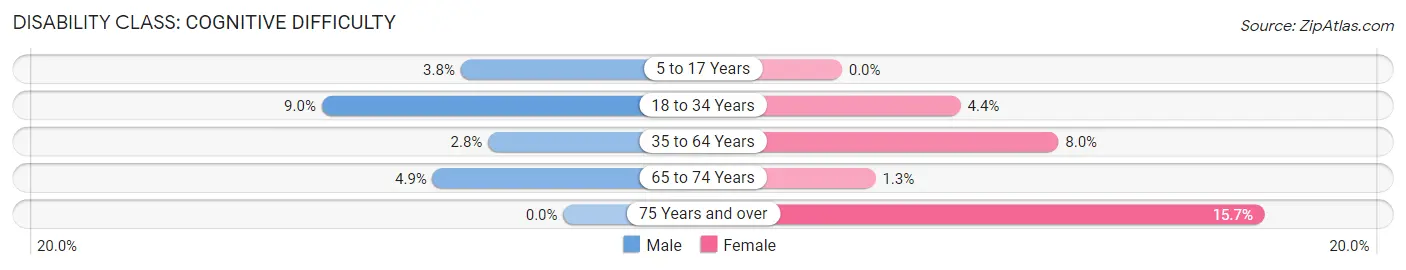
| Age Bracket | Male | Female |
| 5 to 17 Years | 21 (3.8%) | 0 (0.0%) |
| 18 to 34 Years | 63 (9.0%) | 38 (4.4%) |
| 35 to 64 Years | 45 (2.8%) | 107 (8.0%) |
| 65 to 74 Years | 13 (4.9%) | 1 (1.3%) |
| 75 Years and over | 0 (0.0%) | 62 (15.7%) |
Disability Class: Ambulatory Difficulty
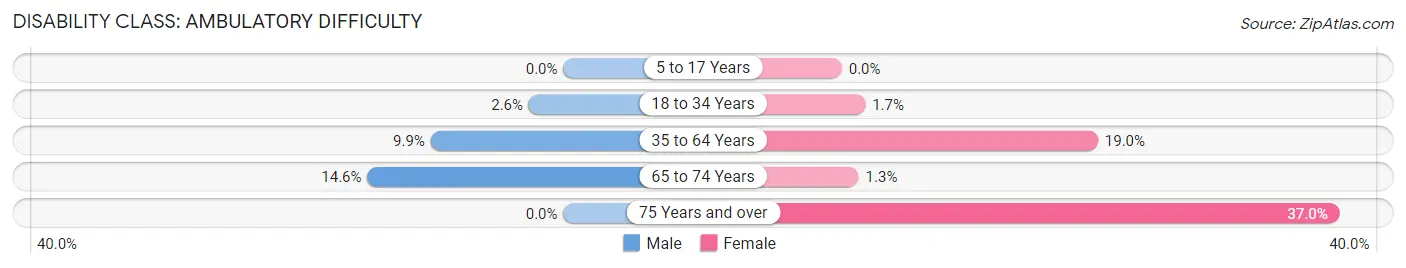
| Age Bracket | Male | Female |
| 5 to 17 Years | 0 (0.0%) | 0 (0.0%) |
| 18 to 34 Years | 18 (2.6%) | 15 (1.7%) |
| 35 to 64 Years | 159 (9.9%) | 253 (19.0%) |
| 65 to 74 Years | 39 (14.5%) | 1 (1.3%) |
| 75 Years and over | 0 (0.0%) | 146 (37.0%) |
Disability Class: Self-Care Difficulty
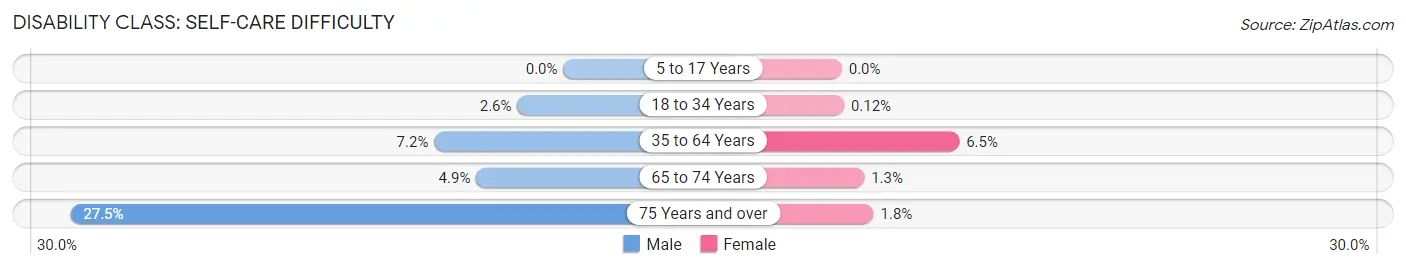
| Age Bracket | Male | Female |
| 5 to 17 Years | 0 (0.0%) | 0 (0.0%) |
| 18 to 34 Years | 18 (2.6%) | 1 (0.1%) |
| 35 to 64 Years | 116 (7.2%) | 87 (6.5%) |
| 65 to 74 Years | 13 (4.9%) | 1 (1.3%) |
| 75 Years and over | 14 (27.5%) | 7 (1.8%) |
Technology Access in Walden
Computing Device Access in Walden
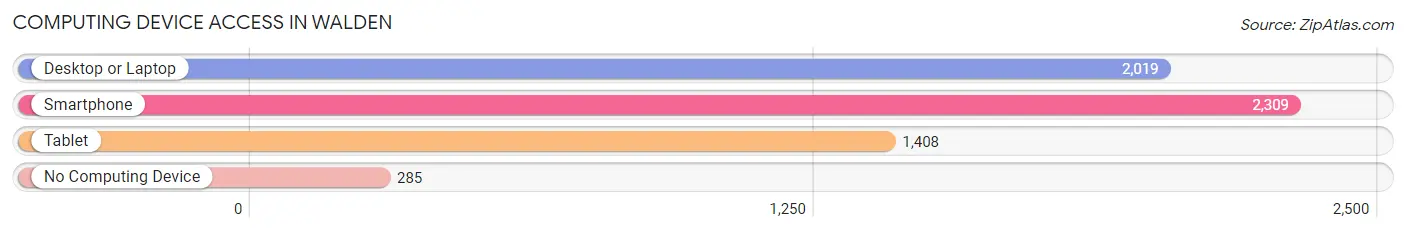
| Device Type | # Households | % Households |
| Desktop or Laptop | 2,019 | 73.9% |
| Smartphone | 2,309 | 84.5% |
| Tablet | 1,408 | 51.5% |
| No Computing Device | 285 | 10.4% |
| Total | 2,734 | 100.0% |
Internet Access in Walden
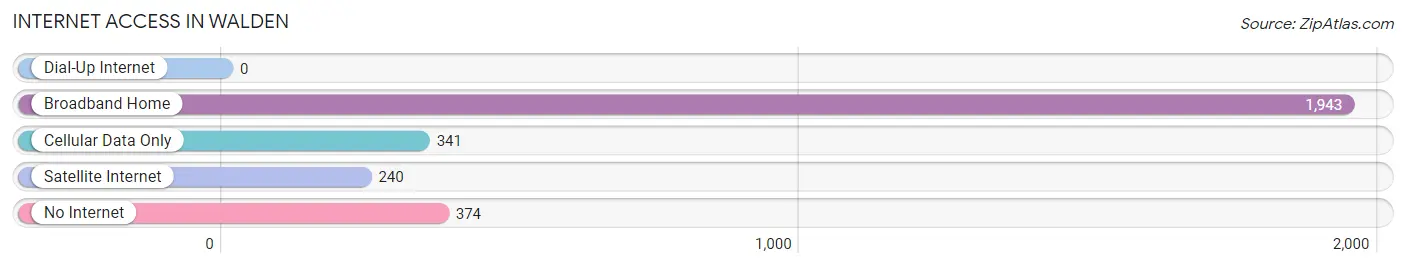
| Internet Type | # Households | % Households |
| Dial-Up Internet | 0 | 0.0% |
| Broadband Home | 1,943 | 71.1% |
| Cellular Data Only | 341 | 12.5% |
| Satellite Internet | 240 | 8.8% |
| No Internet | 374 | 13.7% |
| Total | 2,734 | 100.0% |
Walden Summary
Walden is a small town located in Orange County, New York, United States. It is situated in the foothills of the Shawangunk Mountains, about 50 miles northwest of New York City. The town was founded in 1788 and is named after the English philosopher and poet, Henry David Thoreau, who wrote his famous book, Walden, while living in a cabin near Walden Pond in Massachusetts. The town has a population of approximately 5,000 people and covers an area of 8.3 square miles.
Geography
Walden is located in the foothills of the Shawangunk Mountains, which are part of the Appalachian Mountains. The town is situated on the Wallkill River, which flows through the town and is a tributary of the Hudson River. The town is bordered by the towns of Montgomery, Crawford, and Wallkill. The terrain of the town is mostly hilly, with some flat areas in the valleys. The highest point in the town is the summit of Mount St. John, which is 1,845 feet above sea level.
Climate
Walden has a humid continental climate, with cold winters and hot, humid summers. The average annual temperature is 48°F, with an average high of 68°F in July and an average low of 28°F in January. The average annual precipitation is 43 inches, with the most precipitation occurring in the months of April and May.
Demographics
As of the 2010 census, the population of Walden was 5,061. The racial makeup of the town was 94.3% White, 2.2% African American, 0.3% Native American, 0.7% Asian, 0.1% Pacific Islander, 1.2% from other races, and 1.3% from two or more races. Hispanic or Latino of any race were 4.3% of the population.
Economy
Walden is a small, rural town with a largely agricultural economy. The town is home to several farms, including dairy farms, vegetable farms, and apple orchards. The town is also home to several small businesses, including restaurants, retail stores, and service providers. The town is also home to several manufacturing companies, including a plastics manufacturer and a paper mill.
Education
Walden is served by the Valley Central School District, which includes four elementary schools, one middle school, and one high school. The town is also home to several private schools, including Walden Christian Academy and Walden Montessori School.
Transportation
Walden is served by several major highways, including Interstate 84, U.S. Route 6, and New York State Route 17K. The town is also served by the Walden Bus Company, which provides local bus service to the surrounding towns. The nearest airport is Stewart International Airport, located in Newburgh, New York.
Conclusion
Walden is a small town located in Orange County, New York, United States. It is situated in the foothills of the Shawangunk Mountains, about 50 miles northwest of New York City. The town has a population of approximately 5,000 people and covers an area of 8.3 square miles. The town has a largely agricultural economy, with several farms, small businesses, and manufacturing companies. The town is served by the Valley Central School District and is also home to several private schools. Walden is served by several major highways and is also served by the Walden Bus Company.
Common Questions
What is Per Capita Income in Walden?
Per Capita income in Walden is $34,899.
What is the Median Family Income in Walden?
Median Family Income in Walden is $103,672.
What is the Median Household income in Walden?
Median Household Income in Walden is $76,724.
What is Income or Wage Gap in Walden?
Income or Wage Gap in Walden is 48.3%.
Women in Walden earn 51.7 cents for every dollar earned by a man.
What is Inequality or Gini Index in Walden?
Inequality or Gini Index in Walden is 0.46.
What is the Total Population of Walden?
Total Population of Walden is 6,861.
What is the Total Male Population of Walden?
Total Male Population of Walden is 3,342.
What is the Total Female Population of Walden?
Total Female Population of Walden is 3,519.
What is the Ratio of Males per 100 Females in Walden?
There are 94.97 Males per 100 Females in Walden.
What is the Ratio of Females per 100 Males in Walden?
There are 105.30 Females per 100 Males in Walden.
What is the Median Population Age in Walden?
Median Population Age in Walden is 39.0 Years.
What is the Average Family Size in Walden
Average Family Size in Walden is 3.3 People.
What is the Average Household Size in Walden
Average Household Size in Walden is 2.5 People.
How Large is the Labor Force in Walden?
There are 3,270 People in the Labor Forcein in Walden.
What is the Percentage of People in the Labor Force in Walden?
58.5% of People are in the Labor Force in Walden.
What is the Unemployment Rate in Walden?
Unemployment Rate in Walden is 5.8%.