Baytown, TX Map & Demographics
Baytown Map
Baytown Overview
$28,915
PER CAPITA INCOME
$69,580
AVG FAMILY INCOME
$61,158
AVG HOUSEHOLD INCOME
42.6%
WAGE / INCOME GAP [ % ]
57.4¢/ $1
WAGE / INCOME GAP [ $ ]
$12,205
FAMILY INCOME DEFICIT
0.43
INEQUALITY / GINI INDEX
84,449
TOTAL POPULATION
42,793
MALE POPULATION
41,656
FEMALE POPULATION
102.73
MALES / 100 FEMALES
97.34
FEMALES / 100 MALES
33.9
MEDIAN AGE
3.4
AVG FAMILY SIZE
2.7
AVG HOUSEHOLD SIZE
40,905
LABOR FORCE [ PEOPLE ]
64.4%
PERCENT IN LABOR FORCE
9.2%
UNEMPLOYMENT RATE
Income in Baytown
Income Overview in Baytown
Per Capita Income in Baytown is $28,915, while median incomes of families and households are $69,580 and $61,158 respectively.
| Characteristic | Number | Measure |
| Per Capita Income | 84,449 | $28,915 |
| Median Family Income | 20,539 | $69,580 |
| Mean Family Income | 20,539 | $83,407 |
| Median Household Income | 30,749 | $61,158 |
| Mean Household Income | 30,749 | $77,518 |
| Income Deficit | 20,539 | $12,205 |
| Wage / Income Gap (%) | 84,449 | 42.65% |
| Wage / Income Gap ($) | 84,449 | 57.35¢ per $1 |
| Gini / Inequality Index | 84,449 | 0.43 |
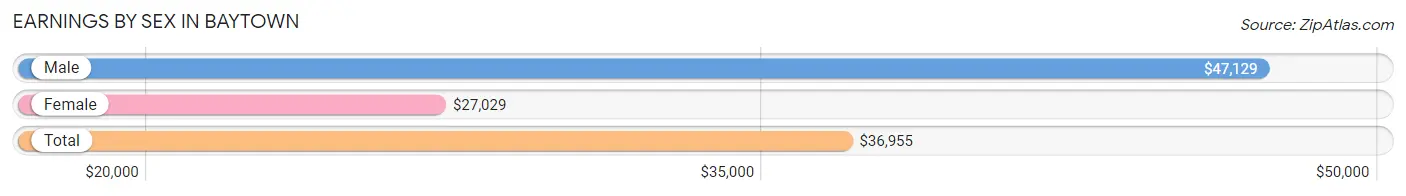
Earnings by Sex in Baytown
Average Earnings in Baytown are $36,955, $47,129 for men and $27,029 for women, a difference of 42.6%.
| Sex | Number | Average Earnings |
| Male | 23,905 (57.1%) | $47,129 |
| Female | 17,983 (42.9%) | $27,029 |
| Total | 41,888 (100.0%) | $36,955 |
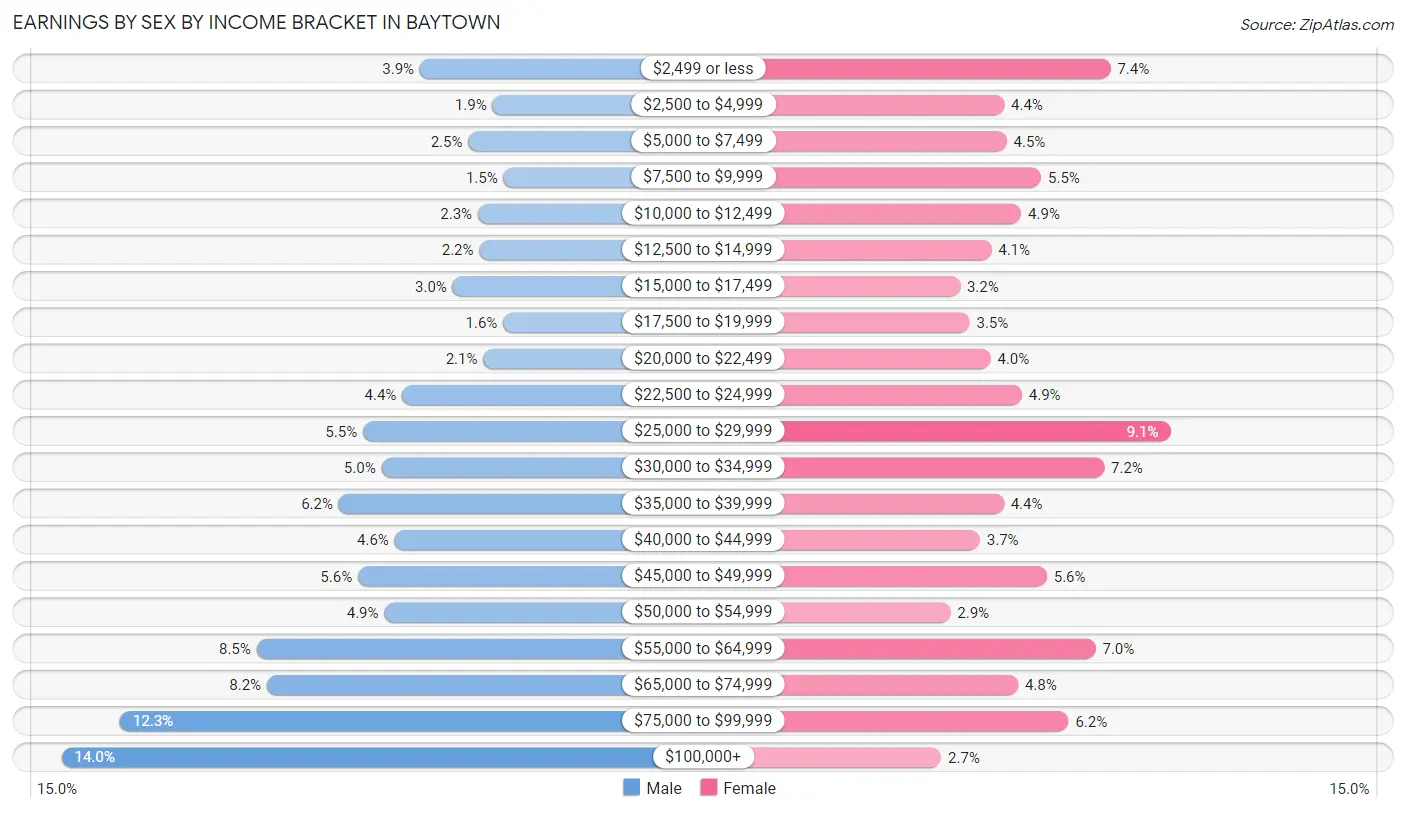
Earnings by Sex by Income Bracket in Baytown
The most common earnings brackets in Baytown are $100,000+ for men (3,337 | 14.0%) and $25,000 to $29,999 for women (1,635 | 9.1%).
| Income | Male | Female |
| $2,499 or less | 931 (3.9%) | 1,333 (7.4%) |
| $2,500 to $4,999 | 442 (1.8%) | 794 (4.4%) |
| $5,000 to $7,499 | 604 (2.5%) | 808 (4.5%) |
| $7,500 to $9,999 | 367 (1.5%) | 981 (5.5%) |
| $10,000 to $12,499 | 540 (2.3%) | 881 (4.9%) |
| $12,500 to $14,999 | 530 (2.2%) | 730 (4.1%) |
| $15,000 to $17,499 | 710 (3.0%) | 571 (3.2%) |
| $17,500 to $19,999 | 370 (1.5%) | 620 (3.5%) |
| $20,000 to $22,499 | 505 (2.1%) | 727 (4.0%) |
| $22,500 to $24,999 | 1,050 (4.4%) | 885 (4.9%) |
| $25,000 to $29,999 | 1,313 (5.5%) | 1,635 (9.1%) |
| $30,000 to $34,999 | 1,187 (5.0%) | 1,300 (7.2%) |
| $35,000 to $39,999 | 1,474 (6.2%) | 793 (4.4%) |
| $40,000 to $44,999 | 1,099 (4.6%) | 672 (3.7%) |
| $45,000 to $49,999 | 1,346 (5.6%) | 1,010 (5.6%) |
| $50,000 to $54,999 | 1,170 (4.9%) | 523 (2.9%) |
| $55,000 to $64,999 | 2,026 (8.5%) | 1,257 (7.0%) |
| $65,000 to $74,999 | 1,959 (8.2%) | 865 (4.8%) |
| $75,000 to $99,999 | 2,945 (12.3%) | 1,121 (6.2%) |
| $100,000+ | 3,337 (14.0%) | 477 (2.6%) |
| Total | 23,905 (100.0%) | 17,983 (100.0%) |
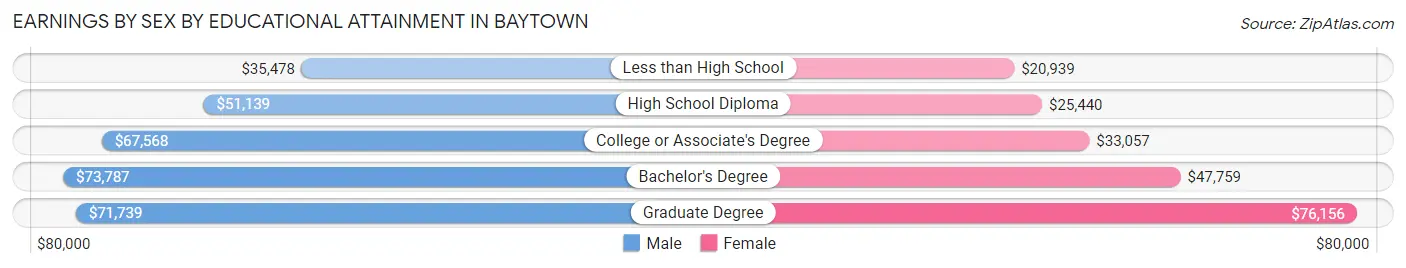
Earnings by Sex by Educational Attainment in Baytown
Average earnings in Baytown are $52,209 for men and $31,404 for women, a difference of 39.9%. Men with an educational attainment of bachelor's degree enjoy the highest average annual earnings of $73,787, while those with less than high school education earn the least with $35,478. Women with an educational attainment of graduate degree earn the most with the average annual earnings of $76,156, while those with less than high school education have the smallest earnings of $20,939.
| Educational Attainment | Male Income | Female Income |
| Less than High School | $35,478 | $20,939 |
| High School Diploma | $51,139 | $25,440 |
| College or Associate's Degree | $67,568 | $33,057 |
| Bachelor's Degree | $73,787 | $47,759 |
| Graduate Degree | $71,739 | $76,156 |
| Total | $52,209 | $31,404 |
Family Income in Baytown
Family Income Brackets in Baytown
According to the Baytown family income data, there are 3,902 families falling into the $50,000 to $74,999 income range, which is the most common income bracket and makes up 19.0% of all families. Conversely, the $10,000 to $14,999 income bracket is the least frequent group with only 431 families (2.1%) belonging to this category.
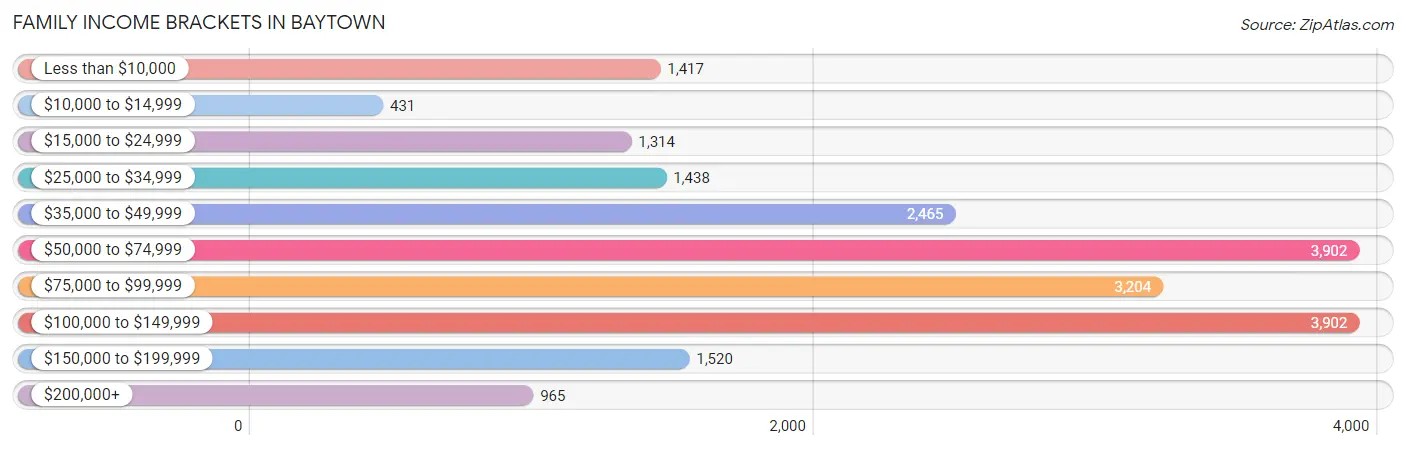
| Income Bracket | # Families | % Families |
| Less than $10,000 | 1,417 | 6.9% |
| $10,000 to $14,999 | 431 | 2.1% |
| $15,000 to $24,999 | 1,314 | 6.4% |
| $25,000 to $34,999 | 1,438 | 7.0% |
| $35,000 to $49,999 | 2,465 | 12.0% |
| $50,000 to $74,999 | 3,902 | 19.0% |
| $75,000 to $99,999 | 3,204 | 15.6% |
| $100,000 to $149,999 | 3,902 | 19.0% |
| $150,000 to $199,999 | 1,520 | 7.4% |
| $200,000+ | 965 | 4.7% |
Family Income by Famaliy Size in Baytown
7+ person families (348 | 1.7%) account for the highest median family income in Baytown with $85,000 per family, while 2-person families (7,694 | 37.5%) have the highest median income of $32,672 per family member.
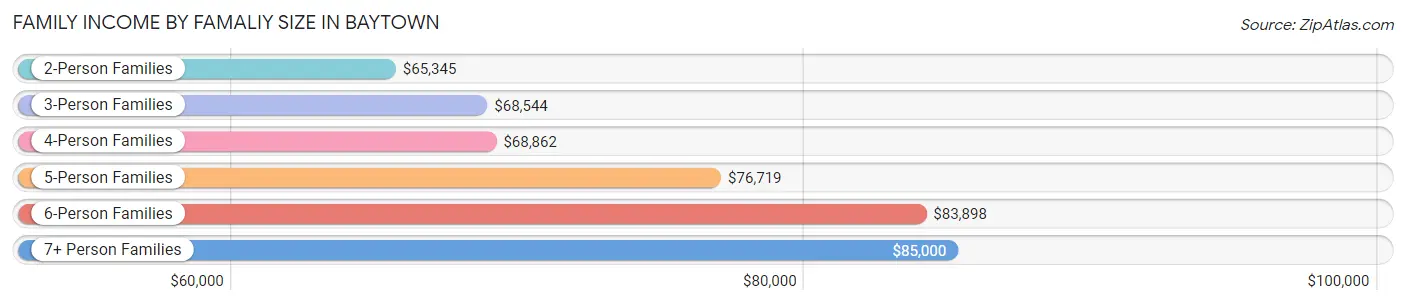
| Income Bracket | # Families | Median Income |
| 2-Person Families | 7,694 (37.5%) | $65,345 |
| 3-Person Families | 4,955 (24.1%) | $68,544 |
| 4-Person Families | 4,226 (20.6%) | $68,862 |
| 5-Person Families | 2,564 (12.5%) | $76,719 |
| 6-Person Families | 752 (3.7%) | $83,898 |
| 7+ Person Families | 348 (1.7%) | $85,000 |
| Total | 20,539 (100.0%) | $69,580 |
Family Income by Number of Earners in Baytown
The median family income in Baytown is $69,580, with families comprising 3+ earners (2,205) having the highest median family income of $102,039, while families with no earners (2,492) have the lowest median family income of $28,669, accounting for 10.7% and 12.1% of families, respectively.
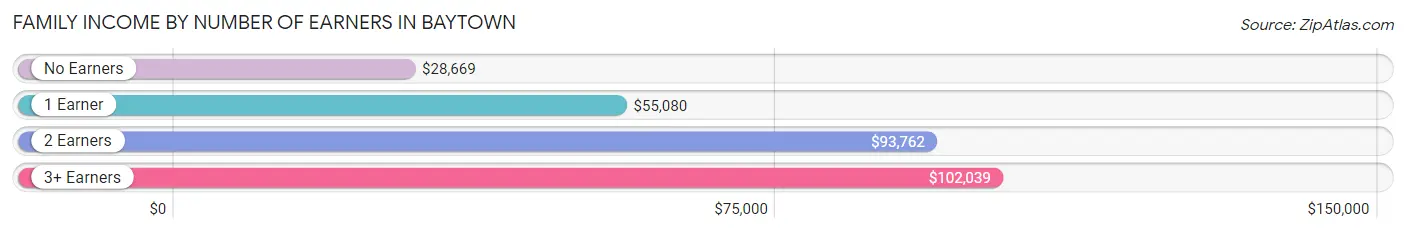
| Number of Earners | # Families | Median Income |
| No Earners | 2,492 (12.1%) | $28,669 |
| 1 Earner | 8,232 (40.1%) | $55,080 |
| 2 Earners | 7,610 (37.0%) | $93,762 |
| 3+ Earners | 2,205 (10.7%) | $102,039 |
| Total | 20,539 (100.0%) | $69,580 |
Household Income in Baytown
Household Income Brackets in Baytown
With 5,473 households falling in the category, the $50,000 to $74,999 income range is the most frequent in Baytown, accounting for 17.8% of all households. In contrast, only 1,261 households (4.1%) fall into the $200,000+ income bracket, making it the least populous group.
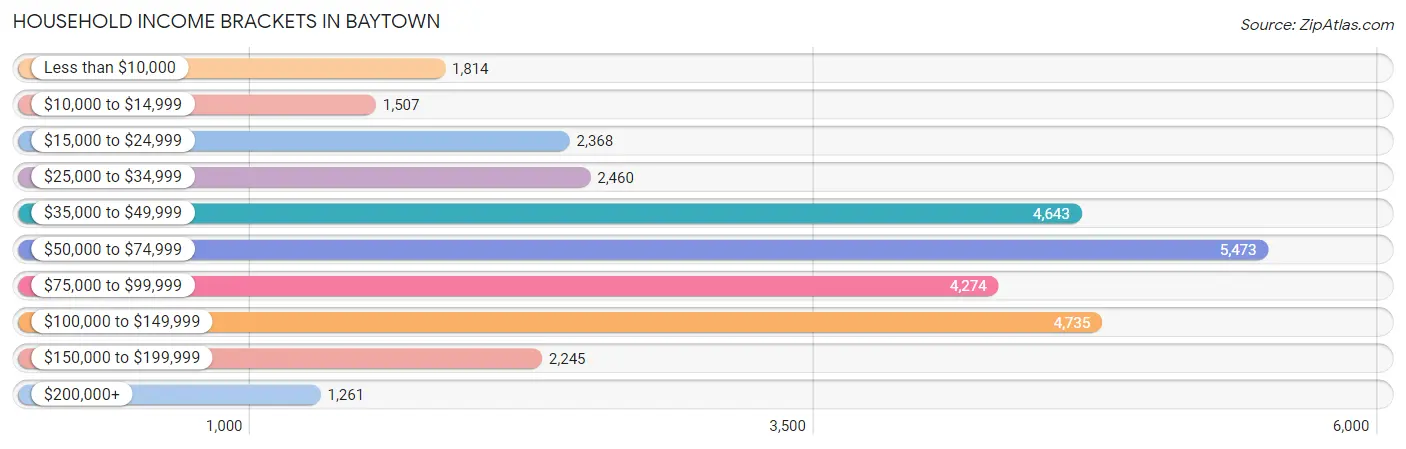
| Income Bracket | # Households | % Households |
| Less than $10,000 | 1,814 | 5.9% |
| $10,000 to $14,999 | 1,507 | 4.9% |
| $15,000 to $24,999 | 2,368 | 7.7% |
| $25,000 to $34,999 | 2,460 | 8.0% |
| $35,000 to $49,999 | 4,643 | 15.1% |
| $50,000 to $74,999 | 5,473 | 17.8% |
| $75,000 to $99,999 | 4,274 | 13.9% |
| $100,000 to $149,999 | 4,735 | 15.4% |
| $150,000 to $199,999 | 2,245 | 7.3% |
| $200,000+ | 1,261 | 4.1% |
Household Income by Householder Age in Baytown
The median household income in Baytown is $61,158, with the highest median household income of $69,971 found in the 45 to 64 years age bracket for the primary householder. A total of 11,219 households (36.5%) fall into this category. Meanwhile, the 65+ years age bracket for the primary householder has the lowest median household income of $45,990, with 5,872 households (19.1%) in this group.
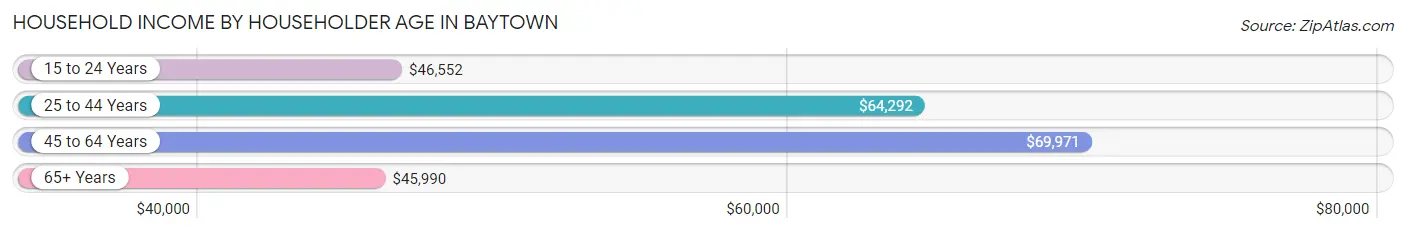
| Income Bracket | # Households | Median Income |
| 15 to 24 Years | 1,564 (5.1%) | $46,552 |
| 25 to 44 Years | 12,094 (39.3%) | $64,292 |
| 45 to 64 Years | 11,219 (36.5%) | $69,971 |
| 65+ Years | 5,872 (19.1%) | $45,990 |
| Total | 30,749 (100.0%) | $61,158 |
Poverty in Baytown
Income Below Poverty by Sex and Age in Baytown
With 14.5% poverty level for males and 20.4% for females among the residents of Baytown, 12 to 14 year old males and under 5 year old females are the most vulnerable to poverty, with 869 males (34.3%) and 1,200 females (39.0%) in their respective age groups living below the poverty level.
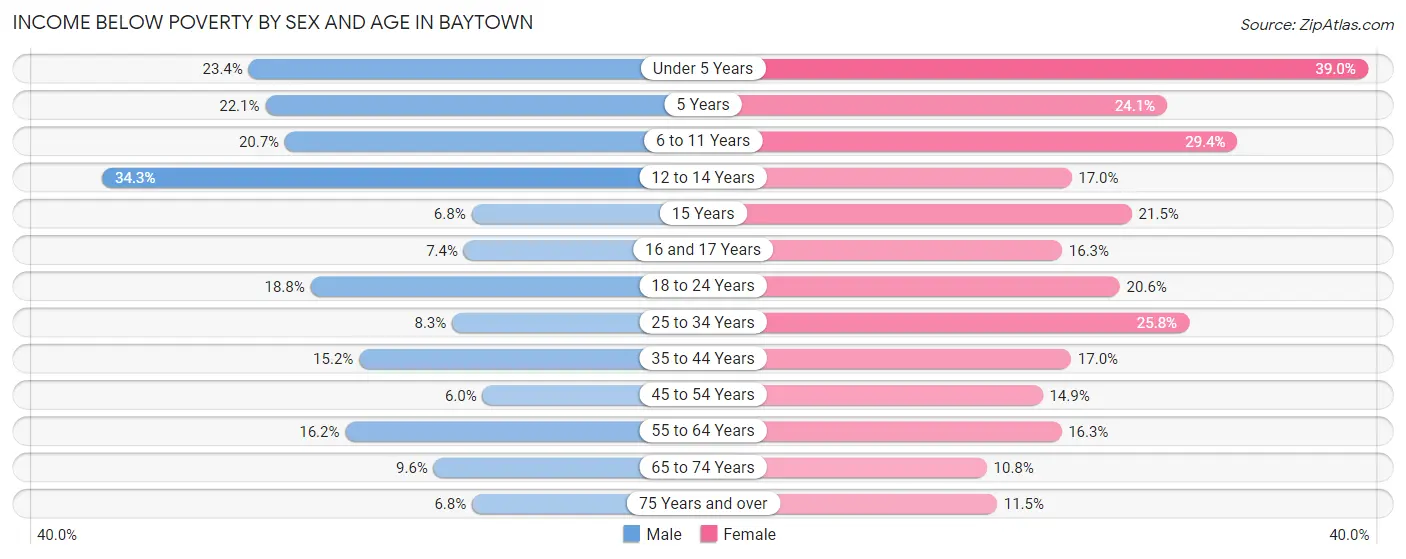
| Age Bracket | Male | Female |
| Under 5 Years | 692 (23.4%) | 1,200 (39.0%) |
| 5 Years | 164 (22.1%) | 119 (24.1%) |
| 6 to 11 Years | 832 (20.7%) | 1,064 (29.4%) |
| 12 to 14 Years | 869 (34.3%) | 385 (17.0%) |
| 15 Years | 41 (6.8%) | 99 (21.5%) |
| 16 and 17 Years | 133 (7.4%) | 167 (16.3%) |
| 18 to 24 Years | 669 (18.8%) | 911 (20.6%) |
| 25 to 34 Years | 507 (8.3%) | 1,483 (25.8%) |
| 35 to 44 Years | 914 (15.2%) | 1,004 (17.0%) |
| 45 to 54 Years | 379 (6.0%) | 692 (14.9%) |
| 55 to 64 Years | 652 (16.2%) | 720 (16.3%) |
| 65 to 74 Years | 254 (9.6%) | 298 (10.7%) |
| 75 Years and over | 83 (6.8%) | 268 (11.5%) |
| Total | 6,189 (14.5%) | 8,410 (20.4%) |
Income Above Poverty by Sex and Age in Baytown
According to the poverty statistics in Baytown, males aged 45 to 54 years and females aged 65 to 74 years are the age groups that are most secure financially, with 94.0% of males and 89.2% of females in these age groups living above the poverty line.
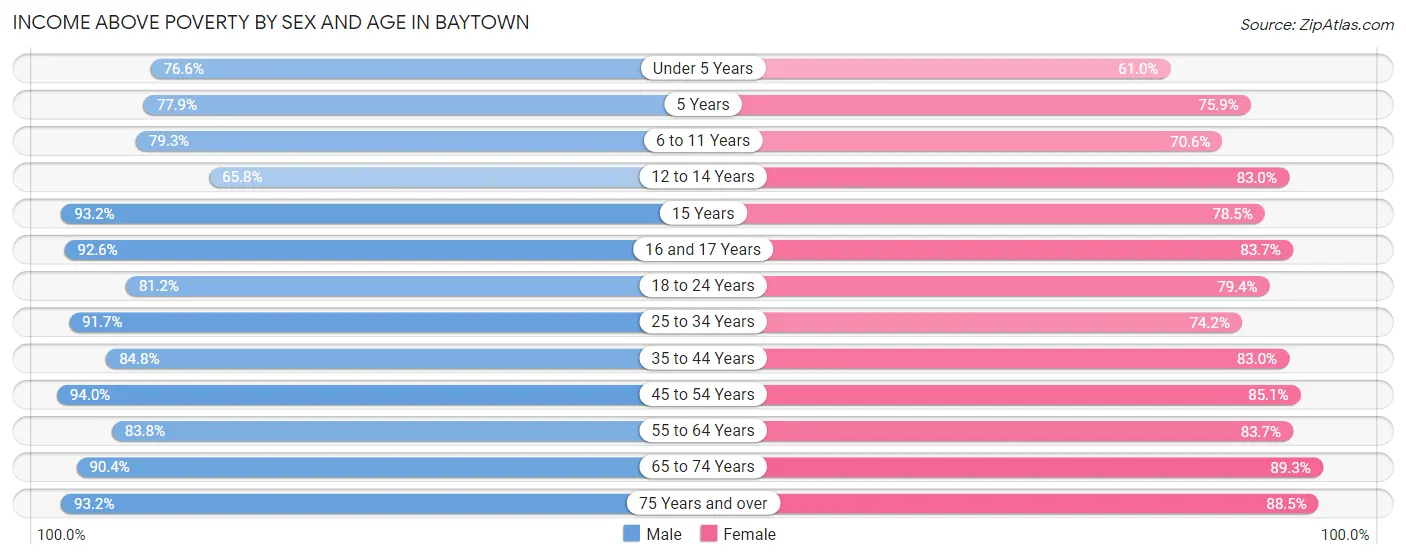
| Age Bracket | Male | Female |
| Under 5 Years | 2,269 (76.6%) | 1,874 (61.0%) |
| 5 Years | 577 (77.9%) | 374 (75.9%) |
| 6 to 11 Years | 3,194 (79.3%) | 2,559 (70.6%) |
| 12 to 14 Years | 1,668 (65.7%) | 1,874 (83.0%) |
| 15 Years | 560 (93.2%) | 361 (78.5%) |
| 16 and 17 Years | 1,666 (92.6%) | 855 (83.7%) |
| 18 to 24 Years | 2,896 (81.2%) | 3,505 (79.4%) |
| 25 to 34 Years | 5,630 (91.7%) | 4,272 (74.2%) |
| 35 to 44 Years | 5,116 (84.8%) | 4,900 (83.0%) |
| 45 to 54 Years | 5,940 (94.0%) | 3,953 (85.1%) |
| 55 to 64 Years | 3,375 (83.8%) | 3,699 (83.7%) |
| 65 to 74 Years | 2,384 (90.4%) | 2,473 (89.2%) |
| 75 Years and over | 1,141 (93.2%) | 2,060 (88.5%) |
| Total | 36,416 (85.5%) | 32,759 (79.6%) |
Income Below Poverty Among Married-Couple Families in Baytown
The poverty statistics for married-couple families in Baytown show that 7.4% or 964 of the total 12,968 families live below the poverty line. Families with 5 or more children have the highest poverty rate of 12.3%, comprising of 14 families. On the other hand, families with no children have the lowest poverty rate of 5.2%, which includes 328 families.
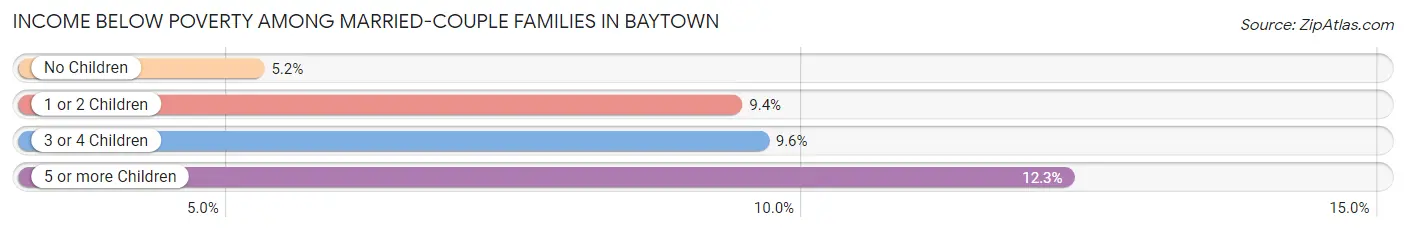
| Children | Above Poverty | Below Poverty |
| No Children | 5,941 (94.8%) | 328 (5.2%) |
| 1 or 2 Children | 4,516 (90.6%) | 468 (9.4%) |
| 3 or 4 Children | 1,447 (90.4%) | 154 (9.6%) |
| 5 or more Children | 100 (87.7%) | 14 (12.3%) |
| Total | 12,004 (92.6%) | 964 (7.4%) |
Income Below Poverty Among Single-Parent Households in Baytown
According to the poverty data in Baytown, 11.0% or 247 single-father households and 35.4% or 1,886 single-mother households are living below the poverty line. Among single-father households, those with 1 or 2 children have the highest poverty rate, with 142 households (18.9%) experiencing poverty. Likewise, among single-mother households, those with 5 or more children have the highest poverty rate, with 68 households (100.0%) falling below the poverty line.
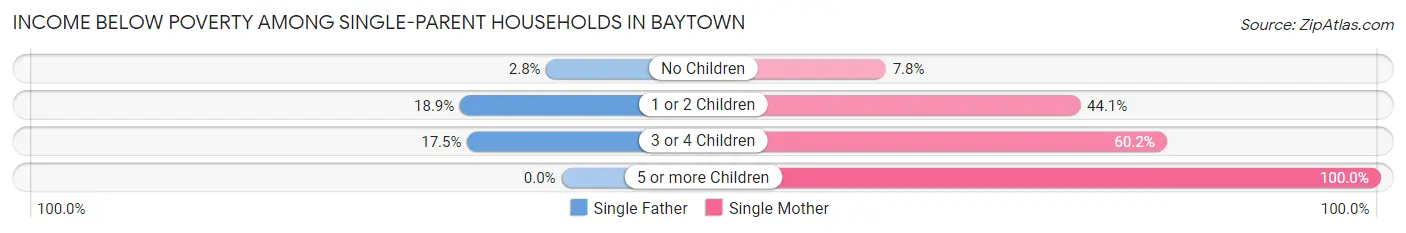
| Children | Single Father | Single Mother |
| No Children | 28 (2.8%) | 131 (7.8%) |
| 1 or 2 Children | 142 (18.9%) | 1,293 (44.1%) |
| 3 or 4 Children | 77 (17.5%) | 394 (60.2%) |
| 5 or more Children | 0 (0.0%) | 68 (100.0%) |
| Total | 247 (11.0%) | 1,886 (35.4%) |
Income Below Poverty Among Married-Couple vs Single-Parent Households in Baytown
The poverty data for Baytown shows that 964 of the married-couple family households (7.4%) and 2,133 of the single-parent households (28.2%) are living below the poverty level. Within the married-couple family households, those with 5 or more children have the highest poverty rate, with 14 households (12.3%) falling below the poverty line. Among the single-parent households, those with 5 or more children have the highest poverty rate, with 68 household (58.6%) living below poverty.
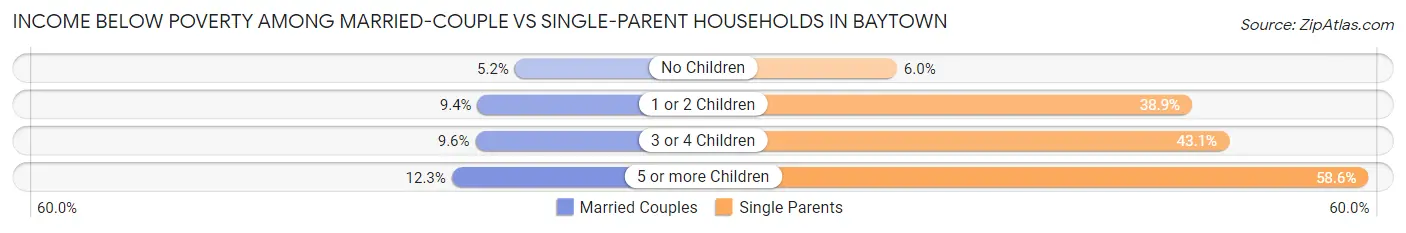
| Children | Married-Couple Families | Single-Parent Households |
| No Children | 328 (5.2%) | 159 (5.9%) |
| 1 or 2 Children | 468 (9.4%) | 1,435 (38.9%) |
| 3 or 4 Children | 154 (9.6%) | 471 (43.0%) |
| 5 or more Children | 14 (12.3%) | 68 (58.6%) |
| Total | 964 (7.4%) | 2,133 (28.2%) |
Race in Baytown
The most populous races in Baytown are White / Caucasian (45,204 | 53.5%), Hispanic or Latino (44,114 | 52.2%), and Black / African American (13,177 | 15.6%).
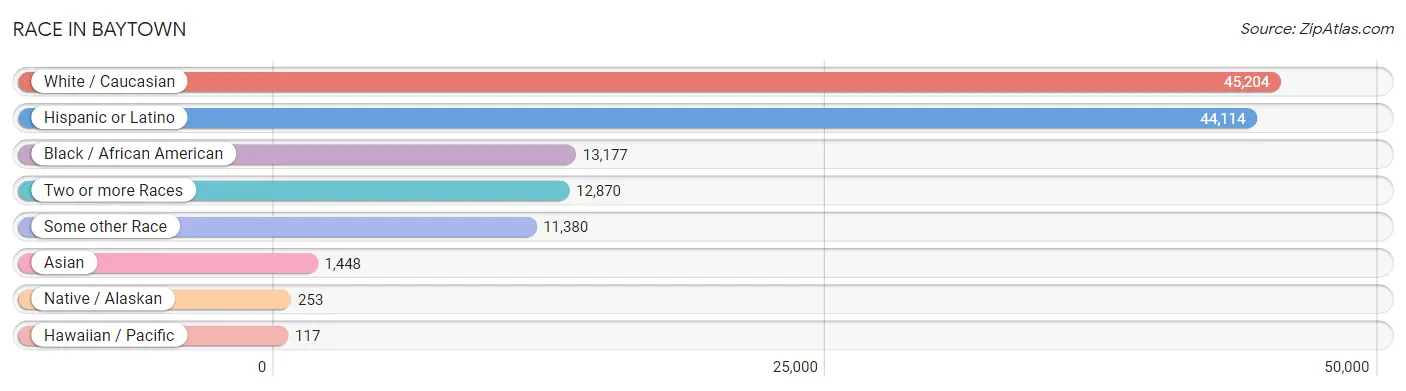
| Race | # Population | % Population |
| Asian | 1,448 | 1.7% |
| Black / African American | 13,177 | 15.6% |
| Hawaiian / Pacific | 117 | 0.1% |
| Hispanic or Latino | 44,114 | 52.2% |
| Native / Alaskan | 253 | 0.3% |
| White / Caucasian | 45,204 | 53.5% |
| Two or more Races | 12,870 | 15.2% |
| Some other Race | 11,380 | 13.5% |
| Total | 84,449 | 100.0% |
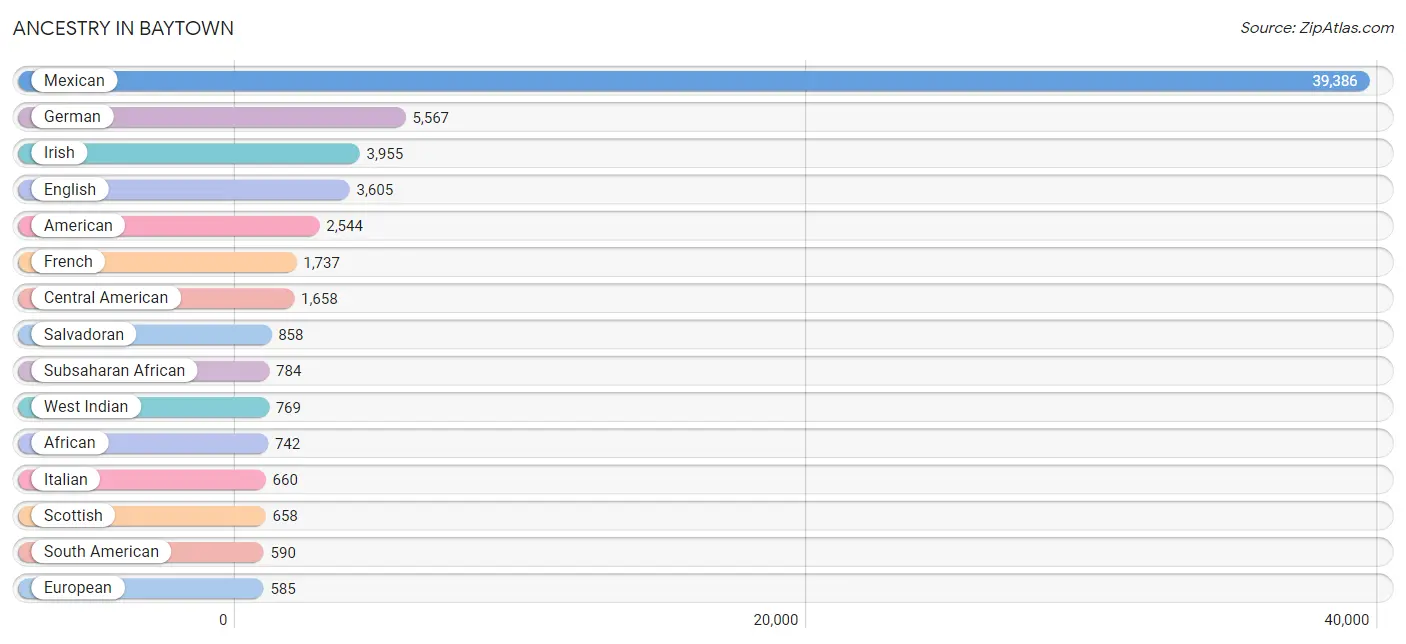
Ancestry in Baytown
The most populous ancestries reported in Baytown are Mexican (39,386 | 46.6%), German (5,567 | 6.6%), Irish (3,955 | 4.7%), English (3,605 | 4.3%), and American (2,544 | 3.0%), together accounting for 65.2% of all Baytown residents.
| Ancestry | # Population | % Population |
| African | 742 | 0.9% |
| Alaska Native | 52 | 0.1% |
| American | 2,544 | 3.0% |
| Apache | 1 | 0.0% |
| Arab | 119 | 0.1% |
| Belizean | 14 | 0.0% |
| Blackfeet | 57 | 0.1% |
| Bolivian | 171 | 0.2% |
| Brazilian | 7 | 0.0% |
| British | 213 | 0.3% |
| British West Indian | 46 | 0.1% |
| Burmese | 35 | 0.0% |
| Cajun | 12 | 0.0% |
| Celtic | 37 | 0.0% |
| Central American | 1,658 | 2.0% |
| Central American Indian | 17 | 0.0% |
| Cherokee | 37 | 0.0% |
| Cheyenne | 38 | 0.0% |
| Choctaw | 64 | 0.1% |
| Colombian | 19 | 0.0% |
| Creek | 8 | 0.0% |
| Croatian | 29 | 0.0% |
| Cuban | 214 | 0.3% |
| Czech | 211 | 0.3% |
| Czechoslovakian | 26 | 0.0% |
| Danish | 29 | 0.0% |
| Dominican | 225 | 0.3% |
| Dutch | 177 | 0.2% |
| Dutch West Indian | 50 | 0.1% |
| Eastern European | 19 | 0.0% |
| Ecuadorian | 126 | 0.2% |
| English | 3,605 | 4.3% |
| Estonian | 28 | 0.0% |
| European | 585 | 0.7% |
| Filipino | 168 | 0.2% |
| Finnish | 27 | 0.0% |
| French | 1,737 | 2.1% |
| French Canadian | 422 | 0.5% |
| German | 5,567 | 6.6% |
| German Russian | 19 | 0.0% |
| Greek | 75 | 0.1% |
| Guamanian / Chamorro | 99 | 0.1% |
| Guatemalan | 373 | 0.4% |
| Honduran | 391 | 0.5% |
| Hungarian | 30 | 0.0% |
| Indian (Asian) | 50 | 0.1% |
| Indonesian | 89 | 0.1% |
| Irish | 3,955 | 4.7% |
| Iroquois | 4 | 0.0% |
| Israeli | 241 | 0.3% |
| Italian | 660 | 0.8% |
| Japanese | 236 | 0.3% |
| Korean | 441 | 0.5% |
| Laotian | 107 | 0.1% |
| Latvian | 15 | 0.0% |
| Mexican | 39,386 | 46.6% |
| Mexican American Indian | 163 | 0.2% |
| Native Hawaiian | 42 | 0.1% |
| Nicaraguan | 9 | 0.0% |
| Nigerian | 105 | 0.1% |
| Northern European | 44 | 0.1% |
| Norwegian | 106 | 0.1% |
| Osage | 24 | 0.0% |
| Pakistani | 47 | 0.1% |
| Panamanian | 27 | 0.0% |
| Peruvian | 252 | 0.3% |
| Polish | 489 | 0.6% |
| Portuguese | 11 | 0.0% |
| Pueblo | 91 | 0.1% |
| Puerto Rican | 220 | 0.3% |
| Russian | 8 | 0.0% |
| Salvadoran | 858 | 1.0% |
| Samoan | 13 | 0.0% |
| Scandinavian | 29 | 0.0% |
| Scotch-Irish | 358 | 0.4% |
| Scottish | 658 | 0.8% |
| Sioux | 36 | 0.0% |
| Slavic | 46 | 0.1% |
| South American | 590 | 0.7% |
| Spaniard | 288 | 0.3% |
| Spanish | 80 | 0.1% |
| Sri Lankan | 301 | 0.4% |
| Subsaharan African | 784 | 0.9% |
| Swedish | 115 | 0.1% |
| Swiss | 12 | 0.0% |
| Thai | 401 | 0.5% |
| Trinidadian and Tobagonian | 366 | 0.4% |
| Turkish | 96 | 0.1% |
| U.S. Virgin Islander | 237 | 0.3% |
| Ukrainian | 22 | 0.0% |
| Ute | 3 | 0.0% |
| Venezuelan | 22 | 0.0% |
| Welsh | 99 | 0.1% |
| West Indian | 769 | 0.9% |
| Yugoslavian | 33 | 0.0% | View All 95 Rows |
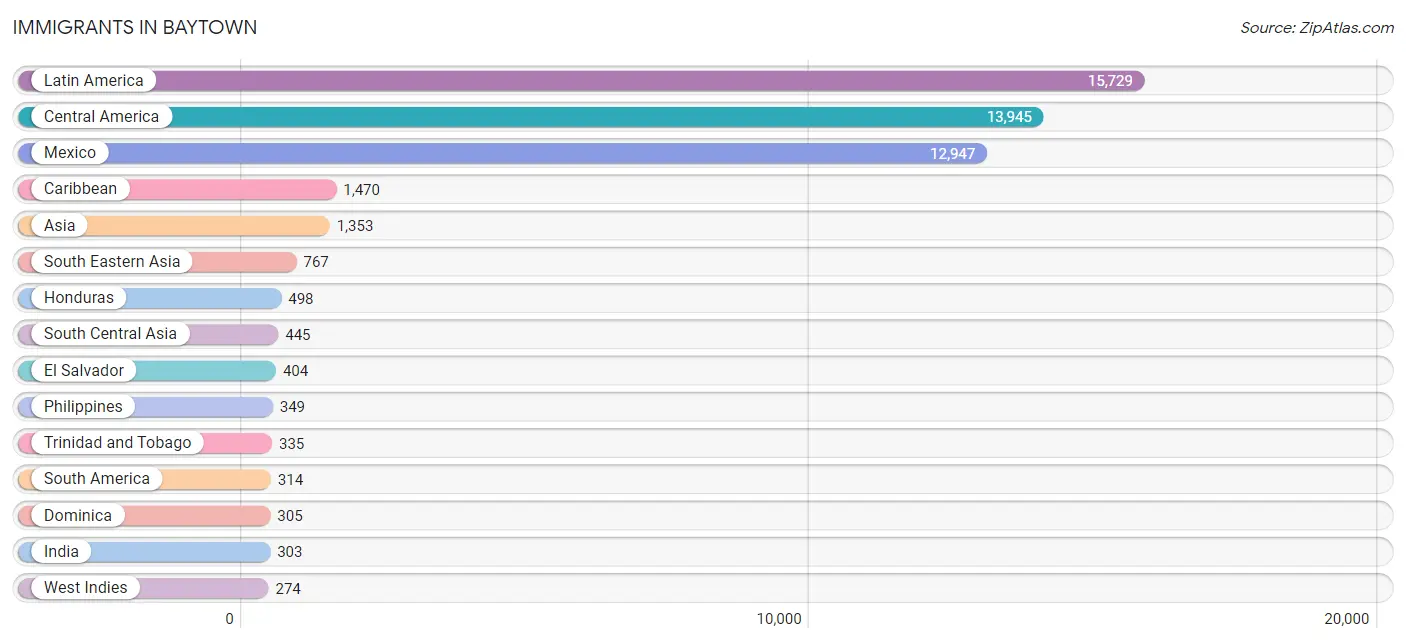
Immigrants in Baytown
The most numerous immigrant groups reported in Baytown came from Latin America (15,729 | 18.6%), Central America (13,945 | 16.5%), Mexico (12,947 | 15.3%), Caribbean (1,470 | 1.7%), and Asia (1,353 | 1.6%), together accounting for 53.8% of all Baytown residents.
| Immigration Origin | # Population | % Population |
| Africa | 162 | 0.2% |
| Asia | 1,353 | 1.6% |
| Belize | 17 | 0.0% |
| Bolivia | 171 | 0.2% |
| Brazil | 7 | 0.0% |
| Cambodia | 35 | 0.0% |
| Cameroon | 20 | 0.0% |
| Canada | 94 | 0.1% |
| Caribbean | 1,470 | 1.7% |
| Central America | 13,945 | 16.5% |
| China | 78 | 0.1% |
| Colombia | 28 | 0.0% |
| Cuba | 84 | 0.1% |
| Denmark | 18 | 0.0% |
| Dominica | 305 | 0.4% |
| Dominican Republic | 2 | 0.0% |
| Eastern Asia | 97 | 0.1% |
| Eastern Europe | 34 | 0.0% |
| Ecuador | 55 | 0.1% |
| Egypt | 58 | 0.1% |
| El Salvador | 404 | 0.5% |
| England | 5 | 0.0% |
| Europe | 166 | 0.2% |
| Germany | 86 | 0.1% |
| Guatemala | 64 | 0.1% |
| Honduras | 498 | 0.6% |
| India | 303 | 0.4% |
| Iraq | 23 | 0.0% |
| Korea | 19 | 0.0% |
| Latin America | 15,729 | 18.6% |
| Latvia | 15 | 0.0% |
| Mexico | 12,947 | 15.3% |
| Middle Africa | 20 | 0.0% |
| Nicaragua | 15 | 0.0% |
| Nigeria | 73 | 0.1% |
| Northern Africa | 69 | 0.1% |
| Northern Europe | 46 | 0.1% |
| Oceania | 22 | 0.0% |
| Pakistan | 142 | 0.2% |
| Peru | 31 | 0.0% |
| Philippines | 349 | 0.4% |
| Russia | 10 | 0.0% |
| Saudi Arabia | 21 | 0.0% |
| South America | 314 | 0.4% |
| South Central Asia | 445 | 0.5% |
| South Eastern Asia | 767 | 0.9% |
| Taiwan | 52 | 0.1% |
| Thailand | 53 | 0.1% |
| Trinidad and Tobago | 335 | 0.4% |
| Ukraine | 9 | 0.0% |
| Venezuela | 22 | 0.0% |
| Vietnam | 241 | 0.3% |
| West Indies | 274 | 0.3% |
| Western Africa | 73 | 0.1% |
| Western Asia | 44 | 0.1% |
| Western Europe | 86 | 0.1% | View All 56 Rows |
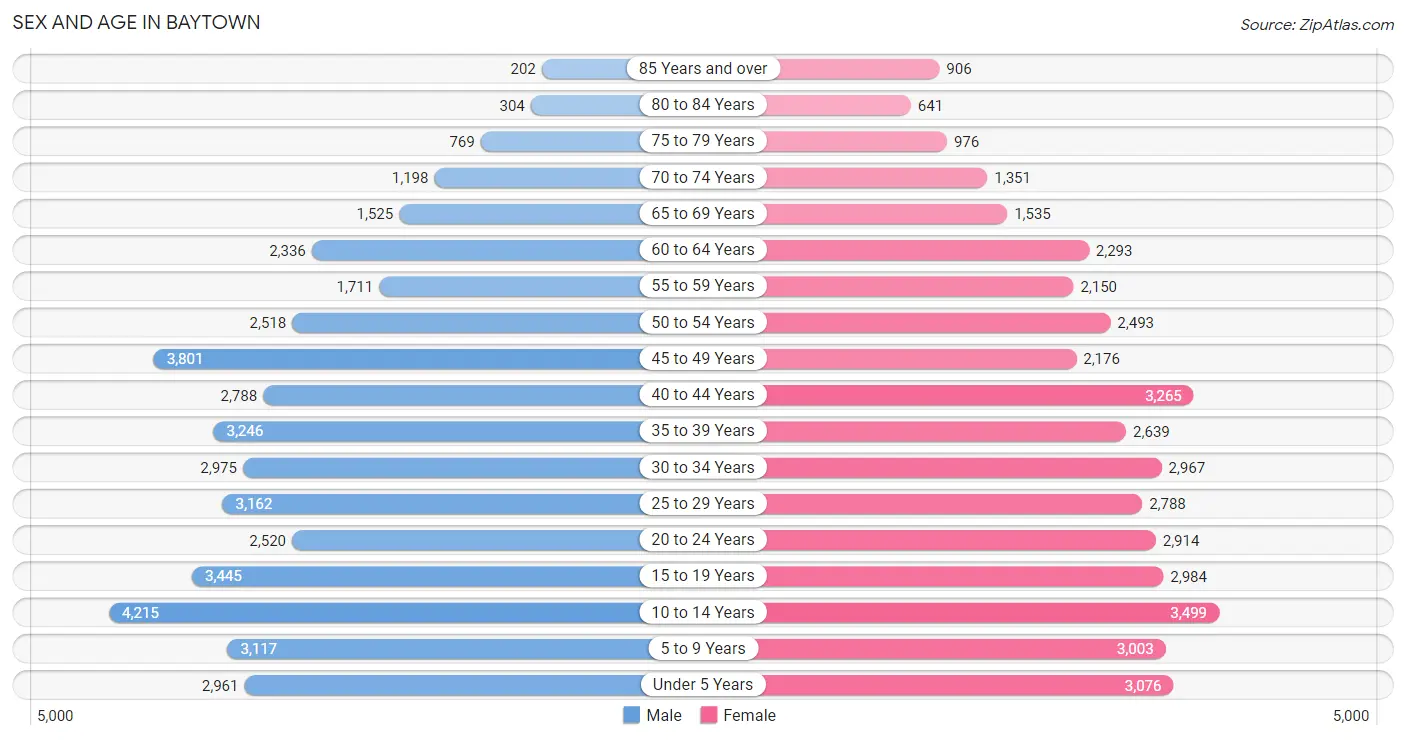
Sex and Age in Baytown
Sex and Age in Baytown
The most populous age groups in Baytown are 10 to 14 Years (4,215 | 9.9%) for men and 10 to 14 Years (3,499 | 8.4%) for women.
| Age Bracket | Male | Female |
| Under 5 Years | 2,961 (6.9%) | 3,076 (7.4%) |
| 5 to 9 Years | 3,117 (7.3%) | 3,003 (7.2%) |
| 10 to 14 Years | 4,215 (9.9%) | 3,499 (8.4%) |
| 15 to 19 Years | 3,445 (8.1%) | 2,984 (7.2%) |
| 20 to 24 Years | 2,520 (5.9%) | 2,914 (7.0%) |
| 25 to 29 Years | 3,162 (7.4%) | 2,788 (6.7%) |
| 30 to 34 Years | 2,975 (7.0%) | 2,967 (7.1%) |
| 35 to 39 Years | 3,246 (7.6%) | 2,639 (6.3%) |
| 40 to 44 Years | 2,788 (6.5%) | 3,265 (7.8%) |
| 45 to 49 Years | 3,801 (8.9%) | 2,176 (5.2%) |
| 50 to 54 Years | 2,518 (5.9%) | 2,493 (6.0%) |
| 55 to 59 Years | 1,711 (4.0%) | 2,150 (5.2%) |
| 60 to 64 Years | 2,336 (5.5%) | 2,293 (5.5%) |
| 65 to 69 Years | 1,525 (3.6%) | 1,535 (3.7%) |
| 70 to 74 Years | 1,198 (2.8%) | 1,351 (3.2%) |
| 75 to 79 Years | 769 (1.8%) | 976 (2.3%) |
| 80 to 84 Years | 304 (0.7%) | 641 (1.5%) |
| 85 Years and over | 202 (0.5%) | 906 (2.2%) |
| Total | 42,793 (100.0%) | 41,656 (100.0%) |
Families and Households in Baytown
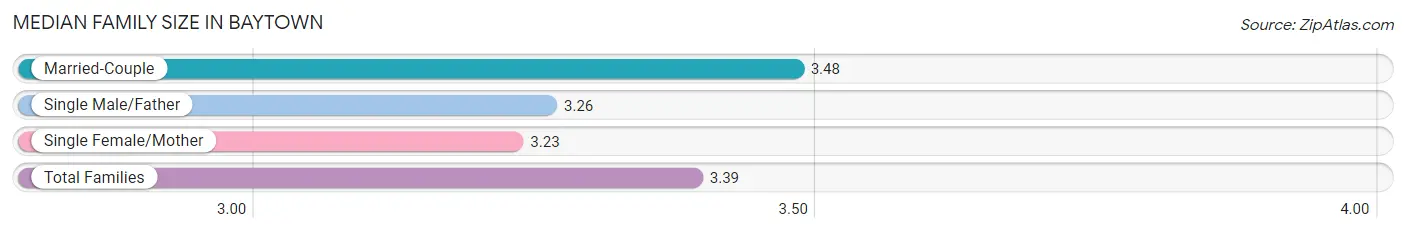
Median Family Size in Baytown
The median family size in Baytown is 3.39 persons per family, with married-couple families (12,968 | 63.1%) accounting for the largest median family size of 3.48 persons per family. On the other hand, single female/mother families (5,331 | 26.0%) represent the smallest median family size with 3.23 persons per family.
| Family Type | # Families | Family Size |
| Married-Couple | 12,968 (63.1%) | 3.48 |
| Single Male/Father | 2,240 (10.9%) | 3.26 |
| Single Female/Mother | 5,331 (26.0%) | 3.23 |
| Total Families | 20,539 (100.0%) | 3.39 |
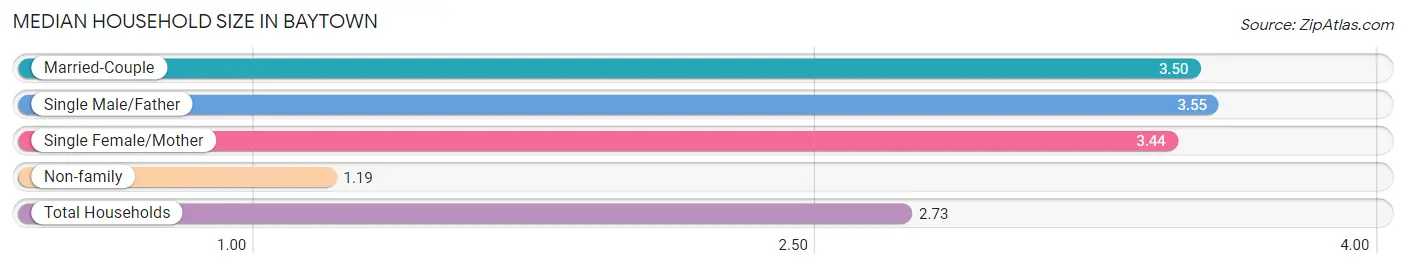
Median Household Size in Baytown
The median household size in Baytown is 2.73 persons per household, with single male/father households (2,240 | 7.3%) accounting for the largest median household size of 3.55 persons per household. non-family households (10,210 | 33.2%) represent the smallest median household size with 1.19 persons per household.
| Household Type | # Households | Household Size |
| Married-Couple | 12,968 (42.2%) | 3.50 |
| Single Male/Father | 2,240 (7.3%) | 3.55 |
| Single Female/Mother | 5,331 (17.3%) | 3.44 |
| Non-family | 10,210 (33.2%) | 1.19 |
| Total Households | 30,749 (100.0%) | 2.73 |
Household Size by Marriage Status in Baytown
Out of a total of 30,749 households in Baytown, 20,539 (66.8%) are family households, while 10,210 (33.2%) are nonfamily households. The most numerous type of family households are 2-person households, comprising 7,079, and the most common type of nonfamily households are 1-person households, comprising 8,513.
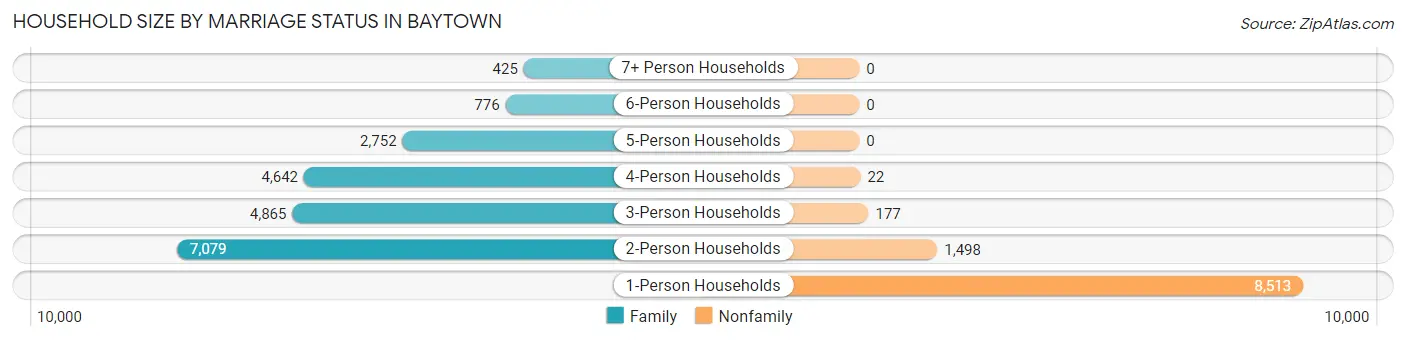
| Household Size | Family Households | Nonfamily Households |
| 1-Person Households | - | 8,513 (27.7%) |
| 2-Person Households | 7,079 (23.0%) | 1,498 (4.9%) |
| 3-Person Households | 4,865 (15.8%) | 177 (0.6%) |
| 4-Person Households | 4,642 (15.1%) | 22 (0.1%) |
| 5-Person Households | 2,752 (8.9%) | 0 (0.0%) |
| 6-Person Households | 776 (2.5%) | 0 (0.0%) |
| 7+ Person Households | 425 (1.4%) | 0 (0.0%) |
| Total | 20,539 (66.8%) | 10,210 (33.2%) |
Female Fertility in Baytown
Fertility by Age in Baytown
Average fertility rate in Baytown is 52.0 births per 1,000 women. Women in the age bracket of 20 to 34 years have the highest fertility rate with 109.0 births per 1,000 women. Women in the age bracket of 20 to 34 years acount for 89.3% of all women with births.
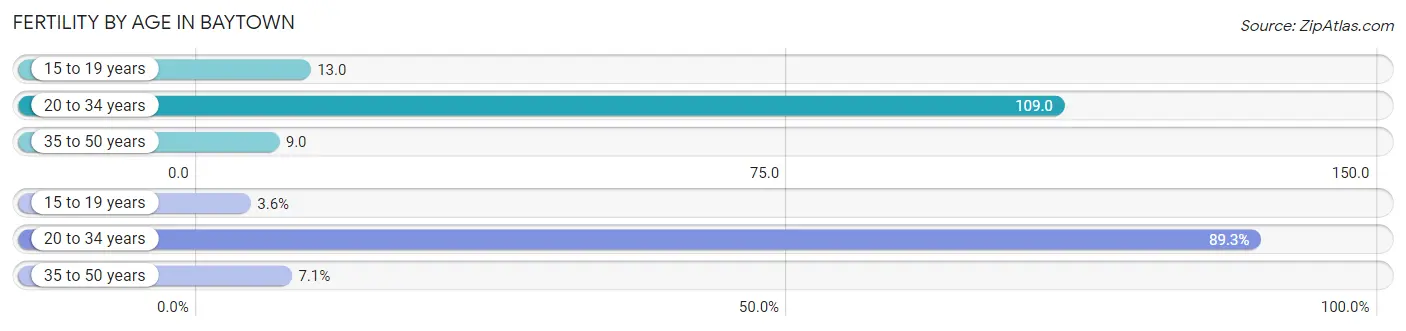
| Age Bracket | Women with Births | Births / 1,000 Women |
| 15 to 19 years | 38 (3.6%) | 13.0 |
| 20 to 34 years | 946 (89.3%) | 109.0 |
| 35 to 50 years | 75 (7.1%) | 9.0 |
| Total | 1,059 (100.0%) | 52.0 |
Fertility by Age by Marriage Status in Baytown
57.5% of women with births (1,059) in Baytown are married. The highest percentage of unmarried women with births falls into 35 to 50 years age bracket with 80.0% of them unmarried at the time of birth, while the lowest percentage of unmarried women with births belong to 15 to 19 years age bracket with 0.0% of them unmarried.
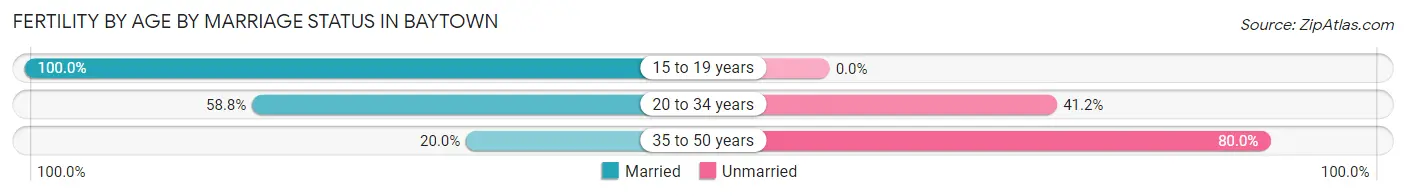
| Age Bracket | Married | Unmarried |
| 15 to 19 years | 38 (100.0%) | 0 (0.0%) |
| 20 to 34 years | 556 (58.8%) | 390 (41.2%) |
| 35 to 50 years | 15 (20.0%) | 60 (80.0%) |
| Total | 609 (57.5%) | 450 (42.5%) |
Fertility by Education in Baytown
Average fertility rate in Baytown is 52.0 births per 1,000 women. Women with the education attainment of bachelor's degree have the highest fertility rate of 122.0 births per 1,000 women, while women with the education attainment of less than high school have the lowest fertility at 27.0 births per 1,000 women. Women with the education attainment of college or associate's degree represent 36.4% of all women with births.
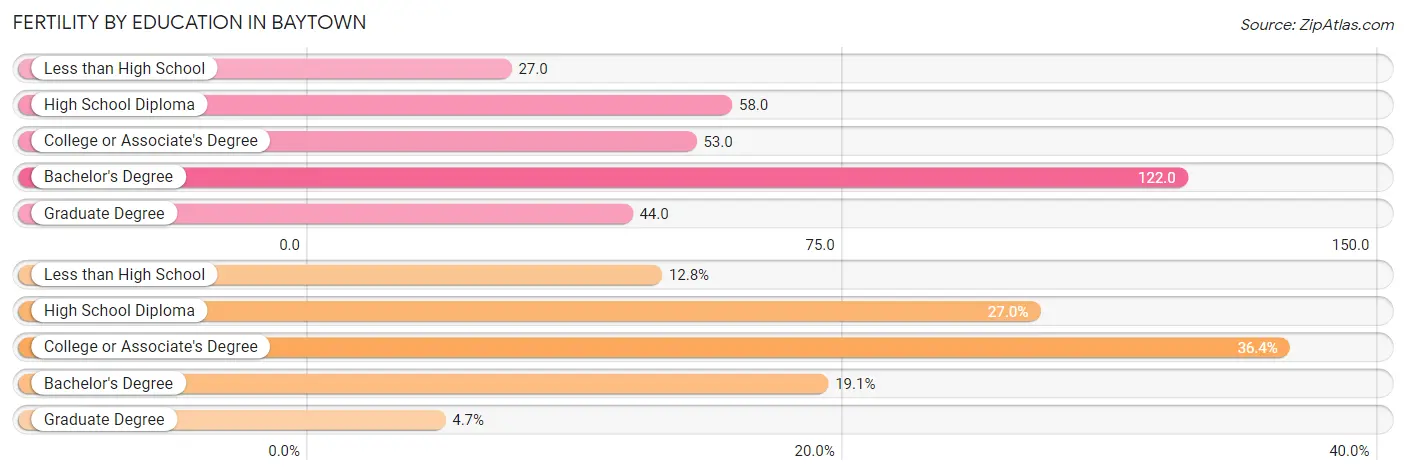
| Educational Attainment | Women with Births | Births / 1,000 Women |
| Less than High School | 136 (12.8%) | 27.0 |
| High School Diploma | 286 (27.0%) | 58.0 |
| College or Associate's Degree | 385 (36.4%) | 53.0 |
| Bachelor's Degree | 202 (19.1%) | 122.0 |
| Graduate Degree | 50 (4.7%) | 44.0 |
| Total | 1,059 (100.0%) | 52.0 |
Fertility by Education by Marriage Status in Baytown
42.5% of women with births in Baytown are unmarried. Women with the educational attainment of graduate degree are most likely to be married with 100.0% of them married at childbirth, while women with the educational attainment of less than high school are least likely to be married with 64.7% of them unmarried at childbirth.
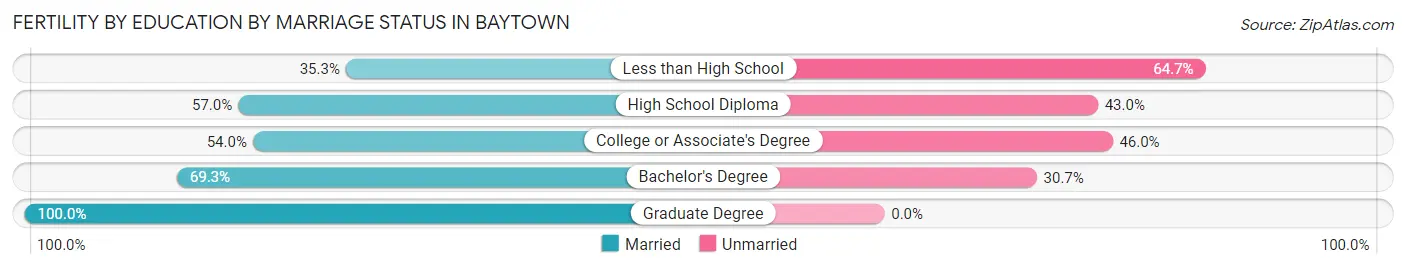
| Educational Attainment | Married | Unmarried |
| Less than High School | 48 (35.3%) | 88 (64.7%) |
| High School Diploma | 163 (57.0%) | 123 (43.0%) |
| College or Associate's Degree | 208 (54.0%) | 177 (46.0%) |
| Bachelor's Degree | 140 (69.3%) | 62 (30.7%) |
| Graduate Degree | 50 (100.0%) | 0 (0.0%) |
| Total | 609 (57.5%) | 450 (42.5%) |
Employment Characteristics in Baytown
Employment by Class of Employer in Baytown
Among the 36,614 employed individuals in Baytown, private company employees (27,997 | 76.5%), local government employees (2,866 | 7.8%), and self-employed (not incorporated) (2,141 | 5.9%) make up the most common classes of employment.
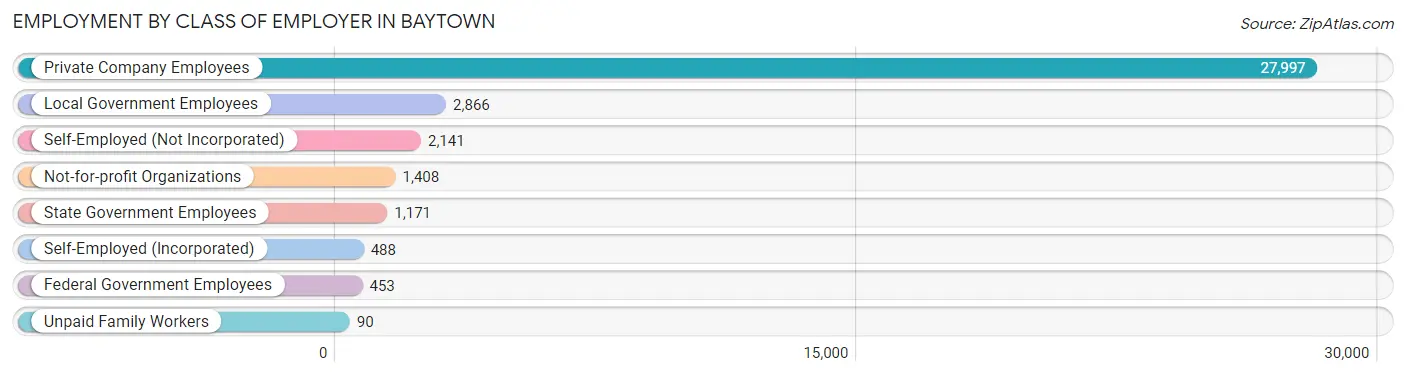
| Employer Class | # Employees | % Employees |
| Private Company Employees | 27,997 | 76.5% |
| Self-Employed (Incorporated) | 488 | 1.3% |
| Self-Employed (Not Incorporated) | 2,141 | 5.9% |
| Not-for-profit Organizations | 1,408 | 3.8% |
| Local Government Employees | 2,866 | 7.8% |
| State Government Employees | 1,171 | 3.2% |
| Federal Government Employees | 453 | 1.2% |
| Unpaid Family Workers | 90 | 0.3% |
| Total | 36,614 | 100.0% |
Employment Status by Age in Baytown
According to the labor force statistics for Baytown, out of the total population over 16 years of age (63,517), 64.4% or 40,905 individuals are in the labor force, with 9.2% or 3,763 of them unemployed. The age group with the highest labor force participation rate is 35 to 44 years, with 83.2% or 9,932 individuals in the labor force. Within the labor force, the 75 years and over age range has the highest percentage of unemployed individuals, with 19.4% or 28 of them being unemployed.
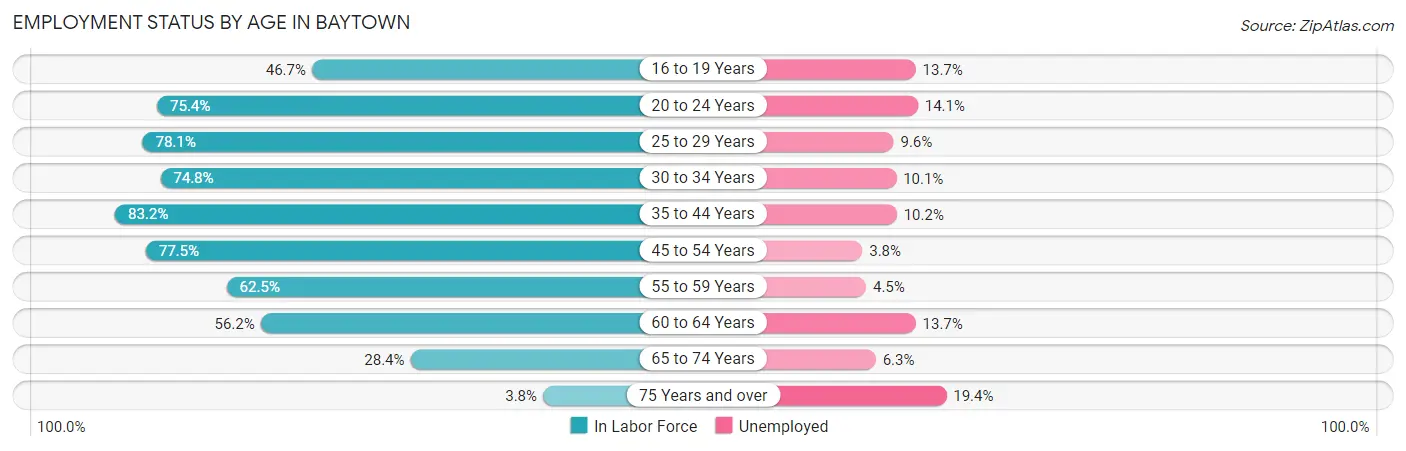
| Age Bracket | In Labor Force | Unemployed |
| 16 to 19 Years | 2,507 (46.7%) | 343 (13.7%) |
| 20 to 24 Years | 4,097 (75.4%) | 578 (14.1%) |
| 25 to 29 Years | 4,647 (78.1%) | 446 (9.6%) |
| 30 to 34 Years | 4,445 (74.8%) | 449 (10.1%) |
| 35 to 44 Years | 9,932 (83.2%) | 1,013 (10.2%) |
| 45 to 54 Years | 8,516 (77.5%) | 324 (3.8%) |
| 55 to 59 Years | 2,413 (62.5%) | 109 (4.5%) |
| 60 to 64 Years | 2,601 (56.2%) | 356 (13.7%) |
| 65 to 74 Years | 1,593 (28.4%) | 100 (6.3%) |
| 75 Years and over | 144 (3.8%) | 28 (19.4%) |
| Total | 40,905 (64.4%) | 3,763 (9.2%) |
Employment Status by Educational Attainment in Baytown
According to labor force statistics for Baytown, 75.2% of individuals (32,568) out of the total population between 25 and 64 years of age (43,308) are in the labor force, with 8.3% or 2,703 of them being unemployed. The group with the highest labor force participation rate are those with the educational attainment of bachelor's degree or higher, with 83.1% or 5,127 individuals in the labor force. Within the labor force, individuals with less than high school education have the highest percentage of unemployment, with 12.2% or 770 of them being unemployed.
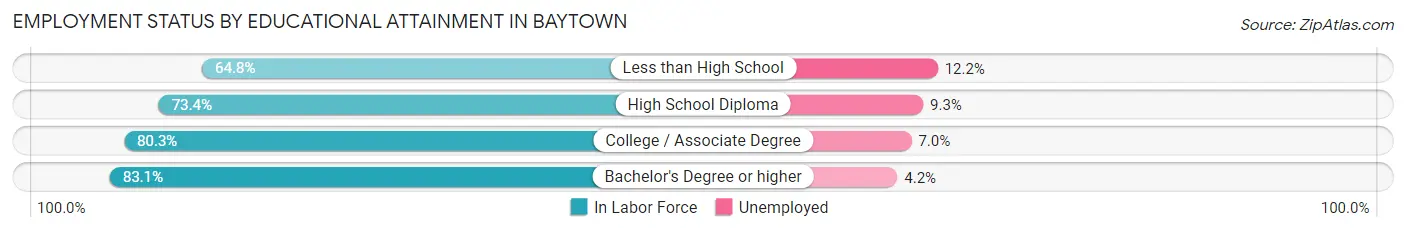
| Educational Attainment | In Labor Force | Unemployed |
| Less than High School | 6,308 (64.8%) | 1,188 (12.2%) |
| High School Diploma | 9,546 (73.4%) | 1,210 (9.3%) |
| College / Associate Degree | 11,561 (80.3%) | 1,008 (7.0%) |
| Bachelor's Degree or higher | 5,127 (83.1%) | 259 (4.2%) |
| Total | 32,568 (75.2%) | 3,595 (8.3%) |
Employment Occupations by Sex in Baytown
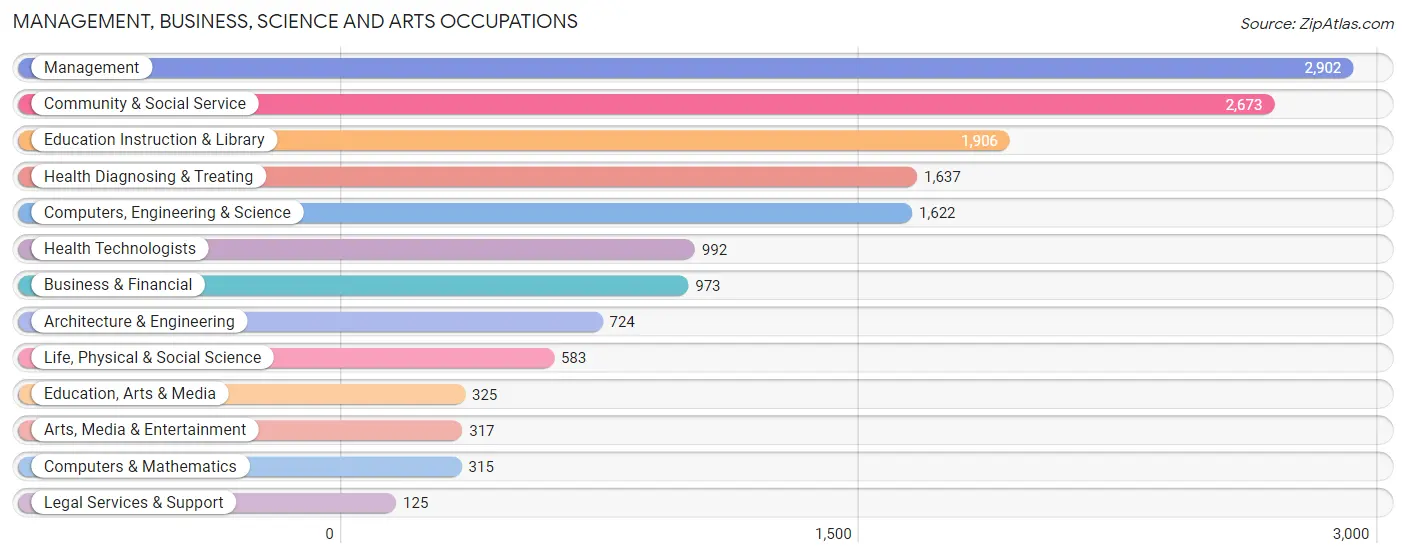
Management, Business, Science and Arts Occupations
The most common Management, Business, Science and Arts occupations in Baytown are Management (2,902 | 7.8%), Community & Social Service (2,673 | 7.2%), Education Instruction & Library (1,906 | 5.1%), Health Diagnosing & Treating (1,637 | 4.4%), and Computers, Engineering & Science (1,622 | 4.4%).
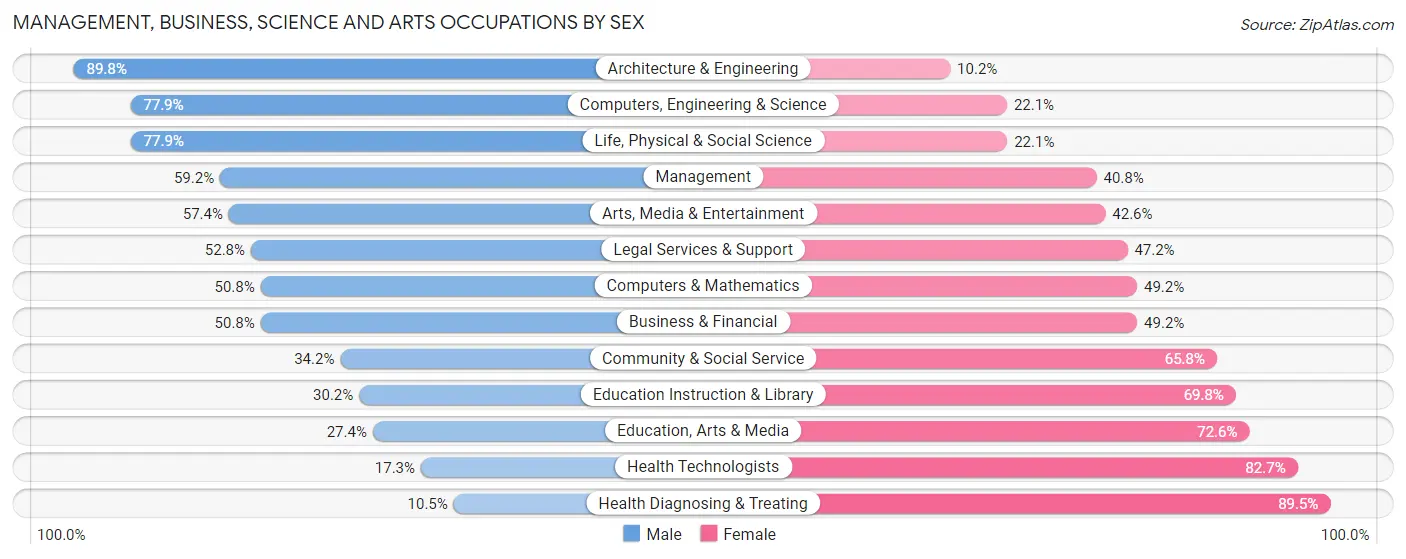
Management, Business, Science and Arts Occupations by Sex
Within the Management, Business, Science and Arts occupations in Baytown, the most male-oriented occupations are Architecture & Engineering (89.8%), Computers, Engineering & Science (77.9%), and Life, Physical & Social Science (77.9%), while the most female-oriented occupations are Health Diagnosing & Treating (89.5%), Health Technologists (82.7%), and Education, Arts & Media (72.6%).
| Occupation | Male | Female |
| Management | 1,719 (59.2%) | 1,183 (40.8%) |
| Business & Financial | 494 (50.8%) | 479 (49.2%) |
| Computers, Engineering & Science | 1,264 (77.9%) | 358 (22.1%) |
| Computers & Mathematics | 160 (50.8%) | 155 (49.2%) |
| Architecture & Engineering | 650 (89.8%) | 74 (10.2%) |
| Life, Physical & Social Science | 454 (77.9%) | 129 (22.1%) |
| Community & Social Service | 913 (34.2%) | 1,760 (65.8%) |
| Education, Arts & Media | 89 (27.4%) | 236 (72.6%) |
| Legal Services & Support | 66 (52.8%) | 59 (47.2%) |
| Education Instruction & Library | 576 (30.2%) | 1,330 (69.8%) |
| Arts, Media & Entertainment | 182 (57.4%) | 135 (42.6%) |
| Health Diagnosing & Treating | 172 (10.5%) | 1,465 (89.5%) |
| Health Technologists | 172 (17.3%) | 820 (82.7%) |
| Total (Category) | 4,562 (46.5%) | 5,245 (53.5%) |
| Total (Overall) | 20,864 (56.3%) | 16,224 (43.7%) |
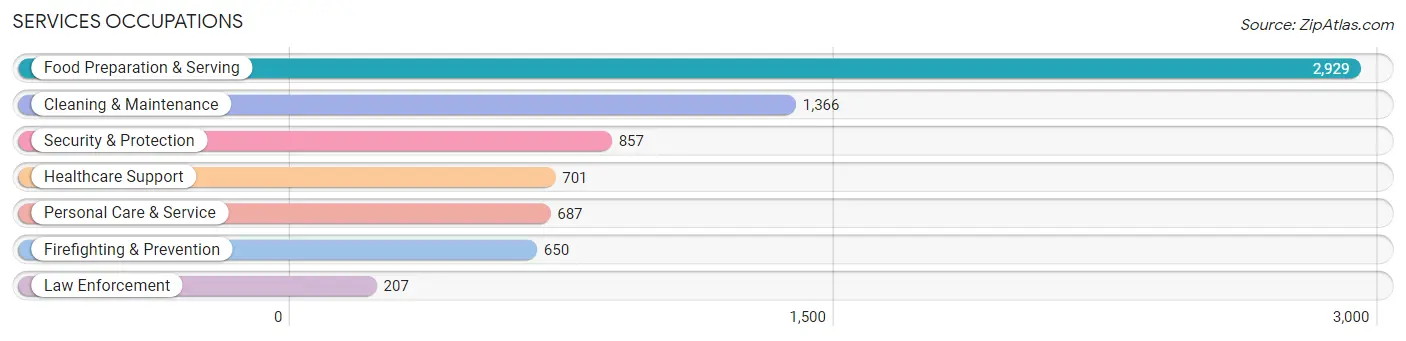
Services Occupations
The most common Services occupations in Baytown are Food Preparation & Serving (2,929 | 7.9%), Cleaning & Maintenance (1,366 | 3.7%), Security & Protection (857 | 2.3%), Healthcare Support (701 | 1.9%), and Personal Care & Service (687 | 1.8%).
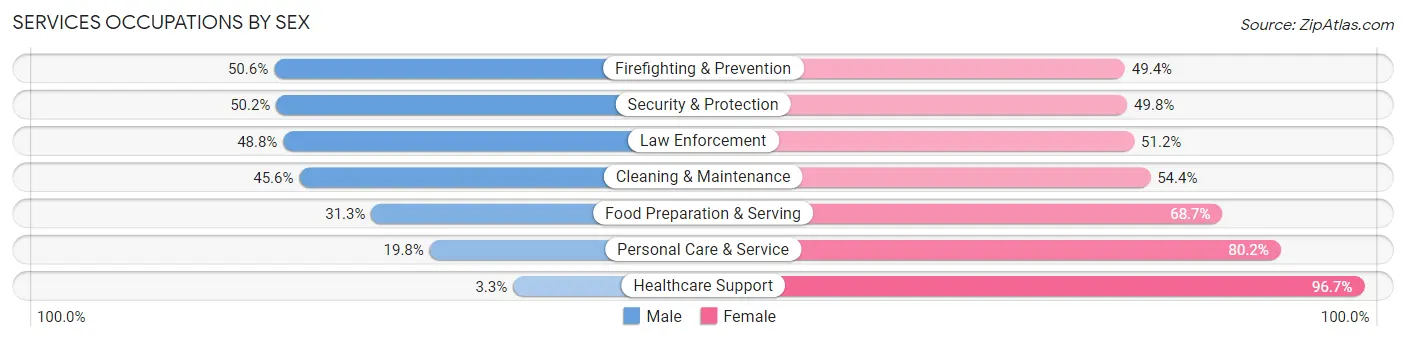
Services Occupations by Sex
Within the Services occupations in Baytown, the most male-oriented occupations are Firefighting & Prevention (50.6%), Security & Protection (50.2%), and Law Enforcement (48.8%), while the most female-oriented occupations are Healthcare Support (96.7%), Personal Care & Service (80.2%), and Food Preparation & Serving (68.7%).
| Occupation | Male | Female |
| Healthcare Support | 23 (3.3%) | 678 (96.7%) |
| Security & Protection | 430 (50.2%) | 427 (49.8%) |
| Firefighting & Prevention | 329 (50.6%) | 321 (49.4%) |
| Law Enforcement | 101 (48.8%) | 106 (51.2%) |
| Food Preparation & Serving | 918 (31.3%) | 2,011 (68.7%) |
| Cleaning & Maintenance | 623 (45.6%) | 743 (54.4%) |
| Personal Care & Service | 136 (19.8%) | 551 (80.2%) |
| Total (Category) | 2,130 (32.6%) | 4,410 (67.4%) |
| Total (Overall) | 20,864 (56.3%) | 16,224 (43.7%) |
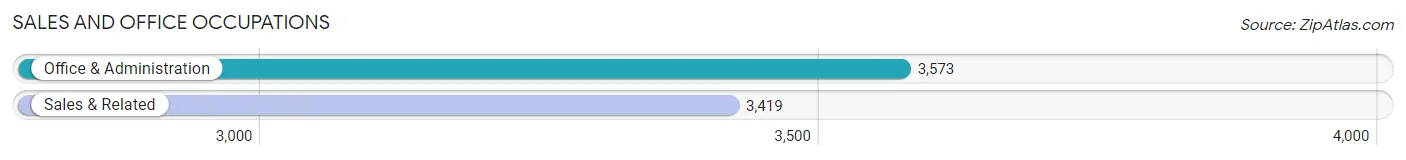
Sales and Office Occupations
The most common Sales and Office occupations in Baytown are Office & Administration (3,573 | 9.6%), and Sales & Related (3,419 | 9.2%).
Sales and Office Occupations by Sex
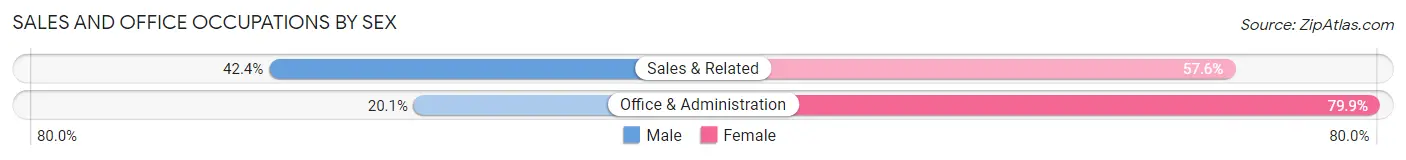
| Occupation | Male | Female |
| Sales & Related | 1,449 (42.4%) | 1,970 (57.6%) |
| Office & Administration | 719 (20.1%) | 2,854 (79.9%) |
| Total (Category) | 2,168 (31.0%) | 4,824 (69.0%) |
| Total (Overall) | 20,864 (56.3%) | 16,224 (43.7%) |
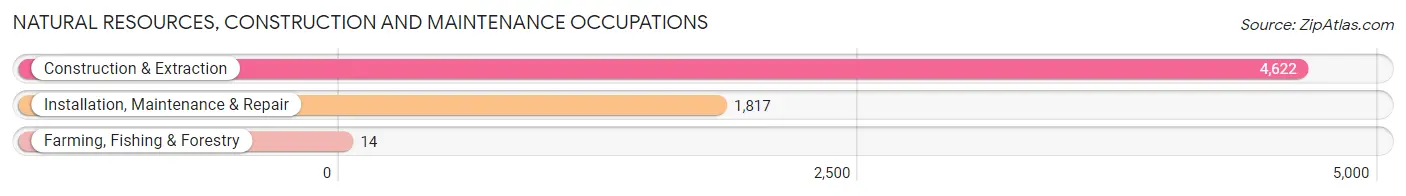
Natural Resources, Construction and Maintenance Occupations
The most common Natural Resources, Construction and Maintenance occupations in Baytown are Construction & Extraction (4,622 | 12.5%), Installation, Maintenance & Repair (1,817 | 4.9%), and Farming, Fishing & Forestry (14 | 0.0%).
Natural Resources, Construction and Maintenance Occupations by Sex
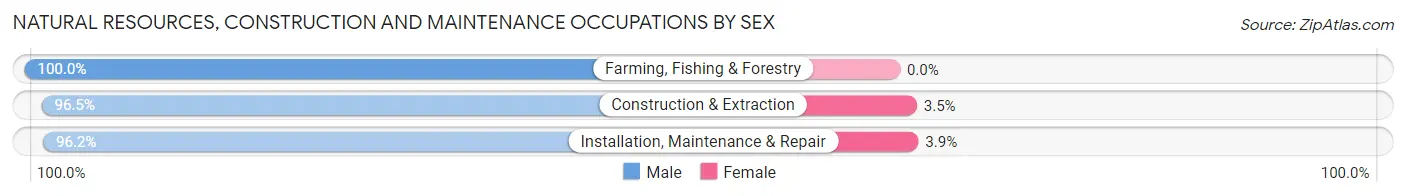
| Occupation | Male | Female |
| Farming, Fishing & Forestry | 14 (100.0%) | 0 (0.0%) |
| Construction & Extraction | 4,459 (96.5%) | 163 (3.5%) |
| Installation, Maintenance & Repair | 1,747 (96.2%) | 70 (3.8%) |
| Total (Category) | 6,220 (96.4%) | 233 (3.6%) |
| Total (Overall) | 20,864 (56.3%) | 16,224 (43.7%) |
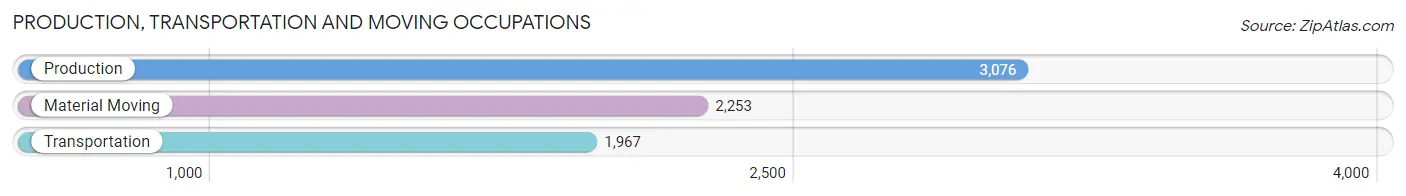
Production, Transportation and Moving Occupations
The most common Production, Transportation and Moving occupations in Baytown are Production (3,076 | 8.3%), Material Moving (2,253 | 6.1%), and Transportation (1,967 | 5.3%).
Production, Transportation and Moving Occupations by Sex
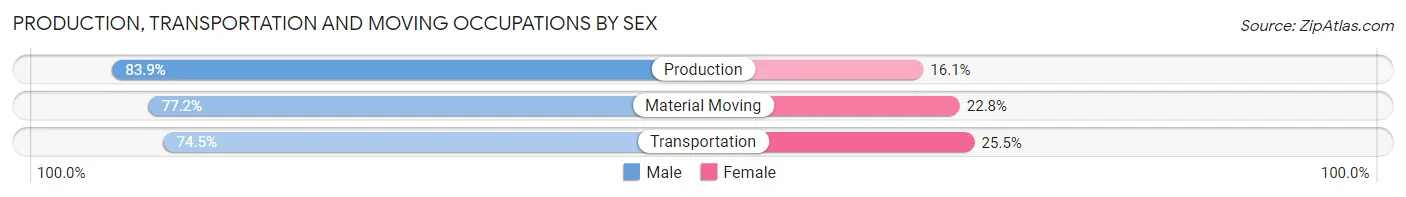
| Occupation | Male | Female |
| Production | 2,580 (83.9%) | 496 (16.1%) |
| Transportation | 1,465 (74.5%) | 502 (25.5%) |
| Material Moving | 1,739 (77.2%) | 514 (22.8%) |
| Total (Category) | 5,784 (79.3%) | 1,512 (20.7%) |
| Total (Overall) | 20,864 (56.3%) | 16,224 (43.7%) |
Employment Industries by Sex in Baytown
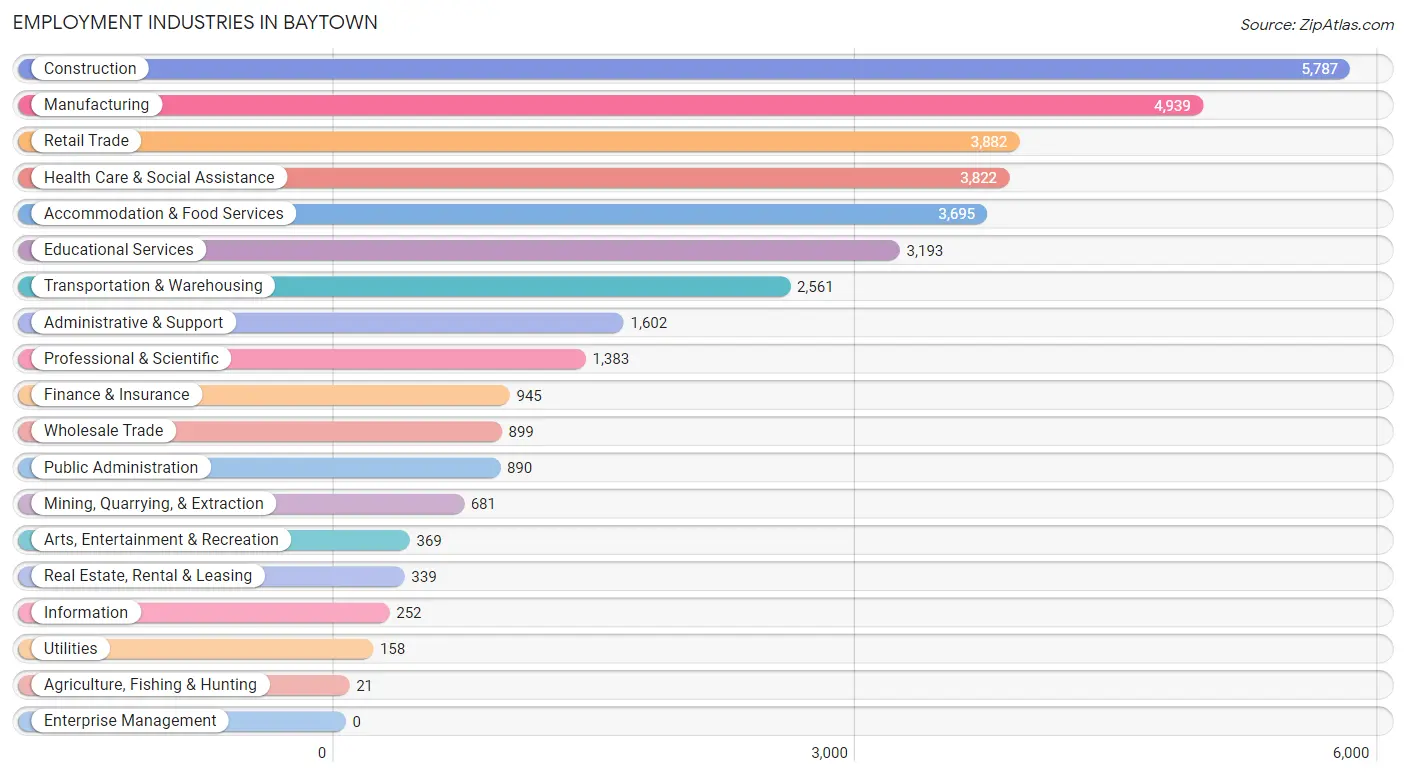
Employment Industries in Baytown
The major employment industries in Baytown include Construction (5,787 | 15.6%), Manufacturing (4,939 | 13.3%), Retail Trade (3,882 | 10.5%), Health Care & Social Assistance (3,822 | 10.3%), and Accommodation & Food Services (3,695 | 10.0%).
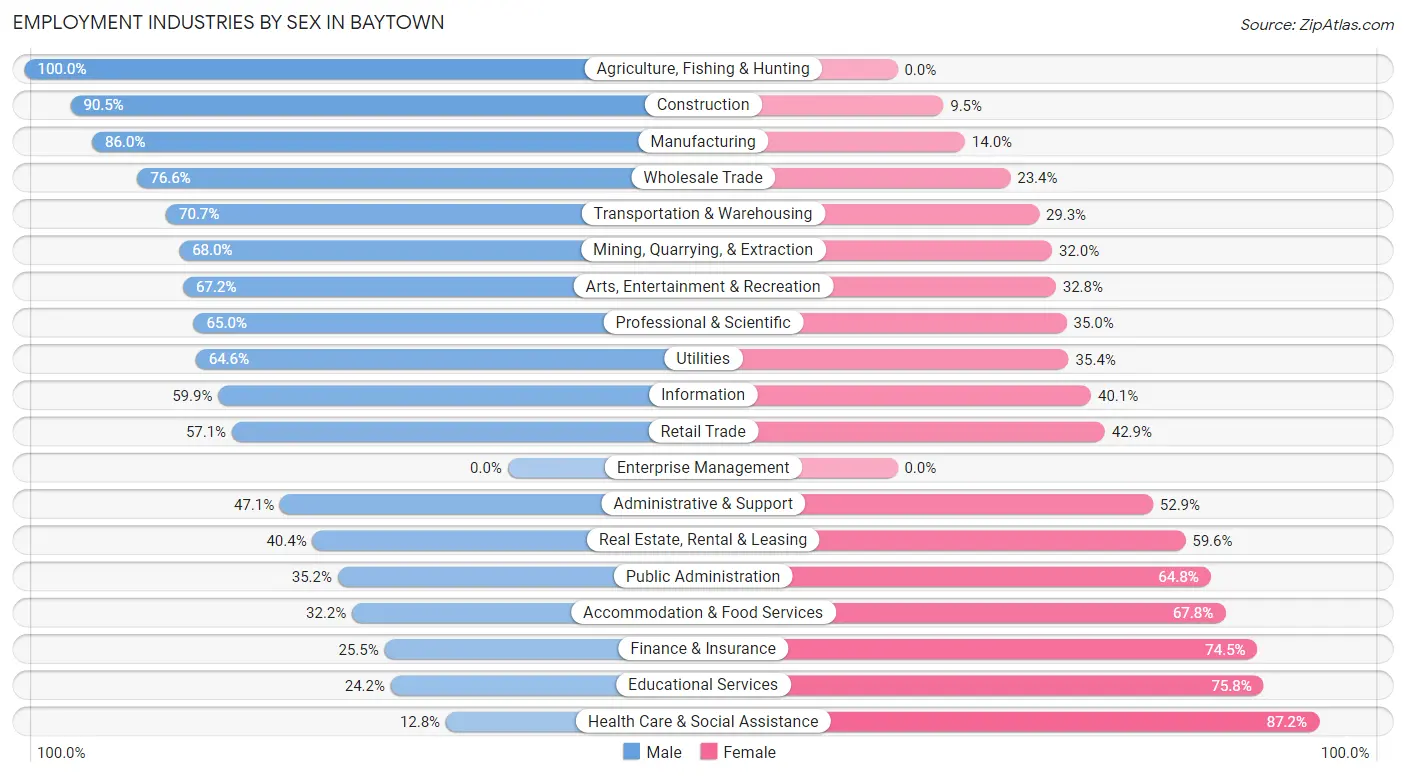
Employment Industries by Sex in Baytown
The Baytown industries that see more men than women are Agriculture, Fishing & Hunting (100.0%), Construction (90.5%), and Manufacturing (86.0%), whereas the industries that tend to have a higher number of women are Health Care & Social Assistance (87.2%), Educational Services (75.8%), and Finance & Insurance (74.5%).
| Industry | Male | Female |
| Agriculture, Fishing & Hunting | 21 (100.0%) | 0 (0.0%) |
| Mining, Quarrying, & Extraction | 463 (68.0%) | 218 (32.0%) |
| Construction | 5,237 (90.5%) | 550 (9.5%) |
| Manufacturing | 4,249 (86.0%) | 690 (14.0%) |
| Wholesale Trade | 689 (76.6%) | 210 (23.4%) |
| Retail Trade | 2,216 (57.1%) | 1,666 (42.9%) |
| Transportation & Warehousing | 1,811 (70.7%) | 750 (29.3%) |
| Utilities | 102 (64.6%) | 56 (35.4%) |
| Information | 151 (59.9%) | 101 (40.1%) |
| Finance & Insurance | 241 (25.5%) | 704 (74.5%) |
| Real Estate, Rental & Leasing | 137 (40.4%) | 202 (59.6%) |
| Professional & Scientific | 899 (65.0%) | 484 (35.0%) |
| Enterprise Management | 0 (0.0%) | 0 (0.0%) |
| Administrative & Support | 755 (47.1%) | 847 (52.9%) |
| Educational Services | 773 (24.2%) | 2,420 (75.8%) |
| Health Care & Social Assistance | 489 (12.8%) | 3,333 (87.2%) |
| Arts, Entertainment & Recreation | 248 (67.2%) | 121 (32.8%) |
| Accommodation & Food Services | 1,190 (32.2%) | 2,505 (67.8%) |
| Public Administration | 313 (35.2%) | 577 (64.8%) |
| Total | 20,864 (56.3%) | 16,224 (43.7%) |
Education in Baytown
School Enrollment in Baytown
The most common levels of schooling among the 22,547 students in Baytown are middle school (6,597 | 29.3%), high school (5,560 | 24.7%), and elementary school (4,950 | 22.0%).
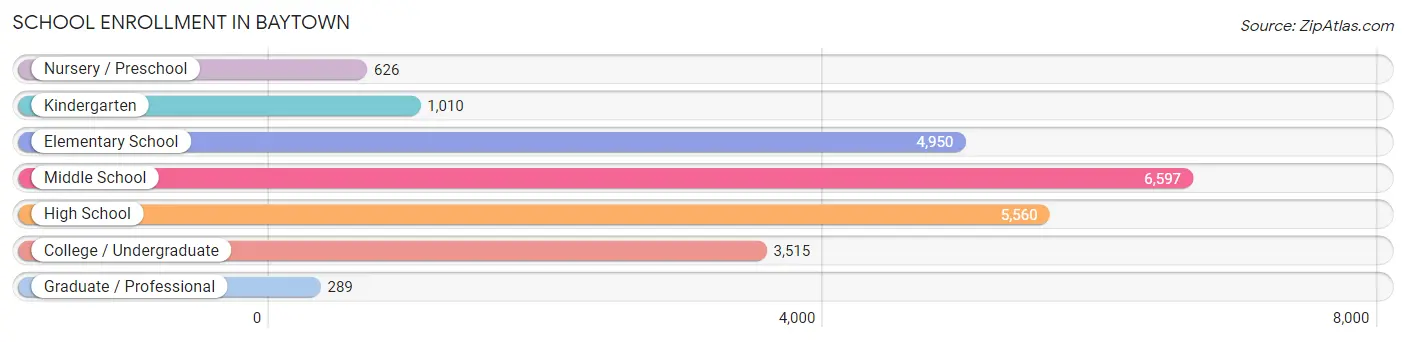
| School Level | # Students | % Students |
| Nursery / Preschool | 626 | 2.8% |
| Kindergarten | 1,010 | 4.5% |
| Elementary School | 4,950 | 22.0% |
| Middle School | 6,597 | 29.3% |
| High School | 5,560 | 24.7% |
| College / Undergraduate | 3,515 | 15.6% |
| Graduate / Professional | 289 | 1.3% |
| Total | 22,547 | 100.0% |
School Enrollment by Age by Funding Source in Baytown
Out of a total of 22,547 students who are enrolled in schools in Baytown, 1,556 (6.9%) attend a private institution, while the remaining 20,991 (93.1%) are enrolled in public schools. The age group of 3 to 4 year olds has the highest likelihood of being enrolled in private schools, with 124 (25.0% in the age bracket) enrolled. Conversely, the age group of 15 to 17 year olds has the lowest likelihood of being enrolled in a private school, with 3,745 (97.7% in the age bracket) attending a public institution.
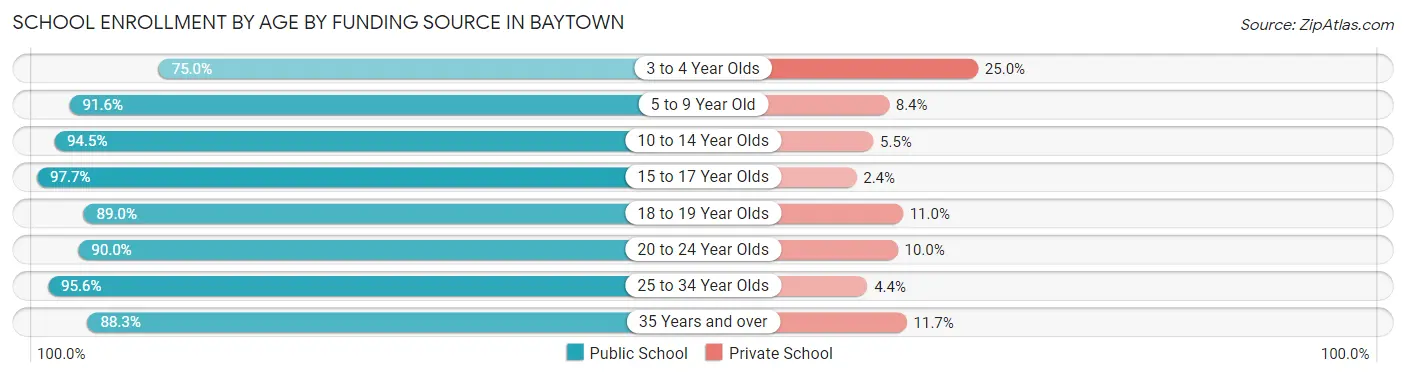
| Age Bracket | Public School | Private School |
| 3 to 4 Year Olds | 372 (75.0%) | 124 (25.0%) |
| 5 to 9 Year Old | 5,072 (91.6%) | 465 (8.4%) |
| 10 to 14 Year Olds | 7,112 (94.5%) | 412 (5.5%) |
| 15 to 17 Year Olds | 3,745 (97.7%) | 90 (2.4%) |
| 18 to 19 Year Olds | 1,578 (89.0%) | 195 (11.0%) |
| 20 to 24 Year Olds | 1,247 (90.0%) | 139 (10.0%) |
| 25 to 34 Year Olds | 1,264 (95.6%) | 58 (4.4%) |
| 35 Years and over | 595 (88.3%) | 79 (11.7%) |
| Total | 20,991 (93.1%) | 1,556 (6.9%) |
Educational Attainment by Field of Study in Baytown
Business (1,466 | 17.6%), education (996 | 11.9%), science & technology (993 | 11.9%), engineering (861 | 10.3%), and arts & humanities (614 | 7.4%) are the most common fields of study among 8,332 individuals in Baytown who have obtained a bachelor's degree or higher.
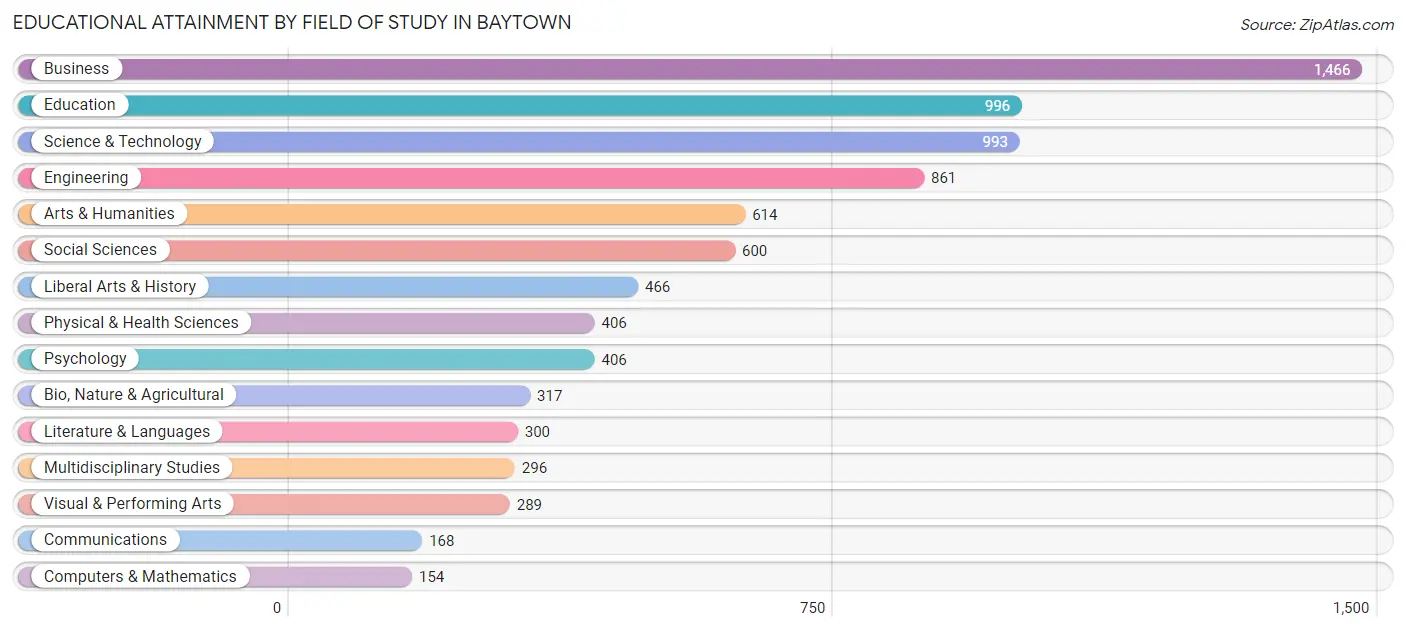
| Field of Study | # Graduates | % Graduates |
| Computers & Mathematics | 154 | 1.8% |
| Bio, Nature & Agricultural | 317 | 3.8% |
| Physical & Health Sciences | 406 | 4.9% |
| Psychology | 406 | 4.9% |
| Social Sciences | 600 | 7.2% |
| Engineering | 861 | 10.3% |
| Multidisciplinary Studies | 296 | 3.5% |
| Science & Technology | 993 | 11.9% |
| Business | 1,466 | 17.6% |
| Education | 996 | 11.9% |
| Literature & Languages | 300 | 3.6% |
| Liberal Arts & History | 466 | 5.6% |
| Visual & Performing Arts | 289 | 3.5% |
| Communications | 168 | 2.0% |
| Arts & Humanities | 614 | 7.4% |
| Total | 8,332 | 100.0% |
Transportation & Commute in Baytown
Vehicle Availability by Sex in Baytown
The most prevalent vehicle ownership categories in Baytown are males with 2 vehicles (9,335, accounting for 45.0%) and females with 2 vehicles (6,265, making up 58.8%).
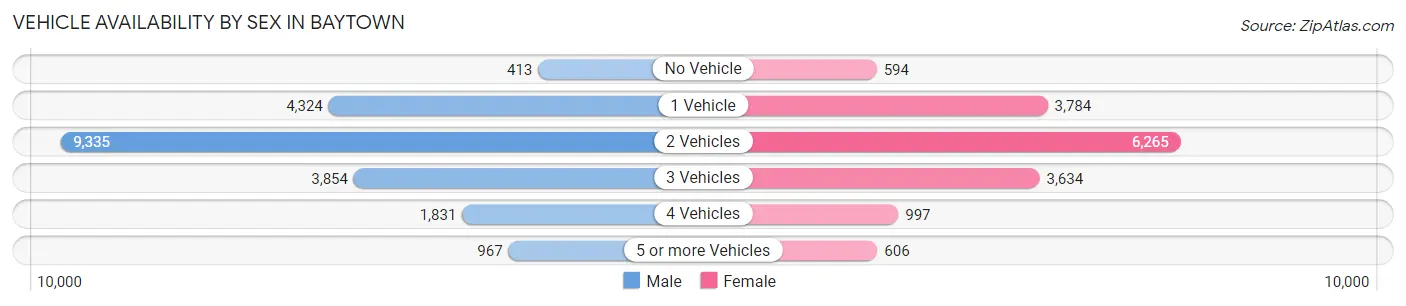
| Vehicles Available | Male | Female |
| No Vehicle | 413 (2.0%) | 594 (3.7%) |
| 1 Vehicle | 4,324 (20.9%) | 3,784 (23.8%) |
| 2 Vehicles | 9,335 (45.0%) | 6,265 (39.5%) |
| 3 Vehicles | 3,854 (18.6%) | 3,634 (22.9%) |
| 4 Vehicles | 1,831 (8.8%) | 997 (6.3%) |
| 5 or more Vehicles | 967 (4.7%) | 606 (3.8%) |
| Total | 20,724 (100.0%) | 15,880 (100.0%) |
Commute Time in Baytown
The most frequently occuring commute durations in Baytown are 15 to 19 minutes (6,264 commuters, 17.7%), 10 to 14 minutes (6,220 commuters, 17.6%), and 30 to 34 minutes (4,672 commuters, 13.2%).
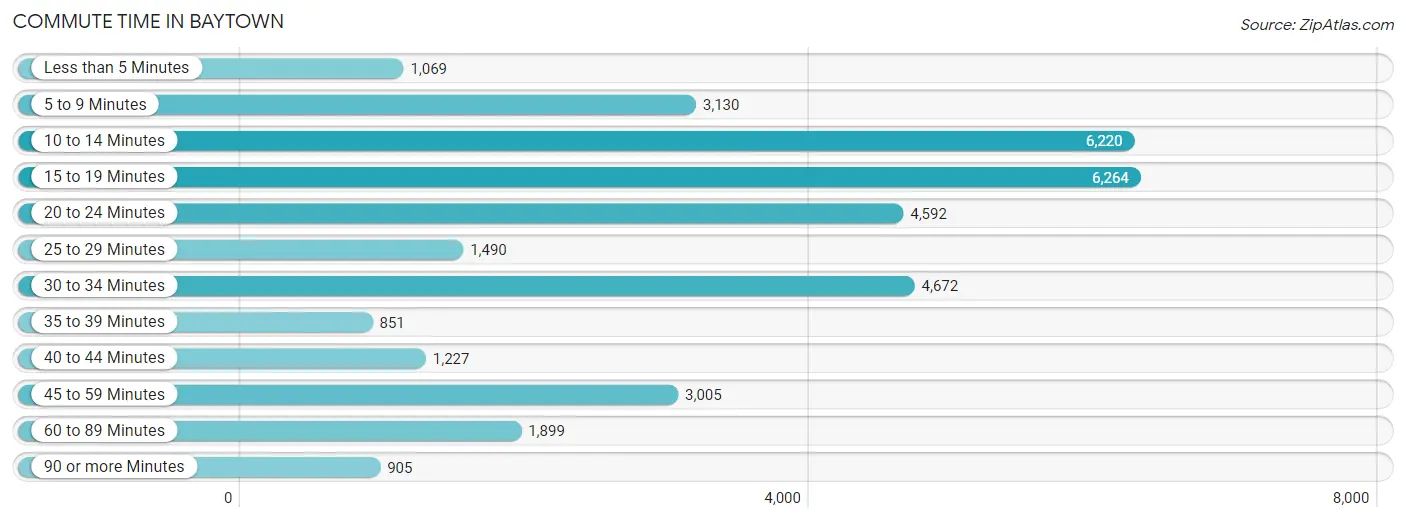
| Commute Time | # Commuters | % Commuters |
| Less than 5 Minutes | 1,069 | 3.0% |
| 5 to 9 Minutes | 3,130 | 8.9% |
| 10 to 14 Minutes | 6,220 | 17.6% |
| 15 to 19 Minutes | 6,264 | 17.7% |
| 20 to 24 Minutes | 4,592 | 13.0% |
| 25 to 29 Minutes | 1,490 | 4.2% |
| 30 to 34 Minutes | 4,672 | 13.2% |
| 35 to 39 Minutes | 851 | 2.4% |
| 40 to 44 Minutes | 1,227 | 3.5% |
| 45 to 59 Minutes | 3,005 | 8.5% |
| 60 to 89 Minutes | 1,899 | 5.4% |
| 90 or more Minutes | 905 | 2.6% |
Commute Time by Sex in Baytown
The most common commute times in Baytown are 15 to 19 minutes (4,033 commuters, 20.3%) for males and 10 to 14 minutes (3,177 commuters, 20.6%) for females.
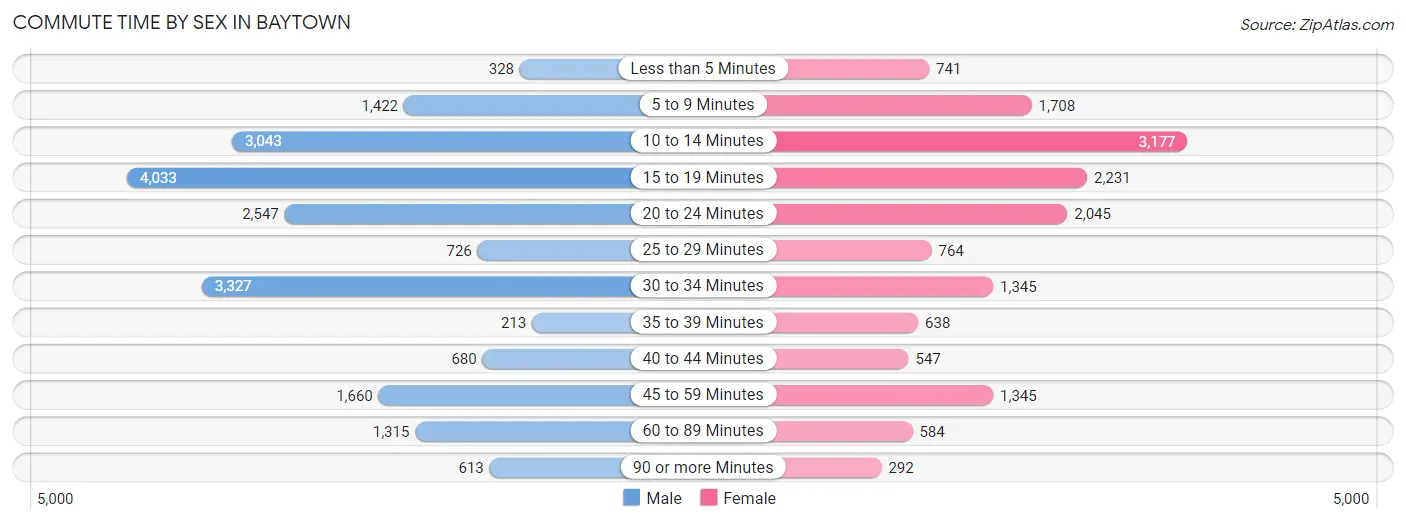
| Commute Time | Male | Female |
| Less than 5 Minutes | 328 (1.7%) | 741 (4.8%) |
| 5 to 9 Minutes | 1,422 (7.1%) | 1,708 (11.1%) |
| 10 to 14 Minutes | 3,043 (15.3%) | 3,177 (20.6%) |
| 15 to 19 Minutes | 4,033 (20.3%) | 2,231 (14.5%) |
| 20 to 24 Minutes | 2,547 (12.8%) | 2,045 (13.3%) |
| 25 to 29 Minutes | 726 (3.6%) | 764 (5.0%) |
| 30 to 34 Minutes | 3,327 (16.7%) | 1,345 (8.7%) |
| 35 to 39 Minutes | 213 (1.1%) | 638 (4.1%) |
| 40 to 44 Minutes | 680 (3.4%) | 547 (3.5%) |
| 45 to 59 Minutes | 1,660 (8.3%) | 1,345 (8.7%) |
| 60 to 89 Minutes | 1,315 (6.6%) | 584 (3.8%) |
| 90 or more Minutes | 613 (3.1%) | 292 (1.9%) |
Time of Departure to Work by Sex in Baytown
The most frequent times of departure to work in Baytown are 6:00 AM to 6:29 AM (2,879, 14.5%) for males and 7:00 AM to 7:29 AM (2,023, 13.1%) for females.
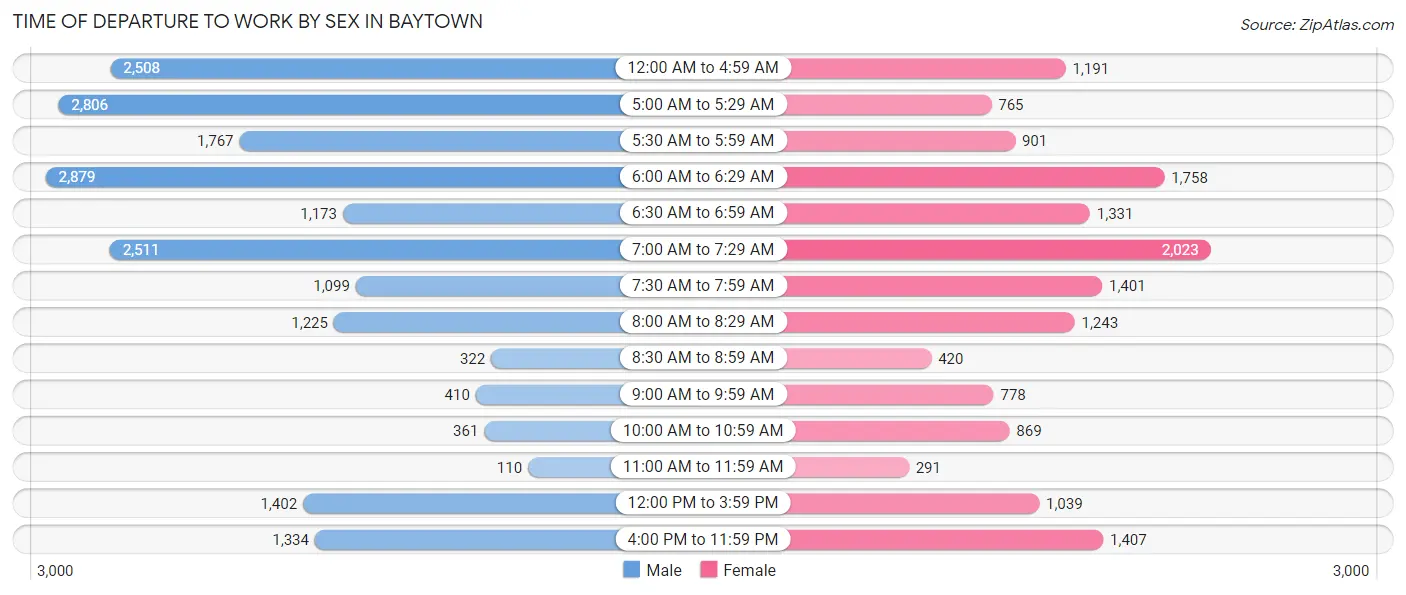
| Time of Departure | Male | Female |
| 12:00 AM to 4:59 AM | 2,508 (12.6%) | 1,191 (7.7%) |
| 5:00 AM to 5:29 AM | 2,806 (14.1%) | 765 (5.0%) |
| 5:30 AM to 5:59 AM | 1,767 (8.9%) | 901 (5.8%) |
| 6:00 AM to 6:29 AM | 2,879 (14.5%) | 1,758 (11.4%) |
| 6:30 AM to 6:59 AM | 1,173 (5.9%) | 1,331 (8.6%) |
| 7:00 AM to 7:29 AM | 2,511 (12.6%) | 2,023 (13.1%) |
| 7:30 AM to 7:59 AM | 1,099 (5.5%) | 1,401 (9.1%) |
| 8:00 AM to 8:29 AM | 1,225 (6.1%) | 1,243 (8.1%) |
| 8:30 AM to 8:59 AM | 322 (1.6%) | 420 (2.7%) |
| 9:00 AM to 9:59 AM | 410 (2.1%) | 778 (5.1%) |
| 10:00 AM to 10:59 AM | 361 (1.8%) | 869 (5.6%) |
| 11:00 AM to 11:59 AM | 110 (0.5%) | 291 (1.9%) |
| 12:00 PM to 3:59 PM | 1,402 (7.0%) | 1,039 (6.7%) |
| 4:00 PM to 11:59 PM | 1,334 (6.7%) | 1,407 (9.1%) |
| Total | 19,907 (100.0%) | 15,417 (100.0%) |
Housing Occupancy in Baytown
Occupancy by Ownership in Baytown
Of the total 30,749 dwellings in Baytown, owner-occupied units account for 16,481 (53.6%), while renter-occupied units make up 14,268 (46.4%).
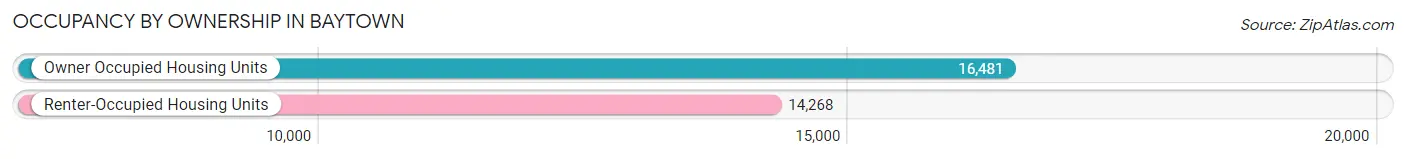
| Occupancy | # Housing Units | % Housing Units |
| Owner Occupied Housing Units | 16,481 | 53.6% |
| Renter-Occupied Housing Units | 14,268 | 46.4% |
| Total Occupied Housing Units | 30,749 | 100.0% |
Occupancy by Household Size in Baytown
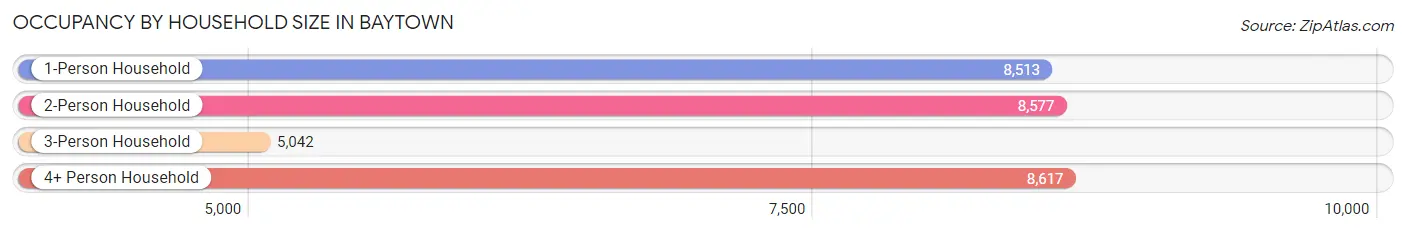
| Household Size | # Housing Units | % Housing Units |
| 1-Person Household | 8,513 | 27.7% |
| 2-Person Household | 8,577 | 27.9% |
| 3-Person Household | 5,042 | 16.4% |
| 4+ Person Household | 8,617 | 28.0% |
| Total Housing Units | 30,749 | 100.0% |
Occupancy by Ownership by Household Size in Baytown
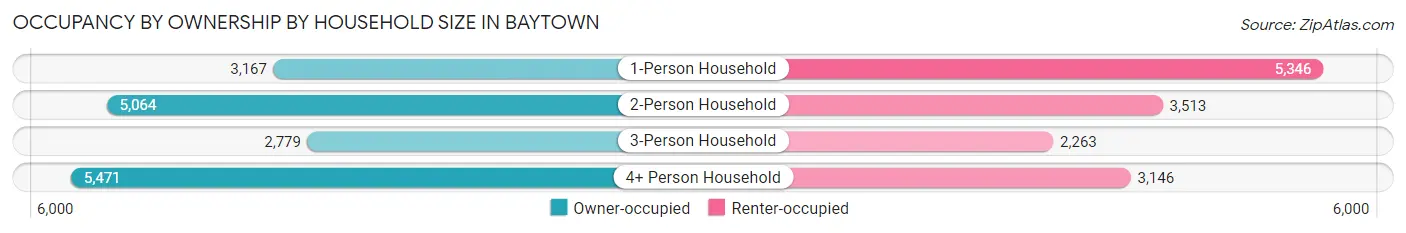
| Household Size | Owner-occupied | Renter-occupied |
| 1-Person Household | 3,167 (37.2%) | 5,346 (62.8%) |
| 2-Person Household | 5,064 (59.0%) | 3,513 (41.0%) |
| 3-Person Household | 2,779 (55.1%) | 2,263 (44.9%) |
| 4+ Person Household | 5,471 (63.5%) | 3,146 (36.5%) |
| Total Housing Units | 16,481 (53.6%) | 14,268 (46.4%) |
Occupancy by Educational Attainment in Baytown
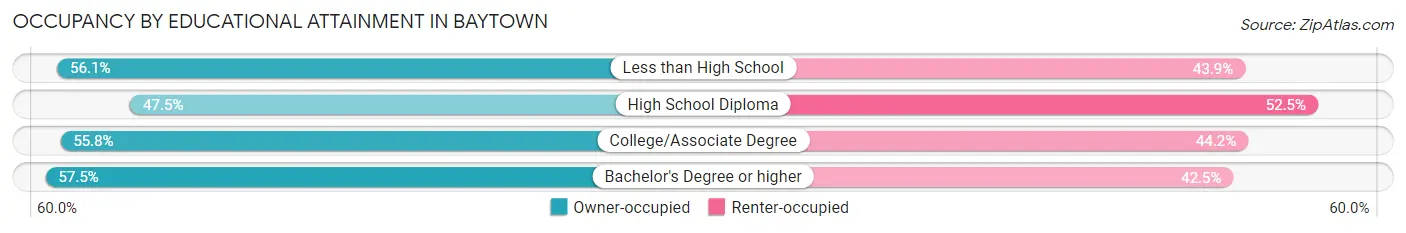
| Household Size | Owner-occupied | Renter-occupied |
| Less than High School | 3,264 (56.1%) | 2,552 (43.9%) |
| High School Diploma | 4,430 (47.5%) | 4,905 (52.5%) |
| College/Associate Degree | 5,878 (55.8%) | 4,663 (44.2%) |
| Bachelor's Degree or higher | 2,909 (57.5%) | 2,148 (42.5%) |
Occupancy by Age of Householder in Baytown
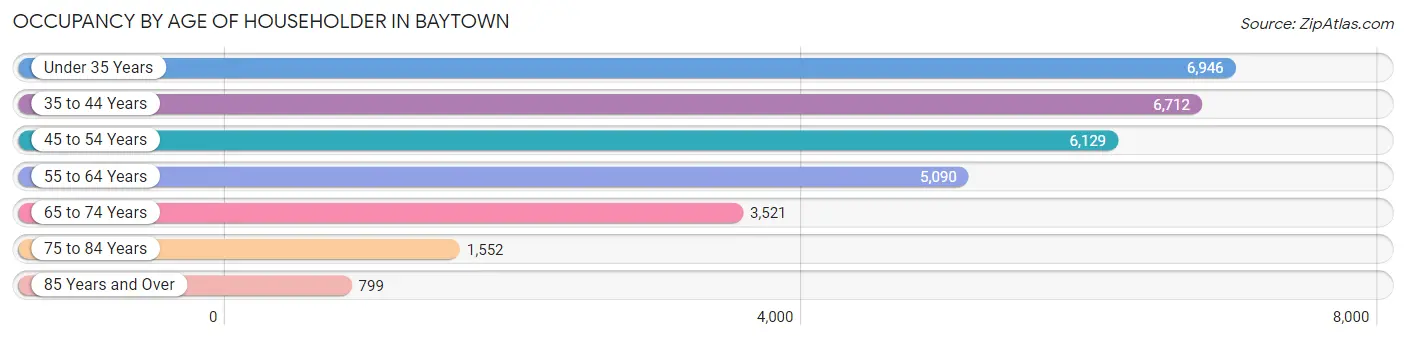
| Age Bracket | # Households | % Households |
| Under 35 Years | 6,946 | 22.6% |
| 35 to 44 Years | 6,712 | 21.8% |
| 45 to 54 Years | 6,129 | 19.9% |
| 55 to 64 Years | 5,090 | 16.6% |
| 65 to 74 Years | 3,521 | 11.5% |
| 75 to 84 Years | 1,552 | 5.1% |
| 85 Years and Over | 799 | 2.6% |
| Total | 30,749 | 100.0% |
Housing Finances in Baytown
Median Income by Occupancy in Baytown
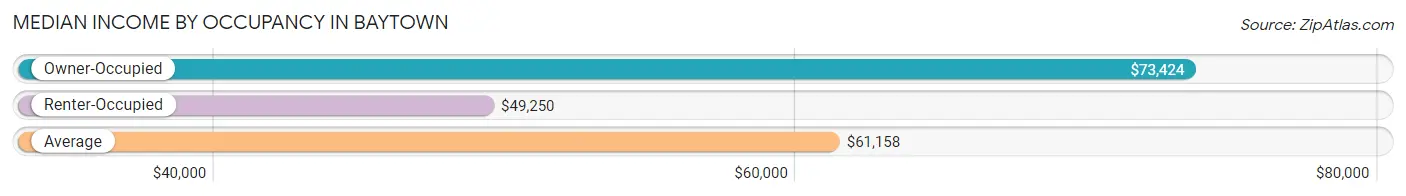
| Occupancy Type | # Households | Median Income |
| Owner-Occupied | 16,481 (53.6%) | $73,424 |
| Renter-Occupied | 14,268 (46.4%) | $49,250 |
| Average | 30,749 (100.0%) | $61,158 |
Occupancy by Householder Income Bracket in Baytown
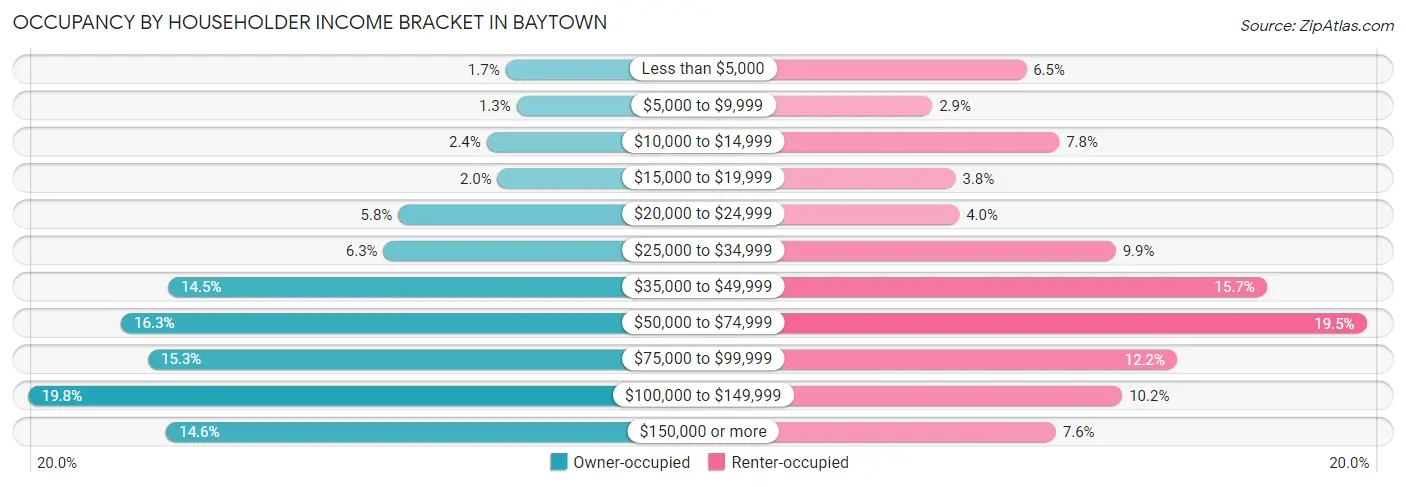
| Income Bracket | Owner-occupied | Renter-occupied |
| Less than $5,000 | 277 (1.7%) | 928 (6.5%) |
| $5,000 to $9,999 | 207 (1.3%) | 417 (2.9%) |
| $10,000 to $14,999 | 395 (2.4%) | 1,107 (7.8%) |
| $15,000 to $19,999 | 326 (2.0%) | 543 (3.8%) |
| $20,000 to $24,999 | 951 (5.8%) | 563 (4.0%) |
| $25,000 to $34,999 | 1,044 (6.3%) | 1,414 (9.9%) |
| $35,000 to $49,999 | 2,395 (14.5%) | 2,234 (15.7%) |
| $50,000 to $74,999 | 2,689 (16.3%) | 2,777 (19.5%) |
| $75,000 to $99,999 | 2,521 (15.3%) | 1,747 (12.2%) |
| $100,000 to $149,999 | 3,270 (19.8%) | 1,450 (10.2%) |
| $150,000 or more | 2,406 (14.6%) | 1,088 (7.6%) |
| Total | 16,481 (100.0%) | 14,268 (100.0%) |
Monthly Housing Cost Tiers in Baytown
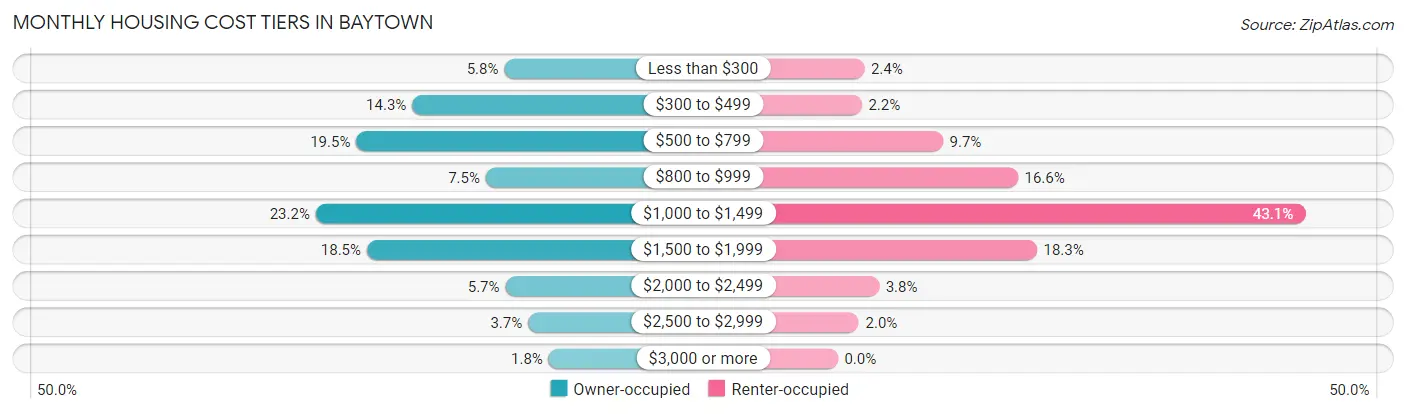
| Monthly Cost | Owner-occupied | Renter-occupied |
| Less than $300 | 962 (5.8%) | 348 (2.4%) |
| $300 to $499 | 2,360 (14.3%) | 315 (2.2%) |
| $500 to $799 | 3,209 (19.5%) | 1,381 (9.7%) |
| $800 to $999 | 1,243 (7.5%) | 2,365 (16.6%) |
| $1,000 to $1,499 | 3,824 (23.2%) | 6,142 (43.0%) |
| $1,500 to $1,999 | 3,048 (18.5%) | 2,615 (18.3%) |
| $2,000 to $2,499 | 946 (5.7%) | 542 (3.8%) |
| $2,500 to $2,999 | 601 (3.6%) | 278 (1.9%) |
| $3,000 or more | 288 (1.8%) | 0 (0.0%) |
| Total | 16,481 (100.0%) | 14,268 (100.0%) |
Physical Housing Characteristics in Baytown
Housing Structures in Baytown
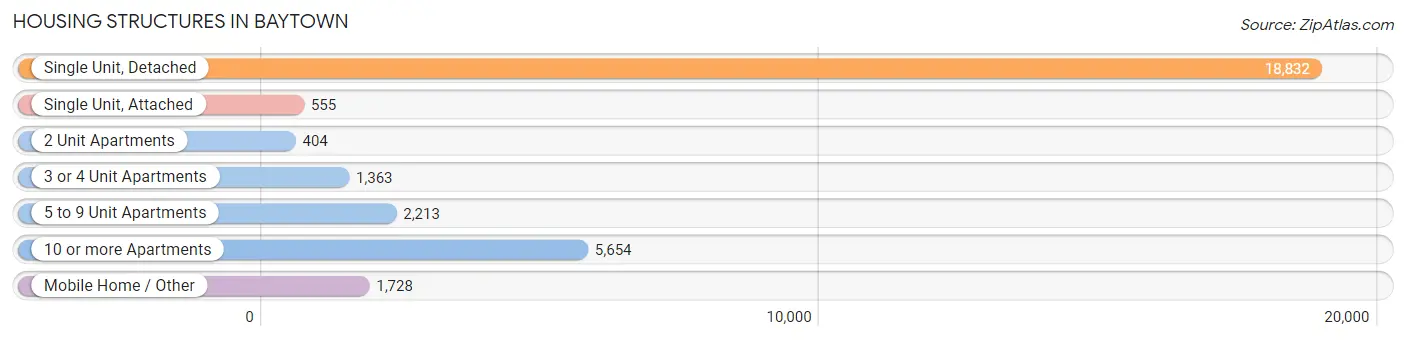
| Structure Type | # Housing Units | % Housing Units |
| Single Unit, Detached | 18,832 | 61.2% |
| Single Unit, Attached | 555 | 1.8% |
| 2 Unit Apartments | 404 | 1.3% |
| 3 or 4 Unit Apartments | 1,363 | 4.4% |
| 5 to 9 Unit Apartments | 2,213 | 7.2% |
| 10 or more Apartments | 5,654 | 18.4% |
| Mobile Home / Other | 1,728 | 5.6% |
| Total | 30,749 | 100.0% |
Housing Structures by Occupancy in Baytown
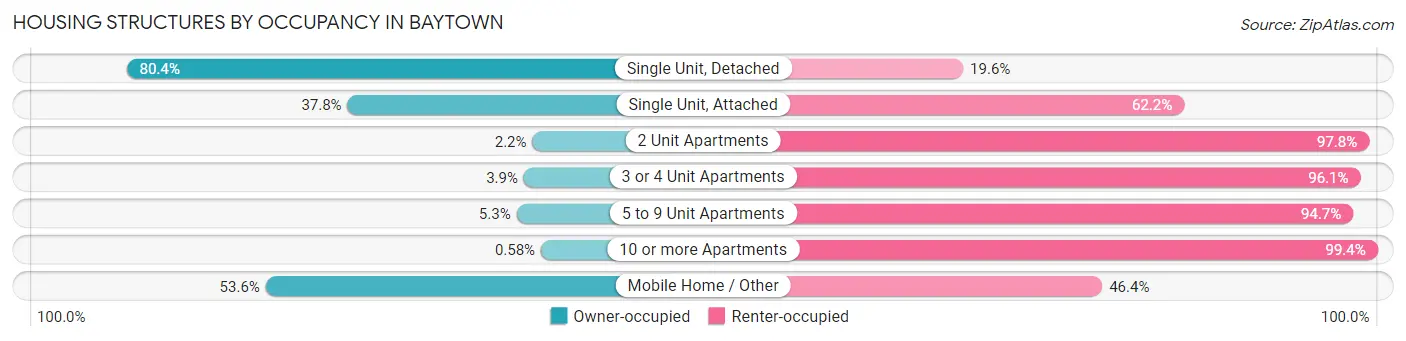
| Structure Type | Owner-occupied | Renter-occupied |
| Single Unit, Detached | 15,133 (80.4%) | 3,699 (19.6%) |
| Single Unit, Attached | 210 (37.8%) | 345 (62.2%) |
| 2 Unit Apartments | 9 (2.2%) | 395 (97.8%) |
| 3 or 4 Unit Apartments | 53 (3.9%) | 1,310 (96.1%) |
| 5 to 9 Unit Apartments | 117 (5.3%) | 2,096 (94.7%) |
| 10 or more Apartments | 33 (0.6%) | 5,621 (99.4%) |
| Mobile Home / Other | 926 (53.6%) | 802 (46.4%) |
| Total | 16,481 (53.6%) | 14,268 (46.4%) |
Housing Structures by Number of Rooms in Baytown
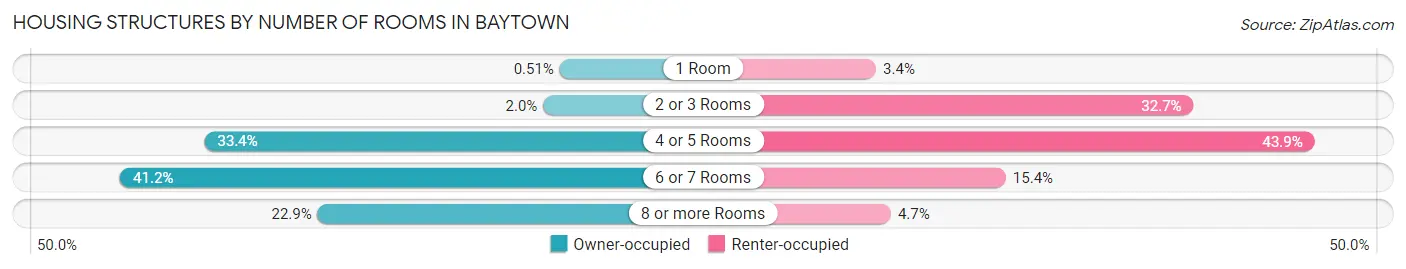
| Number of Rooms | Owner-occupied | Renter-occupied |
| 1 Room | 84 (0.5%) | 478 (3.4%) |
| 2 or 3 Rooms | 337 (2.0%) | 4,664 (32.7%) |
| 4 or 5 Rooms | 5,500 (33.4%) | 6,262 (43.9%) |
| 6 or 7 Rooms | 6,784 (41.2%) | 2,190 (15.3%) |
| 8 or more Rooms | 3,776 (22.9%) | 674 (4.7%) |
| Total | 16,481 (100.0%) | 14,268 (100.0%) |
Housing Structure by Heating Type in Baytown
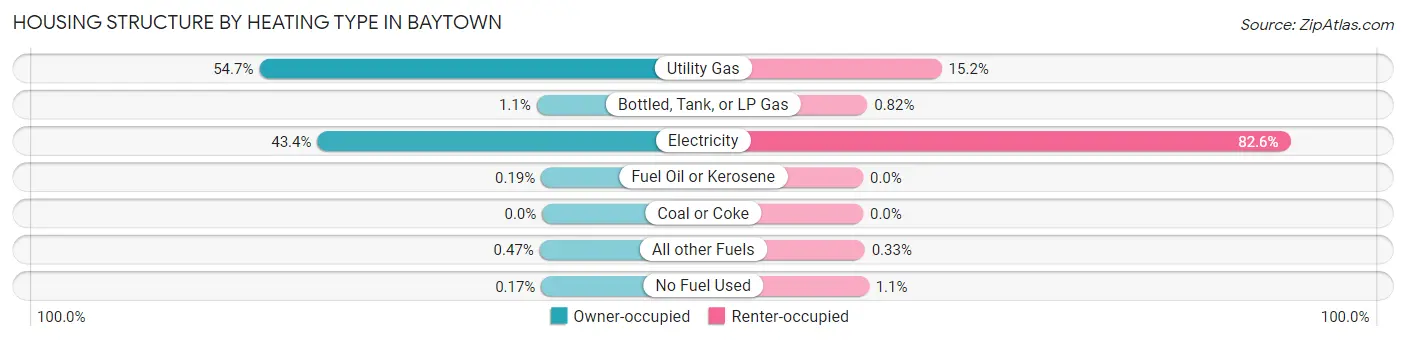
| Heating Type | Owner-occupied | Renter-occupied |
| Utility Gas | 9,008 (54.7%) | 2,168 (15.2%) |
| Bottled, Tank, or LP Gas | 177 (1.1%) | 117 (0.8%) |
| Electricity | 7,159 (43.4%) | 11,781 (82.6%) |
| Fuel Oil or Kerosene | 32 (0.2%) | 0 (0.0%) |
| Coal or Coke | 0 (0.0%) | 0 (0.0%) |
| All other Fuels | 77 (0.5%) | 47 (0.3%) |
| No Fuel Used | 28 (0.2%) | 155 (1.1%) |
| Total | 16,481 (100.0%) | 14,268 (100.0%) |
Household Vehicle Usage in Baytown
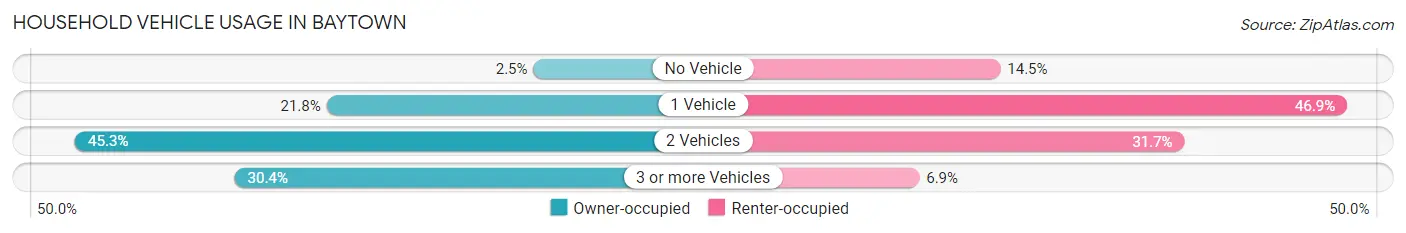
| Vehicles per Household | Owner-occupied | Renter-occupied |
| No Vehicle | 414 (2.5%) | 2,070 (14.5%) |
| 1 Vehicle | 3,595 (21.8%) | 6,687 (46.9%) |
| 2 Vehicles | 7,463 (45.3%) | 4,521 (31.7%) |
| 3 or more Vehicles | 5,009 (30.4%) | 990 (6.9%) |
| Total | 16,481 (100.0%) | 14,268 (100.0%) |
Real Estate & Mortgages in Baytown
Real Estate and Mortgage Overview in Baytown
| Characteristic | Without Mortgage | With Mortgage |
| Housing Units | 8,099 | 8,382 |
| Median Property Value | $142,600 | $176,100 |
| Median Household Income | $54,944 | $1,599 |
| Monthly Housing Costs | $613 | $239 |
| Real Estate Taxes | $2,495 | $563 |
Property Value by Mortgage Status in Baytown
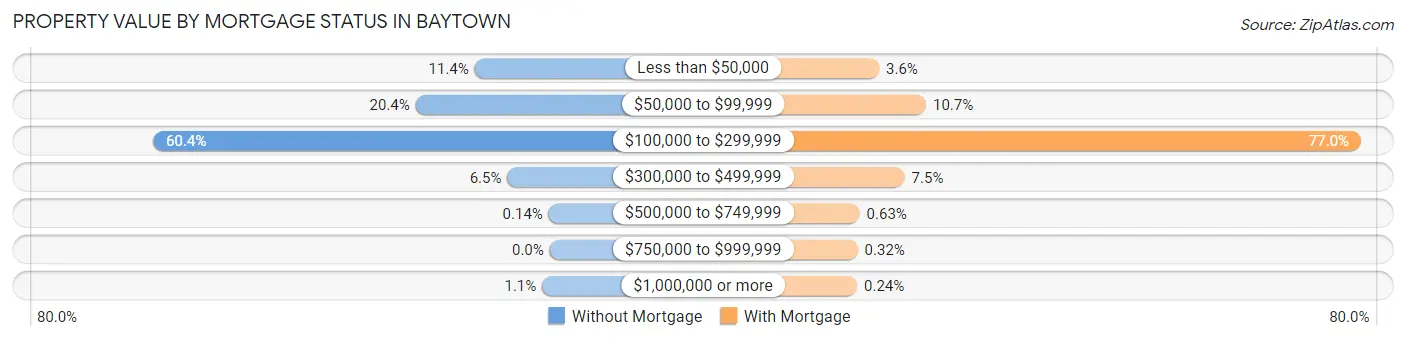
| Property Value | Without Mortgage | With Mortgage |
| Less than $50,000 | 926 (11.4%) | 301 (3.6%) |
| $50,000 to $99,999 | 1,654 (20.4%) | 900 (10.7%) |
| $100,000 to $299,999 | 4,894 (60.4%) | 6,454 (77.0%) |
| $300,000 to $499,999 | 522 (6.5%) | 627 (7.5%) |
| $500,000 to $749,999 | 11 (0.1%) | 53 (0.6%) |
| $750,000 to $999,999 | 0 (0.0%) | 27 (0.3%) |
| $1,000,000 or more | 92 (1.1%) | 20 (0.2%) |
| Total | 8,099 (100.0%) | 8,382 (100.0%) |
Household Income by Mortgage Status in Baytown
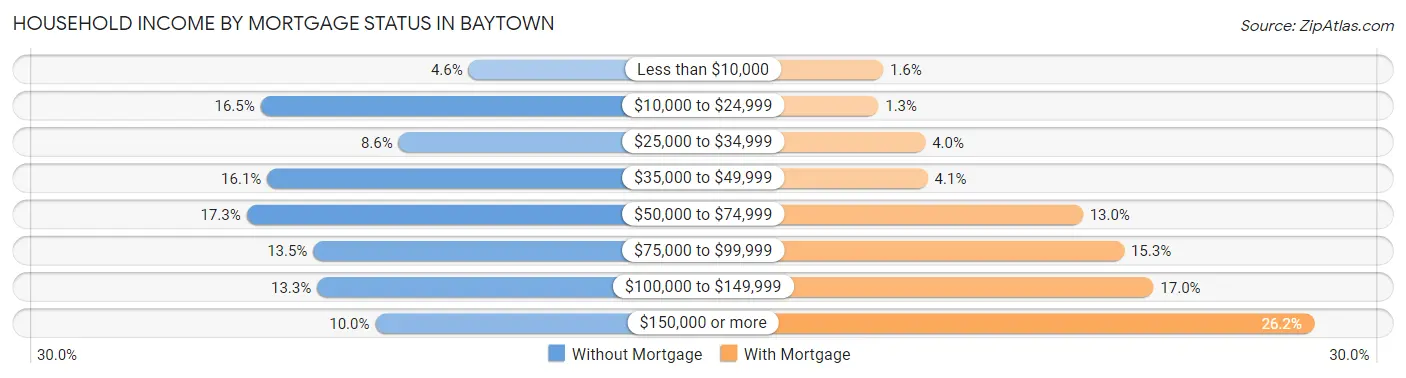
| Household Income | Without Mortgage | With Mortgage |
| Less than $10,000 | 375 (4.6%) | 132 (1.6%) |
| $10,000 to $24,999 | 1,338 (16.5%) | 109 (1.3%) |
| $25,000 to $34,999 | 699 (8.6%) | 334 (4.0%) |
| $35,000 to $49,999 | 1,307 (16.1%) | 345 (4.1%) |
| $50,000 to $74,999 | 1,403 (17.3%) | 1,088 (13.0%) |
| $75,000 to $99,999 | 1,094 (13.5%) | 1,286 (15.3%) |
| $100,000 to $149,999 | 1,076 (13.3%) | 1,427 (17.0%) |
| $150,000 or more | 807 (10.0%) | 2,194 (26.2%) |
| Total | 8,099 (100.0%) | 8,382 (100.0%) |
Property Value to Household Income Ratio in Baytown
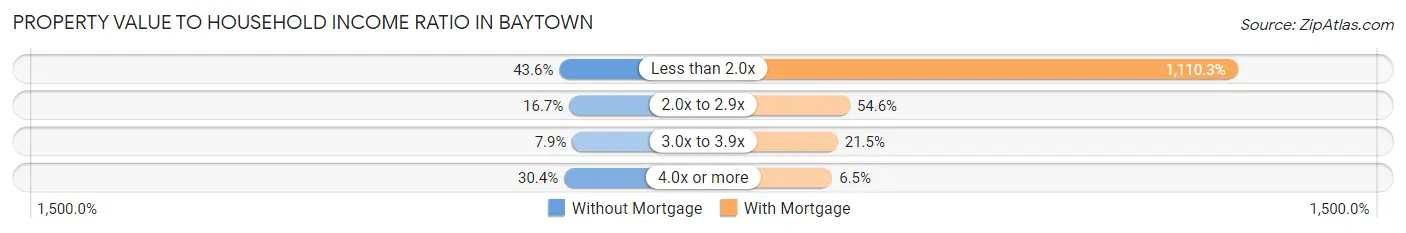
| Value-to-Income Ratio | Without Mortgage | With Mortgage |
| Less than 2.0x | 3,529 (43.6%) | 93,065 (1,110.3%) |
| 2.0x to 2.9x | 1,351 (16.7%) | 4,575 (54.6%) |
| 3.0x to 3.9x | 639 (7.9%) | 1,800 (21.5%) |
| 4.0x or more | 2,462 (30.4%) | 543 (6.5%) |
| Total | 8,099 (100.0%) | 8,382 (100.0%) |
Real Estate Taxes by Mortgage Status in Baytown
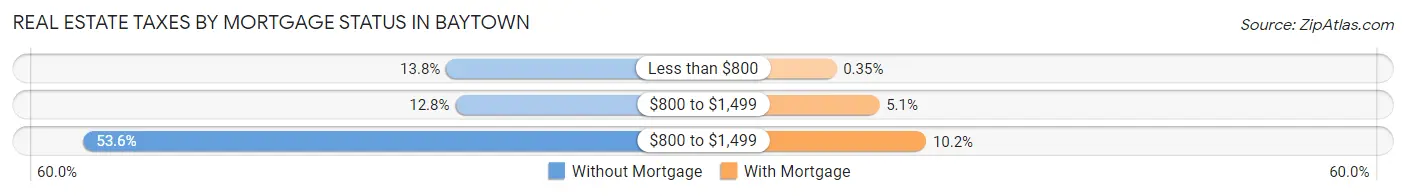
| Property Taxes | Without Mortgage | With Mortgage |
| Less than $800 | 1,118 (13.8%) | 29 (0.4%) |
| $800 to $1,499 | 1,037 (12.8%) | 424 (5.1%) |
| $800 to $1,499 | 4,338 (53.6%) | 853 (10.2%) |
| Total | 8,099 (100.0%) | 8,382 (100.0%) |
Health & Disability in Baytown
Health Insurance Coverage by Age in Baytown
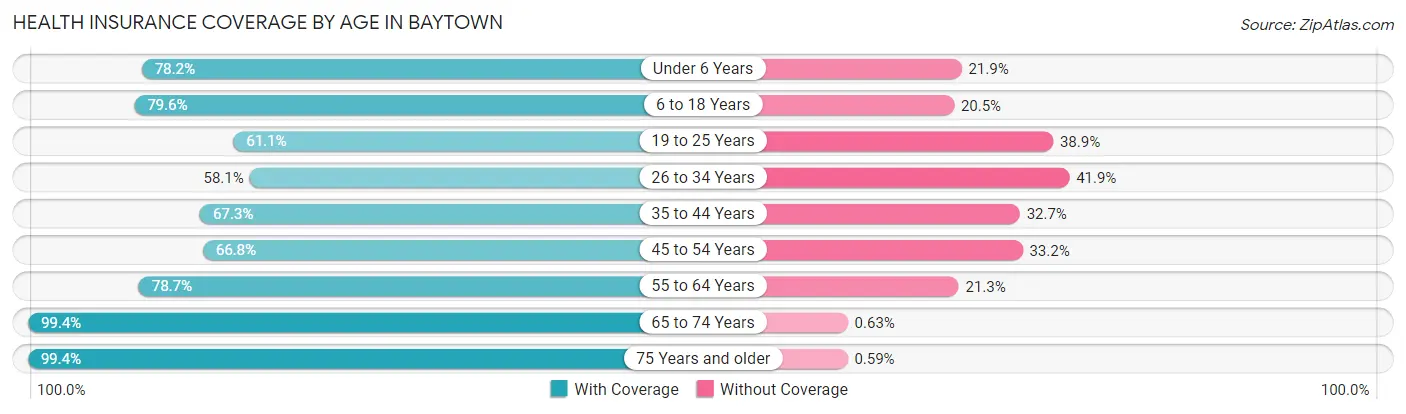
| Age Bracket | With Coverage | Without Coverage |
| Under 6 Years | 5,682 (78.1%) | 1,589 (21.8%) |
| 6 to 18 Years | 14,366 (79.5%) | 3,693 (20.4%) |
| 19 to 25 Years | 4,635 (61.1%) | 2,954 (38.9%) |
| 26 to 34 Years | 6,191 (58.1%) | 4,473 (41.9%) |
| 35 to 44 Years | 8,011 (67.3%) | 3,895 (32.7%) |
| 45 to 54 Years | 7,321 (66.8%) | 3,643 (33.2%) |
| 55 to 64 Years | 6,646 (78.7%) | 1,800 (21.3%) |
| 65 to 74 Years | 5,375 (99.4%) | 34 (0.6%) |
| 75 Years and older | 3,531 (99.4%) | 21 (0.6%) |
| Total | 61,758 (73.6%) | 22,102 (26.4%) |
Health Insurance Coverage by Citizenship Status in Baytown
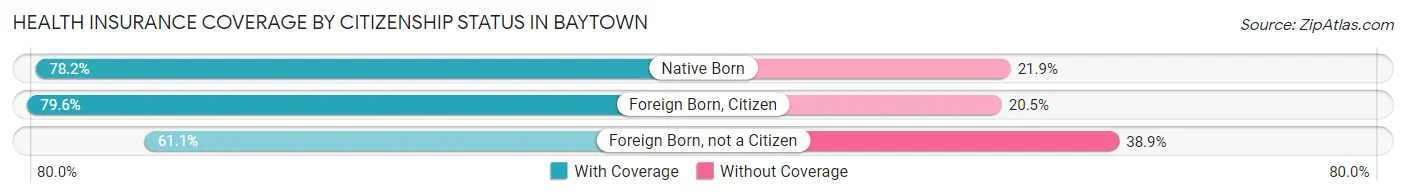
| Citizenship Status | With Coverage | Without Coverage |
| Native Born | 5,682 (78.1%) | 1,589 (21.8%) |
| Foreign Born, Citizen | 14,366 (79.5%) | 3,693 (20.4%) |
| Foreign Born, not a Citizen | 4,635 (61.1%) | 2,954 (38.9%) |
Health Insurance Coverage by Household Income in Baytown
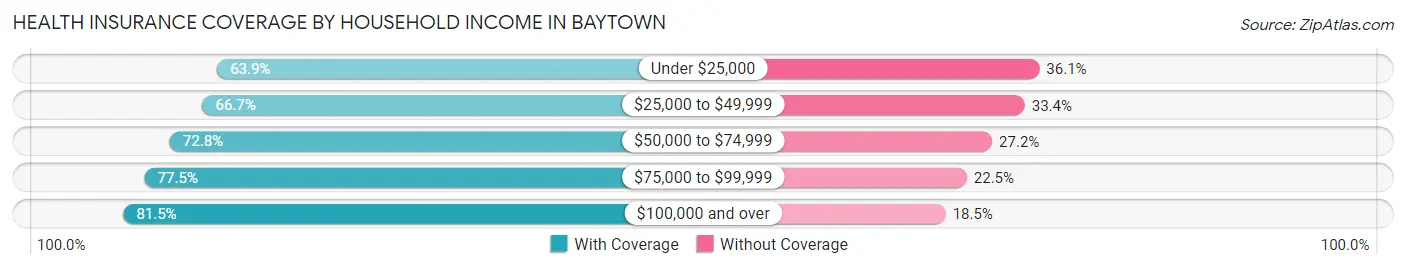
| Household Income | With Coverage | Without Coverage |
| Under $25,000 | 7,744 (63.9%) | 4,373 (36.1%) |
| $25,000 to $49,999 | 11,354 (66.6%) | 5,680 (33.4%) |
| $50,000 to $74,999 | 11,911 (72.8%) | 4,457 (27.2%) |
| $75,000 to $99,999 | 9,475 (77.5%) | 2,751 (22.5%) |
| $100,000 and over | 21,187 (81.5%) | 4,820 (18.5%) |
Public vs Private Health Insurance Coverage by Age in Baytown
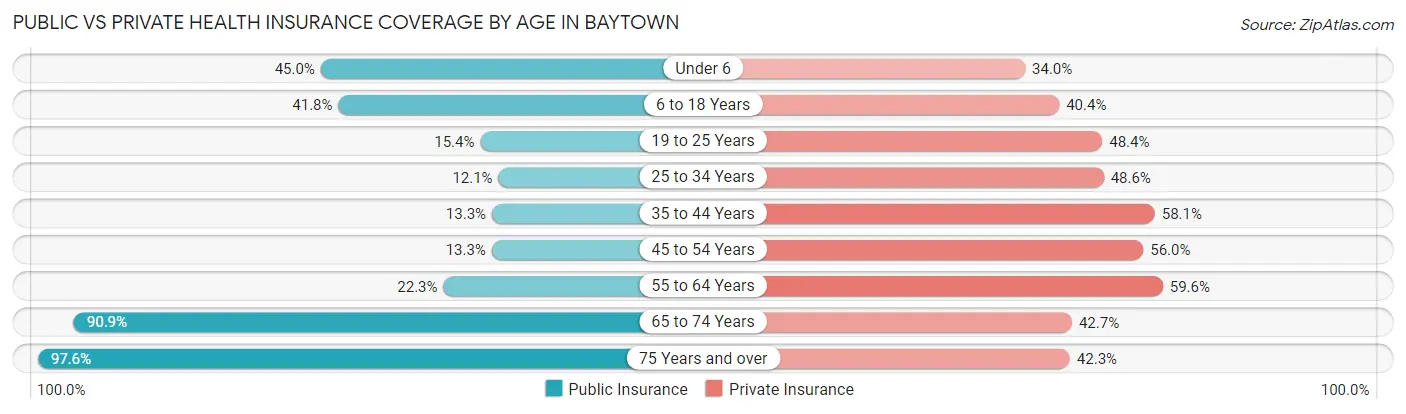
| Age Bracket | Public Insurance | Private Insurance |
| Under 6 | 3,275 (45.0%) | 2,474 (34.0%) |
| 6 to 18 Years | 7,541 (41.8%) | 7,288 (40.4%) |
| 19 to 25 Years | 1,170 (15.4%) | 3,669 (48.3%) |
| 25 to 34 Years | 1,285 (12.0%) | 5,184 (48.6%) |
| 35 to 44 Years | 1,579 (13.3%) | 6,917 (58.1%) |
| 45 to 54 Years | 1,458 (13.3%) | 6,136 (56.0%) |
| 55 to 64 Years | 1,881 (22.3%) | 5,032 (59.6%) |
| 65 to 74 Years | 4,914 (90.8%) | 2,311 (42.7%) |
| 75 Years and over | 3,465 (97.6%) | 1,504 (42.3%) |
| Total | 26,568 (31.7%) | 40,515 (48.3%) |
Disability Status by Sex by Age in Baytown
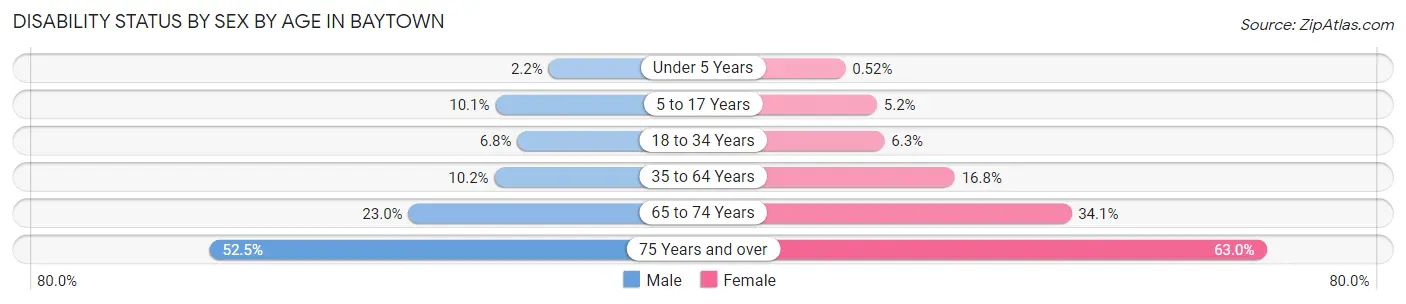
| Age Bracket | Male | Female |
| Under 5 Years | 65 (2.2%) | 16 (0.5%) |
| 5 to 17 Years | 984 (10.1%) | 416 (5.2%) |
| 18 to 34 Years | 660 (6.8%) | 643 (6.3%) |
| 35 to 64 Years | 1,674 (10.2%) | 2,510 (16.8%) |
| 65 to 74 Years | 607 (23.0%) | 944 (34.1%) |
| 75 Years and over | 643 (52.5%) | 1,467 (63.0%) |
Disability Class by Sex by Age in Baytown
Disability Class: Hearing Difficulty
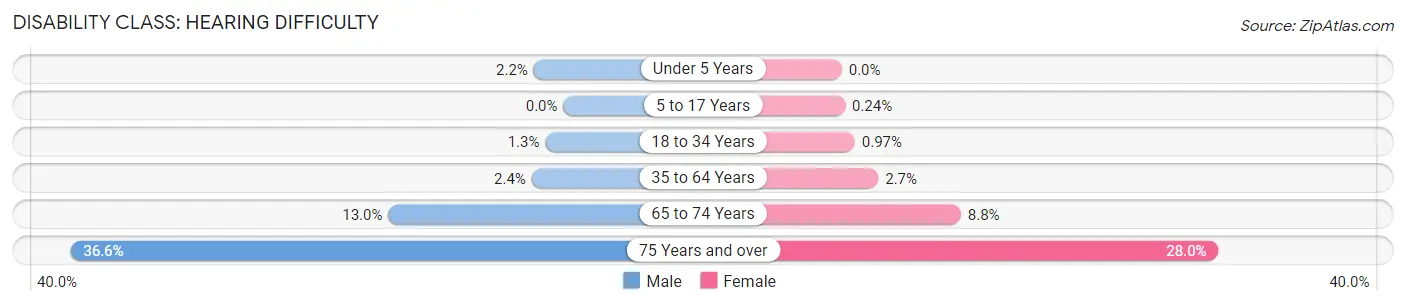
| Age Bracket | Male | Female |
| Under 5 Years | 65 (2.2%) | 0 (0.0%) |
| 5 to 17 Years | 0 (0.0%) | 19 (0.2%) |
| 18 to 34 Years | 129 (1.3%) | 99 (1.0%) |
| 35 to 64 Years | 384 (2.4%) | 406 (2.7%) |
| 65 to 74 Years | 343 (13.0%) | 245 (8.8%) |
| 75 Years and over | 448 (36.6%) | 651 (28.0%) |
Disability Class: Vision Difficulty
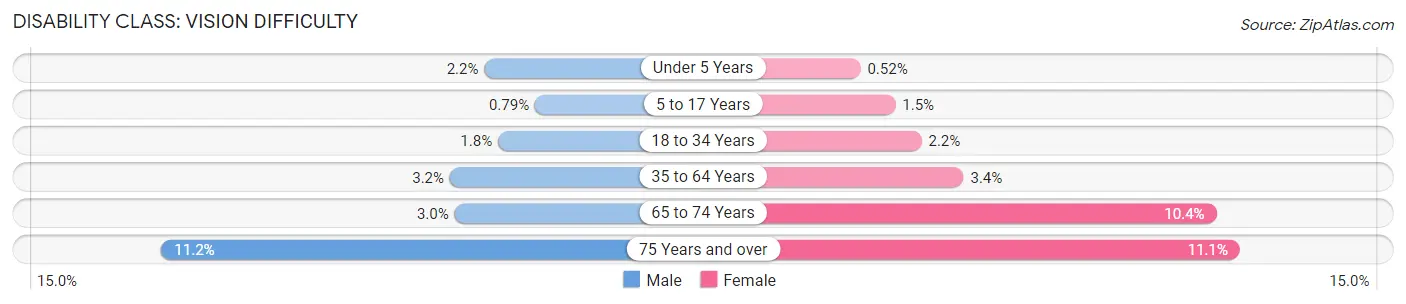
| Age Bracket | Male | Female |
| Under 5 Years | 65 (2.2%) | 16 (0.5%) |
| 5 to 17 Years | 77 (0.8%) | 119 (1.5%) |
| 18 to 34 Years | 176 (1.8%) | 226 (2.2%) |
| 35 to 64 Years | 517 (3.2%) | 508 (3.4%) |
| 65 to 74 Years | 80 (3.0%) | 289 (10.4%) |
| 75 Years and over | 137 (11.2%) | 258 (11.1%) |
Disability Class: Cognitive Difficulty
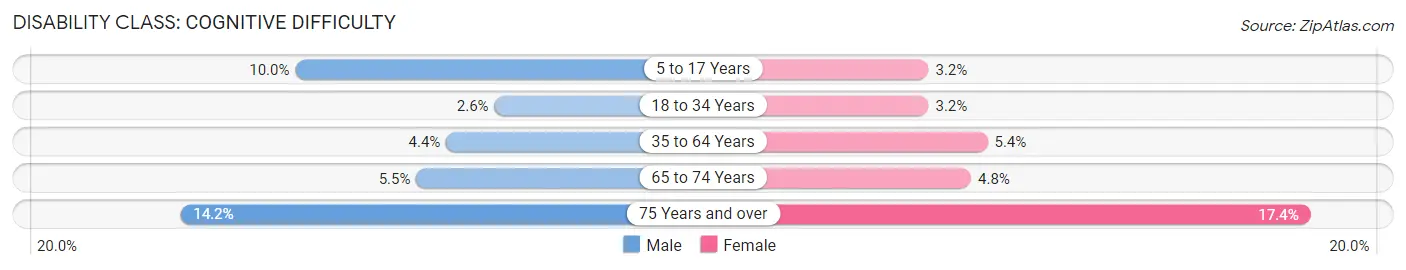
| Age Bracket | Male | Female |
| 5 to 17 Years | 968 (10.0%) | 257 (3.2%) |
| 18 to 34 Years | 247 (2.6%) | 328 (3.2%) |
| 35 to 64 Years | 711 (4.3%) | 810 (5.4%) |
| 65 to 74 Years | 144 (5.5%) | 133 (4.8%) |
| 75 Years and over | 174 (14.2%) | 405 (17.4%) |
Disability Class: Ambulatory Difficulty
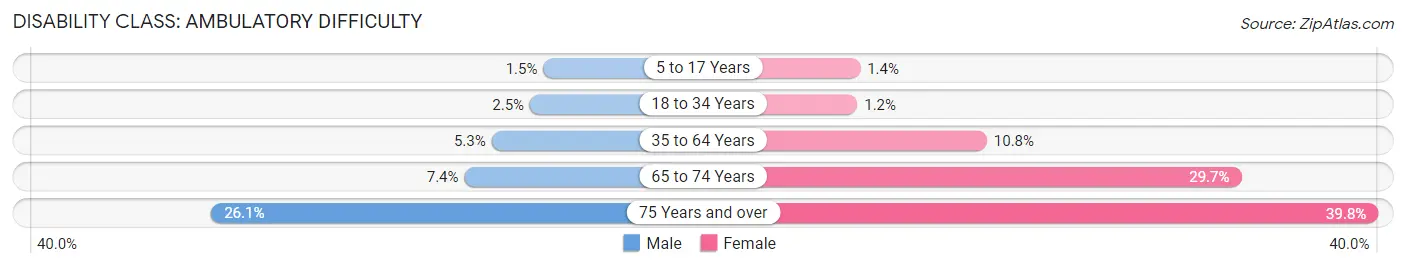
| Age Bracket | Male | Female |
| 5 to 17 Years | 145 (1.5%) | 109 (1.4%) |
| 18 to 34 Years | 240 (2.5%) | 117 (1.1%) |
| 35 to 64 Years | 872 (5.3%) | 1,612 (10.8%) |
| 65 to 74 Years | 194 (7.3%) | 822 (29.7%) |
| 75 Years and over | 320 (26.1%) | 927 (39.8%) |
Disability Class: Self-Care Difficulty
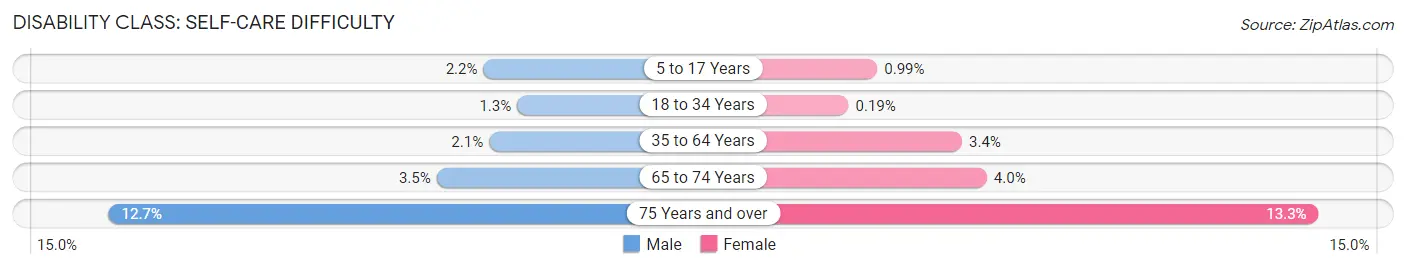
| Age Bracket | Male | Female |
| 5 to 17 Years | 217 (2.2%) | 79 (1.0%) |
| 18 to 34 Years | 125 (1.3%) | 19 (0.2%) |
| 35 to 64 Years | 339 (2.1%) | 501 (3.4%) |
| 65 to 74 Years | 93 (3.5%) | 112 (4.0%) |
| 75 Years and over | 155 (12.7%) | 309 (13.3%) |
Technology Access in Baytown
Computing Device Access in Baytown
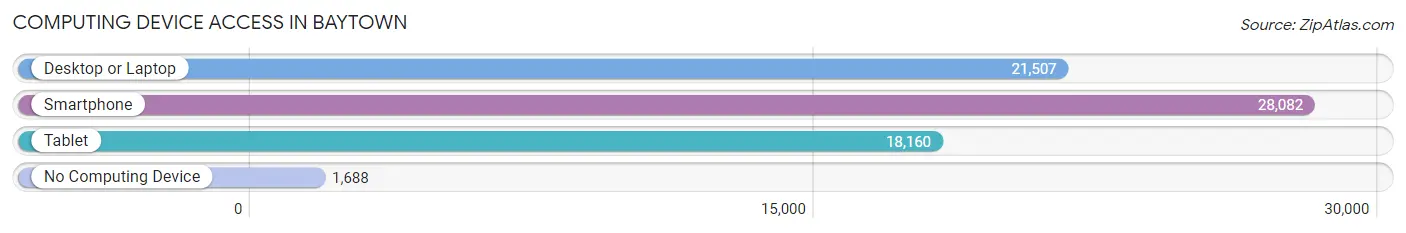
| Device Type | # Households | % Households |
| Desktop or Laptop | 21,507 | 69.9% |
| Smartphone | 28,082 | 91.3% |
| Tablet | 18,160 | 59.1% |
| No Computing Device | 1,688 | 5.5% |
| Total | 30,749 | 100.0% |
Internet Access in Baytown
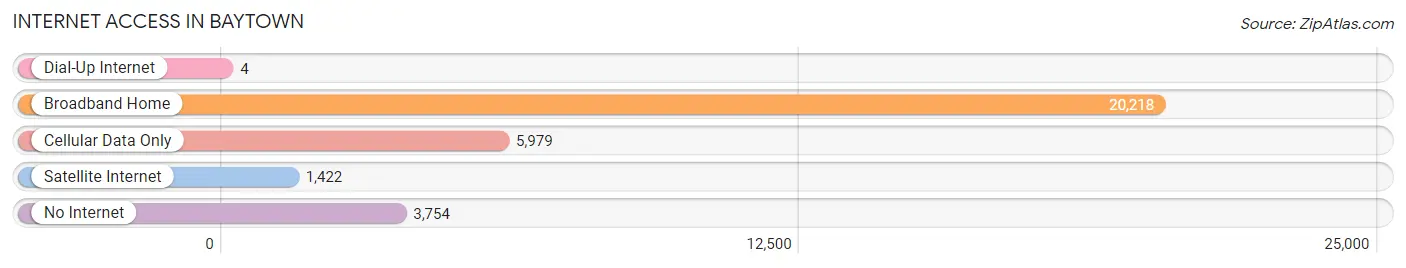
| Internet Type | # Households | % Households |
| Dial-Up Internet | 4 | 0.0% |
| Broadband Home | 20,218 | 65.7% |
| Cellular Data Only | 5,979 | 19.4% |
| Satellite Internet | 1,422 | 4.6% |
| No Internet | 3,754 | 12.2% |
| Total | 30,749 | 100.0% |
Baytown Summary
Baytown is a city located in Harris County, Texas, United States. It is located within the Houston–The Woodlands–Sugar Land metropolitan area. As of the 2010 census, the city population was 71,802.
History
Baytown was founded in 1948 when the Humble Oil and Refining Company (now ExxonMobil) built the first refinery in the area. The city was named after the nearby bay, which was named after the town of Baytown, Virginia. The city was incorporated in 1948 and was the first city in Harris County to incorporate after World War II.
Geography
Baytown is located at the intersection of Interstate 10 and State Highway 146 in Harris County, Texas. It is situated on the north shore of Galveston Bay, approximately 25 miles east of downtown Houston. The city has a total area of 33.3 square miles, of which 32.2 square miles is land and 1.1 square miles is water.
Economy
Baytown is home to several major industries, including oil and gas, petrochemicals, and manufacturing. The city is also home to several large employers, including ExxonMobil, Chevron Phillips Chemical Company, and Baytown Refinery.
The city's economy is also supported by a strong retail sector, with several shopping centers and malls located in the city. The city is also home to several restaurants, bars, and entertainment venues.
Demographics
As of the 2010 census, the population of Baytown was 71,802. The racial makeup of the city was 63.2% White, 22.3% African American, 0.7% Native American, 1.7% Asian, 0.1% Pacific Islander, 9.2% from other races, and 2.8% from two or more races. Hispanic or Latino of any race were 24.2% of the population.
The median income for a household in the city was $45,945, and the median income for a family was $51,837. The per capita income for the city was $20,945. About 14.2% of families and 17.2% of the population were below the poverty line, including 25.2% of those under age 18 and 11.2% of those age 65 or over.
Conclusion
Baytown is a city located in Harris County, Texas, United States. It is located within the Houston–The Woodlands–Sugar Land metropolitan area. As of the 2010 census, the city population was 71,802. The city was founded in 1948 when the Humble Oil and Refining Company (now ExxonMobil) built the first refinery in the area. The city is home to several major industries, including oil and gas, petrochemicals, and manufacturing. The city's economy is also supported by a strong retail sector, with several shopping centers and malls located in the city. The racial makeup of the city was 63.2% White, 22.3% African American, 0.7% Native American, 1.7% Asian, 0.1% Pacific Islander, 9.2% from other races, and 2.8% from two or more races. The median income for a household in the city was $45,945, and the median income for a family was $51,837. Baytown is a vibrant city with a diverse economy and population.
Common Questions
What is Per Capita Income in Baytown?
Per Capita income in Baytown is $28,915.
What is the Median Family Income in Baytown?
Median Family Income in Baytown is $69,580.
What is the Median Household income in Baytown?
Median Household Income in Baytown is $61,158.
What is Income or Wage Gap in Baytown?
Income or Wage Gap in Baytown is 42.6%.
Women in Baytown earn 57.4 cents for every dollar earned by a man.
What is Family Income Deficit in Baytown?
Family Income Deficit in Baytown is $12,205.
Families that are below poverty line in Baytown earn $12,205 less on average than the poverty threshold level.
What is Inequality or Gini Index in Baytown?
Inequality or Gini Index in Baytown is 0.43.
What is the Total Population of Baytown?
Total Population of Baytown is 84,449.
What is the Total Male Population of Baytown?
Total Male Population of Baytown is 42,793.
What is the Total Female Population of Baytown?
Total Female Population of Baytown is 41,656.
What is the Ratio of Males per 100 Females in Baytown?
There are 102.73 Males per 100 Females in Baytown.
What is the Ratio of Females per 100 Males in Baytown?
There are 97.34 Females per 100 Males in Baytown.
What is the Median Population Age in Baytown?
Median Population Age in Baytown is 33.9 Years.
What is the Average Family Size in Baytown
Average Family Size in Baytown is 3.4 People.
What is the Average Household Size in Baytown
Average Household Size in Baytown is 2.7 People.
How Large is the Labor Force in Baytown?
There are 40,905 People in the Labor Forcein in Baytown.
What is the Percentage of People in the Labor Force in Baytown?
64.4% of People are in the Labor Force in Baytown.
What is the Unemployment Rate in Baytown?
Unemployment Rate in Baytown is 9.2%.