Fresno, TX Map & Demographics
Fresno Map
Fresno Overview
$36,231
PER CAPITA INCOME
$88,489
AVG FAMILY INCOME
$88,448
AVG HOUSEHOLD INCOME
20.2%
WAGE / INCOME GAP [ % ]
79.8¢/ $1
WAGE / INCOME GAP [ $ ]
0.34
INEQUALITY / GINI INDEX
23,608
TOTAL POPULATION
11,602
MALE POPULATION
12,006
FEMALE POPULATION
96.64
MALES / 100 FEMALES
103.48
FEMALES / 100 MALES
37.1
MEDIAN AGE
3.3
AVG FAMILY SIZE
3.0
AVG HOUSEHOLD SIZE
14,220
LABOR FORCE [ PEOPLE ]
75.1%
PERCENT IN LABOR FORCE
4.6%
UNEMPLOYMENT RATE
Fresno Zip Codes
Income in Fresno
Income Overview in Fresno
Per Capita Income in Fresno is $36,231, while median incomes of families and households are $88,489 and $88,448 respectively.
| Characteristic | Number | Measure |
| Per Capita Income | 23,608 | $36,231 |
| Median Family Income | 6,335 | $88,489 |
| Mean Family Income | 6,335 | $107,336 |
| Median Household Income | 7,846 | $88,448 |
| Mean Household Income | 7,846 | $105,185 |
| Income Deficit | 6,335 | $0 |
| Wage / Income Gap (%) | 23,608 | 20.21% |
| Wage / Income Gap ($) | 23,608 | 79.79¢ per $1 |
| Gini / Inequality Index | 23,608 | 0.34 |
Earnings by Sex in Fresno
Average Earnings in Fresno are $46,726, $51,010 for men and $40,700 for women, a difference of 20.2%.
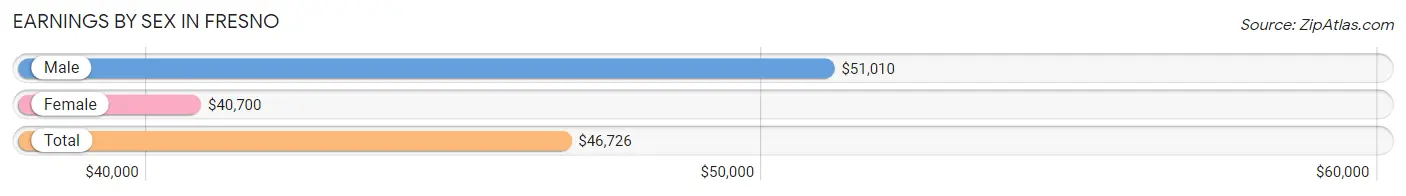
| Sex | Number | Average Earnings |
| Male | 7,159 (51.3%) | $51,010 |
| Female | 6,808 (48.7%) | $40,700 |
| Total | 13,967 (100.0%) | $46,726 |
Earnings by Sex by Income Bracket in Fresno
The most common earnings brackets in Fresno are $100,000+ for men (1,146 | 16.0%) and $55,000 to $64,999 for women (930 | 13.7%).
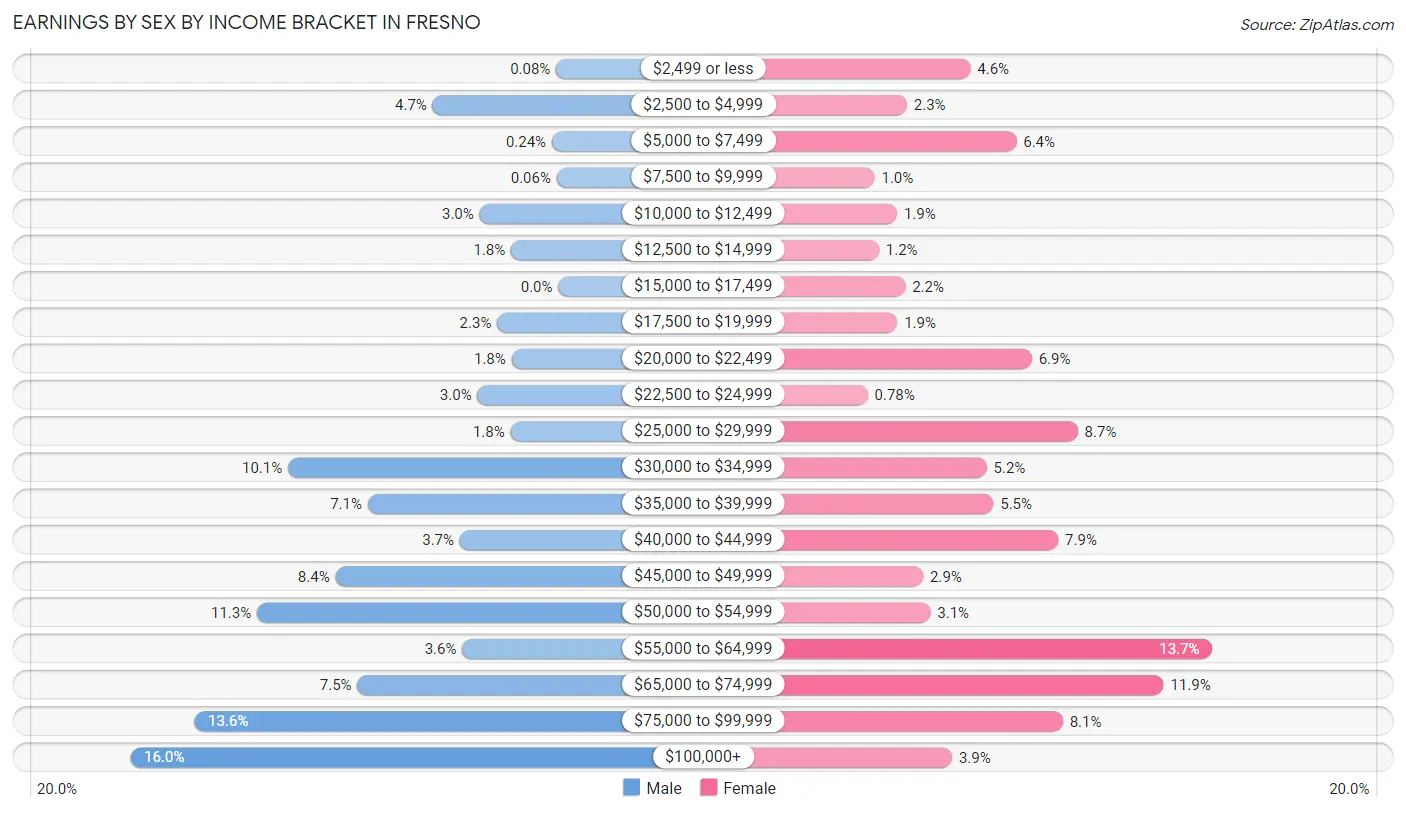
| Income | Male | Female |
| $2,499 or less | 6 (0.1%) | 315 (4.6%) |
| $2,500 to $4,999 | 337 (4.7%) | 153 (2.2%) |
| $5,000 to $7,499 | 17 (0.2%) | 432 (6.4%) |
| $7,500 to $9,999 | 4 (0.1%) | 71 (1.0%) |
| $10,000 to $12,499 | 211 (2.9%) | 128 (1.9%) |
| $12,500 to $14,999 | 127 (1.8%) | 82 (1.2%) |
| $15,000 to $17,499 | 0 (0.0%) | 149 (2.2%) |
| $17,500 to $19,999 | 164 (2.3%) | 129 (1.9%) |
| $20,000 to $22,499 | 125 (1.8%) | 472 (6.9%) |
| $22,500 to $24,999 | 217 (3.0%) | 53 (0.8%) |
| $25,000 to $29,999 | 128 (1.8%) | 589 (8.6%) |
| $30,000 to $34,999 | 725 (10.1%) | 357 (5.2%) |
| $35,000 to $39,999 | 511 (7.1%) | 374 (5.5%) |
| $40,000 to $44,999 | 264 (3.7%) | 539 (7.9%) |
| $45,000 to $49,999 | 598 (8.4%) | 195 (2.9%) |
| $50,000 to $54,999 | 808 (11.3%) | 213 (3.1%) |
| $55,000 to $64,999 | 258 (3.6%) | 930 (13.7%) |
| $65,000 to $74,999 | 539 (7.5%) | 808 (11.9%) |
| $75,000 to $99,999 | 974 (13.6%) | 551 (8.1%) |
| $100,000+ | 1,146 (16.0%) | 268 (3.9%) |
| Total | 7,159 (100.0%) | 6,808 (100.0%) |
Earnings by Sex by Educational Attainment in Fresno
Average earnings in Fresno are $52,832 for men and $45,809 for women, a difference of 13.3%. Men with an educational attainment of graduate degree enjoy the highest average annual earnings of $158,292, while those with less than high school education earn the least with $35,436. Women with an educational attainment of graduate degree earn the most with the average annual earnings of $67,050, while those with less than high school education have the smallest earnings of $22,030.
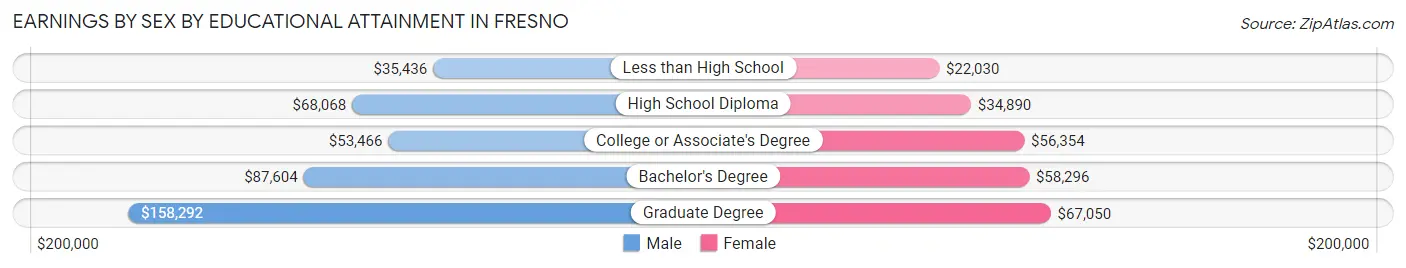
| Educational Attainment | Male Income | Female Income |
| Less than High School | $35,436 | $22,030 |
| High School Diploma | $68,068 | $34,890 |
| College or Associate's Degree | $53,466 | $56,354 |
| Bachelor's Degree | $87,604 | $58,296 |
| Graduate Degree | $158,292 | $67,050 |
| Total | $52,832 | $45,809 |
Family Income in Fresno
Family Income Brackets in Fresno
According to the Fresno family income data, there are 1,495 families falling into the $75,000 to $99,999 income range, which is the most common income bracket and makes up 23.6% of all families. Conversely, the less than $10,000 income bracket is the least frequent group with only 25 families (0.4%) belonging to this category.
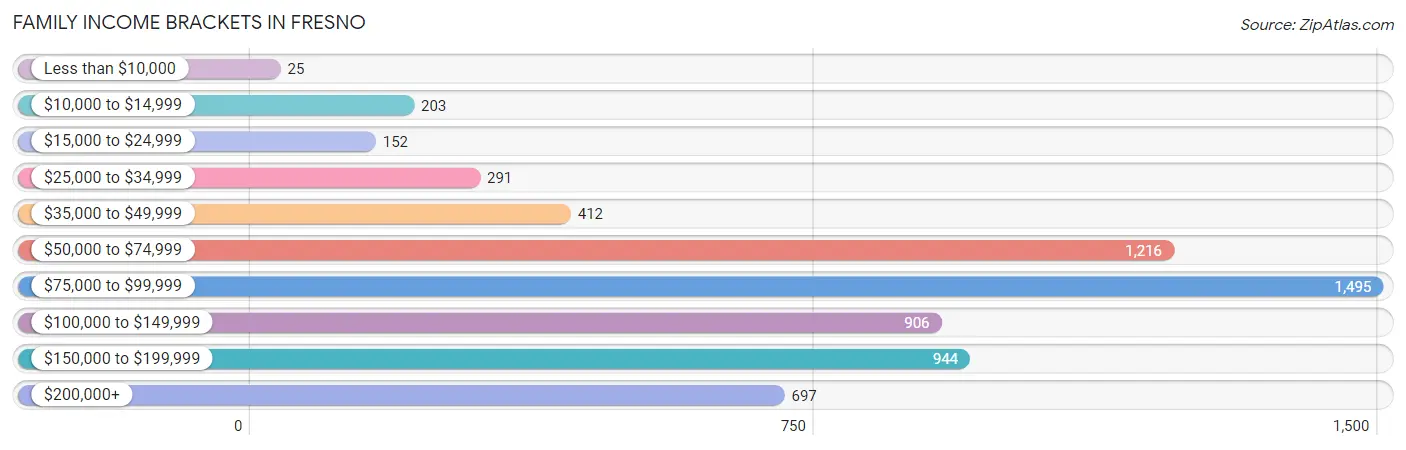
| Income Bracket | # Families | % Families |
| Less than $10,000 | 25 | 0.4% |
| $10,000 to $14,999 | 203 | 3.2% |
| $15,000 to $24,999 | 152 | 2.4% |
| $25,000 to $34,999 | 291 | 4.6% |
| $35,000 to $49,999 | 412 | 6.5% |
| $50,000 to $74,999 | 1,216 | 19.2% |
| $75,000 to $99,999 | 1,495 | 23.6% |
| $100,000 to $149,999 | 906 | 14.3% |
| $150,000 to $199,999 | 944 | 14.9% |
| $200,000+ | 697 | 11.0% |
Family Income by Famaliy Size in Fresno
3-person families (1,404 | 22.2%) account for the highest median family income in Fresno with $110,259 per family, while 2-person families (2,730 | 43.1%) have the highest median income of $39,776 per family member.
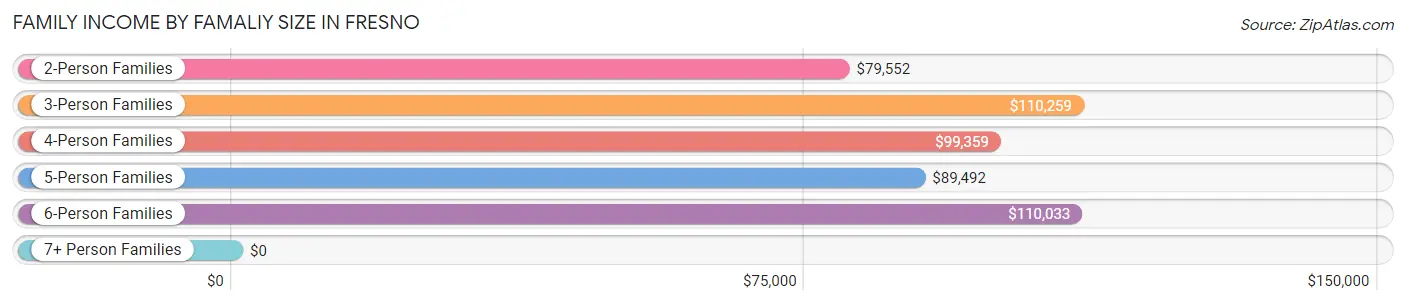
| Income Bracket | # Families | Median Income |
| 2-Person Families | 2,730 (43.1%) | $79,552 |
| 3-Person Families | 1,404 (22.2%) | $110,259 |
| 4-Person Families | 999 (15.8%) | $99,359 |
| 5-Person Families | 911 (14.4%) | $89,492 |
| 6-Person Families | 245 (3.9%) | $110,033 |
| 7+ Person Families | 46 (0.7%) | $0 |
| Total | 6,335 (100.0%) | $88,489 |
Family Income by Number of Earners in Fresno
The median family income in Fresno is $88,489, with families comprising 3+ earners (1,073) having the highest median family income of $146,653, while families with 1 earner (2,109) have the lowest median family income of $59,368, accounting for 16.9% and 33.3% of families, respectively.
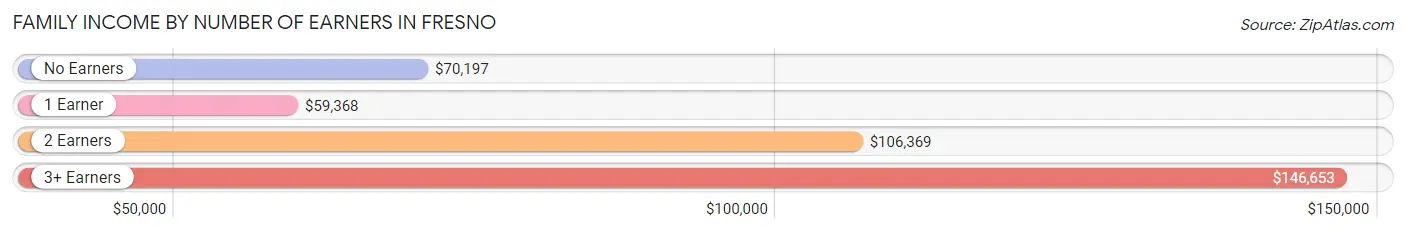
| Number of Earners | # Families | Median Income |
| No Earners | 334 (5.3%) | $70,197 |
| 1 Earner | 2,109 (33.3%) | $59,368 |
| 2 Earners | 2,819 (44.5%) | $106,369 |
| 3+ Earners | 1,073 (16.9%) | $146,653 |
| Total | 6,335 (100.0%) | $88,489 |
Household Income in Fresno
Household Income Brackets in Fresno
With 1,922 households falling in the category, the $75,000 to $99,999 income range is the most frequent in Fresno, accounting for 24.5% of all households. In contrast, only 133 households (1.7%) fall into the less than $10,000 income bracket, making it the least populous group.
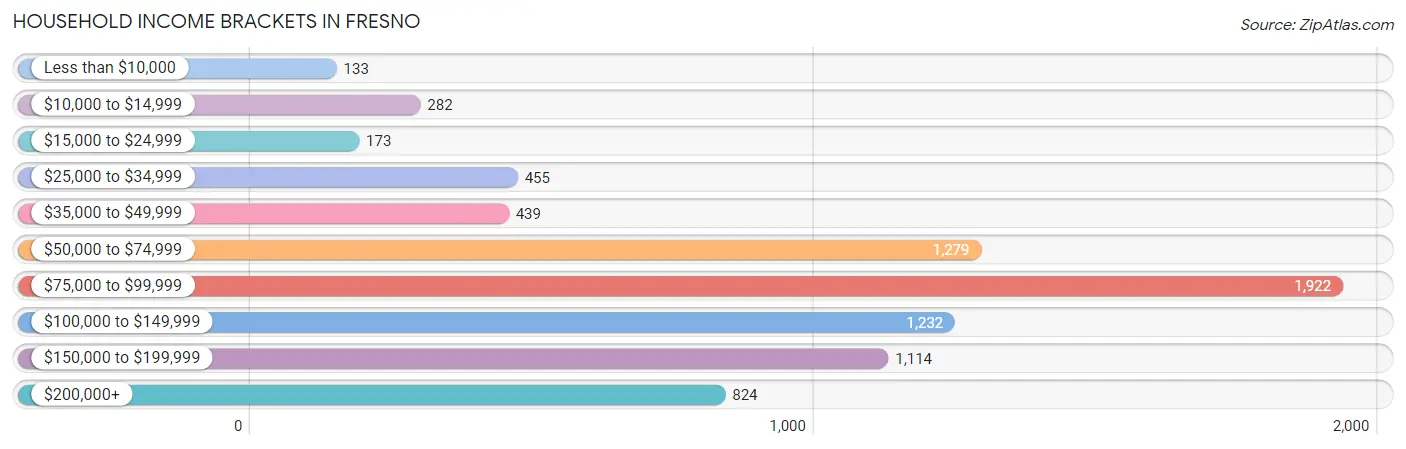
| Income Bracket | # Households | % Households |
| Less than $10,000 | 133 | 1.7% |
| $10,000 to $14,999 | 282 | 3.6% |
| $15,000 to $24,999 | 173 | 2.2% |
| $25,000 to $34,999 | 455 | 5.8% |
| $35,000 to $49,999 | 439 | 5.6% |
| $50,000 to $74,999 | 1,279 | 16.3% |
| $75,000 to $99,999 | 1,922 | 24.5% |
| $100,000 to $149,999 | 1,232 | 15.7% |
| $150,000 to $199,999 | 1,114 | 14.2% |
| $200,000+ | 824 | 10.5% |
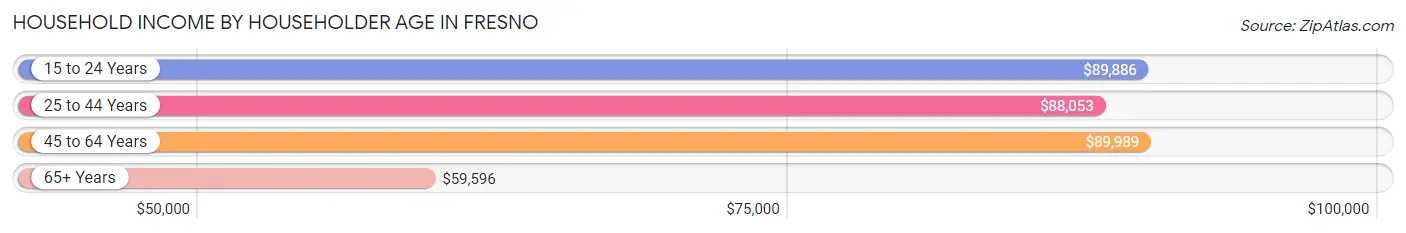
Household Income by Householder Age in Fresno
The median household income in Fresno is $88,448, with the highest median household income of $89,989 found in the 45 to 64 years age bracket for the primary householder. A total of 3,655 households (46.6%) fall into this category. Meanwhile, the 65+ years age bracket for the primary householder has the lowest median household income of $59,596, with 761 households (9.7%) in this group.
| Income Bracket | # Households | Median Income |
| 15 to 24 Years | 105 (1.3%) | $89,886 |
| 25 to 44 Years | 3,325 (42.4%) | $88,053 |
| 45 to 64 Years | 3,655 (46.6%) | $89,989 |
| 65+ Years | 761 (9.7%) | $59,596 |
| Total | 7,846 (100.0%) | $88,448 |
Poverty in Fresno
Income Below Poverty by Sex and Age in Fresno
With 4.6% poverty level for males and 6.8% for females among the residents of Fresno, 6 to 11 year old males and 25 to 34 year old females are the most vulnerable to poverty, with 164 males (23.2%) and 238 females (20.8%) in their respective age groups living below the poverty level.
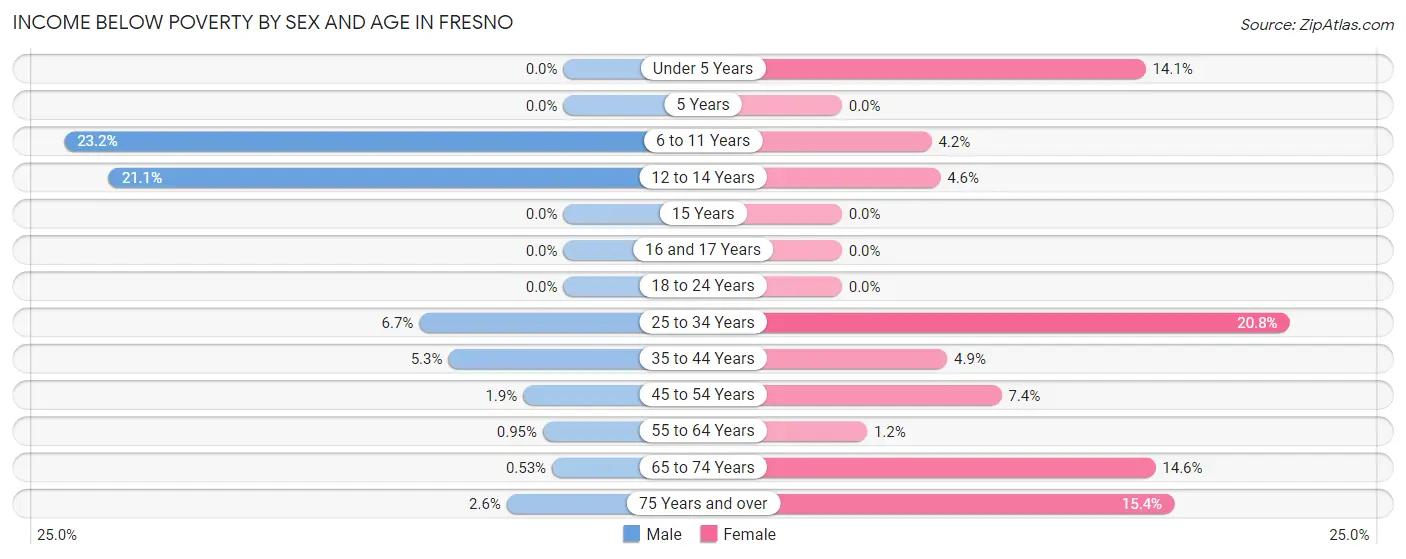
| Age Bracket | Male | Female |
| Under 5 Years | 0 (0.0%) | 66 (14.1%) |
| 5 Years | 0 (0.0%) | 0 (0.0%) |
| 6 to 11 Years | 164 (23.2%) | 32 (4.2%) |
| 12 to 14 Years | 81 (21.1%) | 24 (4.6%) |
| 15 Years | 0 (0.0%) | 0 (0.0%) |
| 16 and 17 Years | 0 (0.0%) | 0 (0.0%) |
| 18 to 24 Years | 0 (0.0%) | 0 (0.0%) |
| 25 to 34 Years | 119 (6.7%) | 238 (20.8%) |
| 35 to 44 Years | 115 (5.3%) | 111 (4.9%) |
| 45 to 54 Years | 23 (1.9%) | 157 (7.4%) |
| 55 to 64 Years | 16 (0.9%) | 14 (1.2%) |
| 65 to 74 Years | 4 (0.5%) | 102 (14.5%) |
| 75 Years and over | 1 (2.6%) | 53 (15.4%) |
| Total | 523 (4.6%) | 797 (6.8%) |
Income Above Poverty by Sex and Age in Fresno
According to the poverty statistics in Fresno, males aged under 5 years and females aged 5 years are the age groups that are most secure financially, with 100.0% of males and 100.0% of females in these age groups living above the poverty line.
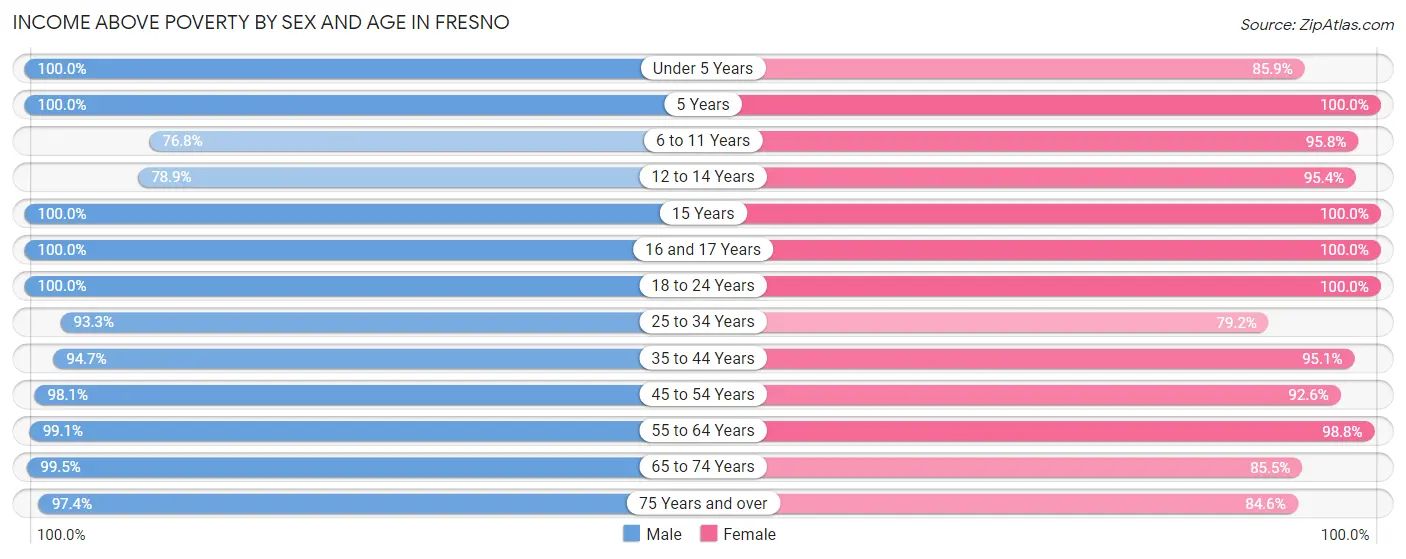
| Age Bracket | Male | Female |
| Under 5 Years | 517 (100.0%) | 402 (85.9%) |
| 5 Years | 213 (100.0%) | 93 (100.0%) |
| 6 to 11 Years | 544 (76.8%) | 737 (95.8%) |
| 12 to 14 Years | 303 (78.9%) | 501 (95.4%) |
| 15 Years | 192 (100.0%) | 288 (100.0%) |
| 16 and 17 Years | 278 (100.0%) | 436 (100.0%) |
| 18 to 24 Years | 1,397 (100.0%) | 1,406 (100.0%) |
| 25 to 34 Years | 1,660 (93.3%) | 908 (79.2%) |
| 35 to 44 Years | 2,039 (94.7%) | 2,159 (95.1%) |
| 45 to 54 Years | 1,206 (98.1%) | 1,961 (92.6%) |
| 55 to 64 Years | 1,675 (99.1%) | 1,180 (98.8%) |
| 65 to 74 Years | 750 (99.5%) | 599 (85.5%) |
| 75 Years and over | 37 (97.4%) | 291 (84.6%) |
| Total | 10,811 (95.4%) | 10,961 (93.2%) |
Income Below Poverty Among Married-Couple Families in Fresno
The poverty statistics for married-couple families in Fresno show that 3.6% or 135 of the total 3,788 families live below the poverty line. Families with 3 or 4 children have the highest poverty rate of 23.2%, comprising of 112 families. On the other hand, families with no children have the lowest poverty rate of 0.0%, which includes 0 families.
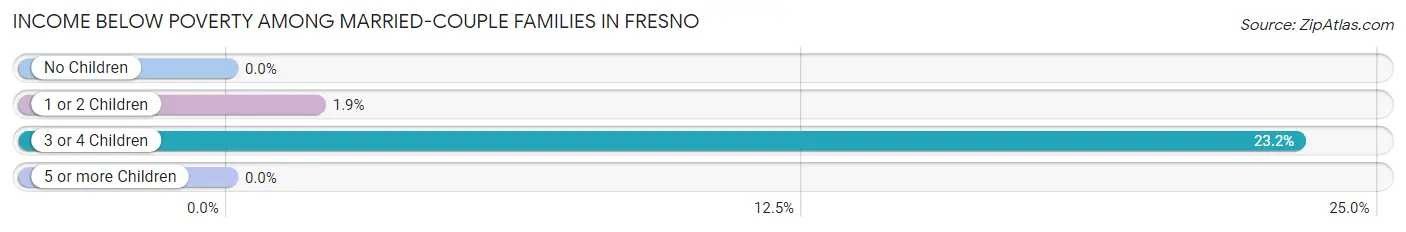
| Children | Above Poverty | Below Poverty |
| No Children | 2,101 (100.0%) | 0 (0.0%) |
| 1 or 2 Children | 1,182 (98.1%) | 23 (1.9%) |
| 3 or 4 Children | 370 (76.8%) | 112 (23.2%) |
| 5 or more Children | 0 (0.0%) | 0 (0.0%) |
| Total | 3,653 (96.4%) | 135 (3.6%) |
Income Below Poverty Among Single-Parent Households in Fresno
According to the poverty data in Fresno, 0.6% or 4 single-father households and 12.9% or 237 single-mother households are living below the poverty line. Among single-father households, those with no children have the highest poverty rate, with 4 households (0.7%) experiencing poverty. Likewise, among single-mother households, those with no children have the highest poverty rate, with 204 households (18.9%) falling below the poverty line.
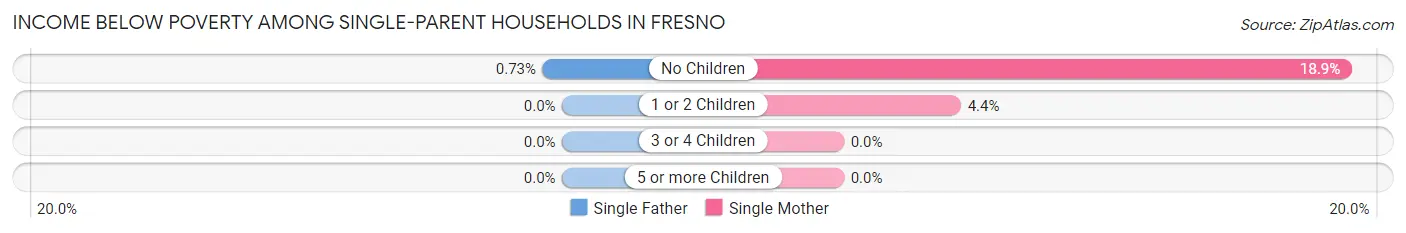
| Children | Single Father | Single Mother |
| No Children | 4 (0.7%) | 204 (18.9%) |
| 1 or 2 Children | 0 (0.0%) | 33 (4.4%) |
| 3 or 4 Children | 0 (0.0%) | 0 (0.0%) |
| 5 or more Children | 0 (0.0%) | 0 (0.0%) |
| Total | 4 (0.6%) | 237 (12.9%) |
Income Below Poverty Among Married-Couple vs Single-Parent Households in Fresno
The poverty data for Fresno shows that 135 of the married-couple family households (3.6%) and 241 of the single-parent households (9.5%) are living below the poverty level. Within the married-couple family households, those with 3 or 4 children have the highest poverty rate, with 112 households (23.2%) falling below the poverty line. Among the single-parent households, those with no children have the highest poverty rate, with 208 household (12.8%) living below poverty.
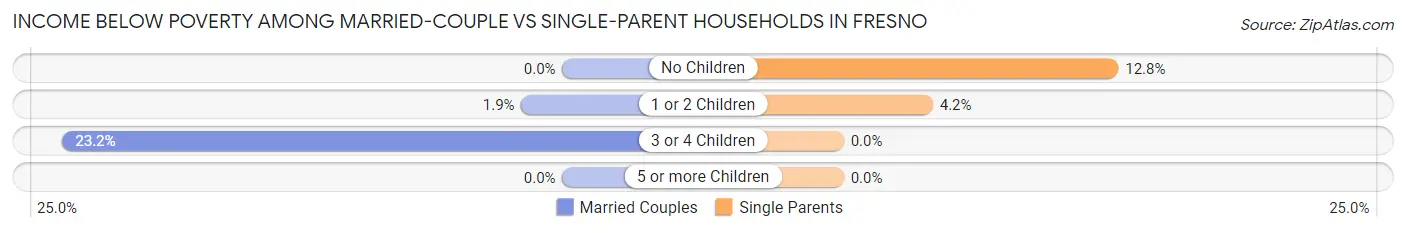
| Children | Married-Couple Families | Single-Parent Households |
| No Children | 0 (0.0%) | 208 (12.8%) |
| 1 or 2 Children | 23 (1.9%) | 33 (4.2%) |
| 3 or 4 Children | 112 (23.2%) | 0 (0.0%) |
| 5 or more Children | 0 (0.0%) | 0 (0.0%) |
| Total | 135 (3.6%) | 241 (9.5%) |
Race in Fresno
The most populous races in Fresno are Black / African American (13,012 | 55.1%), Hispanic or Latino (8,079 | 34.2%), and Some other Race (4,166 | 17.6%).
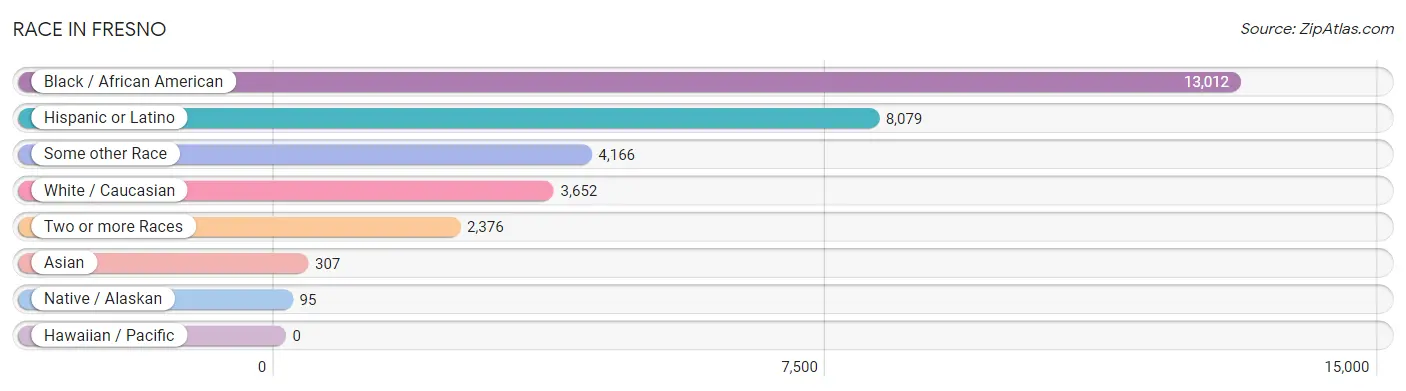
| Race | # Population | % Population |
| Asian | 307 | 1.3% |
| Black / African American | 13,012 | 55.1% |
| Hawaiian / Pacific | 0 | 0.0% |
| Hispanic or Latino | 8,079 | 34.2% |
| Native / Alaskan | 95 | 0.4% |
| White / Caucasian | 3,652 | 15.5% |
| Two or more Races | 2,376 | 10.1% |
| Some other Race | 4,166 | 17.6% |
| Total | 23,608 | 100.0% |
Ancestry in Fresno
The most populous ancestries reported in Fresno are Mexican (6,433 | 27.3%), Central American (1,046 | 4.4%), Salvadoran (1,010 | 4.3%), Subsaharan African (888 | 3.8%), and African (448 | 1.9%), together accounting for 41.6% of all Fresno residents.
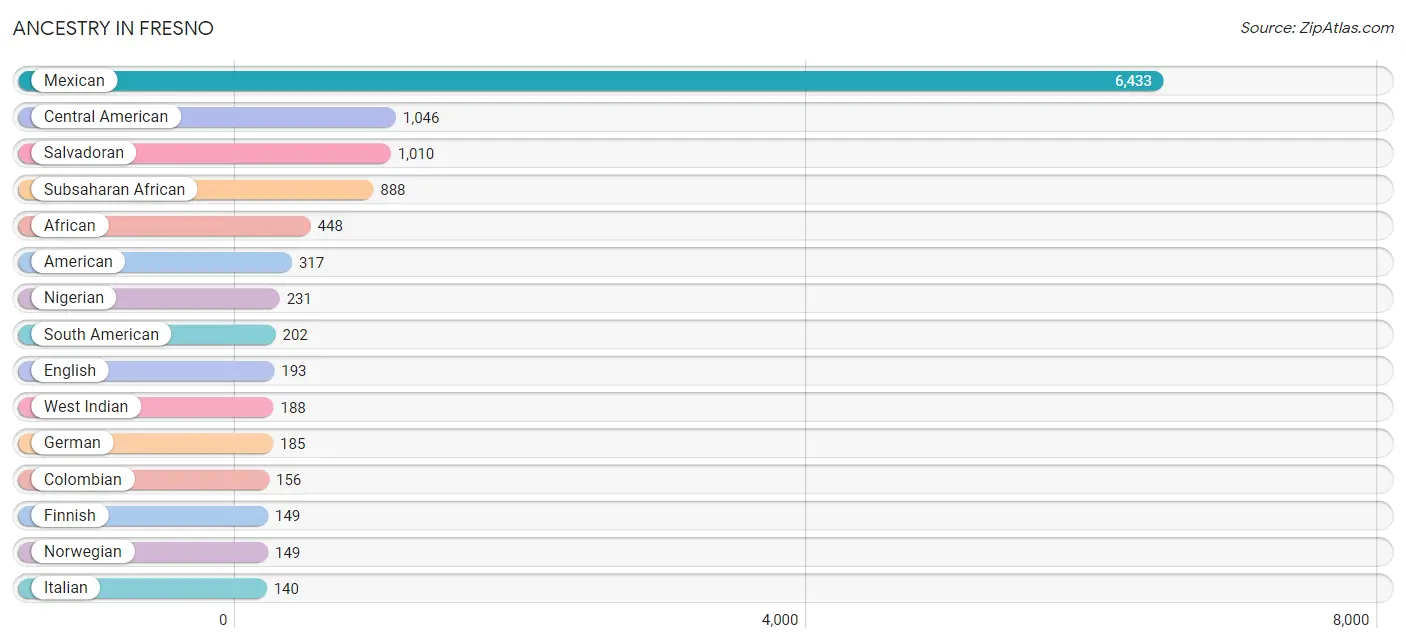
| Ancestry | # Population | % Population |
| African | 448 | 1.9% |
| American | 317 | 1.3% |
| Arab | 22 | 0.1% |
| British | 12 | 0.1% |
| Central American | 1,046 | 4.4% |
| Central American Indian | 36 | 0.2% |
| Colombian | 156 | 0.7% |
| Dominican | 32 | 0.1% |
| Ecuadorian | 14 | 0.1% |
| English | 193 | 0.8% |
| European | 48 | 0.2% |
| Finnish | 149 | 0.6% |
| French | 10 | 0.0% |
| French Canadian | 16 | 0.1% |
| German | 185 | 0.8% |
| Ghanaian | 72 | 0.3% |
| Haitian | 24 | 0.1% |
| Honduran | 36 | 0.2% |
| Indian (Asian) | 45 | 0.2% |
| Irish | 126 | 0.5% |
| Italian | 140 | 0.6% |
| Jamaican | 18 | 0.1% |
| Japanese | 65 | 0.3% |
| Korean | 36 | 0.2% |
| Mexican | 6,433 | 27.3% |
| Mexican American Indian | 73 | 0.3% |
| Moroccan | 22 | 0.1% |
| Native Hawaiian | 7 | 0.0% |
| Nigerian | 231 | 1.0% |
| Norwegian | 149 | 0.6% |
| Pakistani | 127 | 0.5% |
| Polish | 39 | 0.2% |
| Puerto Rican | 61 | 0.3% |
| Salvadoran | 1,010 | 4.3% |
| Scottish | 52 | 0.2% |
| Somali | 23 | 0.1% |
| South American | 202 | 0.9% |
| Spanish American | 17 | 0.1% |
| Sri Lankan | 11 | 0.1% |
| Subsaharan African | 888 | 3.8% |
| Thai | 93 | 0.4% |
| Trinidadian and Tobagonian | 69 | 0.3% |
| Venezuelan | 32 | 0.1% |
| West Indian | 188 | 0.8% | View All 44 Rows |
Immigrants in Fresno
The most numerous immigrant groups reported in Fresno came from Latin America (3,249 | 13.8%), Central America (2,788 | 11.8%), Mexico (2,055 | 8.7%), El Salvador (638 | 2.7%), and Africa (344 | 1.5%), together accounting for 38.4% of all Fresno residents.
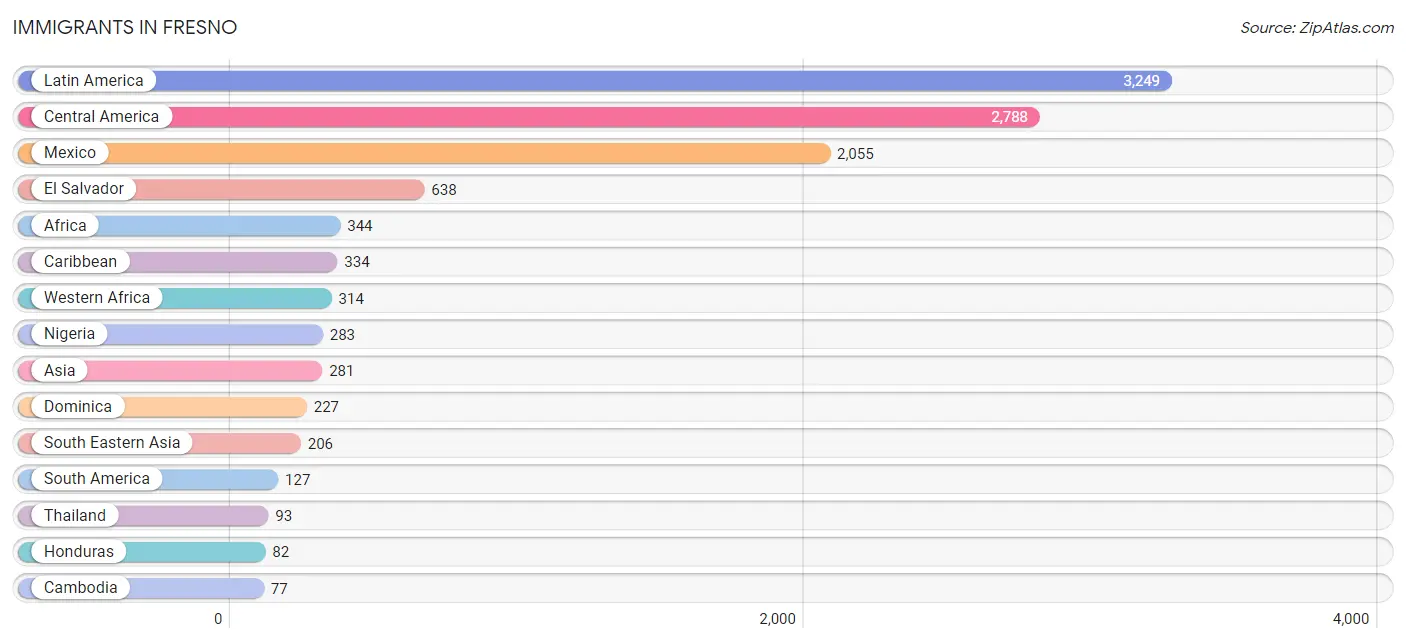
| Immigration Origin | # Population | % Population |
| Africa | 344 | 1.5% |
| Asia | 281 | 1.2% |
| Cambodia | 77 | 0.3% |
| Caribbean | 334 | 1.4% |
| Central America | 2,788 | 11.8% |
| Colombia | 20 | 0.1% |
| Dominica | 227 | 1.0% |
| Ecuador | 14 | 0.1% |
| El Salvador | 638 | 2.7% |
| Europe | 17 | 0.1% |
| Ghana | 31 | 0.1% |
| Grenada | 4 | 0.0% |
| Guyana | 18 | 0.1% |
| Honduras | 82 | 0.4% |
| India | 75 | 0.3% |
| Jamaica | 18 | 0.1% |
| Latin America | 3,249 | 13.8% |
| Mexico | 2,055 | 8.7% |
| Middle Africa | 30 | 0.1% |
| Nigeria | 283 | 1.2% |
| Panama | 13 | 0.1% |
| Peru | 43 | 0.2% |
| Philippines | 36 | 0.2% |
| South America | 127 | 0.5% |
| South Central Asia | 75 | 0.3% |
| South Eastern Asia | 206 | 0.9% |
| Southern Europe | 17 | 0.1% |
| Spain | 17 | 0.1% |
| Thailand | 93 | 0.4% |
| Trinidad and Tobago | 69 | 0.3% |
| Venezuela | 32 | 0.1% |
| Western Africa | 314 | 1.3% |
| Zaire | 30 | 0.1% | View All 33 Rows |
Sex and Age in Fresno
Sex and Age in Fresno
The most populous age groups in Fresno are 55 to 59 Years (1,402 | 12.1%) for men and 15 to 19 Years (1,365 | 11.4%) for women.
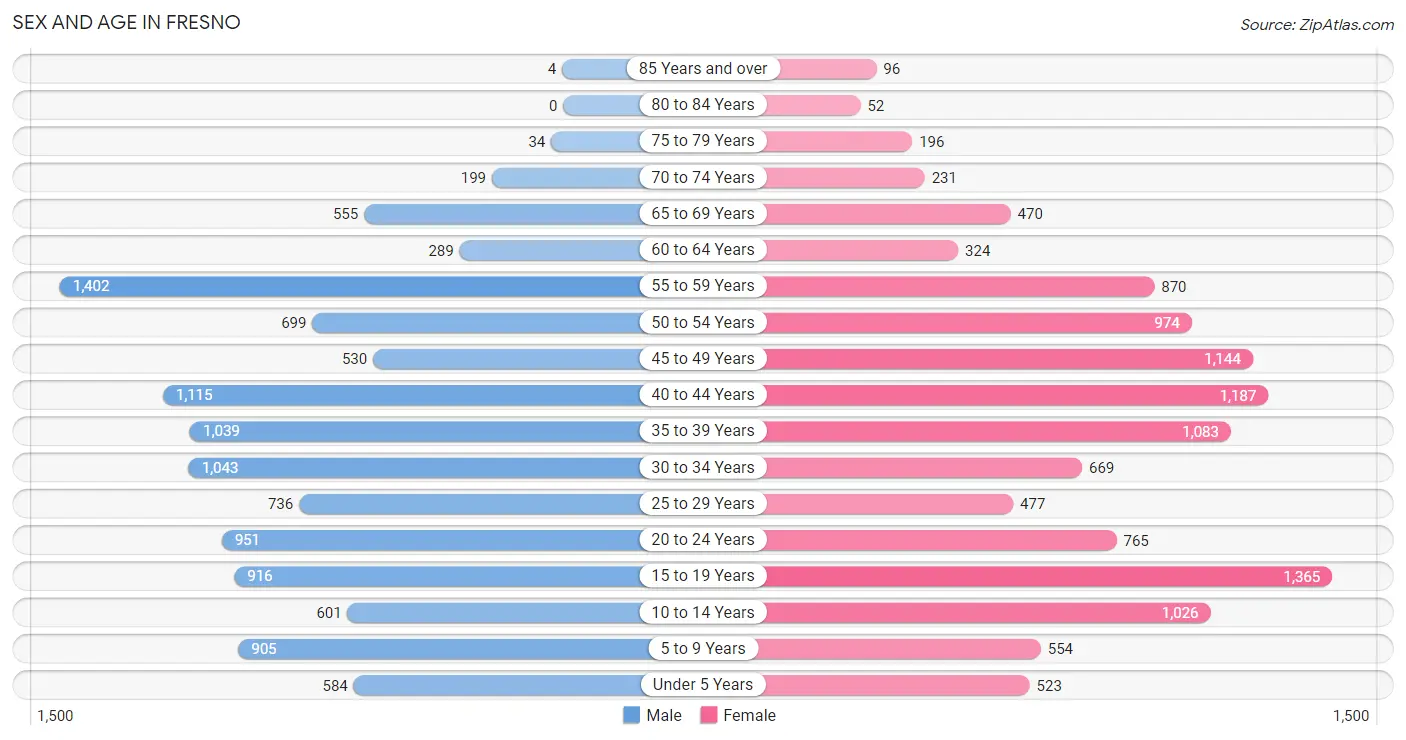
| Age Bracket | Male | Female |
| Under 5 Years | 584 (5.0%) | 523 (4.4%) |
| 5 to 9 Years | 905 (7.8%) | 554 (4.6%) |
| 10 to 14 Years | 601 (5.2%) | 1,026 (8.6%) |
| 15 to 19 Years | 916 (7.9%) | 1,365 (11.4%) |
| 20 to 24 Years | 951 (8.2%) | 765 (6.4%) |
| 25 to 29 Years | 736 (6.3%) | 477 (4.0%) |
| 30 to 34 Years | 1,043 (9.0%) | 669 (5.6%) |
| 35 to 39 Years | 1,039 (9.0%) | 1,083 (9.0%) |
| 40 to 44 Years | 1,115 (9.6%) | 1,187 (9.9%) |
| 45 to 49 Years | 530 (4.6%) | 1,144 (9.5%) |
| 50 to 54 Years | 699 (6.0%) | 974 (8.1%) |
| 55 to 59 Years | 1,402 (12.1%) | 870 (7.2%) |
| 60 to 64 Years | 289 (2.5%) | 324 (2.7%) |
| 65 to 69 Years | 555 (4.8%) | 470 (3.9%) |
| 70 to 74 Years | 199 (1.7%) | 231 (1.9%) |
| 75 to 79 Years | 34 (0.3%) | 196 (1.6%) |
| 80 to 84 Years | 0 (0.0%) | 52 (0.4%) |
| 85 Years and over | 4 (0.0%) | 96 (0.8%) |
| Total | 11,602 (100.0%) | 12,006 (100.0%) |
Families and Households in Fresno
Median Family Size in Fresno
The median family size in Fresno is 3.26 persons per family, with married-couple families (3,788 | 59.8%) accounting for the largest median family size of 3.57 persons per family. On the other hand, single male/father families (713 | 11.3%) represent the smallest median family size with 2.73 persons per family.
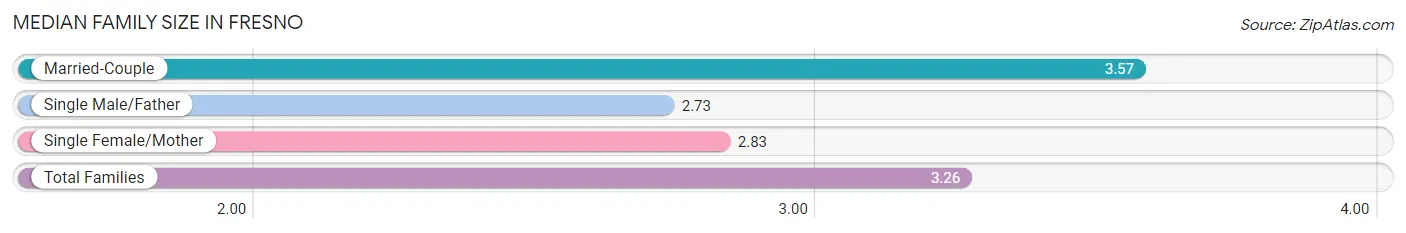
| Family Type | # Families | Family Size |
| Married-Couple | 3,788 (59.8%) | 3.57 |
| Single Male/Father | 713 (11.3%) | 2.73 |
| Single Female/Mother | 1,834 (28.9%) | 2.83 |
| Total Families | 6,335 (100.0%) | 3.26 |
Median Household Size in Fresno
The median household size in Fresno is 3.00 persons per household, with married-couple households (3,788 | 48.3%) accounting for the largest median household size of 3.58 persons per household. non-family households (1,511 | 19.3%) represent the smallest median household size with 1.23 persons per household.
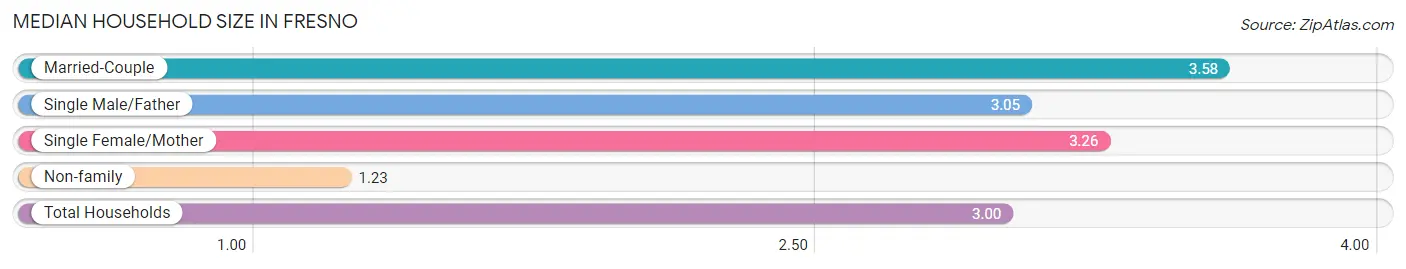
| Household Type | # Households | Household Size |
| Married-Couple | 3,788 (48.3%) | 3.58 |
| Single Male/Father | 713 (9.1%) | 3.05 |
| Single Female/Mother | 1,834 (23.4%) | 3.26 |
| Non-family | 1,511 (19.3%) | 1.23 |
| Total Households | 7,846 (100.0%) | 3.00 |
Household Size by Marriage Status in Fresno
Out of a total of 7,846 households in Fresno, 6,335 (80.7%) are family households, while 1,511 (19.3%) are nonfamily households. The most numerous type of family households are 2-person households, comprising 2,424, and the most common type of nonfamily households are 1-person households, comprising 1,266.
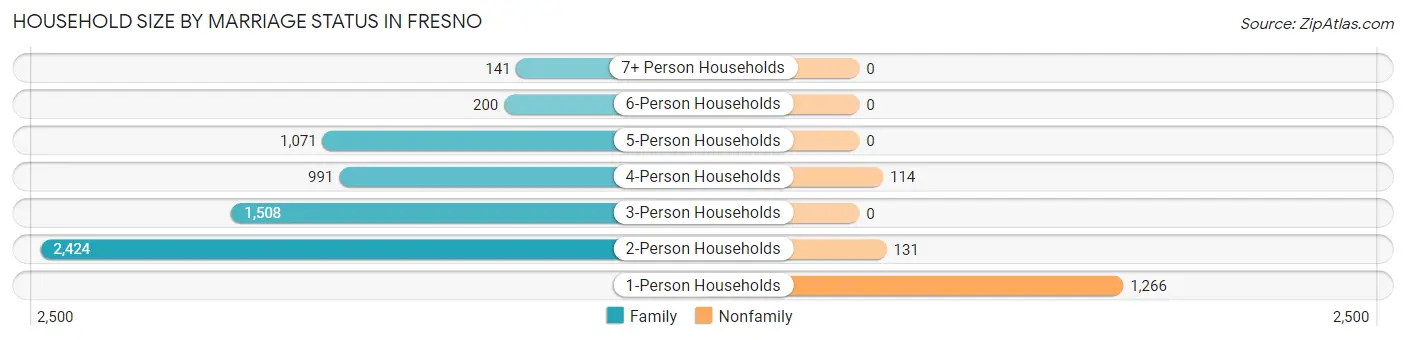
| Household Size | Family Households | Nonfamily Households |
| 1-Person Households | - | 1,266 (16.1%) |
| 2-Person Households | 2,424 (30.9%) | 131 (1.7%) |
| 3-Person Households | 1,508 (19.2%) | 0 (0.0%) |
| 4-Person Households | 991 (12.6%) | 114 (1.5%) |
| 5-Person Households | 1,071 (13.7%) | 0 (0.0%) |
| 6-Person Households | 200 (2.5%) | 0 (0.0%) |
| 7+ Person Households | 141 (1.8%) | 0 (0.0%) |
| Total | 6,335 (80.7%) | 1,511 (19.3%) |
Female Fertility in Fresno
Fertility by Age in Fresno
Average fertility rate in Fresno is 23.0 births per 1,000 women. Women in the age bracket of 35 to 50 years have the highest fertility rate with 40.0 births per 1,000 women. Women in the age bracket of 35 to 50 years acount for 88.1% of all women with births.
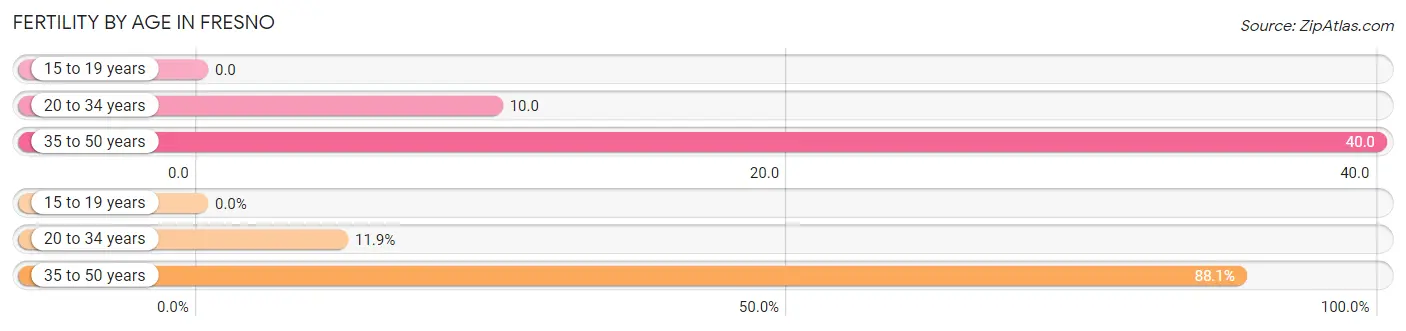
| Age Bracket | Women with Births | Births / 1,000 Women |
| 15 to 19 years | 0 (0.0%) | 0.0 |
| 20 to 34 years | 19 (11.9%) | 10.0 |
| 35 to 50 years | 141 (88.1%) | 40.0 |
| Total | 160 (100.0%) | 23.0 |
Fertility by Age by Marriage Status in Fresno
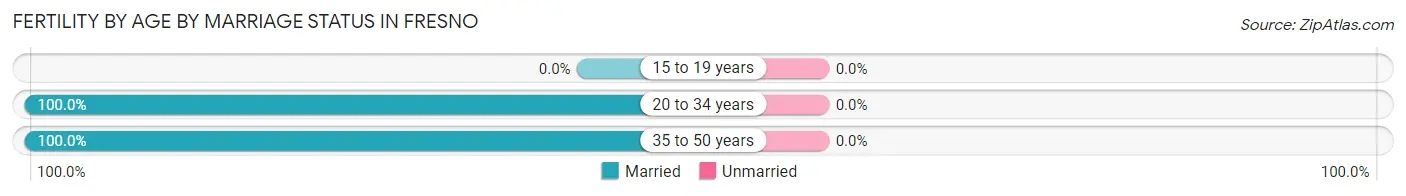
| Age Bracket | Married | Unmarried |
| 15 to 19 years | 0 (0.0%) | 0 (0.0%) |
| 20 to 34 years | 19 (100.0%) | 0 (0.0%) |
| 35 to 50 years | 141 (100.0%) | 0 (0.0%) |
| Total | 160 (100.0%) | 0 (0.0%) |
Fertility by Education in Fresno
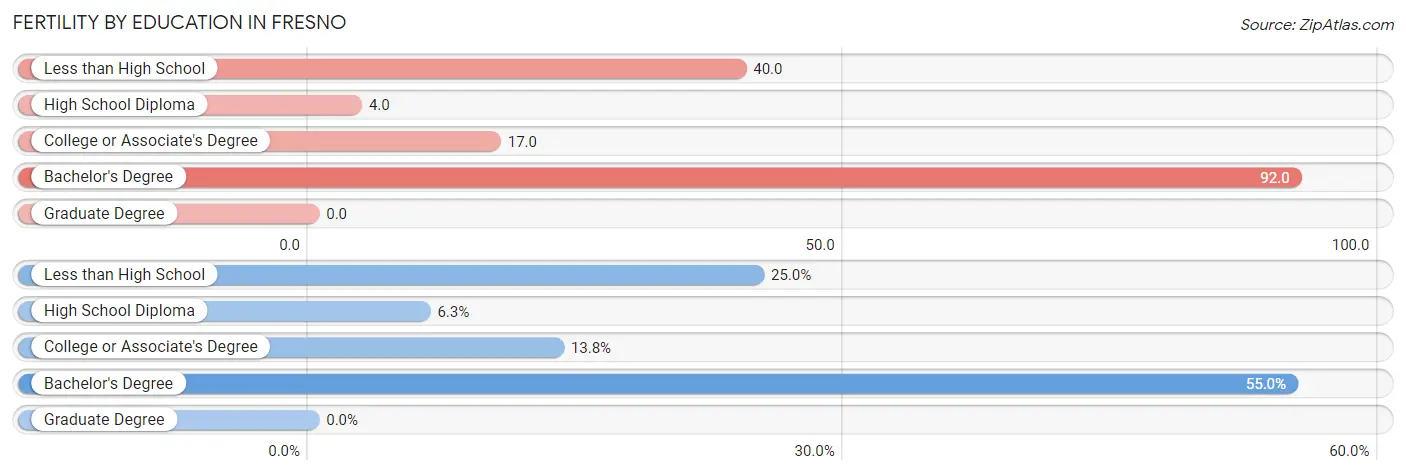
| Educational Attainment | Women with Births | Births / 1,000 Women |
| Less than High School | 40 (25.0%) | 40.0 |
| High School Diploma | 10 (6.2%) | 4.0 |
| College or Associate's Degree | 22 (13.8%) | 17.0 |
| Bachelor's Degree | 88 (55.0%) | 92.0 |
| Graduate Degree | 0 (0.0%) | 0.0 |
| Total | 160 (100.0%) | 23.0 |
Fertility by Education by Marriage Status in Fresno
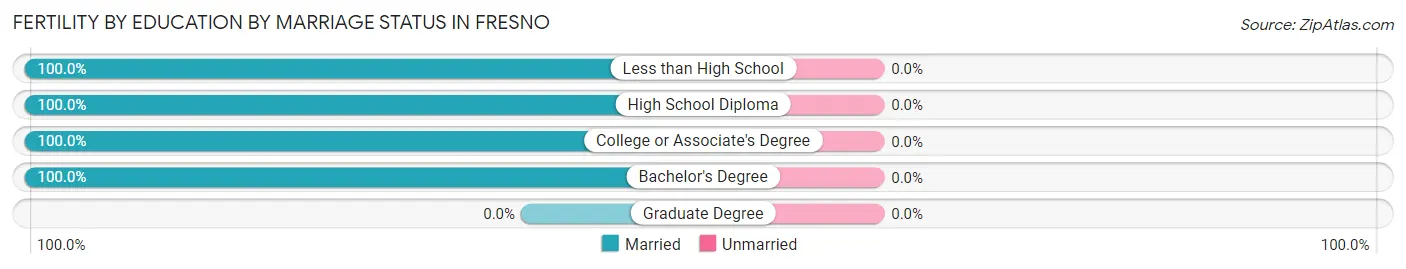
| Educational Attainment | Married | Unmarried |
| Less than High School | 40 (100.0%) | 0 (0.0%) |
| High School Diploma | 10 (100.0%) | 0 (0.0%) |
| College or Associate's Degree | 22 (100.0%) | 0 (0.0%) |
| Bachelor's Degree | 88 (100.0%) | 0 (0.0%) |
| Graduate Degree | 0 (0.0%) | 0 (0.0%) |
| Total | 160 (100.0%) | 0 (0.0%) |
Employment Characteristics in Fresno
Employment by Class of Employer in Fresno
Among the 13,470 employed individuals in Fresno, private company employees (9,955 | 73.9%), local government employees (1,069 | 7.9%), and self-employed (not incorporated) (707 | 5.2%) make up the most common classes of employment.
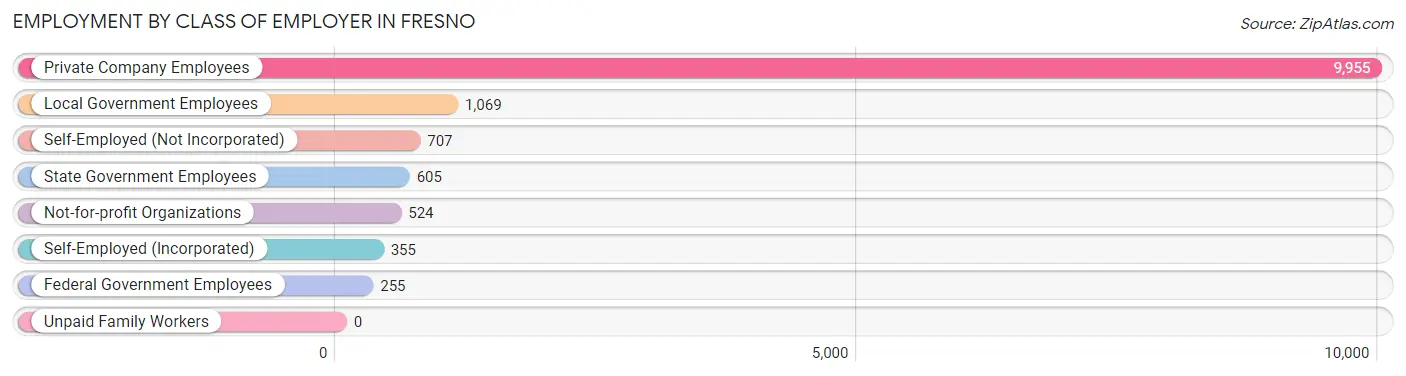
| Employer Class | # Employees | % Employees |
| Private Company Employees | 9,955 | 73.9% |
| Self-Employed (Incorporated) | 355 | 2.6% |
| Self-Employed (Not Incorporated) | 707 | 5.2% |
| Not-for-profit Organizations | 524 | 3.9% |
| Local Government Employees | 1,069 | 7.9% |
| State Government Employees | 605 | 4.5% |
| Federal Government Employees | 255 | 1.9% |
| Unpaid Family Workers | 0 | 0.0% |
| Total | 13,470 | 100.0% |
Employment Status by Age in Fresno
According to the labor force statistics for Fresno, out of the total population over 16 years of age (18,935), 75.1% or 14,220 individuals are in the labor force, with 4.6% or 654 of them unemployed. The age group with the highest labor force participation rate is 45 to 54 years, with 93.3% or 3,123 individuals in the labor force. Within the labor force, the 25 to 29 years age range has the highest percentage of unemployed individuals, with 21.6% or 242 of them being unemployed.
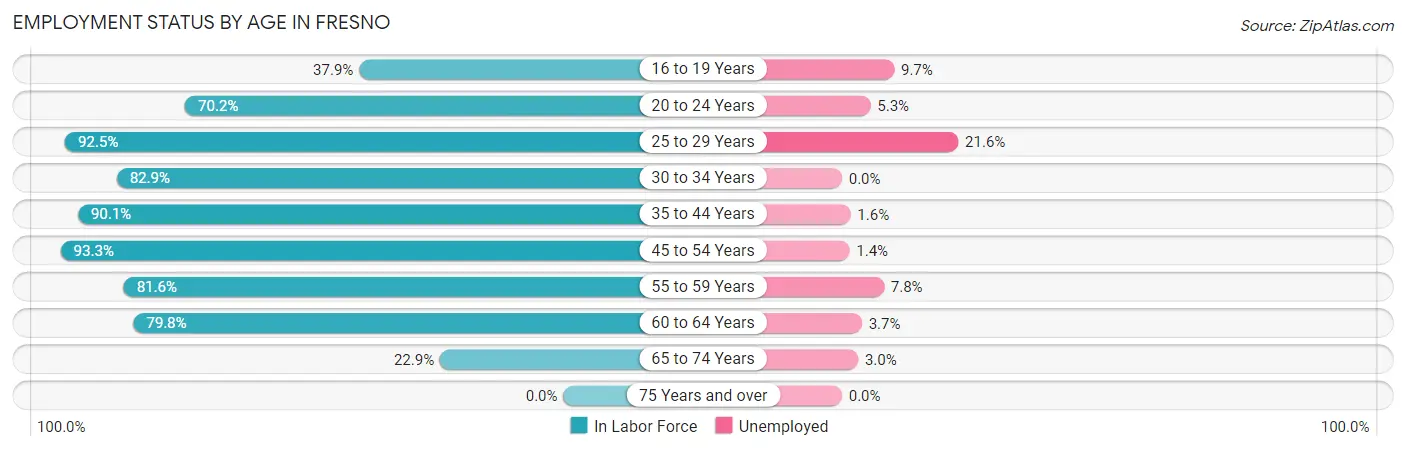
| Age Bracket | In Labor Force | Unemployed |
| 16 to 19 Years | 683 (37.9%) | 66 (9.7%) |
| 20 to 24 Years | 1,205 (70.2%) | 64 (5.3%) |
| 25 to 29 Years | 1,122 (92.5%) | 242 (21.6%) |
| 30 to 34 Years | 1,419 (82.9%) | 0 (0.0%) |
| 35 to 44 Years | 3,986 (90.1%) | 64 (1.6%) |
| 45 to 54 Years | 3,123 (93.3%) | 44 (1.4%) |
| 55 to 59 Years | 1,854 (81.6%) | 145 (7.8%) |
| 60 to 64 Years | 489 (79.8%) | 18 (3.7%) |
| 65 to 74 Years | 333 (22.9%) | 10 (3.0%) |
| 75 Years and over | 0 (0.0%) | 0 (0.0%) |
| Total | 14,220 (75.1%) | 654 (4.6%) |
Employment Status by Educational Attainment in Fresno
According to labor force statistics for Fresno, 88.3% of individuals (11,992) out of the total population between 25 and 64 years of age (13,581) are in the labor force, with 4.3% or 516 of them being unemployed. The group with the highest labor force participation rate are those with the educational attainment of bachelor's degree or higher, with 96.0% or 3,448 individuals in the labor force. Within the labor force, individuals with high school diploma education have the highest percentage of unemployment, with 8.9% or 356 of them being unemployed.
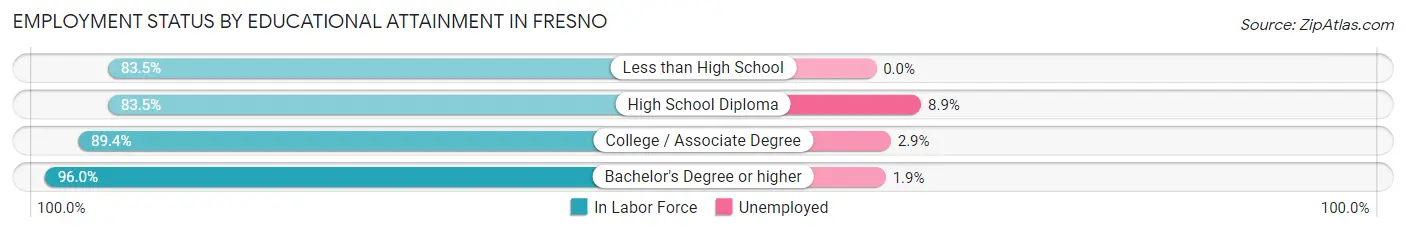
| Educational Attainment | In Labor Force | Unemployed |
| Less than High School | 1,465 (83.5%) | 0 (0.0%) |
| High School Diploma | 4,004 (83.5%) | 427 (8.9%) |
| College / Associate Degree | 3,074 (89.4%) | 100 (2.9%) |
| Bachelor's Degree or higher | 3,448 (96.0%) | 68 (1.9%) |
| Total | 11,992 (88.3%) | 584 (4.3%) |
Employment Occupations by Sex in Fresno
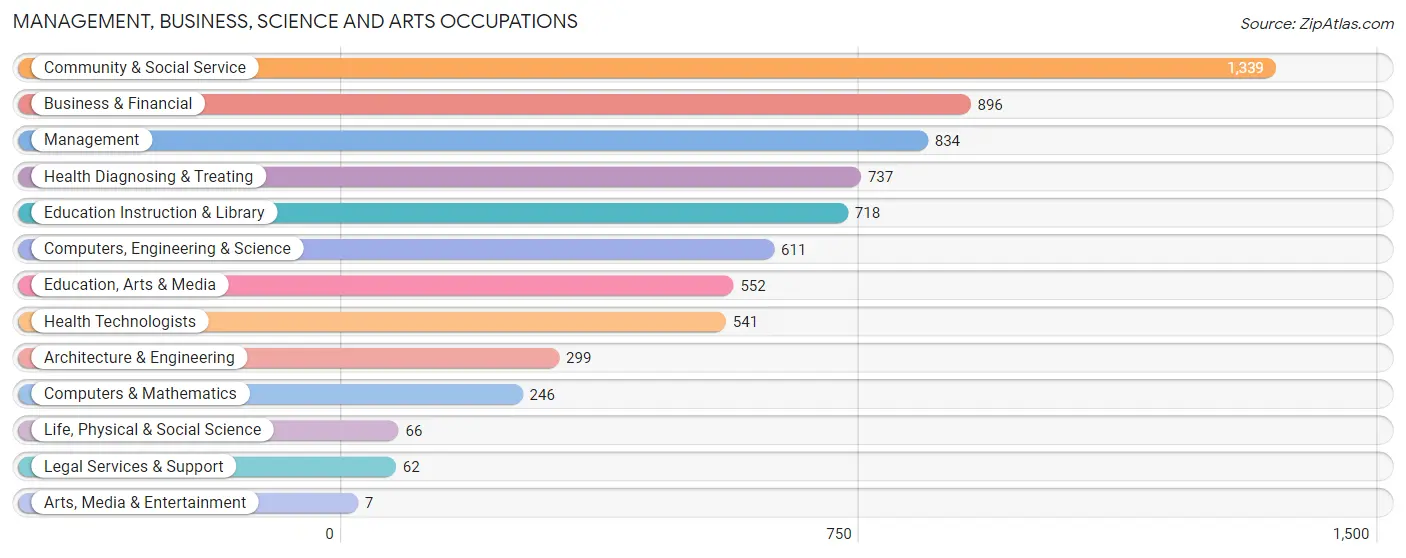
Management, Business, Science and Arts Occupations
The most common Management, Business, Science and Arts occupations in Fresno are Community & Social Service (1,339 | 9.9%), Business & Financial (896 | 6.6%), Management (834 | 6.2%), Health Diagnosing & Treating (737 | 5.4%), and Education Instruction & Library (718 | 5.3%).
Management, Business, Science and Arts Occupations by Sex
Within the Management, Business, Science and Arts occupations in Fresno, the most male-oriented occupations are Architecture & Engineering (100.0%), Arts, Media & Entertainment (100.0%), and Computers, Engineering & Science (80.5%), while the most female-oriented occupations are Life, Physical & Social Science (100.0%), Education Instruction & Library (89.8%), and Health Technologists (86.7%).
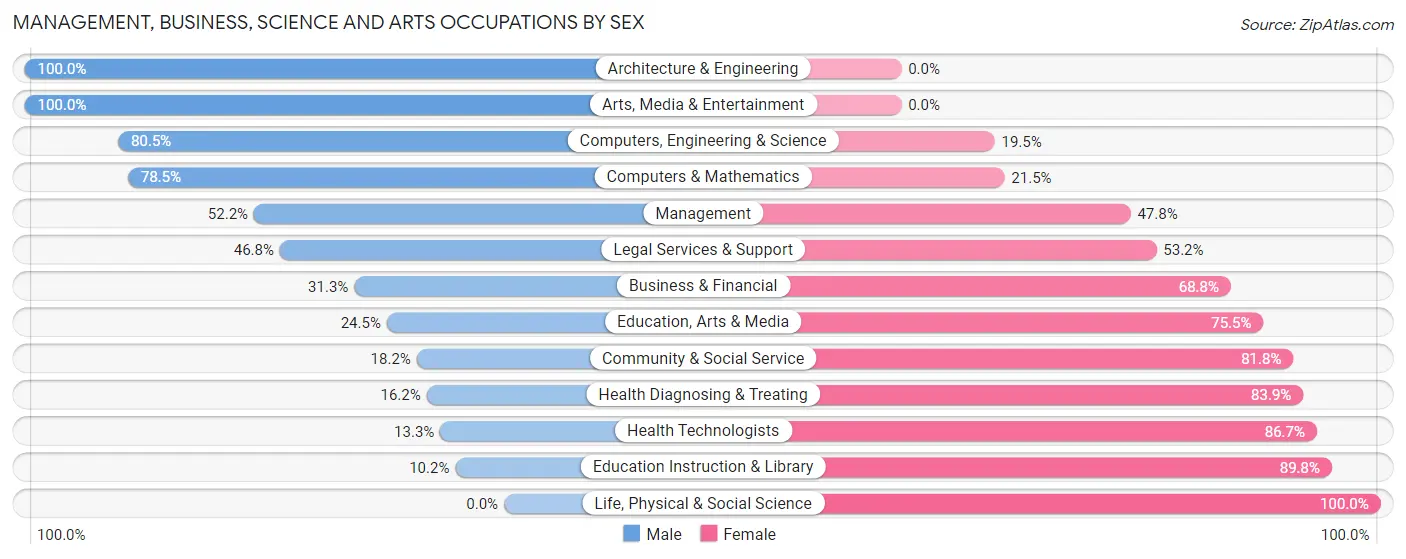
| Occupation | Male | Female |
| Management | 435 (52.2%) | 399 (47.8%) |
| Business & Financial | 280 (31.2%) | 616 (68.8%) |
| Computers, Engineering & Science | 492 (80.5%) | 119 (19.5%) |
| Computers & Mathematics | 193 (78.5%) | 53 (21.5%) |
| Architecture & Engineering | 299 (100.0%) | 0 (0.0%) |
| Life, Physical & Social Science | 0 (0.0%) | 66 (100.0%) |
| Community & Social Service | 244 (18.2%) | 1,095 (81.8%) |
| Education, Arts & Media | 135 (24.5%) | 417 (75.5%) |
| Legal Services & Support | 29 (46.8%) | 33 (53.2%) |
| Education Instruction & Library | 73 (10.2%) | 645 (89.8%) |
| Arts, Media & Entertainment | 7 (100.0%) | 0 (0.0%) |
| Health Diagnosing & Treating | 119 (16.2%) | 618 (83.9%) |
| Health Technologists | 72 (13.3%) | 469 (86.7%) |
| Total (Category) | 1,570 (35.5%) | 2,847 (64.5%) |
| Total (Overall) | 6,978 (51.6%) | 6,541 (48.4%) |
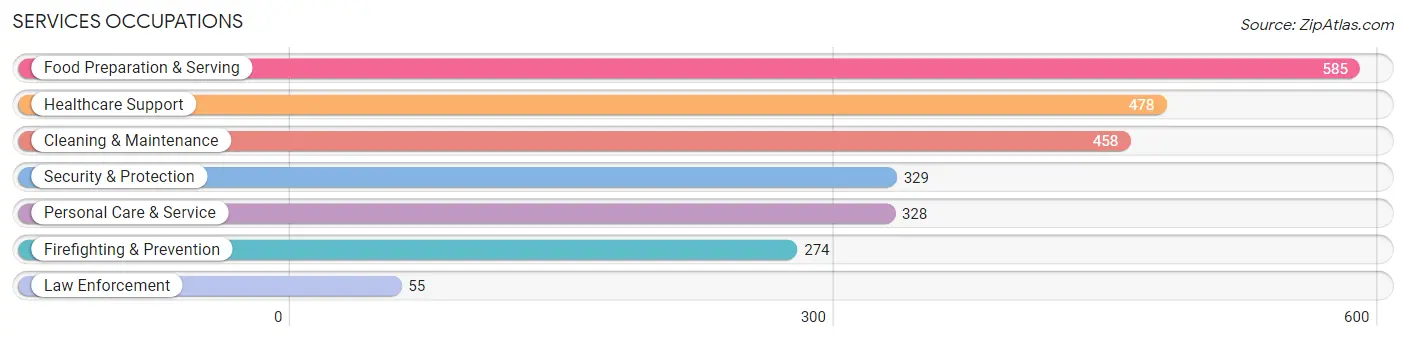
Services Occupations
The most common Services occupations in Fresno are Food Preparation & Serving (585 | 4.3%), Healthcare Support (478 | 3.5%), Cleaning & Maintenance (458 | 3.4%), Security & Protection (329 | 2.4%), and Personal Care & Service (328 | 2.4%).
Services Occupations by Sex
Within the Services occupations in Fresno, the most male-oriented occupations are Law Enforcement (100.0%), Cleaning & Maintenance (62.0%), and Security & Protection (61.1%), while the most female-oriented occupations are Healthcare Support (96.4%), Personal Care & Service (91.5%), and Food Preparation & Serving (68.2%).
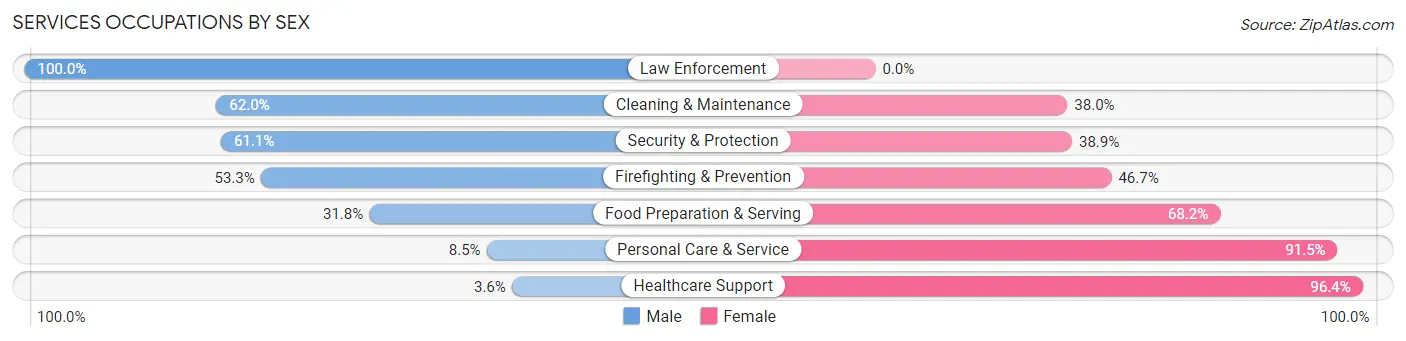
| Occupation | Male | Female |
| Healthcare Support | 17 (3.6%) | 461 (96.4%) |
| Security & Protection | 201 (61.1%) | 128 (38.9%) |
| Firefighting & Prevention | 146 (53.3%) | 128 (46.7%) |
| Law Enforcement | 55 (100.0%) | 0 (0.0%) |
| Food Preparation & Serving | 186 (31.8%) | 399 (68.2%) |
| Cleaning & Maintenance | 284 (62.0%) | 174 (38.0%) |
| Personal Care & Service | 28 (8.5%) | 300 (91.5%) |
| Total (Category) | 716 (32.9%) | 1,462 (67.1%) |
| Total (Overall) | 6,978 (51.6%) | 6,541 (48.4%) |
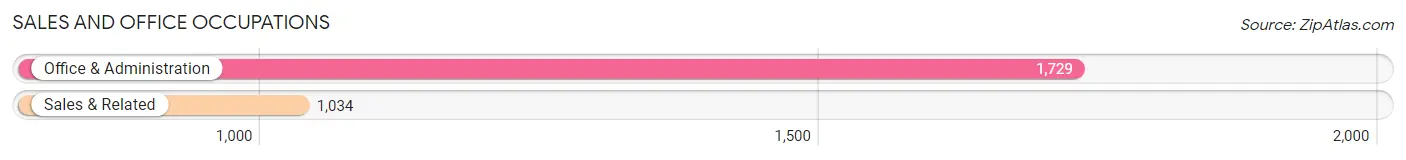
Sales and Office Occupations
The most common Sales and Office occupations in Fresno are Office & Administration (1,729 | 12.8%), and Sales & Related (1,034 | 7.6%).
Sales and Office Occupations by Sex
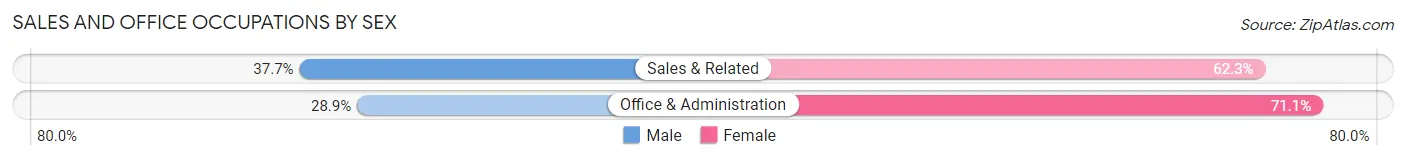
| Occupation | Male | Female |
| Sales & Related | 390 (37.7%) | 644 (62.3%) |
| Office & Administration | 499 (28.9%) | 1,230 (71.1%) |
| Total (Category) | 889 (32.2%) | 1,874 (67.8%) |
| Total (Overall) | 6,978 (51.6%) | 6,541 (48.4%) |
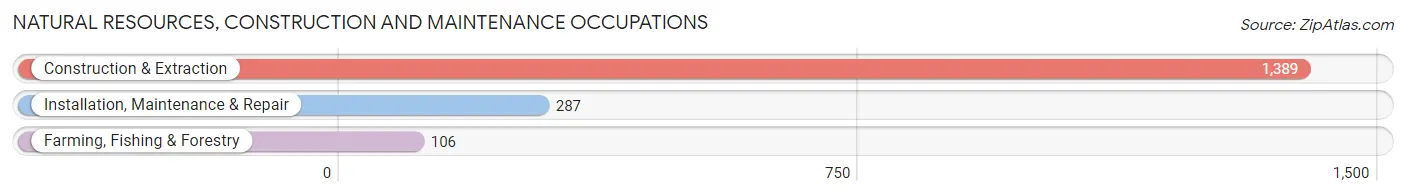
Natural Resources, Construction and Maintenance Occupations
The most common Natural Resources, Construction and Maintenance occupations in Fresno are Construction & Extraction (1,389 | 10.3%), Installation, Maintenance & Repair (287 | 2.1%), and Farming, Fishing & Forestry (106 | 0.8%).
Natural Resources, Construction and Maintenance Occupations by Sex
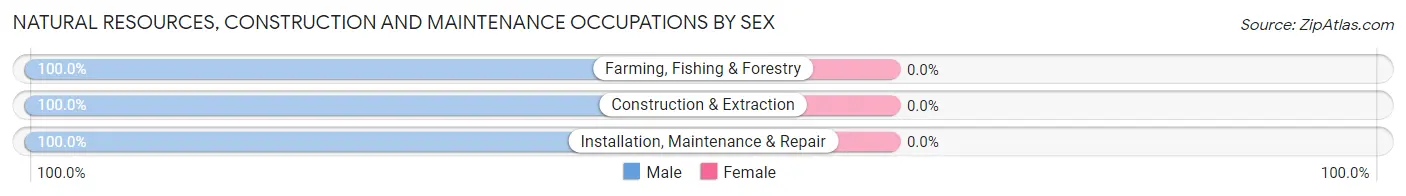
| Occupation | Male | Female |
| Farming, Fishing & Forestry | 106 (100.0%) | 0 (0.0%) |
| Construction & Extraction | 1,389 (100.0%) | 0 (0.0%) |
| Installation, Maintenance & Repair | 287 (100.0%) | 0 (0.0%) |
| Total (Category) | 1,782 (100.0%) | 0 (0.0%) |
| Total (Overall) | 6,978 (51.6%) | 6,541 (48.4%) |
Production, Transportation and Moving Occupations
The most common Production, Transportation and Moving occupations in Fresno are Transportation (1,365 | 10.1%), Production (538 | 4.0%), and Material Moving (476 | 3.5%).
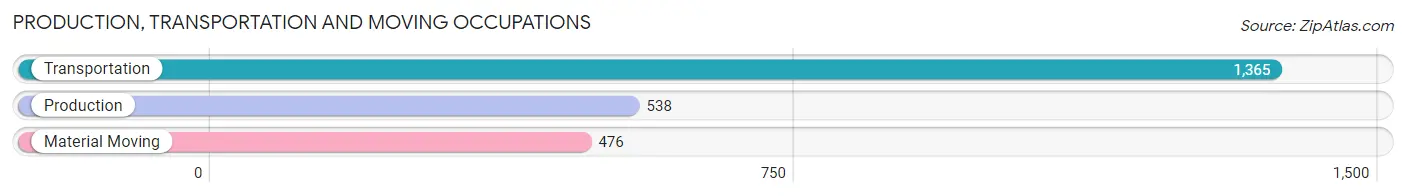
Production, Transportation and Moving Occupations by Sex
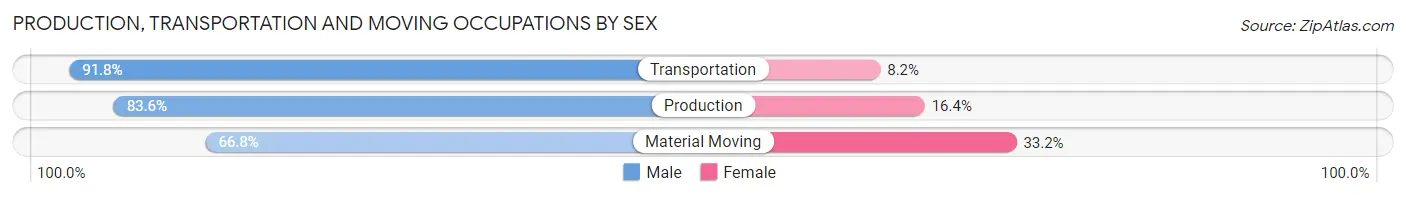
| Occupation | Male | Female |
| Production | 450 (83.6%) | 88 (16.4%) |
| Transportation | 1,253 (91.8%) | 112 (8.2%) |
| Material Moving | 318 (66.8%) | 158 (33.2%) |
| Total (Category) | 2,021 (85.0%) | 358 (15.0%) |
| Total (Overall) | 6,978 (51.6%) | 6,541 (48.4%) |
Employment Industries by Sex in Fresno
Employment Industries in Fresno
The major employment industries in Fresno include Health Care & Social Assistance (1,984 | 14.7%), Transportation & Warehousing (1,416 | 10.5%), Construction (1,401 | 10.4%), Educational Services (1,392 | 10.3%), and Retail Trade (907 | 6.7%).
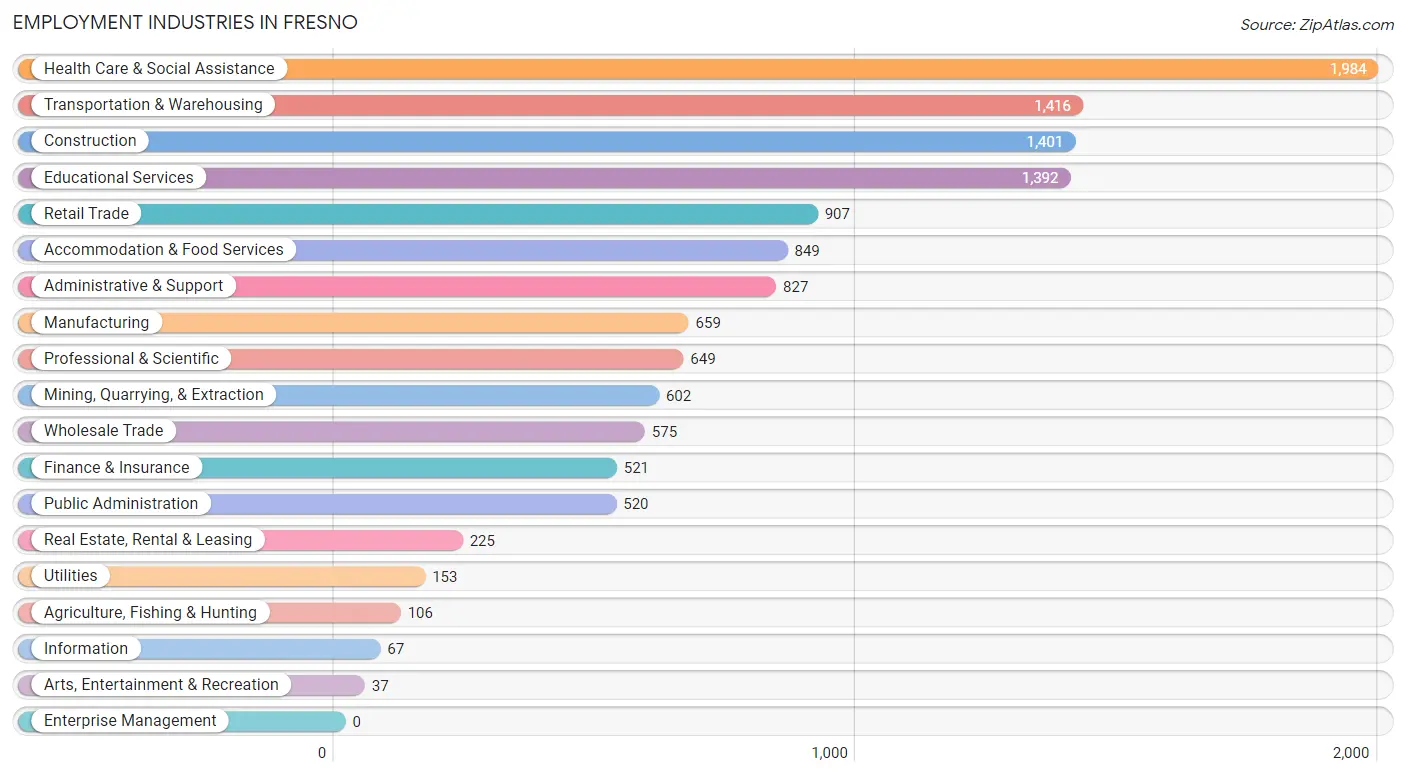
Employment Industries by Sex in Fresno
The Fresno industries that see more men than women are Agriculture, Fishing & Hunting (100.0%), Construction (98.3%), and Utilities (89.5%), whereas the industries that tend to have a higher number of women are Health Care & Social Assistance (87.5%), Educational Services (76.3%), and Finance & Insurance (73.5%).
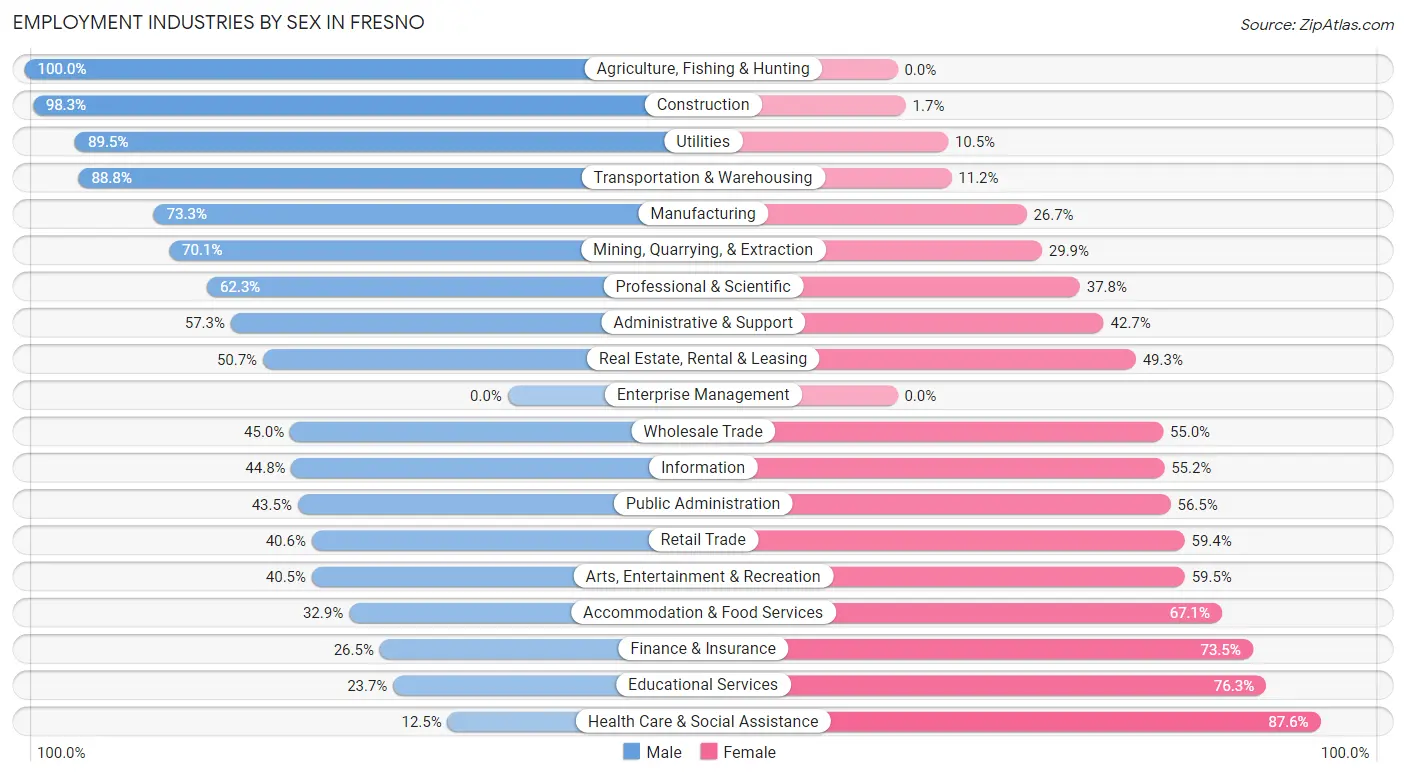
| Industry | Male | Female |
| Agriculture, Fishing & Hunting | 106 (100.0%) | 0 (0.0%) |
| Mining, Quarrying, & Extraction | 422 (70.1%) | 180 (29.9%) |
| Construction | 1,377 (98.3%) | 24 (1.7%) |
| Manufacturing | 483 (73.3%) | 176 (26.7%) |
| Wholesale Trade | 259 (45.0%) | 316 (55.0%) |
| Retail Trade | 368 (40.6%) | 539 (59.4%) |
| Transportation & Warehousing | 1,258 (88.8%) | 158 (11.2%) |
| Utilities | 137 (89.5%) | 16 (10.5%) |
| Information | 30 (44.8%) | 37 (55.2%) |
| Finance & Insurance | 138 (26.5%) | 383 (73.5%) |
| Real Estate, Rental & Leasing | 114 (50.7%) | 111 (49.3%) |
| Professional & Scientific | 404 (62.3%) | 245 (37.8%) |
| Enterprise Management | 0 (0.0%) | 0 (0.0%) |
| Administrative & Support | 474 (57.3%) | 353 (42.7%) |
| Educational Services | 330 (23.7%) | 1,062 (76.3%) |
| Health Care & Social Assistance | 247 (12.4%) | 1,737 (87.5%) |
| Arts, Entertainment & Recreation | 15 (40.5%) | 22 (59.5%) |
| Accommodation & Food Services | 279 (32.9%) | 570 (67.1%) |
| Public Administration | 226 (43.5%) | 294 (56.5%) |
| Total | 6,978 (51.6%) | 6,541 (48.4%) |
Education in Fresno
School Enrollment in Fresno
The most common levels of schooling among the 5,559 students in Fresno are middle school (1,366 | 24.6%), high school (1,203 | 21.6%), and elementary school (1,162 | 20.9%).
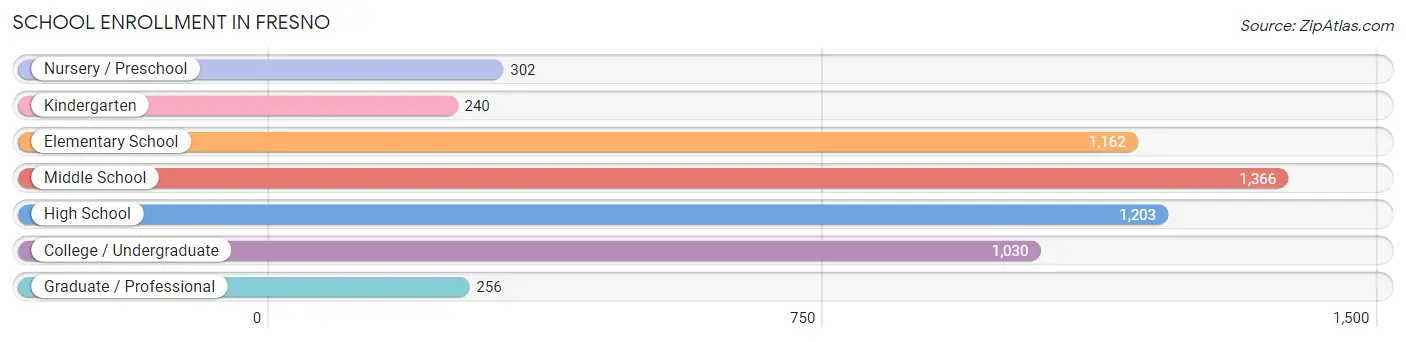
| School Level | # Students | % Students |
| Nursery / Preschool | 302 | 5.4% |
| Kindergarten | 240 | 4.3% |
| Elementary School | 1,162 | 20.9% |
| Middle School | 1,366 | 24.6% |
| High School | 1,203 | 21.6% |
| College / Undergraduate | 1,030 | 18.5% |
| Graduate / Professional | 256 | 4.6% |
| Total | 5,559 | 100.0% |
School Enrollment by Age by Funding Source in Fresno
Out of a total of 5,559 students who are enrolled in schools in Fresno, 233 (4.2%) attend a private institution, while the remaining 5,326 (95.8%) are enrolled in public schools. The age group of 3 to 4 year olds has the highest likelihood of being enrolled in private schools, with 89 (60.5% in the age bracket) enrolled. Conversely, the age group of 15 to 17 year olds has the lowest likelihood of being enrolled in a private school, with 1,033 (100.0% in the age bracket) attending a public institution.
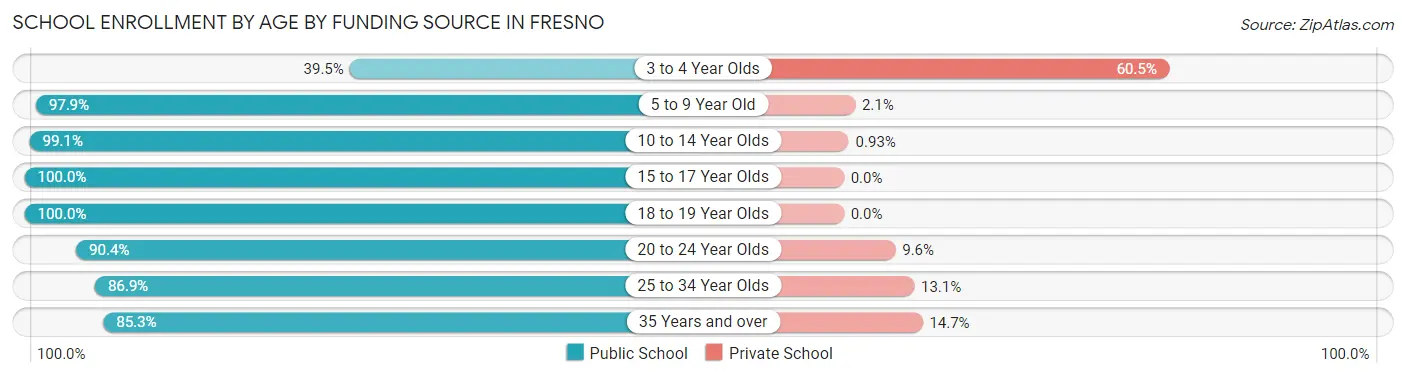
| Age Bracket | Public School | Private School |
| 3 to 4 Year Olds | 58 (39.5%) | 89 (60.5%) |
| 5 to 9 Year Old | 1,346 (97.9%) | 29 (2.1%) |
| 10 to 14 Year Olds | 1,593 (99.1%) | 15 (0.9%) |
| 15 to 17 Year Olds | 1,033 (100.0%) | 0 (0.0%) |
| 18 to 19 Year Olds | 530 (100.0%) | 0 (0.0%) |
| 20 to 24 Year Olds | 414 (90.4%) | 44 (9.6%) |
| 25 to 34 Year Olds | 159 (86.9%) | 24 (13.1%) |
| 35 Years and over | 192 (85.3%) | 33 (14.7%) |
| Total | 5,326 (95.8%) | 233 (4.2%) |
Educational Attainment by Field of Study in Fresno
Business (1,092 | 26.5%), science & technology (731 | 17.8%), arts & humanities (419 | 10.2%), education (339 | 8.2%), and psychology (314 | 7.6%) are the most common fields of study among 4,115 individuals in Fresno who have obtained a bachelor's degree or higher.
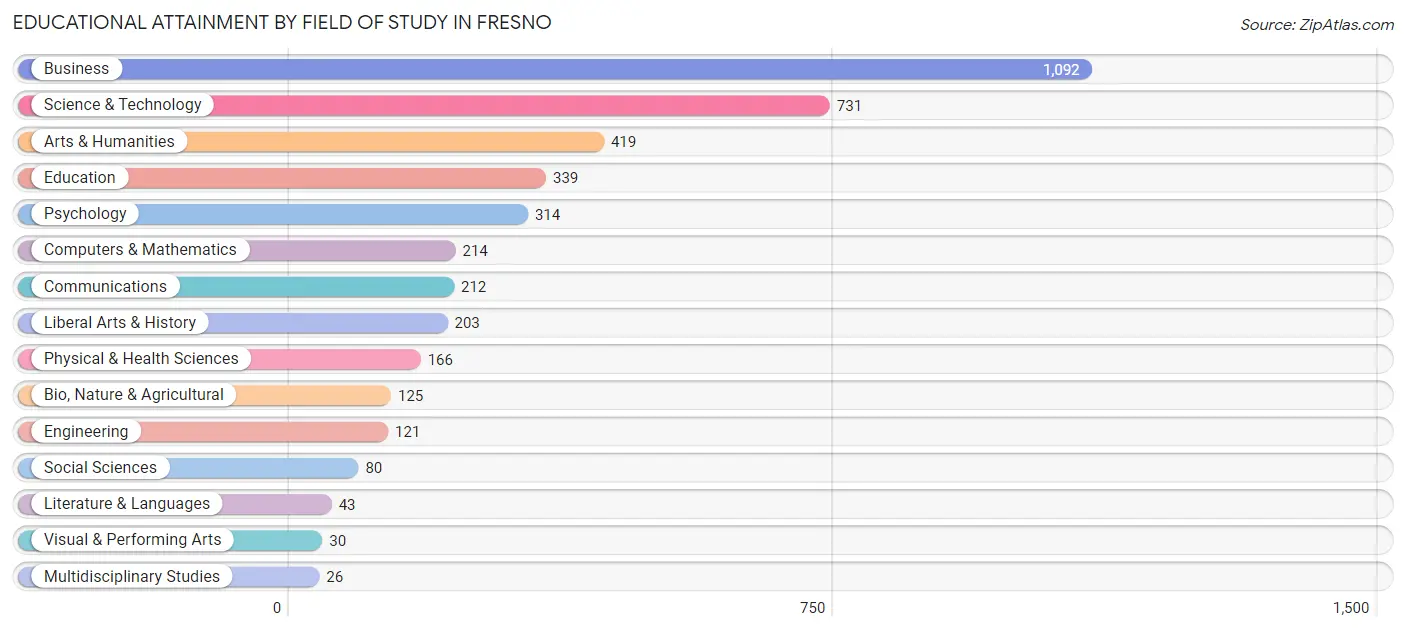
| Field of Study | # Graduates | % Graduates |
| Computers & Mathematics | 214 | 5.2% |
| Bio, Nature & Agricultural | 125 | 3.0% |
| Physical & Health Sciences | 166 | 4.0% |
| Psychology | 314 | 7.6% |
| Social Sciences | 80 | 1.9% |
| Engineering | 121 | 2.9% |
| Multidisciplinary Studies | 26 | 0.6% |
| Science & Technology | 731 | 17.8% |
| Business | 1,092 | 26.5% |
| Education | 339 | 8.2% |
| Literature & Languages | 43 | 1.0% |
| Liberal Arts & History | 203 | 4.9% |
| Visual & Performing Arts | 30 | 0.7% |
| Communications | 212 | 5.1% |
| Arts & Humanities | 419 | 10.2% |
| Total | 4,115 | 100.0% |
Transportation & Commute in Fresno
Vehicle Availability by Sex in Fresno
The most prevalent vehicle ownership categories in Fresno are males with 2 vehicles (2,698, accounting for 38.7%) and females with 2 vehicles (2,333, making up 41.6%).
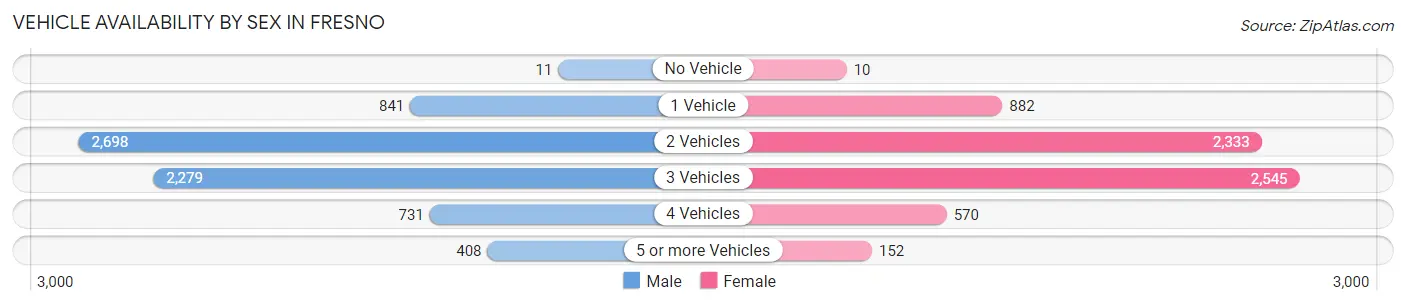
| Vehicles Available | Male | Female |
| No Vehicle | 11 (0.2%) | 10 (0.2%) |
| 1 Vehicle | 841 (12.1%) | 882 (13.6%) |
| 2 Vehicles | 2,698 (38.7%) | 2,333 (35.9%) |
| 3 Vehicles | 2,279 (32.7%) | 2,545 (39.2%) |
| 4 Vehicles | 731 (10.5%) | 570 (8.8%) |
| 5 or more Vehicles | 408 (5.9%) | 152 (2.3%) |
| Total | 6,968 (100.0%) | 6,492 (100.0%) |
Commute Time in Fresno
The most frequently occuring commute durations in Fresno are 30 to 34 minutes (2,702 commuters, 22.2%), 45 to 59 minutes (1,979 commuters, 16.2%), and 60 to 89 minutes (1,598 commuters, 13.1%).
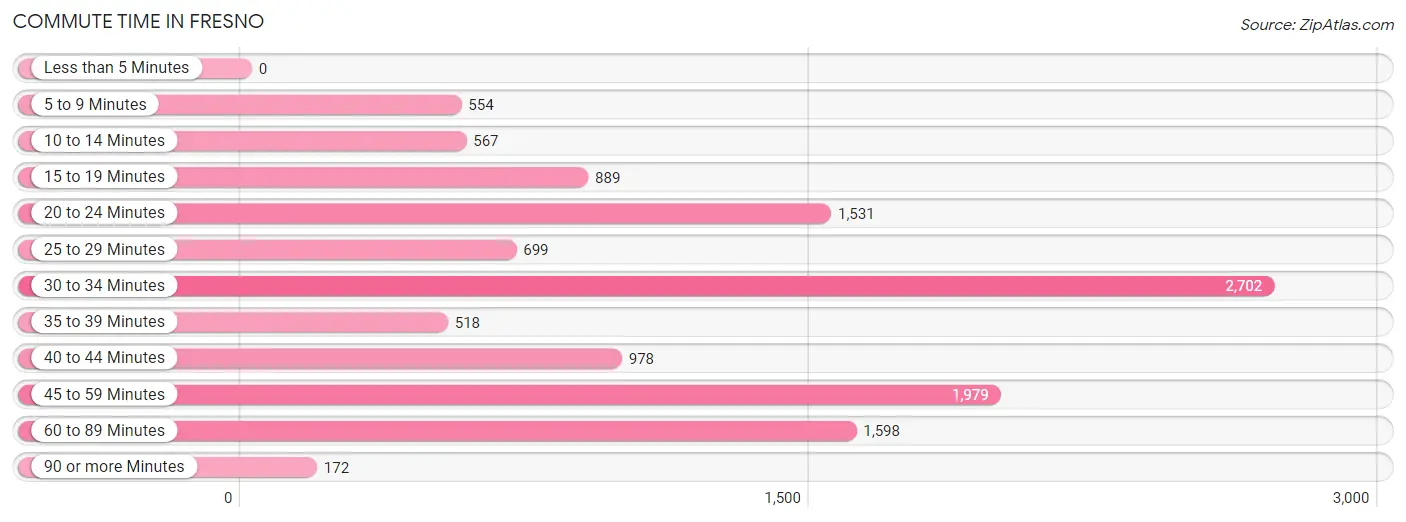
| Commute Time | # Commuters | % Commuters |
| Less than 5 Minutes | 0 | 0.0% |
| 5 to 9 Minutes | 554 | 4.5% |
| 10 to 14 Minutes | 567 | 4.6% |
| 15 to 19 Minutes | 889 | 7.3% |
| 20 to 24 Minutes | 1,531 | 12.6% |
| 25 to 29 Minutes | 699 | 5.7% |
| 30 to 34 Minutes | 2,702 | 22.2% |
| 35 to 39 Minutes | 518 | 4.3% |
| 40 to 44 Minutes | 978 | 8.0% |
| 45 to 59 Minutes | 1,979 | 16.2% |
| 60 to 89 Minutes | 1,598 | 13.1% |
| 90 or more Minutes | 172 | 1.4% |
Commute Time by Sex in Fresno
The most common commute times in Fresno are 30 to 34 minutes (1,447 commuters, 21.8%) for males and 30 to 34 minutes (1,255 commuters, 22.6%) for females.
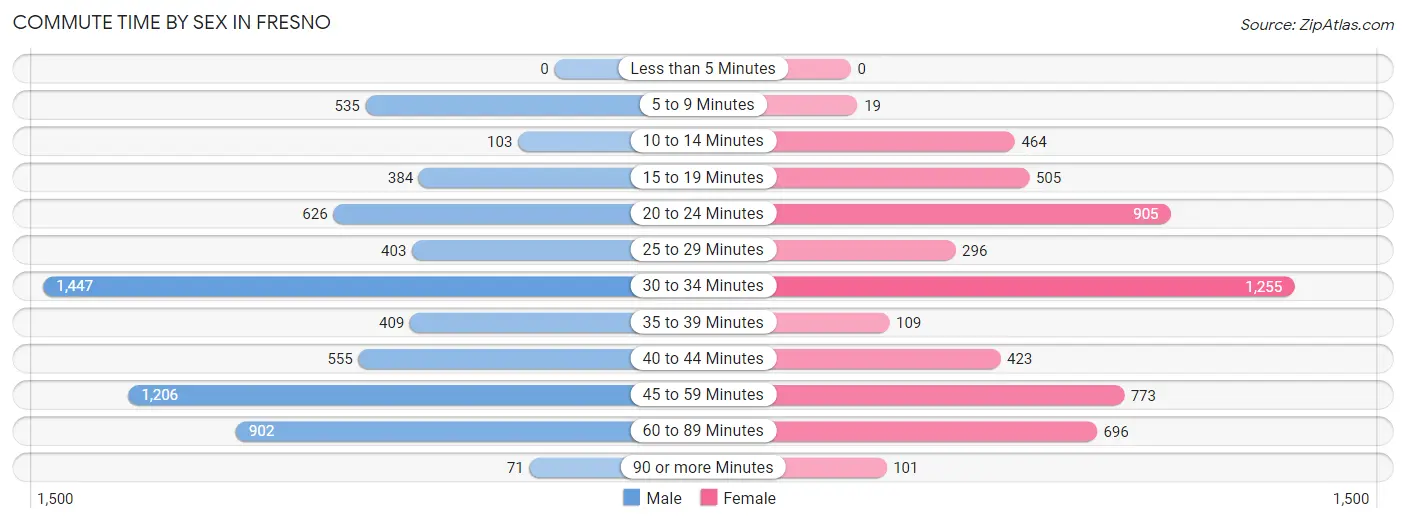
| Commute Time | Male | Female |
| Less than 5 Minutes | 0 (0.0%) | 0 (0.0%) |
| 5 to 9 Minutes | 535 (8.1%) | 19 (0.3%) |
| 10 to 14 Minutes | 103 (1.5%) | 464 (8.4%) |
| 15 to 19 Minutes | 384 (5.8%) | 505 (9.1%) |
| 20 to 24 Minutes | 626 (9.4%) | 905 (16.3%) |
| 25 to 29 Minutes | 403 (6.1%) | 296 (5.3%) |
| 30 to 34 Minutes | 1,447 (21.8%) | 1,255 (22.6%) |
| 35 to 39 Minutes | 409 (6.2%) | 109 (2.0%) |
| 40 to 44 Minutes | 555 (8.4%) | 423 (7.6%) |
| 45 to 59 Minutes | 1,206 (18.2%) | 773 (13.9%) |
| 60 to 89 Minutes | 902 (13.6%) | 696 (12.6%) |
| 90 or more Minutes | 71 (1.1%) | 101 (1.8%) |
Time of Departure to Work by Sex in Fresno
The most frequent times of departure to work in Fresno are 12:00 AM to 4:59 AM (1,305, 19.7%) for males and 7:00 AM to 7:29 AM (1,274, 23.0%) for females.
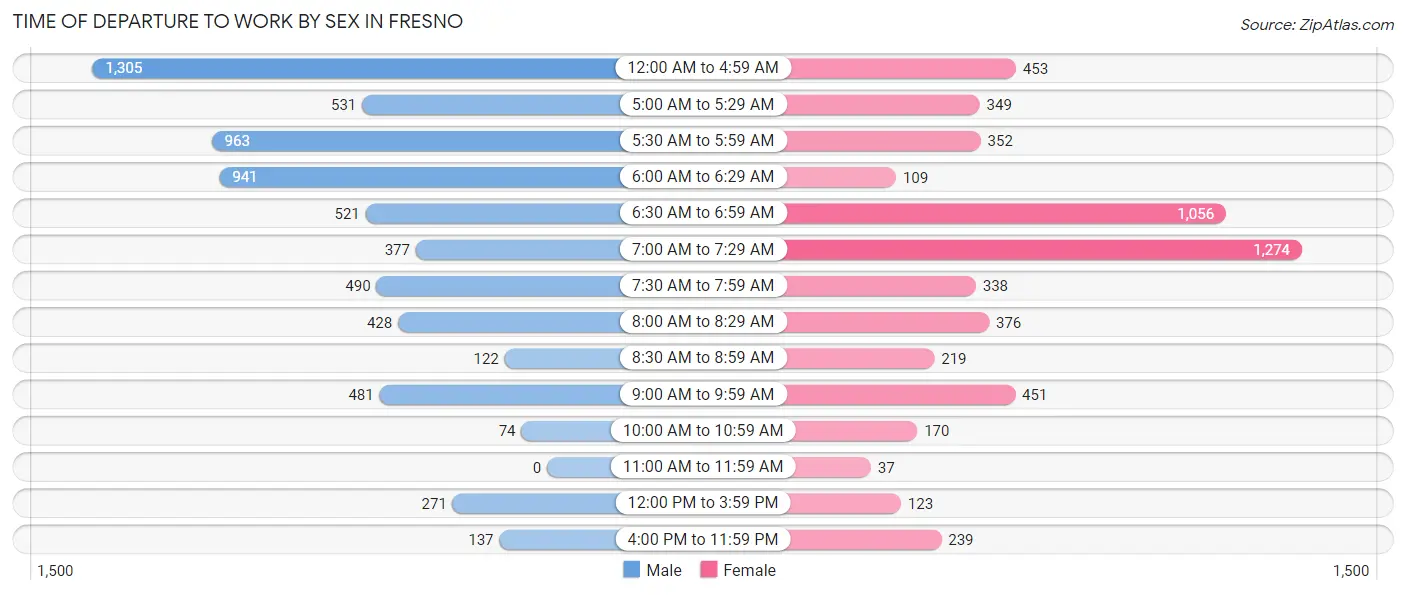
| Time of Departure | Male | Female |
| 12:00 AM to 4:59 AM | 1,305 (19.7%) | 453 (8.2%) |
| 5:00 AM to 5:29 AM | 531 (8.0%) | 349 (6.3%) |
| 5:30 AM to 5:59 AM | 963 (14.5%) | 352 (6.4%) |
| 6:00 AM to 6:29 AM | 941 (14.2%) | 109 (2.0%) |
| 6:30 AM to 6:59 AM | 521 (7.9%) | 1,056 (19.0%) |
| 7:00 AM to 7:29 AM | 377 (5.7%) | 1,274 (23.0%) |
| 7:30 AM to 7:59 AM | 490 (7.4%) | 338 (6.1%) |
| 8:00 AM to 8:29 AM | 428 (6.4%) | 376 (6.8%) |
| 8:30 AM to 8:59 AM | 122 (1.8%) | 219 (4.0%) |
| 9:00 AM to 9:59 AM | 481 (7.2%) | 451 (8.1%) |
| 10:00 AM to 10:59 AM | 74 (1.1%) | 170 (3.1%) |
| 11:00 AM to 11:59 AM | 0 (0.0%) | 37 (0.7%) |
| 12:00 PM to 3:59 PM | 271 (4.1%) | 123 (2.2%) |
| 4:00 PM to 11:59 PM | 137 (2.1%) | 239 (4.3%) |
| Total | 6,641 (100.0%) | 5,546 (100.0%) |
Housing Occupancy in Fresno
Occupancy by Ownership in Fresno
Of the total 7,846 dwellings in Fresno, owner-occupied units account for 6,553 (83.5%), while renter-occupied units make up 1,293 (16.5%).
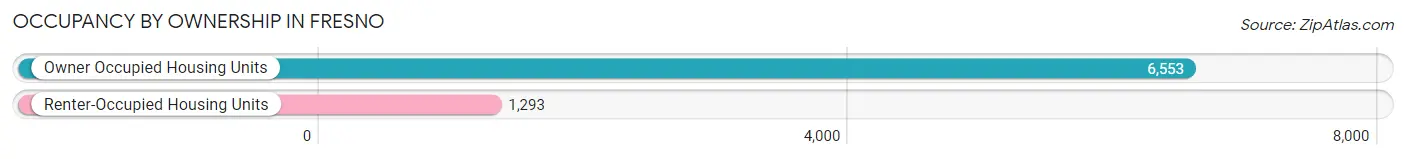
| Occupancy | # Housing Units | % Housing Units |
| Owner Occupied Housing Units | 6,553 | 83.5% |
| Renter-Occupied Housing Units | 1,293 | 16.5% |
| Total Occupied Housing Units | 7,846 | 100.0% |
Occupancy by Household Size in Fresno
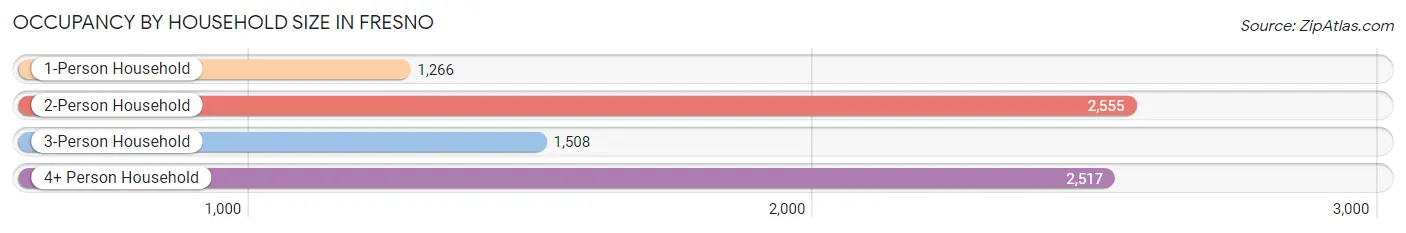
| Household Size | # Housing Units | % Housing Units |
| 1-Person Household | 1,266 | 16.1% |
| 2-Person Household | 2,555 | 32.6% |
| 3-Person Household | 1,508 | 19.2% |
| 4+ Person Household | 2,517 | 32.1% |
| Total Housing Units | 7,846 | 100.0% |
Occupancy by Ownership by Household Size in Fresno
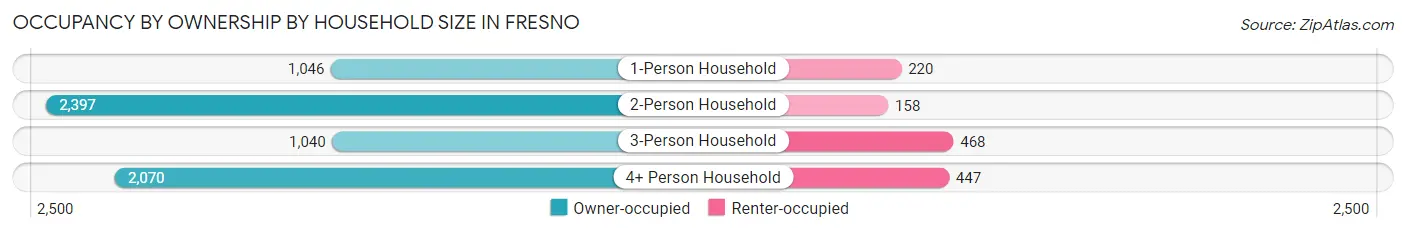
| Household Size | Owner-occupied | Renter-occupied |
| 1-Person Household | 1,046 (82.6%) | 220 (17.4%) |
| 2-Person Household | 2,397 (93.8%) | 158 (6.2%) |
| 3-Person Household | 1,040 (69.0%) | 468 (31.0%) |
| 4+ Person Household | 2,070 (82.2%) | 447 (17.8%) |
| Total Housing Units | 6,553 (83.5%) | 1,293 (16.5%) |
Occupancy by Educational Attainment in Fresno
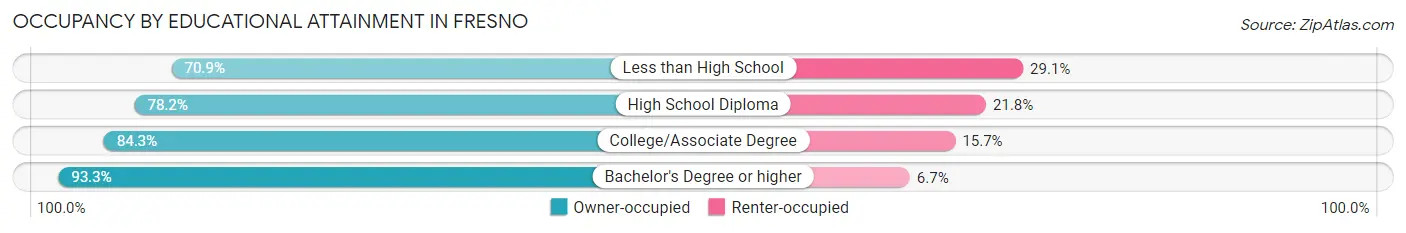
| Household Size | Owner-occupied | Renter-occupied |
| Less than High School | 654 (70.9%) | 269 (29.1%) |
| High School Diploma | 2,056 (78.2%) | 573 (21.8%) |
| College/Associate Degree | 1,528 (84.3%) | 285 (15.7%) |
| Bachelor's Degree or higher | 2,315 (93.3%) | 166 (6.7%) |
Occupancy by Age of Householder in Fresno
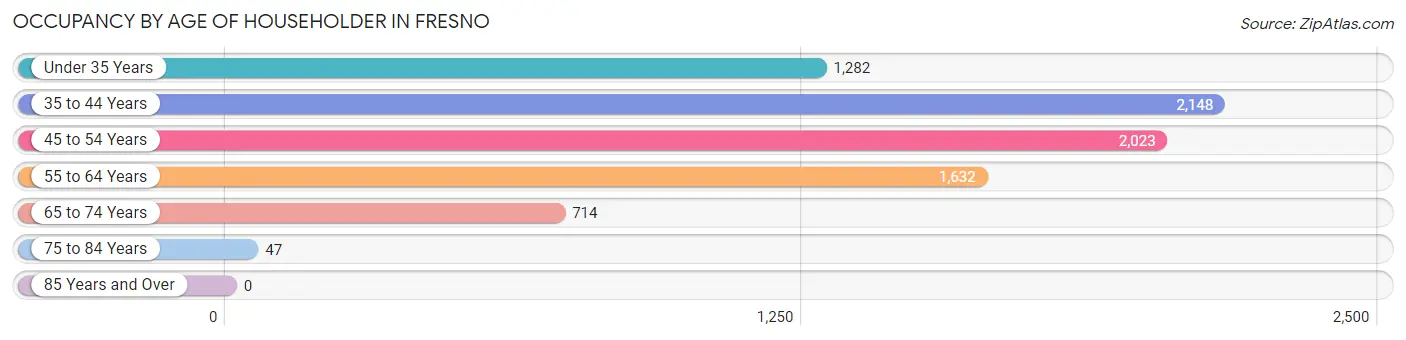
| Age Bracket | # Households | % Households |
| Under 35 Years | 1,282 | 16.3% |
| 35 to 44 Years | 2,148 | 27.4% |
| 45 to 54 Years | 2,023 | 25.8% |
| 55 to 64 Years | 1,632 | 20.8% |
| 65 to 74 Years | 714 | 9.1% |
| 75 to 84 Years | 47 | 0.6% |
| 85 Years and Over | 0 | 0.0% |
| Total | 7,846 | 100.0% |
Housing Finances in Fresno
Median Income by Occupancy in Fresno
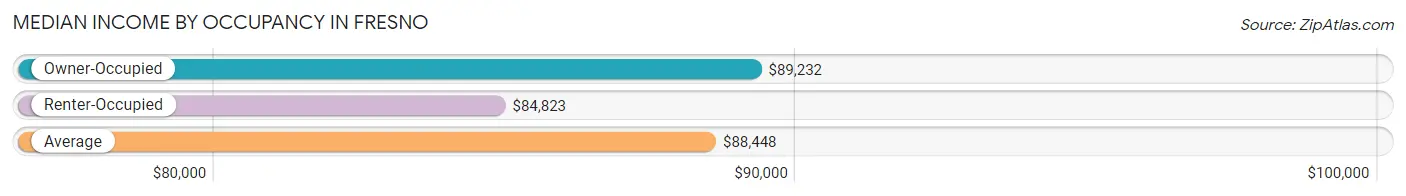
| Occupancy Type | # Households | Median Income |
| Owner-Occupied | 6,553 (83.5%) | $89,232 |
| Renter-Occupied | 1,293 (16.5%) | $84,823 |
| Average | 7,846 (100.0%) | $88,448 |
Occupancy by Householder Income Bracket in Fresno
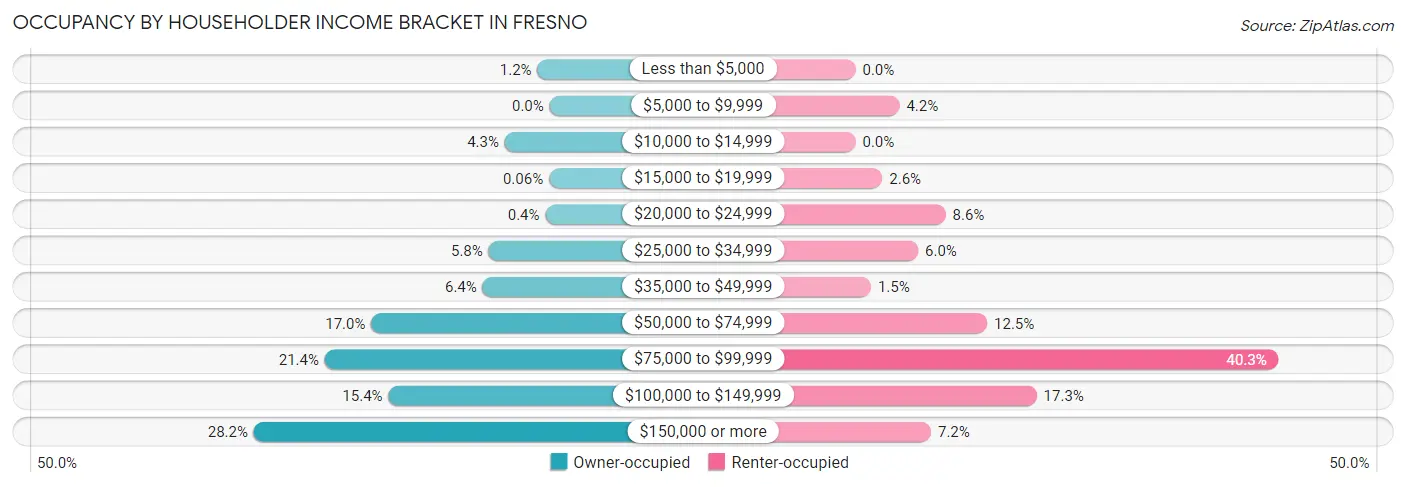
| Income Bracket | Owner-occupied | Renter-occupied |
| Less than $5,000 | 76 (1.2%) | 0 (0.0%) |
| $5,000 to $9,999 | 0 (0.0%) | 54 (4.2%) |
| $10,000 to $14,999 | 280 (4.3%) | 0 (0.0%) |
| $15,000 to $19,999 | 4 (0.1%) | 33 (2.5%) |
| $20,000 to $24,999 | 26 (0.4%) | 111 (8.6%) |
| $25,000 to $34,999 | 381 (5.8%) | 77 (6.0%) |
| $35,000 to $49,999 | 418 (6.4%) | 19 (1.5%) |
| $50,000 to $74,999 | 1,113 (17.0%) | 162 (12.5%) |
| $75,000 to $99,999 | 1,403 (21.4%) | 521 (40.3%) |
| $100,000 to $149,999 | 1,006 (15.3%) | 223 (17.2%) |
| $150,000 or more | 1,846 (28.2%) | 93 (7.2%) |
| Total | 6,553 (100.0%) | 1,293 (100.0%) |
Monthly Housing Cost Tiers in Fresno
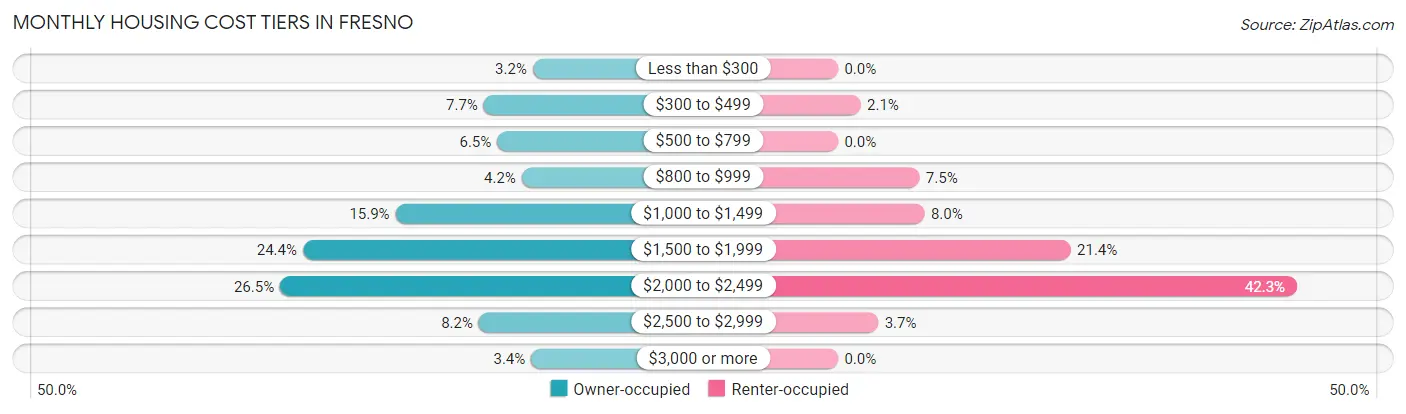
| Monthly Cost | Owner-occupied | Renter-occupied |
| Less than $300 | 211 (3.2%) | 0 (0.0%) |
| $300 to $499 | 507 (7.7%) | 27 (2.1%) |
| $500 to $799 | 426 (6.5%) | 0 (0.0%) |
| $800 to $999 | 278 (4.2%) | 97 (7.5%) |
| $1,000 to $1,499 | 1,039 (15.9%) | 103 (8.0%) |
| $1,500 to $1,999 | 1,598 (24.4%) | 277 (21.4%) |
| $2,000 to $2,499 | 1,736 (26.5%) | 547 (42.3%) |
| $2,500 to $2,999 | 537 (8.2%) | 48 (3.7%) |
| $3,000 or more | 221 (3.4%) | 0 (0.0%) |
| Total | 6,553 (100.0%) | 1,293 (100.0%) |
Physical Housing Characteristics in Fresno
Housing Structures in Fresno
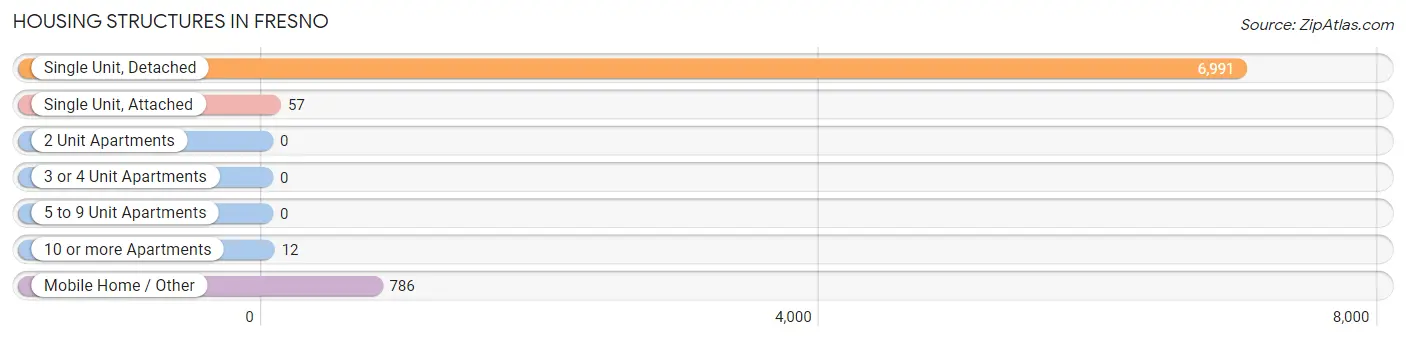
| Structure Type | # Housing Units | % Housing Units |
| Single Unit, Detached | 6,991 | 89.1% |
| Single Unit, Attached | 57 | 0.7% |
| 2 Unit Apartments | 0 | 0.0% |
| 3 or 4 Unit Apartments | 0 | 0.0% |
| 5 to 9 Unit Apartments | 0 | 0.0% |
| 10 or more Apartments | 12 | 0.2% |
| Mobile Home / Other | 786 | 10.0% |
| Total | 7,846 | 100.0% |
Housing Structures by Occupancy in Fresno
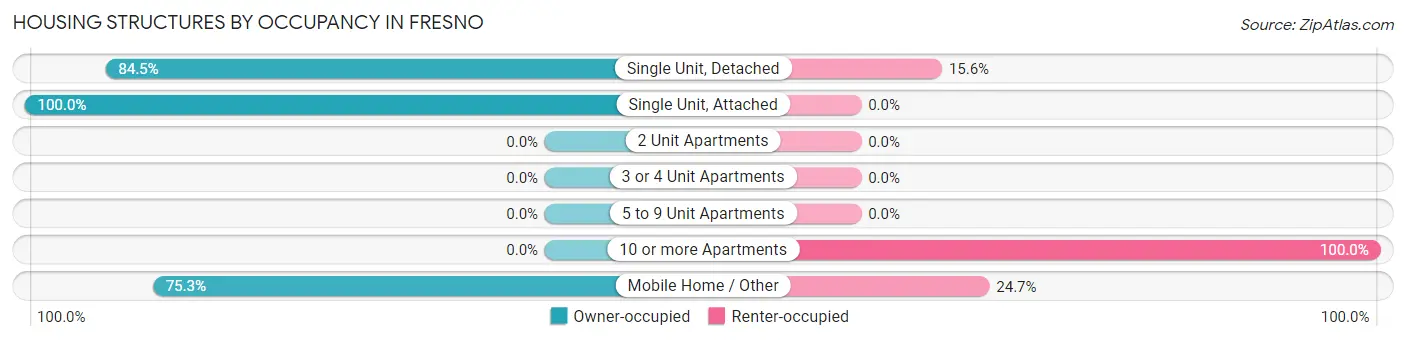
| Structure Type | Owner-occupied | Renter-occupied |
| Single Unit, Detached | 5,904 (84.5%) | 1,087 (15.5%) |
| Single Unit, Attached | 57 (100.0%) | 0 (0.0%) |
| 2 Unit Apartments | 0 (0.0%) | 0 (0.0%) |
| 3 or 4 Unit Apartments | 0 (0.0%) | 0 (0.0%) |
| 5 to 9 Unit Apartments | 0 (0.0%) | 0 (0.0%) |
| 10 or more Apartments | 0 (0.0%) | 12 (100.0%) |
| Mobile Home / Other | 592 (75.3%) | 194 (24.7%) |
| Total | 6,553 (83.5%) | 1,293 (16.5%) |
Housing Structures by Number of Rooms in Fresno
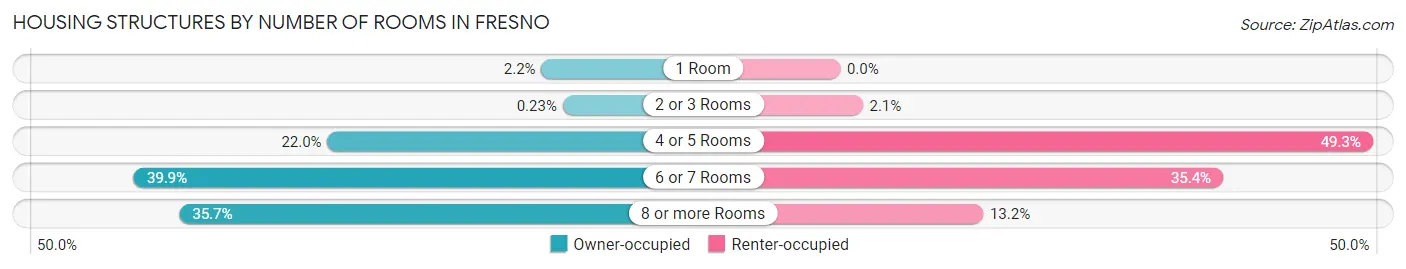
| Number of Rooms | Owner-occupied | Renter-occupied |
| 1 Room | 144 (2.2%) | 0 (0.0%) |
| 2 or 3 Rooms | 15 (0.2%) | 27 (2.1%) |
| 4 or 5 Rooms | 1,441 (22.0%) | 637 (49.3%) |
| 6 or 7 Rooms | 2,614 (39.9%) | 458 (35.4%) |
| 8 or more Rooms | 2,339 (35.7%) | 171 (13.2%) |
| Total | 6,553 (100.0%) | 1,293 (100.0%) |
Housing Structure by Heating Type in Fresno
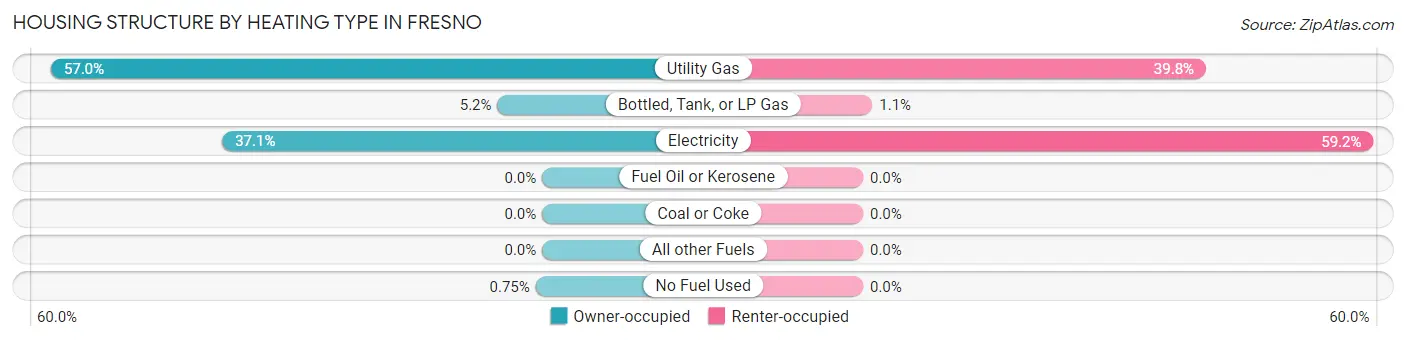
| Heating Type | Owner-occupied | Renter-occupied |
| Utility Gas | 3,732 (57.0%) | 514 (39.8%) |
| Bottled, Tank, or LP Gas | 340 (5.2%) | 14 (1.1%) |
| Electricity | 2,432 (37.1%) | 765 (59.2%) |
| Fuel Oil or Kerosene | 0 (0.0%) | 0 (0.0%) |
| Coal or Coke | 0 (0.0%) | 0 (0.0%) |
| All other Fuels | 0 (0.0%) | 0 (0.0%) |
| No Fuel Used | 49 (0.7%) | 0 (0.0%) |
| Total | 6,553 (100.0%) | 1,293 (100.0%) |
Household Vehicle Usage in Fresno
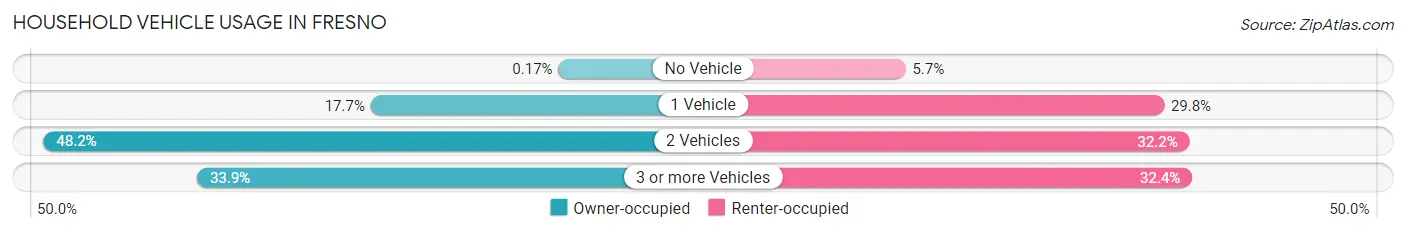
| Vehicles per Household | Owner-occupied | Renter-occupied |
| No Vehicle | 11 (0.2%) | 73 (5.7%) |
| 1 Vehicle | 1,159 (17.7%) | 385 (29.8%) |
| 2 Vehicles | 3,161 (48.2%) | 416 (32.2%) |
| 3 or more Vehicles | 2,222 (33.9%) | 419 (32.4%) |
| Total | 6,553 (100.0%) | 1,293 (100.0%) |
Real Estate & Mortgages in Fresno
Real Estate and Mortgage Overview in Fresno
| Characteristic | Without Mortgage | With Mortgage |
| Housing Units | 1,363 | 5,190 |
| Median Property Value | $193,900 | $231,400 |
| Median Household Income | $78,464 | $1,717 |
| Monthly Housing Costs | $499 | $221 |
| Real Estate Taxes | $2,820 | $423 |
Property Value by Mortgage Status in Fresno
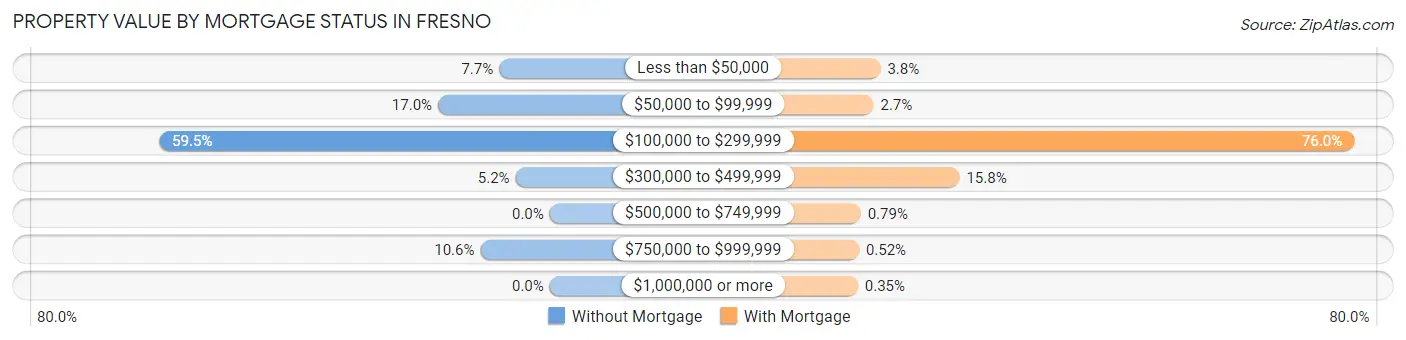
| Property Value | Without Mortgage | With Mortgage |
| Less than $50,000 | 105 (7.7%) | 197 (3.8%) |
| $50,000 to $99,999 | 232 (17.0%) | 142 (2.7%) |
| $100,000 to $299,999 | 811 (59.5%) | 3,943 (76.0%) |
| $300,000 to $499,999 | 71 (5.2%) | 822 (15.8%) |
| $500,000 to $749,999 | 0 (0.0%) | 41 (0.8%) |
| $750,000 to $999,999 | 144 (10.6%) | 27 (0.5%) |
| $1,000,000 or more | 0 (0.0%) | 18 (0.4%) |
| Total | 1,363 (100.0%) | 5,190 (100.0%) |
Household Income by Mortgage Status in Fresno
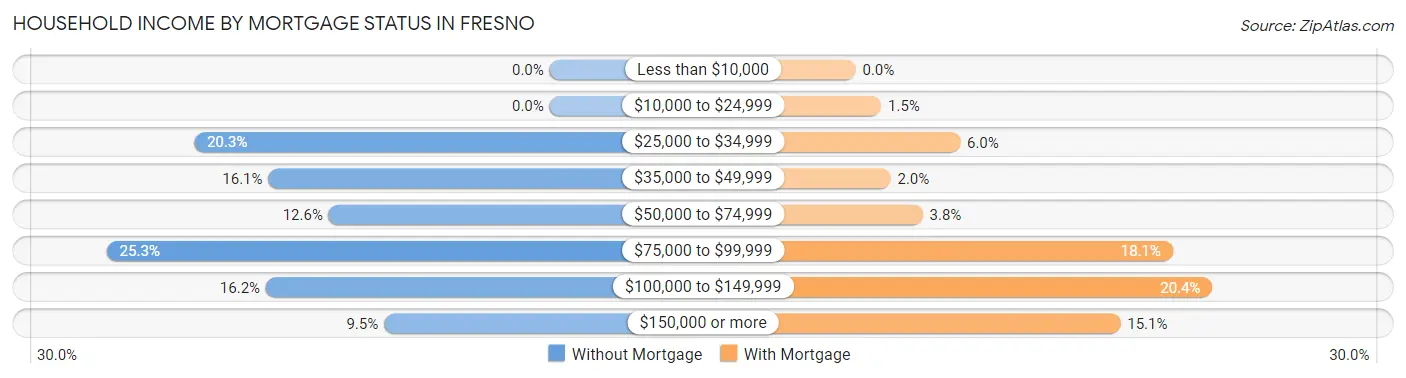
| Household Income | Without Mortgage | With Mortgage |
| Less than $10,000 | 0 (0.0%) | 0 (0.0%) |
| $10,000 to $24,999 | 0 (0.0%) | 76 (1.5%) |
| $25,000 to $34,999 | 277 (20.3%) | 310 (6.0%) |
| $35,000 to $49,999 | 219 (16.1%) | 104 (2.0%) |
| $50,000 to $74,999 | 172 (12.6%) | 199 (3.8%) |
| $75,000 to $99,999 | 345 (25.3%) | 941 (18.1%) |
| $100,000 to $149,999 | 221 (16.2%) | 1,058 (20.4%) |
| $150,000 or more | 129 (9.5%) | 785 (15.1%) |
| Total | 1,363 (100.0%) | 5,190 (100.0%) |
Property Value to Household Income Ratio in Fresno
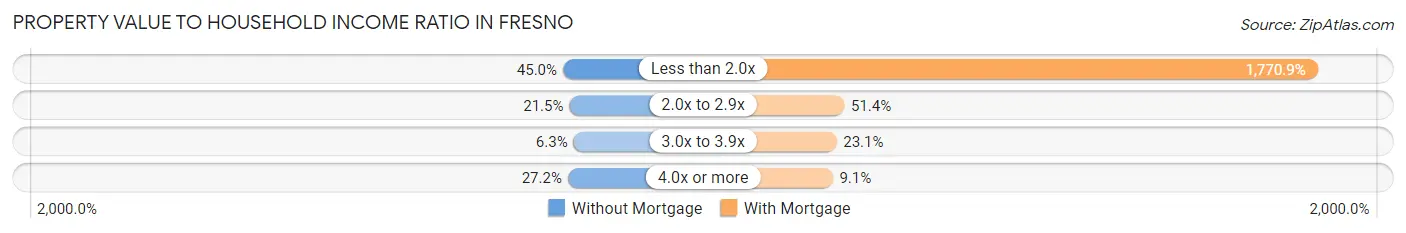
| Value-to-Income Ratio | Without Mortgage | With Mortgage |
| Less than 2.0x | 613 (45.0%) | 91,910 (1,770.9%) |
| 2.0x to 2.9x | 293 (21.5%) | 2,666 (51.4%) |
| 3.0x to 3.9x | 86 (6.3%) | 1,199 (23.1%) |
| 4.0x or more | 371 (27.2%) | 472 (9.1%) |
| Total | 1,363 (100.0%) | 5,190 (100.0%) |
Real Estate Taxes by Mortgage Status in Fresno
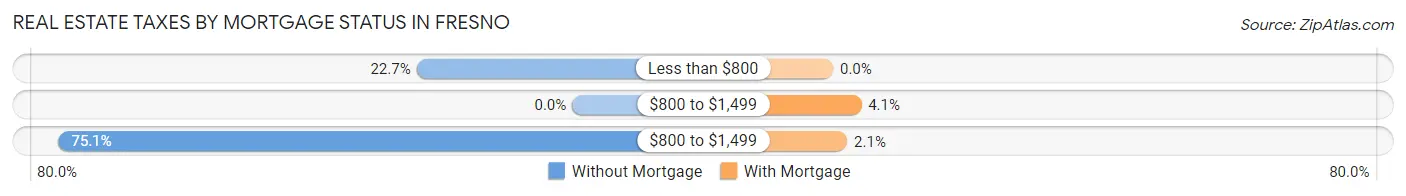
| Property Taxes | Without Mortgage | With Mortgage |
| Less than $800 | 310 (22.7%) | 0 (0.0%) |
| $800 to $1,499 | 0 (0.0%) | 214 (4.1%) |
| $800 to $1,499 | 1,023 (75.1%) | 107 (2.1%) |
| Total | 1,363 (100.0%) | 5,190 (100.0%) |
Health & Disability in Fresno
Health Insurance Coverage by Age in Fresno
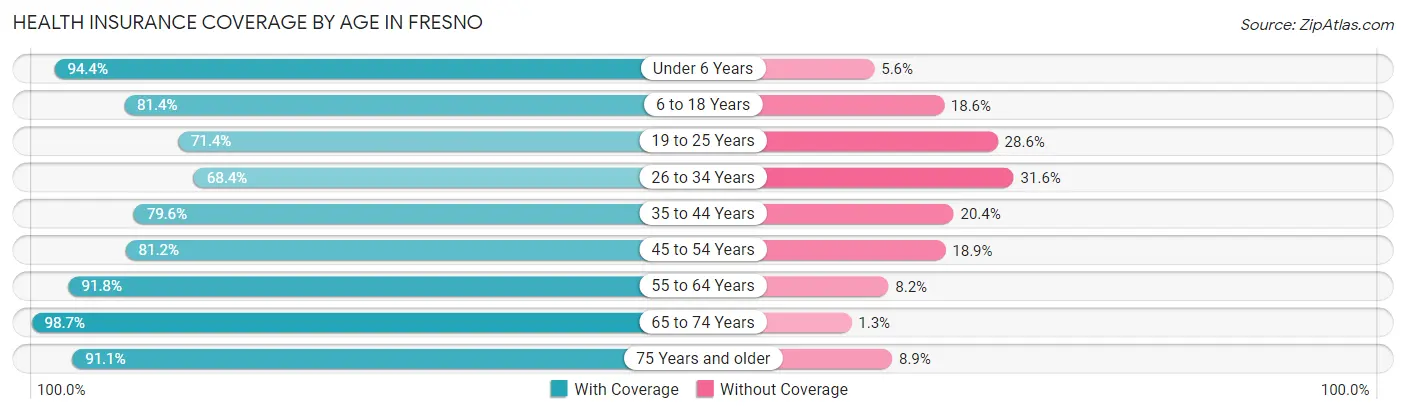
| Age Bracket | With Coverage | Without Coverage |
| Under 6 Years | 1,334 (94.4%) | 79 (5.6%) |
| 6 to 18 Years | 3,552 (81.4%) | 810 (18.6%) |
| 19 to 25 Years | 1,987 (71.4%) | 796 (28.6%) |
| 26 to 34 Years | 1,718 (68.4%) | 793 (31.6%) |
| 35 to 44 Years | 3,523 (79.6%) | 901 (20.4%) |
| 45 to 54 Years | 2,716 (81.1%) | 631 (18.9%) |
| 55 to 64 Years | 2,648 (91.8%) | 237 (8.2%) |
| 65 to 74 Years | 1,436 (98.7%) | 19 (1.3%) |
| 75 Years and older | 348 (91.1%) | 34 (8.9%) |
| Total | 19,262 (81.8%) | 4,300 (18.2%) |
Health Insurance Coverage by Citizenship Status in Fresno
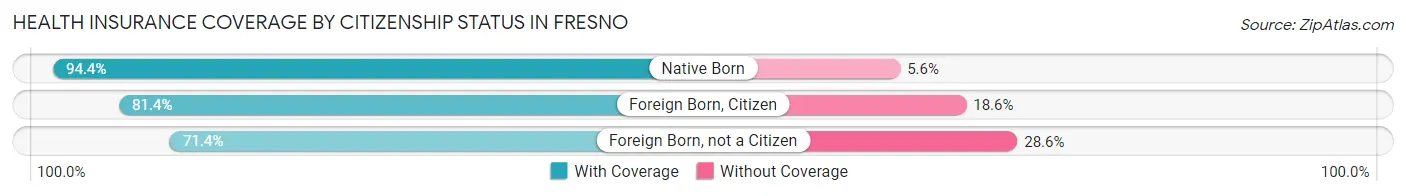
| Citizenship Status | With Coverage | Without Coverage |
| Native Born | 1,334 (94.4%) | 79 (5.6%) |
| Foreign Born, Citizen | 3,552 (81.4%) | 810 (18.6%) |
| Foreign Born, not a Citizen | 1,987 (71.4%) | 796 (28.6%) |
Health Insurance Coverage by Household Income in Fresno
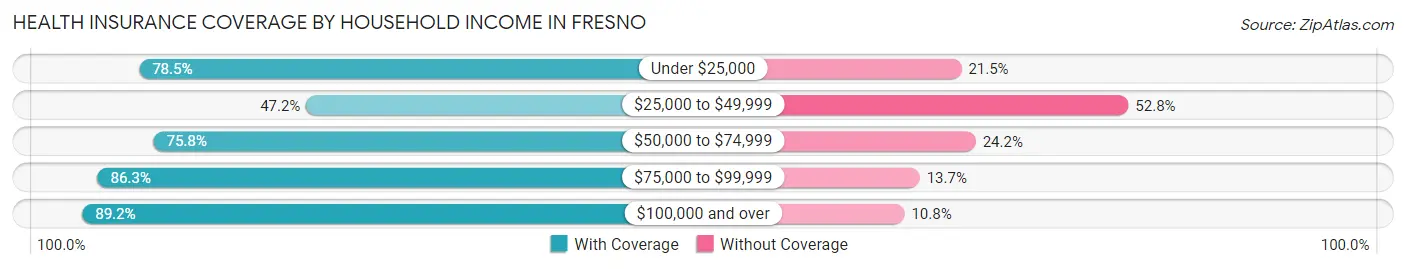
| Household Income | With Coverage | Without Coverage |
| Under $25,000 | 910 (78.5%) | 249 (21.5%) |
| $25,000 to $49,999 | 1,120 (47.2%) | 1,251 (52.8%) |
| $50,000 to $74,999 | 2,696 (75.8%) | 859 (24.2%) |
| $75,000 to $99,999 | 4,831 (86.3%) | 765 (13.7%) |
| $100,000 and over | 9,677 (89.2%) | 1,173 (10.8%) |
Public vs Private Health Insurance Coverage by Age in Fresno
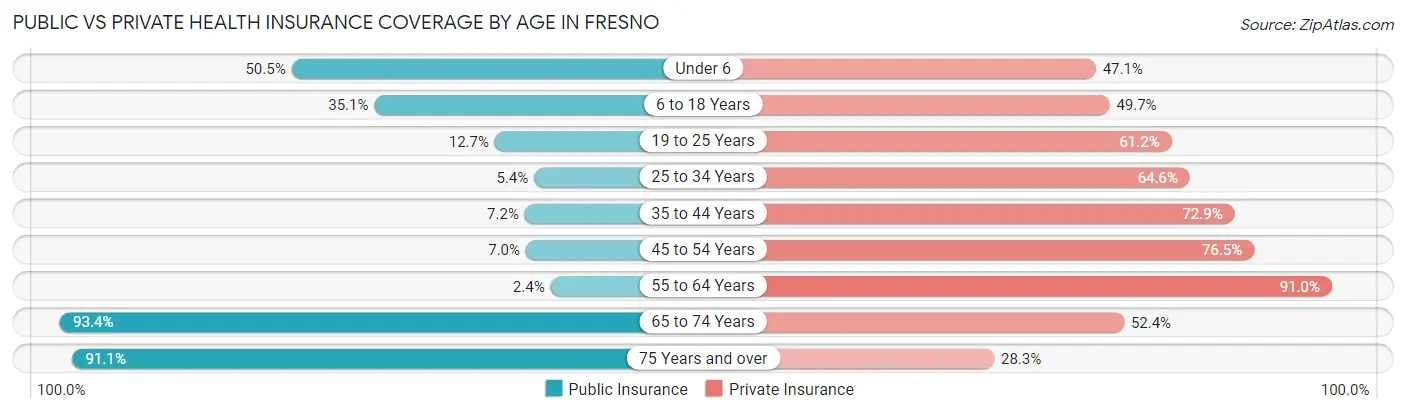
| Age Bracket | Public Insurance | Private Insurance |
| Under 6 | 713 (50.5%) | 666 (47.1%) |
| 6 to 18 Years | 1,531 (35.1%) | 2,167 (49.7%) |
| 19 to 25 Years | 354 (12.7%) | 1,703 (61.2%) |
| 25 to 34 Years | 136 (5.4%) | 1,622 (64.6%) |
| 35 to 44 Years | 317 (7.2%) | 3,224 (72.9%) |
| 45 to 54 Years | 233 (7.0%) | 2,561 (76.5%) |
| 55 to 64 Years | 69 (2.4%) | 2,624 (90.9%) |
| 65 to 74 Years | 1,359 (93.4%) | 762 (52.4%) |
| 75 Years and over | 348 (91.1%) | 108 (28.3%) |
| Total | 5,060 (21.5%) | 15,437 (65.5%) |
Disability Status by Sex by Age in Fresno
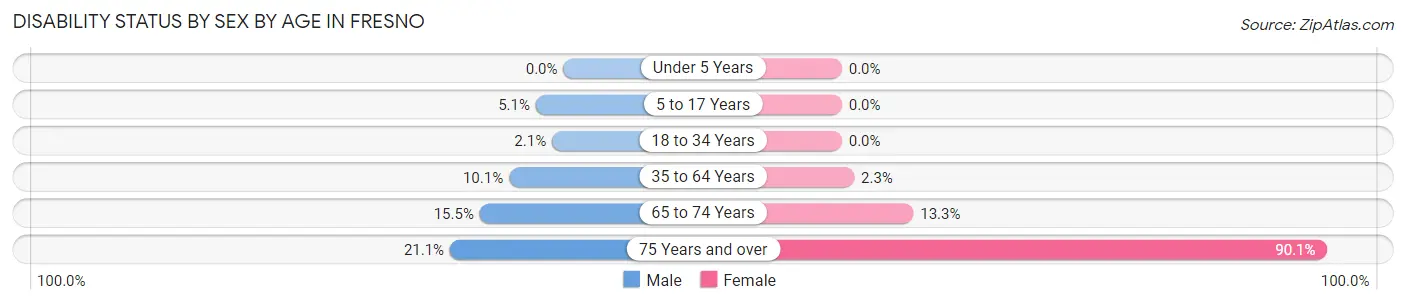
| Age Bracket | Male | Female |
| Under 5 Years | 0 (0.0%) | 0 (0.0%) |
| 5 to 17 Years | 101 (5.1%) | 0 (0.0%) |
| 18 to 34 Years | 67 (2.1%) | 0 (0.0%) |
| 35 to 64 Years | 512 (10.1%) | 128 (2.3%) |
| 65 to 74 Years | 117 (15.5%) | 93 (13.3%) |
| 75 Years and over | 8 (21.0%) | 310 (90.1%) |
Disability Class by Sex by Age in Fresno
Disability Class: Hearing Difficulty
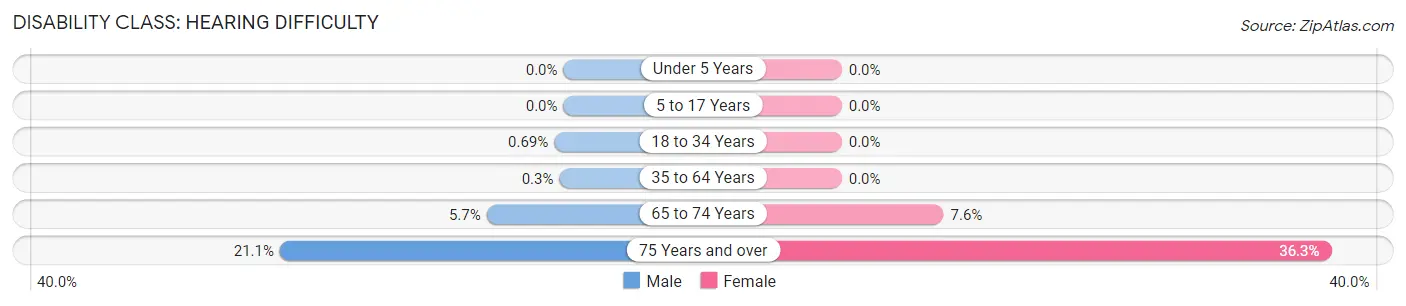
| Age Bracket | Male | Female |
| Under 5 Years | 0 (0.0%) | 0 (0.0%) |
| 5 to 17 Years | 0 (0.0%) | 0 (0.0%) |
| 18 to 34 Years | 22 (0.7%) | 0 (0.0%) |
| 35 to 64 Years | 15 (0.3%) | 0 (0.0%) |
| 65 to 74 Years | 43 (5.7%) | 53 (7.6%) |
| 75 Years and over | 8 (21.0%) | 125 (36.3%) |
Disability Class: Vision Difficulty
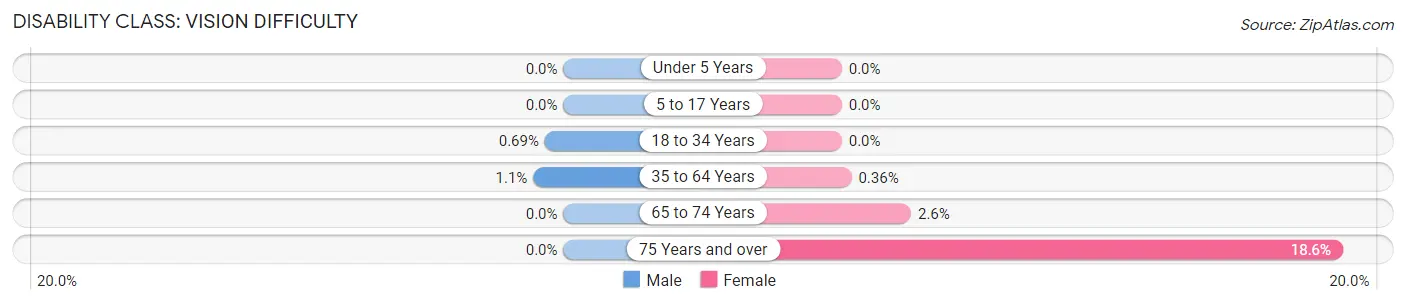
| Age Bracket | Male | Female |
| Under 5 Years | 0 (0.0%) | 0 (0.0%) |
| 5 to 17 Years | 0 (0.0%) | 0 (0.0%) |
| 18 to 34 Years | 22 (0.7%) | 0 (0.0%) |
| 35 to 64 Years | 57 (1.1%) | 20 (0.4%) |
| 65 to 74 Years | 0 (0.0%) | 18 (2.6%) |
| 75 Years and over | 0 (0.0%) | 64 (18.6%) |
Disability Class: Cognitive Difficulty
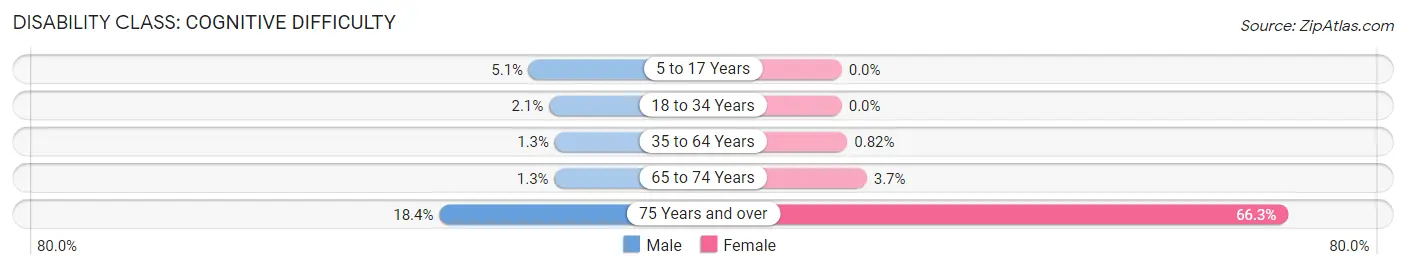
| Age Bracket | Male | Female |
| 5 to 17 Years | 101 (5.1%) | 0 (0.0%) |
| 18 to 34 Years | 67 (2.1%) | 0 (0.0%) |
| 35 to 64 Years | 64 (1.3%) | 46 (0.8%) |
| 65 to 74 Years | 10 (1.3%) | 26 (3.7%) |
| 75 Years and over | 7 (18.4%) | 228 (66.3%) |
Disability Class: Ambulatory Difficulty
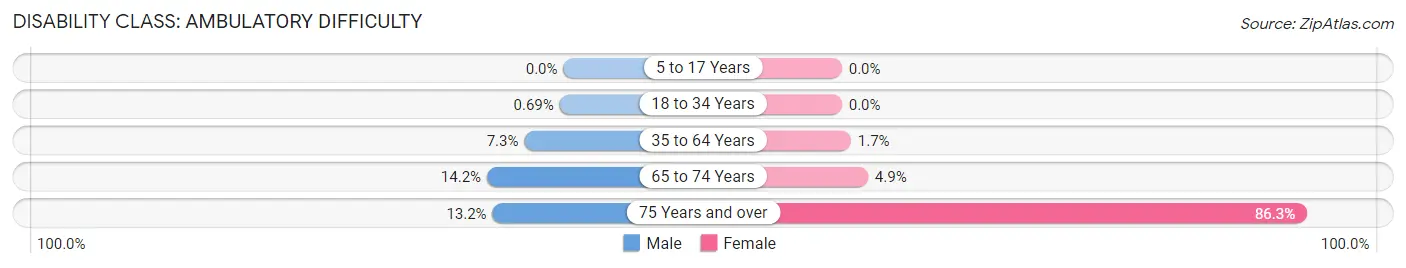
| Age Bracket | Male | Female |
| 5 to 17 Years | 0 (0.0%) | 0 (0.0%) |
| 18 to 34 Years | 22 (0.7%) | 0 (0.0%) |
| 35 to 64 Years | 368 (7.2%) | 94 (1.7%) |
| 65 to 74 Years | 107 (14.2%) | 34 (4.9%) |
| 75 Years and over | 5 (13.2%) | 297 (86.3%) |
Disability Class: Self-Care Difficulty
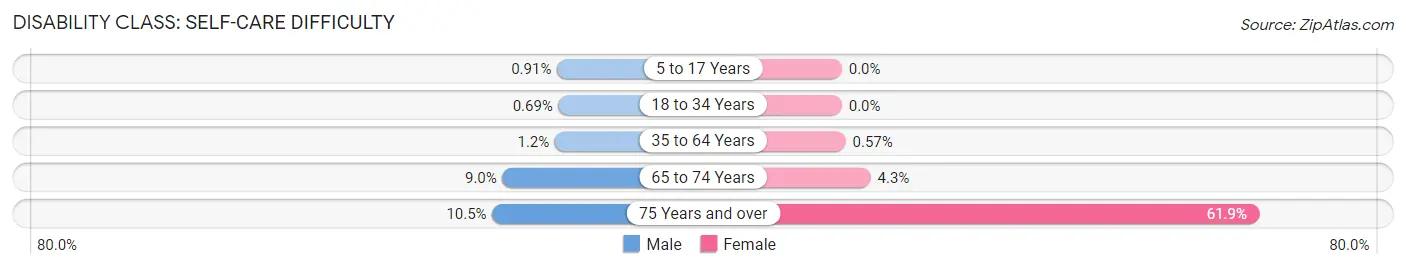
| Age Bracket | Male | Female |
| 5 to 17 Years | 18 (0.9%) | 0 (0.0%) |
| 18 to 34 Years | 22 (0.7%) | 0 (0.0%) |
| 35 to 64 Years | 62 (1.2%) | 32 (0.6%) |
| 65 to 74 Years | 68 (9.0%) | 30 (4.3%) |
| 75 Years and over | 4 (10.5%) | 213 (61.9%) |
Technology Access in Fresno
Computing Device Access in Fresno
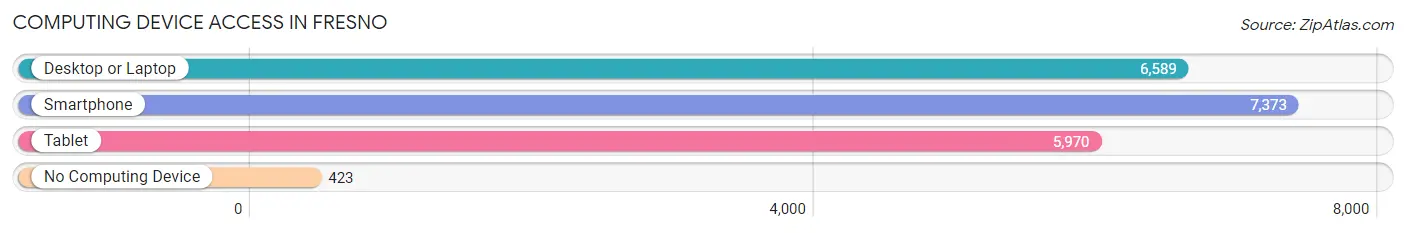
| Device Type | # Households | % Households |
| Desktop or Laptop | 6,589 | 84.0% |
| Smartphone | 7,373 | 94.0% |
| Tablet | 5,970 | 76.1% |
| No Computing Device | 423 | 5.4% |
| Total | 7,846 | 100.0% |
Internet Access in Fresno
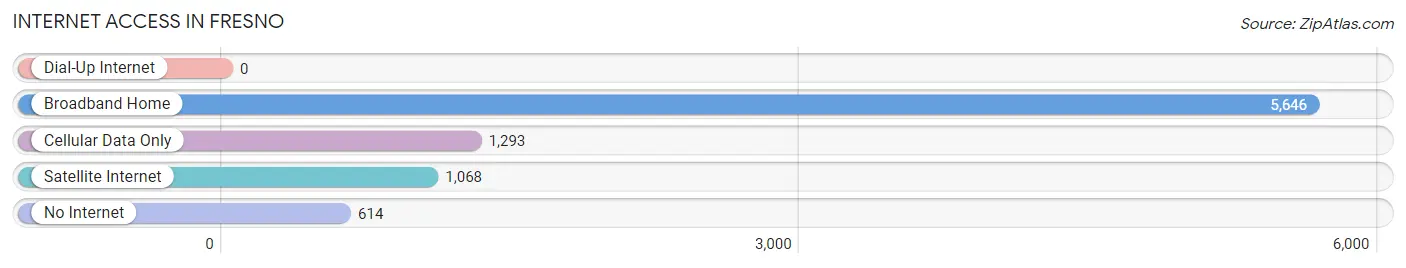
| Internet Type | # Households | % Households |
| Dial-Up Internet | 0 | 0.0% |
| Broadband Home | 5,646 | 72.0% |
| Cellular Data Only | 1,293 | 16.5% |
| Satellite Internet | 1,068 | 13.6% |
| No Internet | 614 | 7.8% |
| Total | 7,846 | 100.0% |
Fresno Summary
Fresno, Texas is a small city located in the southeastern part of Fort Bend County, Texas. It is part of the Houston–The Woodlands–Sugar Land metropolitan area. The city has a population of approximately 8,000 people and is located about 25 miles southwest of downtown Houston.
History
Fresno was founded in 1883 by a group of German immigrants who had settled in the area. The city was named after Fresno, California, which was named after the Spanish word for ash tree. The city was incorporated in 1956 and has since grown to become a thriving community.
Geography
Fresno is located in the southeastern part of Fort Bend County, Texas. It is part of the Houston–The Woodlands–Sugar Land metropolitan area. The city is situated on the Brazos River and is surrounded by prairies and woodlands. The climate is humid subtropical, with hot summers and mild winters.
Economy
Fresno’s economy is largely based on agriculture and oil and gas production. The city is home to several large oil and gas companies, including Chevron, ExxonMobil, and Shell. Agriculture is also an important part of the local economy, with the city being home to several large farms and ranches.
Demographics
As of the 2010 census, the population of Fresno was 8,000. The racial makeup of the city was 75.3% White, 11.2% African American, 0.7% Native American, 0.7% Asian, 0.1% Pacific Islander, 10.2% from other races, and 2.0% from two or more races. Hispanic or Latino of any race were 24.3% of the population.
The median income for a household in the city was $45,000, and the median income for a family was $50,000. The per capita income for the city was $20,000. About 15.3% of families and 18.2% of the population were below the poverty line, including 25.2% of those under age 18 and 11.2% of those age 65 or over.
Conclusion
Fresno, Texas is a small city located in the southeastern part of Fort Bend County, Texas. It is part of the Houston–The Woodlands–Sugar Land metropolitan area and has a population of approximately 8,000 people. The city was founded in 1883 by a group of German immigrants and has since grown to become a thriving community. The economy of Fresno is largely based on agriculture and oil and gas production. The city has a diverse population, with the majority of residents being White, African American, and Hispanic or Latino. The median income for a household in the city is $45,000, and the median income for a family is $50,000.
Common Questions
What is Per Capita Income in Fresno?
Per Capita income in Fresno is $36,231.
What is the Median Family Income in Fresno?
Median Family Income in Fresno is $88,489.
What is the Median Household income in Fresno?
Median Household Income in Fresno is $88,448.
What is Income or Wage Gap in Fresno?
Income or Wage Gap in Fresno is 20.2%.
Women in Fresno earn 79.8 cents for every dollar earned by a man.
What is Inequality or Gini Index in Fresno?
Inequality or Gini Index in Fresno is 0.34.
What is the Total Population of Fresno?
Total Population of Fresno is 23,608.
What is the Total Male Population of Fresno?
Total Male Population of Fresno is 11,602.
What is the Total Female Population of Fresno?
Total Female Population of Fresno is 12,006.
What is the Ratio of Males per 100 Females in Fresno?
There are 96.64 Males per 100 Females in Fresno.
What is the Ratio of Females per 100 Males in Fresno?
There are 103.48 Females per 100 Males in Fresno.
What is the Median Population Age in Fresno?
Median Population Age in Fresno is 37.1 Years.
What is the Average Family Size in Fresno
Average Family Size in Fresno is 3.3 People.
What is the Average Household Size in Fresno
Average Household Size in Fresno is 3.0 People.
How Large is the Labor Force in Fresno?
There are 14,220 People in the Labor Forcein in Fresno.
What is the Percentage of People in the Labor Force in Fresno?
75.1% of People are in the Labor Force in Fresno.
What is the Unemployment Rate in Fresno?
Unemployment Rate in Fresno is 4.6%.