Clermont, FL Map & Demographics
Clermont Map
Clermont Overview
$35,217
PER CAPITA INCOME
$92,716
AVG FAMILY INCOME
$75,951
AVG HOUSEHOLD INCOME
25.0%
WAGE / INCOME GAP [ % ]
75.0¢/ $1
WAGE / INCOME GAP [ $ ]
$15,355
FAMILY INCOME DEFICIT
0.39
INEQUALITY / GINI INDEX
43,266
TOTAL POPULATION
20,270
MALE POPULATION
22,996
FEMALE POPULATION
88.15
MALES / 100 FEMALES
113.45
FEMALES / 100 MALES
41.7
MEDIAN AGE
3.2
AVG FAMILY SIZE
2.7
AVG HOUSEHOLD SIZE
18,425
LABOR FORCE [ PEOPLE ]
52.9%
PERCENT IN LABOR FORCE
5.0%
UNEMPLOYMENT RATE
Clermont Area Codes
Income in Clermont
Income Overview in Clermont
Per Capita Income in Clermont is $35,217, while median incomes of families and households are $92,716 and $75,951 respectively.
| Characteristic | Number | Measure |
| Per Capita Income | 43,266 | $35,217 |
| Median Family Income | 11,179 | $92,716 |
| Mean Family Income | 11,179 | $104,410 |
| Median Household Income | 15,853 | $75,951 |
| Mean Household Income | 15,853 | $92,141 |
| Income Deficit | 11,179 | $15,355 |
| Wage / Income Gap (%) | 43,266 | 24.99% |
| Wage / Income Gap ($) | 43,266 | 75.01¢ per $1 |
| Gini / Inequality Index | 43,266 | 0.39 |
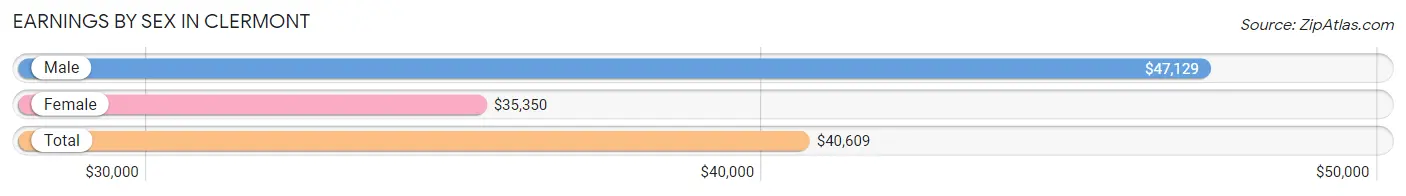
Earnings by Sex in Clermont
Average Earnings in Clermont are $40,609, $47,129 for men and $35,350 for women, a difference of 25.0%.
| Sex | Number | Average Earnings |
| Male | 10,078 (52.9%) | $47,129 |
| Female | 8,958 (47.1%) | $35,350 |
| Total | 19,036 (100.0%) | $40,609 |
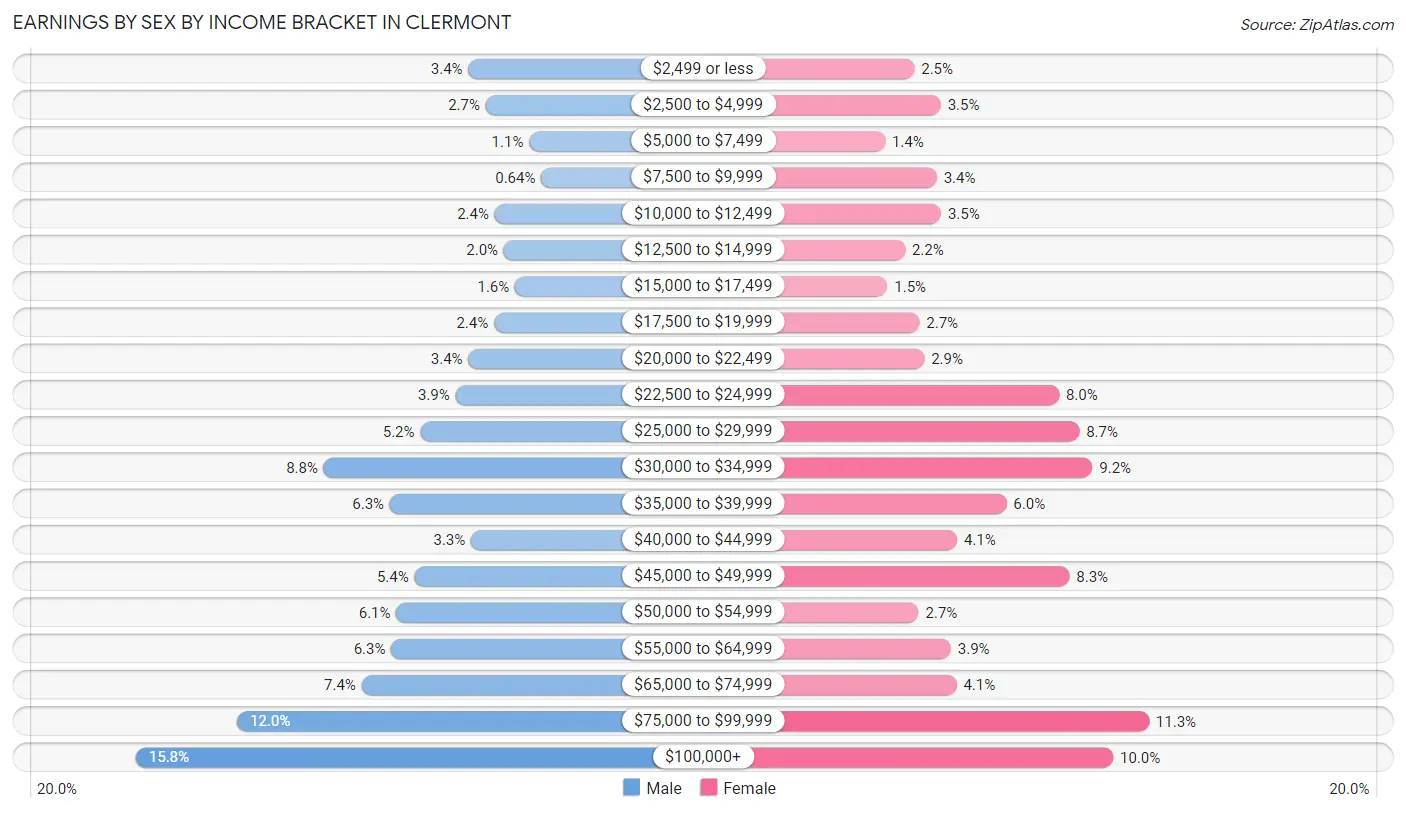
Earnings by Sex by Income Bracket in Clermont
The most common earnings brackets in Clermont are $100,000+ for men (1,595 | 15.8%) and $75,000 to $99,999 for women (1,014 | 11.3%).
| Income | Male | Female |
| $2,499 or less | 340 (3.4%) | 227 (2.5%) |
| $2,500 to $4,999 | 274 (2.7%) | 315 (3.5%) |
| $5,000 to $7,499 | 110 (1.1%) | 128 (1.4%) |
| $7,500 to $9,999 | 64 (0.6%) | 302 (3.4%) |
| $10,000 to $12,499 | 240 (2.4%) | 316 (3.5%) |
| $12,500 to $14,999 | 206 (2.0%) | 195 (2.2%) |
| $15,000 to $17,499 | 163 (1.6%) | 136 (1.5%) |
| $17,500 to $19,999 | 243 (2.4%) | 244 (2.7%) |
| $20,000 to $22,499 | 340 (3.4%) | 260 (2.9%) |
| $22,500 to $24,999 | 388 (3.8%) | 712 (8.0%) |
| $25,000 to $29,999 | 521 (5.2%) | 780 (8.7%) |
| $30,000 to $34,999 | 886 (8.8%) | 824 (9.2%) |
| $35,000 to $39,999 | 636 (6.3%) | 536 (6.0%) |
| $40,000 to $44,999 | 330 (3.3%) | 370 (4.1%) |
| $45,000 to $49,999 | 543 (5.4%) | 747 (8.3%) |
| $50,000 to $54,999 | 612 (6.1%) | 241 (2.7%) |
| $55,000 to $64,999 | 631 (6.3%) | 349 (3.9%) |
| $65,000 to $74,999 | 743 (7.4%) | 368 (4.1%) |
| $75,000 to $99,999 | 1,213 (12.0%) | 1,014 (11.3%) |
| $100,000+ | 1,595 (15.8%) | 894 (10.0%) |
| Total | 10,078 (100.0%) | 8,958 (100.0%) |
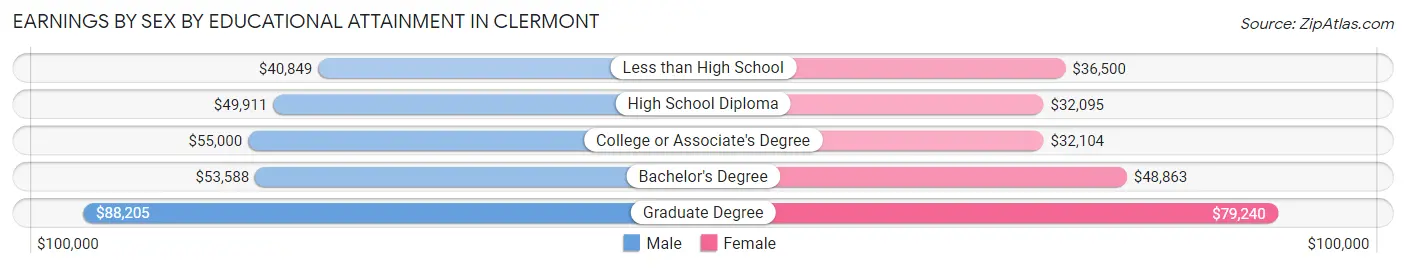
Earnings by Sex by Educational Attainment in Clermont
Average earnings in Clermont are $53,367 for men and $41,418 for women, a difference of 22.4%. Men with an educational attainment of graduate degree enjoy the highest average annual earnings of $88,205, while those with less than high school education earn the least with $40,849. Women with an educational attainment of graduate degree earn the most with the average annual earnings of $79,240, while those with high school diploma education have the smallest earnings of $32,095.
| Educational Attainment | Male Income | Female Income |
| Less than High School | $40,849 | $36,500 |
| High School Diploma | $49,911 | $32,095 |
| College or Associate's Degree | $55,000 | $32,104 |
| Bachelor's Degree | $53,588 | $48,863 |
| Graduate Degree | $88,205 | $79,240 |
| Total | $53,367 | $41,418 |
Family Income in Clermont
Family Income Brackets in Clermont
According to the Clermont family income data, there are 2,169 families falling into the $100,000 to $149,999 income range, which is the most common income bracket and makes up 19.4% of all families. Conversely, the $10,000 to $14,999 income bracket is the least frequent group with only 101 families (0.9%) belonging to this category.
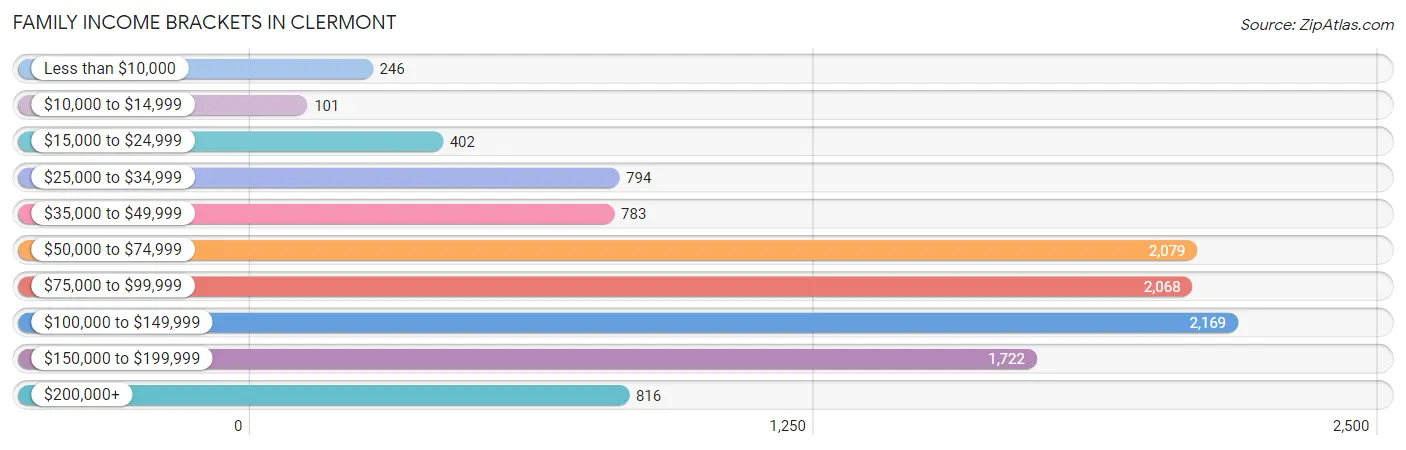
| Income Bracket | # Families | % Families |
| Less than $10,000 | 246 | 2.2% |
| $10,000 to $14,999 | 101 | 0.9% |
| $15,000 to $24,999 | 402 | 3.6% |
| $25,000 to $34,999 | 794 | 7.1% |
| $35,000 to $49,999 | 783 | 7.0% |
| $50,000 to $74,999 | 2,079 | 18.6% |
| $75,000 to $99,999 | 2,068 | 18.5% |
| $100,000 to $149,999 | 2,169 | 19.4% |
| $150,000 to $199,999 | 1,722 | 15.4% |
| $200,000+ | 816 | 7.3% |
Family Income by Famaliy Size in Clermont
7+ person families (203 | 1.8%) account for the highest median family income in Clermont with $193,250 per family, while 2-person families (5,318 | 47.6%) have the highest median income of $43,572 per family member.
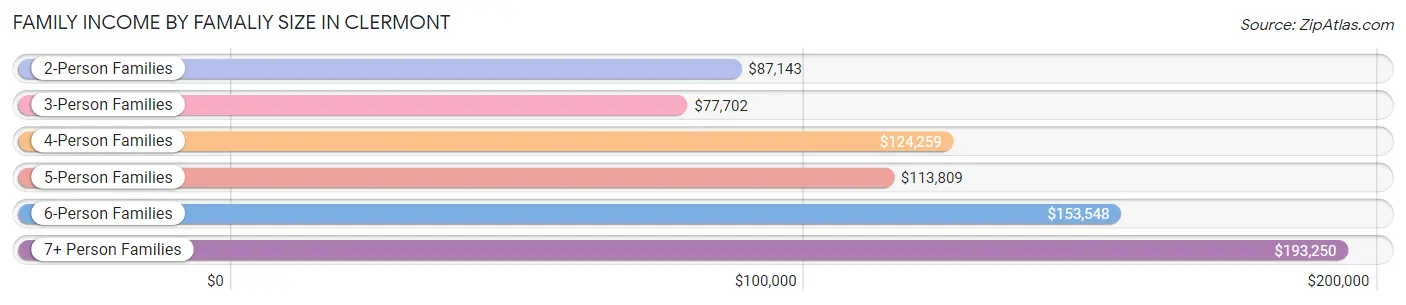
| Income Bracket | # Families | Median Income |
| 2-Person Families | 5,318 (47.6%) | $87,143 |
| 3-Person Families | 2,345 (21.0%) | $77,702 |
| 4-Person Families | 1,936 (17.3%) | $124,259 |
| 5-Person Families | 1,019 (9.1%) | $113,809 |
| 6-Person Families | 358 (3.2%) | $153,548 |
| 7+ Person Families | 203 (1.8%) | $193,250 |
| Total | 11,179 (100.0%) | $92,716 |
Family Income by Number of Earners in Clermont
The median family income in Clermont is $92,716, with families comprising 3+ earners (1,148) having the highest median family income of $154,583, while families with no earners (2,890) have the lowest median family income of $58,934, accounting for 10.3% and 25.9% of families, respectively.
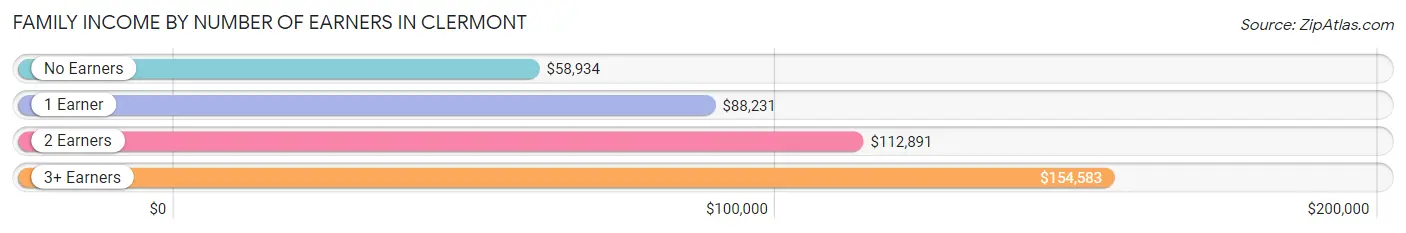
| Number of Earners | # Families | Median Income |
| No Earners | 2,890 (25.9%) | $58,934 |
| 1 Earner | 3,090 (27.6%) | $88,231 |
| 2 Earners | 4,051 (36.2%) | $112,891 |
| 3+ Earners | 1,148 (10.3%) | $154,583 |
| Total | 11,179 (100.0%) | $92,716 |
Household Income in Clermont
Household Income Brackets in Clermont
With 3,107 households falling in the category, the $50,000 to $74,999 income range is the most frequent in Clermont, accounting for 19.6% of all households. In contrast, only 127 households (0.8%) fall into the $10,000 to $14,999 income bracket, making it the least populous group.
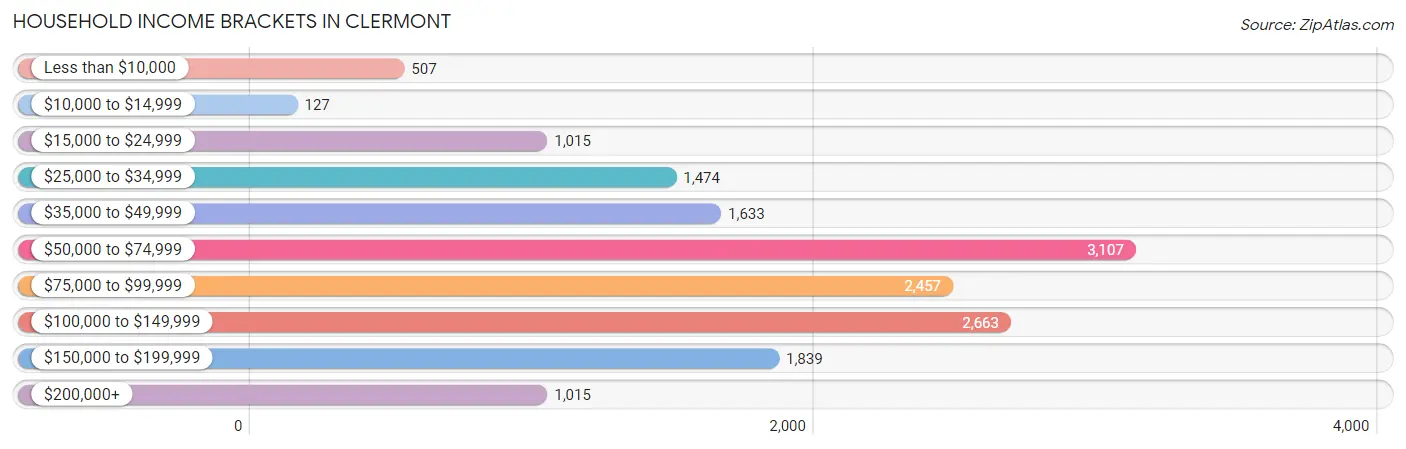
| Income Bracket | # Households | % Households |
| Less than $10,000 | 507 | 3.2% |
| $10,000 to $14,999 | 127 | 0.8% |
| $15,000 to $24,999 | 1,015 | 6.4% |
| $25,000 to $34,999 | 1,474 | 9.3% |
| $35,000 to $49,999 | 1,633 | 10.3% |
| $50,000 to $74,999 | 3,107 | 19.6% |
| $75,000 to $99,999 | 2,457 | 15.5% |
| $100,000 to $149,999 | 2,663 | 16.8% |
| $150,000 to $199,999 | 1,839 | 11.6% |
| $200,000+ | 1,015 | 6.4% |
Household Income by Householder Age in Clermont
The median household income in Clermont is $75,951, with the highest median household income of $97,066 found in the 45 to 64 years age bracket for the primary householder. A total of 4,833 households (30.5%) fall into this category. Meanwhile, the 15 to 24 years age bracket for the primary householder has the lowest median household income of $36,720, with 344 households (2.2%) in this group.
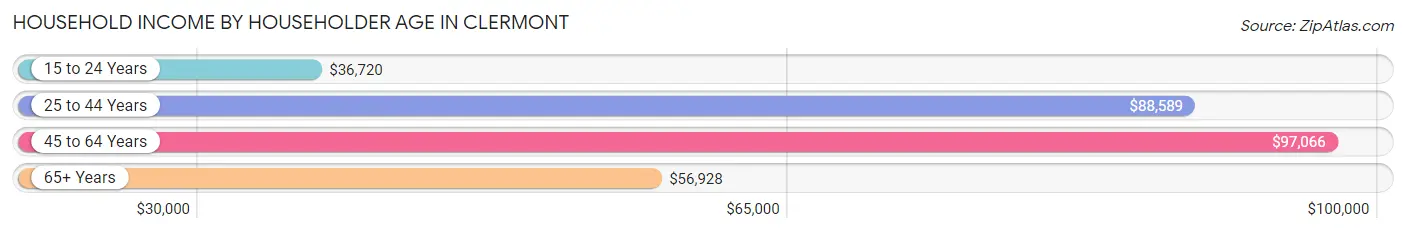
| Income Bracket | # Households | Median Income |
| 15 to 24 Years | 344 (2.2%) | $36,720 |
| 25 to 44 Years | 4,677 (29.5%) | $88,589 |
| 45 to 64 Years | 4,833 (30.5%) | $97,066 |
| 65+ Years | 5,999 (37.8%) | $56,928 |
| Total | 15,853 (100.0%) | $75,951 |
Poverty in Clermont
Income Below Poverty by Sex and Age in Clermont
With 5.1% poverty level for males and 8.0% for females among the residents of Clermont, 12 to 14 year old males and 5 year old females are the most vulnerable to poverty, with 139 males (14.1%) and 115 females (37.7%) in their respective age groups living below the poverty level.
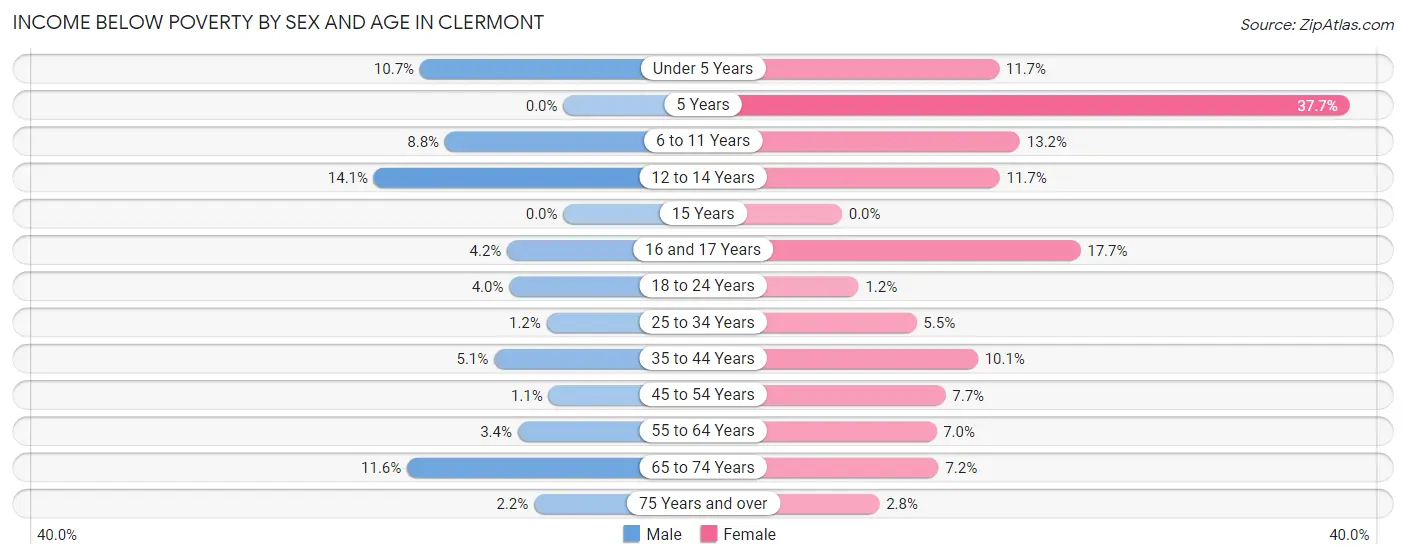
| Age Bracket | Male | Female |
| Under 5 Years | 69 (10.6%) | 109 (11.7%) |
| 5 Years | 0 (0.0%) | 115 (37.7%) |
| 6 to 11 Years | 144 (8.8%) | 244 (13.2%) |
| 12 to 14 Years | 139 (14.1%) | 136 (11.7%) |
| 15 Years | 0 (0.0%) | 0 (0.0%) |
| 16 and 17 Years | 22 (4.2%) | 88 (17.7%) |
| 18 to 24 Years | 78 (4.0%) | 21 (1.2%) |
| 25 to 34 Years | 27 (1.2%) | 140 (5.5%) |
| 35 to 44 Years | 127 (5.1%) | 298 (10.1%) |
| 45 to 54 Years | 27 (1.1%) | 158 (7.7%) |
| 55 to 64 Years | 79 (3.4%) | 178 (7.0%) |
| 65 to 74 Years | 260 (11.6%) | 263 (7.2%) |
| 75 Years and over | 46 (2.2%) | 65 (2.8%) |
| Total | 1,018 (5.1%) | 1,815 (8.0%) |
Income Above Poverty by Sex and Age in Clermont
According to the poverty statistics in Clermont, males aged 5 years and females aged 15 years are the age groups that are most secure financially, with 100.0% of males and 100.0% of females in these age groups living above the poverty line.
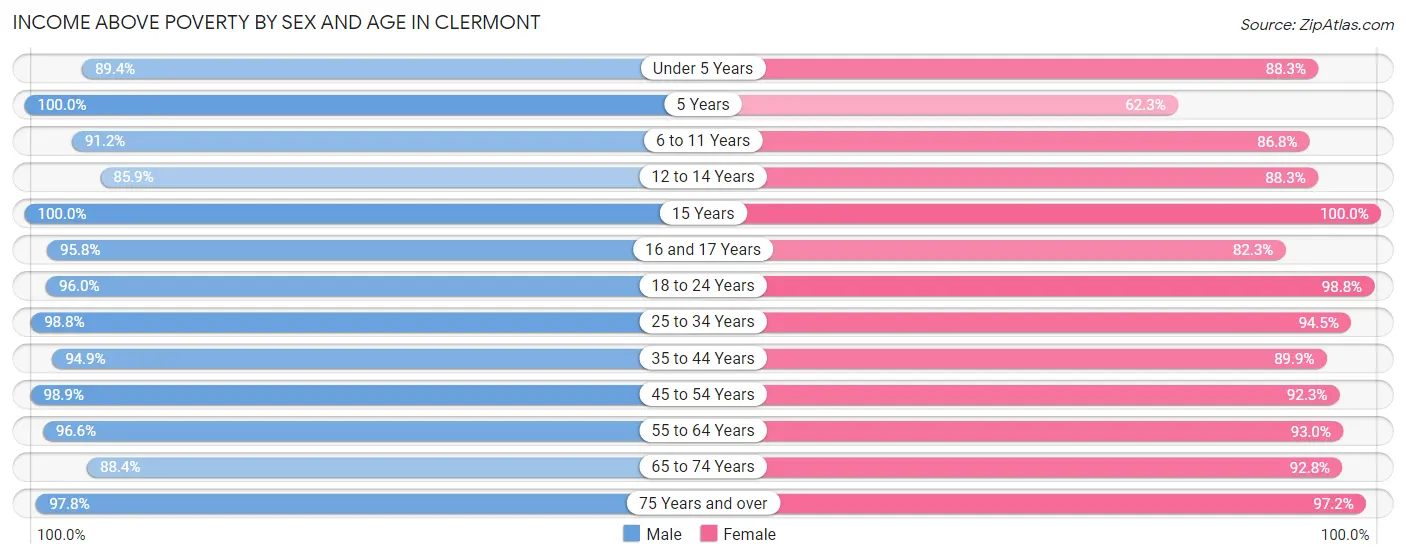
| Age Bracket | Male | Female |
| Under 5 Years | 579 (89.3%) | 826 (88.3%) |
| 5 Years | 136 (100.0%) | 190 (62.3%) |
| 6 to 11 Years | 1,495 (91.2%) | 1,601 (86.8%) |
| 12 to 14 Years | 849 (85.9%) | 1,025 (88.3%) |
| 15 Years | 211 (100.0%) | 287 (100.0%) |
| 16 and 17 Years | 506 (95.8%) | 409 (82.3%) |
| 18 to 24 Years | 1,869 (96.0%) | 1,670 (98.8%) |
| 25 to 34 Years | 2,143 (98.8%) | 2,387 (94.5%) |
| 35 to 44 Years | 2,345 (94.9%) | 2,654 (89.9%) |
| 45 to 54 Years | 2,427 (98.9%) | 1,897 (92.3%) |
| 55 to 64 Years | 2,256 (96.6%) | 2,360 (93.0%) |
| 65 to 74 Years | 1,982 (88.4%) | 3,402 (92.8%) |
| 75 Years and over | 2,075 (97.8%) | 2,270 (97.2%) |
| Total | 18,873 (94.9%) | 20,978 (92.0%) |
Income Below Poverty Among Married-Couple Families in Clermont
The poverty statistics for married-couple families in Clermont show that 1.8% or 164 of the total 8,863 families live below the poverty line. Families with 3 or 4 children have the highest poverty rate of 8.6%, comprising of 73 families. On the other hand, families with 5 or more children have the lowest poverty rate of 0.0%, which includes 0 families.
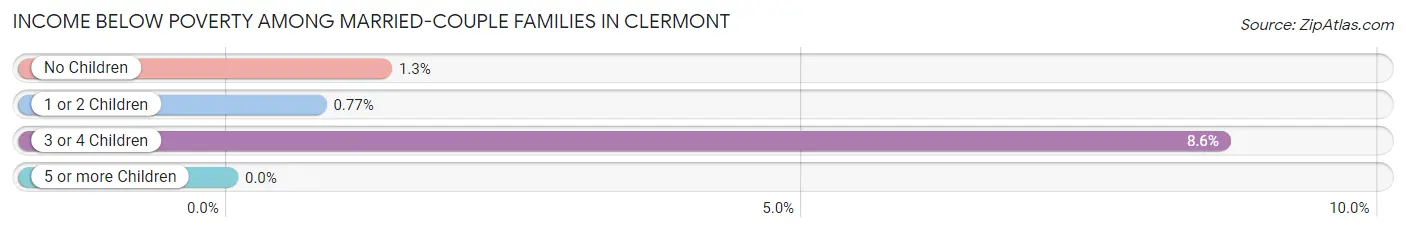
| Children | Above Poverty | Below Poverty |
| No Children | 5,169 (98.7%) | 70 (1.3%) |
| 1 or 2 Children | 2,700 (99.2%) | 21 (0.8%) |
| 3 or 4 Children | 772 (91.4%) | 73 (8.6%) |
| 5 or more Children | 58 (100.0%) | 0 (0.0%) |
| Total | 8,699 (98.2%) | 164 (1.8%) |
Income Below Poverty Among Single-Parent Households in Clermont
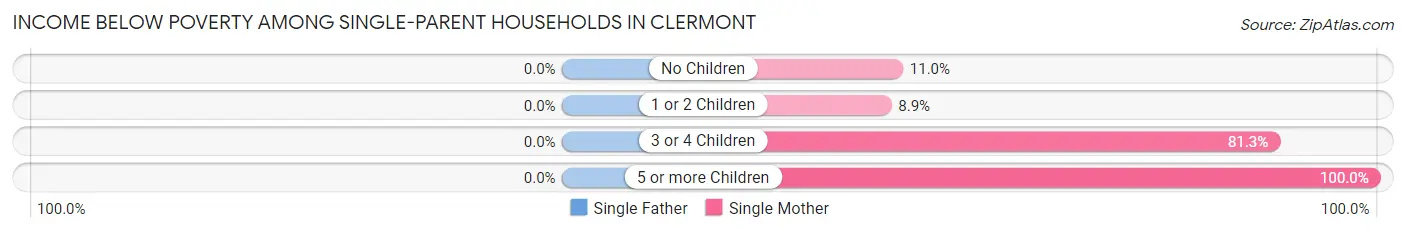
| Children | Single Father | Single Mother |
| No Children | 0 (0.0%) | 107 (11.0%) |
| 1 or 2 Children | 0 (0.0%) | 39 (8.9%) |
| 3 or 4 Children | 0 (0.0%) | 113 (81.3%) |
| 5 or more Children | 0 (0.0%) | 50 (100.0%) |
| Total | 0 (0.0%) | 309 (19.3%) |
Income Below Poverty Among Married-Couple vs Single-Parent Households in Clermont
The poverty data for Clermont shows that 164 of the married-couple family households (1.8%) and 309 of the single-parent households (13.3%) are living below the poverty level. Within the married-couple family households, those with 3 or 4 children have the highest poverty rate, with 73 households (8.6%) falling below the poverty line. Among the single-parent households, those with 5 or more children have the highest poverty rate, with 50 household (100.0%) living below poverty.
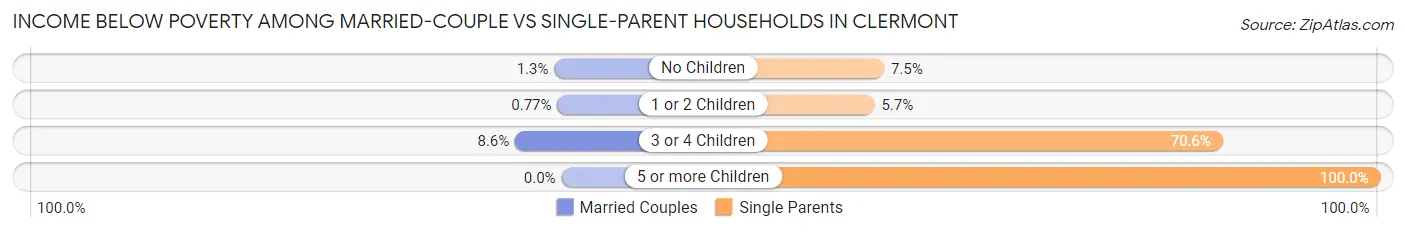
| Children | Married-Couple Families | Single-Parent Households |
| No Children | 70 (1.3%) | 107 (7.5%) |
| 1 or 2 Children | 21 (0.8%) | 39 (5.7%) |
| 3 or 4 Children | 73 (8.6%) | 113 (70.6%) |
| 5 or more Children | 0 (0.0%) | 50 (100.0%) |
| Total | 164 (1.8%) | 309 (13.3%) |
Race in Clermont
The most populous races in Clermont are White / Caucasian (26,029 | 60.2%), Hispanic or Latino (9,880 | 22.8%), and Two or more Races (7,645 | 17.7%).
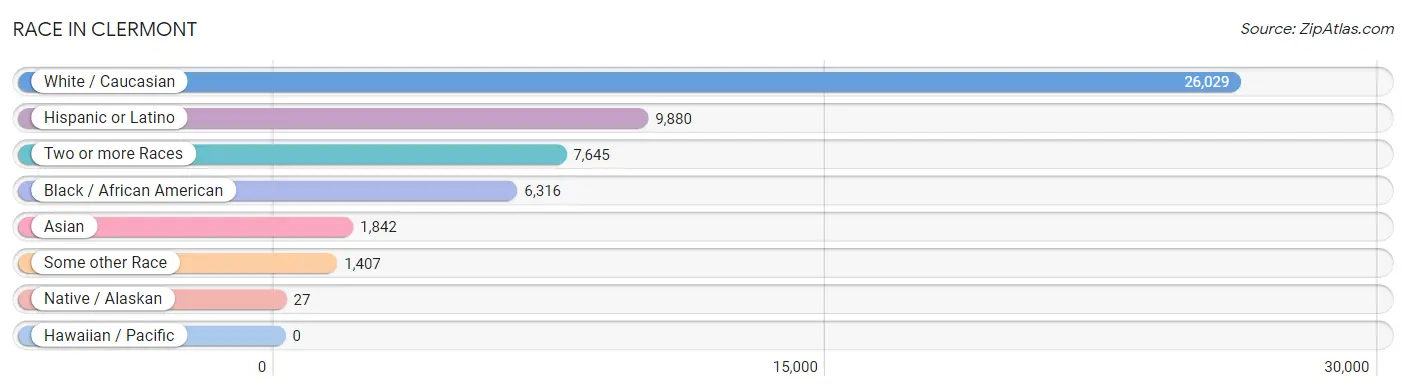
| Race | # Population | % Population |
| Asian | 1,842 | 4.3% |
| Black / African American | 6,316 | 14.6% |
| Hawaiian / Pacific | 0 | 0.0% |
| Hispanic or Latino | 9,880 | 22.8% |
| Native / Alaskan | 27 | 0.1% |
| White / Caucasian | 26,029 | 60.2% |
| Two or more Races | 7,645 | 17.7% |
| Some other Race | 1,407 | 3.3% |
| Total | 43,266 | 100.0% |
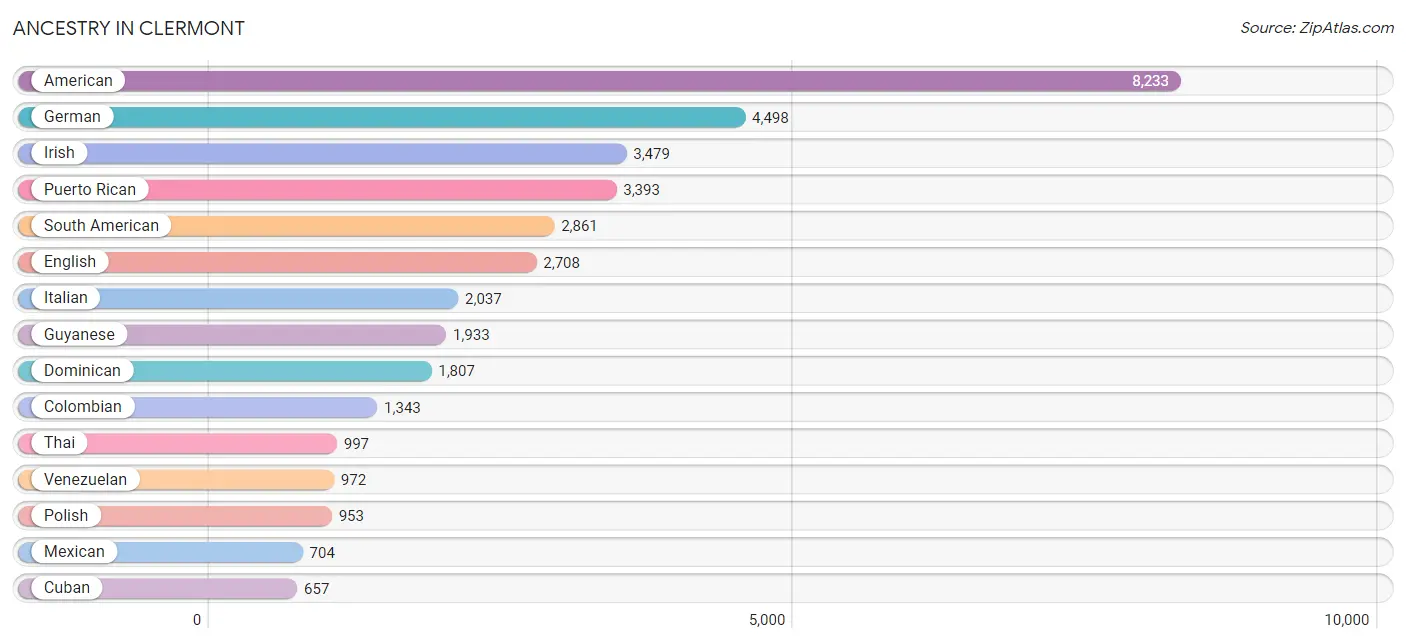
Ancestry in Clermont
The most populous ancestries reported in Clermont are American (8,233 | 19.0%), German (4,498 | 10.4%), Irish (3,479 | 8.0%), Puerto Rican (3,393 | 7.8%), and South American (2,861 | 6.6%), together accounting for 51.9% of all Clermont residents.
| Ancestry | # Population | % Population |
| African | 82 | 0.2% |
| American | 8,233 | 19.0% |
| Apache | 9 | 0.0% |
| Arab | 281 | 0.6% |
| Argentinean | 38 | 0.1% |
| Armenian | 10 | 0.0% |
| Austrian | 59 | 0.1% |
| Barbadian | 70 | 0.2% |
| Belgian | 37 | 0.1% |
| Bhutanese | 17 | 0.0% |
| British | 318 | 0.7% |
| British West Indian | 159 | 0.4% |
| Burmese | 188 | 0.4% |
| Canadian | 99 | 0.2% |
| Cape Verdean | 24 | 0.1% |
| Central American | 212 | 0.5% |
| Central American Indian | 15 | 0.0% |
| Chilean | 205 | 0.5% |
| Colombian | 1,343 | 3.1% |
| Croatian | 94 | 0.2% |
| Cuban | 657 | 1.5% |
| Czech | 25 | 0.1% |
| Danish | 118 | 0.3% |
| Dominican | 1,807 | 4.2% |
| Dutch | 421 | 1.0% |
| Egyptian | 39 | 0.1% |
| English | 2,708 | 6.3% |
| European | 484 | 1.1% |
| Filipino | 101 | 0.2% |
| French | 432 | 1.0% |
| French Canadian | 289 | 0.7% |
| German | 4,498 | 10.4% |
| Guatemalan | 120 | 0.3% |
| Guyanese | 1,933 | 4.5% |
| Honduran | 88 | 0.2% |
| Hungarian | 194 | 0.4% |
| Icelander | 18 | 0.0% |
| Indian (Asian) | 371 | 0.9% |
| Iranian | 15 | 0.0% |
| Irish | 3,479 | 8.0% |
| Italian | 2,037 | 4.7% |
| Jamaican | 248 | 0.6% |
| Korean | 233 | 0.5% |
| Laotian | 40 | 0.1% |
| Latvian | 49 | 0.1% |
| Lebanese | 181 | 0.4% |
| Lithuanian | 69 | 0.2% |
| Luxembourger | 18 | 0.0% |
| Mexican | 704 | 1.6% |
| Nicaraguan | 4 | 0.0% |
| Nigerian | 60 | 0.1% |
| Northern European | 73 | 0.2% |
| Norwegian | 123 | 0.3% |
| Pakistani | 23 | 0.1% |
| Palestinian | 12 | 0.0% |
| Peruvian | 174 | 0.4% |
| Polish | 953 | 2.2% |
| Portuguese | 132 | 0.3% |
| Puerto Rican | 3,393 | 7.8% |
| Romanian | 186 | 0.4% |
| Russian | 408 | 0.9% |
| Scandinavian | 67 | 0.2% |
| Scotch-Irish | 247 | 0.6% |
| Scottish | 359 | 0.8% |
| Seminole | 34 | 0.1% |
| Serbian | 22 | 0.1% |
| Sioux | 18 | 0.0% |
| Slavic | 17 | 0.0% |
| Slovak | 110 | 0.3% |
| Slovene | 54 | 0.1% |
| South American | 2,861 | 6.6% |
| Spaniard | 24 | 0.1% |
| Spanish | 82 | 0.2% |
| Sri Lankan | 209 | 0.5% |
| Subsaharan African | 166 | 0.4% |
| Swedish | 265 | 0.6% |
| Swiss | 51 | 0.1% |
| Thai | 997 | 2.3% |
| Trinidadian and Tobagonian | 76 | 0.2% |
| Ukrainian | 52 | 0.1% |
| Uruguayan | 109 | 0.3% |
| Venezuelan | 972 | 2.2% |
| Vietnamese | 17 | 0.0% |
| Welsh | 98 | 0.2% |
| West Indian | 24 | 0.1% |
| Yugoslavian | 59 | 0.1% | View All 86 Rows |
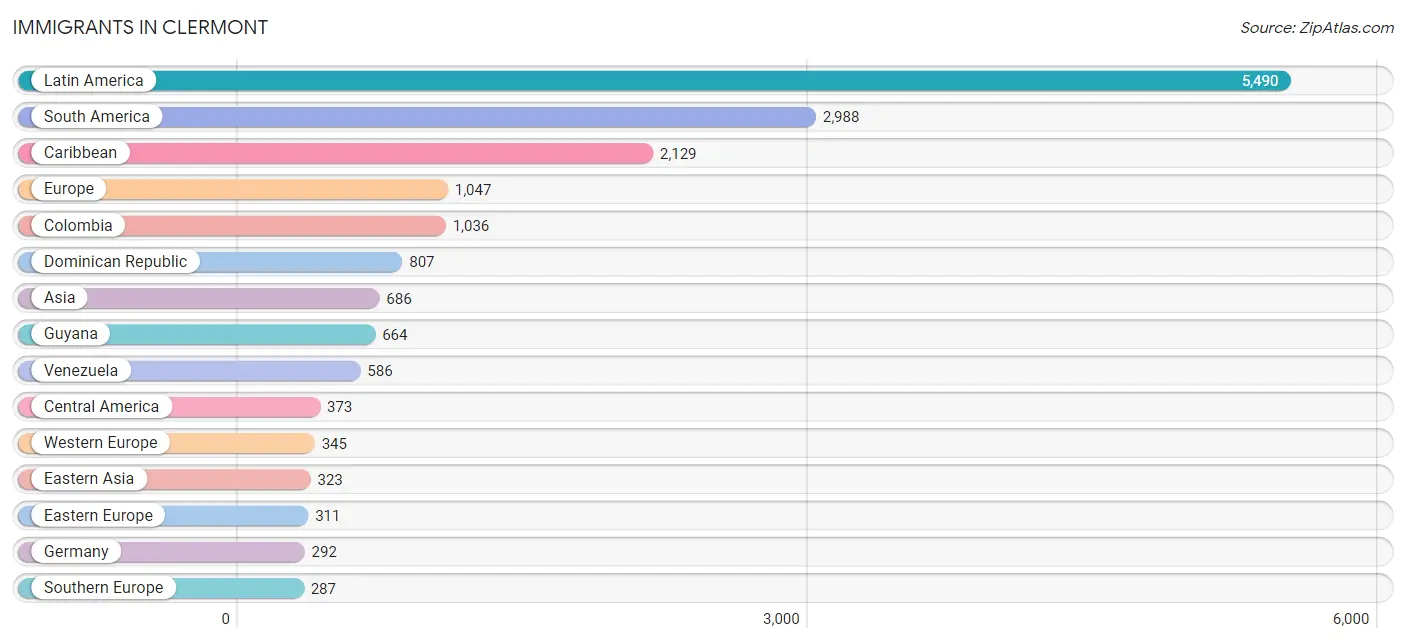
Immigrants in Clermont
The most numerous immigrant groups reported in Clermont came from Latin America (5,490 | 12.7%), South America (2,988 | 6.9%), Caribbean (2,129 | 4.9%), Europe (1,047 | 2.4%), and Colombia (1,036 | 2.4%), together accounting for 29.3% of all Clermont residents.
| Immigration Origin | # Population | % Population |
| Africa | 241 | 0.6% |
| Argentina | 38 | 0.1% |
| Asia | 686 | 1.6% |
| Bangladesh | 17 | 0.0% |
| Barbados | 178 | 0.4% |
| Brazil | 42 | 0.1% |
| Bulgaria | 153 | 0.4% |
| Canada | 256 | 0.6% |
| Caribbean | 2,129 | 4.9% |
| Central America | 373 | 0.9% |
| Chile | 205 | 0.5% |
| China | 286 | 0.7% |
| Colombia | 1,036 | 2.4% |
| Cuba | 270 | 0.6% |
| Denmark | 13 | 0.0% |
| Dominica | 202 | 0.5% |
| Dominican Republic | 807 | 1.9% |
| Eastern Africa | 15 | 0.0% |
| Eastern Asia | 323 | 0.7% |
| Eastern Europe | 311 | 0.7% |
| Ecuador | 27 | 0.1% |
| Egypt | 39 | 0.1% |
| England | 27 | 0.1% |
| Europe | 1,047 | 2.4% |
| France | 40 | 0.1% |
| Germany | 292 | 0.7% |
| Guatemala | 107 | 0.3% |
| Guyana | 664 | 1.5% |
| Honduras | 67 | 0.2% |
| India | 79 | 0.2% |
| Indonesia | 6 | 0.0% |
| Ireland | 25 | 0.1% |
| Israel | 12 | 0.0% |
| Italy | 259 | 0.6% |
| Jamaica | 244 | 0.6% |
| Japan | 12 | 0.0% |
| Korea | 25 | 0.1% |
| Latin America | 5,490 | 12.7% |
| Malaysia | 52 | 0.1% |
| Mexico | 165 | 0.4% |
| Netherlands | 13 | 0.0% |
| Nicaragua | 34 | 0.1% |
| Nigeria | 187 | 0.4% |
| Northern Africa | 39 | 0.1% |
| Northern Europe | 104 | 0.2% |
| Peru | 239 | 0.5% |
| Philippines | 112 | 0.3% |
| Portugal | 19 | 0.0% |
| Romania | 104 | 0.2% |
| Russia | 32 | 0.1% |
| Scotland | 16 | 0.0% |
| Serbia | 22 | 0.1% |
| South America | 2,988 | 6.9% |
| South Central Asia | 96 | 0.2% |
| South Eastern Asia | 243 | 0.6% |
| Southern Europe | 287 | 0.7% |
| Spain | 9 | 0.0% |
| Taiwan | 166 | 0.4% |
| Thailand | 16 | 0.0% |
| Trinidad and Tobago | 125 | 0.3% |
| Uruguay | 119 | 0.3% |
| Venezuela | 586 | 1.3% |
| Vietnam | 57 | 0.1% |
| Western Africa | 187 | 0.4% |
| Western Asia | 12 | 0.0% |
| Western Europe | 345 | 0.8% | View All 66 Rows |
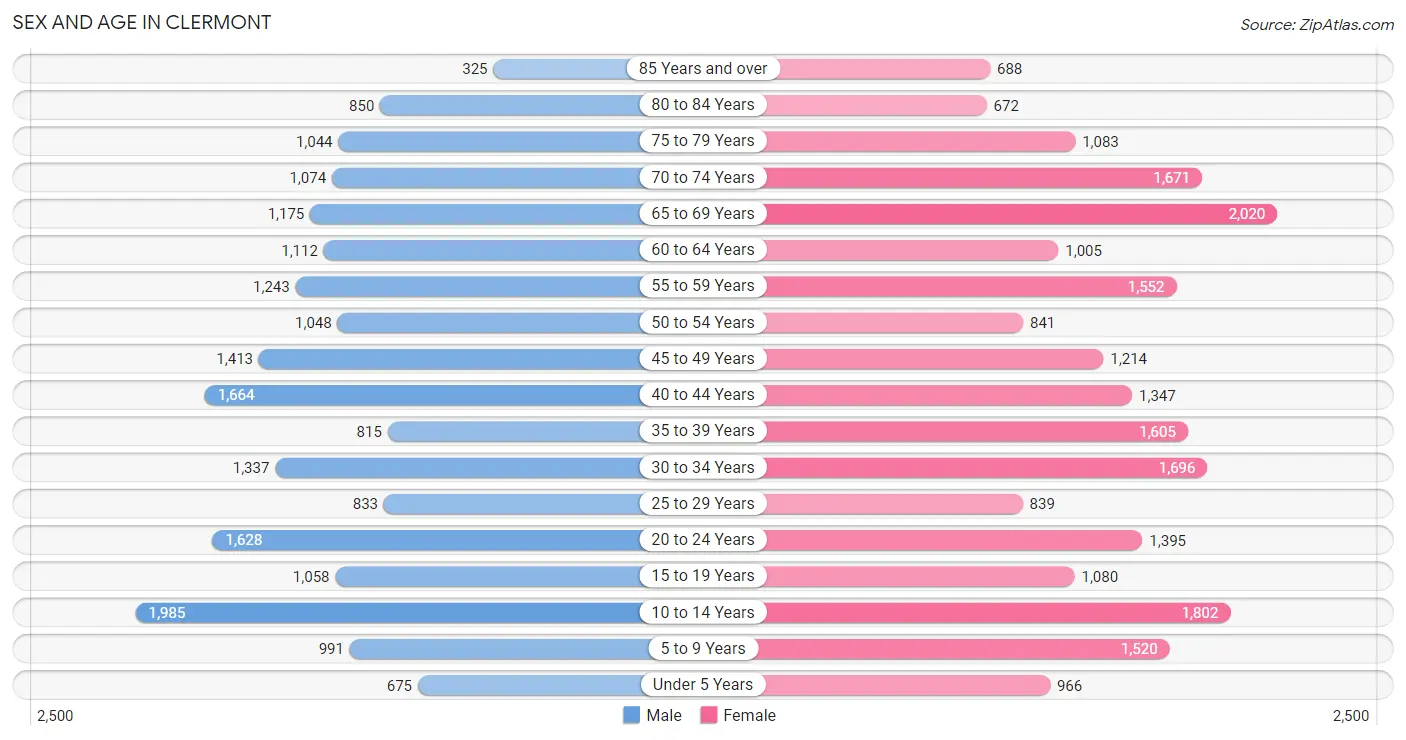
Sex and Age in Clermont
Sex and Age in Clermont
The most populous age groups in Clermont are 10 to 14 Years (1,985 | 9.8%) for men and 65 to 69 Years (2,020 | 8.8%) for women.
| Age Bracket | Male | Female |
| Under 5 Years | 675 (3.3%) | 966 (4.2%) |
| 5 to 9 Years | 991 (4.9%) | 1,520 (6.6%) |
| 10 to 14 Years | 1,985 (9.8%) | 1,802 (7.8%) |
| 15 to 19 Years | 1,058 (5.2%) | 1,080 (4.7%) |
| 20 to 24 Years | 1,628 (8.0%) | 1,395 (6.1%) |
| 25 to 29 Years | 833 (4.1%) | 839 (3.6%) |
| 30 to 34 Years | 1,337 (6.6%) | 1,696 (7.4%) |
| 35 to 39 Years | 815 (4.0%) | 1,605 (7.0%) |
| 40 to 44 Years | 1,664 (8.2%) | 1,347 (5.9%) |
| 45 to 49 Years | 1,413 (7.0%) | 1,214 (5.3%) |
| 50 to 54 Years | 1,048 (5.2%) | 841 (3.7%) |
| 55 to 59 Years | 1,243 (6.1%) | 1,552 (6.8%) |
| 60 to 64 Years | 1,112 (5.5%) | 1,005 (4.4%) |
| 65 to 69 Years | 1,175 (5.8%) | 2,020 (8.8%) |
| 70 to 74 Years | 1,074 (5.3%) | 1,671 (7.3%) |
| 75 to 79 Years | 1,044 (5.1%) | 1,083 (4.7%) |
| 80 to 84 Years | 850 (4.2%) | 672 (2.9%) |
| 85 Years and over | 325 (1.6%) | 688 (3.0%) |
| Total | 20,270 (100.0%) | 22,996 (100.0%) |
Families and Households in Clermont
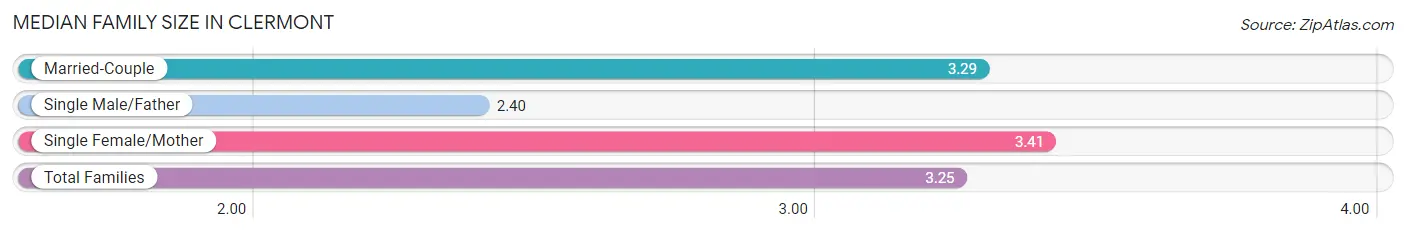
Median Family Size in Clermont
The median family size in Clermont is 3.25 persons per family, with single female/mother families (1,598 | 14.3%) accounting for the largest median family size of 3.41 persons per family. On the other hand, single male/father families (718 | 6.4%) represent the smallest median family size with 2.40 persons per family.
| Family Type | # Families | Family Size |
| Married-Couple | 8,863 (79.3%) | 3.29 |
| Single Male/Father | 718 (6.4%) | 2.40 |
| Single Female/Mother | 1,598 (14.3%) | 3.41 |
| Total Families | 11,179 (100.0%) | 3.25 |
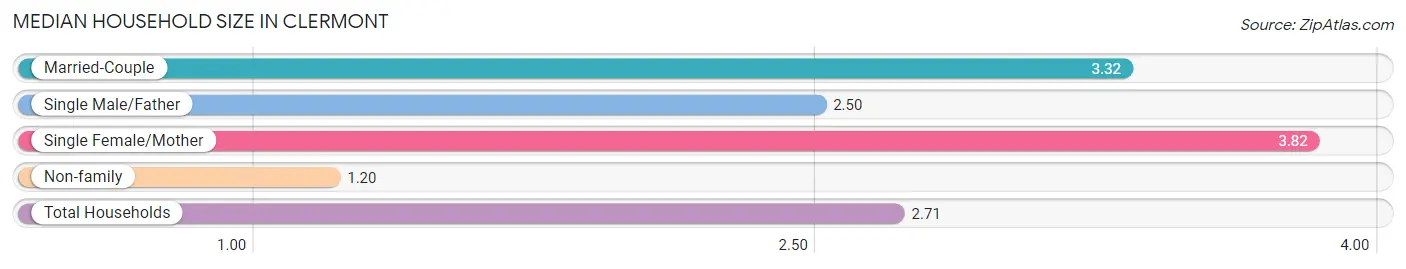
Median Household Size in Clermont
The median household size in Clermont is 2.71 persons per household, with single female/mother households (1,598 | 10.1%) accounting for the largest median household size of 3.82 persons per household. non-family households (4,674 | 29.5%) represent the smallest median household size with 1.20 persons per household.
| Household Type | # Households | Household Size |
| Married-Couple | 8,863 (55.9%) | 3.32 |
| Single Male/Father | 718 (4.5%) | 2.50 |
| Single Female/Mother | 1,598 (10.1%) | 3.82 |
| Non-family | 4,674 (29.5%) | 1.20 |
| Total Households | 15,853 (100.0%) | 2.71 |
Household Size by Marriage Status in Clermont
Out of a total of 15,853 households in Clermont, 11,179 (70.5%) are family households, while 4,674 (29.5%) are nonfamily households. The most numerous type of family households are 2-person households, comprising 5,103, and the most common type of nonfamily households are 1-person households, comprising 3,878.
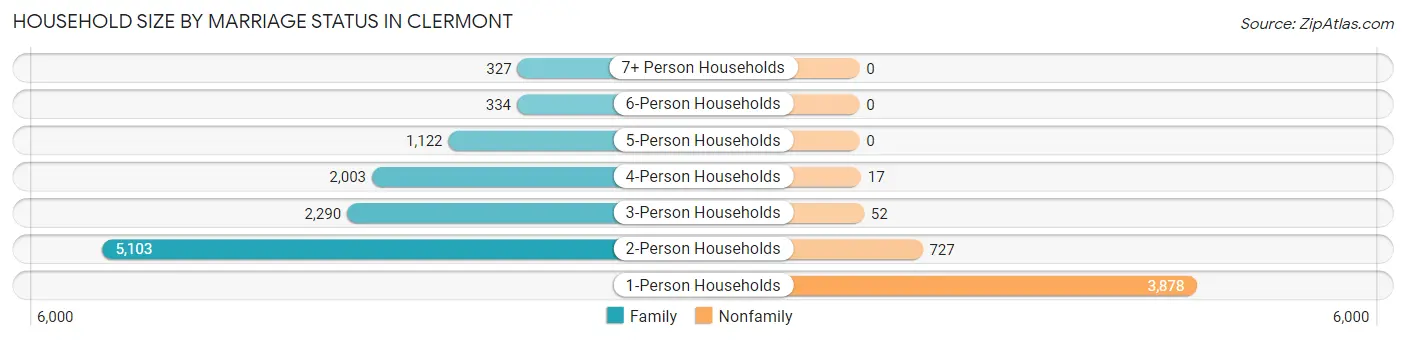
| Household Size | Family Households | Nonfamily Households |
| 1-Person Households | - | 3,878 (24.5%) |
| 2-Person Households | 5,103 (32.2%) | 727 (4.6%) |
| 3-Person Households | 2,290 (14.4%) | 52 (0.3%) |
| 4-Person Households | 2,003 (12.6%) | 17 (0.1%) |
| 5-Person Households | 1,122 (7.1%) | 0 (0.0%) |
| 6-Person Households | 334 (2.1%) | 0 (0.0%) |
| 7+ Person Households | 327 (2.1%) | 0 (0.0%) |
| Total | 11,179 (70.5%) | 4,674 (29.5%) |
Female Fertility in Clermont
Fertility by Age in Clermont
Average fertility rate in Clermont is 33.0 births per 1,000 women. Women in the age bracket of 20 to 34 years have the highest fertility rate with 62.0 births per 1,000 women. Women in the age bracket of 20 to 34 years acount for 80.7% of all women with births.
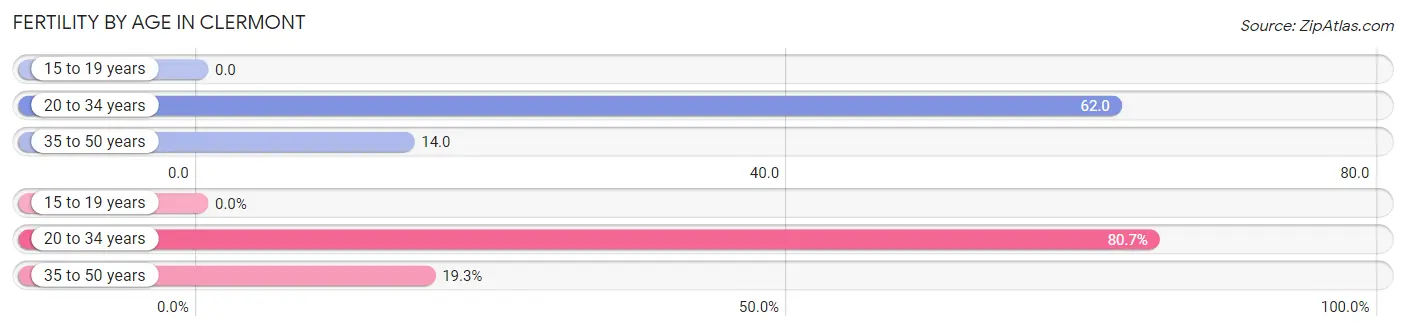
| Age Bracket | Women with Births | Births / 1,000 Women |
| 15 to 19 years | 0 (0.0%) | 0.0 |
| 20 to 34 years | 243 (80.7%) | 62.0 |
| 35 to 50 years | 58 (19.3%) | 14.0 |
| Total | 301 (100.0%) | 33.0 |
Fertility by Age by Marriage Status in Clermont
64.8% of women with births (301) in Clermont are married. The highest percentage of unmarried women with births falls into 20 to 34 years age bracket with 43.6% of them unmarried at the time of birth, while the lowest percentage of unmarried women with births belong to 35 to 50 years age bracket with 0.0% of them unmarried.
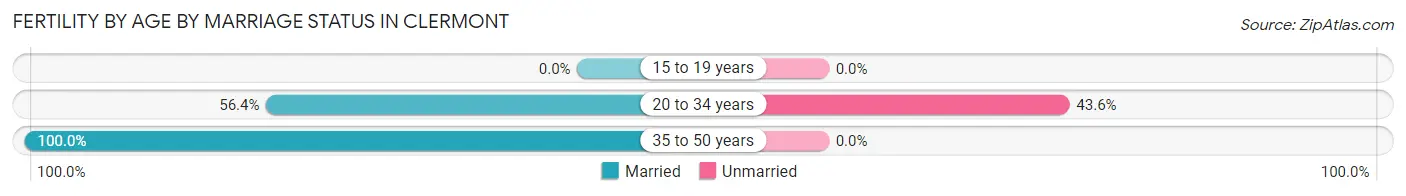
| Age Bracket | Married | Unmarried |
| 15 to 19 years | 0 (0.0%) | 0 (0.0%) |
| 20 to 34 years | 137 (56.4%) | 106 (43.6%) |
| 35 to 50 years | 58 (100.0%) | 0 (0.0%) |
| Total | 195 (64.8%) | 106 (35.2%) |
Fertility by Education in Clermont
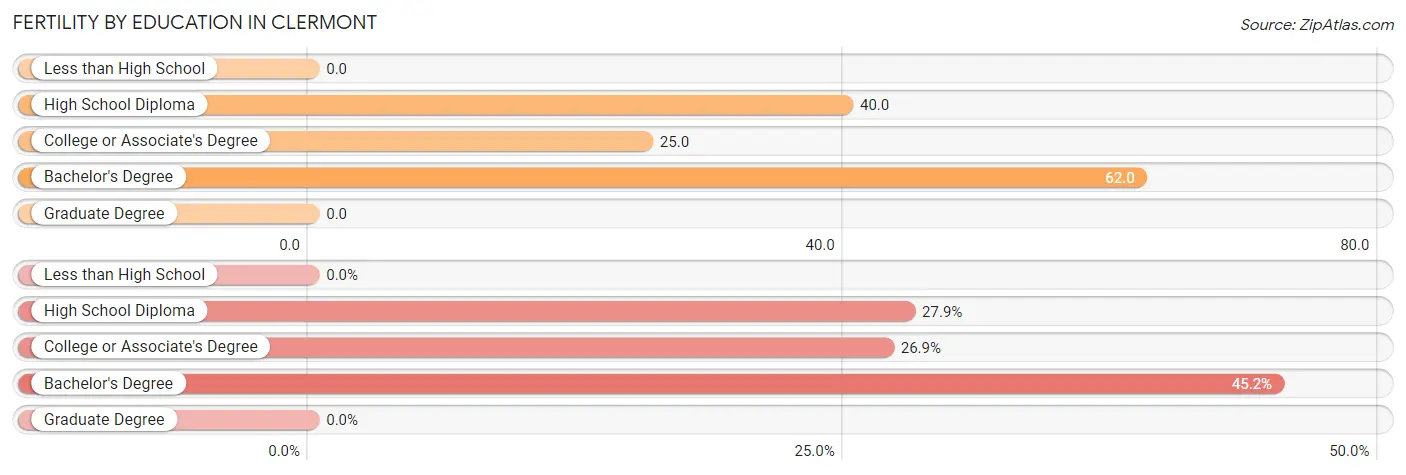
| Educational Attainment | Women with Births | Births / 1,000 Women |
| Less than High School | 0 (0.0%) | 0.0 |
| High School Diploma | 84 (27.9%) | 40.0 |
| College or Associate's Degree | 81 (26.9%) | 25.0 |
| Bachelor's Degree | 136 (45.2%) | 62.0 |
| Graduate Degree | 0 (0.0%) | 0.0 |
| Total | 301 (100.0%) | 33.0 |
Fertility by Education by Marriage Status in Clermont
35.2% of women with births in Clermont are unmarried. Women with the educational attainment of bachelor's degree are most likely to be married with 87.5% of them married at childbirth, while women with the educational attainment of high school diploma are least likely to be married with 75.0% of them unmarried at childbirth.
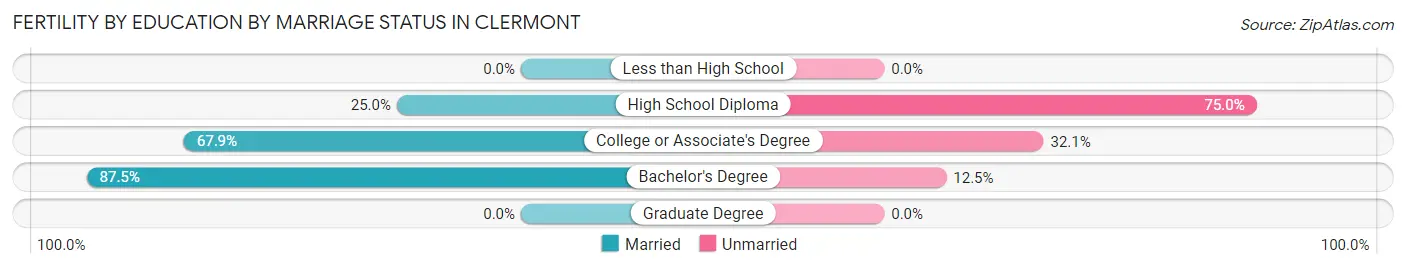
| Educational Attainment | Married | Unmarried |
| Less than High School | 0 (0.0%) | 0 (0.0%) |
| High School Diploma | 21 (25.0%) | 63 (75.0%) |
| College or Associate's Degree | 55 (67.9%) | 26 (32.1%) |
| Bachelor's Degree | 119 (87.5%) | 17 (12.5%) |
| Graduate Degree | 0 (0.0%) | 0 (0.0%) |
| Total | 195 (64.8%) | 106 (35.2%) |
Employment Characteristics in Clermont
Employment by Class of Employer in Clermont
Among the 17,190 employed individuals in Clermont, private company employees (12,991 | 75.6%), local government employees (1,389 | 8.1%), and not-for-profit organizations (933 | 5.4%) make up the most common classes of employment.
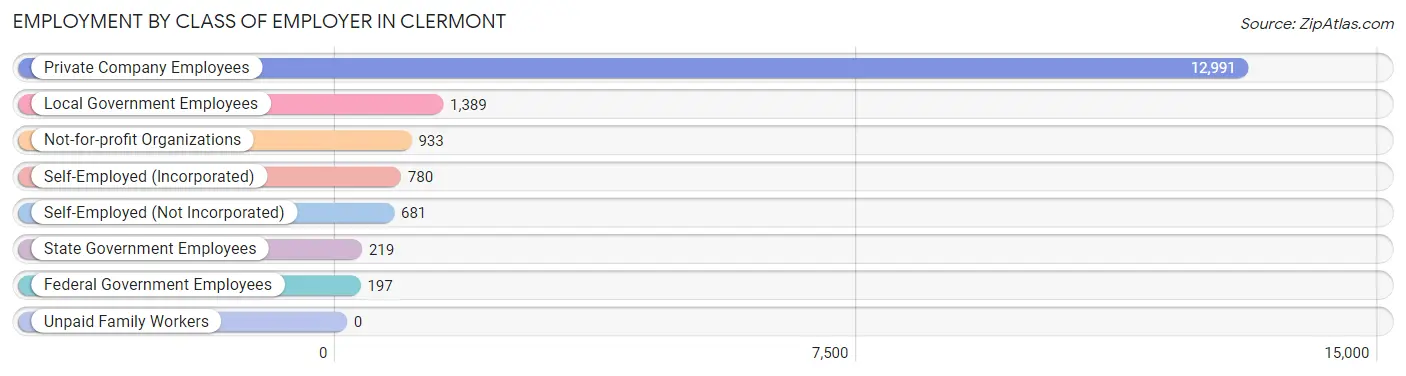
| Employer Class | # Employees | % Employees |
| Private Company Employees | 12,991 | 75.6% |
| Self-Employed (Incorporated) | 780 | 4.5% |
| Self-Employed (Not Incorporated) | 681 | 4.0% |
| Not-for-profit Organizations | 933 | 5.4% |
| Local Government Employees | 1,389 | 8.1% |
| State Government Employees | 219 | 1.3% |
| Federal Government Employees | 197 | 1.1% |
| Unpaid Family Workers | 0 | 0.0% |
| Total | 17,190 | 100.0% |
Employment Status by Age in Clermont
According to the labor force statistics for Clermont, out of the total population over 16 years of age (34,829), 52.9% or 18,425 individuals are in the labor force, with 5.0% or 921 of them unemployed. The age group with the highest labor force participation rate is 30 to 34 years, with 90.9% or 2,757 individuals in the labor force. Within the labor force, the 30 to 34 years age range has the highest percentage of unemployed individuals, with 12.6% or 347 of them being unemployed.
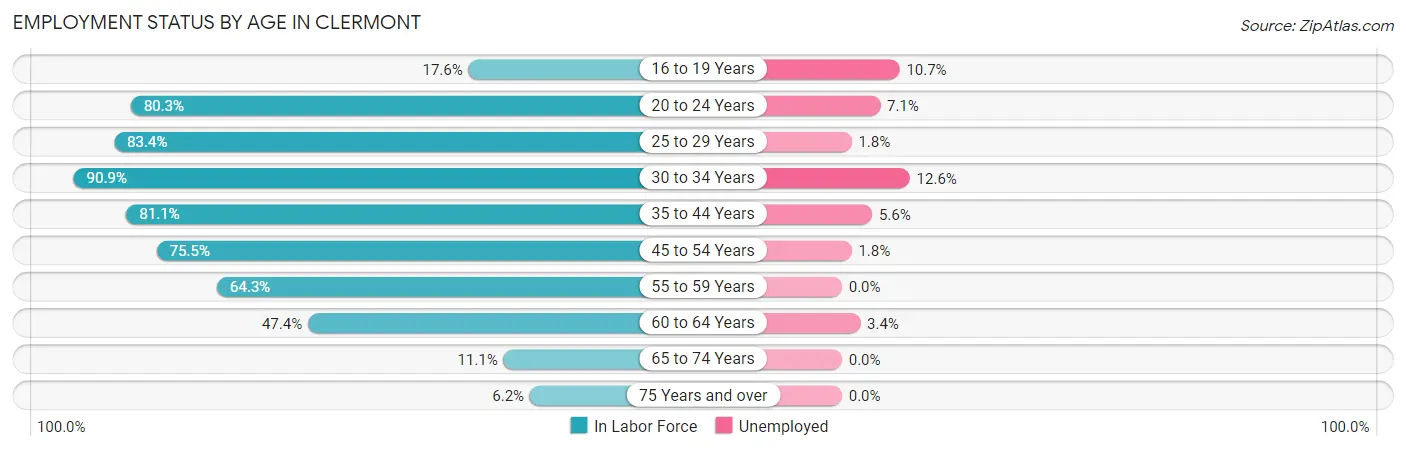
| Age Bracket | In Labor Force | Unemployed |
| 16 to 19 Years | 289 (17.6%) | 31 (10.7%) |
| 20 to 24 Years | 2,427 (80.3%) | 172 (7.1%) |
| 25 to 29 Years | 1,394 (83.4%) | 25 (1.8%) |
| 30 to 34 Years | 2,757 (90.9%) | 347 (12.6%) |
| 35 to 44 Years | 4,405 (81.1%) | 247 (5.6%) |
| 45 to 54 Years | 3,410 (75.5%) | 61 (1.8%) |
| 55 to 59 Years | 1,797 (64.3%) | 0 (0.0%) |
| 60 to 64 Years | 1,003 (47.4%) | 34 (3.4%) |
| 65 to 74 Years | 659 (11.1%) | 0 (0.0%) |
| 75 Years and over | 289 (6.2%) | 0 (0.0%) |
| Total | 18,425 (52.9%) | 921 (5.0%) |
Employment Status by Educational Attainment in Clermont
According to labor force statistics for Clermont, 75.5% of individuals (14,771) out of the total population between 25 and 64 years of age (19,564) are in the labor force, with 4.8% or 709 of them being unemployed. The group with the highest labor force participation rate are those with the educational attainment of bachelor's degree or higher, with 83.8% or 5,936 individuals in the labor force. Within the labor force, individuals with college / associate degree education have the highest percentage of unemployment, with 8.3% or 471 of them being unemployed.
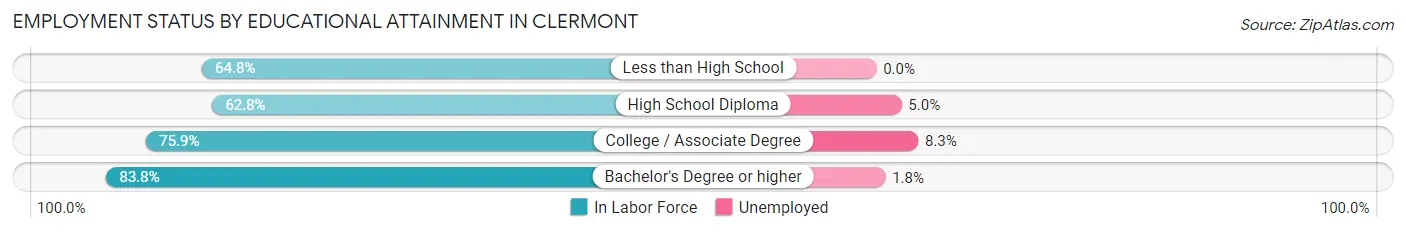
| Educational Attainment | In Labor Force | Unemployed |
| Less than High School | 354 (64.8%) | 0 (0.0%) |
| High School Diploma | 2,795 (62.8%) | 223 (5.0%) |
| College / Associate Degree | 5,680 (75.9%) | 621 (8.3%) |
| Bachelor's Degree or higher | 5,936 (83.8%) | 128 (1.8%) |
| Total | 14,771 (75.5%) | 939 (4.8%) |
Employment Occupations by Sex in Clermont
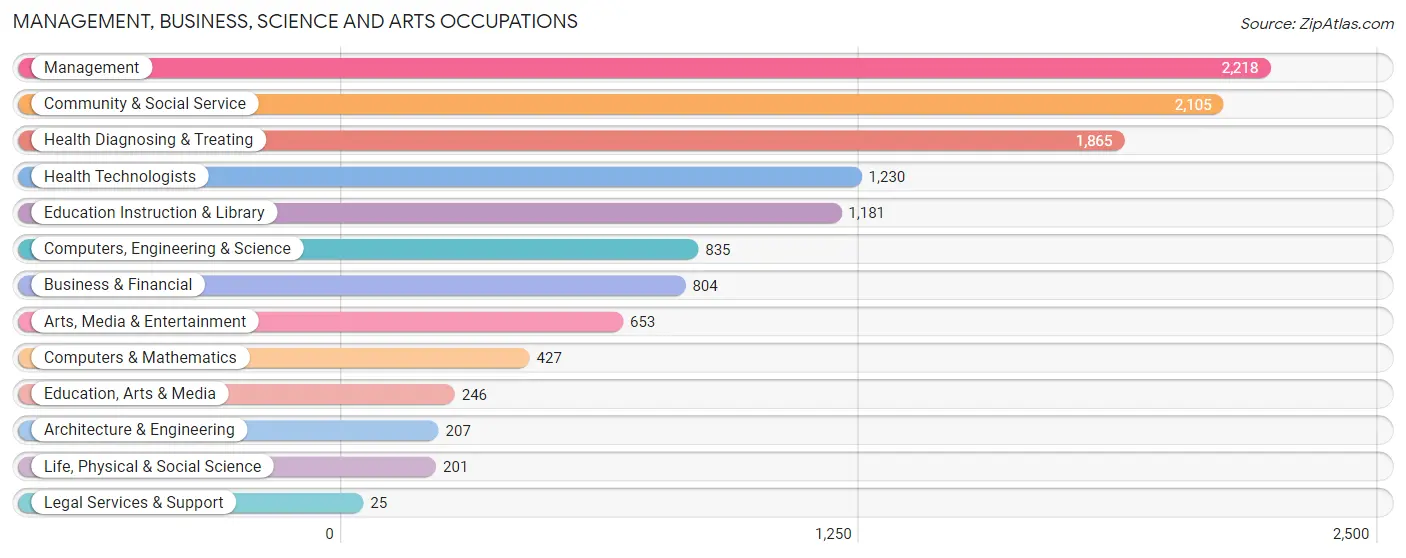
Management, Business, Science and Arts Occupations
The most common Management, Business, Science and Arts occupations in Clermont are Management (2,218 | 12.7%), Community & Social Service (2,105 | 12.0%), Health Diagnosing & Treating (1,865 | 10.6%), Health Technologists (1,230 | 7.0%), and Education Instruction & Library (1,181 | 6.7%).
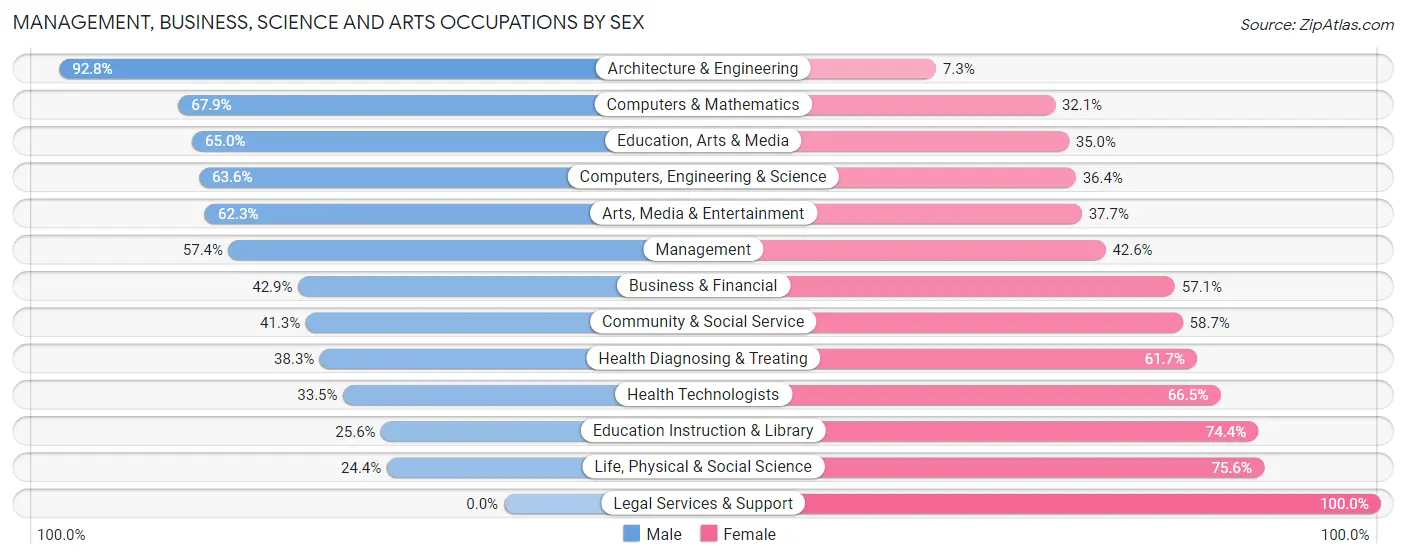
Management, Business, Science and Arts Occupations by Sex
Within the Management, Business, Science and Arts occupations in Clermont, the most male-oriented occupations are Architecture & Engineering (92.7%), Computers & Mathematics (67.9%), and Education, Arts & Media (65.0%), while the most female-oriented occupations are Legal Services & Support (100.0%), Life, Physical & Social Science (75.6%), and Education Instruction & Library (74.4%).
| Occupation | Male | Female |
| Management | 1,273 (57.4%) | 945 (42.6%) |
| Business & Financial | 345 (42.9%) | 459 (57.1%) |
| Computers, Engineering & Science | 531 (63.6%) | 304 (36.4%) |
| Computers & Mathematics | 290 (67.9%) | 137 (32.1%) |
| Architecture & Engineering | 192 (92.7%) | 15 (7.2%) |
| Life, Physical & Social Science | 49 (24.4%) | 152 (75.6%) |
| Community & Social Service | 869 (41.3%) | 1,236 (58.7%) |
| Education, Arts & Media | 160 (65.0%) | 86 (35.0%) |
| Legal Services & Support | 0 (0.0%) | 25 (100.0%) |
| Education Instruction & Library | 302 (25.6%) | 879 (74.4%) |
| Arts, Media & Entertainment | 407 (62.3%) | 246 (37.7%) |
| Health Diagnosing & Treating | 715 (38.3%) | 1,150 (61.7%) |
| Health Technologists | 412 (33.5%) | 818 (66.5%) |
| Total (Category) | 3,733 (47.7%) | 4,094 (52.3%) |
| Total (Overall) | 9,357 (53.4%) | 8,157 (46.6%) |
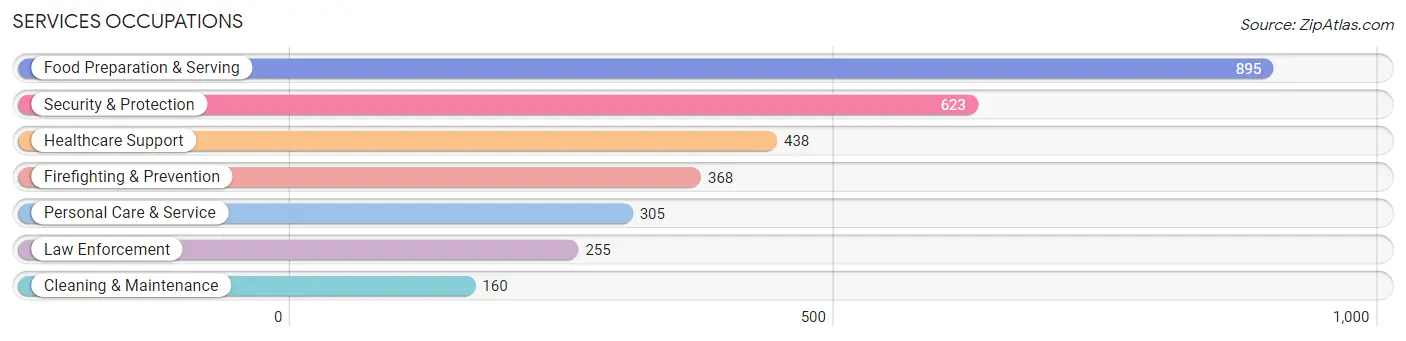
Services Occupations
The most common Services occupations in Clermont are Food Preparation & Serving (895 | 5.1%), Security & Protection (623 | 3.6%), Healthcare Support (438 | 2.5%), Firefighting & Prevention (368 | 2.1%), and Personal Care & Service (305 | 1.7%).
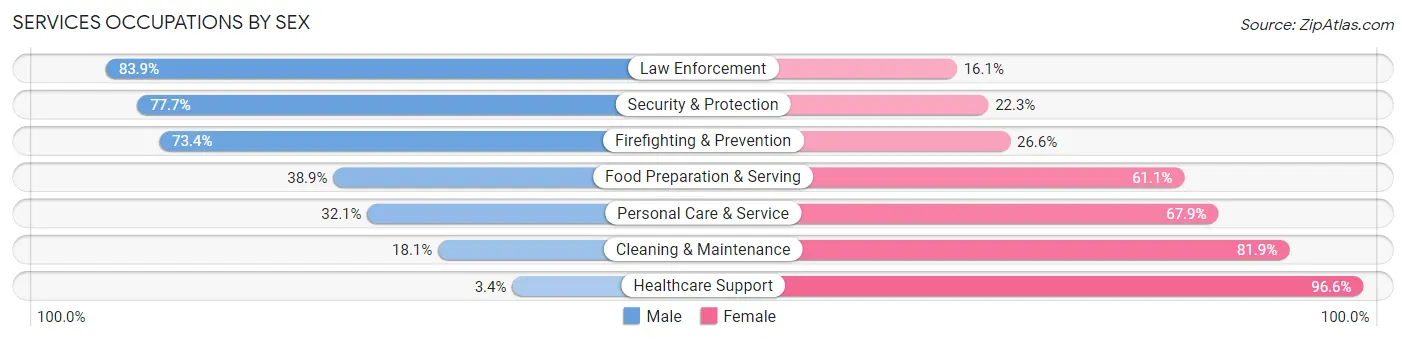
Services Occupations by Sex
Within the Services occupations in Clermont, the most male-oriented occupations are Law Enforcement (83.9%), Security & Protection (77.7%), and Firefighting & Prevention (73.4%), while the most female-oriented occupations are Healthcare Support (96.6%), Cleaning & Maintenance (81.9%), and Personal Care & Service (67.9%).
| Occupation | Male | Female |
| Healthcare Support | 15 (3.4%) | 423 (96.6%) |
| Security & Protection | 484 (77.7%) | 139 (22.3%) |
| Firefighting & Prevention | 270 (73.4%) | 98 (26.6%) |
| Law Enforcement | 214 (83.9%) | 41 (16.1%) |
| Food Preparation & Serving | 348 (38.9%) | 547 (61.1%) |
| Cleaning & Maintenance | 29 (18.1%) | 131 (81.9%) |
| Personal Care & Service | 98 (32.1%) | 207 (67.9%) |
| Total (Category) | 974 (40.2%) | 1,447 (59.8%) |
| Total (Overall) | 9,357 (53.4%) | 8,157 (46.6%) |
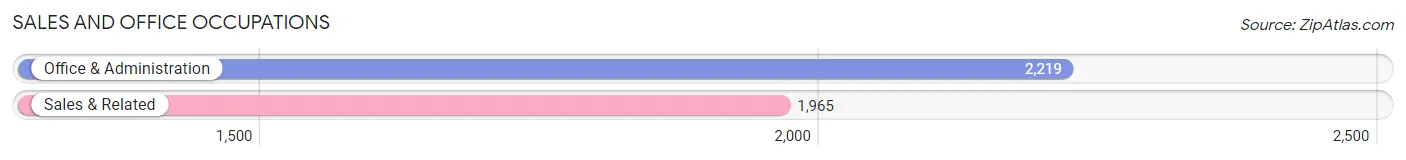
Sales and Office Occupations
The most common Sales and Office occupations in Clermont are Office & Administration (2,219 | 12.7%), and Sales & Related (1,965 | 11.2%).
Sales and Office Occupations by Sex
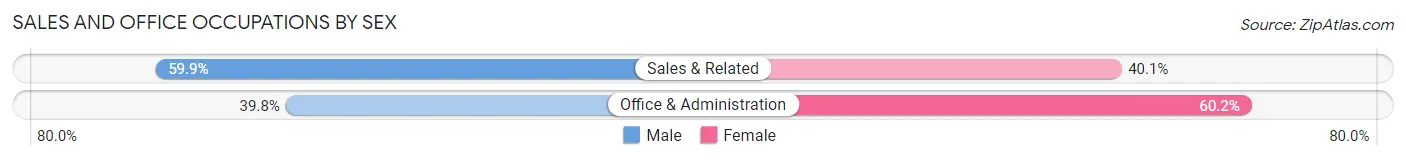
| Occupation | Male | Female |
| Sales & Related | 1,177 (59.9%) | 788 (40.1%) |
| Office & Administration | 884 (39.8%) | 1,335 (60.2%) |
| Total (Category) | 2,061 (49.3%) | 2,123 (50.7%) |
| Total (Overall) | 9,357 (53.4%) | 8,157 (46.6%) |
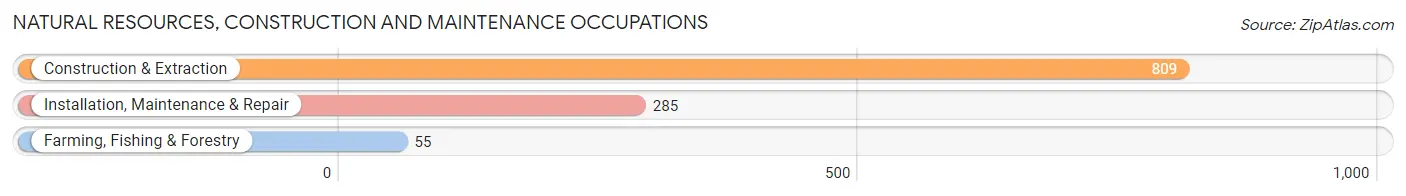
Natural Resources, Construction and Maintenance Occupations
The most common Natural Resources, Construction and Maintenance occupations in Clermont are Construction & Extraction (809 | 4.6%), Installation, Maintenance & Repair (285 | 1.6%), and Farming, Fishing & Forestry (55 | 0.3%).
Natural Resources, Construction and Maintenance Occupations by Sex
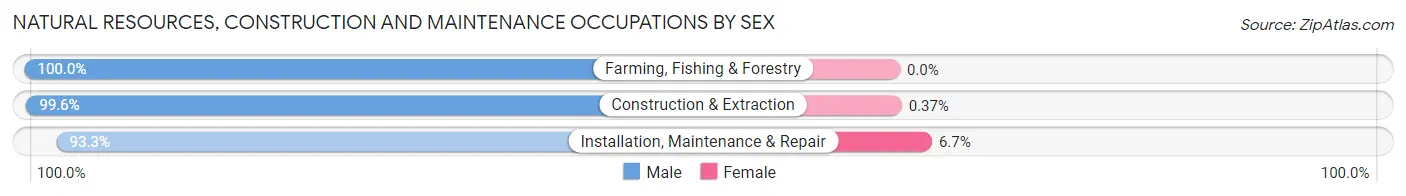
| Occupation | Male | Female |
| Farming, Fishing & Forestry | 55 (100.0%) | 0 (0.0%) |
| Construction & Extraction | 806 (99.6%) | 3 (0.4%) |
| Installation, Maintenance & Repair | 266 (93.3%) | 19 (6.7%) |
| Total (Category) | 1,127 (98.1%) | 22 (1.9%) |
| Total (Overall) | 9,357 (53.4%) | 8,157 (46.6%) |
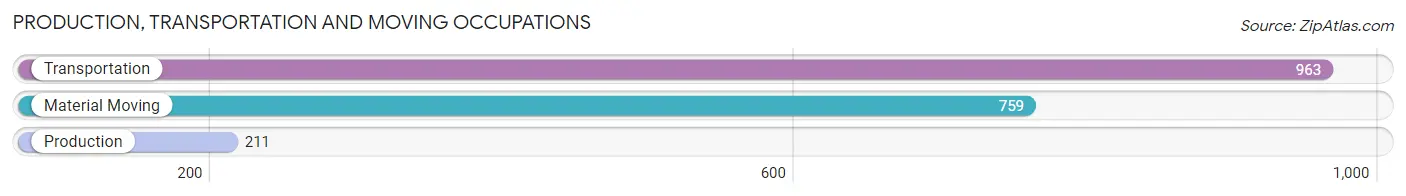
Production, Transportation and Moving Occupations
The most common Production, Transportation and Moving occupations in Clermont are Transportation (963 | 5.5%), Material Moving (759 | 4.3%), and Production (211 | 1.2%).
Production, Transportation and Moving Occupations by Sex
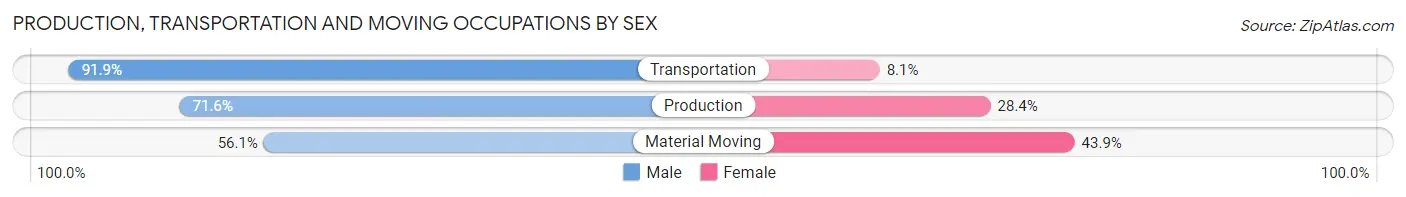
| Occupation | Male | Female |
| Production | 151 (71.6%) | 60 (28.4%) |
| Transportation | 885 (91.9%) | 78 (8.1%) |
| Material Moving | 426 (56.1%) | 333 (43.9%) |
| Total (Category) | 1,462 (75.6%) | 471 (24.4%) |
| Total (Overall) | 9,357 (53.4%) | 8,157 (46.6%) |
Employment Industries by Sex in Clermont
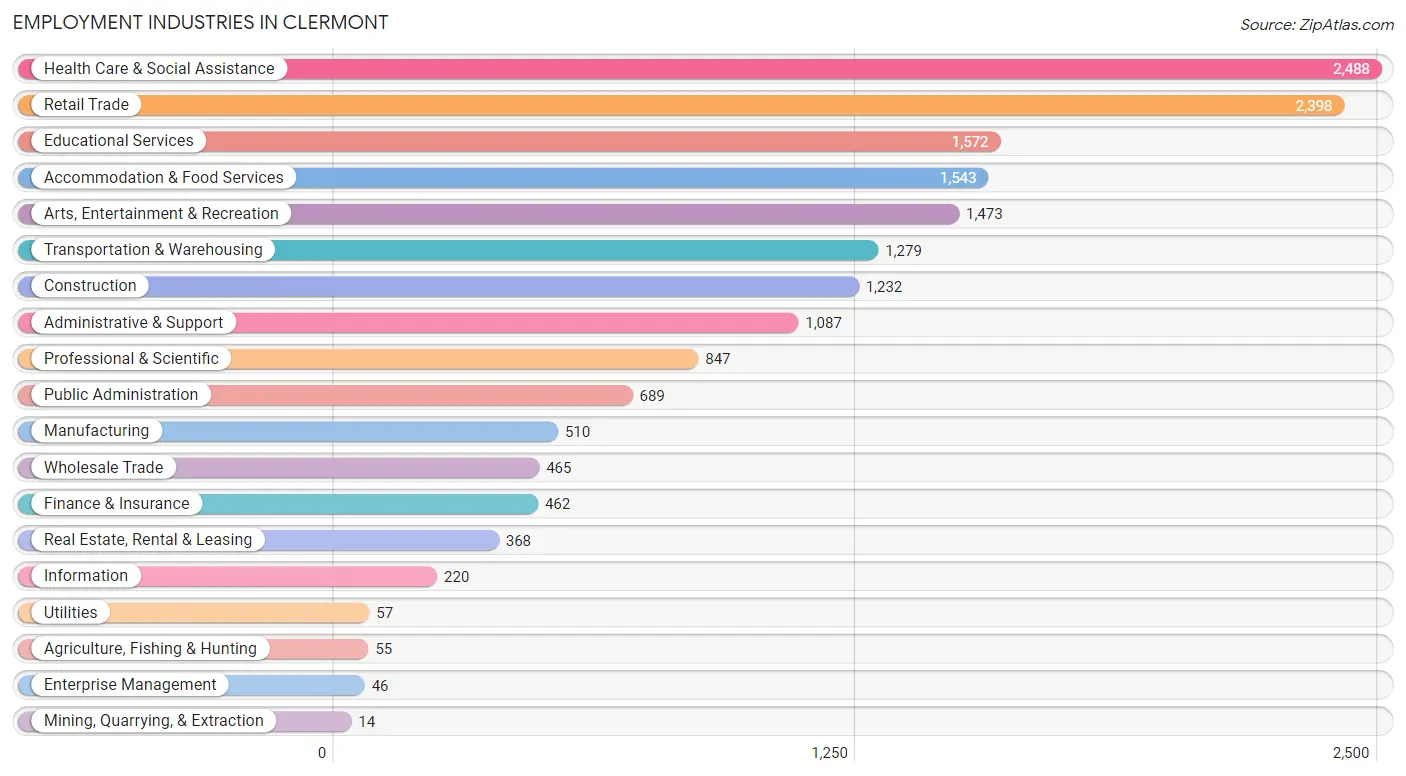
Employment Industries in Clermont
The major employment industries in Clermont include Health Care & Social Assistance (2,488 | 14.2%), Retail Trade (2,398 | 13.7%), Educational Services (1,572 | 9.0%), Accommodation & Food Services (1,543 | 8.8%), and Arts, Entertainment & Recreation (1,473 | 8.4%).
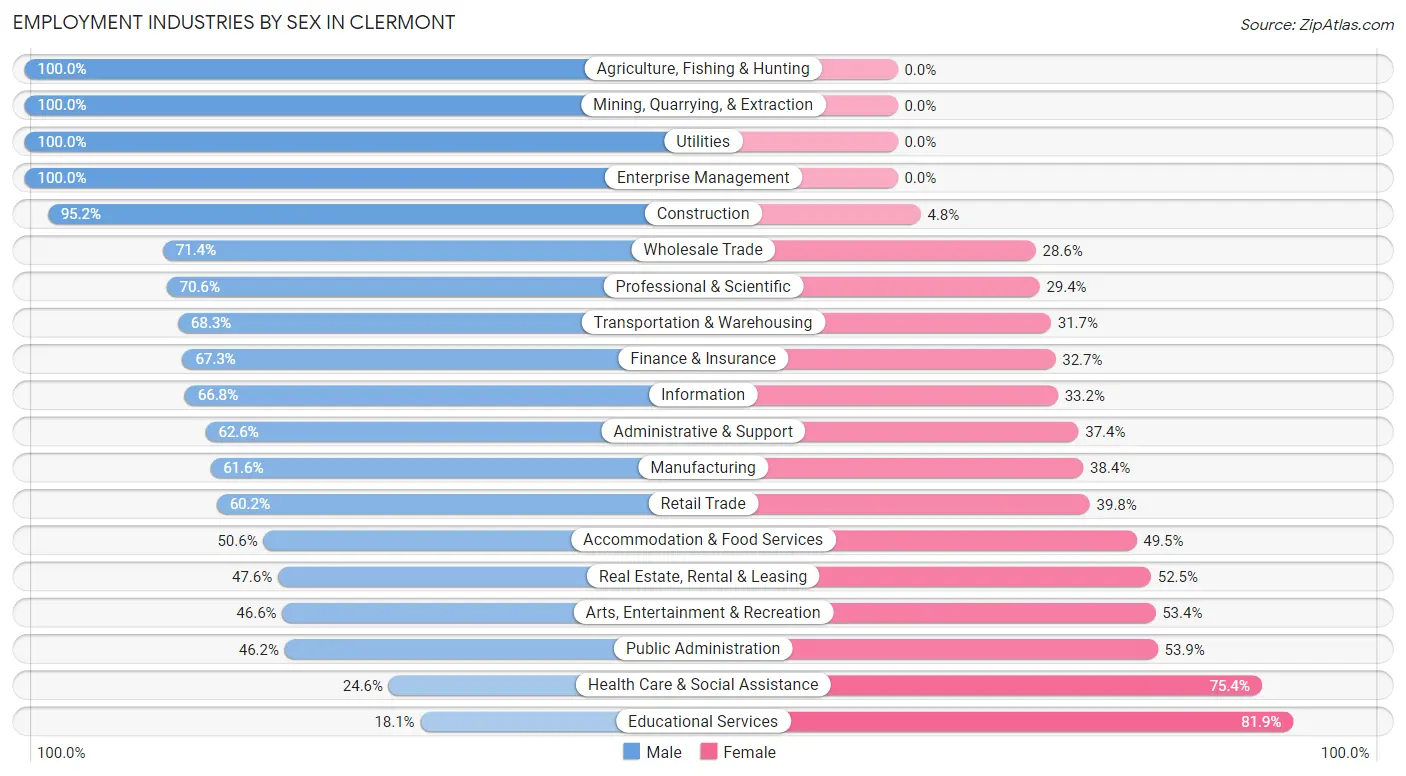
Employment Industries by Sex in Clermont
The Clermont industries that see more men than women are Agriculture, Fishing & Hunting (100.0%), Mining, Quarrying, & Extraction (100.0%), and Utilities (100.0%), whereas the industries that tend to have a higher number of women are Educational Services (81.9%), Health Care & Social Assistance (75.4%), and Public Administration (53.8%).
| Industry | Male | Female |
| Agriculture, Fishing & Hunting | 55 (100.0%) | 0 (0.0%) |
| Mining, Quarrying, & Extraction | 14 (100.0%) | 0 (0.0%) |
| Construction | 1,173 (95.2%) | 59 (4.8%) |
| Manufacturing | 314 (61.6%) | 196 (38.4%) |
| Wholesale Trade | 332 (71.4%) | 133 (28.6%) |
| Retail Trade | 1,444 (60.2%) | 954 (39.8%) |
| Transportation & Warehousing | 873 (68.3%) | 406 (31.7%) |
| Utilities | 57 (100.0%) | 0 (0.0%) |
| Information | 147 (66.8%) | 73 (33.2%) |
| Finance & Insurance | 311 (67.3%) | 151 (32.7%) |
| Real Estate, Rental & Leasing | 175 (47.5%) | 193 (52.4%) |
| Professional & Scientific | 598 (70.6%) | 249 (29.4%) |
| Enterprise Management | 46 (100.0%) | 0 (0.0%) |
| Administrative & Support | 680 (62.6%) | 407 (37.4%) |
| Educational Services | 284 (18.1%) | 1,288 (81.9%) |
| Health Care & Social Assistance | 612 (24.6%) | 1,876 (75.4%) |
| Arts, Entertainment & Recreation | 687 (46.6%) | 786 (53.4%) |
| Accommodation & Food Services | 780 (50.5%) | 763 (49.4%) |
| Public Administration | 318 (46.2%) | 371 (53.8%) |
| Total | 9,357 (53.4%) | 8,157 (46.6%) |
Education in Clermont
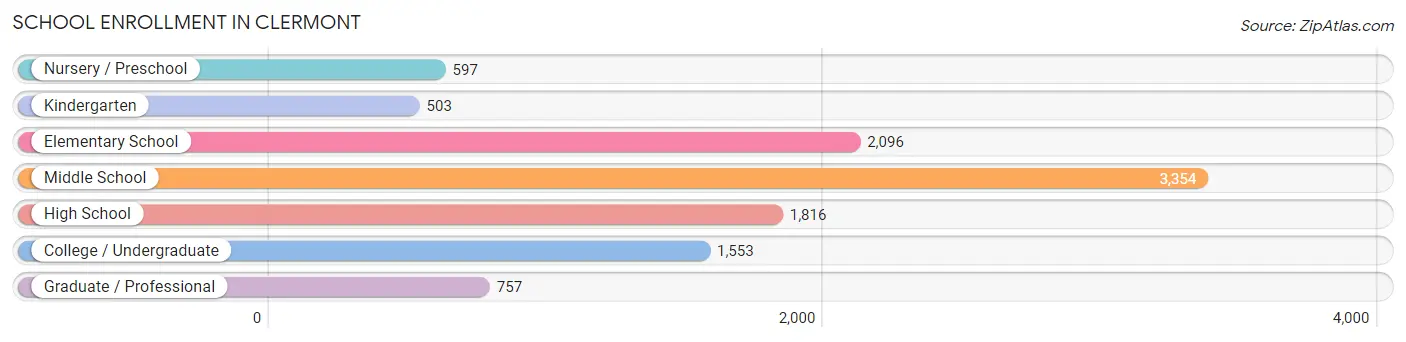
School Enrollment in Clermont
The most common levels of schooling among the 10,676 students in Clermont are middle school (3,354 | 31.4%), elementary school (2,096 | 19.6%), and high school (1,816 | 17.0%).
| School Level | # Students | % Students |
| Nursery / Preschool | 597 | 5.6% |
| Kindergarten | 503 | 4.7% |
| Elementary School | 2,096 | 19.6% |
| Middle School | 3,354 | 31.4% |
| High School | 1,816 | 17.0% |
| College / Undergraduate | 1,553 | 14.5% |
| Graduate / Professional | 757 | 7.1% |
| Total | 10,676 | 100.0% |
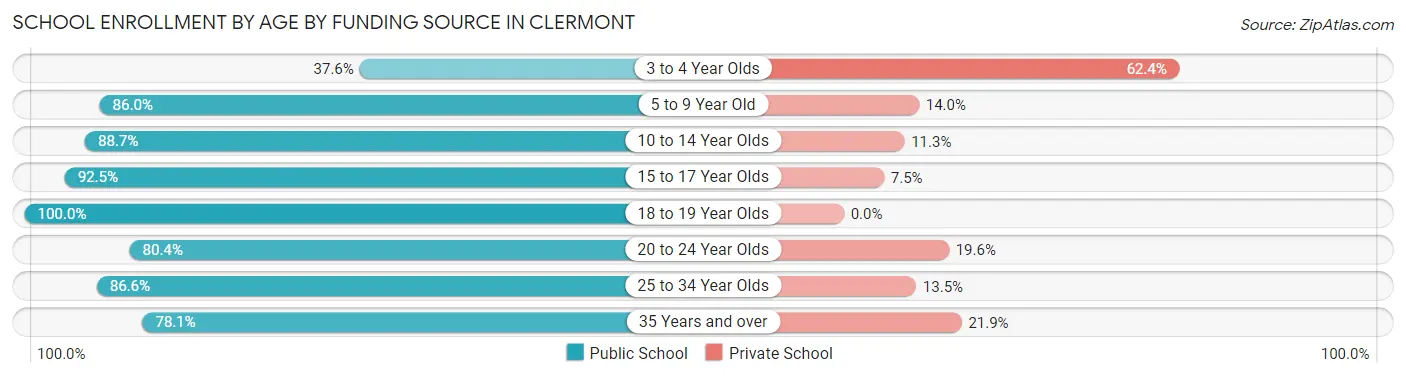
School Enrollment by Age by Funding Source in Clermont
Out of a total of 10,676 students who are enrolled in schools in Clermont, 1,580 (14.8%) attend a private institution, while the remaining 9,096 (85.2%) are enrolled in public schools. The age group of 3 to 4 year olds has the highest likelihood of being enrolled in private schools, with 307 (62.4% in the age bracket) enrolled. Conversely, the age group of 18 to 19 year olds has the lowest likelihood of being enrolled in a private school, with 413 (100.0% in the age bracket) attending a public institution.
| Age Bracket | Public School | Private School |
| 3 to 4 Year Olds | 185 (37.6%) | 307 (62.4%) |
| 5 to 9 Year Old | 2,091 (86.0%) | 340 (14.0%) |
| 10 to 14 Year Olds | 3,360 (88.7%) | 427 (11.3%) |
| 15 to 17 Year Olds | 1,335 (92.5%) | 108 (7.5%) |
| 18 to 19 Year Olds | 413 (100.0%) | 0 (0.0%) |
| 20 to 24 Year Olds | 596 (80.4%) | 145 (19.6%) |
| 25 to 34 Year Olds | 534 (86.6%) | 83 (13.5%) |
| 35 Years and over | 587 (78.1%) | 165 (21.9%) |
| Total | 9,096 (85.2%) | 1,580 (14.8%) |
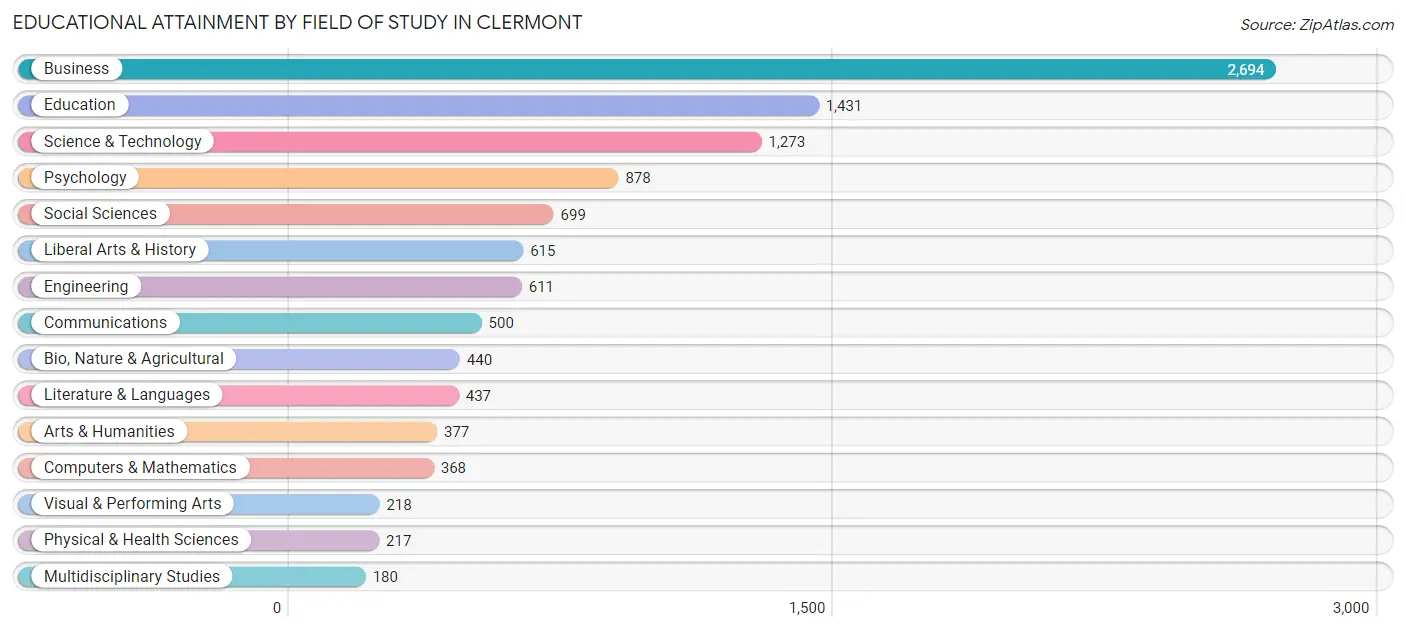
Educational Attainment by Field of Study in Clermont
Business (2,694 | 24.6%), education (1,431 | 13.1%), science & technology (1,273 | 11.6%), psychology (878 | 8.0%), and social sciences (699 | 6.4%) are the most common fields of study among 10,938 individuals in Clermont who have obtained a bachelor's degree or higher.
| Field of Study | # Graduates | % Graduates |
| Computers & Mathematics | 368 | 3.4% |
| Bio, Nature & Agricultural | 440 | 4.0% |
| Physical & Health Sciences | 217 | 2.0% |
| Psychology | 878 | 8.0% |
| Social Sciences | 699 | 6.4% |
| Engineering | 611 | 5.6% |
| Multidisciplinary Studies | 180 | 1.7% |
| Science & Technology | 1,273 | 11.6% |
| Business | 2,694 | 24.6% |
| Education | 1,431 | 13.1% |
| Literature & Languages | 437 | 4.0% |
| Liberal Arts & History | 615 | 5.6% |
| Visual & Performing Arts | 218 | 2.0% |
| Communications | 500 | 4.6% |
| Arts & Humanities | 377 | 3.5% |
| Total | 10,938 | 100.0% |
Transportation & Commute in Clermont
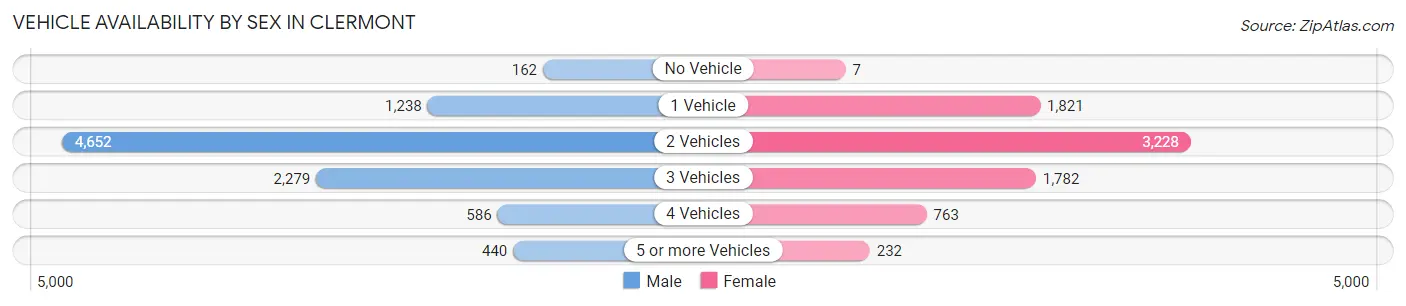
Vehicle Availability by Sex in Clermont
The most prevalent vehicle ownership categories in Clermont are males with 2 vehicles (4,652, accounting for 49.7%) and females with 2 vehicles (3,228, making up 59.4%).
| Vehicles Available | Male | Female |
| No Vehicle | 162 (1.7%) | 7 (0.1%) |
| 1 Vehicle | 1,238 (13.2%) | 1,821 (23.3%) |
| 2 Vehicles | 4,652 (49.7%) | 3,228 (41.2%) |
| 3 Vehicles | 2,279 (24.4%) | 1,782 (22.8%) |
| 4 Vehicles | 586 (6.3%) | 763 (9.7%) |
| 5 or more Vehicles | 440 (4.7%) | 232 (3.0%) |
| Total | 9,357 (100.0%) | 7,833 (100.0%) |
Commute Time in Clermont
The most frequently occuring commute durations in Clermont are 45 to 59 minutes (2,455 commuters, 17.1%), 30 to 34 minutes (2,331 commuters, 16.3%), and 5 to 9 minutes (1,316 commuters, 9.2%).
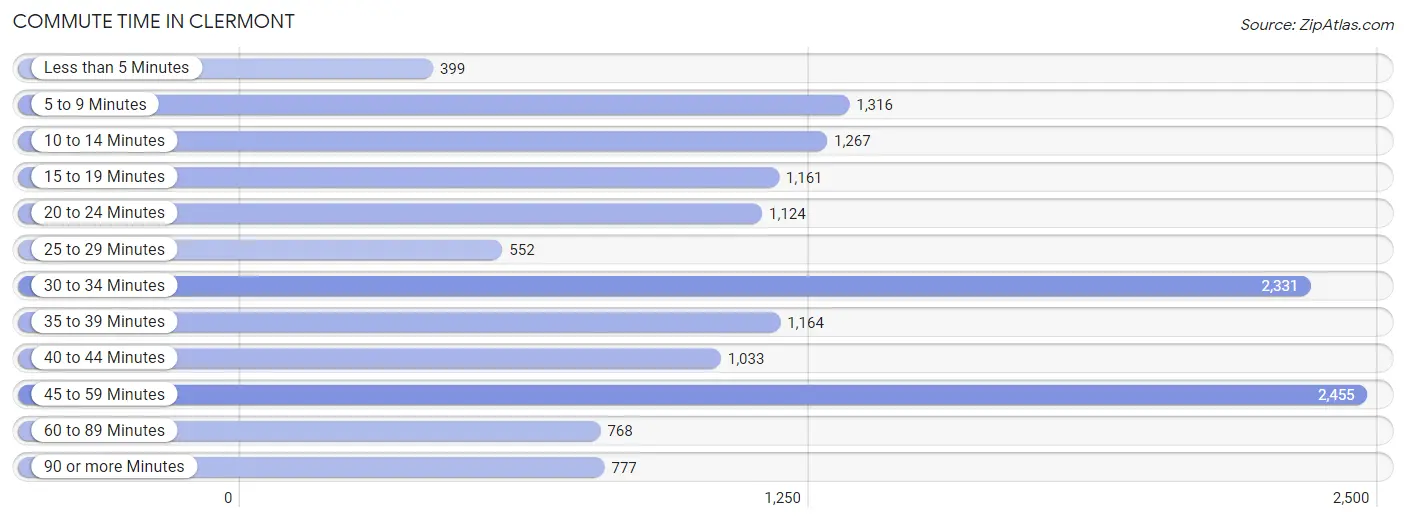
| Commute Time | # Commuters | % Commuters |
| Less than 5 Minutes | 399 | 2.8% |
| 5 to 9 Minutes | 1,316 | 9.2% |
| 10 to 14 Minutes | 1,267 | 8.8% |
| 15 to 19 Minutes | 1,161 | 8.1% |
| 20 to 24 Minutes | 1,124 | 7.8% |
| 25 to 29 Minutes | 552 | 3.8% |
| 30 to 34 Minutes | 2,331 | 16.3% |
| 35 to 39 Minutes | 1,164 | 8.1% |
| 40 to 44 Minutes | 1,033 | 7.2% |
| 45 to 59 Minutes | 2,455 | 17.1% |
| 60 to 89 Minutes | 768 | 5.3% |
| 90 or more Minutes | 777 | 5.4% |
Commute Time by Sex in Clermont
The most common commute times in Clermont are 45 to 59 minutes (1,589 commuters, 20.5%) for males and 30 to 34 minutes (978 commuters, 14.8%) for females.

| Commute Time | Male | Female |
| Less than 5 Minutes | 292 (3.8%) | 107 (1.6%) |
| 5 to 9 Minutes | 547 (7.1%) | 769 (11.7%) |
| 10 to 14 Minutes | 543 (7.0%) | 724 (11.0%) |
| 15 to 19 Minutes | 643 (8.3%) | 518 (7.9%) |
| 20 to 24 Minutes | 548 (7.1%) | 576 (8.7%) |
| 25 to 29 Minutes | 114 (1.5%) | 438 (6.6%) |
| 30 to 34 Minutes | 1,353 (17.5%) | 978 (14.8%) |
| 35 to 39 Minutes | 522 (6.7%) | 642 (9.7%) |
| 40 to 44 Minutes | 542 (7.0%) | 491 (7.4%) |
| 45 to 59 Minutes | 1,589 (20.5%) | 866 (13.1%) |
| 60 to 89 Minutes | 432 (5.6%) | 336 (5.1%) |
| 90 or more Minutes | 626 (8.1%) | 151 (2.3%) |
Time of Departure to Work by Sex in Clermont
The most frequent times of departure to work in Clermont are 7:30 AM to 7:59 AM (1,067, 13.8%) for males and 8:00 AM to 8:29 AM (1,266, 19.2%) for females.
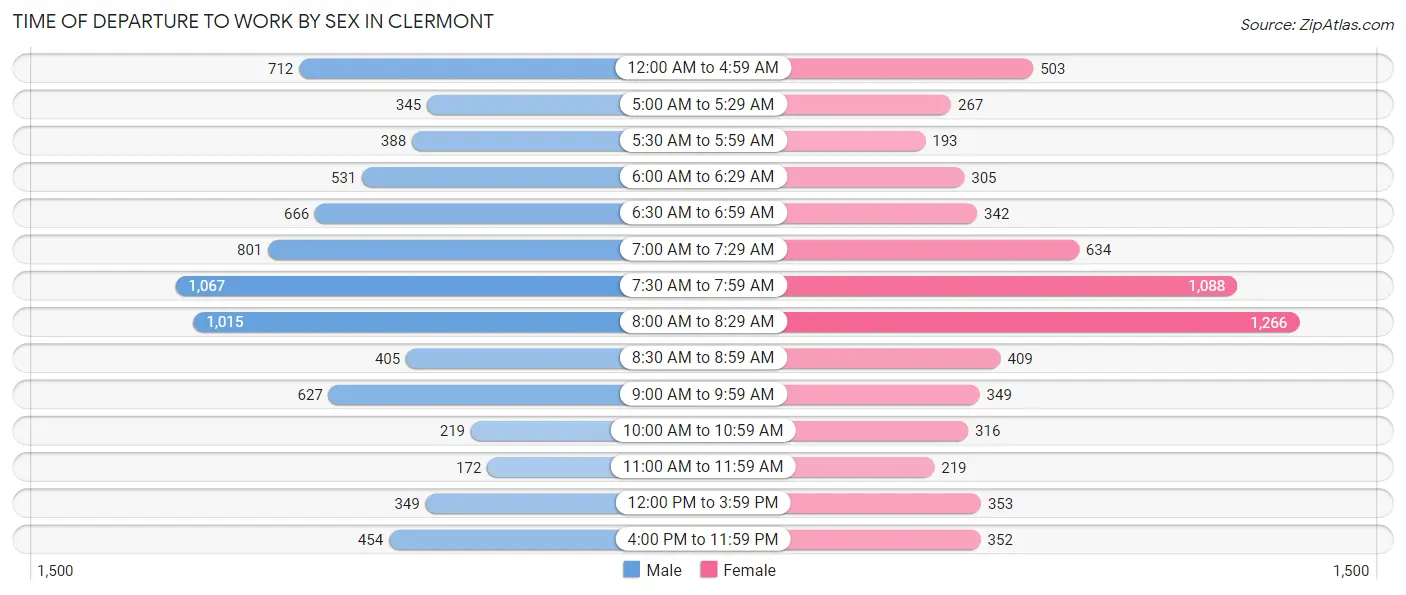
| Time of Departure | Male | Female |
| 12:00 AM to 4:59 AM | 712 (9.2%) | 503 (7.6%) |
| 5:00 AM to 5:29 AM | 345 (4.4%) | 267 (4.1%) |
| 5:30 AM to 5:59 AM | 388 (5.0%) | 193 (2.9%) |
| 6:00 AM to 6:29 AM | 531 (6.9%) | 305 (4.6%) |
| 6:30 AM to 6:59 AM | 666 (8.6%) | 342 (5.2%) |
| 7:00 AM to 7:29 AM | 801 (10.3%) | 634 (9.6%) |
| 7:30 AM to 7:59 AM | 1,067 (13.8%) | 1,088 (16.5%) |
| 8:00 AM to 8:29 AM | 1,015 (13.1%) | 1,266 (19.2%) |
| 8:30 AM to 8:59 AM | 405 (5.2%) | 409 (6.2%) |
| 9:00 AM to 9:59 AM | 627 (8.1%) | 349 (5.3%) |
| 10:00 AM to 10:59 AM | 219 (2.8%) | 316 (4.8%) |
| 11:00 AM to 11:59 AM | 172 (2.2%) | 219 (3.3%) |
| 12:00 PM to 3:59 PM | 349 (4.5%) | 353 (5.3%) |
| 4:00 PM to 11:59 PM | 454 (5.9%) | 352 (5.3%) |
| Total | 7,751 (100.0%) | 6,596 (100.0%) |
Housing Occupancy in Clermont
Occupancy by Ownership in Clermont
Of the total 15,853 dwellings in Clermont, owner-occupied units account for 11,036 (69.6%), while renter-occupied units make up 4,817 (30.4%).
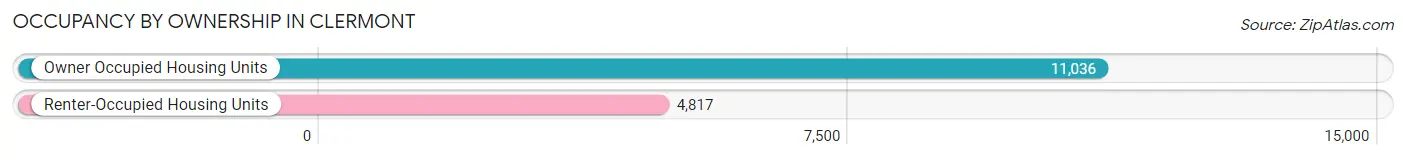
| Occupancy | # Housing Units | % Housing Units |
| Owner Occupied Housing Units | 11,036 | 69.6% |
| Renter-Occupied Housing Units | 4,817 | 30.4% |
| Total Occupied Housing Units | 15,853 | 100.0% |
Occupancy by Household Size in Clermont
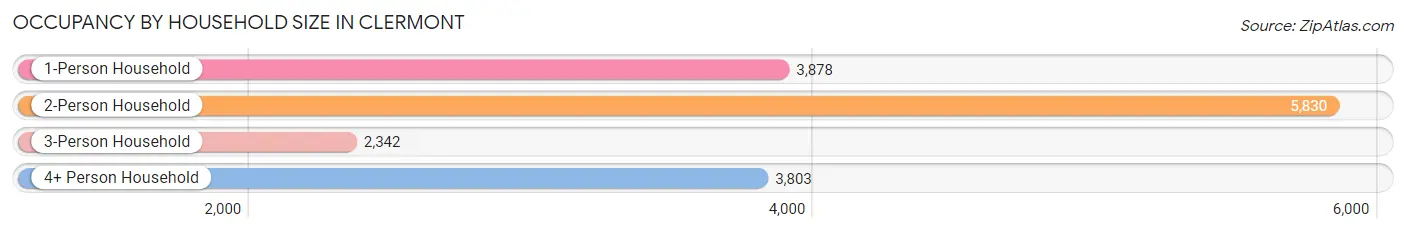
| Household Size | # Housing Units | % Housing Units |
| 1-Person Household | 3,878 | 24.5% |
| 2-Person Household | 5,830 | 36.8% |
| 3-Person Household | 2,342 | 14.8% |
| 4+ Person Household | 3,803 | 24.0% |
| Total Housing Units | 15,853 | 100.0% |
Occupancy by Ownership by Household Size in Clermont
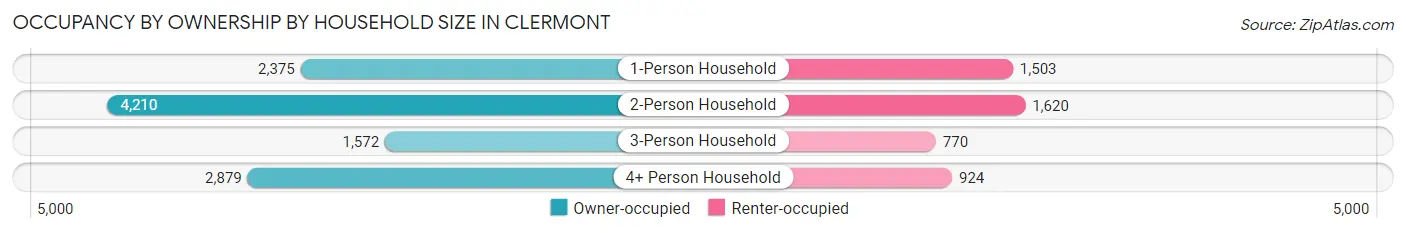
| Household Size | Owner-occupied | Renter-occupied |
| 1-Person Household | 2,375 (61.2%) | 1,503 (38.8%) |
| 2-Person Household | 4,210 (72.2%) | 1,620 (27.8%) |
| 3-Person Household | 1,572 (67.1%) | 770 (32.9%) |
| 4+ Person Household | 2,879 (75.7%) | 924 (24.3%) |
| Total Housing Units | 11,036 (69.6%) | 4,817 (30.4%) |
Occupancy by Educational Attainment in Clermont
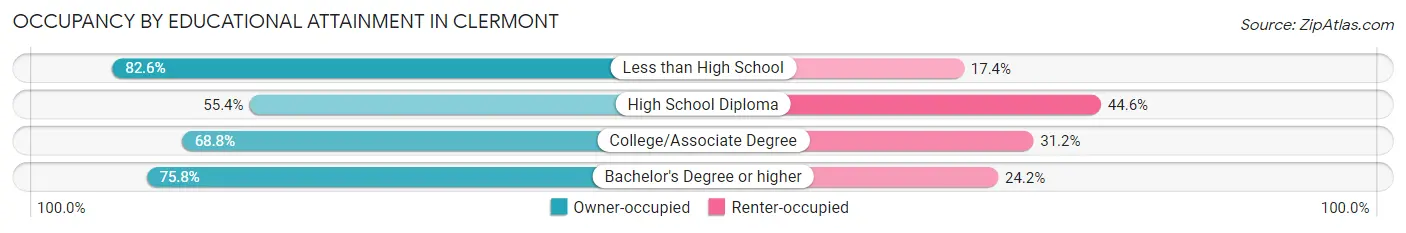
| Household Size | Owner-occupied | Renter-occupied |
| Less than High School | 689 (82.6%) | 145 (17.4%) |
| High School Diploma | 1,635 (55.4%) | 1,314 (44.6%) |
| College/Associate Degree | 4,348 (68.8%) | 1,968 (31.2%) |
| Bachelor's Degree or higher | 4,364 (75.8%) | 1,390 (24.2%) |
Occupancy by Age of Householder in Clermont
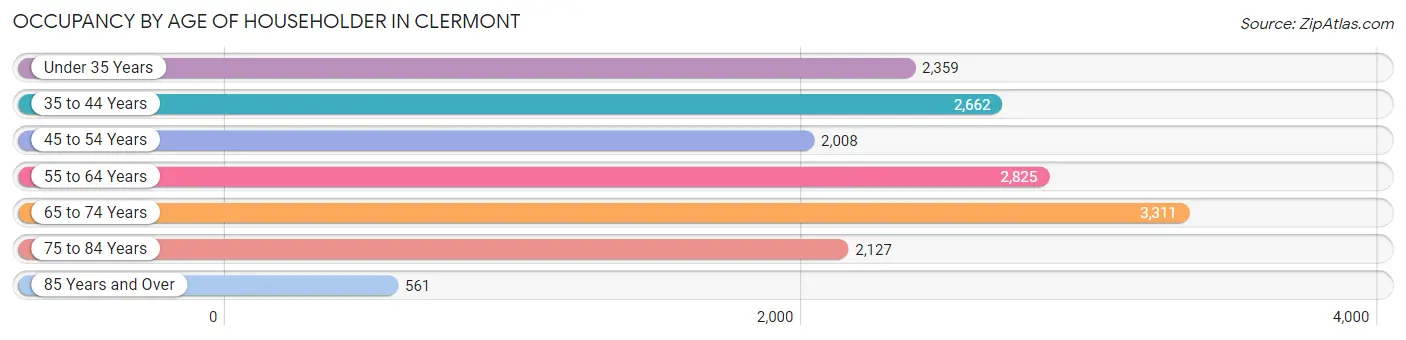
| Age Bracket | # Households | % Households |
| Under 35 Years | 2,359 | 14.9% |
| 35 to 44 Years | 2,662 | 16.8% |
| 45 to 54 Years | 2,008 | 12.7% |
| 55 to 64 Years | 2,825 | 17.8% |
| 65 to 74 Years | 3,311 | 20.9% |
| 75 to 84 Years | 2,127 | 13.4% |
| 85 Years and Over | 561 | 3.5% |
| Total | 15,853 | 100.0% |
Housing Finances in Clermont
Median Income by Occupancy in Clermont
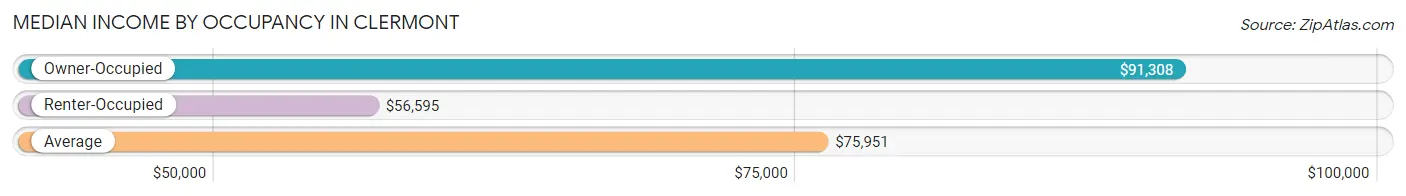
| Occupancy Type | # Households | Median Income |
| Owner-Occupied | 11,036 (69.6%) | $91,308 |
| Renter-Occupied | 4,817 (30.4%) | $56,595 |
| Average | 15,853 (100.0%) | $75,951 |
Occupancy by Householder Income Bracket in Clermont
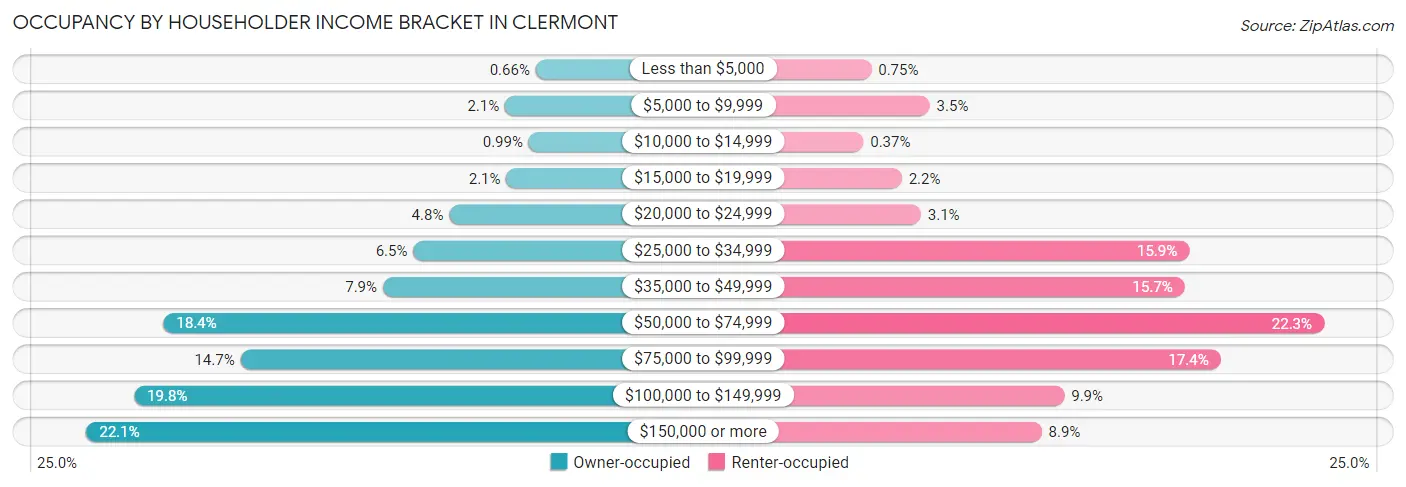
| Income Bracket | Owner-occupied | Renter-occupied |
| Less than $5,000 | 73 (0.7%) | 36 (0.7%) |
| $5,000 to $9,999 | 234 (2.1%) | 170 (3.5%) |
| $10,000 to $14,999 | 109 (1.0%) | 18 (0.4%) |
| $15,000 to $19,999 | 227 (2.1%) | 106 (2.2%) |
| $20,000 to $24,999 | 528 (4.8%) | 150 (3.1%) |
| $25,000 to $34,999 | 716 (6.5%) | 765 (15.9%) |
| $35,000 to $49,999 | 876 (7.9%) | 755 (15.7%) |
| $50,000 to $74,999 | 2,029 (18.4%) | 1,074 (22.3%) |
| $75,000 to $99,999 | 1,625 (14.7%) | 837 (17.4%) |
| $100,000 to $149,999 | 2,184 (19.8%) | 479 (9.9%) |
| $150,000 or more | 2,435 (22.1%) | 427 (8.9%) |
| Total | 11,036 (100.0%) | 4,817 (100.0%) |
Monthly Housing Cost Tiers in Clermont
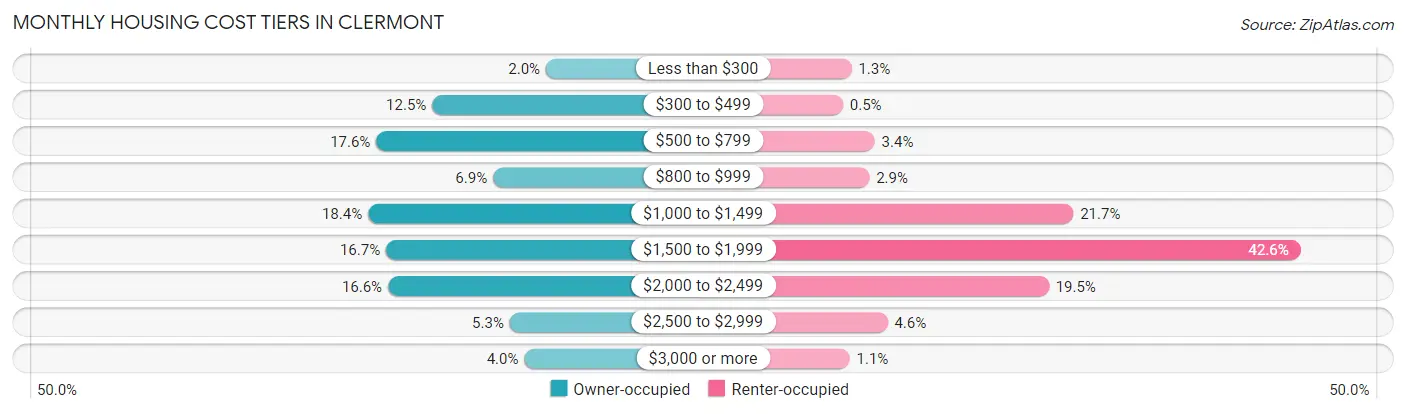
| Monthly Cost | Owner-occupied | Renter-occupied |
| Less than $300 | 222 (2.0%) | 62 (1.3%) |
| $300 to $499 | 1,377 (12.5%) | 24 (0.5%) |
| $500 to $799 | 1,946 (17.6%) | 165 (3.4%) |
| $800 to $999 | 759 (6.9%) | 141 (2.9%) |
| $1,000 to $1,499 | 2,029 (18.4%) | 1,046 (21.7%) |
| $1,500 to $1,999 | 1,846 (16.7%) | 2,054 (42.6%) |
| $2,000 to $2,499 | 1,827 (16.6%) | 937 (19.5%) |
| $2,500 to $2,999 | 589 (5.3%) | 222 (4.6%) |
| $3,000 or more | 441 (4.0%) | 54 (1.1%) |
| Total | 11,036 (100.0%) | 4,817 (100.0%) |
Physical Housing Characteristics in Clermont
Housing Structures in Clermont
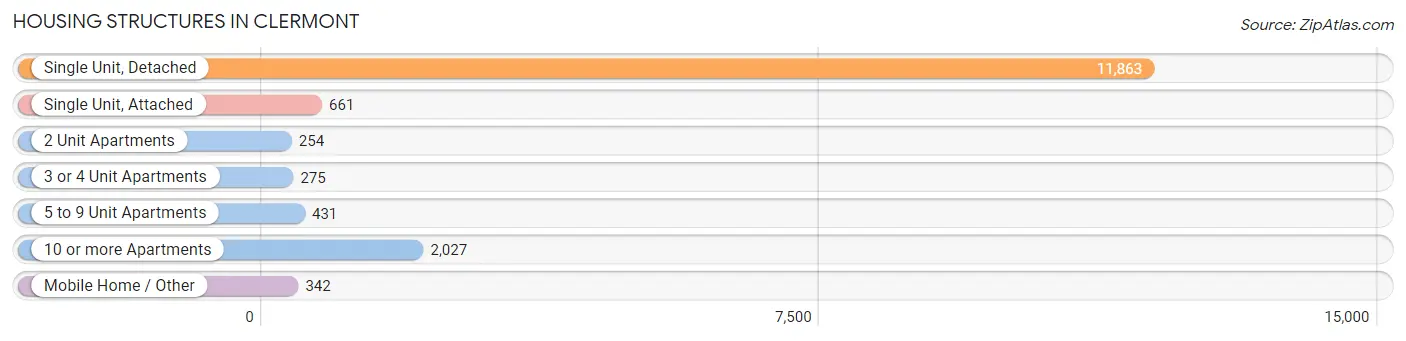
| Structure Type | # Housing Units | % Housing Units |
| Single Unit, Detached | 11,863 | 74.8% |
| Single Unit, Attached | 661 | 4.2% |
| 2 Unit Apartments | 254 | 1.6% |
| 3 or 4 Unit Apartments | 275 | 1.7% |
| 5 to 9 Unit Apartments | 431 | 2.7% |
| 10 or more Apartments | 2,027 | 12.8% |
| Mobile Home / Other | 342 | 2.2% |
| Total | 15,853 | 100.0% |
Housing Structures by Occupancy in Clermont
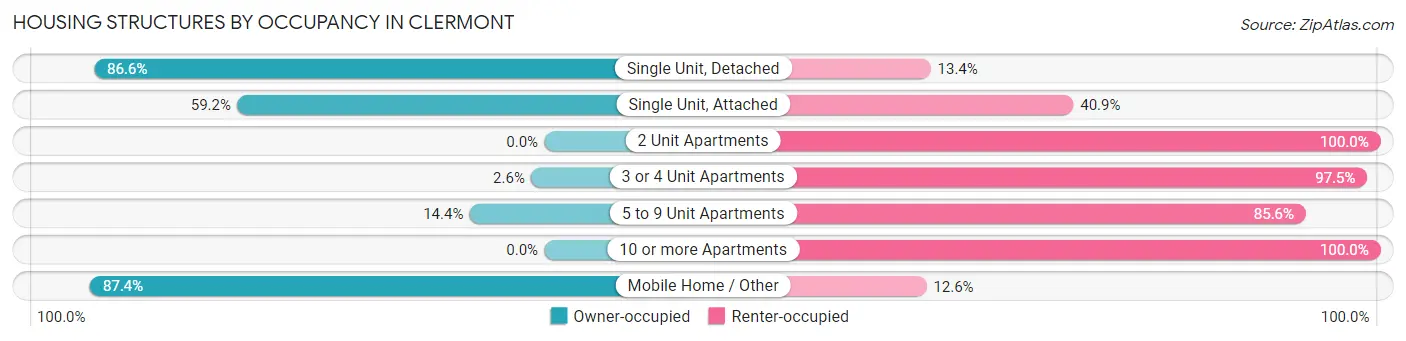
| Structure Type | Owner-occupied | Renter-occupied |
| Single Unit, Detached | 10,277 (86.6%) | 1,586 (13.4%) |
| Single Unit, Attached | 391 (59.2%) | 270 (40.8%) |
| 2 Unit Apartments | 0 (0.0%) | 254 (100.0%) |
| 3 or 4 Unit Apartments | 7 (2.5%) | 268 (97.5%) |
| 5 to 9 Unit Apartments | 62 (14.4%) | 369 (85.6%) |
| 10 or more Apartments | 0 (0.0%) | 2,027 (100.0%) |
| Mobile Home / Other | 299 (87.4%) | 43 (12.6%) |
| Total | 11,036 (69.6%) | 4,817 (30.4%) |
Housing Structures by Number of Rooms in Clermont
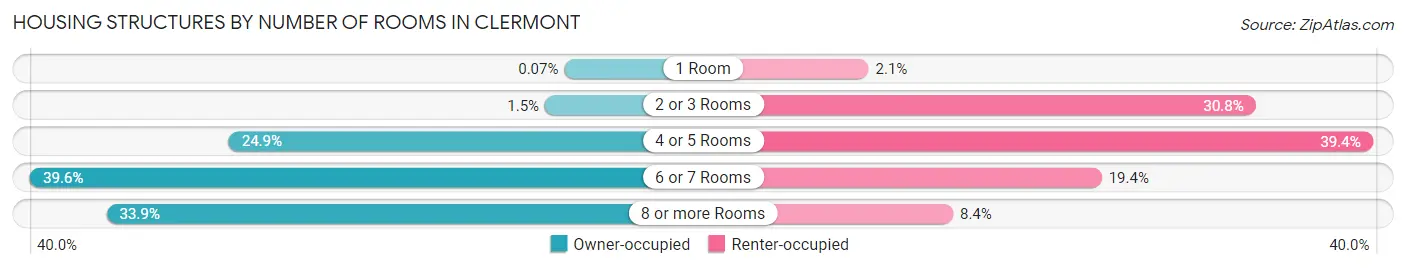
| Number of Rooms | Owner-occupied | Renter-occupied |
| 1 Room | 8 (0.1%) | 102 (2.1%) |
| 2 or 3 Rooms | 166 (1.5%) | 1,481 (30.7%) |
| 4 or 5 Rooms | 2,747 (24.9%) | 1,898 (39.4%) |
| 6 or 7 Rooms | 4,369 (39.6%) | 933 (19.4%) |
| 8 or more Rooms | 3,746 (33.9%) | 403 (8.4%) |
| Total | 11,036 (100.0%) | 4,817 (100.0%) |
Housing Structure by Heating Type in Clermont
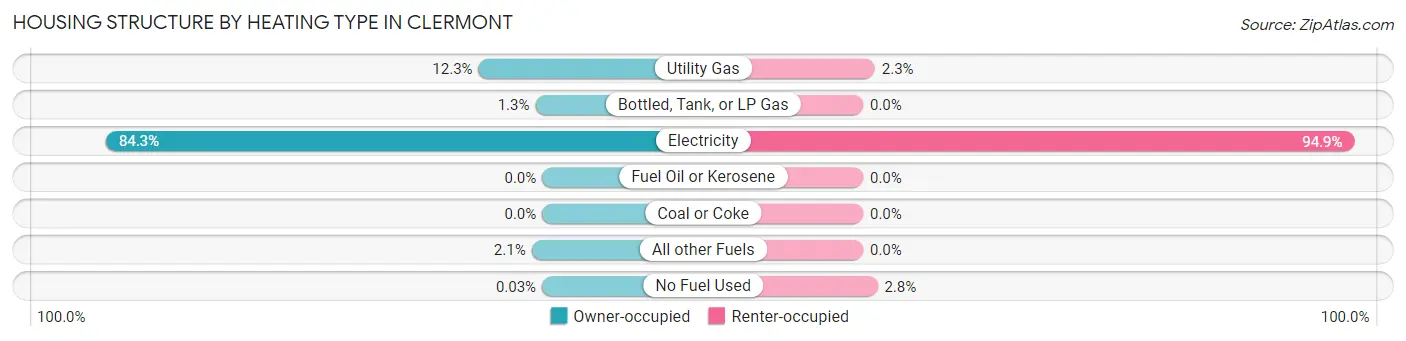
| Heating Type | Owner-occupied | Renter-occupied |
| Utility Gas | 1,359 (12.3%) | 110 (2.3%) |
| Bottled, Tank, or LP Gas | 146 (1.3%) | 0 (0.0%) |
| Electricity | 9,302 (84.3%) | 4,573 (94.9%) |
| Fuel Oil or Kerosene | 0 (0.0%) | 0 (0.0%) |
| Coal or Coke | 0 (0.0%) | 0 (0.0%) |
| All other Fuels | 226 (2.1%) | 0 (0.0%) |
| No Fuel Used | 3 (0.0%) | 134 (2.8%) |
| Total | 11,036 (100.0%) | 4,817 (100.0%) |
Household Vehicle Usage in Clermont
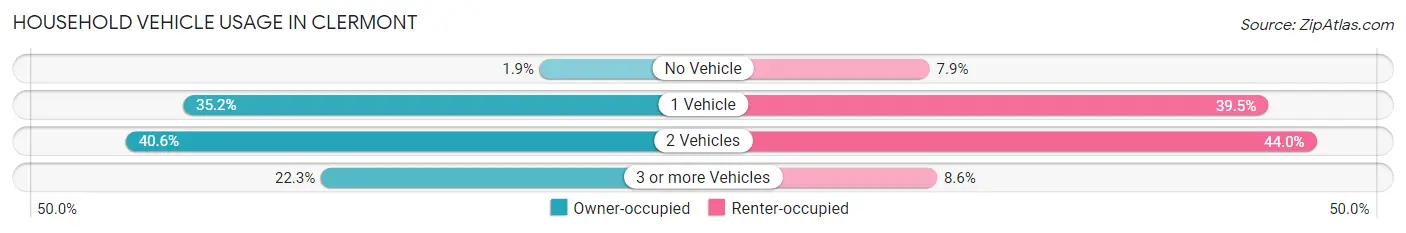
| Vehicles per Household | Owner-occupied | Renter-occupied |
| No Vehicle | 210 (1.9%) | 381 (7.9%) |
| 1 Vehicle | 3,886 (35.2%) | 1,902 (39.5%) |
| 2 Vehicles | 4,476 (40.6%) | 2,120 (44.0%) |
| 3 or more Vehicles | 2,464 (22.3%) | 414 (8.6%) |
| Total | 11,036 (100.0%) | 4,817 (100.0%) |
Real Estate & Mortgages in Clermont
Real Estate and Mortgage Overview in Clermont
| Characteristic | Without Mortgage | With Mortgage |
| Housing Units | 4,256 | 6,780 |
| Median Property Value | $314,300 | $344,200 |
| Median Household Income | $67,177 | $1,585 |
| Monthly Housing Costs | $554 | $441 |
| Real Estate Taxes | $2,350 | $219 |
Property Value by Mortgage Status in Clermont
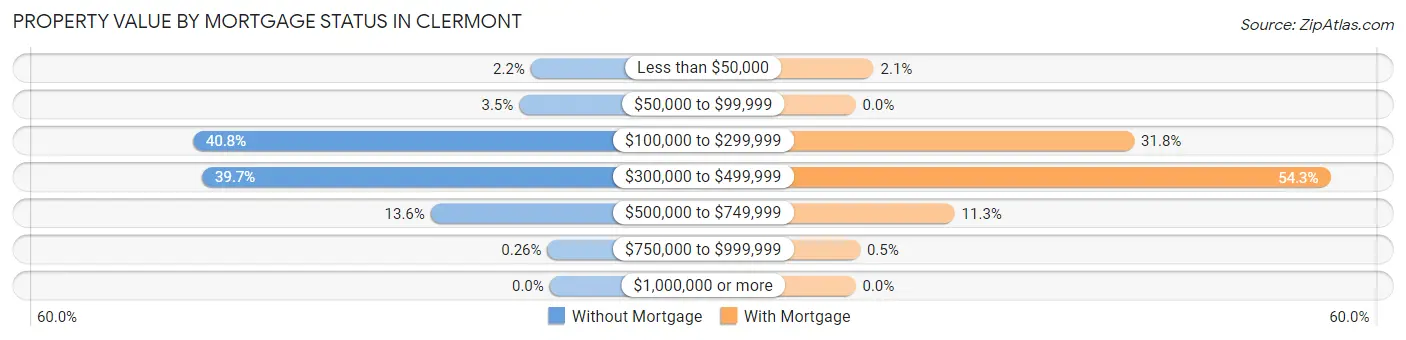
| Property Value | Without Mortgage | With Mortgage |
| Less than $50,000 | 92 (2.2%) | 140 (2.1%) |
| $50,000 to $99,999 | 148 (3.5%) | 0 (0.0%) |
| $100,000 to $299,999 | 1,735 (40.8%) | 2,159 (31.8%) |
| $300,000 to $499,999 | 1,691 (39.7%) | 3,679 (54.3%) |
| $500,000 to $749,999 | 579 (13.6%) | 768 (11.3%) |
| $750,000 to $999,999 | 11 (0.3%) | 34 (0.5%) |
| $1,000,000 or more | 0 (0.0%) | 0 (0.0%) |
| Total | 4,256 (100.0%) | 6,780 (100.0%) |
Household Income by Mortgage Status in Clermont
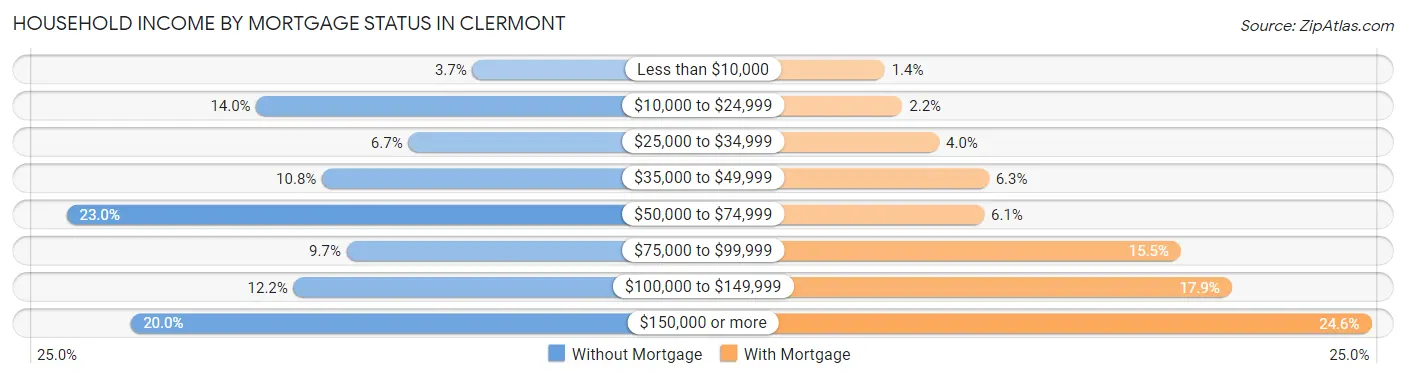
| Household Income | Without Mortgage | With Mortgage |
| Less than $10,000 | 156 (3.7%) | 94 (1.4%) |
| $10,000 to $24,999 | 594 (14.0%) | 151 (2.2%) |
| $25,000 to $34,999 | 286 (6.7%) | 270 (4.0%) |
| $35,000 to $49,999 | 461 (10.8%) | 430 (6.3%) |
| $50,000 to $74,999 | 979 (23.0%) | 415 (6.1%) |
| $75,000 to $99,999 | 411 (9.7%) | 1,050 (15.5%) |
| $100,000 to $149,999 | 519 (12.2%) | 1,214 (17.9%) |
| $150,000 or more | 850 (20.0%) | 1,665 (24.6%) |
| Total | 4,256 (100.0%) | 6,780 (100.0%) |
Property Value to Household Income Ratio in Clermont
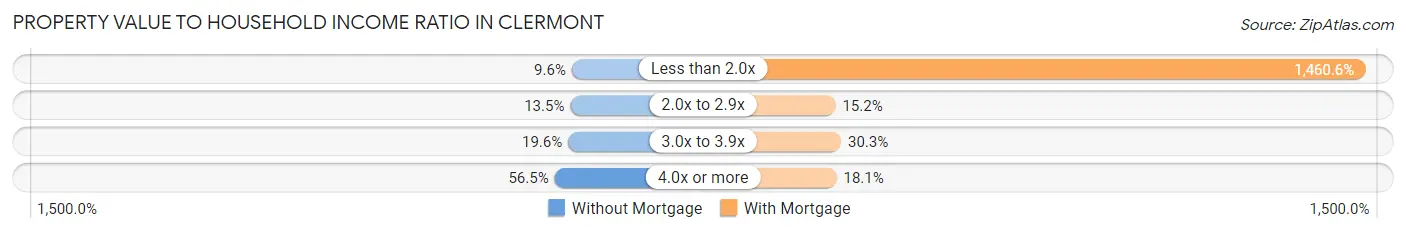
| Value-to-Income Ratio | Without Mortgage | With Mortgage |
| Less than 2.0x | 407 (9.6%) | 99,025 (1,460.5%) |
| 2.0x to 2.9x | 576 (13.5%) | 1,028 (15.2%) |
| 3.0x to 3.9x | 834 (19.6%) | 2,051 (30.2%) |
| 4.0x or more | 2,404 (56.5%) | 1,228 (18.1%) |
| Total | 4,256 (100.0%) | 6,780 (100.0%) |
Real Estate Taxes by Mortgage Status in Clermont
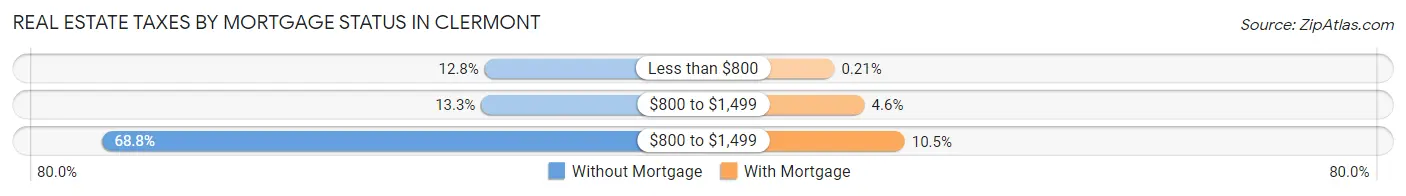
| Property Taxes | Without Mortgage | With Mortgage |
| Less than $800 | 544 (12.8%) | 14 (0.2%) |
| $800 to $1,499 | 565 (13.3%) | 313 (4.6%) |
| $800 to $1,499 | 2,926 (68.8%) | 711 (10.5%) |
| Total | 4,256 (100.0%) | 6,780 (100.0%) |
Health & Disability in Clermont
Health Insurance Coverage by Age in Clermont
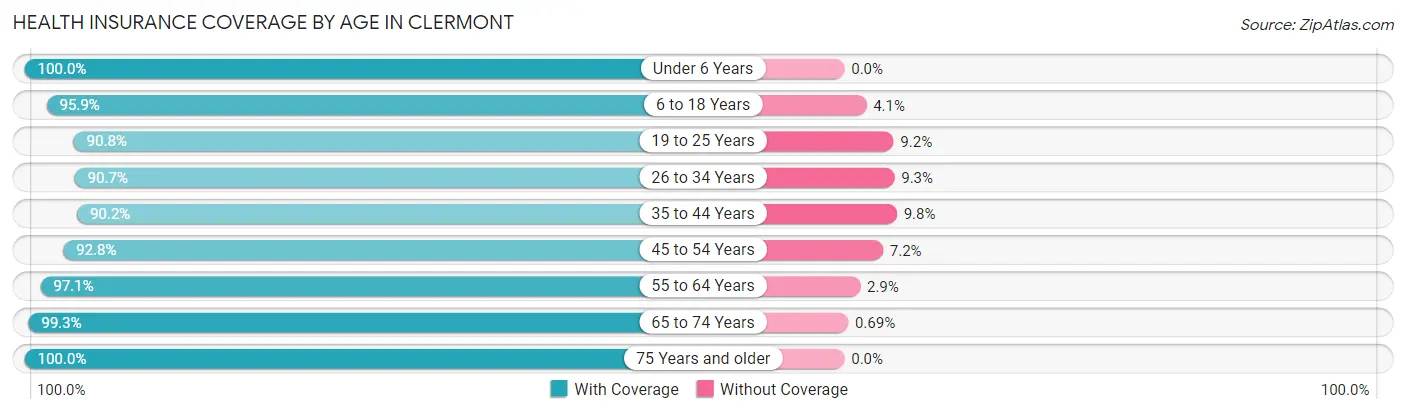
| Age Bracket | With Coverage | Without Coverage |
| Under 6 Years | 2,082 (100.0%) | 0 (0.0%) |
| 6 to 18 Years | 7,526 (95.9%) | 320 (4.1%) |
| 19 to 25 Years | 3,084 (90.8%) | 311 (9.2%) |
| 26 to 34 Years | 4,057 (90.7%) | 417 (9.3%) |
| 35 to 44 Years | 4,894 (90.2%) | 530 (9.8%) |
| 45 to 54 Years | 4,185 (92.8%) | 324 (7.2%) |
| 55 to 64 Years | 4,730 (97.1%) | 143 (2.9%) |
| 65 to 74 Years | 5,866 (99.3%) | 41 (0.7%) |
| 75 Years and older | 4,456 (100.0%) | 0 (0.0%) |
| Total | 40,880 (95.1%) | 2,086 (4.9%) |
Health Insurance Coverage by Citizenship Status in Clermont
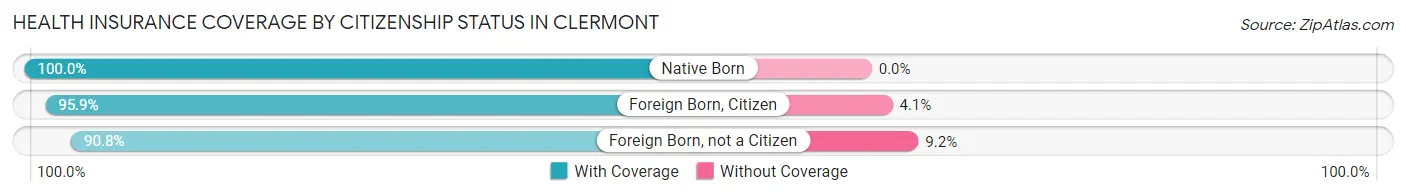
| Citizenship Status | With Coverage | Without Coverage |
| Native Born | 2,082 (100.0%) | 0 (0.0%) |
| Foreign Born, Citizen | 7,526 (95.9%) | 320 (4.1%) |
| Foreign Born, not a Citizen | 3,084 (90.8%) | 311 (9.2%) |
Health Insurance Coverage by Household Income in Clermont
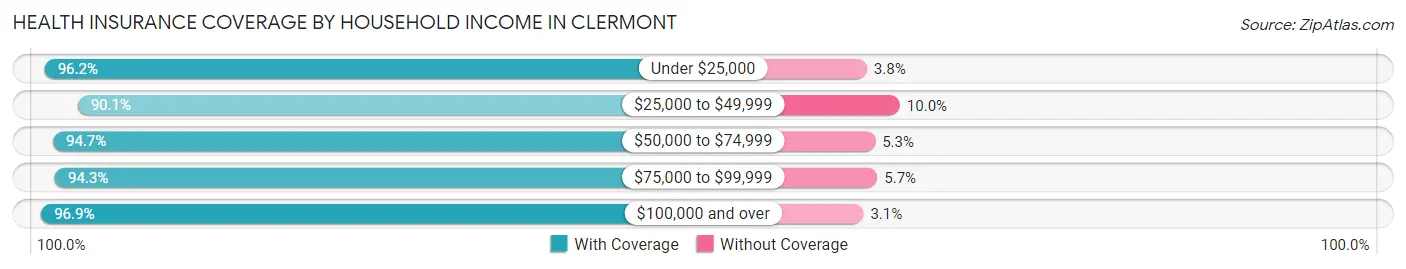
| Household Income | With Coverage | Without Coverage |
| Under $25,000 | 2,805 (96.2%) | 110 (3.8%) |
| $25,000 to $49,999 | 5,179 (90.0%) | 572 (10.0%) |
| $50,000 to $74,999 | 6,531 (94.7%) | 368 (5.3%) |
| $75,000 to $99,999 | 6,428 (94.3%) | 390 (5.7%) |
| $100,000 and over | 19,918 (96.9%) | 642 (3.1%) |
Public vs Private Health Insurance Coverage by Age in Clermont
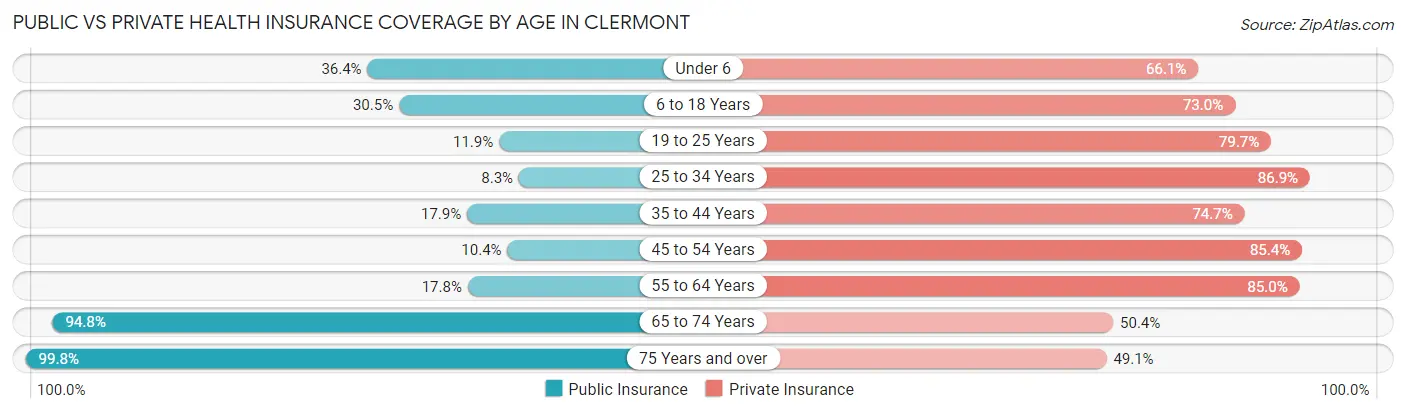
| Age Bracket | Public Insurance | Private Insurance |
| Under 6 | 757 (36.4%) | 1,377 (66.1%) |
| 6 to 18 Years | 2,394 (30.5%) | 5,725 (73.0%) |
| 19 to 25 Years | 405 (11.9%) | 2,705 (79.7%) |
| 25 to 34 Years | 369 (8.3%) | 3,887 (86.9%) |
| 35 to 44 Years | 969 (17.9%) | 4,054 (74.7%) |
| 45 to 54 Years | 468 (10.4%) | 3,851 (85.4%) |
| 55 to 64 Years | 865 (17.7%) | 4,140 (85.0%) |
| 65 to 74 Years | 5,601 (94.8%) | 2,975 (50.4%) |
| 75 Years and over | 4,447 (99.8%) | 2,189 (49.1%) |
| Total | 16,275 (37.9%) | 30,903 (71.9%) |
Disability Status by Sex by Age in Clermont
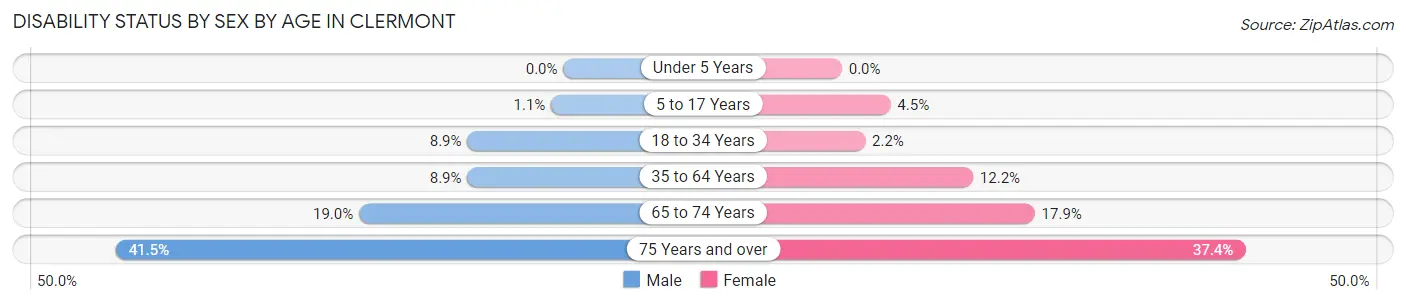
| Age Bracket | Male | Female |
| Under 5 Years | 0 (0.0%) | 0 (0.0%) |
| 5 to 17 Years | 42 (1.1%) | 185 (4.5%) |
| 18 to 34 Years | 367 (8.9%) | 91 (2.2%) |
| 35 to 64 Years | 647 (8.9%) | 918 (12.2%) |
| 65 to 74 Years | 425 (19.0%) | 656 (17.9%) |
| 75 Years and over | 881 (41.5%) | 874 (37.4%) |
Disability Class by Sex by Age in Clermont
Disability Class: Hearing Difficulty
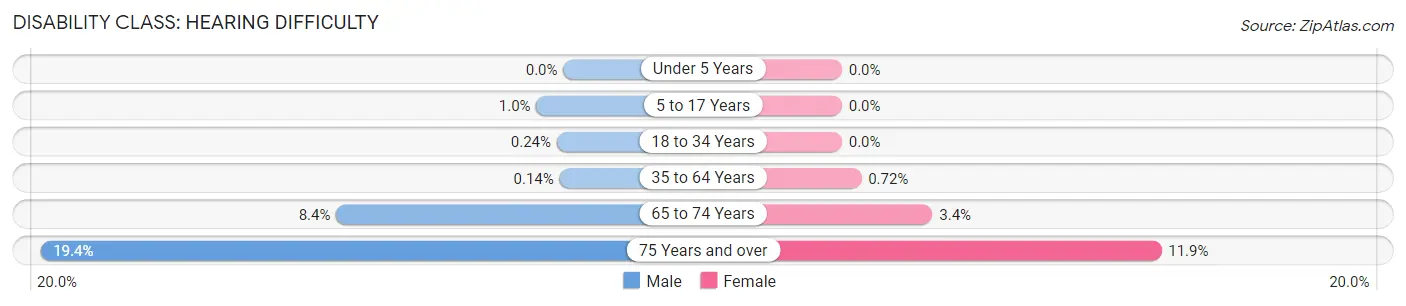
| Age Bracket | Male | Female |
| Under 5 Years | 0 (0.0%) | 0 (0.0%) |
| 5 to 17 Years | 37 (1.0%) | 0 (0.0%) |
| 18 to 34 Years | 10 (0.2%) | 0 (0.0%) |
| 35 to 64 Years | 10 (0.1%) | 54 (0.7%) |
| 65 to 74 Years | 189 (8.4%) | 123 (3.4%) |
| 75 Years and over | 412 (19.4%) | 277 (11.9%) |
Disability Class: Vision Difficulty
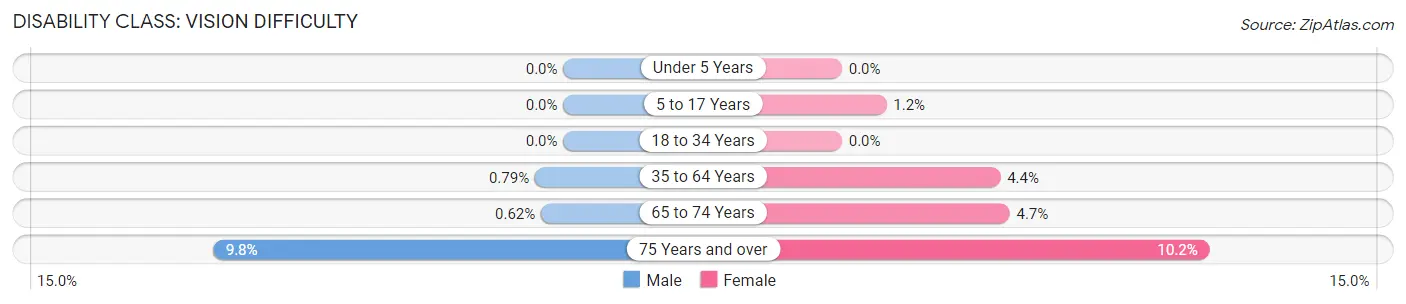
| Age Bracket | Male | Female |
| Under 5 Years | 0 (0.0%) | 0 (0.0%) |
| 5 to 17 Years | 0 (0.0%) | 51 (1.2%) |
| 18 to 34 Years | 0 (0.0%) | 0 (0.0%) |
| 35 to 64 Years | 57 (0.8%) | 333 (4.4%) |
| 65 to 74 Years | 14 (0.6%) | 171 (4.7%) |
| 75 Years and over | 207 (9.8%) | 239 (10.2%) |
Disability Class: Cognitive Difficulty
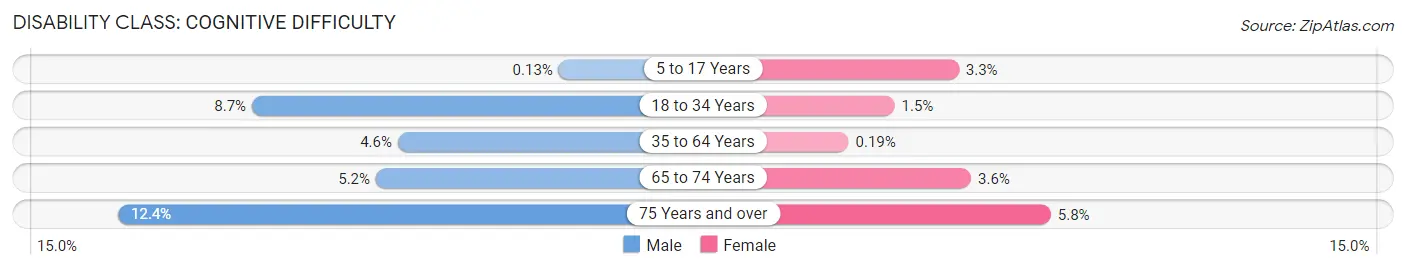
| Age Bracket | Male | Female |
| 5 to 17 Years | 5 (0.1%) | 134 (3.3%) |
| 18 to 34 Years | 357 (8.7%) | 62 (1.5%) |
| 35 to 64 Years | 335 (4.6%) | 14 (0.2%) |
| 65 to 74 Years | 117 (5.2%) | 132 (3.6%) |
| 75 Years and over | 263 (12.4%) | 136 (5.8%) |
Disability Class: Ambulatory Difficulty
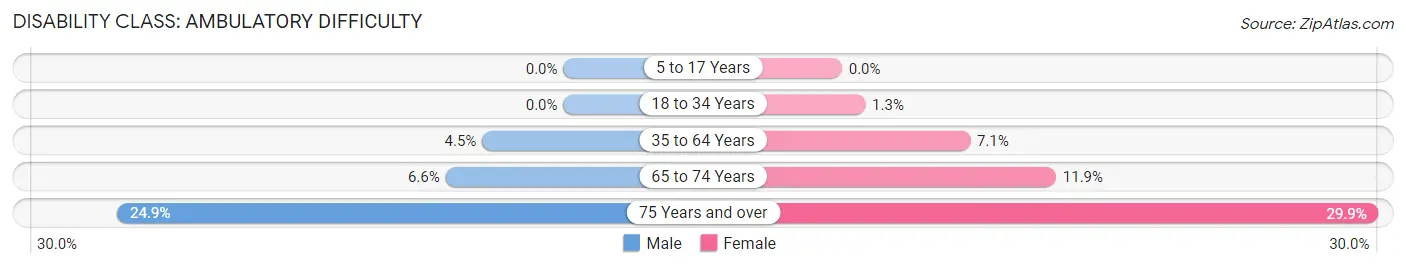
| Age Bracket | Male | Female |
| 5 to 17 Years | 0 (0.0%) | 0 (0.0%) |
| 18 to 34 Years | 0 (0.0%) | 55 (1.3%) |
| 35 to 64 Years | 328 (4.5%) | 539 (7.1%) |
| 65 to 74 Years | 147 (6.6%) | 437 (11.9%) |
| 75 Years and over | 527 (24.8%) | 698 (29.9%) |
Disability Class: Self-Care Difficulty
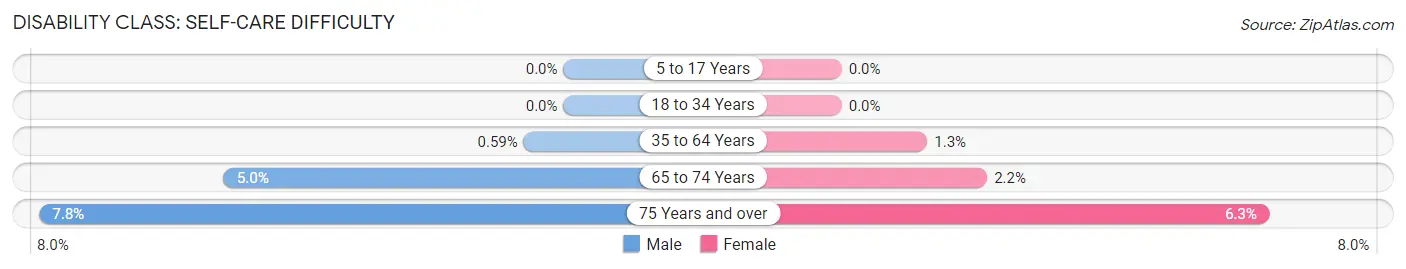
| Age Bracket | Male | Female |
| 5 to 17 Years | 0 (0.0%) | 0 (0.0%) |
| 18 to 34 Years | 0 (0.0%) | 0 (0.0%) |
| 35 to 64 Years | 43 (0.6%) | 96 (1.3%) |
| 65 to 74 Years | 113 (5.0%) | 79 (2.2%) |
| 75 Years and over | 165 (7.8%) | 148 (6.3%) |
Technology Access in Clermont
Computing Device Access in Clermont
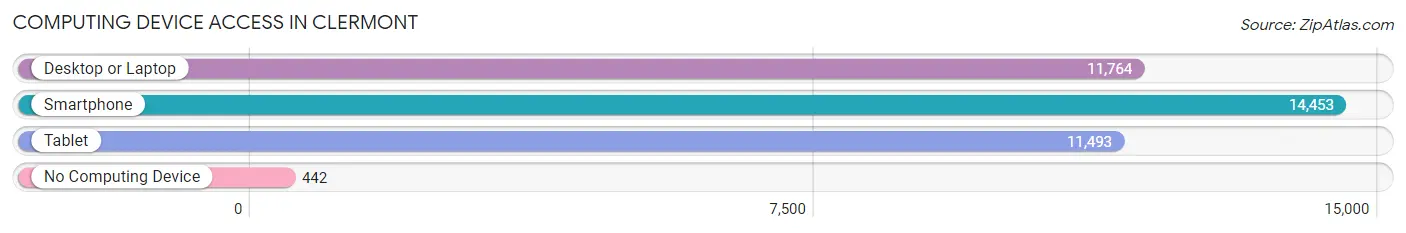
| Device Type | # Households | % Households |
| Desktop or Laptop | 11,764 | 74.2% |
| Smartphone | 14,453 | 91.2% |
| Tablet | 11,493 | 72.5% |
| No Computing Device | 442 | 2.8% |
| Total | 15,853 | 100.0% |
Internet Access in Clermont
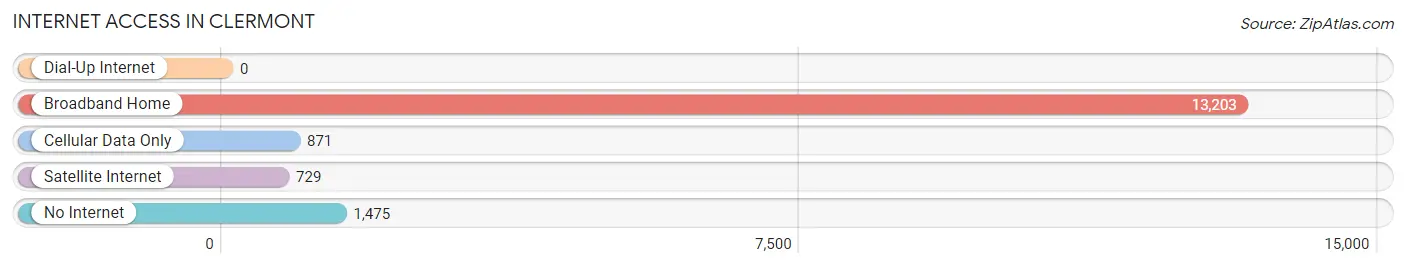
| Internet Type | # Households | % Households |
| Dial-Up Internet | 0 | 0.0% |
| Broadband Home | 13,203 | 83.3% |
| Cellular Data Only | 871 | 5.5% |
| Satellite Internet | 729 | 4.6% |
| No Internet | 1,475 | 9.3% |
| Total | 15,853 | 100.0% |
Clermont Summary
Clermont is a city located in Lake County, Florida, United States, about 22 miles west of Orlando and 22 miles southeast of Leesburg. The population was 28,742 in the 2010 census. Clermont is part of the Orlando–Kissimmee–Sanford Metropolitan Statistical Area.
Geography
Clermont is located in central Florida, in Lake County, at 28°30'N 81°45'W (28.50, -81.75). The city is situated on a ridge between two lakes, Lake Minneola to the north and Lake Louisa to the south. The city is approximately 22 miles west of Orlando and 22 miles southeast of Leesburg.
The total area of Clermont is 24.4 square miles, of which 24.2 square miles is land and 0.2 square miles (0.83%) is water.
History
Clermont was founded in 1884 by A.F. Wrotniski, who named the city after the French city of Clermont-Ferrand. The city was incorporated in 1916.
In the early 1900s, Clermont was a popular tourist destination, with many visitors coming to the area to enjoy the mild climate and natural beauty. The city was also known for its citrus industry, with many groves in the area.
In the 1950s, Clermont began to experience rapid growth, as the city became a popular retirement destination. The population increased from 1,800 in 1950 to over 10,000 by 1970.
Economy
Clermont's economy is largely based on tourism and agriculture. The city is home to several tourist attractions, including the Citrus Tower, a 226-foot observation tower that offers views of the surrounding area. The city is also home to several wineries and breweries, as well as several golf courses.
Agriculture is also an important part of the local economy, with citrus, vegetables, and cattle being the main products.
Demographics
As of the 2010 census, there were 28,742 people, 11,945 households, and 7,945 families residing in the city. The population density was 1,189.3 people per square mile. The racial makeup of the city was 79.2% White, 11.2% African American, 0.3% Native American, 1.7% Asian, 0.1% Pacific Islander, 5.2% from other races, and 2.3% from two or more races. Hispanic or Latino of any race were 15.2% of the population.
The median income for a household in the city was $45,945, and the median income for a family was $54,945. The per capita income for the city was $23,945. About 8.2% of families and 11.2% of the population were below the poverty line, including 15.2% of those under age 18 and 8.2% of those age 65 or over.
Common Questions
What is Per Capita Income in Clermont?
Per Capita income in Clermont is $35,217.
What is the Median Family Income in Clermont?
Median Family Income in Clermont is $92,716.
What is the Median Household income in Clermont?
Median Household Income in Clermont is $75,951.
What is Income or Wage Gap in Clermont?
Income or Wage Gap in Clermont is 25.0%.
Women in Clermont earn 75.0 cents for every dollar earned by a man.
What is Family Income Deficit in Clermont?
Family Income Deficit in Clermont is $15,355.
Families that are below poverty line in Clermont earn $15,355 less on average than the poverty threshold level.
What is Inequality or Gini Index in Clermont?
Inequality or Gini Index in Clermont is 0.39.
What is the Total Population of Clermont?
Total Population of Clermont is 43,266.
What is the Total Male Population of Clermont?
Total Male Population of Clermont is 20,270.
What is the Total Female Population of Clermont?
Total Female Population of Clermont is 22,996.
What is the Ratio of Males per 100 Females in Clermont?
There are 88.15 Males per 100 Females in Clermont.
What is the Ratio of Females per 100 Males in Clermont?
There are 113.45 Females per 100 Males in Clermont.
What is the Median Population Age in Clermont?
Median Population Age in Clermont is 41.7 Years.
What is the Average Family Size in Clermont
Average Family Size in Clermont is 3.2 People.
What is the Average Household Size in Clermont
Average Household Size in Clermont is 2.7 People.
How Large is the Labor Force in Clermont?
There are 18,425 People in the Labor Forcein in Clermont.
What is the Percentage of People in the Labor Force in Clermont?
52.9% of People are in the Labor Force in Clermont.
What is the Unemployment Rate in Clermont?
Unemployment Rate in Clermont is 5.0%.